Test de l'Alienware m18 R1 : plus grand et plus lourd que le MSI Titan GT77
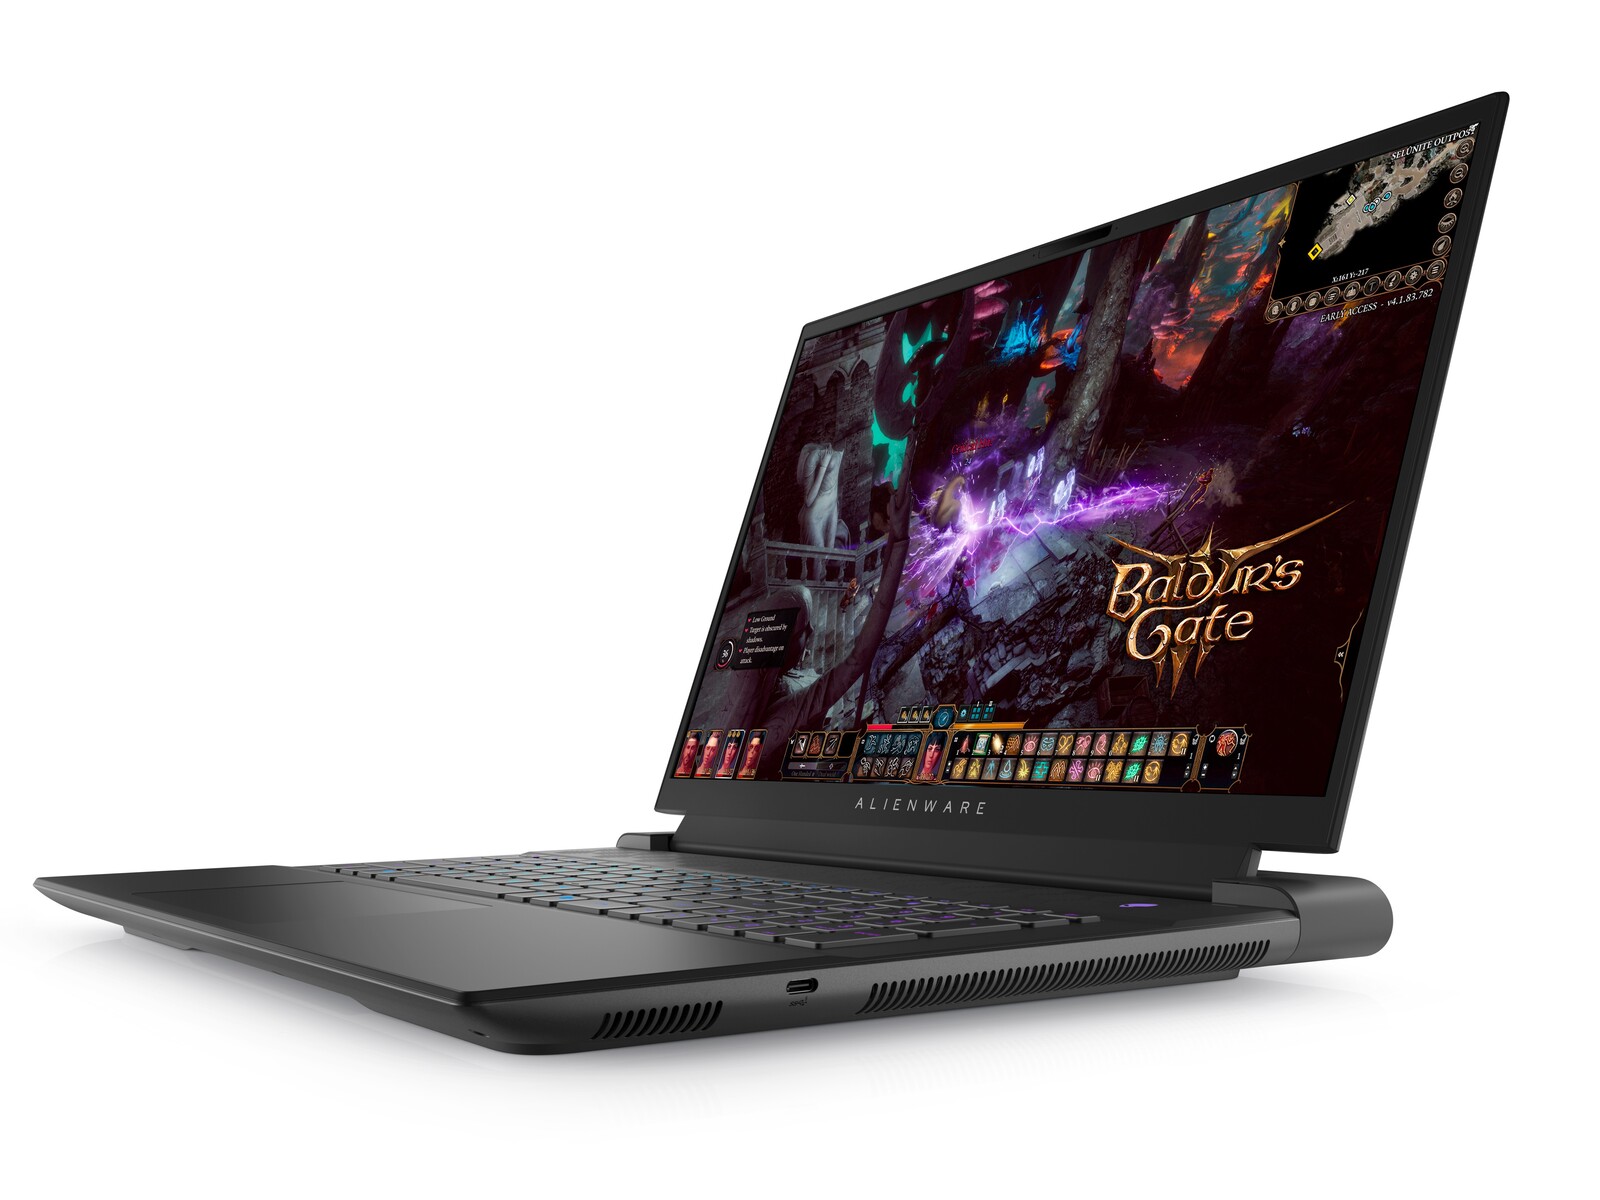
Dévoilé plus tôt cette année aux côtés de la série mobile Intel Raptor Lake-H et de la série mobile Ada Lovelace GeForce RTX 40, le modèle phare Alienware m18 R1 est le premier modèle 18 pouces de sa famille depuis 2013. Beaucoup de choses ont changé depuis, bien sûr, mais les chasseurs de performances qui veulent quelque chose de plus grand que la solution habituelle de 17 pouces peuvent trouver beaucoup à aimer d'un facteur de forme de 18 pouces où les caractéristiques et les thermiques peuvent être maximisés.
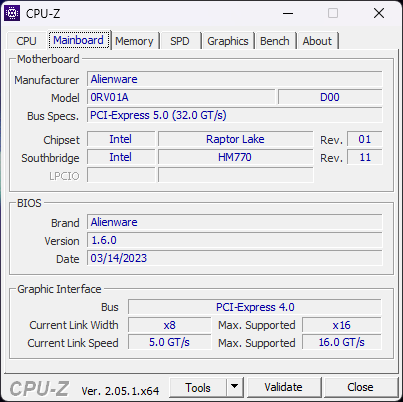
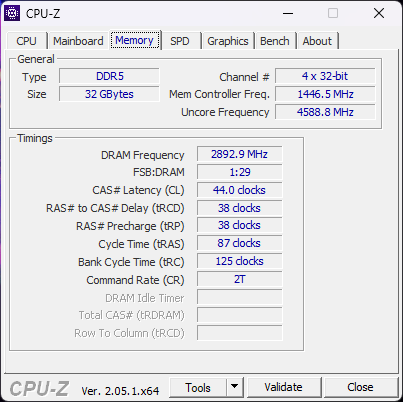
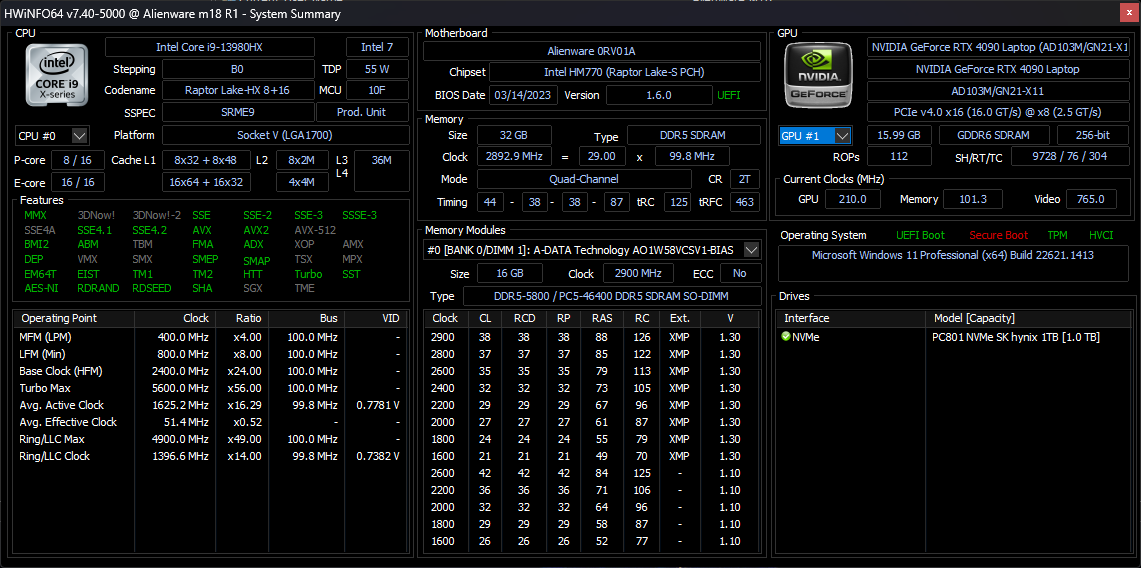
Notre configuration est une spécification haut de gamme avec le CPU Core i9-13980HX de 13ème génération, 175 W GeForce RTX 4090, un clavier RGB à membrane, et un écran IPS 1200p 480 Hz pour environ $2900 USD. D'autres SKU sont disponibles à partir de la RTX 4060, Core i7-13700HX, et 1600p 165 Hz écran avec CherryMX ultra low-profile clavier mécanique. Toutes les configurations prennent en charge G-Sync et les couleurs DCI-P3.
Parmi les concurrents directs, on trouve d'autres ordinateurs portables de jeu de 18 pouces comme le Razer Blade 18 ou leAsus ROG Strix Scar 18. MSI n'a pas encore annoncé de nouveau modèle 18 pouces à l'heure où nous écrivons ces lignes.
Plus d'avis Dell :
Comparaison avec les concurrents potentiels
Note | Date | Modèle | Poids | Épaisseur | Taille | Résolution | Prix |
|---|---|---|---|---|---|---|---|
| 90.7 % v7 (old) | 04/23 | Alienware m18 R1 i9-13980HX, GeForce RTX 4090 Laptop GPU | 3.9 kg | 26.7 mm | 18.00" | 1920x1200 | |
| 91.4 % v7 (old) | 02/23 | Razer Blade 18 RTX 4070 i9-13950HX, GeForce RTX 4070 Laptop GPU | 3 kg | 21.9 mm | 18.00" | 2560x1600 | |
| 86.6 % v7 (old) | 02/23 | Asus ROG Strix Scar 18 2023 G834JY-N6005W i9-13980HX, GeForce RTX 4090 Laptop GPU | 3.1 kg | 30.8 mm | 18.00" | 2560x1600 | |
| 88.3 % v7 (old) | 03/23 | MSI GE78HX 13VH-070US i9-13950HX, GeForce RTX 4080 Laptop GPU | 3 kg | 23 mm | 17.00" | 2560x1600 | |
| 89.9 % v7 (old) | 03/23 | Eluktronics Mech-17 GP2 i9-13900HX, GeForce RTX 4090 Laptop GPU | 2.9 kg | 27 mm | 17.00" | 2560x1600 | |
| 89 % v7 (old) | 02/23 | MSI Titan GT77 HX 13VI i9-13950HX, GeForce RTX 4090 Laptop GPU | 3.5 kg | 23 mm | 17.30" | 3840x2160 |
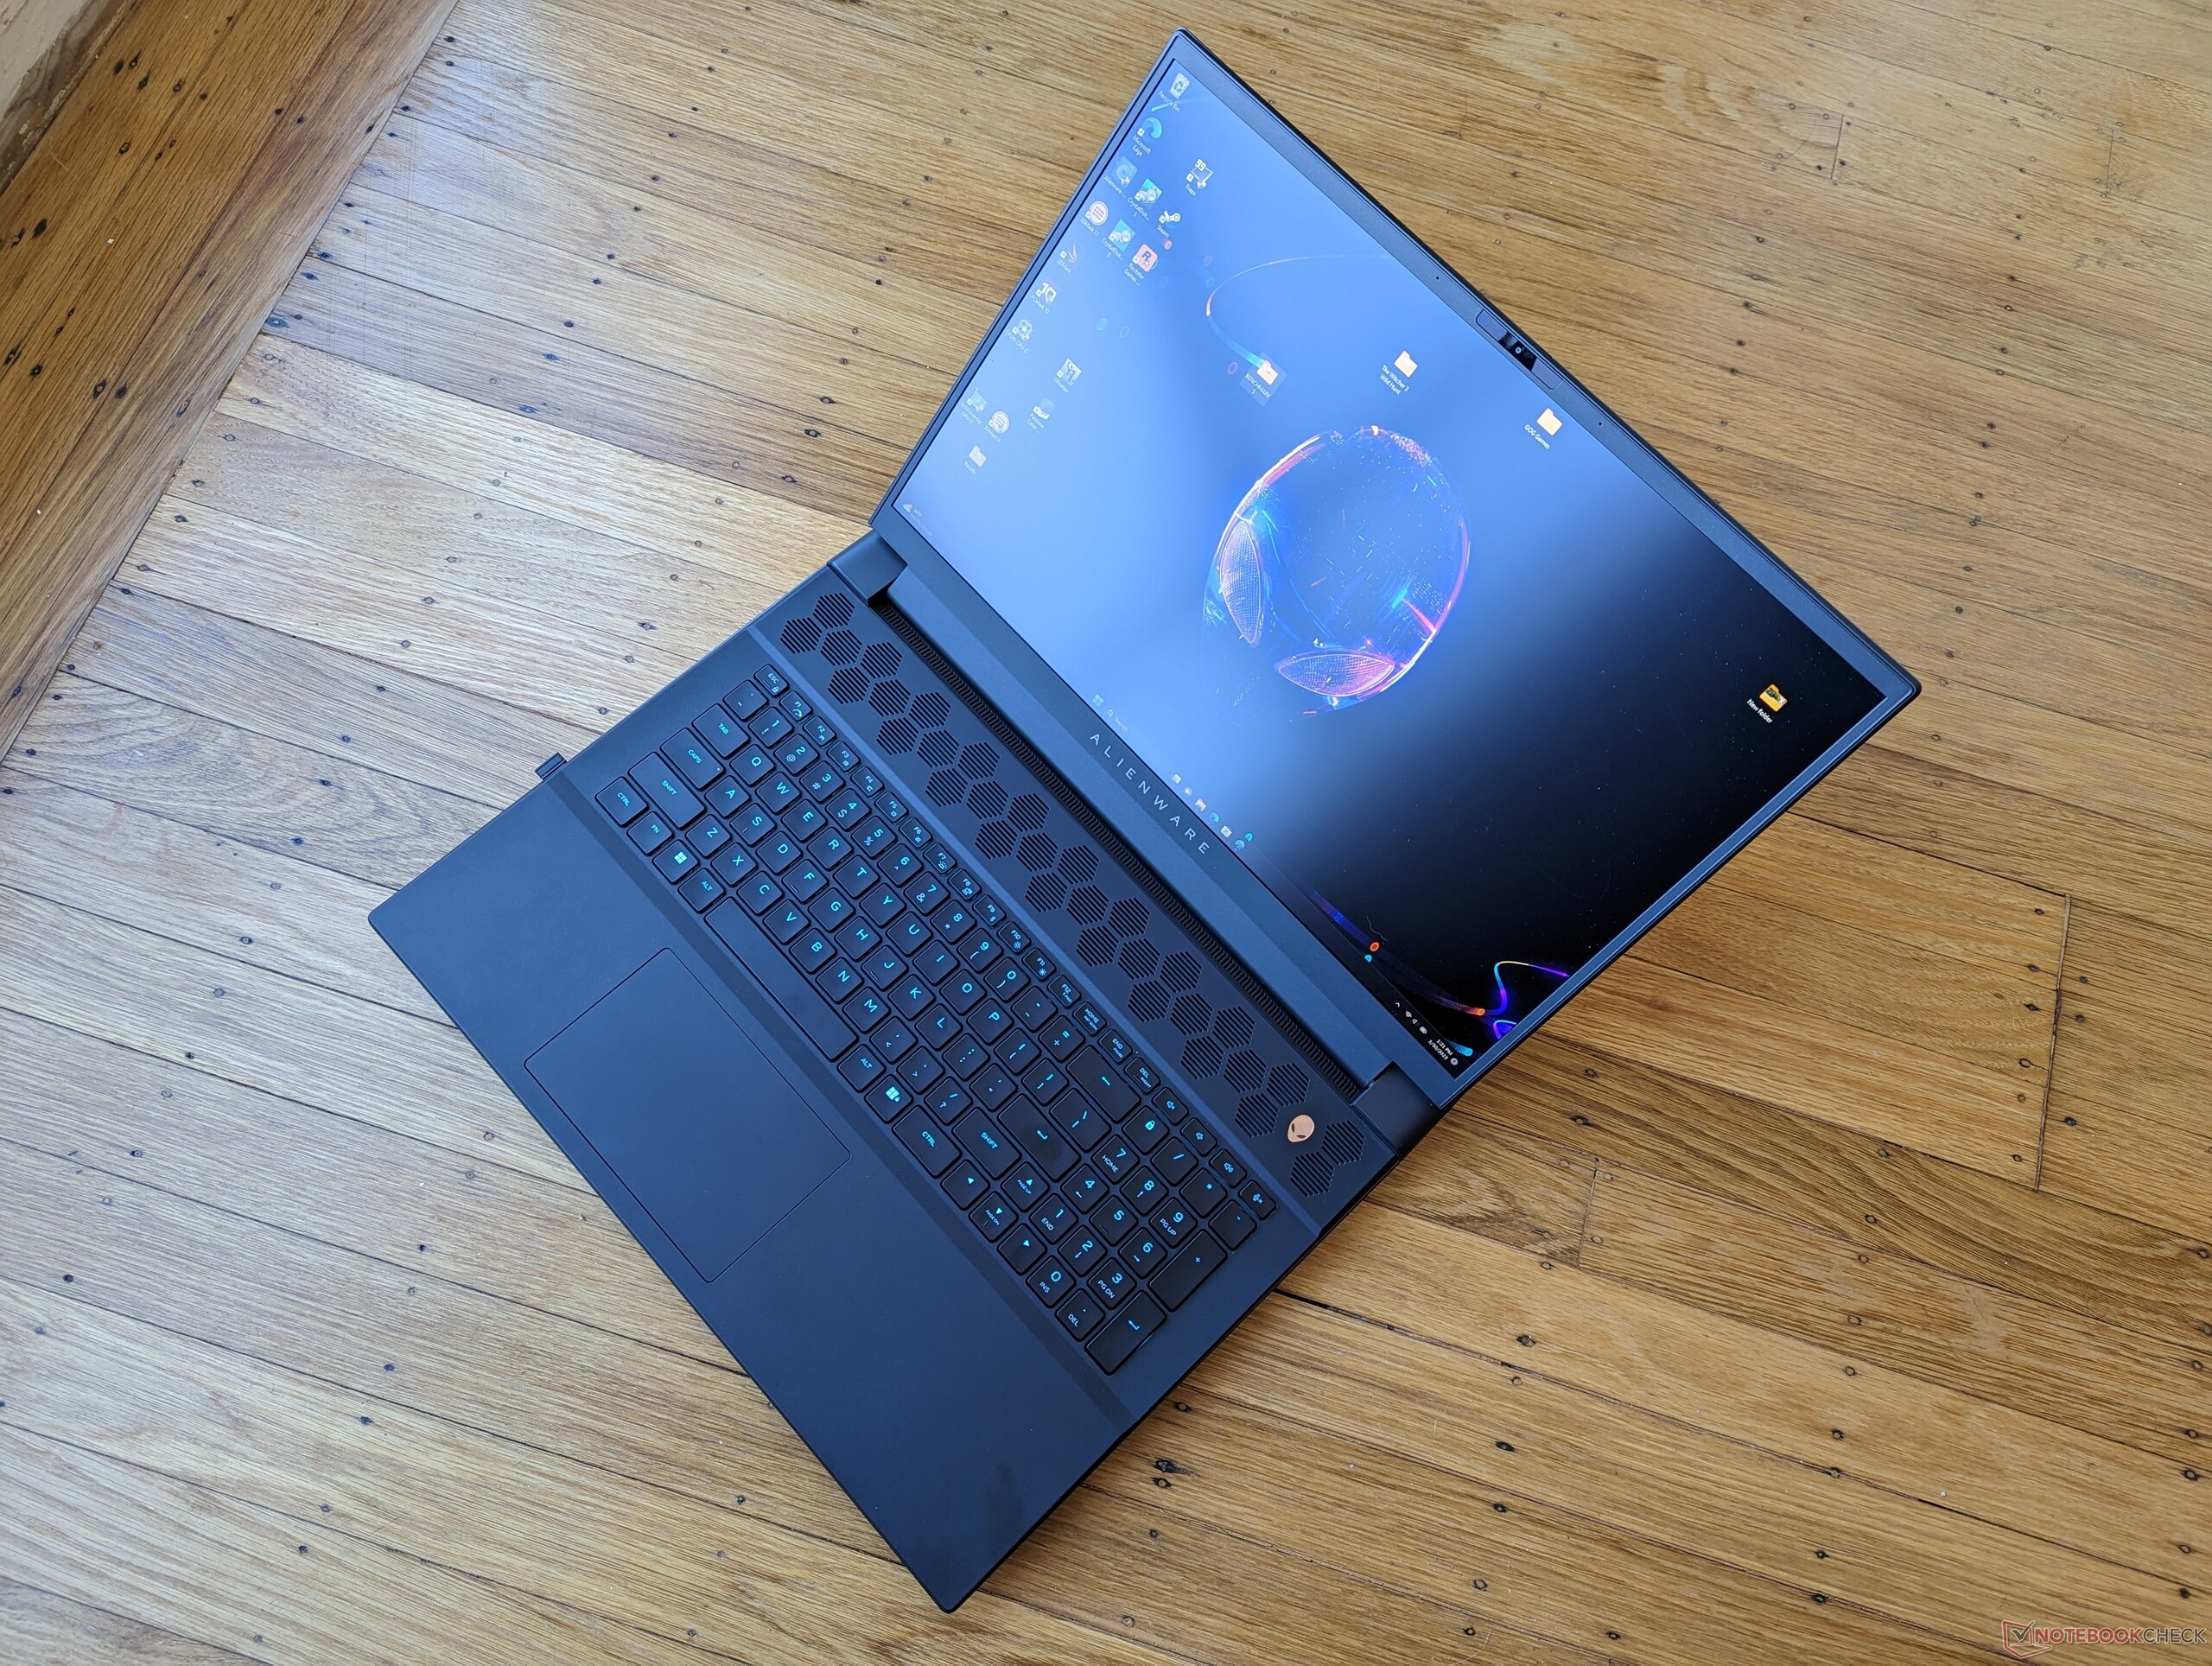
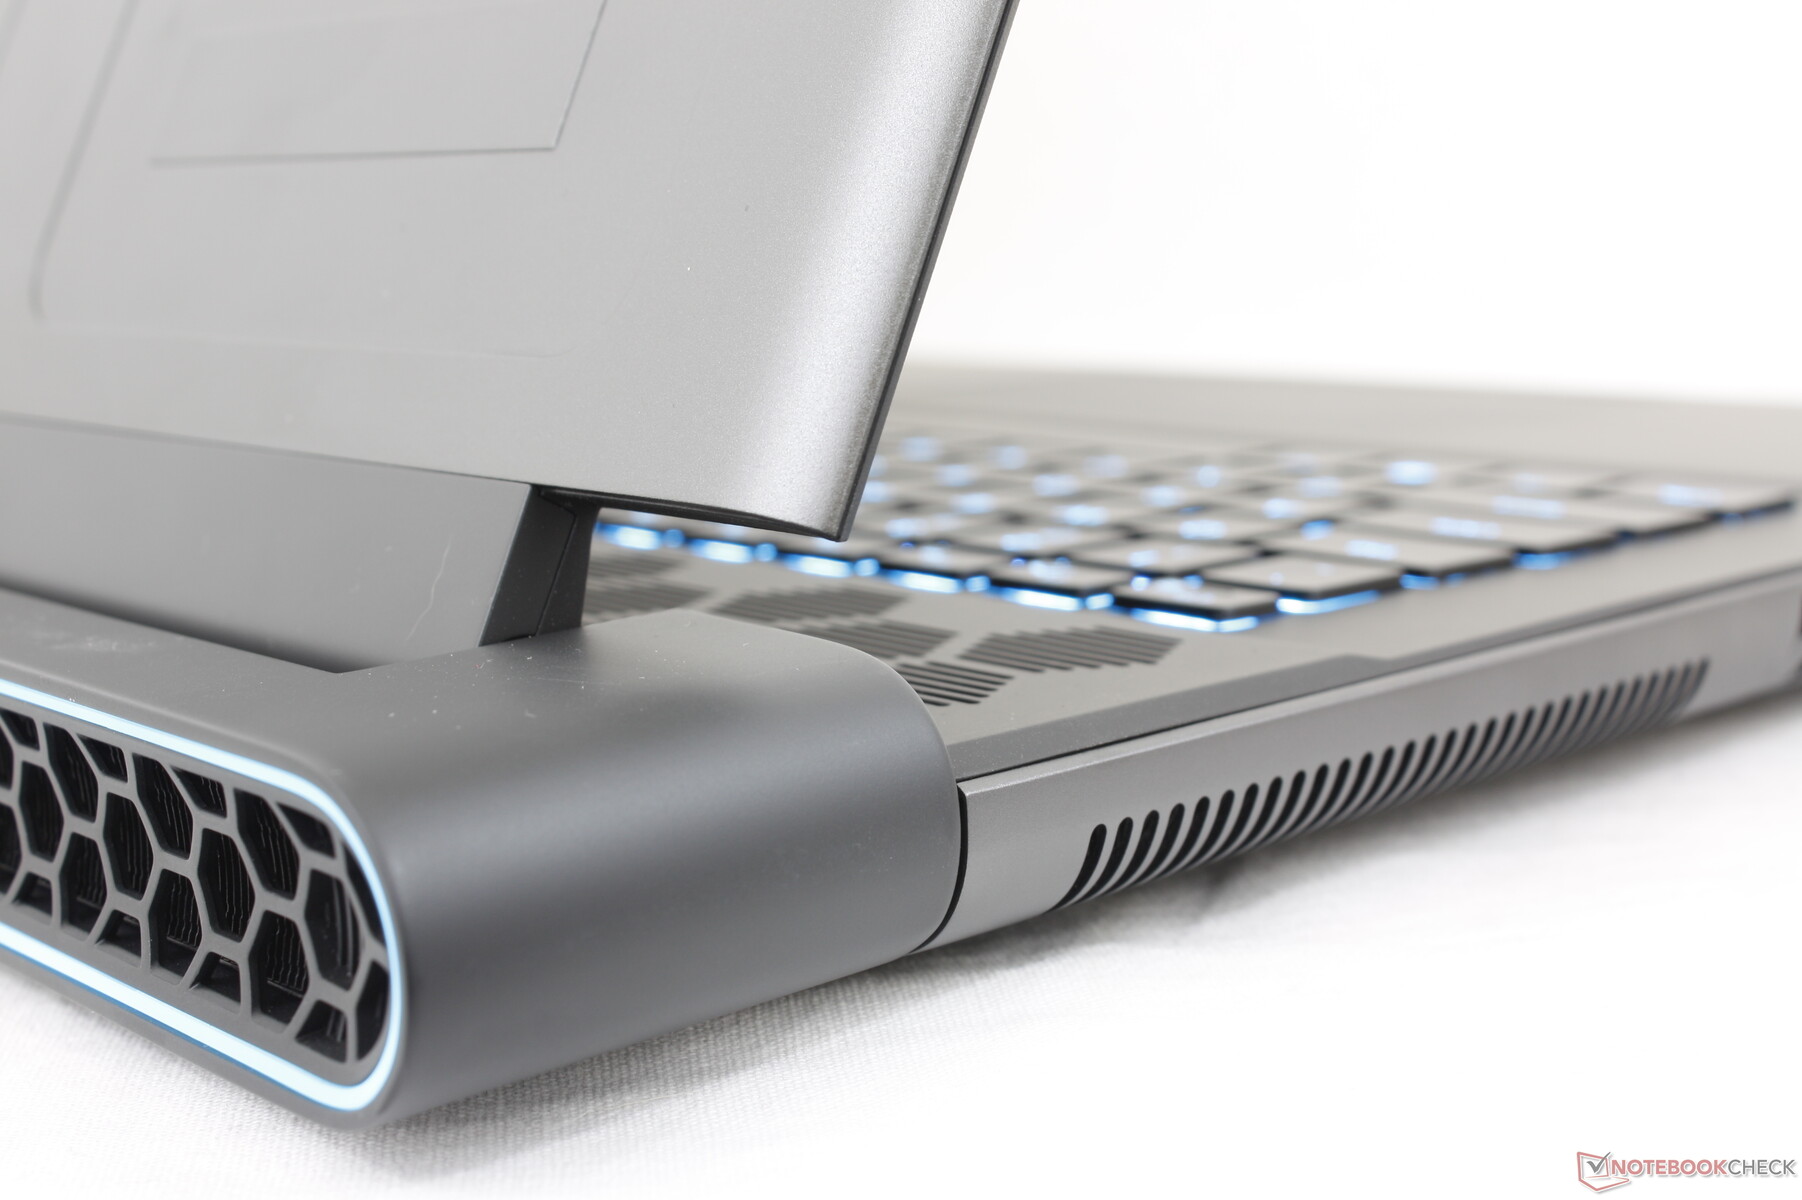
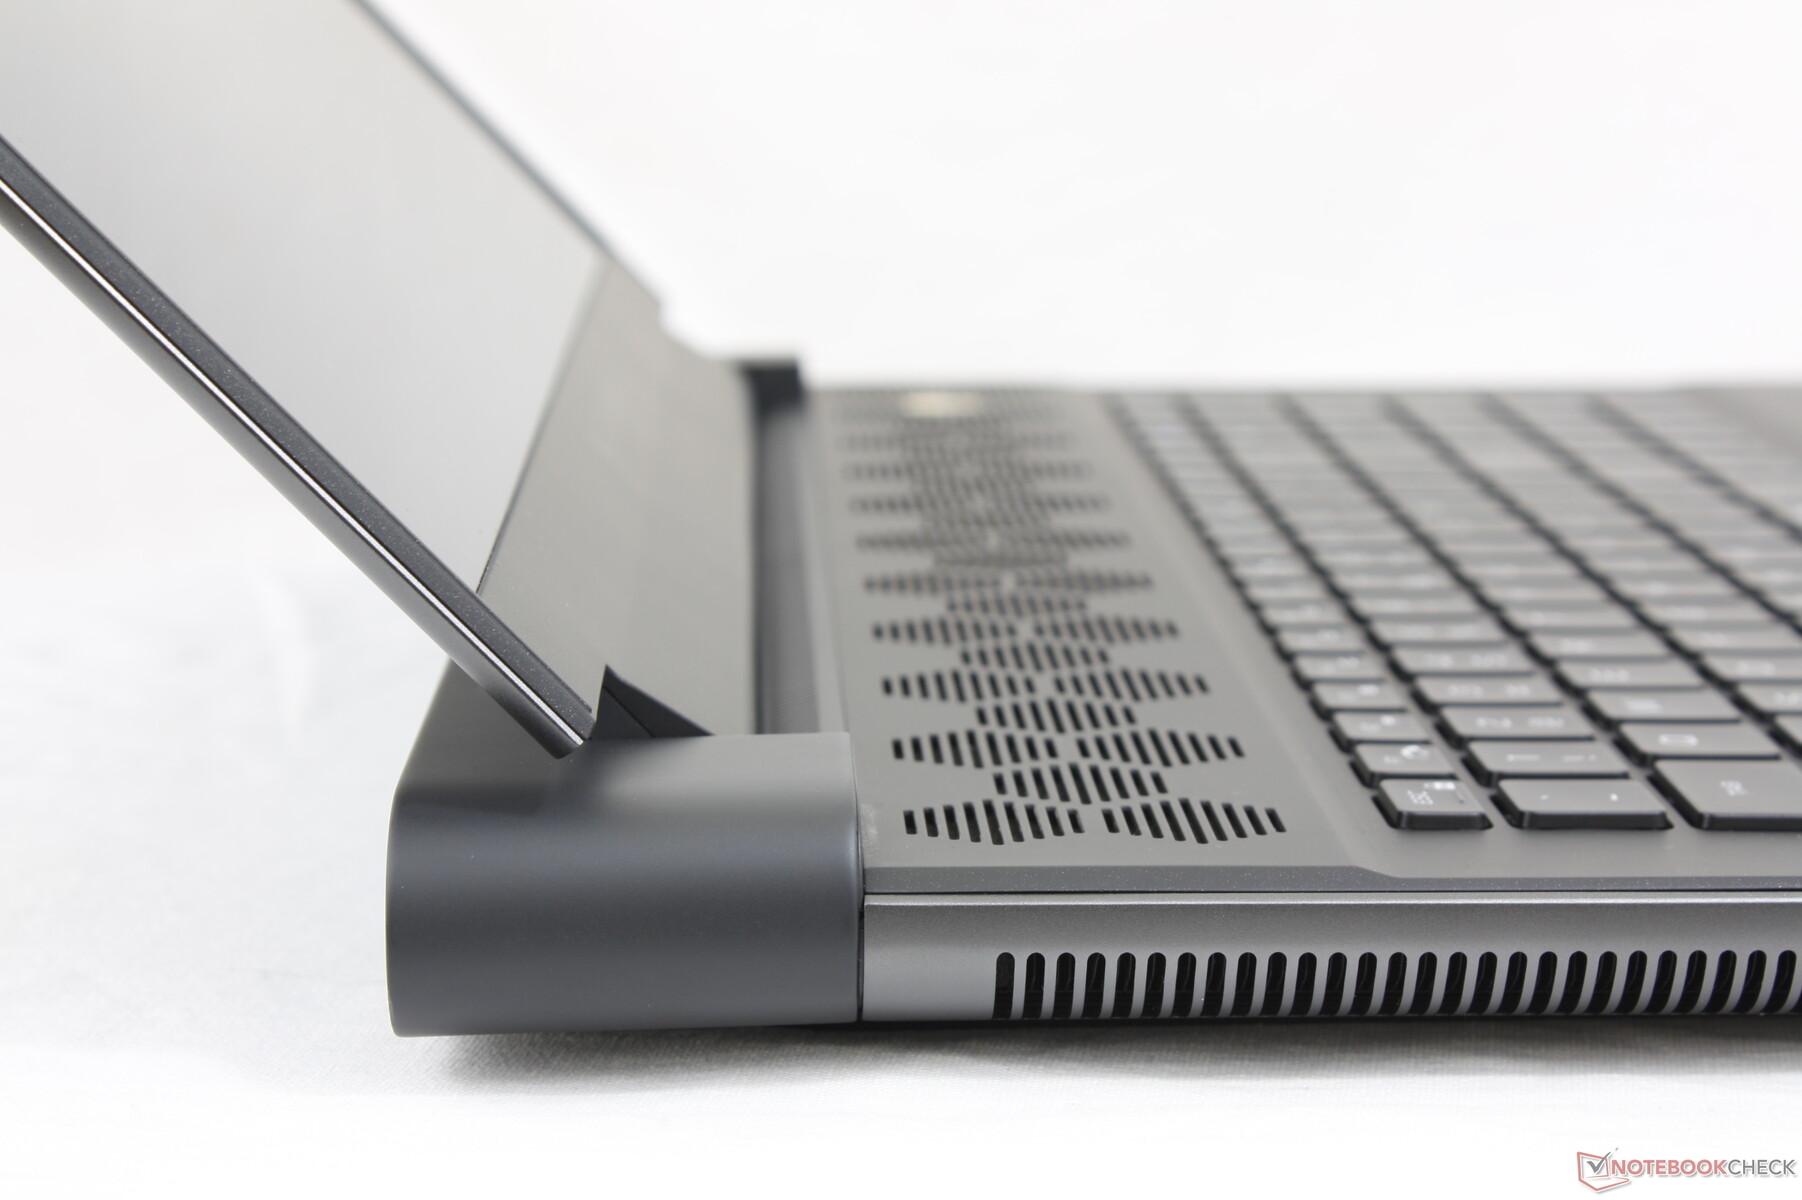
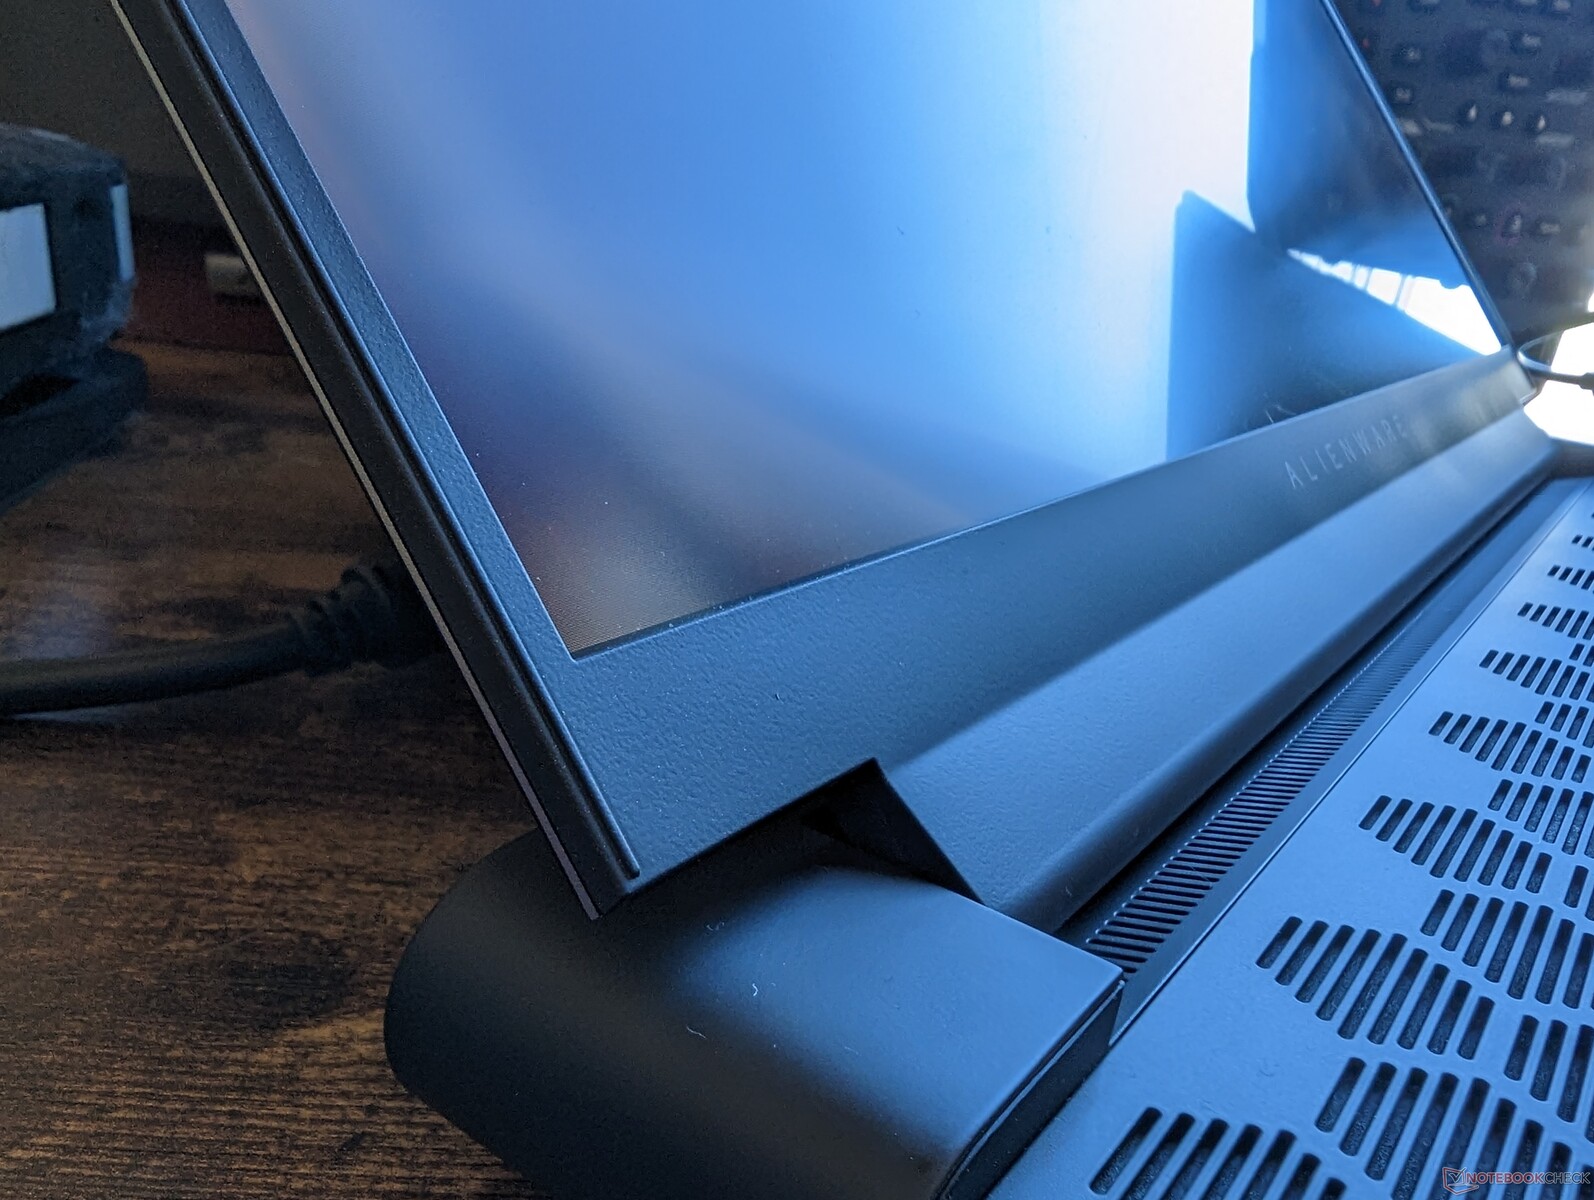
Cas - Legend 3 Design
Les impressions du châssis sont similaires à celles du récent Alienware x17 R2 puisque l'Alienware m18 R1 utilise des matériaux similaires. Sa construction dense et l'alignement serré entre les matériaux montrent qu'il n'est pas nécessaire d'avoir un design unibody comme le Razer Blade 18 pour avoir une sensation de haute qualité. Tout, du centre du clavier au couvercle extérieur, est plus ferme et plus résistant aux torsions et aux dépressions que sur beaucoup d'autres ordinateurs portables de jeu, y compris le MSI GE78.
Le clavier mat caoutchouté peut être un inconvénient car il recueille facilement la graisse et les traces de doigts au fil du temps.
Le modèle Alienware est nettement plus lourd que les modèles Blade 18 ou ROG Strix Scar 18 de 18 pouces.ROG Strix Scar 18 de près d'un kilogramme chacun, ce qui en fait l'un des ordinateurs portables les plus lourds de l'année. En fait, notre livreur a même commenté le poids de la boîte d'expédition par rapport à sa petite taille. Une grande partie du poids peut être attribuée à l'arrière allongé, au profil plus épais et au refroidisseur à chambre à vapeur, tous destinés à améliorer le refroidissement. Si vous vous souciez du poids lors de vos déplacements, vous devriez considérer le MSI Titan GT77 qui est en fait plus léger et plus fin que notre Alienware.
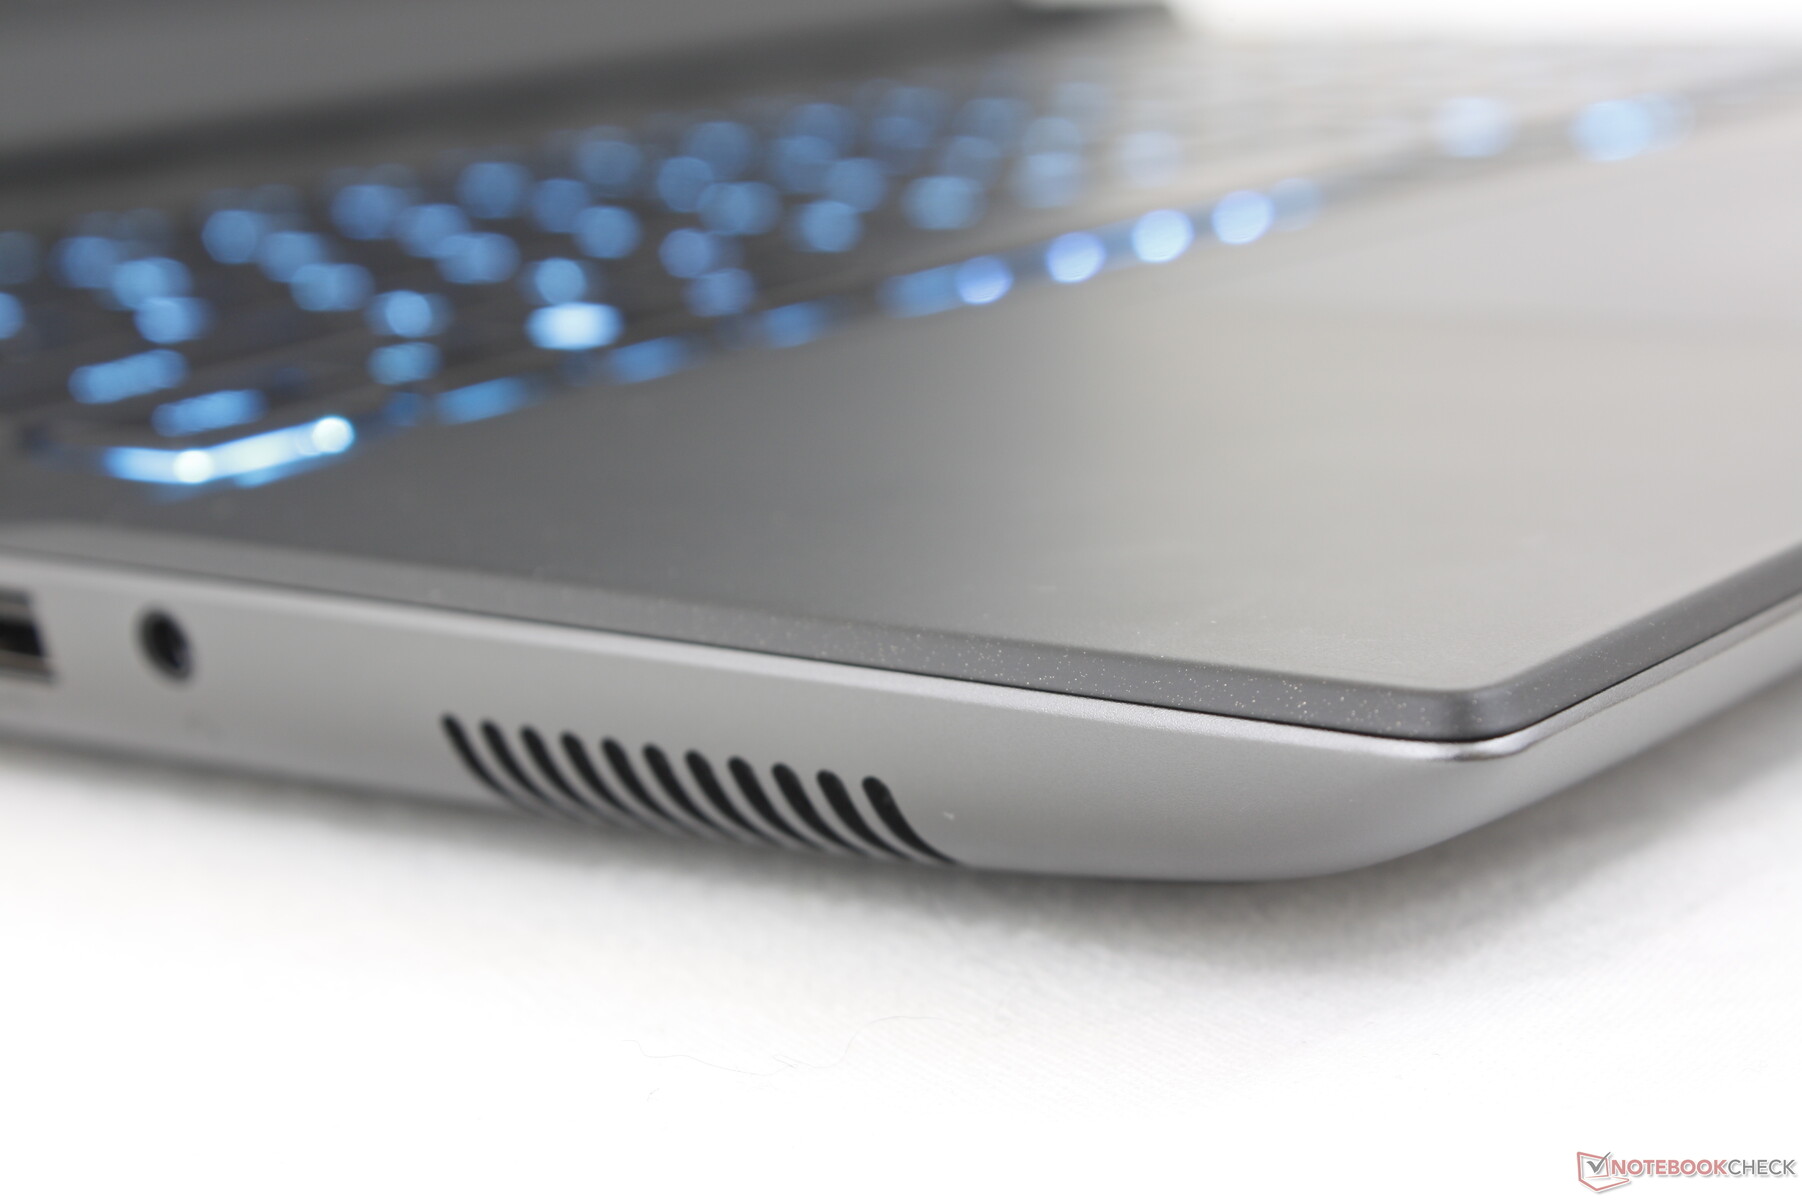
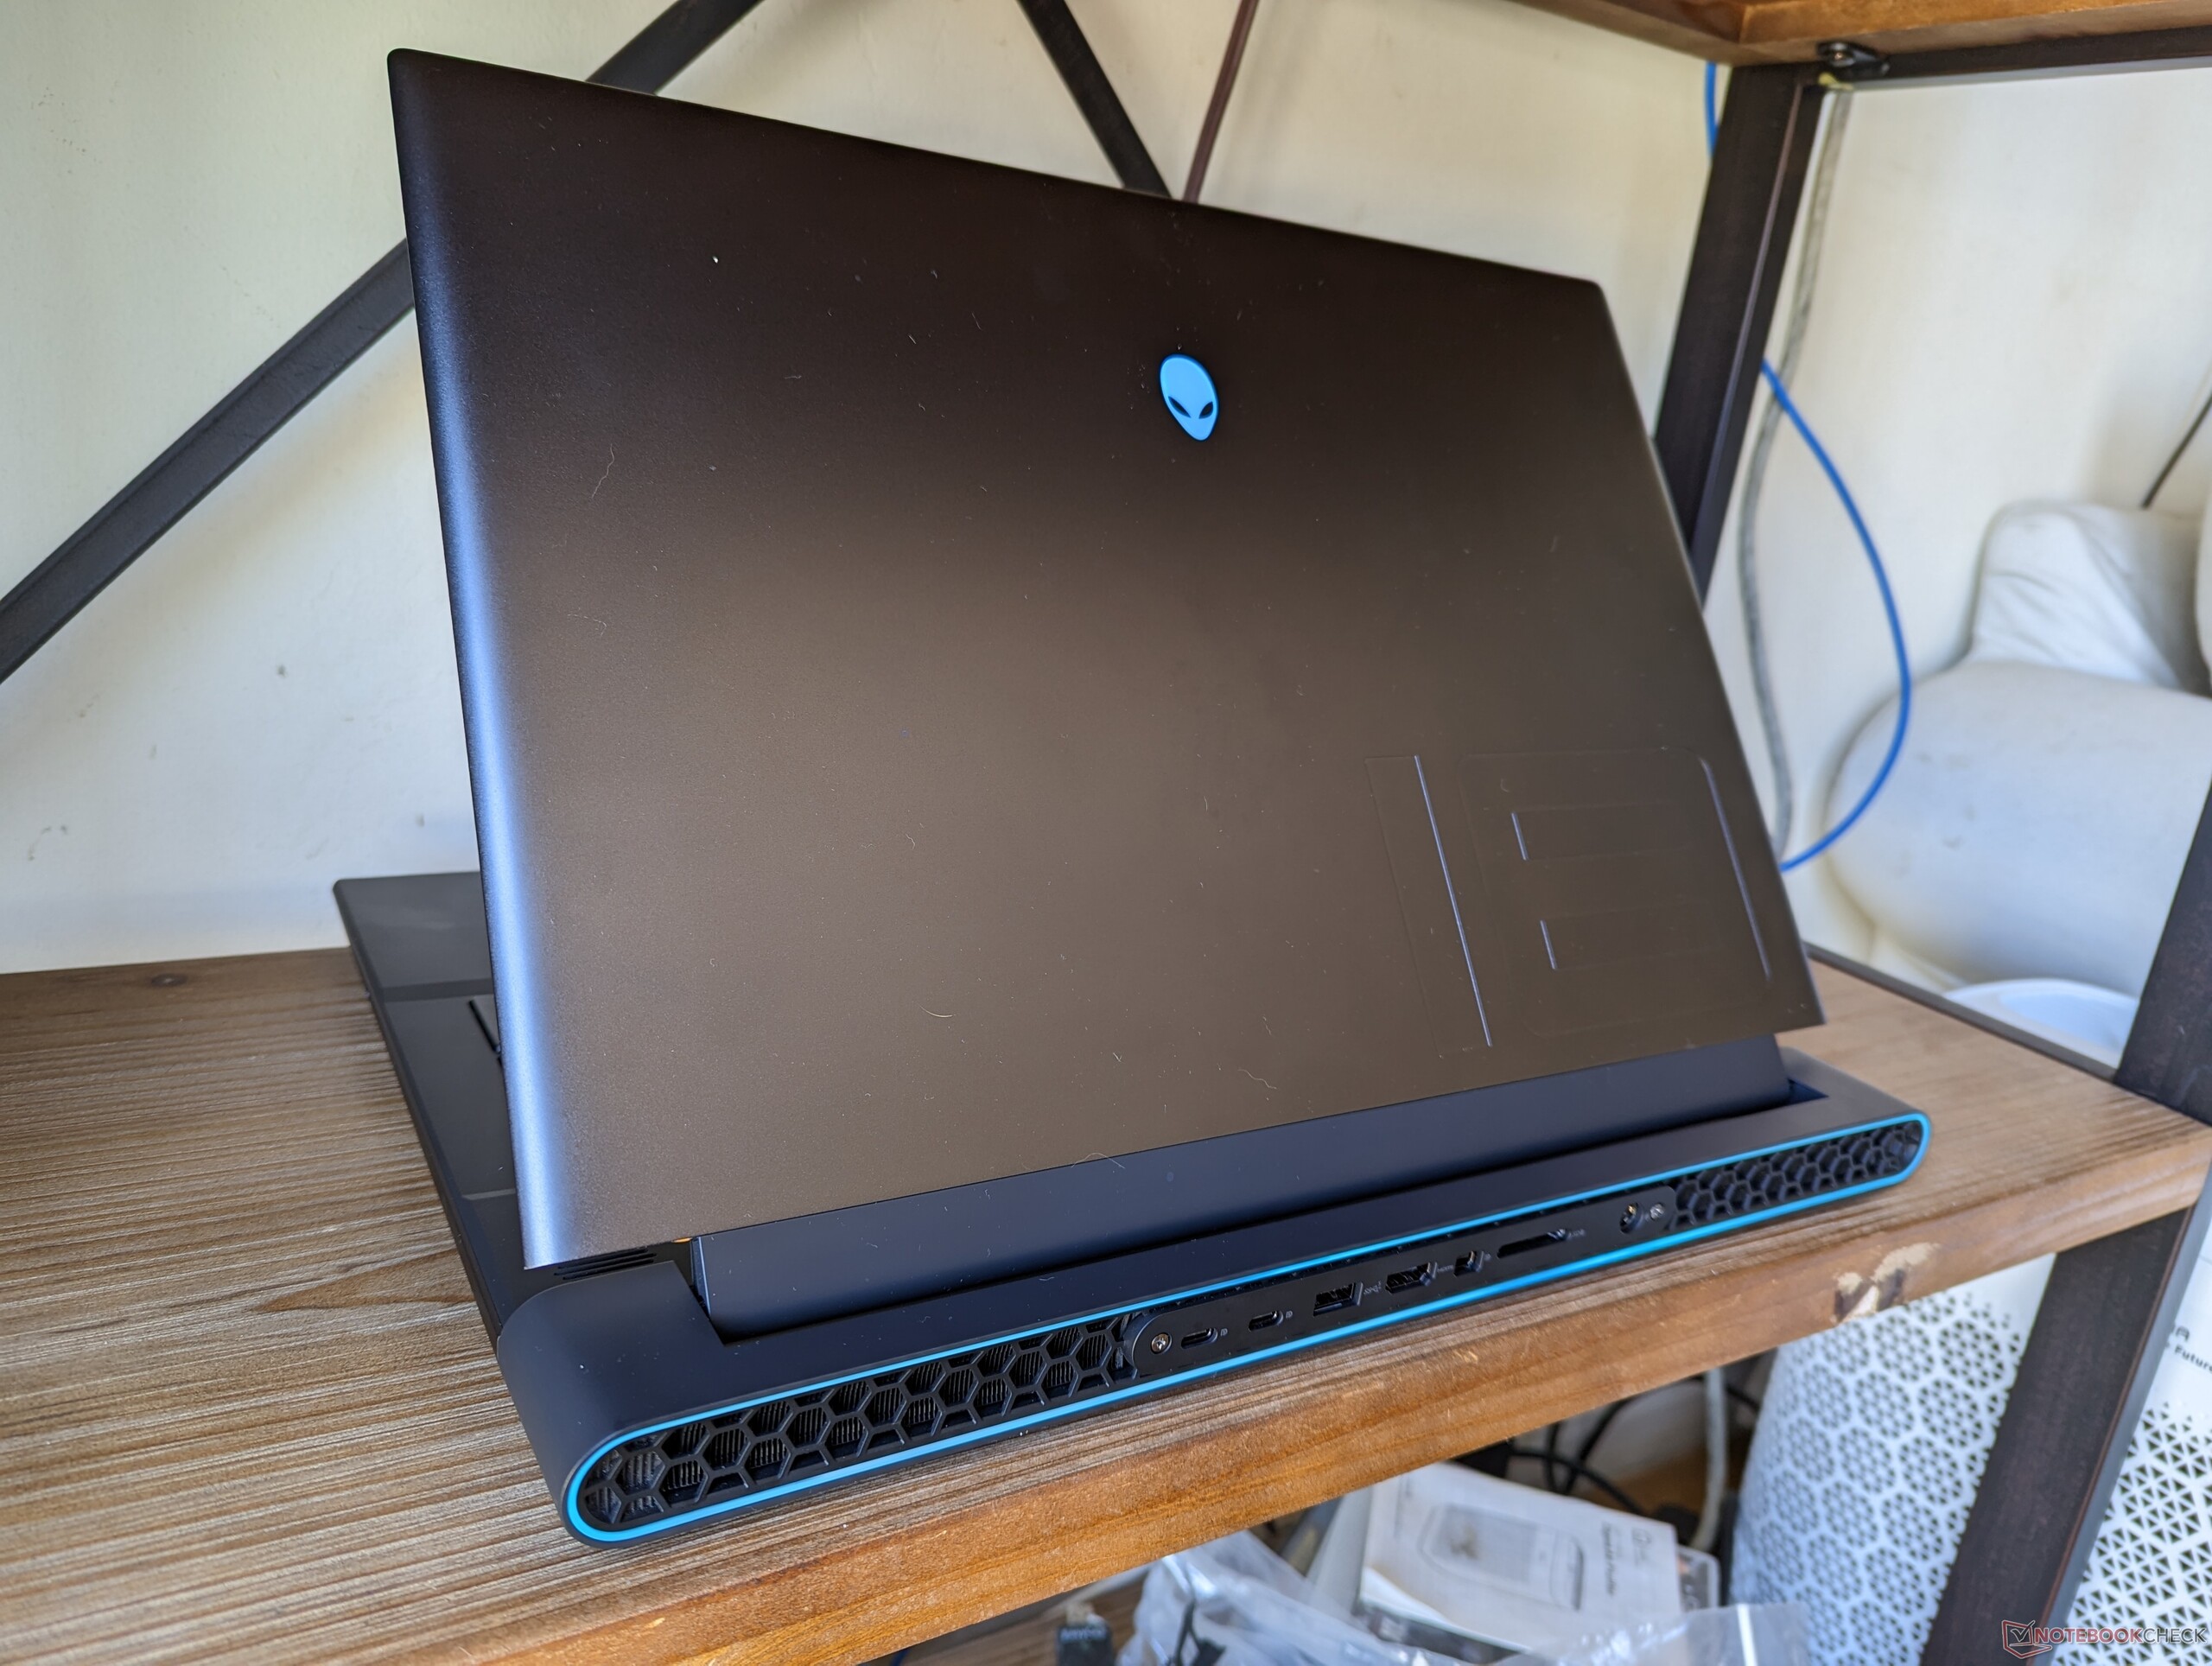
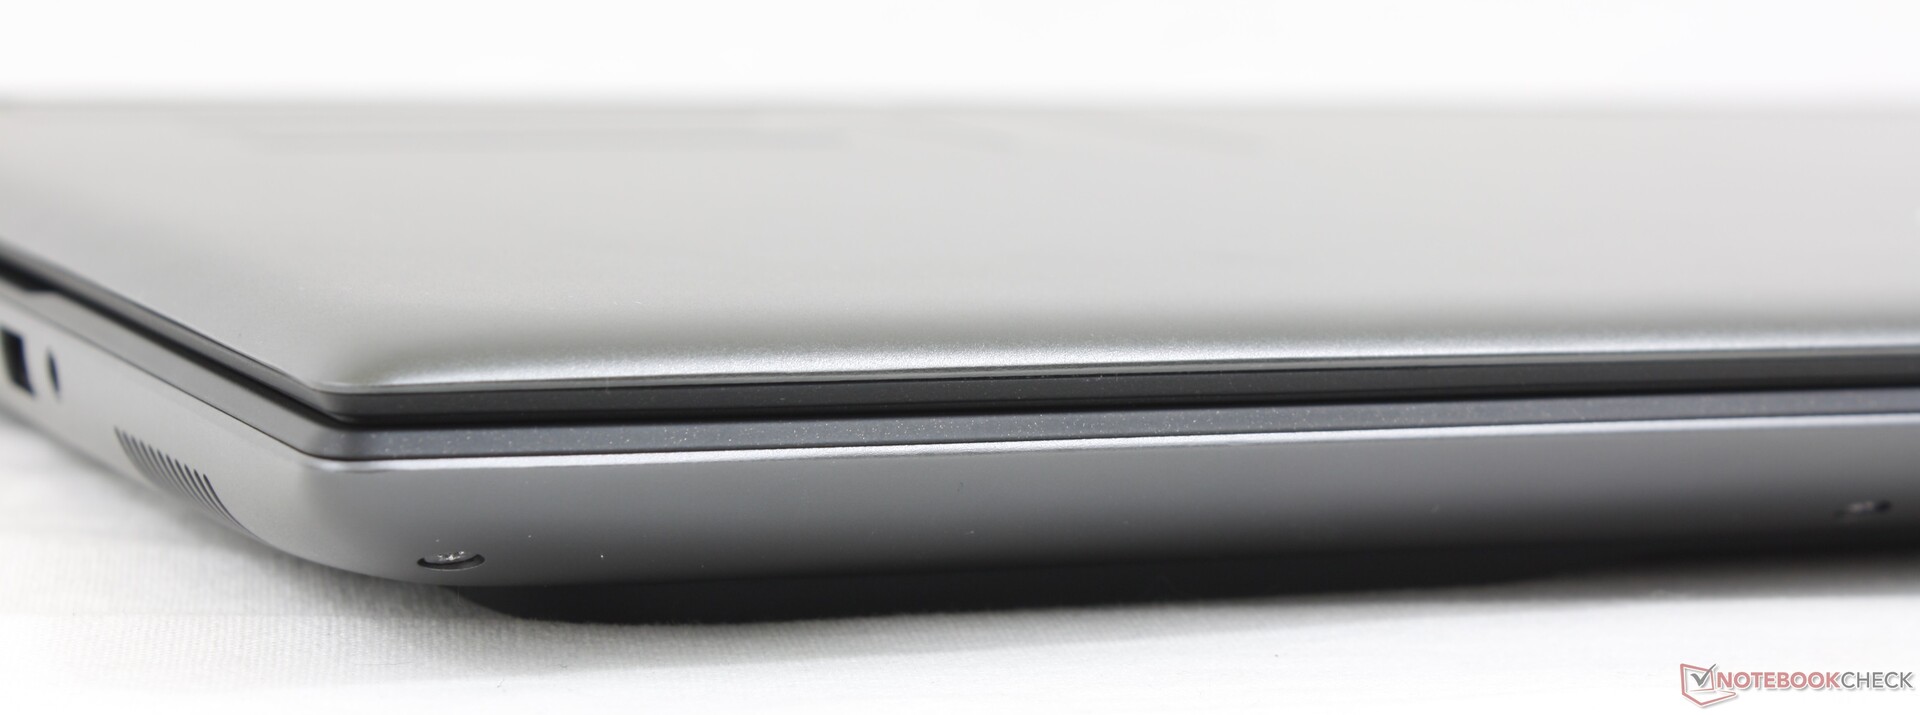
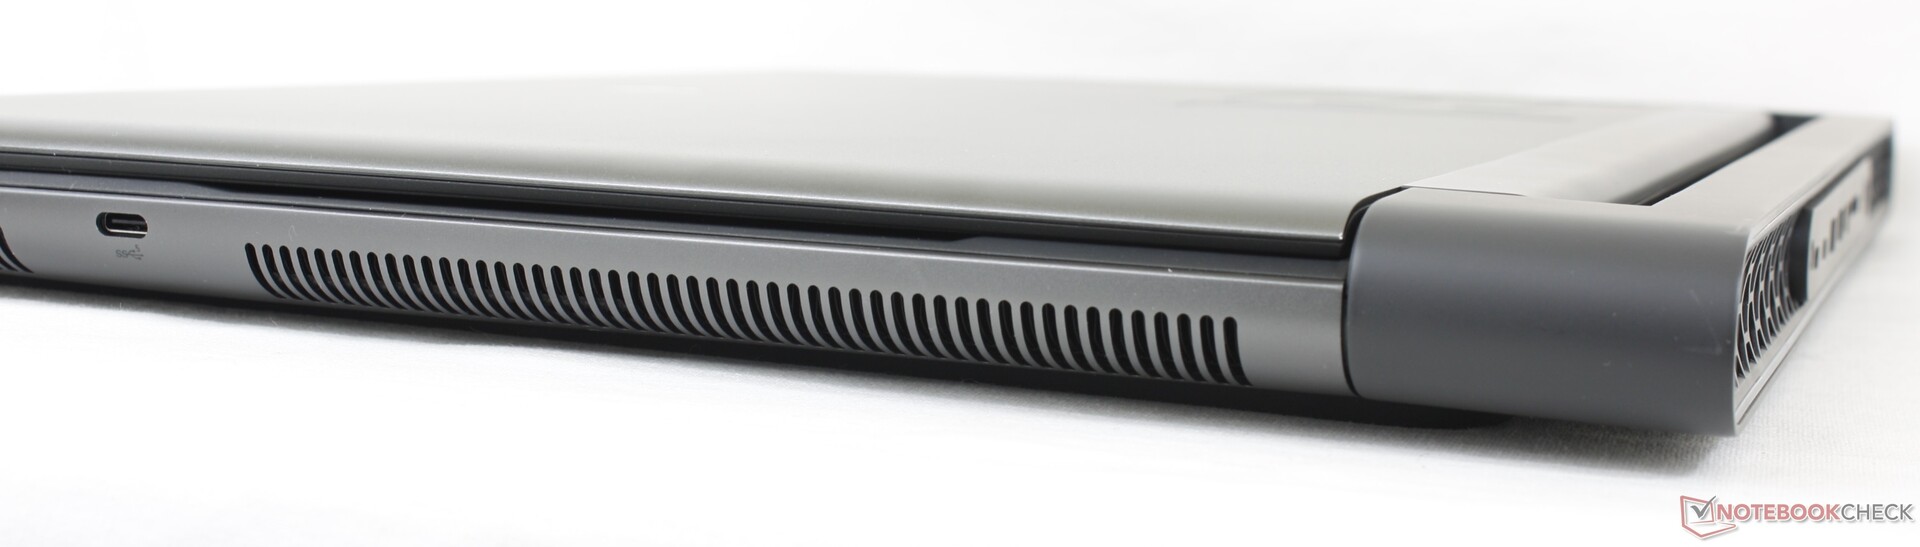
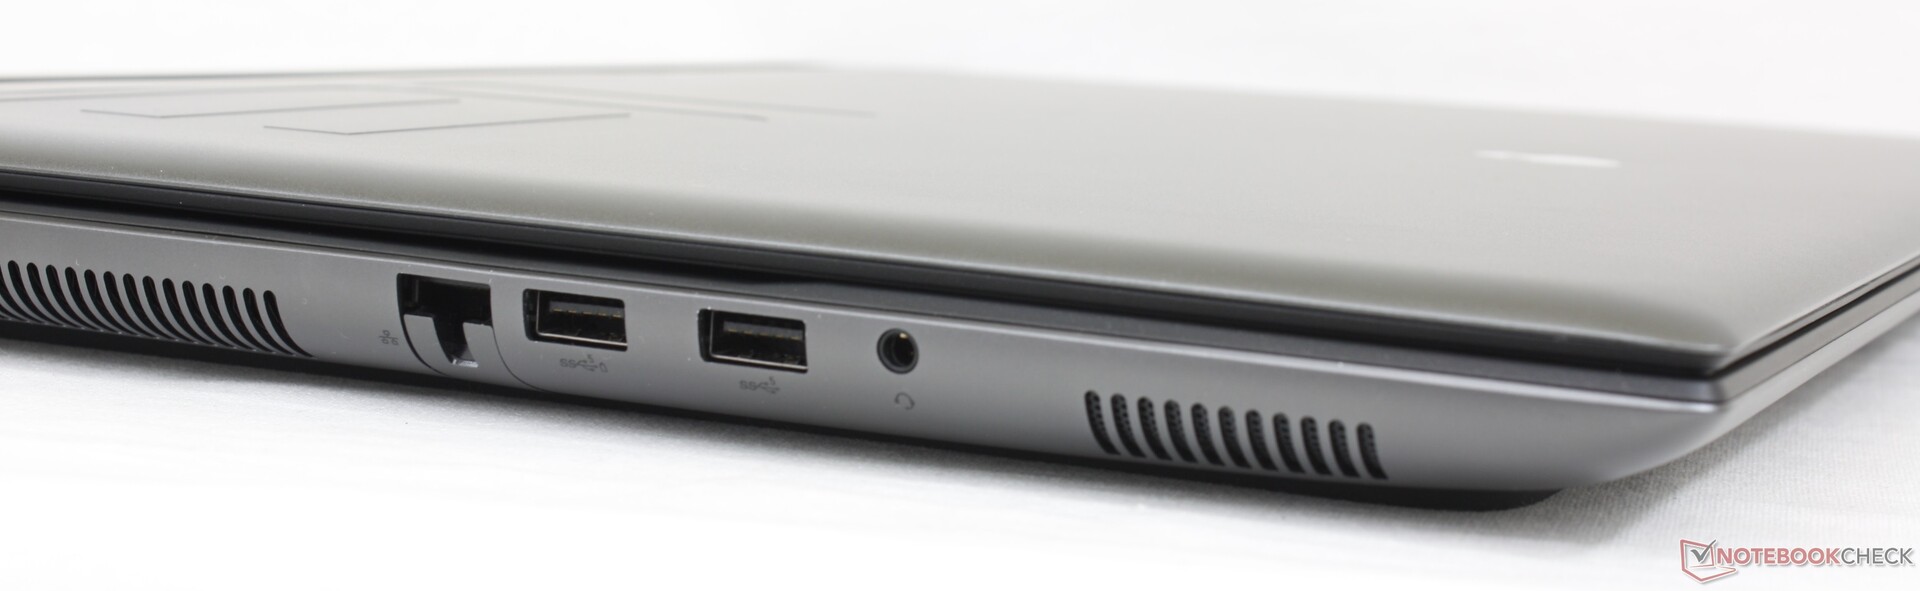
Connectivité - Plus que d'habitude
Il y a plus de ports intégrés sur l'Alienware que sur le Razer Blade 18 ou l'Asus ROG Strix Scar 18. Le problème, cependant, est que la plupart des ports sont serrés le long du bord arrière, ce qui les rend un peu plus difficiles d'accès.
Les moniteurs USB-C ne sont pris en charge que sur les deux ports USB-C arrière, le troisième port USB-C situé sur le bord droit ne prenant pas en charge la sortie vidéo.
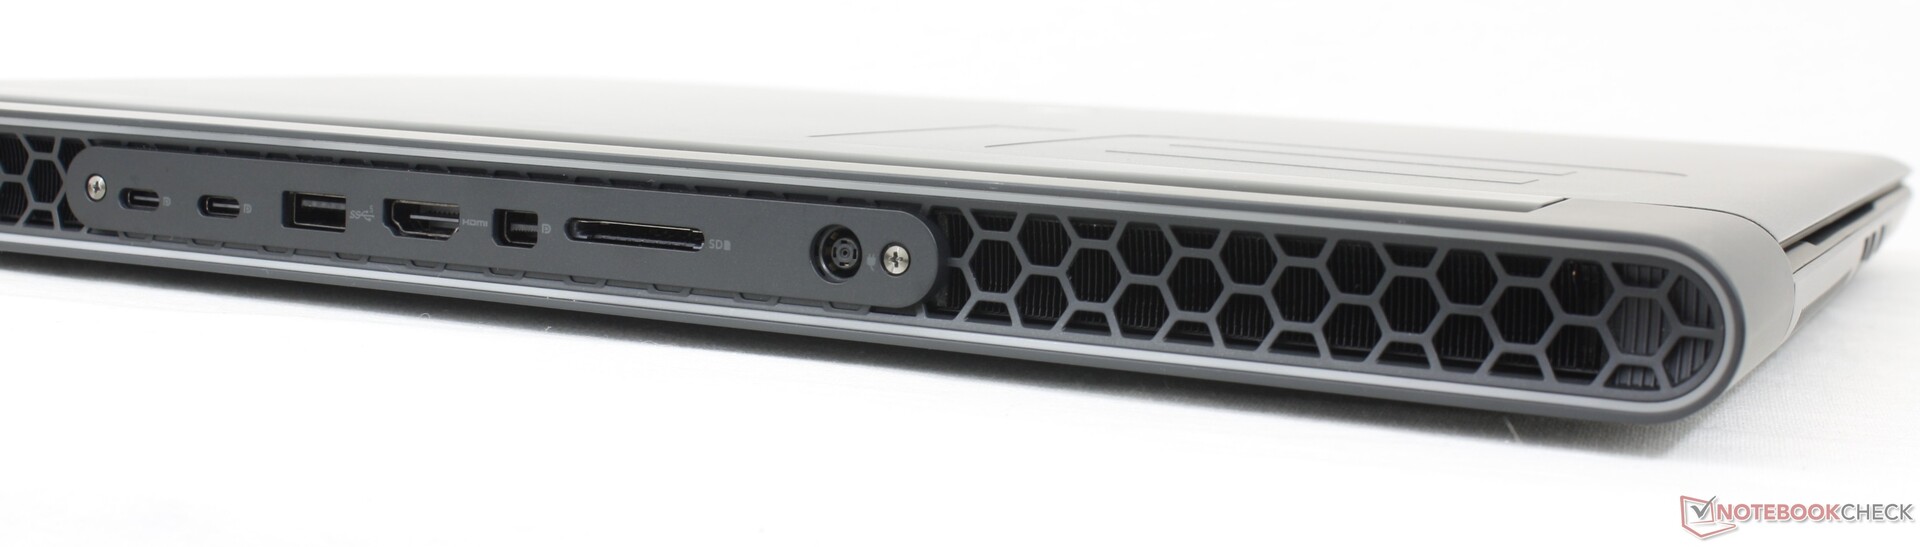
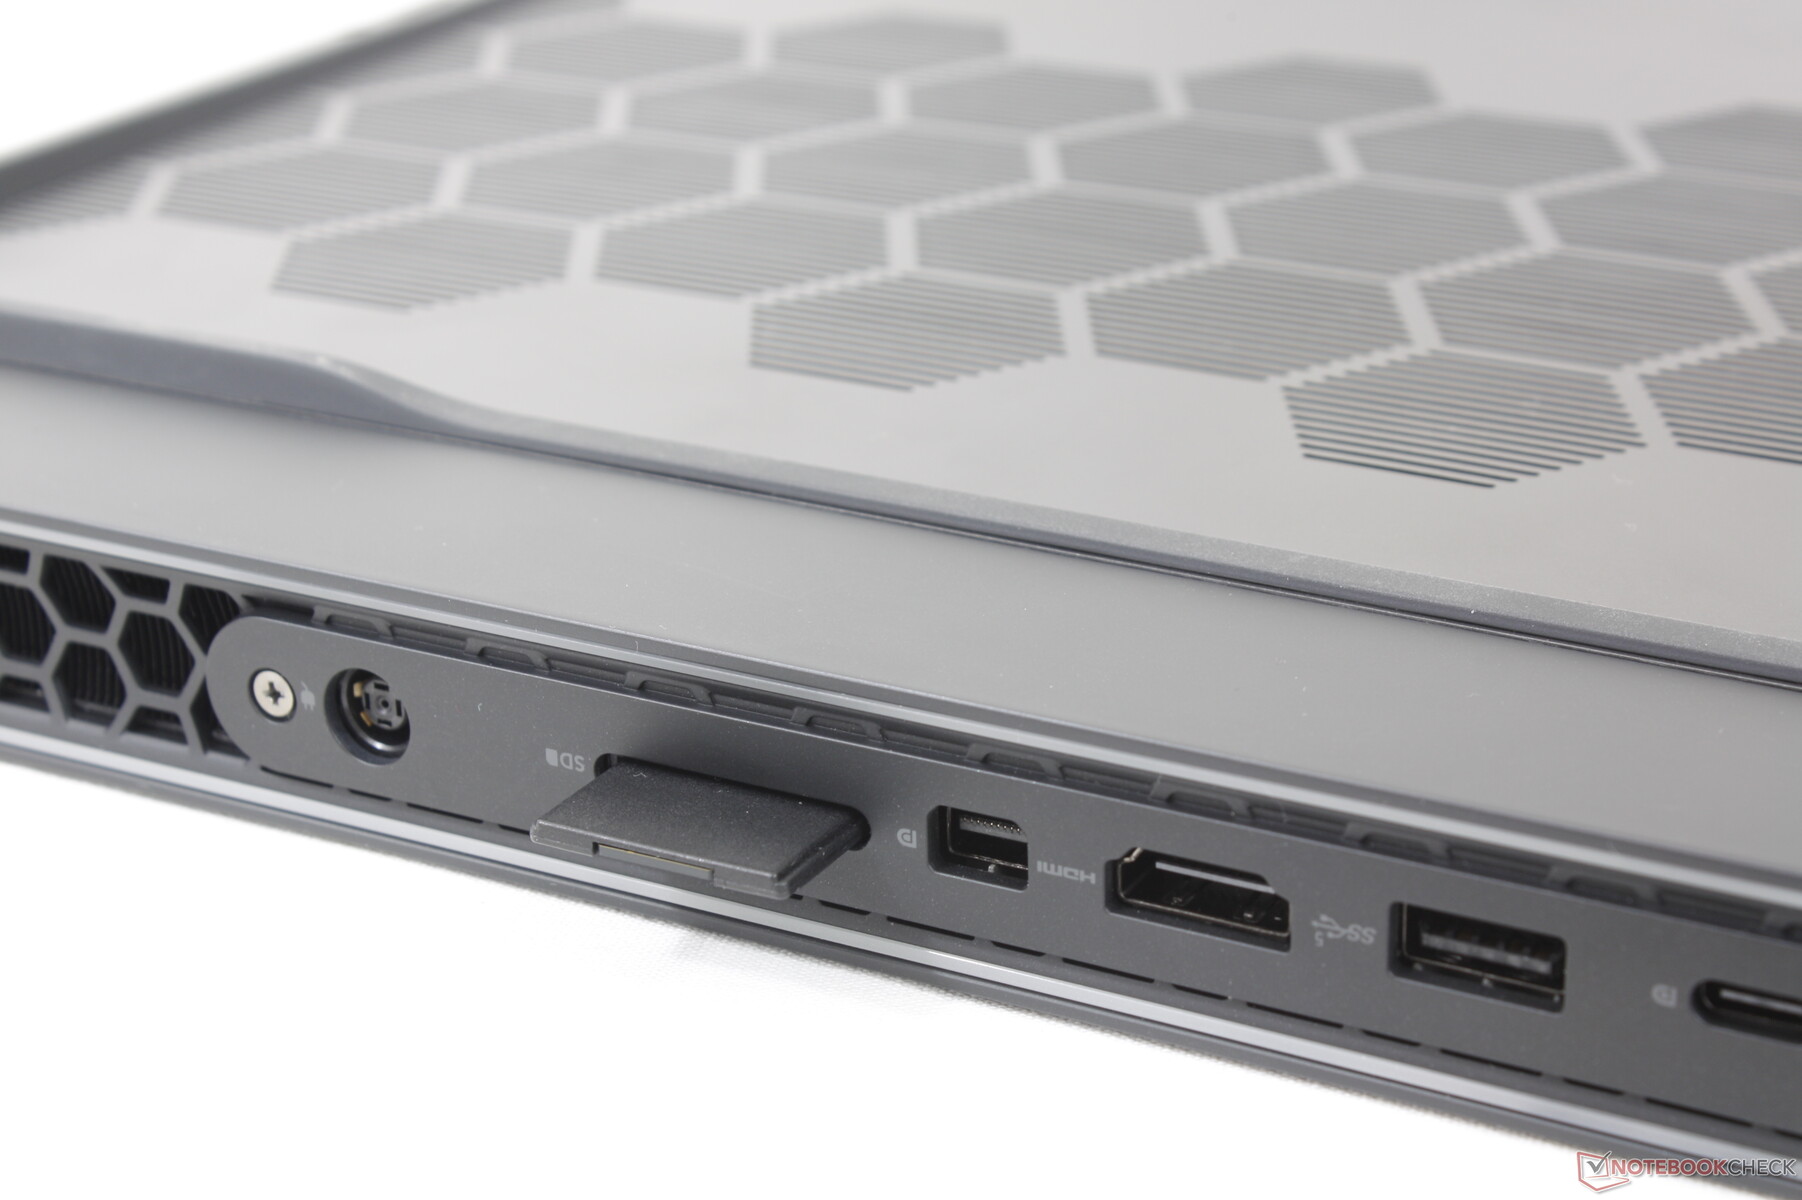
Lecteur de carte SD
Le lecteur de carte SD intégré se trouve à l'arrière de l'appareil, contrairement à la plupart des autres ordinateurs portables. Les taux de transfert sont néanmoins très rapides, plus de deux fois supérieurs à ceux de la MSI Titan GT77.
| SD Card Reader | |
| average JPG Copy Test (av. of 3 runs) | |
| Razer Blade 18 RTX 4070 (Angelibird AV Pro V60) | |
| Alienware m18 R1 (Angelibird AV Pro V60) | |
| Alienware x17 R2 P48E (AV Pro V60) | |
| MSI Titan GT77 HX 13VI (Angelibird AV Pro V60) | |
| Eluktronics Mech-17 GP2 (Angelibird AV Pro V60) | |
| maximum AS SSD Seq Read Test (1GB) | |
| Alienware x17 R2 P48E (AV Pro V60) | |
| Alienware m18 R1 (Angelibird AV Pro V60) | |
| Razer Blade 18 RTX 4070 (Angelibird AV Pro V60) | |
| Eluktronics Mech-17 GP2 (Angelibird AV Pro V60) | |
| MSI Titan GT77 HX 13VI (Angelibird AV Pro V60) | |
Communication
Un Intel Killer 1675i est livré en standard avec une compatibilité Wi-Fi 6E et Bluetooth 5.2. Killer est une sous-marque d'Intel optimisée pour les ordinateurs portables de jeu et le Killer 1675i est donc essentiellement un Intel AX211. Les performances sont excellentes et fiables lorsqu'il est associé à notre routeur de test Asus AXE11000.
| Networking | |
| iperf3 transmit AX12 | |
| Alienware x17 R2 P48E | |
| iperf3 receive AX12 | |
| Alienware x17 R2 P48E | |
| iperf3 transmit AXE11000 | |
| MSI Titan GT77 HX 13VI | |
| Asus ROG Strix Scar 18 2023 G834JY-N6005W | |
| Eluktronics Mech-17 GP2 | |
| Alienware m18 R1 | |
| Razer Blade 18 RTX 4070 | |
| iperf3 receive AXE11000 | |
| Asus ROG Strix Scar 18 2023 G834JY-N6005W | |
| MSI Titan GT77 HX 13VI | |
| Razer Blade 18 RTX 4070 | |
| Eluktronics Mech-17 GP2 | |
| Alienware m18 R1 | |
| iperf3 transmit AXE11000 6GHz | |
| Alienware m18 R1 | |
| Razer Blade 18 RTX 4070 | |
| iperf3 receive AXE11000 6GHz | |
| Razer Blade 18 RTX 4070 | |
| Alienware m18 R1 | |
Webcam
La webcam de 2 mégapixels est typique de la plupart des ordinateurs portables de nos jours, mais nous sommes légèrement déçus de ne pas voir un capteur de 5 mégapixels étant donné la taille du châssis. L'infrarouge est fourni en standard, mais l'obturateur de la webcam est absent, contrairement au Razer Blade 18.


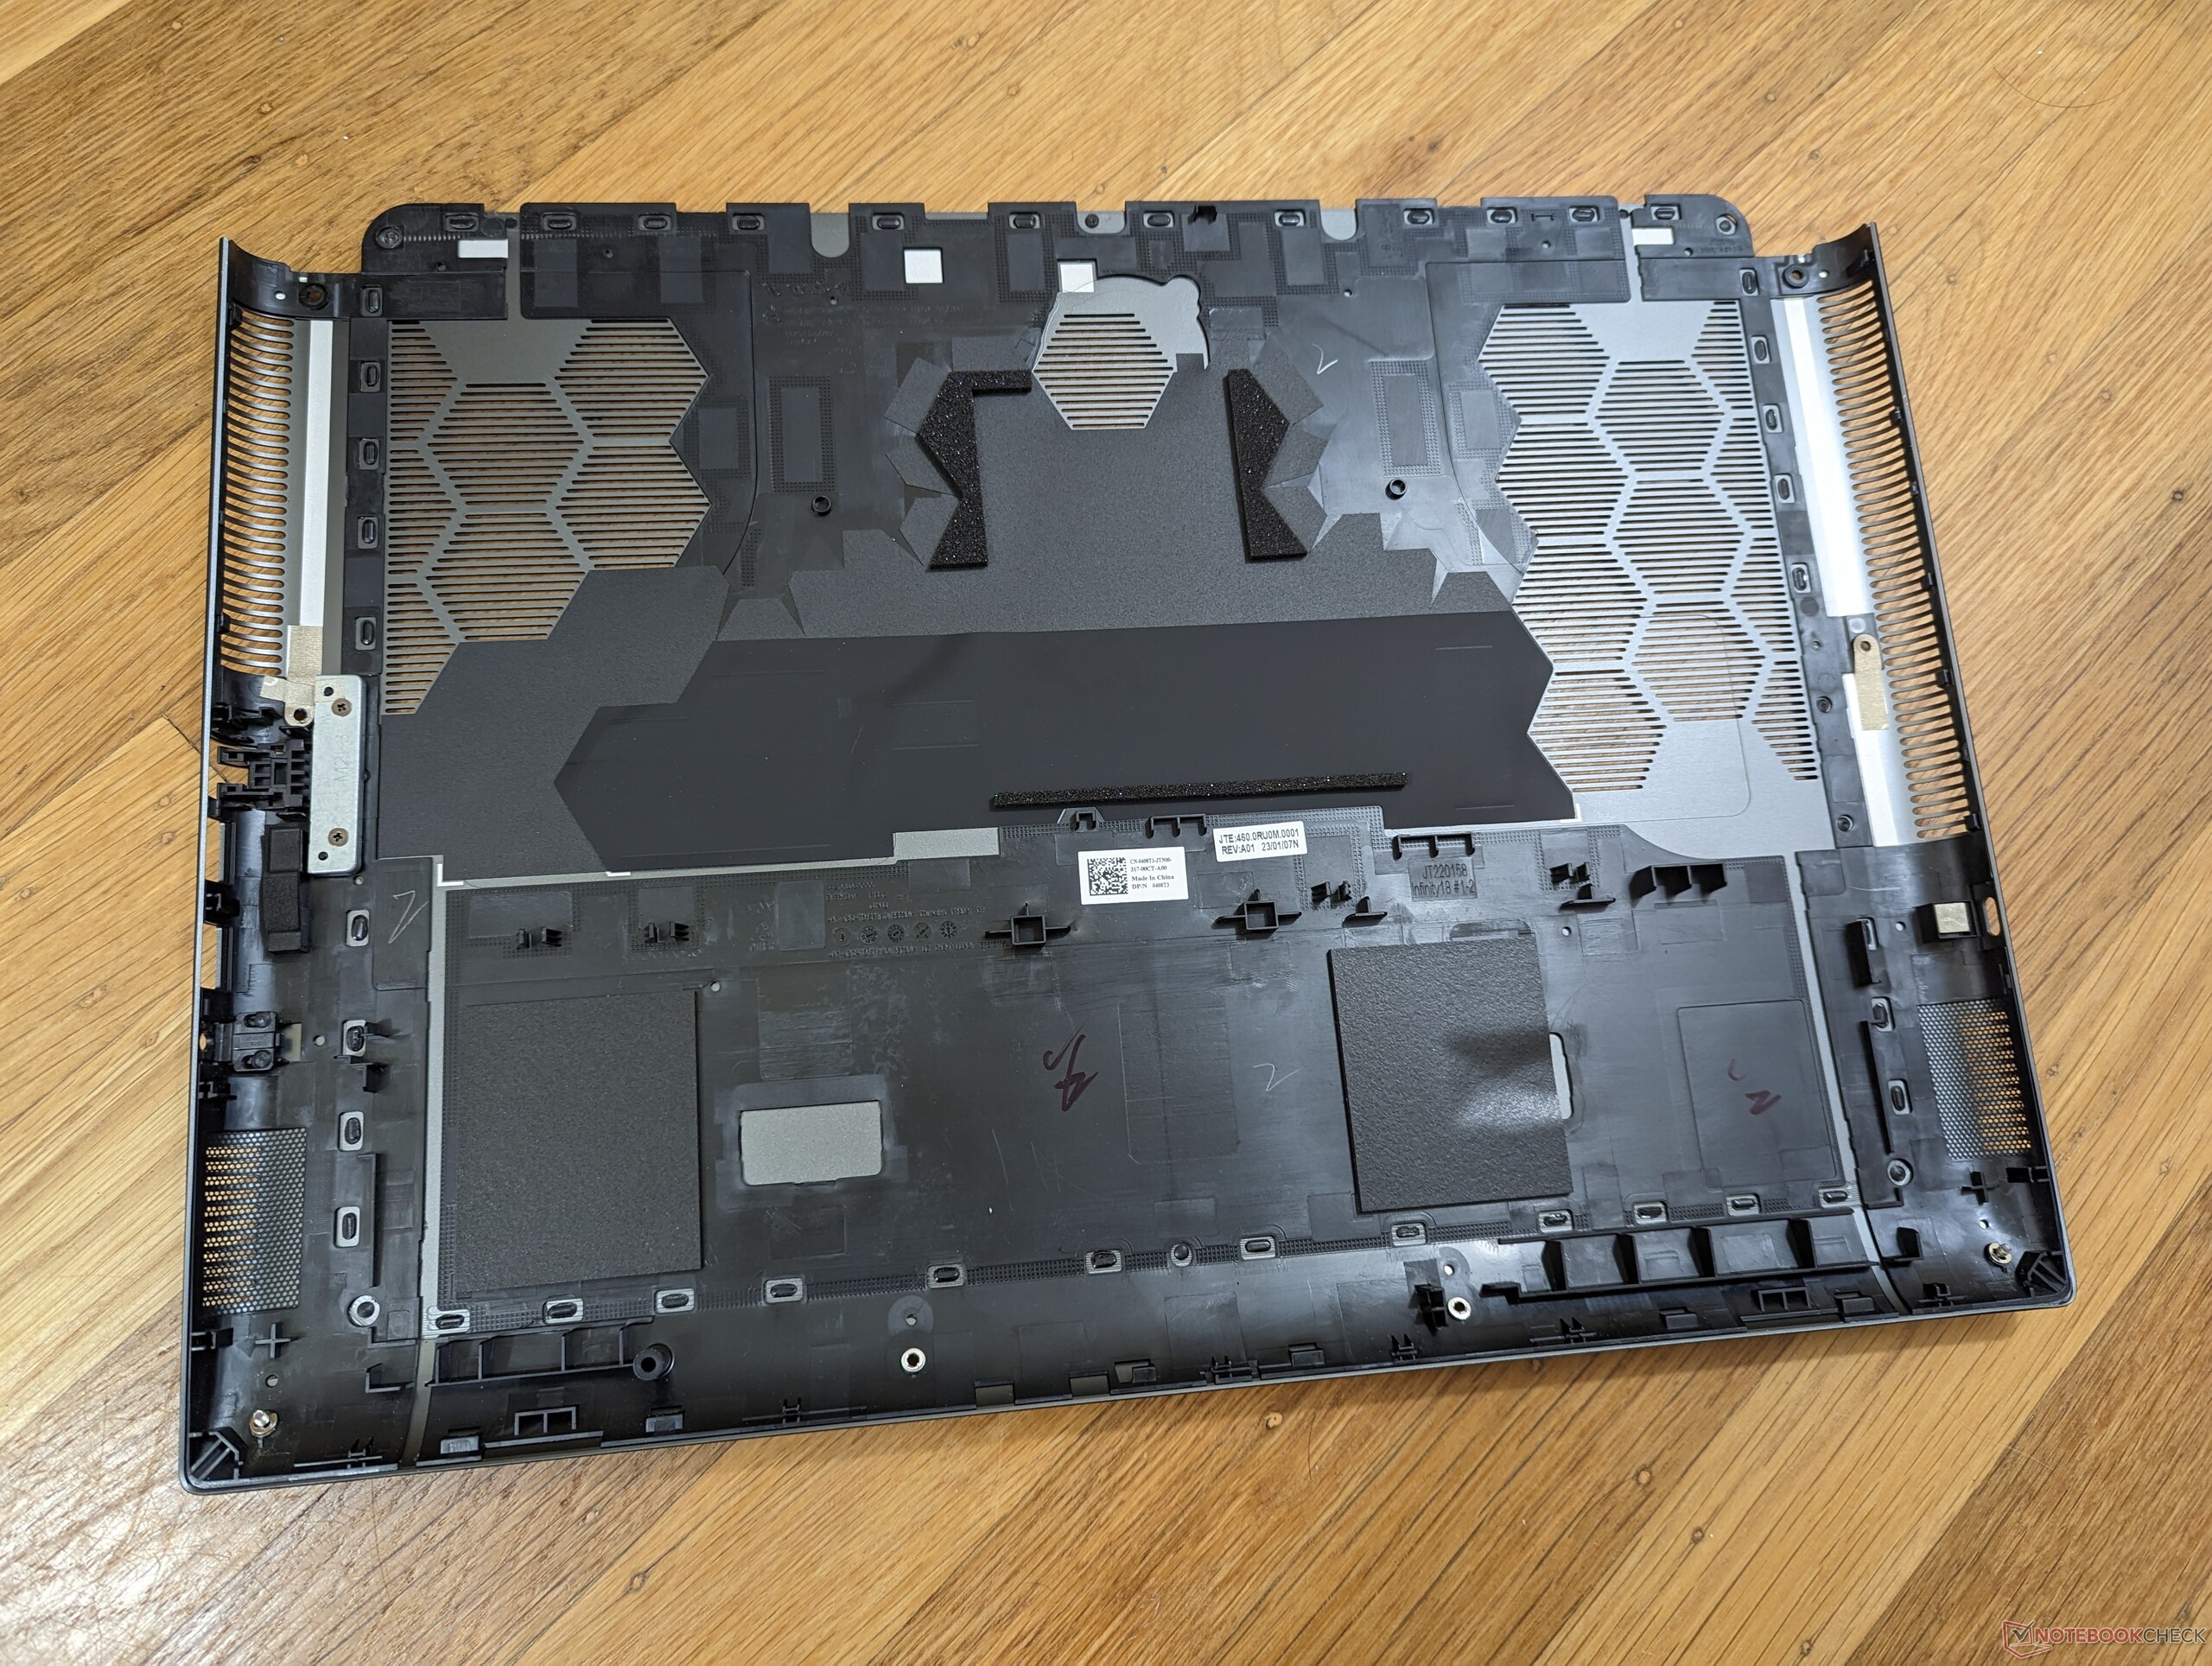
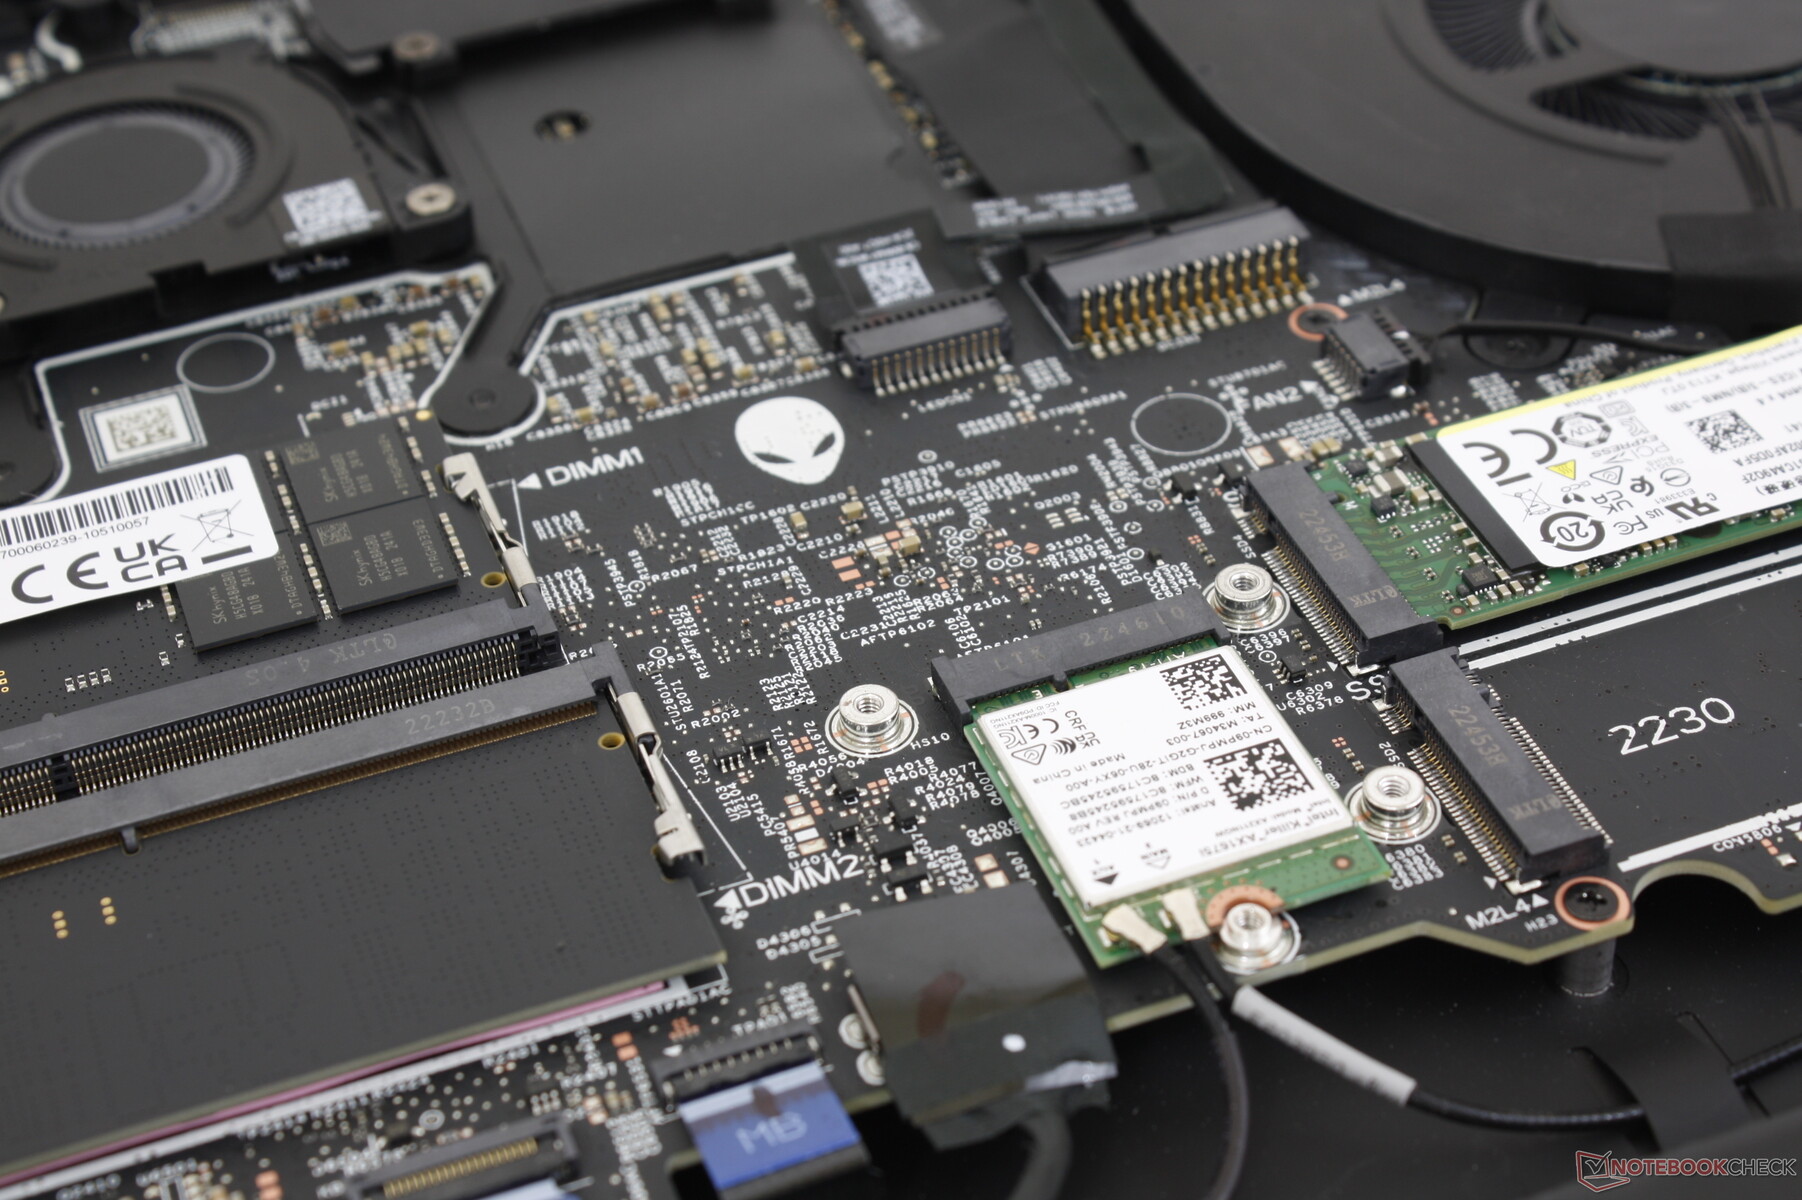
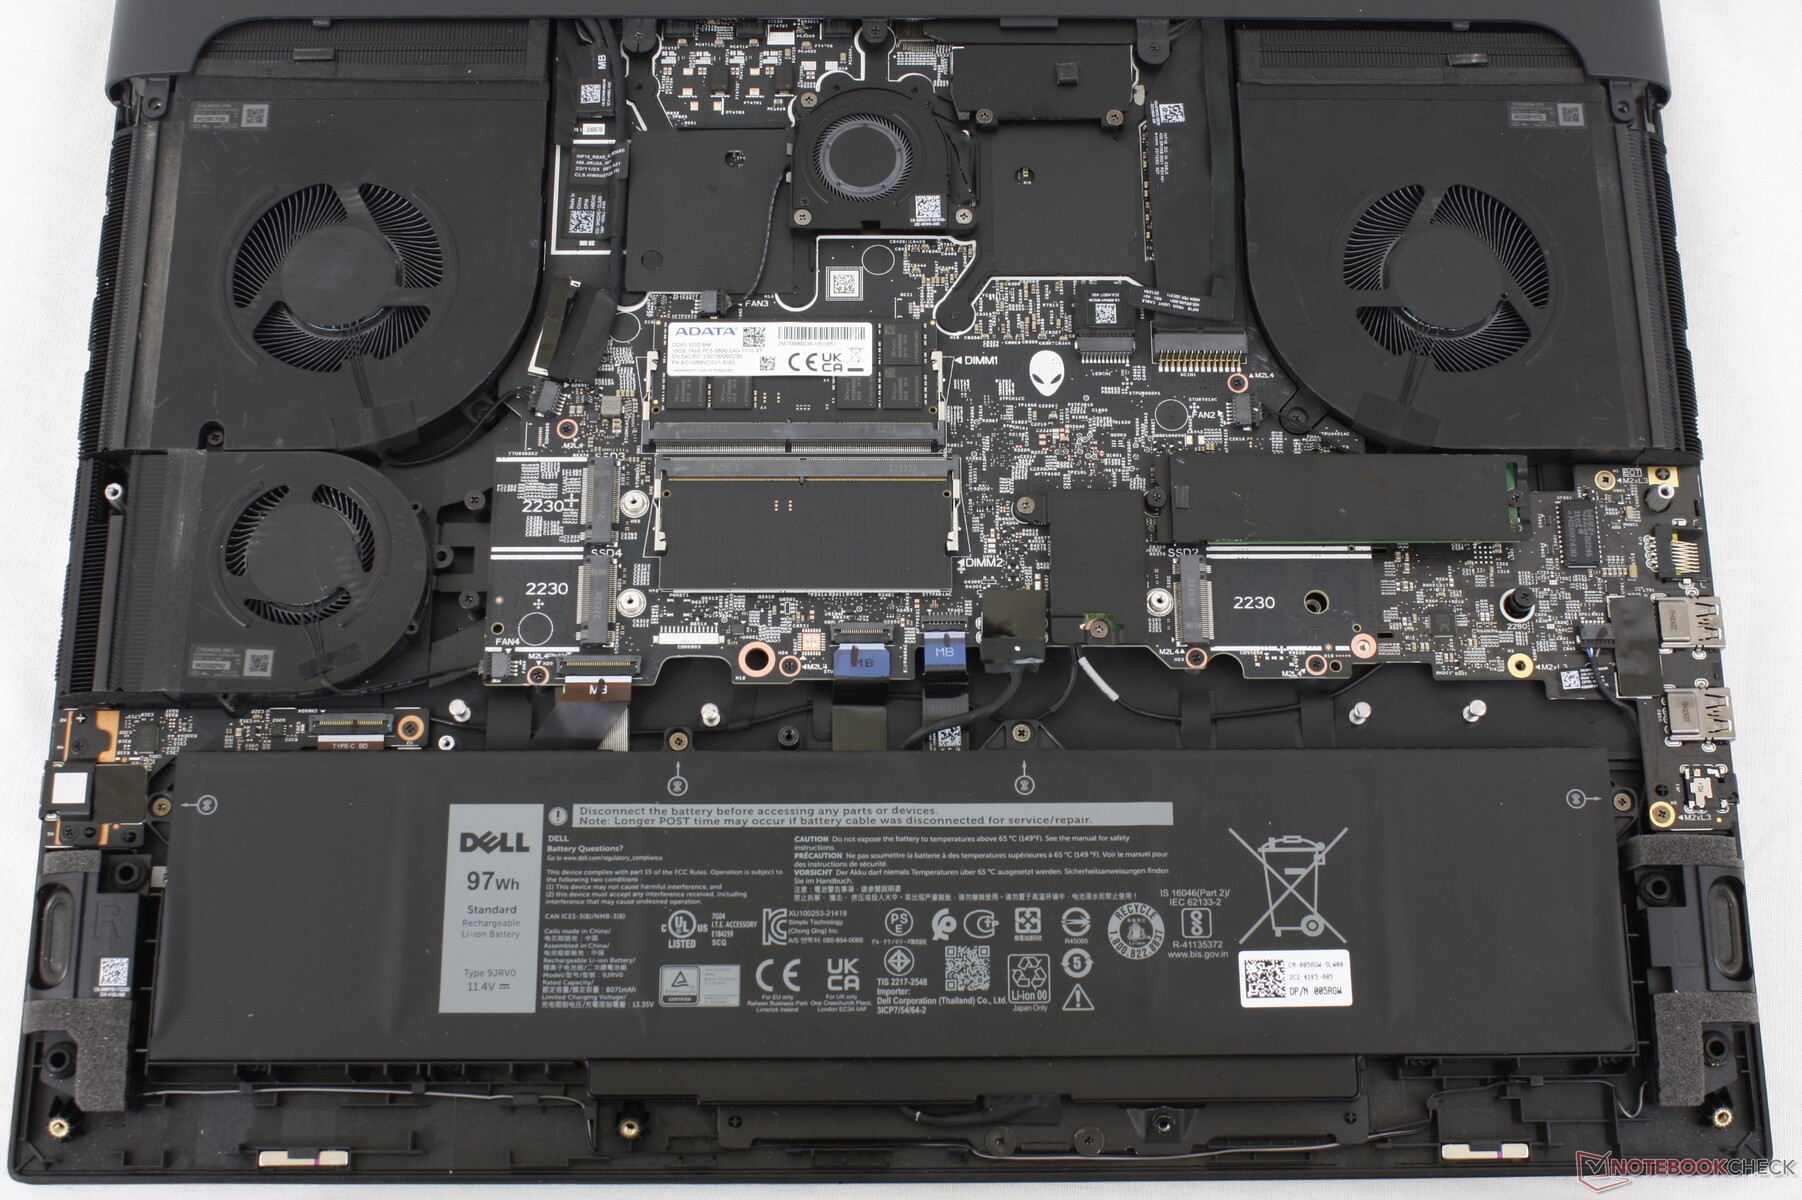
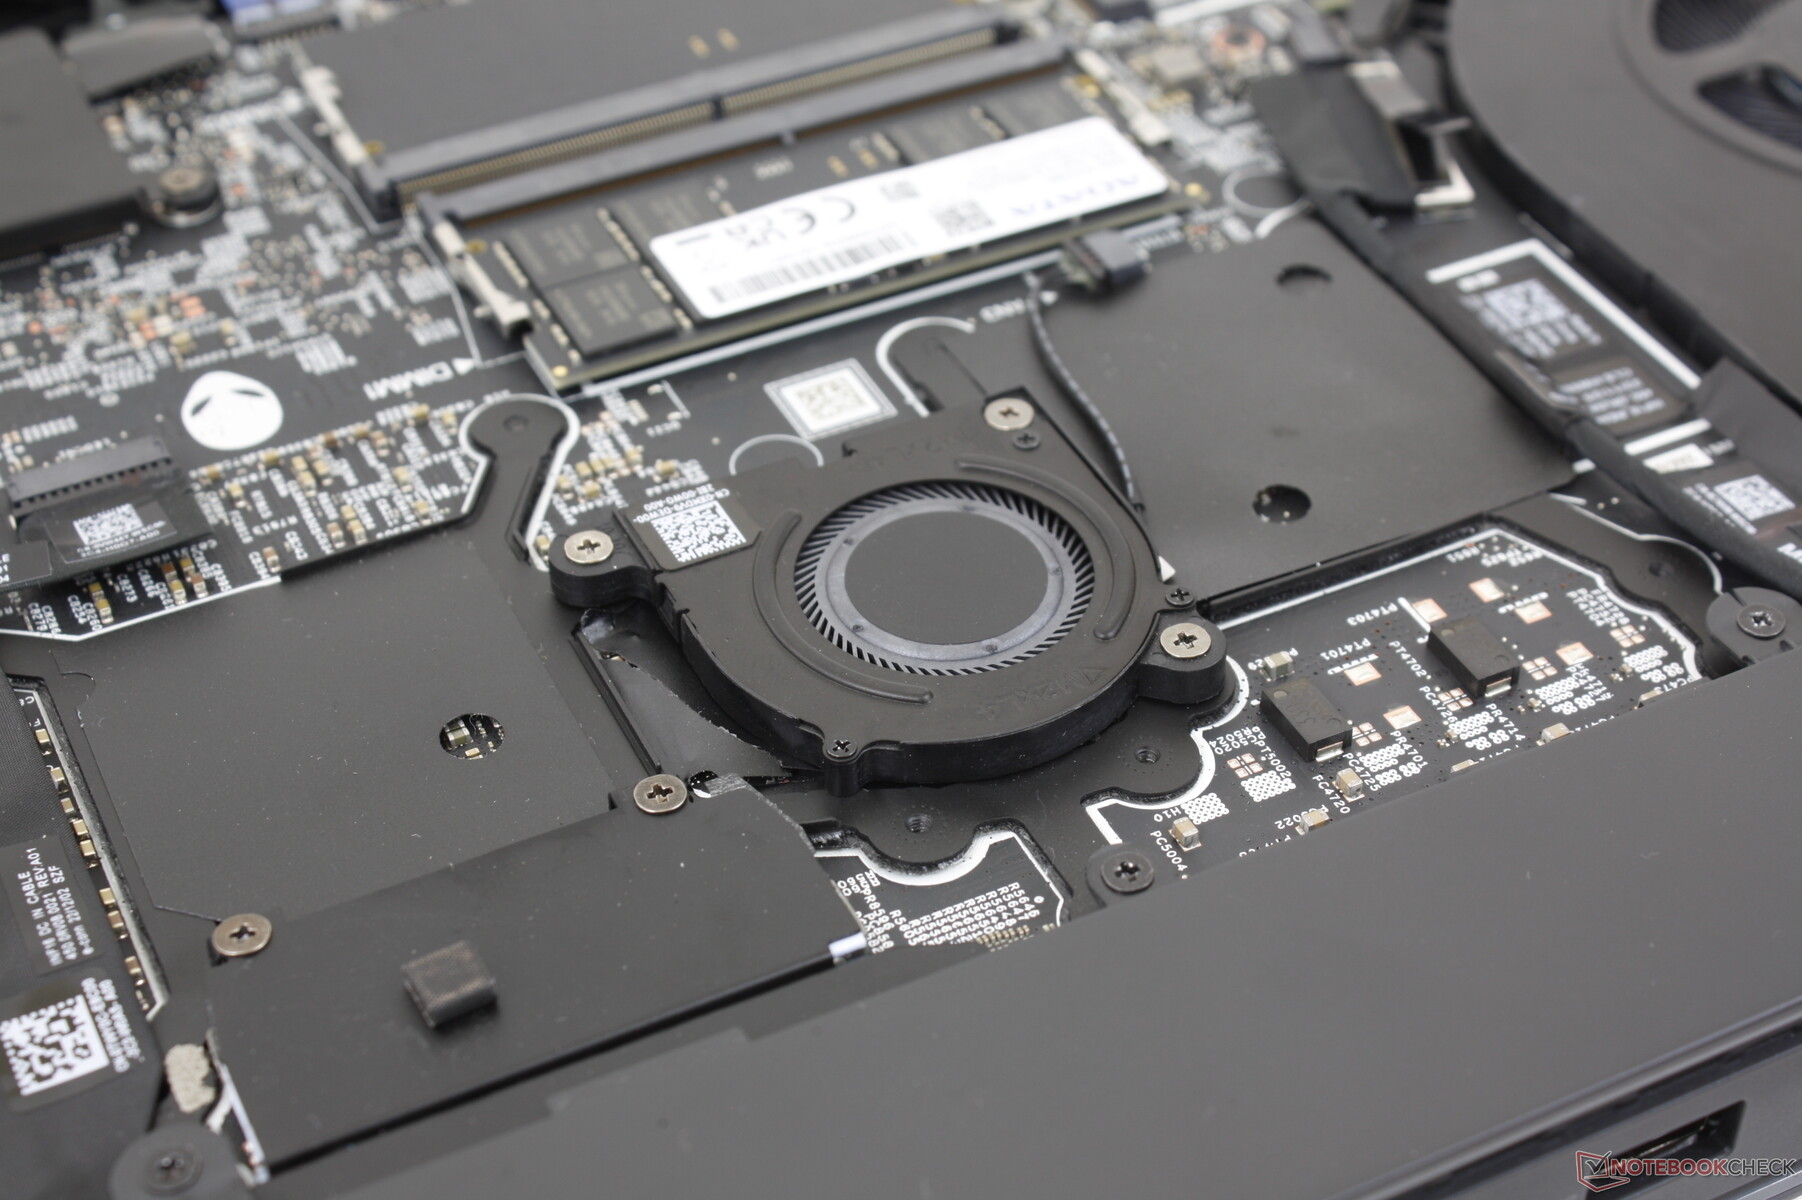
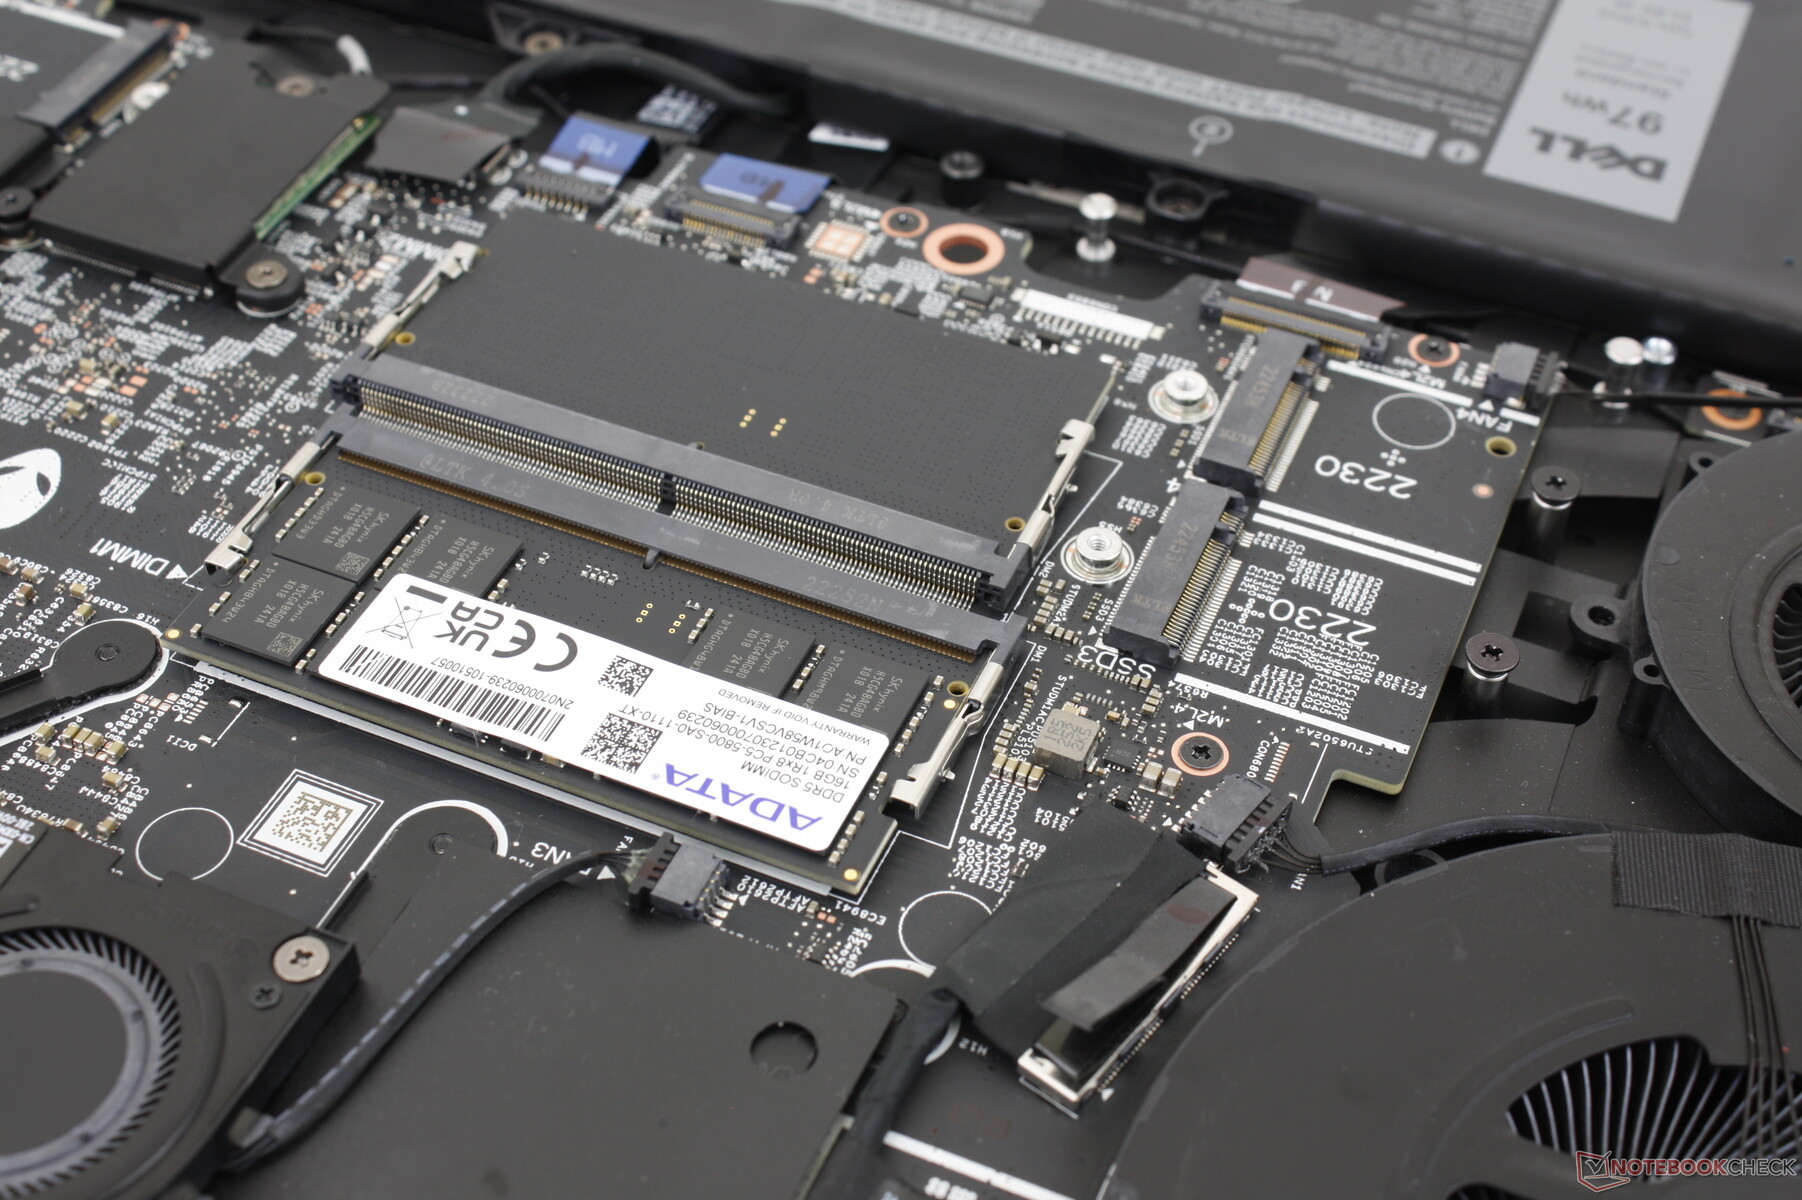
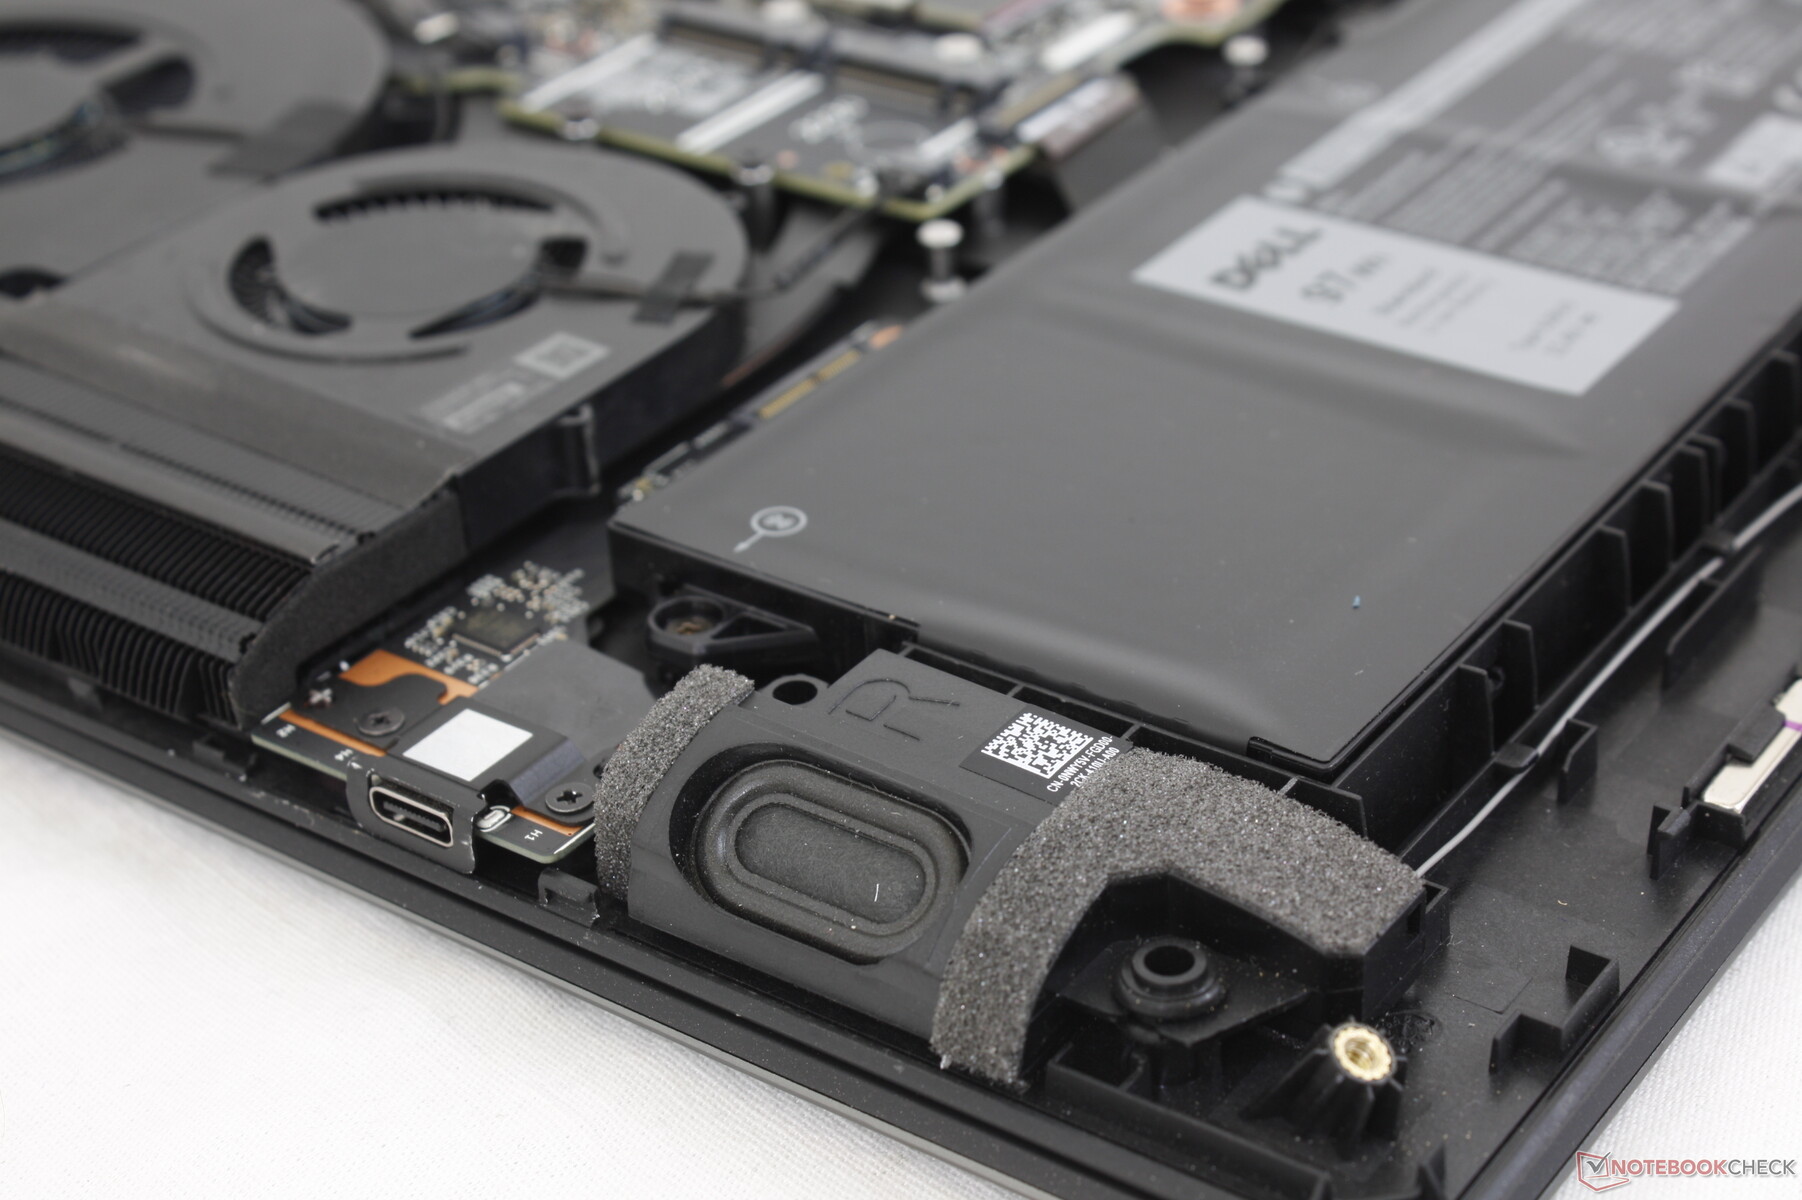
Maintenance
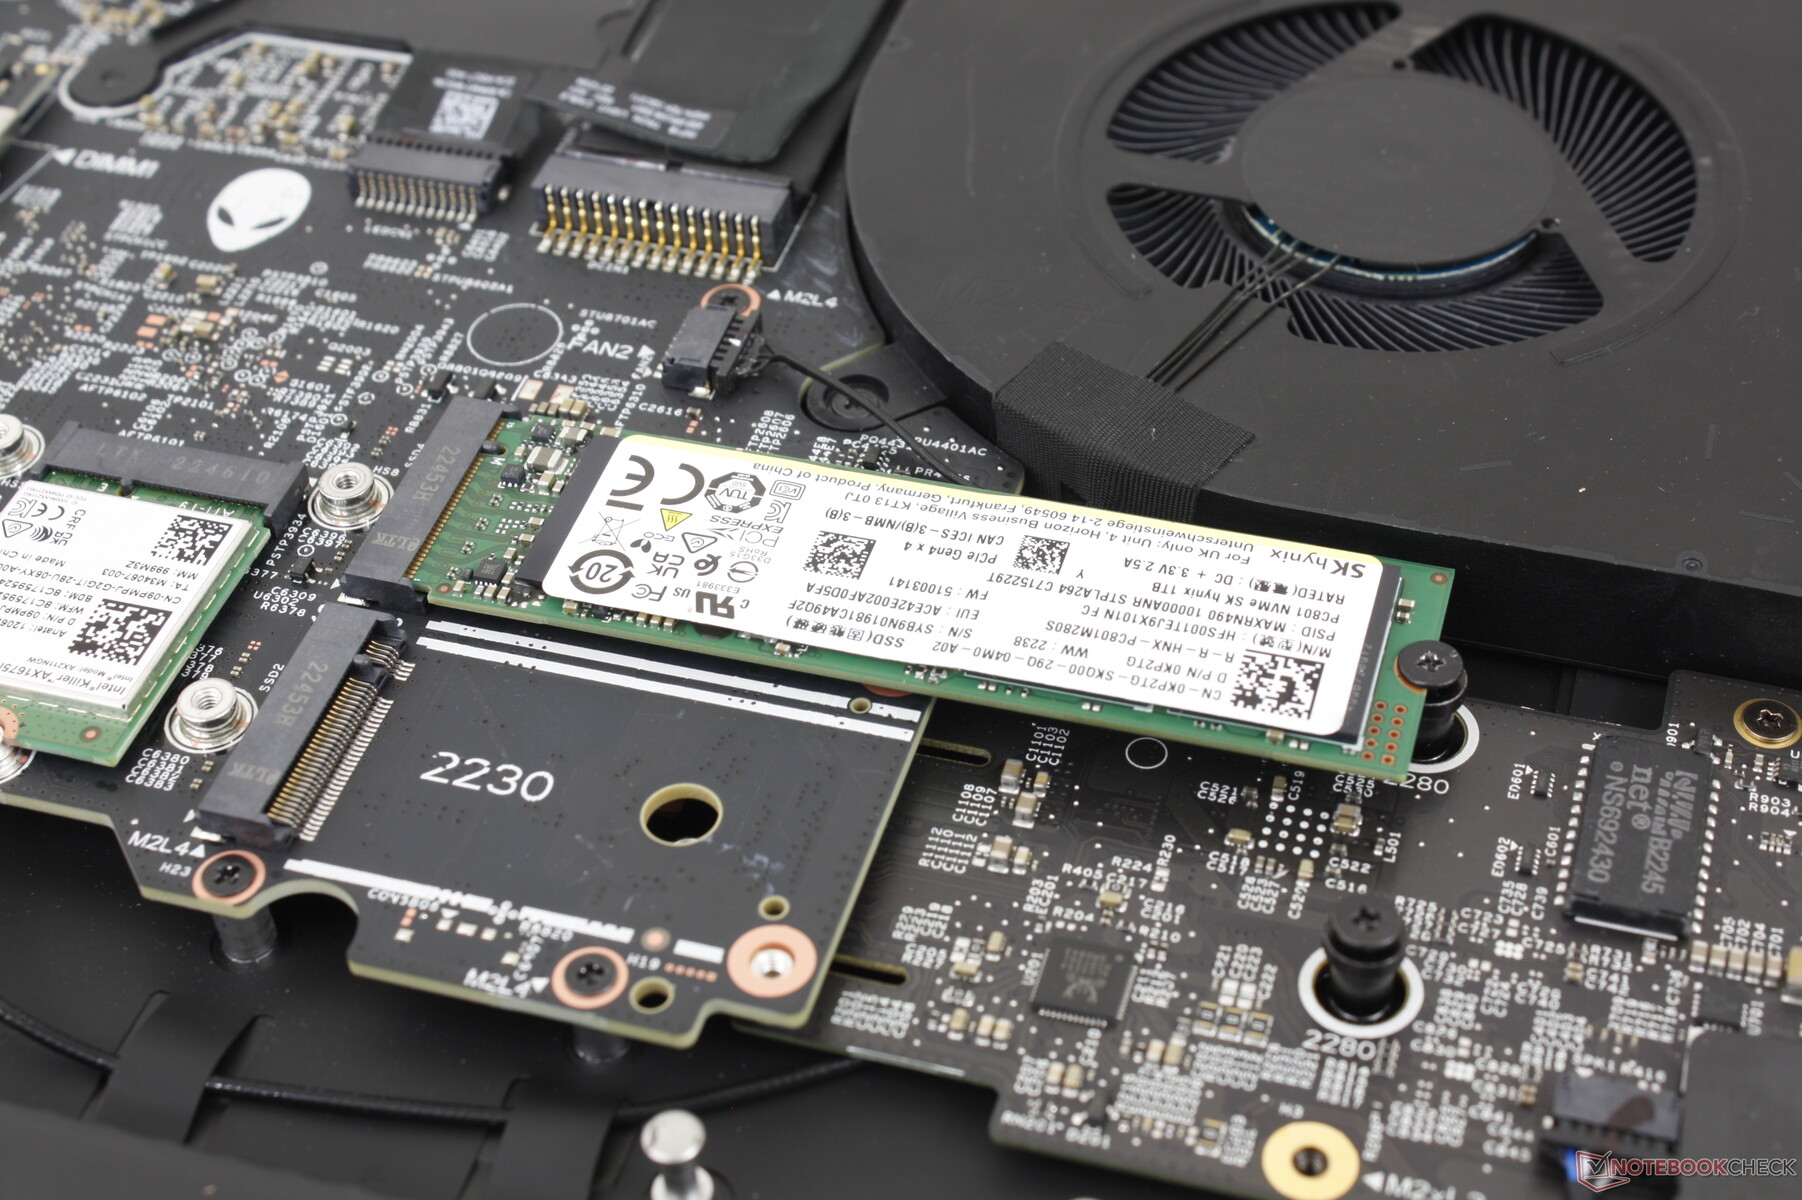
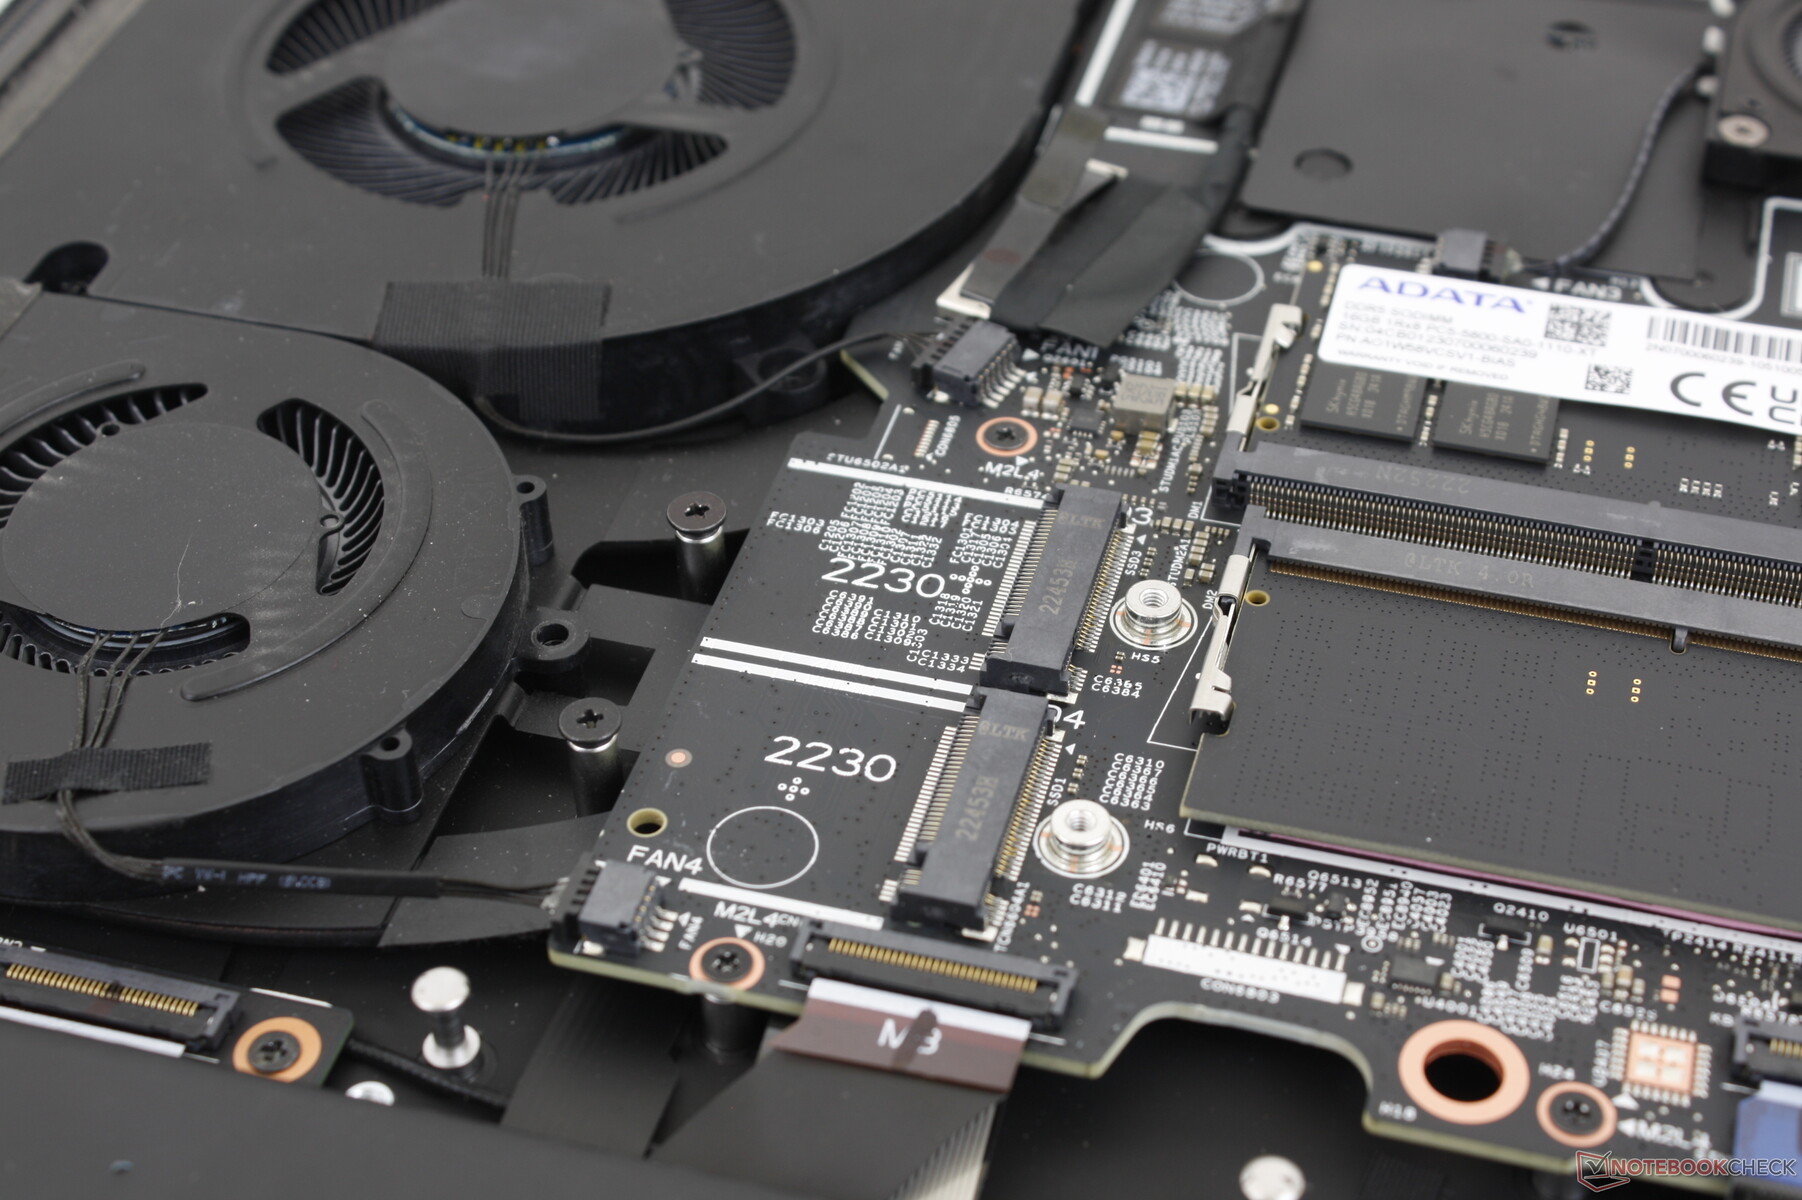
Le panneau inférieur se détache très facilement à l'aide d'un simple tournevis Philips. En comparaison, le panneau inférieur du nouveau MSI GE78 nécessite plus de manipulations et la déchirure d'un autocollant anti-sabotage.
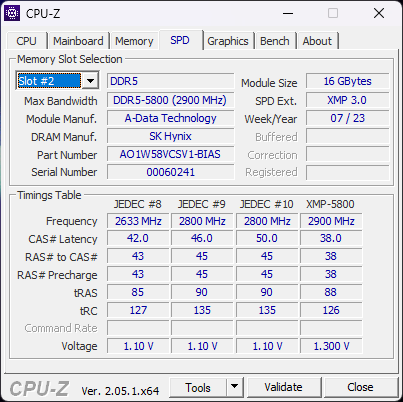
Les utilisateurs ont un accès direct à la batterie, au module WLAN amovible, aux 4 emplacements SSD M.2 et aux 2 emplacements SODIMM DDR5. C'est l'un des rares ordinateurs portables à prendre en charge quatre SSD NVMe internes (2 M.2 2230 + 2 M.2 2280). Il aurait été intéressant de voir la CAMM au lieu de SODIMM, d'autant plus que Dell s'est fait le champion de la technologie RAM la plus rapide.
Accessoires et garantie
La boîte ne contient rien d'autre que l'adaptateur secteur et la documentation. Notez que Dell a abandonné son port d'accueil Alienware propriétaire et que l'ancienne station d'accueil Alienware eGPU n'est donc plus prise en charge.
La garantie limitée standard d'un an s'applique si l'appareil est acheté aux États-Unis.
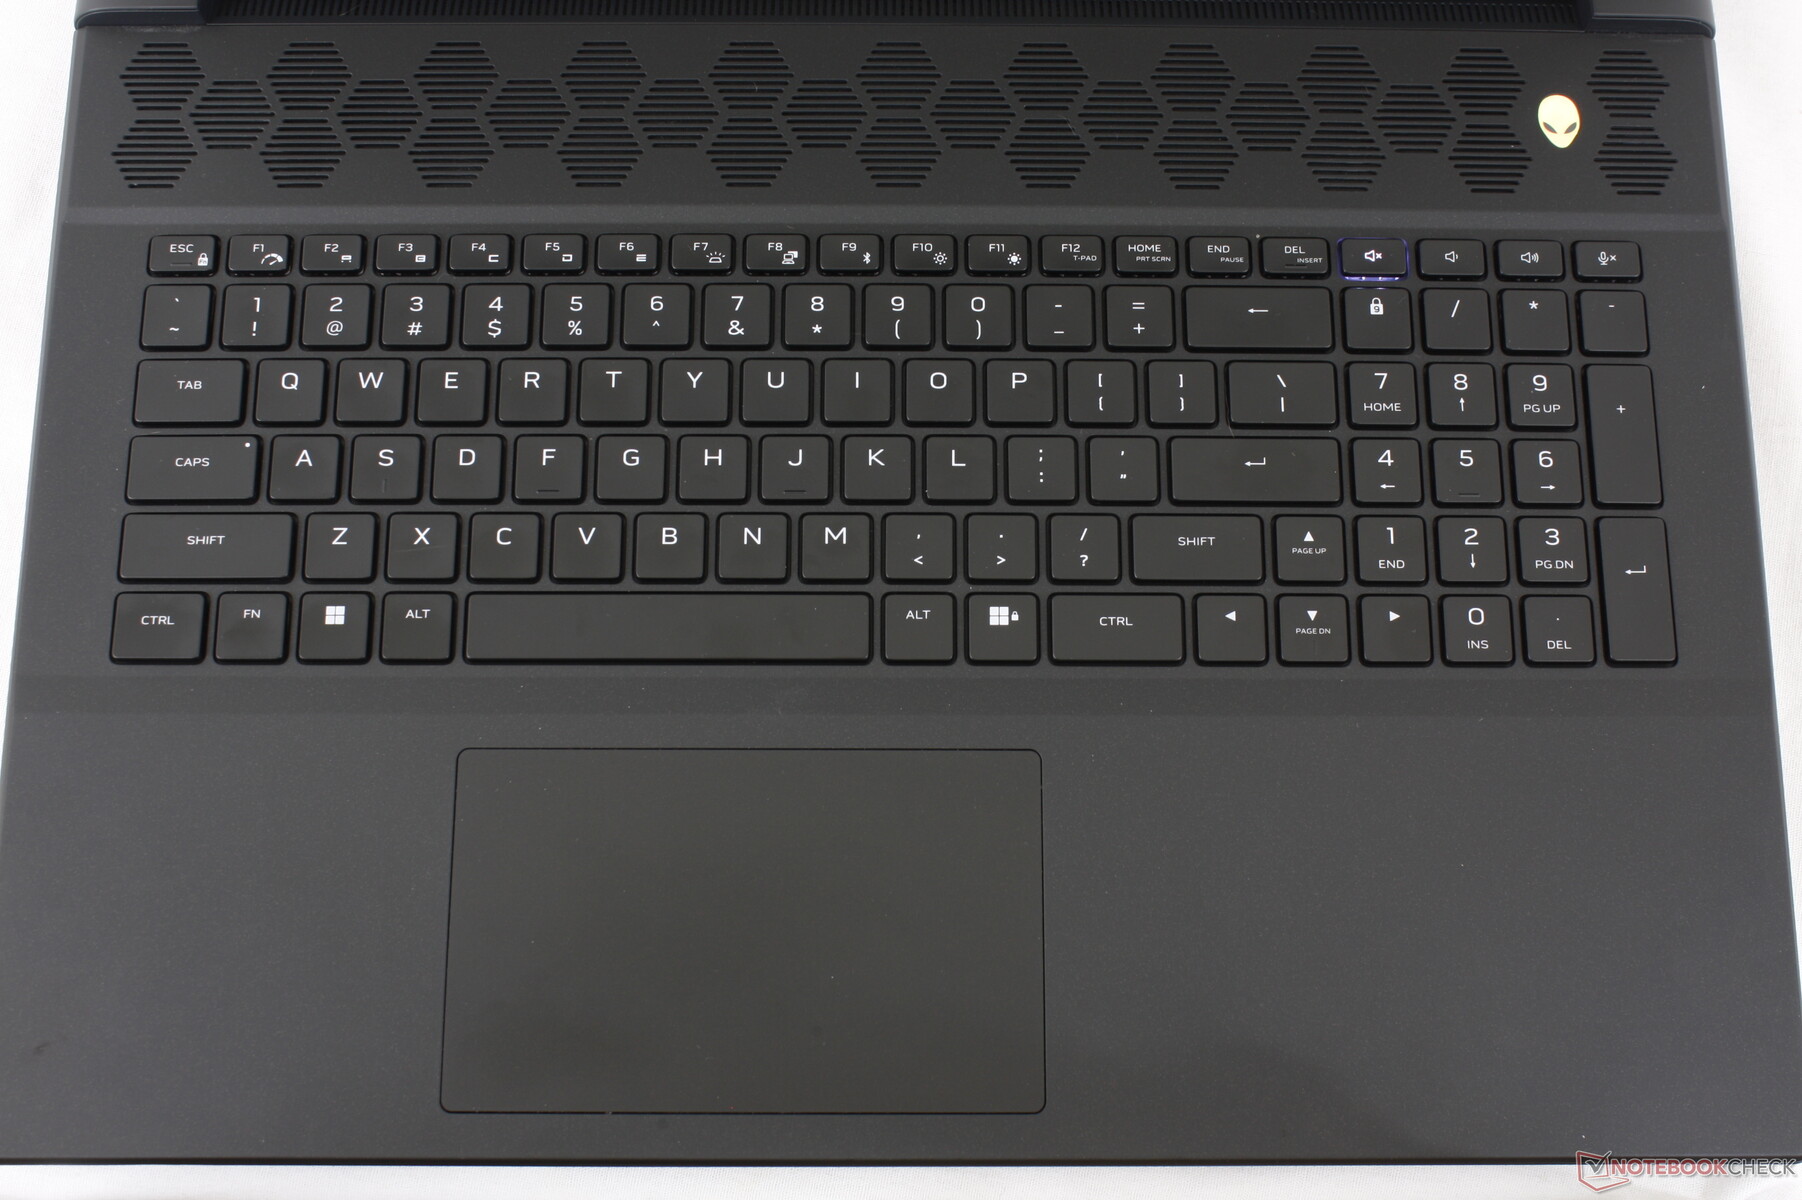
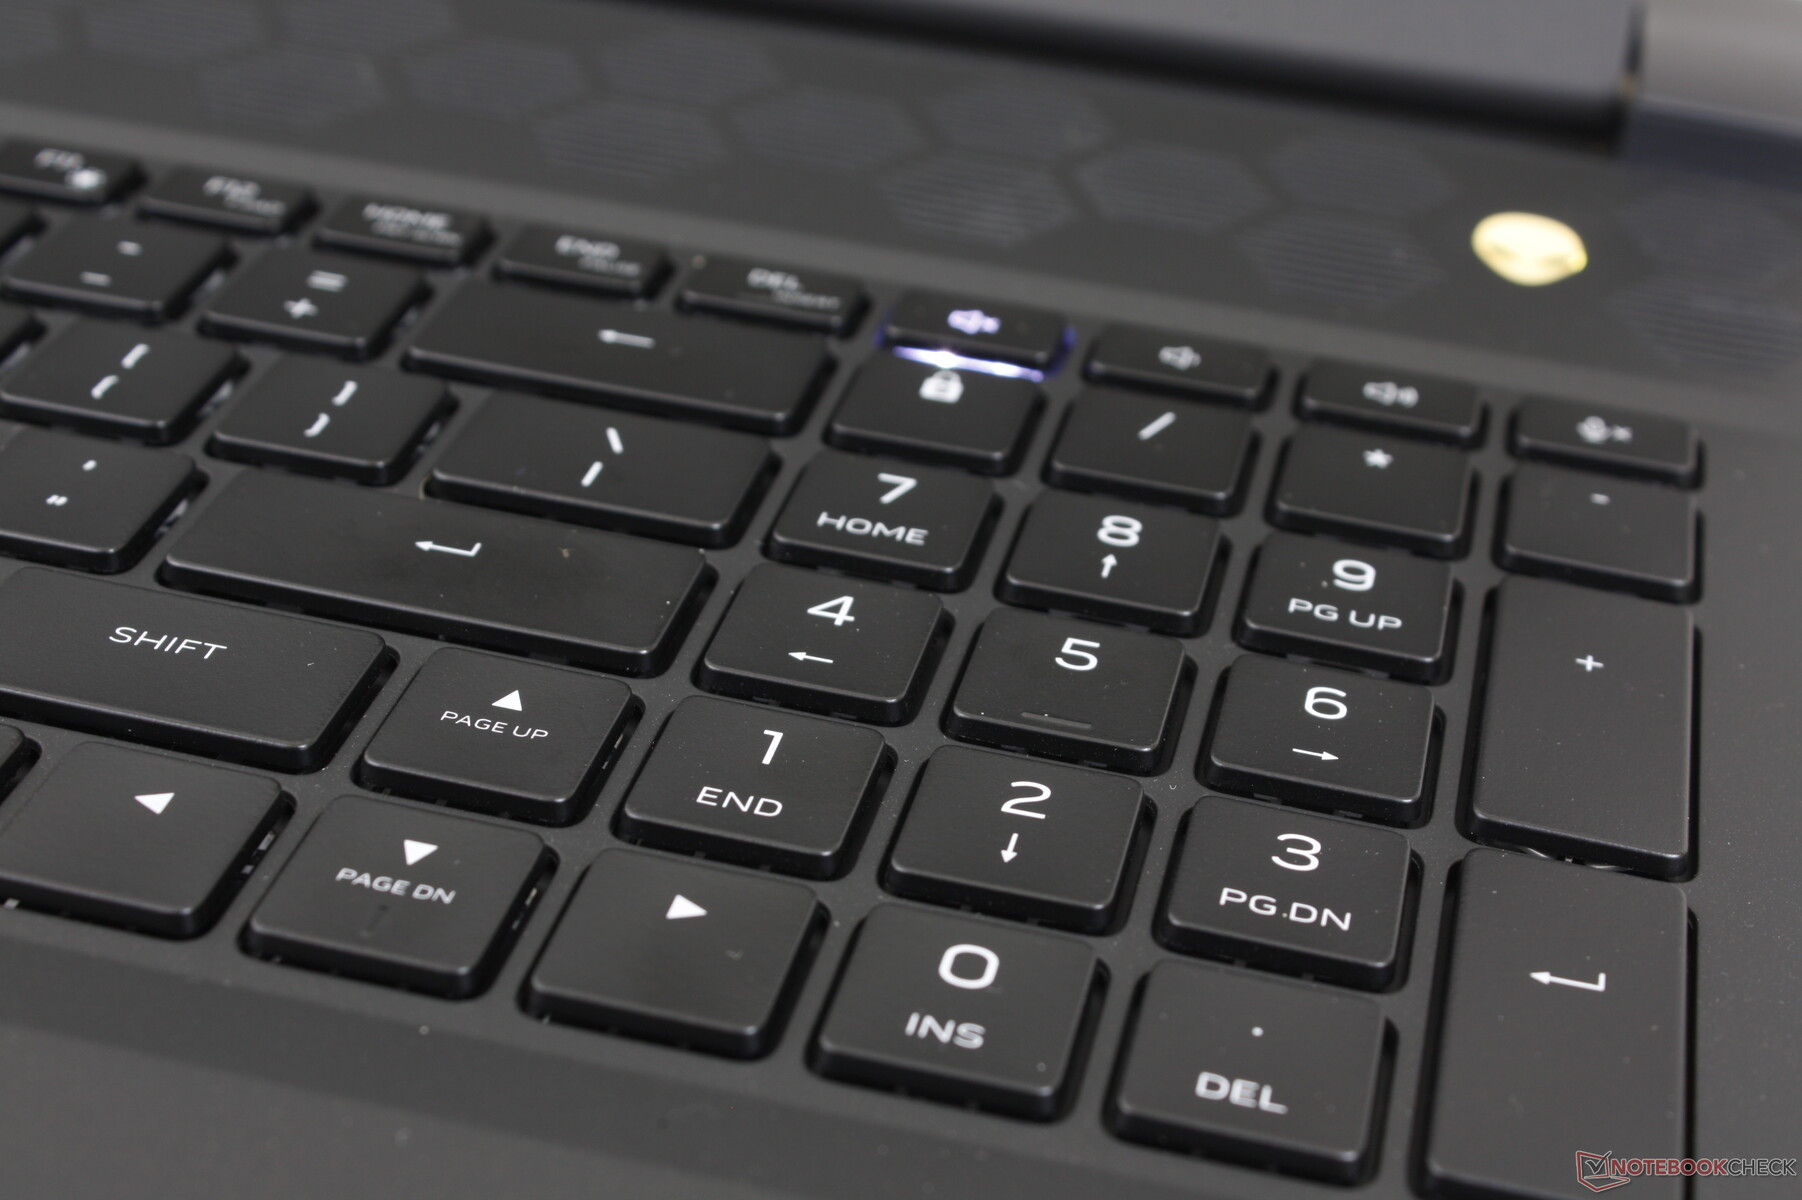
Périphériques d'entrée - Clavier confortable, pavé tactile souple
Clavier
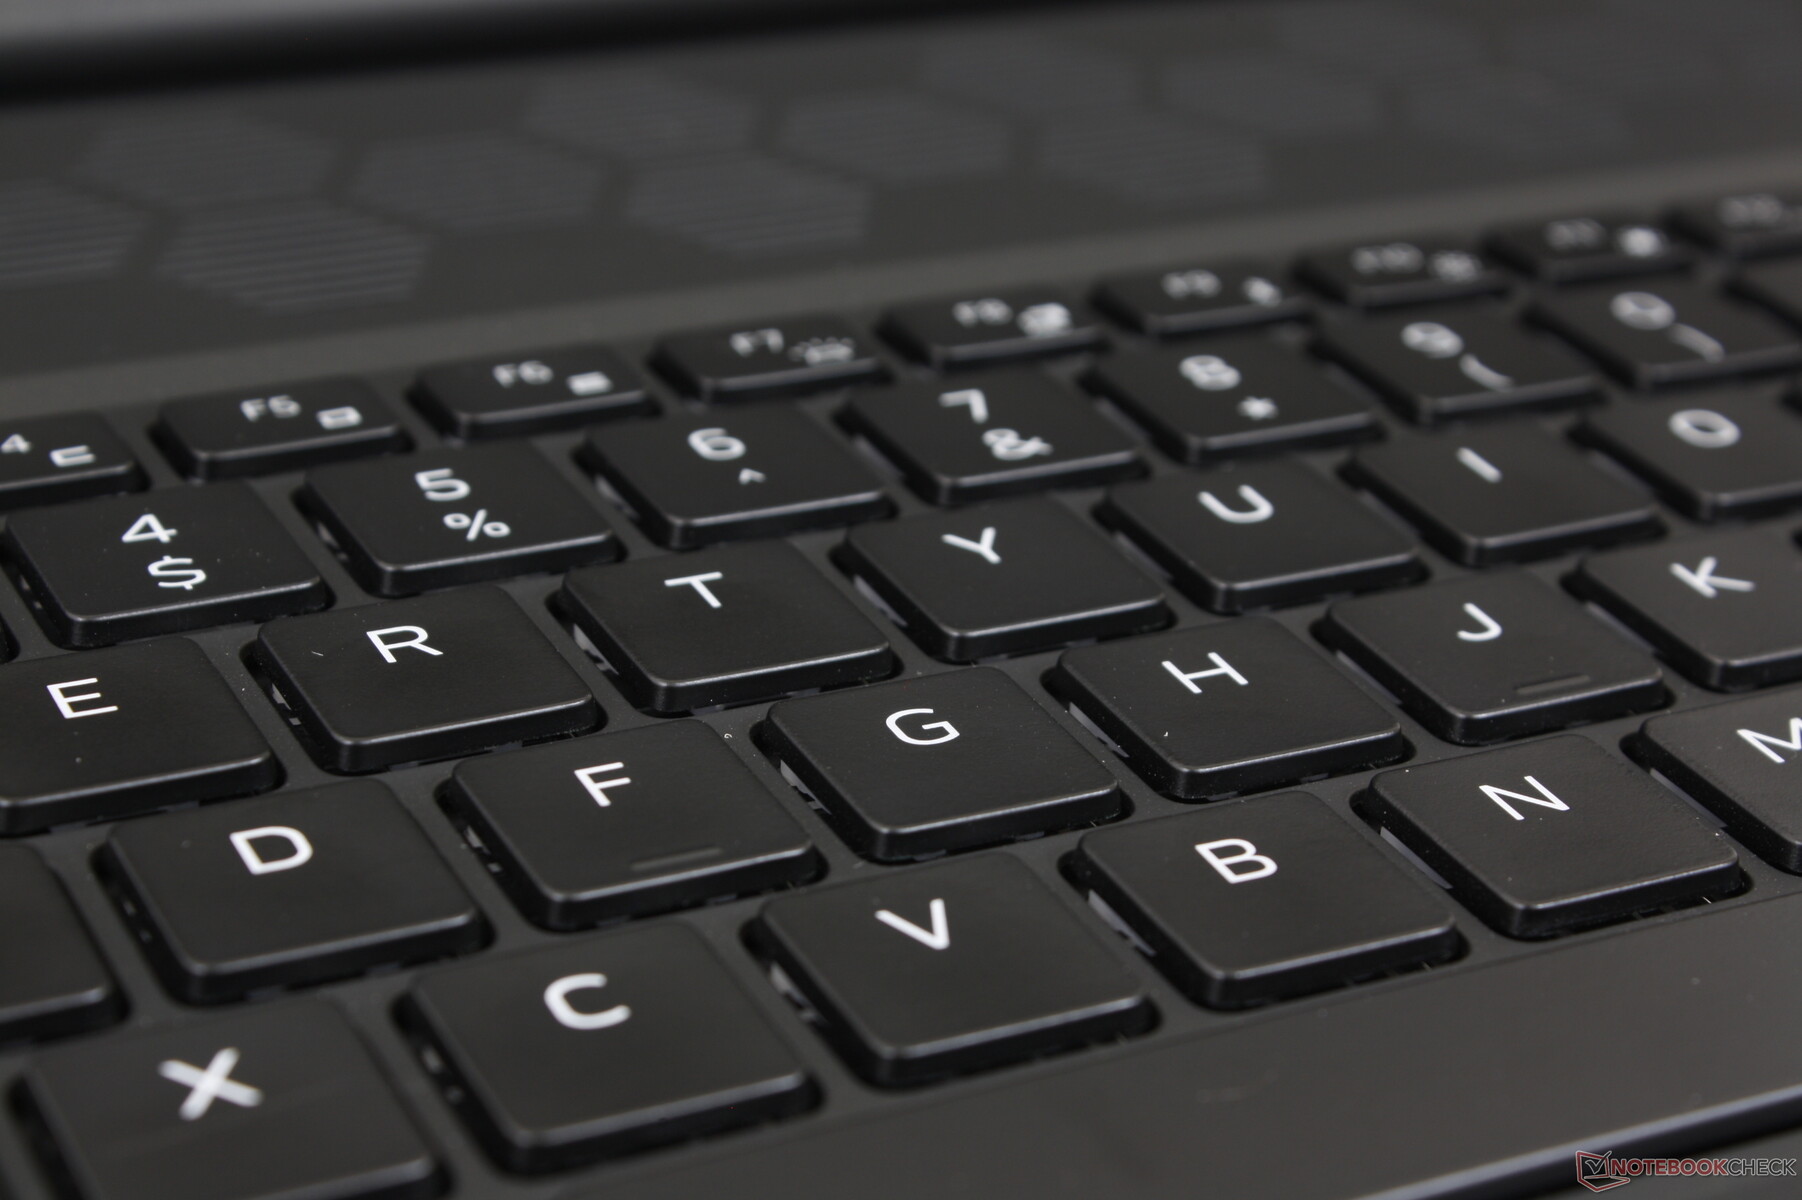
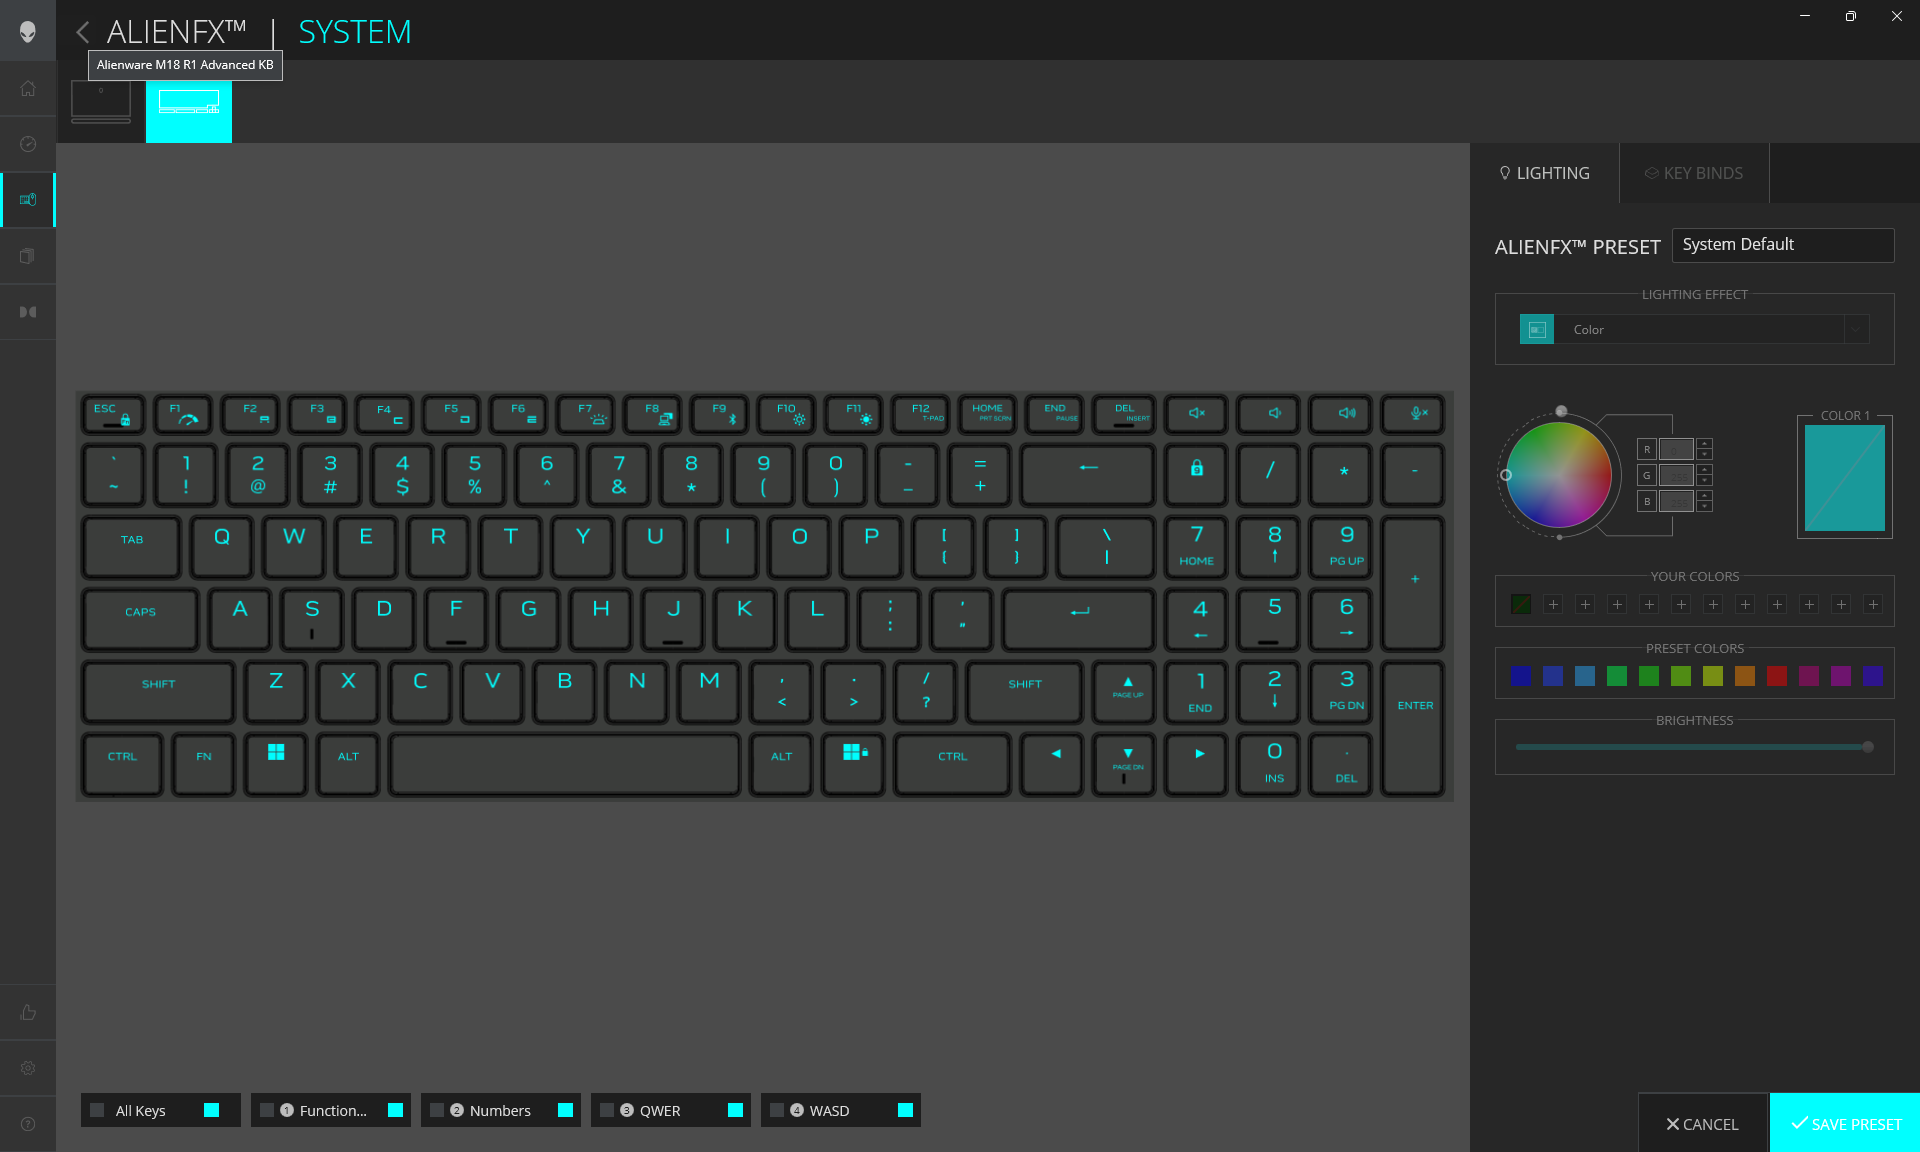
Les touches à membrane de notre unité sont probablement les meilleures que nous ayons utilisées sur un ordinateur portable de jeu. Les déplacements sont plus profonds et les retours plus fermes que sur le MSI GE78 ou le Razer Blade 18. Il n'y a pas grand-chose à redire sur le confort du clavier.
Les touches mécaniques CherryMX (en option) seront sans doute plus cliquantes mais aussi plus bruyantes. Ces interrupteurs sont probablement les mêmes que ceux que Dell propose pour les Alienware M15 et M17.
Tous les symboles des touches sont éclairés lorsque le rétroéclairage est actif, contrairement aux anciens modèles Alienware x15/x17 où les symboles secondaires ne sont pas éclairés.
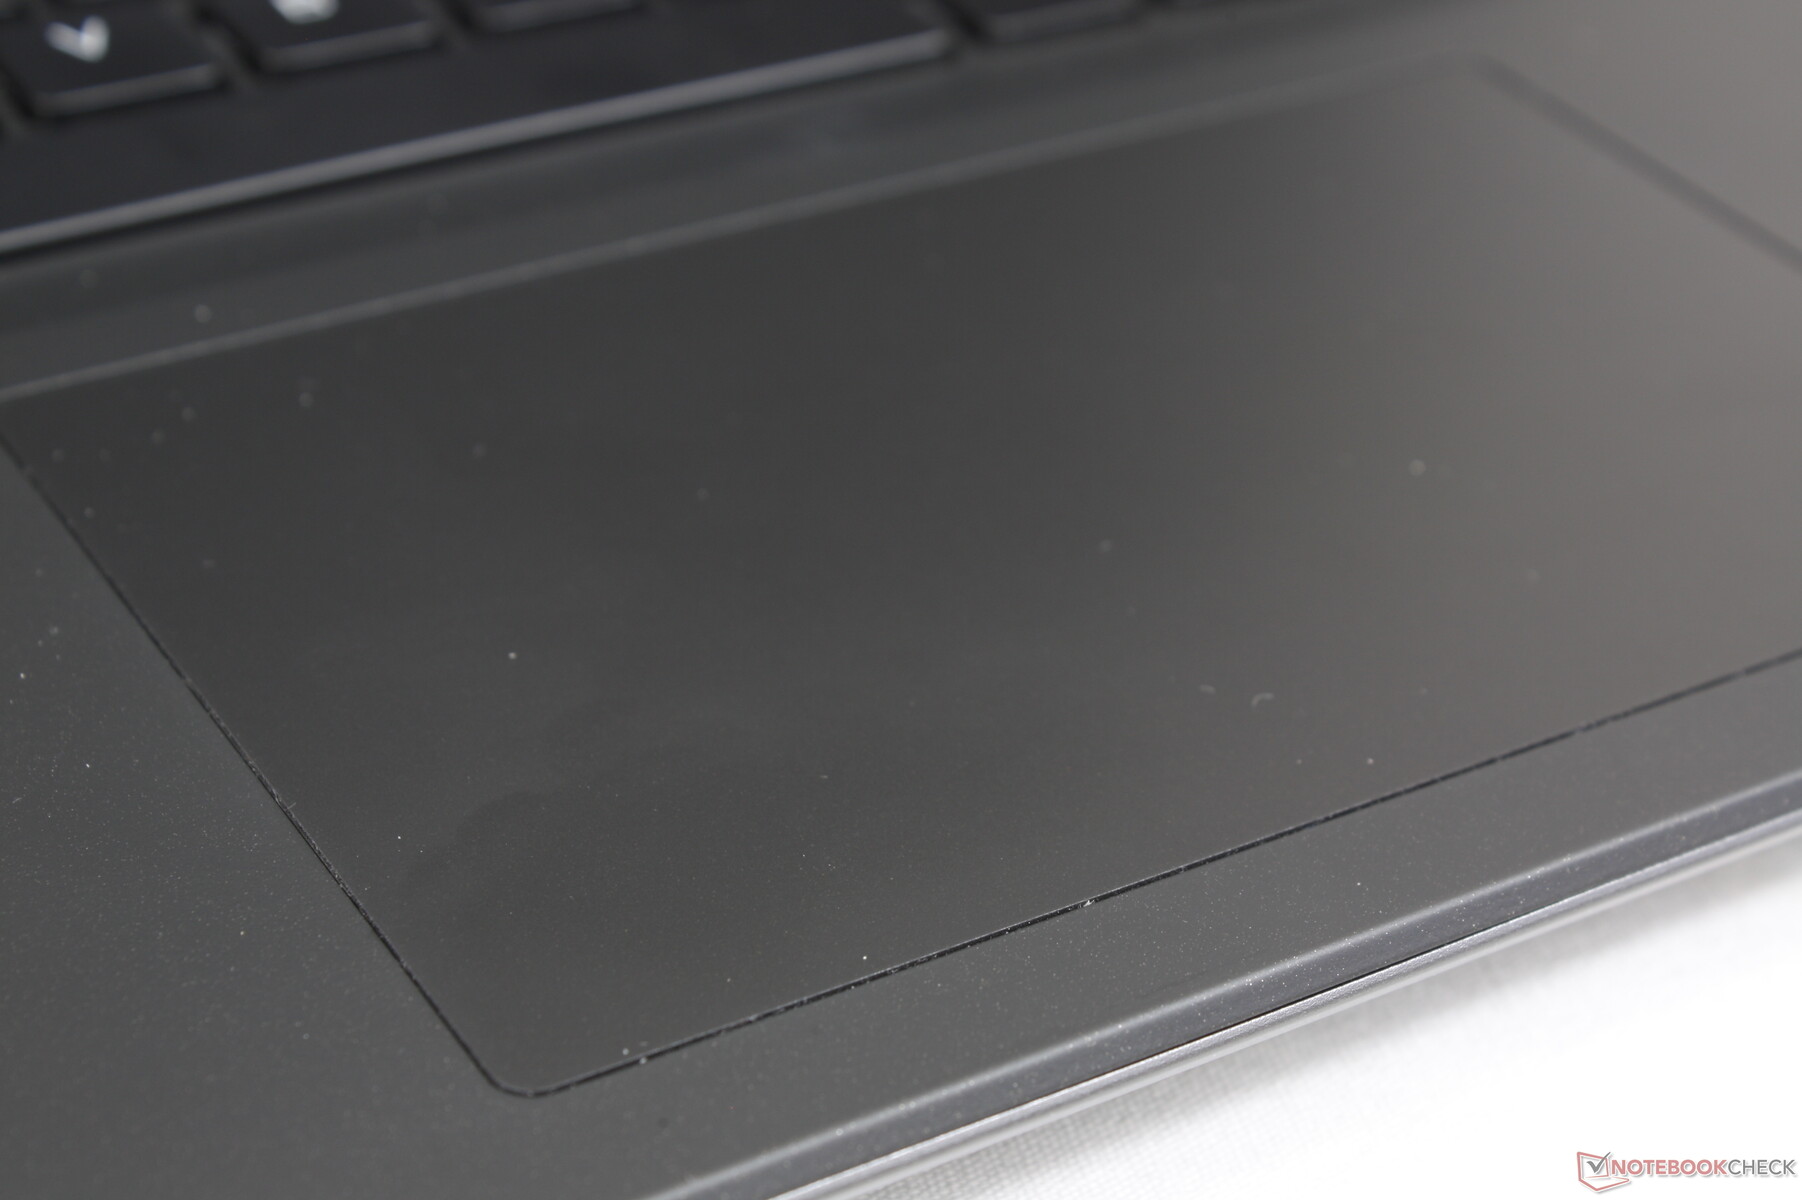
Pavé tactile
La surface est presque identique à celle du pavé tactile du MSI GE78 (13,2 x 8 cm contre 13 x 8,2 cm) malgré le format plus grand de 18 pouces de l'Alienware. Bien que la traction soit fluide avec un minimum d'adhérence lors du glissement, le retour d'information lors du clic est un peu mou, ce qui rend l'expérience insatisfaisante. Le double-clic est également fatigant car chaque clic demande un peu plus de force au doigt que sur la plupart des autres ordinateurs portables.
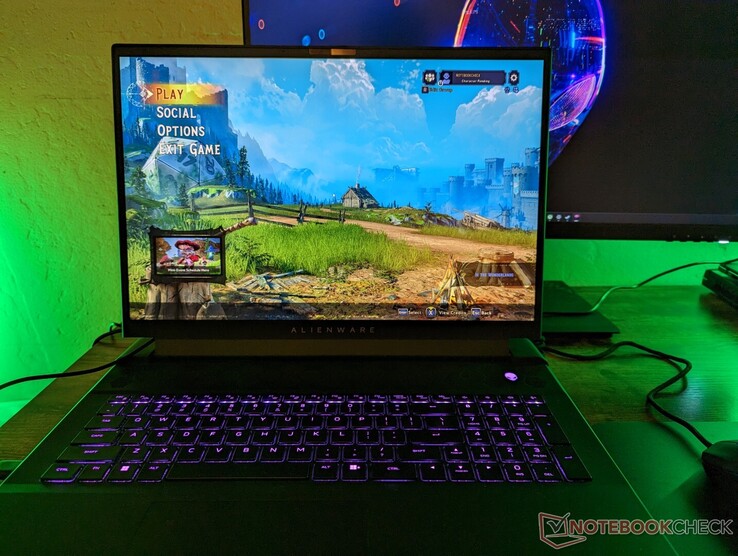
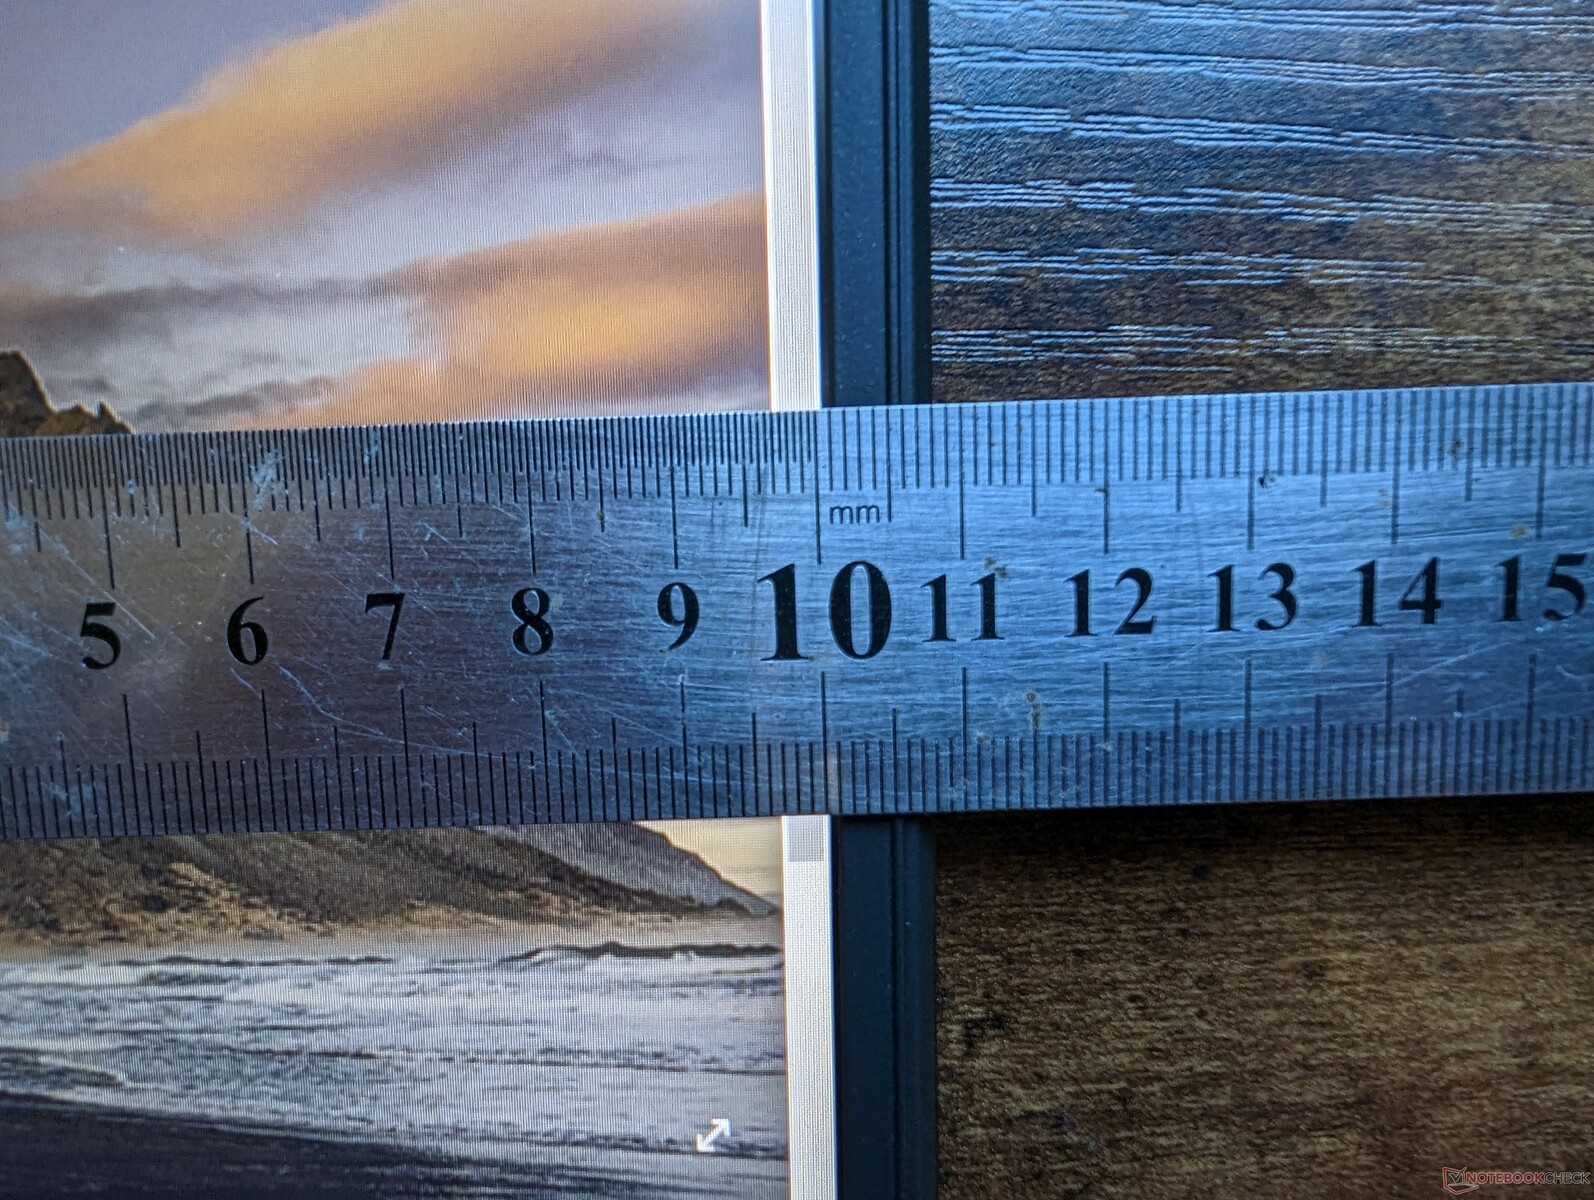
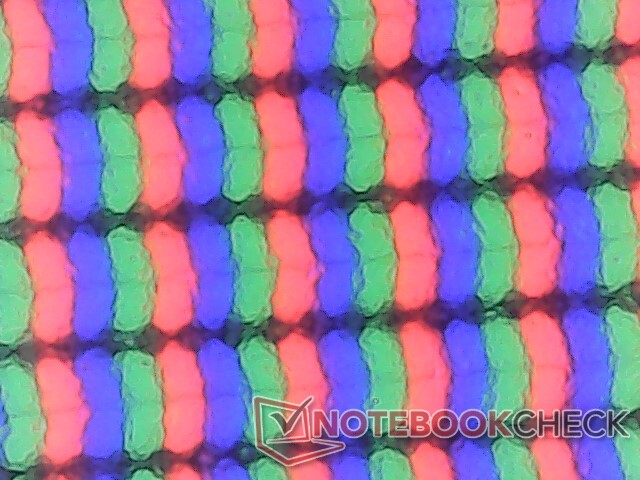
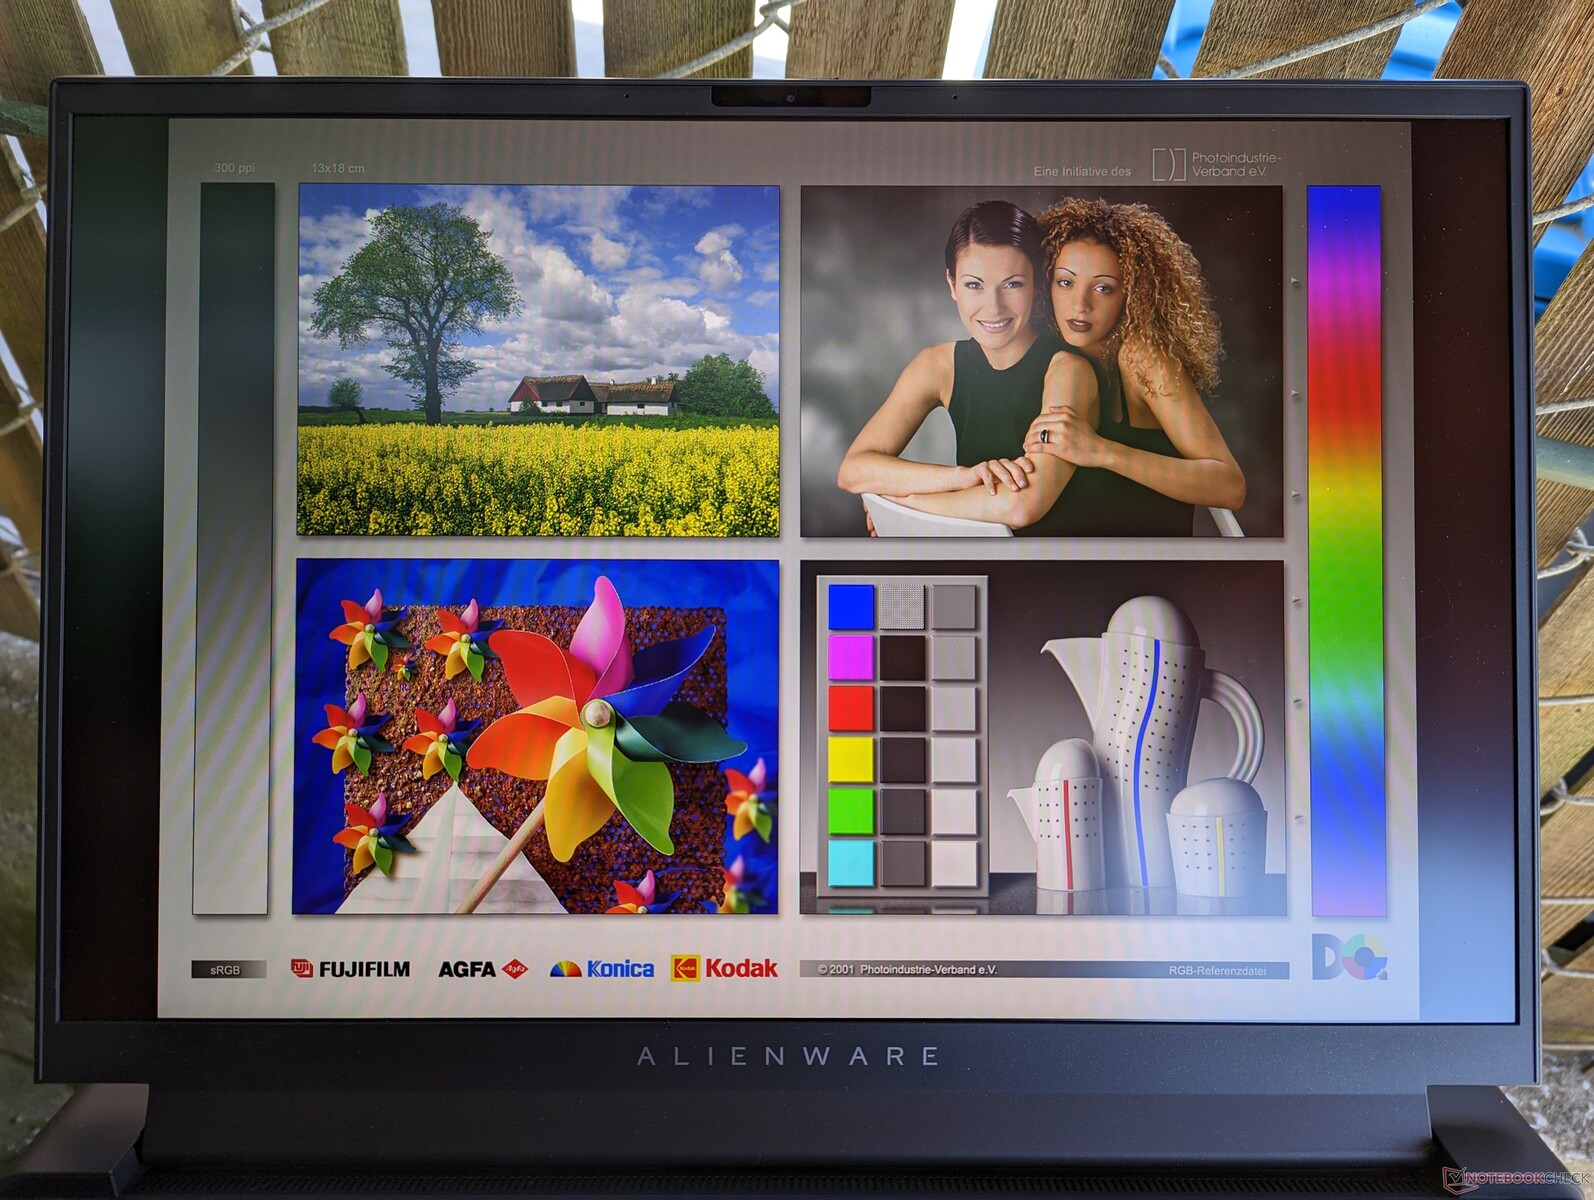
Affichage - Taux de rafraîchissement extrêmement rapide de 480 Hz
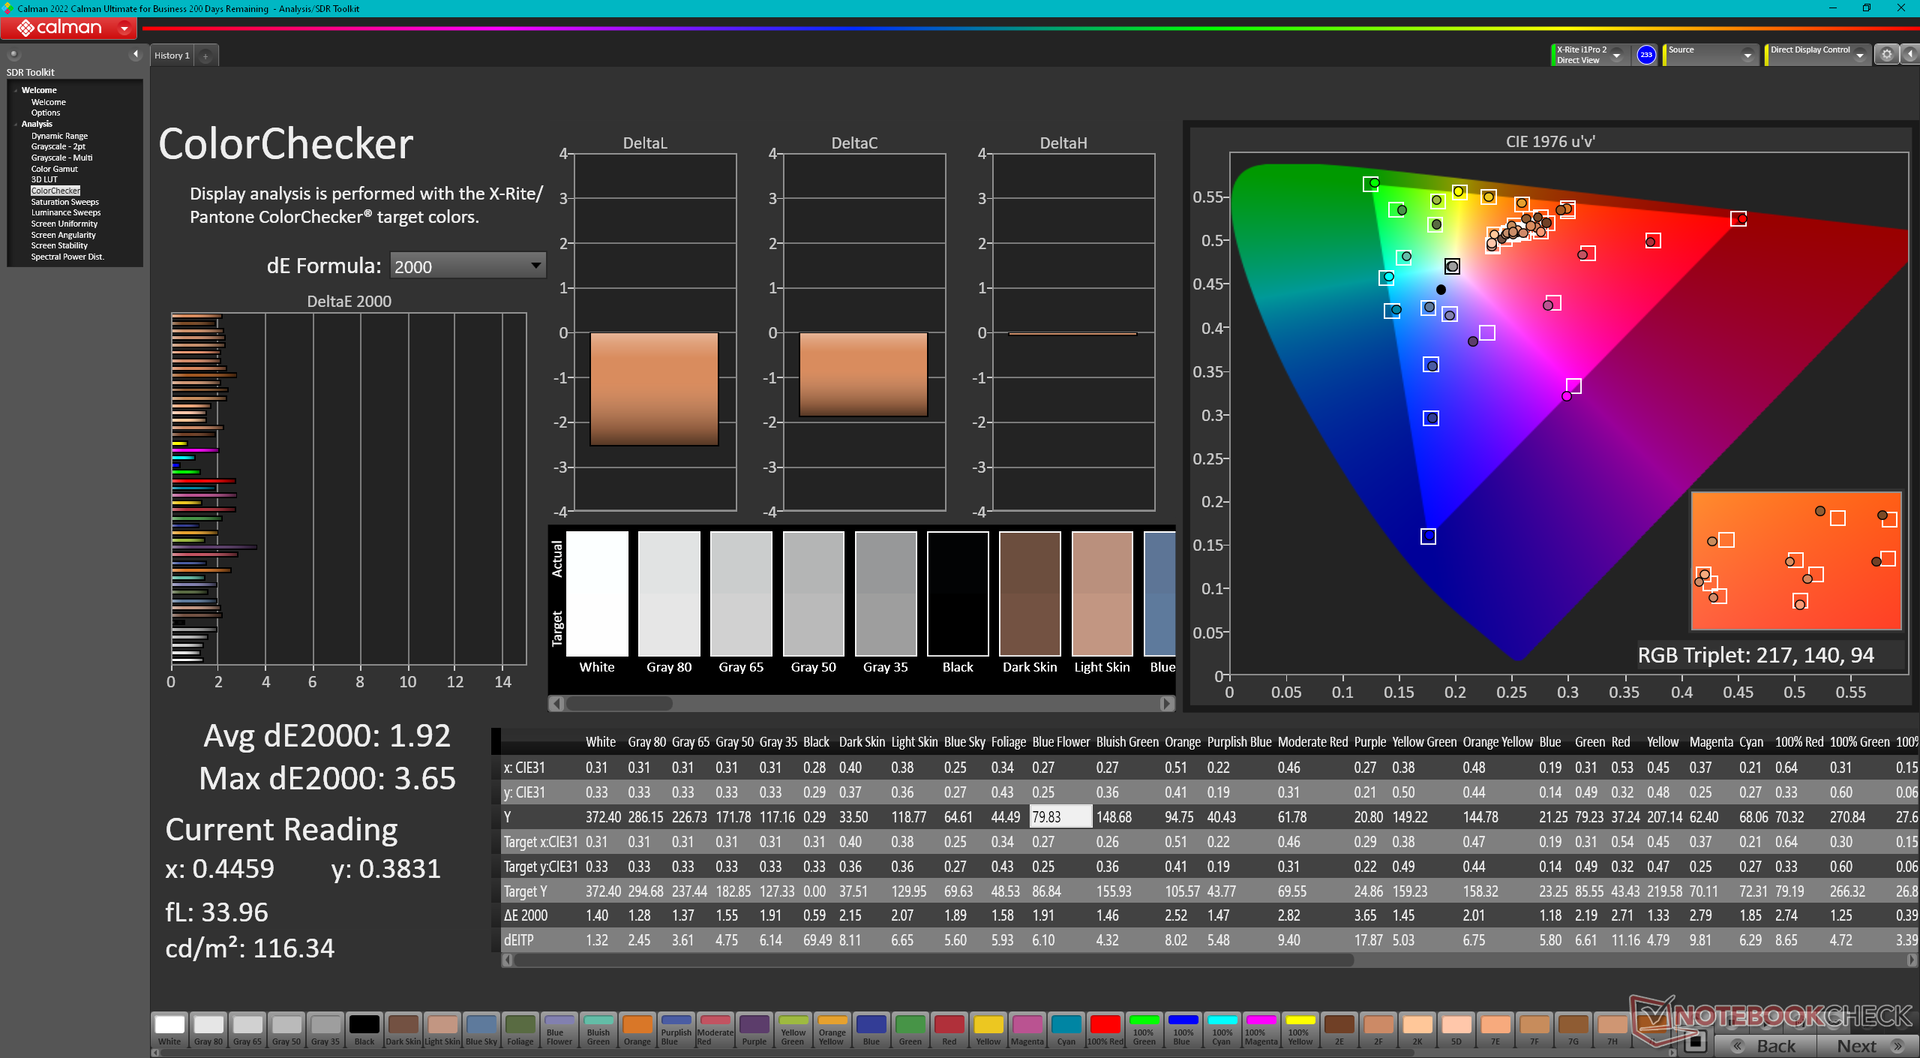
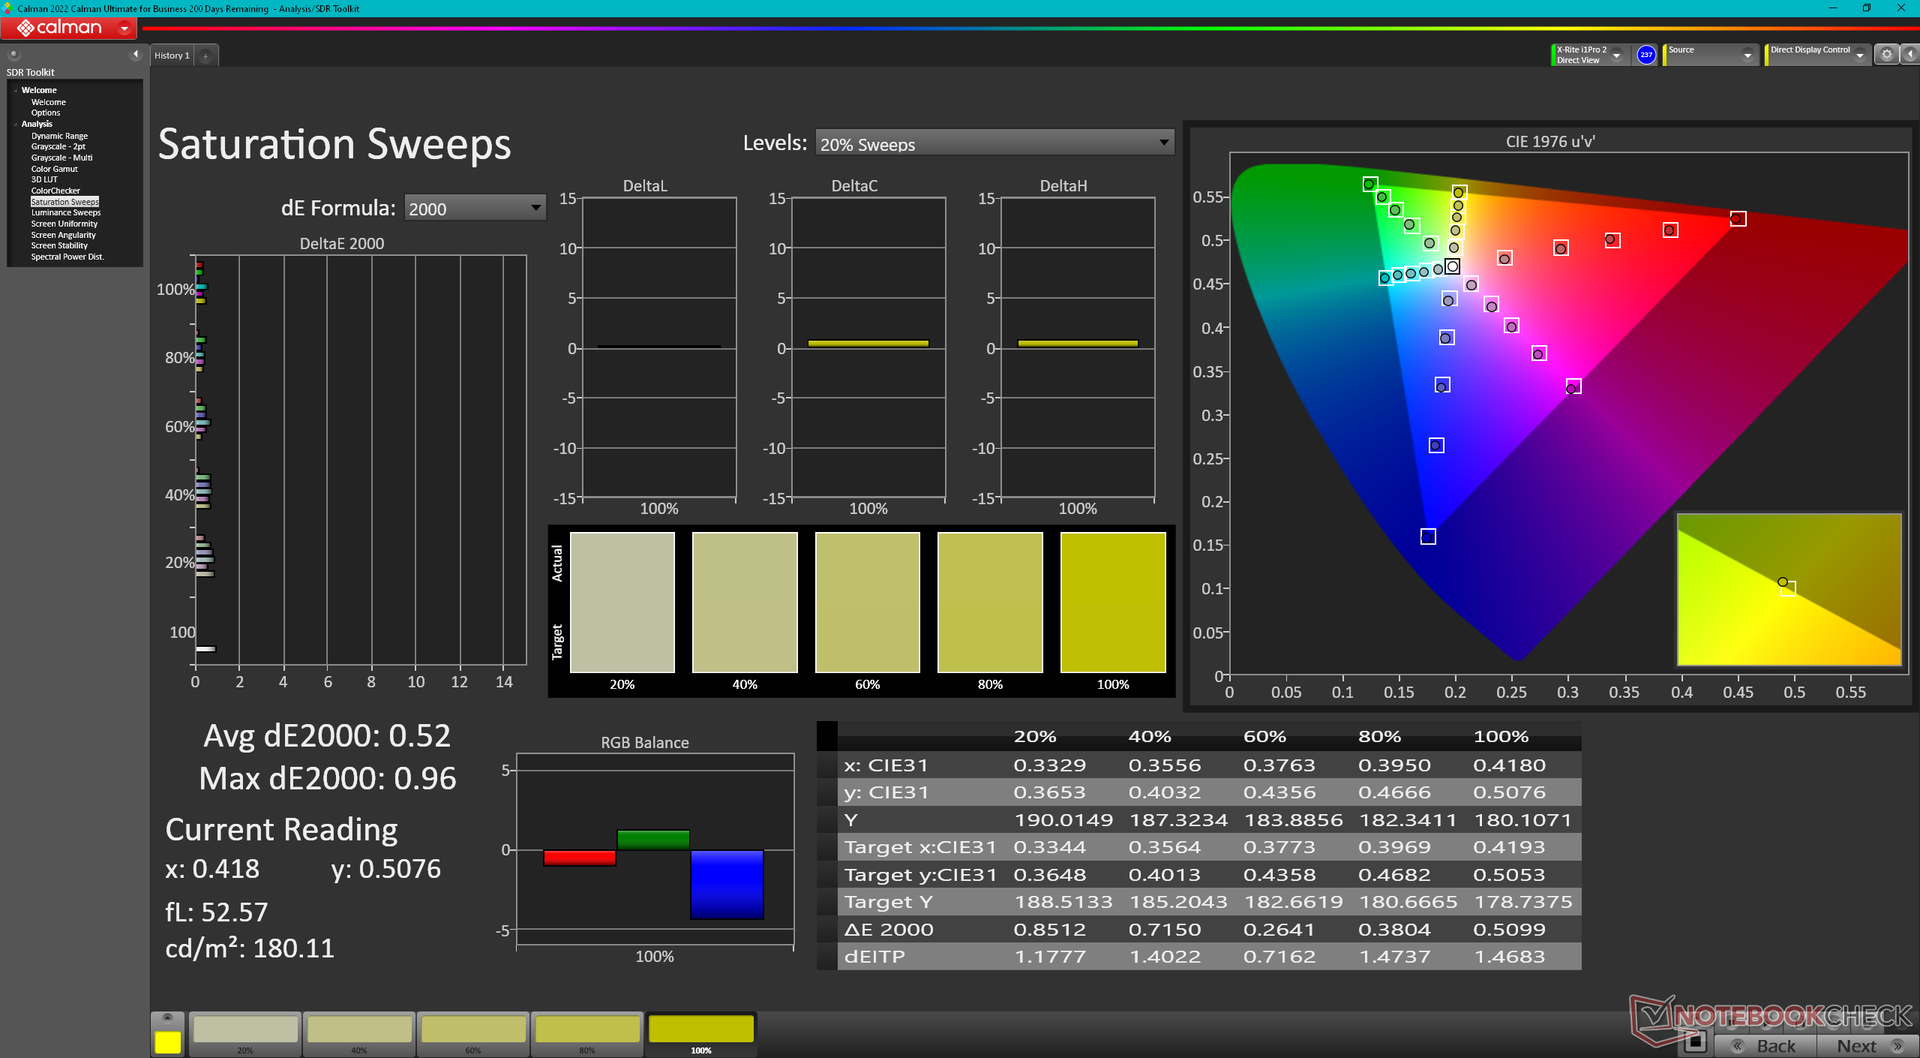
L'Alienware est livré avec une dalle Chi Mei 180JME de 1200p, contrairement aux dalles AU Optronics B180QAN01.0 ou BOE NE180QDM de 1600p qui équipent l'Alienware.Razer Blade 18 et Asus ROG Strix Scar 18, respectivement. La caractéristique unique qui sépare ce panneau Chi Mei des deux autres est son taux de rafraîchissement natif deux fois plus rapide de 480 Hz au lieu de 240 Hz. Pour le reste, les trois écrans partagent des couvertures de couleurs, des temps de réponse des pixels et des taux de contraste similaires. Les couleurs P3 et le taux de rafraîchissement rapide font de ce modèle Alienware un outil idéal pour les jeux et l'édition graphique.
Une deuxième option d'affichage est disponible avec une résolution native plus élevée de 1600p mais un taux de rafraîchissement plus faible de 165 Hz.
| |||||||||||||||||||||||||
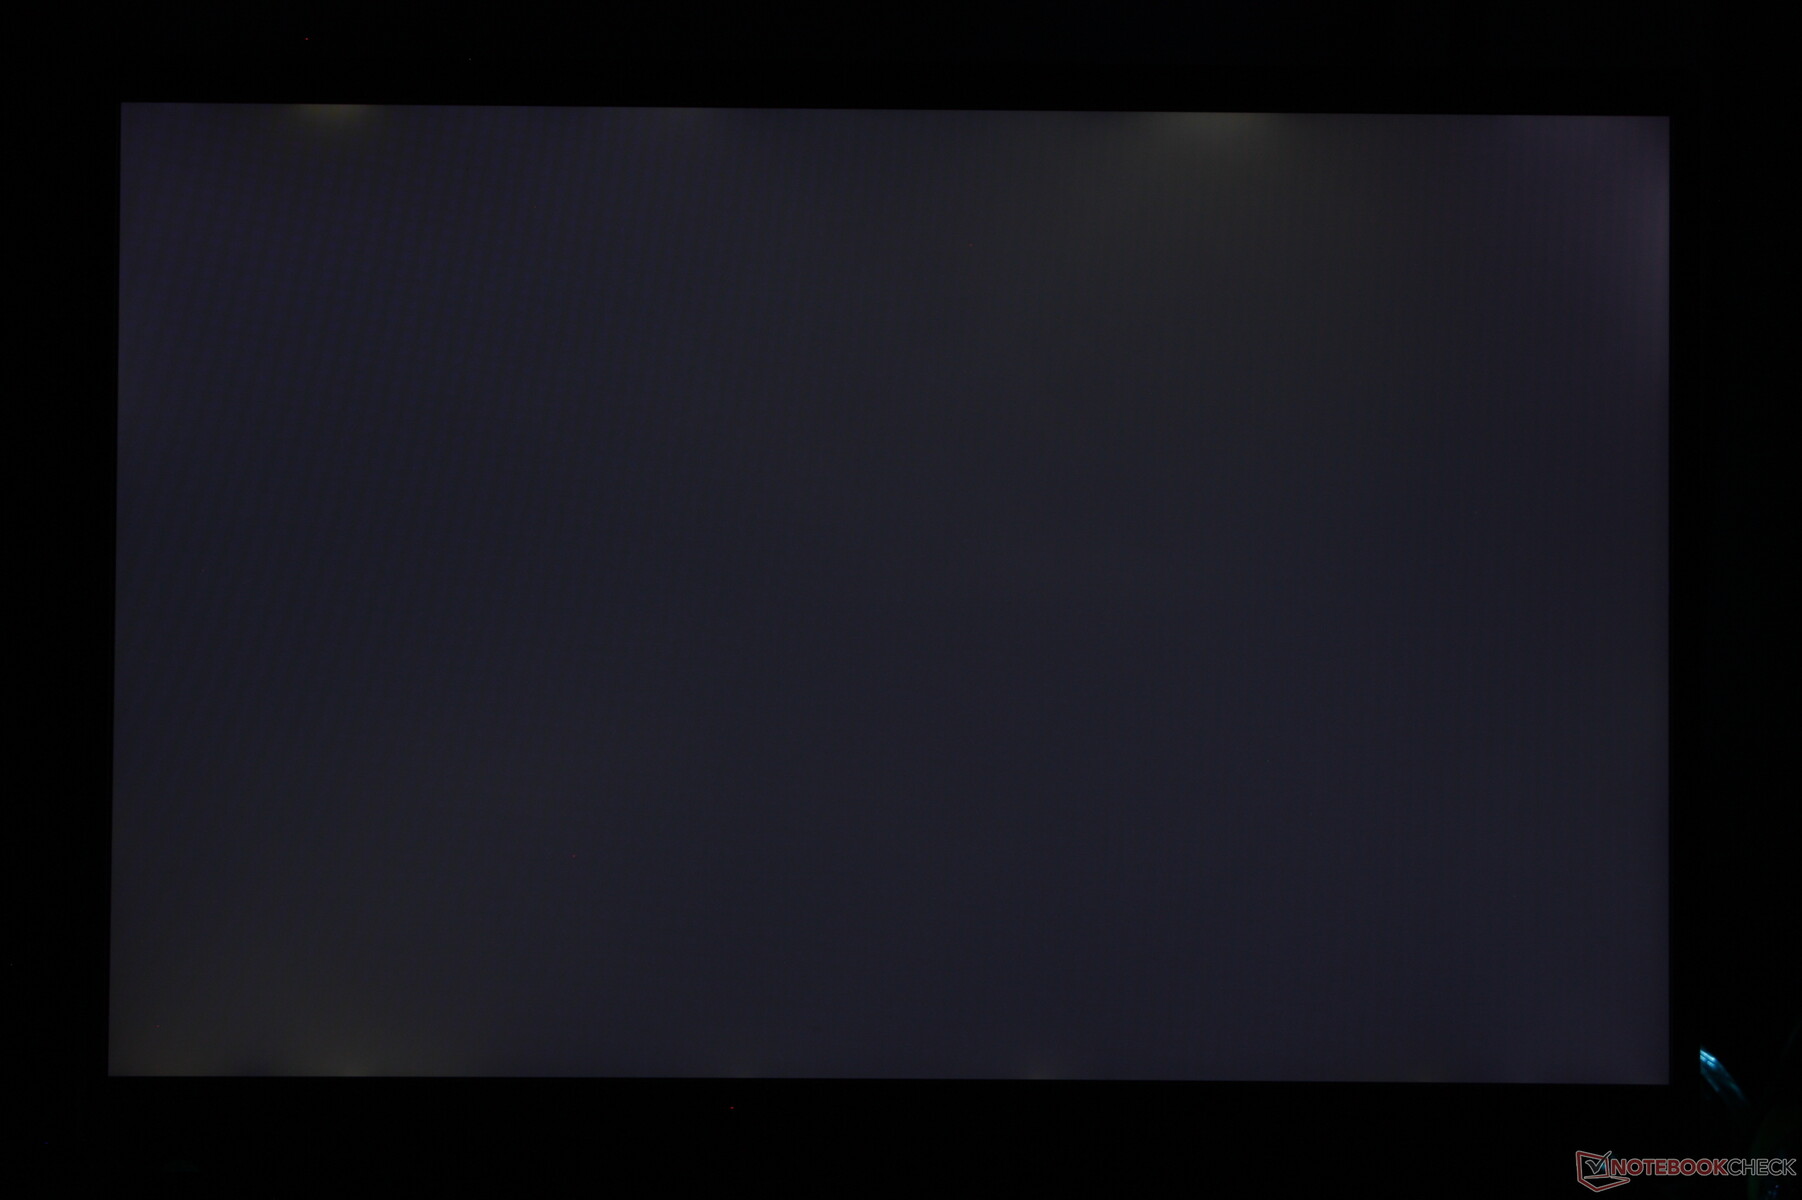
Homogénéité de la luminosité: 97 %
Valeur mesurée au centre, sur batterie: 372.8 cd/m²
Contraste: 1165:1 (Valeurs des noirs: 0.32 cd/m²)
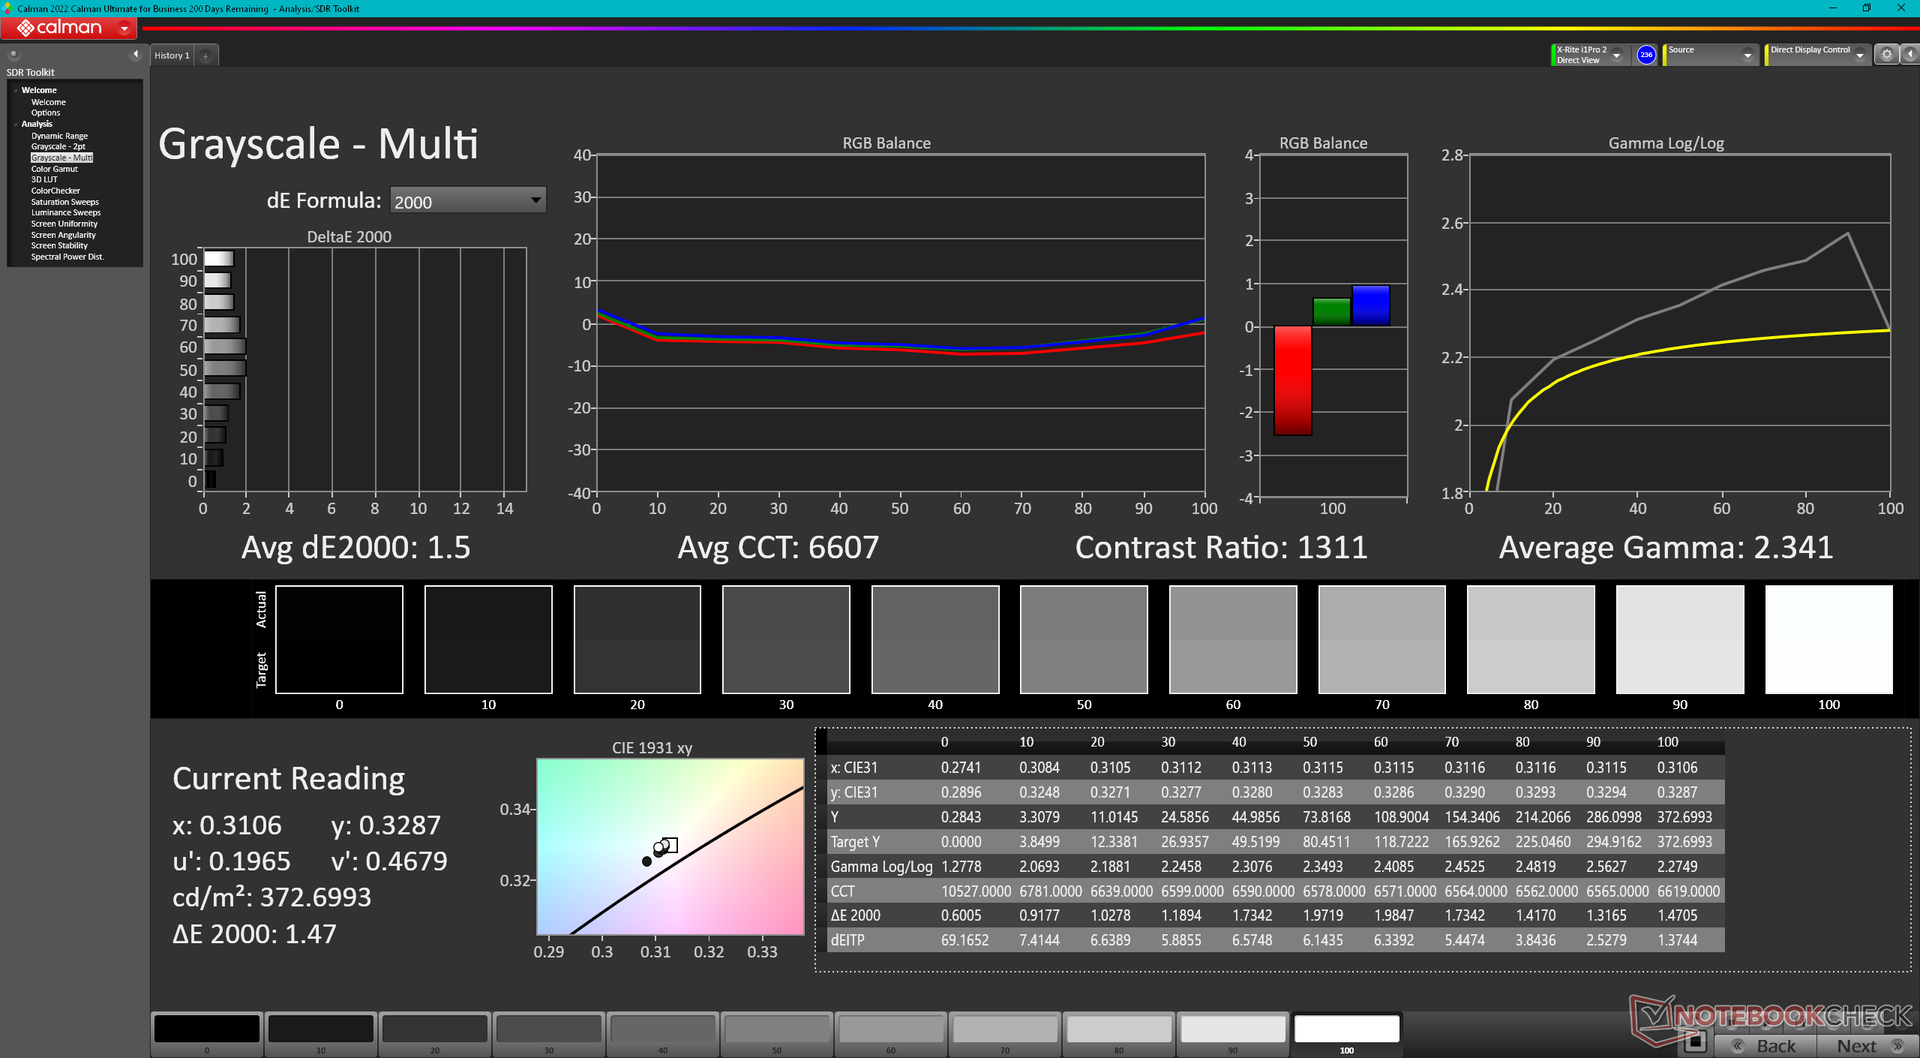
ΔE ColorChecker Calman: 1.92 | ∀{0.5-29.43 Ø4.71}
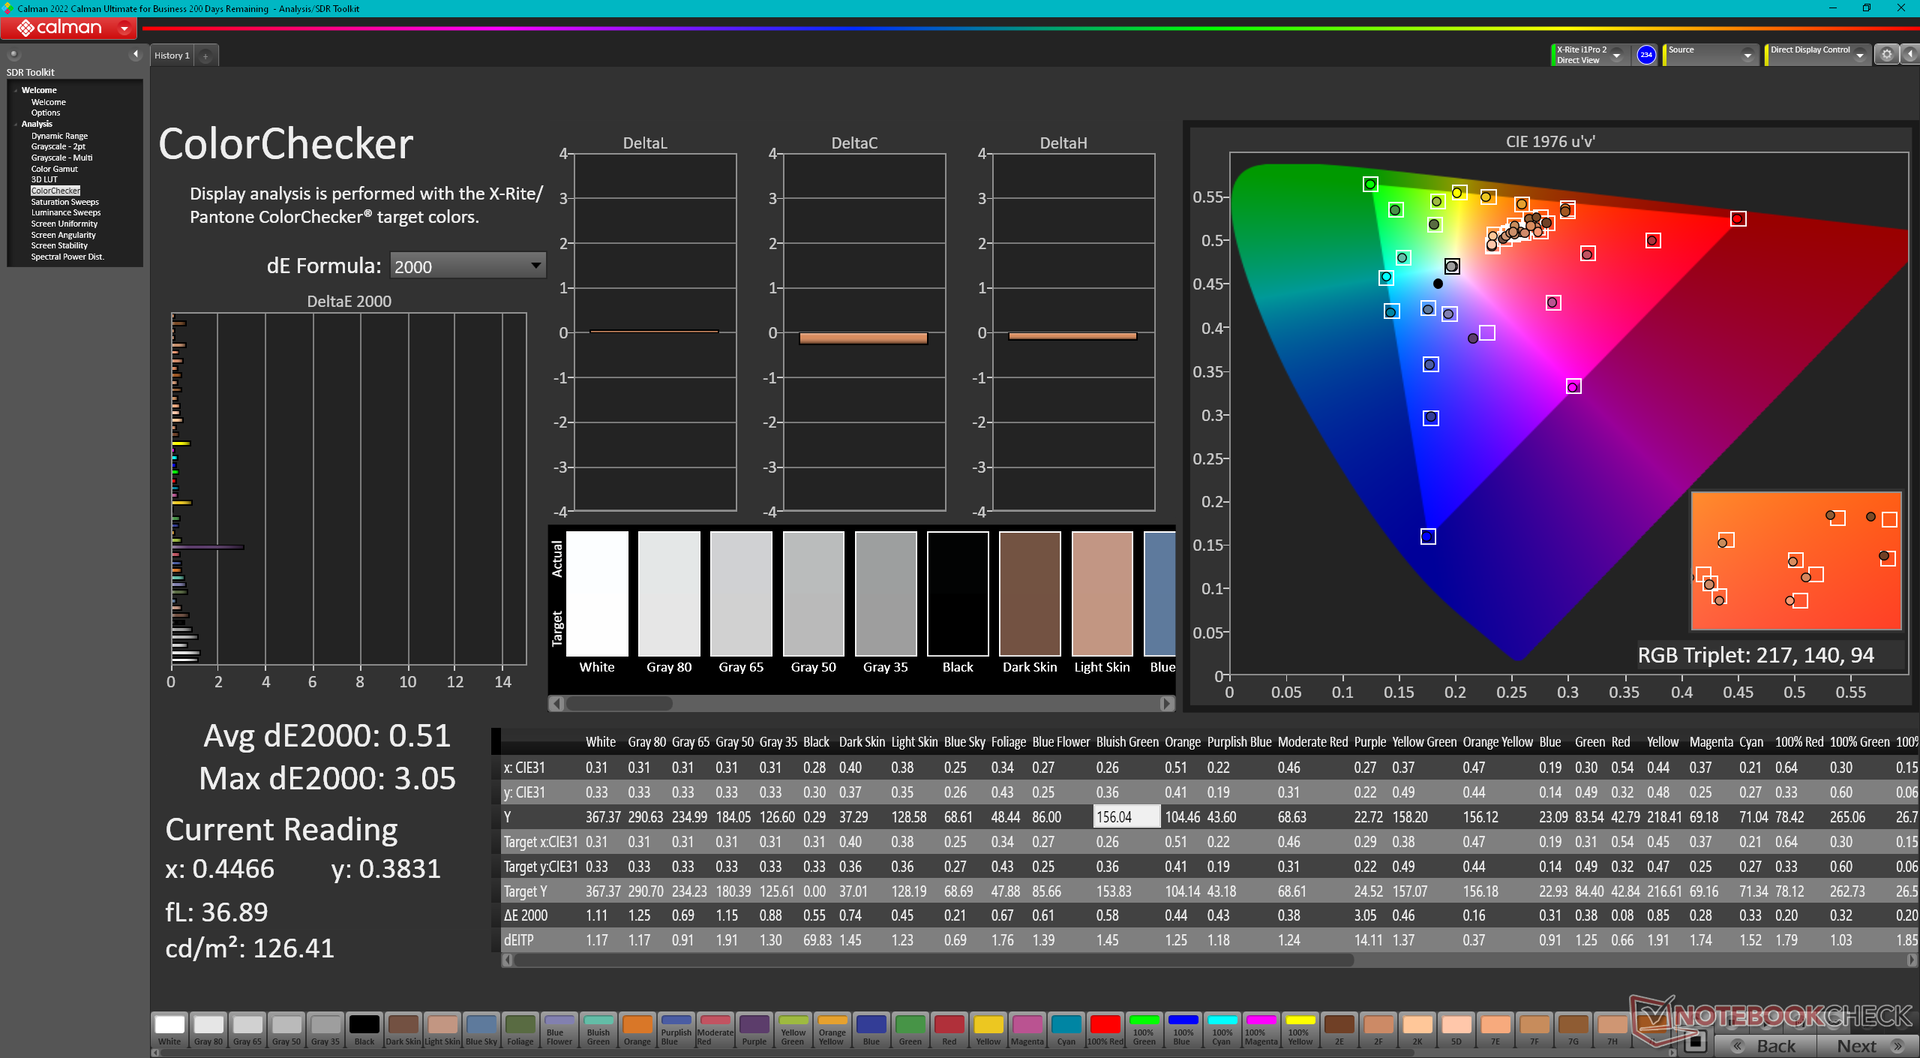
calibrated: 0.51
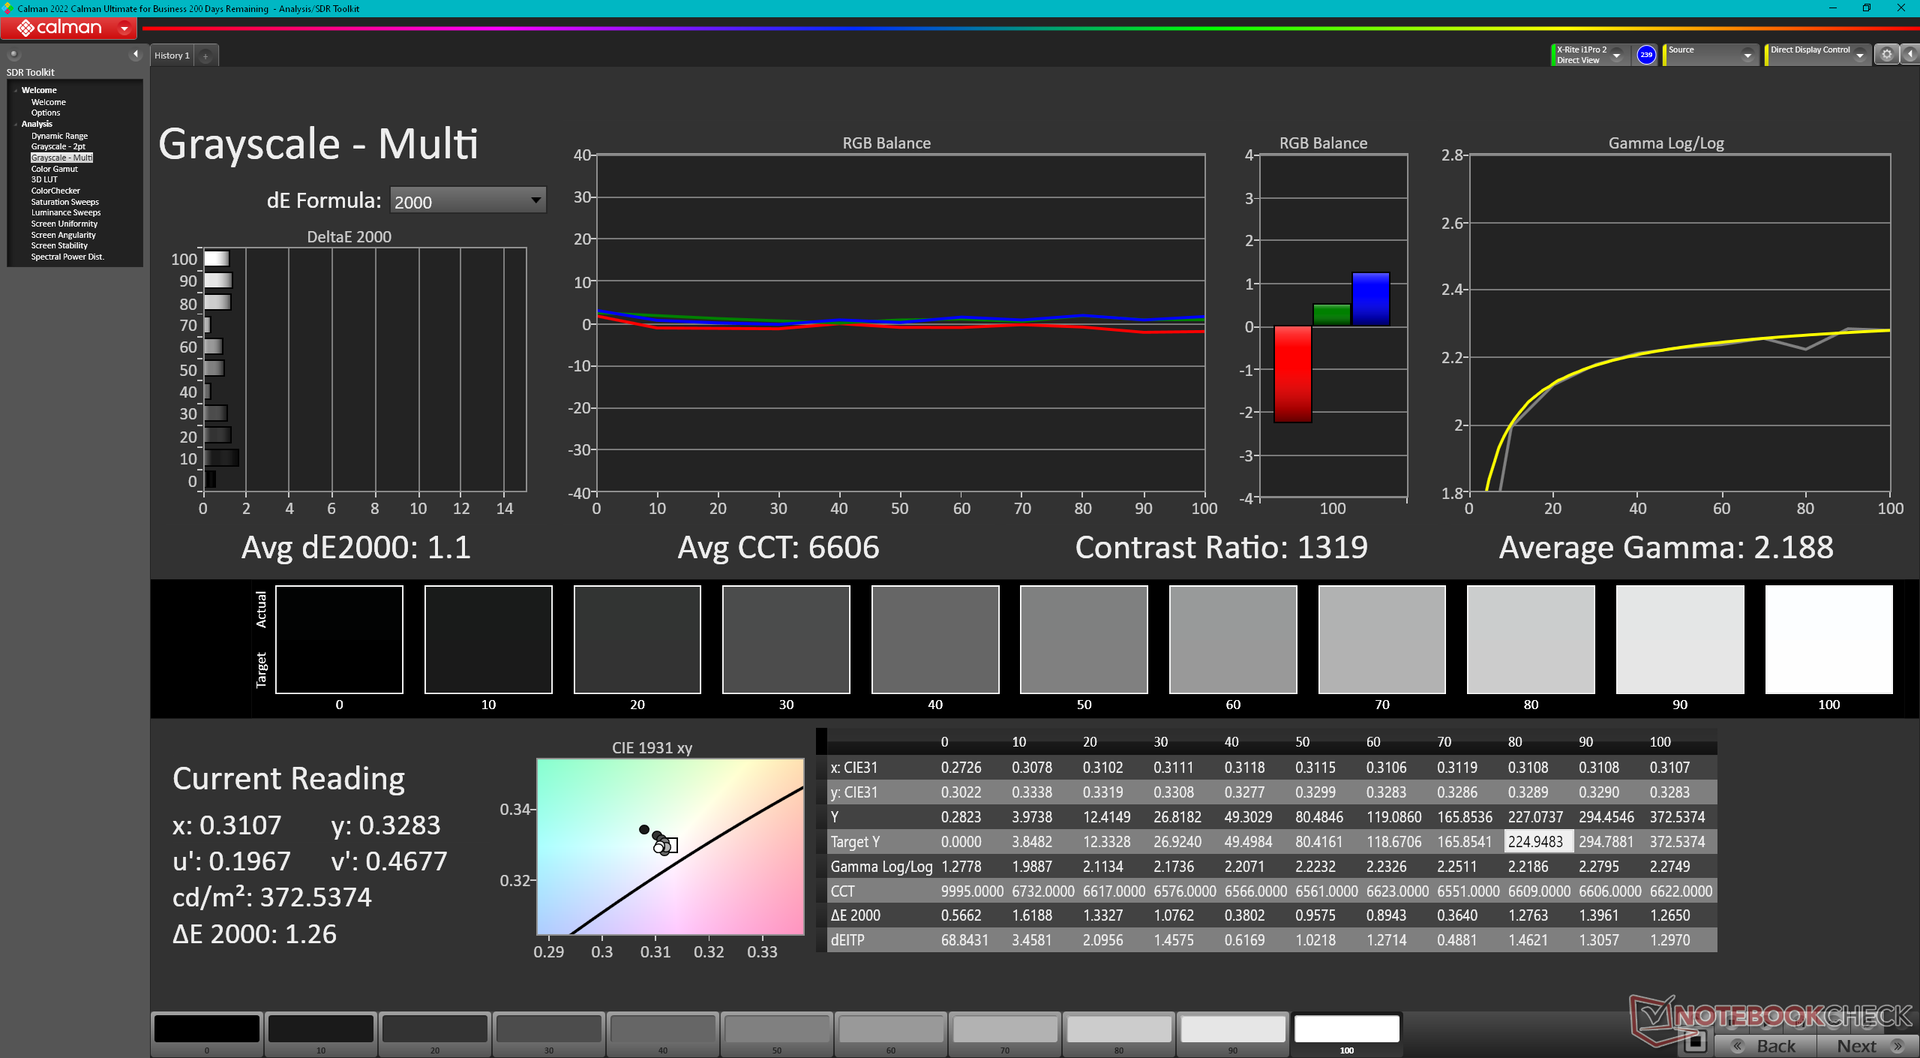
ΔE Greyscale Calman: 1.5 | ∀{0.09-98 Ø4.96}
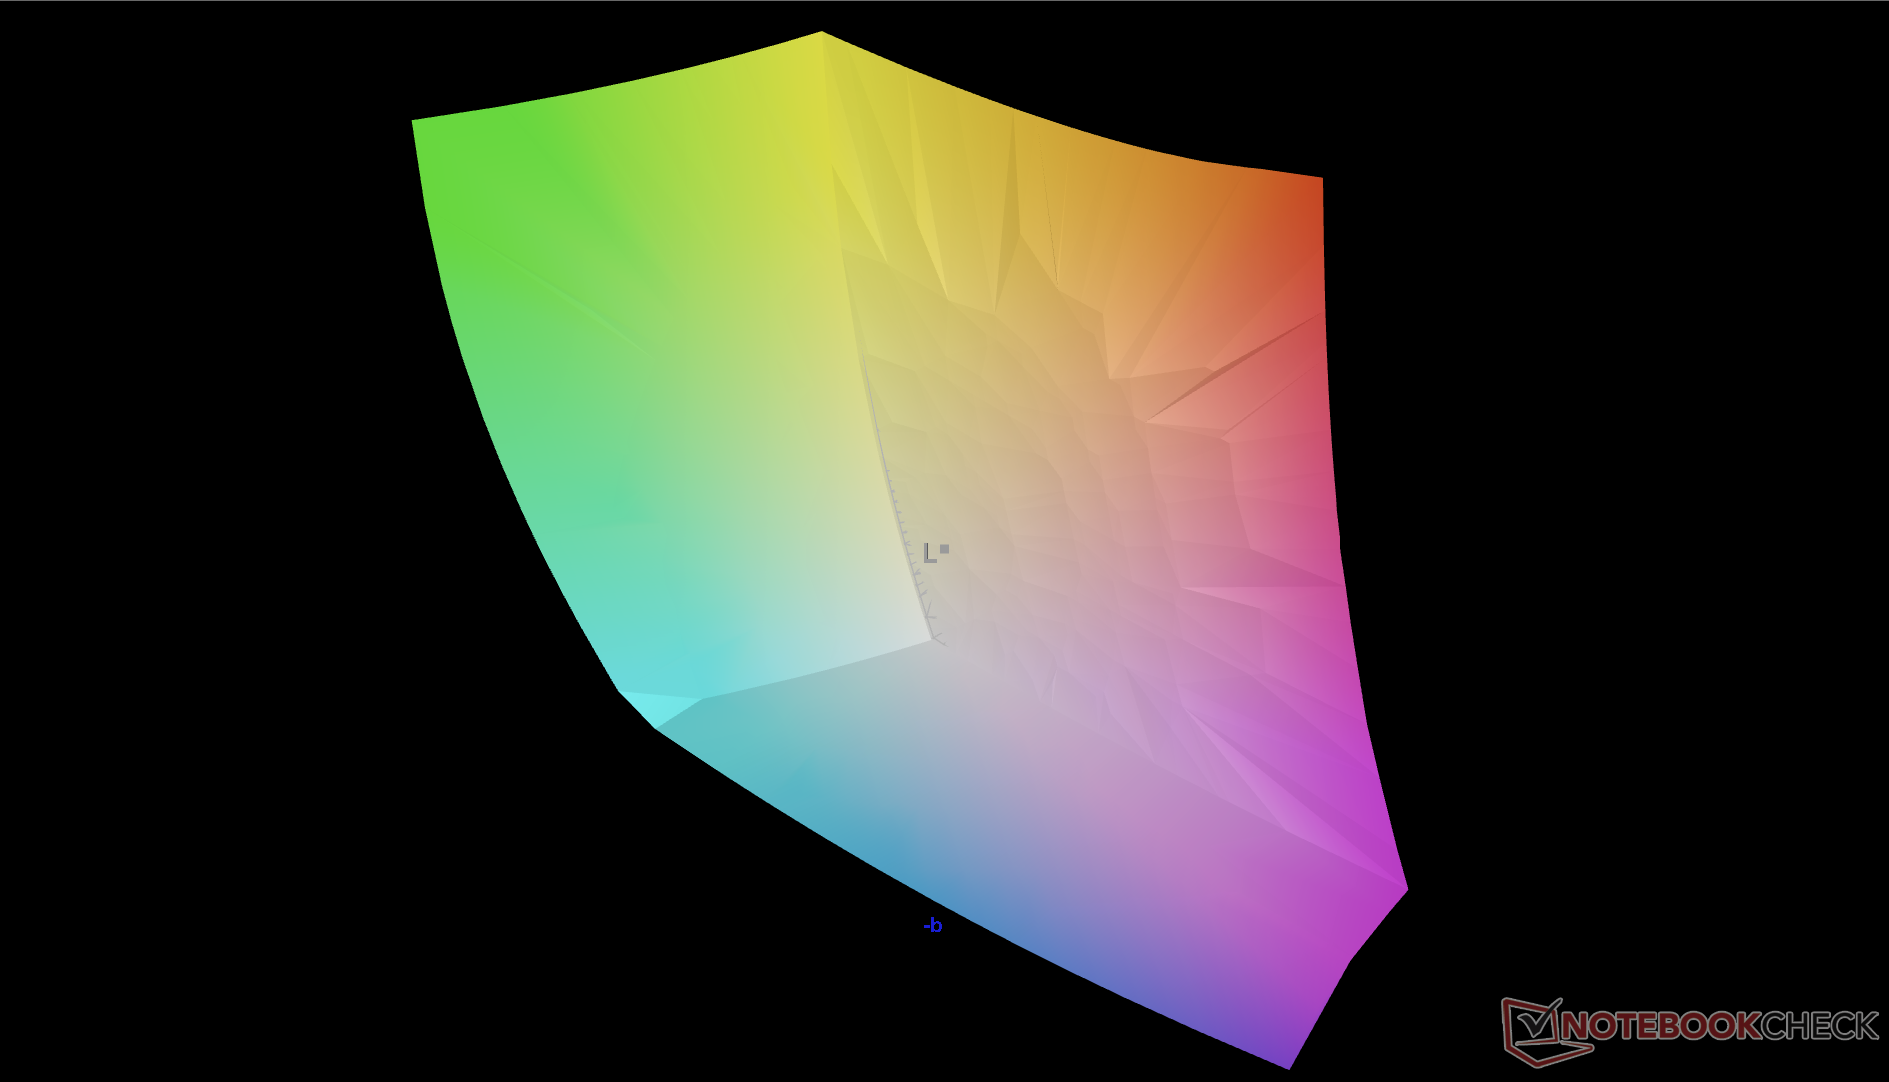
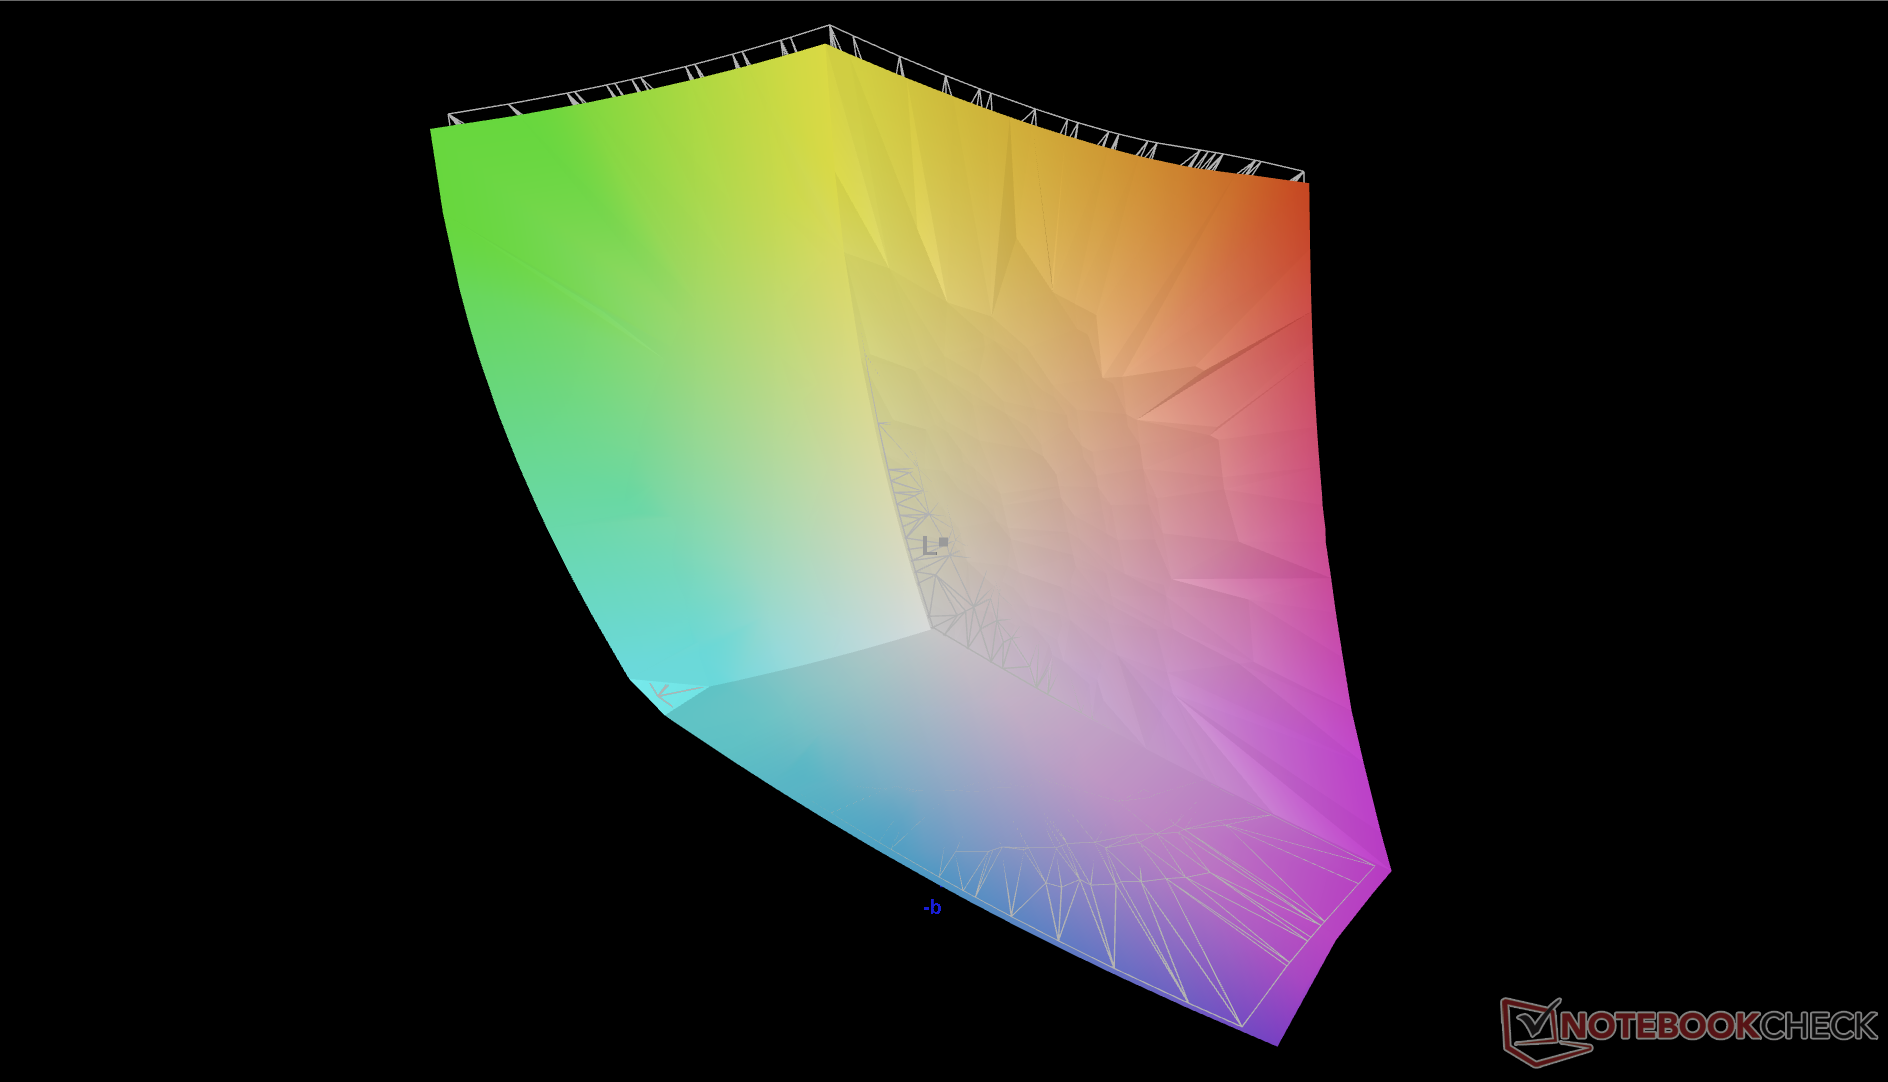
89.8% AdobeRGB 1998 (Argyll 3D)
100% sRGB (Argyll 3D)
97.7% Display P3 (Argyll 3D)
Gamma: 2.34
CCT: 6607 K
| Alienware m18 R1 Chi Mei 180JME, IPS, 1920x1200, 18" | Razer Blade 18 RTX 4070 AU Optronics B180QAN01.0, IPS, 2560x1600, 18" | Asus ROG Strix Scar 18 2023 G834JY-N6005W NE180QDM-NZ2, IPS, 2560x1600, 18" | Eluktronics Mech-17 GP2 BOE NE170QDM-NZ1, IPS, 2560x1600, 17" | MSI Titan GT77 HX 13VI B173ZAN06.C, Mini-LED, 3840x2160, 17.3" | Alienware x17 R2 P48E AU Optronics B173HAN, IPS, 1920x1080, 17.3" | |
|---|---|---|---|---|---|---|
| Display | -2% | -2% | -17% | 0% | -10% | |
| Display P3 Coverage (%) | 97.7 | 96.9 -1% | 97.2 -1% | 69.1 -29% | 94.9 -3% | 79.2 -19% |
| sRGB Coverage (%) | 100 | 99.8 0% | 99.9 0% | 99.7 0% | 99.9 0% | 99.8 0% |
| AdobeRGB 1998 Coverage (%) | 89.8 | 85.3 -5% | 84.9 -5% | 69.8 -22% | 92.4 3% | 79.6 -11% |
| Response Times | -11% | -34% | -148% | -675% | -153% | |
| Response Time Grey 50% / Grey 80% * (ms) | 3 ? | 4.2 ? -40% | 5.41 ? -80% | 12 ? -300% | 38.4 ? -1180% | 12.4 ? -313% |
| Response Time Black / White * (ms) | 9.9 ? | 8 ? 19% | 8.62 ? 13% | 9.4 ? 5% | 26.6 ? -169% | 9.2 ? 7% |
| PWM Frequency (Hz) | 2380 ? | |||||
| Screen | -68% | -141% | -17% | 57715% | -48% | |
| Brightness middle (cd/m²) | 372.8 | 549.6 47% | 490 31% | 417.3 12% | 606 63% | 365.4 -2% |
| Brightness (cd/m²) | 367 | 524 43% | 468 28% | 387 5% | 602 64% | 344 -6% |
| Brightness Distribution (%) | 97 | 89 -8% | 86 -11% | 87 -10% | 93 -4% | 85 -12% |
| Black Level * (cd/m²) | 0.32 | 0.53 -66% | 0.54 -69% | 0.42 -31% | 0.0001 100% | 0.29 9% |
| Contrast (:1) | 1165 | 1037 -11% | 907 -22% | 994 -15% | 6060000 520072% | 1260 8% |
| Colorchecker dE 2000 * | 1.92 | 3.32 -73% | 4.97 -159% | 2.14 -11% | 4.8 -150% | 3.17 -65% |
| Colorchecker dE 2000 max. * | 3.65 | 6.63 -82% | 11.02 -202% | 4.09 -12% | 8.2 -125% | 7.69 -111% |
| Colorchecker dE 2000 calibrated * | 0.51 | 2.7 -429% | 2.97 -482% | 0.42 18% | 1.8 -253% | 0.51 -0% |
| Greyscale dE 2000 * | 1.5 | 2 -33% | 7.2 -380% | 3.1 -107% | 6.5 -333% | 5.3 -253% |
| Gamma | 2.34 94% | 2.29 96% | 2.161 102% | 2.19 100% | 2.63 84% | 2.18 101% |
| CCT | 6607 98% | 6319 103% | 6515 100% | 6040 108% | 6596 99% | 5879 111% |
| Moyenne finale (programmes/paramètres) | -27% /
-46% | -59% /
-96% | -61% /
-36% | 19013% /
37006% | -70% /
-55% |
* ... Moindre est la valeur, meilleures sont les performances
L'écran est pré-calibré pour des couleurs et des niveaux de gris précis dès sa sortie de l'emballage. Un étalonnage plus poussé du panneau n'améliorerait pas de manière significative les valeurs moyennes du deltaE et un étalonnage par l'utilisateur final n'est donc pas nécessaire.

Temps de réponse de l'écran
| ↔ Temps de réponse noir à blanc | ||
|---|---|---|
| 9.9 ms ... hausse ↗ et chute ↘ combinées | ↗ 5.4 ms hausse | 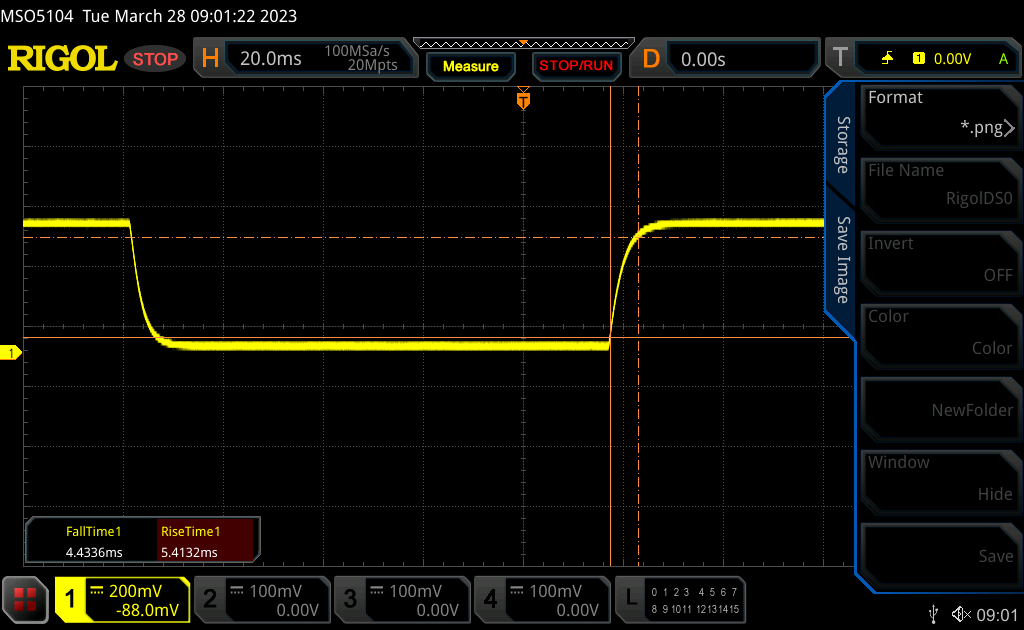 |
| ↘ 4.5 ms chute | ||
| L'écran montre de faibles temps de réponse, un bon écran pour jouer. En comparaison, tous les appareils testés affichent entre 0.1 (minimum) et 240 (maximum) ms. » 27 % des appareils testés affichent de meilleures performances. Cela signifie que les latences relevées sont meilleures que la moyenne (19.8 ms) de tous les appareils testés. | ||
| ↔ Temps de réponse gris 50% à gris 80% | ||
| 3 ms ... hausse ↗ et chute ↘ combinées | ↗ 1.5 ms hausse | 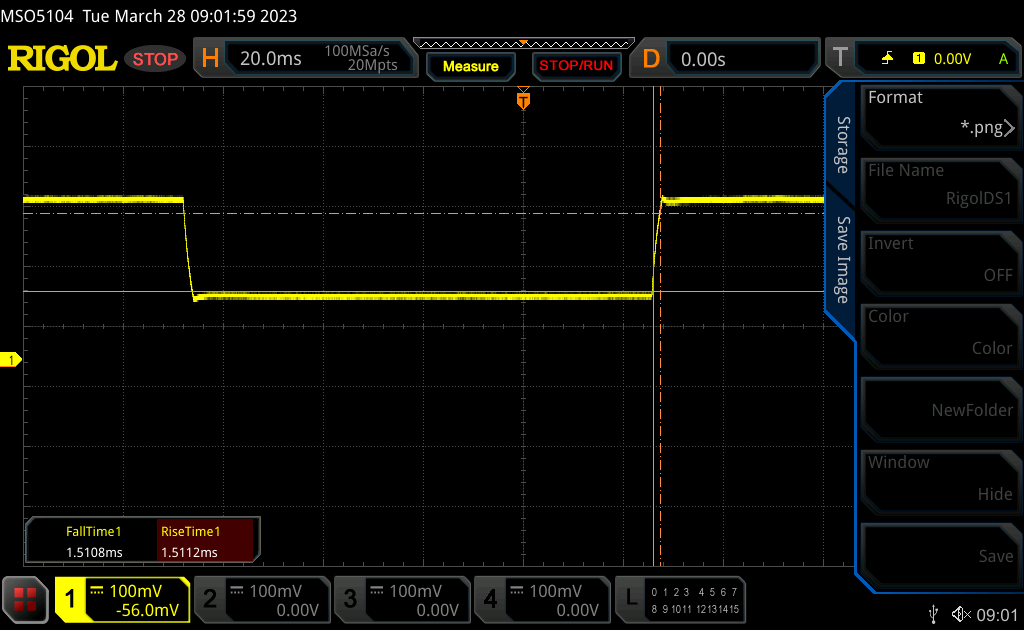 |
| ↘ 1.5 ms chute | ||
| L'écran montre de très faibles temps de réponse, parfait pour le jeu. En comparaison, tous les appareils testés affichent entre 0.165 (minimum) et 636 (maximum) ms. » 13 % des appareils testés affichent de meilleures performances. Cela signifie que les latences relevées sont meilleures que la moyenne (31 ms) de tous les appareils testés. | ||
Scintillement / MLI (Modulation de largeur d'impulsion)
| Scintillement / MLI (Modulation de largeur d'impulsion) non décelé | 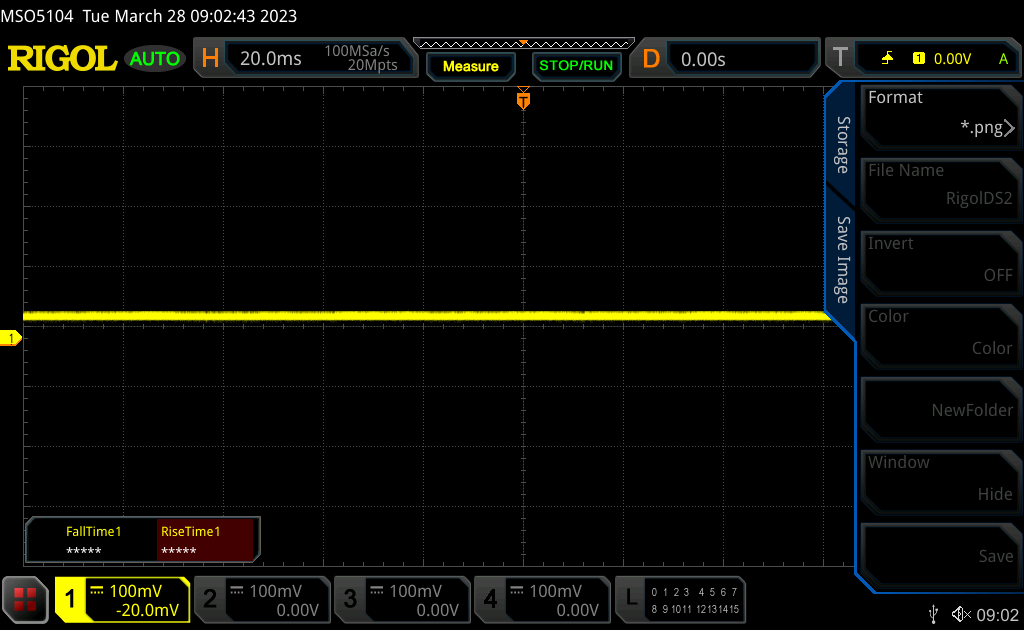 | ||
En comparaison, 52 % des appareils testés n'emploient pas MDI pour assombrir leur écran. Nous avons relevé une moyenne à 7757 (minimum : 5 - maximum : 343500) Hz dans le cas où une MDI était active. | |||
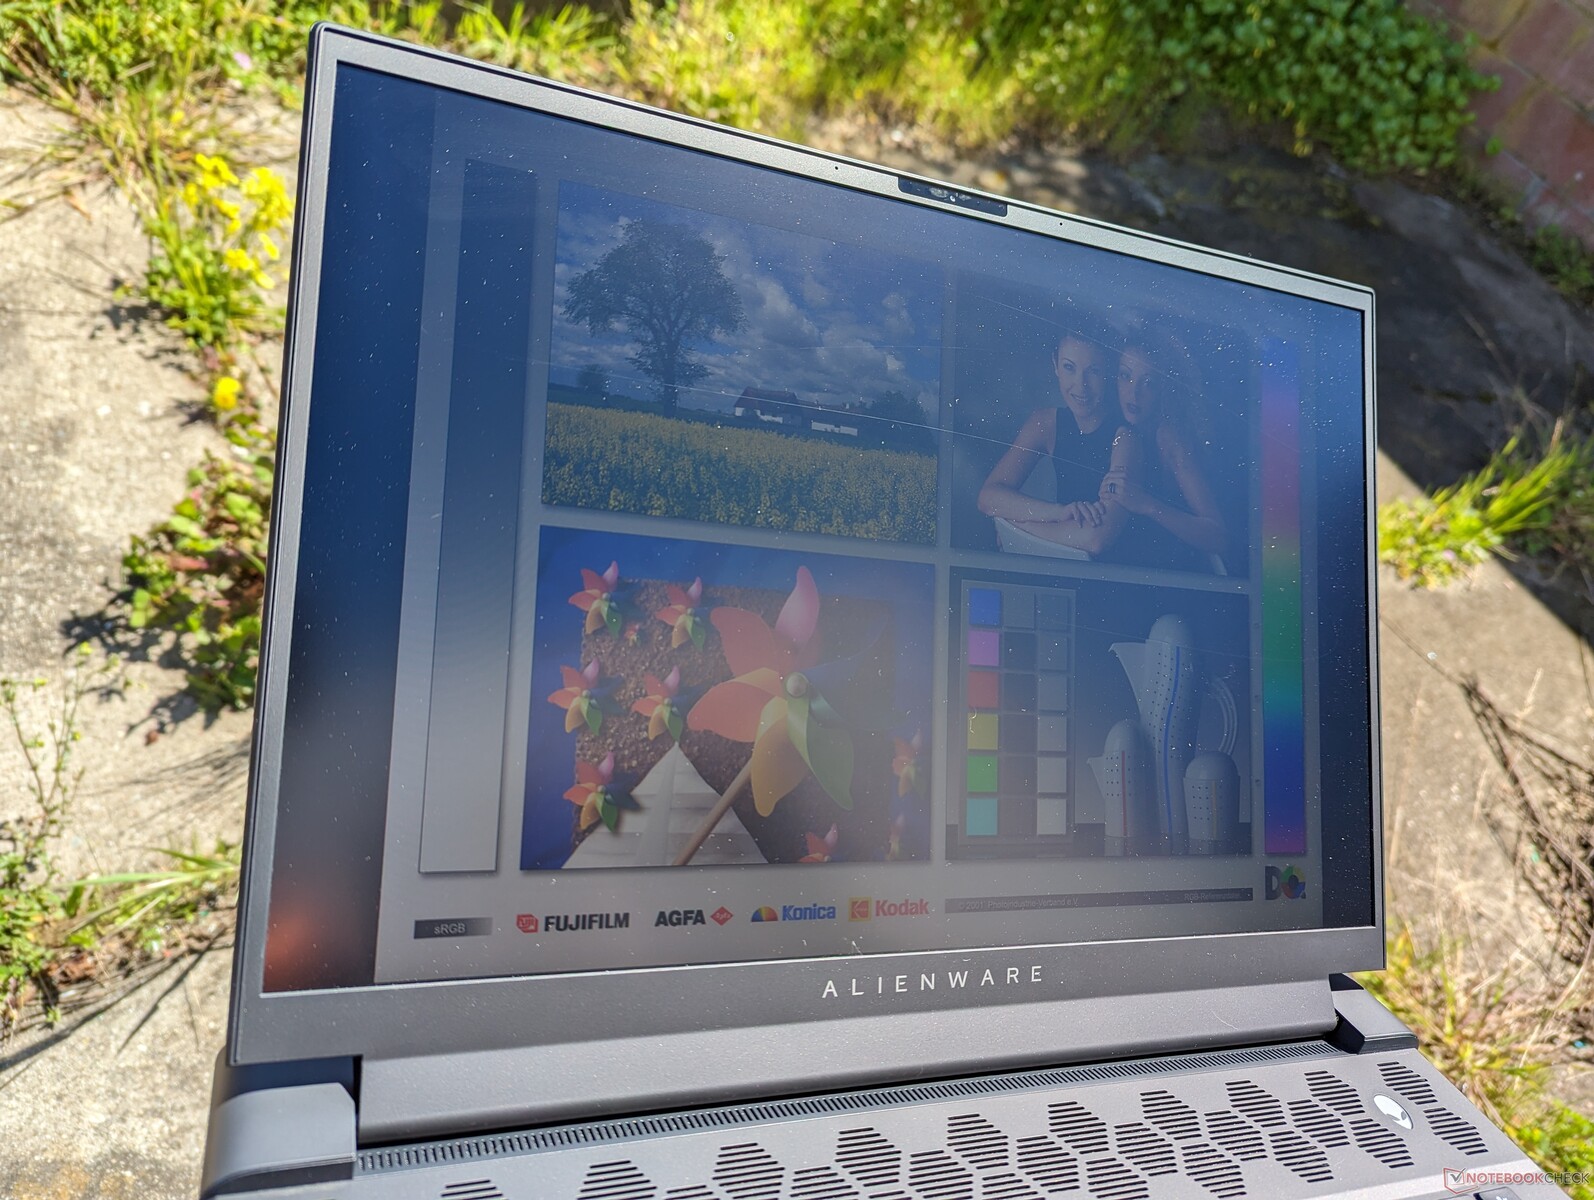
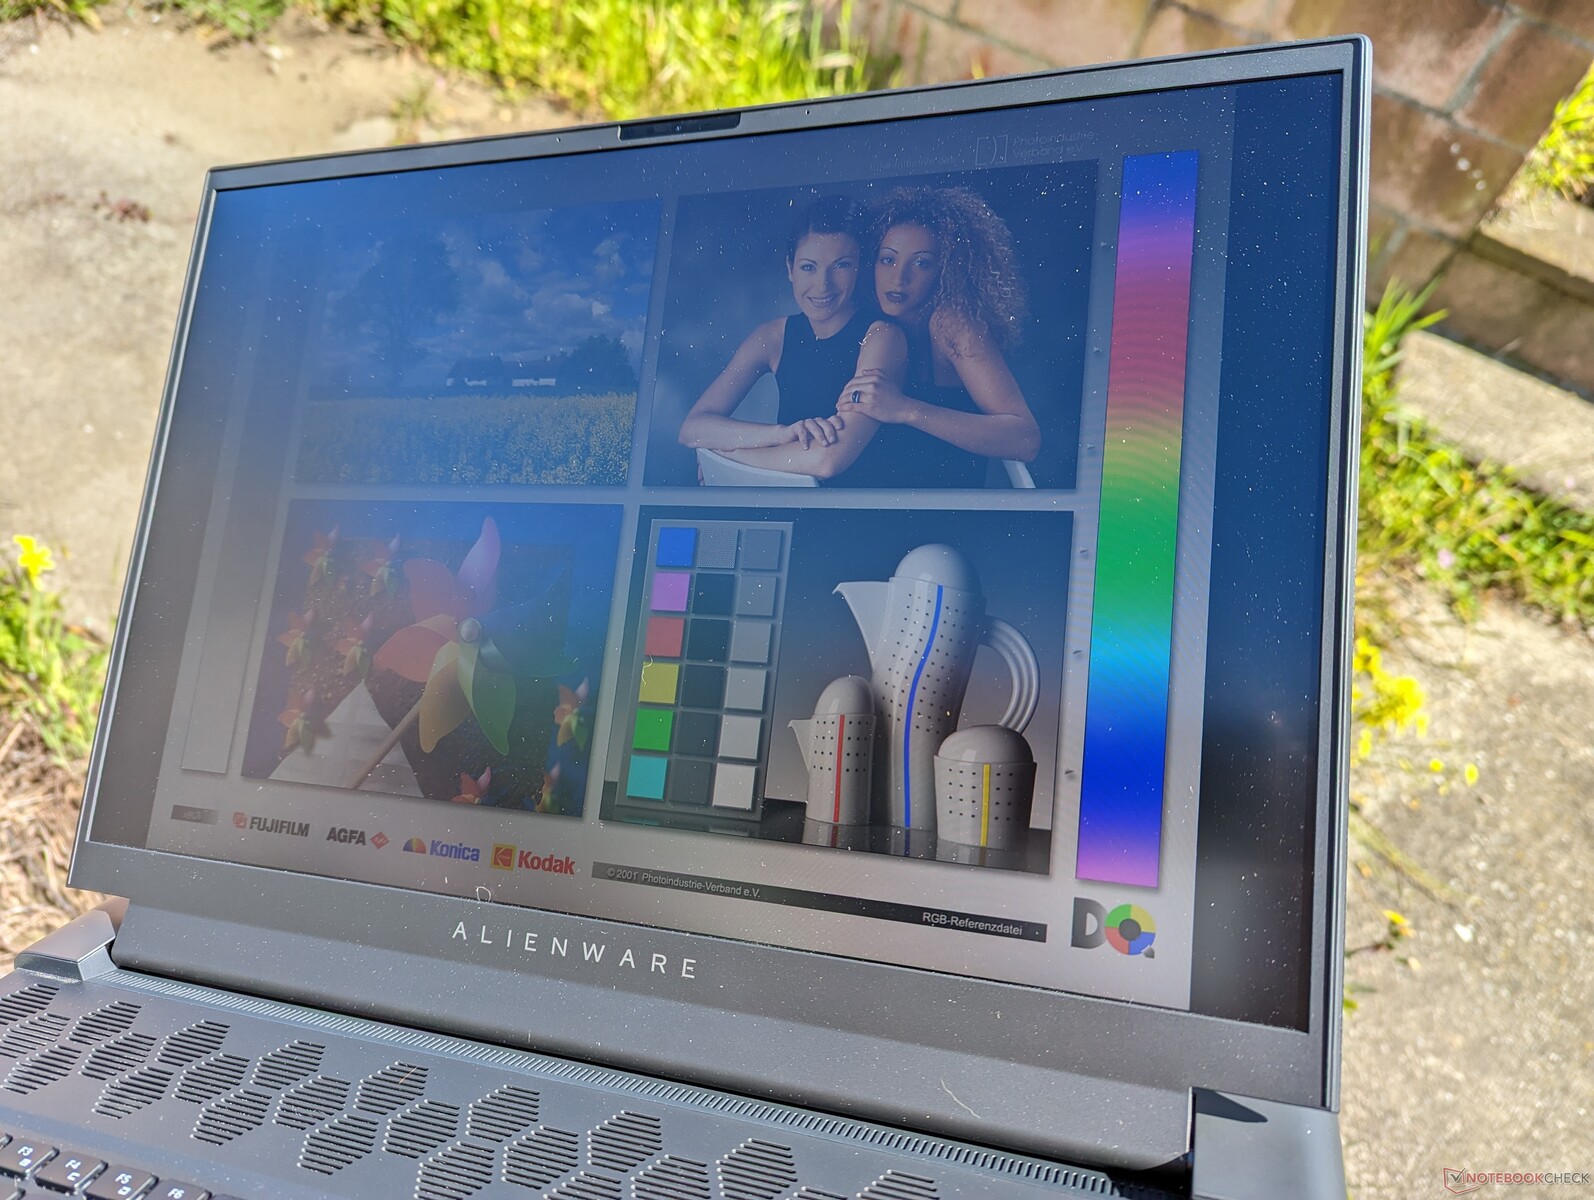
La visibilité en extérieur est moyenne pour la catégorie, car les écrans de la plupart des ordinateurs portables de jeu se situent généralement entre 300 et 400 nits. Malgré cela, le poids important de l'Alienware décourage l'utilisation en extérieur. Le Blade 18 et le Titan GT77 sont plus lumineux et offrent une meilleure visibilité à l'extérieur.
Performance - Intel 13th Gen + Nvidia Ada Lovelace
Conditions d'essai
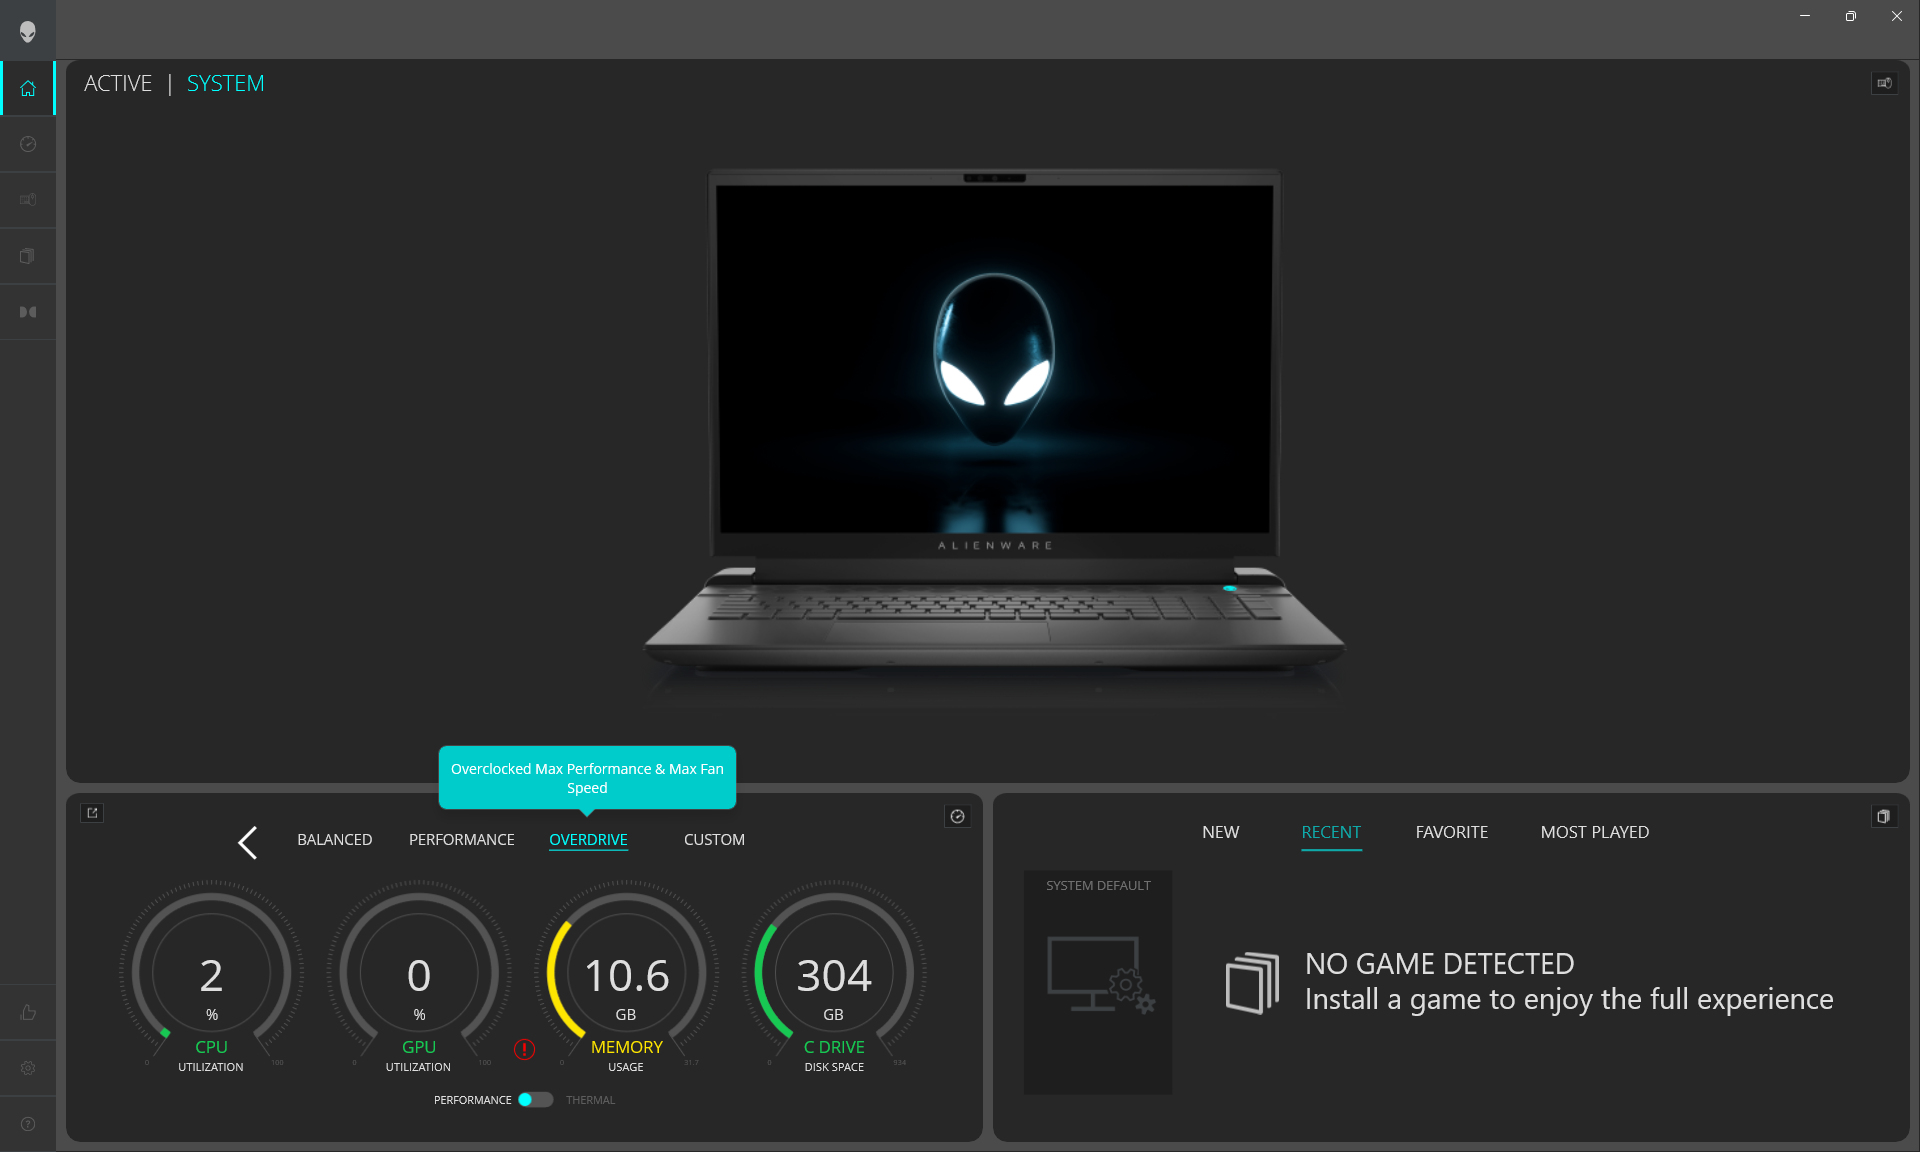
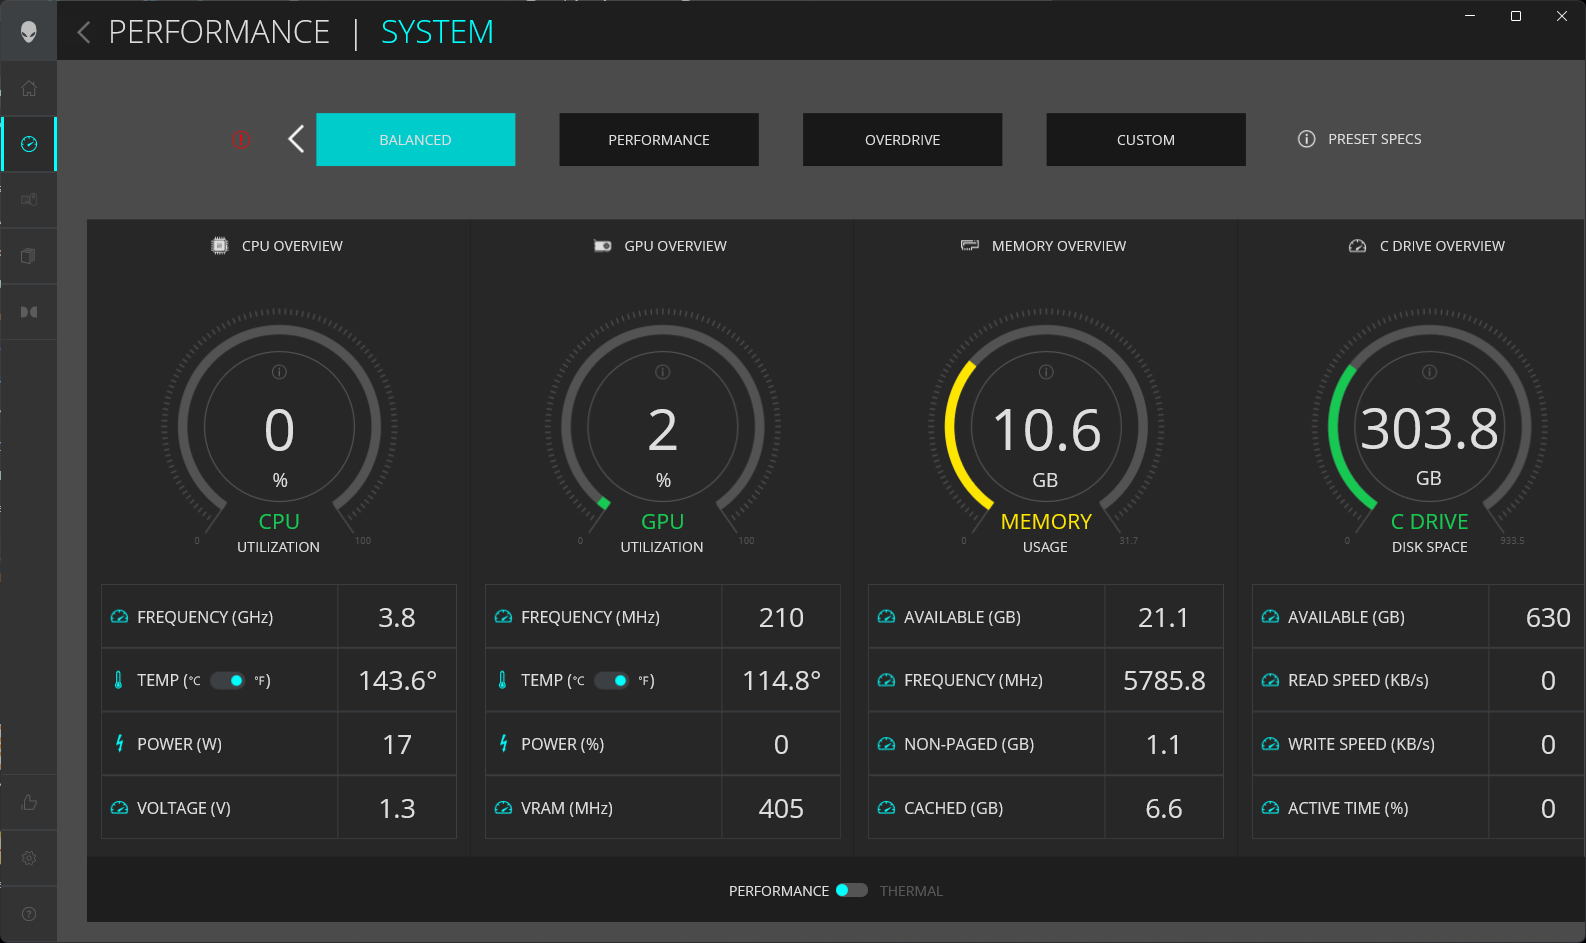
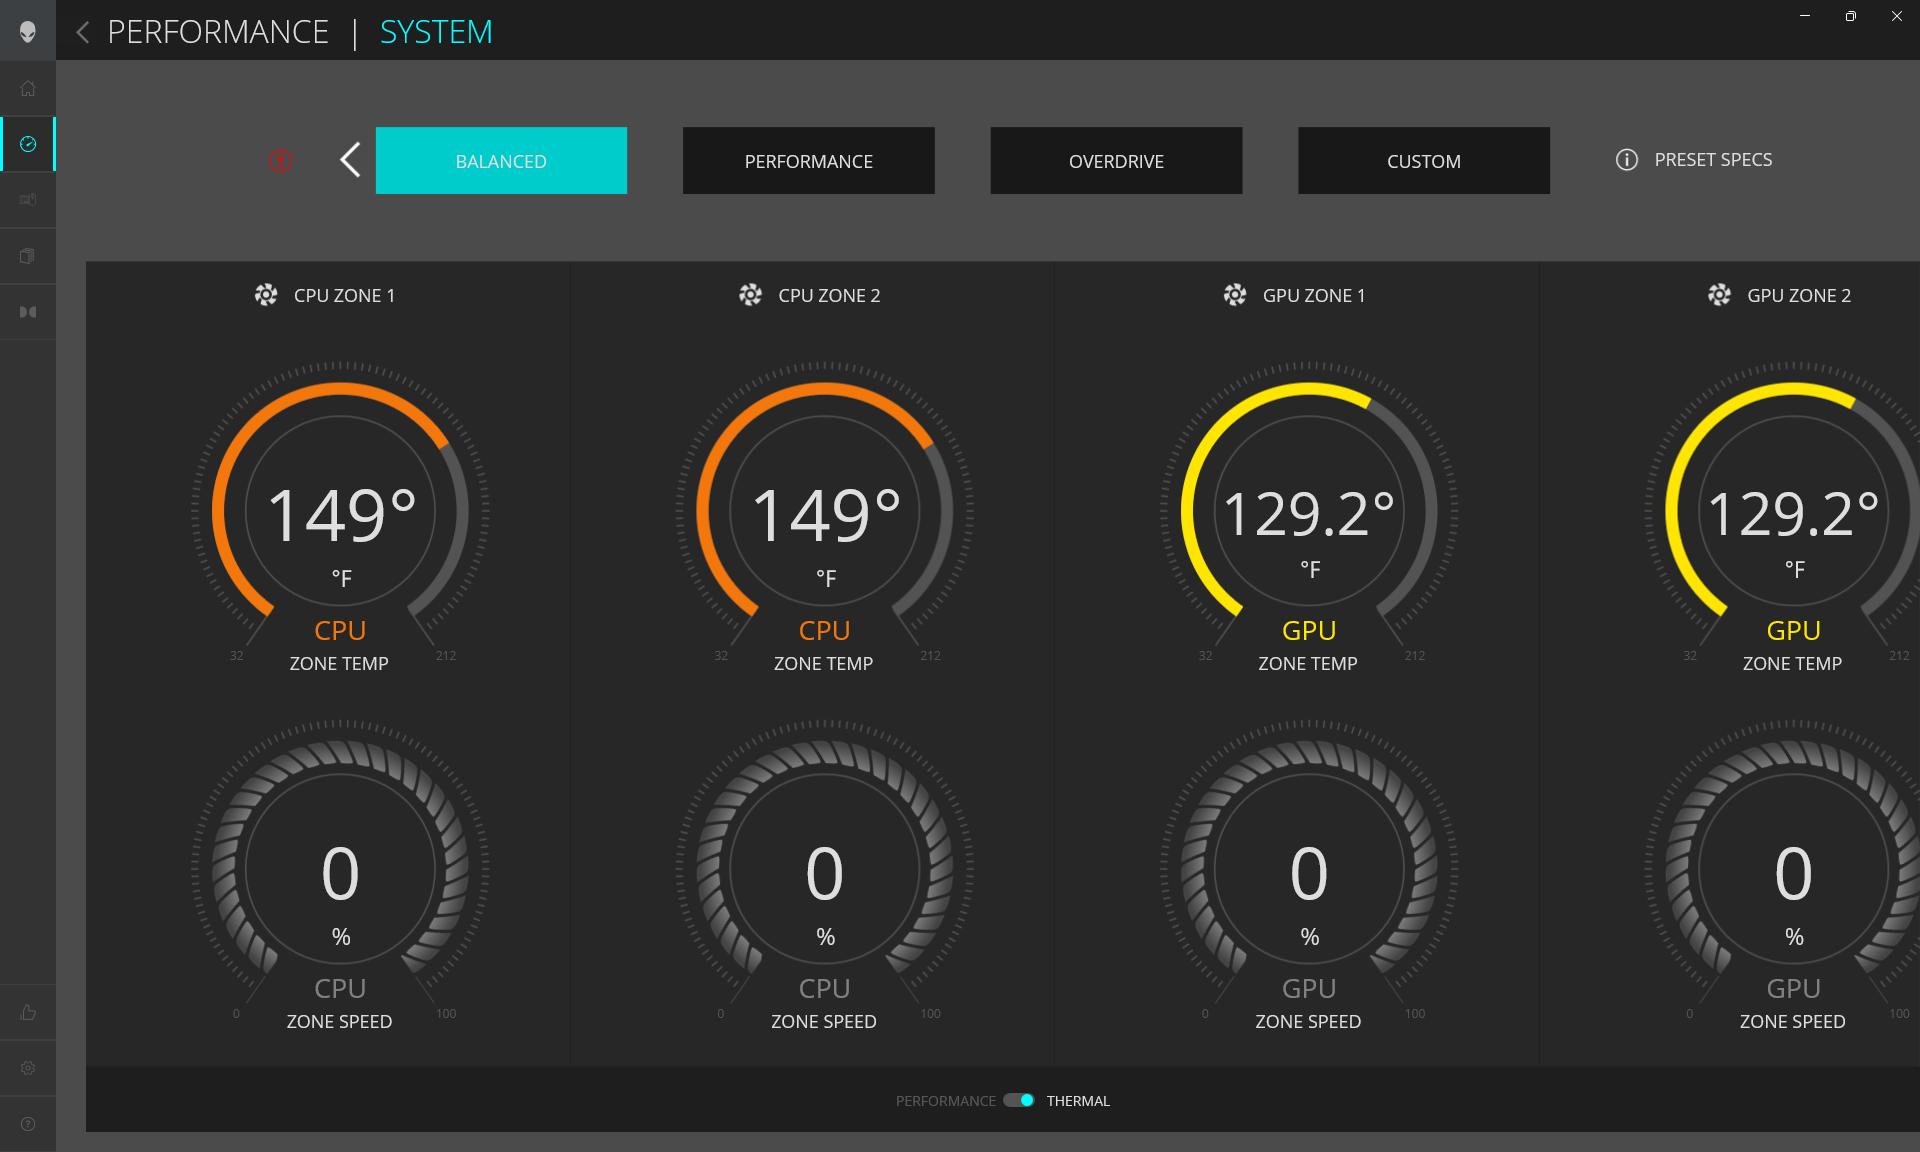
Nous avons réglé notre appareil en mode Performance via Windows, en mode GPU discret via le panneau de configuration Nvidia et en mode Overdrive via le centre de commande Alienware avant d'effectuer les tests de référence ci-dessous. Dell a complètement rafraîchi le logiciel Command Center cette année pour qu'il soit plus facile à utiliser et que la taille des caractères soit plus grande qu'auparavant. Cependant, il se charge toujours très lentement, surtout si on le compare aux équivalents plus rapides que sont le MSI Center ou le Schenker Control Center.
Nous avons rencontré quelques bugs avec l'Alienware Command Center qui méritent d'être mentionnés, même après avoir mis à jour la dernière version au moment de la rédaction de cet article. Tout d'abord, le logiciel ne se charge pas si un moniteur externe est connecté. Deuxièmement, les ventilateurs internes continuent parfois de fonctionner très bruyamment même lorsque le système est en veille ou en hibernation en mode Performance ou Overdrive.
Advanced Optimus est pris en charge, ce qui signifie que les utilisateurs peuvent basculer entre les modes GPU discret et Optimus via le panneau de configuration Nvidia sans avoir besoin de redémarrer. G-Sync n'est disponible qu'en mode dGPU, tandis qu'Optimus s'active automatiquement si un moniteur externe est connecté.
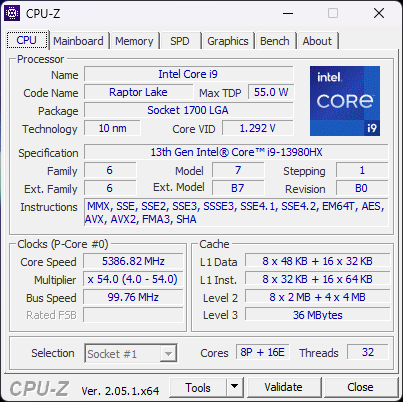
Processeur
Les performances du processeur sont parmi les plus rapides de tous les processeurs mobiles actuellement disponibles sur le marché. Les utilisateurs peuvent s'attendre à des gains d'environ 10 % pour le single-thread et 75 % pour le multi-thread, respectivement, par rapport au processeur Core i9-12900HK de 12e génération.Core i9-12900HK dans l'ancien Alienware x17 R2. Le principal concurrent Zen 4 d'AMD, leRyzen 9 7945HX n'est pas à la hauteur dans les charges à un seul thread, avec un écart de 10 à 15 %.
Malgré l'augmentation massive des performances par rapport à Alder Lake-H, les écarts de performances entre leCore i9-13900HX,Core i9-13950HXet leCore i9-13980HX sont très faibles, inférieures à 5 %. Par conséquent, si vous avez le choix entre ces trois processeurs, vous pouvez économiser de l'argent en optant pour le i9-13900HX, plus "lent".
L'option CPU la plus basse disponible est le Core i7-13700HX qui est plus lent que notre i9-13980HX d'environ 33 %.
Cinebench R15 Multi Loop
Cinebench R23: Multi Core | Single Core
Cinebench R20: CPU (Multi Core) | CPU (Single Core)
Cinebench R15: CPU Multi 64Bit | CPU Single 64Bit
Blender: v2.79 BMW27 CPU
7-Zip 18.03: 7z b 4 | 7z b 4 -mmt1
Geekbench 5.5: Multi-Core | Single-Core
HWBOT x265 Benchmark v2.2: 4k Preset
LibreOffice : 20 Documents To PDF
R Benchmark 2.5: Overall mean
* ... Moindre est la valeur, meilleures sont les performances
AIDA64: FP32 Ray-Trace | FPU Julia | CPU SHA3 | CPU Queen | FPU SinJulia | FPU Mandel | CPU AES | CPU ZLib | FP64 Ray-Trace | CPU PhotoWorxx
| Performance rating | |
| Alienware m18 R1 | |
| Eluktronics Mech-17 GP2 | |
| MSI Titan GT77 HX 13VI | |
| Asus ROG Strix Scar 18 2023 G834JY-N6005W | |
| Moyenne Intel Core i9-13980HX | |
| Razer Blade 18 RTX 4070 | |
| Alienware x17 R2 P48E | |
| AIDA64 / FP32 Ray-Trace | |
| Alienware m18 R1 | |
| MSI Titan GT77 HX 13VI | |
| Asus ROG Strix Scar 18 2023 G834JY-N6005W | |
| Eluktronics Mech-17 GP2 | |
| Moyenne Intel Core i9-13980HX (21332 - 29553, n=9) | |
| Razer Blade 18 RTX 4070 | |
| Alienware x17 R2 P48E | |
| AIDA64 / FPU Julia | |
| Alienware m18 R1 | |
| MSI Titan GT77 HX 13VI | |
| Asus ROG Strix Scar 18 2023 G834JY-N6005W | |
| Moyenne Intel Core i9-13980HX (108001 - 148168, n=9) | |
| Eluktronics Mech-17 GP2 | |
| Razer Blade 18 RTX 4070 | |
| Alienware x17 R2 P48E | |
| AIDA64 / CPU SHA3 | |
| Alienware m18 R1 | |
| MSI Titan GT77 HX 13VI | |
| Eluktronics Mech-17 GP2 | |
| Asus ROG Strix Scar 18 2023 G834JY-N6005W | |
| Moyenne Intel Core i9-13980HX (5264 - 7142, n=9) | |
| Razer Blade 18 RTX 4070 | |
| Alienware x17 R2 P48E | |
| AIDA64 / CPU Queen | |
| Alienware m18 R1 | |
| Asus ROG Strix Scar 18 2023 G834JY-N6005W | |
| Eluktronics Mech-17 GP2 | |
| MSI Titan GT77 HX 13VI | |
| Moyenne Intel Core i9-13980HX (126758 - 143409, n=9) | |
| Razer Blade 18 RTX 4070 | |
| Alienware x17 R2 P48E | |
| AIDA64 / FPU SinJulia | |
| Eluktronics Mech-17 GP2 | |
| Asus ROG Strix Scar 18 2023 G834JY-N6005W | |
| MSI Titan GT77 HX 13VI | |
| Alienware m18 R1 | |
| Moyenne Intel Core i9-13980HX (13785 - 17117, n=9) | |
| Razer Blade 18 RTX 4070 | |
| Alienware x17 R2 P48E | |
| AIDA64 / FPU Mandel | |
| Alienware m18 R1 | |
| MSI Titan GT77 HX 13VI | |
| Asus ROG Strix Scar 18 2023 G834JY-N6005W | |
| Eluktronics Mech-17 GP2 | |
| Moyenne Intel Core i9-13980HX (53398 - 73758, n=9) | |
| Razer Blade 18 RTX 4070 | |
| Alienware x17 R2 P48E | |
| AIDA64 / CPU AES | |
| Eluktronics Mech-17 GP2 | |
| MSI Titan GT77 HX 13VI | |
| Alienware m18 R1 | |
| Asus ROG Strix Scar 18 2023 G834JY-N6005W | |
| Moyenne Intel Core i9-13980HX (105169 - 136520, n=9) | |
| Razer Blade 18 RTX 4070 | |
| Alienware x17 R2 P48E | |
| AIDA64 / CPU ZLib | |
| MSI Titan GT77 HX 13VI | |
| Asus ROG Strix Scar 18 2023 G834JY-N6005W | |
| Alienware m18 R1 | |
| Eluktronics Mech-17 GP2 | |
| Moyenne Intel Core i9-13980HX (1513 - 2039, n=9) | |
| Razer Blade 18 RTX 4070 | |
| Alienware x17 R2 P48E | |
| AIDA64 / FP64 Ray-Trace | |
| Alienware m18 R1 | |
| MSI Titan GT77 HX 13VI | |
| Asus ROG Strix Scar 18 2023 G834JY-N6005W | |
| Eluktronics Mech-17 GP2 | |
| Moyenne Intel Core i9-13980HX (11431 - 16325, n=9) | |
| Razer Blade 18 RTX 4070 | |
| Alienware x17 R2 P48E | |
| AIDA64 / CPU PhotoWorxx | |
| Alienware m18 R1 | |
| Razer Blade 18 RTX 4070 | |
| Moyenne Intel Core i9-13980HX (37069 - 52949, n=9) | |
| Eluktronics Mech-17 GP2 | |
| Asus ROG Strix Scar 18 2023 G834JY-N6005W | |
| MSI Titan GT77 HX 13VI | |
| Alienware x17 R2 P48E | |
Performance du système
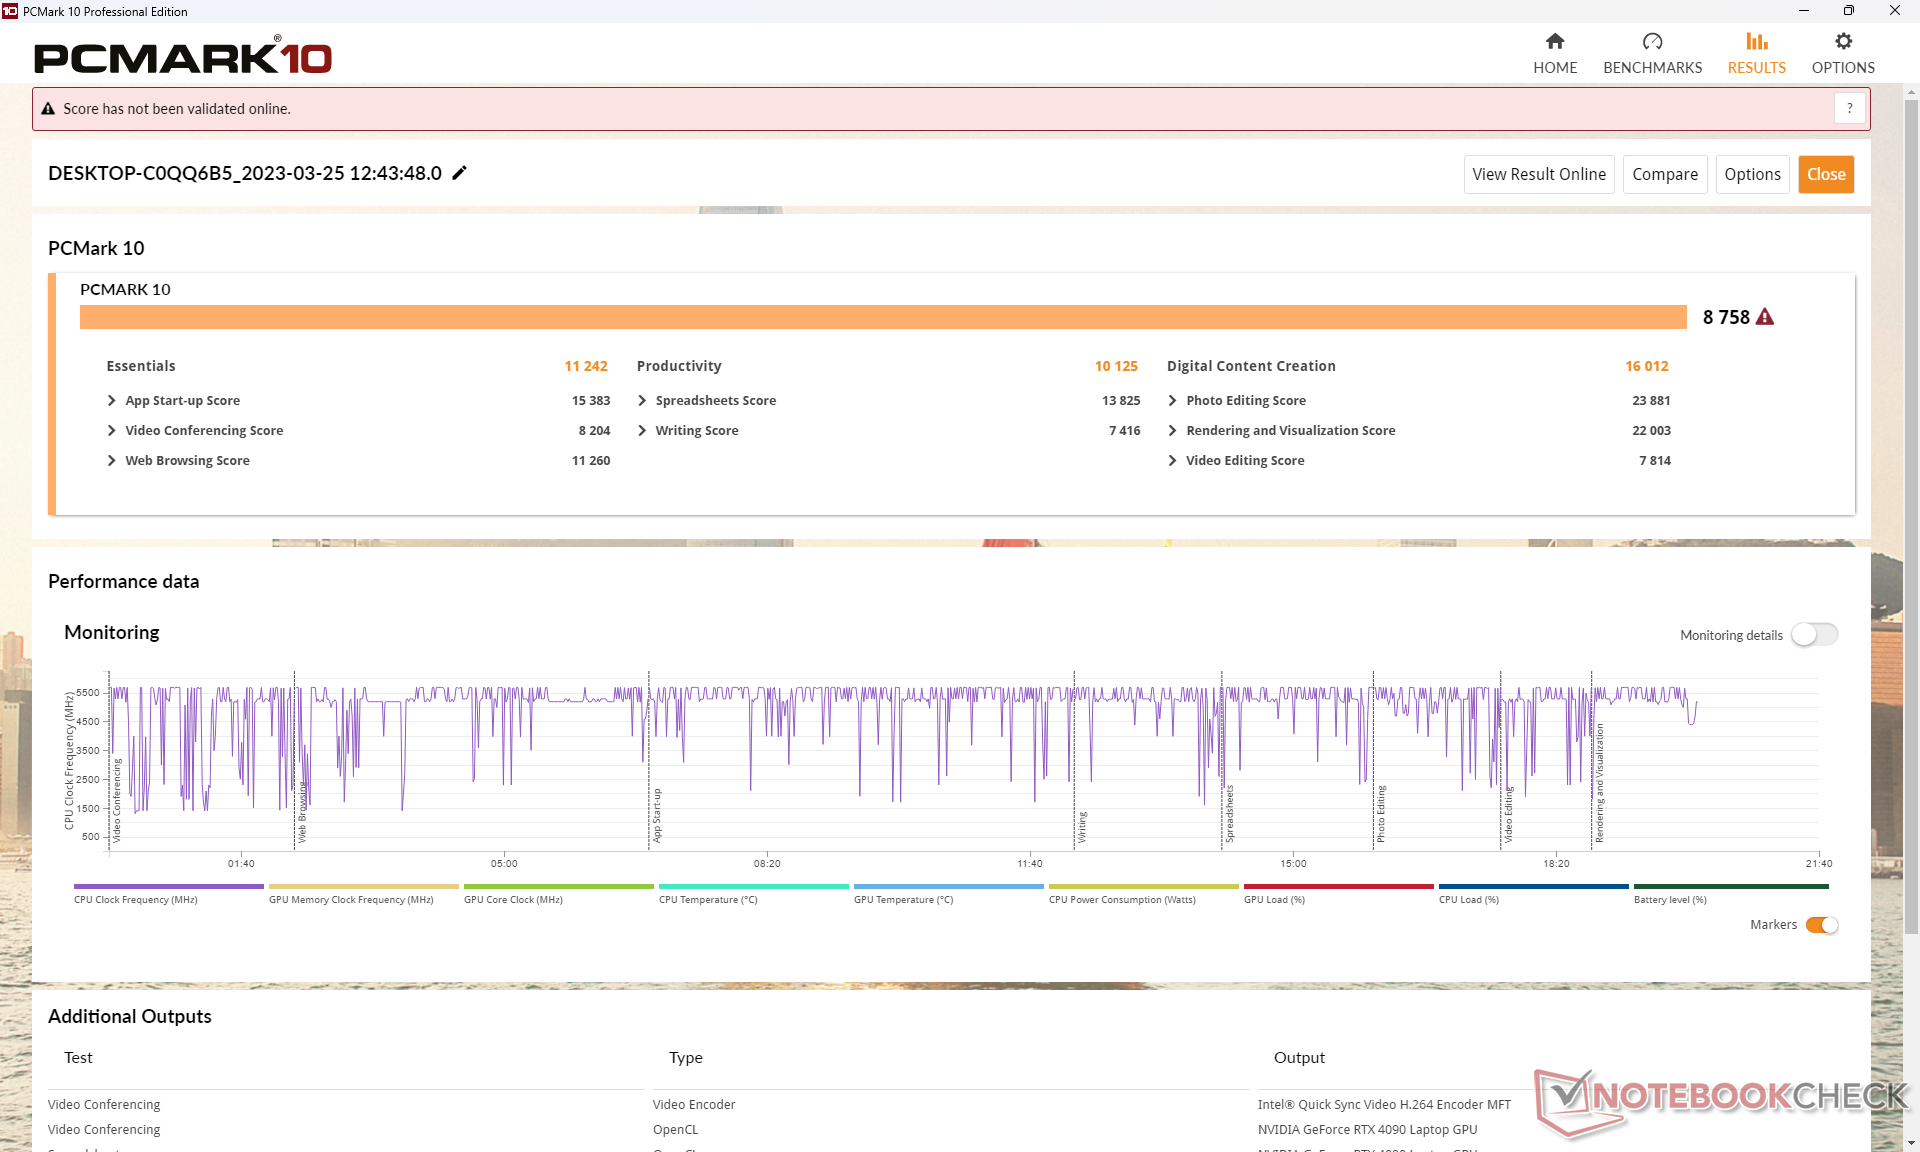
Les scores PCMark 10 sont comparables à ceux d'autres ordinateurs portables de jeu phares équipés de CPU Intel de la 13e génération et de GPU GeForce 40, tels que l'Asus ROG Strix Scar 18 et l'Asus ROG Strix Scar 18.Asus ROG Strix Scar 18 ou MSI Titan GT77 HX. Notre Alienware parvient également à devancer l'ancien Alienware x17 R2 fonctionnant avec deux SSD Samsung PM9A1 en RAID 0.
CrossMark: Overall | Productivity | Creativity | Responsiveness
| PCMark 10 / Score | |
| Eluktronics Mech-17 GP2 | |
| MSI Titan GT77 HX 13VI | |
| Moyenne Intel Core i9-13980HX, NVIDIA GeForce RTX 4090 Laptop GPU (8650 - 9068, n=4) | |
| Asus ROG Strix Scar 18 2023 G834JY-N6005W | |
| Alienware m18 R1 | |
| Alienware x17 R2 P48E | |
| Razer Blade 18 RTX 4070 | |
| PCMark 10 / Essentials | |
| Eluktronics Mech-17 GP2 | |
| MSI Titan GT77 HX 13VI | |
| Razer Blade 18 RTX 4070 | |
| Moyenne Intel Core i9-13980HX, NVIDIA GeForce RTX 4090 Laptop GPU (11215 - 11644, n=3) | |
| Alienware m18 R1 | |
| Alienware x17 R2 P48E | |
| PCMark 10 / Productivity | |
| Eluktronics Mech-17 GP2 | |
| Moyenne Intel Core i9-13980HX, NVIDIA GeForce RTX 4090 Laptop GPU (10125 - 11067, n=3) | |
| Alienware x17 R2 P48E | |
| Alienware m18 R1 | |
| MSI Titan GT77 HX 13VI | |
| Razer Blade 18 RTX 4070 | |
| PCMark 10 / Digital Content Creation | |
| MSI Titan GT77 HX 13VI | |
| Alienware m18 R1 | |
| Moyenne Intel Core i9-13980HX, NVIDIA GeForce RTX 4090 Laptop GPU (15052 - 16012, n=3) | |
| Eluktronics Mech-17 GP2 | |
| Alienware x17 R2 P48E | |
| Razer Blade 18 RTX 4070 | |
| CrossMark / Overall | |
| Eluktronics Mech-17 GP2 | |
| Alienware m18 R1 | |
| MSI Titan GT77 HX 13VI | |
| Razer Blade 18 RTX 4070 | |
| Asus ROG Strix Scar 18 2023 G834JY-N6005W | |
| Moyenne Intel Core i9-13980HX, NVIDIA GeForce RTX 4090 Laptop GPU (1935 - 2176, n=4) | |
| Alienware x17 R2 P48E | |
| CrossMark / Productivity | |
| Eluktronics Mech-17 GP2 | |
| Alienware m18 R1 | |
| MSI Titan GT77 HX 13VI | |
| Razer Blade 18 RTX 4070 | |
| Asus ROG Strix Scar 18 2023 G834JY-N6005W | |
| Moyenne Intel Core i9-13980HX, NVIDIA GeForce RTX 4090 Laptop GPU (1764 - 2005, n=4) | |
| Alienware x17 R2 P48E | |
| CrossMark / Creativity | |
| Eluktronics Mech-17 GP2 | |
| Alienware m18 R1 | |
| Asus ROG Strix Scar 18 2023 G834JY-N6005W | |
| MSI Titan GT77 HX 13VI | |
| Moyenne Intel Core i9-13980HX, NVIDIA GeForce RTX 4090 Laptop GPU (2267 - 2469, n=4) | |
| Razer Blade 18 RTX 4070 | |
| Alienware x17 R2 P48E | |
| CrossMark / Responsiveness | |
| Alienware m18 R1 | |
| Razer Blade 18 RTX 4070 | |
| MSI Titan GT77 HX 13VI | |
| Eluktronics Mech-17 GP2 | |
| Moyenne Intel Core i9-13980HX, NVIDIA GeForce RTX 4090 Laptop GPU (1556 - 1904, n=4) | |
| Alienware x17 R2 P48E | |
| Asus ROG Strix Scar 18 2023 G834JY-N6005W | |
| PCMark 10 Score | 8758 points | |
Aide | ||
| AIDA64 / Memory Copy | |
| Alienware m18 R1 | |
| Razer Blade 18 RTX 4070 | |
| Moyenne Intel Core i9-13980HX (62189 - 80776, n=9) | |
| Eluktronics Mech-17 GP2 | |
| Asus ROG Strix Scar 18 2023 G834JY-N6005W | |
| MSI Titan GT77 HX 13VI | |
| Alienware x17 R2 P48E | |
| AIDA64 / Memory Read | |
| Alienware m18 R1 | |
| Razer Blade 18 RTX 4070 | |
| Moyenne Intel Core i9-13980HX (62624 - 89096, n=9) | |
| Eluktronics Mech-17 GP2 | |
| Asus ROG Strix Scar 18 2023 G834JY-N6005W | |
| MSI Titan GT77 HX 13VI | |
| Alienware x17 R2 P48E | |
| AIDA64 / Memory Write | |
| Alienware m18 R1 | |
| Razer Blade 18 RTX 4070 | |
| Moyenne Intel Core i9-13980HX (59912 - 79917, n=9) | |
| Eluktronics Mech-17 GP2 | |
| Asus ROG Strix Scar 18 2023 G834JY-N6005W | |
| MSI Titan GT77 HX 13VI | |
| Alienware x17 R2 P48E | |
| AIDA64 / Memory Latency | |
| Alienware x17 R2 P48E | |
| MSI Titan GT77 HX 13VI | |
| Asus ROG Strix Scar 18 2023 G834JY-N6005W | |
| Eluktronics Mech-17 GP2 | |
| Moyenne Intel Core i9-13980HX (79.4 - 93.2, n=9) | |
| Razer Blade 18 RTX 4070 | |
| Alienware m18 R1 | |
* ... Moindre est la valeur, meilleures sont les performances
Latence DPC
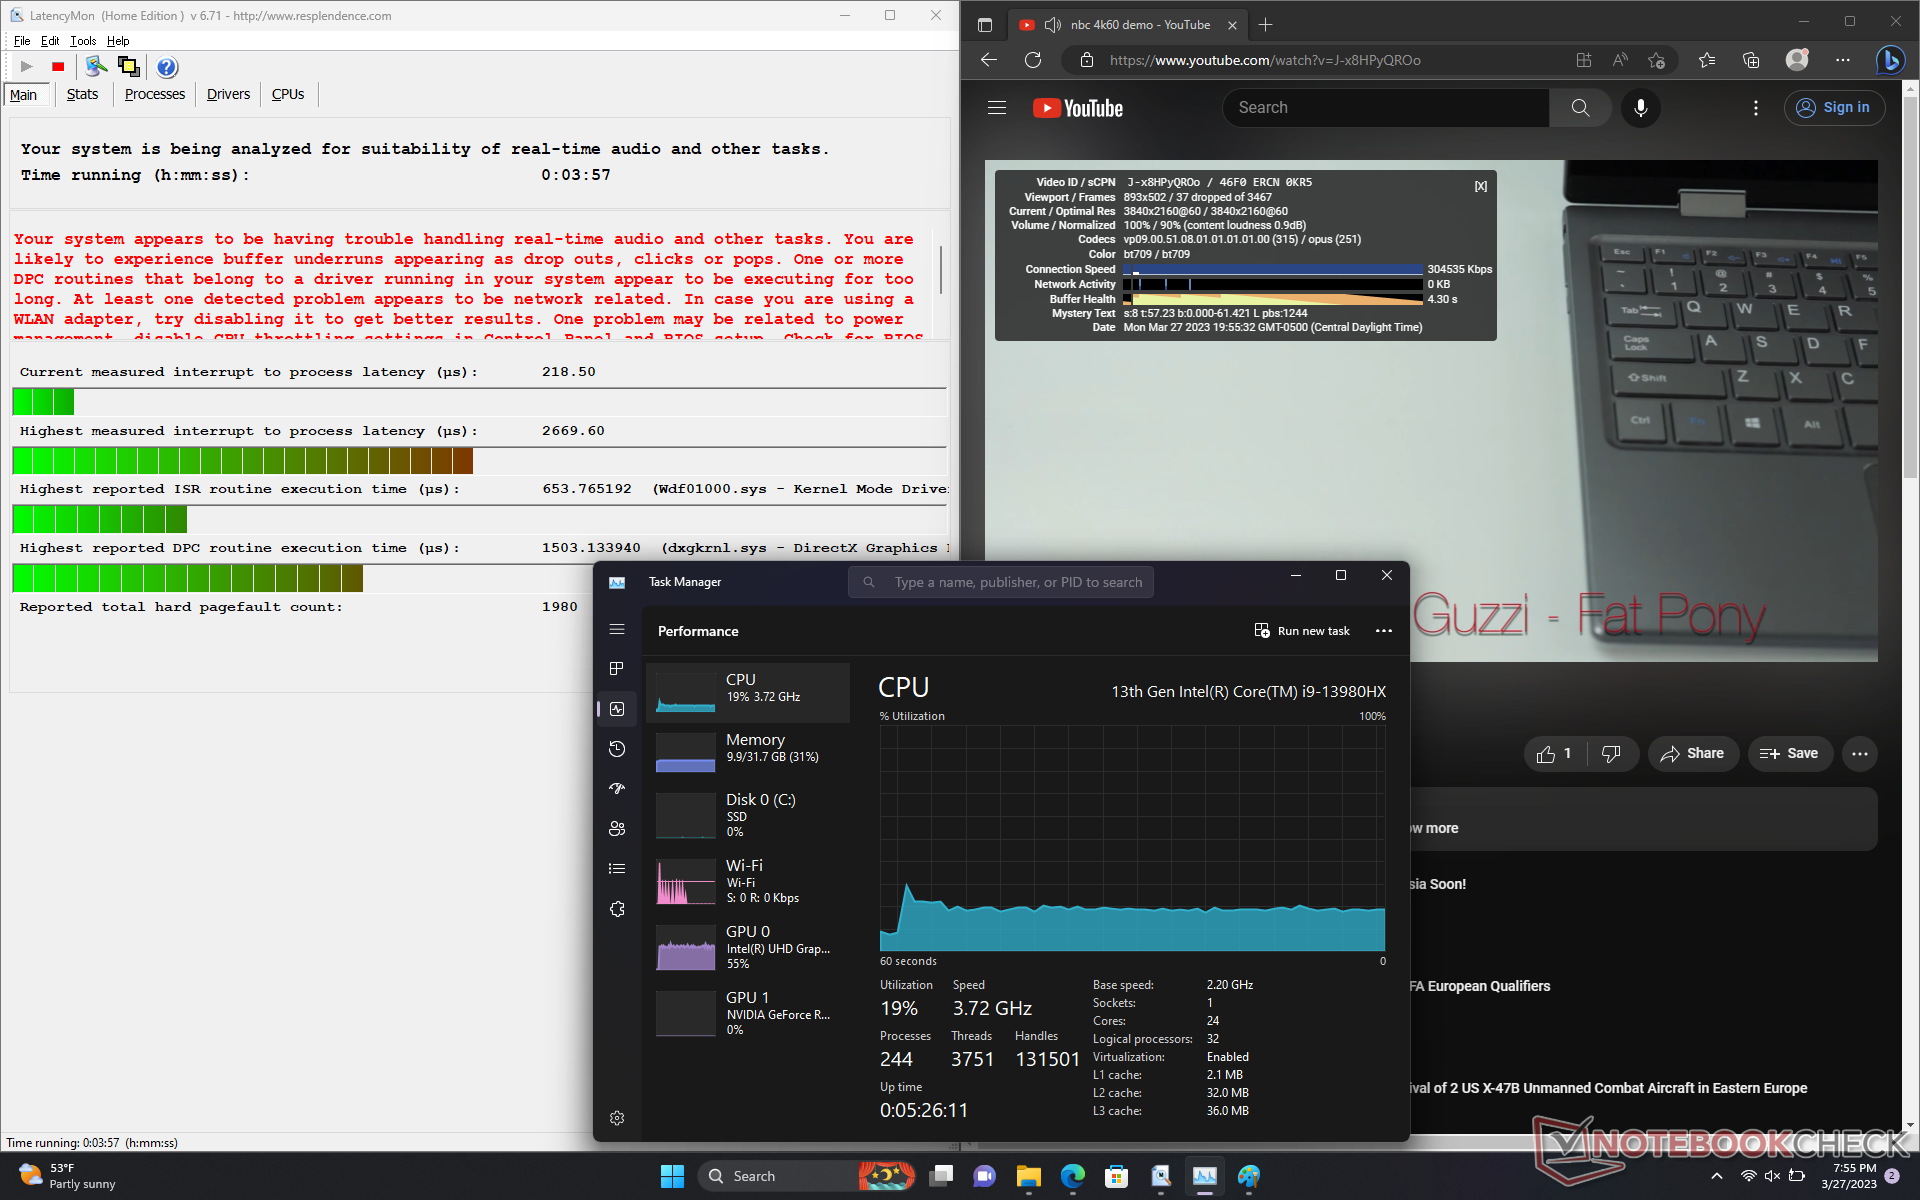
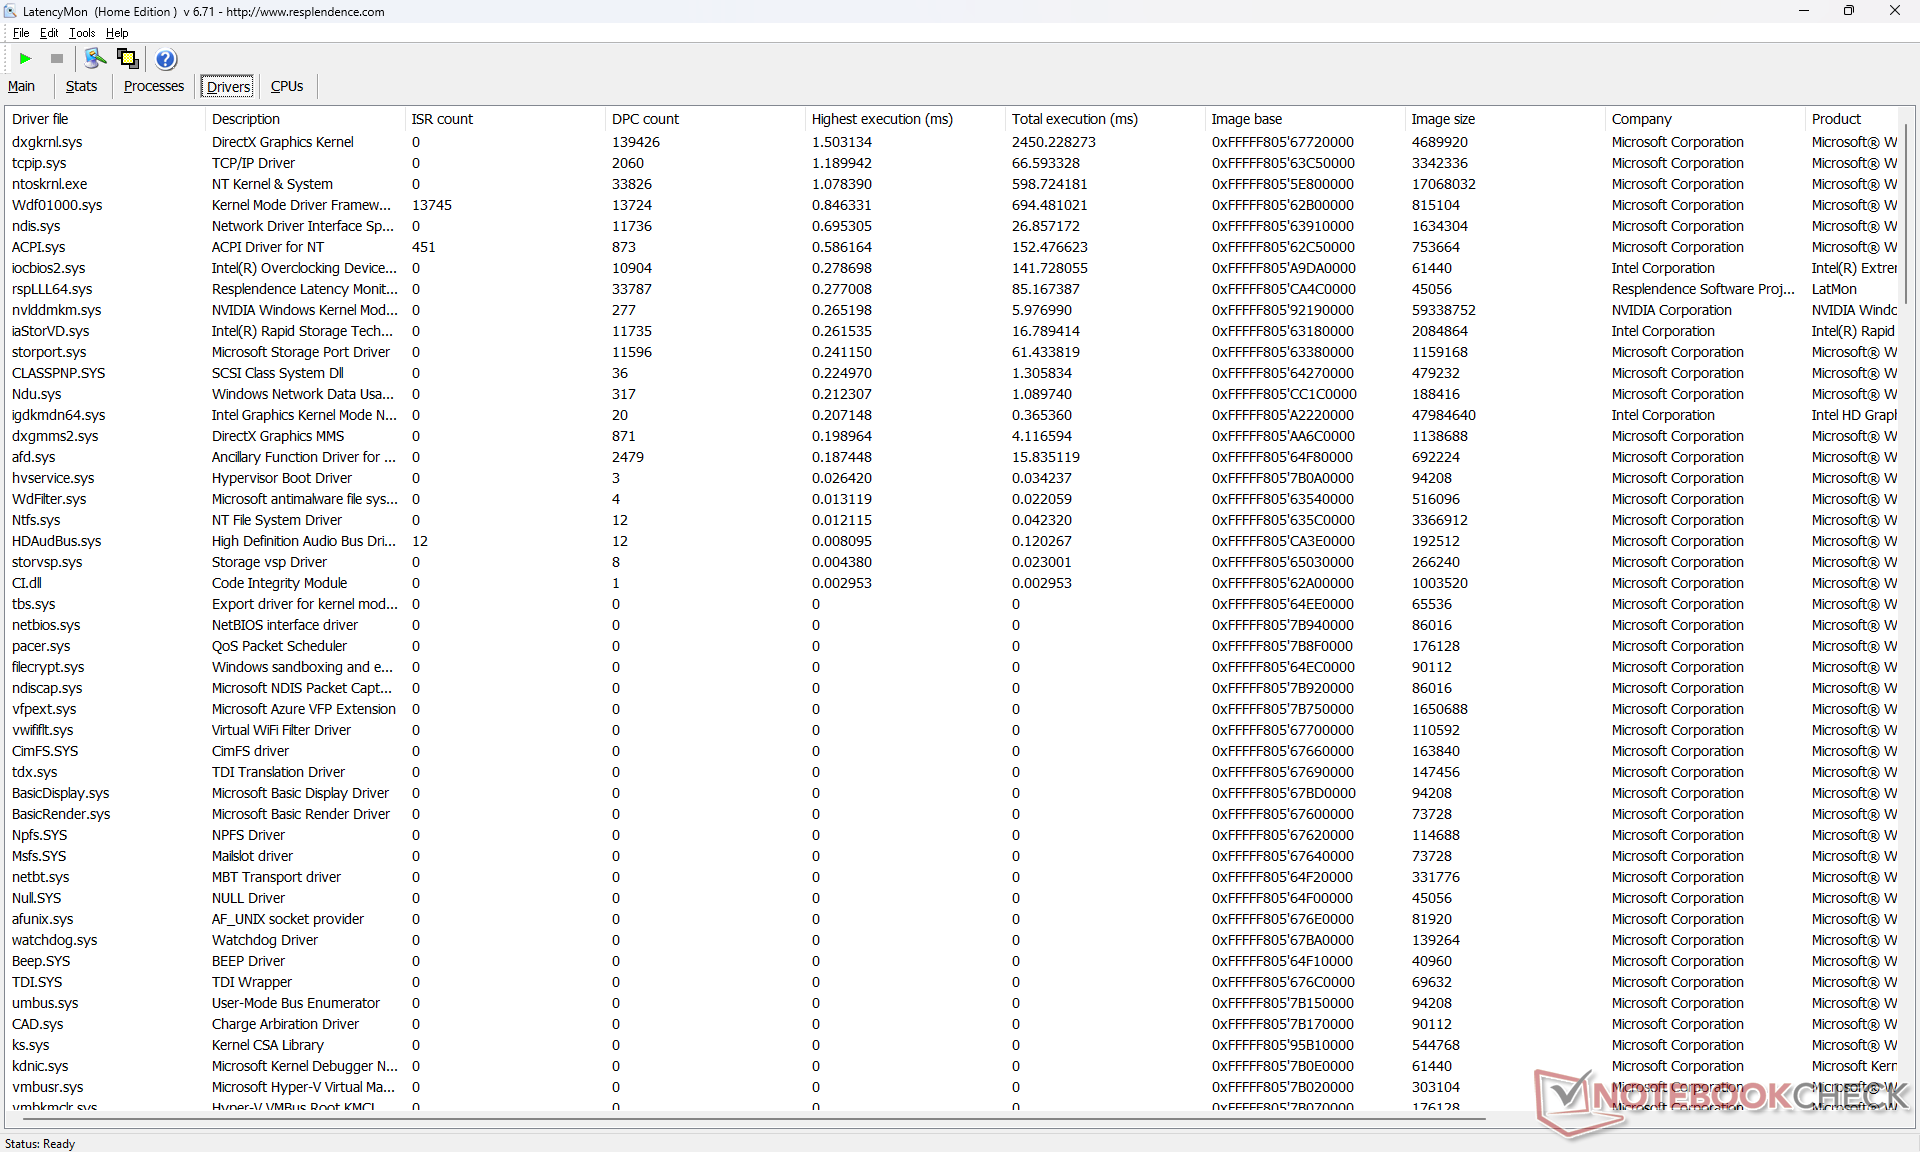
LatencyMon révèle des problèmes de DPC lors de l'ouverture de plusieurs onglets de notre page d'accueil. En outre, le système a des problèmes de lecture de contenu vidéo 4K, puisque nous avons enregistré 37 images perdues pendant notre vidéo de test d'une minute, même après plusieurs essais. L'utilisation du CPU et de l'iGPU est également anormalement élevée, avec respectivement 19 % et 55 %. Ces observations suggèrent une mauvaise gestion des processus d'arrière-plan susceptibles d'avoir un impact sur l'activité en question.
Nvidia a reconnu l'existence d'un bogue lié à une augmentation de la latence DPC avec le pilote graphique 531.29. Espérons qu'un correctif sera bientôt disponible.
| DPC Latencies / LatencyMon - interrupt to process latency (max), Web, Youtube, Prime95 | |
| MSI Titan GT77 HX 13VI | |
| Alienware m18 R1 | |
| Razer Blade 18 RTX 4070 | |
| Alienware x17 R2 P48E | |
| Asus ROG Strix Scar 18 2023 G834JY-N6005W | |
| Eluktronics Mech-17 GP2 | |
* ... Moindre est la valeur, meilleures sont les performances
Périphériques de stockage - Quatre disques M.2 au total
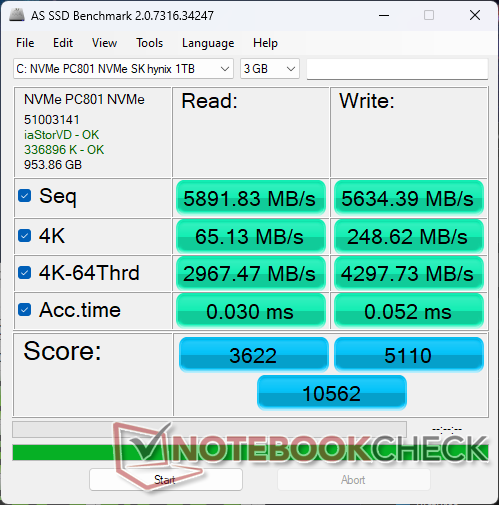
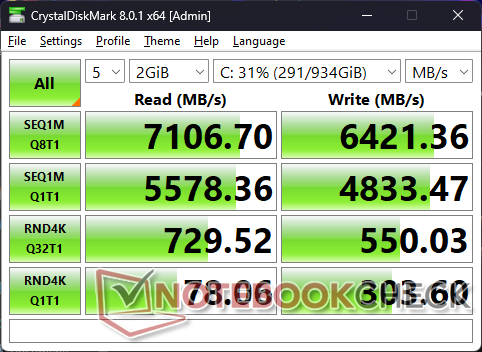
Notre unité est configurée avec un SK Hynix PC801 PCIe4 x4 NVMe SSD pour des taux de lecture séquentielle et d'écriture allant jusqu'à 7000 Mo/s et 6500 Mo/s, respectivement. Les performances sont compétitives par rapport à la série Samsung PMA1 et notre disque ne présente aucun problème pour maintenir des vitesses maximales sans étranglement.
L'Alienware ne prend pas en charge les disques durs NVMe PCIe5, contrairement aux MSI GE78 ou GT77. Néanmoins, il prend en charge plus de disques SSD internes que la plupart des autres ordinateurs portables.

| Drive Performance rating - Percent | |
| Alienware m18 R1 | |
| MSI Titan GT77 HX 13VI | |
| Razer Blade 18 RTX 4070 | |
| Alienware x17 R2 P48E | |
| Asus ROG Strix Scar 18 2023 G834JY-N6005W | |
| Eluktronics Mech-17 GP2 | |
* ... Moindre est la valeur, meilleures sont les performances
Disk Throttling: DiskSpd Read Loop, Queue Depth 8
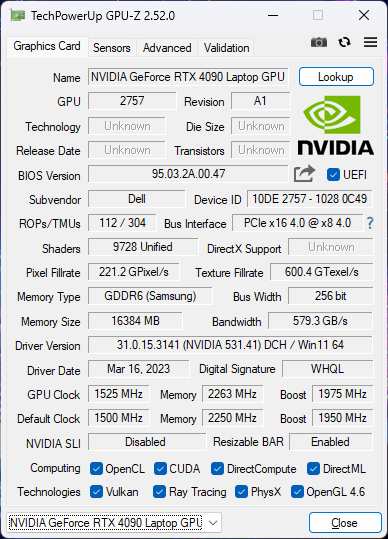
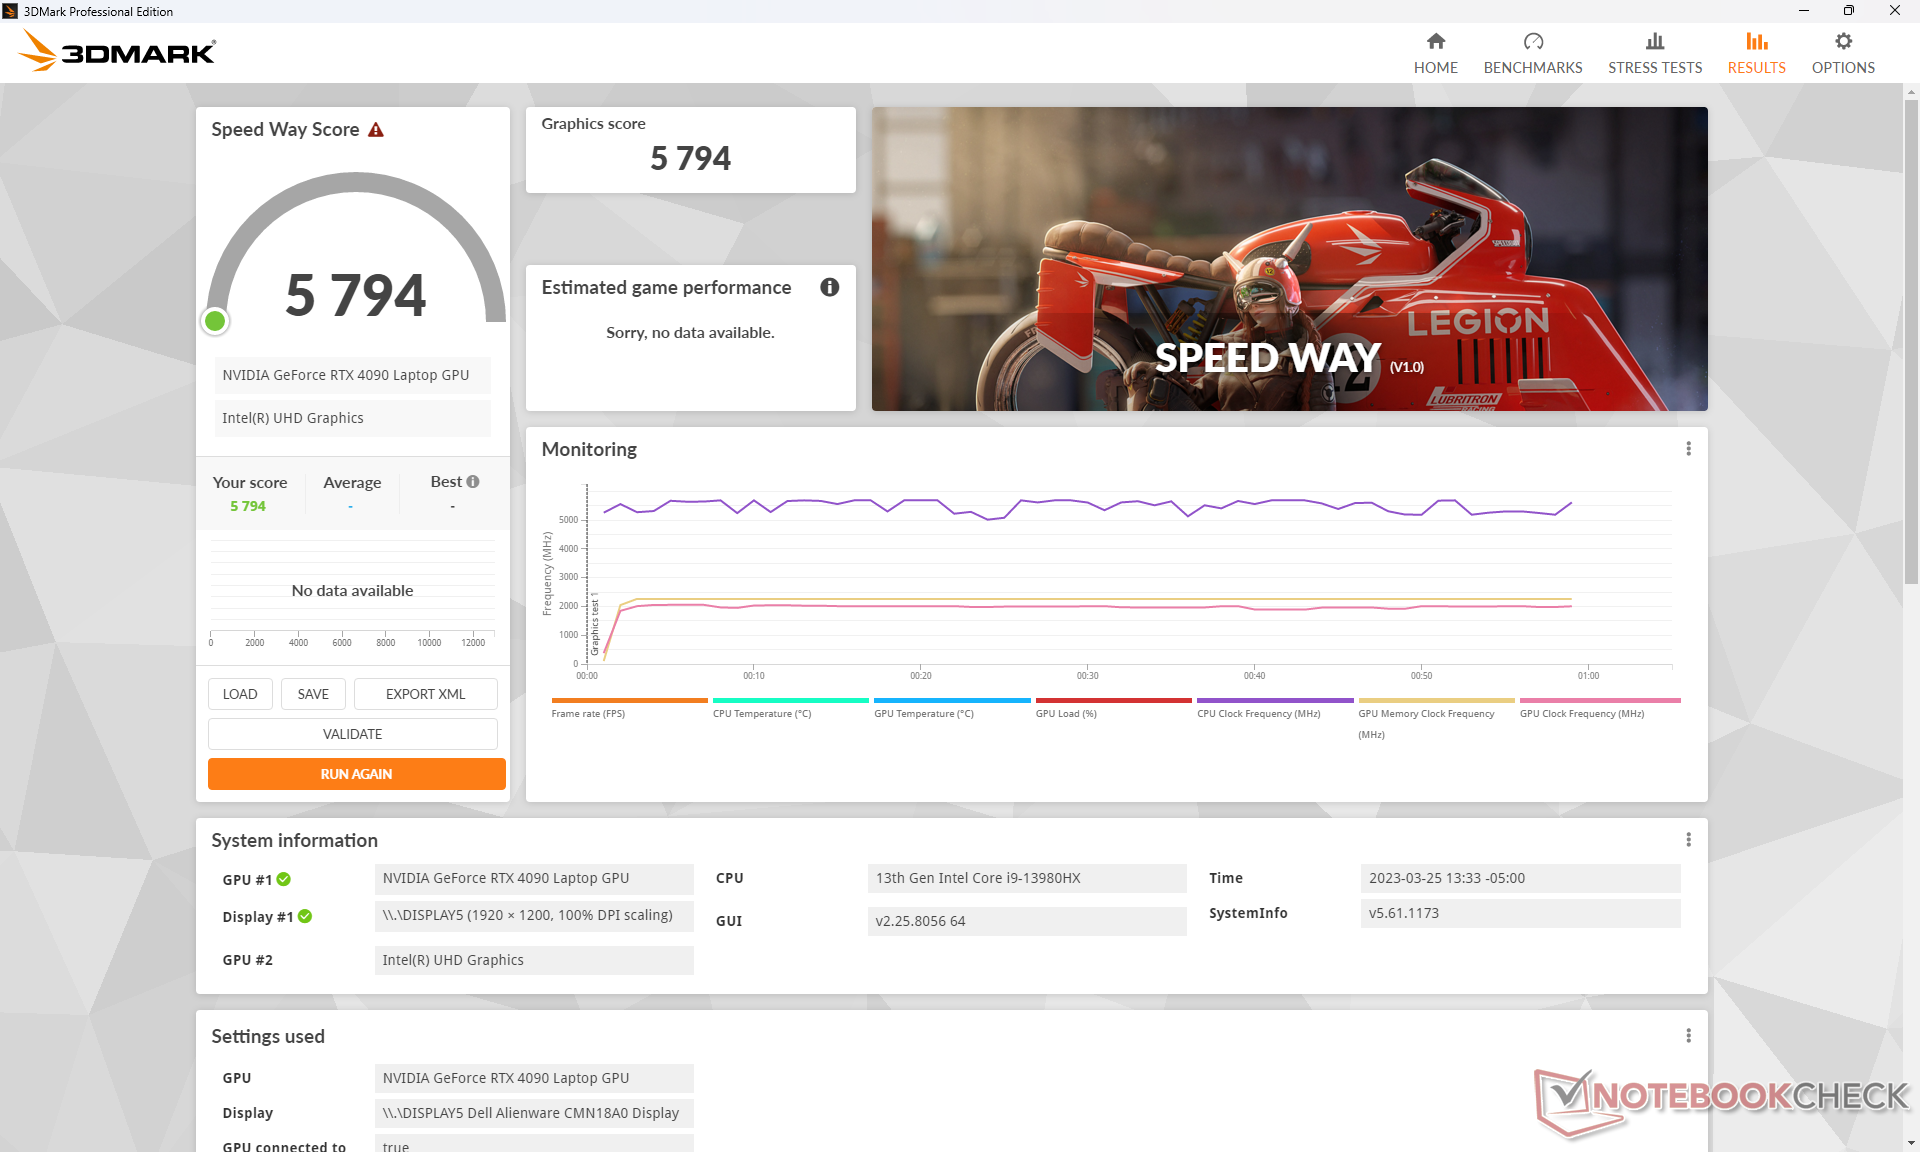
Performance du GPU - 175 W GeForce RTX 4090
Les performances graphiques globales de la mobile GeForce RTX 4090 est la plus similaire à celle de la de bureau GeForce RTX 4070. Elle offre suffisamment de performances pour jouer à n'importe quel jeu actuel en configuration 4K Ultra, y compris F1 22. Si le ray-tracing est activé, il est toutefois recommandé d'activer DLSS ou la génération d'images lorsqu'elle est prise en charge afin de maintenir les taux d'images à flot.
Par rapport à la dernière génération de cartes rTX 3080 Tila RTX 4090 mobile offre entre 40 et 70 % de performances supplémentaires tout en conservant une enveloppe énergétique similaire de 175 W.
L'exécution de Fire Strike en mode Overdrive ne présente pas d'avantages majeurs par rapport au mode Performance, plus silencieux, car les scores finaux sont presque identiques. Répéter le test en mode Balanced, cependant, entraînerait une baisse de 5 % et 9 % des performances du GPU et du CPU, respectivement.
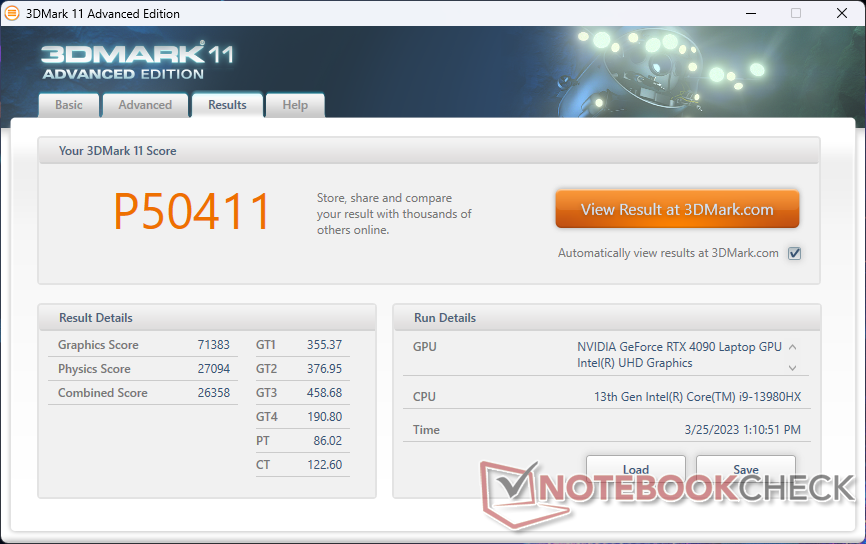
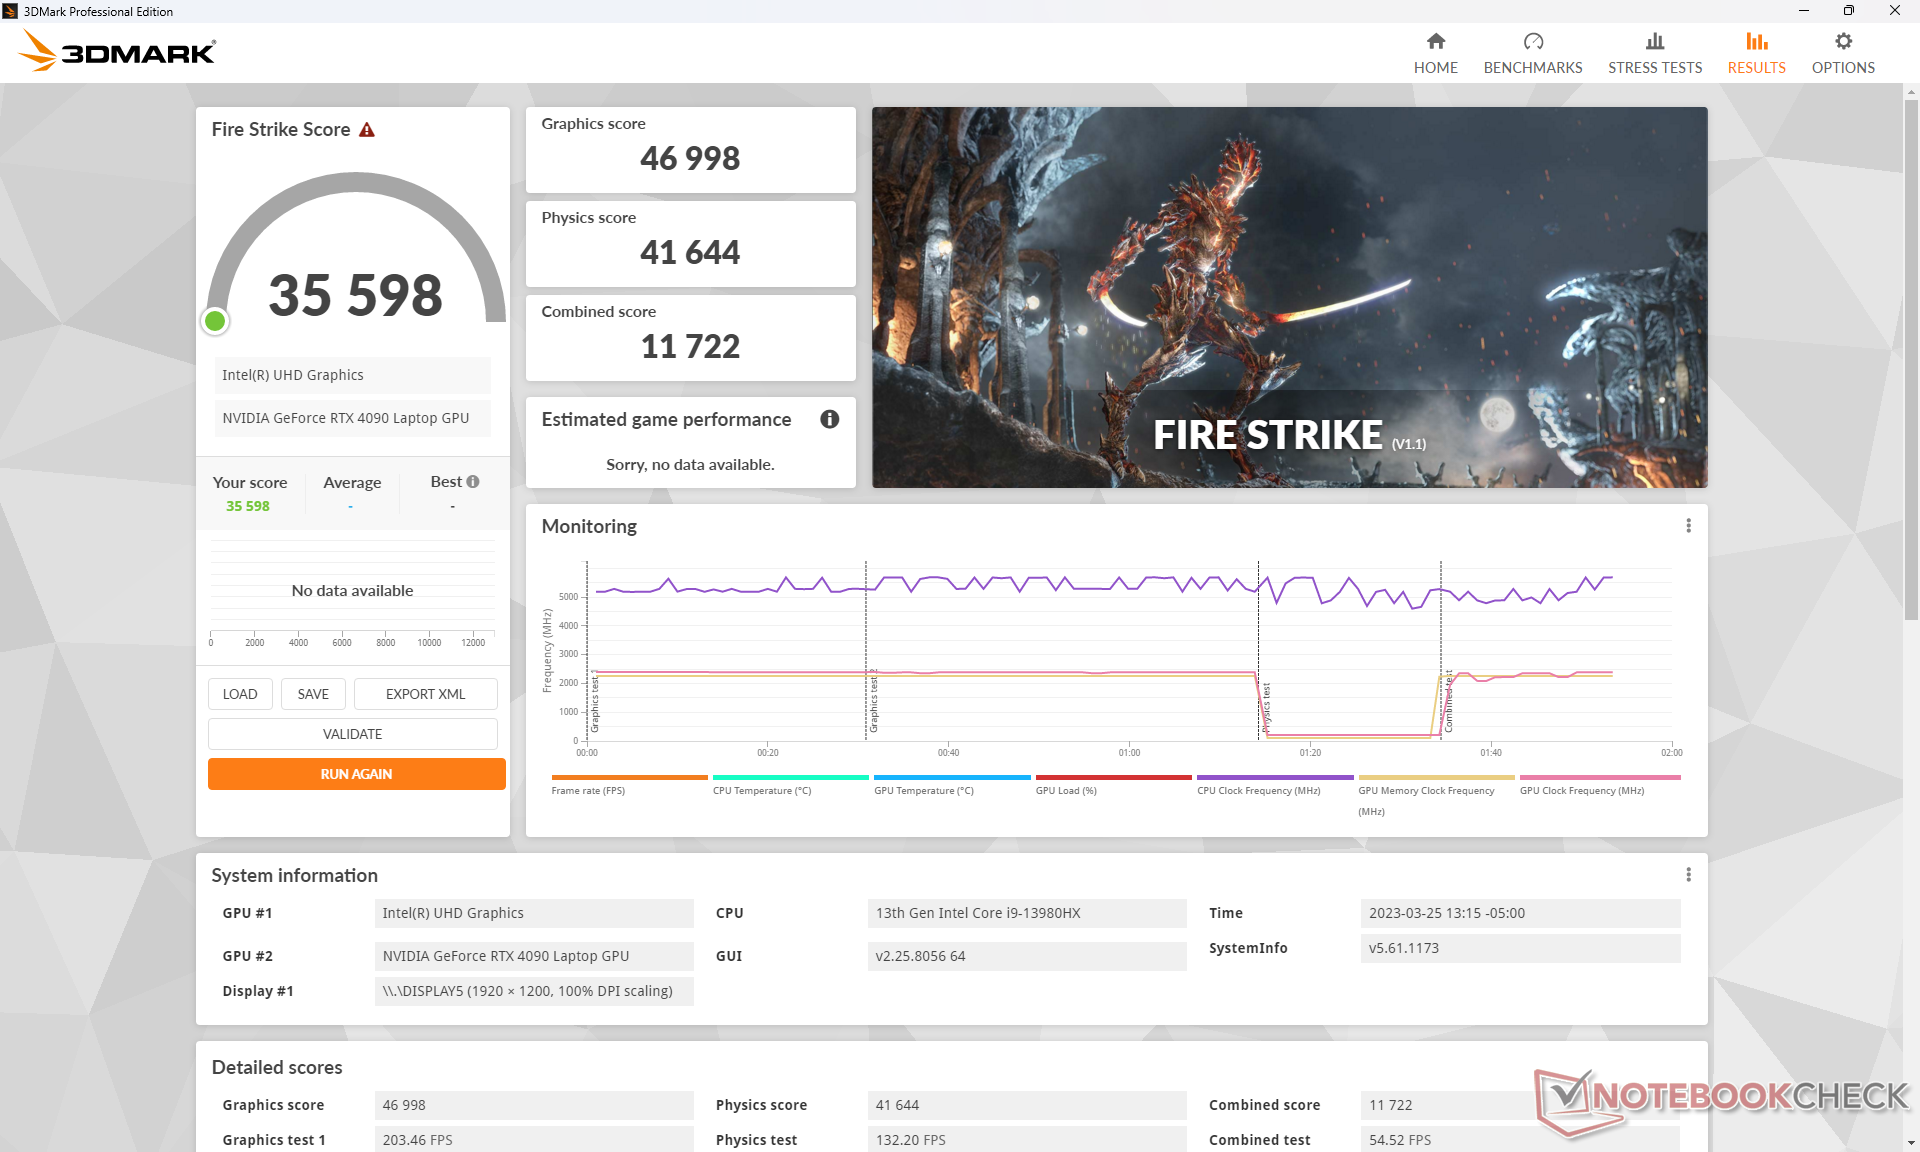
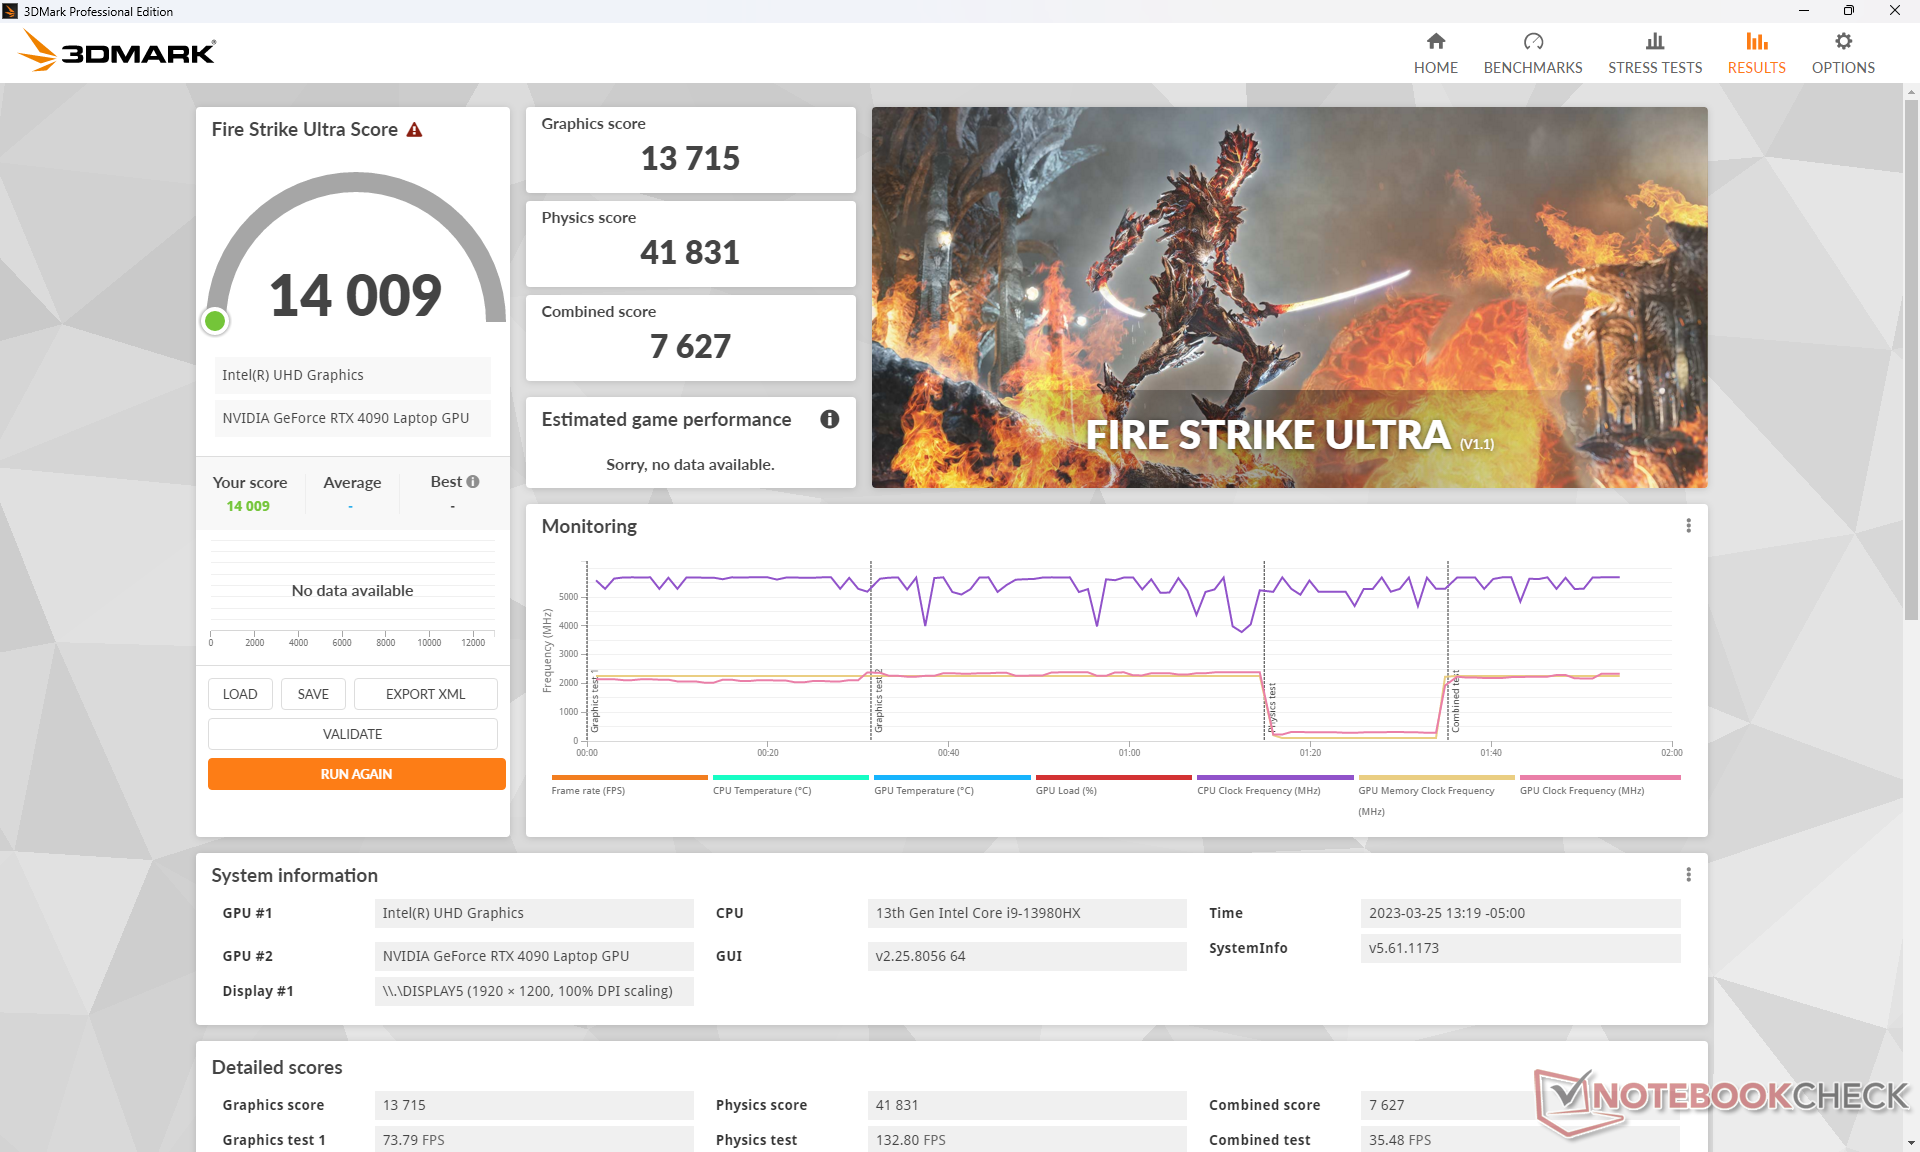
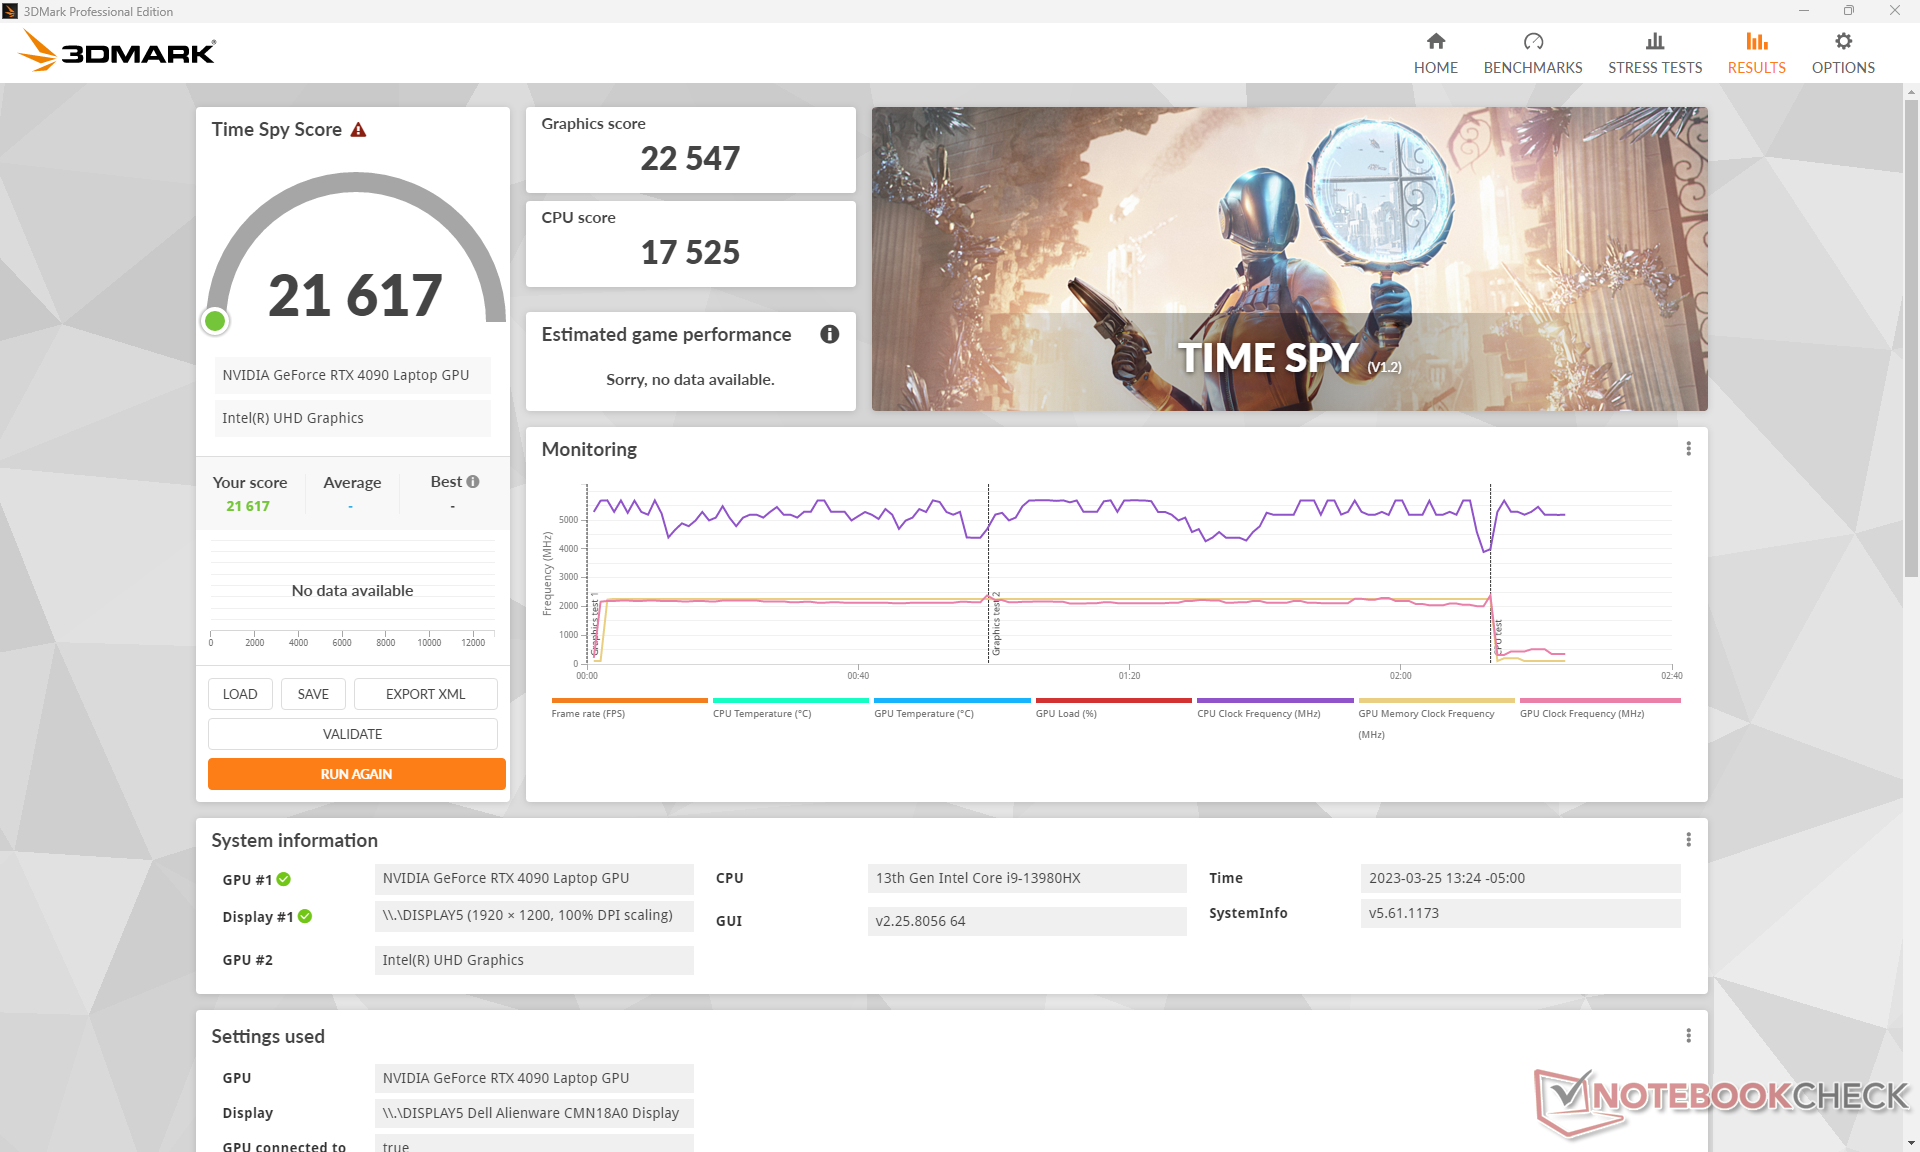
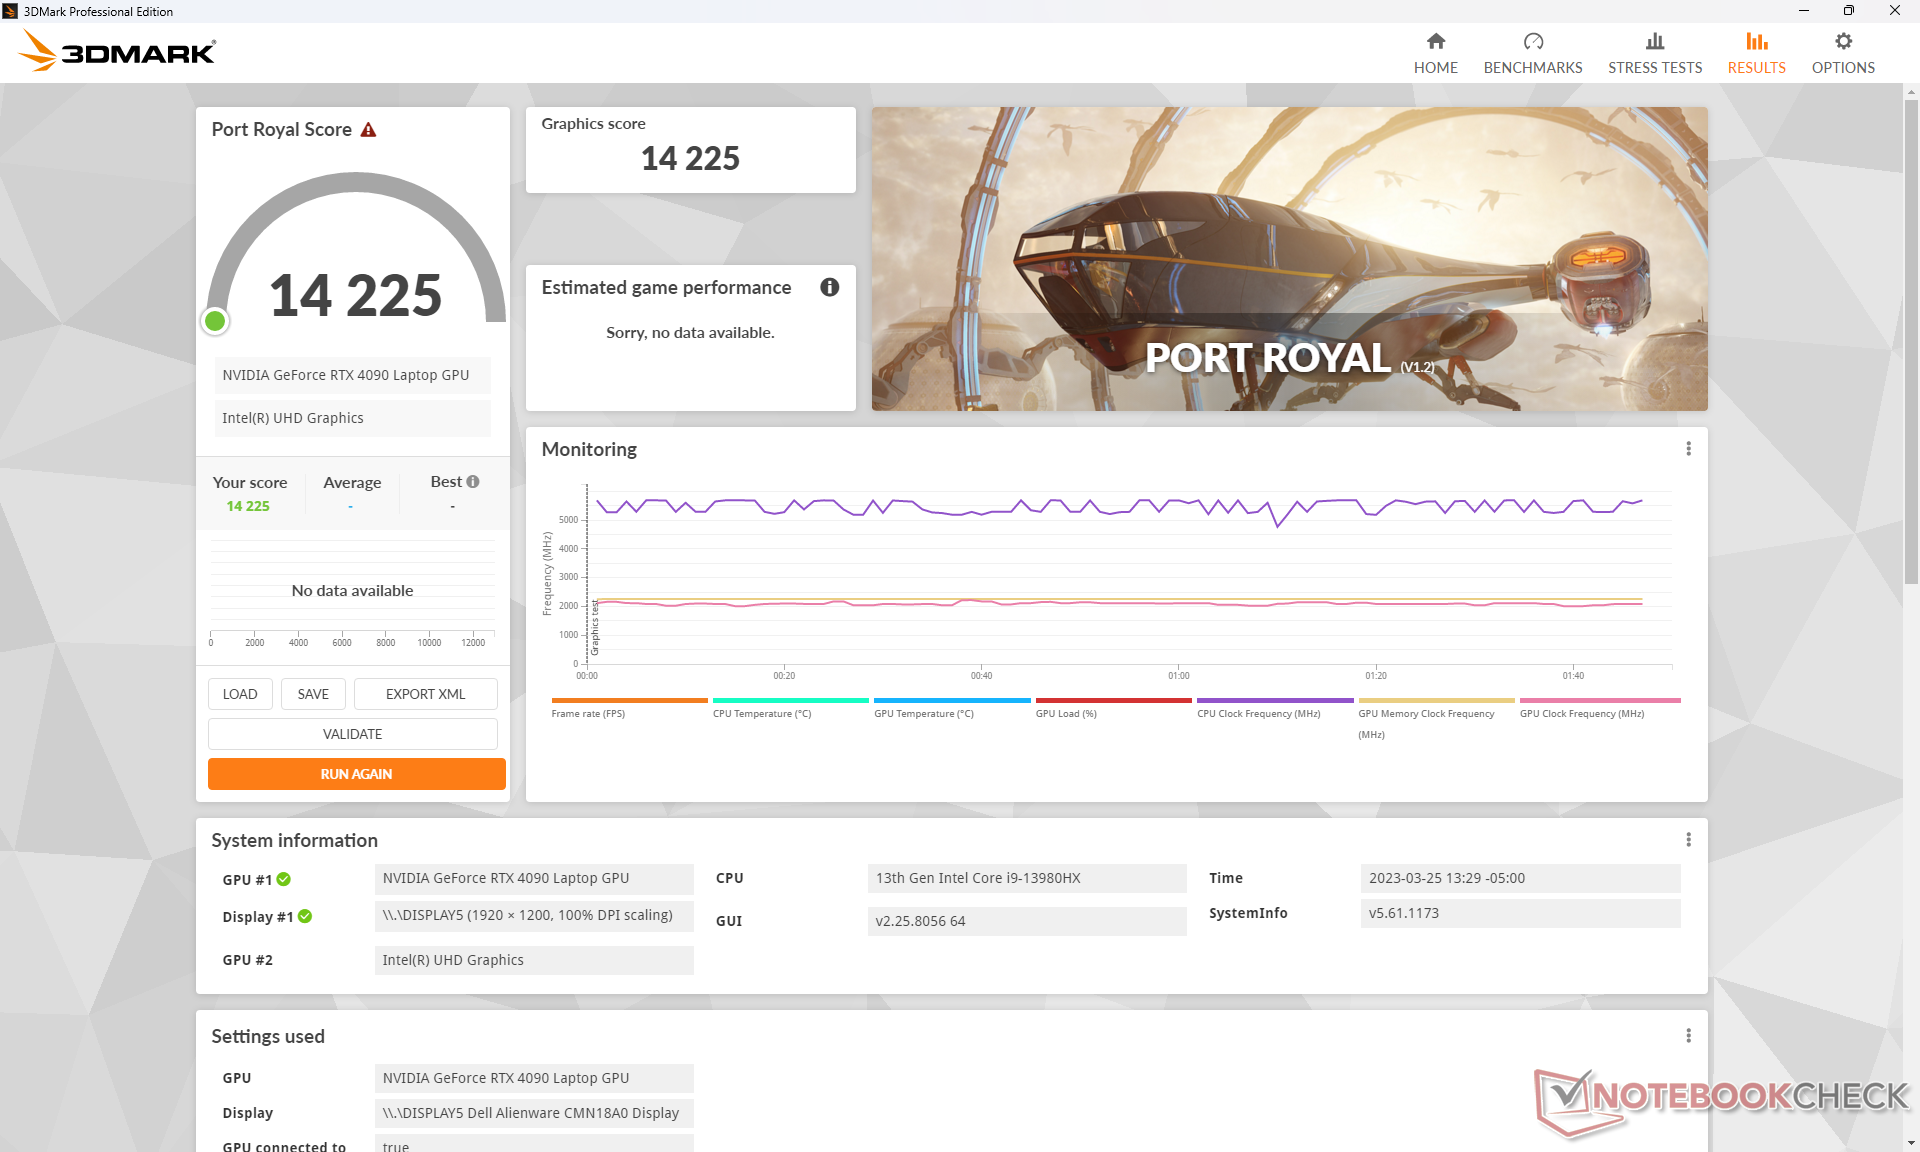
| 3DMark 11 Performance | 50411 points | |
| 3DMark Fire Strike Score | 35598 points | |
| 3DMark Time Spy Score | 21617 points | |
Aide | ||
* ... Moindre est la valeur, meilleures sont les performances
Witcher 3 FPS Chart
| Bas | Moyen | Élevé | Ultra | QHD | 4K | |
|---|---|---|---|---|---|---|
| GTA V (2015) | 186.7 | 185.3 | 184.5 | 149 | 145.5 | 176.4 |
| The Witcher 3 (2015) | 649.2 | 563.8 | 441.6 | 213.9 | 165.6 | |
| Dota 2 Reborn (2015) | 251 | 220 | 210 | 194.2 | 190.2 | |
| Final Fantasy XV Benchmark (2018) | 231 | 227 | 194.8 | 159.5 | 92.6 | |
| X-Plane 11.11 (2018) | 210 | 187.1 | 143.5 | 124 | ||
| Strange Brigade (2018) | 475 | 388 | 388 | 373 | 308 | 159.8 |
| Cyberpunk 2077 1.6 (2022) | 157.2 | 151.8 | 148.2 | 127.92 | 102.16 | 49.99 |
| Tiny Tina's Wonderlands (2022) | 359.1 | 301.8 | 232.5 | 187.7 | 133.8 | 71.3 |
| F1 22 (2022) | 336 | 320 | 318 | 144.7 | 92.2 | 45.5 |
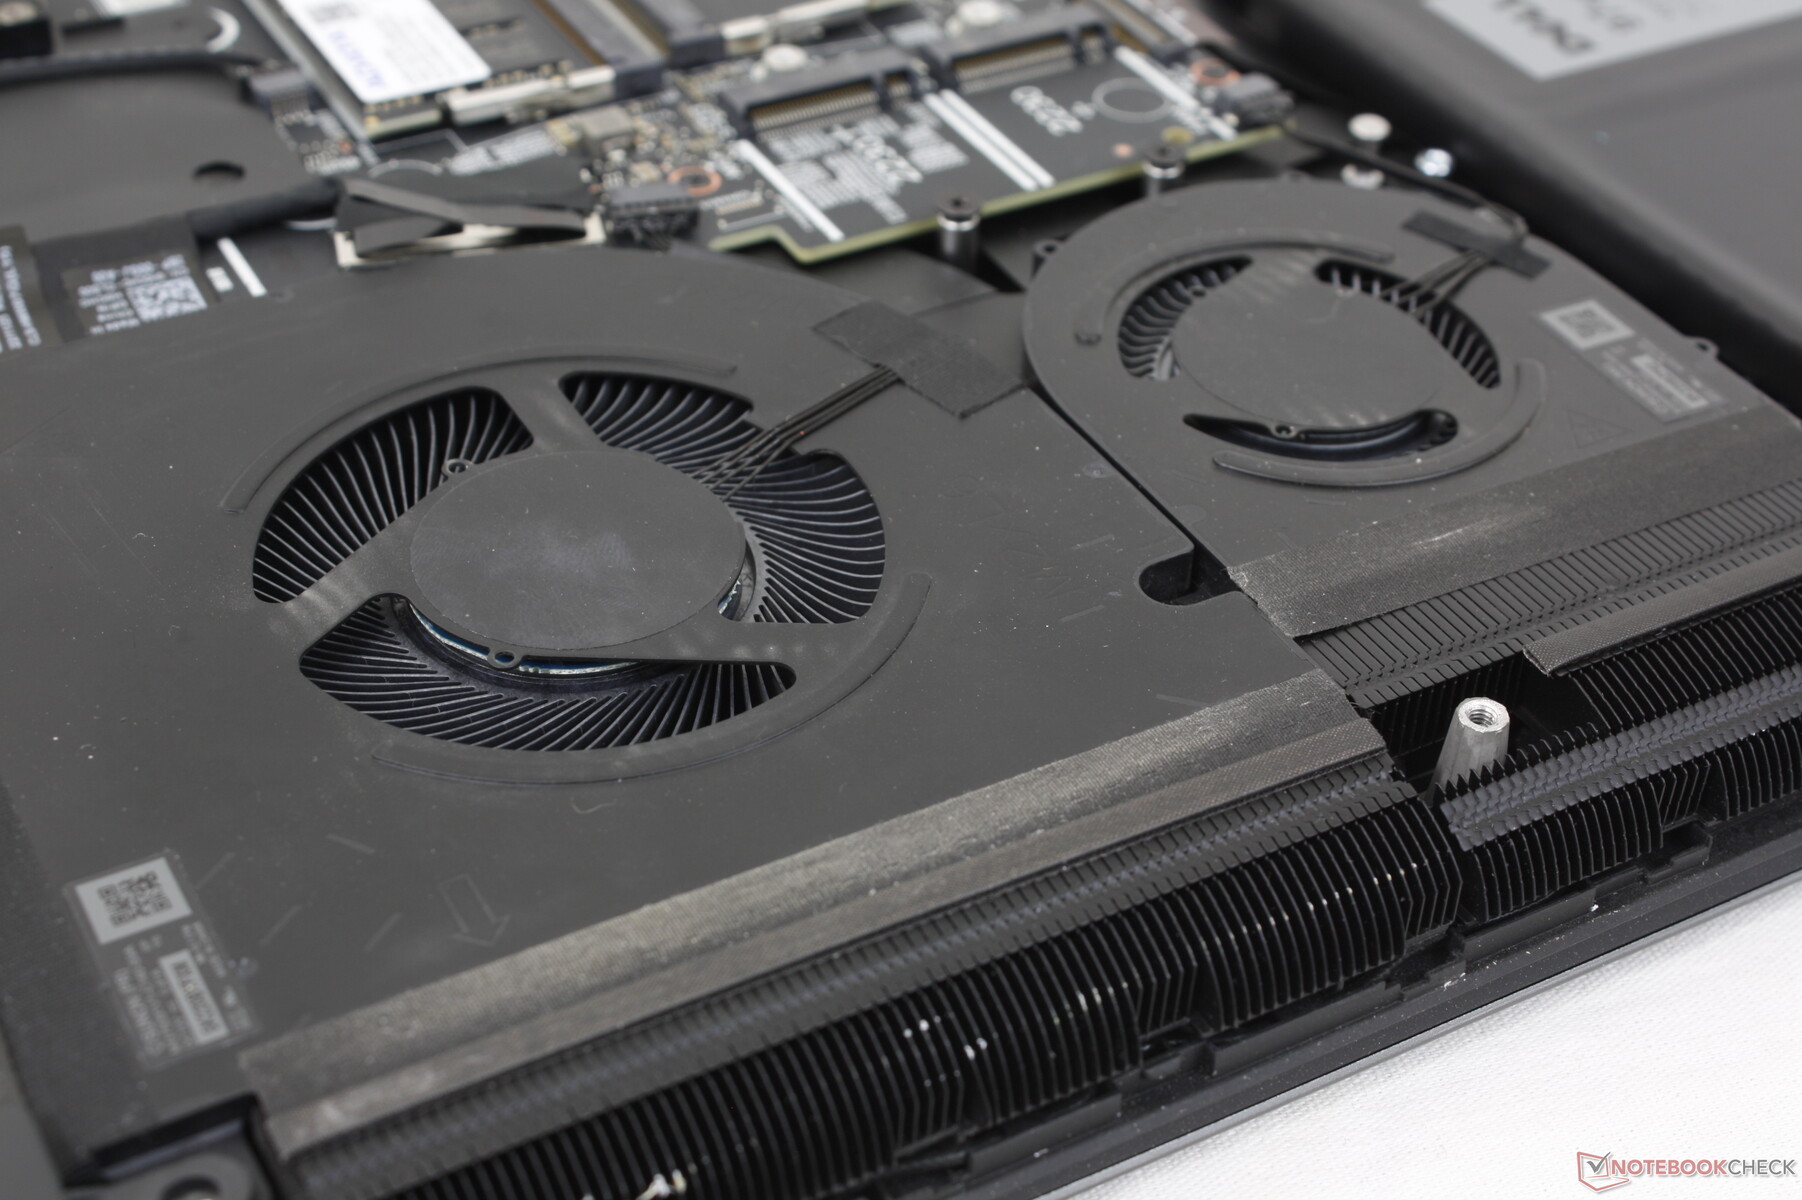
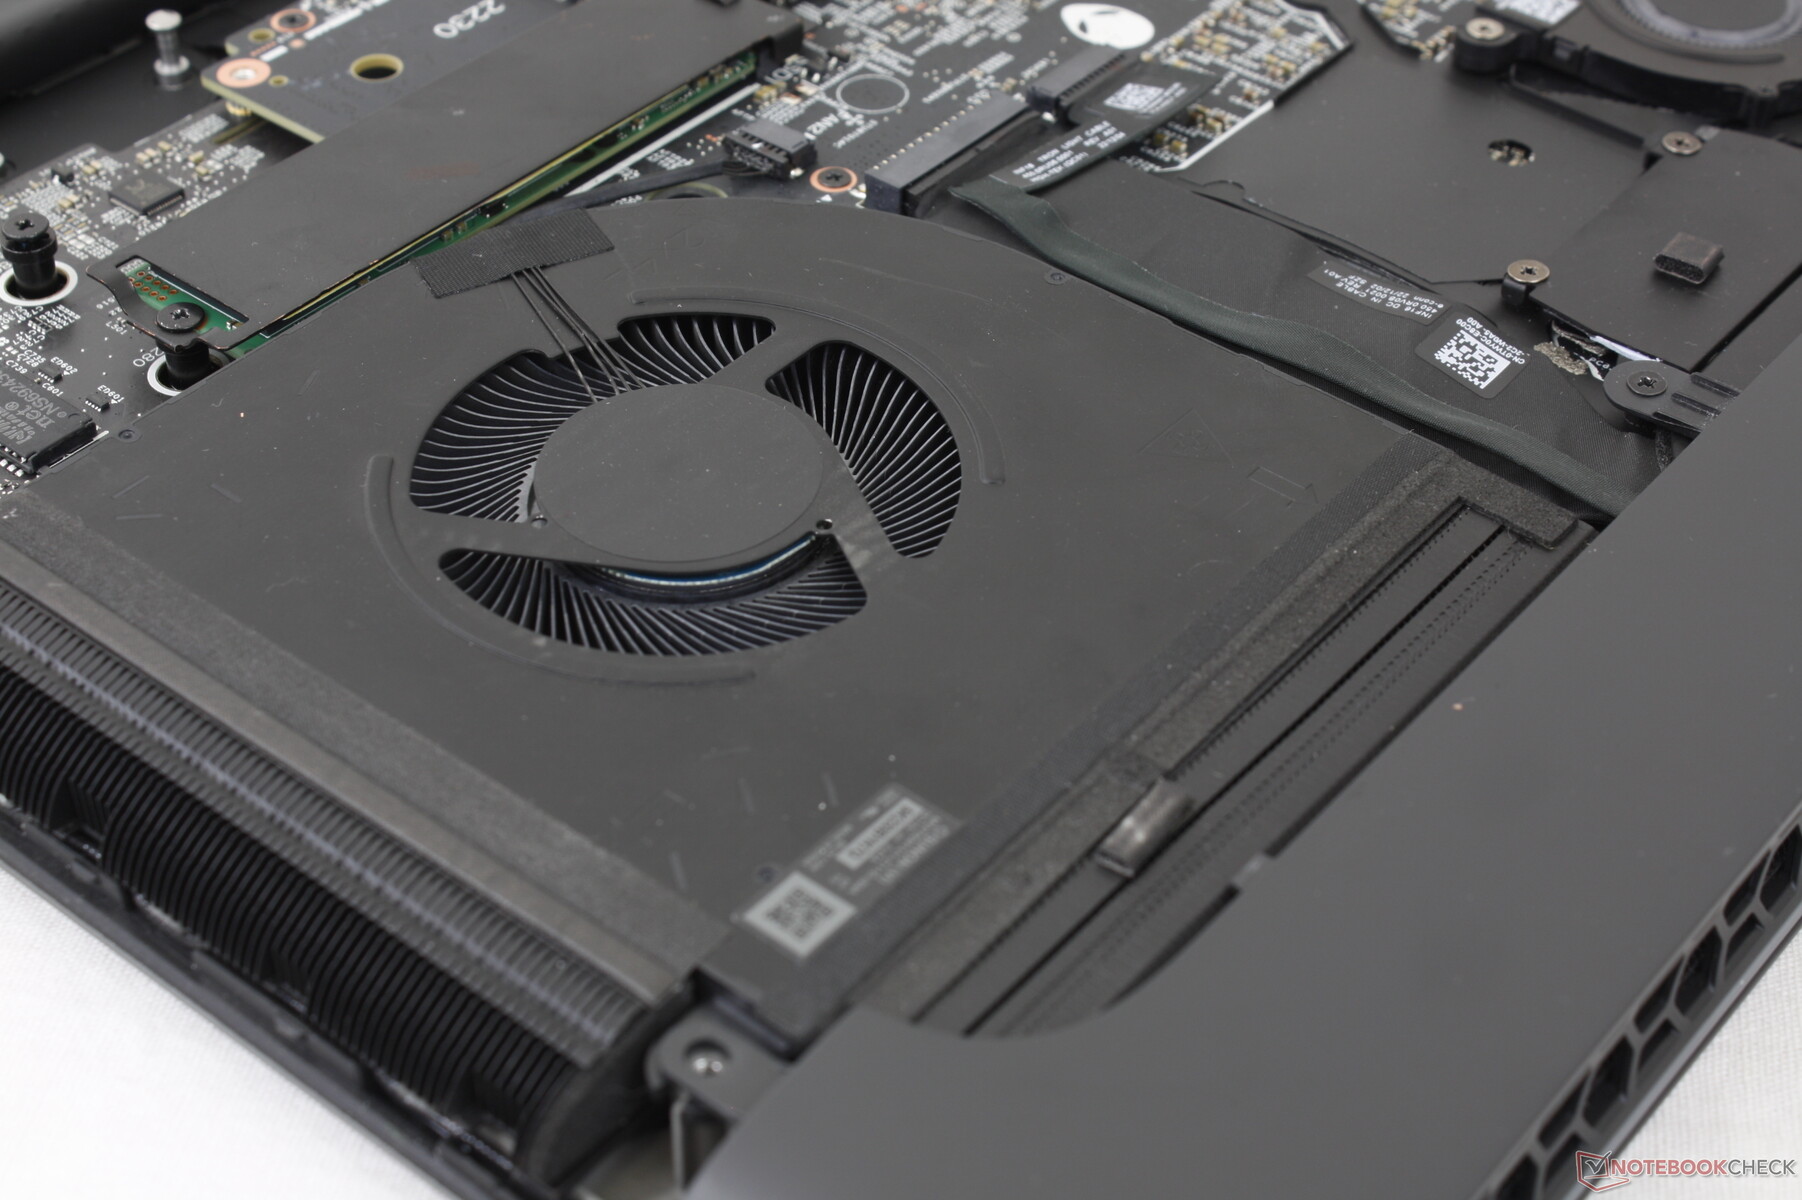
Émissions - Quatre fans de Fast & Furious
Bruit du système
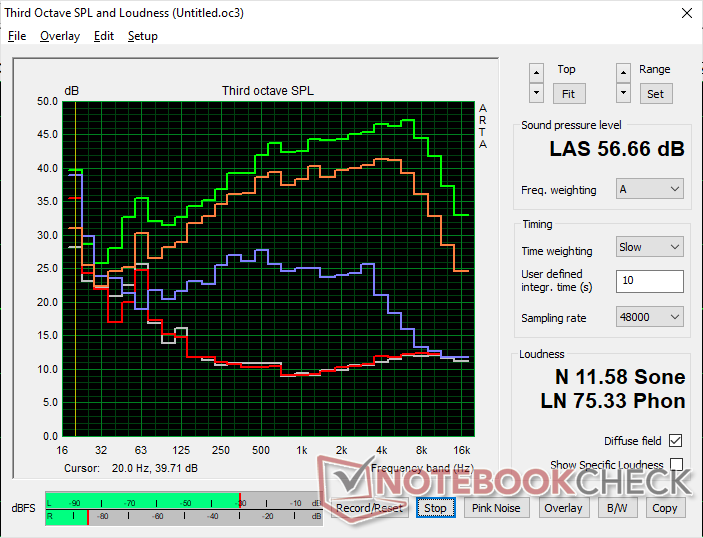
Si vous pensiez qu'un ordinateur portable doté de quatre ventilateurs serait bruyant, vous auriez... tout à fait raison. Le jeu en mode Performance induit un bruit de ventilateur de 51 dB(A), ce qui est similaire à celui de l'Eluktronics Mech-17 GP2, un ordinateur de bureau.Eluktronics Mech-17 GP2 mais plus fort que le Razer Blade 18. Si vous jouez en mode Overdrive, le bruit du ventilateur sera encore plus fort avec près de 57 dB(A). Au-delà de 50 dB(A), il est nécessaire d'utiliser un bon casque pour étouffer le ronronnement des ventilateurs. Gardez à l'esprit que le mode Overdrive n'est pas nécessaire pour la plupart des jeux, comme le montre notre section Stress Test ci-dessous.
Heureusement, le système est plus silencieux lorsqu'il est moins sollicité, car les ventilateurs n'émettent pas de pulsations lorsqu'ils sont réglés sur un profil plus bas. Ainsi, vous pouvez toujours naviguer sur le web ou regarder des vidéos en streaming à des niveaux de bruit de ventilateur confortables.
Degré de la nuisance sonore
| Au repos |
| 23 / 23 / 23 dB(A) |
| Fortement sollicité |
| 35.6 / 56.7 dB(A) |
 | ||
30 dB silencieux 40 dB(A) audible 50 dB(A) bruyant |
||
min: | ||
| Alienware m18 R1 GeForce RTX 4090 Laptop GPU, i9-13980HX, SK hynix PC801 HFS001TEJ9X101N | Razer Blade 18 RTX 4070 GeForce RTX 4070 Laptop GPU, i9-13950HX, SSSTC CA6-8D1024 | Asus ROG Strix Scar 18 2023 G834JY-N6005W GeForce RTX 4090 Laptop GPU, i9-13980HX, 2x Samsung PM9A1 MZVL21T0HCLR (RAID 0) | Eluktronics Mech-17 GP2 GeForce RTX 4090 Laptop GPU, i9-13900HX, Samsung PM9A1 MZVL21T0HCLR | MSI Titan GT77 HX 13VI GeForce RTX 4090 Laptop GPU, i9-13950HX, Samsung PM9A1 MZVL22T0HBLB | Alienware x17 R2 P48E GeForce RTX 3080 Ti Laptop GPU, i9-12900HK, 2x Samsung PM9A1 1TB (RAID 0) | |
|---|---|---|---|---|---|---|
| Noise | -3% | -15% | -13% | -20% | 2% | |
| arrêt / environnement * (dB) | 22.8 | 23.5 -3% | 23.9 -5% | 25.2 -11% | 24.6 -8% | 22.7 -0% |
| Idle Minimum * (dB) | 23 | 23.8 -3% | 23.9 -4% | 28 -22% | 29.2 -27% | 23.1 -0% |
| Idle Average * (dB) | 23 | 23.8 -3% | 32.6 -42% | 28 -22% | 29.2 -27% | 23.1 -0% |
| Idle Maximum * (dB) | 23 | 26.8 -17% | 32.6 -42% | 30.4 -32% | 29.2 -27% | 23.1 -0% |
| Load Average * (dB) | 35.6 | 37.3 -5% | 35.9 -1% | 41 -15% | 50.7 -42% | 31.9 10% |
| Witcher 3 ultra * (dB) | 51.3 | 48 6% | 50.7 1% | 53.3 -4% | 52.5 -2% | |
| Load Maximum * (dB) | 56.7 | 53.5 6% | 55.8 2% | 52.6 7% | 61 -8% | 52.5 7% |
* ... Moindre est la valeur, meilleures sont les performances
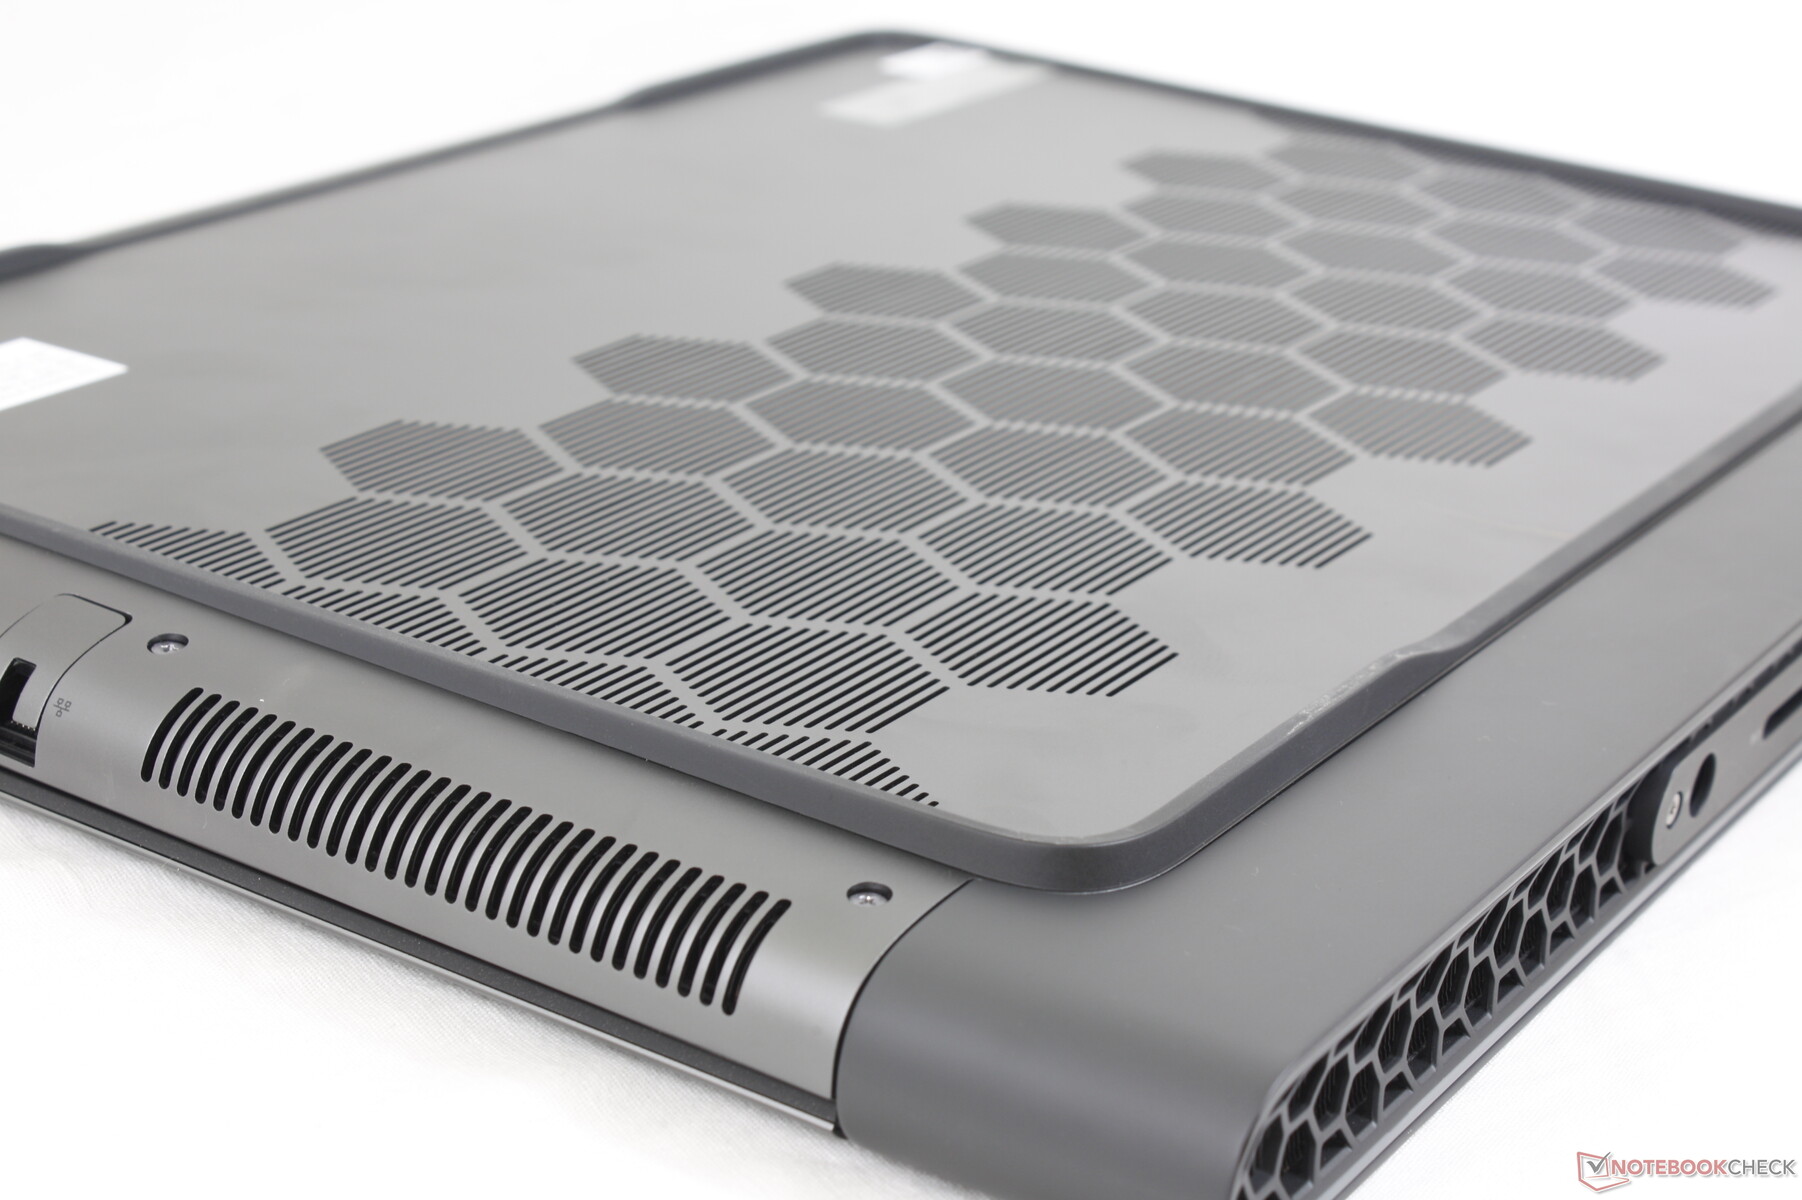
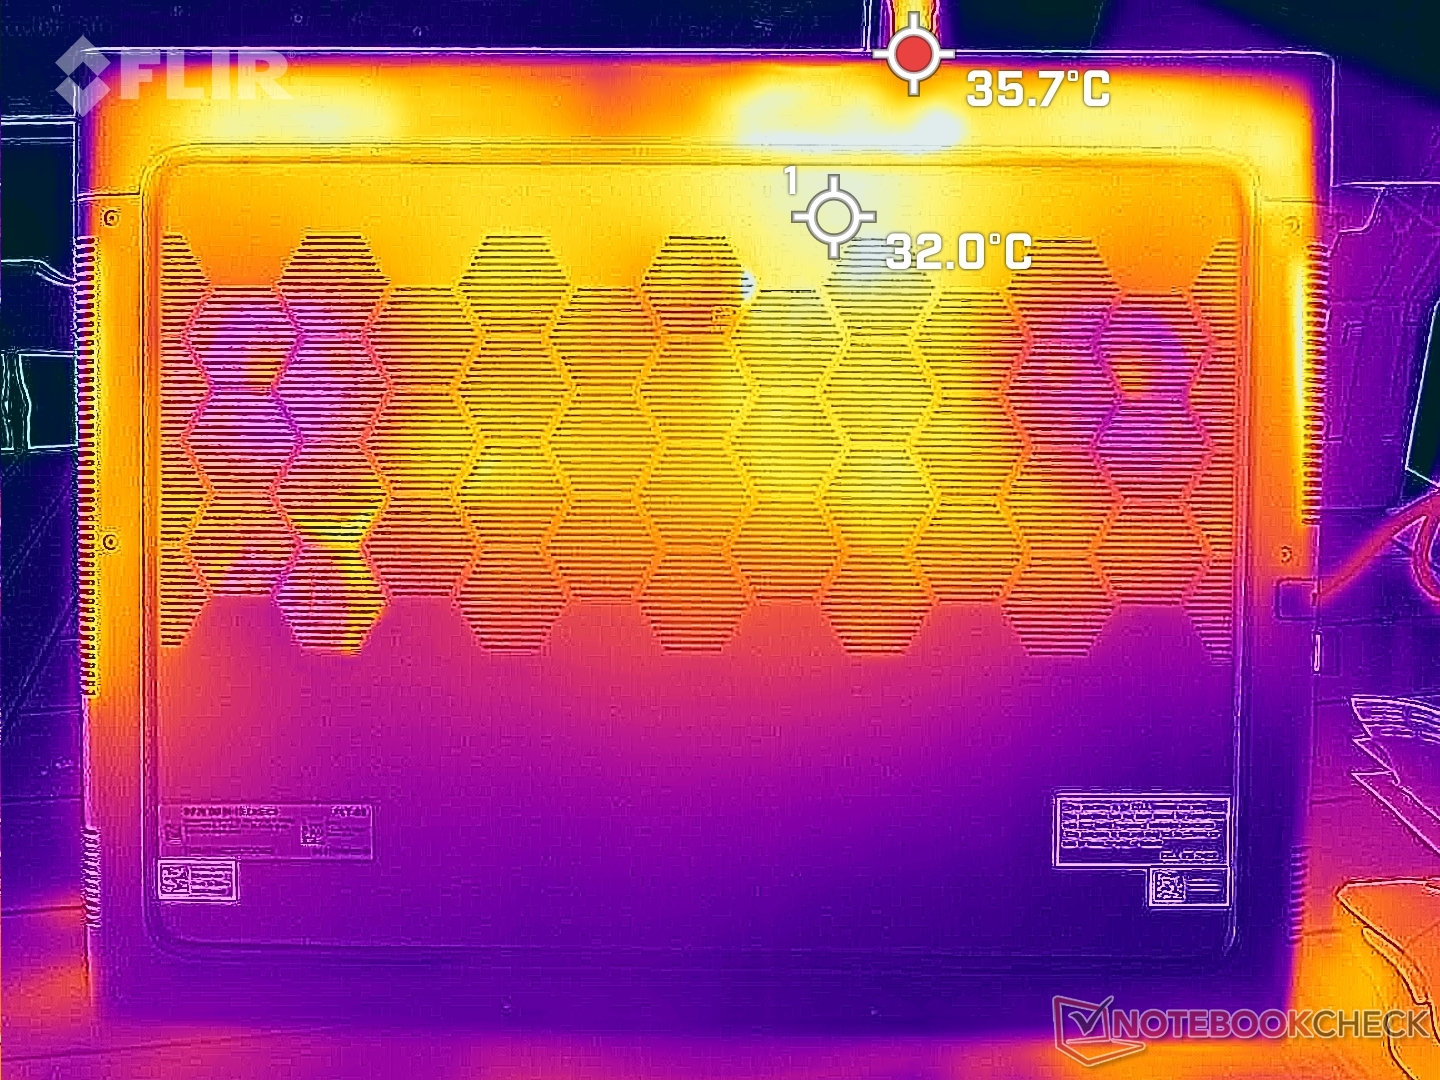
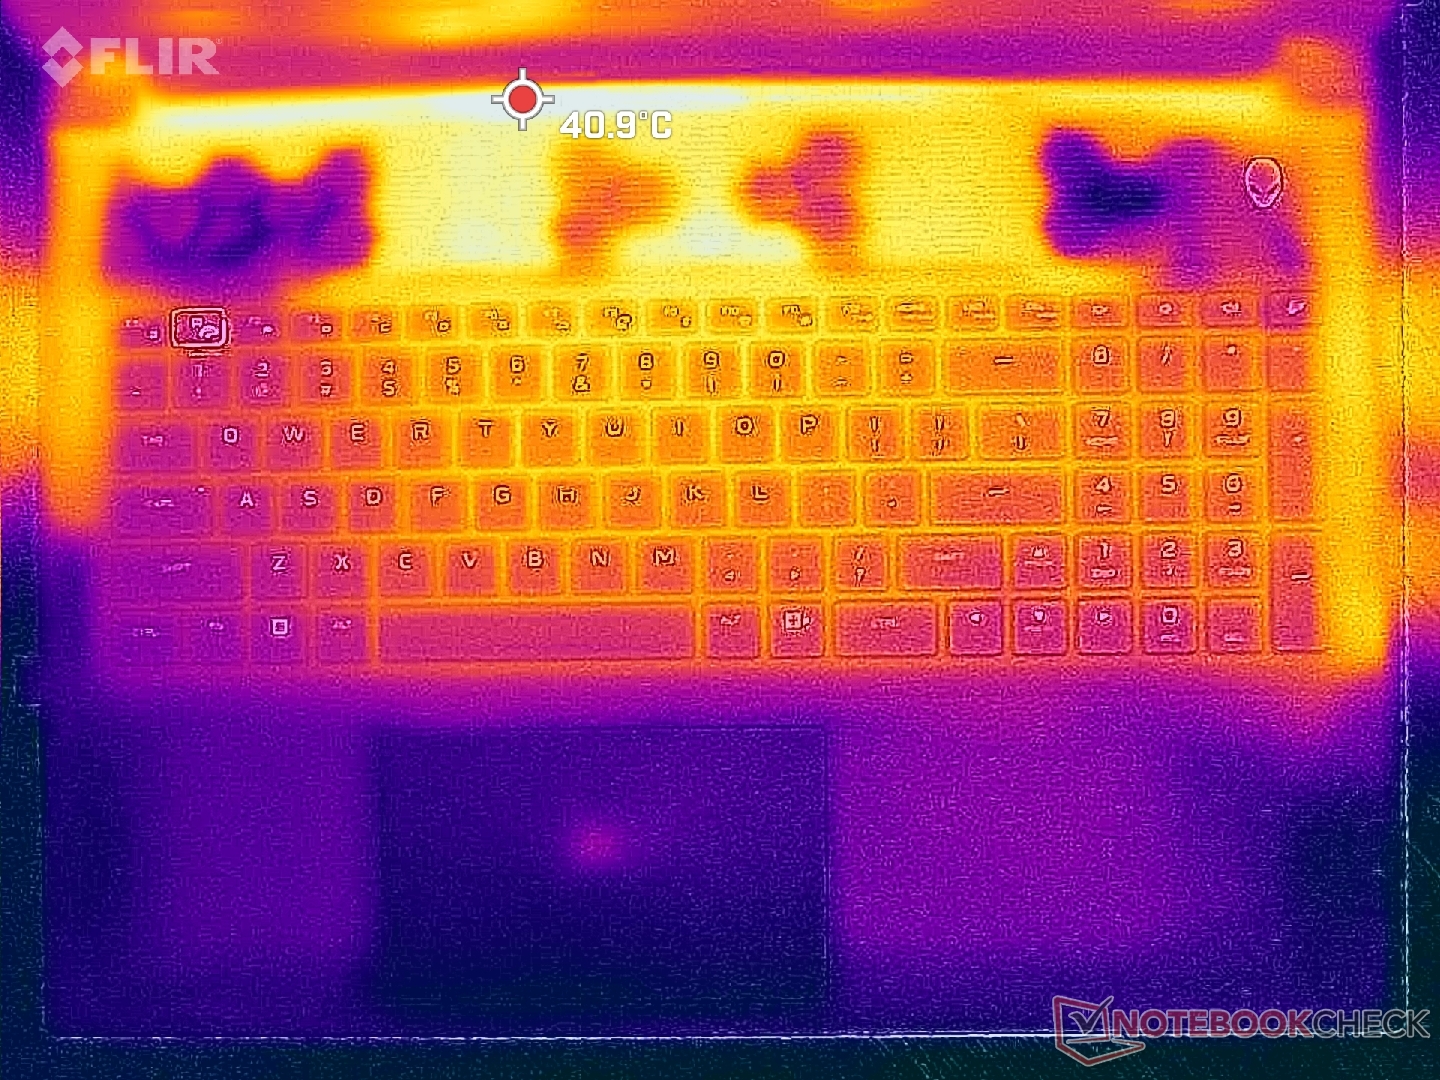
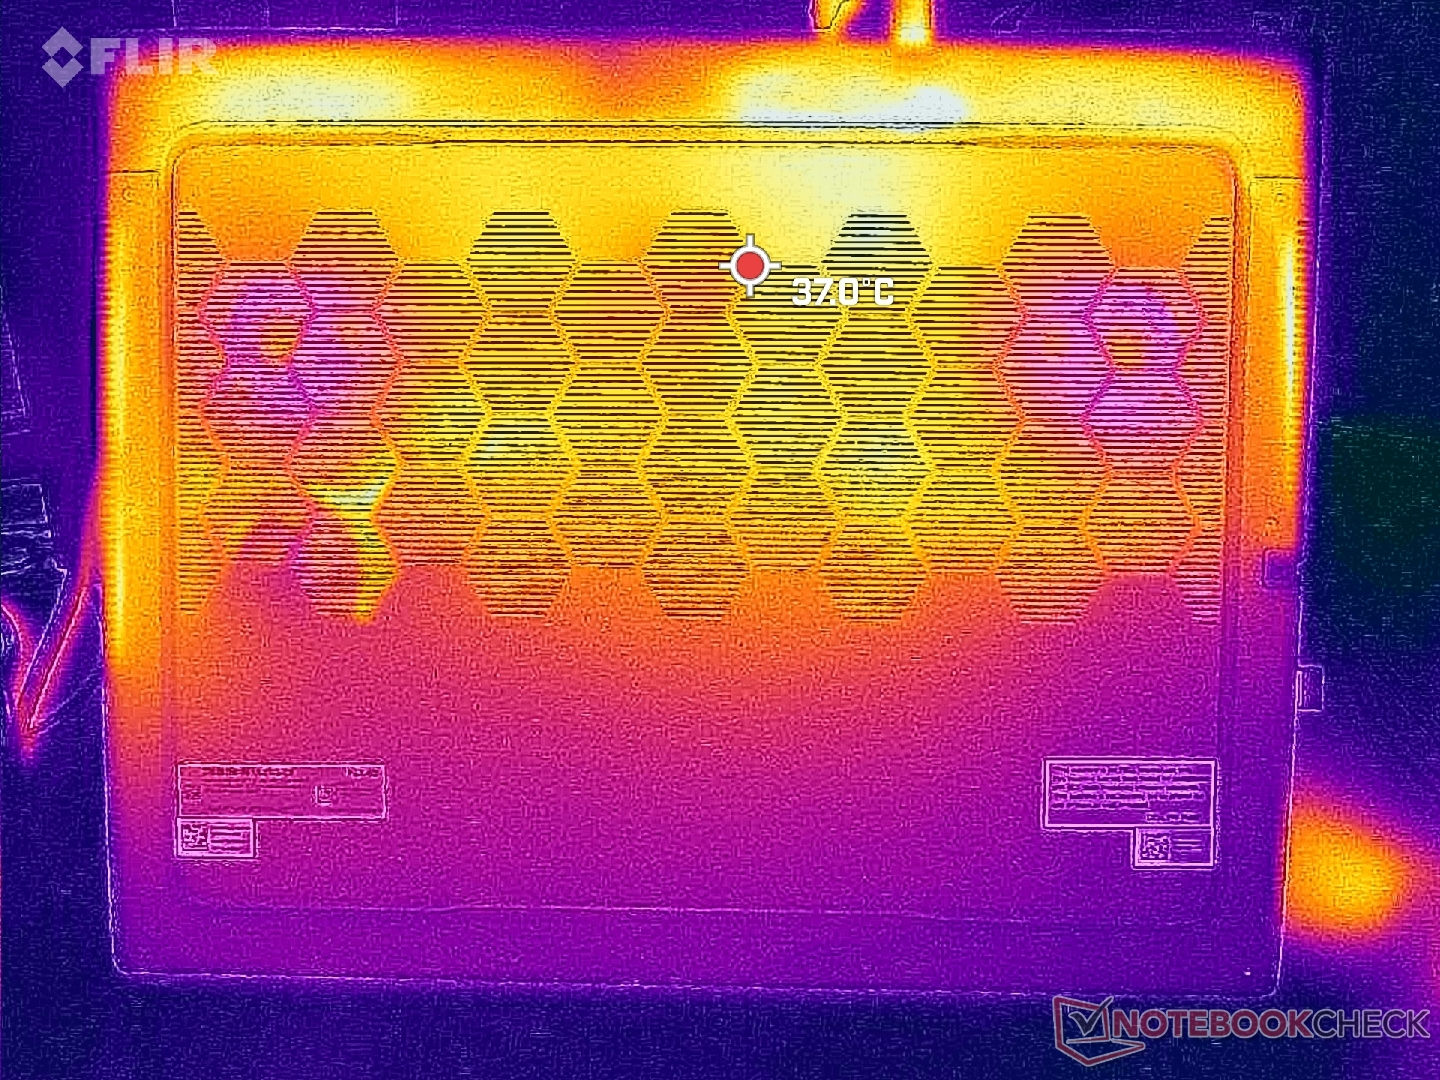
Température
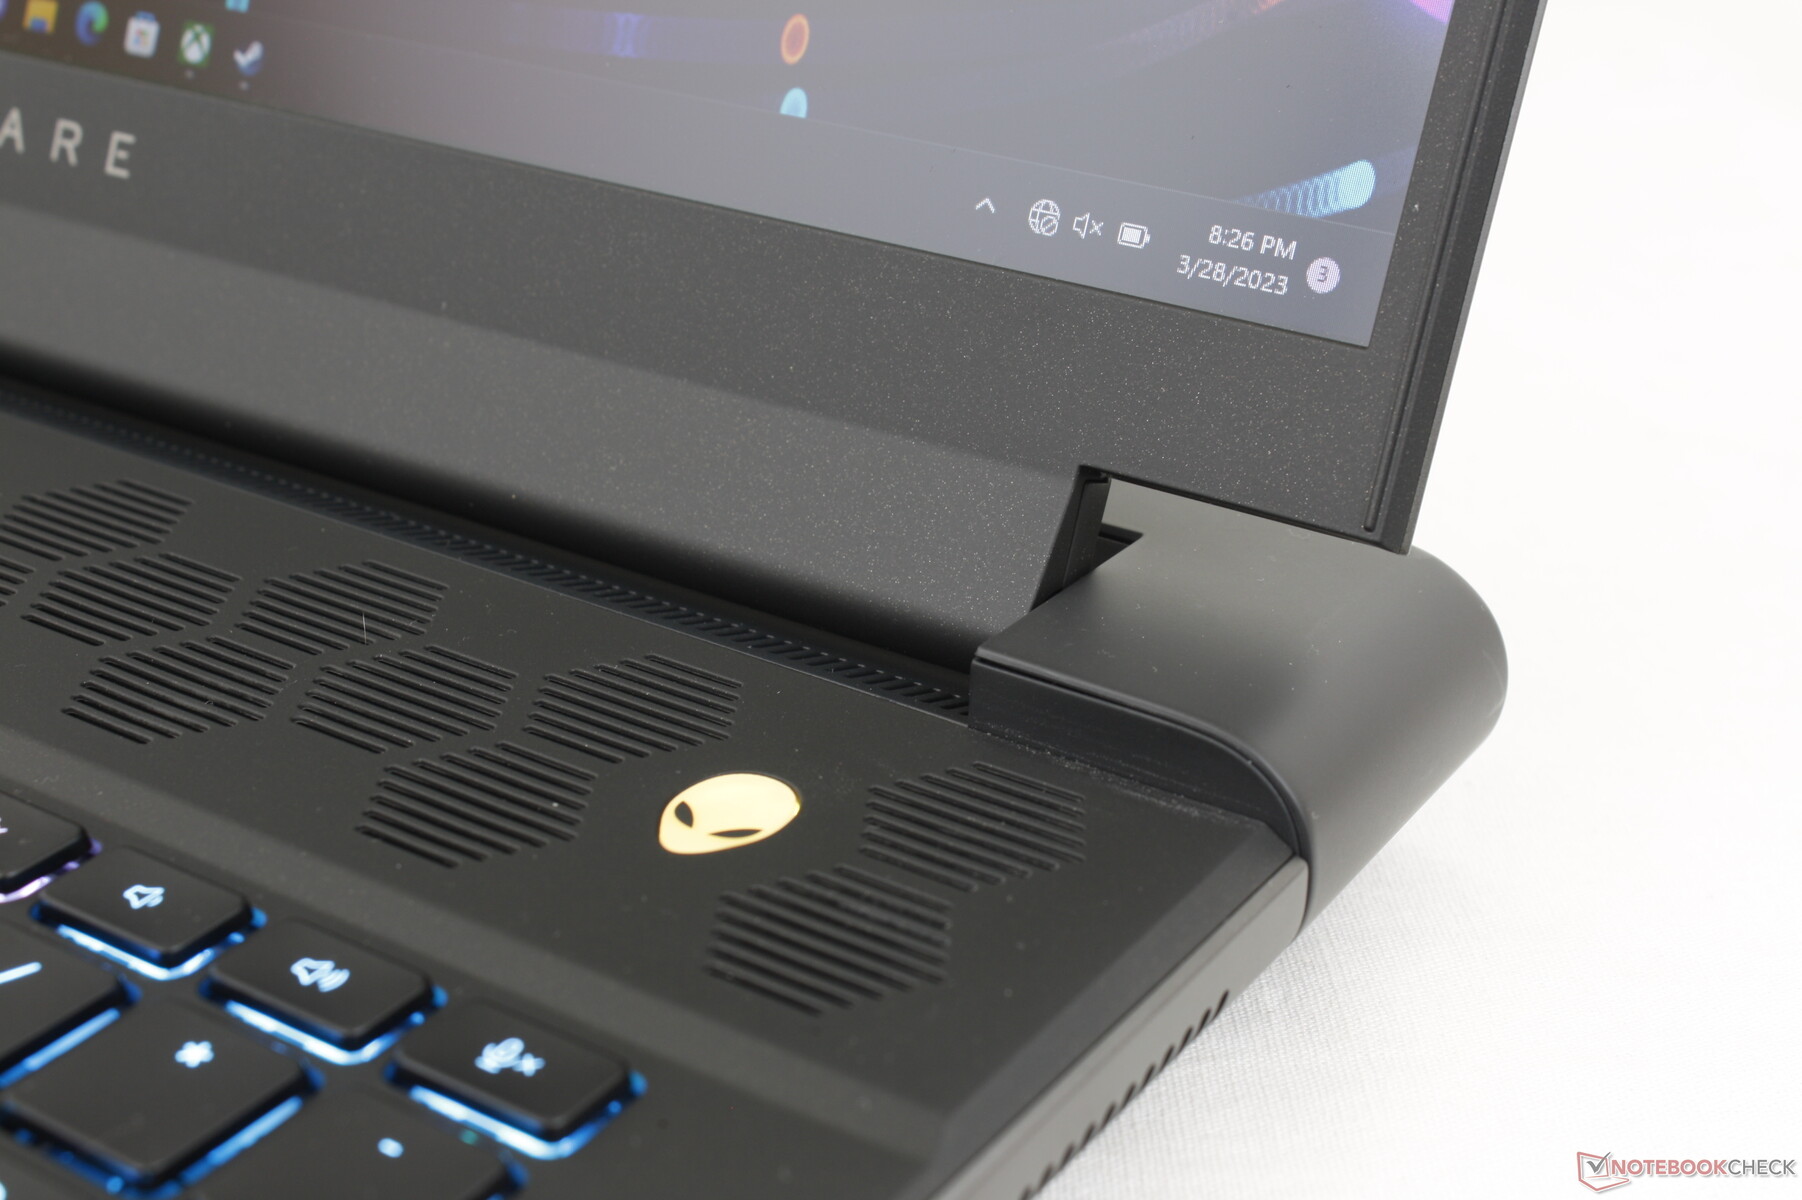
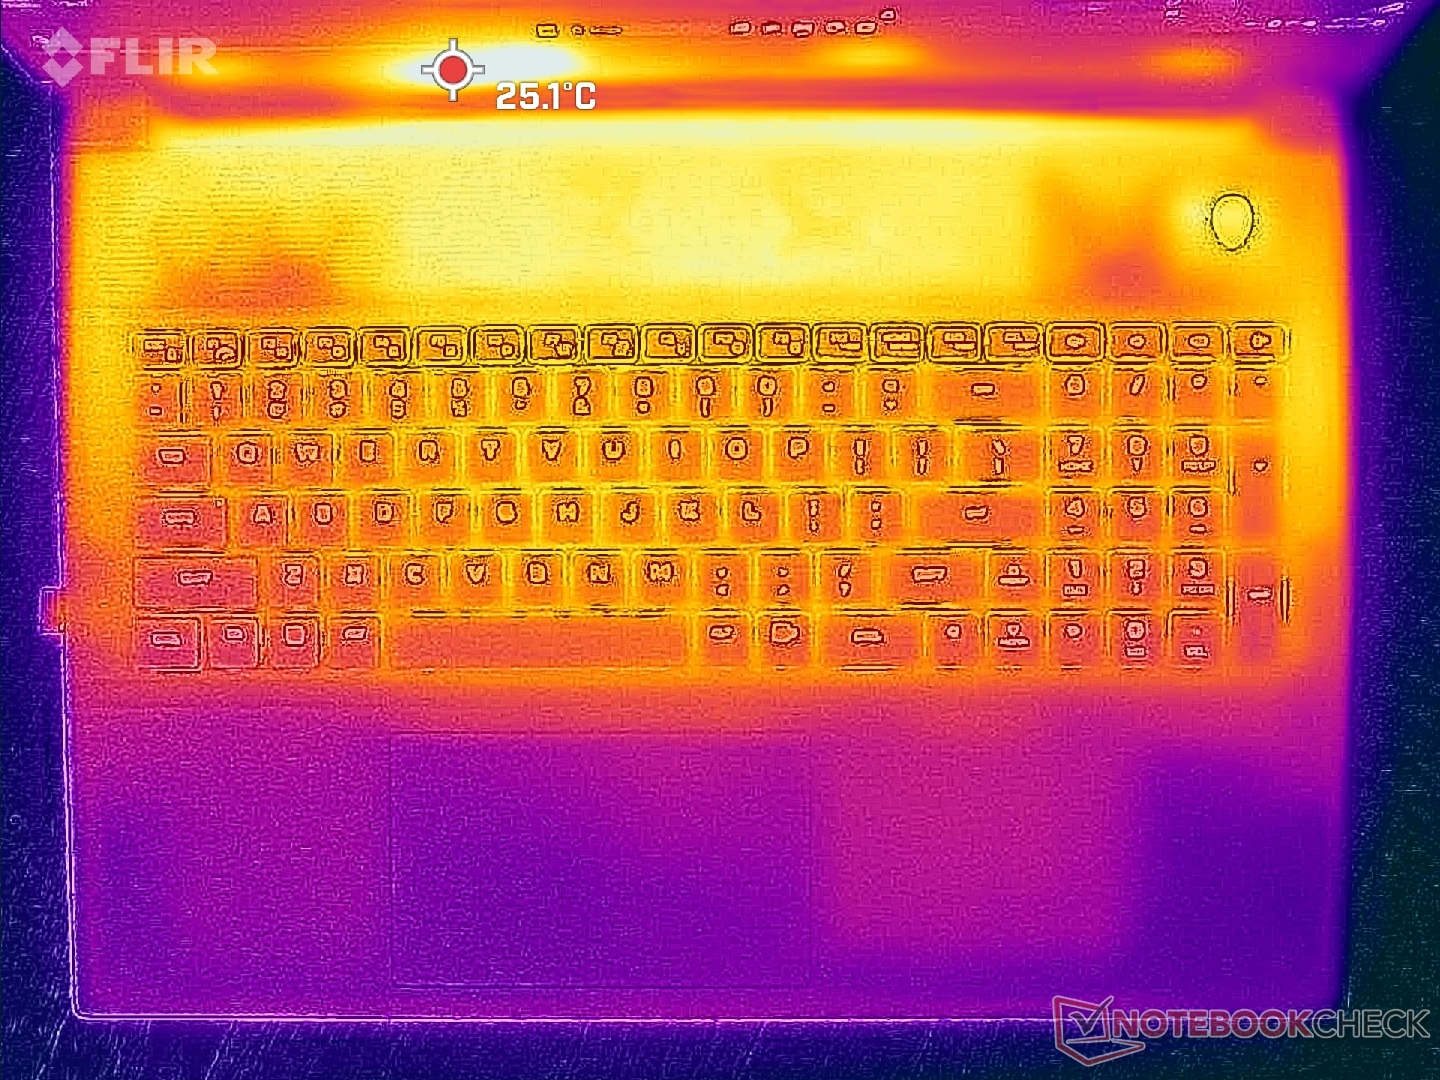
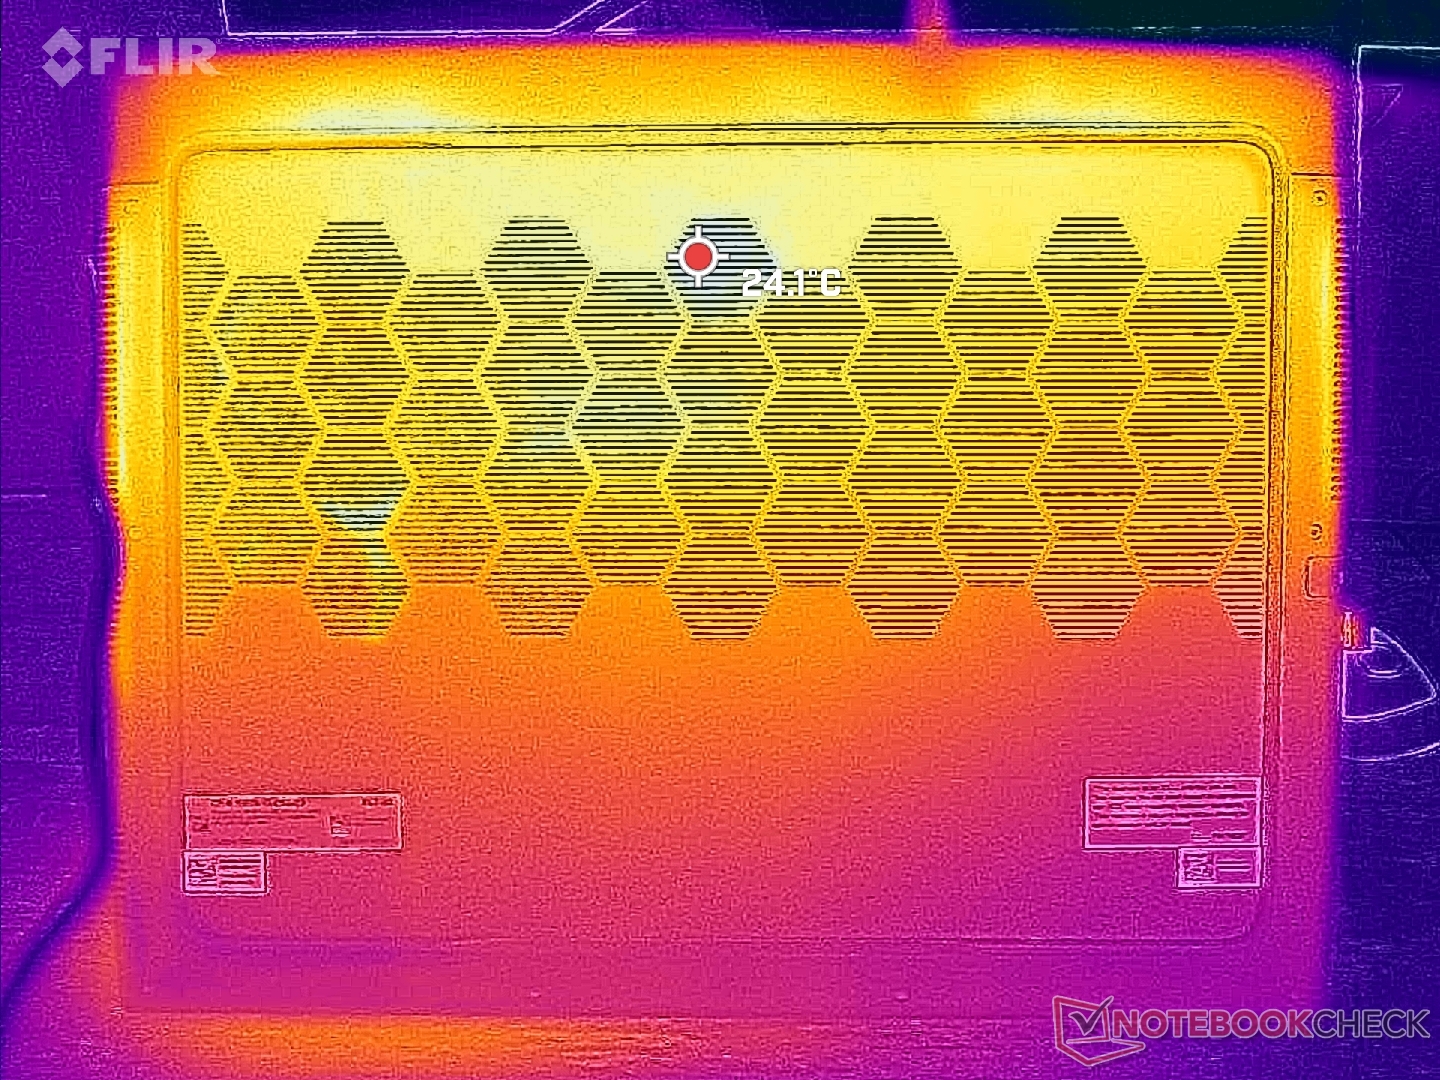
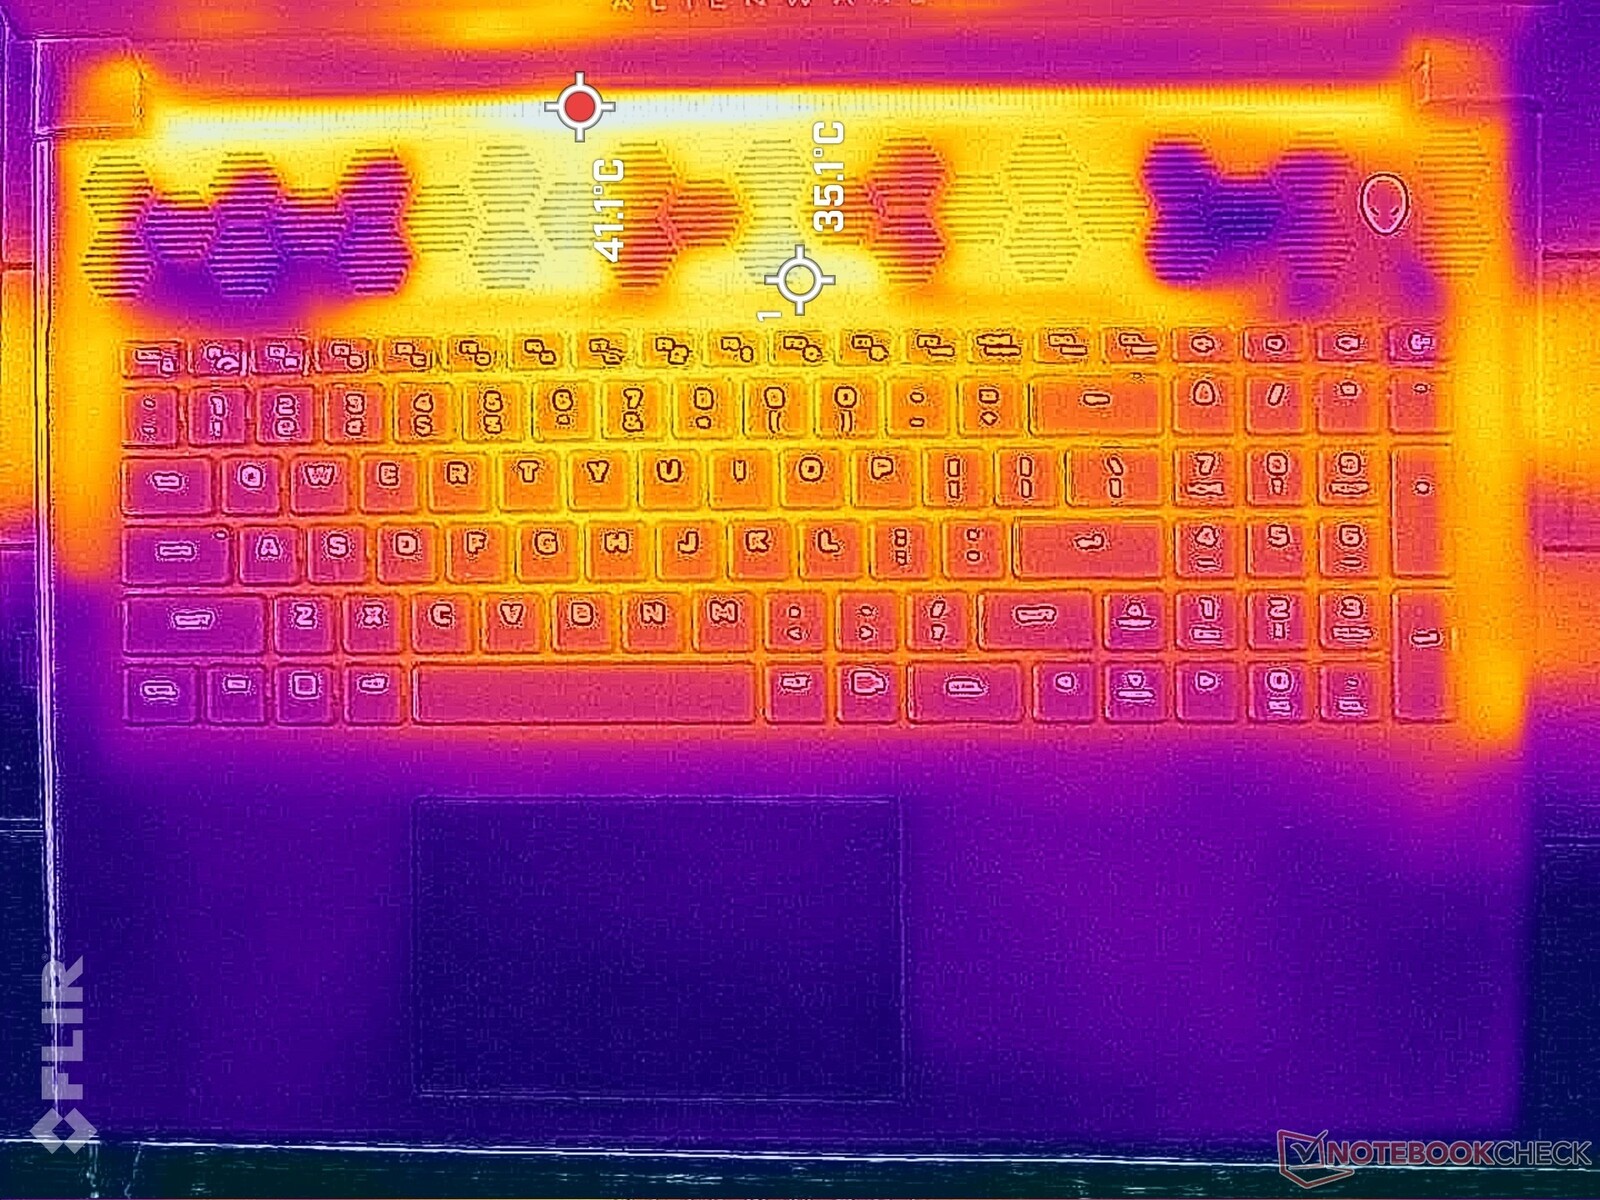
Les températures de surface ne sont pas un problème, en partie grâce aux nombreuses grilles d'aération sur presque tous les côtés du grand châssis. Les zones les plus chaudes se trouvent à l'arrière, loin des touches du clavier et des repose-poignets, ce qui permet de garder les mains à l'aise.
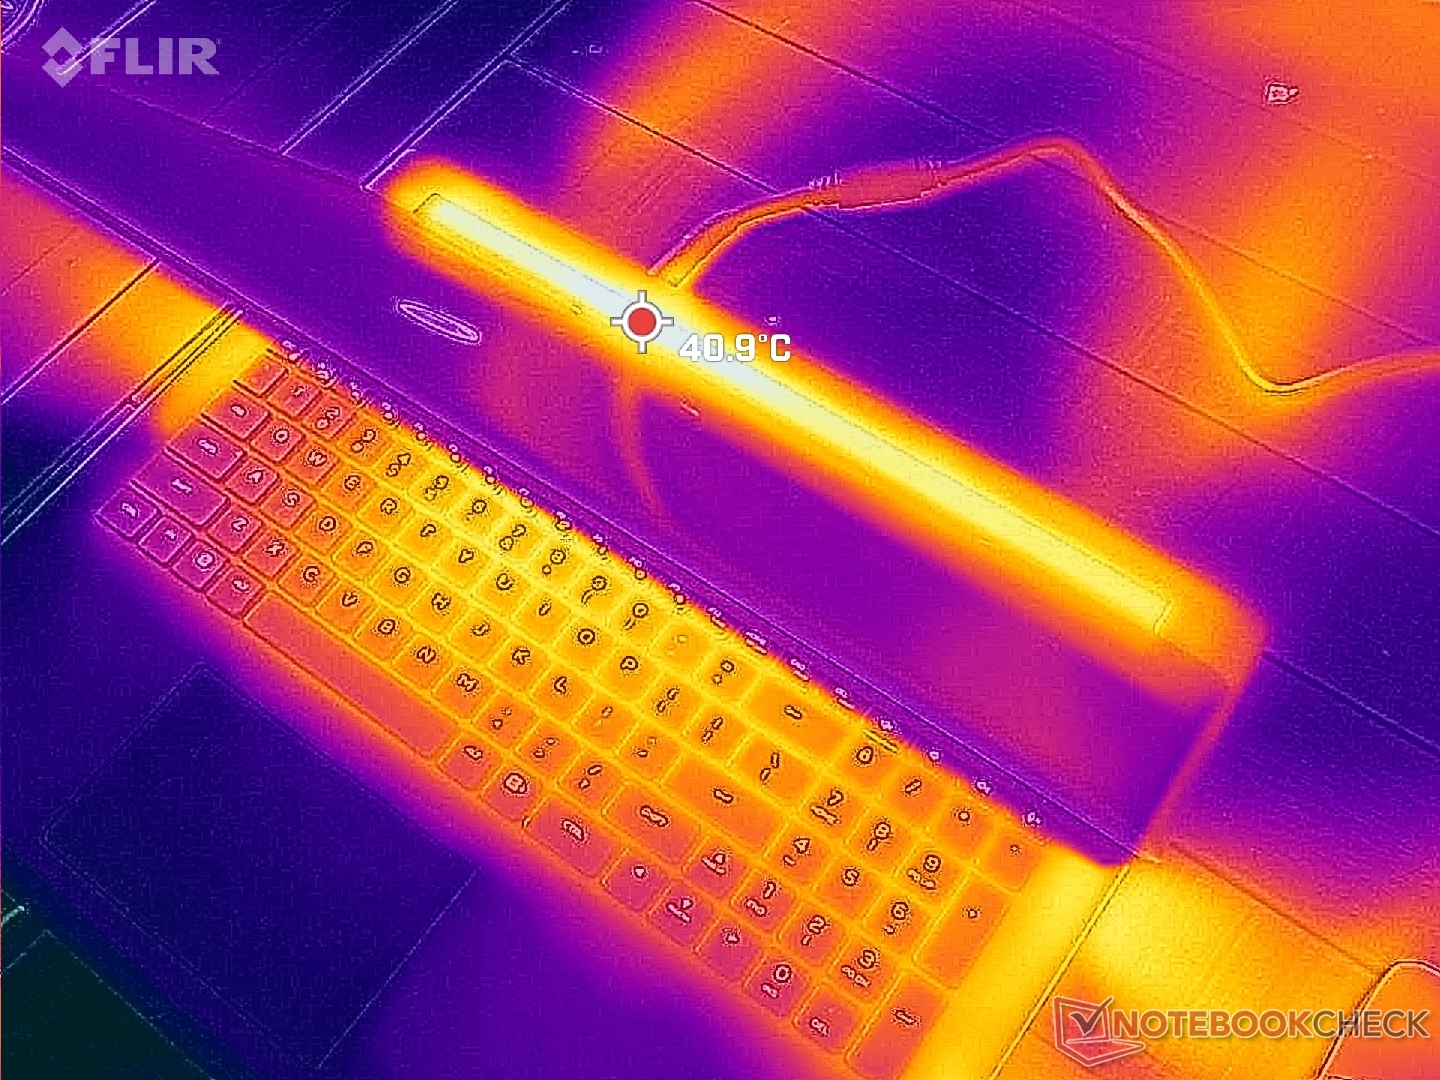
(+) La température maximale du côté supérieur est de 39 °C / 102 F, par rapport à la moyenne de 40.4 °C / 105 F, allant de 21.2 à 68.8 °C pour la classe Gaming.
(+) Le fond chauffe jusqu'à un maximum de 36.4 °C / 98 F, contre une moyenne de 43.2 °C / 110 F
(+) En utilisation inactive, la température moyenne du côté supérieur est de 25.2 °C / 77 F, par rapport à la moyenne du dispositif de 33.9 °C / 93 F.
(+) En jouant à The Witcher 3, la température moyenne du côté supérieur est de 29.8 °C / 86 F, alors que la moyenne de l'appareil est de 33.9 °C / 93 F.
(+) Les repose-poignets et le pavé tactile sont plus froids que la température de la peau avec un maximum de 23.8 °C / 74.8 F et sont donc froids au toucher.
(+) La température moyenne de la zone de l'appui-paume de dispositifs similaires était de 28.8 °C / 83.8 F (+5 °C / #9 F).
| Alienware m18 R1 Intel Core i9-13980HX, NVIDIA GeForce RTX 4090 Laptop GPU | Razer Blade 18 RTX 4070 Intel Core i9-13950HX, NVIDIA GeForce RTX 4070 Laptop GPU | Asus ROG Strix Scar 18 2023 G834JY-N6005W Intel Core i9-13980HX, NVIDIA GeForce RTX 4090 Laptop GPU | Eluktronics Mech-17 GP2 Intel Core i9-13900HX, NVIDIA GeForce RTX 4090 Laptop GPU | MSI Titan GT77 HX 13VI Intel Core i9-13950HX, NVIDIA GeForce RTX 4090 Laptop GPU | Alienware x17 R2 P48E Intel Core i9-12900HK, NVIDIA GeForce RTX 3080 Ti Laptop GPU | |
|---|---|---|---|---|---|---|
| Heat | -7% | -20% | -9% | -4% | -15% | |
| Maximum Upper Side * (°C) | 39 | 39.2 -1% | 54 -38% | 39 -0% | 40.6 -4% | 49.6 -27% |
| Maximum Bottom * (°C) | 36.4 | 35.6 2% | 46 -26% | 44 -21% | 41.1 -13% | 42.4 -16% |
| Idle Upper Side * (°C) | 29.2 | 31.8 -9% | 30 -3% | 31 -6% | 26.2 10% | 29.2 -0% |
| Idle Bottom * (°C) | 27.8 | 33.2 -19% | 31 -12% | 29.8 -7% | 30.3 -9% | 32 -15% |
* ... Moindre est la valeur, meilleures sont les performances
Test de stress
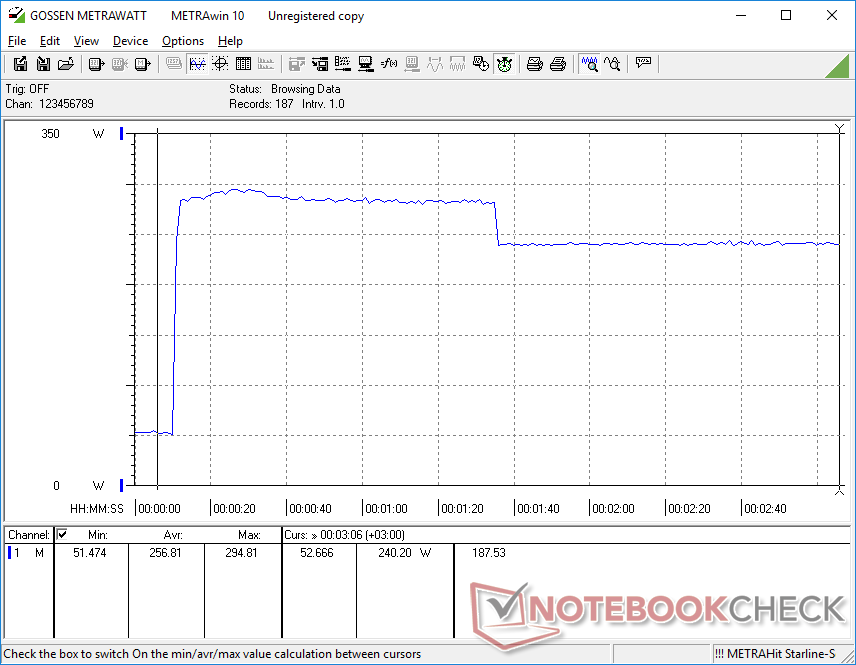
En exécutant Prime95 pour stresser le CPU, les fréquences d'horloge et la consommation d'énergie de la carte montent en flèche à 4,5 GHz et 198 W, respectivement, pendant quelques secondes ou jusqu'à ce que la température du cœur atteigne 99 C. Ensuite, le CPU descend à 4,2 GHz et 175 W pendant quelques minutes avant de se stabiliser à 3,4 GHz, 143 W et 99 C. Le Turbo Boost maximum n'est donc pas durable, quel que soit le mode d'alimentation. Les températures du processeur sont également extrêmes, même pour un ordinateur portable de jeu.
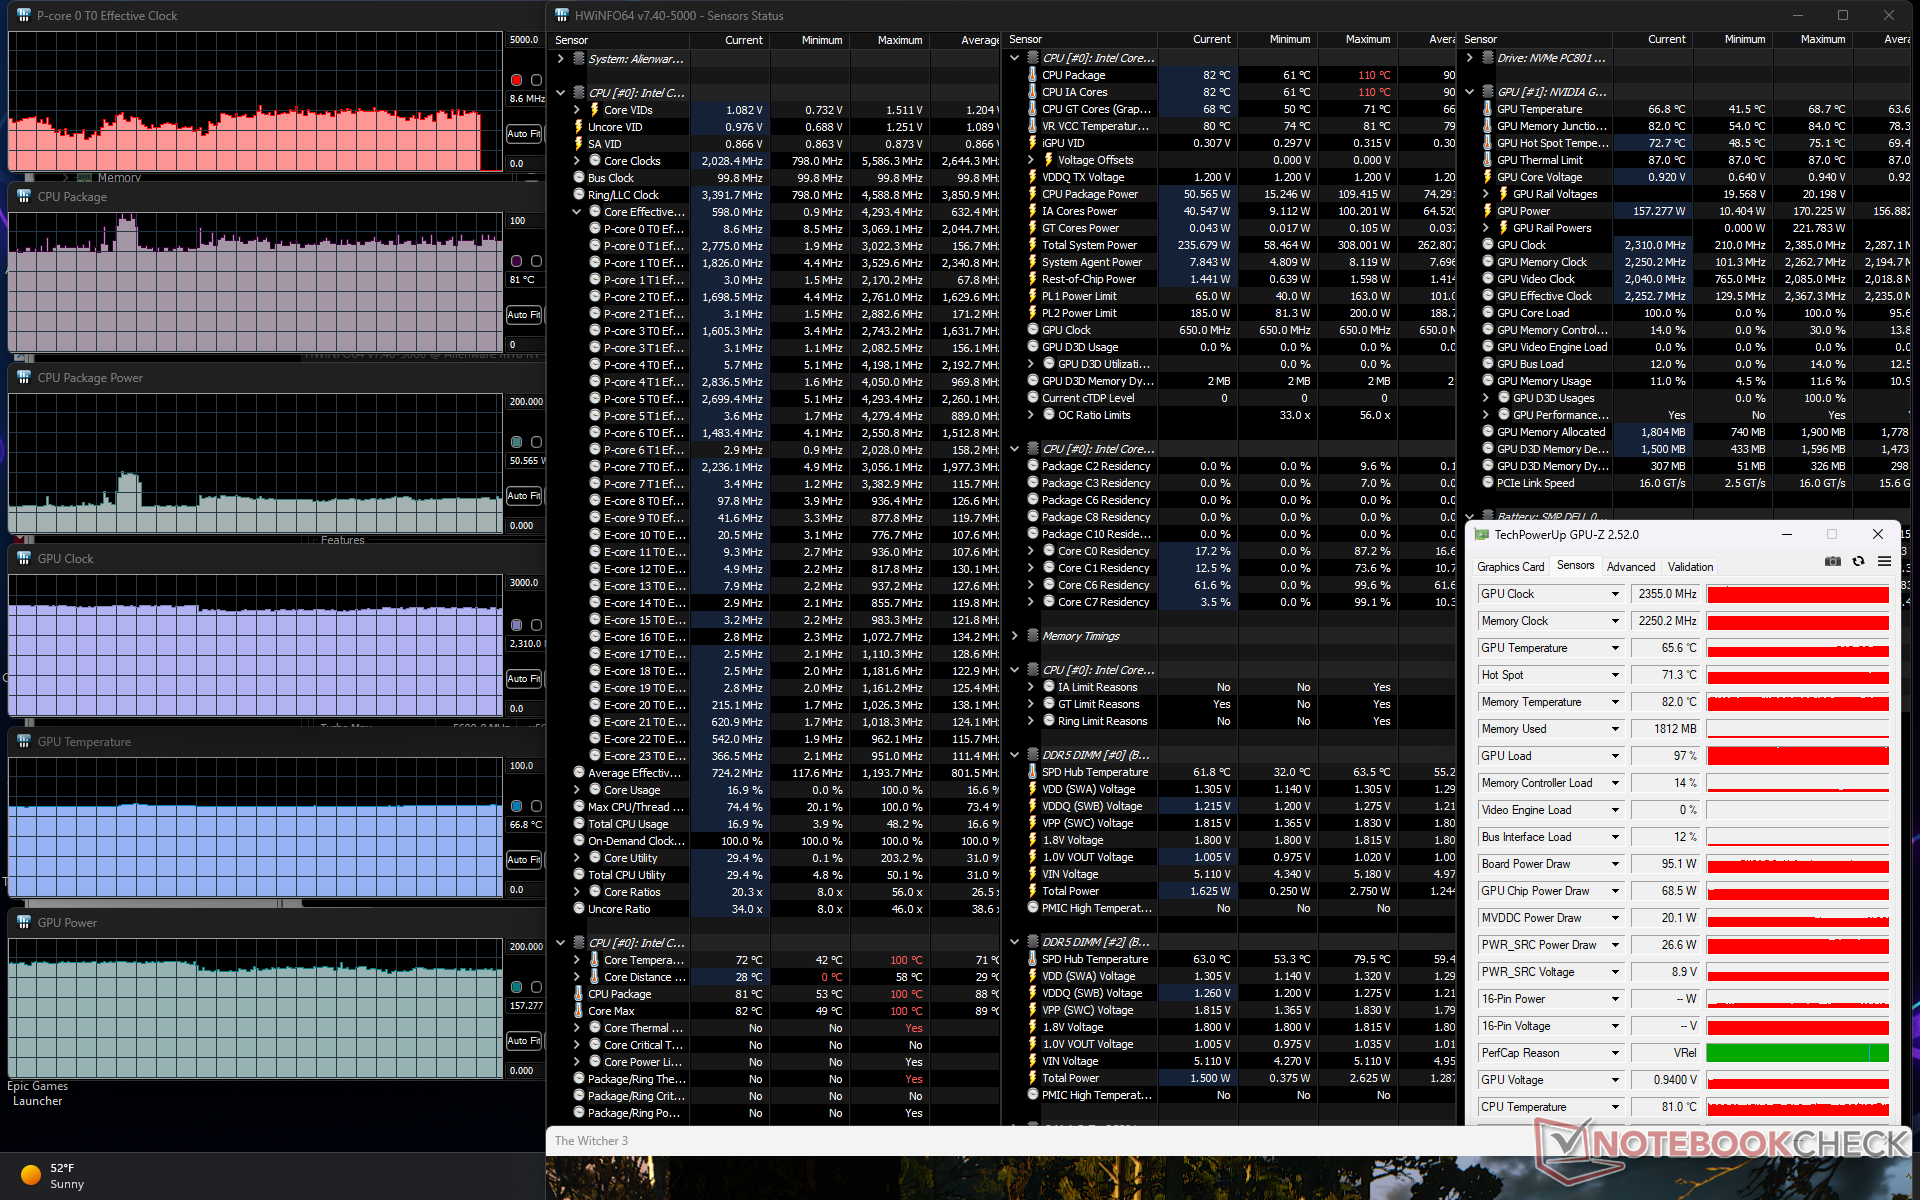
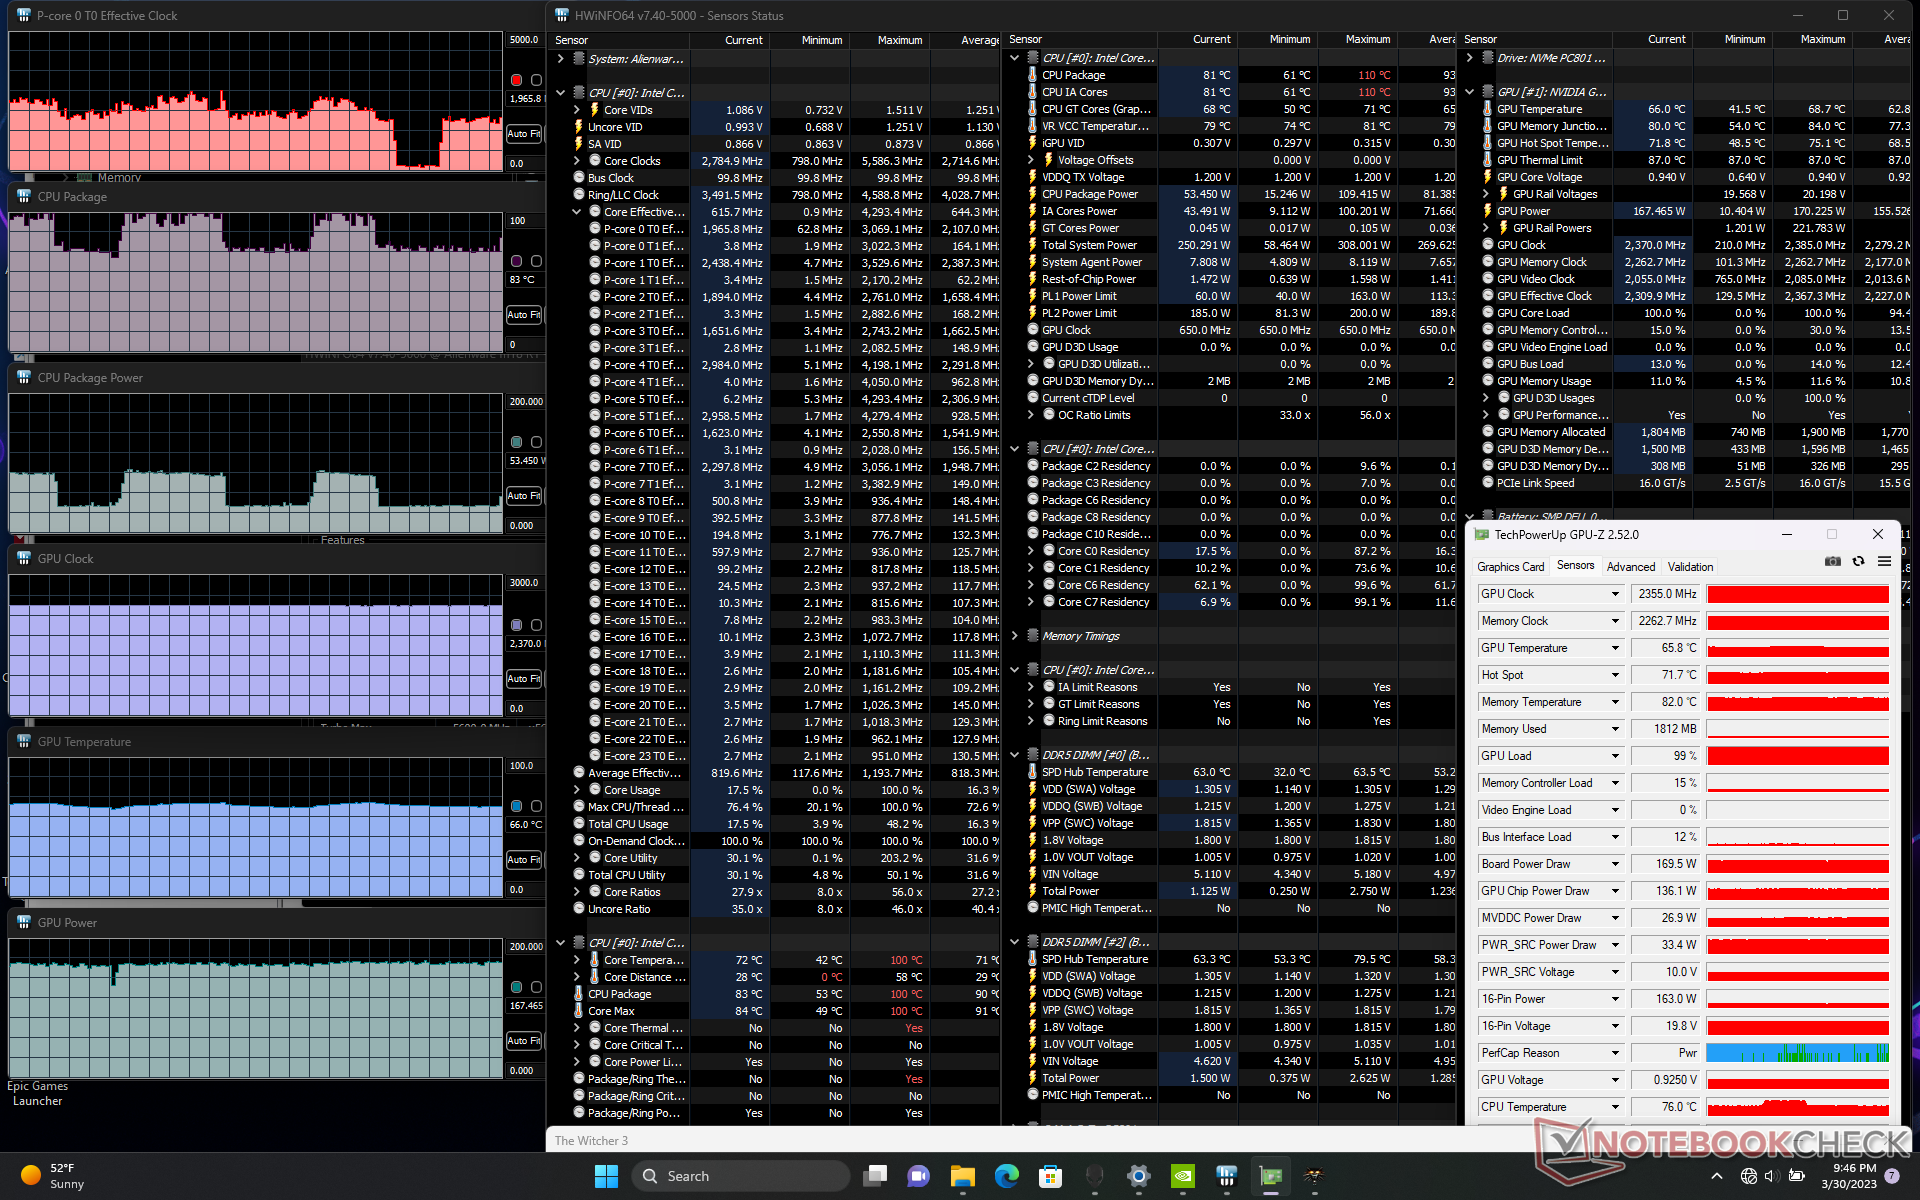
Les fréquences d'horloge du GPU, la température et la consommation d'énergie de la carte se stabilisent à 2370 MHz, 63 C et 162 W, respectivement, en mode Overdrive Witcher 3 en mode Overdrive. Notez que les performances du GPU ne sont pas affectées lorsqu'il fonctionne en mode Performance, plus silencieux, ce qui correspond à nos observations sur Fire Strike. Au lieu de cela, c'est le processeur qui subit une légère baisse de performance. La plupart des jeux étant liés au GPU, nous recommandons de jouer en mode Performance plutôt qu'en mode Overdrive, plus bruyant, si le bruit du ventilateur vous préoccupe.
L'utilisation de la batterie limite les performances comme prévu. Un test Fire Strike sur batterie donnerait des scores en physique et en graphique de 25319 et 18778 points, respectivement, contre 41644 et 46998 points sur secteur.
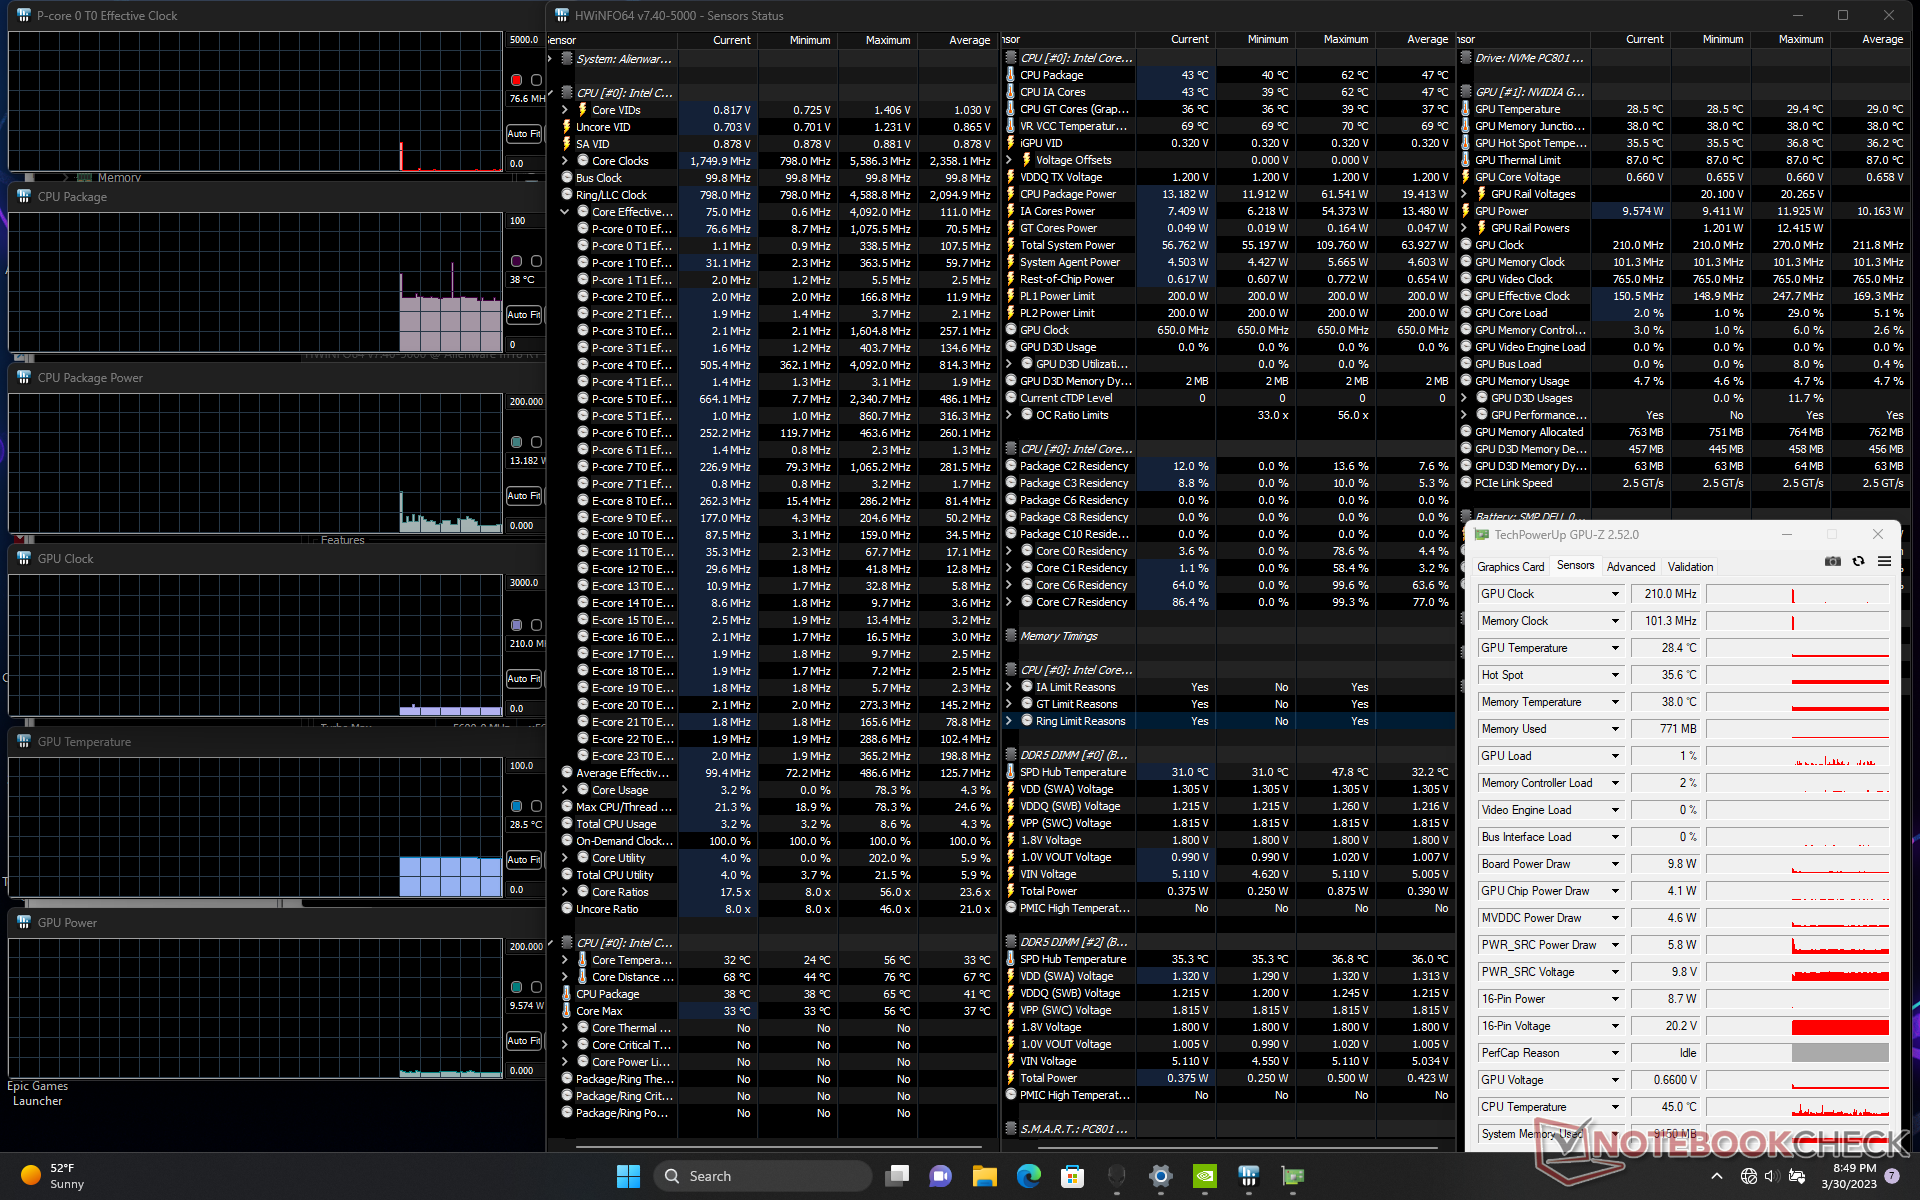
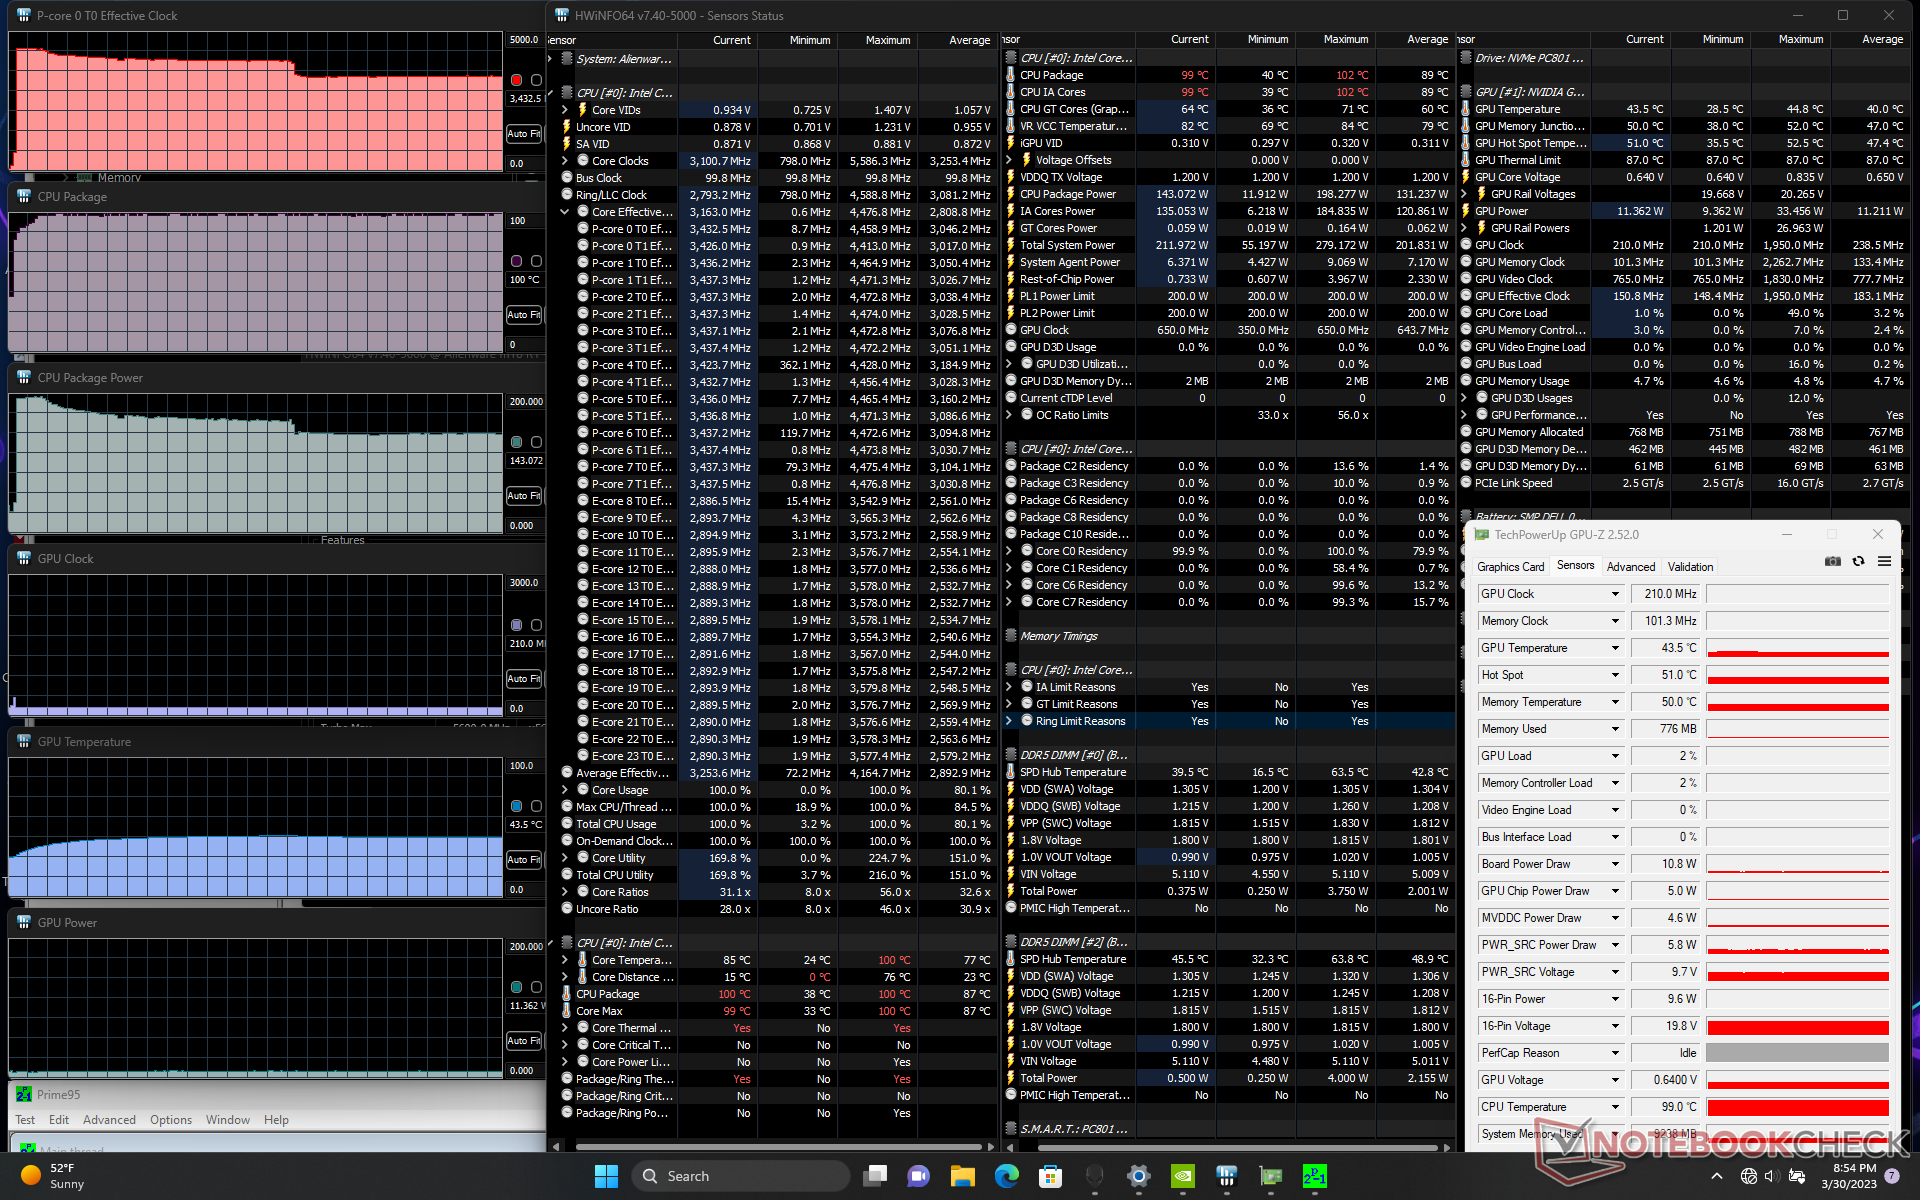
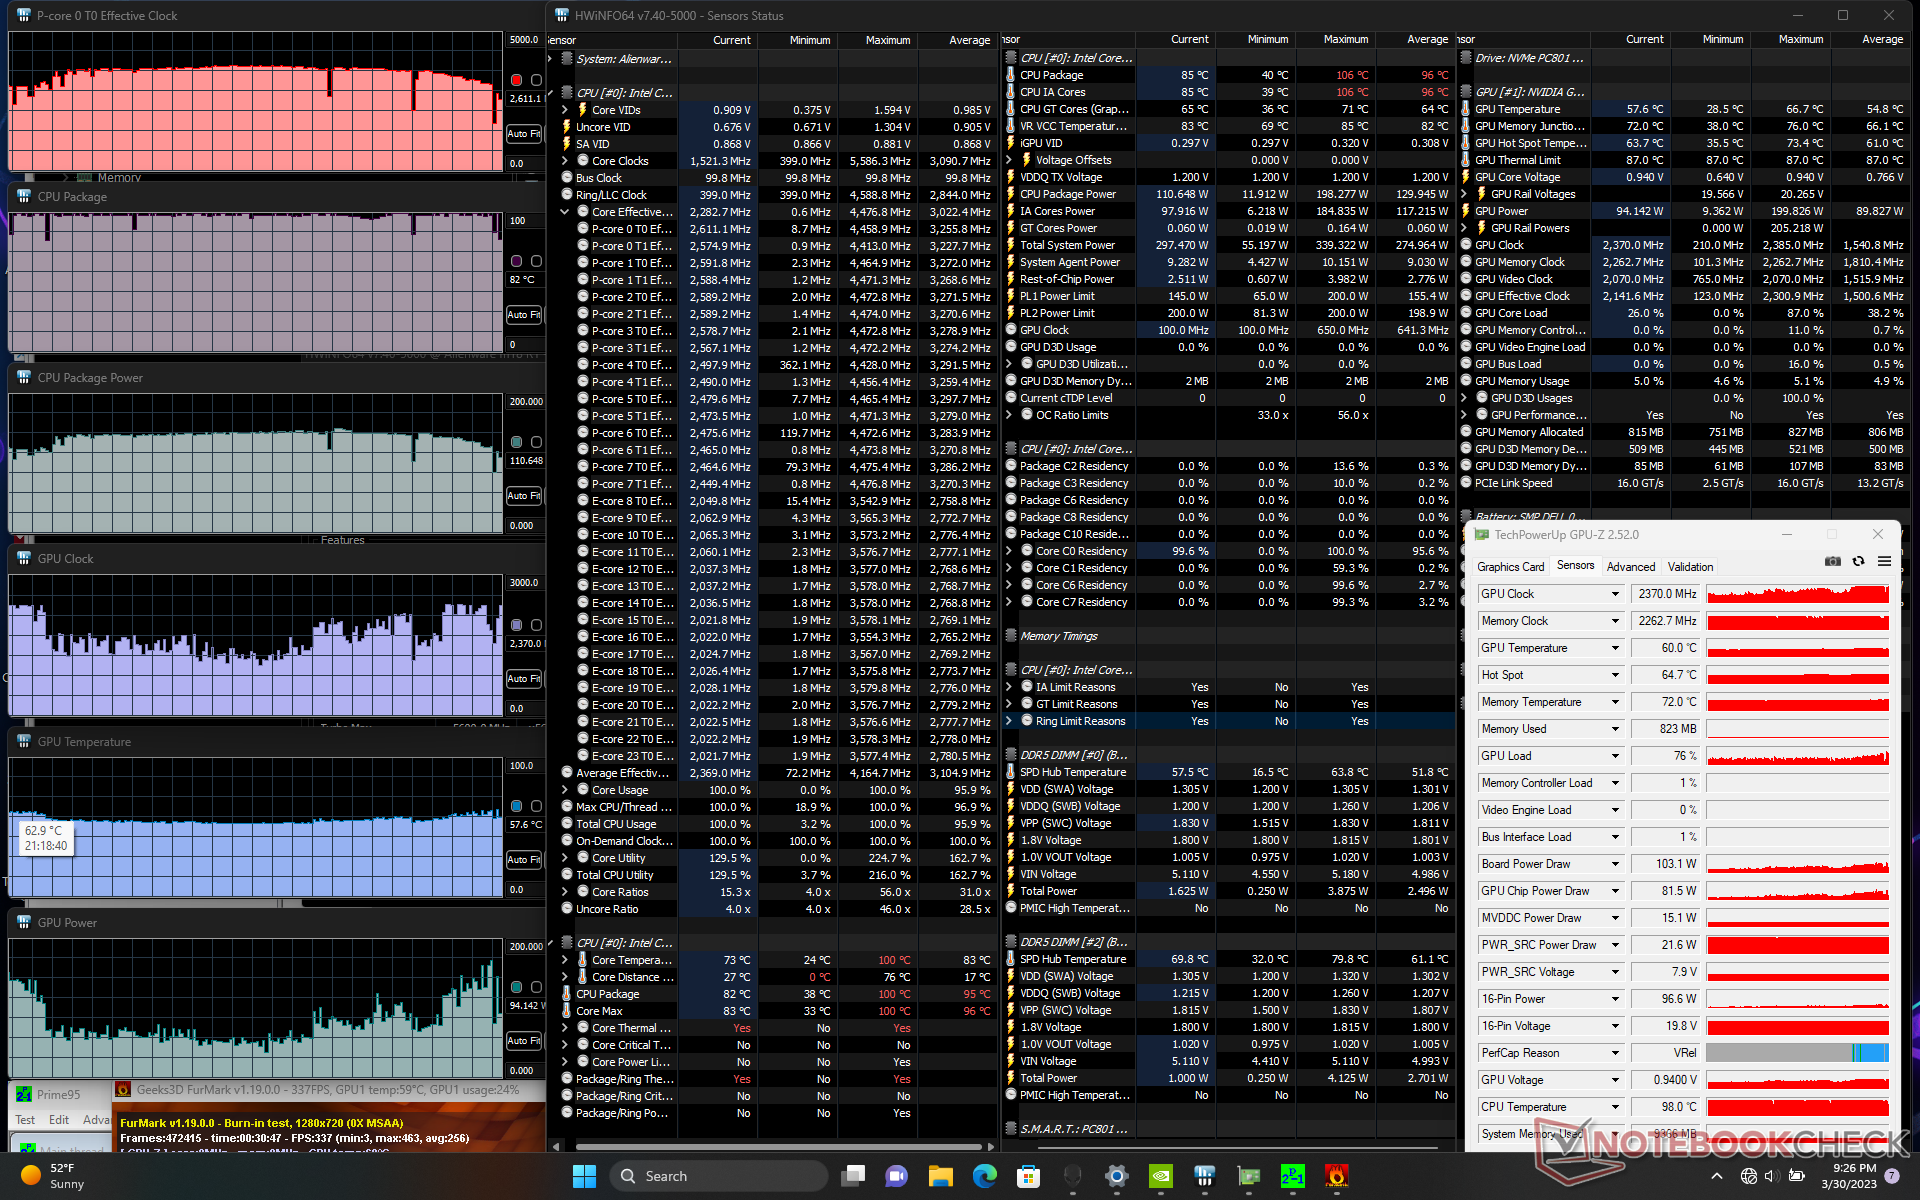
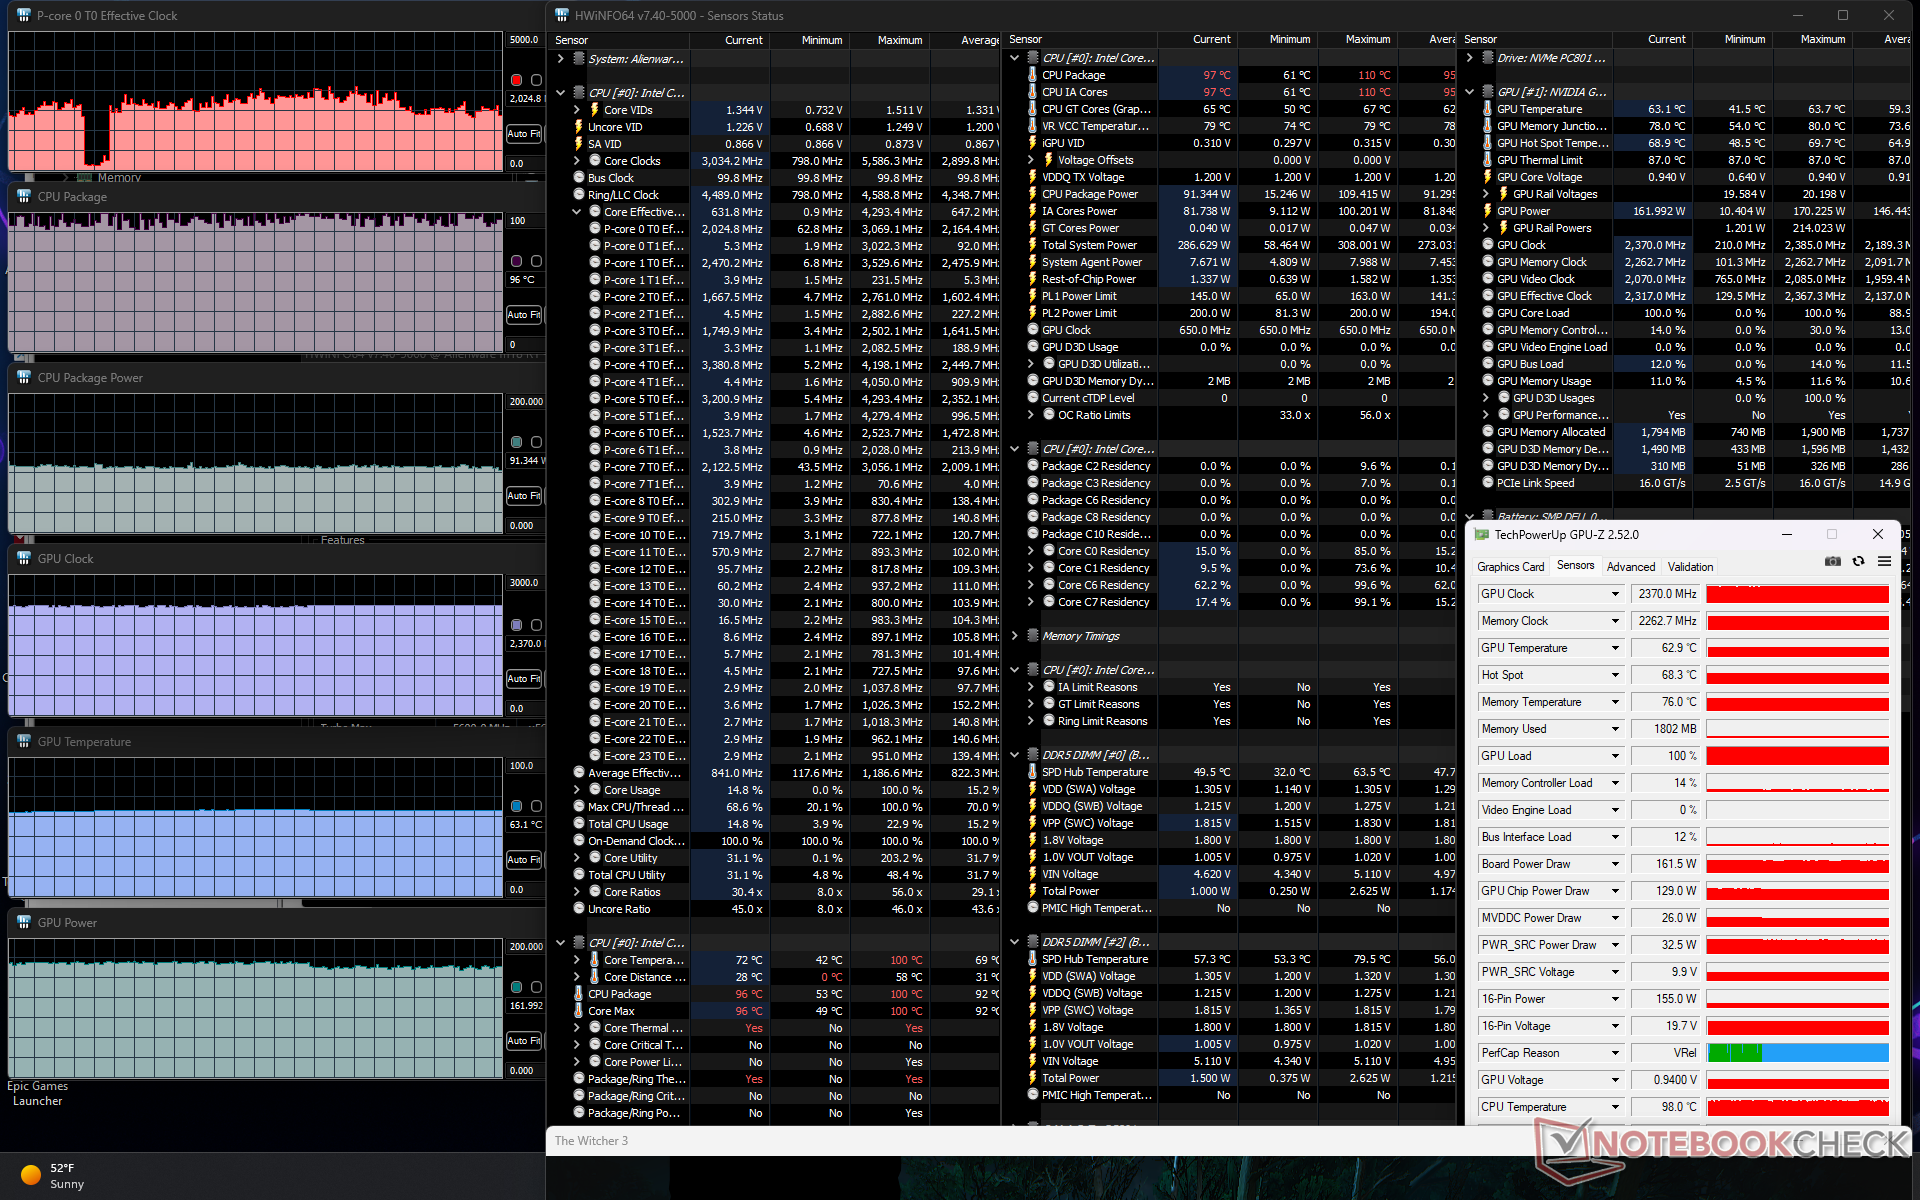
| Horloge du CPU (GHz) | Horloge du GPU (MHz) | Température moyenne du CPU (°C) | Température moyenne du GPU (°C) | |
| Système en veille | -- | -- | 38 | 29 |
| Prime95 Stress | 3.4 | -- | 100 | 44 |
| Prime95 + FurMark Stress | 2.6+ | 1070 - 2370 | 82 - 100 | 57 |
| Witcher 3 Stress(mode Overdrive) | ~2.0+ | 2370 | 96 | 63 |
| Witcher 3 Stress (mode Performance) | ~1.8+ | 2370 | 81 | 66 |
| Witcher 3 Stress (mode équilibré) | ~1.8 | 2310 | 81 | 67 |
Intervenants
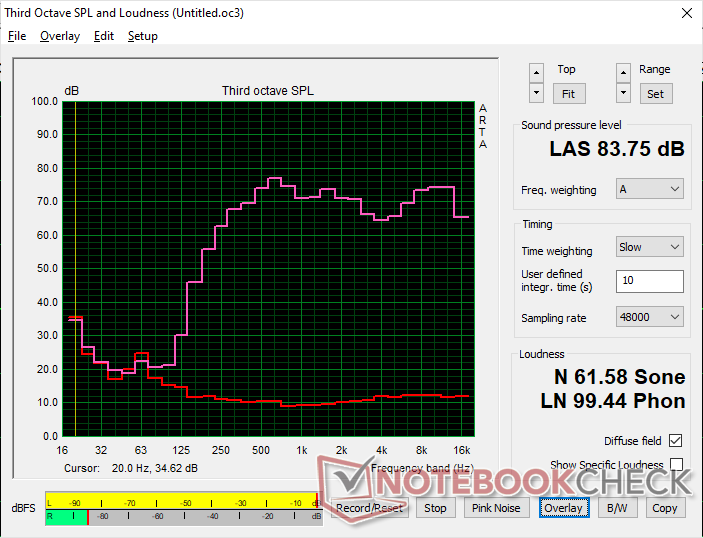
Alienware m18 R1 analyse audio
(+) | les haut-parleurs peuvent jouer relativement fort (83.8# dB)
Basses 100 - 315 Hz
(-) | presque aucune basse - en moyenne 22.4% plus bas que la médiane
(±) | la linéarité des basses est moyenne (13.4% delta à la fréquence précédente)
Médiums 400 - 2000 Hz
(+) | médiane équilibrée - seulement 3.2% de la médiane
(+) | les médiums sont linéaires (4.4% delta à la fréquence précédente)
Aiguës 2 - 16 kHz
(+) | des sommets équilibrés - à seulement 3.2% de la médiane
(+) | les aigus sont linéaires (4% delta à la fréquence précédente)
Globalement 100 - 16 000 Hz
(+) | le son global est linéaire (14.6% différence à la médiane)
Par rapport à la même classe
» 28% de tous les appareils testés de cette catégorie étaient meilleurs, 7% similaires, 65% pires
» Le meilleur avait un delta de 6%, la moyenne était de 18%, le pire était de 132%.
Par rapport à tous les appareils testés
» 19% de tous les appareils testés étaient meilleurs, 4% similaires, 77% pires
» Le meilleur avait un delta de 4%, la moyenne était de 23%, le pire était de 134%.
Apple MacBook Pro 16 2021 M1 Pro analyse audio
(+) | les haut-parleurs peuvent jouer relativement fort (84.7# dB)
Basses 100 - 315 Hz
(+) | bonne basse - seulement 3.8% loin de la médiane
(+) | les basses sont linéaires (5.2% delta à la fréquence précédente)
Médiums 400 - 2000 Hz
(+) | médiane équilibrée - seulement 1.3% de la médiane
(+) | les médiums sont linéaires (2.1% delta à la fréquence précédente)
Aiguës 2 - 16 kHz
(+) | des sommets équilibrés - à seulement 1.9% de la médiane
(+) | les aigus sont linéaires (2.7% delta à la fréquence précédente)
Globalement 100 - 16 000 Hz
(+) | le son global est linéaire (4.6% différence à la médiane)
Par rapport à la même classe
» 0% de tous les appareils testés de cette catégorie étaient meilleurs, 0% similaires, 100% pires
» Le meilleur avait un delta de 5%, la moyenne était de 17%, le pire était de 45%.
Par rapport à tous les appareils testés
» 0% de tous les appareils testés étaient meilleurs, 0% similaires, 100% pires
» Le meilleur avait un delta de 4%, la moyenne était de 23%, le pire était de 134%.
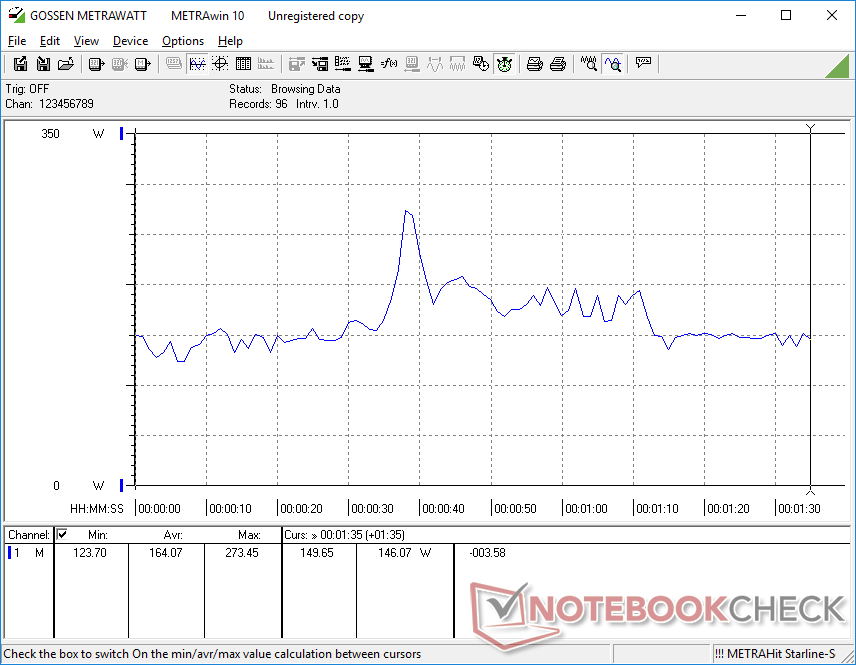
Gestion de l'énergie - Plus de 300 W en jeu
Consommation électrique
Le système est sans surprise très exigeant, même lorsqu'aucune application n'est en cours d'exécution. Nous avons pu enregistrer un minimum de 21 W en mode économie d'énergie, en mode Optimus et avec le réglage de luminosité le plus bas. En mode Performance ou Turbo, la consommation au ralenti est multipliée par deux. Il est donc fortement recommandé d'éviter les paramètres les plus élevés si l'on n'a pas besoin de la puissance supplémentaire.
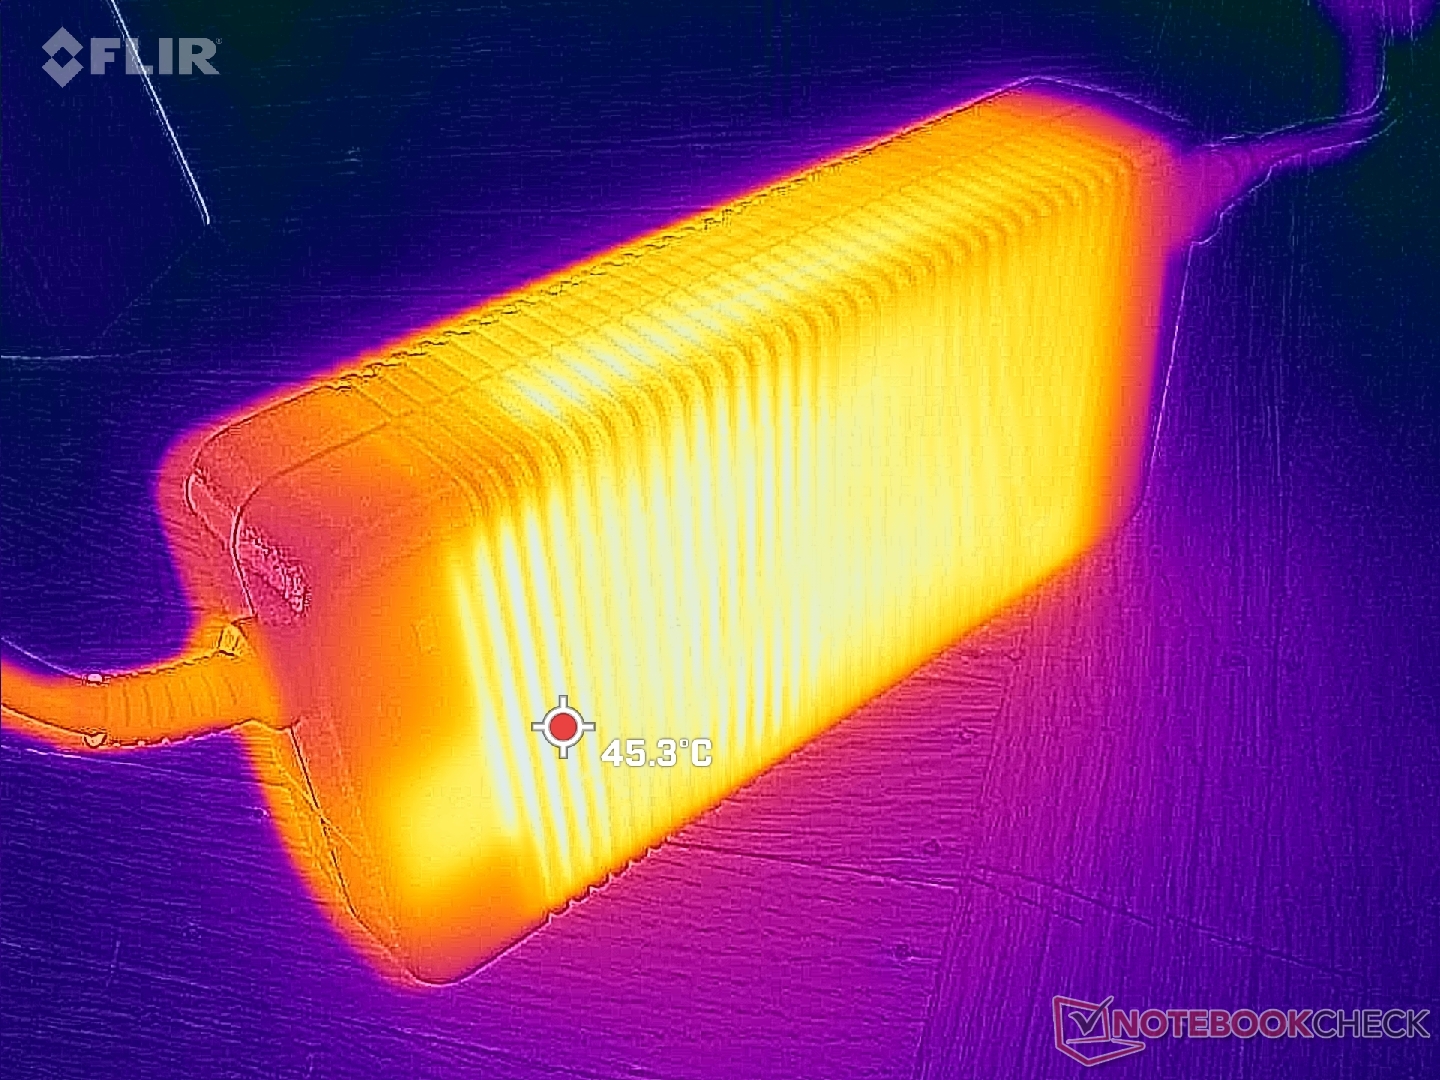
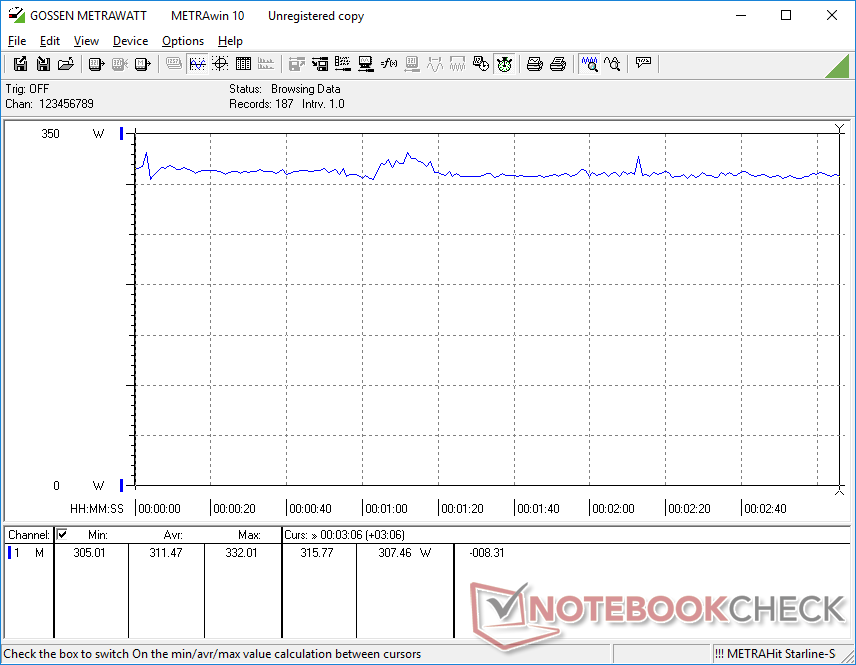
L'utilisation du mode Witcher 3 pour représenter des charges de jeu typiques consomme 311 W, soit plus de 50 W de plus que l'Alienware x17 R2 équipé de la RTX 3080 Ti de l'année dernière Alienware x17 R2. Ainsi, bien que les performances soient plus élevées d'une génération à l'autre, les utilisateurs devront payer pour cela des factures d'électricité plus élevées à cause d'un CPU plus exigeant.
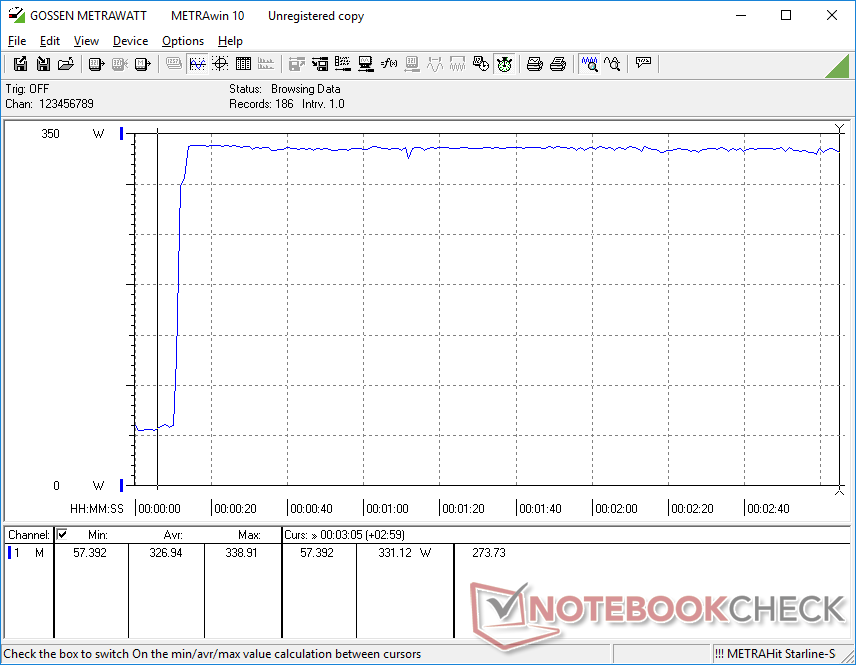
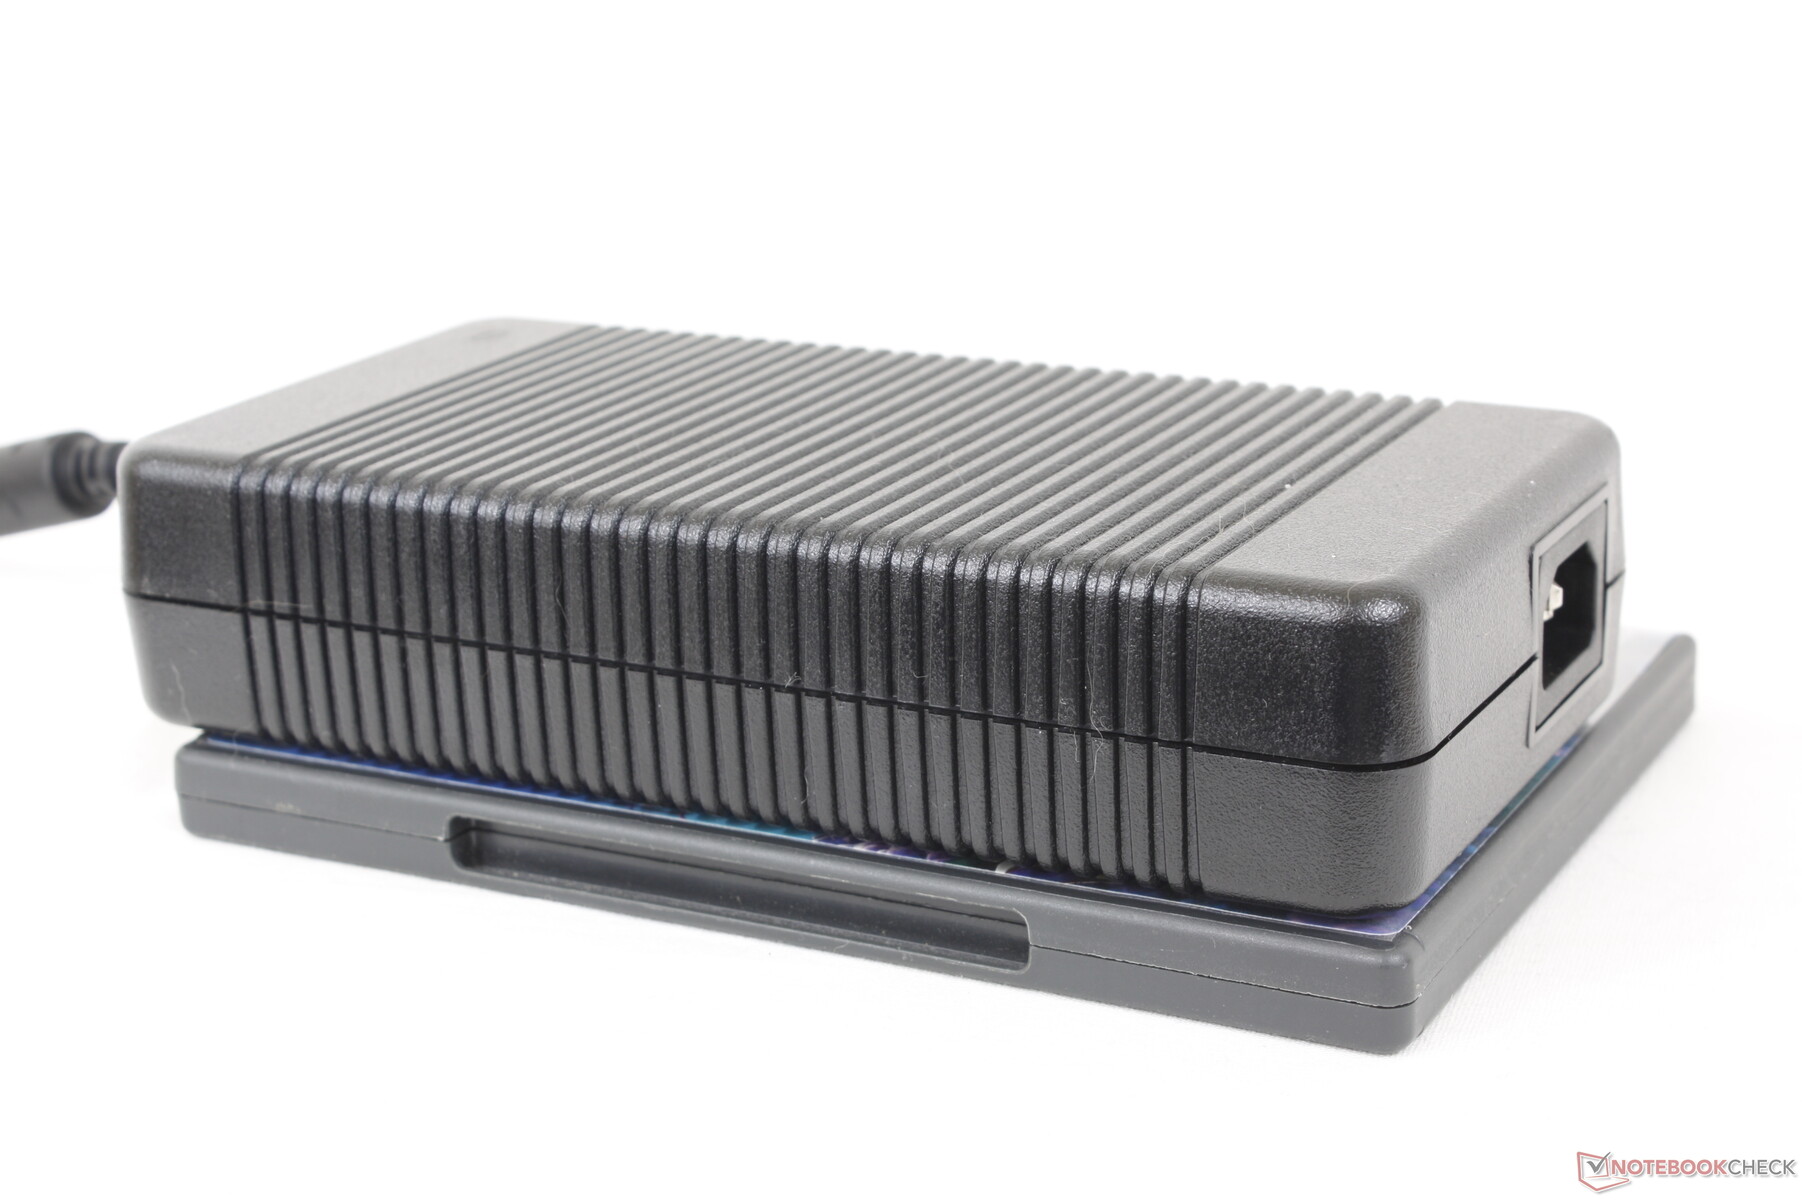
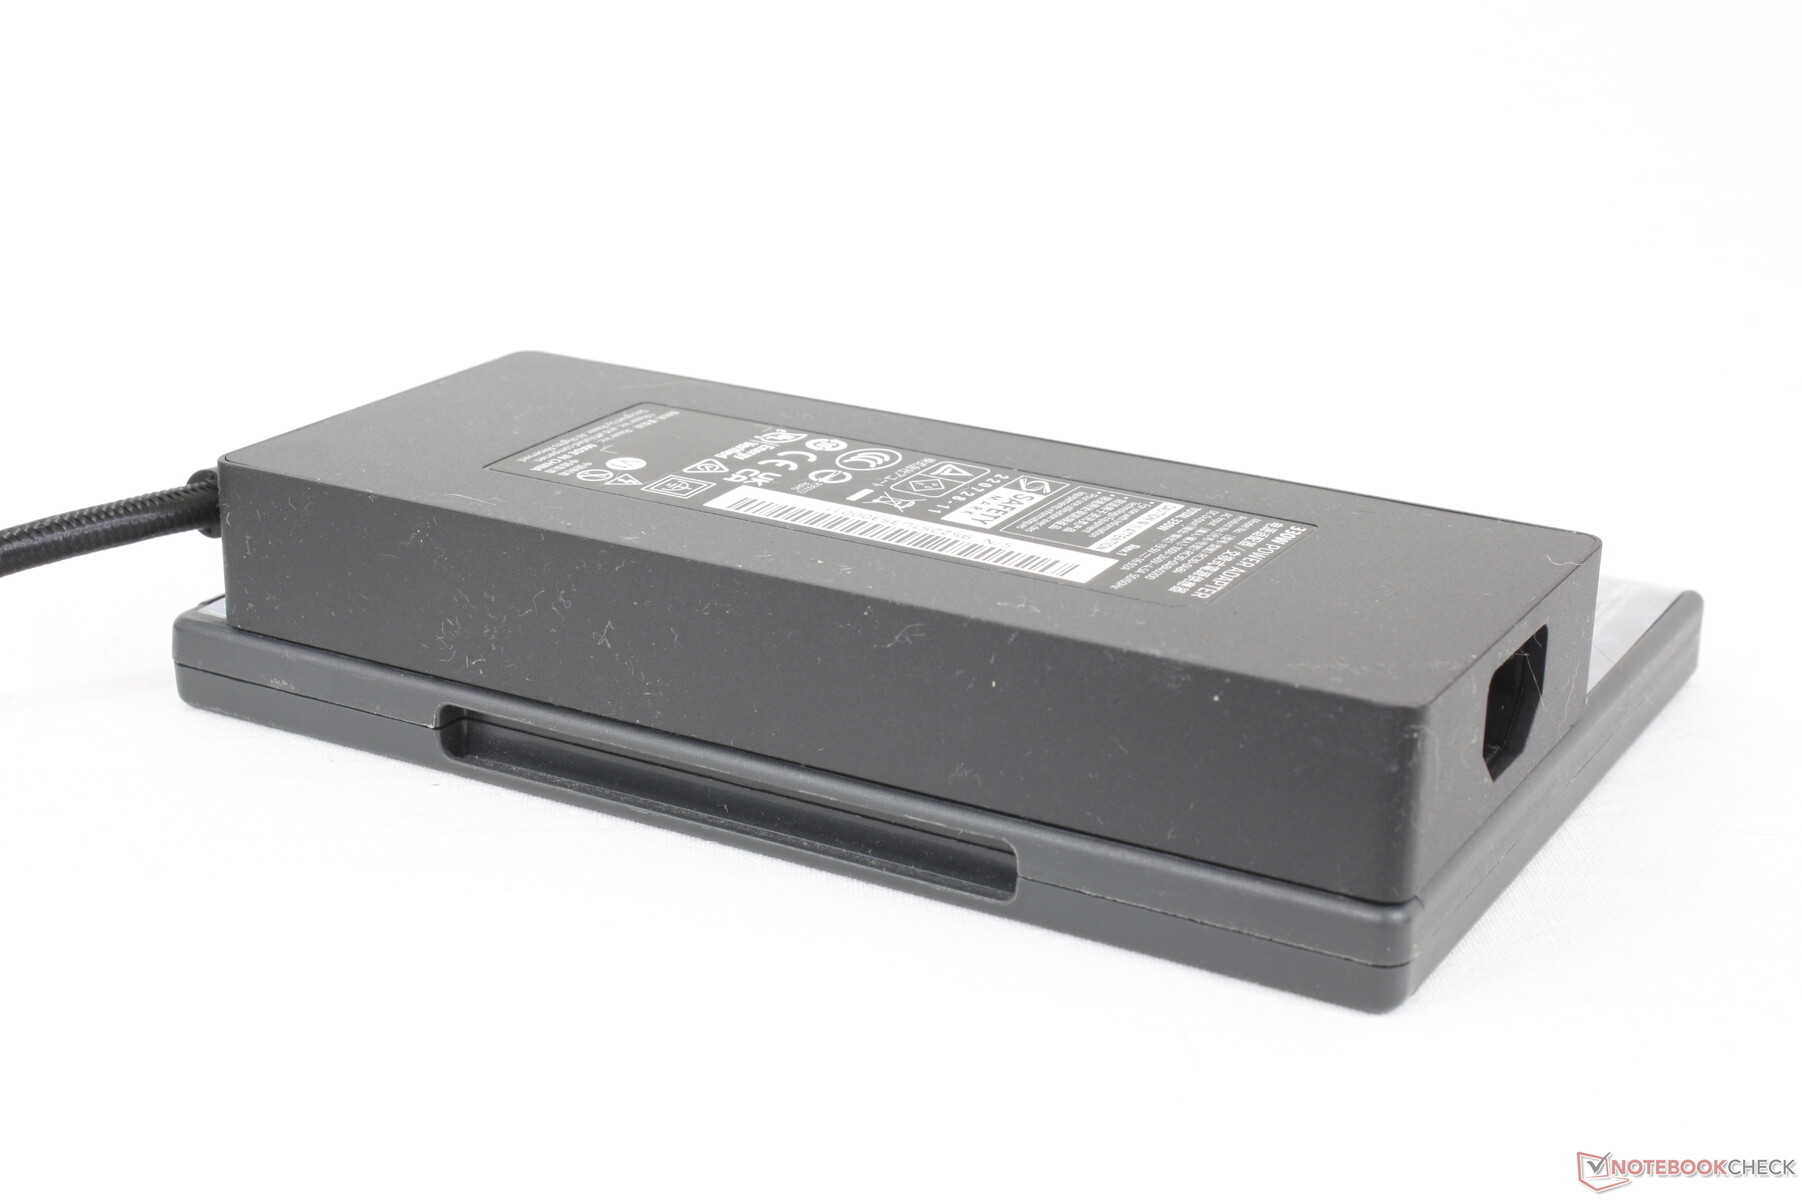
Nous avons enregistré une consommation maximale de 339 W lorsque le CPU et le GPU sont utilisés à 100 %. L'adaptateur secteur volumineux (~19,5 x 9,8 x 4 cm) est conçu pour une puissance de 330 W. Notre appareil entièrement configuré tire donc le maximum de la puissance disponible. N'oubliez pas que le taux de charge de la batterie de l'ordinateur portable ralentit lorsque vous jouez. En fait, nous pouvons observer que notre batterie passe de 100 % à 91 % lors de l'exécution simultanée de charges extrêmement exigeantes telles que Prime95 et FurMark.
| Éteint/en veille | |
| Au repos | |
| Fortement sollicité |
|
Légende:
min: | |
| Alienware m18 R1 i9-13980HX, GeForce RTX 4090 Laptop GPU, SK hynix PC801 HFS001TEJ9X101N, IPS, 1920x1200, 18" | Razer Blade 18 RTX 4070 i9-13950HX, GeForce RTX 4070 Laptop GPU, SSSTC CA6-8D1024, IPS, 2560x1600, 18" | Asus ROG Strix Scar 18 2023 G834JY-N6005W i9-13980HX, GeForce RTX 4090 Laptop GPU, 2x Samsung PM9A1 MZVL21T0HCLR (RAID 0), IPS, 2560x1600, 18" | MSI GE78HX 13VH-070US i9-13950HX, GeForce RTX 4080 Laptop GPU, Samsung PM9A1 MZVL22T0HBLB, IPS, 2560x1600, 17" | Eluktronics Mech-17 GP2 i9-13900HX, GeForce RTX 4090 Laptop GPU, Samsung PM9A1 MZVL21T0HCLR, IPS, 2560x1600, 17" | MSI Titan GT77 HX 13VI i9-13950HX, GeForce RTX 4090 Laptop GPU, Samsung PM9A1 MZVL22T0HBLB, Mini-LED, 3840x2160, 17.3" | |
|---|---|---|---|---|---|---|
| Power Consumption | 7% | 11% | 20% | 21% | 20% | |
| Idle Minimum * (Watt) | 21.6 | 24.5 -13% | 17.3 20% | 16.1 25% | 14 35% | 14 35% |
| Idle Average * (Watt) | 25.2 | 34.1 -35% | 27 -7% | 24 5% | 19.3 23% | 21.6 14% |
| Idle Maximum * (Watt) | 56.7 | 47.7 16% | 46 19% | 34 40% | 36.8 35% | 24.8 56% |
| Load Average * (Watt) | 164.1 | 140 15% | 133 19% | 123.6 25% | 117.2 29% | 122.5 25% |
| Witcher 3 ultra * (Watt) | 311 | 202 35% | 286 8% | 304 2% | 265 15% | |
| Load Maximum * (Watt) | 338.9 | 261 23% | 329 3% | 285.7 16% | 342.5 -1% | 418 -23% |
* ... Moindre est la valeur, meilleures sont les performances
Power Consumption Witcher 3 / Stresstest
Power Consumption external Monitor
Autonomie de la batterie - Pas terrible pour la taille
L'autonomie de la batterie n'a jamais été un point fort de la gamme Alienware. L'Alienware x17 R2 de l'année dernière, par exemple, ne tenait que quelques heures, même en naviguant sur le web. L'Alienware m18 intègre une batterie de plus grande capacité (97 Wh contre 87 Wh) avec une meilleure gestion de l'énergie pour des durées de navigation nettement plus longues, de l'ordre de 4 heures. Ce n'est certainement pas aussi long qu'un Ultrabook typique, mais ce n'est pas mal pour un ordinateur portable de jeu de cette taille.
Le chargement de la batterie vide à la batterie pleine prend environ 2 heures avec l'adaptateur secteur fourni. Les chargeurs USB-C ne sont pas pris en charge, ce qui est dommage car cela signifie que vous êtes lié à l'énorme adaptateur secteur de 330 W où que vous alliez.
| Alienware m18 R1 i9-13980HX, GeForce RTX 4090 Laptop GPU, 97 Wh | Razer Blade 18 RTX 4070 i9-13950HX, GeForce RTX 4070 Laptop GPU, 91.7 Wh | Asus ROG Strix Scar 18 2023 G834JY-N6005W i9-13980HX, GeForce RTX 4090 Laptop GPU, 90 Wh | Eluktronics Mech-17 GP2 i9-13900HX, GeForce RTX 4090 Laptop GPU, 99 Wh | MSI Titan GT77 HX 13VI i9-13950HX, GeForce RTX 4090 Laptop GPU, 99.9 Wh | Alienware x17 R2 P48E i9-12900HK, GeForce RTX 3080 Ti Laptop GPU, 87 Wh | |
|---|---|---|---|---|---|---|
| Autonomie de la batterie | 35% | 47% | 19% | 62% | -23% | |
| Reader / Idle (h) | 5.6 | 7 25% | 3.9 -30% | |||
| WiFi v1.3 (h) | 4.3 | 4 -7% | 7.1 65% | 5.1 19% | 5.3 23% | 2 -53% |
| Load (h) | 0.7 | 1.3 86% | 0.9 29% | 1.4 100% | 0.8 14% | |
| H.264 (h) | 7 | 6 | ||||
| Witcher 3 ultra (h) | 0.9 |
Points positifs
Points négatifs
Verdict - Neuf livres de puissance pure
Les ordinateurs portables Alienware ont toujours eu cette mentalité de "performance à tout prix" et l'Alienware m18 R1 ne fait pas exception. Cette machine n'a pas peur d'être l'un des ordinateurs portables les plus grands, les plus lourds ou même les plus bruyants du marché si cela signifie qu'elle peut tirer un peu plus de performances du CPU et du GPU ou incorporer plus de fonctionnalités que les joueurs zélés pourraient apprécier. Les utilisateurs qui ont l'intention d'exploiter les 4 SSD M.2, les nombreuses options de ports, le pavé numérique intégré et le taux de rafraîchissement de 480 Hz, et qui n'ont pas peur du poids encombrant ou de l'énorme adaptateur secteur, auront beaucoup plus à apprécier sur l'Alienware m18 R1.
Si vous voulez maximiser les performances et les fonctionnalités, même si cela signifie un ordinateur portable beaucoup plus lourd et plus grand, alors l'Alienware m18 R1 est fait pour vous.
Si les caractéristiques auxiliaires ci-dessus ne vous intéressent pas, vous pouvez obtenir pratiquement les mêmes performances de base avec le Razer Blade 18 R1, nettement plus léger Razer Blade 18 ou Asus ROG Strix 18. Nous aimerions également que le nouveau logiciel Alienware Command Center soit amélioré, car il se charge parfois très lentement.
Prix et disponibilité
L'Alienware m18 R1 est maintenant expédié directement par Dell à partir de $2100 USD pour la configuration Core i7/RTX 4060 jusqu'à plus de $5000 USD s'il est entièrement configuré. Le modèle que nous avons testé se vend aux alentours de $3700 USD. Le modèle n'est pas encore disponible chez les principaux détaillants au moment où nous écrivons ces lignes.
Alienware m18 R1
- 04/01/2023 v7 (old)
Allen Ngo
Transparency
La sélection des appareils à examiner est effectuée par notre équipe éditoriale. L'échantillon de test a été prêté à l'auteur par le fabricant ou le détaillant pour les besoins de cet examen. Le prêteur n'a pas eu d'influence sur cette évaluation et le fabricant n'a pas reçu de copie de cette évaluation avant sa publication. Il n'y avait aucune obligation de publier cet article. En tant que média indépendant, Notebookcheck n'est pas soumis à l'autorité des fabricants, des détaillants ou des éditeurs.
Voici comment Notebookcheck teste
Chaque année, Notebookcheck examine de manière indépendante des centaines d'ordinateurs portables et de smartphones en utilisant des procédures standardisées afin de garantir que tous les résultats sont comparables. Nous avons continuellement développé nos méthodes de test depuis environ 20 ans et avons établi des normes industrielles dans le processus. Dans nos laboratoires de test, des équipements de mesure de haute qualité sont utilisés par des techniciens et des rédacteurs expérimentés. Ces tests impliquent un processus de validation en plusieurs étapes. Notre système d'évaluation complexe repose sur des centaines de mesures et de points de référence bien fondés, ce qui garantit l'objectivité.Price comparison

