Test de l'Acer Predator Triton Neo 16 : PC portable haut de gamme RTX 4070 pour joueurs et créatifs
Un écran brillant.
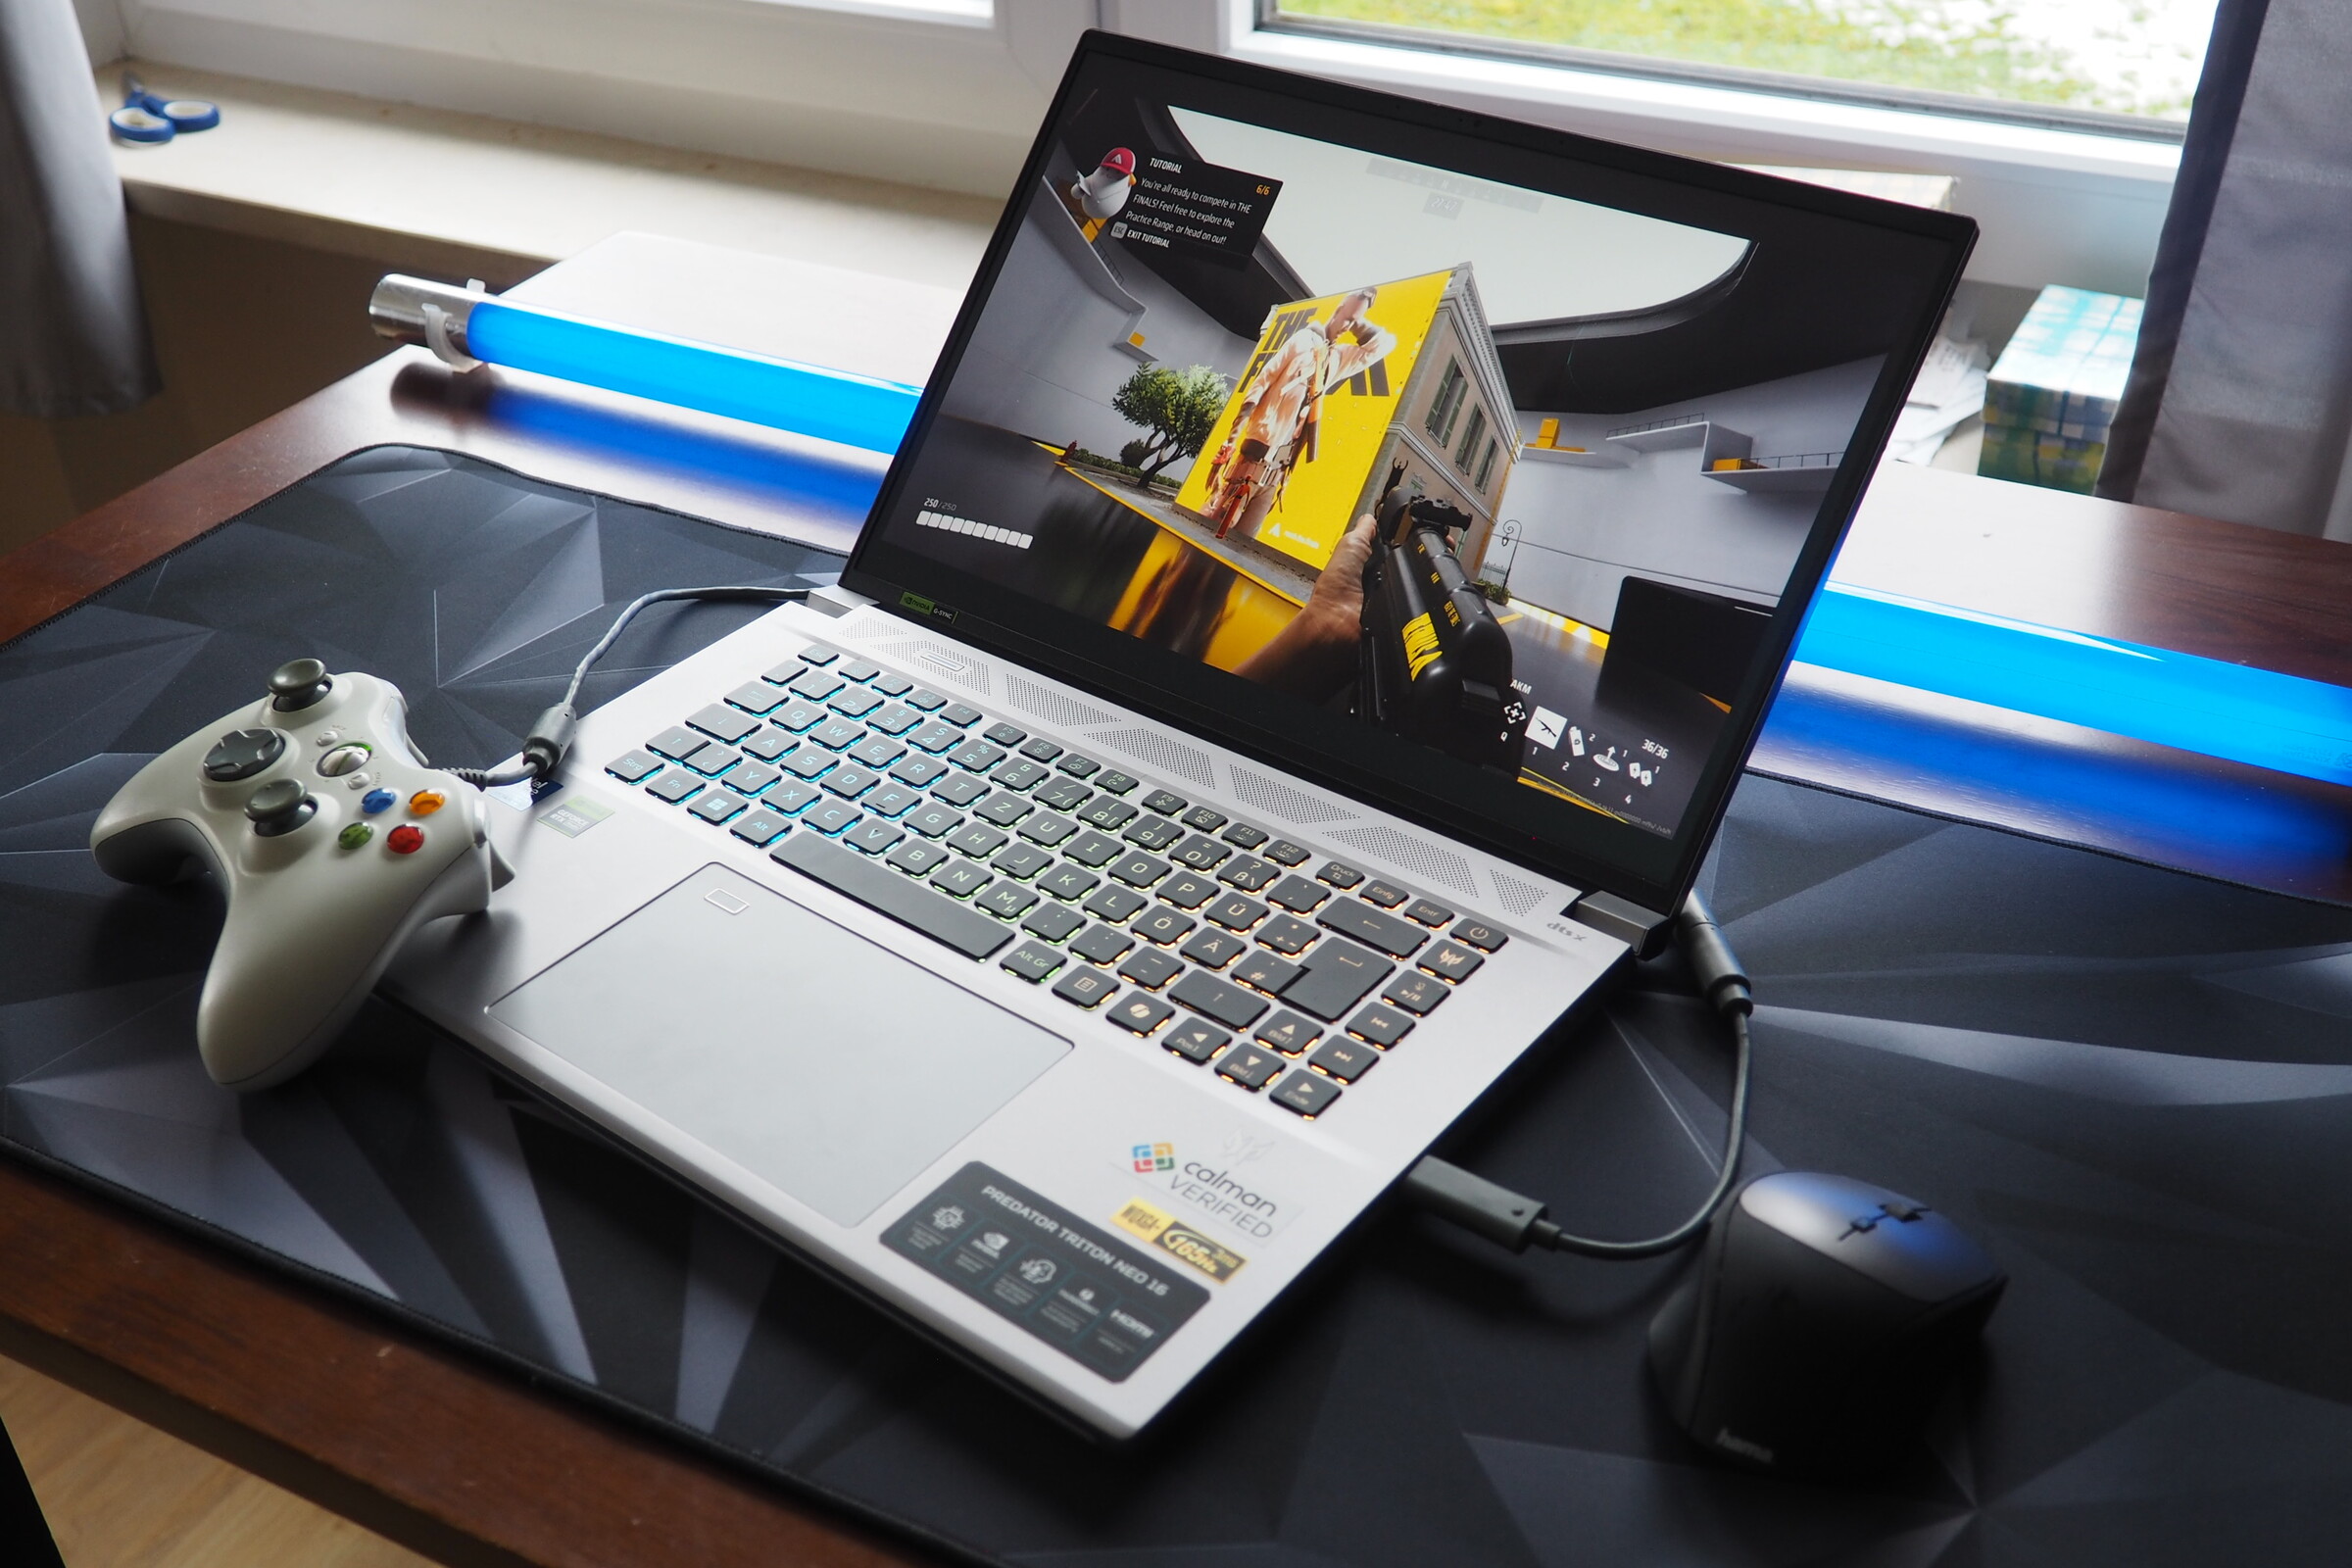
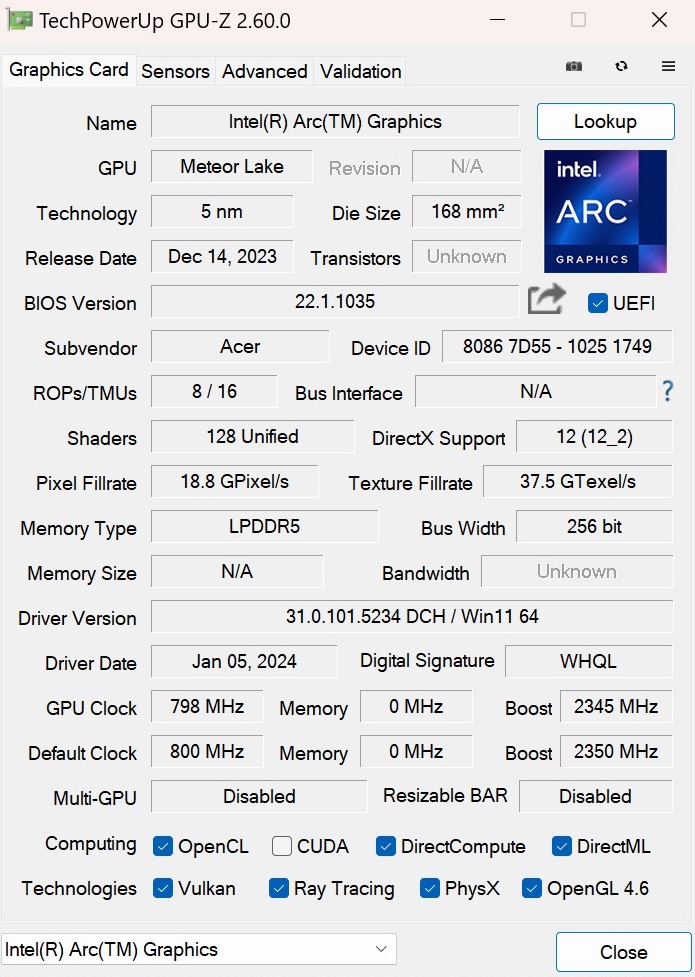
Alors que le Nitro V 16 que nous avons testé récemment ne nous a impressionné que de façon limitée en raison de son affichage médiocre, le Predator Triton Neo 16 fait bien meilleure figure. Nous avons mis à l'épreuve ce gamer de 16 pouces équipé d'un processeur Meteor Lake et d'une GeForce RTX 4070.Florian Glaser, 👁 Florian Glaser (traduit par DeepL / Ninh Duy) Publié 🇺🇸 🇩🇪 ...
Verdict - Le plaisir des yeux d'Acer
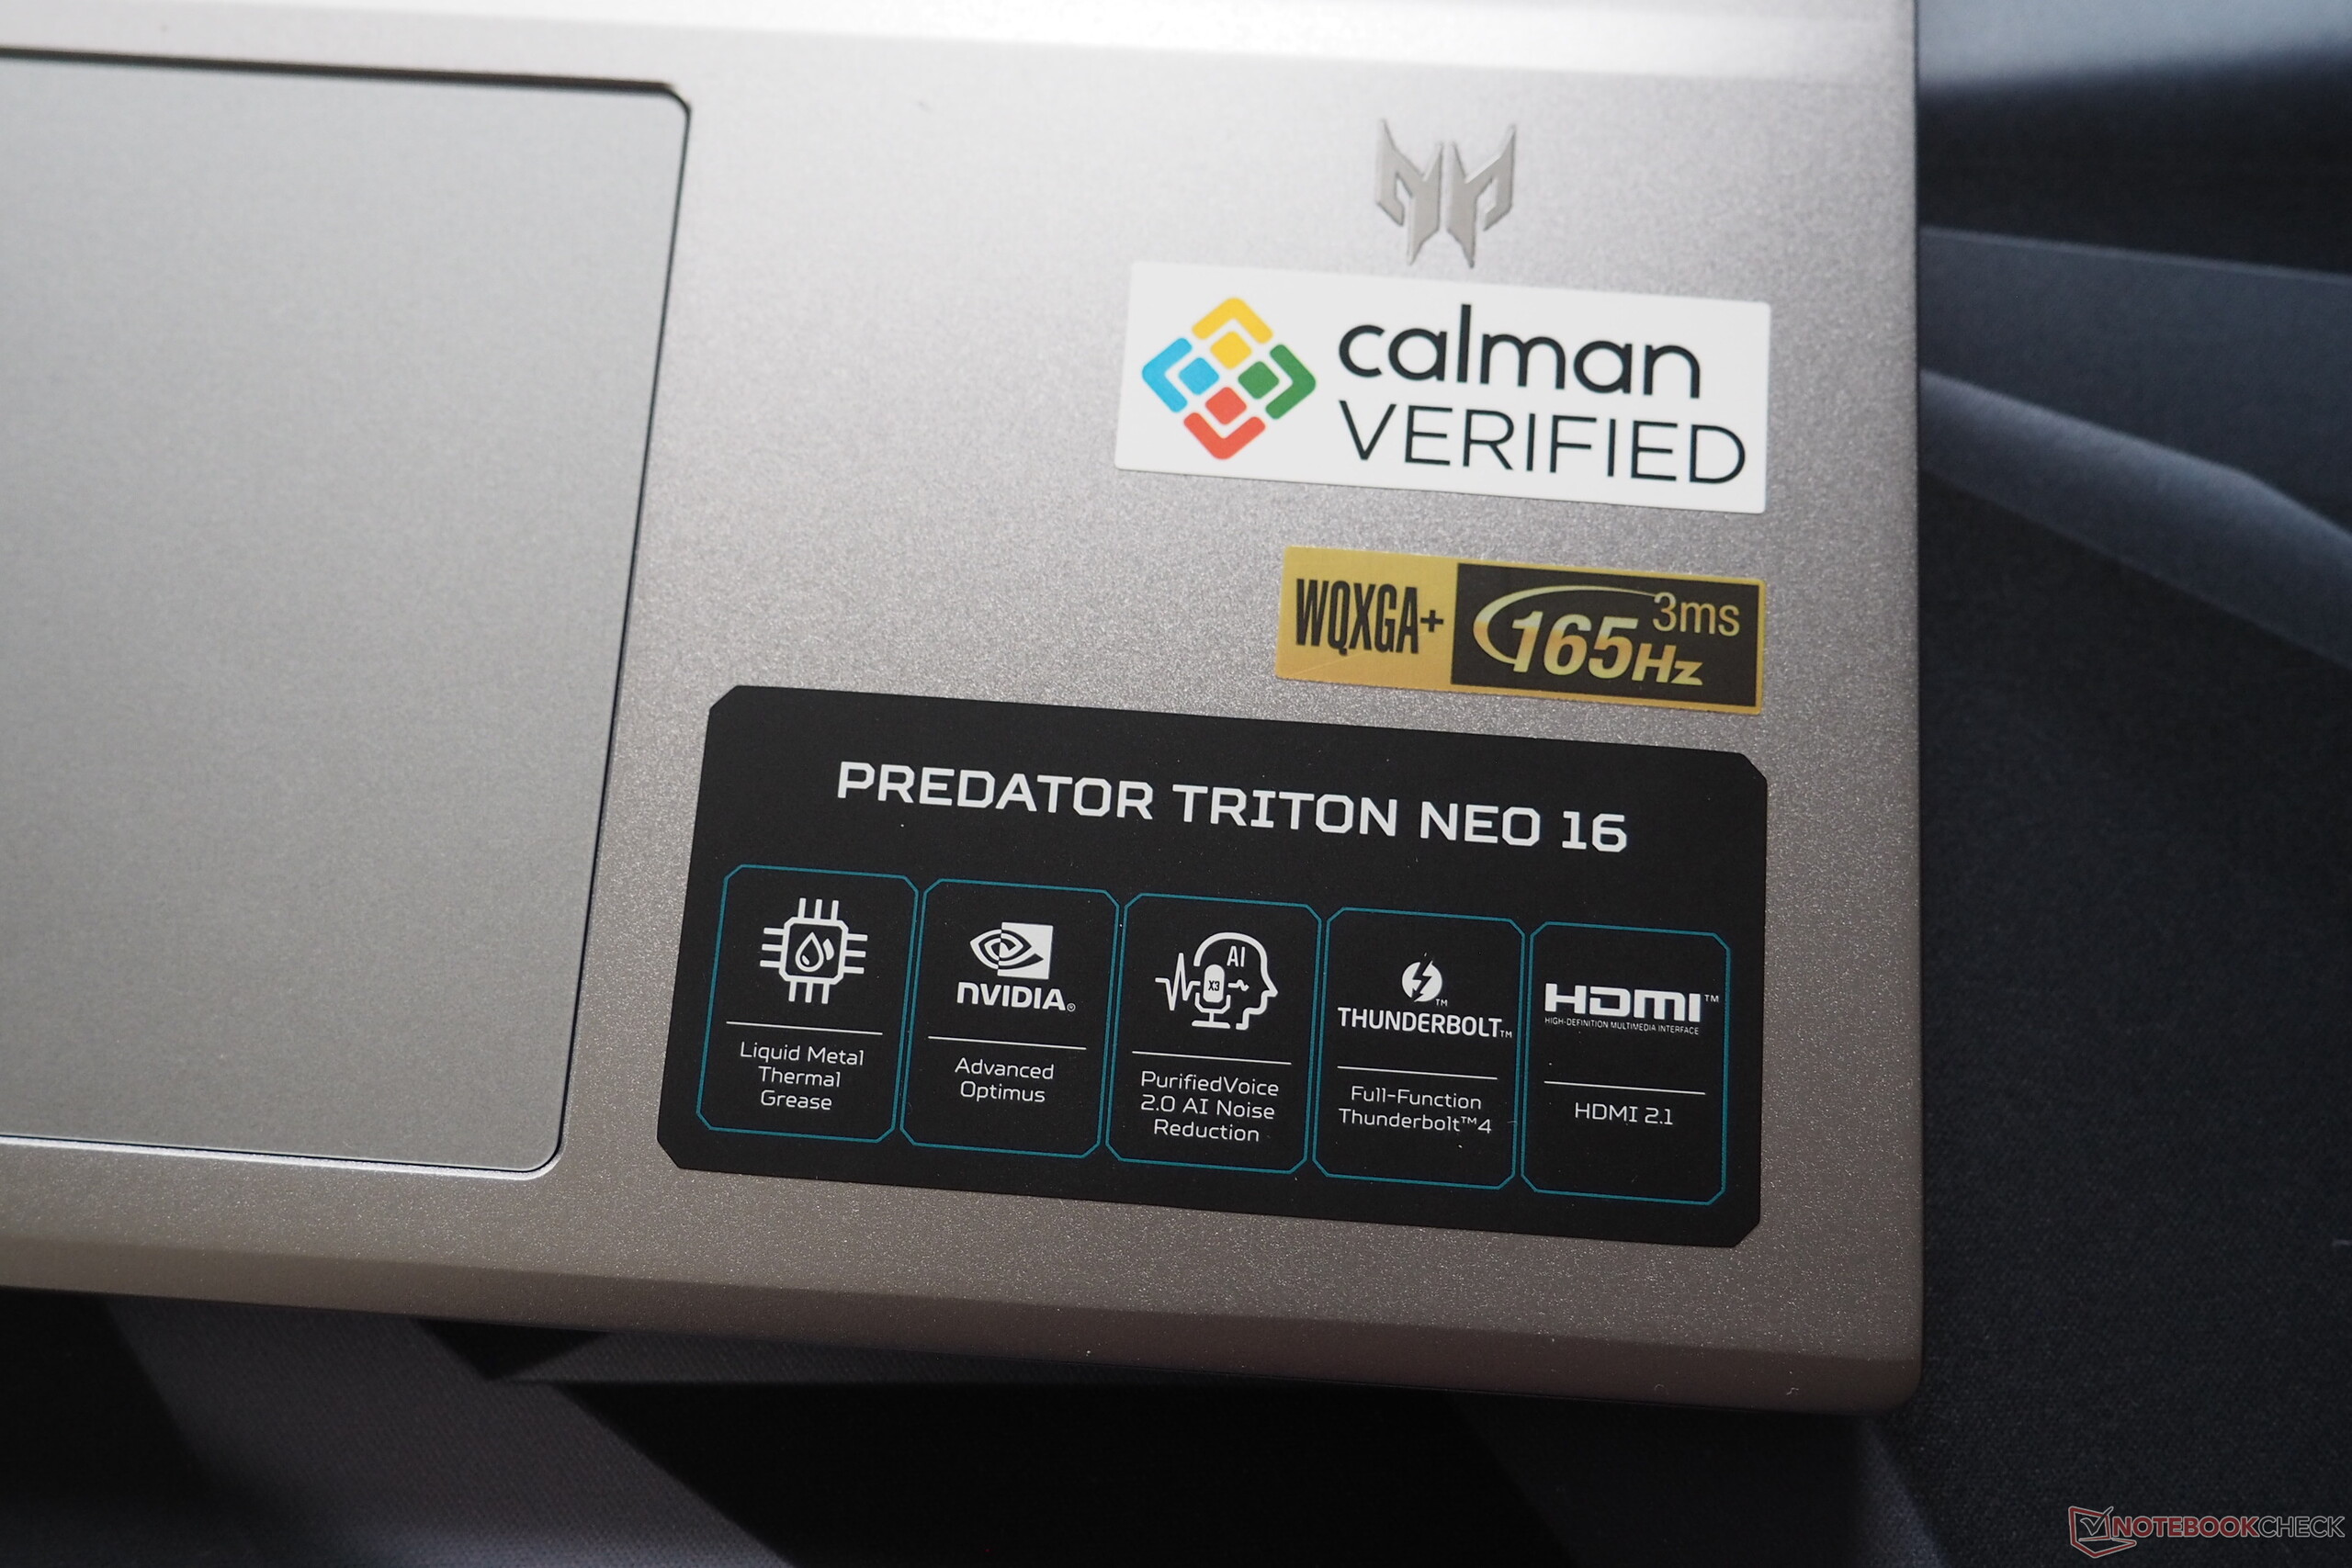
Si vous êtes à la recherche d'un ordinateur portable de jeu et de création élégant et de haute qualité, le Predator Triton Neo 16 pourrait bien être celui qu'il vous faut. Acer n'a pas seulement donné à cet appareil de 16 pouces un nom absurdement long, mais aussi un boîtier métallique stable dont les surfaces gris argent n'attirent pratiquement pas les traces de doigts. Les options de connectivité ne sont pas en reste grâce à la prise en charge de l'USB 4. La qualité d'image du Neo 16 est également impressionnante. Son écran 165 Hz basé sur la technologie IPS offre de bons niveaux de luminosité, une haute résolution (3 200 x 2 000 pixels), une couverture généreuse de l'espace colorimétrique et, grâce à sa certification Calman, une précision des couleurs respectable.
Les performances du GPU, en revanche, ne sont pas aussi impressionnantes. La GeForce RTX 4070 ne peut développer qu'une partie limitée de ses performances potentielles et se situe en dessous de la moyenne que nous avons déterminée. De plus, il n'y a pas beaucoup d'options de maintenance et de mise à jour. Bien que l'appareil de 16 pouces dispose de deux emplacements M.2 (dont l'un est encore libre), sa RAM a été soudée - alors que les 32 Go dont dispose notre appareil de test devraient probablement suffire à la plupart des utilisateurs pour l'instant. Dans l'ensemble, nous considérons le Predator Triton Neo 16 comme un bon ordinateur portable de jeu et de création, mais pas exceptionnel.
La concurrence comprend d'autres appareils de 16 pouces avec une RTX 4070 tels que l'Asus ProArt P16 H7606WI, le Lenovo Yoga Pro 9 16IMH9, l'Asus ROG Zephyrus G16 GU605M et l'Alienware m16 R2, qui sont cependant généralement plus chers.
Points positifs
Points négatifs
Prix et disponibilité
Actuellement, l'Acer Predator Triton Neo 16 PTN16-51-978P est disponible auprès des principaux détaillants en ligne tels qu'Amazon, où il coûte 1 399$.
Comparaison des alternatives possibles
Image | Modèle | Prix | Poids | Épaisseur | Écran |
|---|---|---|---|---|---|
1. 81.1%  | Acer Predator Triton Neo 16 PTN16-51-978P Intel Core Ultra 9 185H ⎘ NVIDIA GeForce RTX 4070 Laptop GPU ⎘ 32 Go Mémoire, 1024 Go SSD | Amazon: Prix de liste: 1900 EUR | 2 kg | 21 mm | 16.00" 3200x2000 236 PPI IPS |
2. 87.8%  | Asus ProArt P16 H7606WI AMD Ryzen AI 9 HX 370 ⎘ NVIDIA GeForce RTX 4070 Laptop GPU ⎘ 64 Go Mémoire, 1024 Go SSD | Amazon: Prix de liste: 4000€ | 1.8 kg | 17.3 mm | 16.00" 3840x2400 283 PPI OLED |
3. 88.7% v7 (old)  | Lenovo Yoga Pro 9 16IMH9 Intel Core Ultra 9 185H ⎘ NVIDIA GeForce RTX 4070 Laptop GPU ⎘ 32 Go Mémoire, 1024 Go SSD | Amazon: Prix de liste: 2700€ | 2.1 kg | 18.3 mm | 16.00" 3200x2000 236 PPI Mini-LED |
4. 92.3% v7 (old)  | Asus ROG Zephyrus G16 2024 GU605M Intel Core Ultra 7 155H ⎘ NVIDIA GeForce RTX 4070 Laptop GPU ⎘ 16 Go Mémoire, 1024 Go SSD | Amazon: Prix de liste: 3000€ | 1.8 kg | 16.4 mm | 16.00" 2560x1600 189 PPI OLED |
5. 90.2% v7 (old)  | Alienware m16 R2 Intel Core Ultra 7 155H ⎘ NVIDIA GeForce RTX 4070 Laptop GPU ⎘ 16 Go Mémoire, 1024 Go SSD | Amazon: Prix de liste: 1850 USD | 2.5 kg | 23.5 mm | 16.00" 2560x1600 189 PPI IPS |
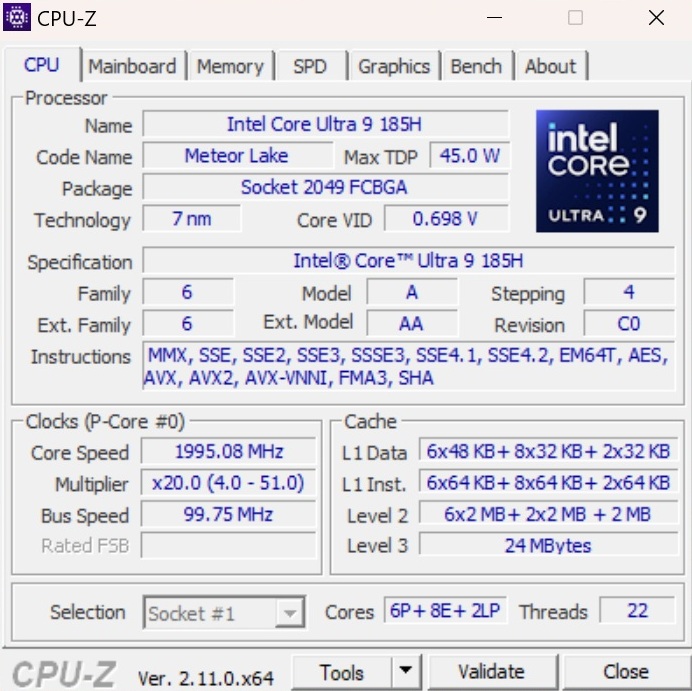
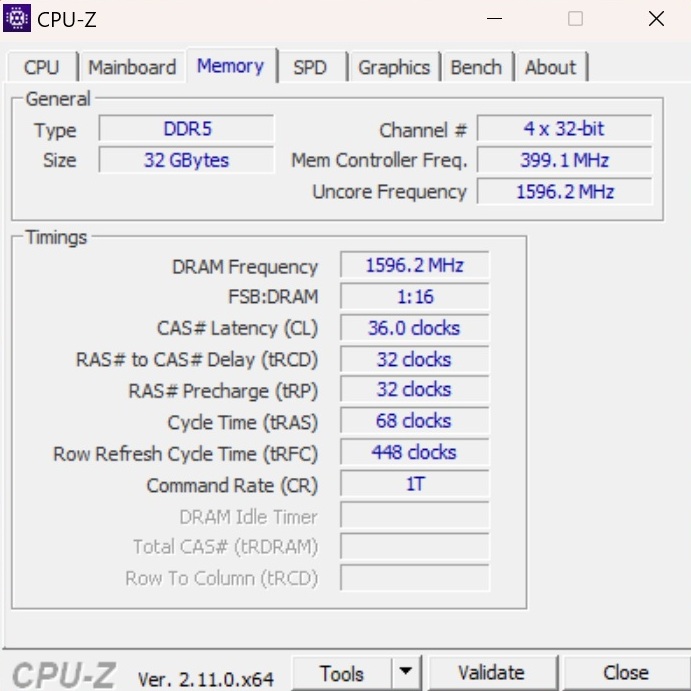
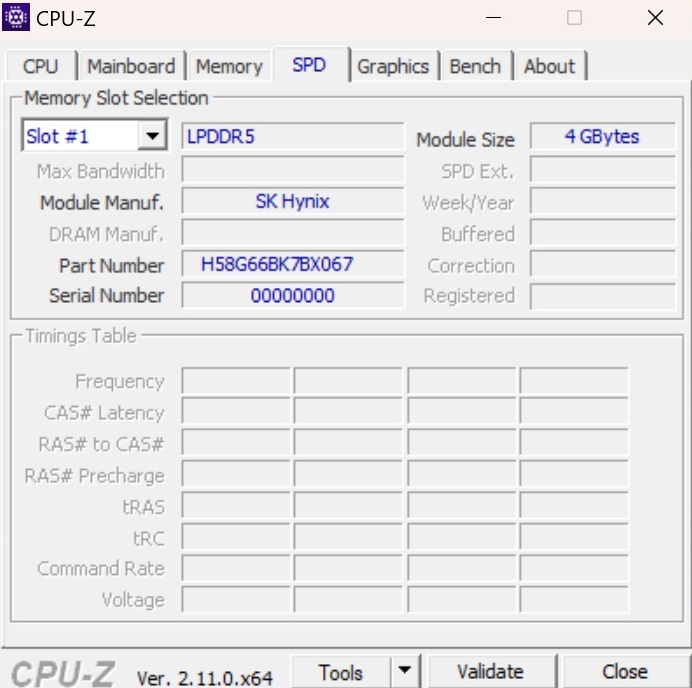
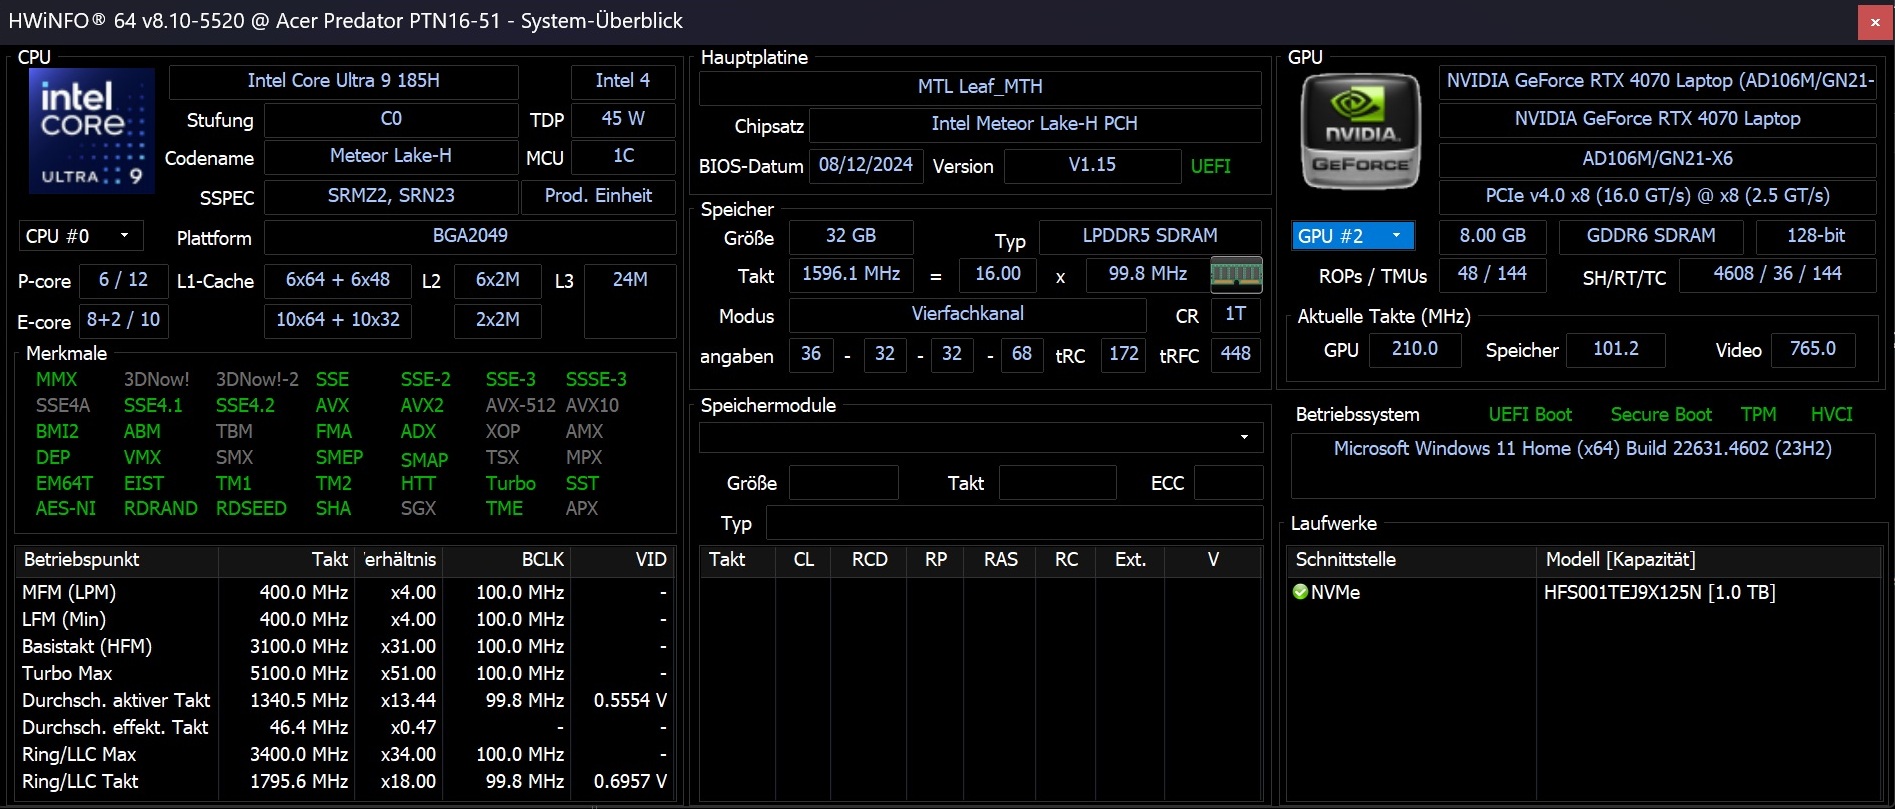
Acer a équipé notre configuration de test d'un Core Ultra 9 185H de la série Meteor Lake et, comme nous l'avons déjà mentionné, d'une GeForce RTX 4070. Il est également doté d'une impressionnante mémoire vive de 32 Go LPDDR5X. Le SSD NVMe installé a une capacité de 1 To. L'écran de l'ordinateur portable a un format 16:10 et son système d'exploitation est Windows 11 Home. La capacité de la batterie de 76 Wh n'est ni faible ni particulièrement généreuse.
Spécifications
Cas
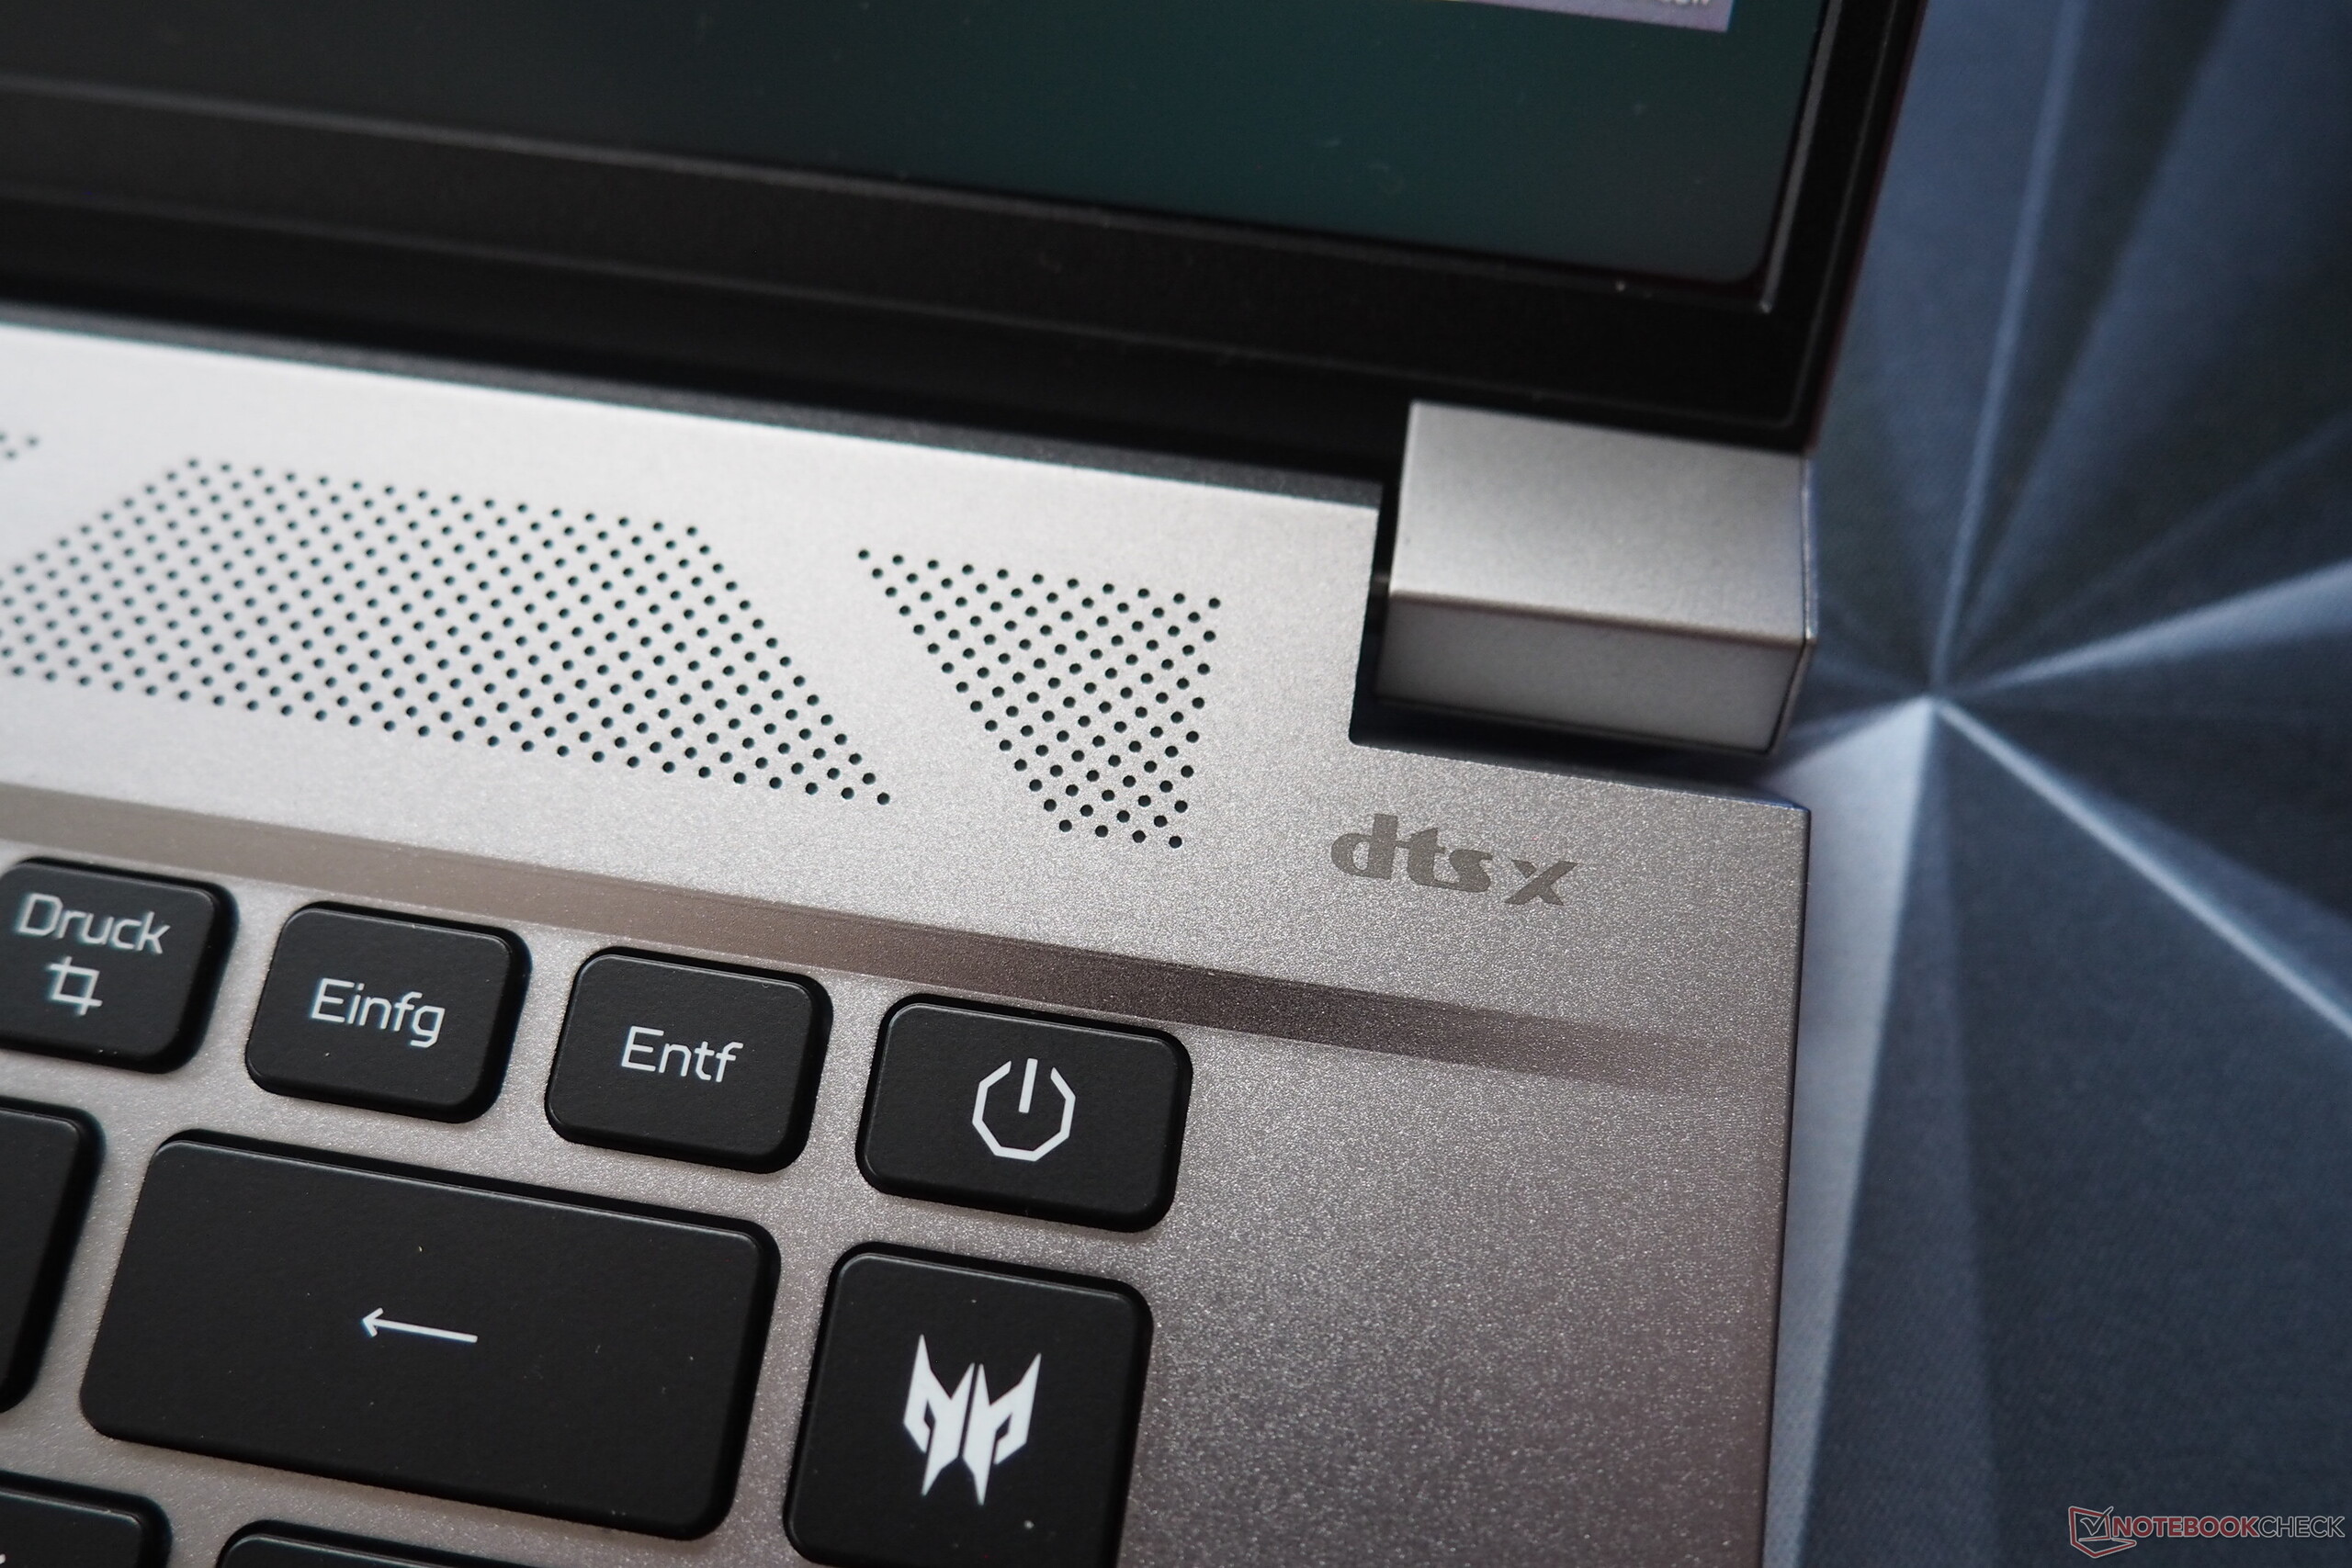
L'un des principaux atouts du Predator Triton est son boîtier élégant et esthétique. Ses surfaces métalliques laissent une impression de haute qualité et attirent à peine les traces de doigts grâce à leur couleur claire. La stabilité du boîtier est également bonne, à l'exception de quelques détails (le touchpad cède un peu par endroits). Acer mérite également des éloges pour les charnières de l'appareil qui fonctionnent bien, bien que leur angle d'ouverture maximal d'environ 135° pourrait être un peu plus large. En revanche, nous n'avons rien à redire sur la qualité de fabrication.
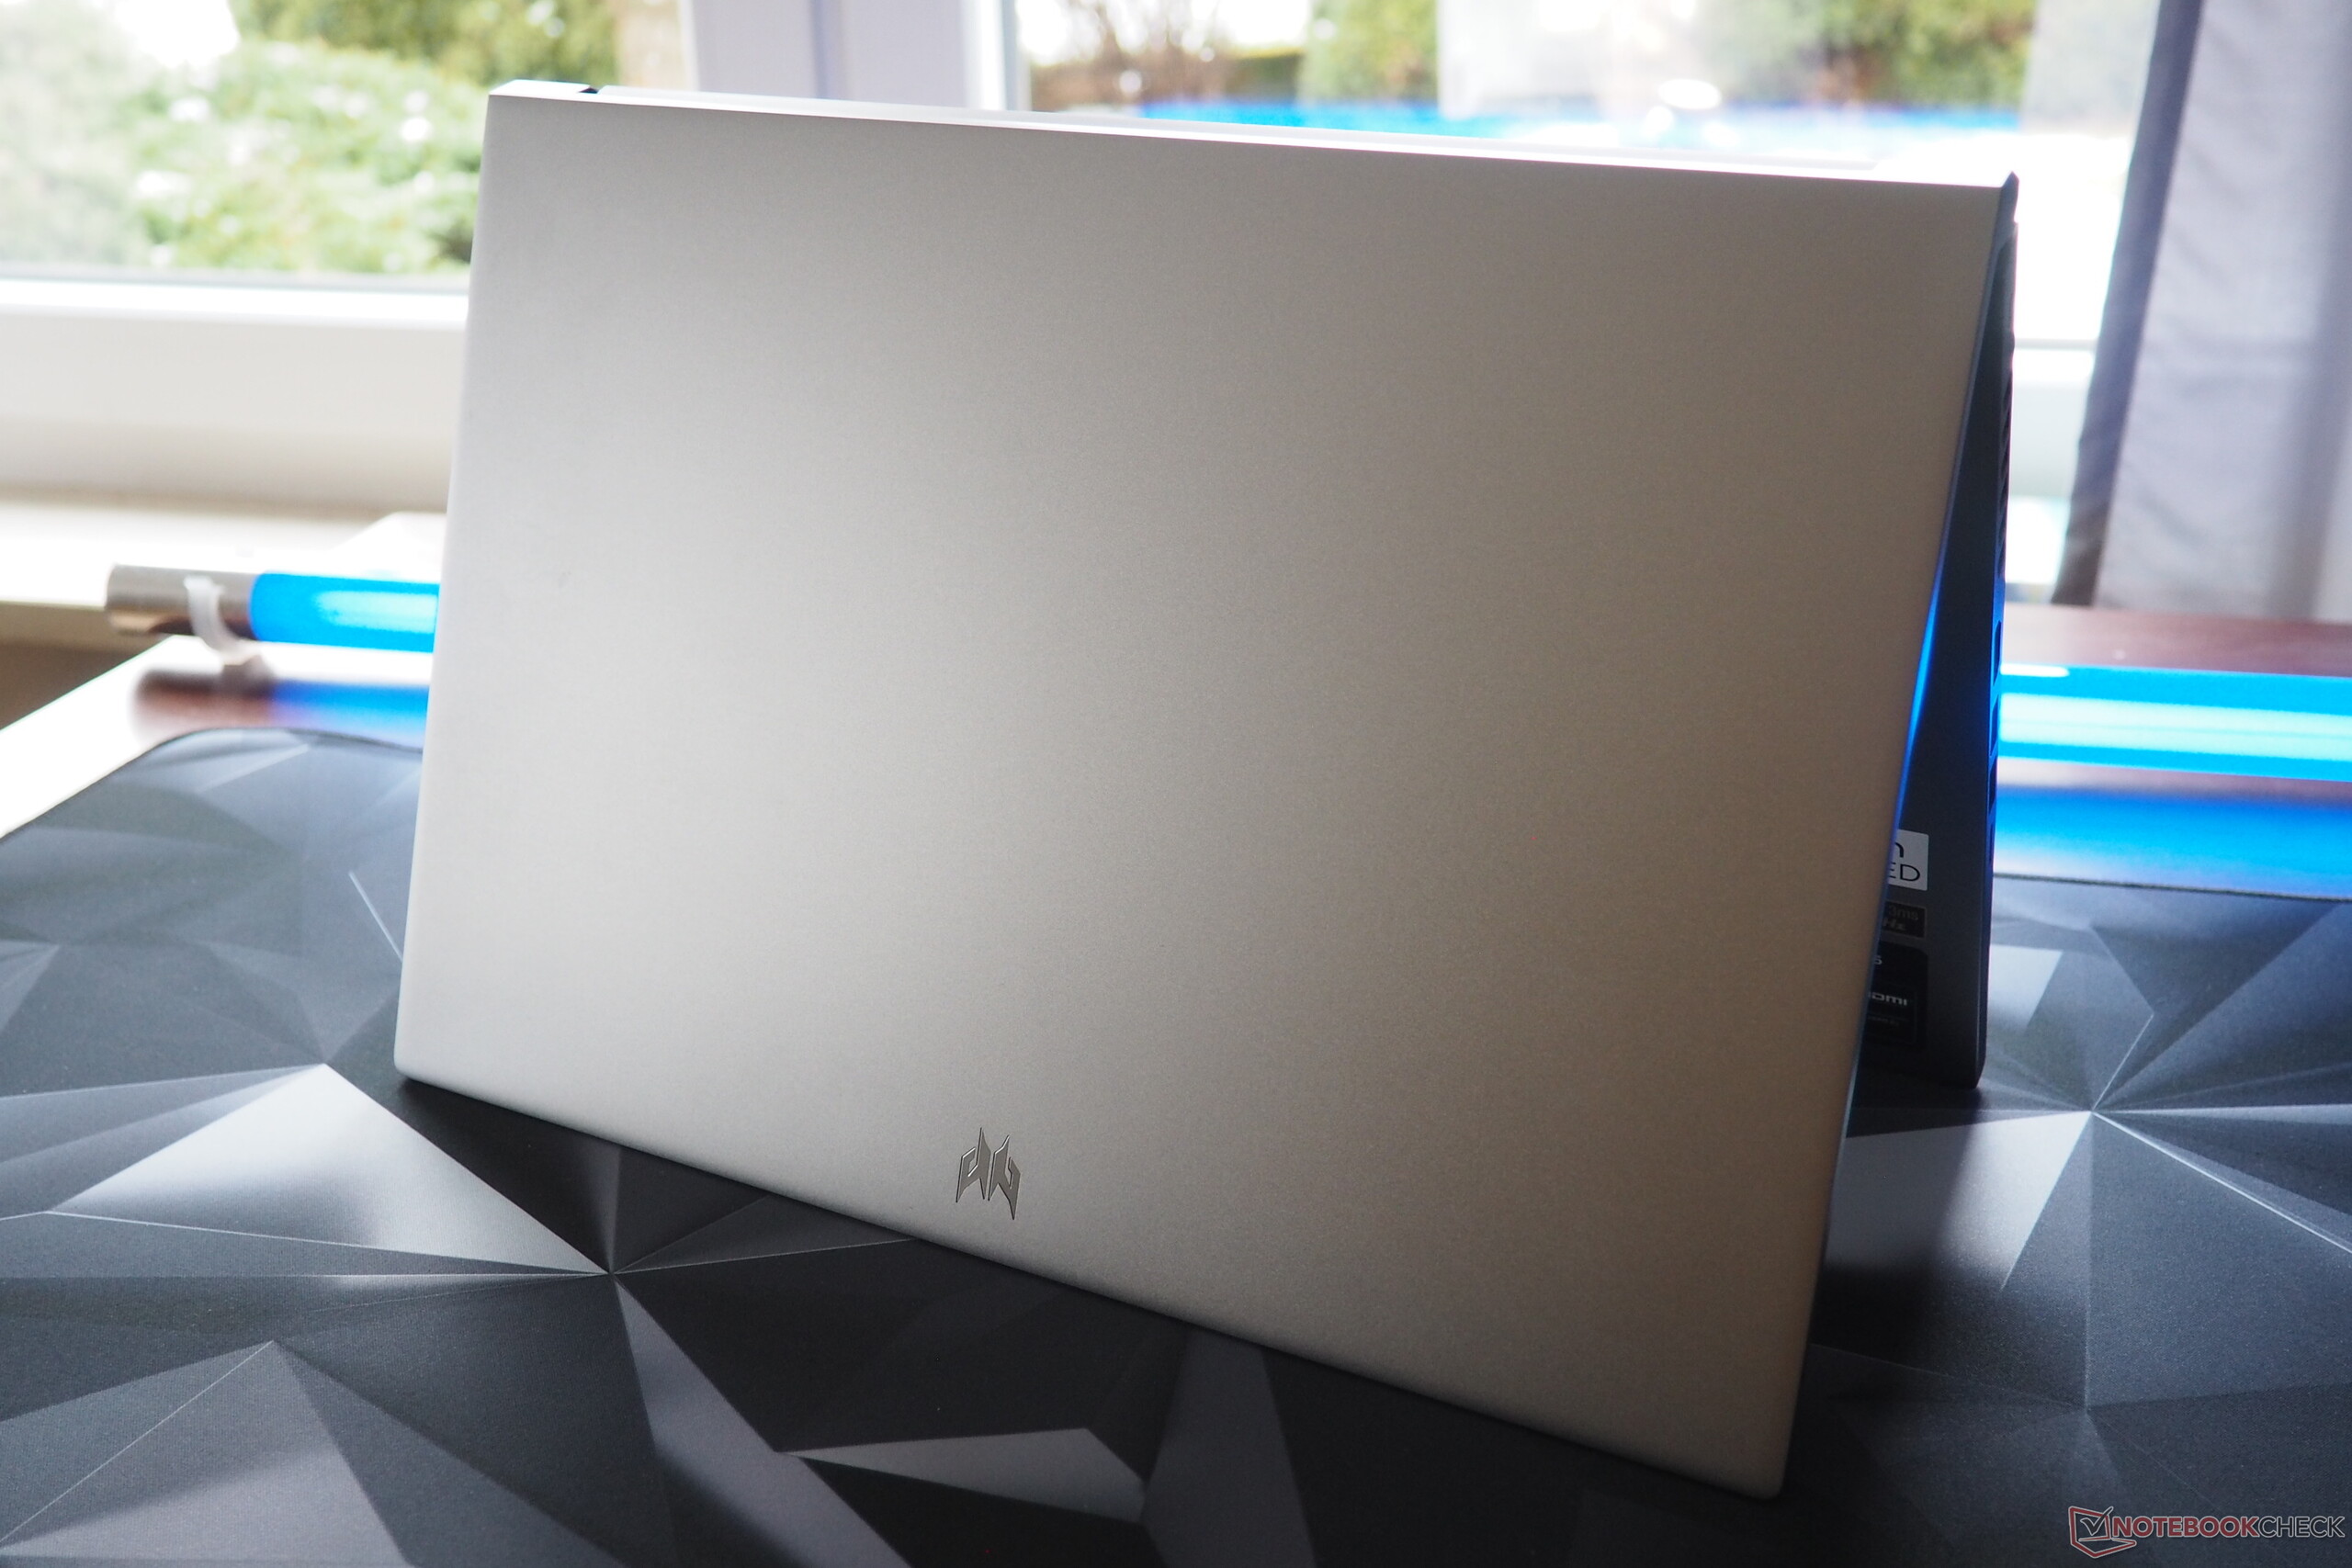

Avec un poids d'environ 2 kg, l'appareil de 16 pouces se situe entre ses concurrents, qui pèsent tous entre 1,8 et 2,5 kg. Leur hauteur et leurs dimensions de base sont similaires : ici aussi, l'ordinateur portable Acer se sent à l'aise au milieu du terrain.
Connectivité
Ports
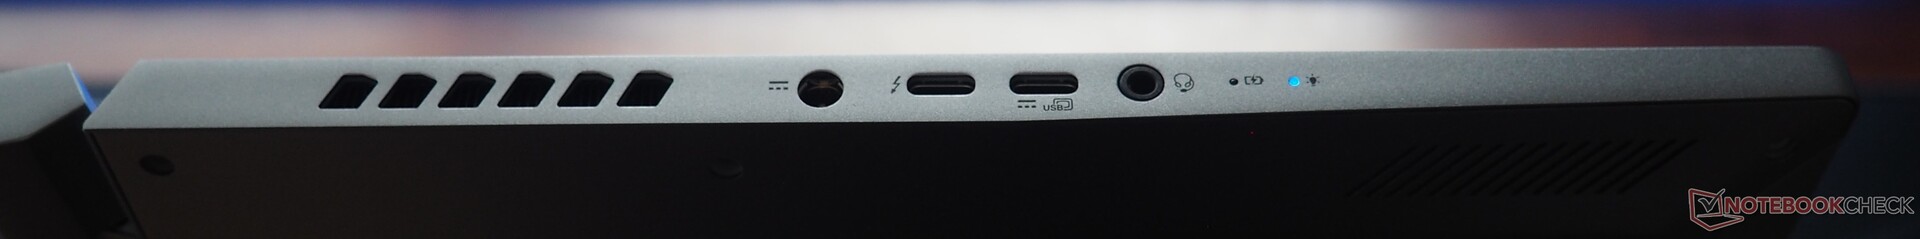
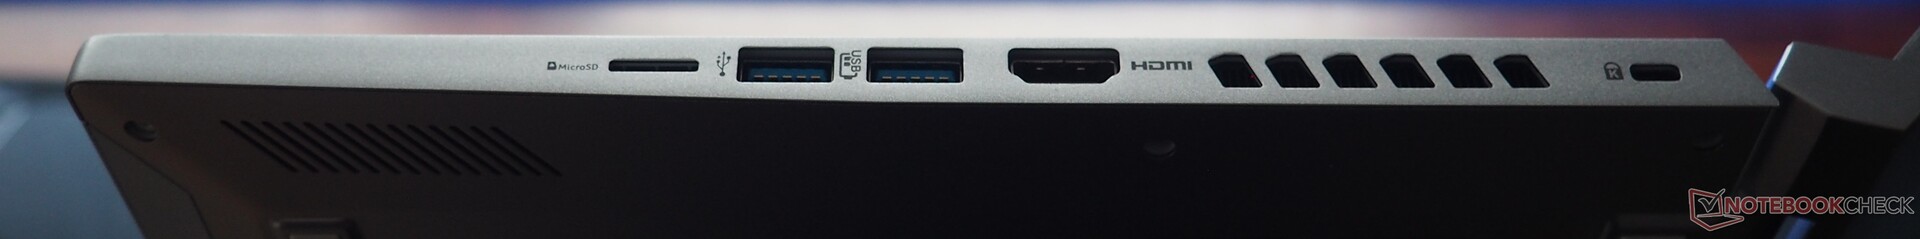
Le Neo 16 offre un large éventail de ports. Alors que le côté gauche abrite la connexion d'alimentation, une prise audio et deux ports USB-C (1x USB 4 avec DisplayPort 1.4 & PowerDelivery), le côté droit est équipé d'un lecteur de carte micro SD, de deux ports USB-A (3.1 Gen 2), de HDMI 2.1 et d'une ouverture pour les verrous Kensington. Néanmoins, Acer aurait dû ajouter un port RJ45 à l'appareil pour lui assurer une très bonne note de connectivité.
Lecteur de carte SD
Le lecteur de cartes de l'ordinateur portable a atteint des vitesses médiocres d'environ 90 Mo/s lors de notre test. Le lecteur de cartes Alienware m16 et le lecteur de carte Asus ProArt P16 ont fait beaucoup mieux en lecture séquentielle.
| SD Card Reader | |
| average JPG Copy Test (av. of 3 runs) | |
| Asus ProArt P16 H7606WI (Angelbird AV Pro V60) | |
| Moyenne de la classe Gaming (20.9 - 210, n=54, 2 dernières années) | |
| Acer Predator Triton Neo 16 PTN16-51-978P (AV PRO microSD 128 GB V60) | |
| Asus ROG Zephyrus G16 2024 GU605M | |
| Lenovo Yoga Pro 9 16IMH9 (Angelbird AV Pro V60) | |
| Alienware m16 R2 (AV PRO microSD 128 GB V60) | |
| maximum AS SSD Seq Read Test (1GB) | |
| Asus ProArt P16 H7606WI (Angelbird AV Pro V60) | |
| Alienware m16 R2 (AV PRO microSD 128 GB V60) | |
| Moyenne de la classe Gaming (25.5 - 261, n=51, 2 dernières années) | |
| Acer Predator Triton Neo 16 PTN16-51-978P (AV PRO microSD 128 GB V60) | |
| Asus ROG Zephyrus G16 2024 GU605M | |
| Lenovo Yoga Pro 9 16IMH9 (Angelbird AV Pro V60) | |
Communication
Son module sans fil porte le nom de Killer Wi-Fi 6E AX1675x et a réalisé des performances allant de solides (émission) à très bonnes (réception) lors de notre test de portée à une distance de 1 mètre du routeur de référence.
Webcam
La webcam de 2 mégapixels de l'appareil est légèrement plus nette et plus précise que celle de la plupart des ordinateurs portables de jeu, mais il ne faut pas s'attendre à des miracles. Il n'y a pas de couvercle pour plus de confidentialité.


Accessoires
L'ordinateur portable Acer est livré avec un bloc d'alimentation de 230 watts et plusieurs brochures d'information.
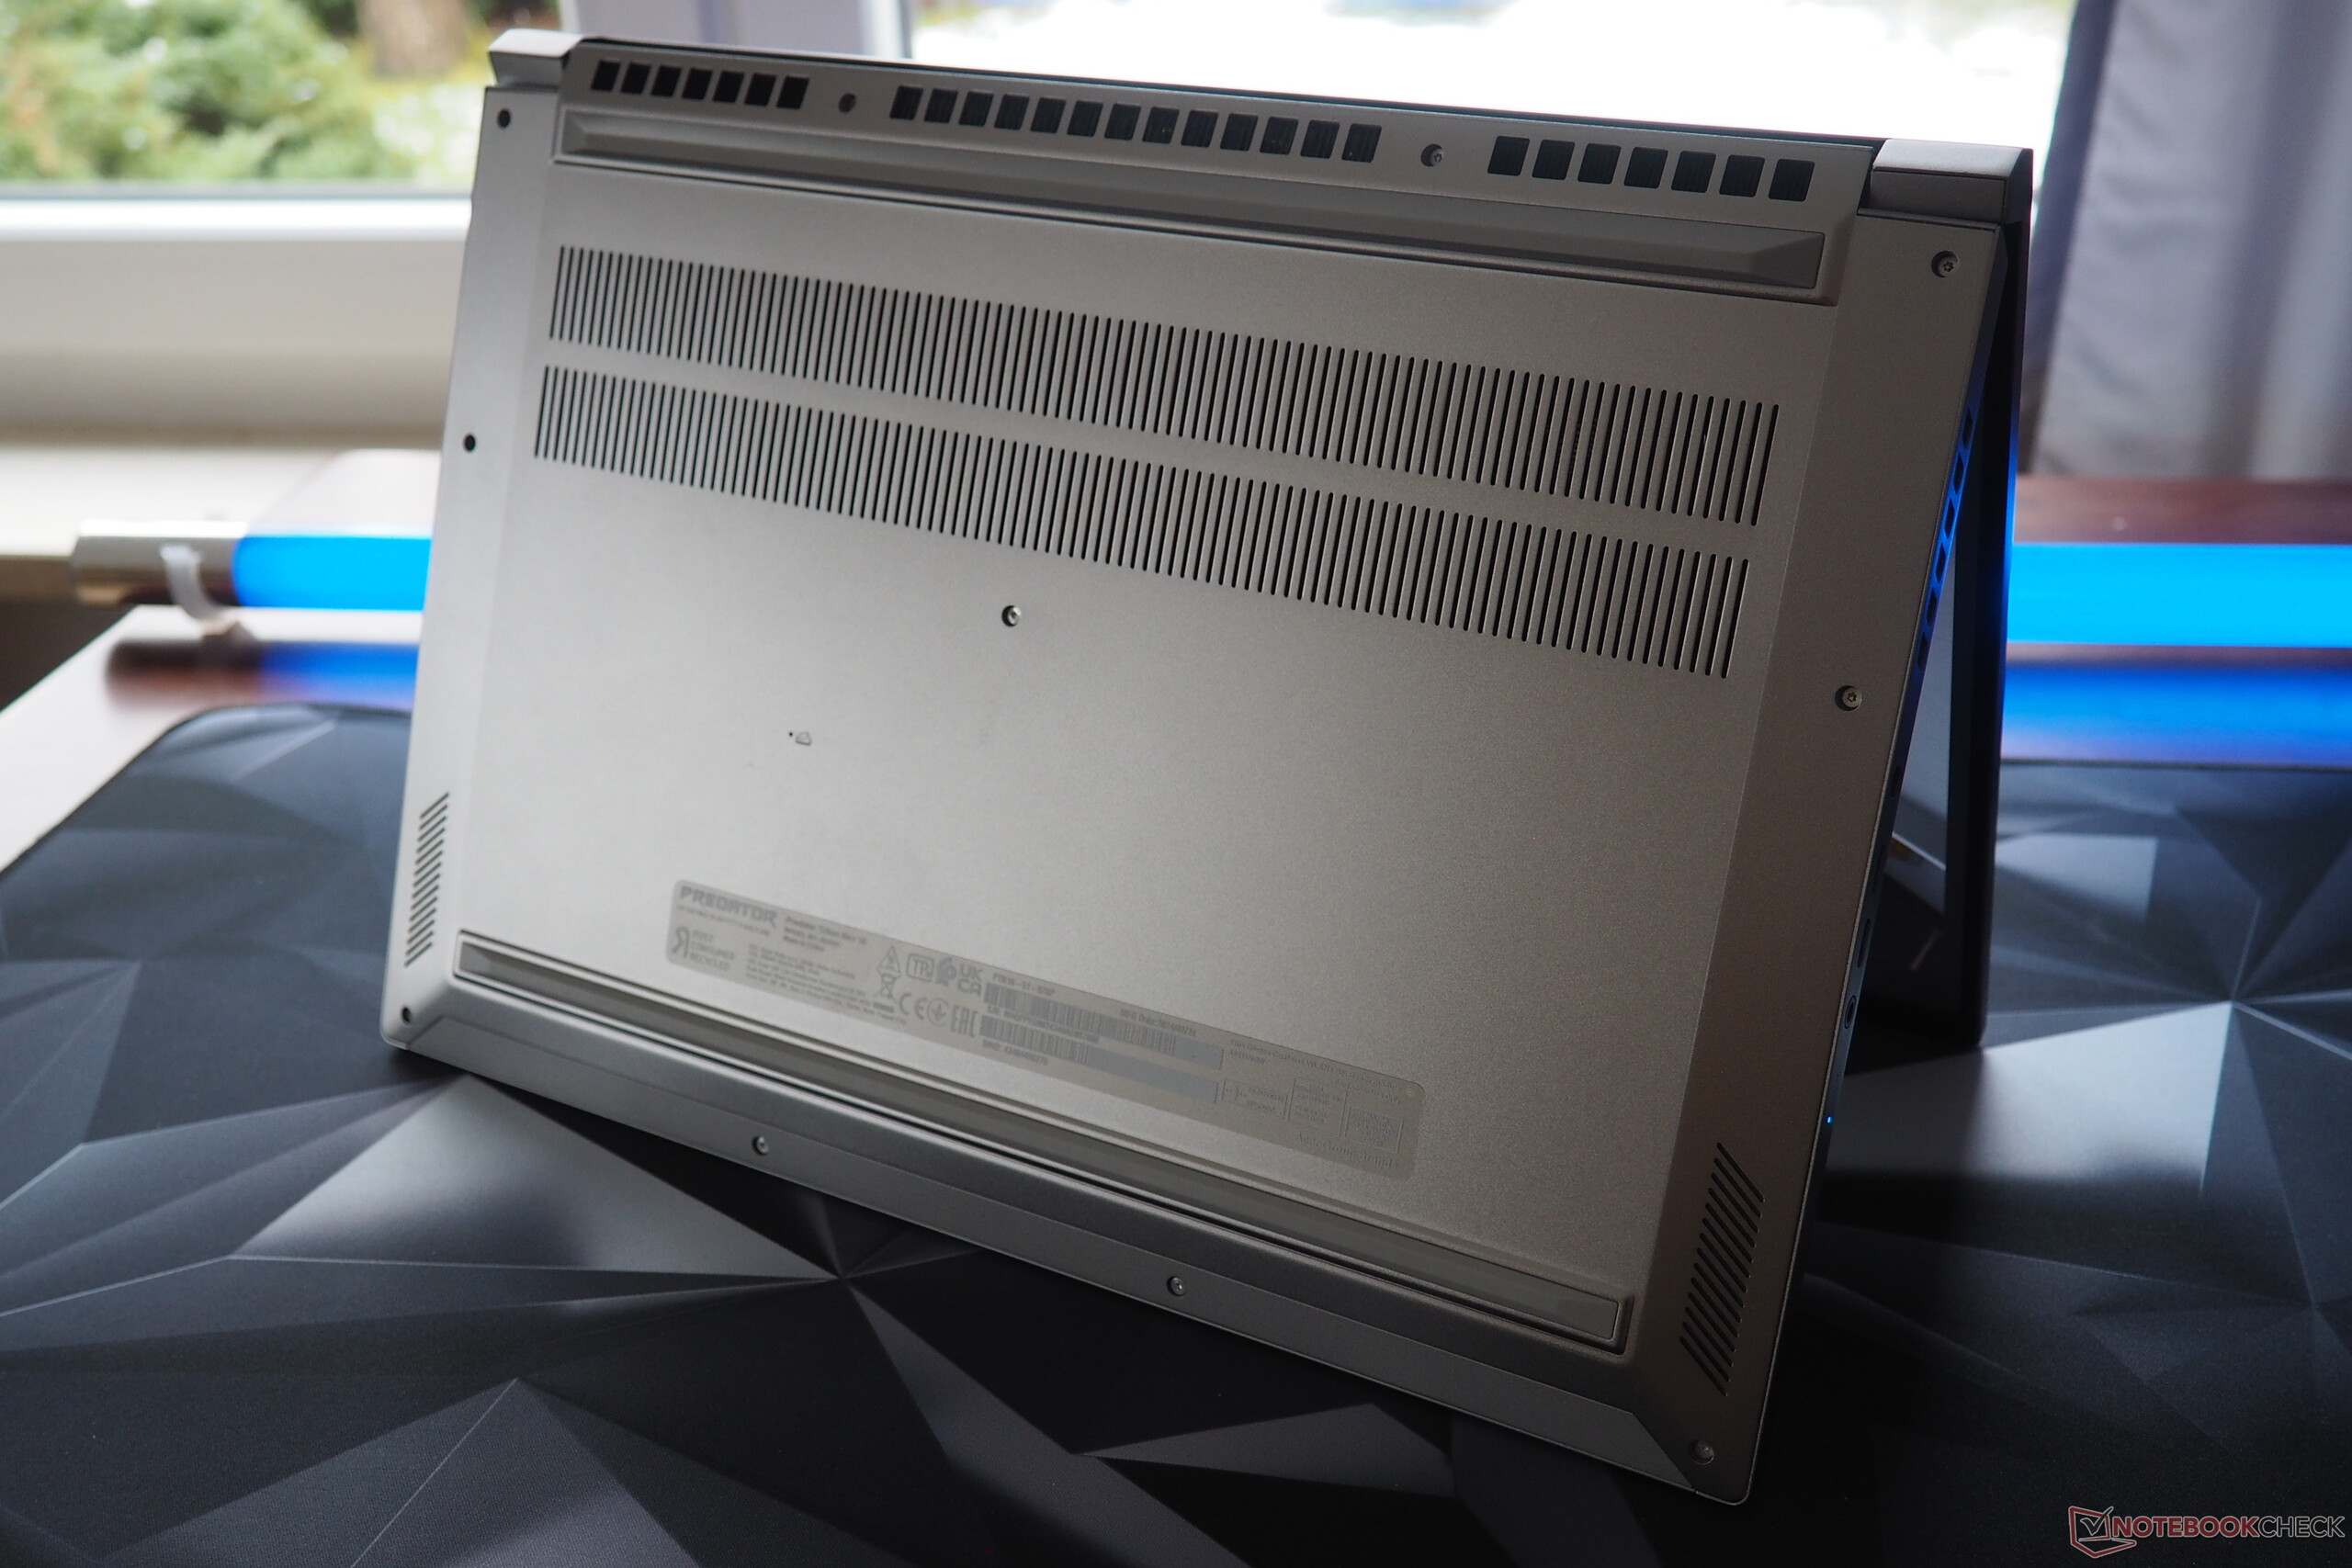
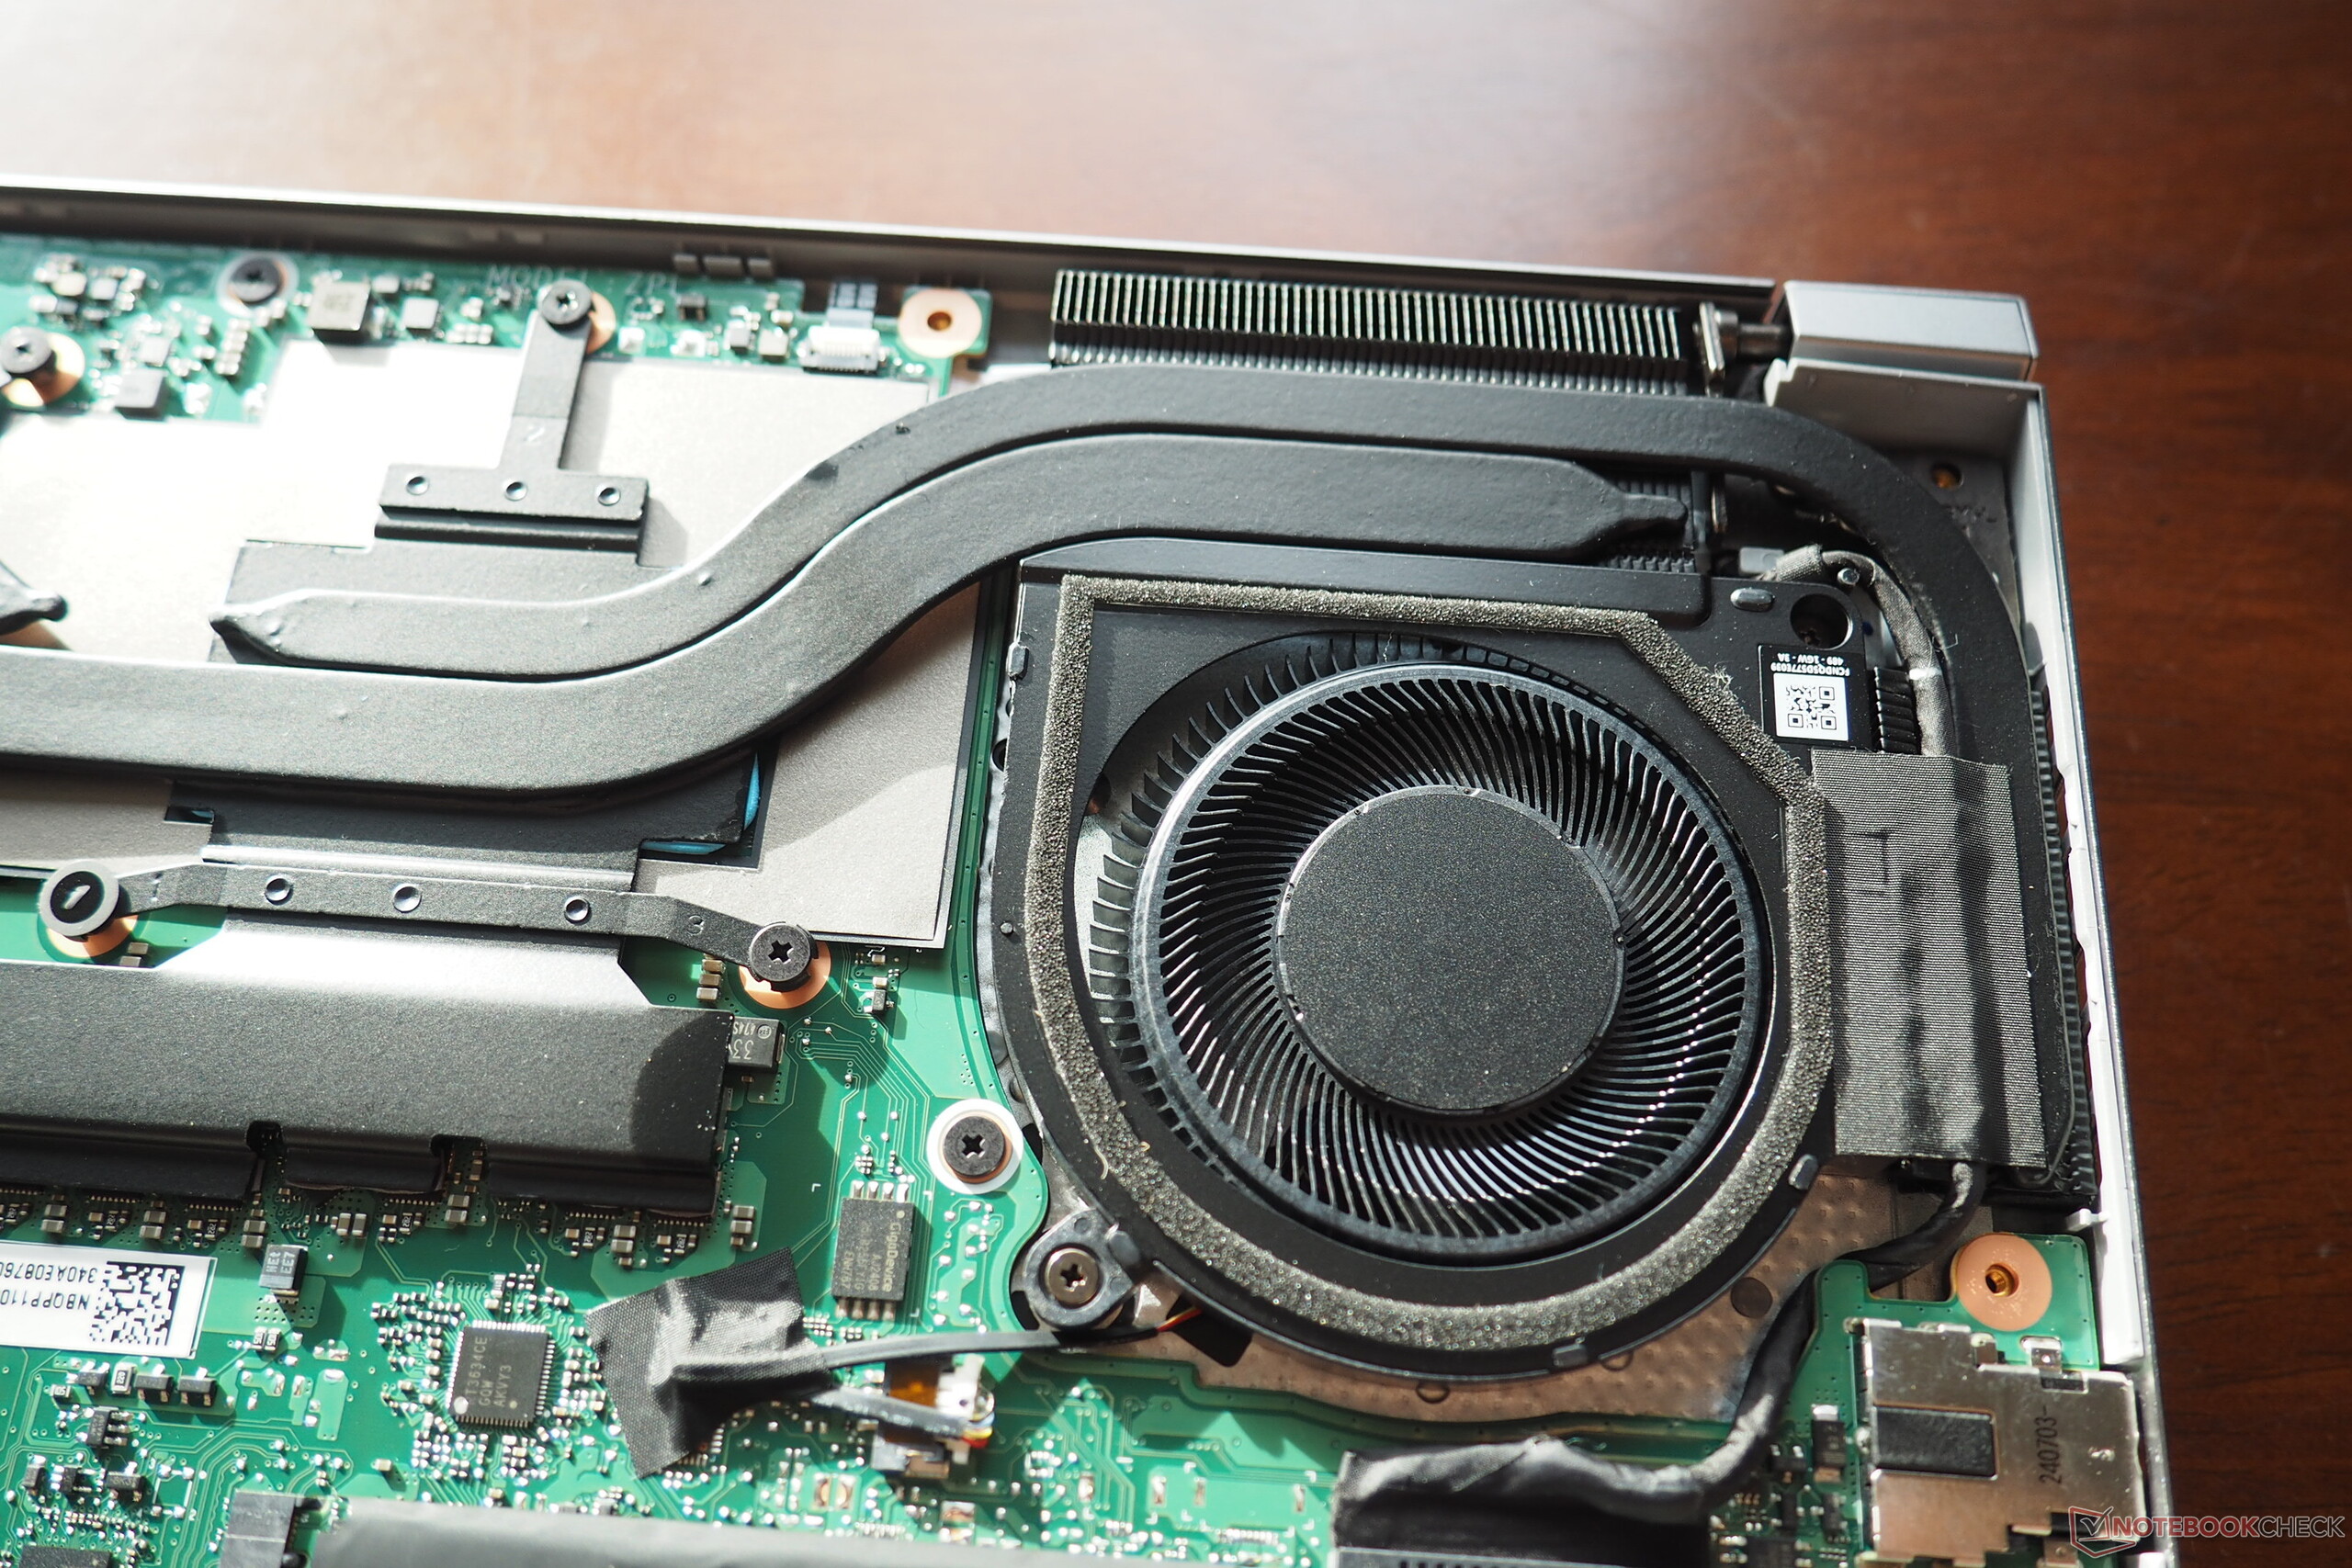
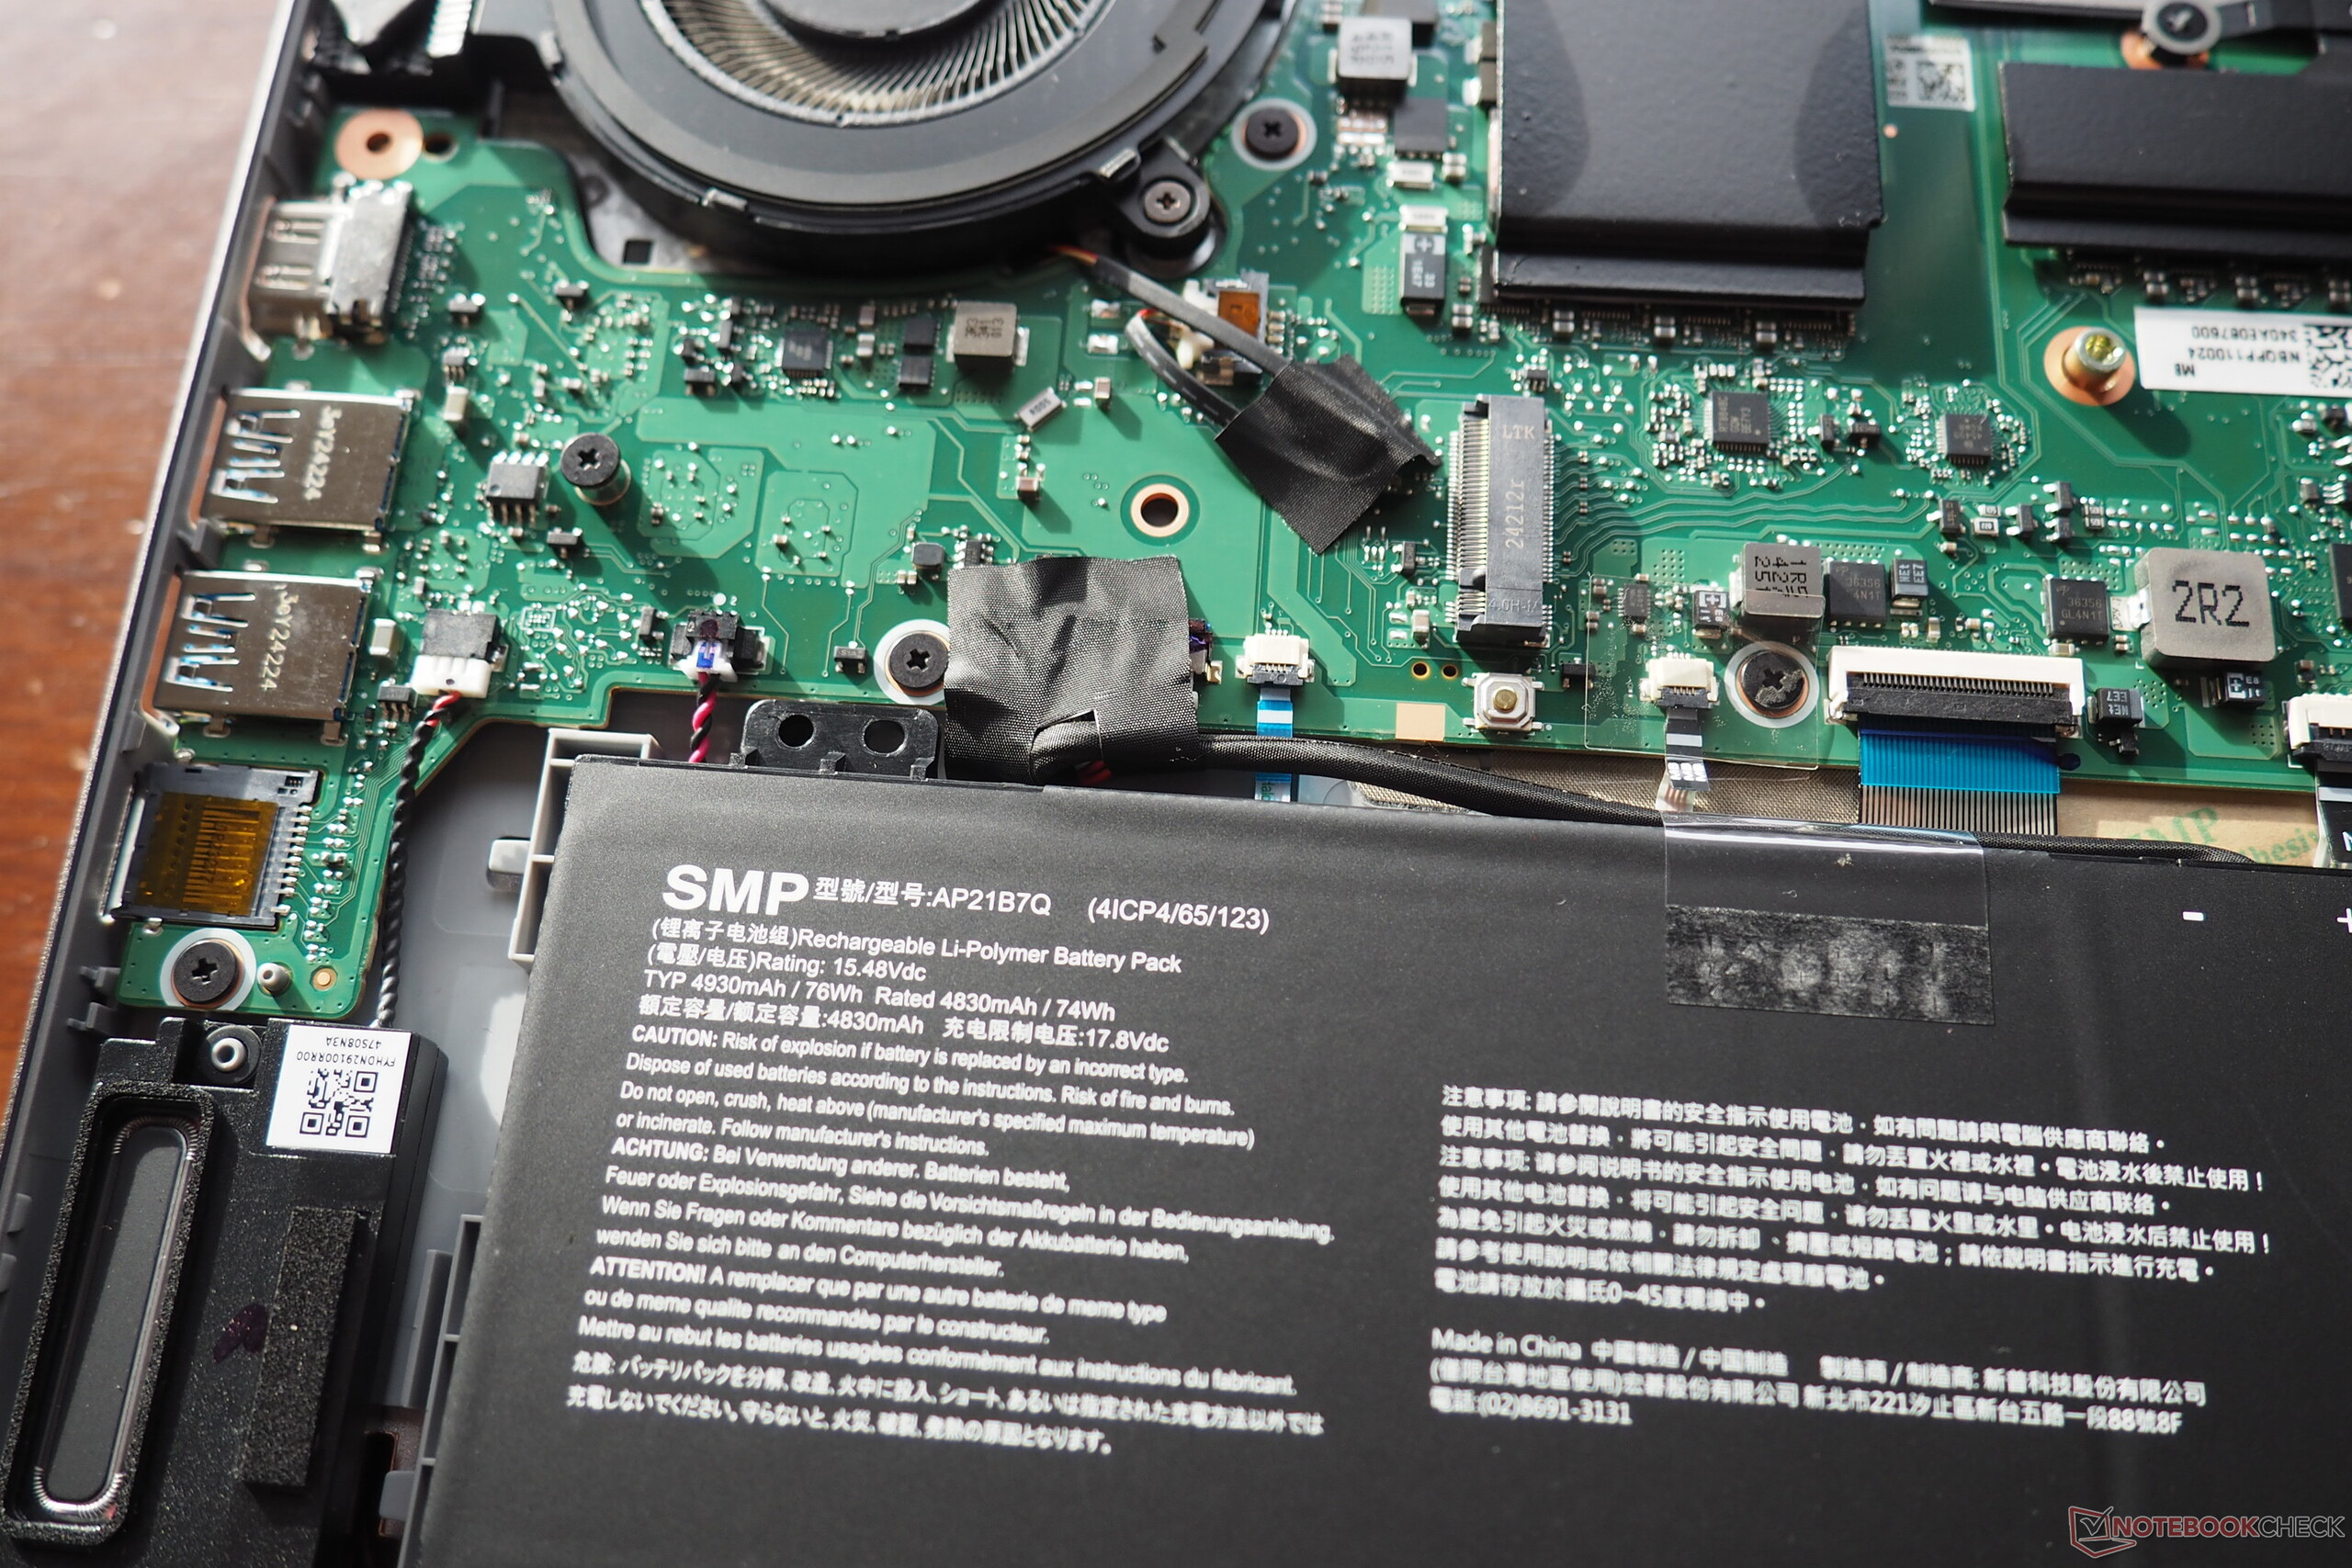
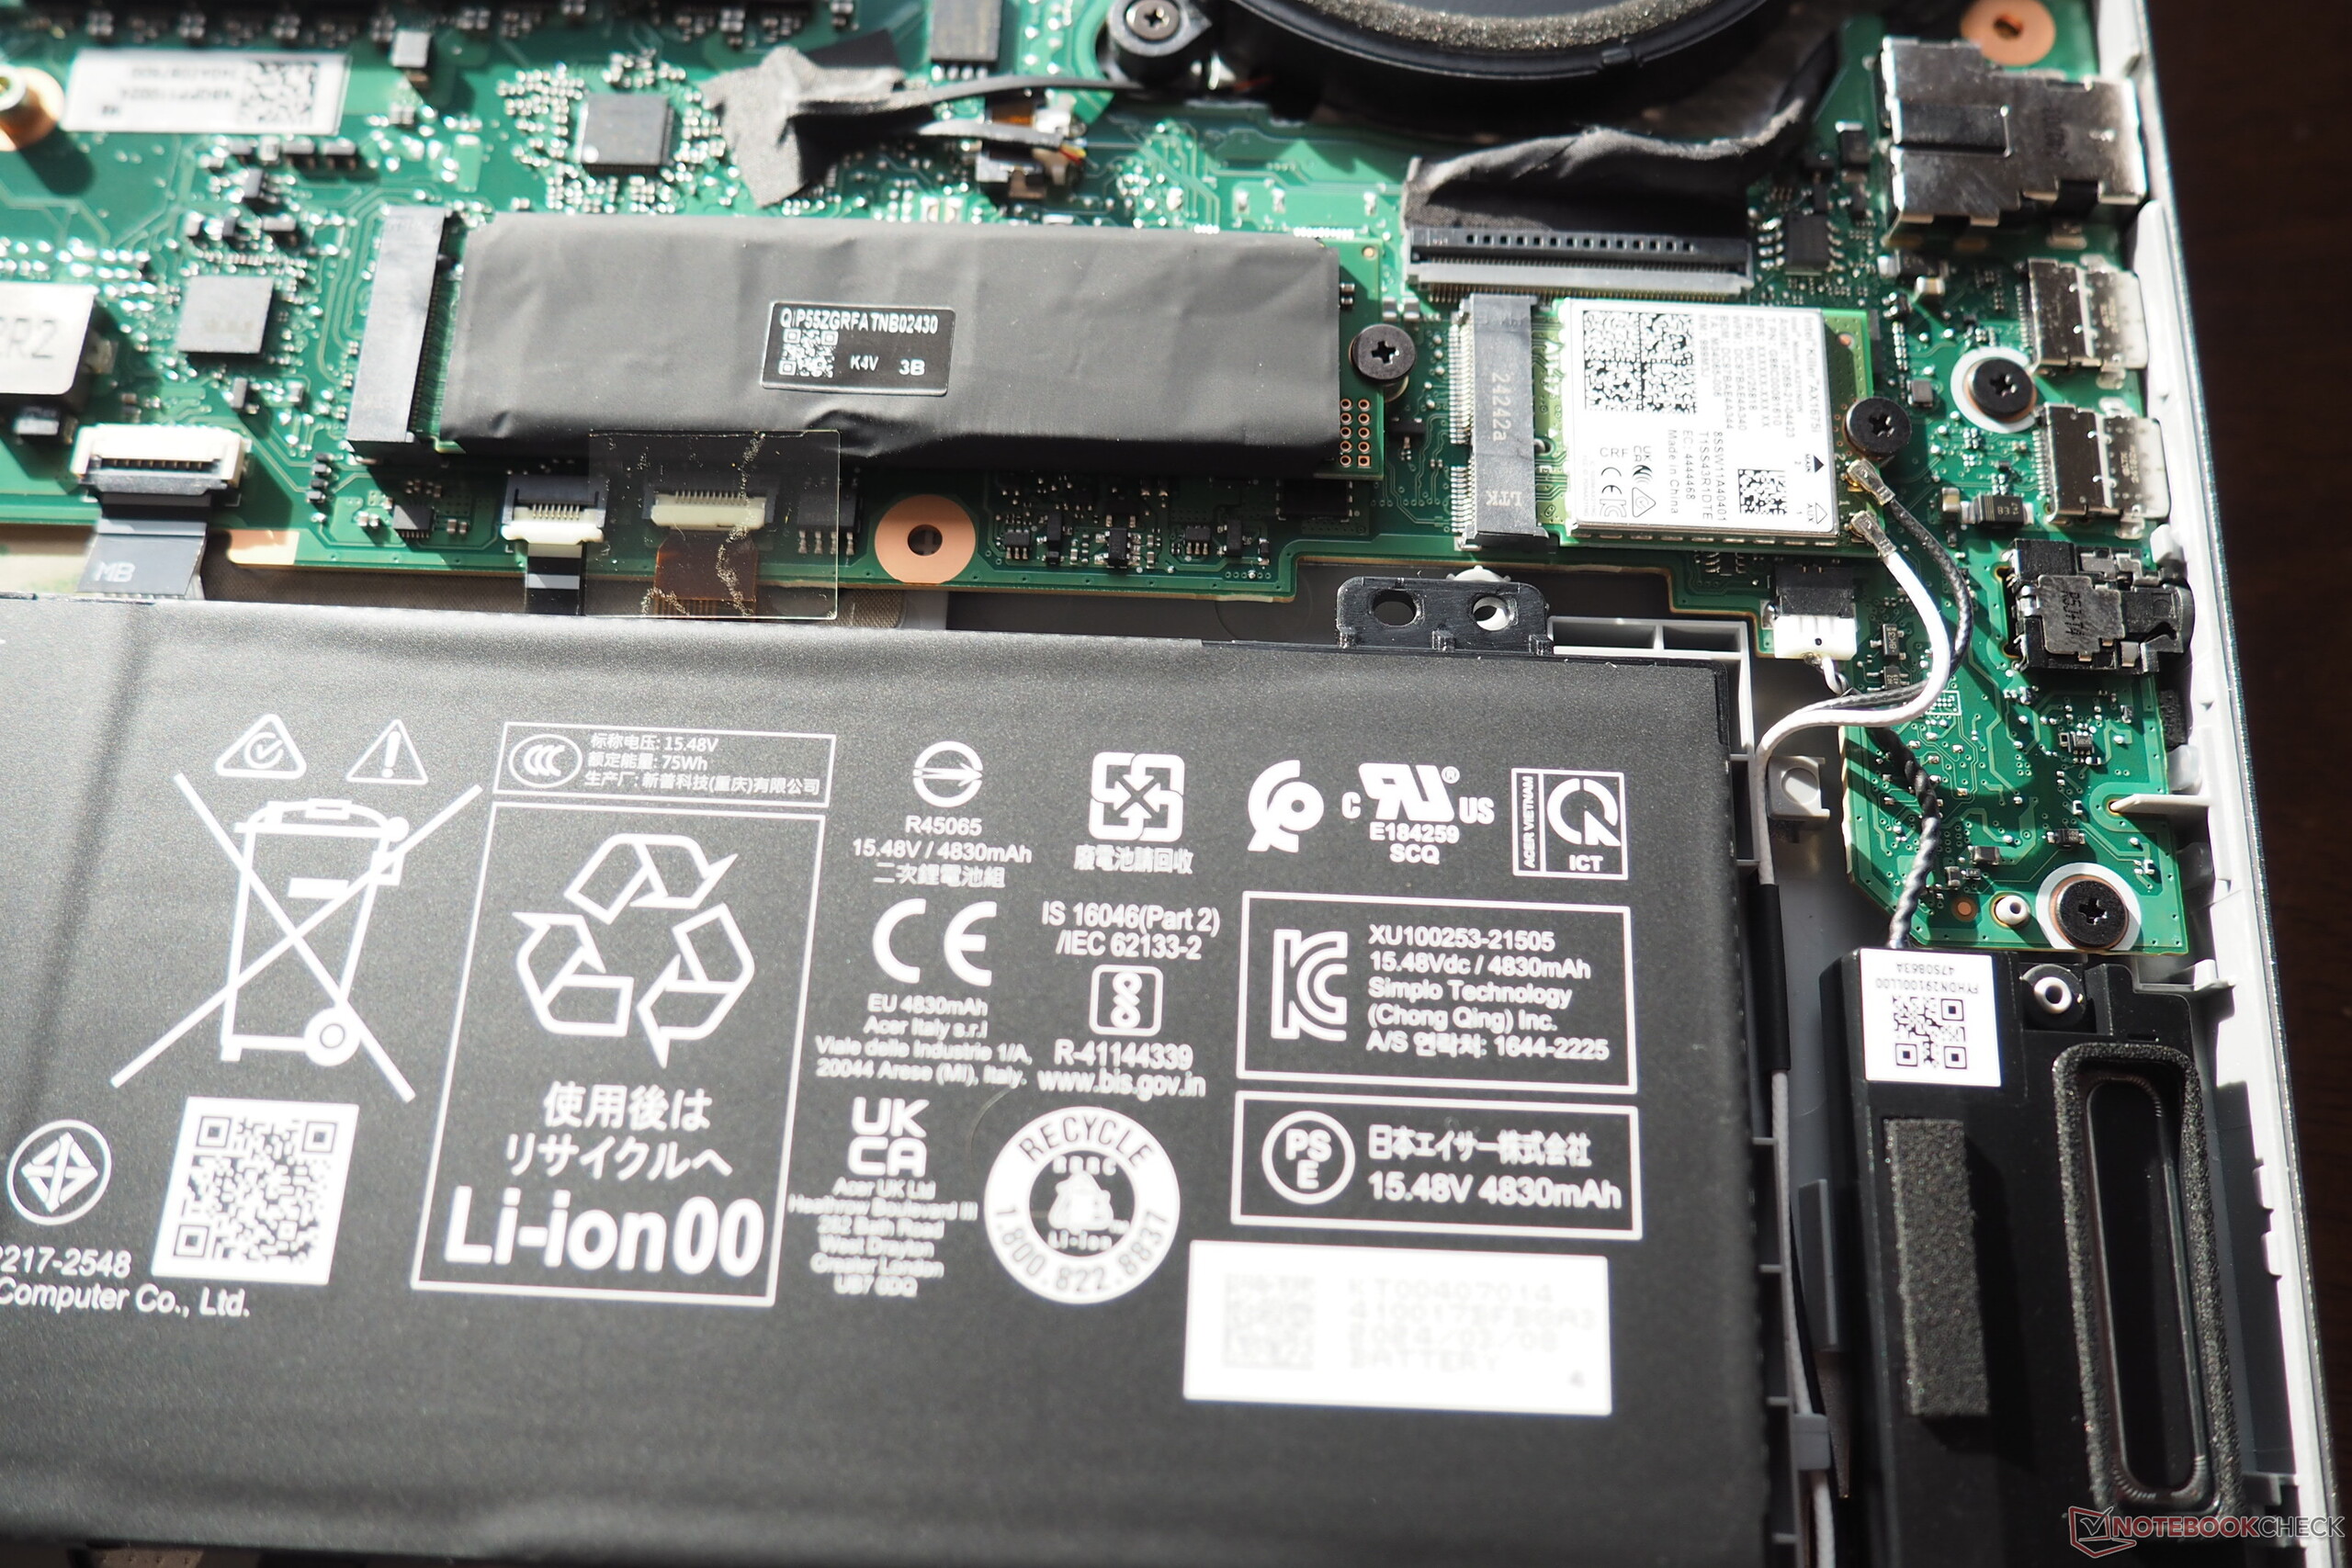
Maintenance
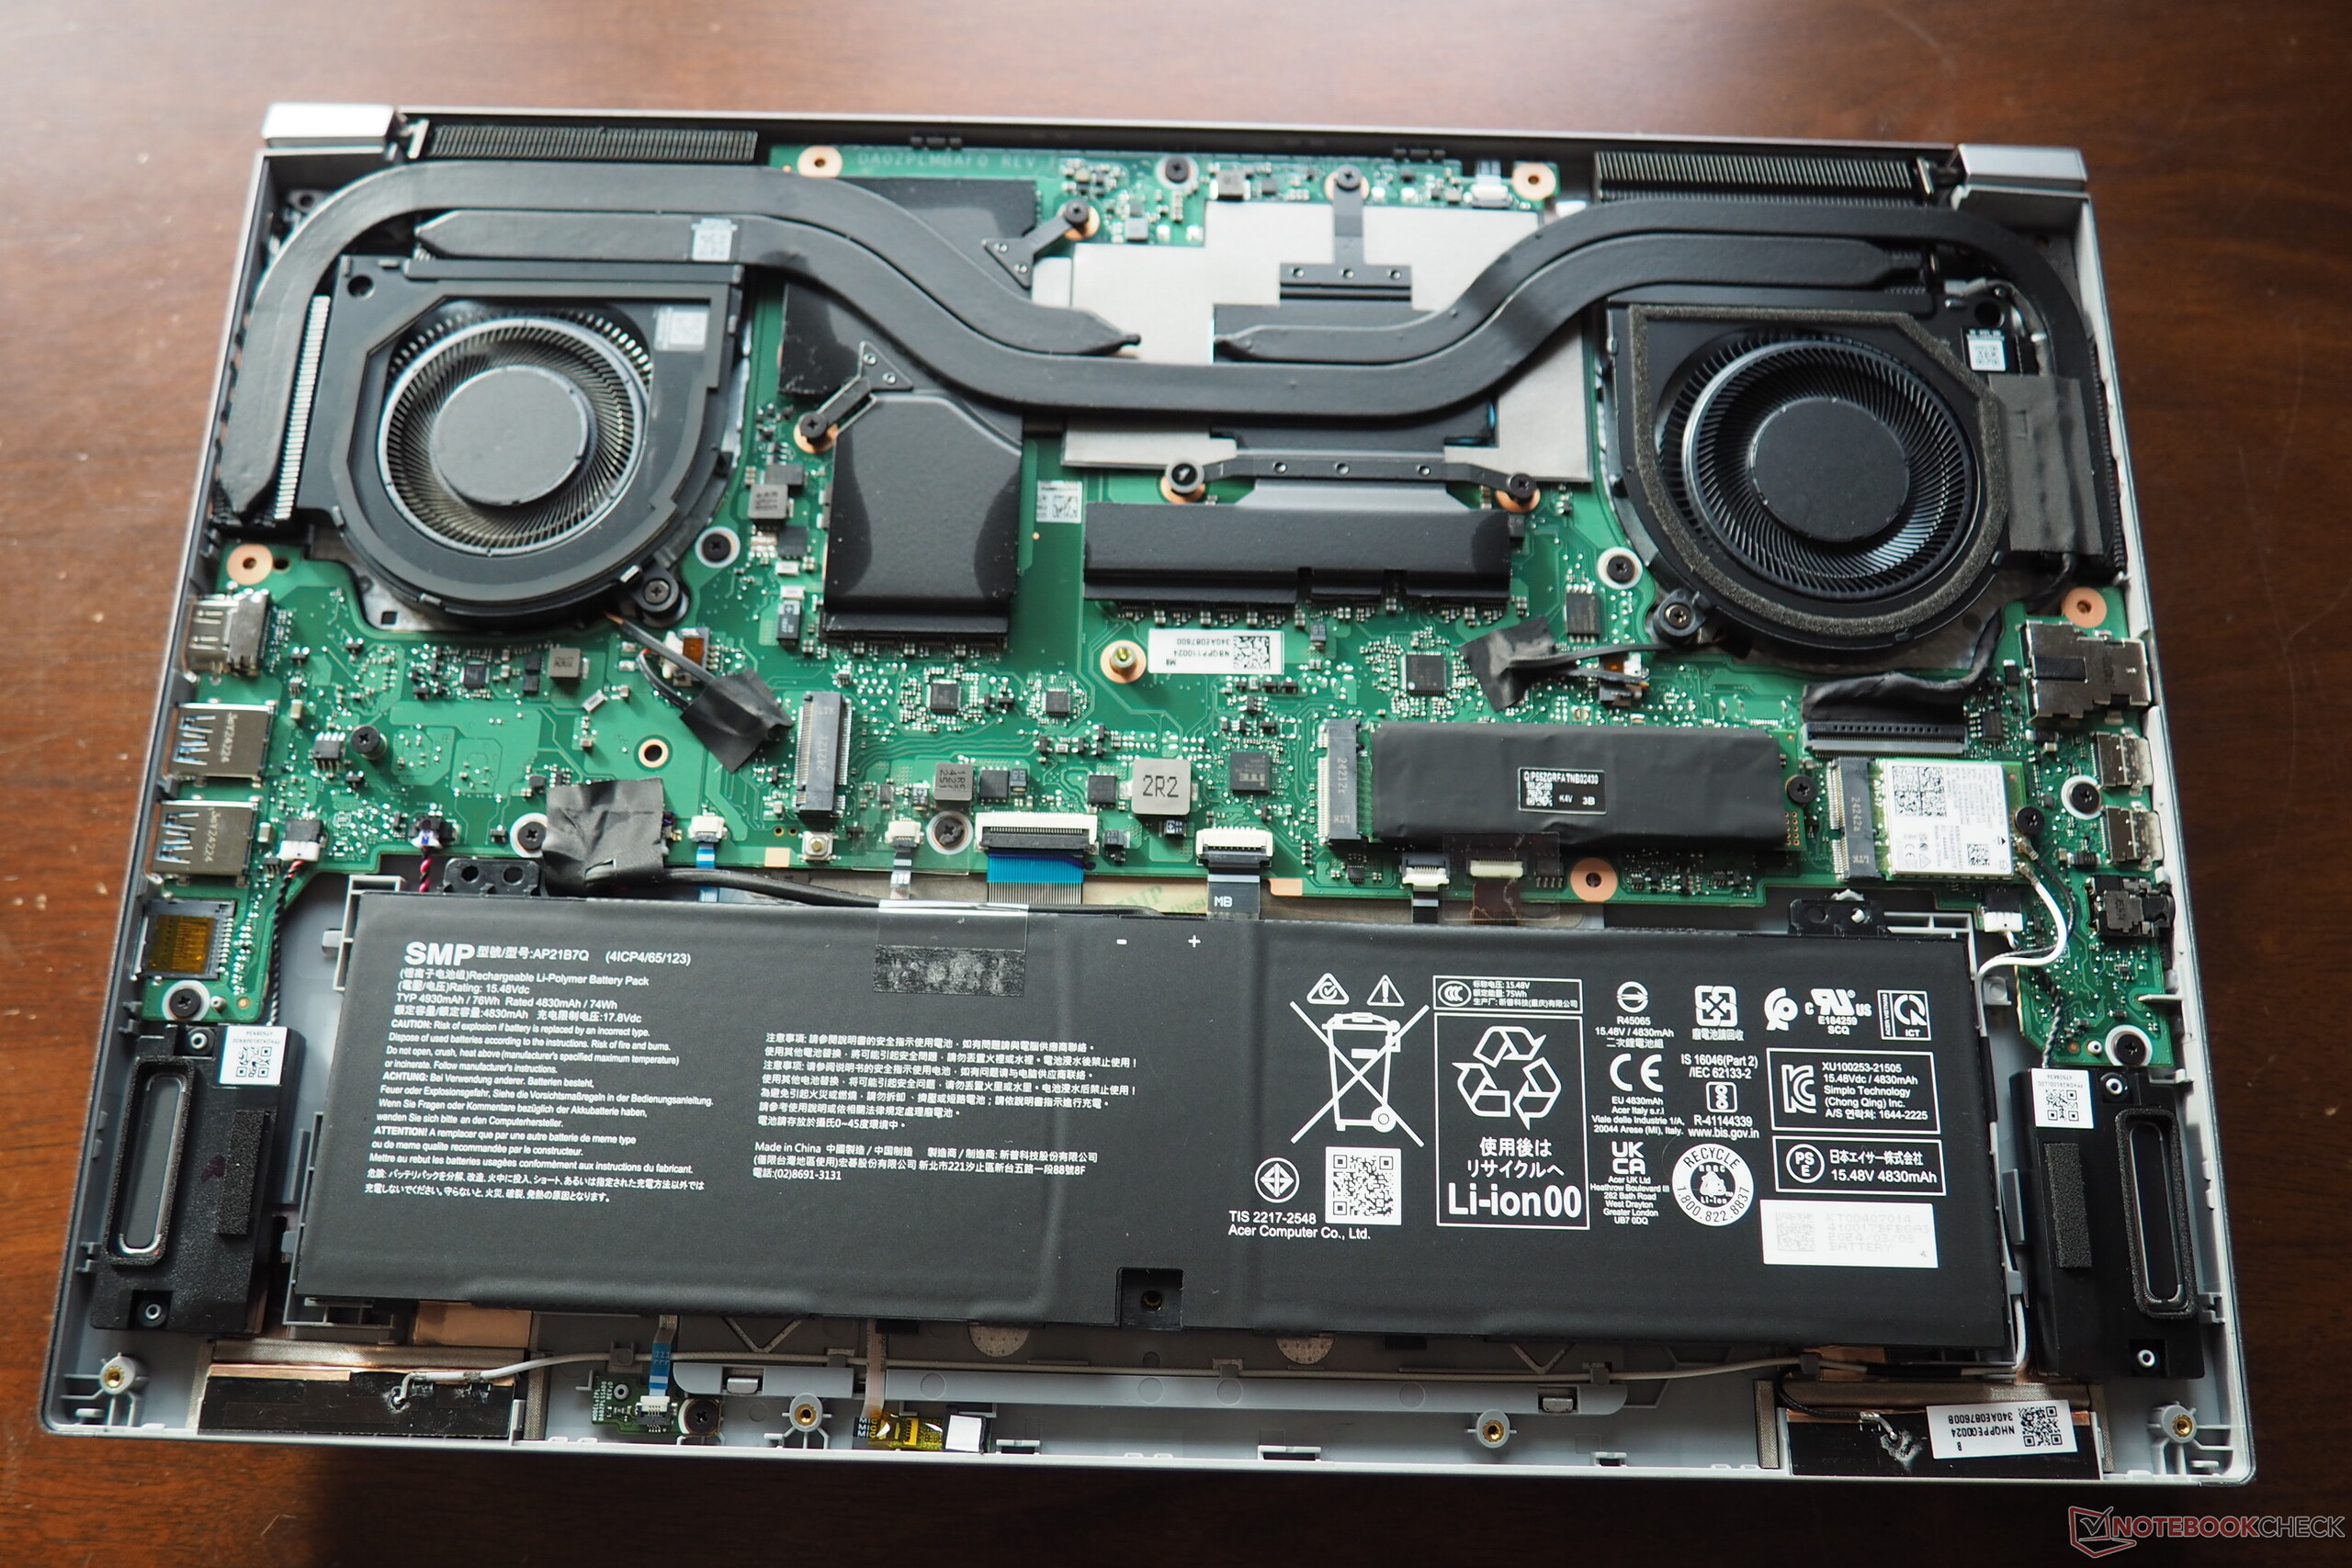
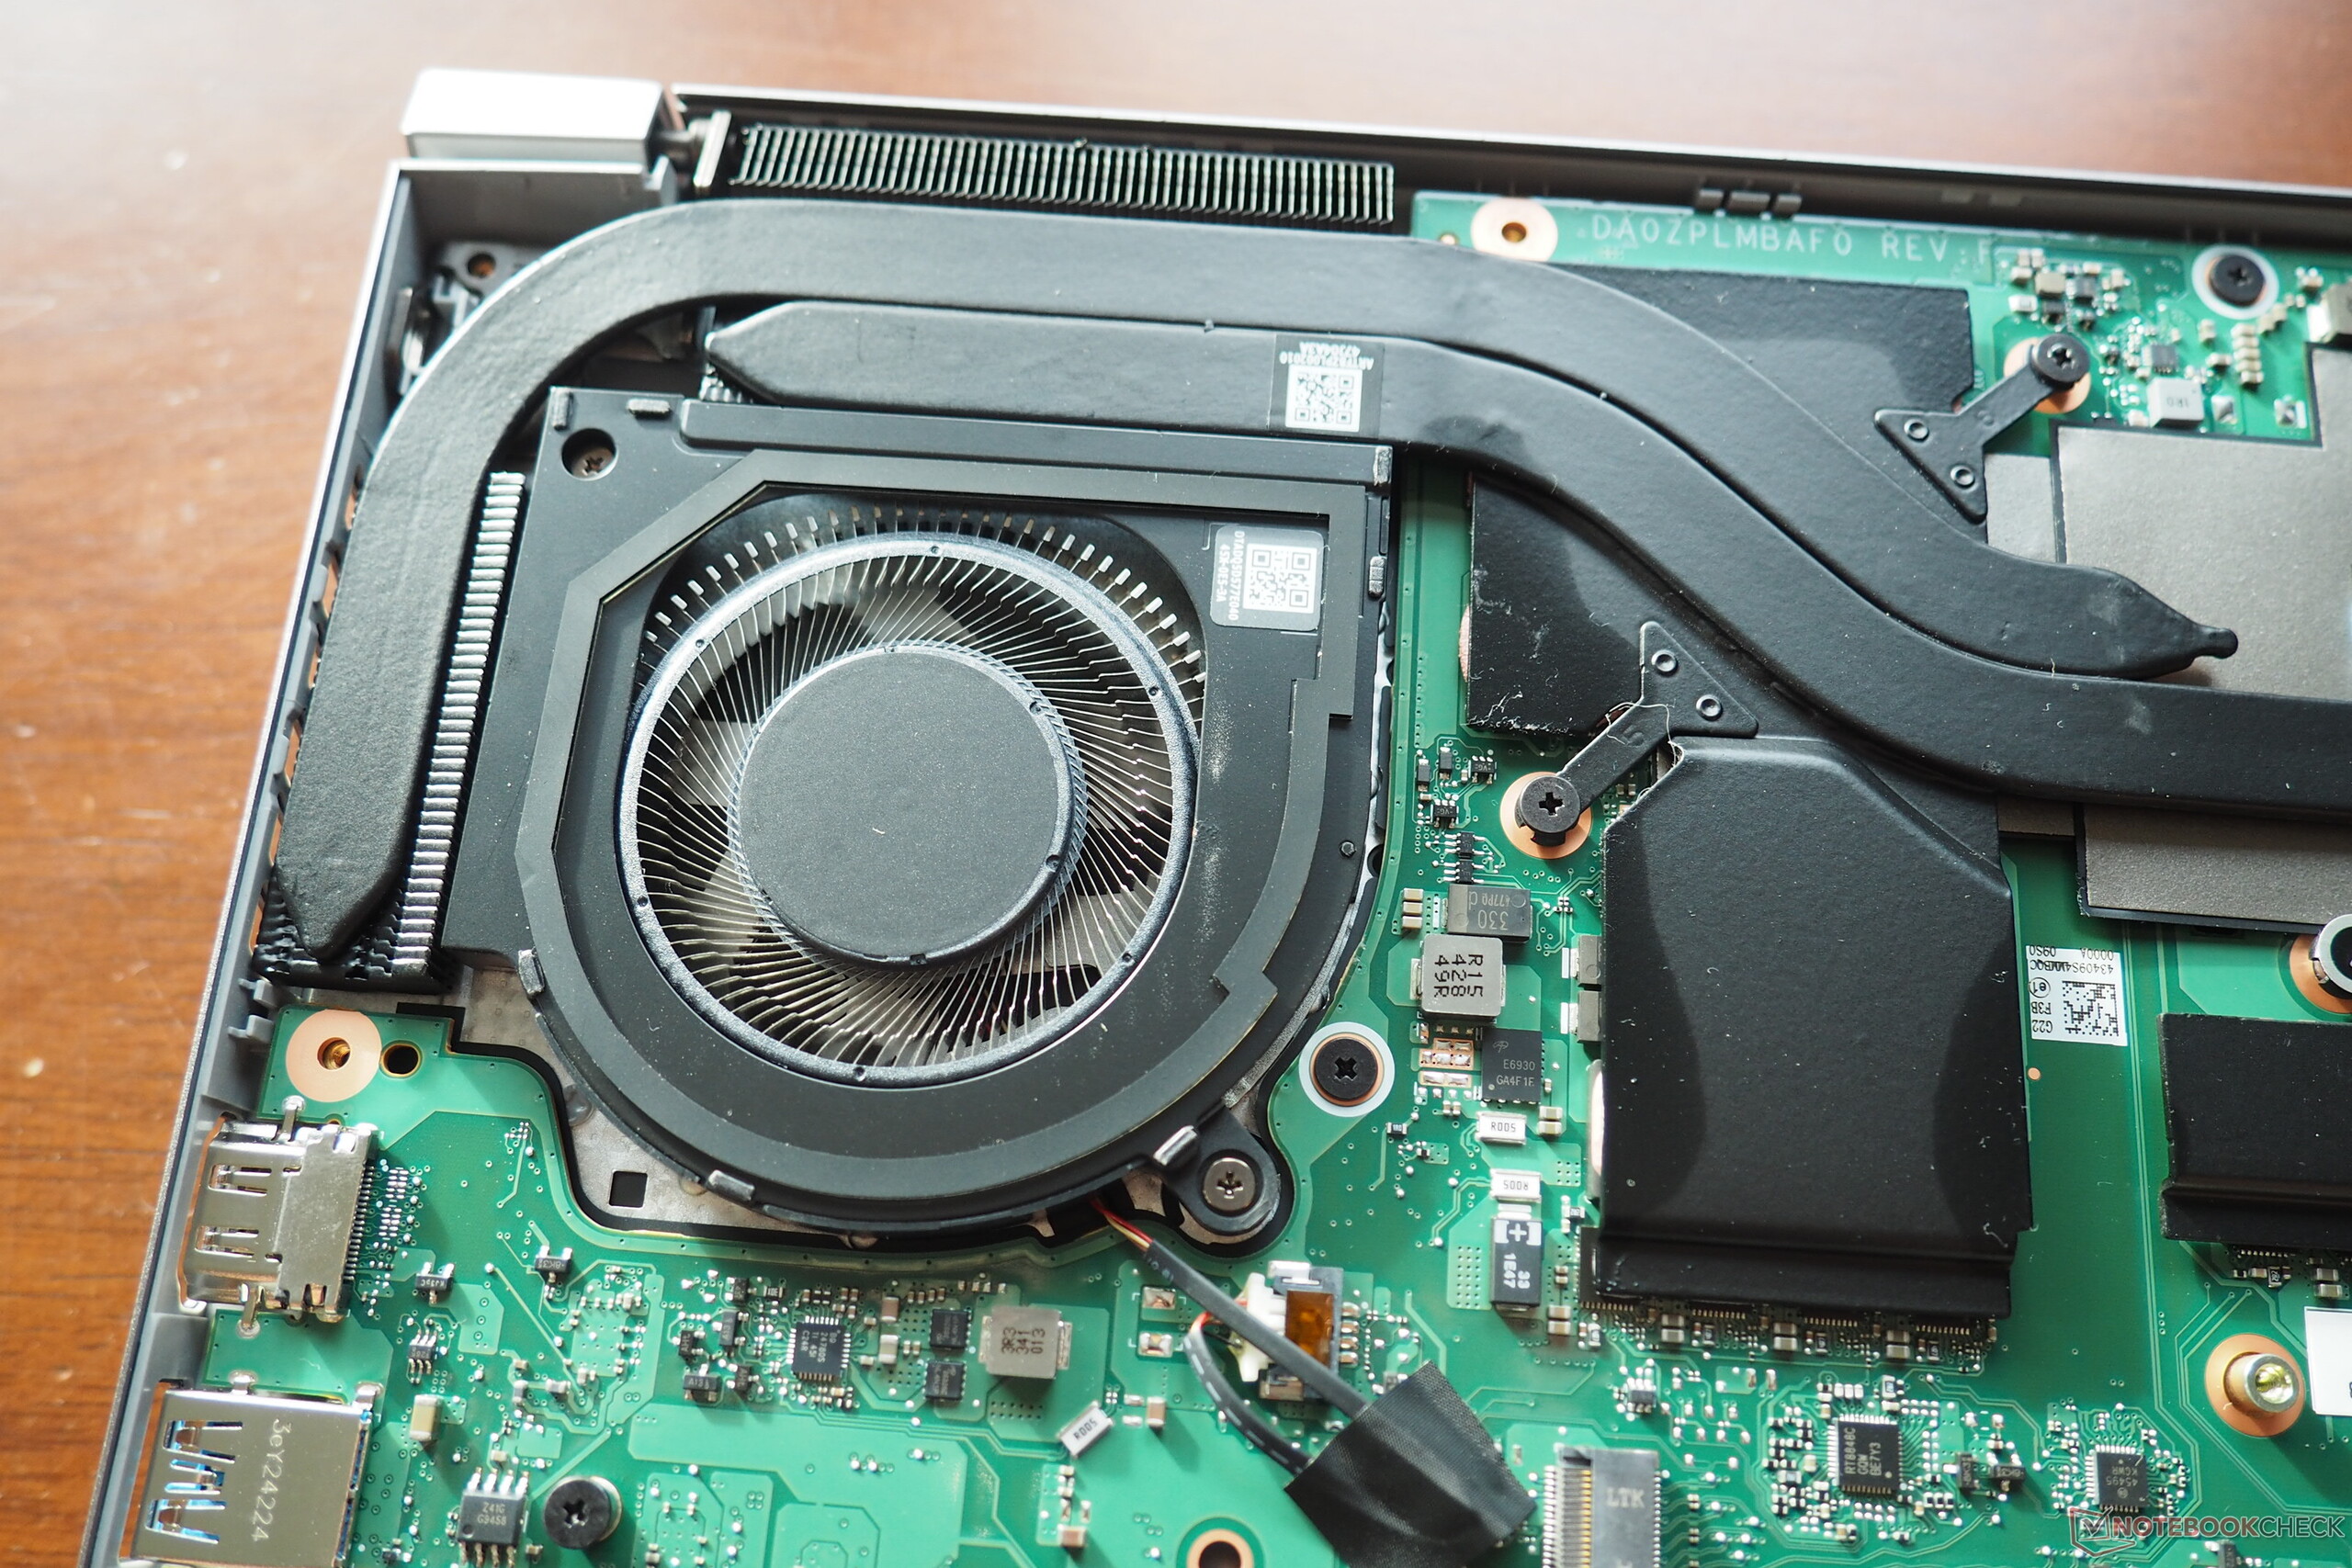
La plaque de base, assez ajustée, est fixée à l'aide de 11 vis Torx. À l'intérieur, l'image est assez claire et directe. Hormis le module sans fil, seuls le SSD et la batterie peuvent être retirés. Le système de refroidissement du portable (qui, selon Acer, utilise du métal liquide) se compose de deux ventilateurs et de plusieurs caloducs.
Durabilité
Acer fait référence à "Post Consumer Recycled" sur l'un des autocollants de l'étui. L'emballage est principalement constitué de carton. L'ordinateur portable est emballé dans un sac en tissu et le bloc d'alimentation dans un film plastique (chaque type est étiqueté).
Garantie
L'ordinateur portable est couvert par une garantie standard de 12 mois aux États-Unis.
Dispositifs d'entrée
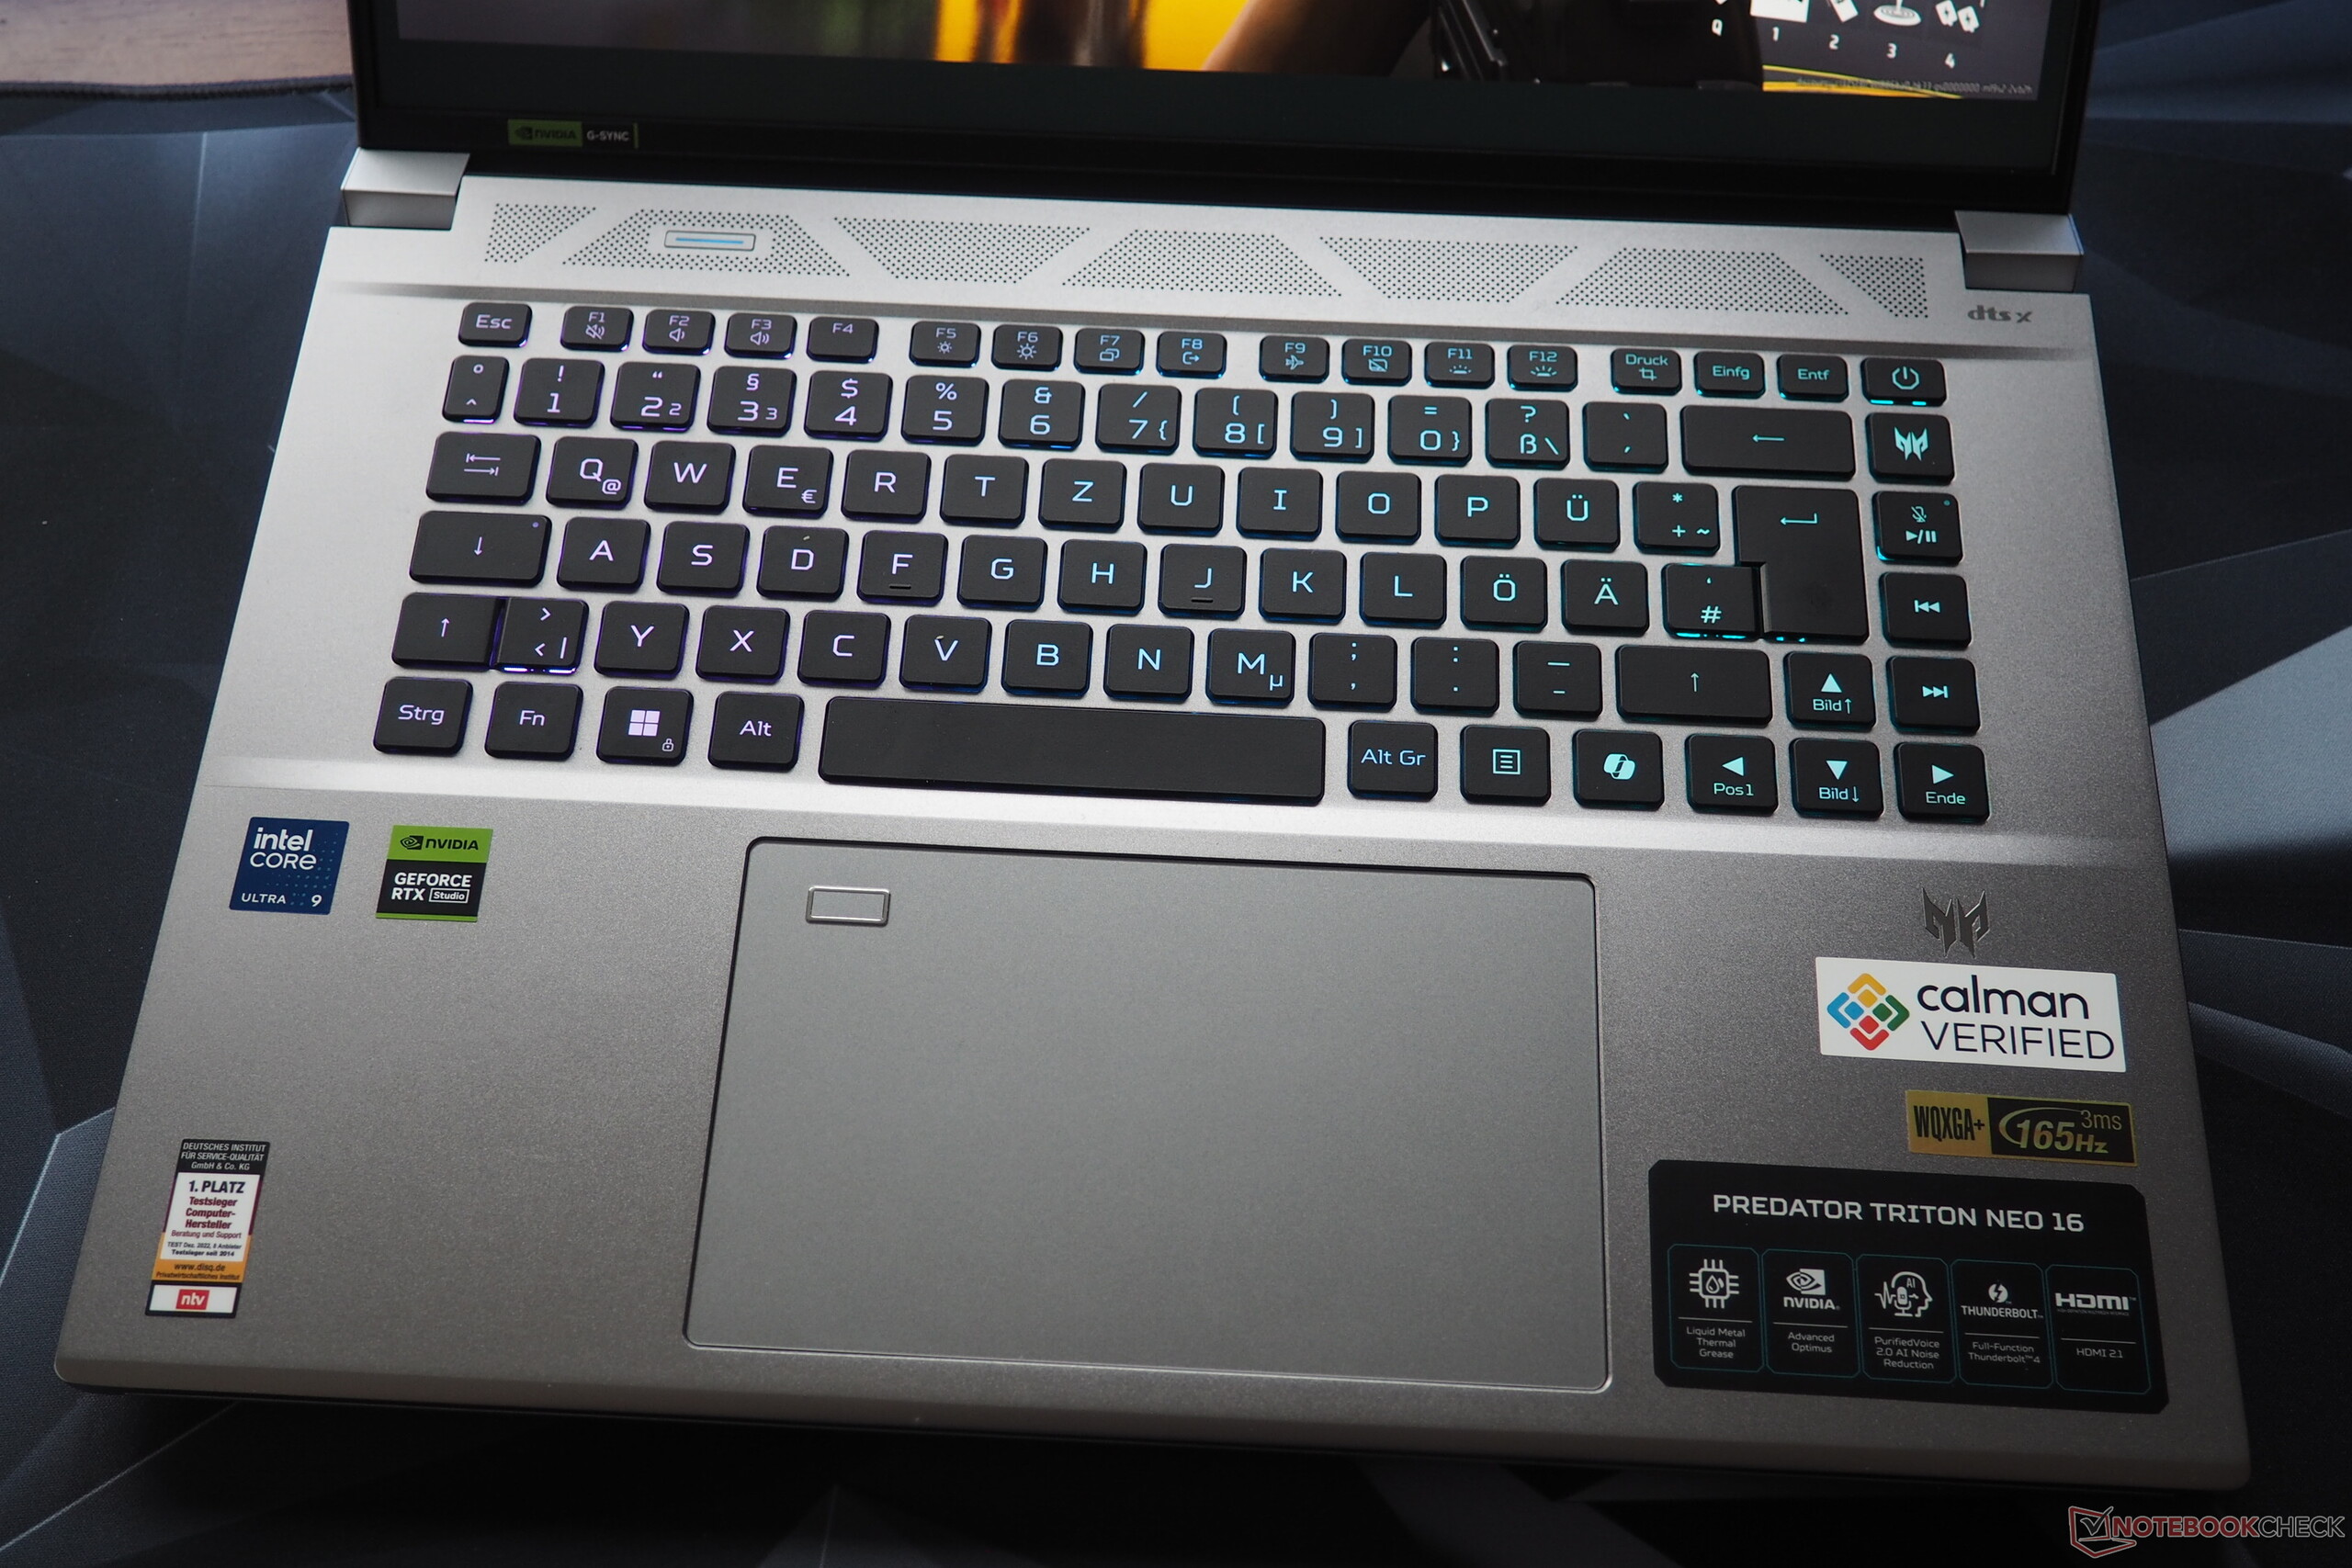
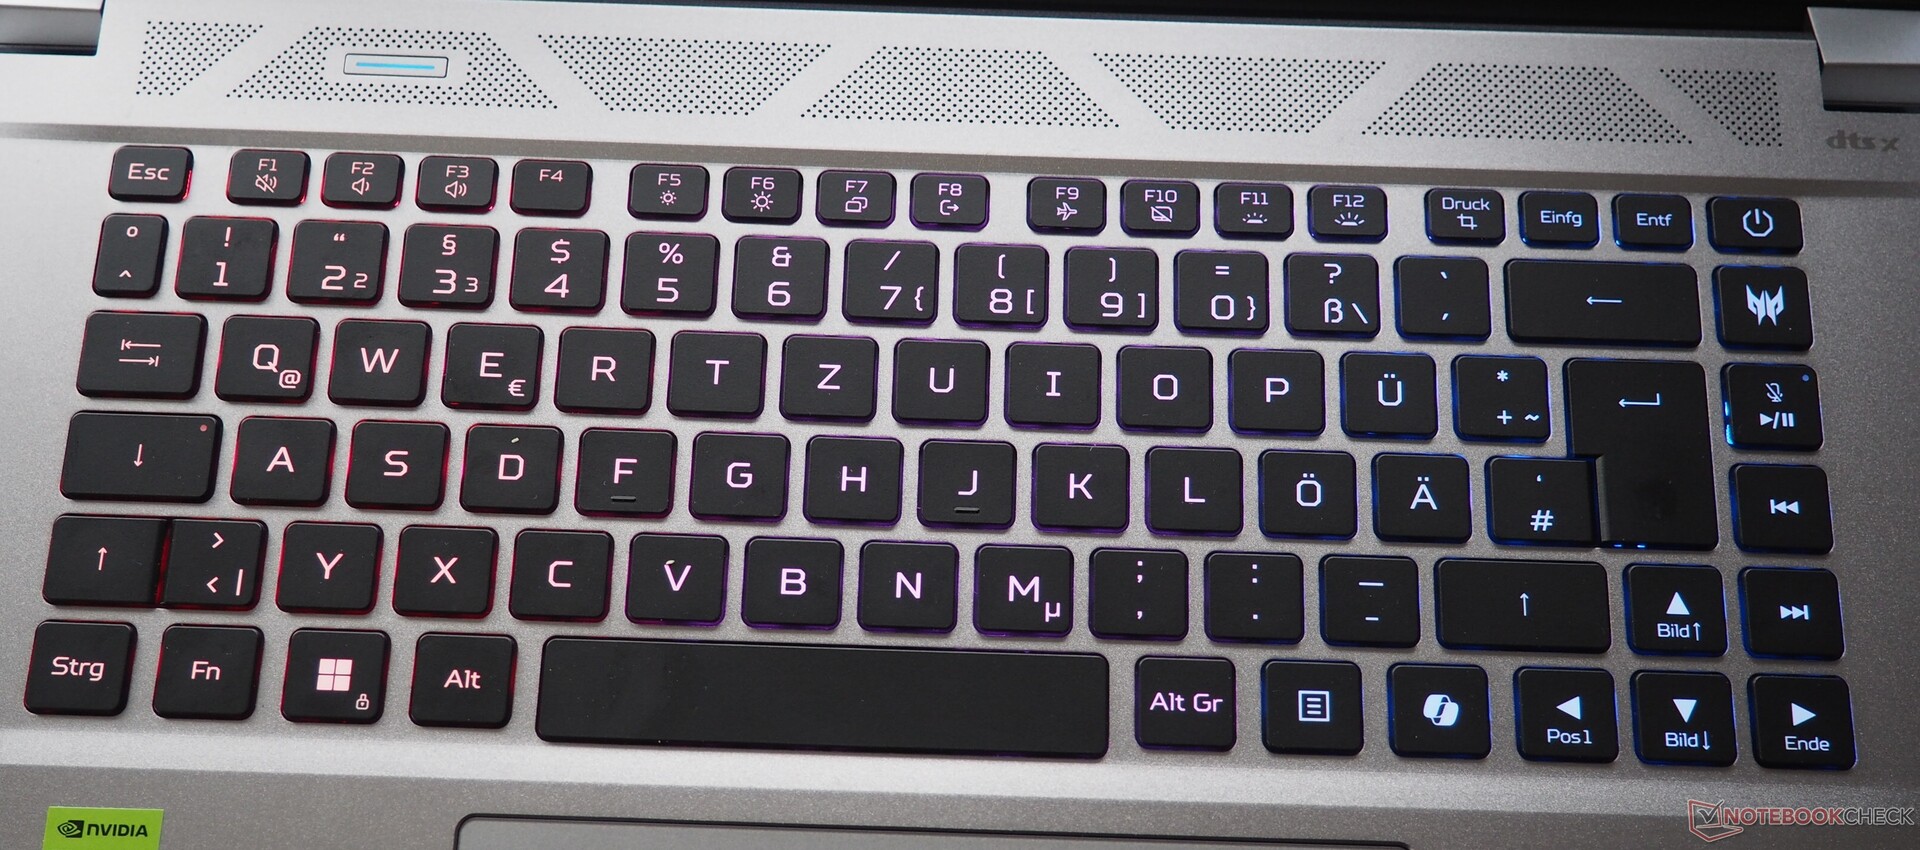
Clavier
Pour un modèle à dôme en caoutchouc, le clavier offre un retour d'information et une sensation de frappe plus que décents. Acer a opté pour une disposition assez classique : le fabricant a renoncé à un pavé numérique et s'est limité à une seule colonne à droite du " bloc principal ", qui est destiné au contrôle des médias et à l'ouverture du logiciel système Predator Sense. À l'exception de la rangée de fonctions, toutes les touches sont de taille raisonnable, y compris les flèches directionnelles. Les joueurs peuvent compter sur un éclairage RVB réglable sur plusieurs niveaux et divisé en trois zones.
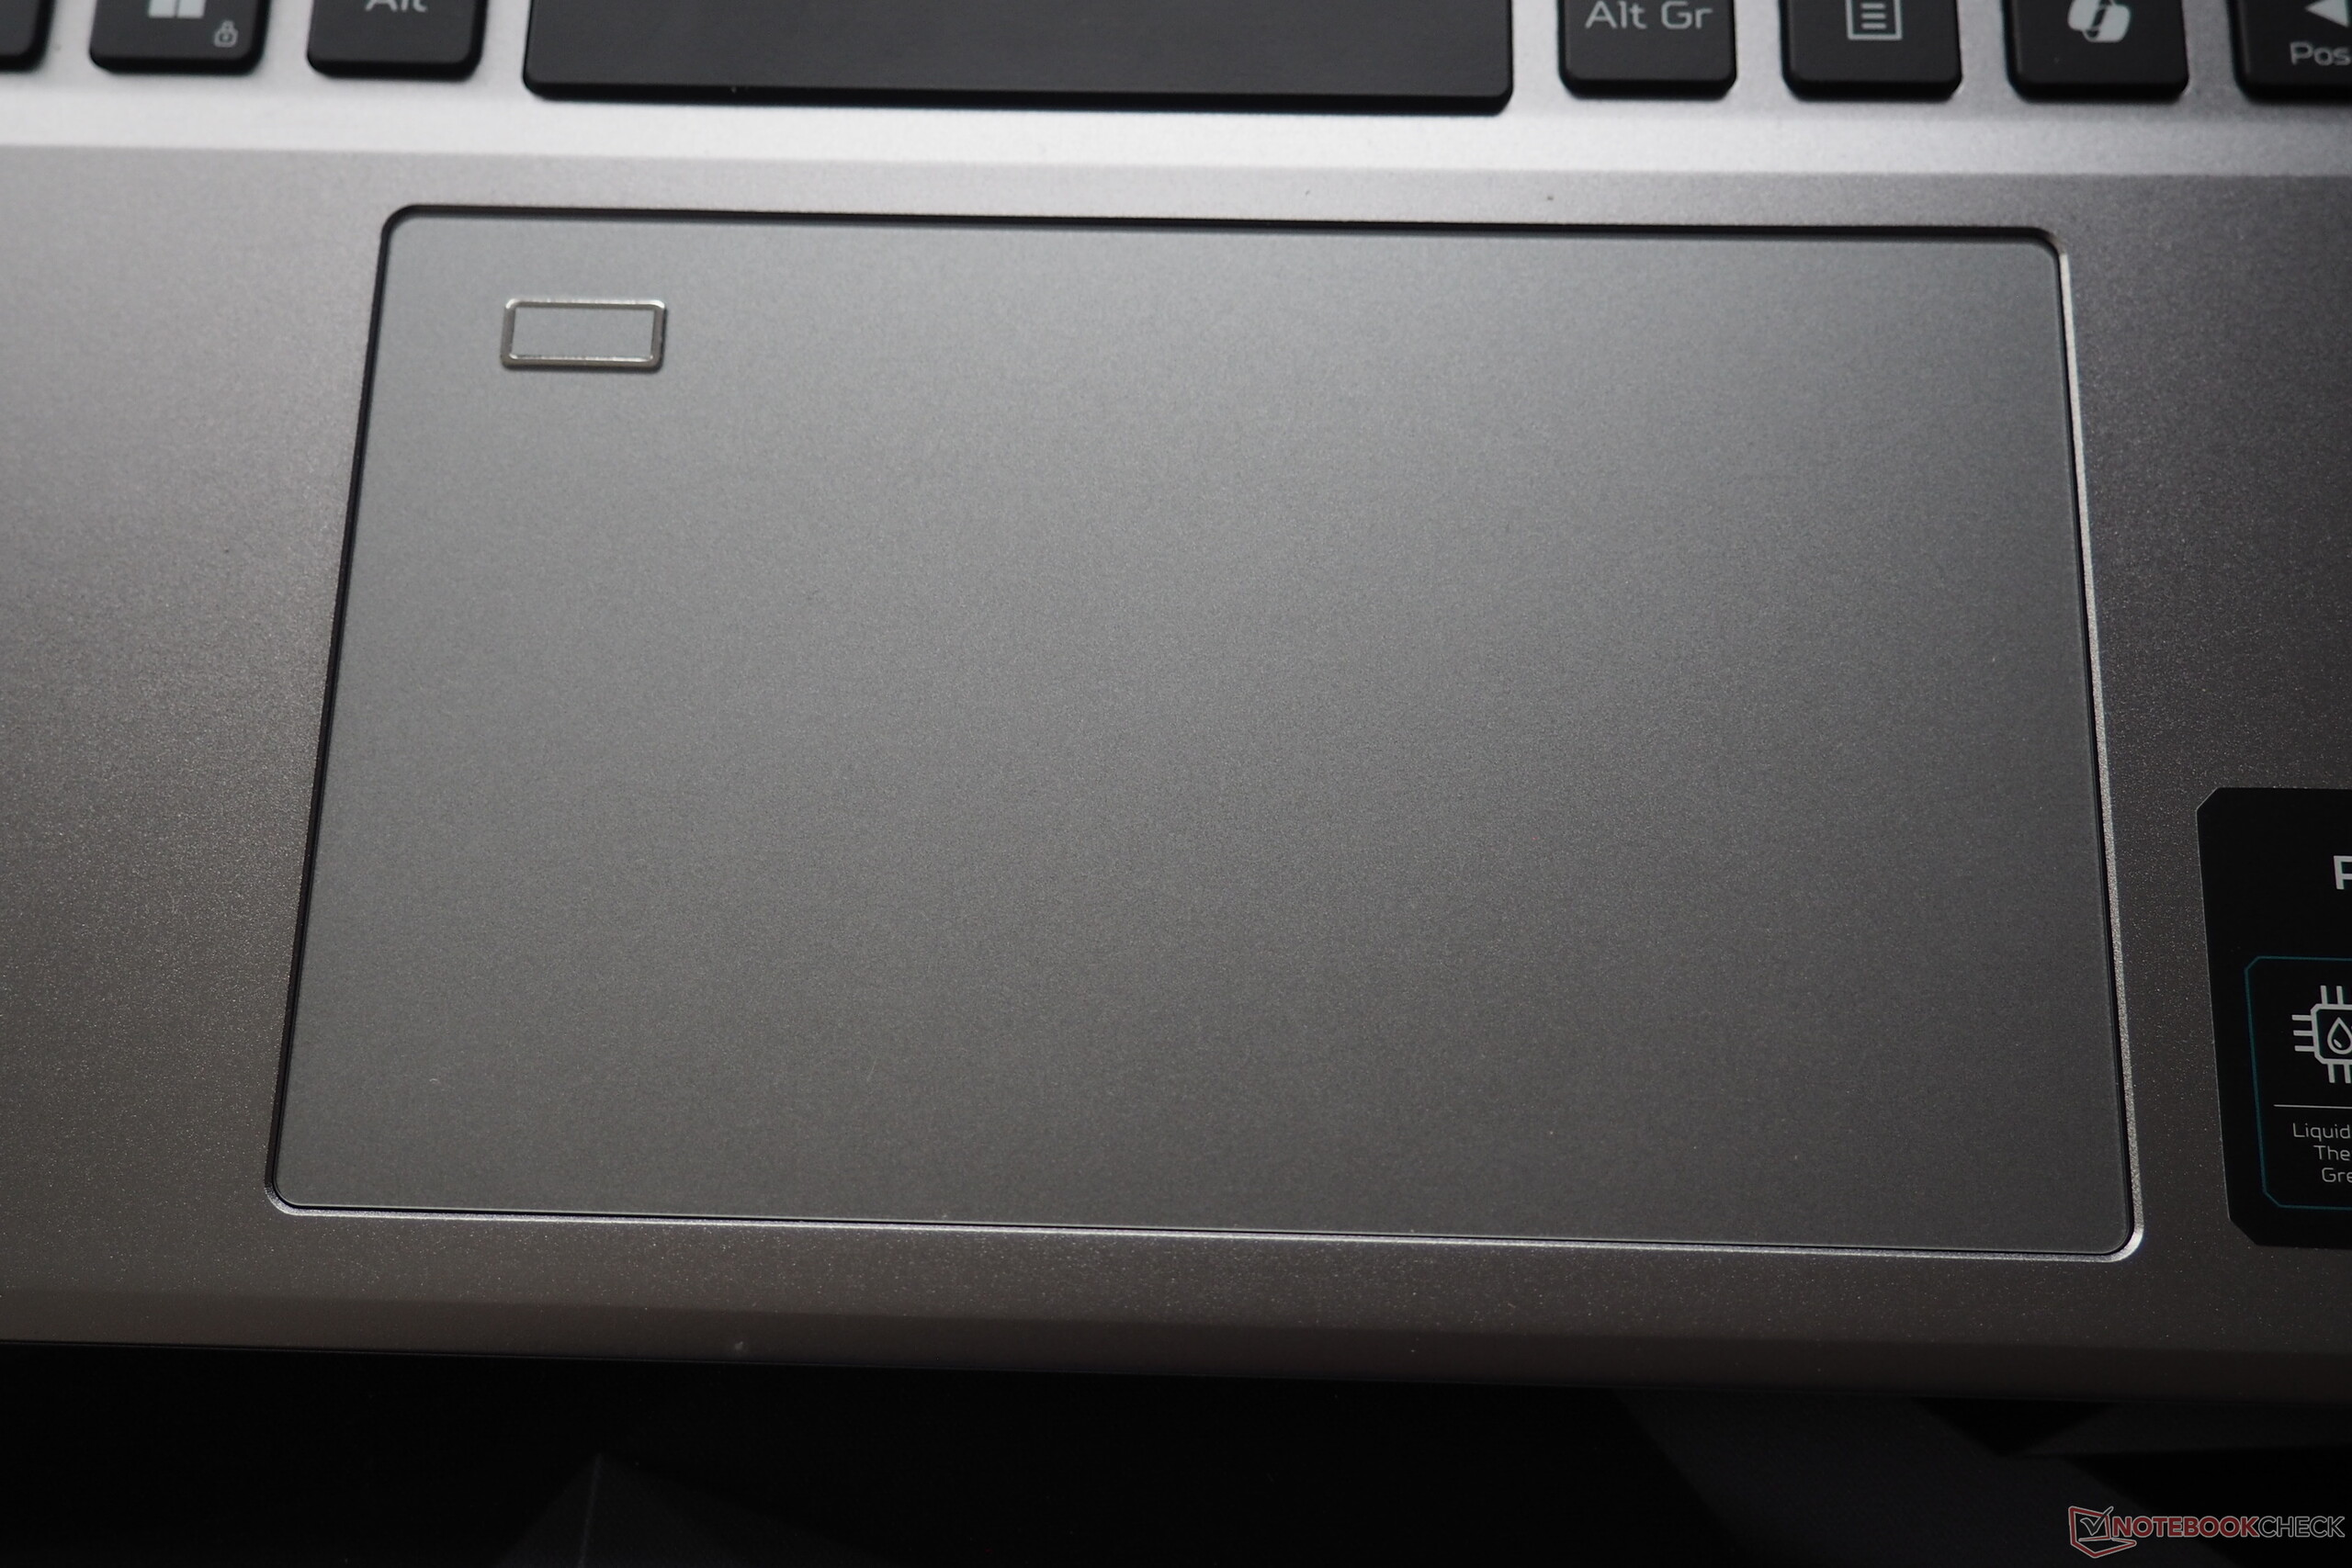
Pavé tactile
D'une taille de 15 x 9 cm, le pavé tactile de l'appareil est extrêmement généreux, mais à notre avis, il aurait pu être un peu plus stable, car les clics vers la gauche en particulier entraînent un certain fléchissement. Nous décririons sa surface comme étant agréable et lisse. Nous n'avons rien à redire non plus sur la prise en charge des gestes et du multi-touch.
Affichage
Contrairement au Nitro V 16qui doit se contenter d'un espace colorimétrique limité et d'une luminosité relativement faible, le Predator Triton Neo 16 dispose d'un écran IPS de haute qualité.
| |||||||||||||||||||||||||
Homogénéité de la luminosité: 90 %
Valeur mesurée au centre, sur batterie: 458 cd/m²
Contraste: 1090:1 (Valeurs des noirs: 0.42 cd/m²)
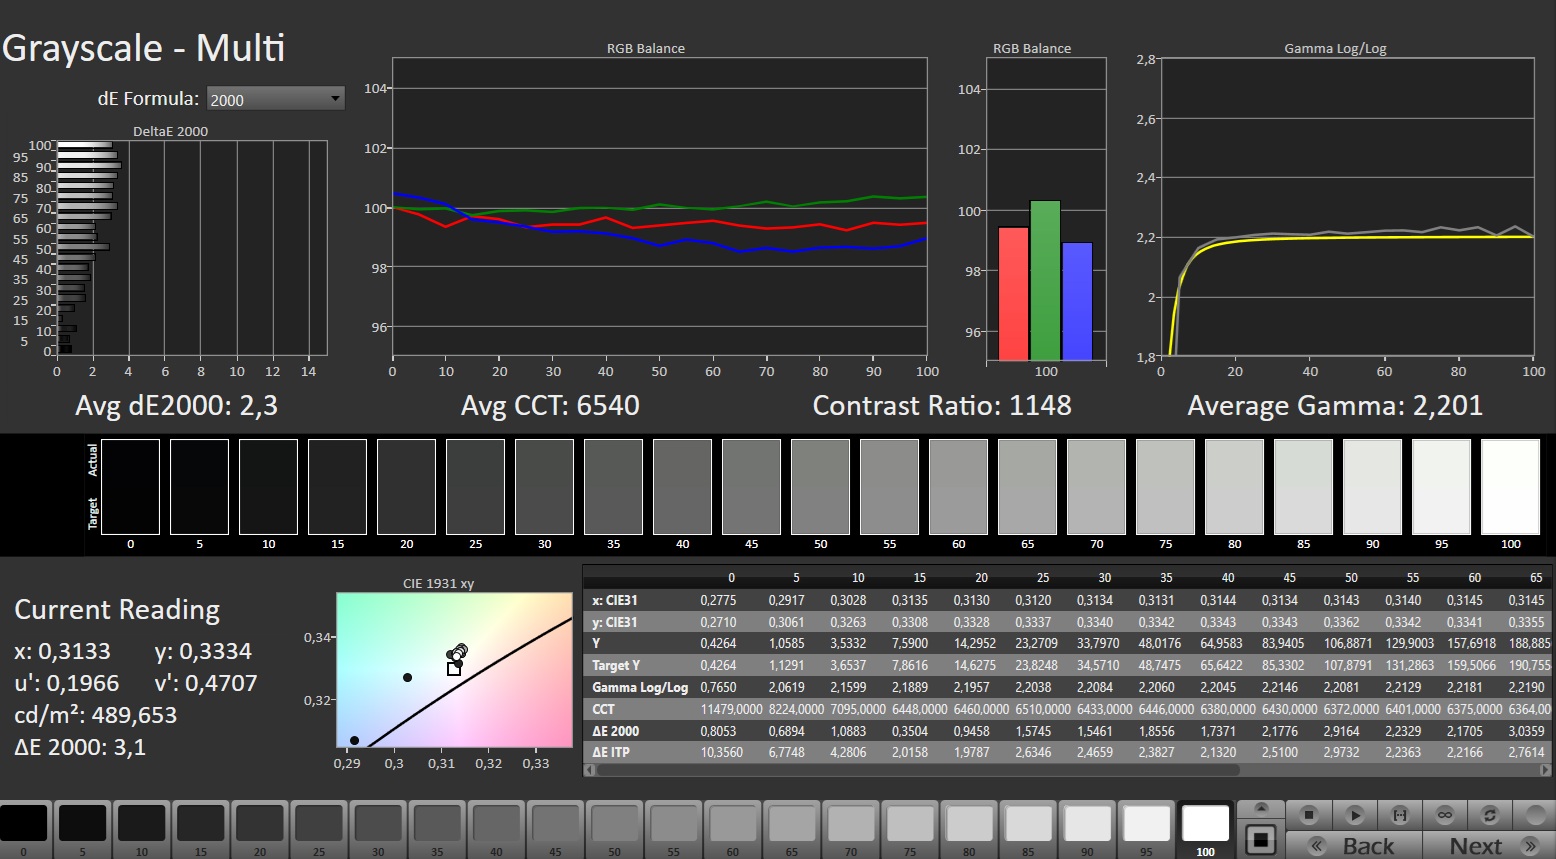
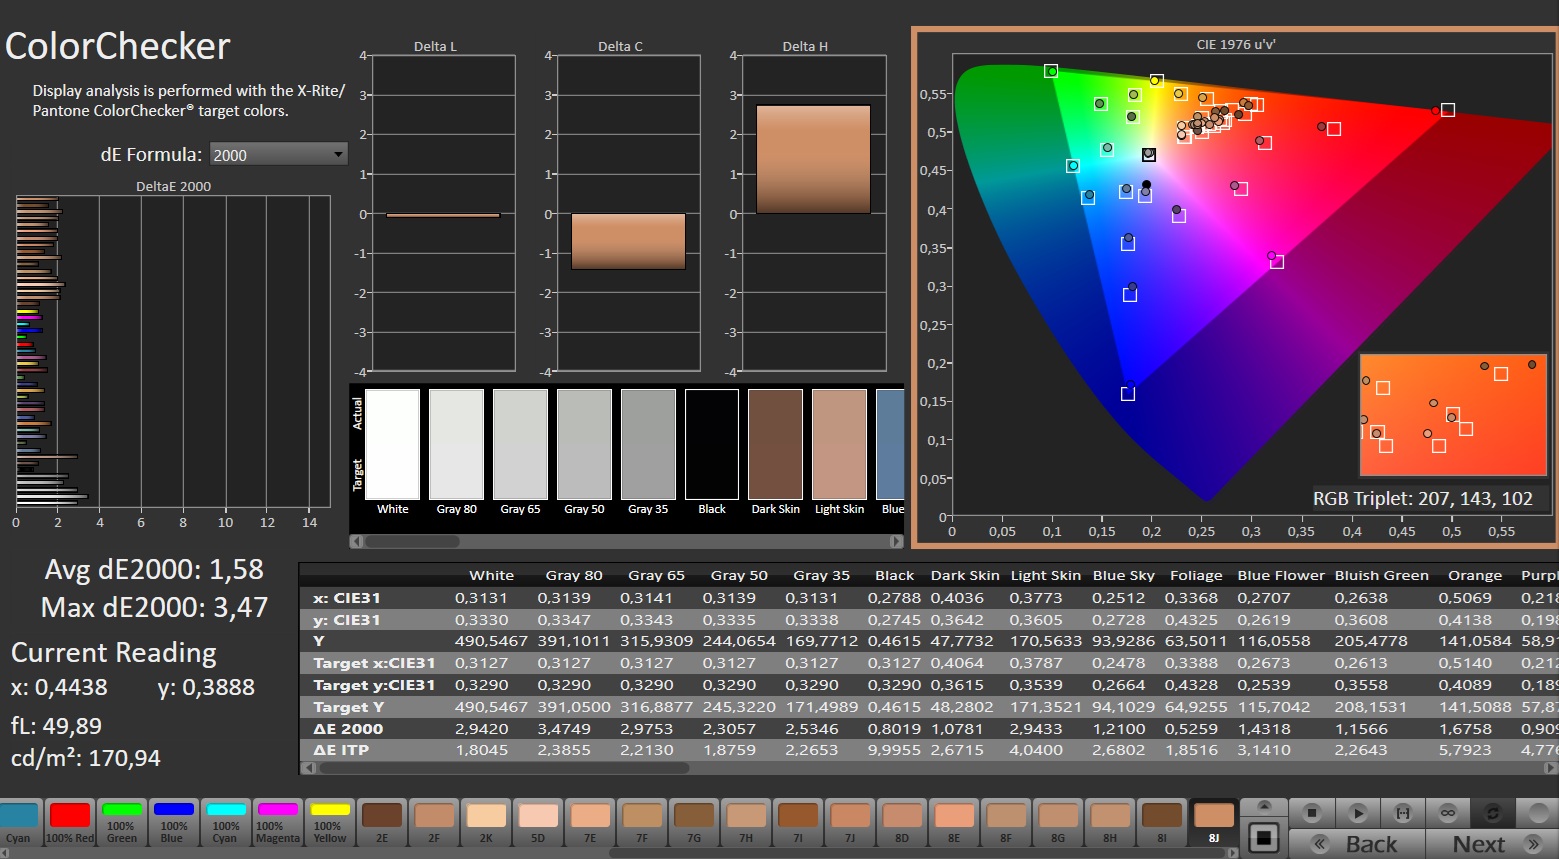
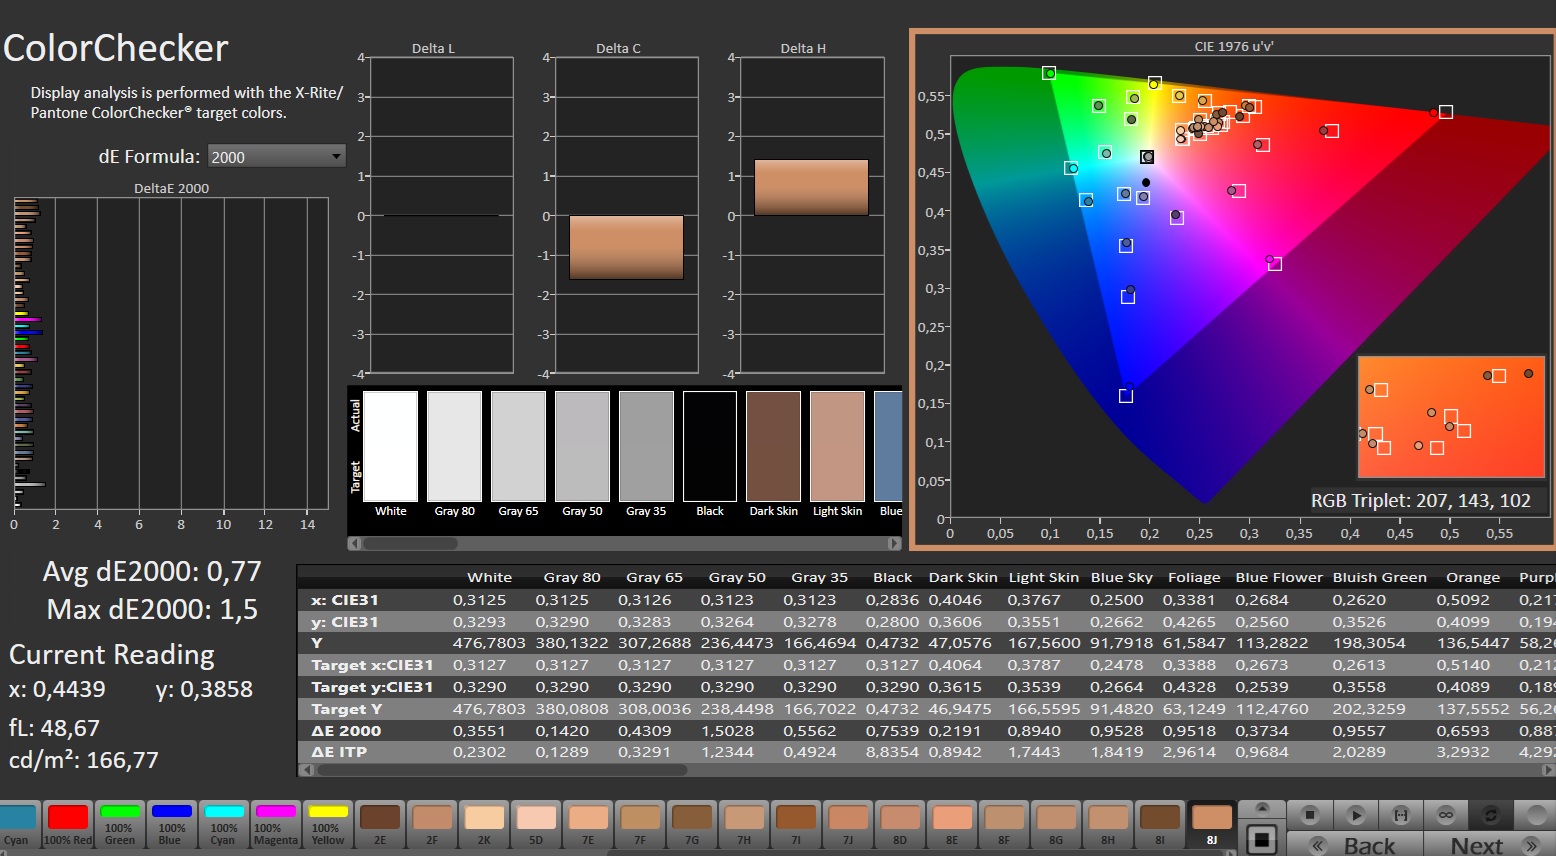
ΔE ColorChecker Calman: 1.58 | ∀{0.5-29.43 Ø4.73}
calibrated: 0.77
ΔE Greyscale Calman: 2.3 | ∀{0.09-98 Ø4.97}
85.3% AdobeRGB 1998 (Argyll 3D)
99.7% sRGB (Argyll 3D)
94.2% Display P3 (Argyll 3D)
Gamma: 2.201
CCT: 6540 K
| Acer Predator Triton Neo 16 PTN16-51-978P AU Optronics B160QAN04.S, IPS, 3200x2000, 16", 165 Hz | Asus ProArt P16 H7606WI ATNA60YV02-0, OLED, 3840x2400, 16", 60 Hz | Lenovo Yoga Pro 9 16IMH9 LEN160-3.2K, Mini-LED, 3200x2000, 16", 165 Hz | Asus ROG Zephyrus G16 2024 GU605M ATNA60DL01-0, OLED, 2560x1600, 16", 240 Hz | Alienware m16 R2 BOE NE16NYH, IPS, 2560x1600, 16", 240 Hz | |
|---|---|---|---|---|---|
| Display | 7% | 2% | 7% | -14% | |
| Display P3 Coverage (%) | 94.2 | 99.9 6% | 97 3% | 99.9 6% | 71 -25% |
| sRGB Coverage (%) | 99.7 | 100 0% | 99.9 0% | 100 0% | 100 0% |
| AdobeRGB 1998 Coverage (%) | 85.3 | 99.1 16% | 86.6 2% | 96.9 14% | 71.4 -16% |
| Response Times | 83% | -137% | 97% | 2% | |
| Response Time Grey 50% / Grey 80% * (ms) | 12.3 ? | 1.58 ? 87% | 22.2 ? -80% | 0.22 ? 98% | 5.7 ? 54% |
| Response Time Black / White * (ms) | 5.8 ? | 1.25 ? 78% | 17 ? -193% | 0.25 ? 96% | 8.7 ? -50% |
| PWM Frequency (Hz) | 240 ? | 4840 ? | 960 ? | ||
| PWM Amplitude * (%) | 36 | ||||
| Screen | 11% | 29% | 2% | -2% | |
| Brightness middle (cd/m²) | 458 | 355 -22% | 651 42% | 416 -9% | 345.8 -24% |
| Brightness (cd/m²) | 453 | 360 -21% | 673 49% | 418 -8% | 337 -26% |
| Brightness Distribution (%) | 90 | 98 9% | 93 3% | 96 7% | 87 -3% |
| Black Level * (cd/m²) | 0.42 | 0.22 48% | 0.3 29% | ||
| Contrast (:1) | 1090 | 2959 171% | 1153 6% | ||
| Colorchecker dE 2000 * | 1.58 | 1.2 24% | 1.9 -20% | 1.6 -1% | 1.99 -26% |
| Colorchecker dE 2000 max. * | 3.47 | 2.6 25% | 4.2 -21% | 2.1 39% | 3.52 -1% |
| Colorchecker dE 2000 calibrated * | 0.77 | 0.6 22% | 0.62 19% | ||
| Greyscale dE 2000 * | 2.3 | 1.2 48% | 3 -30% | 2.7 -17% | 2.1 9% |
| Gamma | 2.201 100% | 2.14 103% | 2.18 101% | 2.16 102% | 2.32 95% |
| CCT | 6540 99% | 6526 100% | 6738 96% | 6331 103% | 6369 102% |
| Moyenne finale (programmes/paramètres) | 34% /
23% | -35% /
-0% | 35% /
20% | -5% /
-4% |
* ... Moindre est la valeur, meilleures sont les performances
La luminosité moyenne de 453 cd/m² est non seulement suffisante pour une utilisation en intérieur, mais aussi, selon les conditions d'éclairage, pour une utilisation en extérieur. En revanche, le rapport de contraste n'est pas très bon, avec un peu moins de 1 100:1, ce qui s'explique par un niveau de noir médiocre (0,42 cd/m²). Ici, les panneaux OLED de certains concurrents montrent qu'il est possible de faire mieux, et il en va de même pour ses temps de réponse (bien qu'ils soient assez bons pour un panneau IPS).

En revanche, l'ordinateur portable Acer est doté d'une surface à faible réflexion et ne présente aucun scintillement, quel que soit le niveau de luminosité.
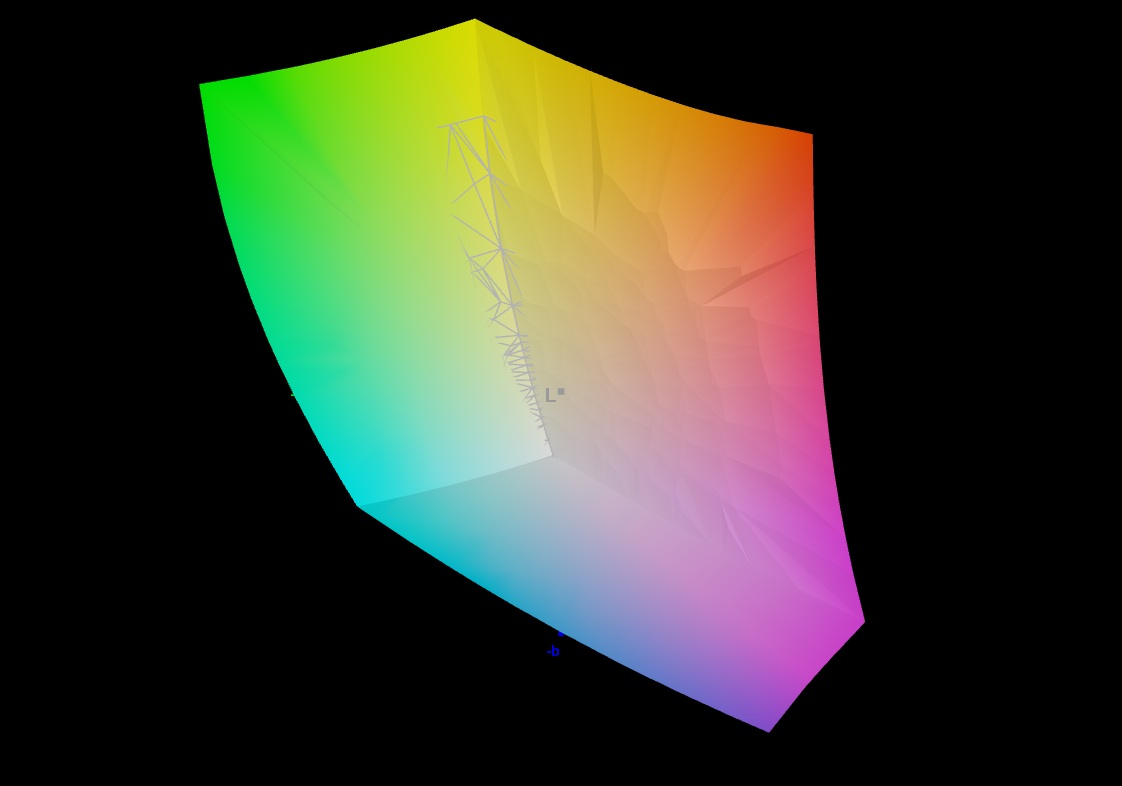
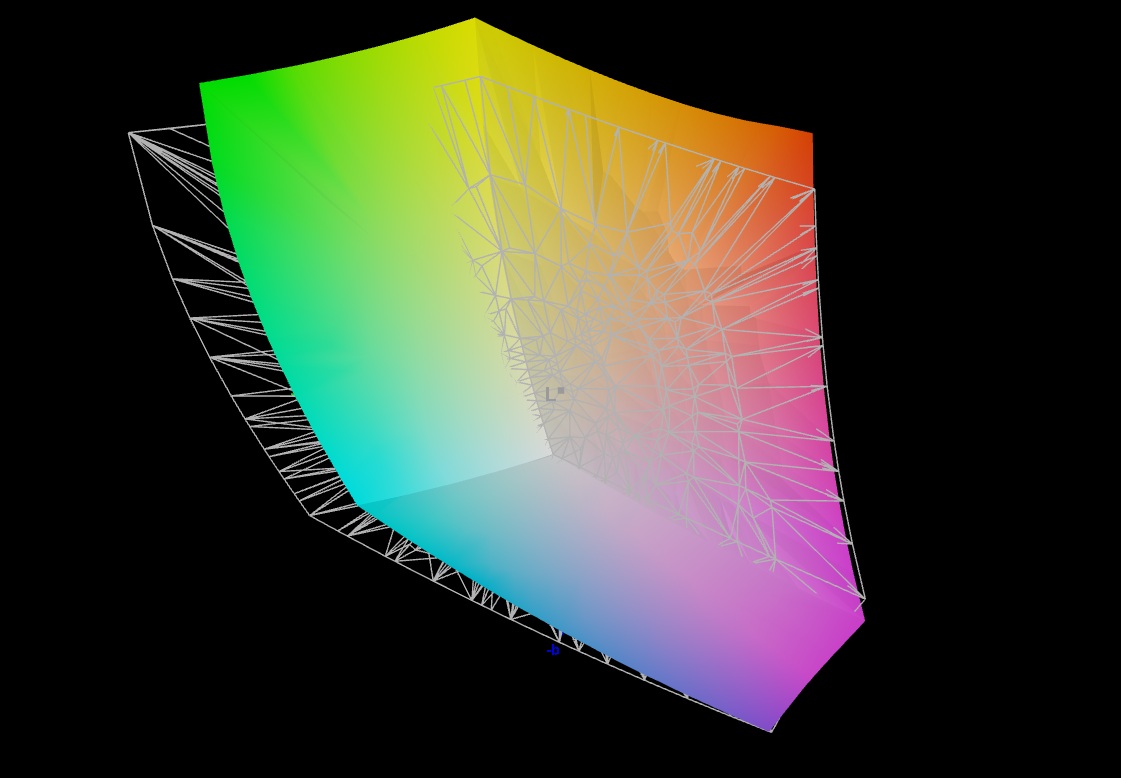

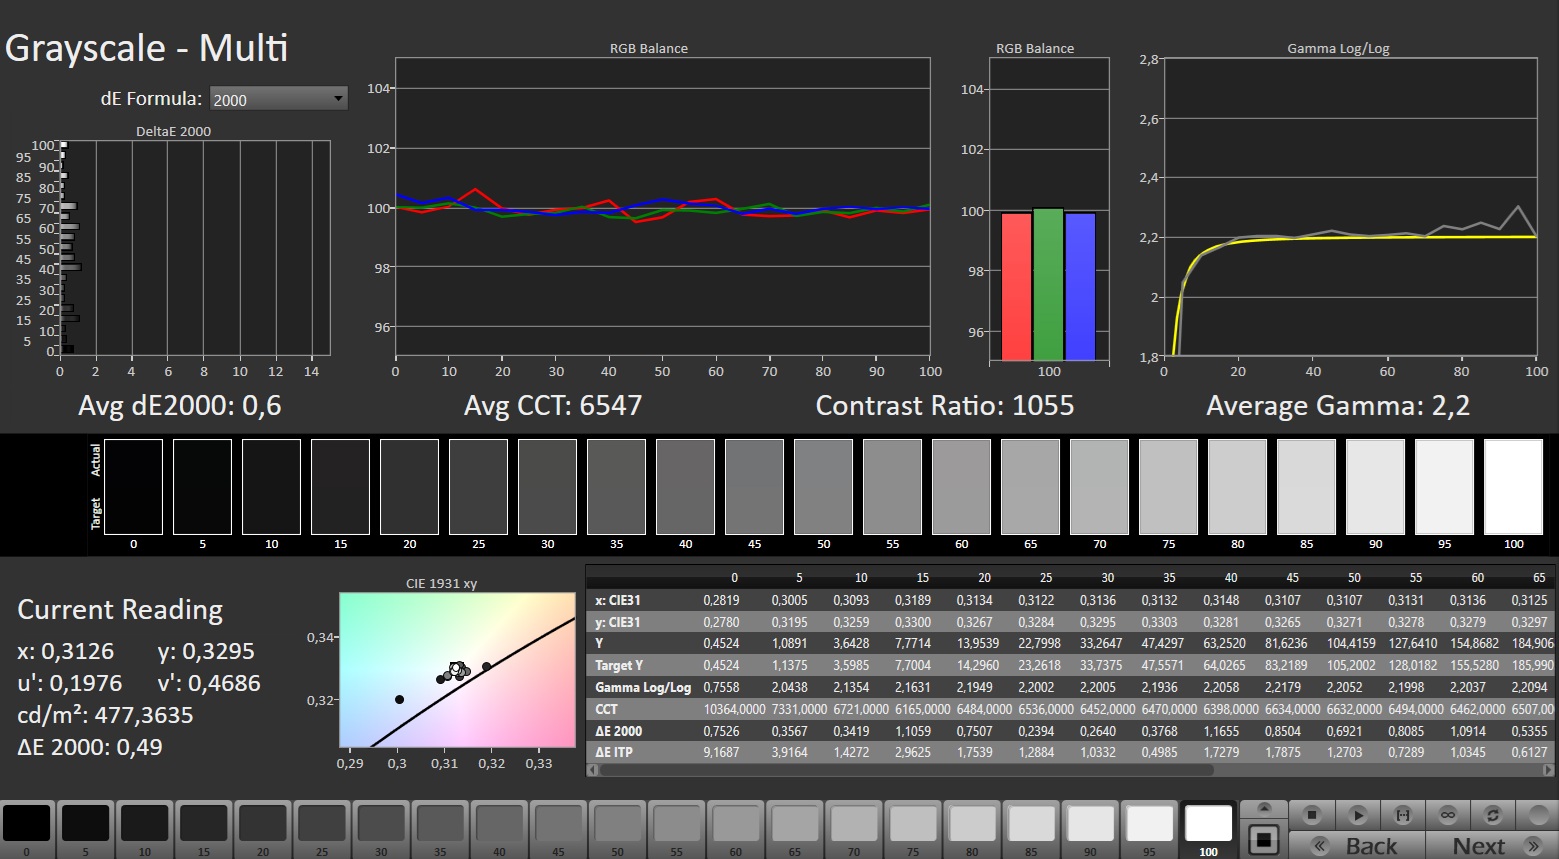
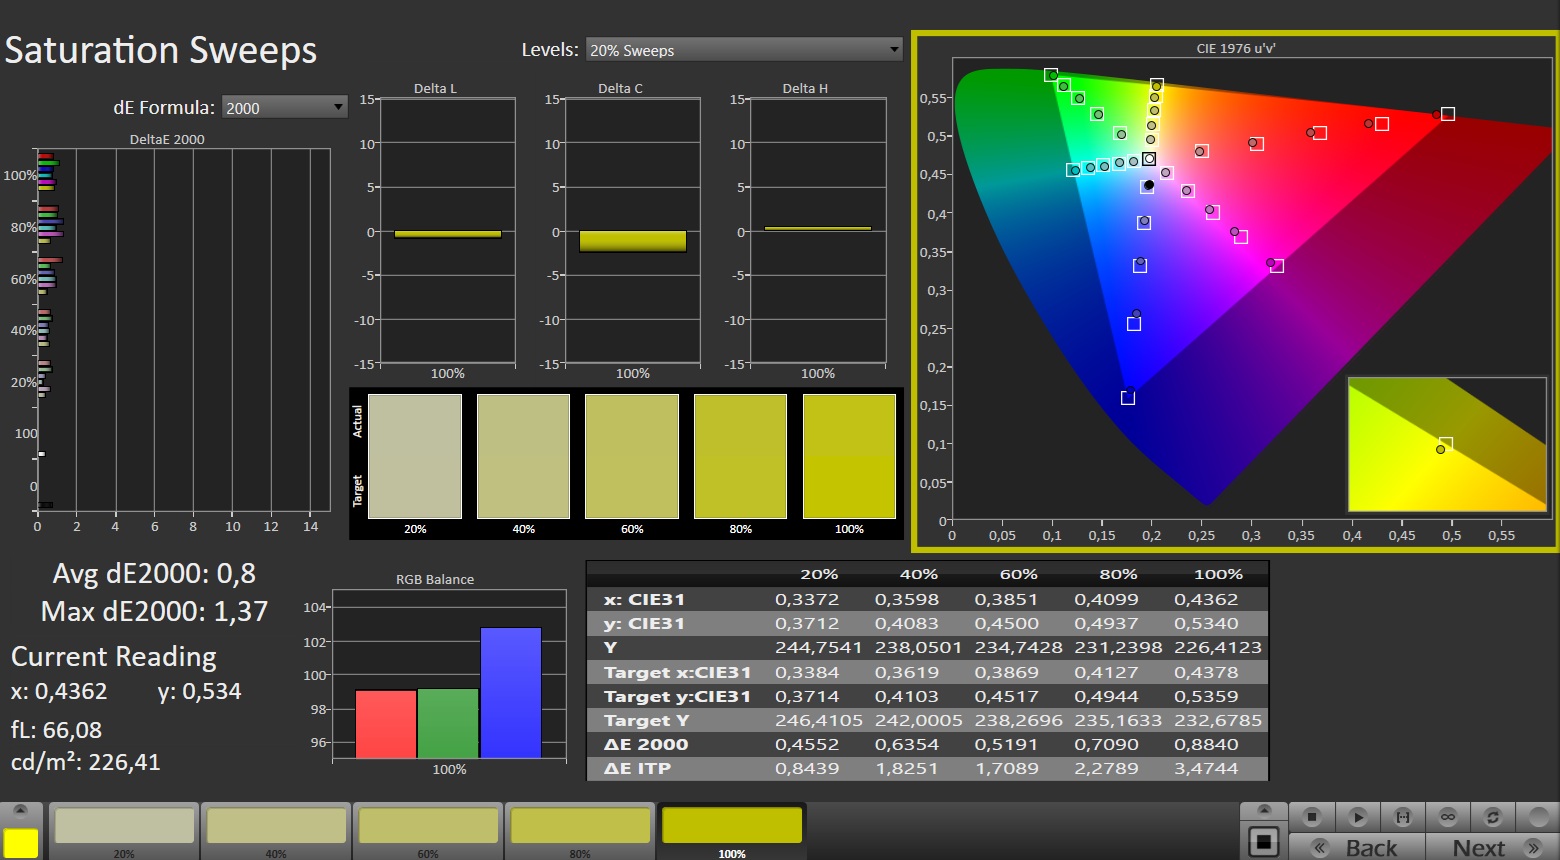
Le Neo 16 vise à séduire les utilisateurs professionnels grâce à son large espace colorimétrique : La couverture de presque 100 % de sRGB, 94 % de DCI-P3 et 85 % d'AdobeRGB fait de ce produit de 16 pouces un véritable produit de création. Grâce à la vérification Calman, les couleurs semblent déjà très naturelles dès la sortie de la boîte. L'ensemble est complété par des angles de vision raisonnables.


Temps de réponse de l'écran
| ↔ Temps de réponse noir à blanc | ||
|---|---|---|
| 5.8 ms ... hausse ↗ et chute ↘ combinées | ↗ 2.2 ms hausse | 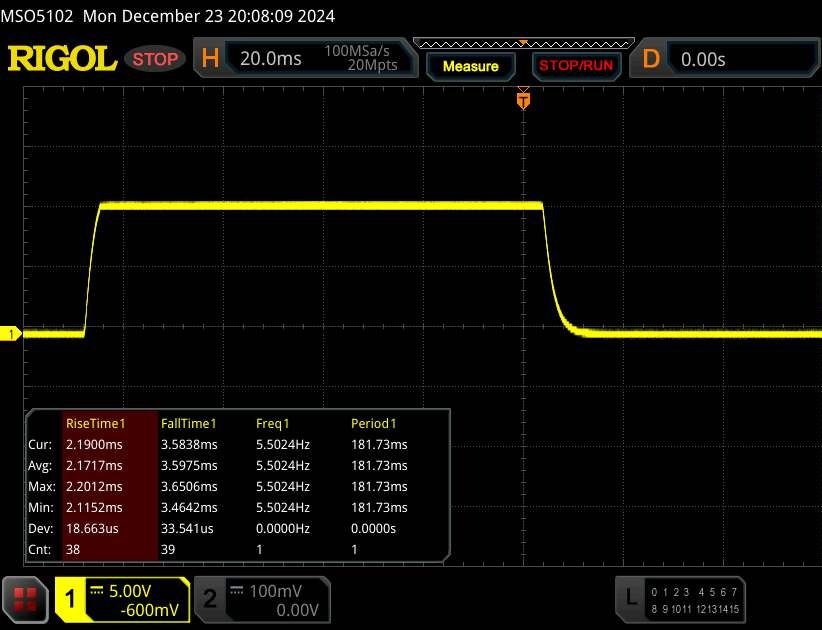 |
| ↘ 3.6 ms chute | ||
| L'écran montre de très faibles temps de réponse, parfait pour le jeu. En comparaison, tous les appareils testés affichent entre 0.1 (minimum) et 240 (maximum) ms. » 18 % des appareils testés affichent de meilleures performances. Cela signifie que les latences relevées sont meilleures que la moyenne (19.9 ms) de tous les appareils testés. | ||
| ↔ Temps de réponse gris 50% à gris 80% | ||
| 12.3 ms ... hausse ↗ et chute ↘ combinées | ↗ 5.9 ms hausse | 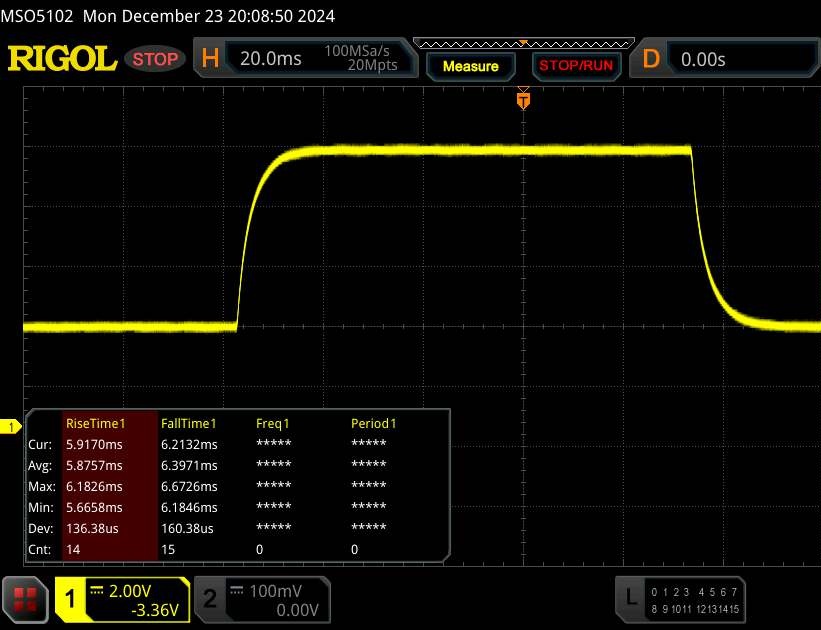 |
| ↘ 6.4 ms chute | ||
| L'écran montre de bons temps de réponse, mais insuffisant pour du jeu compétitif. En comparaison, tous les appareils testés affichent entre 0.165 (minimum) et 636 (maximum) ms. » 26 % des appareils testés affichent de meilleures performances. Cela signifie que les latences relevées sont meilleures que la moyenne (31.1 ms) de tous les appareils testés. | ||
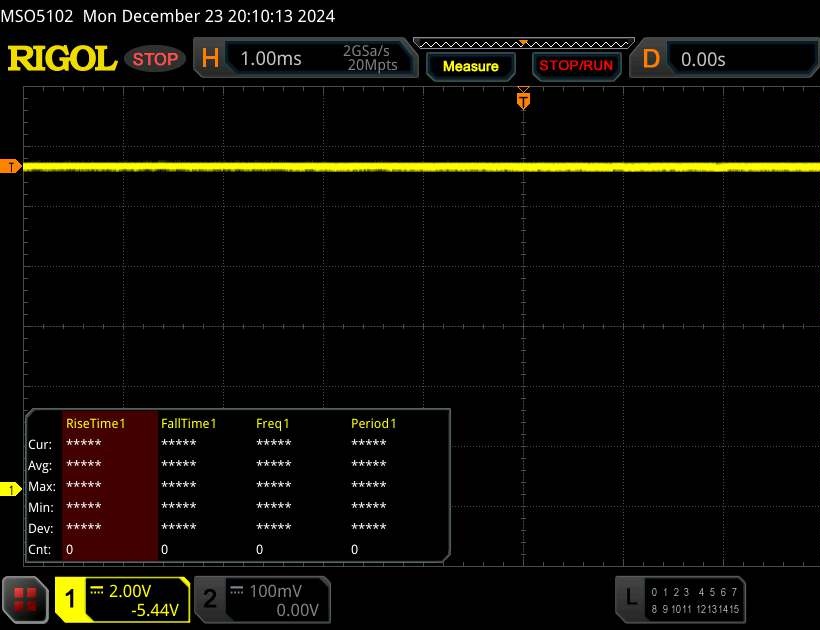
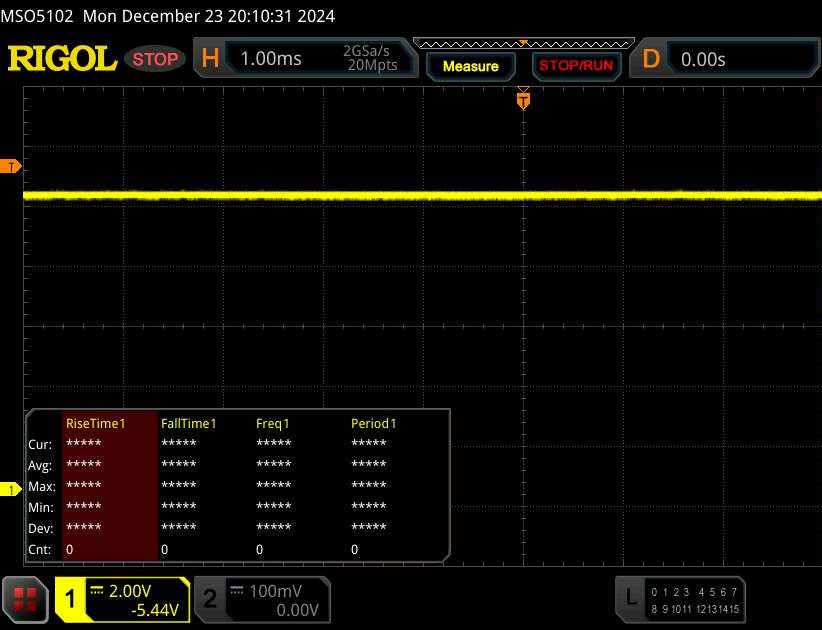
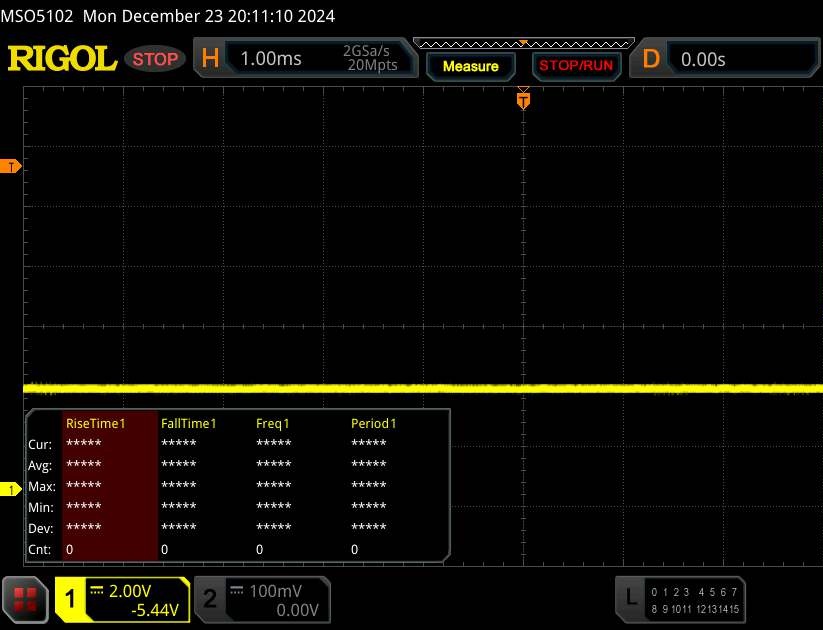
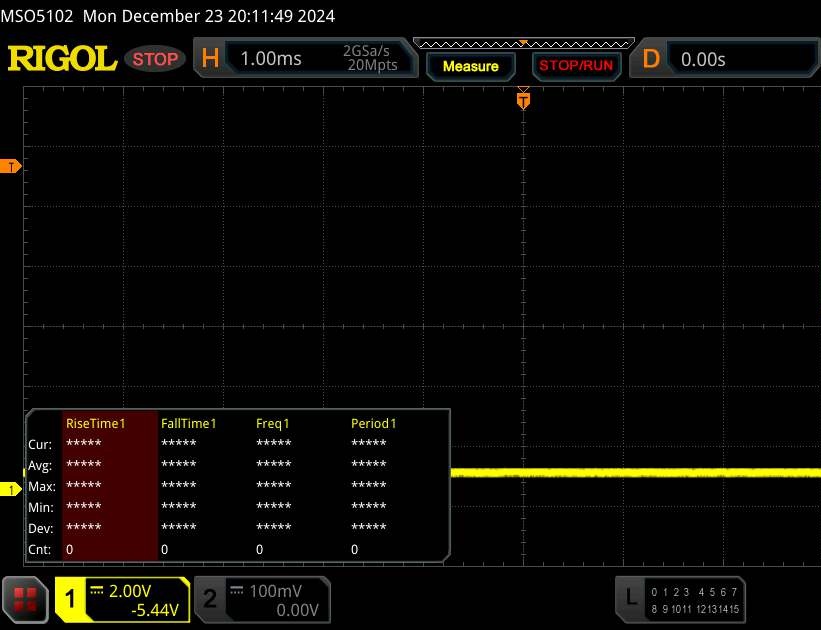
Scintillement / MLI (Modulation de largeur d'impulsion)
| Scintillement / MLI (Modulation de largeur d'impulsion) non décelé | 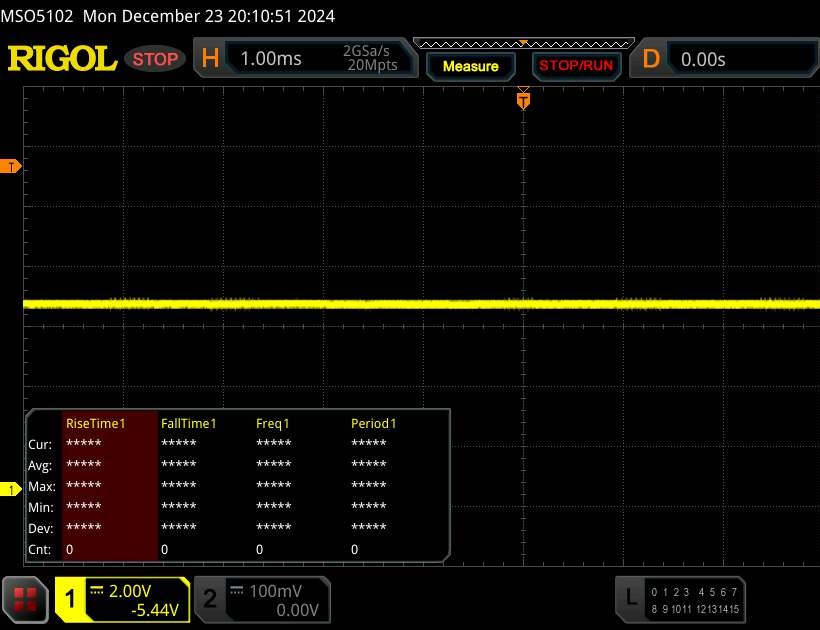 | ||
En comparaison, 52 % des appareils testés n'emploient pas MDI pour assombrir leur écran. Nous avons relevé une moyenne à 7784 (minimum : 5 - maximum : 343500) Hz dans le cas où une MDI était active. | |||
Performance
Les performances de notre version de test PTN16-51-978P se situent dans le milieu de gamme (supérieur). Le Predator Triton Neo 16 est proposé à partir d'un peu moins de 1 200 dollars. Le modèle d'entrée de gamme est équipé d'un écran WQXGA (2 560 x 1 600 pixels, 240 Hz), d'un processeur Core Ultra 7 155H, a GeForce RTX 406016 Go de RAM et un disque dur SSD de 1 To.
Conditions d'essai
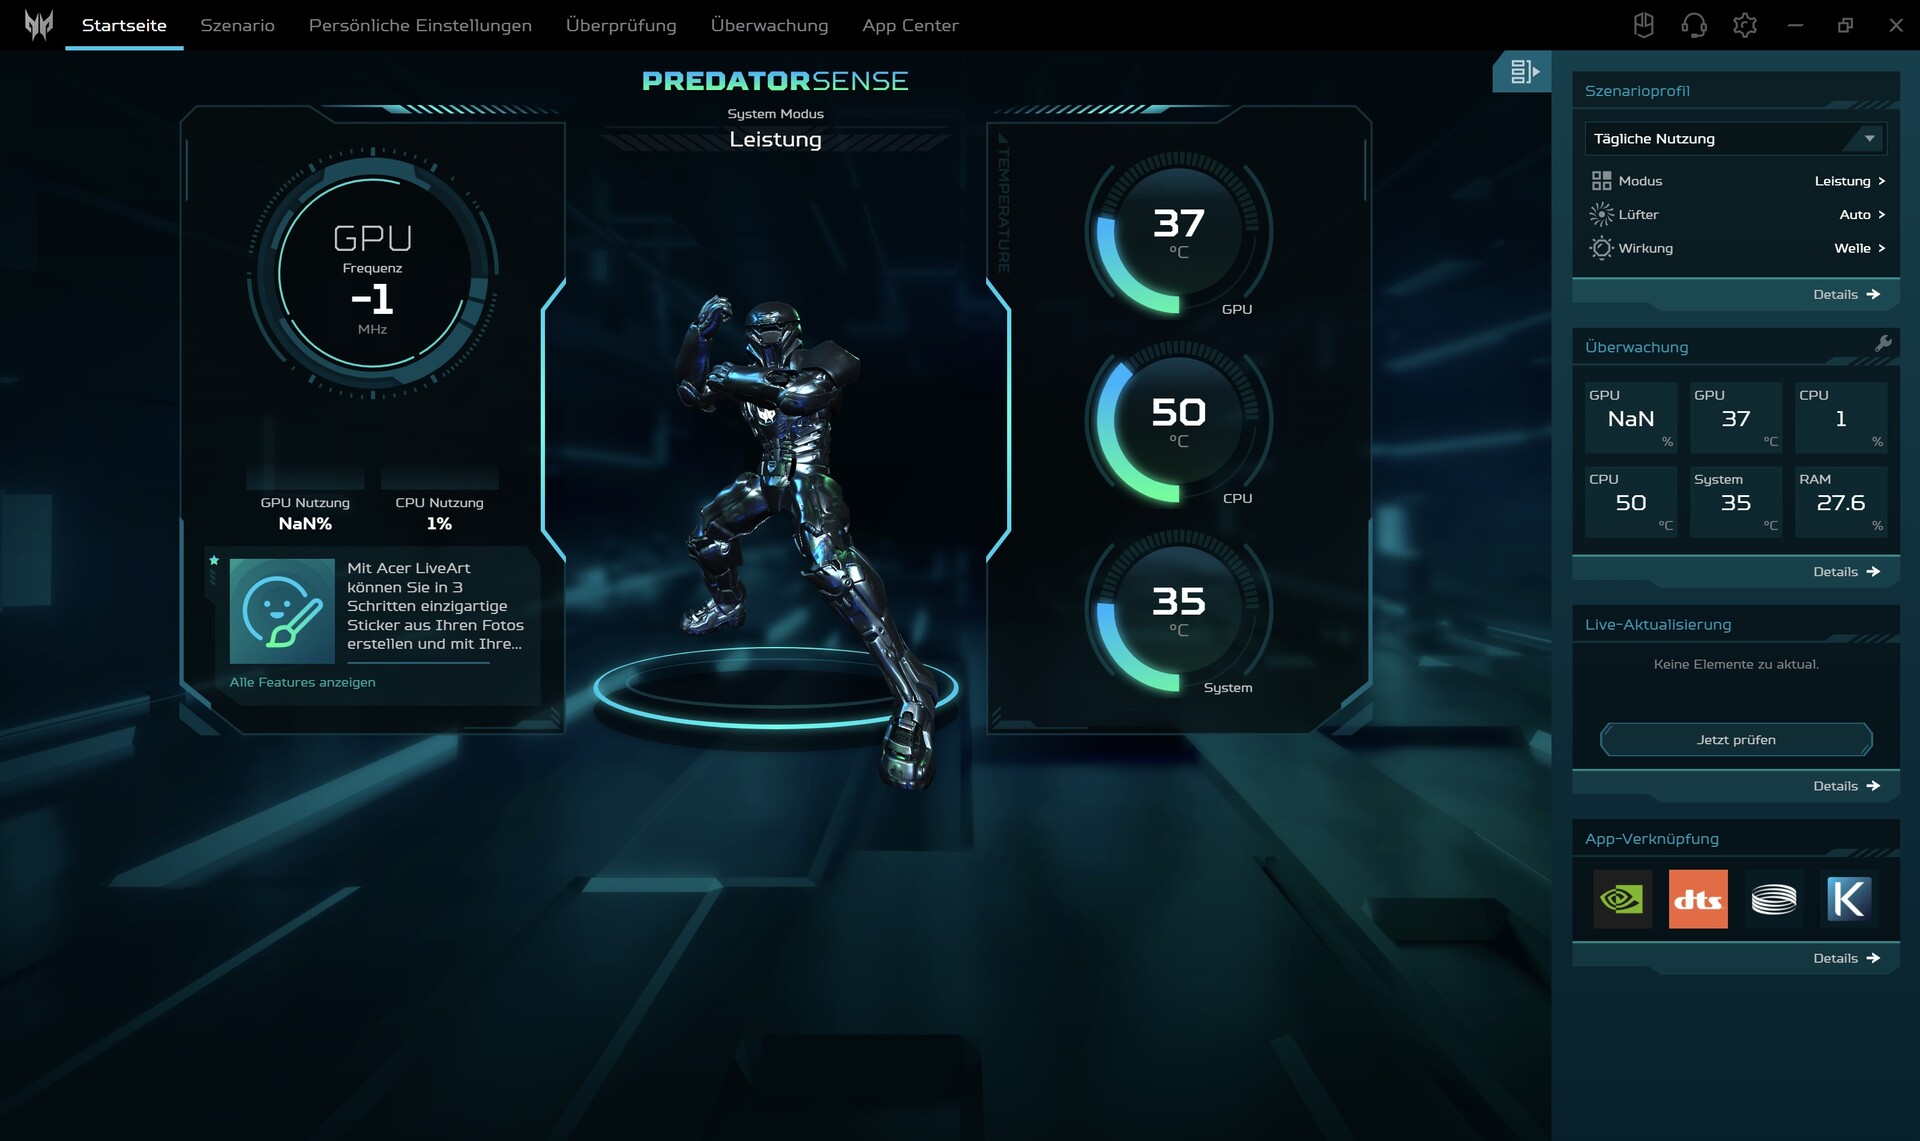
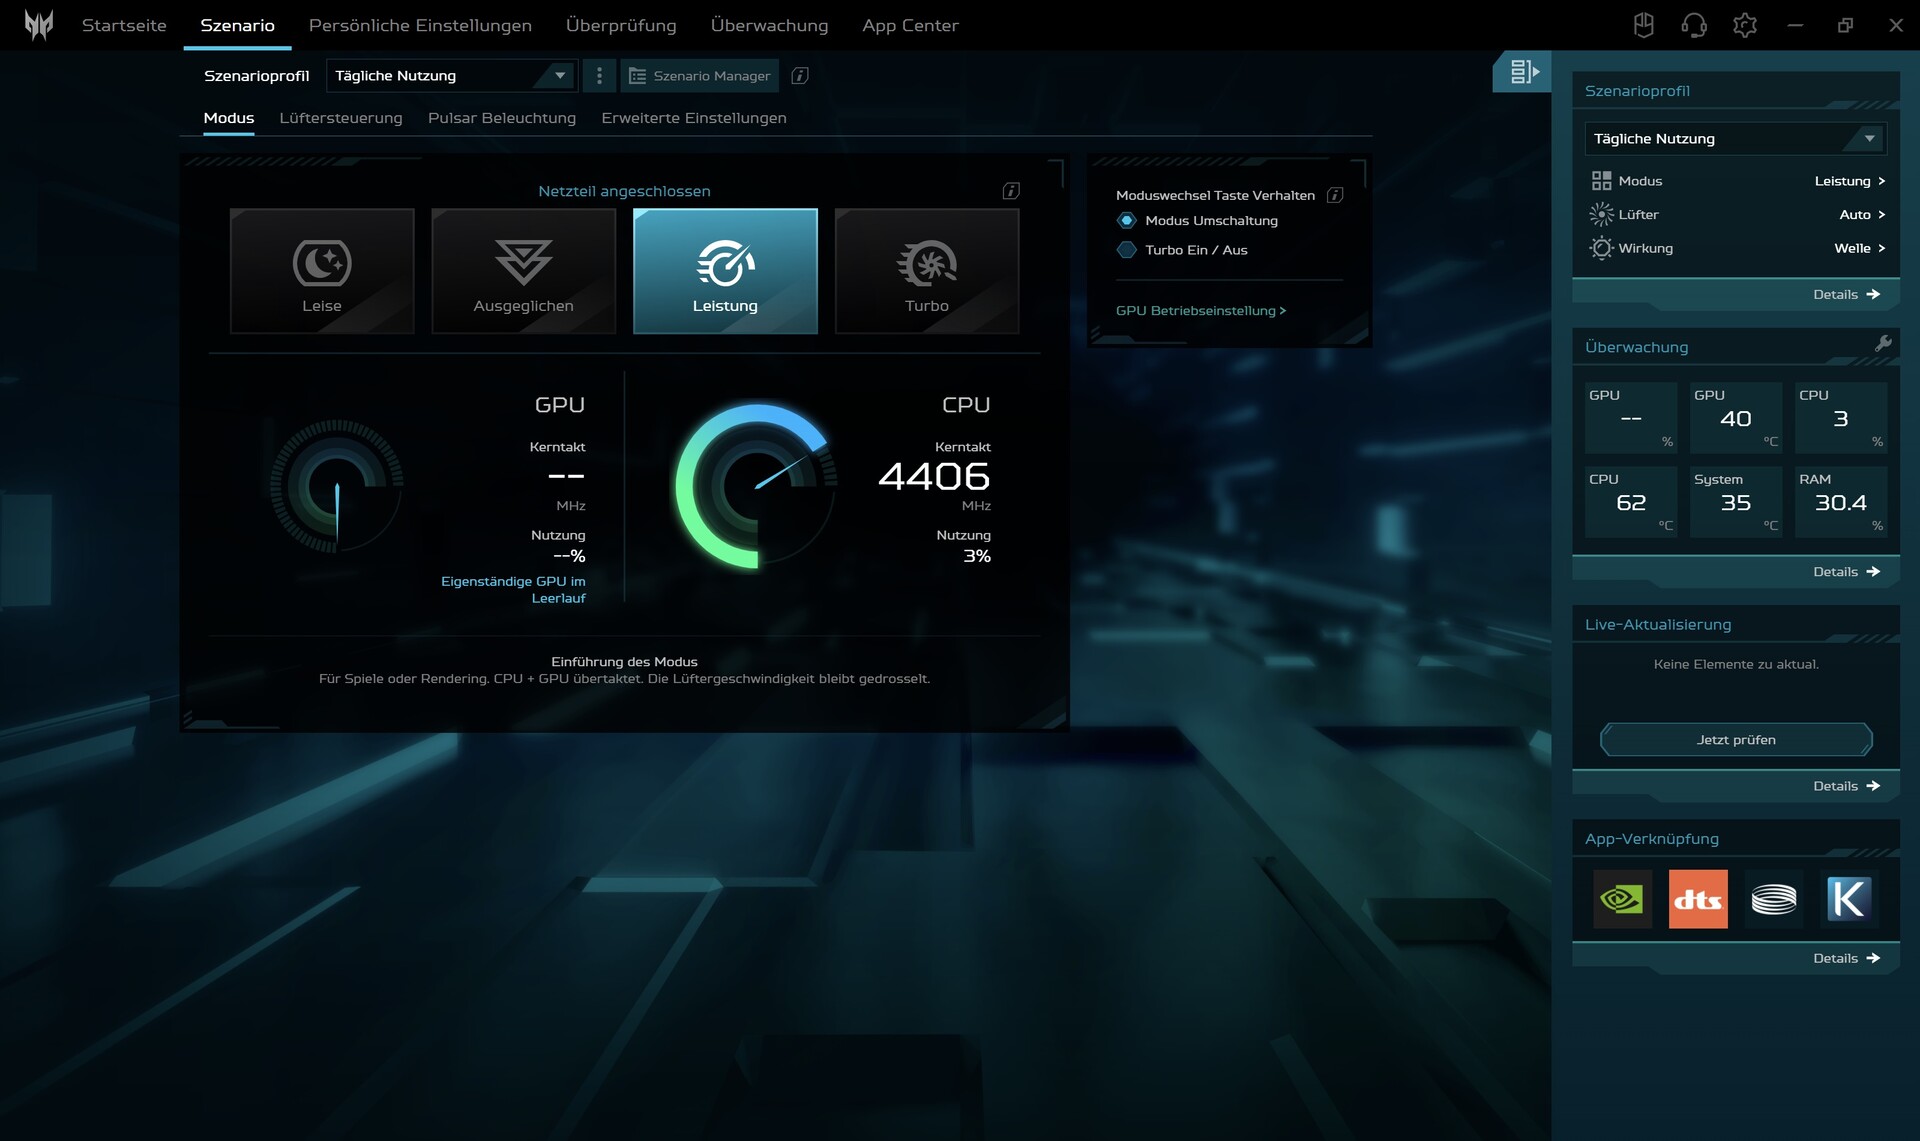
Les utilisateurs peuvent choisir entre quatre profils différents, dont certains diffèrent sensiblement en termes de performances et de niveau sonore. Le mode Turbo étant très bruyant en mode 3D (près de 58 dB), nous avons opté pour le mode Performance lors de nos tests, qui offre un peu moins de performances, mais garantit également un bruit de fonctionnement nettement plus faible (bien que toujours élevé).
| Cyberpunk 2077 Séquence en boucle (FHD/Ultra) | Silencieux | Équilibré | Performant | Turbo |
| Bruit | 39 dB(A) | 47 dB(A) | 50 dB(A) | 58 dB(A) |
| Performance | 32 fps | 62 fps | 66 fps | 74 fps |
| Consommation électrique de la carte GPU | max. 53 watts | max. 66 watts | max. 76 watts | max. 116 watts |
Processeur
Le Core Ultra 9 185H est un puissant processeur pour ordinateur portable avec 16 cœurs (trois types de cœurs différents), qui peut traiter jusqu'à 22 threads simultanément grâce à l'hyperthreading. Lors de notre test de référence, les performances du processeur se situaient à peu près au niveau de la moyenne que nous avions déterminée pour l'Ultra 9 185H. Cependant, l'Ultra 7 155H, que l'on trouve chez certains concurrents, était souvent à peine plus lent (l'Alienware m16 est même légèrement en tête du classement général). La boucle Cinebench a également montré que les résultats de l'ordinateur portable Acer n'étaient pas particulièrement constants, mais présentaient plutôt des fluctuations. Cependant, aucun des deux modèles Intel n'a eu la moindre chance contre le modèle AMD Ryzen AI 9 HX 370 d'AMD.
Cinebench R15 Multi continuous test
* ... Moindre est la valeur, meilleures sont les performances
AIDA64: FP32 Ray-Trace | FPU Julia | CPU SHA3 | CPU Queen | FPU SinJulia | FPU Mandel | CPU AES | CPU ZLib | FP64 Ray-Trace | CPU PhotoWorxx
| Performance rating | |
| Moyenne de la classe Gaming | |
| Asus ProArt P16 H7606WI -2! | |
| Lenovo Yoga Pro 9 16IMH9 | |
| Acer Predator Triton Neo 16 PTN16-51-978P | |
| Alienware m16 R2 | |
| Moyenne Intel Core Ultra 9 185H | |
| Asus ROG Zephyrus G16 2024 GU605M | |
| AIDA64 / FP32 Ray-Trace | |
| Moyenne de la classe Gaming (10227 - 85542, n=107, 2 dernières années) | |
| Acer Predator Triton Neo 16 PTN16-51-978P | |
| Alienware m16 R2 | |
| Lenovo Yoga Pro 9 16IMH9 | |
| Asus ROG Zephyrus G16 2024 GU605M | |
| Moyenne Intel Core Ultra 9 185H (9220 - 18676, n=20) | |
| AIDA64 / FPU Julia | |
| Asus ProArt P16 H7606WI | |
| Moyenne de la classe Gaming (51376 - 238426, n=107, 2 dernières années) | |
| Acer Predator Triton Neo 16 PTN16-51-978P | |
| Lenovo Yoga Pro 9 16IMH9 | |
| Alienware m16 R2 | |
| Asus ROG Zephyrus G16 2024 GU605M | |
| Moyenne Intel Core Ultra 9 185H (48865 - 96463, n=20) | |
| AIDA64 / CPU SHA3 | |
| Moyenne de la classe Gaming (2180 - 9817, n=107, 2 dernières années) | |
| Asus ProArt P16 H7606WI | |
| Acer Predator Triton Neo 16 PTN16-51-978P | |
| Lenovo Yoga Pro 9 16IMH9 | |
| Alienware m16 R2 | |
| Moyenne Intel Core Ultra 9 185H (2394 - 4534, n=20) | |
| Asus ROG Zephyrus G16 2024 GU605M | |
| AIDA64 / CPU Queen | |
| Moyenne de la classe Gaming (49785 - 173351, n=98, 2 dernières années) | |
| Asus ProArt P16 H7606WI | |
| Acer Predator Triton Neo 16 PTN16-51-978P | |
| Lenovo Yoga Pro 9 16IMH9 | |
| Asus ROG Zephyrus G16 2024 GU605M | |
| Moyenne Intel Core Ultra 9 185H (66785 - 95241, n=20) | |
| Alienware m16 R2 | |
| AIDA64 / FPU SinJulia | |
| Asus ProArt P16 H7606WI | |
| Moyenne de la classe Gaming (4424 - 33636, n=107, 2 dernières années) | |
| Lenovo Yoga Pro 9 16IMH9 | |
| Acer Predator Triton Neo 16 PTN16-51-978P | |
| Asus ROG Zephyrus G16 2024 GU605M | |
| Alienware m16 R2 | |
| Moyenne Intel Core Ultra 9 185H (7255 - 11392, n=20) | |
| AIDA64 / FPU Mandel | |
| Moyenne de la classe Gaming (25115 - 128721, n=107, 2 dernières années) | |
| Alienware m16 R2 | |
| Lenovo Yoga Pro 9 16IMH9 | |
| Acer Predator Triton Neo 16 PTN16-51-978P | |
| Asus ROG Zephyrus G16 2024 GU605M | |
| Moyenne Intel Core Ultra 9 185H (24004 - 48020, n=20) | |
| AIDA64 / CPU AES | |
| Moyenne de la classe Gaming (39258 - 247074, n=107, 2 dernières années) | |
| Lenovo Yoga Pro 9 16IMH9 | |
| Acer Predator Triton Neo 16 PTN16-51-978P | |
| Moyenne Intel Core Ultra 9 185H (53116 - 154066, n=20) | |
| Alienware m16 R2 | |
| Asus ProArt P16 H7606WI | |
| Asus ROG Zephyrus G16 2024 GU605M | |
| AIDA64 / CPU ZLib | |
| Moyenne de la classe Gaming (574 - 2531, n=107, 2 dernières années) | |
| Asus ProArt P16 H7606WI | |
| Lenovo Yoga Pro 9 16IMH9 | |
| Acer Predator Triton Neo 16 PTN16-51-978P | |
| Alienware m16 R2 | |
| Moyenne Intel Core Ultra 9 185H (678 - 1341, n=20) | |
| Asus ROG Zephyrus G16 2024 GU605M | |
| AIDA64 / FP64 Ray-Trace | |
| Asus ProArt P16 H7606WI | |
| Moyenne de la classe Gaming (5509 - 45446, n=107, 2 dernières années) | |
| Alienware m16 R2 | |
| Lenovo Yoga Pro 9 16IMH9 | |
| Acer Predator Triton Neo 16 PTN16-51-978P | |
| Asus ROG Zephyrus G16 2024 GU605M | |
| Moyenne Intel Core Ultra 9 185H (4428 - 10078, n=20) | |
| AIDA64 / CPU PhotoWorxx | |
| Lenovo Yoga Pro 9 16IMH9 | |
| Asus ROG Zephyrus G16 2024 GU605M | |
| Moyenne Intel Core Ultra 9 185H (44547 - 53918, n=20) | |
| Asus ProArt P16 H7606WI | |
| Acer Predator Triton Neo 16 PTN16-51-978P | |
| Moyenne de la classe Gaming (12271 - 89891, n=107, 2 dernières années) | |
| Alienware m16 R2 | |
Performance du système
Les performances du système sont sans surprise. 7 443 points dans PCMark 10 sont typiques d'un appareil avec ces composants ou de cette classe de performance.
CrossMark: Overall | Productivity | Creativity | Responsiveness
WebXPRT 3: Overall
WebXPRT 4: Overall
Mozilla Kraken 1.1: Total
| PCMark 10 / Score | |
| Moyenne de la classe Gaming (5828 - 11574, n=94, 2 dernières années) | |
| Alienware m16 R2 | |
| Asus ProArt P16 H7606WI | |
| Moyenne Intel Core Ultra 9 185H, NVIDIA GeForce RTX 4070 Laptop GPU (7443 - 7761, n=4) | |
| Lenovo Yoga Pro 9 16IMH9 | |
| Acer Predator Triton Neo 16 PTN16-51-978P | |
| Asus ROG Zephyrus G16 2024 GU605M | |
| PCMark 10 / Essentials | |
| Lenovo Yoga Pro 9 16IMH9 | |
| Moyenne de la classe Gaming (8810 - 12600, n=98, 2 dernières années) | |
| Moyenne Intel Core Ultra 9 185H, NVIDIA GeForce RTX 4070 Laptop GPU (9728 - 11133, n=4) | |
| Alienware m16 R2 | |
| Asus ROG Zephyrus G16 2024 GU605M | |
| Asus ProArt P16 H7606WI | |
| Acer Predator Triton Neo 16 PTN16-51-978P | |
| PCMark 10 / Productivity | |
| Moyenne de la classe Gaming (6845 - 18766, n=96, 2 dernières années) | |
| Asus ProArt P16 H7606WI | |
| Acer Predator Triton Neo 16 PTN16-51-978P | |
| Alienware m16 R2 | |
| Moyenne Intel Core Ultra 9 185H, NVIDIA GeForce RTX 4070 Laptop GPU (9067 - 9555, n=4) | |
| Asus ROG Zephyrus G16 2024 GU605M | |
| Lenovo Yoga Pro 9 16IMH9 | |
| PCMark 10 / Digital Content Creation | |
| Moyenne de la classe Gaming (7602 - 19657, n=96, 2 dernières années) | |
| Alienware m16 R2 | |
| Asus ProArt P16 H7606WI | |
| Moyenne Intel Core Ultra 9 185H, NVIDIA GeForce RTX 4070 Laptop GPU (11369 - 13194, n=4) | |
| Acer Predator Triton Neo 16 PTN16-51-978P | |
| Lenovo Yoga Pro 9 16IMH9 | |
| Asus ROG Zephyrus G16 2024 GU605M | |
| CrossMark / Overall | |
| Moyenne de la classe Gaming (1366 - 2409, n=96, 2 dernières années) | |
| Asus ProArt P16 H7606WI | |
| Moyenne Intel Core Ultra 9 185H, NVIDIA GeForce RTX 4070 Laptop GPU (1663 - 1917, n=3) | |
| Alienware m16 R2 | |
| Asus ROG Zephyrus G16 2024 GU605M | |
| Lenovo Yoga Pro 9 16IMH9 | |
| CrossMark / Productivity | |
| Moyenne de la classe Gaming (1386 - 2254, n=96, 2 dernières années) | |
| Alienware m16 R2 | |
| Moyenne Intel Core Ultra 9 185H, NVIDIA GeForce RTX 4070 Laptop GPU (1573 - 1849, n=3) | |
| Asus ROG Zephyrus G16 2024 GU605M | |
| Lenovo Yoga Pro 9 16IMH9 | |
| Asus ProArt P16 H7606WI | |
| CrossMark / Creativity | |
| Asus ProArt P16 H7606WI | |
| Moyenne de la classe Gaming (1343 - 2729, n=96, 2 dernières années) | |
| Lenovo Yoga Pro 9 16IMH9 | |
| Moyenne Intel Core Ultra 9 185H, NVIDIA GeForce RTX 4070 Laptop GPU (1872 - 2008, n=3) | |
| Asus ROG Zephyrus G16 2024 GU605M | |
| Alienware m16 R2 | |
| CrossMark / Responsiveness | |
| Moyenne de la classe Gaming (1226 - 2334, n=96, 2 dernières années) | |
| Alienware m16 R2 | |
| Moyenne Intel Core Ultra 9 185H, NVIDIA GeForce RTX 4070 Laptop GPU (1338 - 1856, n=3) | |
| Asus ROG Zephyrus G16 2024 GU605M | |
| Lenovo Yoga Pro 9 16IMH9 | |
| Asus ProArt P16 H7606WI | |
| WebXPRT 3 / Overall | |
| Moyenne de la classe Gaming (242 - 532, n=99, 2 dernières années) | |
| Asus ProArt P16 H7606WI | |
| Lenovo Yoga Pro 9 16IMH9 | |
| Alienware m16 R2 | |
| Asus ROG Zephyrus G16 2024 GU605M | |
| Moyenne Intel Core Ultra 9 185H, NVIDIA GeForce RTX 4070 Laptop GPU (240 - 295, n=5) | |
| Acer Predator Triton Neo 16 PTN16-51-978P | |
| Acer Predator Triton Neo 16 PTN16-51-978P | |
| WebXPRT 4 / Overall | |
| Moyenne de la classe Gaming (176.4 - 354, n=99, 2 dernières années) | |
| Lenovo Yoga Pro 9 16IMH9 | |
| Alienware m16 R2 | |
| Asus ROG Zephyrus G16 2024 GU605M | |
| Moyenne Intel Core Ultra 9 185H, NVIDIA GeForce RTX 4070 Laptop GPU (248 - 268, n=5) | |
| Acer Predator Triton Neo 16 PTN16-51-978P | |
| Acer Predator Triton Neo 16 PTN16-51-978P | |
| Asus ProArt P16 H7606WI | |
| Mozilla Kraken 1.1 / Total | |
| Acer Predator Triton Neo 16 PTN16-51-978P | |
| Acer Predator Triton Neo 16 PTN16-51-978P | |
| Asus ROG Zephyrus G16 2024 GU605M | |
| Alienware m16 R2 | |
| Moyenne Intel Core Ultra 9 185H, NVIDIA GeForce RTX 4070 Laptop GPU (494 - 549, n=5) | |
| Lenovo Yoga Pro 9 16IMH9 | |
| Moyenne de la classe Gaming (391 - 590, n=104, 2 dernières années) | |
| Asus ProArt P16 H7606WI | |
* ... Moindre est la valeur, meilleures sont les performances
| PCMark 10 Score | 7443 points | |
Aide | ||
| AIDA64 / Memory Copy | |
| Lenovo Yoga Pro 9 16IMH9 | |
| Asus ProArt P16 H7606WI | |
| Asus ROG Zephyrus G16 2024 GU605M | |
| Moyenne Intel Core Ultra 9 185H (69929 - 95718, n=20) | |
| Acer Predator Triton Neo 16 PTN16-51-978P | |
| Moyenne de la classe Gaming (21750 - 129946, n=107, 2 dernières années) | |
| Alienware m16 R2 | |
| AIDA64 / Memory Read | |
| Asus ProArt P16 H7606WI | |
| Lenovo Yoga Pro 9 16IMH9 | |
| Asus ROG Zephyrus G16 2024 GU605M | |
| Moyenne Intel Core Ultra 9 185H (64619 - 87768, n=20) | |
| Alienware m16 R2 | |
| Moyenne de la classe Gaming (22956 - 118858, n=107, 2 dernières années) | |
| Acer Predator Triton Neo 16 PTN16-51-978P | |
| AIDA64 / Memory Write | |
| Asus ProArt P16 H7606WI | |
| Moyenne de la classe Gaming (22297 - 135096, n=107, 2 dernières années) | |
| Lenovo Yoga Pro 9 16IMH9 | |
| Acer Predator Triton Neo 16 PTN16-51-978P | |
| Asus ROG Zephyrus G16 2024 GU605M | |
| Moyenne Intel Core Ultra 9 185H (51114 - 93871, n=20) | |
| Alienware m16 R2 | |
| AIDA64 / Memory Latency | |
| Moyenne Intel Core Ultra 9 185H (121.4 - 259, n=20) | |
| Acer Predator Triton Neo 16 PTN16-51-978P | |
| Asus ROG Zephyrus G16 2024 GU605M | |
| Lenovo Yoga Pro 9 16IMH9 | |
| Alienware m16 R2 | |
| Asus ProArt P16 H7606WI | |
| Moyenne de la classe Gaming (75.3 - 259, n=107, 2 dernières années) | |
* ... Moindre est la valeur, meilleures sont les performances
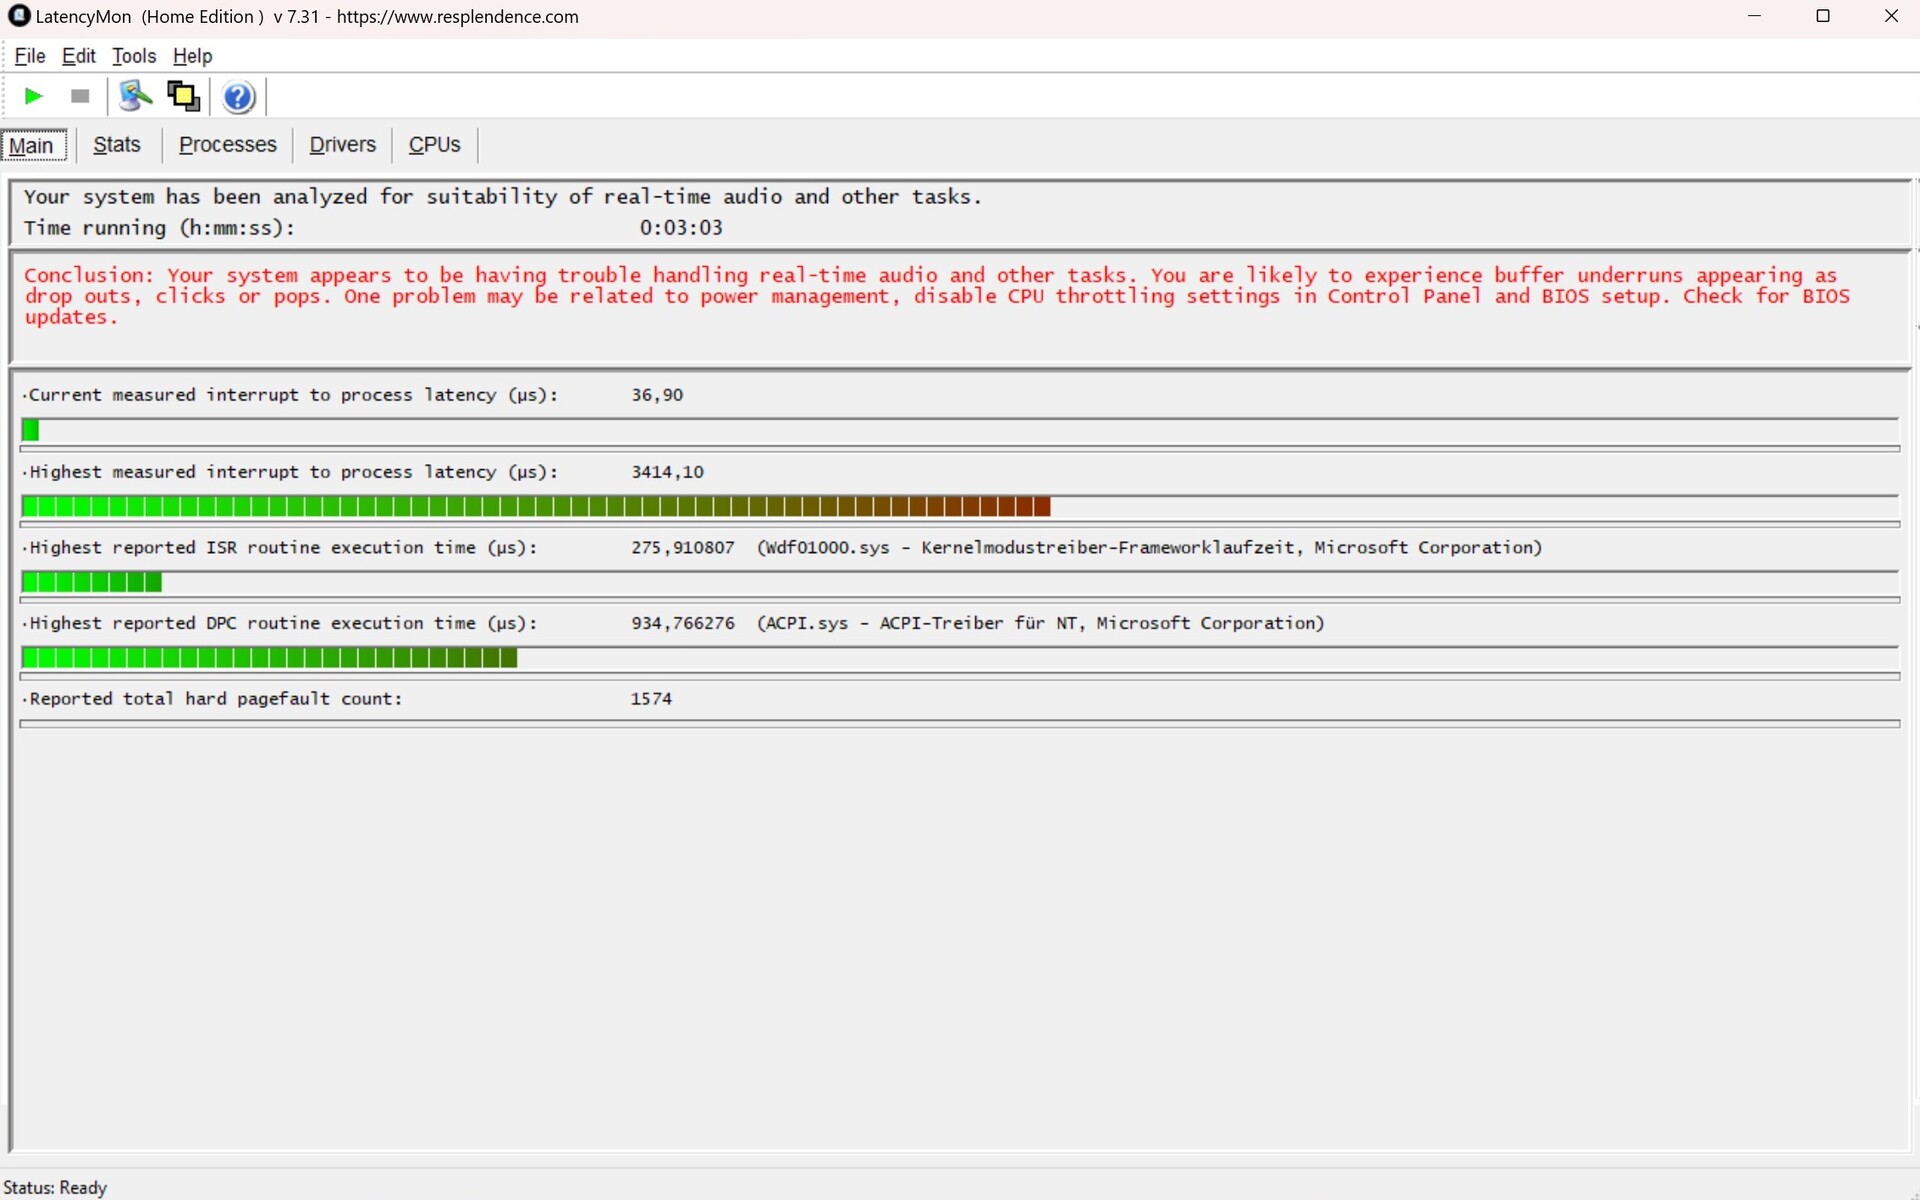
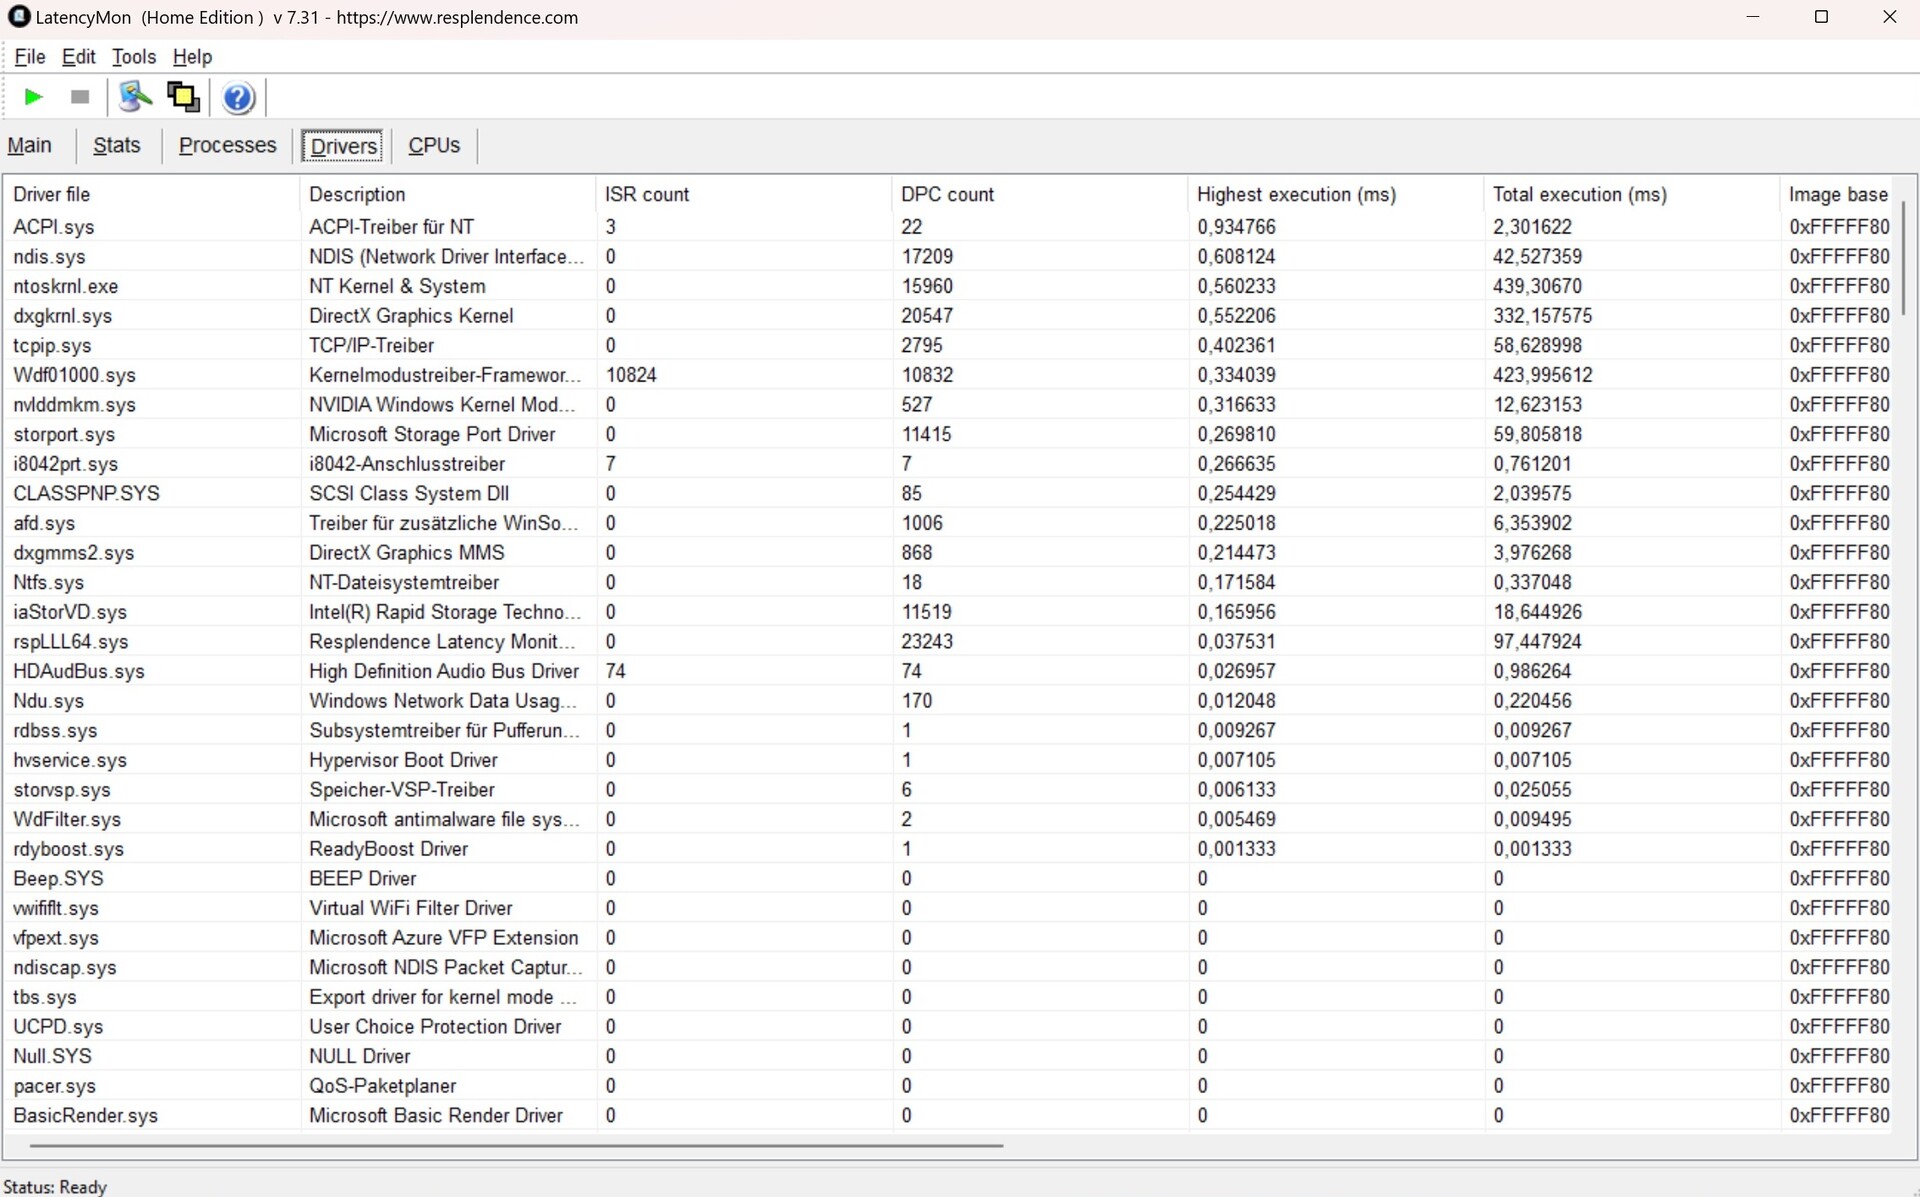
Latences DPC
Acer pourrait améliorer ses temps de latence. L'outil LatencyMon a révélé des valeurs assez élevées, mais on peut en dire autant de certains concurrents. Seul le Lenovo Yoga Pro 9 16 est resté sous la barre des 1 000 µs.
| DPC Latencies / LatencyMon - interrupt to process latency (max), Web, Youtube, Prime95 | |
| Acer Predator Triton Neo 16 PTN16-51-978P | |
| Asus ROG Zephyrus G16 2024 GU605M | |
| Alienware m16 R2 | |
| Lenovo Yoga Pro 9 16IMH9 | |
* ... Moindre est la valeur, meilleures sont les performances
Dispositif de stockage
En revanche, le Predator Triton a impressionné par son SSD ultra-rapide de 1 To (SK Hynix PC801). Selon notre évaluation des performances, l'ordinateur portable Acer a pris la première place parmi les appareils de comparaison. Cependant, il convient de mentionner qu'il y a eu de fortes fluctuations de performances en cas de charge prolongée, ce qui n'était pas le cas de la concurrence (voir la boucle DiskSpd).

* ... Moindre est la valeur, meilleures sont les performances
Reading continuous performance: DiskSpd Read Loop, Queue Depth 8
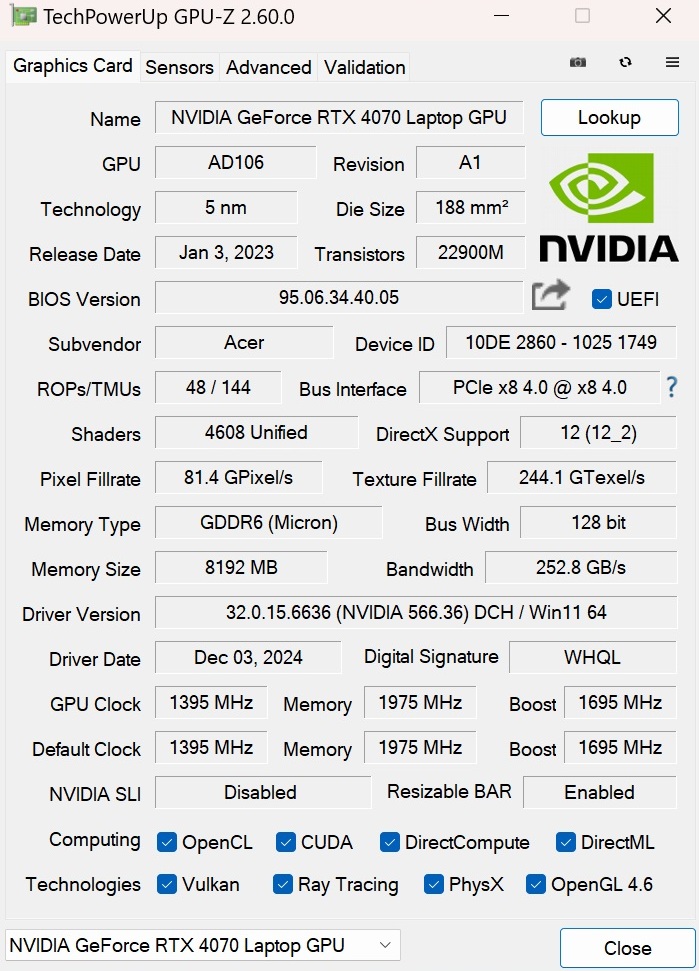
Carte graphique
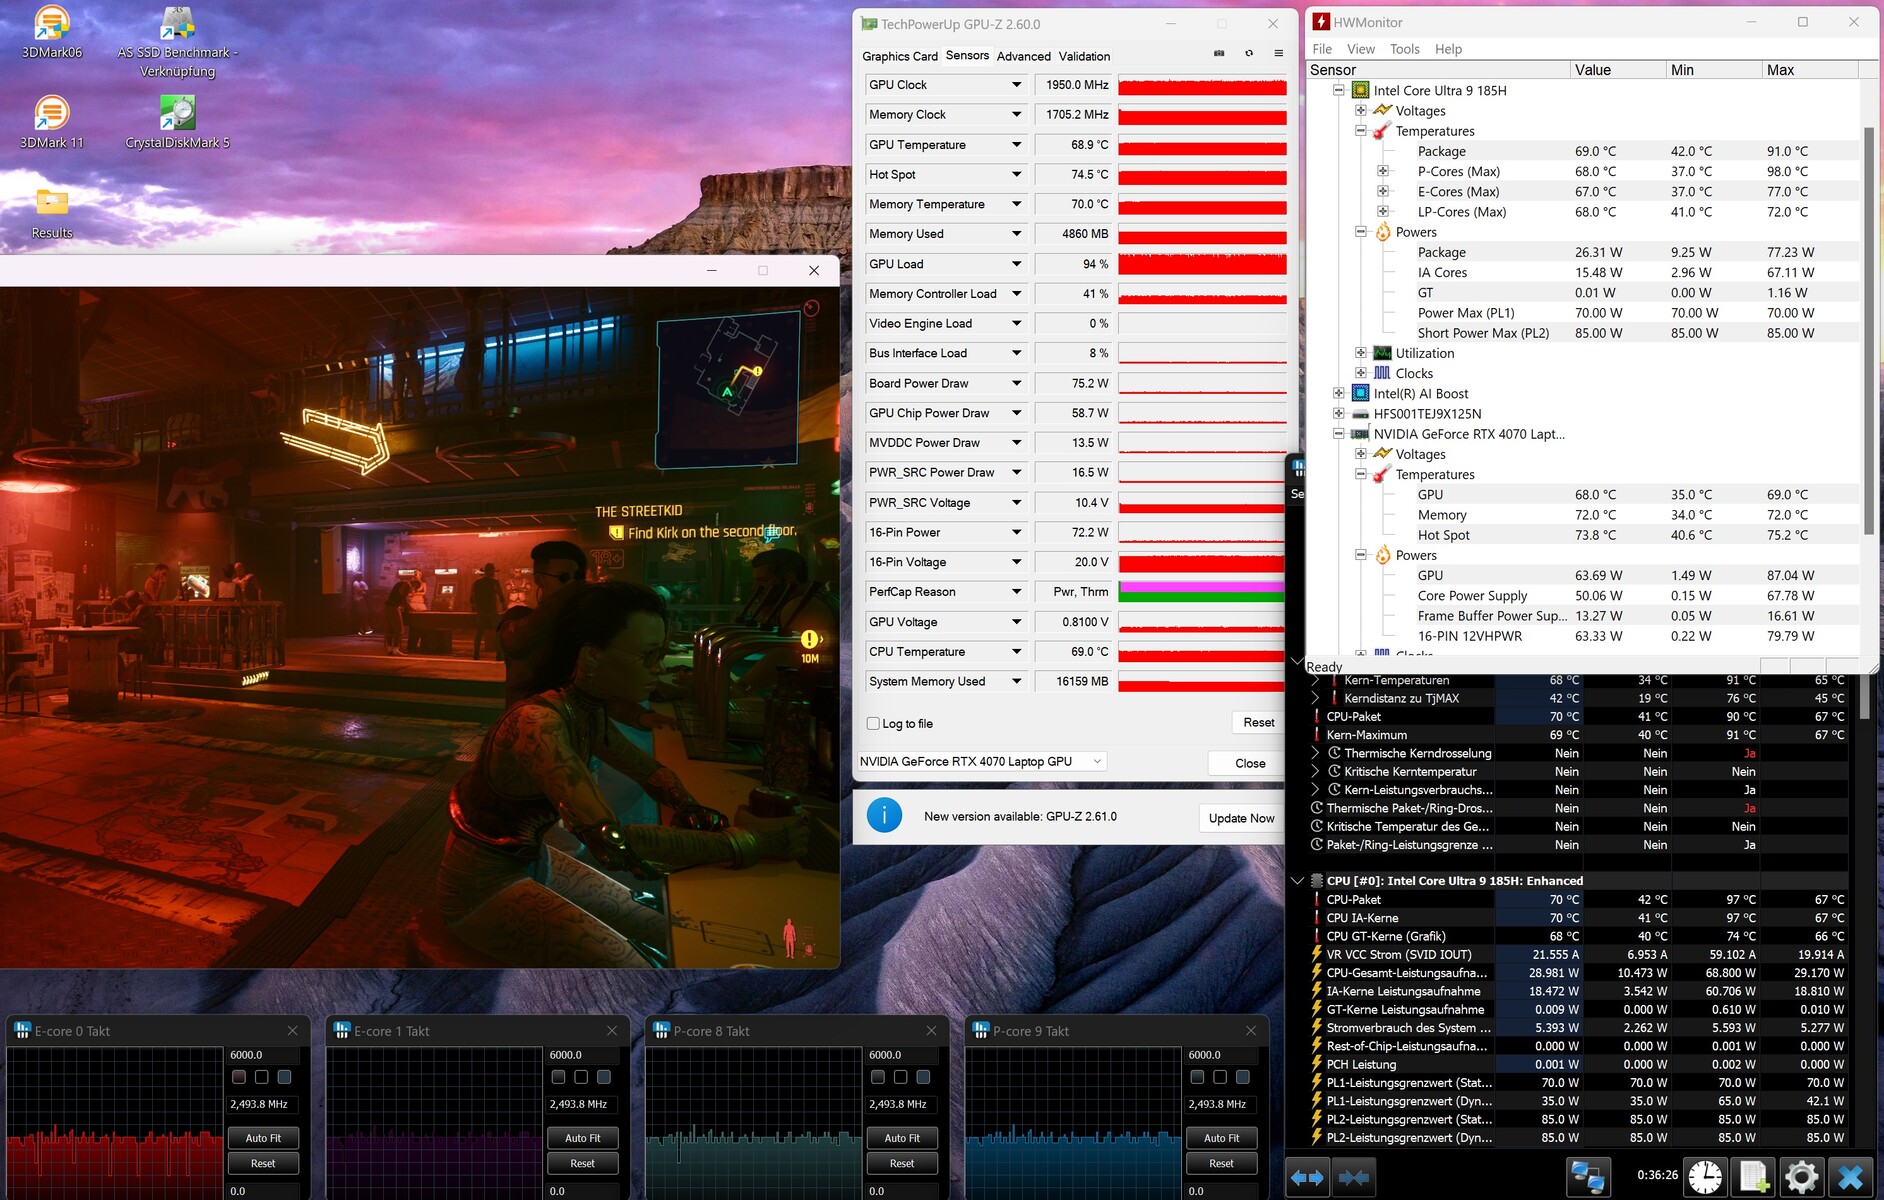
La GeForce RTX 4070 suscite aujourd'hui des sentiments mitigés. Alors que ses performances de base sont tout à fait respectables, sa VRAM limitée à 8 Go devient de plus en plus une pierre d'achoppement lors de l'exécution de jeux exigeants (prenez Indiana Jonespar exemple). Acer a également opté pour un TGP plutôt modéré de 110 watts avec Dynamic Boost pour le Predator Triton Neo 16 (jusqu'à 140 watts pourraient être possibles), ce qui est également évident dans les benchmarks. Lors du test GPU, cela a été suffisant pour s'assurer la dernière place dans le domaine du test. Intéressant : Même l'Asus ROG Zephyrus Asus ROG Zephyrus G16qui dispose d'un TGP de 80 watts, était plus rapide (en jouant à Cyberpunk 2077, par exemple, la consommation d'énergie de la RTX 4070 dans le Neo 16 a été limitée à un maximum de 76 watts en mode Performance ).
| 3DMark 11 Performance | 31196 points | |
| 3DMark Ice Storm Standard Score | 196686 points | |
| 3DMark Cloud Gate Standard Score | 58960 points | |
| 3DMark Fire Strike Score | 23102 points | |
| 3DMark Time Spy Score | 10712 points | |
Aide | ||
* ... Moindre est la valeur, meilleures sont les performances
Performances des jeux
Les choses se présentent un peu mieux pour les jeux de tous les jours. Ici, l'ordinateur portable d'Acer a quelques pourcents d'avance sur son homologue d'Asus, mais reste à la traîne par rapport aux autres concurrents. En général, la RTX 4070 est assez rapide pour faire tourner la plupart des jeux actuels avec un maximum de détails en résolution Full HD (par exemple 1.920 x 1.080). Dans la plage QHD (par exemple 2 560 x 1 440 pixels), la situation n'est plus aussi rose. Les jeux gourmands en ressources informatiques tels que Hellblade 2, Until Dawn et Stalker 2 nécessitent une réduction des détails ou l'utilisation de DLSS (voir tableau). Nous vous recommandons d'utiliser la résolution native de la Neo 16 uniquement pour les jeux les moins exigeants. 3.200 x 2.000 pixels sont maintenant à la limite pour une RTX 4070 (à moins que vous n'utilisiez des méthodes d'upscaling puissantes).
| Strange Brigade - 1920x1080 ultra AA:ultra AF:16 | |
| Moyenne de la classe Gaming (76.3 - 456, n=91, 2 dernières années) | |
| Alienware m16 R2 | |
| Lenovo Yoga Pro 9 16IMH9 | |
| Asus ProArt P16 H7606WI | |
| Moyenne NVIDIA GeForce RTX 4070 Laptop GPU (76.3 - 234, n=63) | |
| Asus ROG Zephyrus G16 2024 GU605M | |
| Bas | Moyen | Élevé | Ultra | QHD DLSS | QHD | |
|---|---|---|---|---|---|---|
| GTA V (2015) | 173.4 | 166.4 | 104.6 | |||
| Dota 2 Reborn (2015) | 169.6 | 150.5 | 144.3 | 135.9 | ||
| Final Fantasy XV Benchmark (2018) | 132.4 | 99.7 | ||||
| X-Plane 11.11 (2018) | 130.8 | 116.5 | 89.2 | |||
| Baldur's Gate 3 (2023) | 108.4 | 94.8 | 91.1 | 65 | ||
| Cyberpunk 2077 (2023) | 93.9 | 80.1 | 69.1 | 42.3 | ||
| Senua's Saga Hellblade 2 (2024) | 53.2 | 39.3 | 42.2 | 27.1 | ||
| Star Wars Outlaws (2024) | 44.9 | 40.8 | 34.4 | 34.1 | 23.3 | |
| Space Marine 2 (2024) | 74.4 | 72.8 | 67.9 | 65.1 | 48.2 | |
| Final Fantasy XVI (2024) | 68.2 | 59 | 54.3 | 53.9 | 37.6 | |
| Until Dawn (2024) | 83.7 | 58.9 | 44.9 | 41.5 | 32.9 | |
| Call of Duty Black Ops 6 (2024) | 105 | 81 | 76 | 65 | 60 | |
| Stalker 2 (2024) | 57.1 | 49.7 | 42.3 | 58.3 | 31.7 |
Contrairement aux performances du CPU et du SSD, la vitesse du GPU de l'ordinateur portable semble rester assez stable. Lors de notre test de 30 minutes avec Cyberpunk 2077nous n'avons pas constaté de baisse notable des FPS ou autres.
Cyberpunk 2077 ultra FPS diagram
Émissions
Émissions sonores
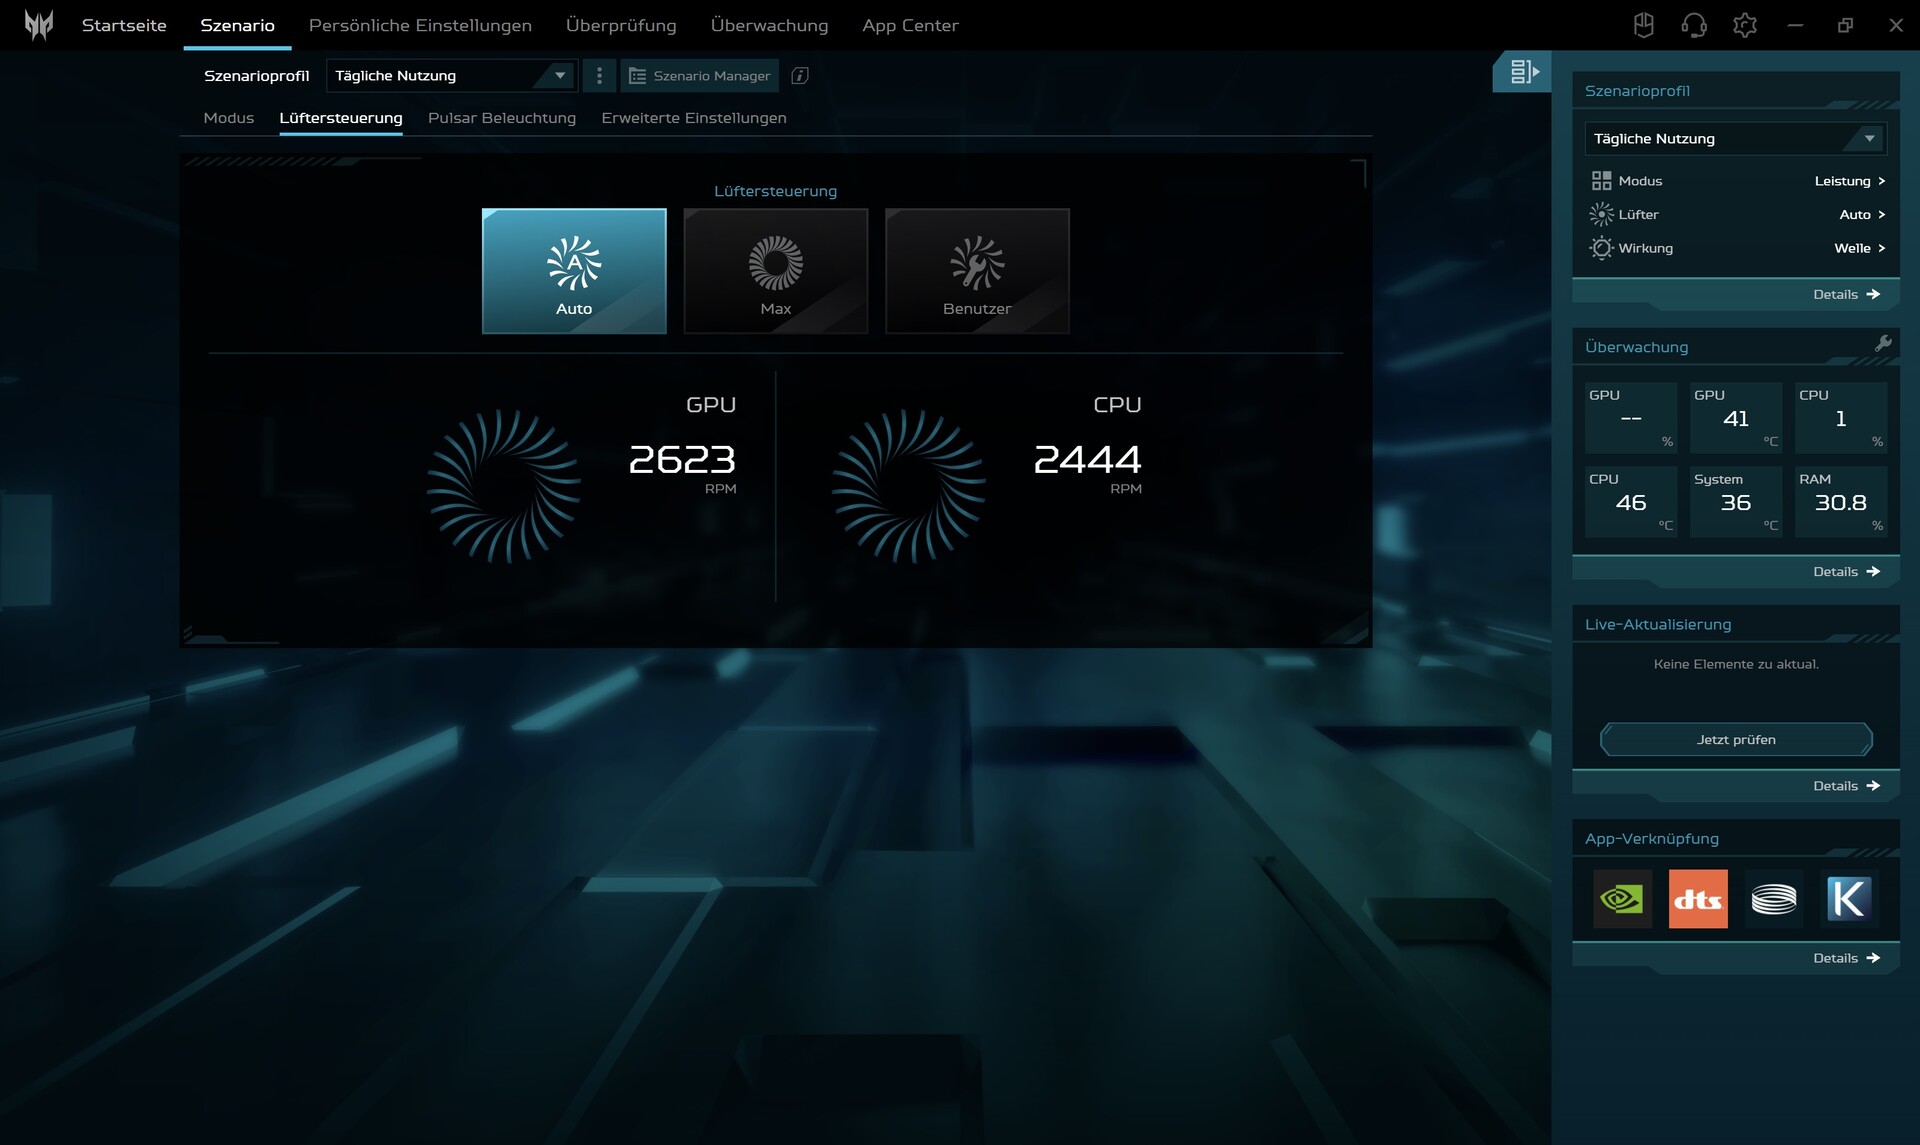
Acer pourrait encore revoir le contrôle de son ventilateur. En mode Performance, le Neo 16 est parfois très perceptible même au ralenti (32 à 34 dB) et a parfois tendance à monter en régime jusqu'à 40 dB(A). Ses homologues restent généralement beaucoup plus silencieux. Nous avons noté environ 50 dB(A) en charge, ce qui est très présent et peut devenir gênant sans casque. Cependant, les concurrents atteignent des valeurs similaires, voire supérieures, dans ce scénario.
Degré de la nuisance sonore
| Au repos |
| 32 / 34 / 40 dB(A) |
| Fortement sollicité |
| 48 / 51 dB(A) |
 | ||
30 dB silencieux 40 dB(A) audible 50 dB(A) bruyant |
||
min: | ||
| Acer Predator Triton Neo 16 PTN16-51-978P Ultra 9 185H, GeForce RTX 4070 Laptop GPU | Asus ProArt P16 H7606WI Ryzen AI 9 HX 370, GeForce RTX 4070 Laptop GPU | Lenovo Yoga Pro 9 16IMH9 Ultra 9 185H, GeForce RTX 4070 Laptop GPU | Asus ROG Zephyrus G16 2024 GU605M Ultra 7 155H, GeForce RTX 4070 Laptop GPU | Alienware m16 R2 Ultra 7 155H, GeForce RTX 4070 Laptop GPU | |
|---|---|---|---|---|---|
| Noise | 9% | 14% | 18% | 16% | |
| arrêt / environnement * (dB) | 24 | 24.4 -2% | 24.3 -1% | 23.9 -0% | 24.7 -3% |
| Idle Minimum * (dB) | 32 | 24.4 24% | 24.3 24% | 23.9 25% | 25.3 21% |
| Idle Average * (dB) | 34 | 27.7 19% | 24.3 29% | 27.8 18% | 25.3 26% |
| Idle Maximum * (dB) | 40 | 32.3 19% | 25.8 35% | 30.1 25% | 25.3 37% |
| Load Average * (dB) | 48 | 42.2 12% | 48.1 -0% | 34.2 29% | 31.7 34% |
| Cyberpunk 2077 ultra * (dB) | 50 | 53.2 -6% | |||
| Load Maximum * (dB) | 51 | 53.2 -4% | 53.9 -6% | 46.4 9% | 62 -22% |
| Witcher 3 ultra * (dB) | 49.7 | 46.4 | 53.8 |
* ... Moindre est la valeur, meilleures sont les performances
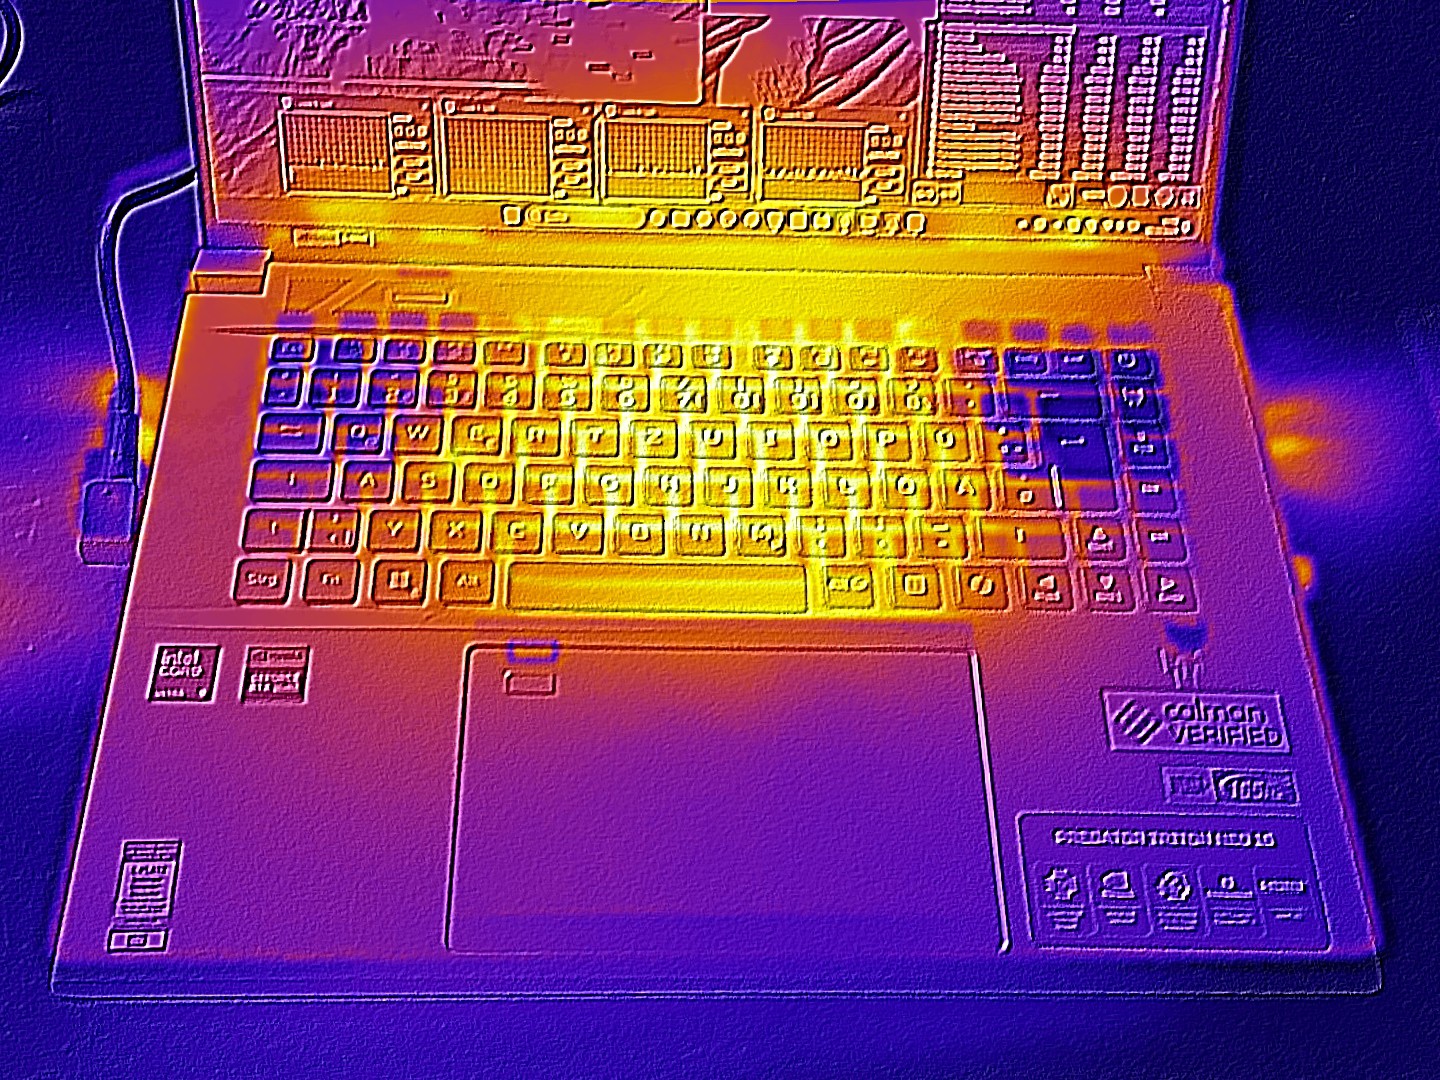
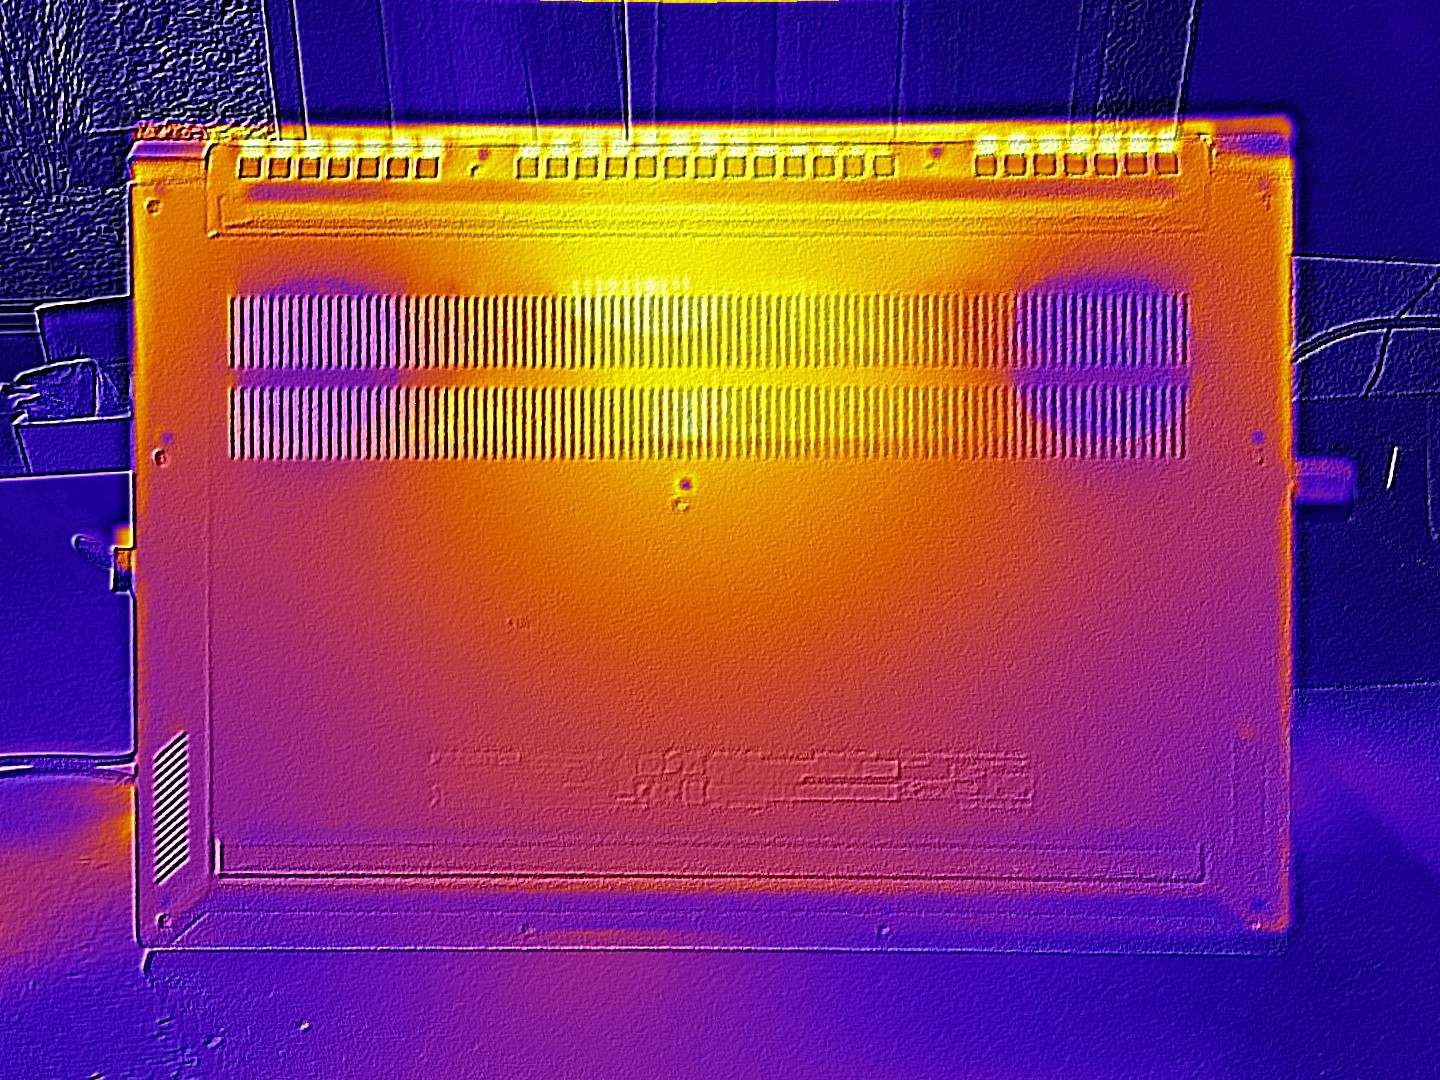
Température
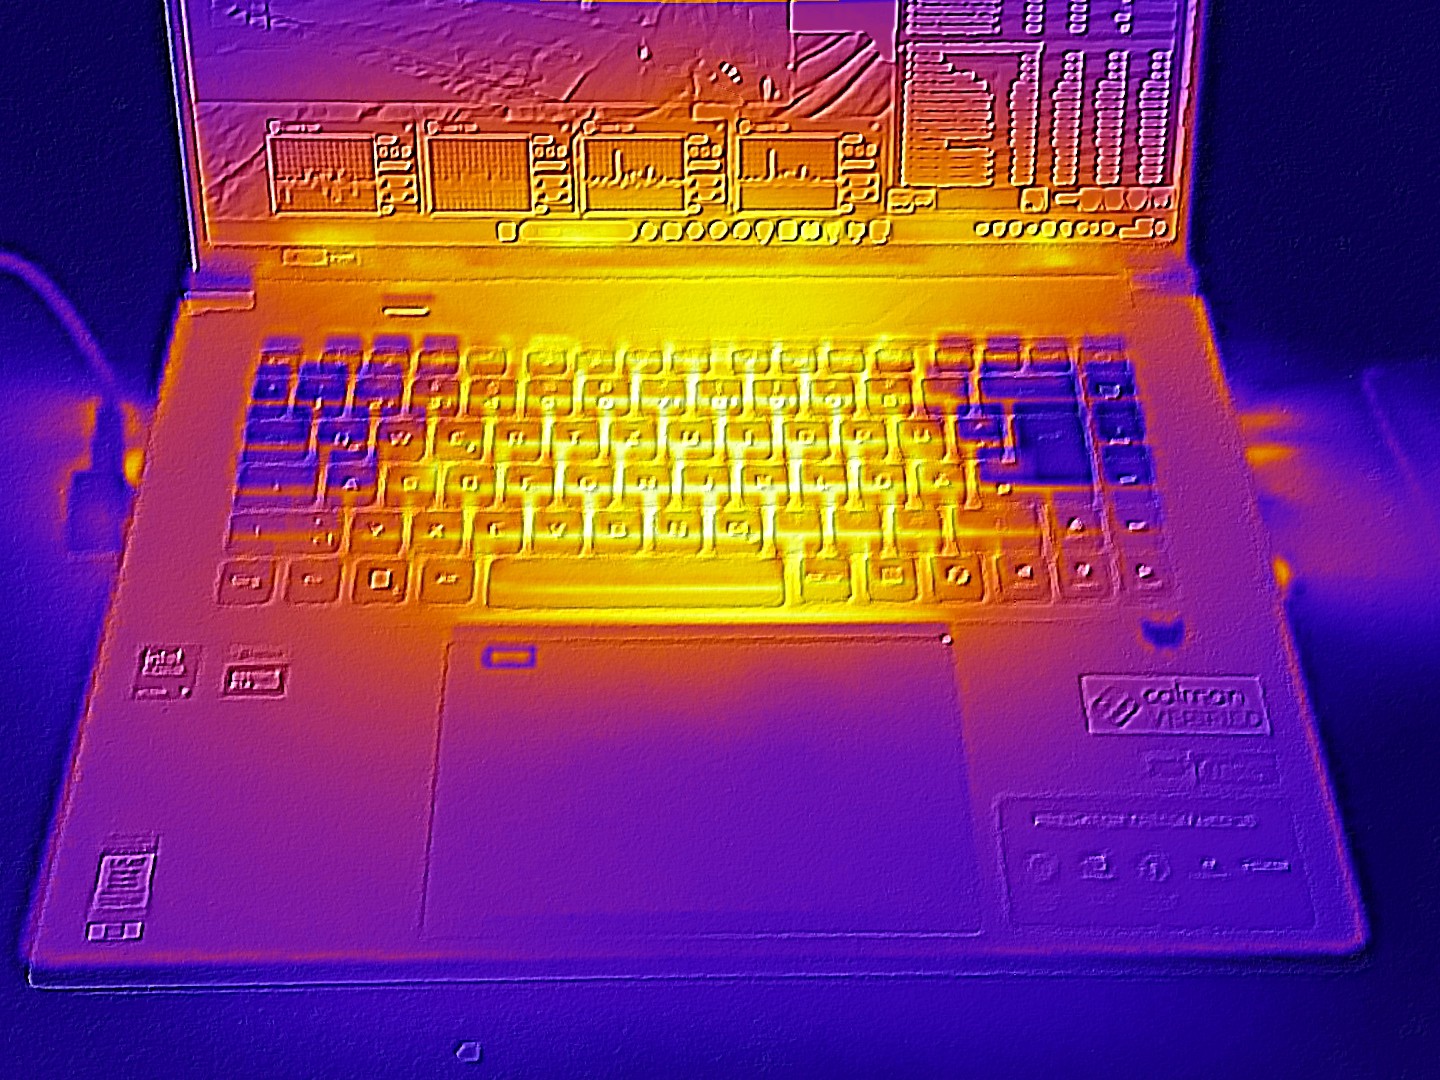
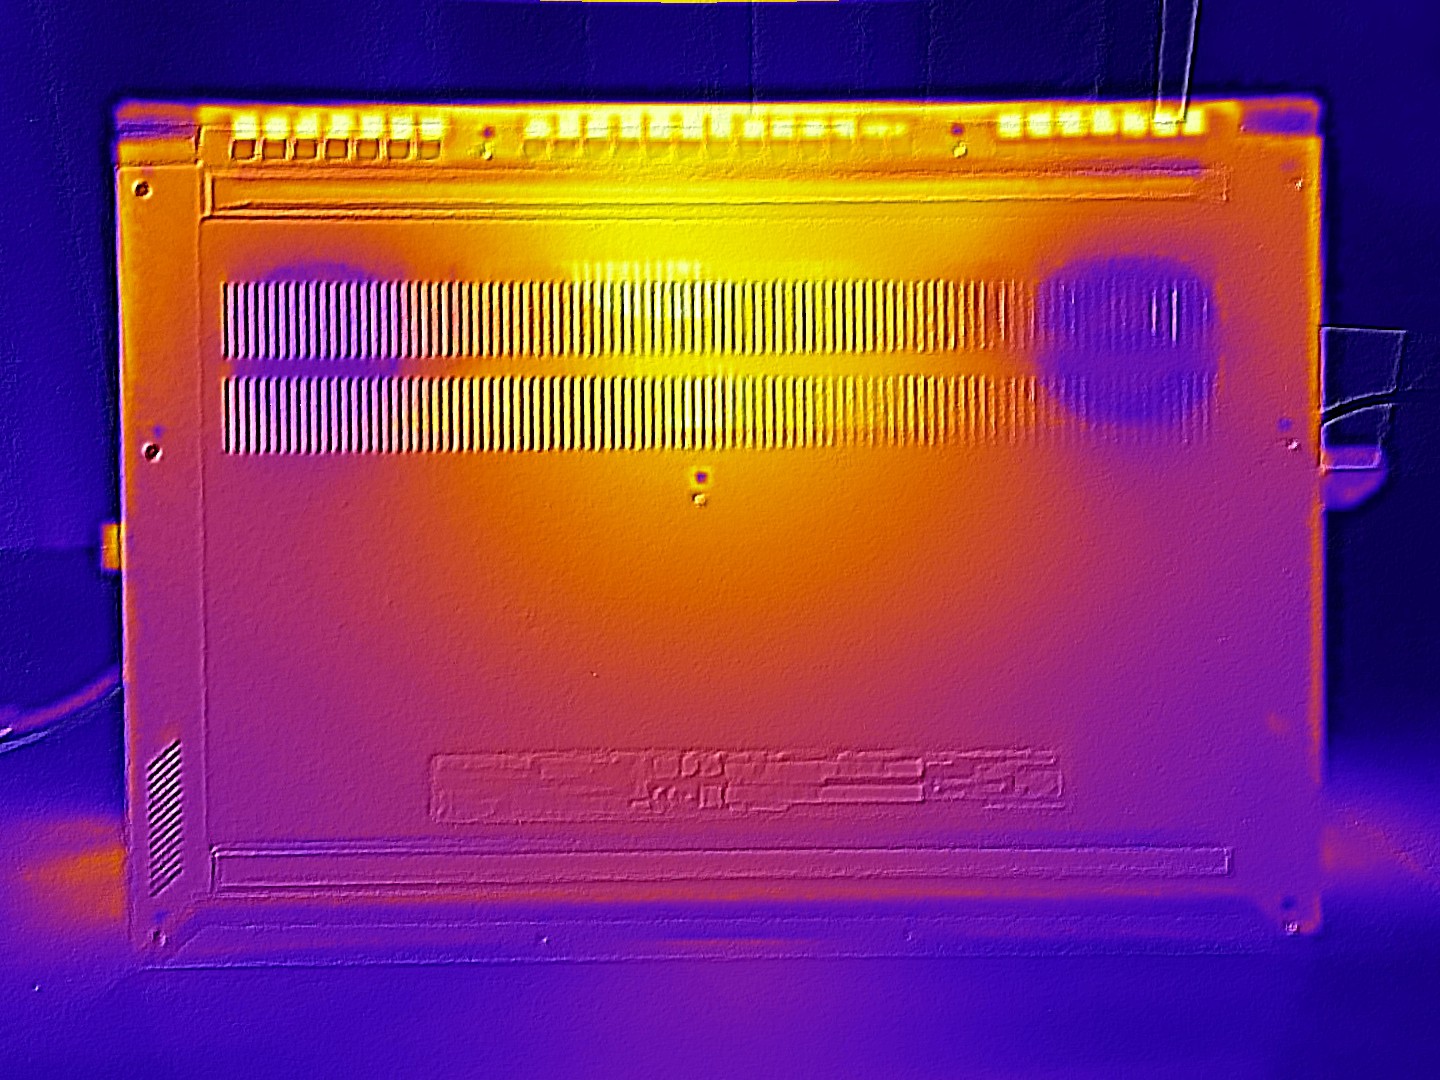
En ce qui concerne les températures, la filiale d'Acer n'est pas en reste. Un maximum de 46 °C sur le dessus et un maximum de 48 °C sur le dessous sont typiques pour un appareil RTX 4070. En mode veille, le boîtier reste sous la barre des 30 °C et reste donc bien frais.
(-) La température maximale du côté supérieur est de 46 °C / 115 F, par rapport à la moyenne de 40.4 °C / 105 F, allant de 21.2 à 68.8 °C pour la classe Gaming.
(-) Le fond chauffe jusqu'à un maximum de 48 °C / 118 F, contre une moyenne de 43.2 °C / 110 F
(+) En utilisation inactive, la température moyenne du côté supérieur est de 25.8 °C / 78 F, par rapport à la moyenne du dispositif de 33.9 °C / 93 F.
(-) 3: The average temperature for the upper side is 39.3 °C / 103 F, compared to the average of 33.9 °C / 93 F for the class Gaming.
(+) Les repose-poignets et le pavé tactile atteignent la température maximale de la peau (34 °C / 93.2 F) et ne sont donc pas chauds.
(-) La température moyenne de la zone de l'appui-paume de dispositifs similaires était de 28.8 °C / 83.8 F (-5.2 °C / #-9.4 F).
| Acer Predator Triton Neo 16 PTN16-51-978P Ultra 9 185H, GeForce RTX 4070 Laptop GPU | Asus ProArt P16 H7606WI Ryzen AI 9 HX 370, GeForce RTX 4070 Laptop GPU | Lenovo Yoga Pro 9 16IMH9 Ultra 9 185H, GeForce RTX 4070 Laptop GPU | Asus ROG Zephyrus G16 2024 GU605M Ultra 7 155H, GeForce RTX 4070 Laptop GPU | Alienware m16 R2 Ultra 7 155H, GeForce RTX 4070 Laptop GPU | |
|---|---|---|---|---|---|
| Heat | -5% | 6% | -5% | -20% | |
| Maximum Upper Side * (°C) | 46 | 46.9 -2% | 41.7 9% | 50.3 -9% | 44.8 3% |
| Maximum Bottom * (°C) | 48 | 50.9 -6% | 46.3 4% | 48 -0% | 48 -0% |
| Idle Upper Side * (°C) | 27 | 28.9 -7% | 26.2 3% | 28.8 -7% | 37.2 -38% |
| Idle Bottom * (°C) | 29 | 30 -3% | 27.2 6% | 29.8 -3% | 42 -45% |
* ... Moindre est la valeur, meilleures sont les performances
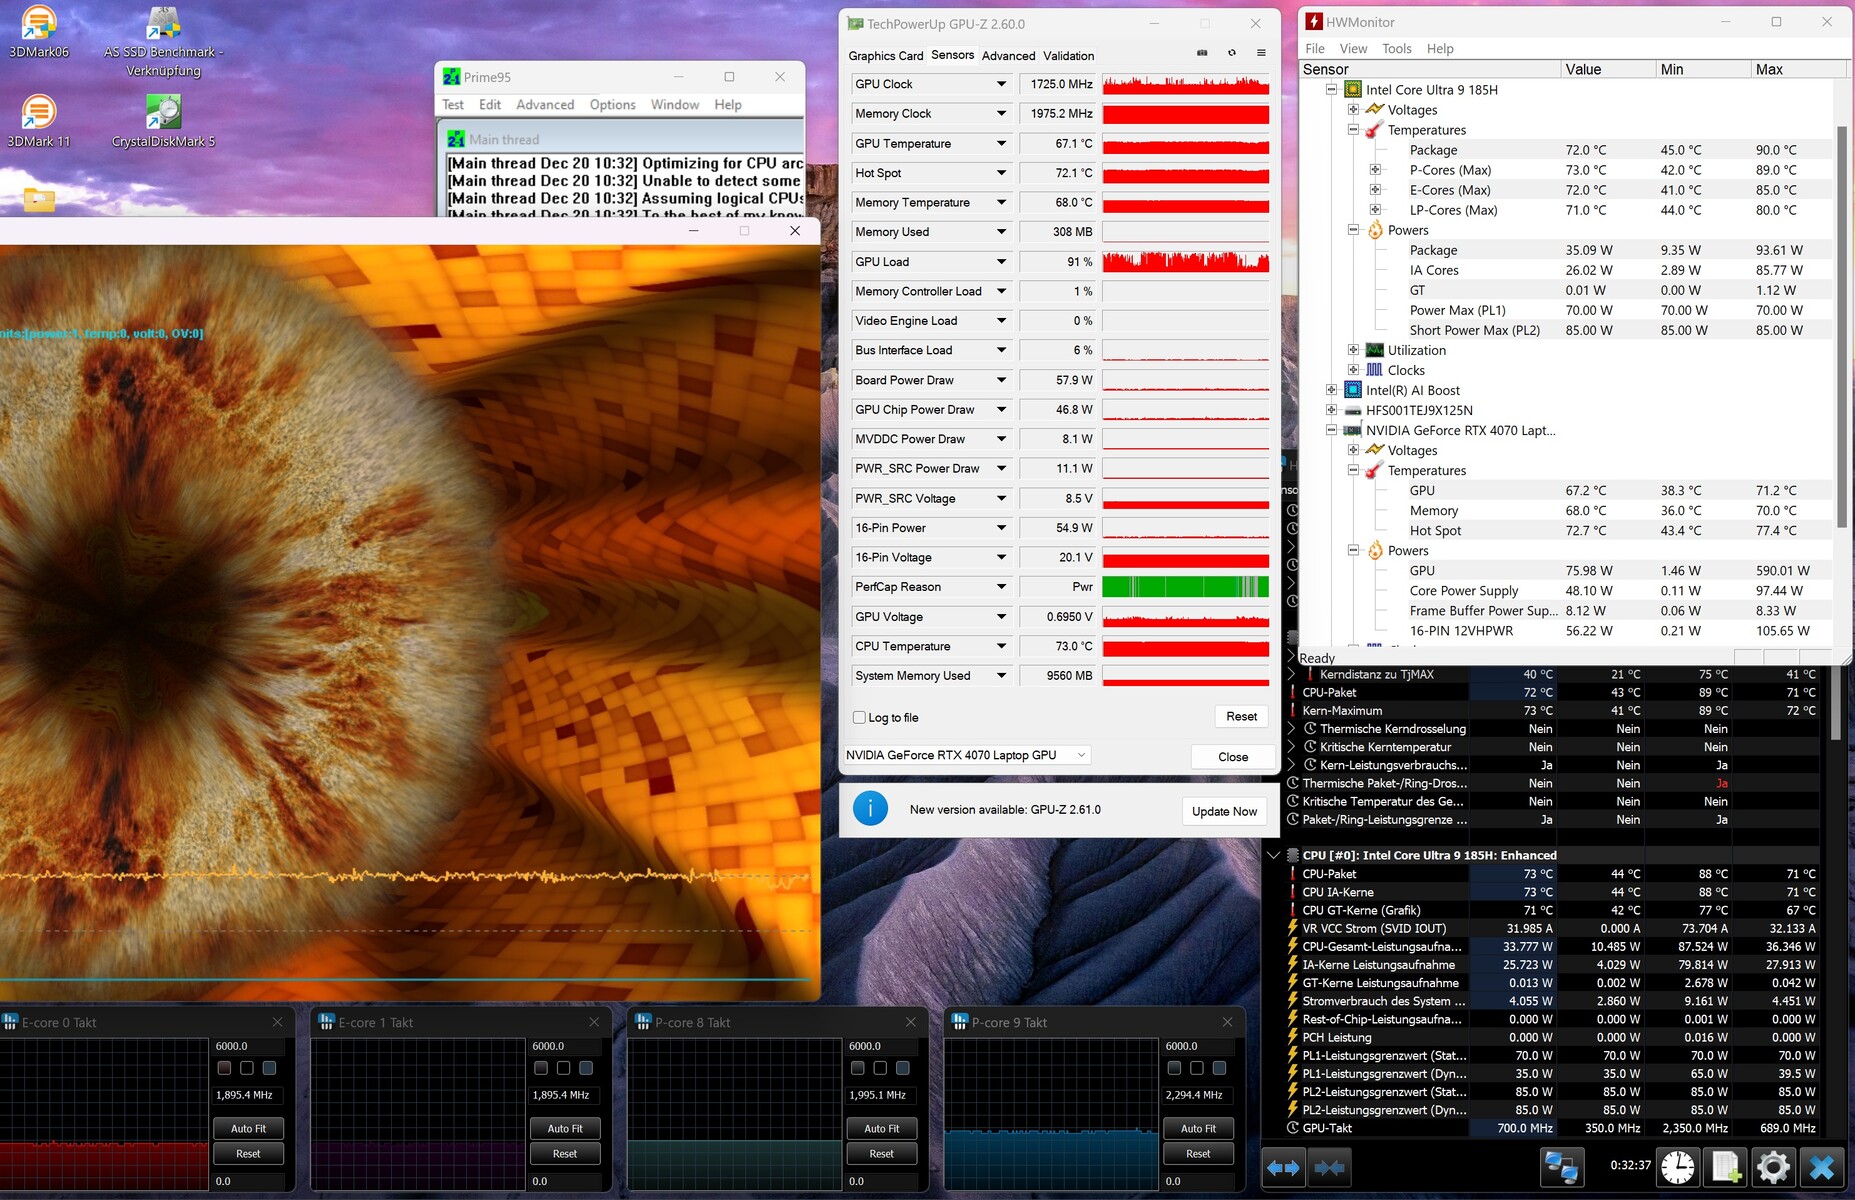
Épreuve d'effort
Lors du test de stress avec les outils Furmark et Prime95 et lors de l'exécution de Cyberpunk 2077, le CPU et le GPU ont chauffé jusqu'à environ 70 °C, ce qui peut être considéré comme un niveau modéré.
Intervenants
La qualité sonore de l'ordinateur portable se situe dans le milieu de gamme. Outre les basses, les médiums et les aigus gagneraient à être plus puissants et plus précis. En revanche, les haut-parleurs de l'appareil de 16 pouces offrent un bon volume maximal de 86 dB(A).
Acer Predator Triton Neo 16 PTN16-51-978P analyse audio
(+) | les haut-parleurs peuvent jouer relativement fort (86# dB)
Basses 100 - 315 Hz
(-) | presque aucune basse - en moyenne 22.7% plus bas que la médiane
(±) | la linéarité des basses est moyenne (10.9% delta à la fréquence précédente)
Médiums 400 - 2000 Hz
(±) | médiane supérieure - en moyenne 5.9% supérieure à la médiane
(+) | les médiums sont linéaires (5.3% delta à la fréquence précédente)
Aiguës 2 - 16 kHz
(±) | sommets plus élevés - en moyenne 5.6% plus élevés que la médiane
(±) | la linéarité des aigus est moyenne (7.2% delta à la fréquence précédente)
Globalement 100 - 16 000 Hz
(±) | la linéarité du son global est moyenne (17.6% de différence avec la médiane)
Par rapport à la même classe
» 50% de tous les appareils testés de cette catégorie étaient meilleurs, 11% similaires, 39% pires
» Le meilleur avait un delta de 6%, la moyenne était de 18%, le pire était de 132%.
Par rapport à tous les appareils testés
» 35% de tous les appareils testés étaient meilleurs, 8% similaires, 57% pires
» Le meilleur avait un delta de 4%, la moyenne était de 24%, le pire était de 134%.
Asus ProArt P16 H7606WI analyse audio
(±) | le niveau sonore du haut-parleur est moyen mais bon (81.4# dB)
Basses 100 - 315 Hz
(+) | bonne basse - seulement 3% loin de la médiane
(±) | la linéarité des basses est moyenne (8.3% delta à la fréquence précédente)
Médiums 400 - 2000 Hz
(+) | médiane équilibrée - seulement 3.5% de la médiane
(+) | les médiums sont linéaires (2.5% delta à la fréquence précédente)
Aiguës 2 - 16 kHz
(+) | des sommets équilibrés - à seulement 3% de la médiane
(+) | les aigus sont linéaires (3.6% delta à la fréquence précédente)
Globalement 100 - 16 000 Hz
(+) | le son global est linéaire (8.5% différence à la médiane)
Par rapport à la même classe
» 9% de tous les appareils testés de cette catégorie étaient meilleurs, 3% similaires, 88% pires
» Le meilleur avait un delta de 5%, la moyenne était de 17%, le pire était de 45%.
Par rapport à tous les appareils testés
» 2% de tous les appareils testés étaient meilleurs, 1% similaires, 97% pires
» Le meilleur avait un delta de 4%, la moyenne était de 24%, le pire était de 134%.
Gestion de l'énergie
Consommation électrique
Grâce à sa commutation graphique intégrée, le Predator Triton est raisonnablement économe lorsqu'il est au repos - nous avons mesuré entre 10 et 23 watts, donc bien en dessous de la moyenne des jeux. En charge, l'ordinateur portable Acer consomme entre 80 et 206 watts, ce qui signifie que l'alimentation de 230 watts n'est à aucun moment surchargée.
| Éteint/en veille | |
| Au repos | |
| Fortement sollicité |
|
Légende:
min: | |
| Acer Predator Triton Neo 16 PTN16-51-978P Ultra 9 185H, GeForce RTX 4070 Laptop GPU | Asus ProArt P16 H7606WI Ryzen AI 9 HX 370, GeForce RTX 4070 Laptop GPU | Lenovo Yoga Pro 9 16IMH9 Ultra 9 185H, GeForce RTX 4070 Laptop GPU | Asus ROG Zephyrus G16 2024 GU605M Ultra 7 155H, GeForce RTX 4070 Laptop GPU | Alienware m16 R2 Ultra 7 155H, GeForce RTX 4070 Laptop GPU | Moyenne de la classe Gaming | |
|---|---|---|---|---|---|---|
| Power Consumption | 6% | -10% | 21% | -13% | -24% | |
| Idle Minimum * (Watt) | 10 | 8 20% | 10.3 -3% | 8.3 17% | 8.1 19% | 13.2 ? -32% |
| Idle Average * (Watt) | 15 | 9.9 34% | 21.9 -46% | 12.5 17% | 13 13% | 18.9 ? -26% |
| Idle Maximum * (Watt) | 23 | 11.6 50% | 22.4 3% | 12.8 44% | 40.3 -75% | 24.3 ? -6% |
| Load Average * (Watt) | 80 | 76.9 4% | 96.9 -21% | 71.3 11% | 79 1% | 108.3 ? -35% |
| Cyberpunk 2077 ultra * (Watt) | 122 | 157.7 -29% | ||||
| Cyberpunk 2077 ultra external monitor * (Watt) | 118.7 | 156.6 -32% | ||||
| Load Maximum * (Watt) | 206 | 212.6 -3% | 173.8 16% | 169.1 18% | 254.9 -24% | 254 ? -23% |
| Witcher 3 ultra * (Watt) | 159.6 | 127.5 | 188.1 |
* ... Moindre est la valeur, meilleures sont les performances
Power consumption Cyberpunk / stress test
Power consumption with external monitor
Délais d'exécution
Bien que ses homologues disposent de batteries légèrement plus grandes (84 à 90 Wh au lieu de 76 Wh), l'autonomie du Neo 16 n'a rien à cacher. Environ 7,5 heures de navigation sans fil sur le web avec une luminosité réduite à 150 cd/m² est une valeur décente. En comparaison, la concurrence affiche une autonomie de 7 à 9 heures.
| Acer Predator Triton Neo 16 PTN16-51-978P Ultra 9 185H, GeForce RTX 4070 Laptop GPU, 76 Wh | Asus ProArt P16 H7606WI Ryzen AI 9 HX 370, GeForce RTX 4070 Laptop GPU, 90 Wh | Lenovo Yoga Pro 9 16IMH9 Ultra 9 185H, GeForce RTX 4070 Laptop GPU, 84 Wh | Asus ROG Zephyrus G16 2024 GU605M Ultra 7 155H, GeForce RTX 4070 Laptop GPU, 90 Wh | Alienware m16 R2 Ultra 7 155H, GeForce RTX 4070 Laptop GPU, 90 Wh | Moyenne de la classe Gaming | |
|---|---|---|---|---|---|---|
| Autonomie de la batterie | 12% | 19% | -1% | 9% | -5% | |
| WiFi v1.3 (h) | 7.4 | 8.3 12% | 8.8 19% | 7.3 -1% | 8.1 9% | 7.04 ? -5% |
| H.264 (h) | 21 | 11.5 | 11.2 | 8.26 ? | ||
| Load (h) | 1.9 | 1.2 | 1.2 | 1 | 1.47 ? | |
| Reader / Idle (h) | 12.6 | 8.71 ? |
Notebookcheck évaluation totale
Vous ne pouvez pas vous tromper avec le Predator Triton Neo 16, car le modèle de 16 pouces ne présente pas de faiblesses flagrantes. Cependant, la concurrence des autres fabricants est rude et prend parfois l'avantage.
Acer Predator Triton Neo 16 PTN16-51-978P
- 12/31/2024 v8
Florian Glaser
 Total Sustainability Score:
 Transparency
La sélection des appareils à examiner est effectuée par notre équipe éditoriale. L'échantillon de test a été prêté à l'auteur par le fabricant ou le détaillant pour les besoins de cet examen. Le prêteur n'a pas eu d'influence sur cette évaluation et le fabricant n'a pas reçu de copie de cette évaluation avant sa publication. Il n'y avait aucune obligation de publier cet article. En tant que média indépendant, Notebookcheck n'est pas soumis à l'autorité des fabricants, des détaillants ou des éditeurs.
Voici comment Notebookcheck teste
Chaque année, Notebookcheck examine de manière indépendante des centaines d'ordinateurs portables et de smartphones en utilisant des procédures standardisées afin de garantir que tous les résultats sont comparables. Nous avons continuellement développé nos méthodes de test depuis environ 20 ans et avons établi des normes industrielles dans le processus. Dans nos laboratoires de test, des équipements de mesure de haute qualité sont utilisés par des techniciens et des rédacteurs expérimentés. Ces tests impliquent un processus de validation en plusieurs étapes. Notre système d'évaluation complexe repose sur des centaines de mesures et de points de référence bien fondés, ce qui garantit l'objectivité.
