Test de l'Alienware m16 R2 : des changements importants et risqués

L'Alienware m16 R2 succède au m16 R1mais pas de la manière dont vous vous y attendez. Le nouveau modèle est une refonte complète de la série m16 dans le but d'attirer à la fois les joueurs et les utilisateurs généraux, alors que les autres produits Alienware sont destinés aux joueurs invétérés. Le m16 R2 est donc l'un des ordinateurs portables Alienware les plus intéressants depuis des années, car il sacrifie certaines options de CPU et de GPU haut de gamme qui étaient disponibles sur le m16 R1 en faveur d'un design plus petit.
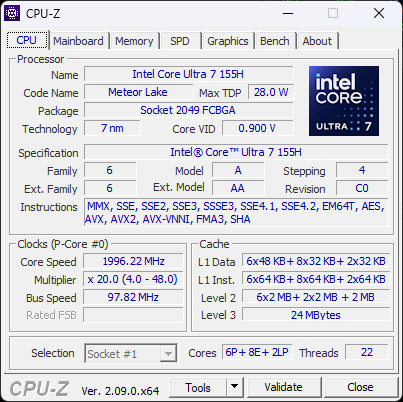
Notre unité de test est une configuration haut de gamme avec le CPU Meteor Lake-H Core Ultra 7 155H, le GPU GeForce RTX 4070, et l'écran IPS 1600p 240 Hz pour environ $1850 USD. Les SKUs bas de gamme peuvent être configurés avec la RTX 4050 ou 4060 à la place et les SKUs haut de gamme incluent le Core Ultra 9, mais toutes les configurations sont autrement limitées au même écran IPS 1600p240 et jusqu'à la RTX 4070 seulement.
Les alternatives à l'Alienware m16 R2 comprennent d'autres ordinateurs portables 16 pouces haute performance comme le Razer Blade 16, HP Omen Transcend 16, Asus ROG Zephyrus G16ou Lenovo Legion Slim 7 16.
Plus d'avis sur Alienware :
Comparaison avec les concurrents potentiels
Note | Date | Modèle | Poids | Épaisseur | Taille | Résolution | Prix |
|---|---|---|---|---|---|---|---|
| 90.2 % v7 (old) | 03/24 | Alienware m16 R2 Ultra 7 155H, GeForce RTX 4070 Laptop GPU | 2.5 kg | 23.5 mm | 16.00" | 2560x1600 | |
| 88.3 % v7 (old) | 09/23 | Alienware m16 R1 Intel i7-13700HX, GeForce RTX 4060 Laptop GPU | 3 kg | 25.4 mm | 16.00" | 2560x1600 | |
| 88.4 % v7 (old) | 06/23 | Alienware x16 R1 i9-13900HK, GeForce RTX 4080 Laptop GPU | 2.6 kg | 18.57 mm | 16.00" | 2560x1600 | |
| 88.4 % v7 (old) | 02/24 | HP Omen Transcend 16-u1095ng i9-14900HX, GeForce RTX 4070 Laptop GPU | 2.3 kg | 20 mm | 16.00" | 2560x1600 | |
| 92.3 % v7 (old) | 02/24 | Asus ROG Zephyrus G16 2024 GU605M Ultra 7 155H, GeForce RTX 4070 Laptop GPU | 1.8 kg | 16.4 mm | 16.00" | 2560x1600 | |
| 90.4 % v7 (old) | 11/23 | Lenovo Legion Slim 7 16APH8 R7 7840HS, GeForce RTX 4060 Laptop GPU | 2.1 kg | 20 mm | 16.00" | 2560x1600 |
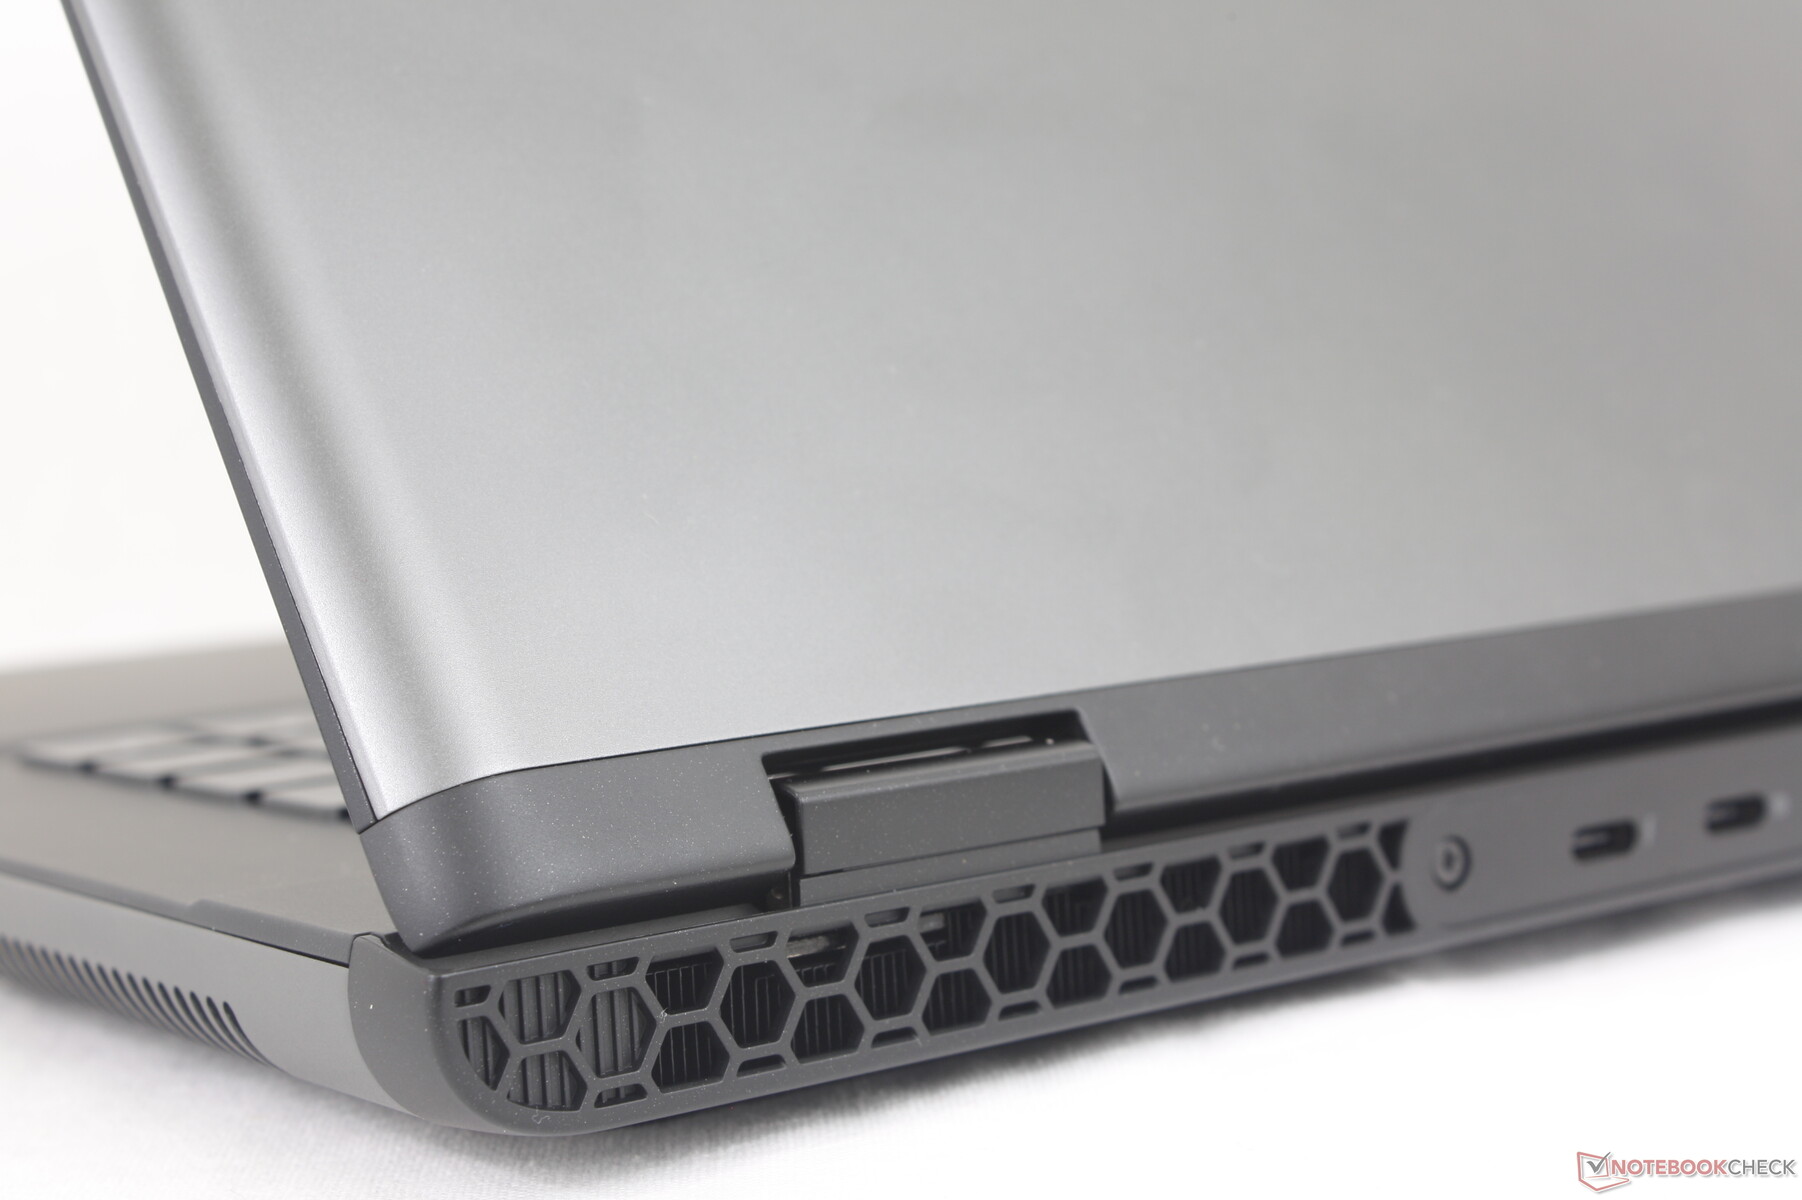
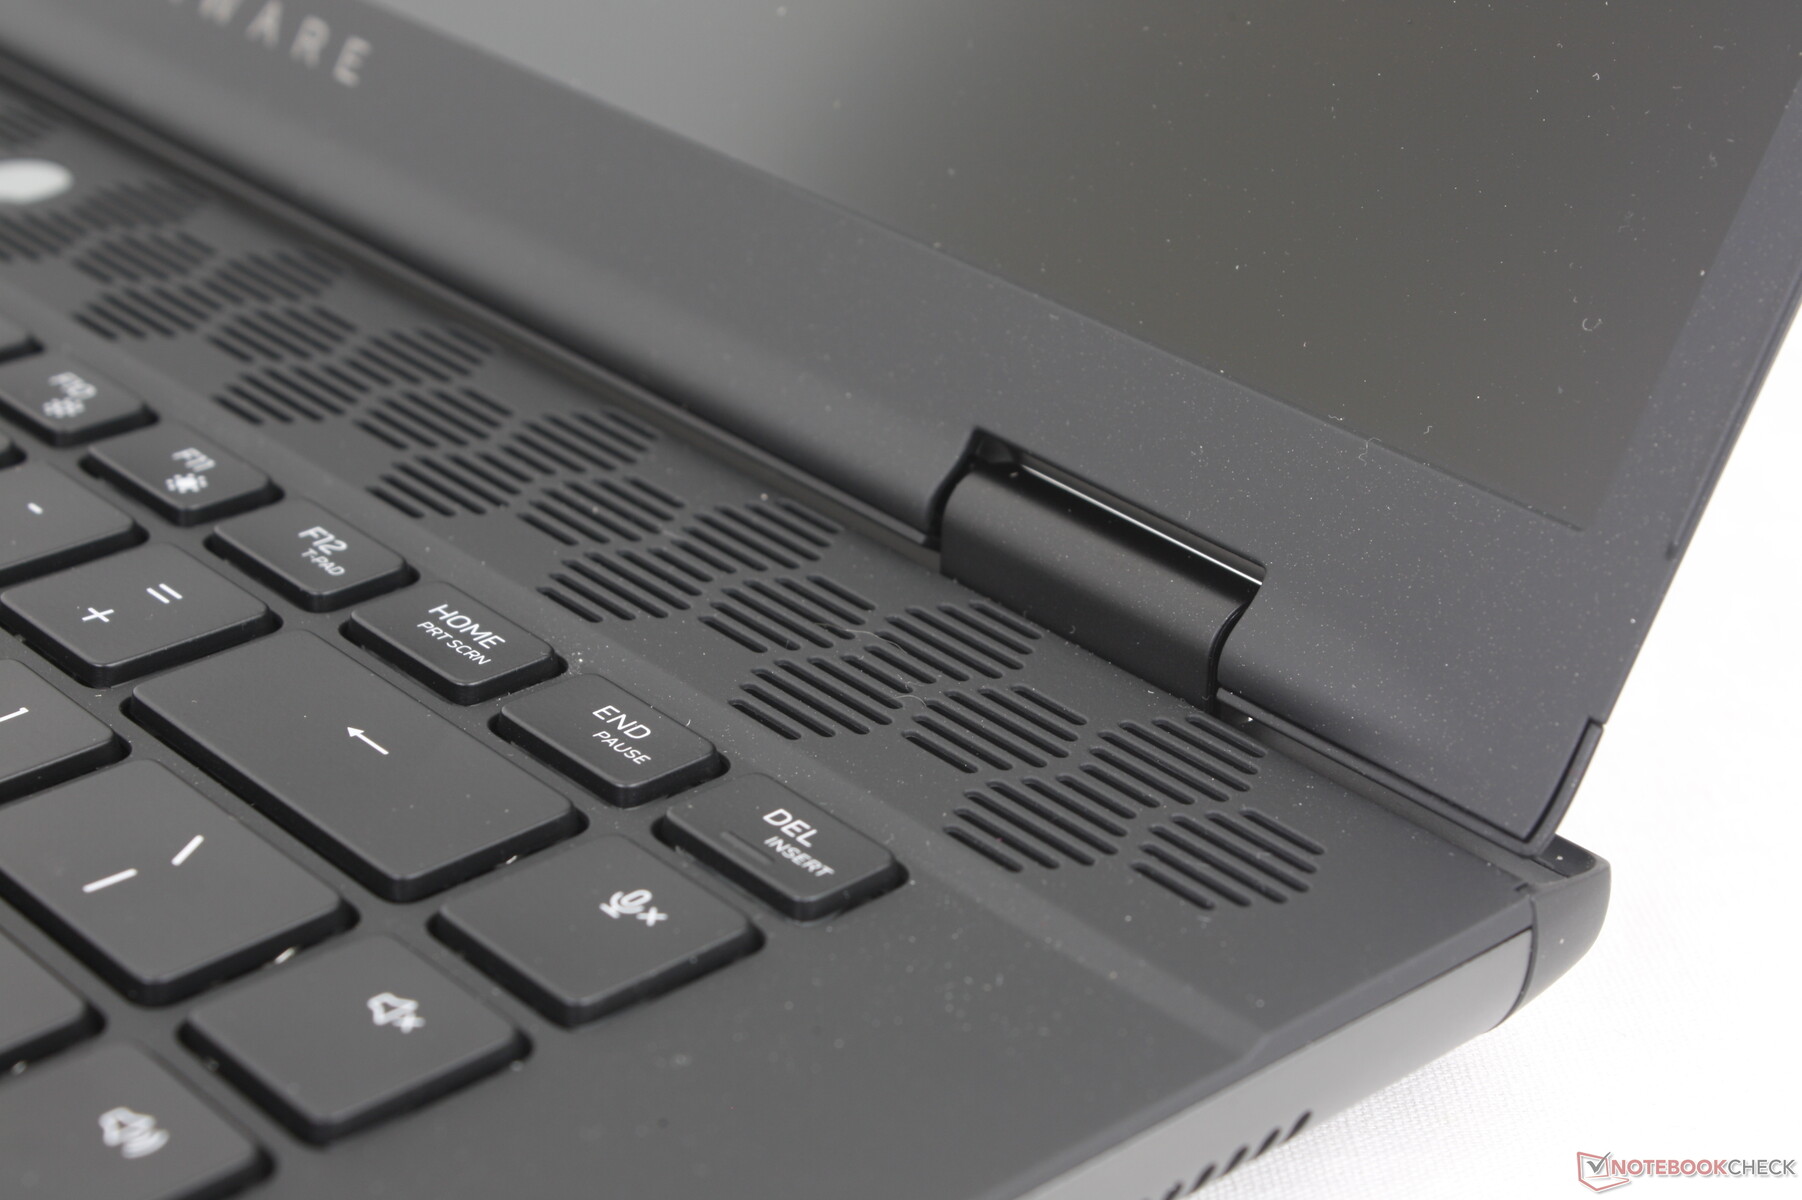
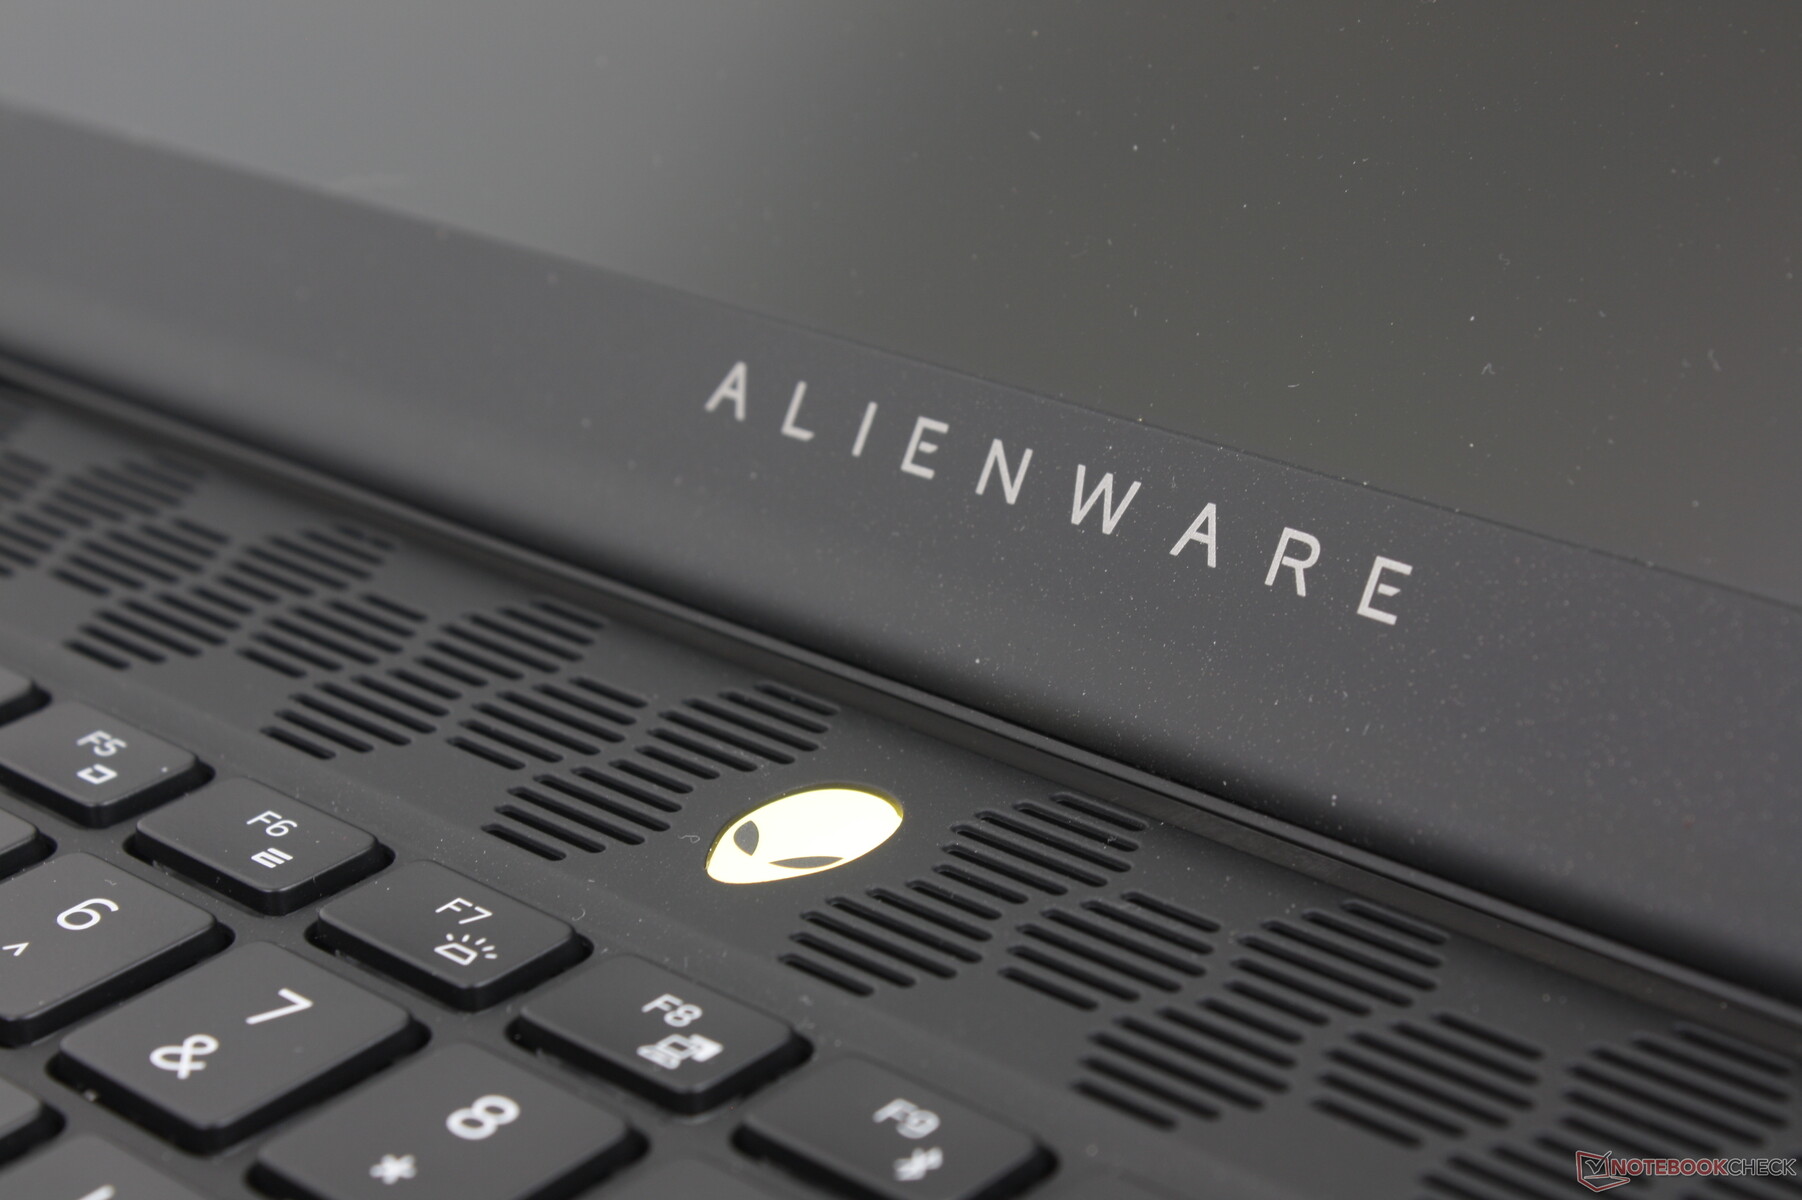
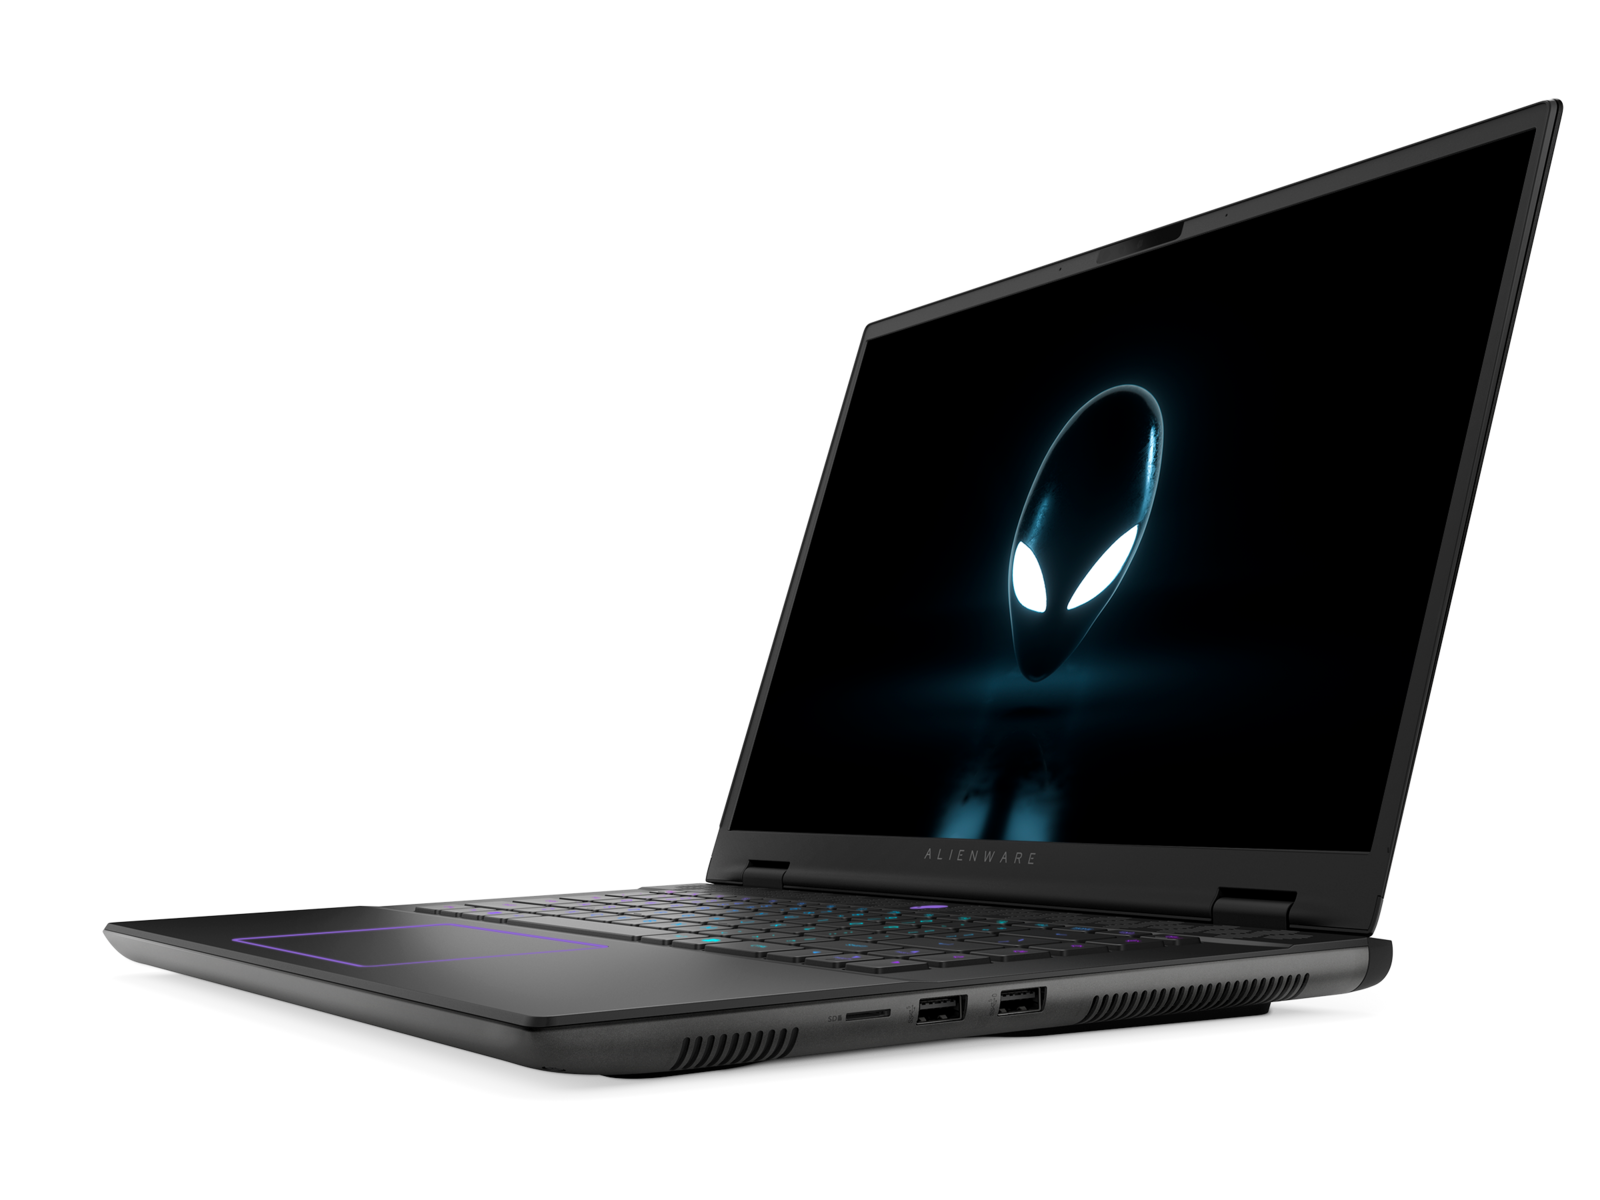
Cas - Légende 3.0 redéfinie
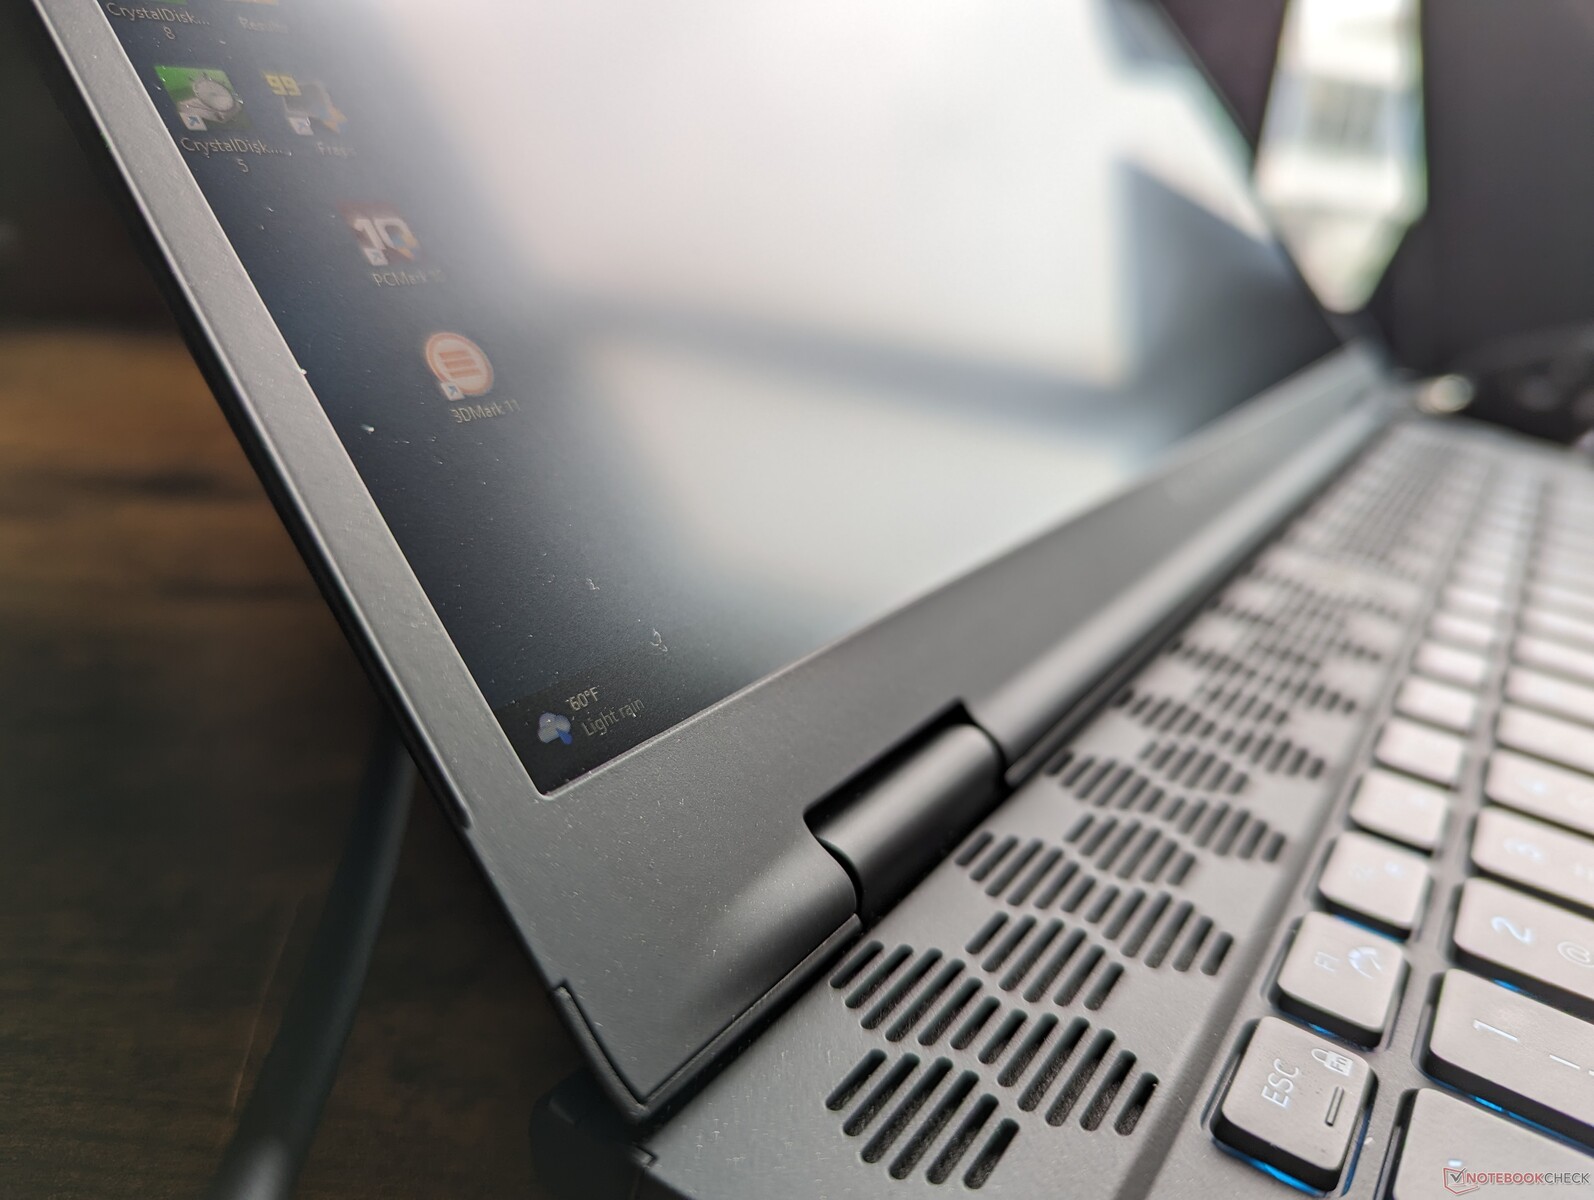
Le Alienware m16 R1 n'a même pas un an et Dell introduit déjà un nouveau design de châssis avec le m16 R2. Le changement le plus notable concerne la suppression de la platine thermique saillante à l'arrière pour un encombrement beaucoup plus faible qu'auparavant. L'anneau LED RVB à l'arrière a disparu et le clavier a été repoussé vers le haut pour faire de la place à des repose-poignets plus larges et à un pavé tactile plus grand.
Les matériaux du châssis sont les mêmes qu'auparavant, pour des textures et des impressions similaires. La rigidité n'a pas changé de façon notable et l'appareil semble toujours aussi solide de haut en bas, sans craquements majeurs ni points faibles évidents.
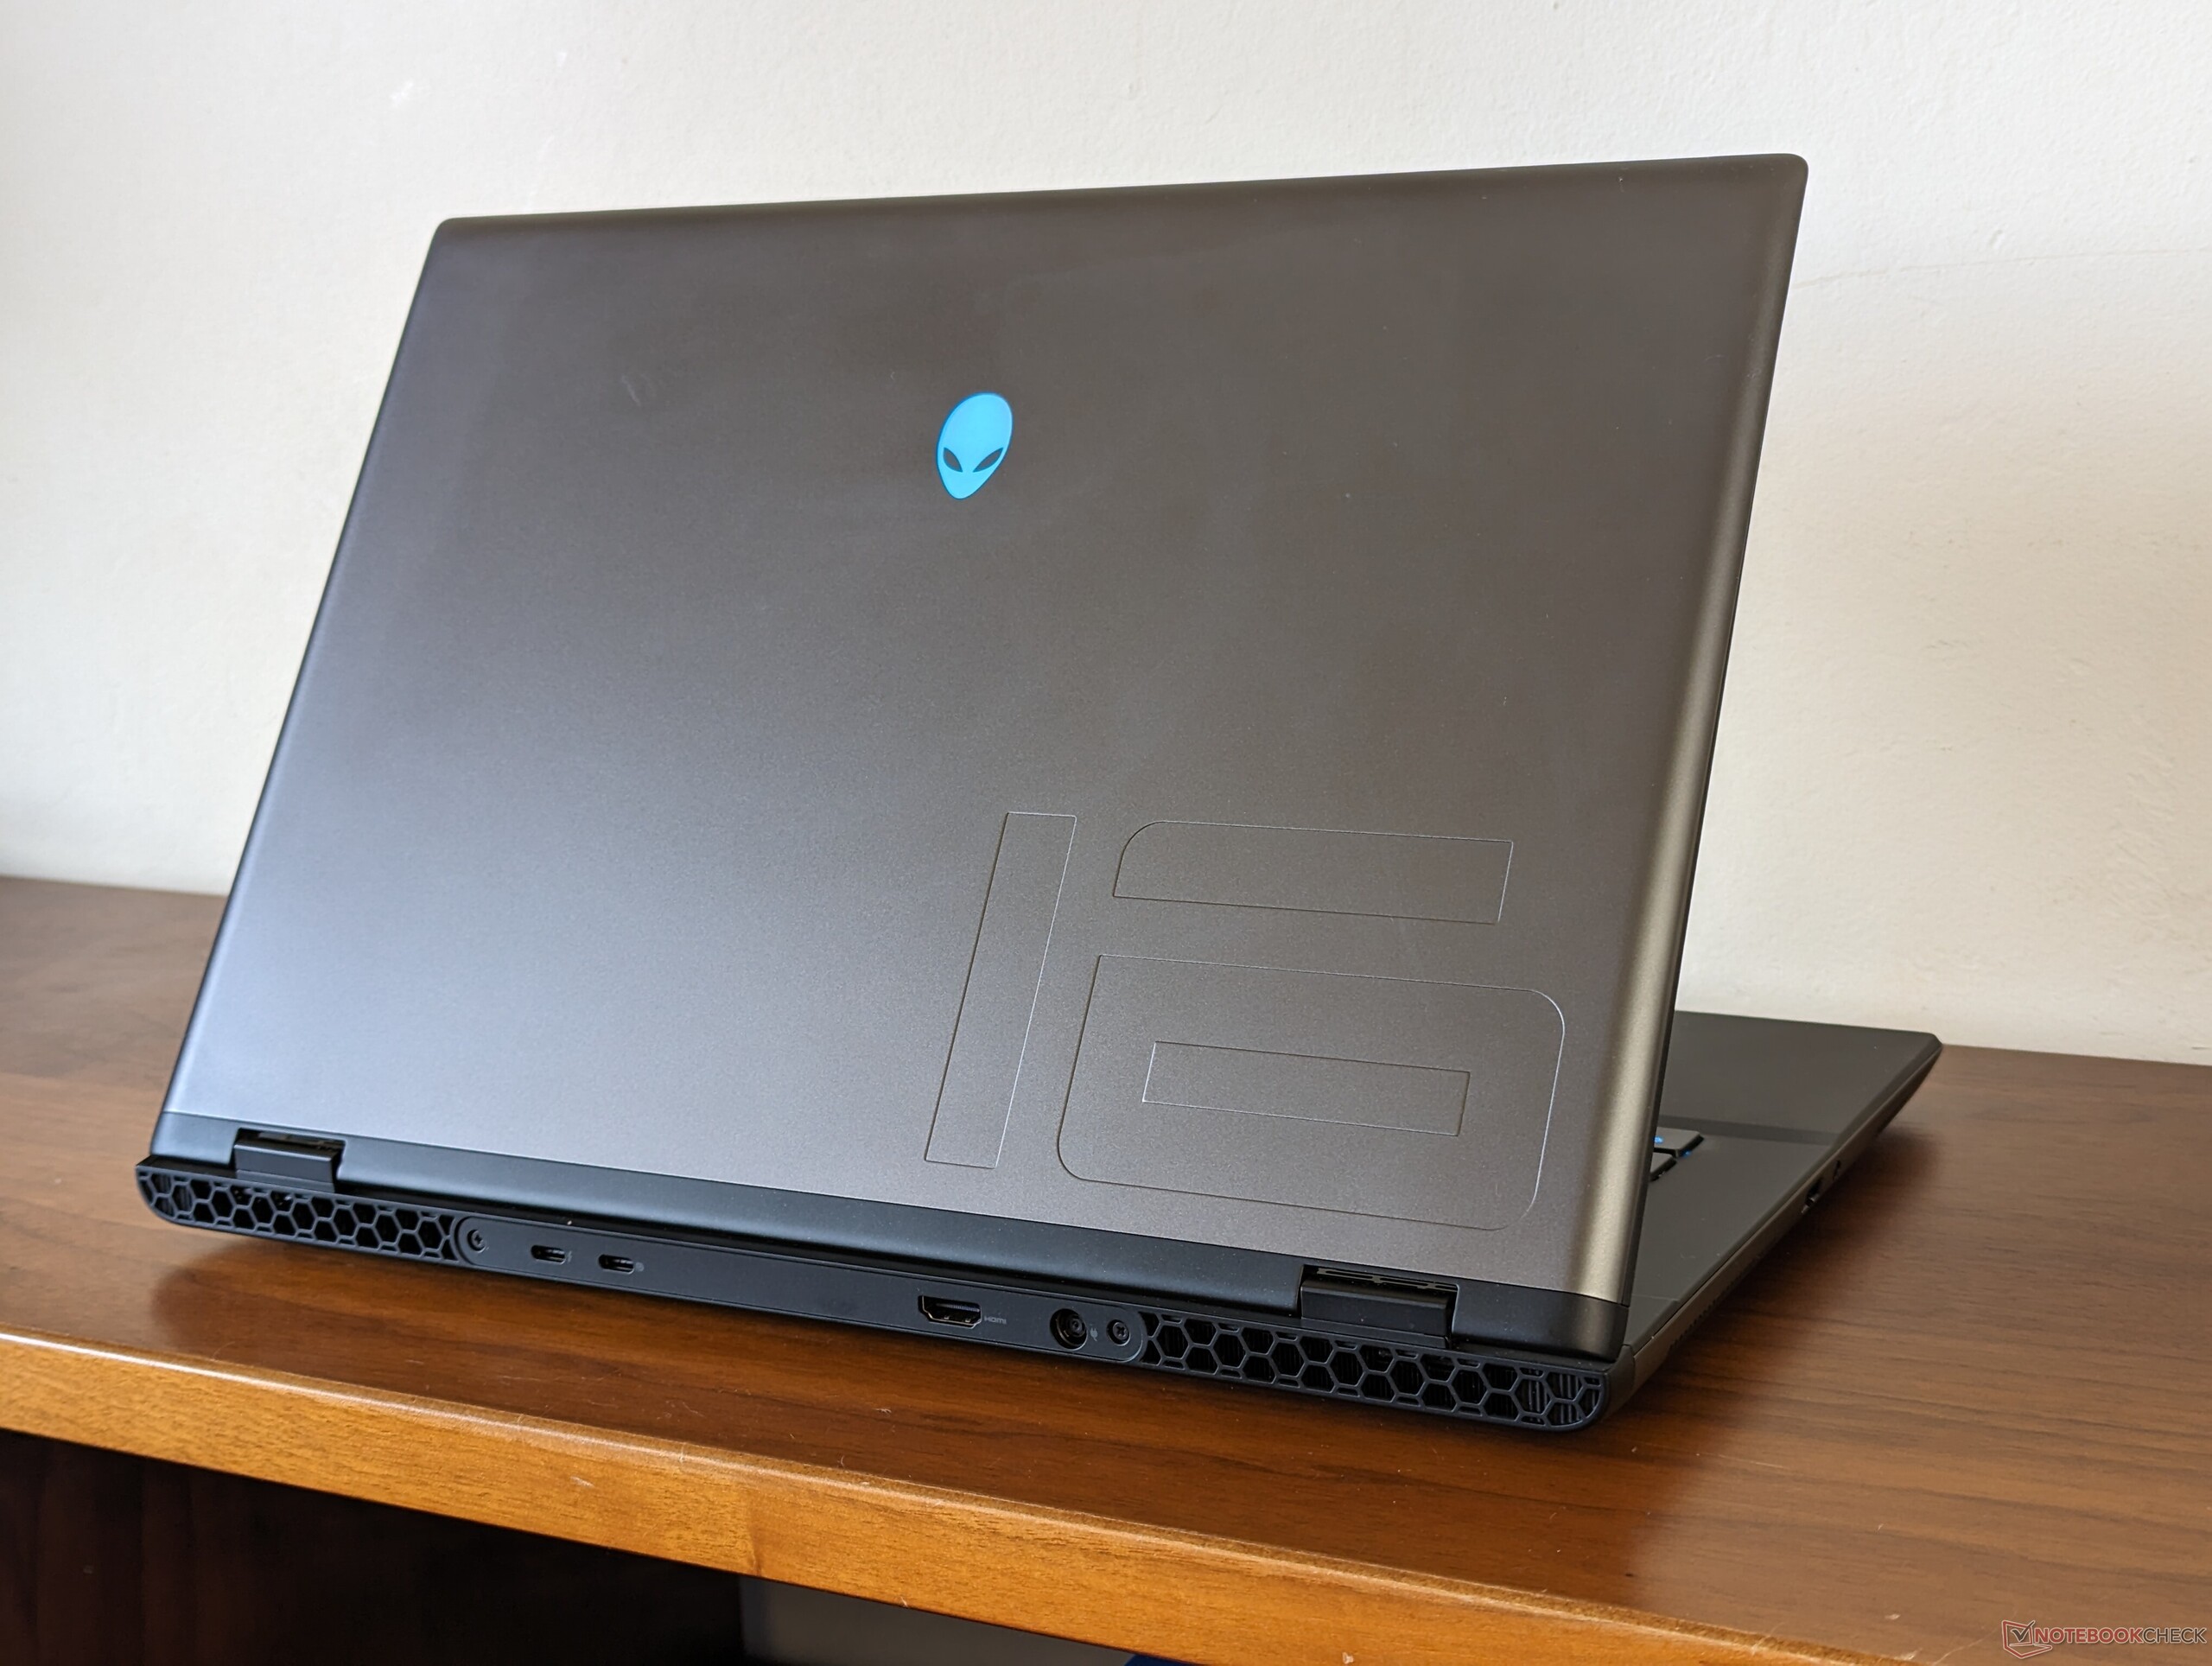
Les modifications importantes apportées au châssis ont permis de réduire considérablement le poids et les dimensions. Le m16 R2 est environ 17 % plus léger et 22 % plus petit que le m16 R1 pour une meilleure portabilité. L'empreinte plus petite permet également au système de s'adapter à des sacs à dos plus petits, alors que les dimensions plus larges du m16 R1 original nécessiteraient des sacs plus grands.
La réduction de taille n'est pas suffisante pour faire de la m16 R2 la plus petite de sa catégorie, car la Razer Blade 16 et l'Asus Zephyrus G16 Asus Zephyrus G16 sont toujours plus légers et plus petits.
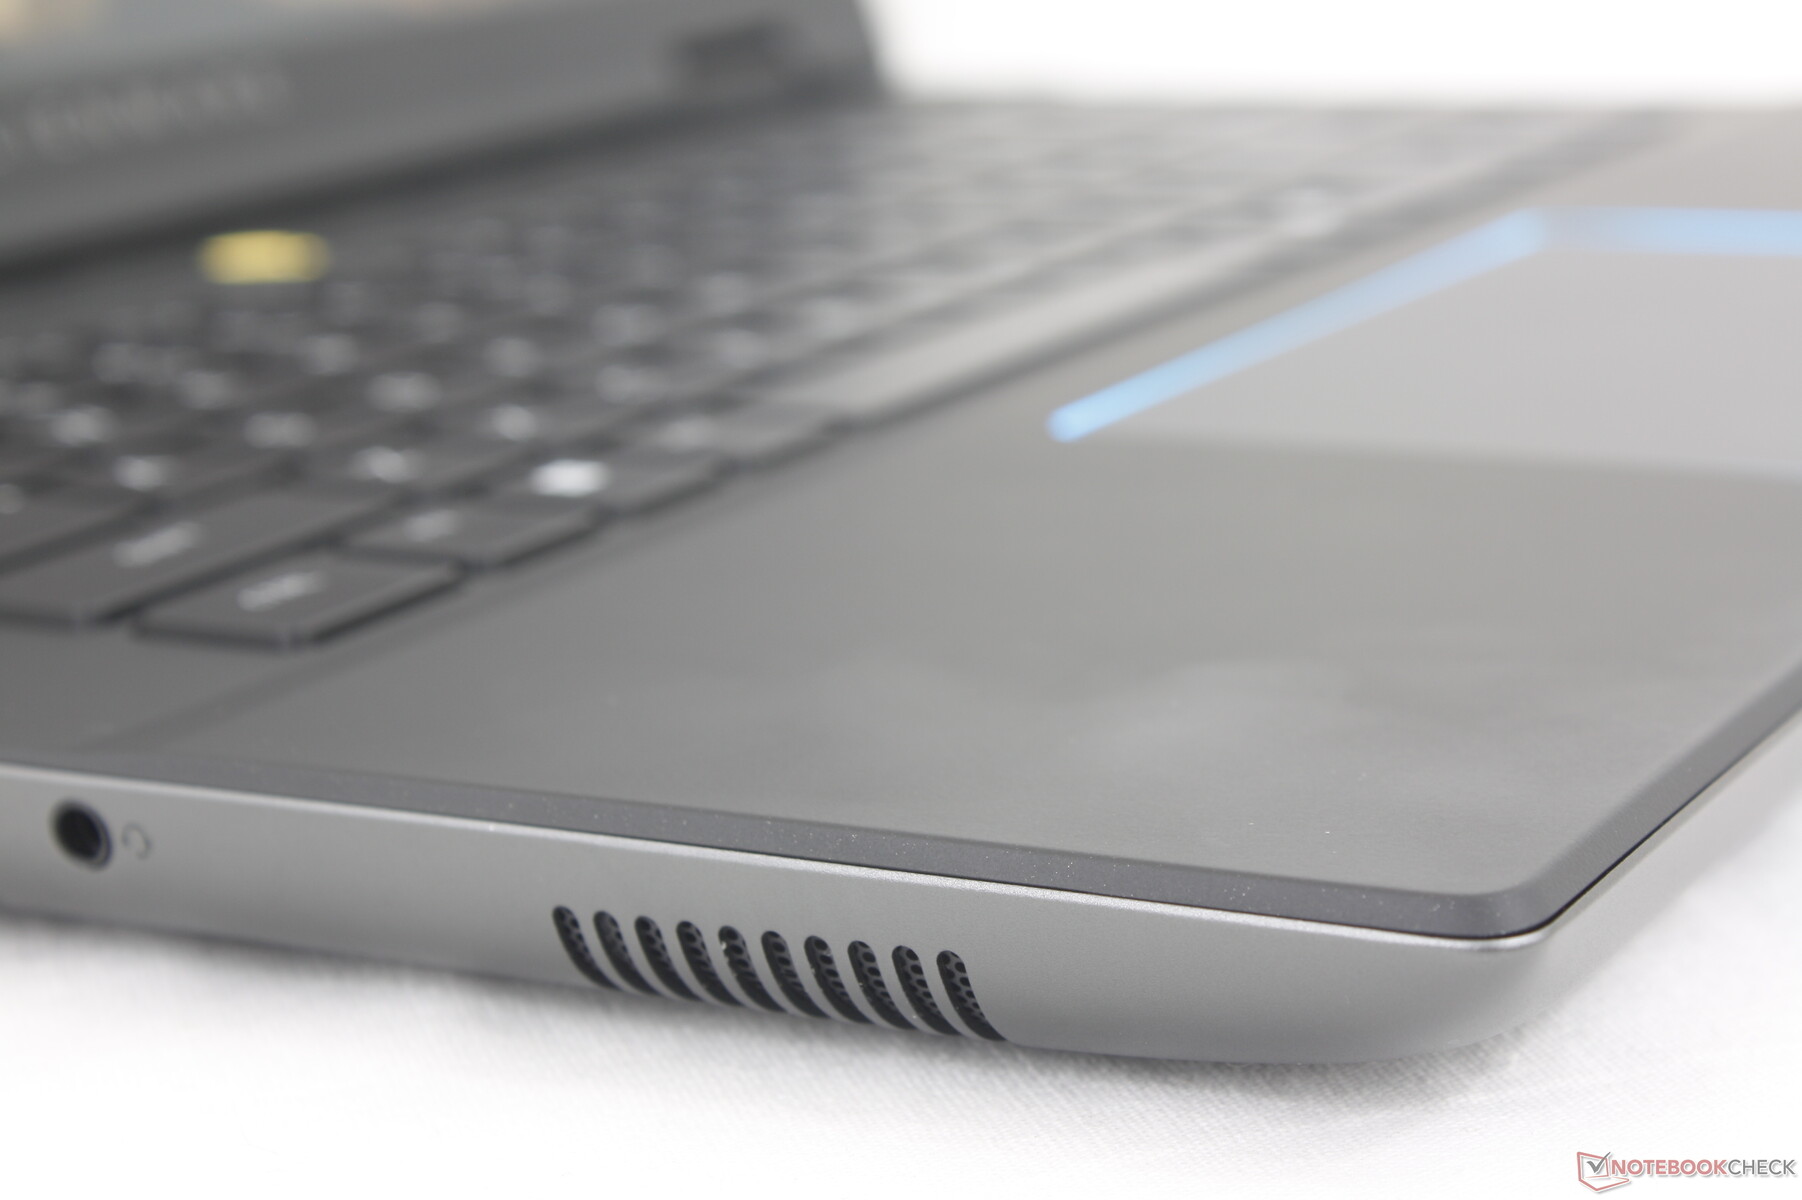
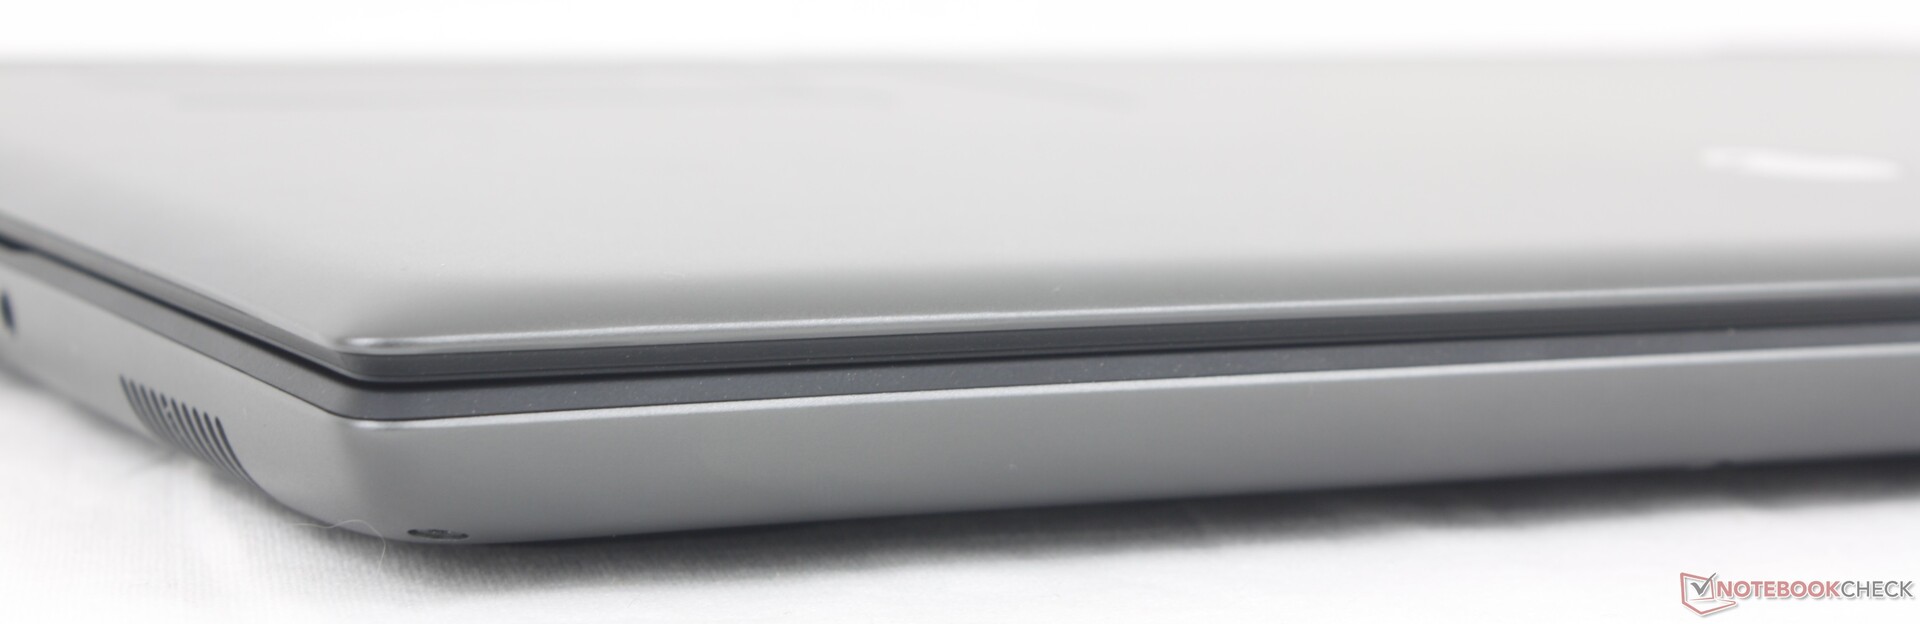
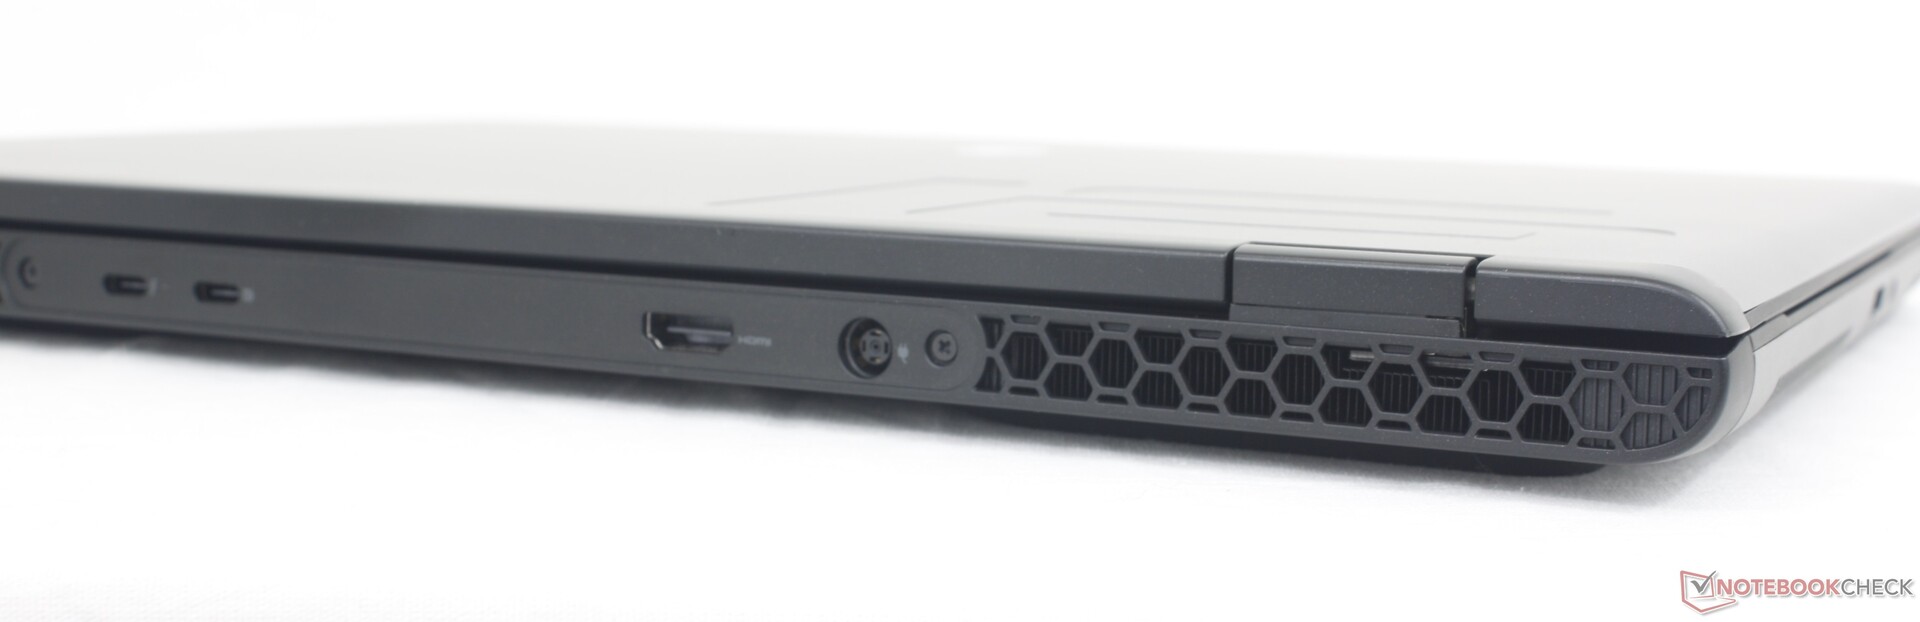
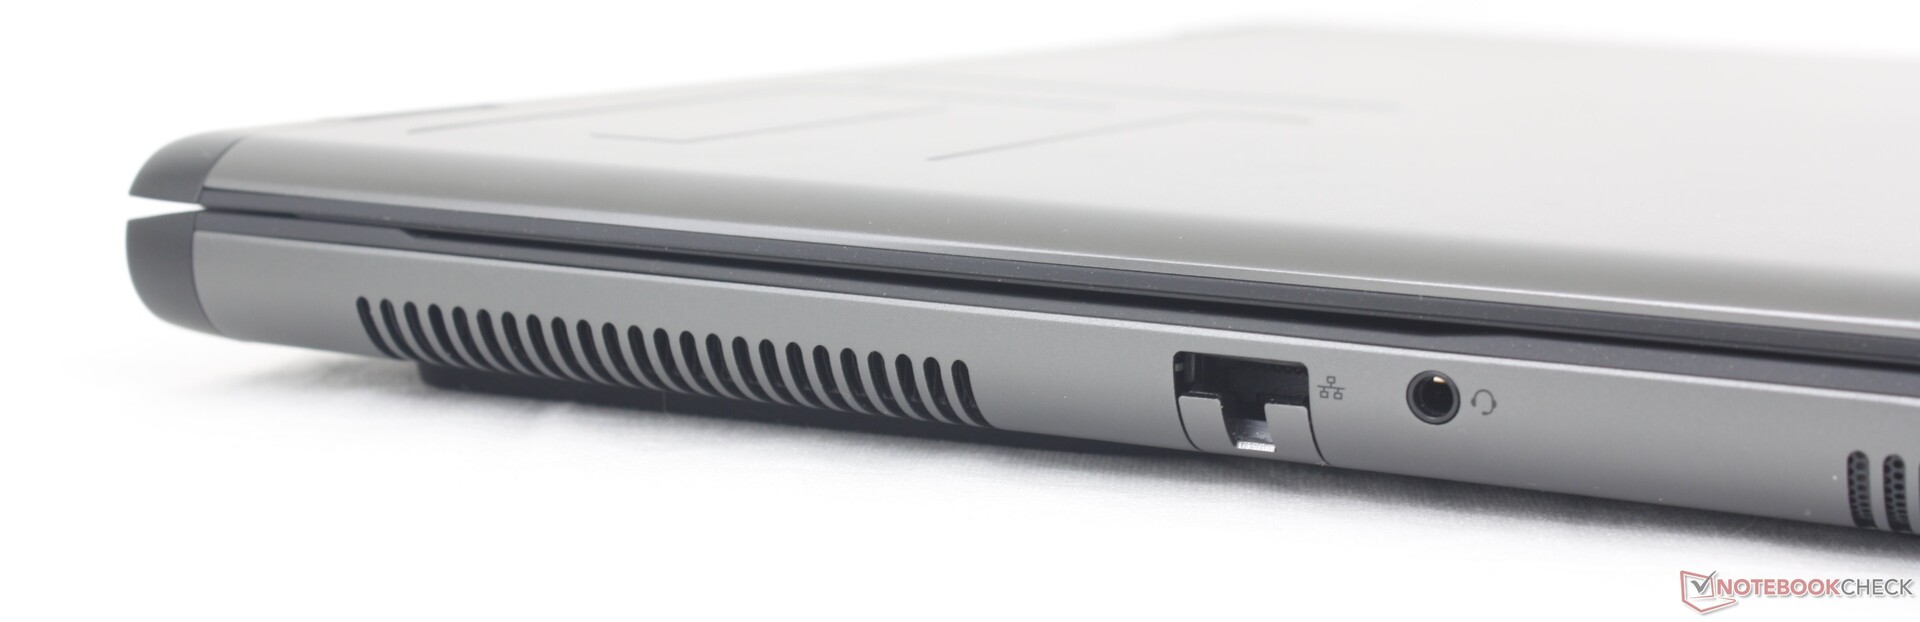
Connectivité - Toutes les bases sont ici
Tous les ports du m16 R1 de l'année dernière sont de retour, à l'exception du mini-port d'affichage. Le positionnement des ports a changé avec le RJ-45 et la prise audio déplacés sur le bord gauche alors que la plupart des ports du m16 R1 se trouvaient à l'arrière.
Gardez à l'esprit que seul l'un des deux ports USB-C prend en charge Power Delivery. Les deux sont par ailleurs compatibles avec des moniteurs externes.
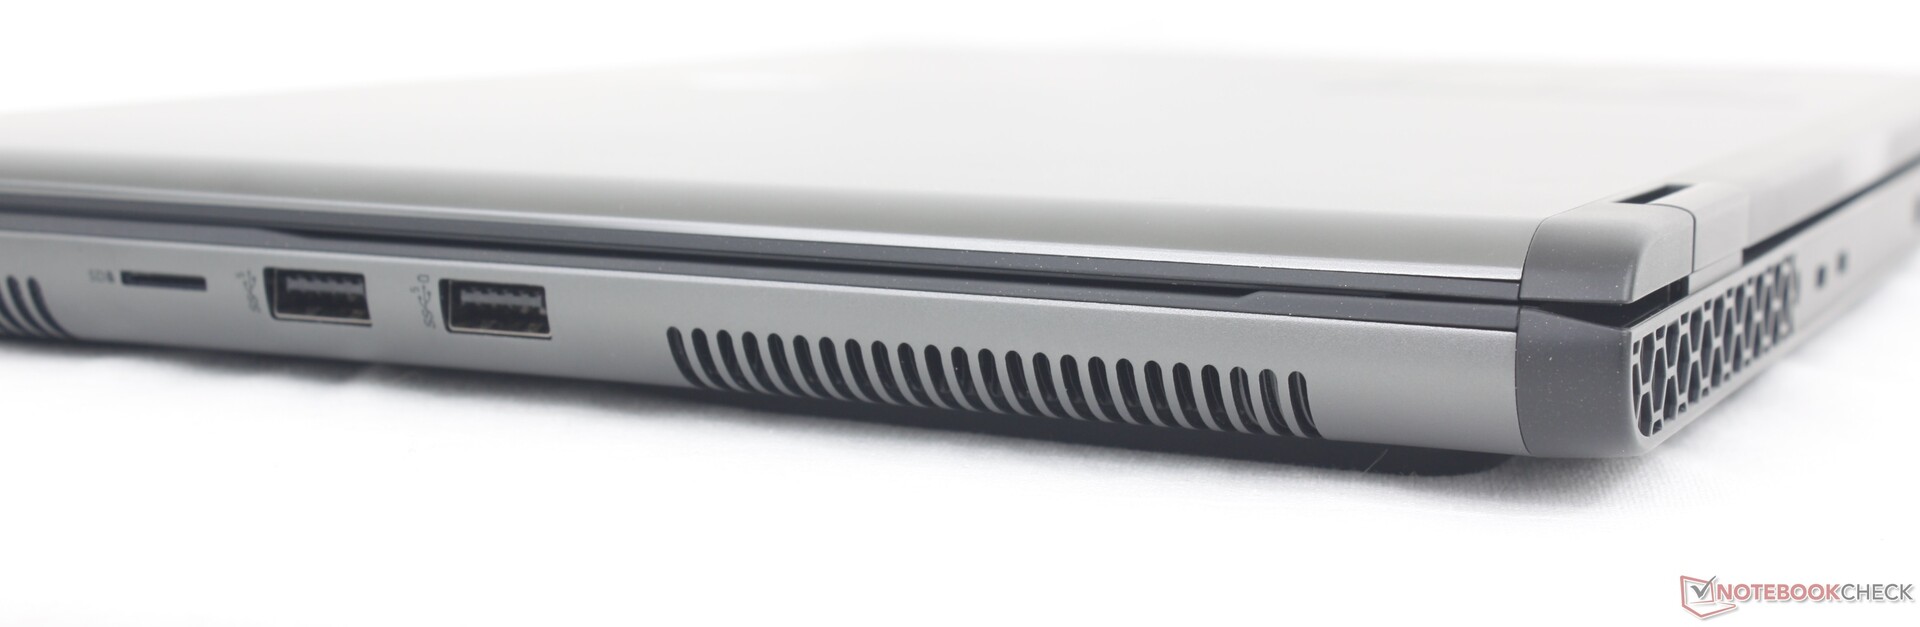
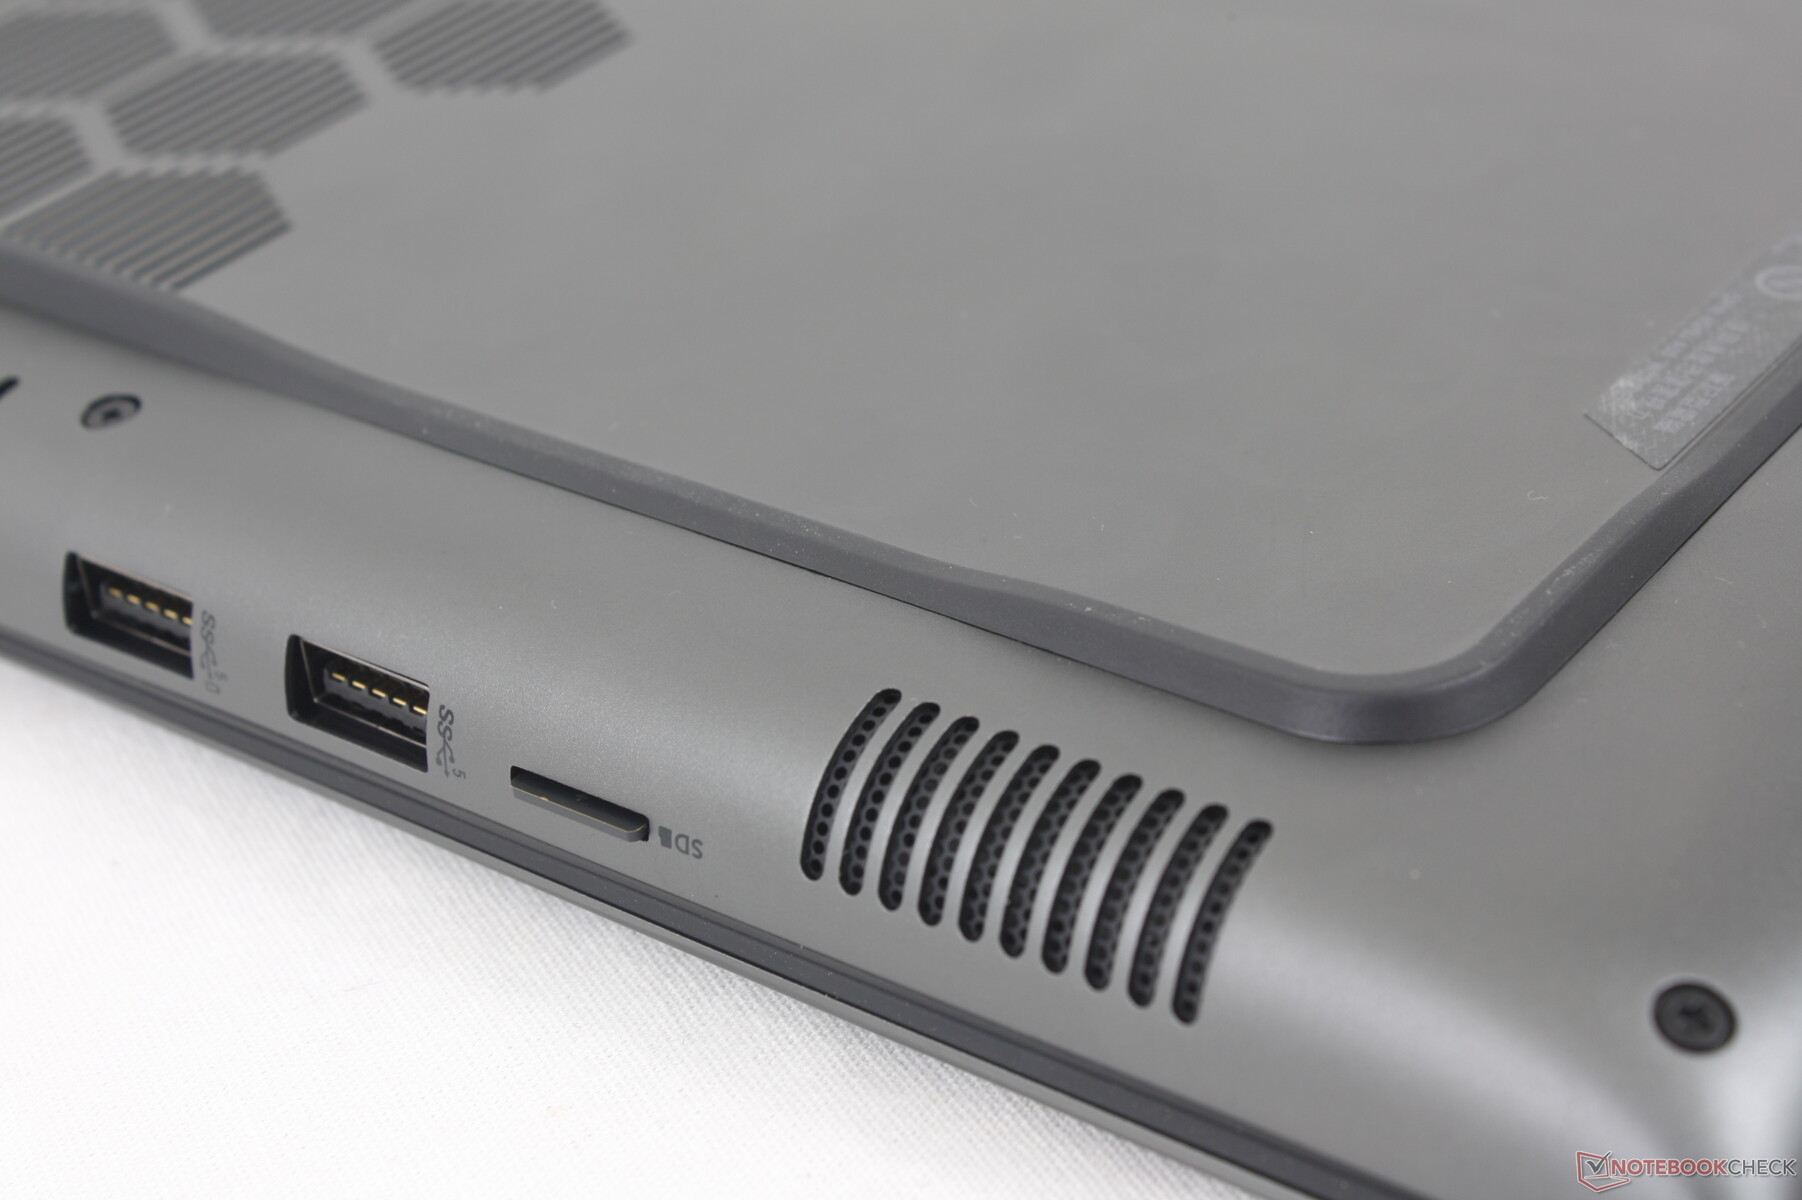
Lecteur de carte SD
Alors que le m16 R1 disposait d'un lecteur SD de grande taille, le m16 R2 a malheureusement opté pour un lecteur MicroSD, ce qui risque d'irriter certains créateurs de contenu. Les taux de transfert sont néanmoins à peu près les mêmes que ceux que nous avons enregistrés sur le m16 R1 malgré le passage au lecteur MicroSD.
| SD Card Reader | |
| average JPG Copy Test (av. of 3 runs) | |
| Alienware m16 R1 Intel (AV PRO microSD 128 GB V60) | |
| Lenovo Legion Slim 7 16APH8 (AV PRO microSD 128 GB V60) | |
| Asus ROG Zephyrus G16 2024 GU605M | |
| Alienware m16 R2 (AV PRO microSD 128 GB V60) | |
| Alienware x16 R1 (AV PRO microSD 128 GB V60) | |
| maximum AS SSD Seq Read Test (1GB) | |
| Alienware x16 R1 (AV PRO microSD 128 GB V60) | |
| Alienware m16 R2 (AV PRO microSD 128 GB V60) | |
| Alienware m16 R1 Intel (AV PRO microSD 128 GB V60) | |
| Asus ROG Zephyrus G16 2024 GU605M | |
| Lenovo Legion Slim 7 16APH8 (AV PRO microSD 128 GB V60) | |
Communication
L'Intel Killer AX1675 est livré en standard avec une connectivité Wi-Fi 6E, avec une option de mise à niveau vers le BE202 pour une compatibilité Wi-Fi 7. Nous n'avons rencontré aucun problème lorsque nous l'avons couplé à notre routeur de test Asus AXE11000.
| Networking | |
| iperf3 transmit AXE11000 | |
| Asus ROG Zephyrus G16 2024 GU605M | |
| HP Omen Transcend 16-u1095ng | |
| Alienware m16 R1 Intel | |
| Alienware m16 R2 | |
| Alienware x16 R1 | |
| Lenovo Legion Slim 7 16APH8 | |
| iperf3 receive AXE11000 | |
| Lenovo Legion Slim 7 16APH8 | |
| HP Omen Transcend 16-u1095ng | |
| Alienware m16 R1 Intel | |
| Asus ROG Zephyrus G16 2024 GU605M | |
| Alienware x16 R1 | |
| Alienware m16 R2 | |
| iperf3 transmit AXE11000 6GHz | |
| Alienware m16 R2 | |
| Alienware x16 R1 | |
| iperf3 receive AXE11000 6GHz | |
| Alienware m16 R2 | |
| Alienware x16 R1 | |
Webcam
Une webcam de 2 mégapixels est fournie en standard, avec une interface infrarouge pour la prise en charge de Windows Hello. Il n'y a pas de volet de confidentialité intégré.


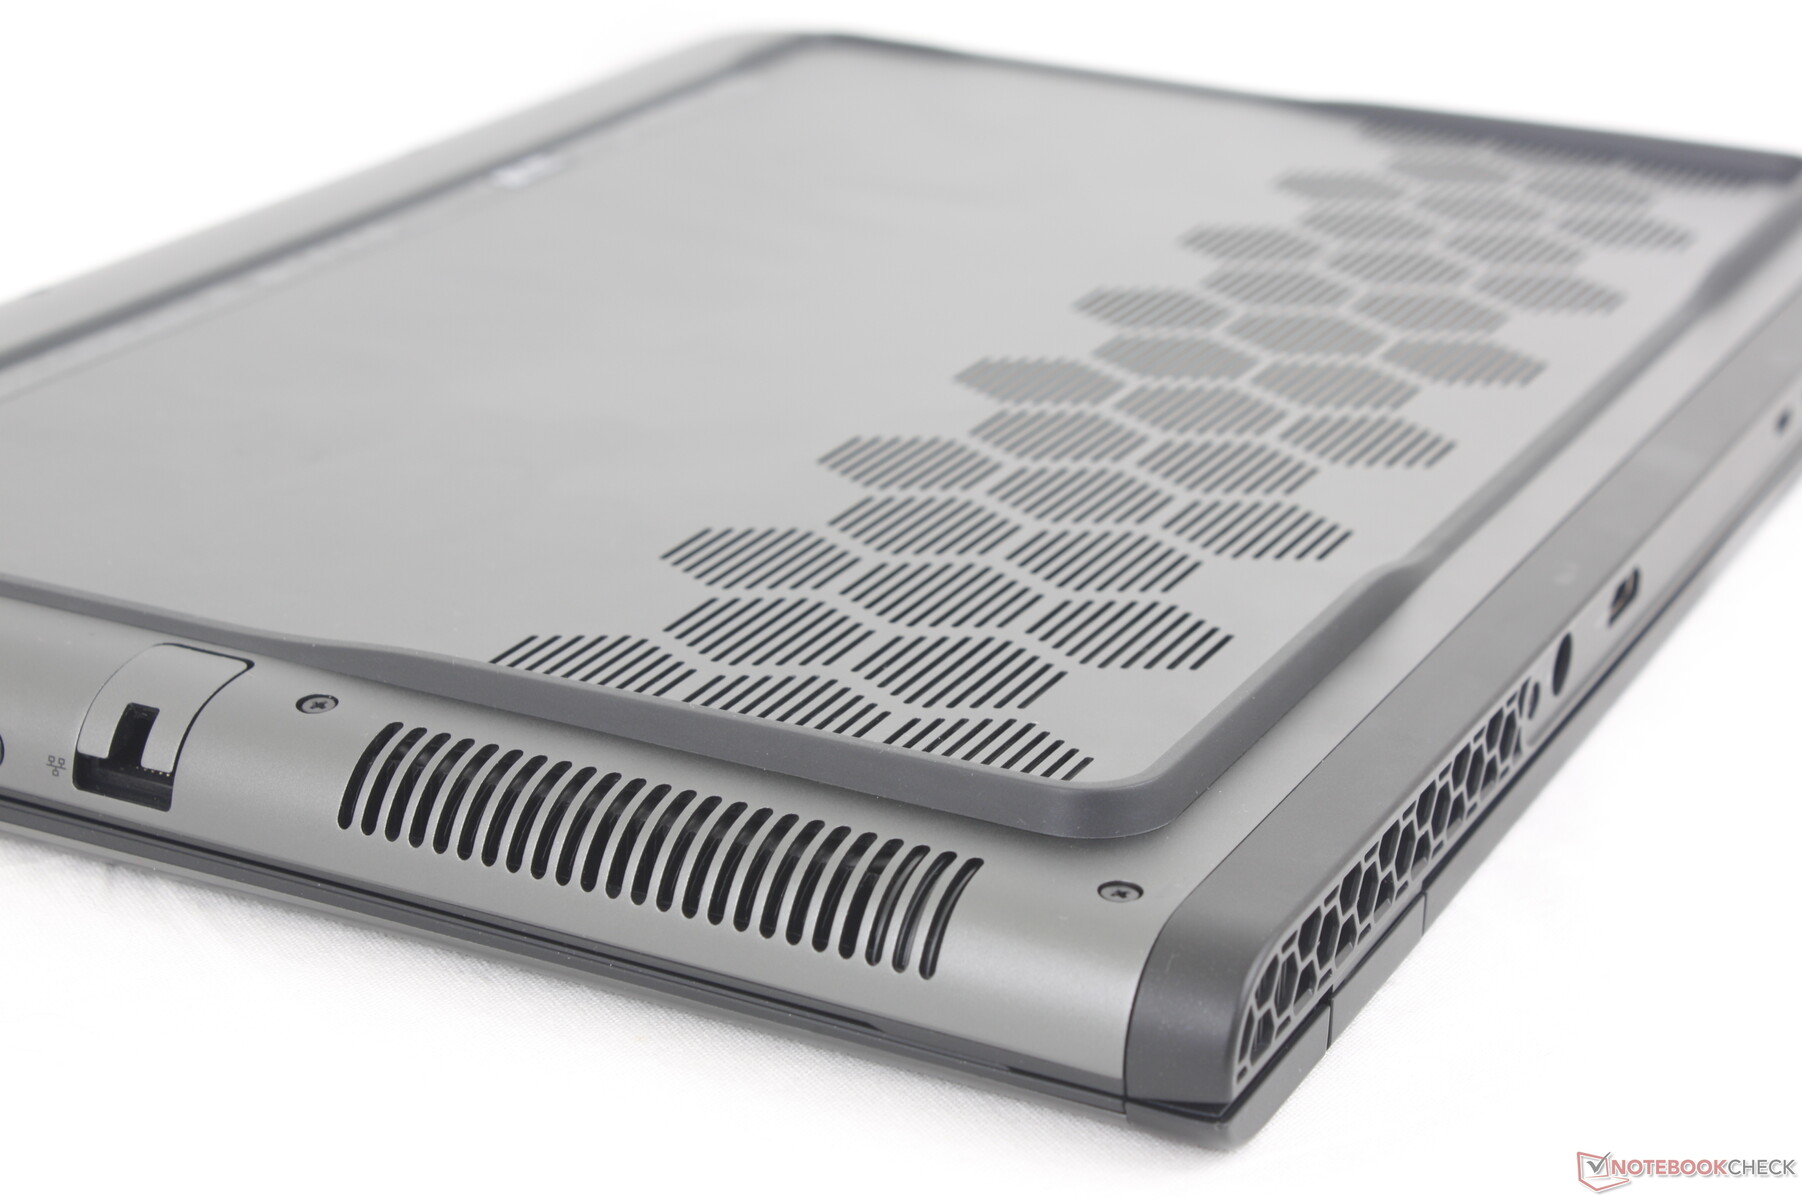
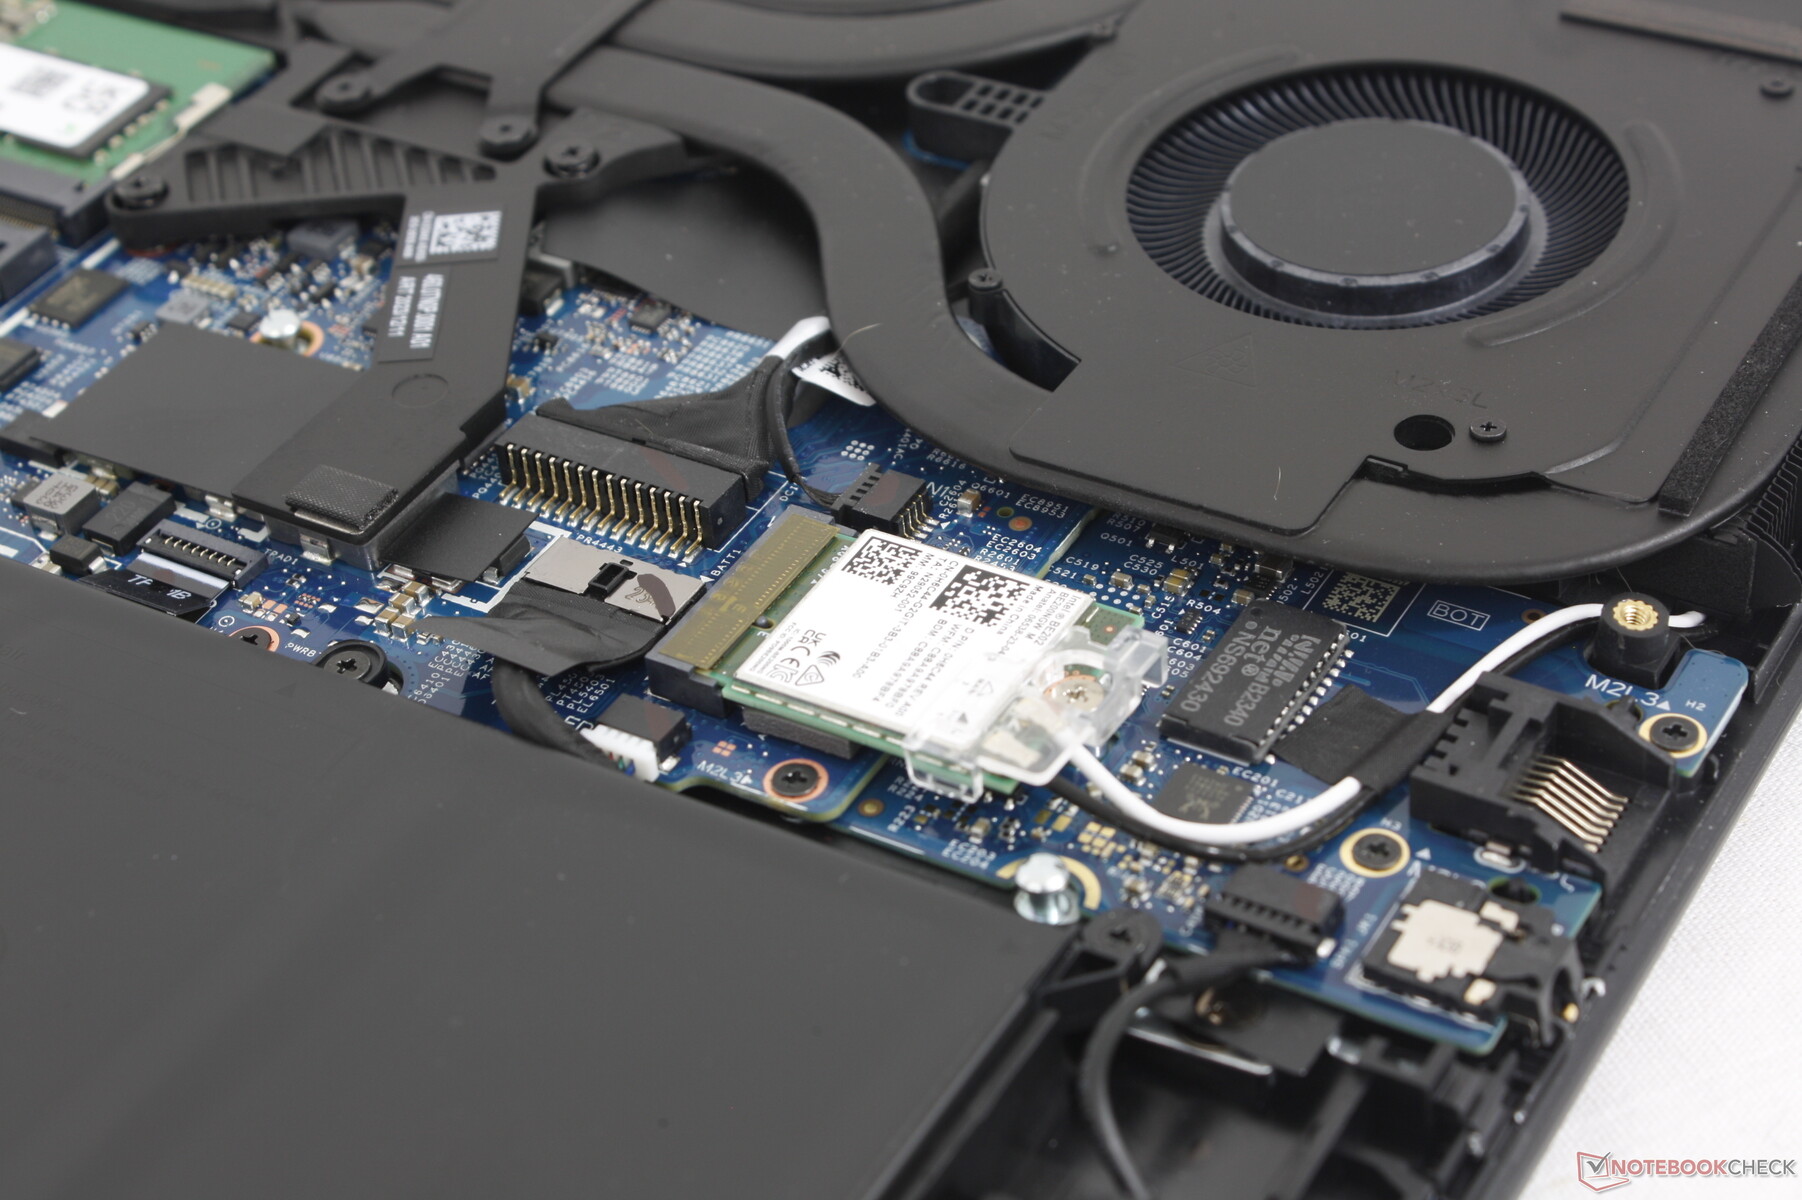
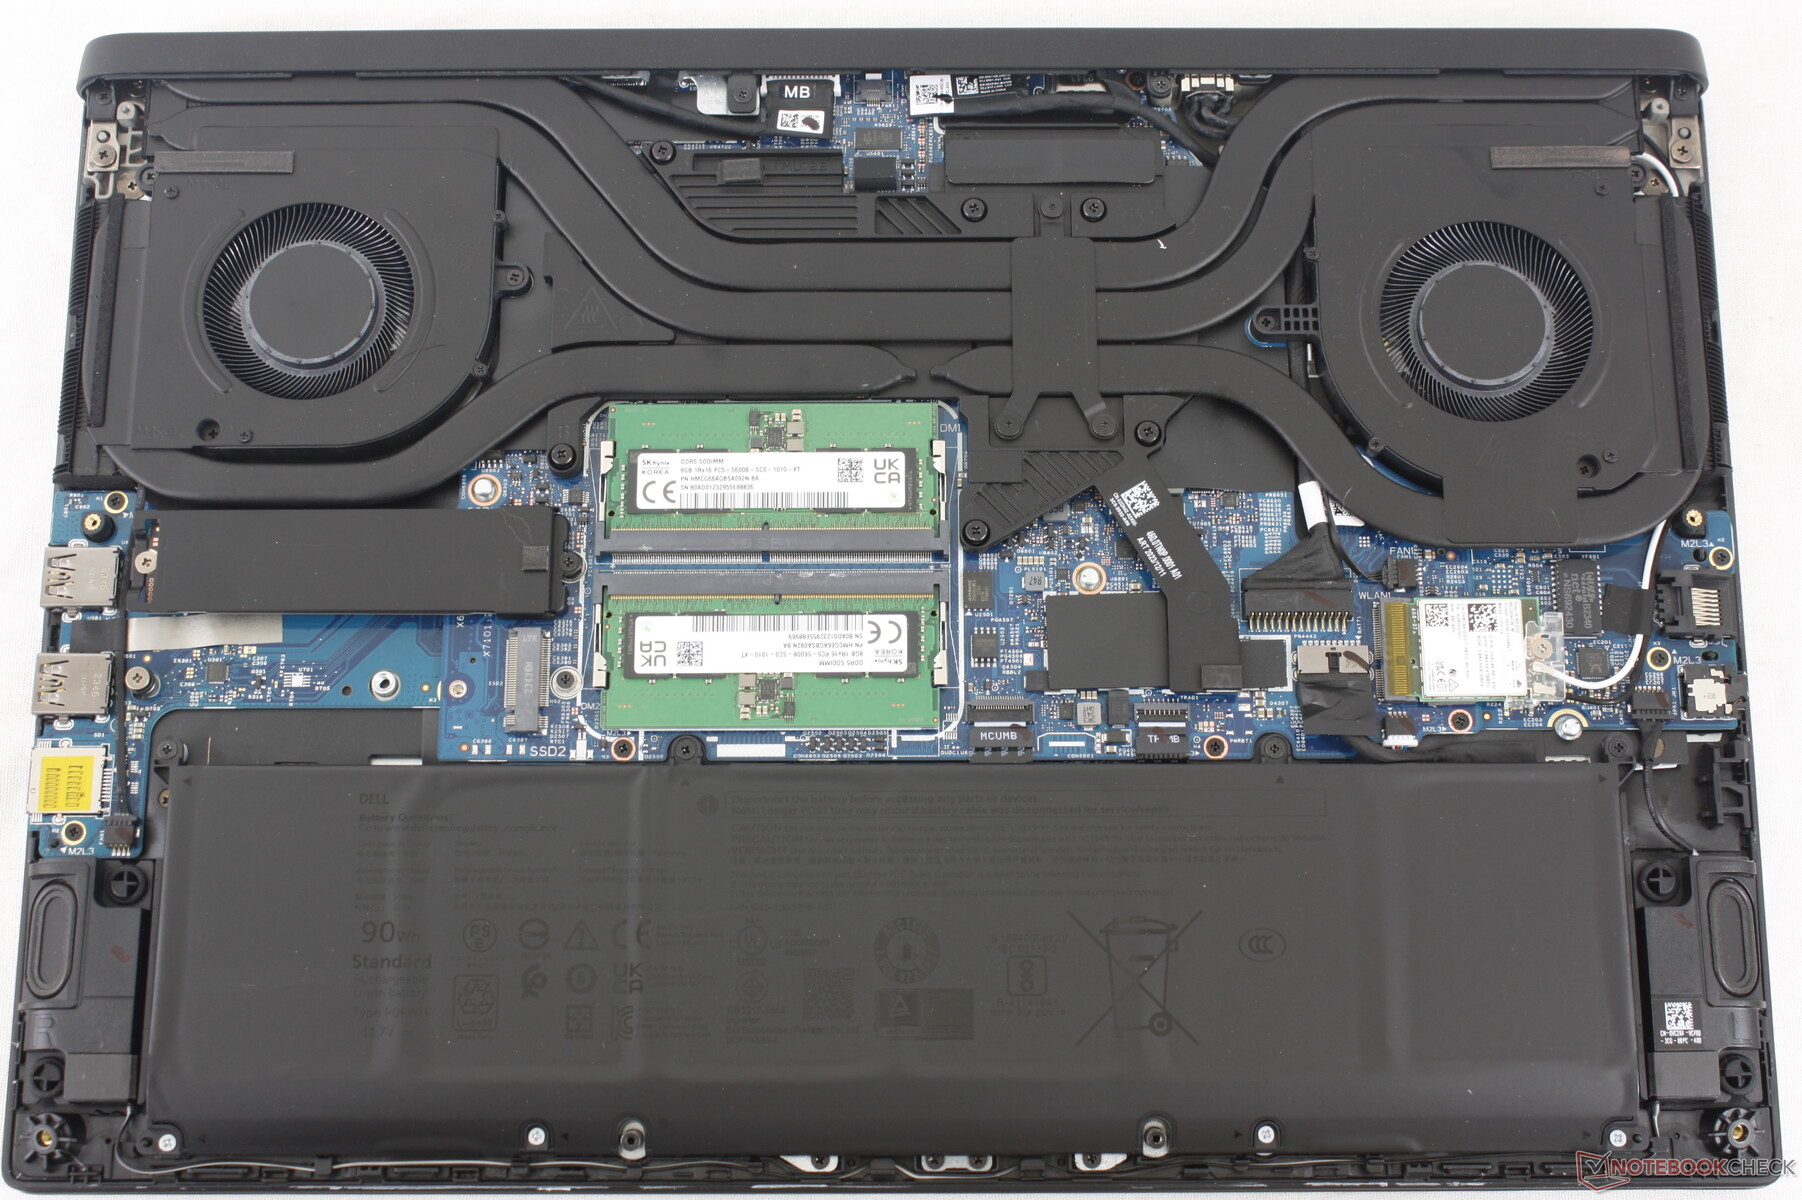
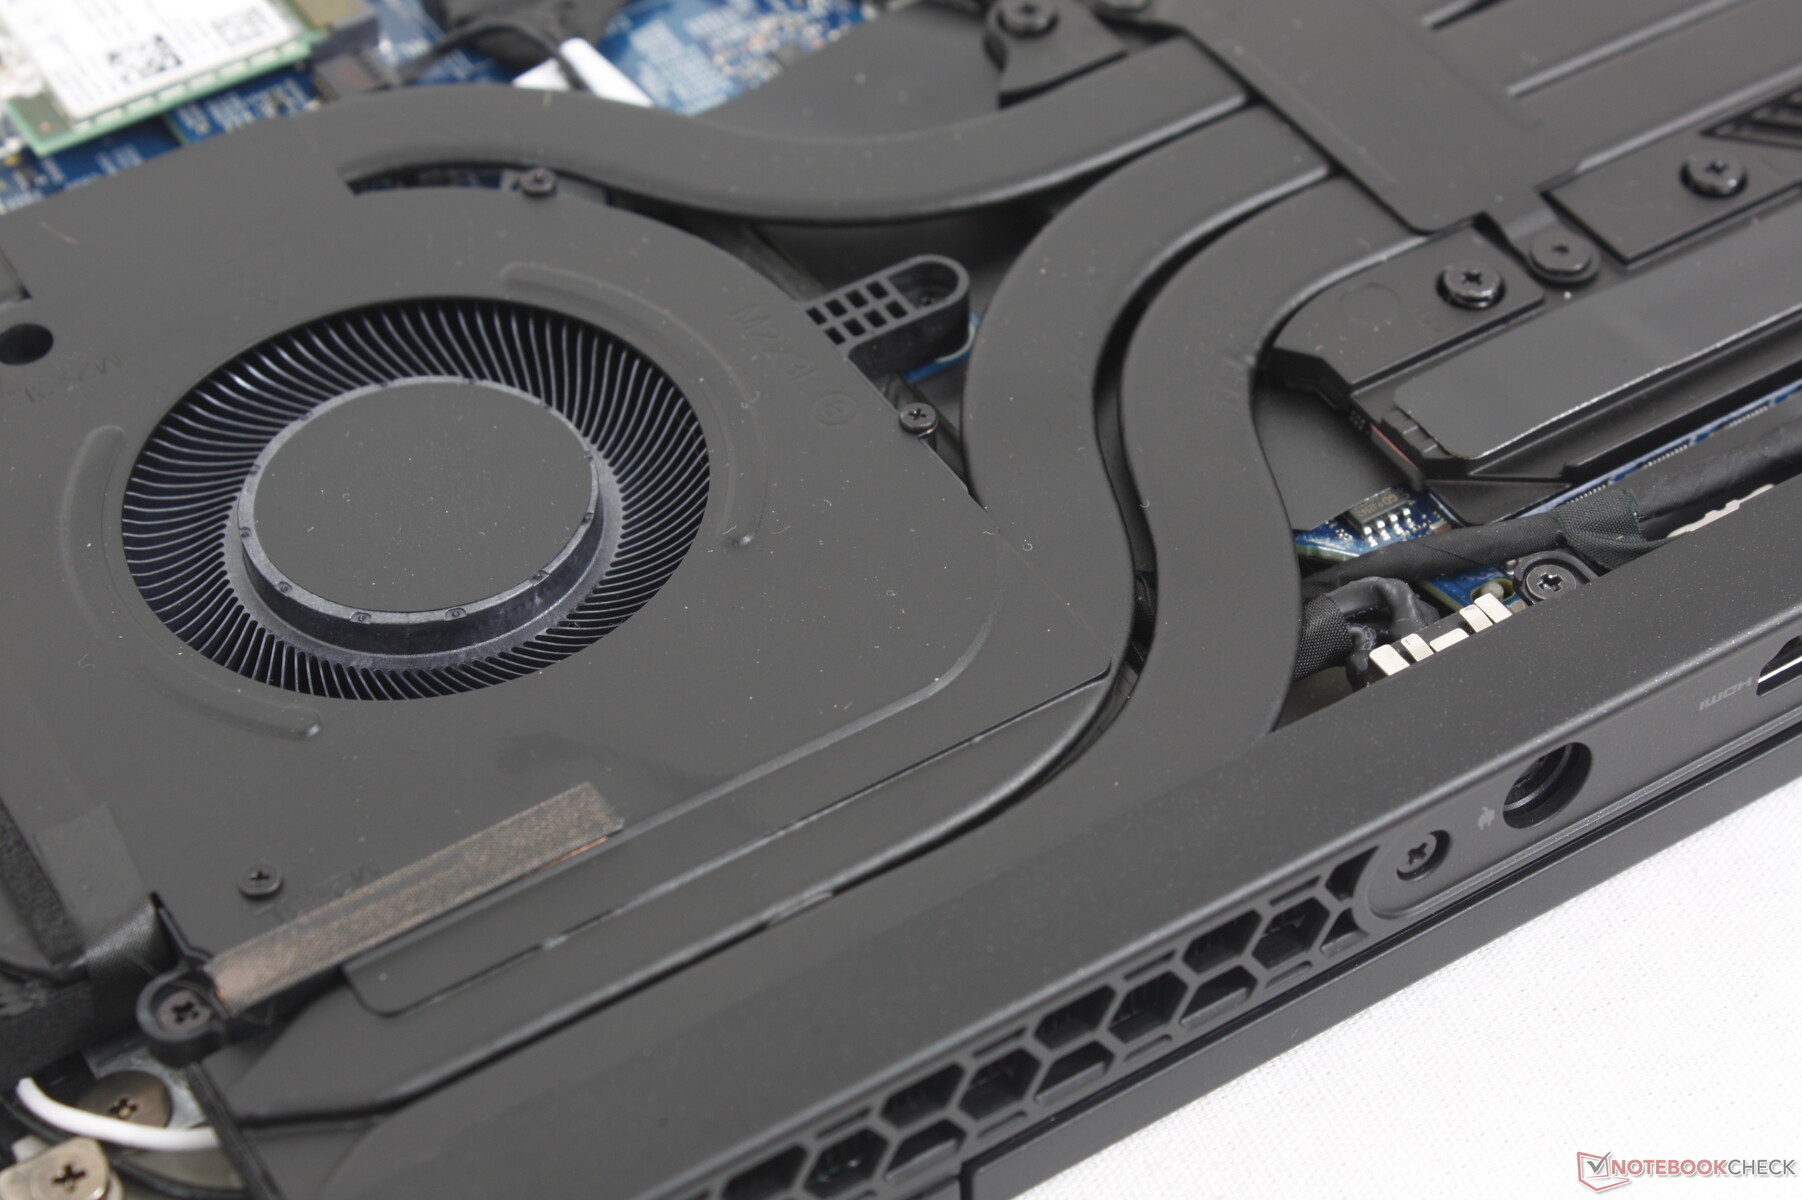
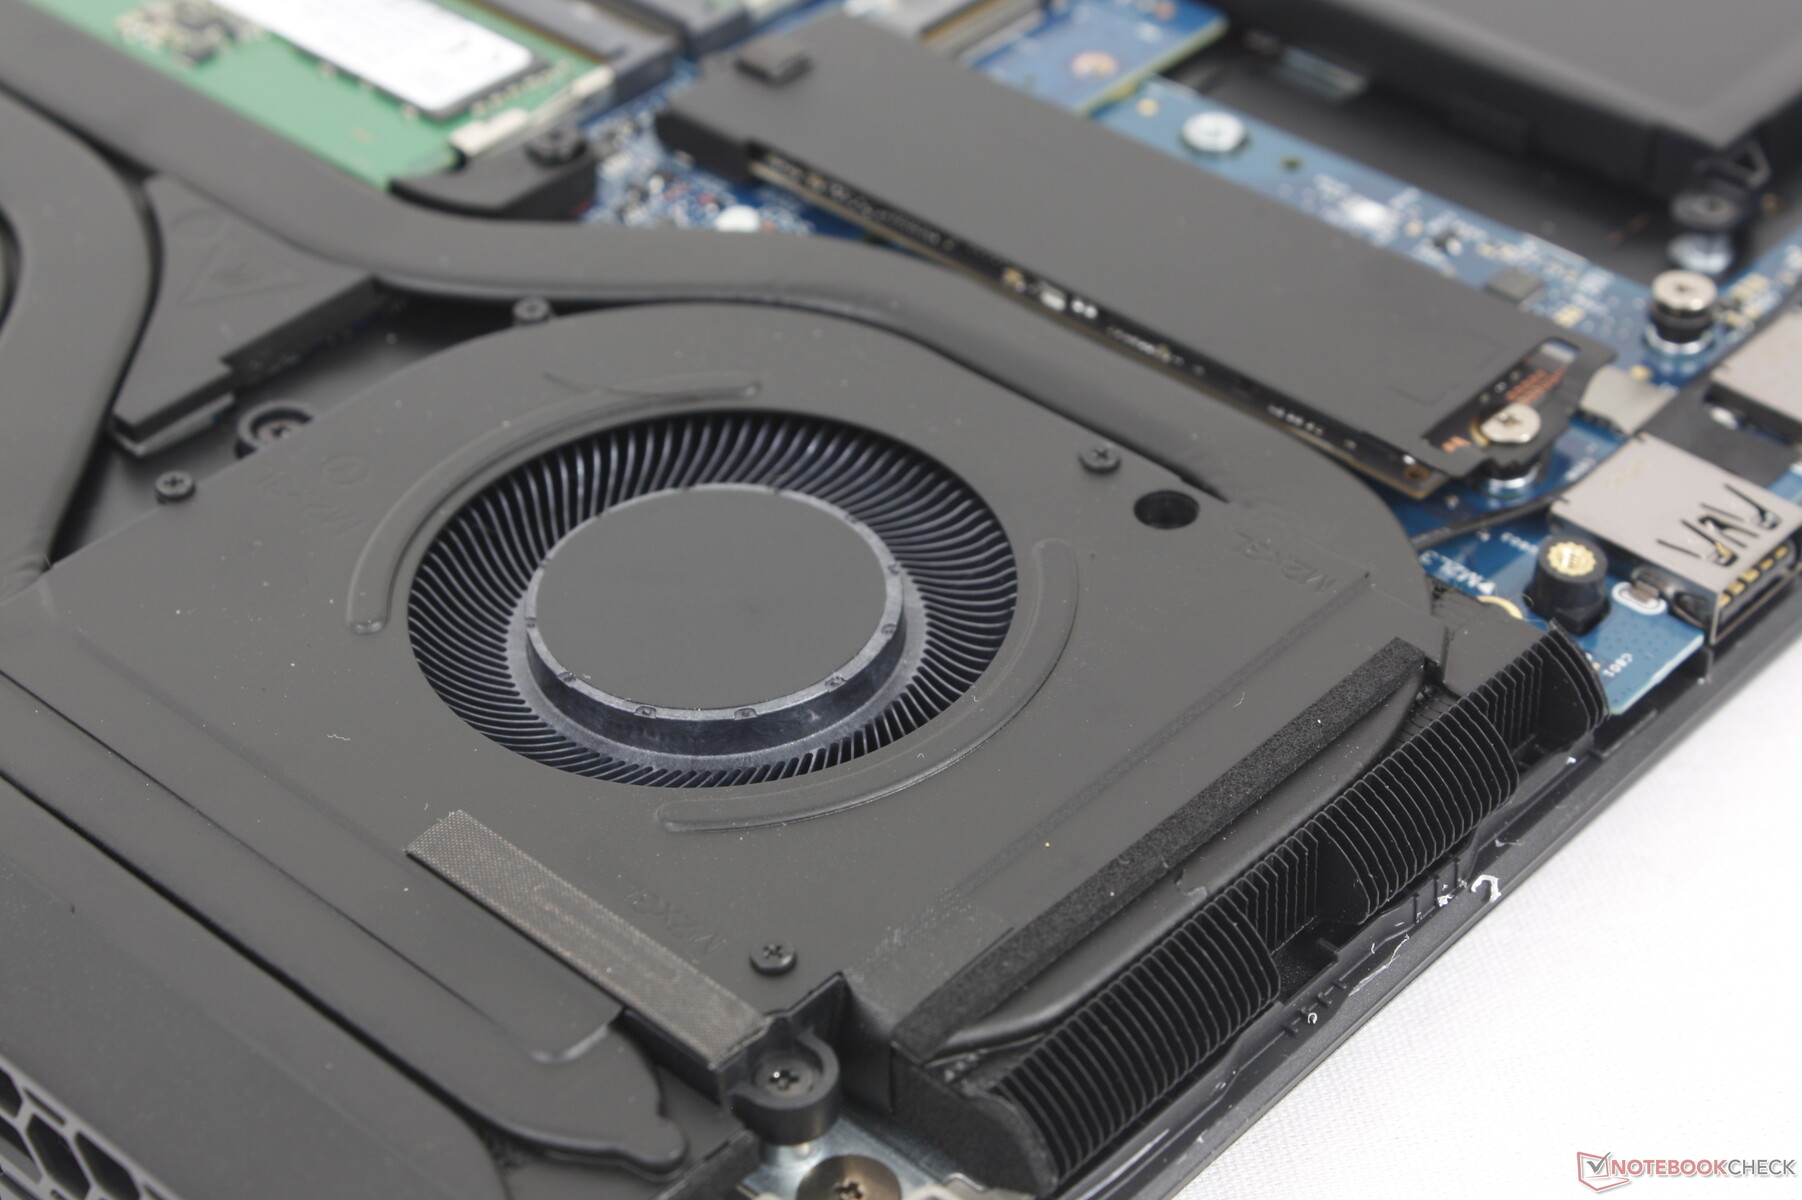
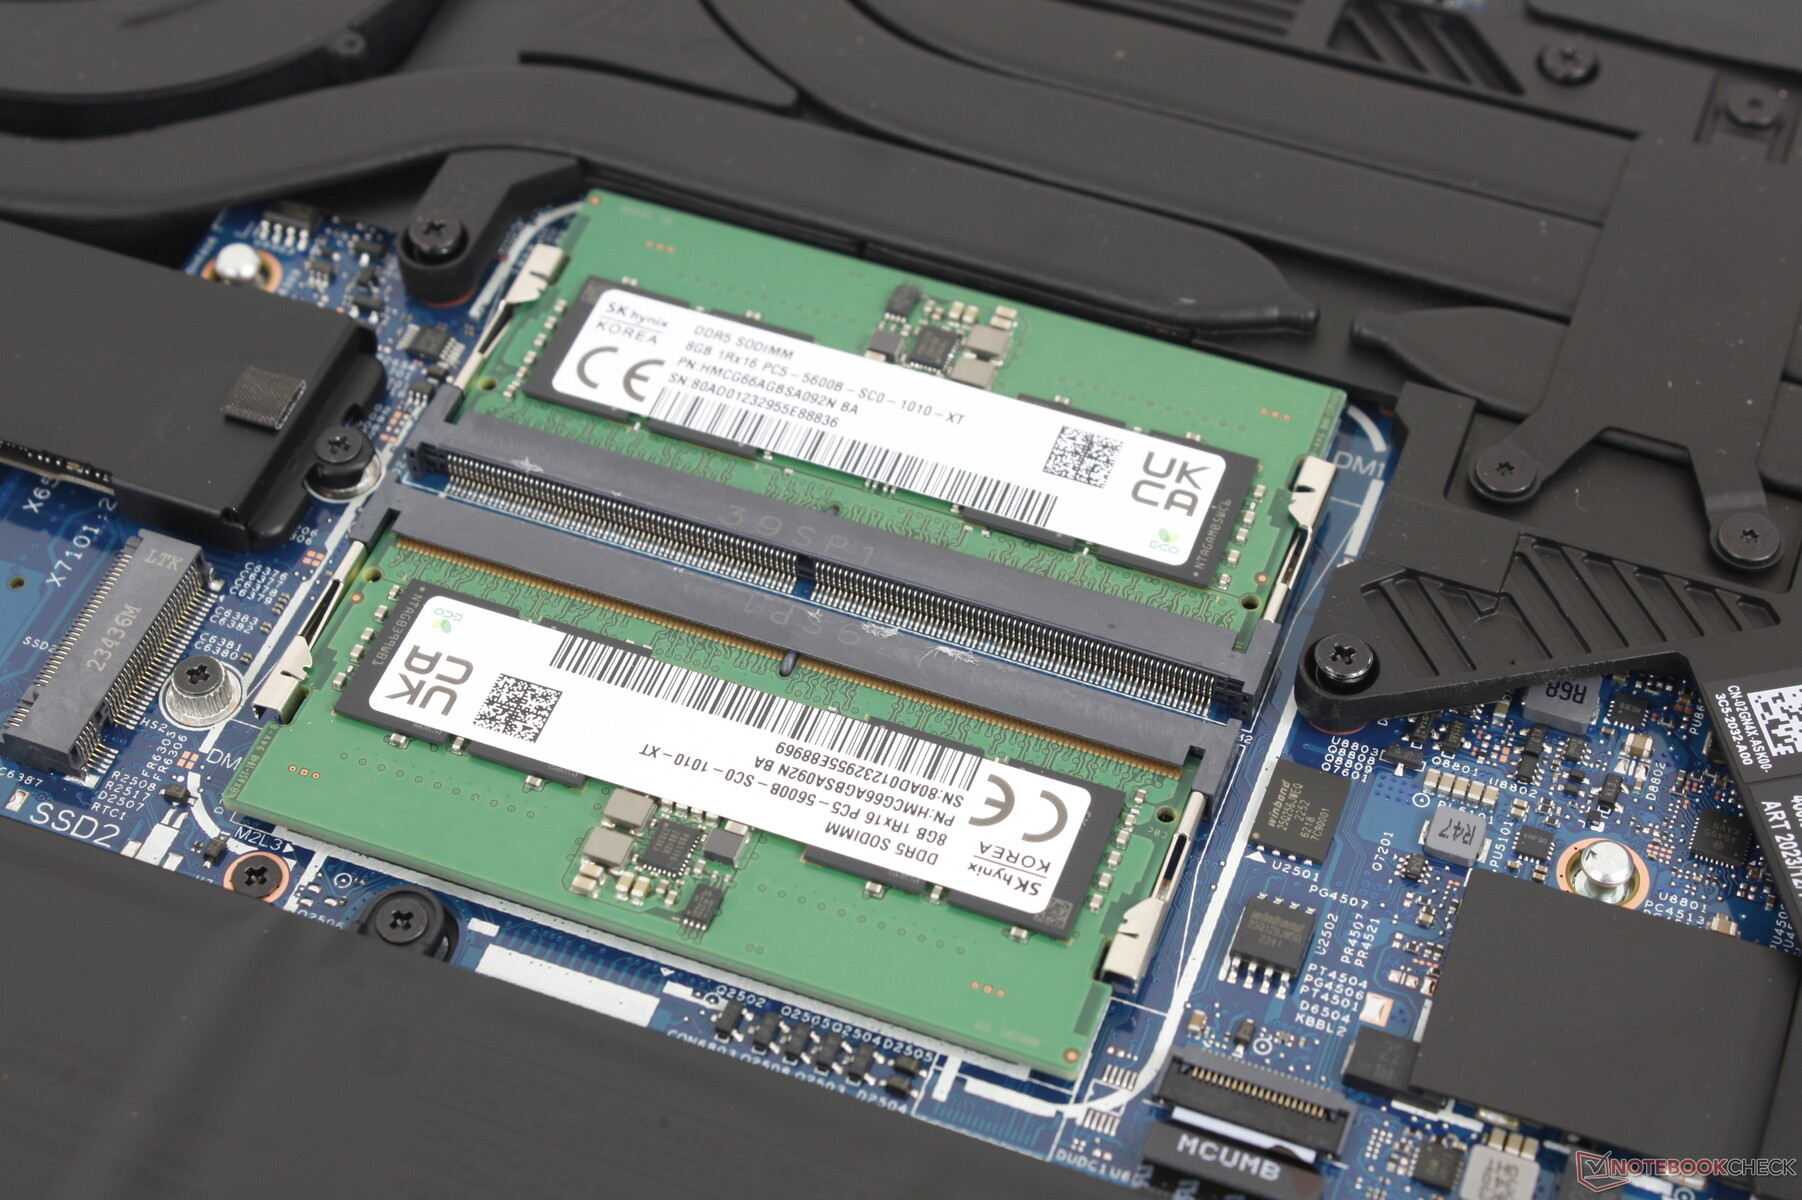
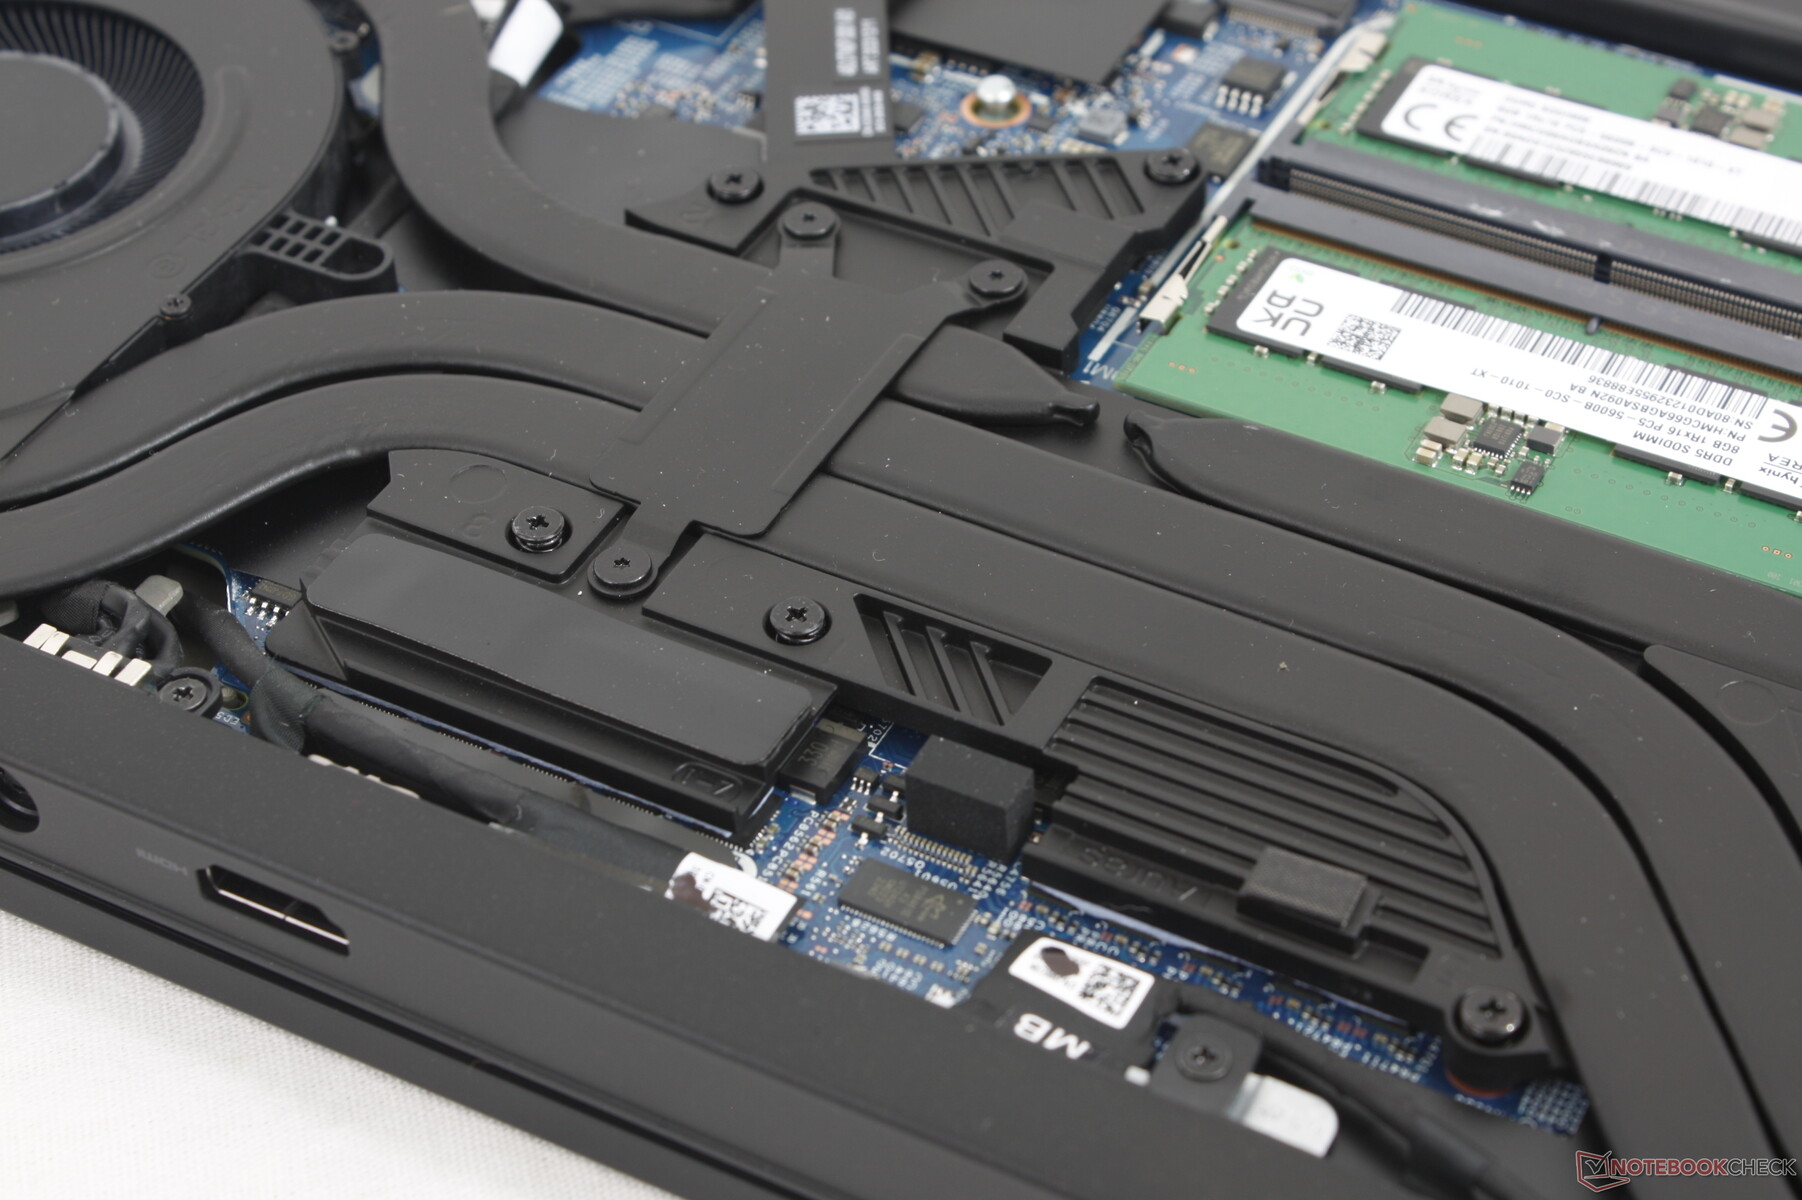
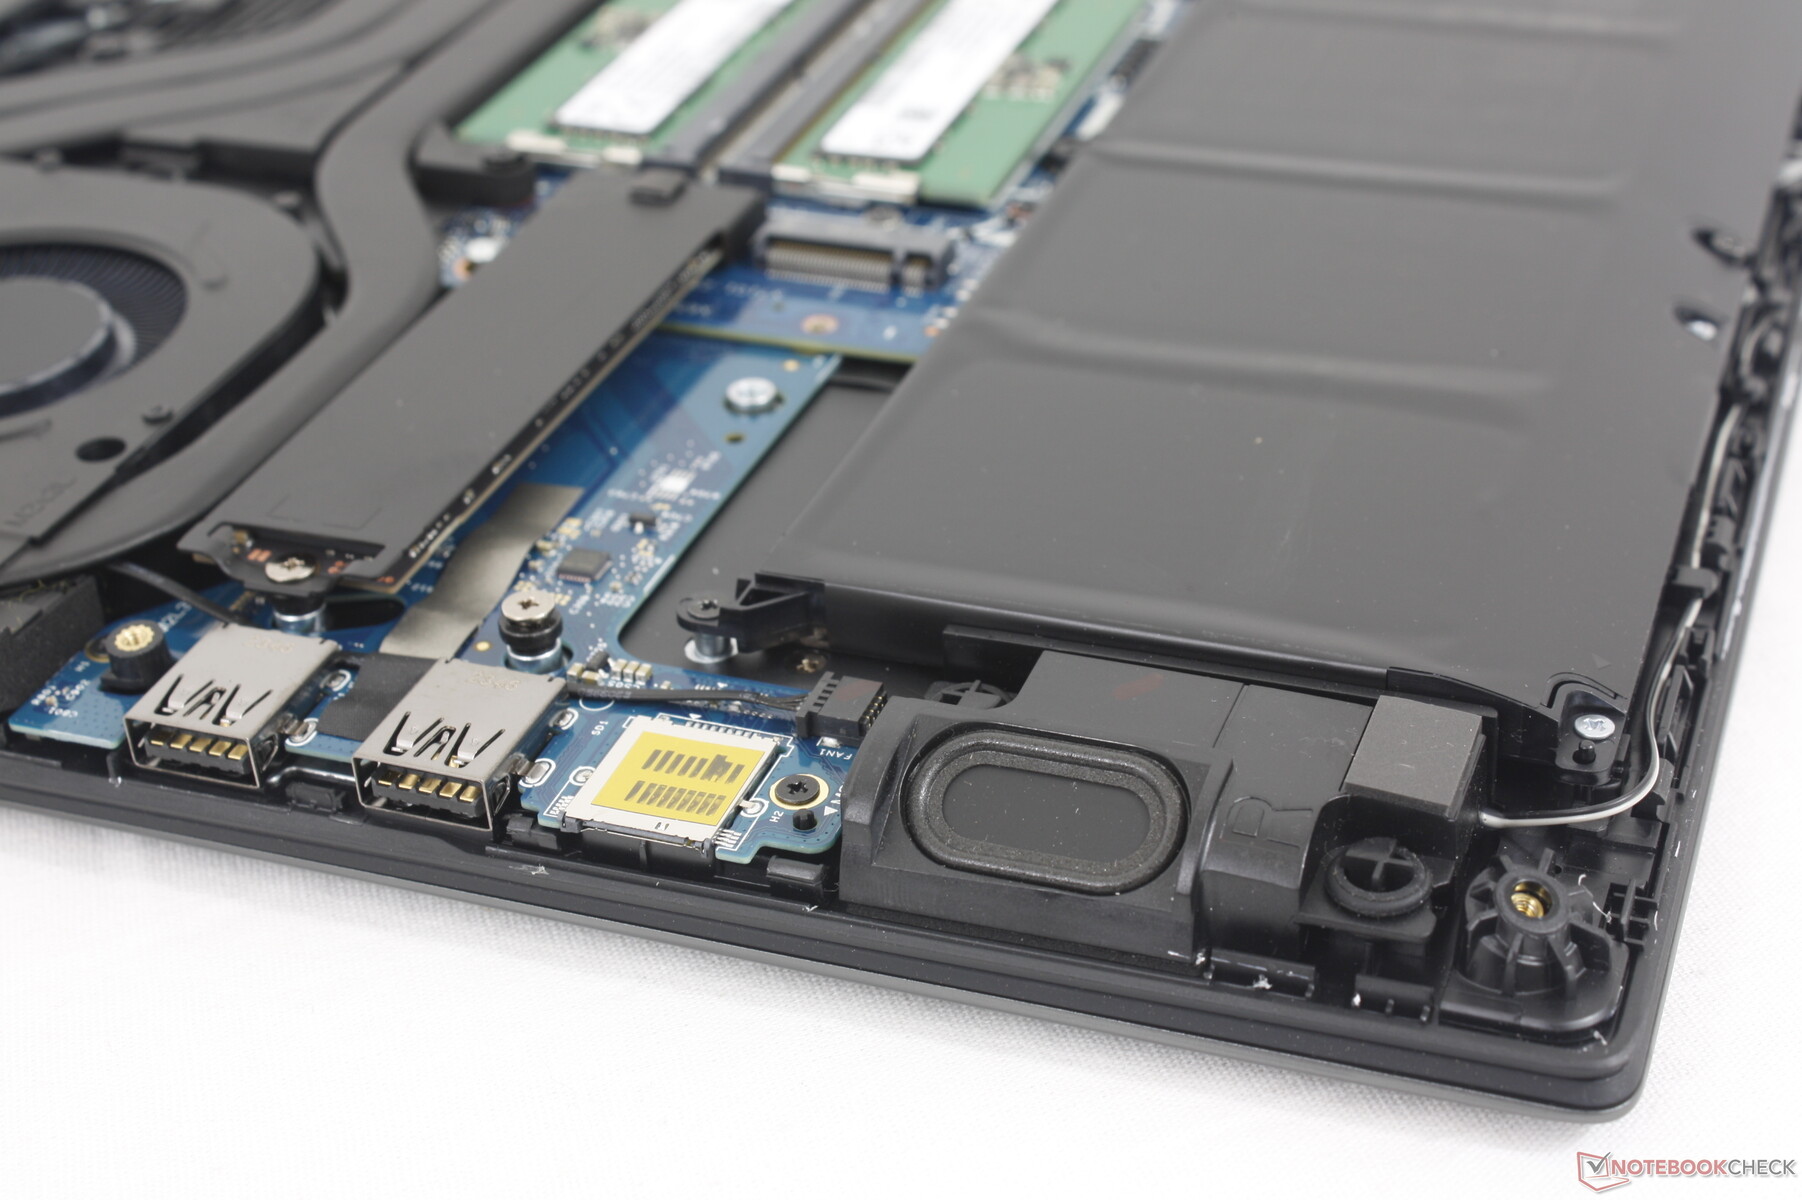
Maintenance
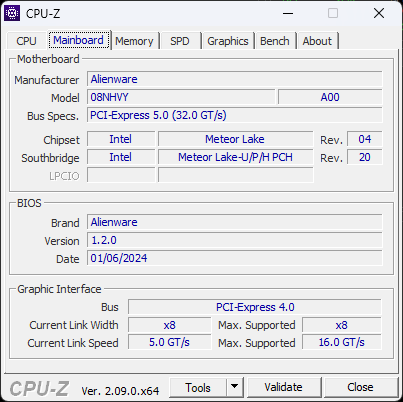
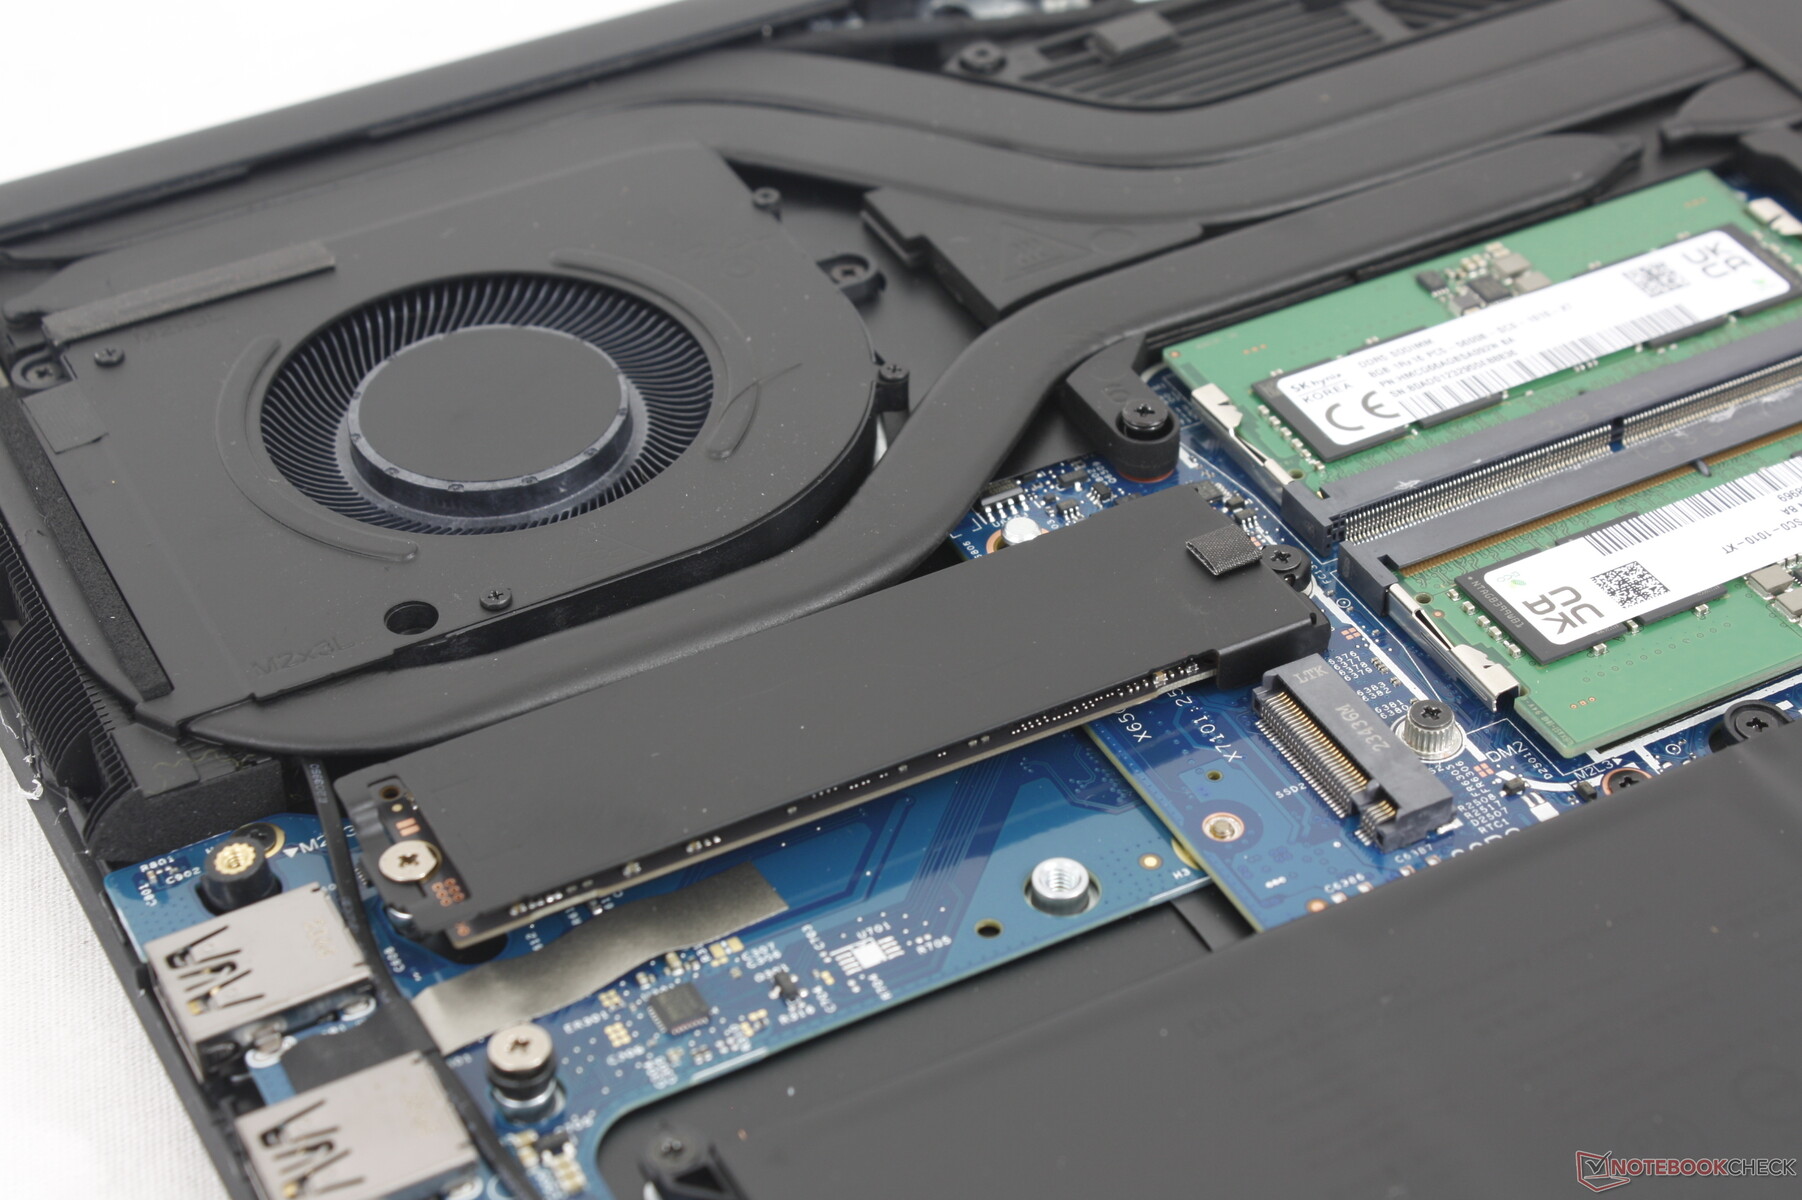
Le panneau inférieur est fixé par 8 vis Phillips pour faciliter l'entretien. La RAM et le WLAN restent amovibles, mais la configuration du stockage a changé : le système prend désormais en charge deux disques SSD M.2 2280 au lieu d'un M.2 2280 et de deux M.2 2230 sur le modèle de l'année dernière.
Accessoires et garantie
La boîte contient quelques autocollants du logo Alienware, ainsi que l'adaptateur secteur et les documents habituels. Une garantie constructeur limitée d'un an est fournie en standard si vous l'achetez aux États-Unis.
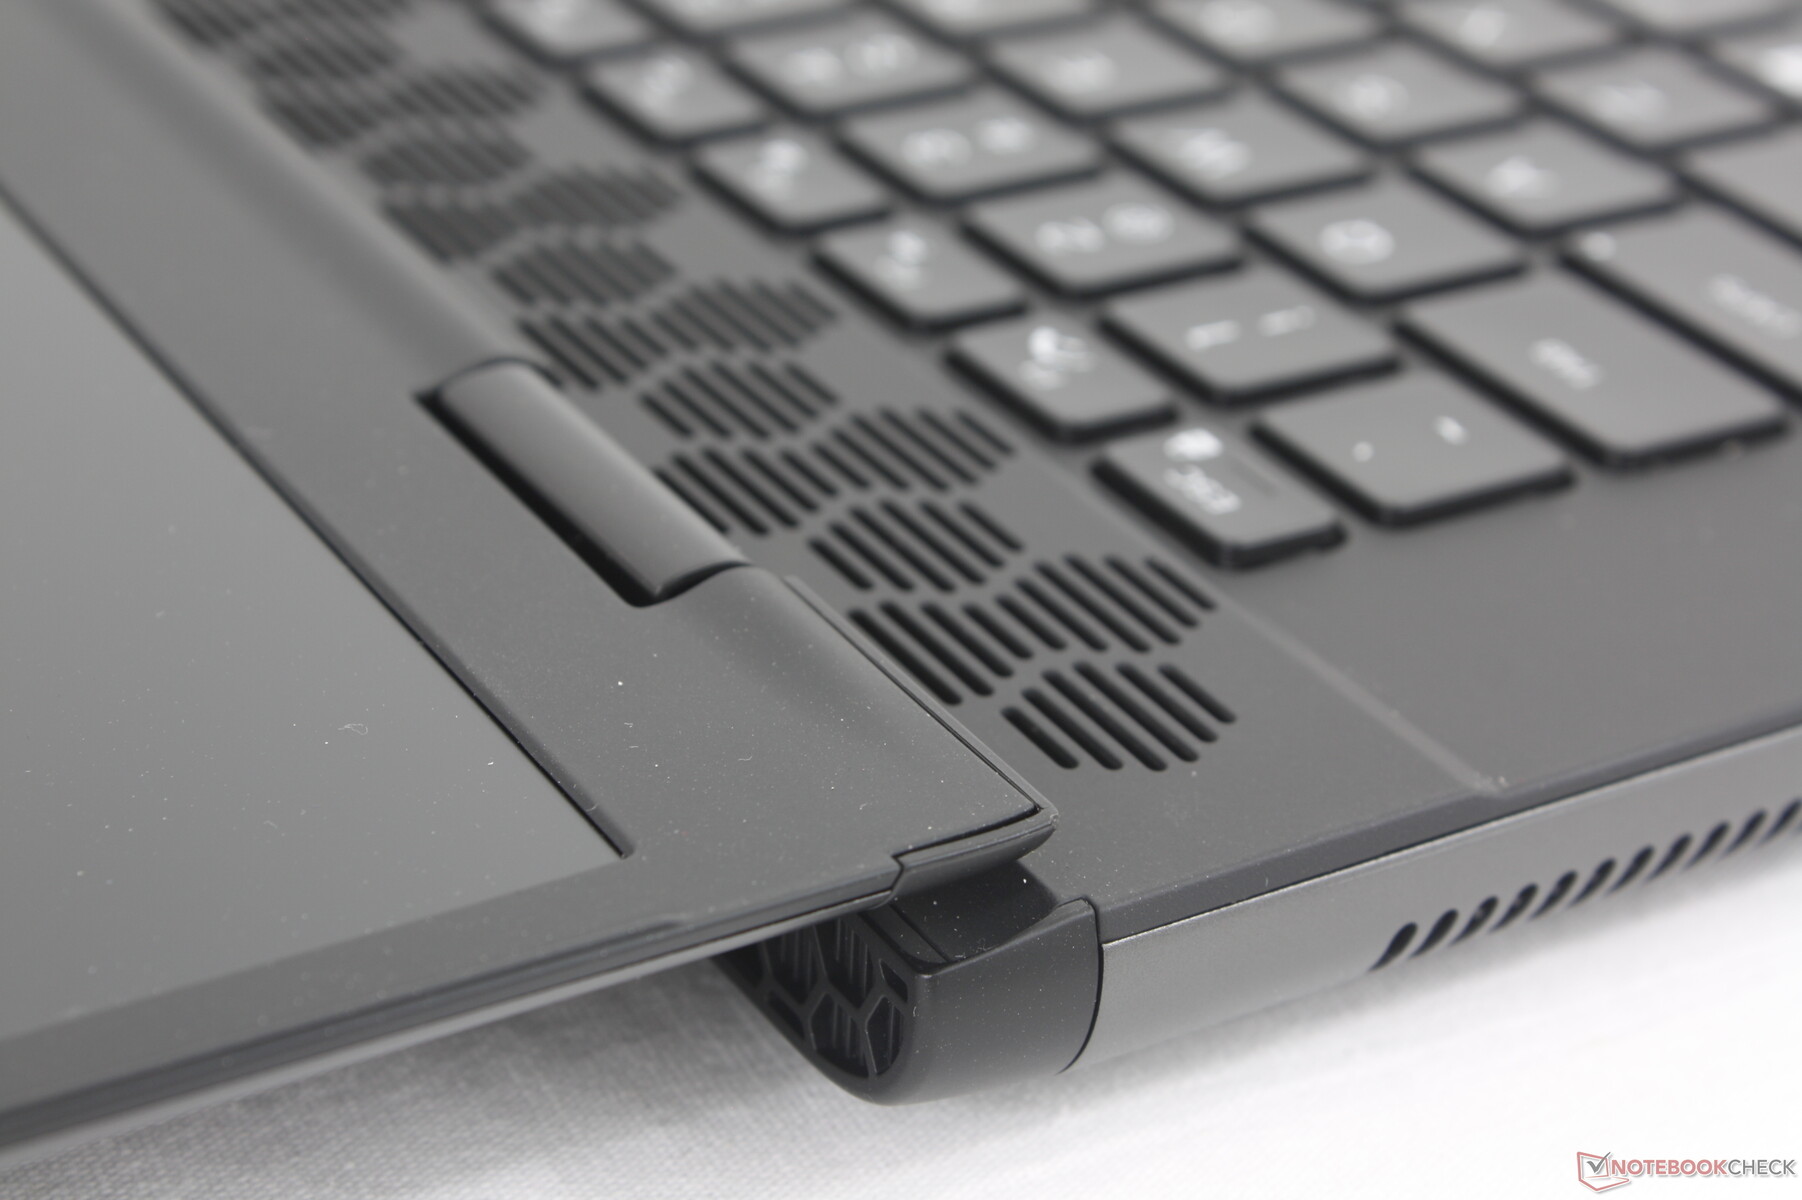
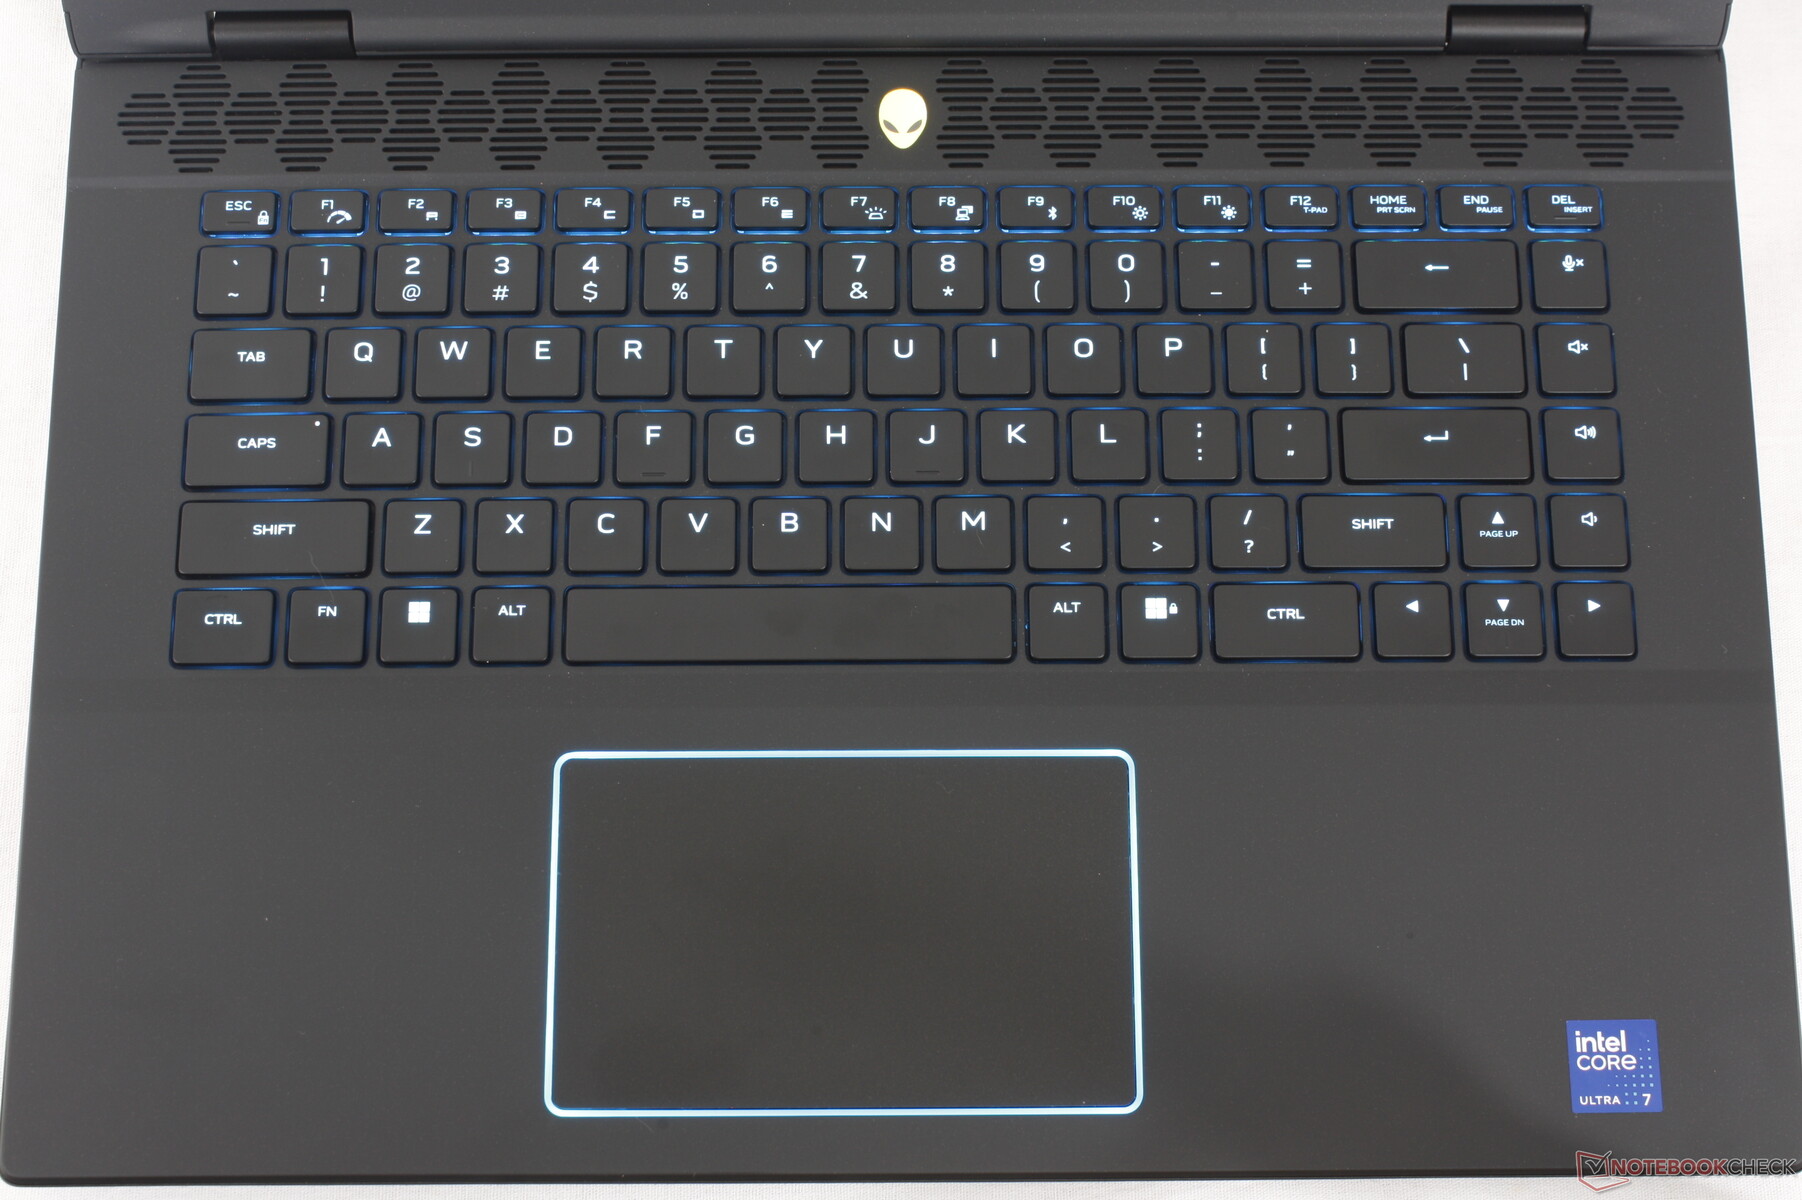
Dispositifs d'entrée - Plus besoin de mécanique
Clavier
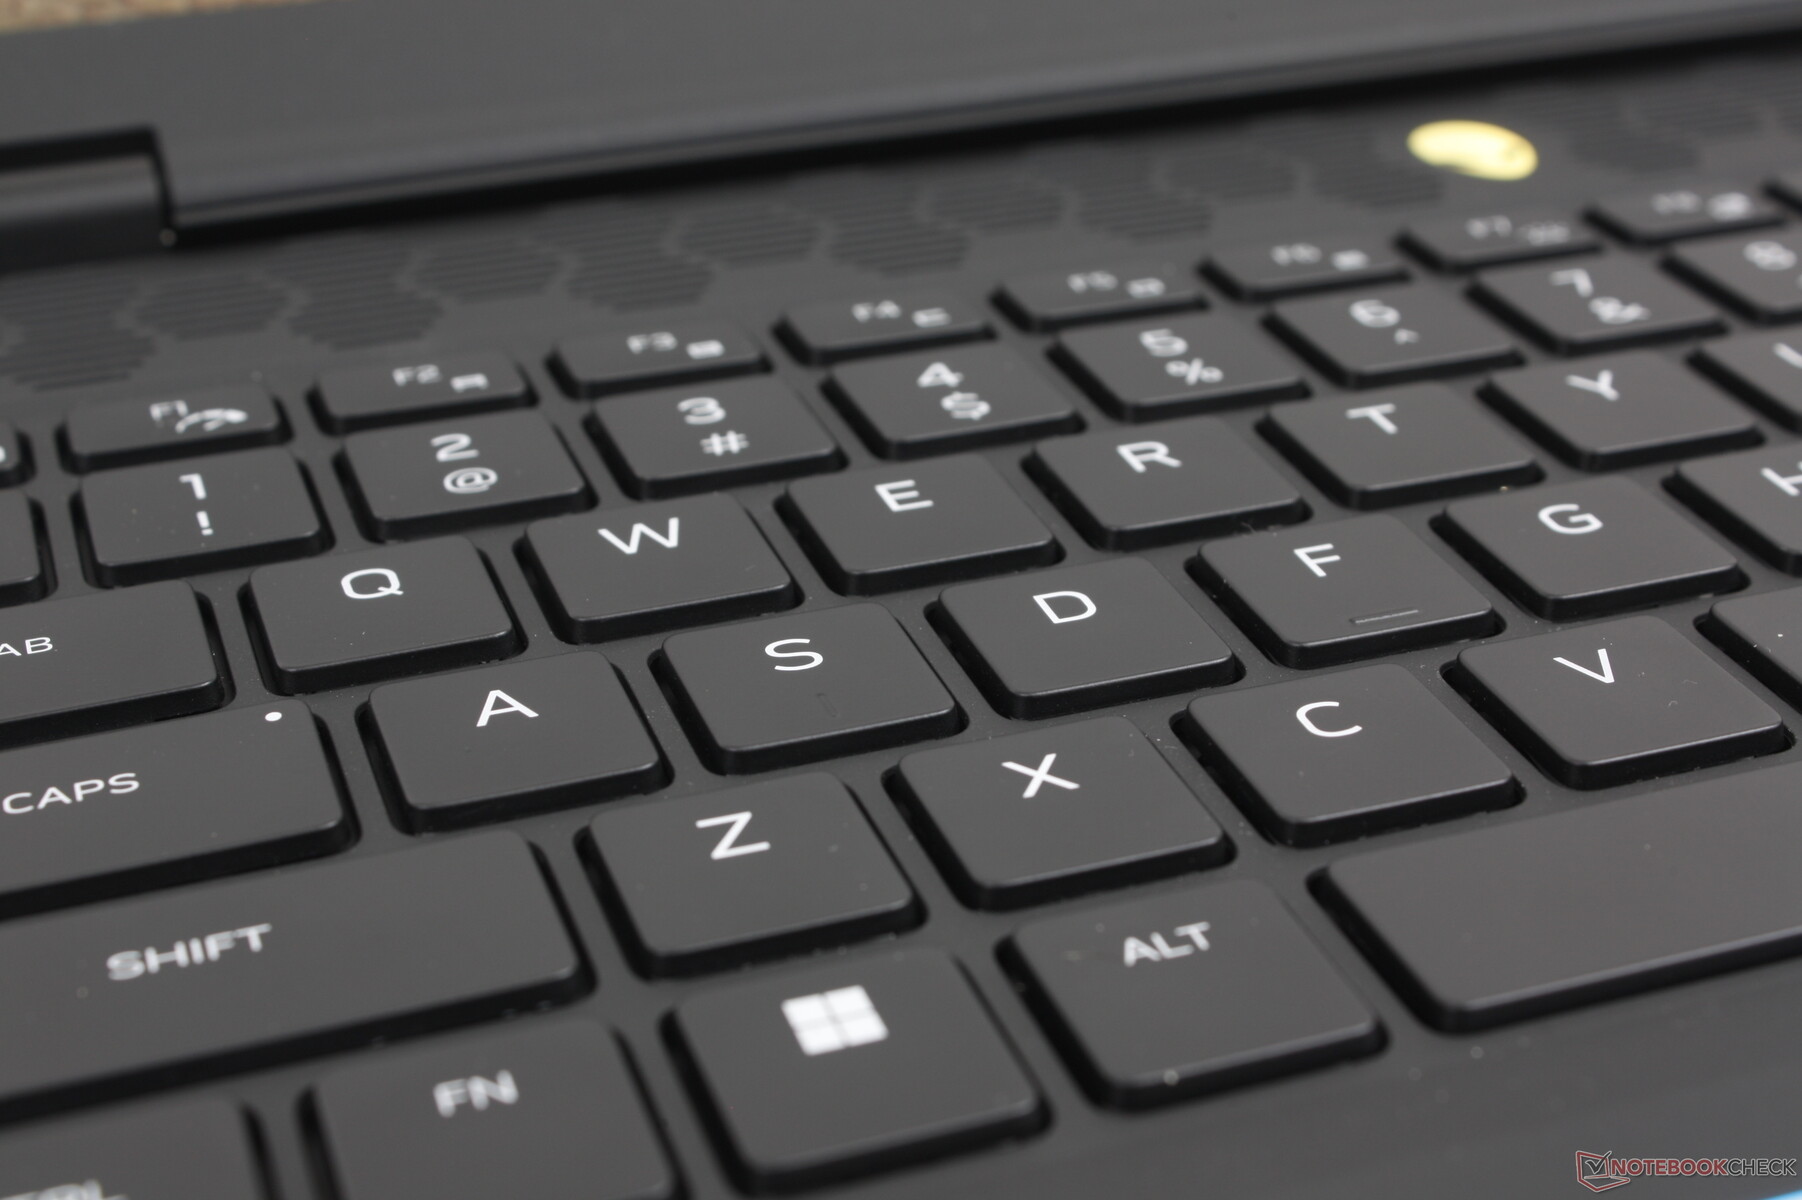
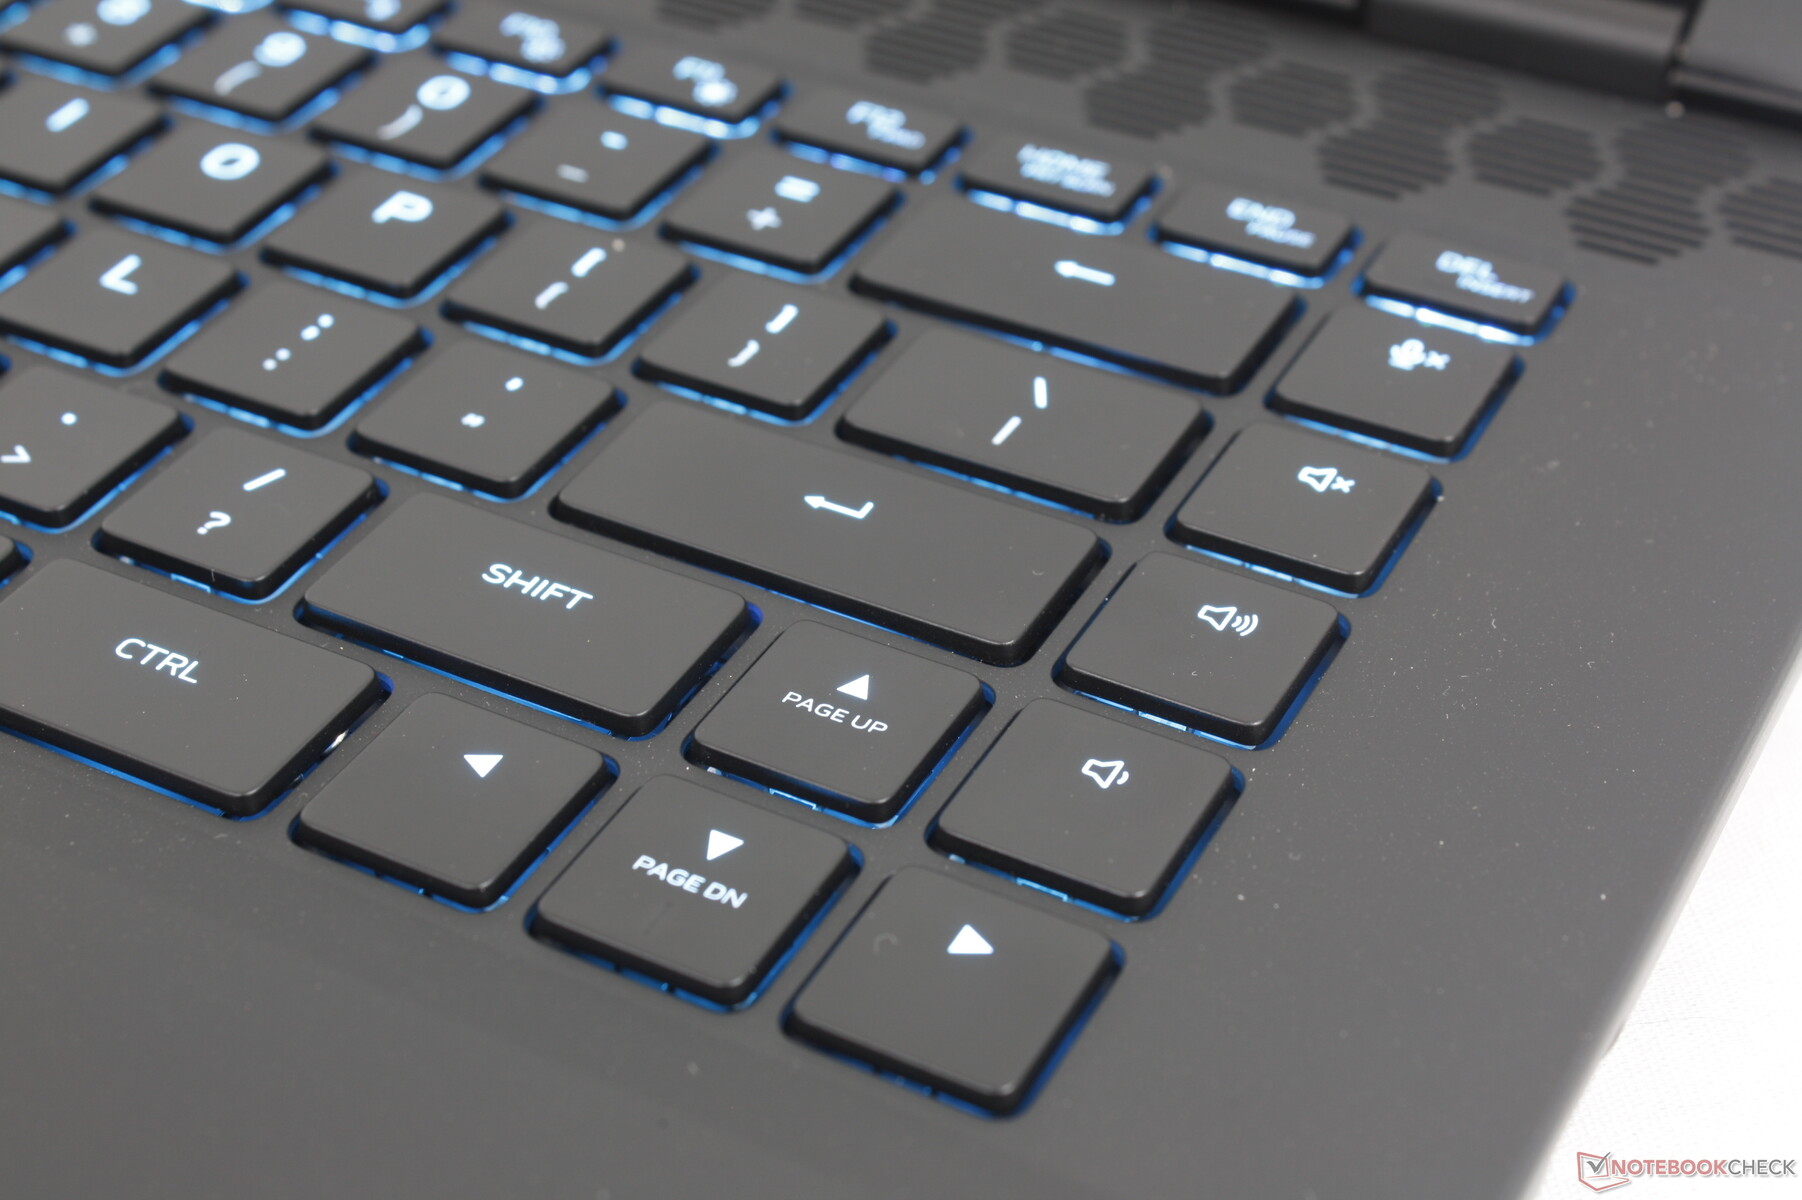
Le système utilise des touches à membrane avec une course de 1,8 mm et aucune option mécanique afin de maintenir un poids faible et d'attirer un public plus large que les joueurs. Il n'en reste pas moins qu'il est confortable et plus agréable à utiliser que les claviers de la plupart des autres ordinateurs portables de jeu, y compris le MSI Raider GE68 ou le HP Omen Transcend 16. Les touches Espace et Entrée, en particulier, sont plus bruyantes et plus nettes que les touches QWERTY principales lorsqu'elles sont enfoncées.
Cette année, le clavier s'est enrichi d'une fonction pratique, le "Stealth mode", liée à la touche F2, qui fait basculer le système en mode silencieux sans qu'il soit nécessaire de lancer au préalable le Alienware Command Center. Sinon, la disposition du clavier reste la même que sur le m16 R1 original.
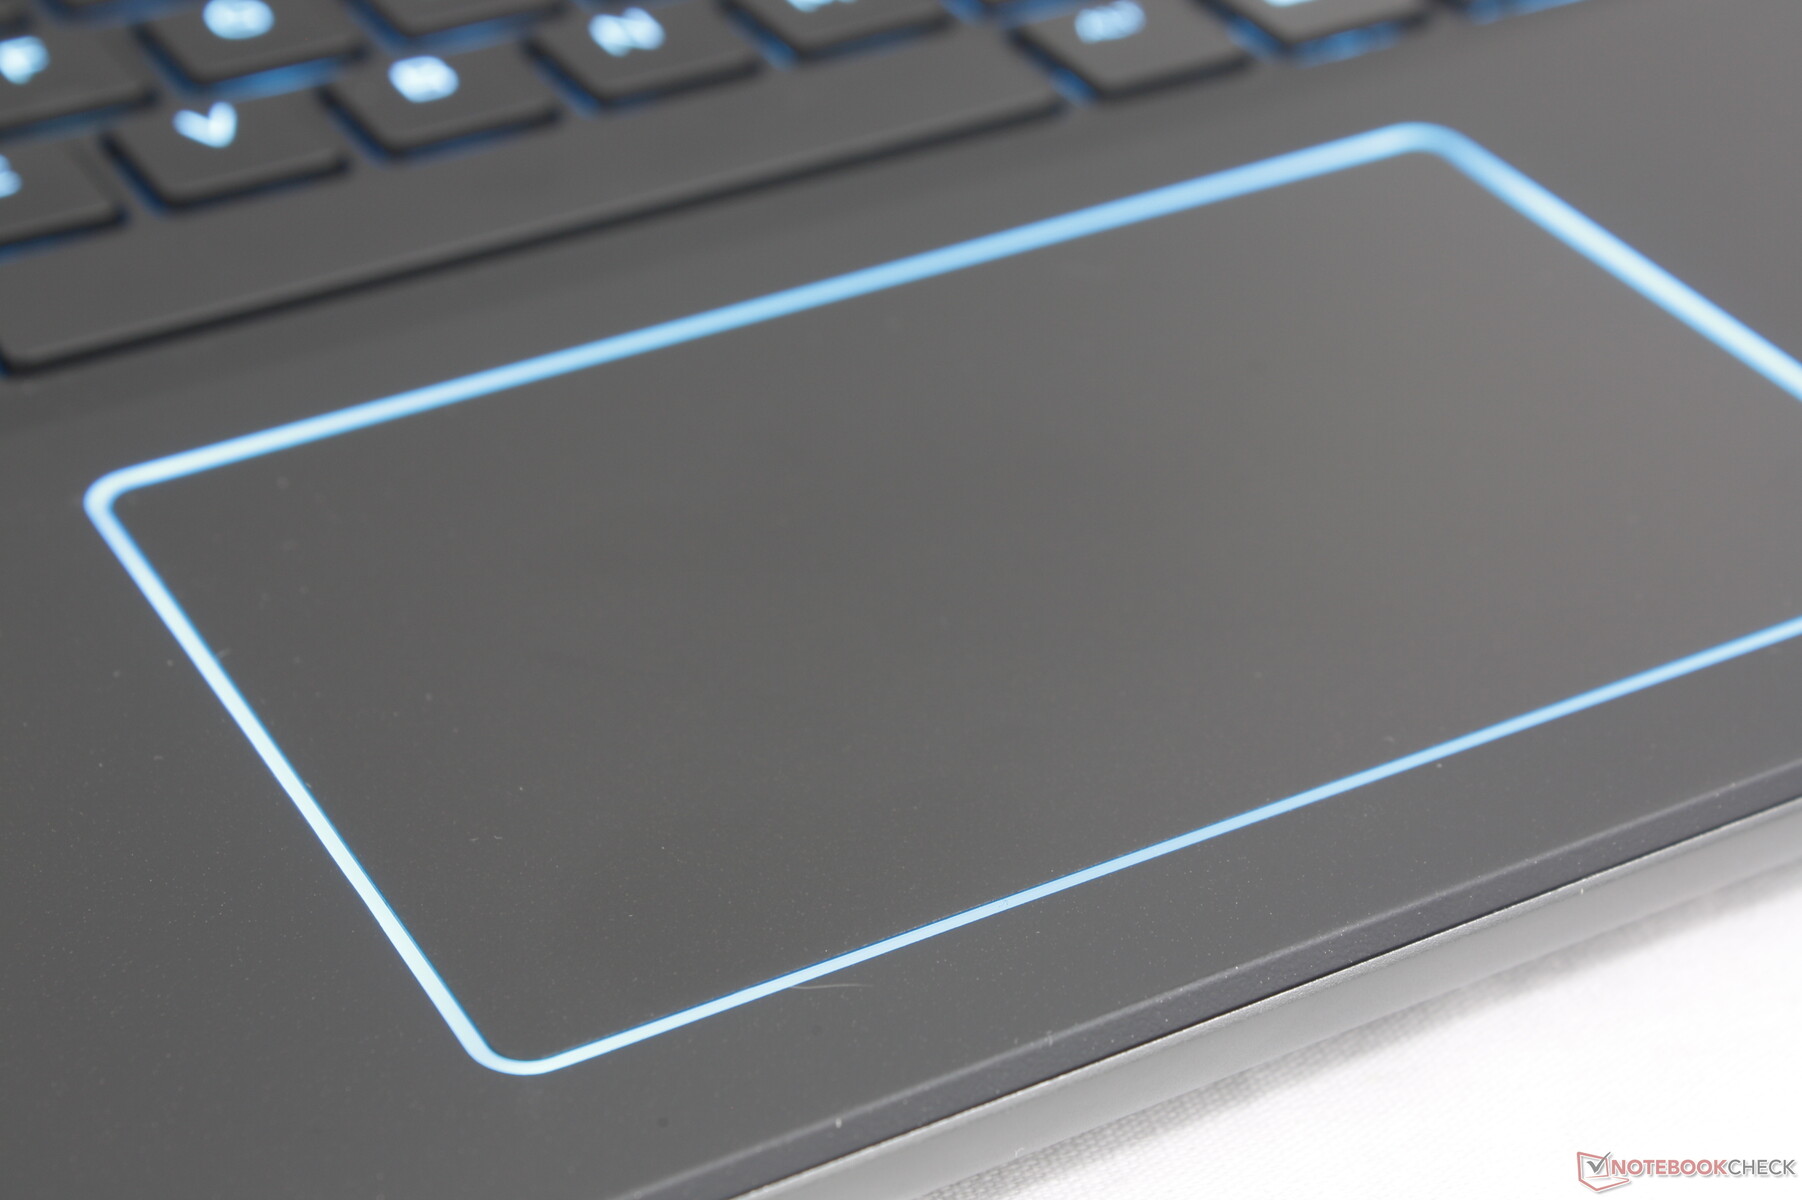
Pavé tactile
Le pavé tactile est légèrement plus grand que sur le modèle de l'année dernière (11,5 x 7 cm contre 11,3 x 6,6 cm) et il comprend un nouvel éclairage RVB sur son pourtour. Cependant, le retour d'information lors du clic reste spongieux et très superficiel, ce qui donne une sensation peu satisfaisante. La souris fonctionne de manière suffisamment fiable pour les opérations de pointage et de clic de base, mais il est recommandé d'utiliser une souris pour les actions plus précises telles que le glisser-déposer.
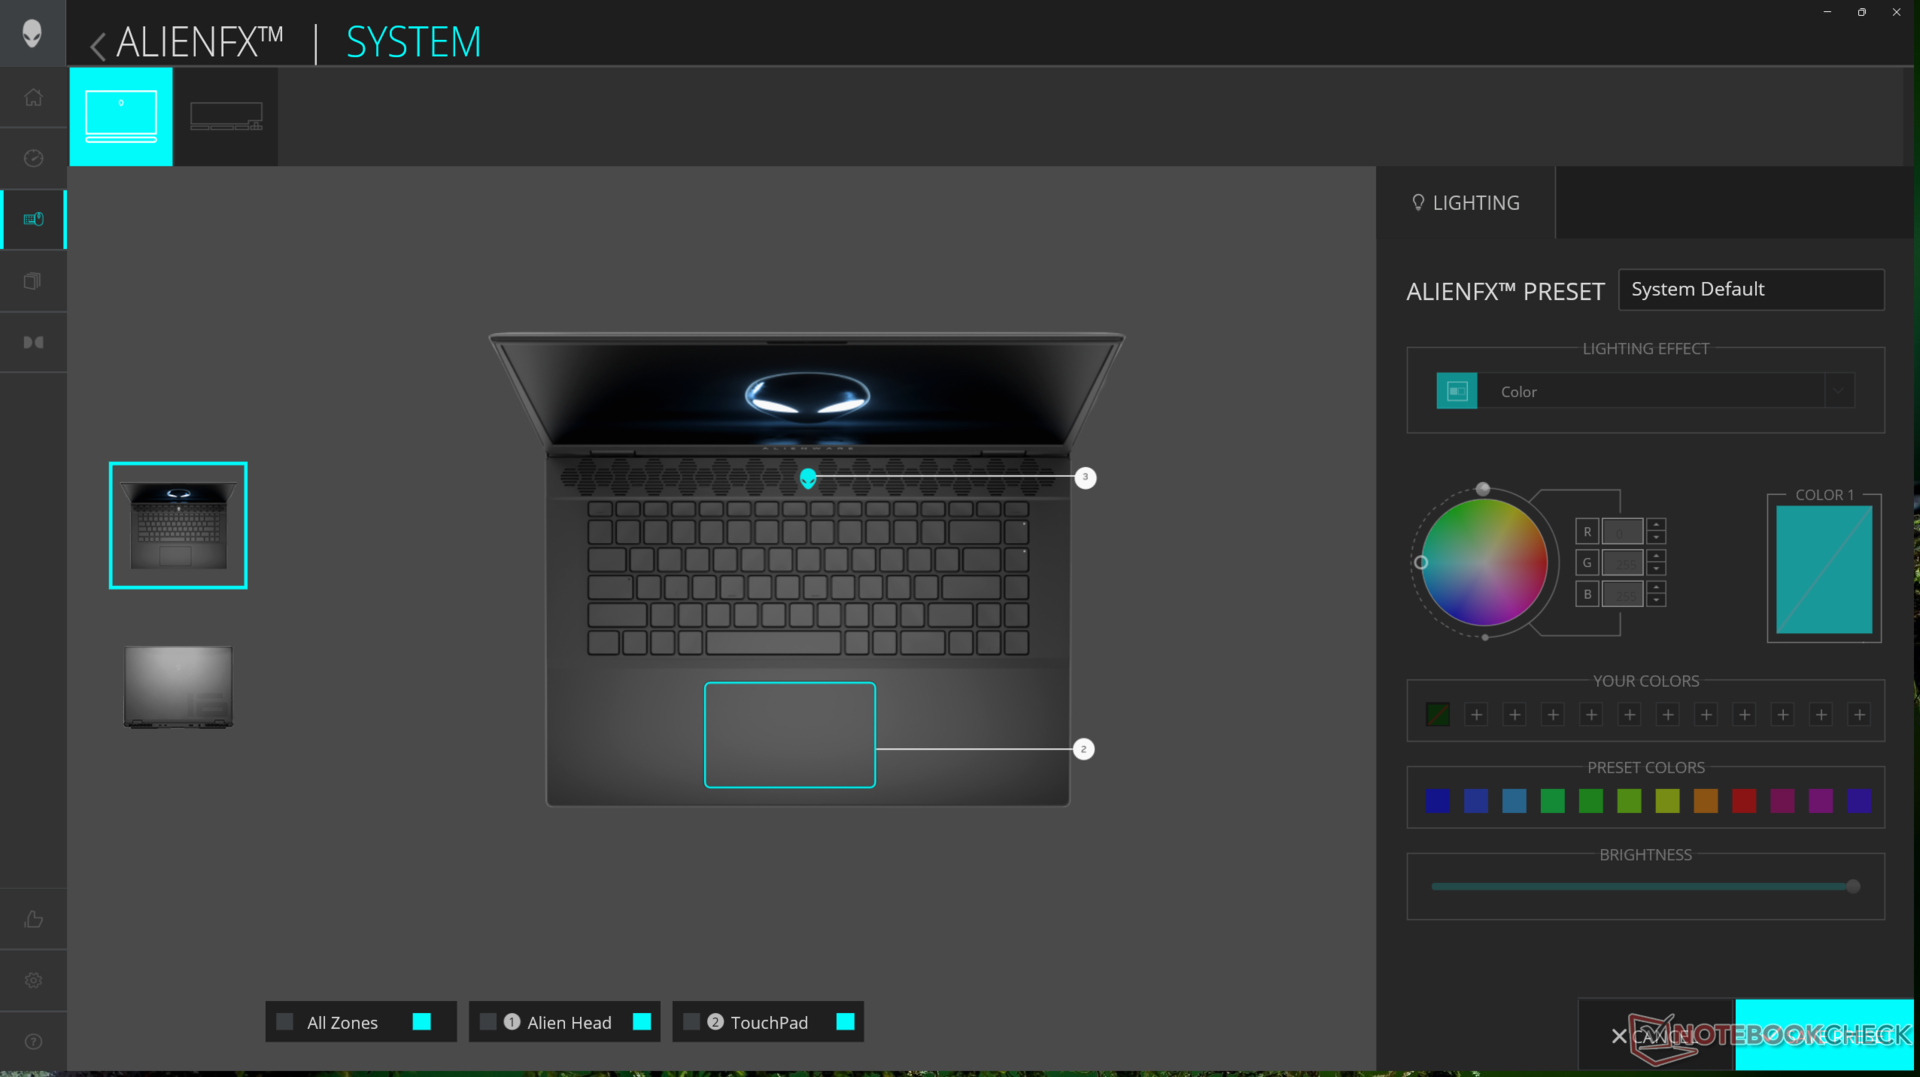
L'éclairage RGB ne peut être activé ou désactivé que via le centre de commande Alienware, car il n'y a pas de touche de raccourci pour le faire basculer. Le réglage de la luminosité des touches RGB n'affecte pas l'éclairage du pavé tactile.
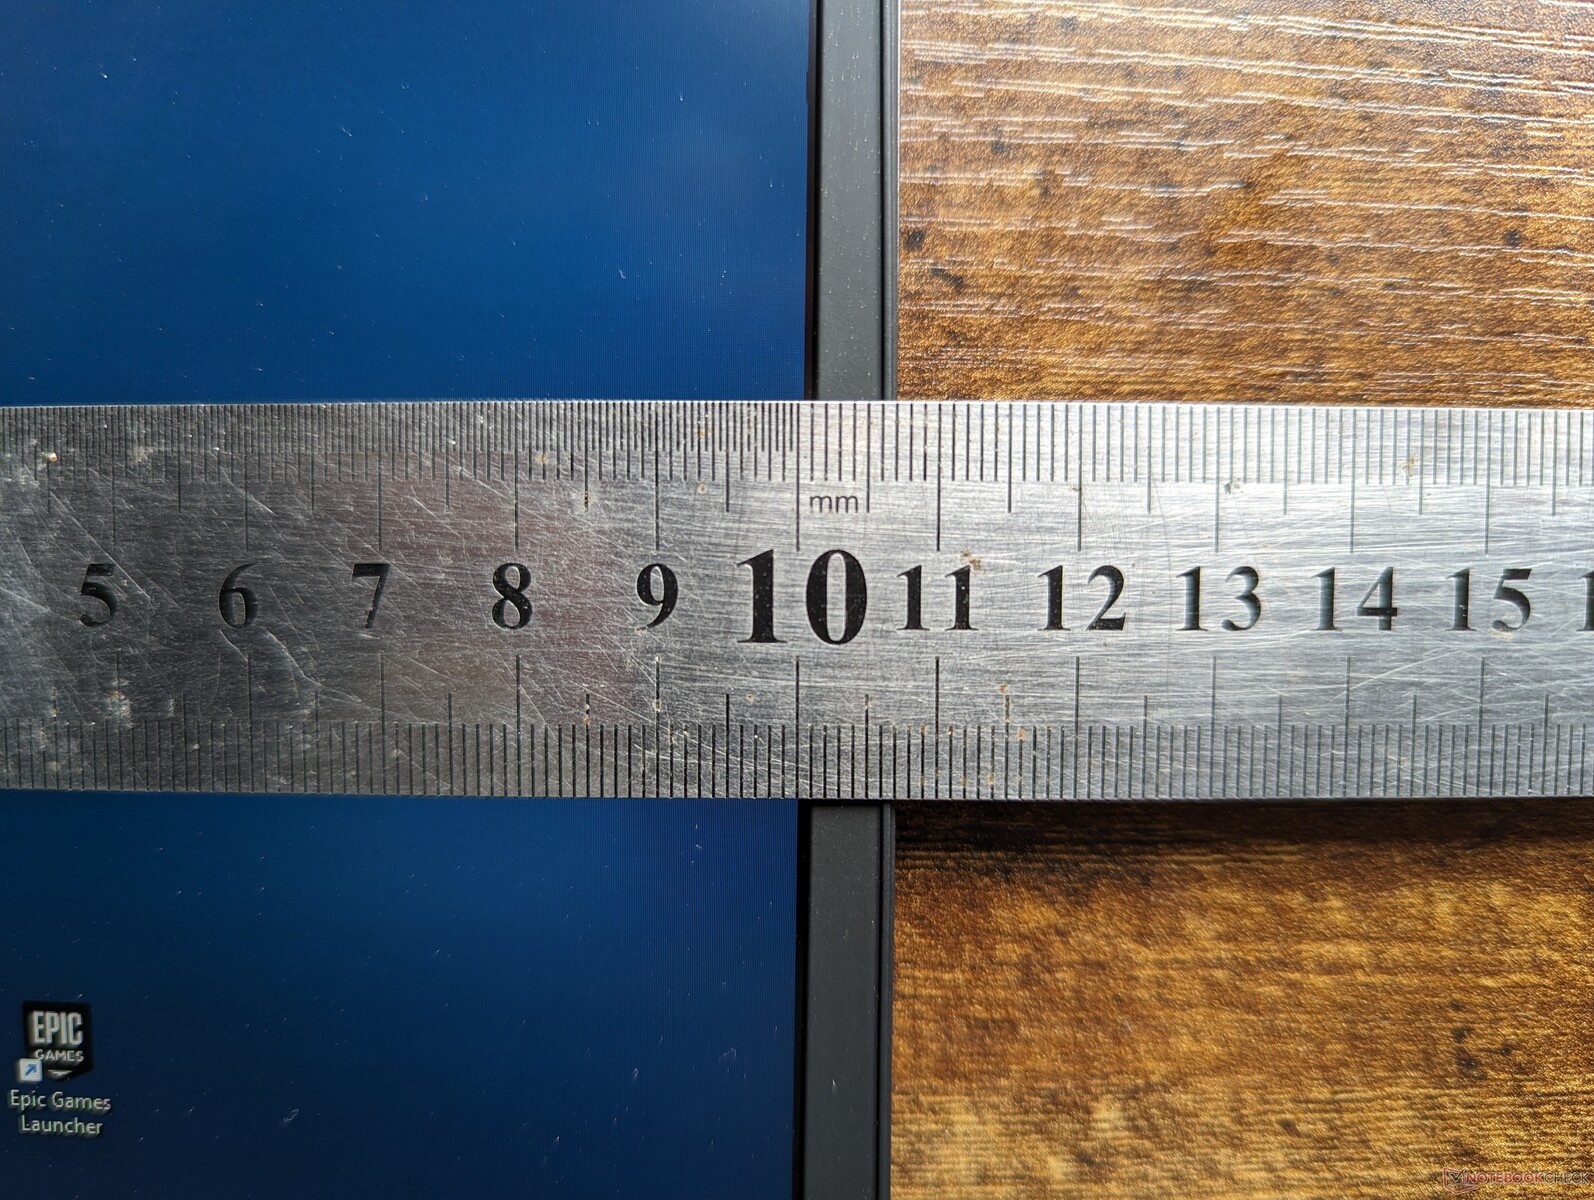
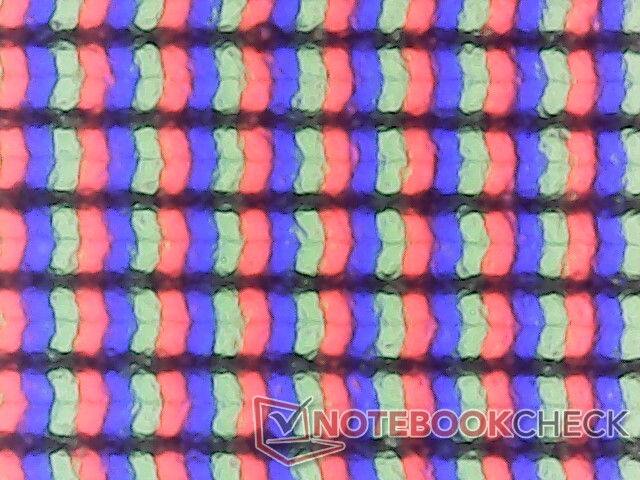
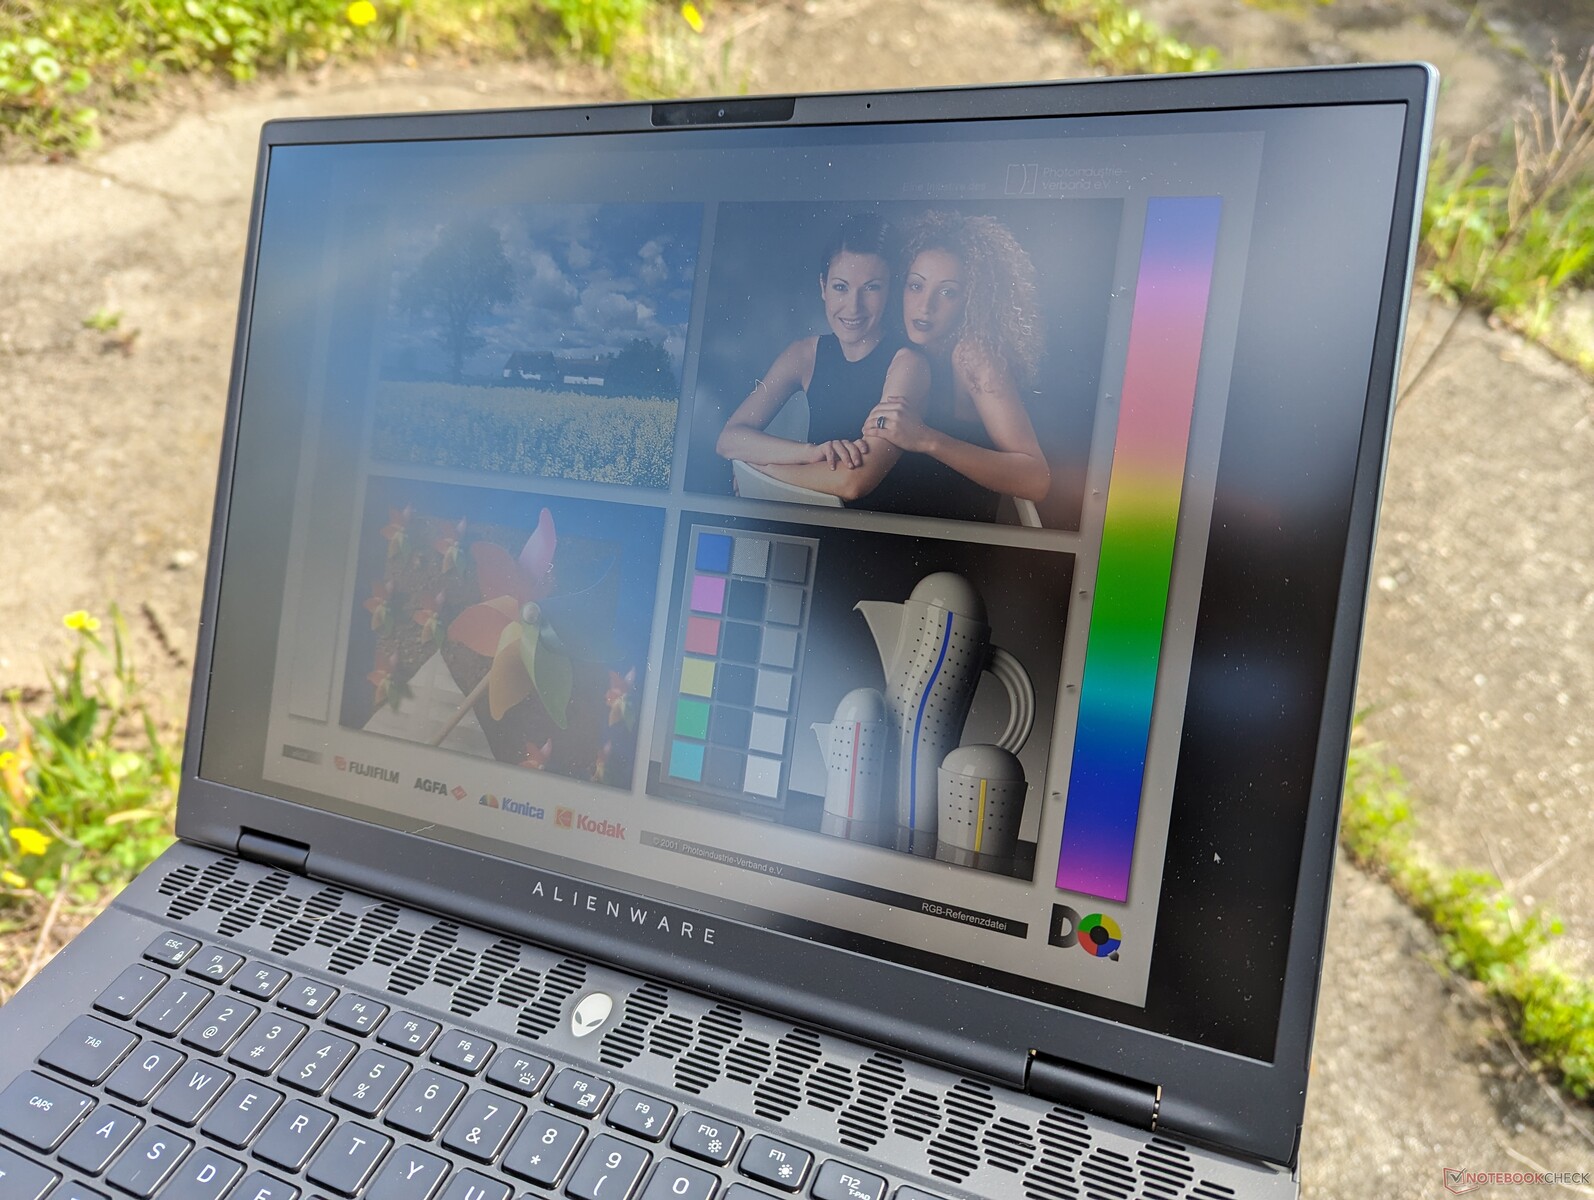
Affichage - 240 Hz et sRGB complet désormais standard
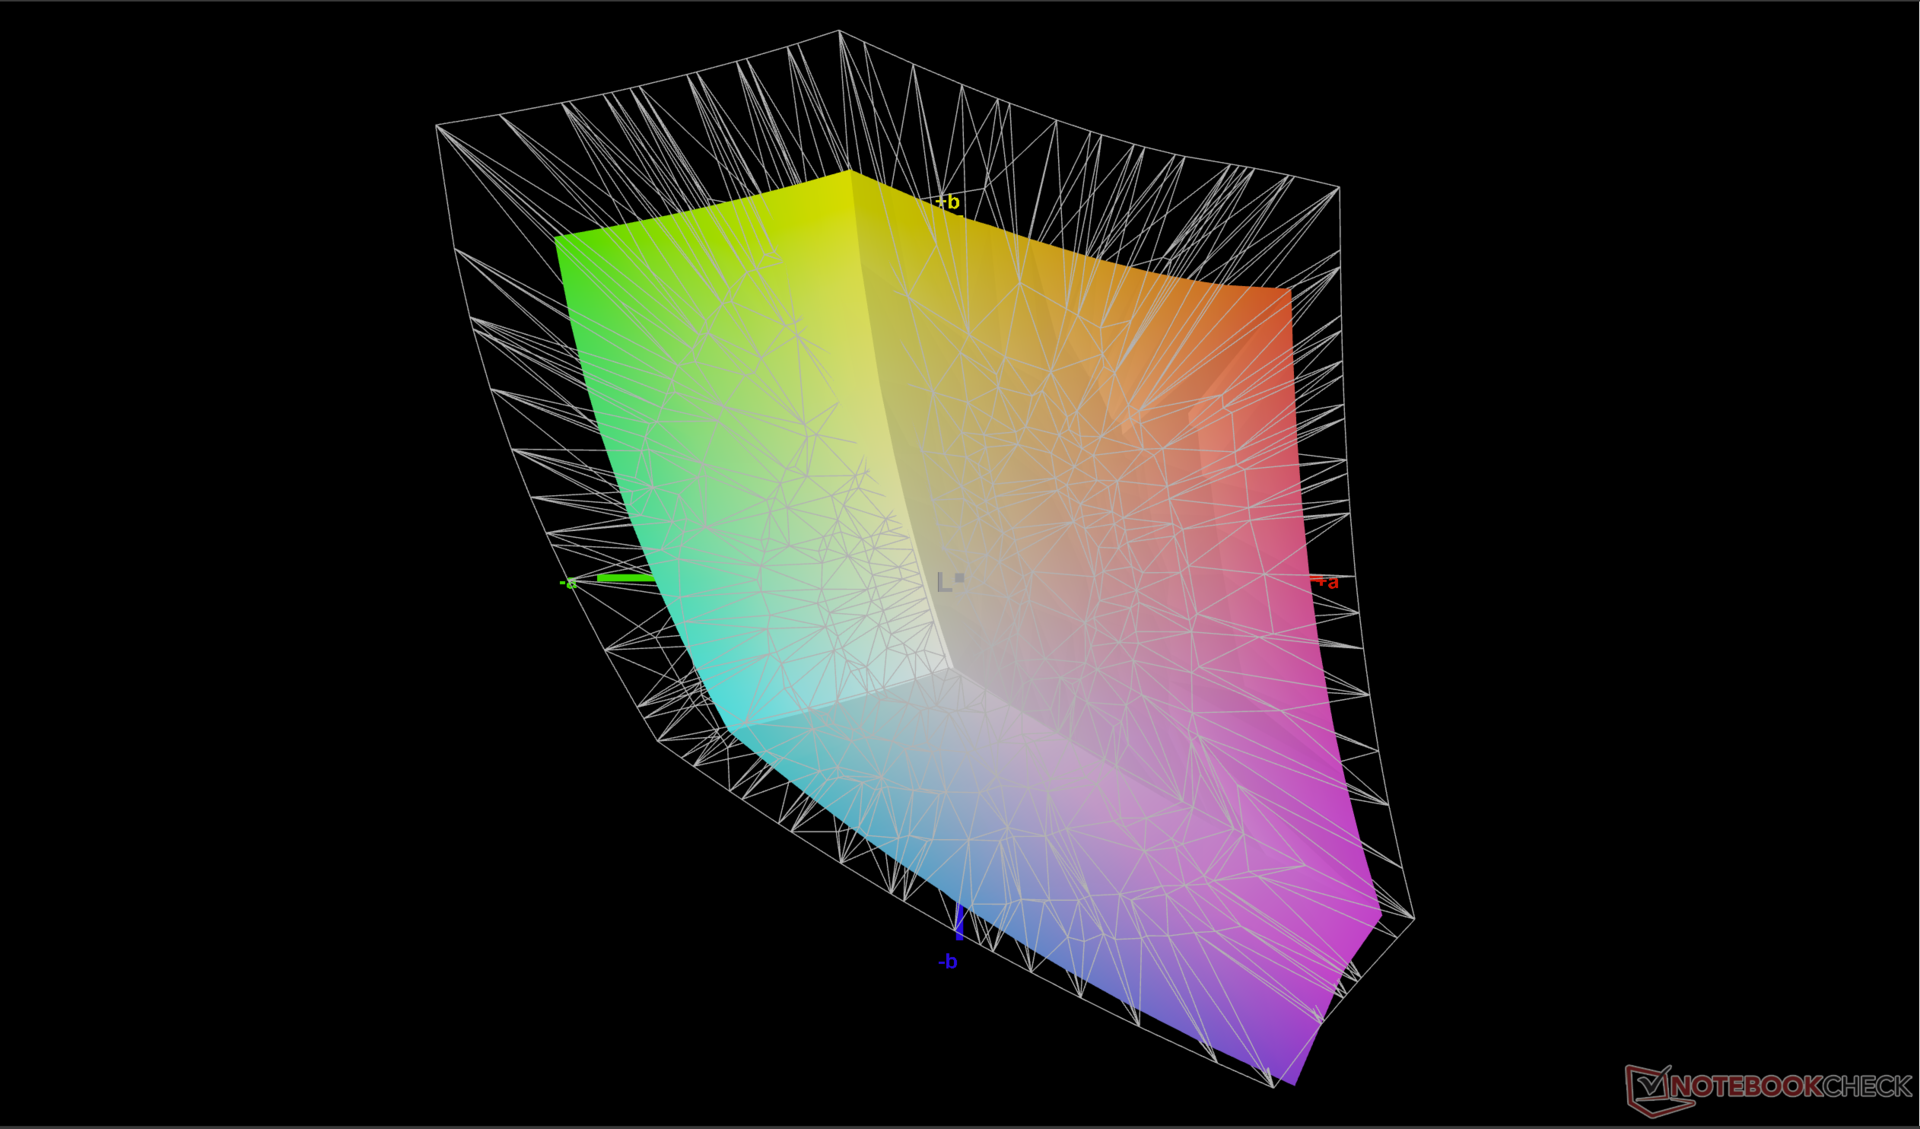
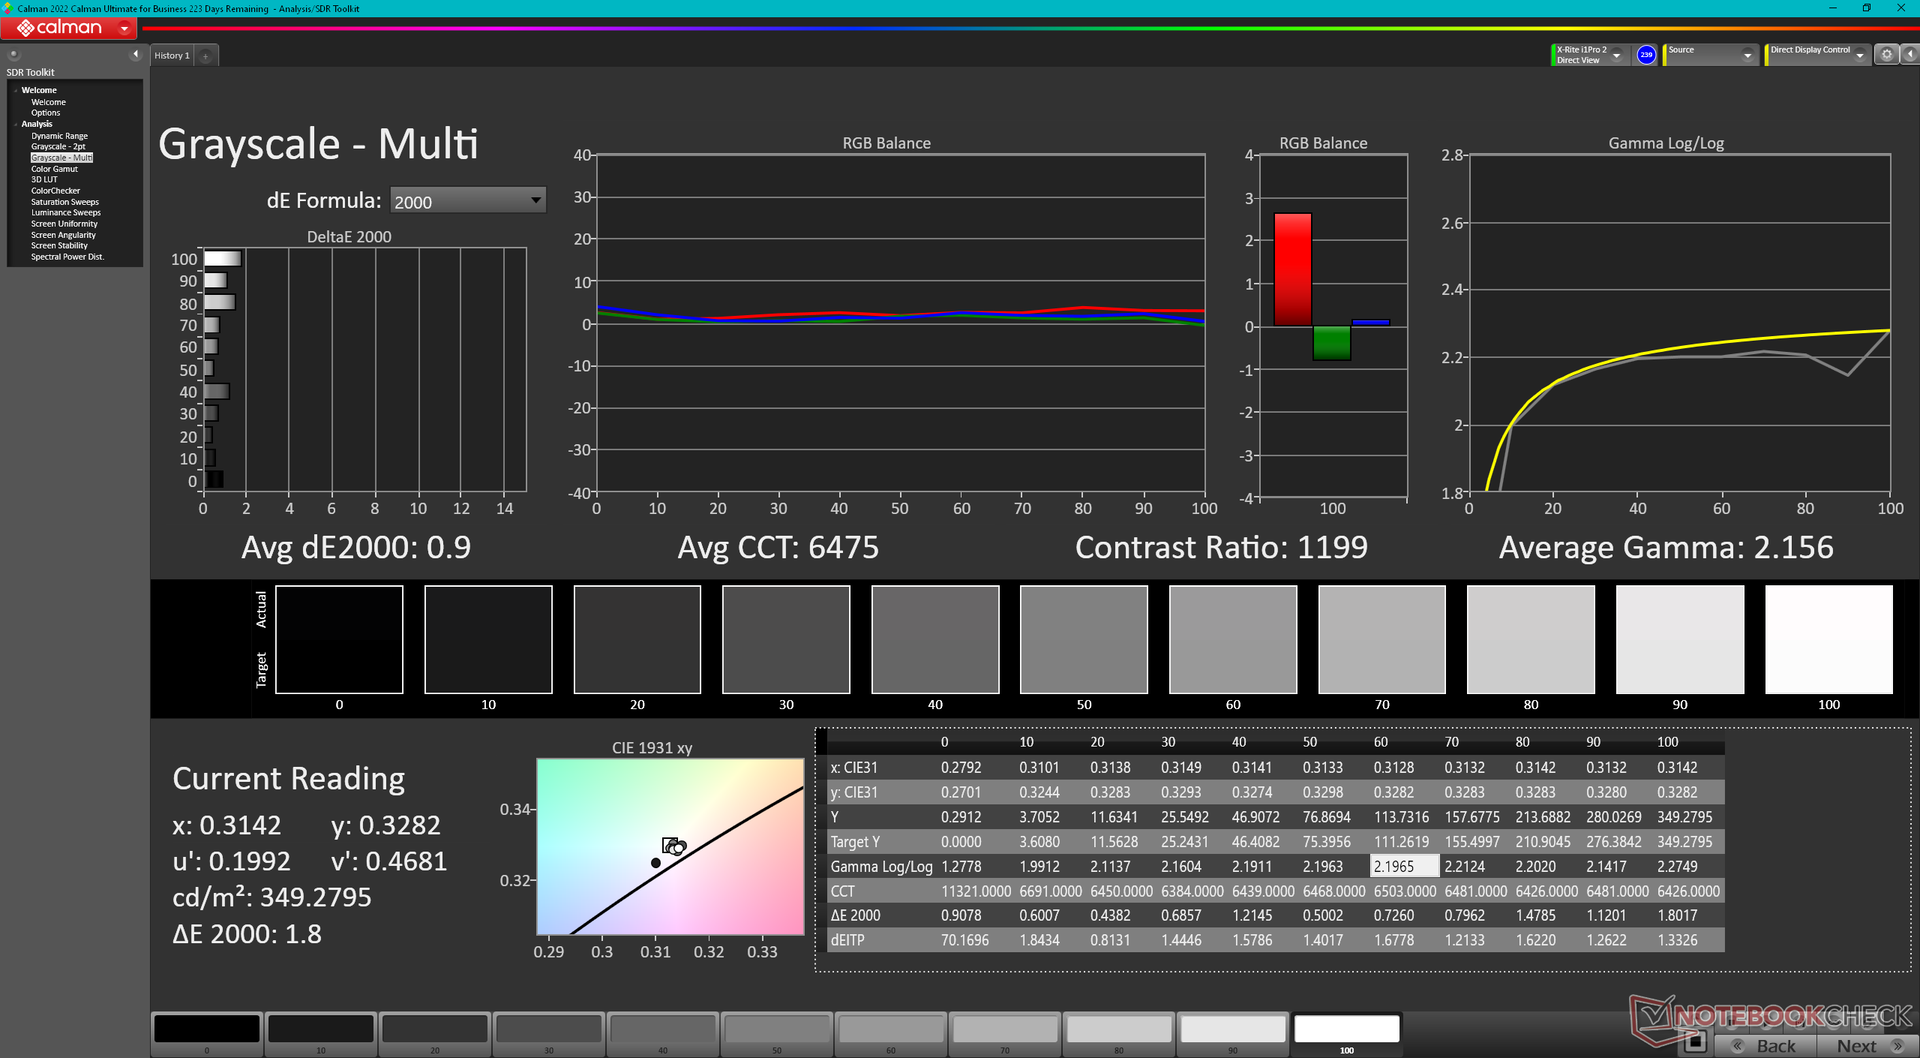
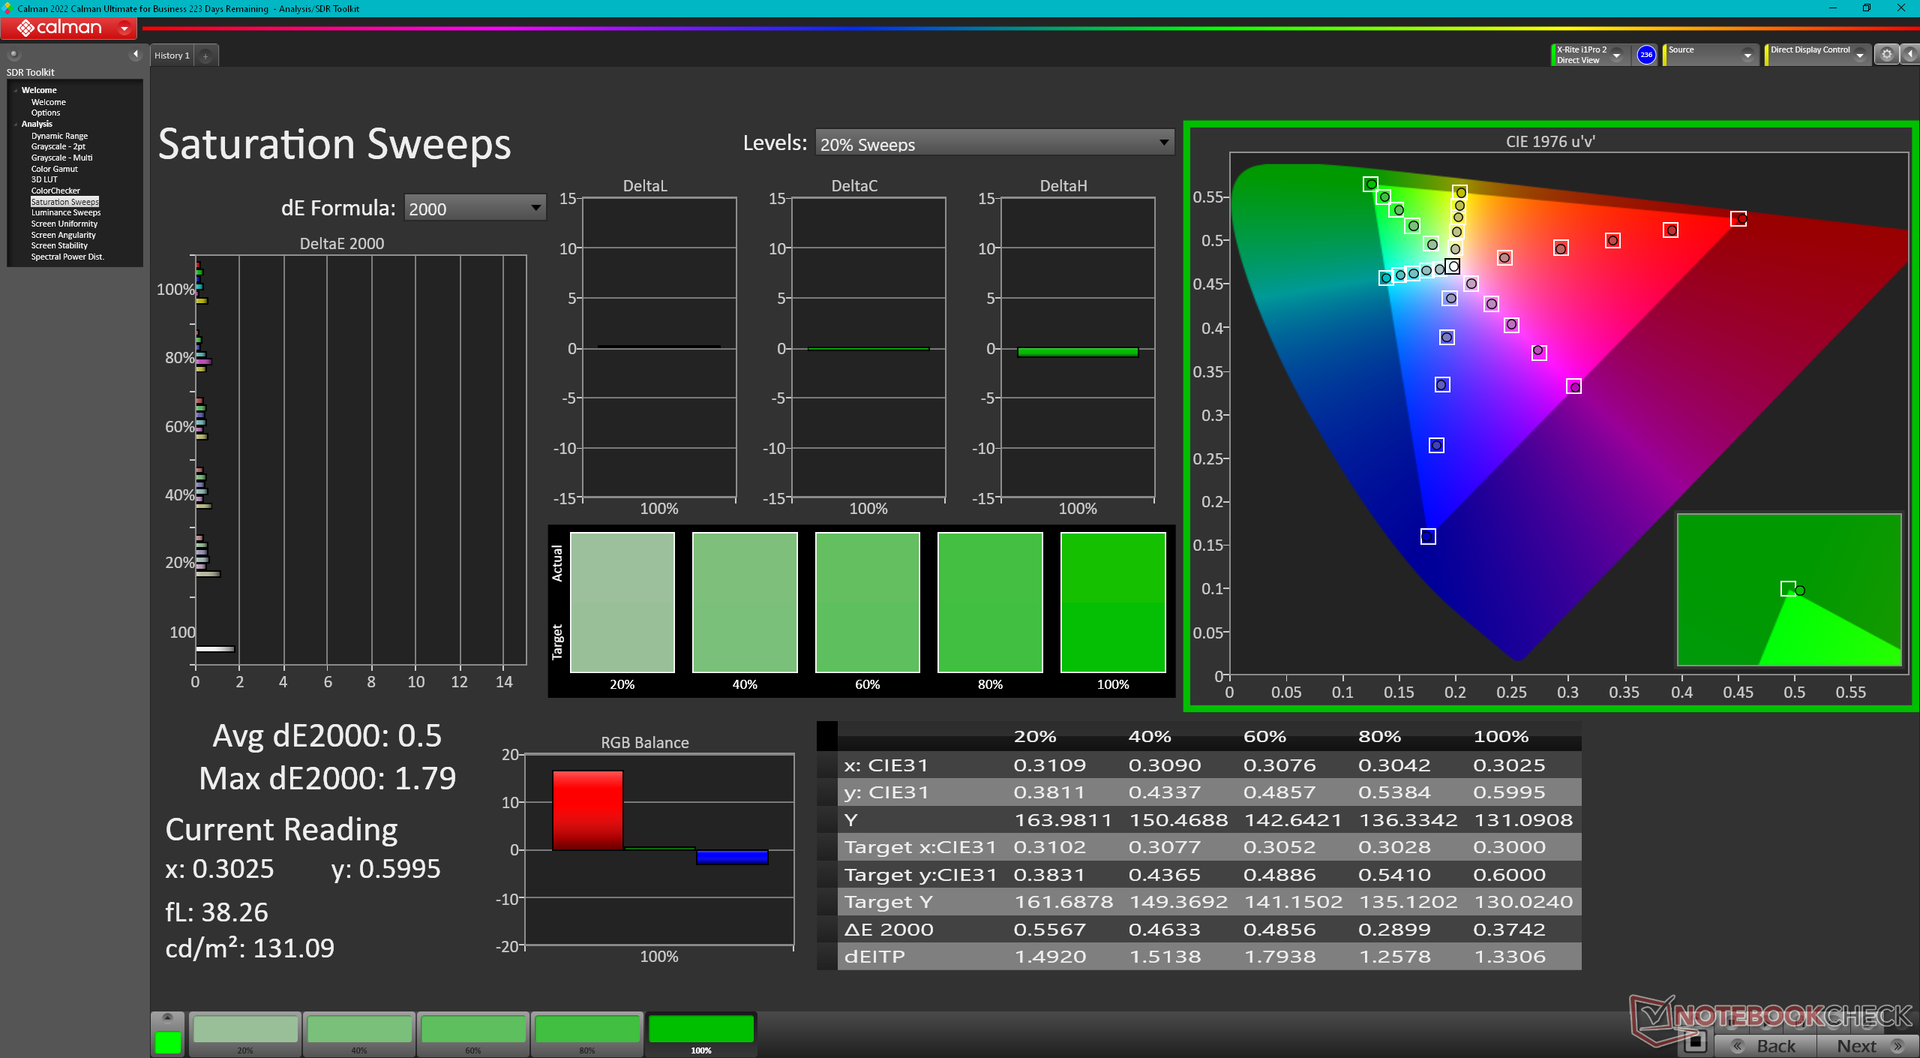
Le modèle utilise un panneau BOE NE16NYH contrairement au BOE NE16NYB du m16 R1 de l'année dernière. Le nouveau panneau a un taux de rafraîchissement natif plus rapide (240 Hz contre 165 Hz) tandis que tous les autres attributs restent essentiellement les mêmes, y compris les temps de réponse noir-blanc rapides, un rapport de contraste de ~1000:1, une couverture sRGB complète, et une luminosité maximale de 300 à 350 nit. L'écran convient aussi bien aux jeux qu'à l'édition amateur.
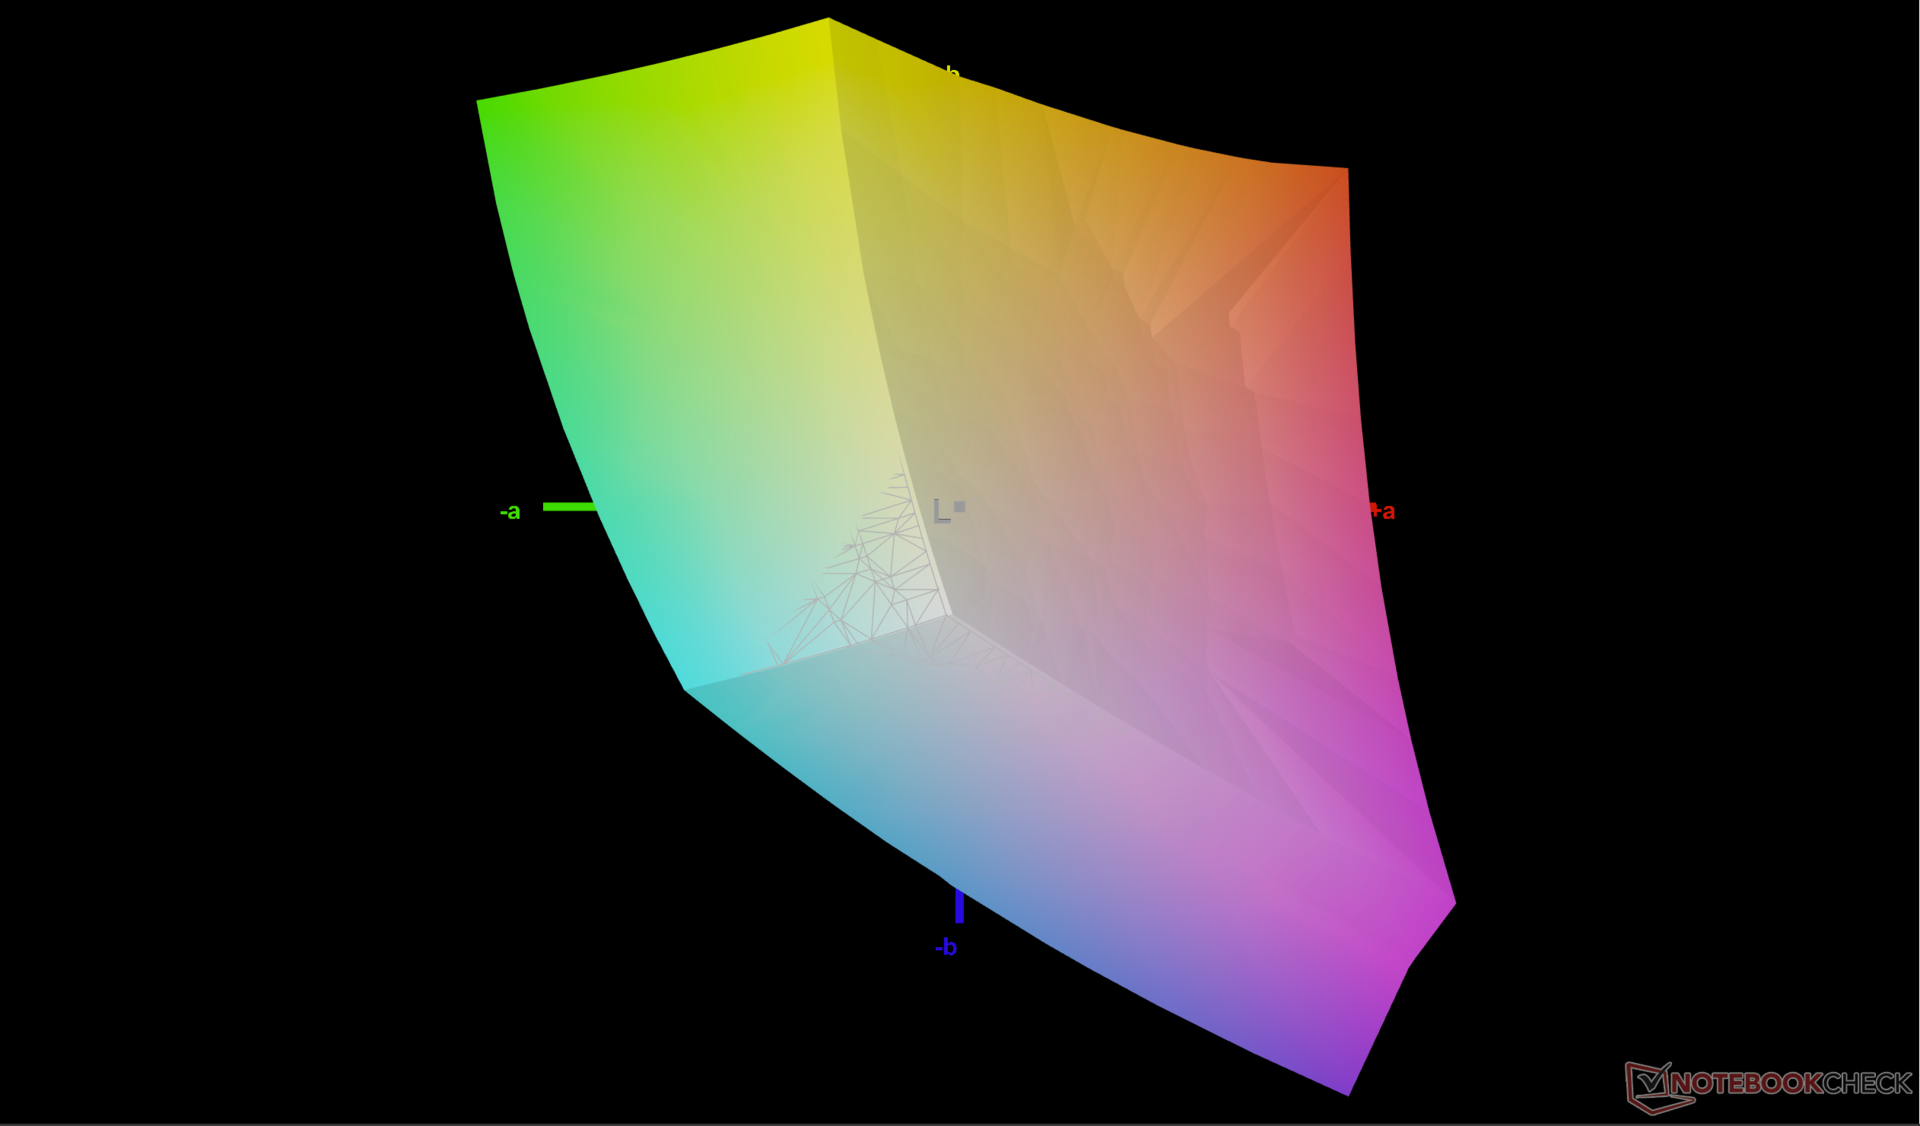
Aussi fluide que soit le nouveau panneau, il manque encore les couleurs DCI-P3 et le taux de rafraîchissement variable de Windows. Les couleurs DCI-P3 auraient séduit les éditeurs graphiques professionnels, tandis que la fréquence de rafraîchissement variable aurait amélioré l'autonomie de la batterie. Les couleurs DCI-P3 sont disponibles sur les écrans x16 R1, HP Omen Transcend 16, et Asus ROG Zephyrus G16. Le HDR n'est pas pris en charge non plus car l'écran n'est pas assez lumineux pour répondre aux exigences du HDR400+.
| |||||||||||||||||||||||||
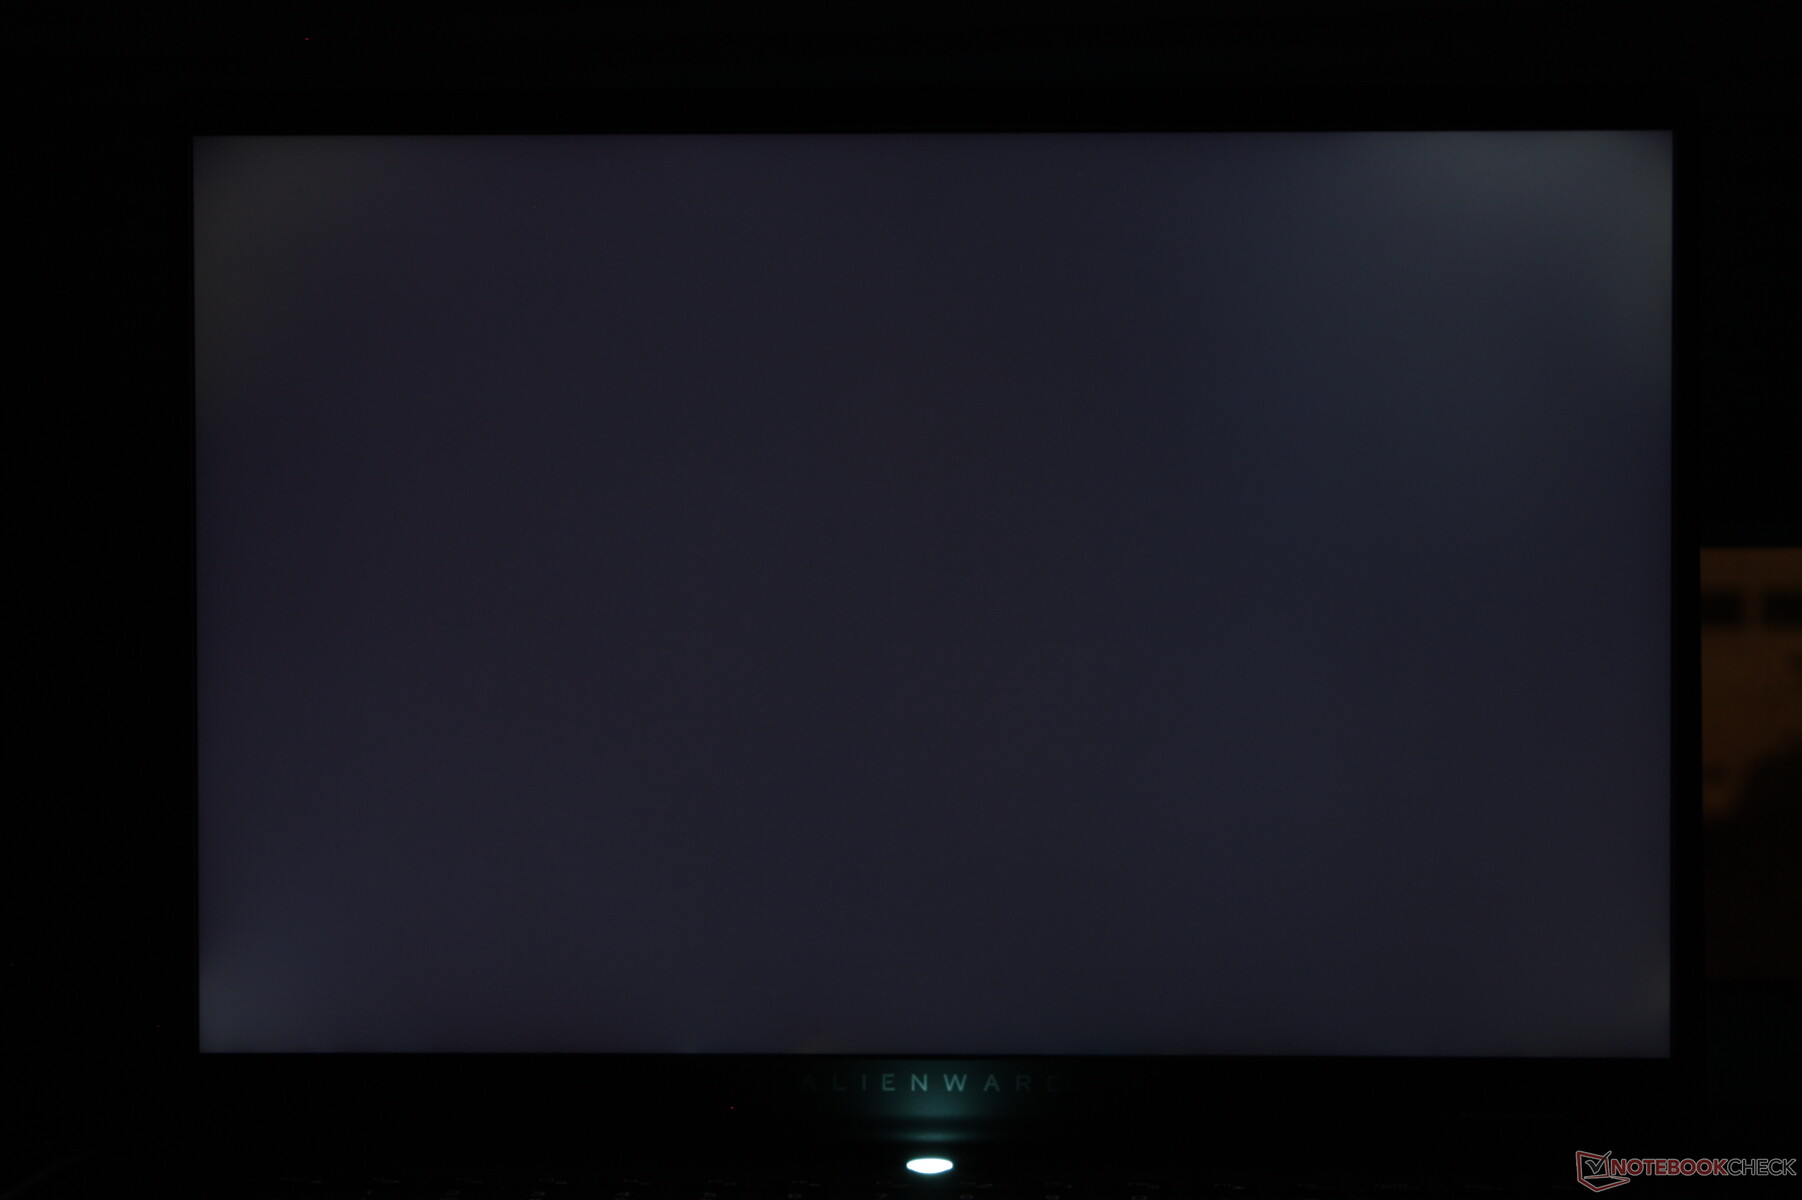
Homogénéité de la luminosité: 87 %
Valeur mesurée au centre, sur batterie: 345.8 cd/m²
Contraste: 1153:1 (Valeurs des noirs: 0.3 cd/m²)
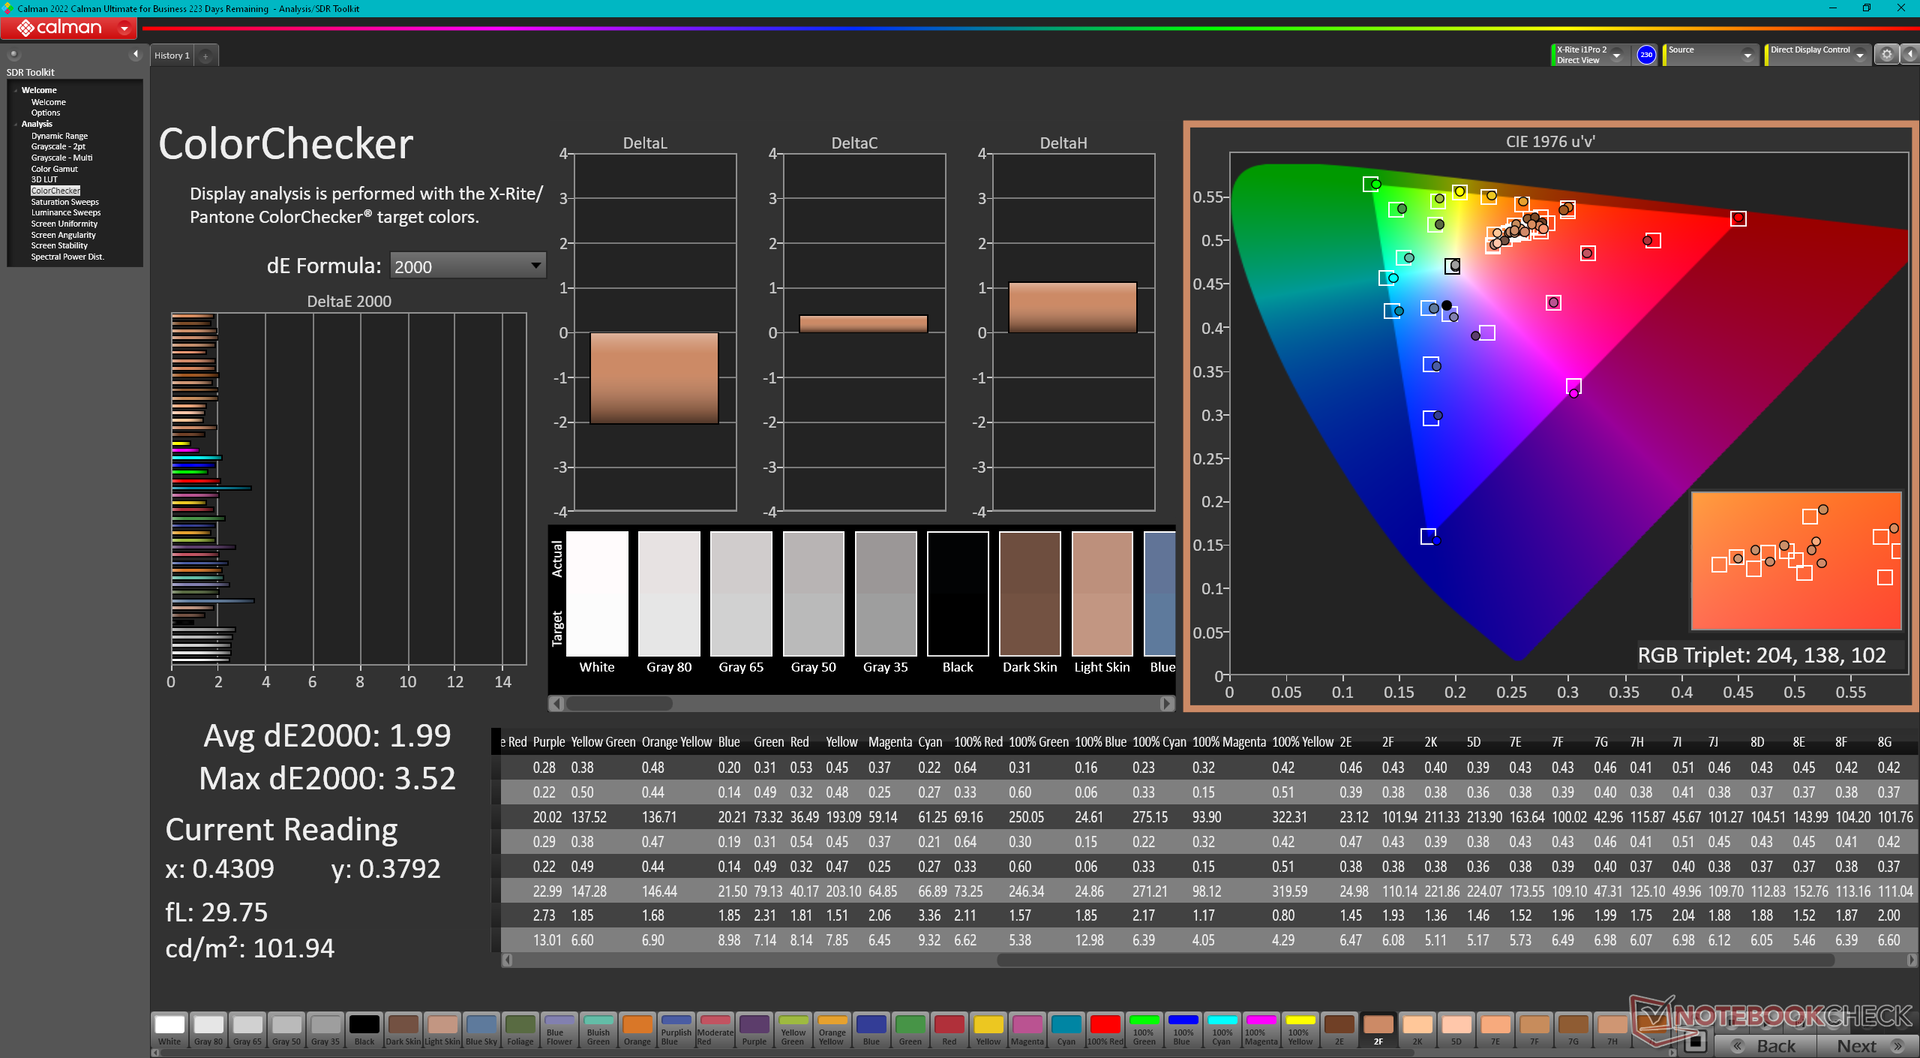
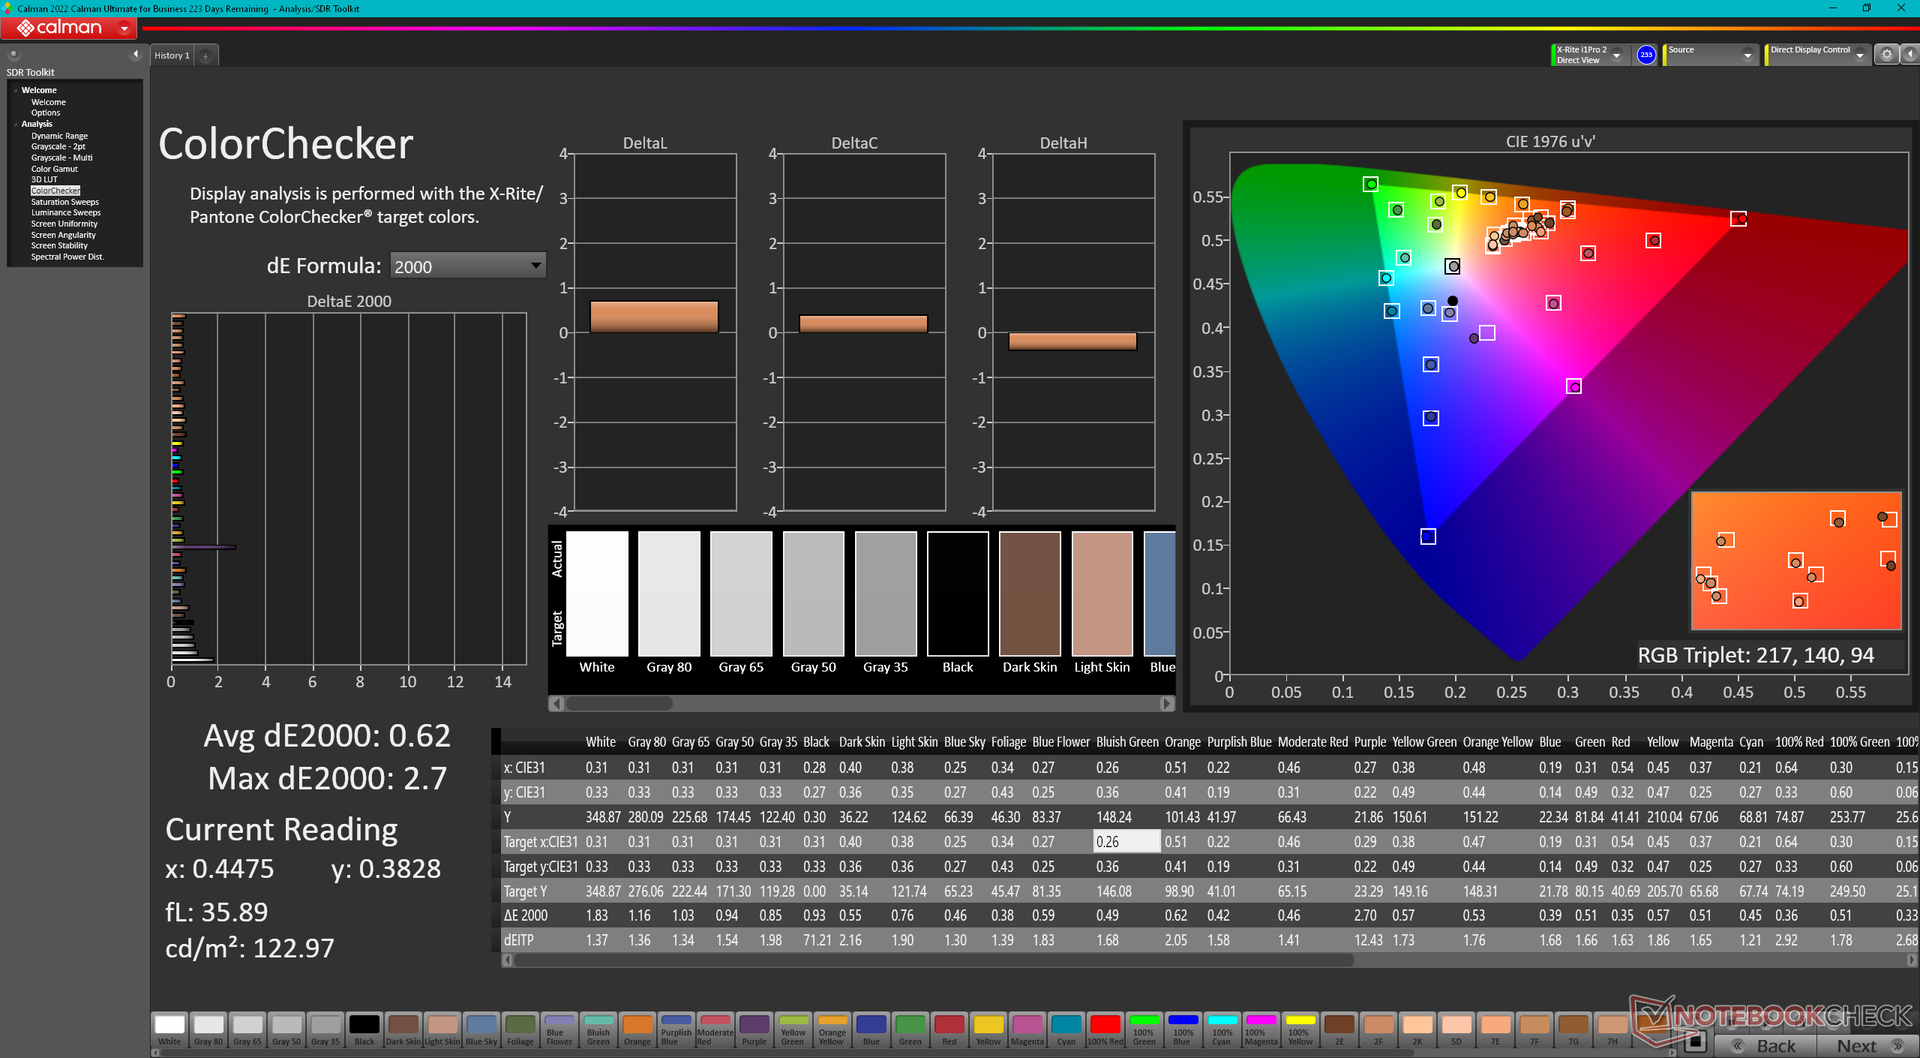
ΔE ColorChecker Calman: 1.99 | ∀{0.5-29.43 Ø4.71}
calibrated: 0.62
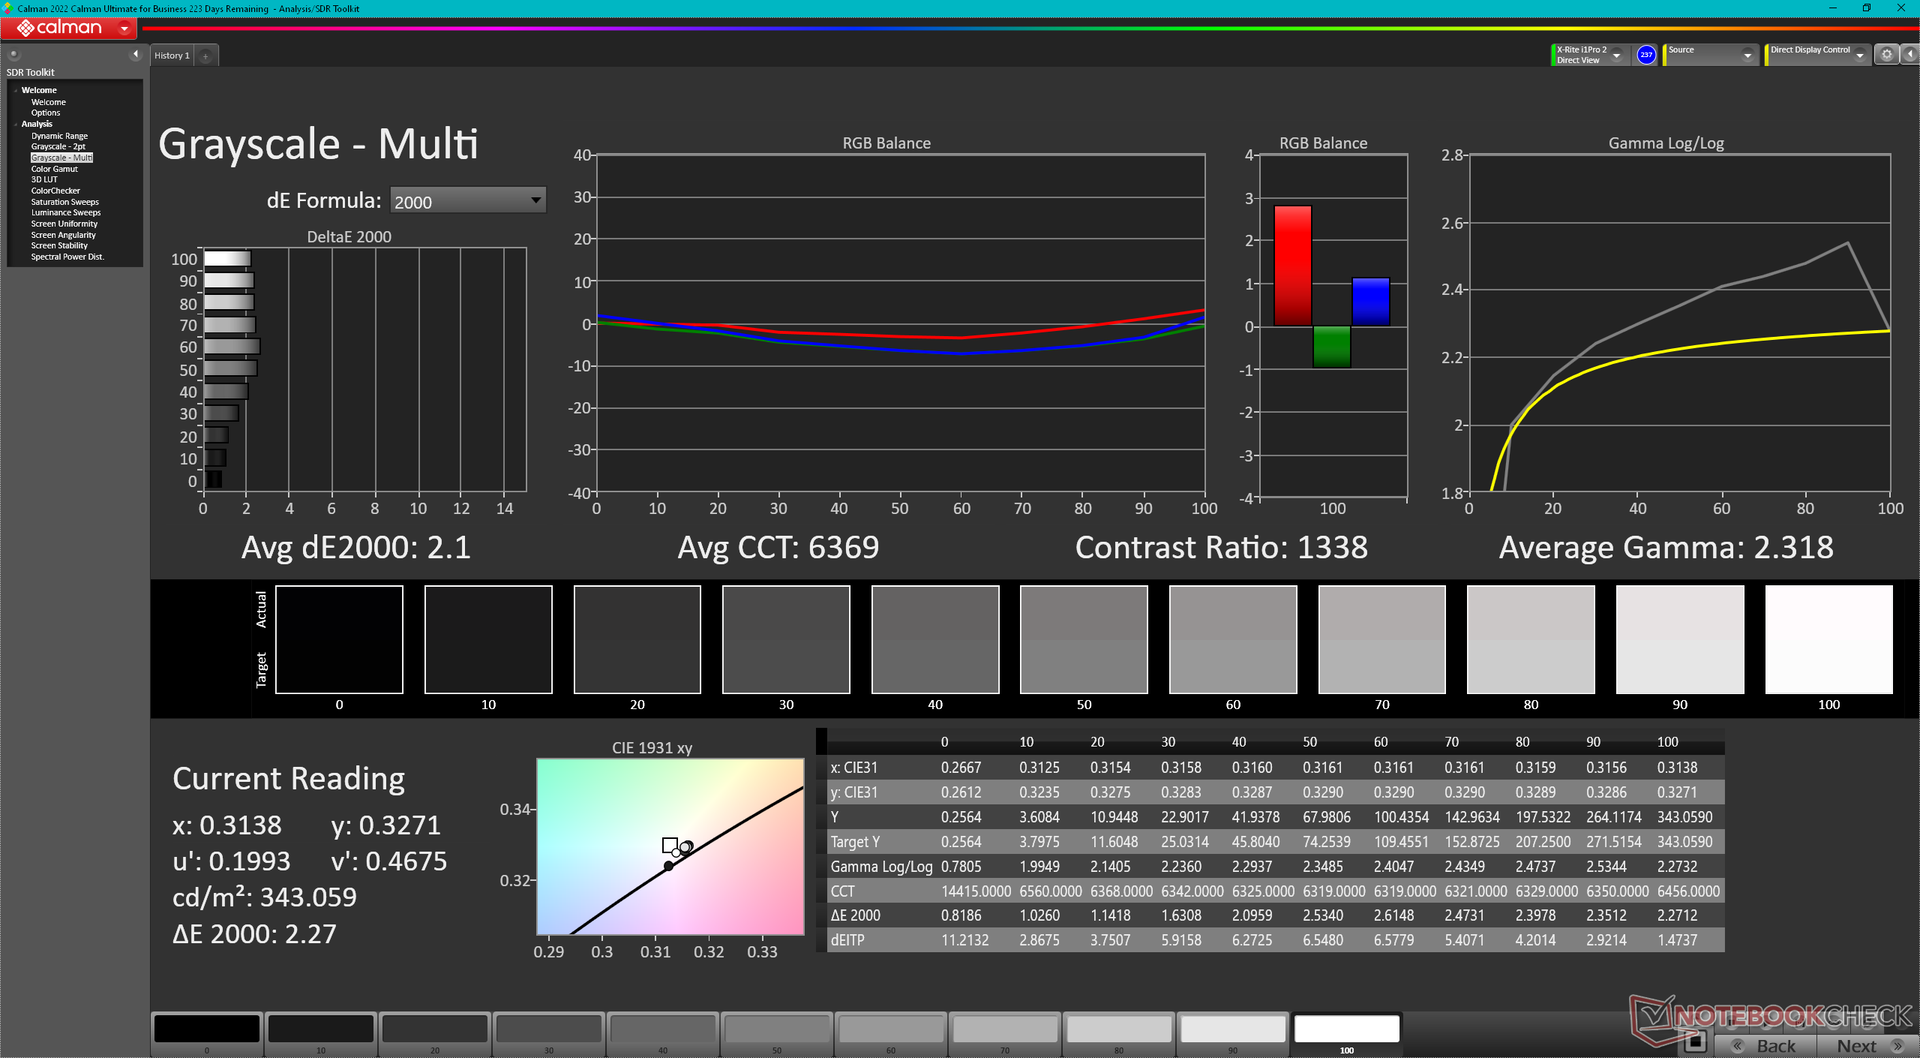
ΔE Greyscale Calman: 2.1 | ∀{0.09-98 Ø4.96}
71.4% AdobeRGB 1998 (Argyll 3D)
100% sRGB (Argyll 3D)
71% Display P3 (Argyll 3D)
Gamma: 2.32
CCT: 6369 K
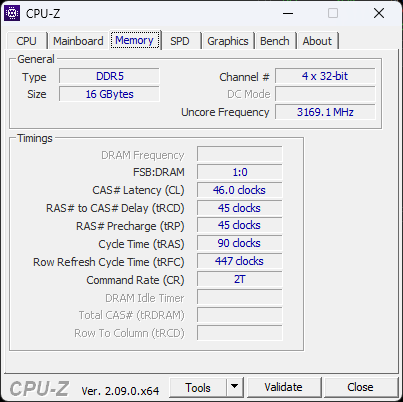
| Alienware m16 R2 BOE NE16NYH, IPS, 2560x1600, 16" | Alienware m16 R1 Intel BOE NE16NYB, IPS, 2560x1600, 16" | Alienware x16 R1 BOE NE16NZ4, IPS, 2560x1600, 16" | HP Omen Transcend 16-u1095ng ATNA60DL02-0 (SDC41A4), OLED, 2560x1600, 16" | Asus ROG Zephyrus G16 2024 GU605M ATNA60DL01-0, OLED, 2560x1600, 16" | Lenovo Legion Slim 7 16APH8 BOE NE160QDM-NZ3, IPS, 2560x1600, 16" | |
|---|---|---|---|---|---|---|
| Display | -3% | 21% | 26% | 26% | 0% | |
| Display P3 Coverage (%) | 71 | 67.7 -5% | 99.2 40% | 99.8 41% | 99.9 41% | 70.3 -1% |
| sRGB Coverage (%) | 100 | 97.2 -3% | 100 0% | 100 0% | 100 0% | 99.6 0% |
| AdobeRGB 1998 Coverage (%) | 71.4 | 70 -2% | 88.6 24% | 97 36% | 96.9 36% | 72.4 1% |
| Response Times | 23% | -4% | 97% | 97% | -45% | |
| Response Time Grey 50% / Grey 80% * (ms) | 5.7 ? | 4 ? 30% | 5.1 ? 11% | 0.2 ? 96% | 0.22 ? 96% | 12.6 ? -121% |
| Response Time Black / White * (ms) | 8.7 ? | 7.3 ? 16% | 10.3 ? -18% | 0.2 ? 98% | 0.25 ? 97% | 5.9 ? 32% |
| PWM Frequency (Hz) | 120 ? | 960 ? | ||||
| Screen | -20% | -13% | 129% | 14% | 5% | |
| Brightness middle (cd/m²) | 345.8 | 306 -12% | 302.2 -13% | 390 13% | 416 20% | 545 58% |
| Brightness (cd/m²) | 337 | 302 -10% | 285 -15% | 392 16% | 418 24% | 502 49% |
| Brightness Distribution (%) | 87 | 89 2% | 89 2% | 98 13% | 96 10% | 82 -6% |
| Black Level * (cd/m²) | 0.3 | 0.3 -0% | 0.26 13% | 0.02 93% | 0.48 -60% | |
| Contrast (:1) | 1153 | 1020 -12% | 1162 1% | 19500 1591% | 1135 -2% | |
| Colorchecker dE 2000 * | 1.99 | 2.57 -29% | 1.63 18% | 1.94 3% | 1.6 20% | 1.36 32% |
| Colorchecker dE 2000 max. * | 3.52 | 4.26 -21% | 4.13 -17% | 4.26 -21% | 2.1 40% | 3.11 12% |
| Colorchecker dE 2000 calibrated * | 0.62 | 0.85 -37% | 1.17 -89% | 4.21 -579% | 1.04 -68% | |
| Greyscale dE 2000 * | 2.1 | 3.3 -57% | 2.5 -19% | 1.5 29% | 2.7 -29% | 1.4 33% |
| Gamma | 2.32 95% | 1.997 110% | 2.23 99% | 2.221 99% | 2.16 102% | 2.253 98% |
| CCT | 6369 102% | 6895 94% | 6590 99% | 6395 102% | 6331 103% | 6631 98% |
| Moyenne finale (programmes/paramètres) | 0% /
-10% | 1% /
-4% | 84% /
102% | 46% /
32% | -13% /
-3% |
* ... Moindre est la valeur, meilleures sont les performances
L'écran est bien calibré dès sa sortie de l'emballage, avec des valeurs moyennes de deltaE en niveaux de gris et en couleurs de seulement 2,1 et 1,99, respectivement. Les résultats s'amélioreraient encore avec des valeurs inférieures à 1 lorsque l'écran est calibré à l'aide de notre colorimètre X-Rite, mais cela ne devrait pas être nécessaire pour la plupart des utilisateurs. Notre profil ICM calibré peut être téléchargé gratuitement ci-dessus.
Temps de réponse de l'écran
| ↔ Temps de réponse noir à blanc | ||
|---|---|---|
| 8.7 ms ... hausse ↗ et chute ↘ combinées | ↗ 4.6 ms hausse | 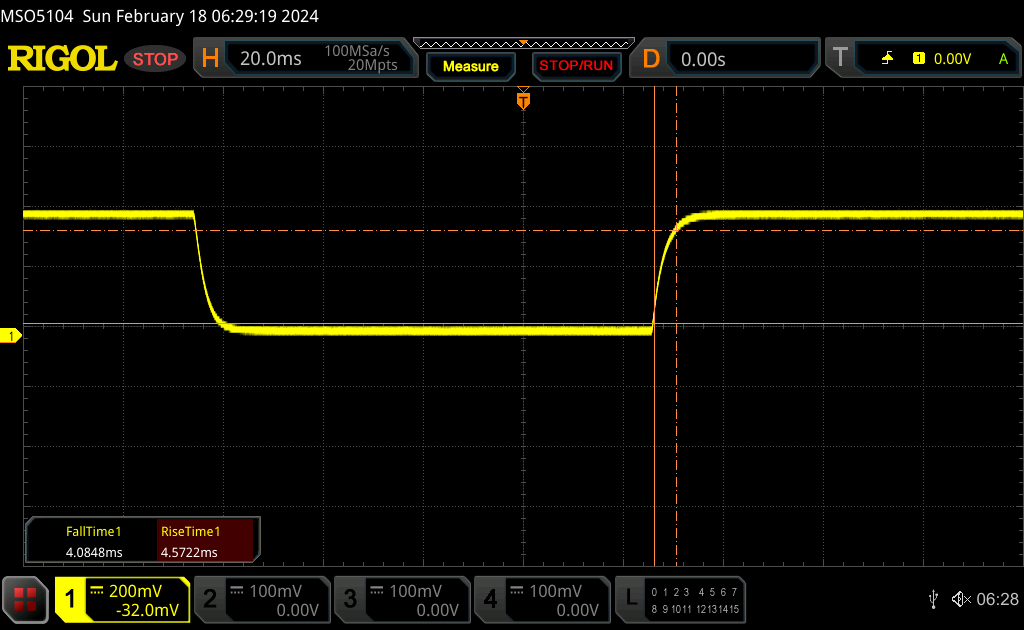 |
| ↘ 4.1 ms chute | ||
| L'écran montre de faibles temps de réponse, un bon écran pour jouer. En comparaison, tous les appareils testés affichent entre 0.1 (minimum) et 240 (maximum) ms. » 24 % des appareils testés affichent de meilleures performances. Cela signifie que les latences relevées sont meilleures que la moyenne (19.8 ms) de tous les appareils testés. | ||
| ↔ Temps de réponse gris 50% à gris 80% | ||
| 5.7 ms ... hausse ↗ et chute ↘ combinées | ↗ 2.6 ms hausse | 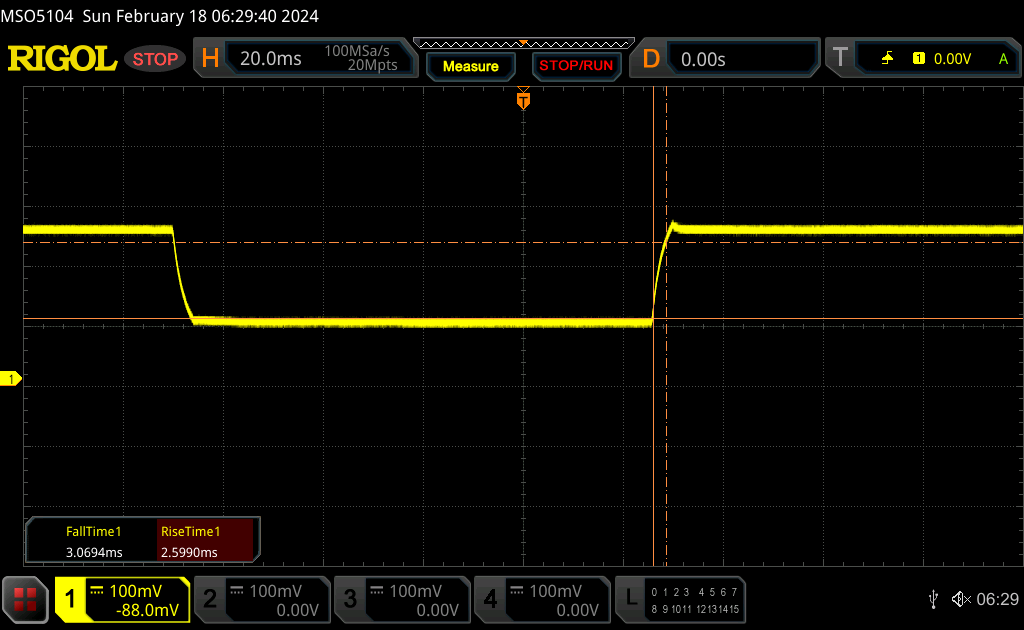 |
| ↘ 3.1 ms chute | ||
| L'écran montre de très faibles temps de réponse, parfait pour le jeu. En comparaison, tous les appareils testés affichent entre 0.165 (minimum) et 636 (maximum) ms. » 18 % des appareils testés affichent de meilleures performances. Cela signifie que les latences relevées sont meilleures que la moyenne (31 ms) de tous les appareils testés. | ||
Scintillement / MLI (Modulation de largeur d'impulsion)
| Scintillement / MLI (Modulation de largeur d'impulsion) non décelé | 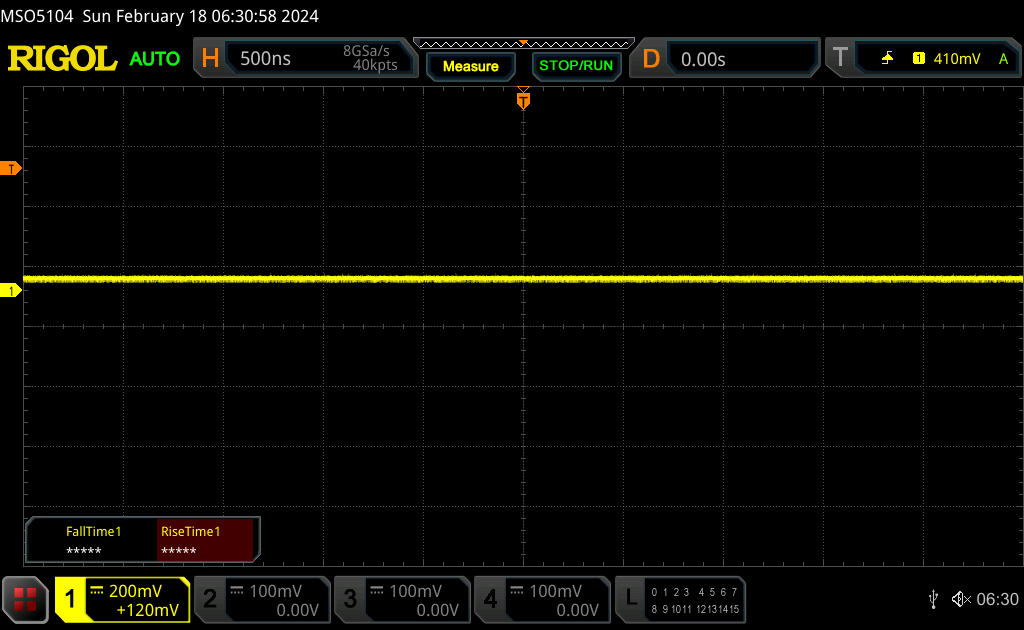 | ||
En comparaison, 52 % des appareils testés n'emploient pas MDI pour assombrir leur écran. Nous avons relevé une moyenne à 7757 (minimum : 5 - maximum : 343500) Hz dans le cas où une MDI était active. | |||
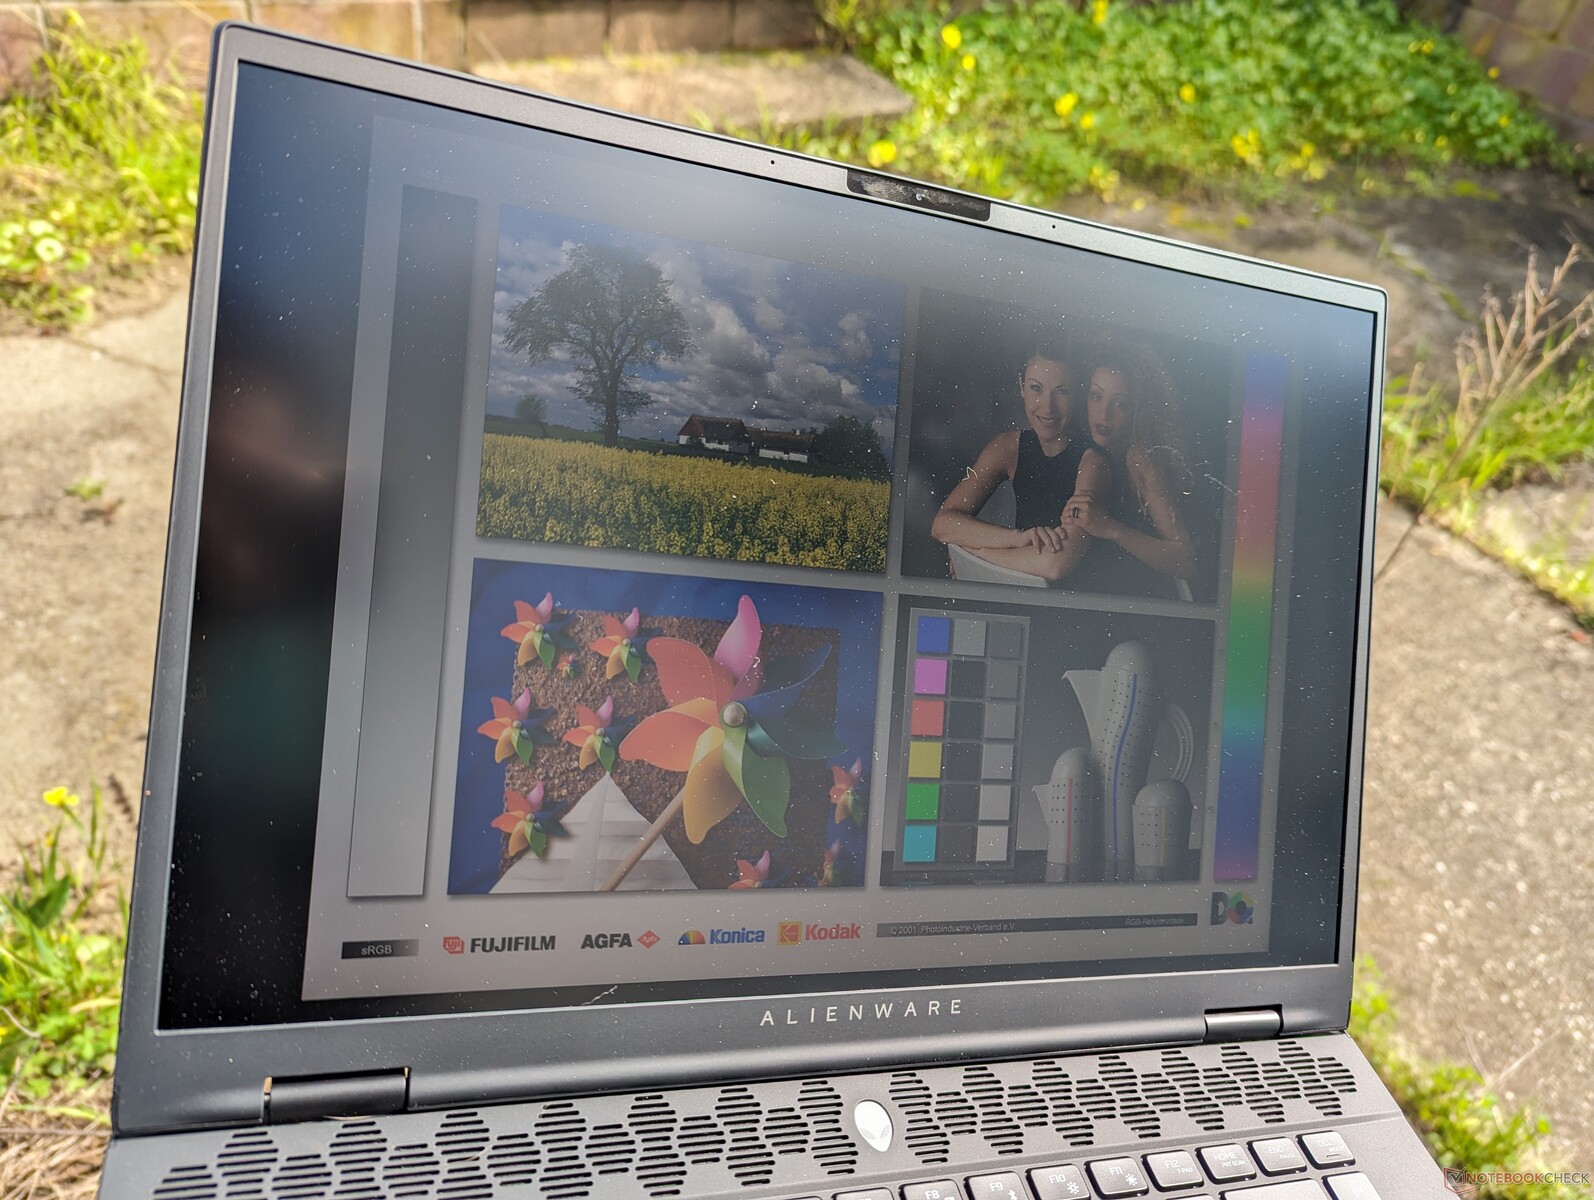
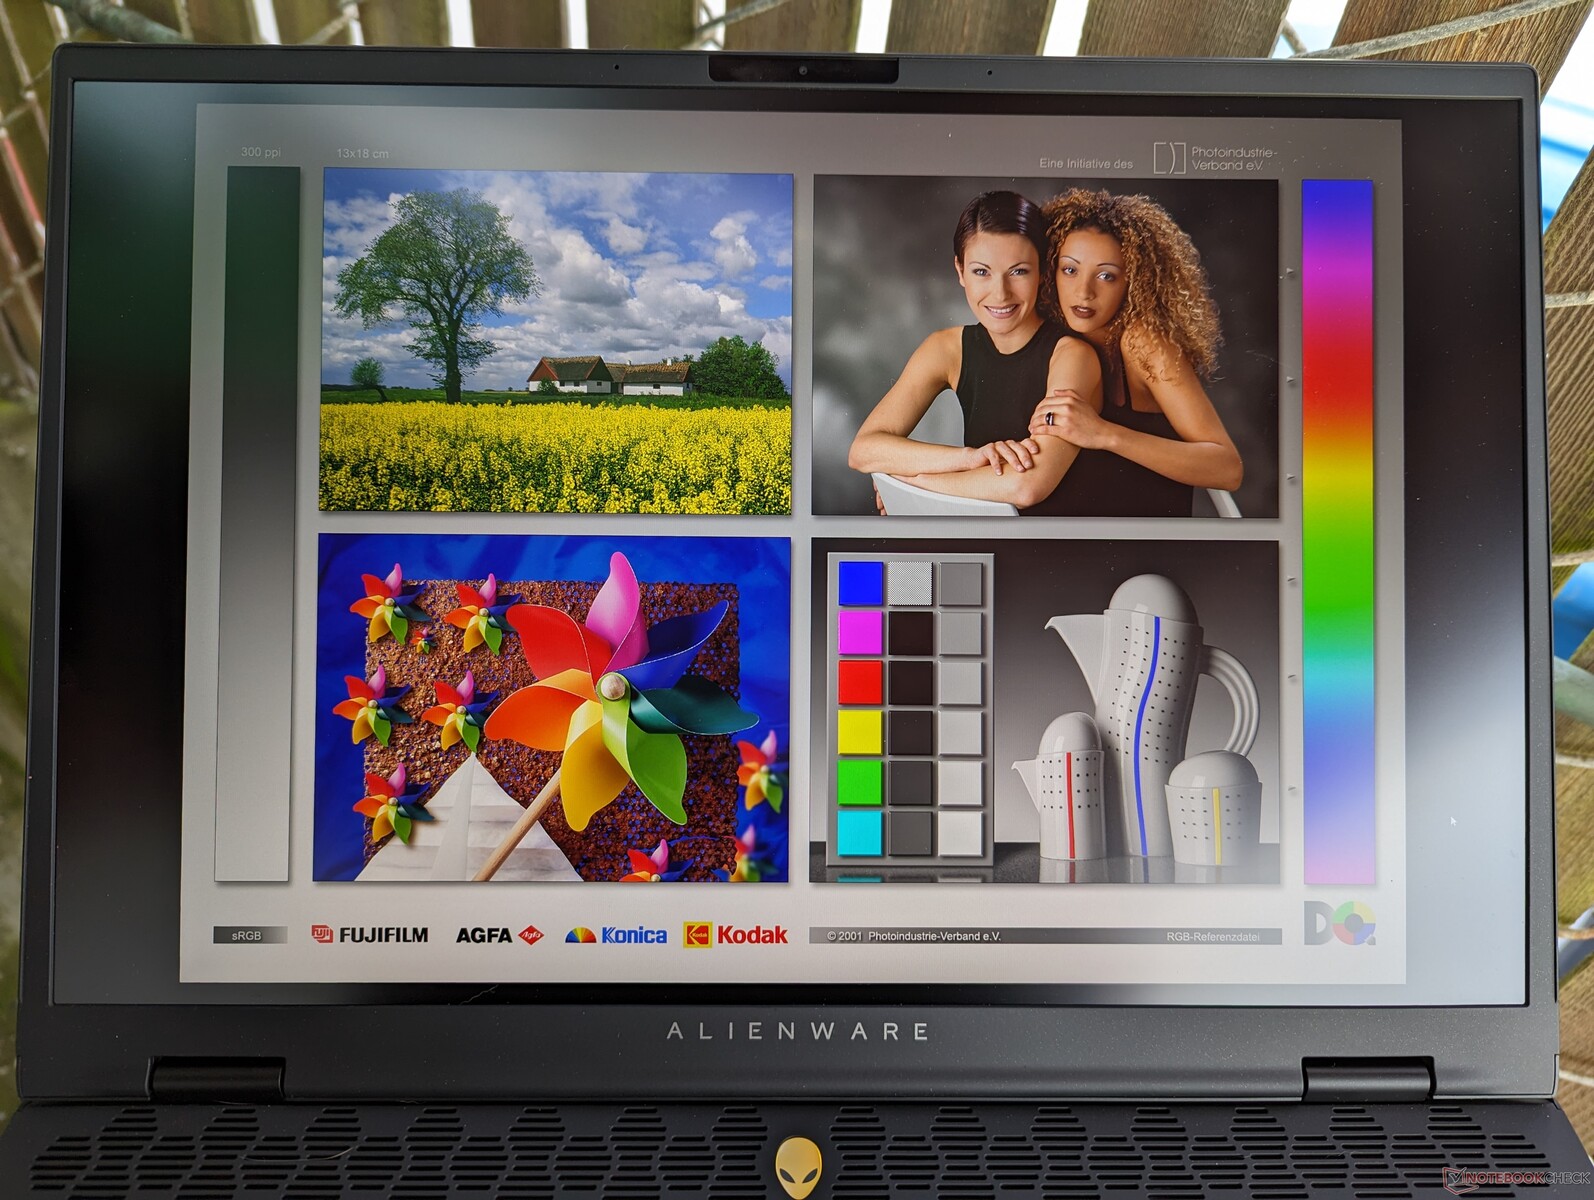
La visibilité à l'extérieur reste à peu près la même qu'auparavant et il est donc recommandé de rester à l'ombre autant que possible pour réduire l'éblouissement et préserver les couleurs. Le poids plus léger et la taille plus petite rendent le système plus facile à manipuler.

Performance - De Raptor Lake-HX à Meteor Lake-H
Conditions d'essai
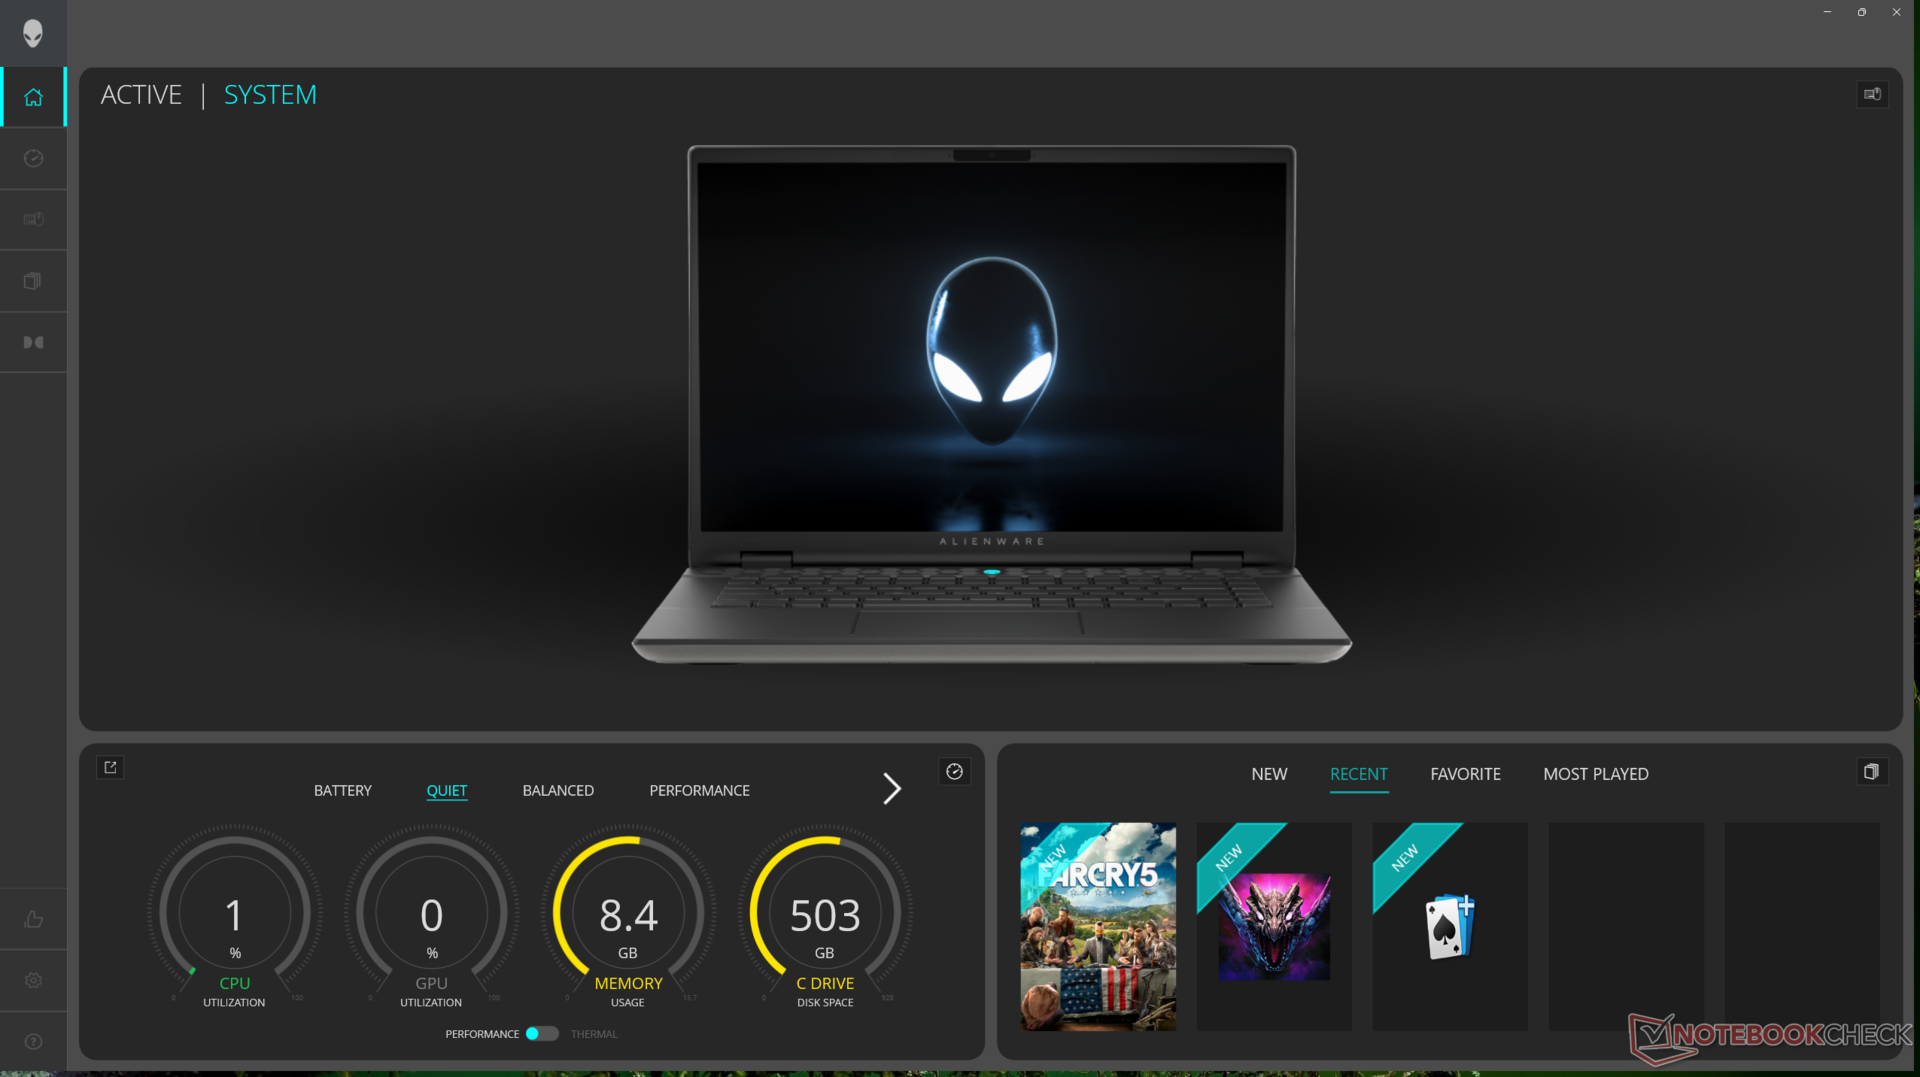
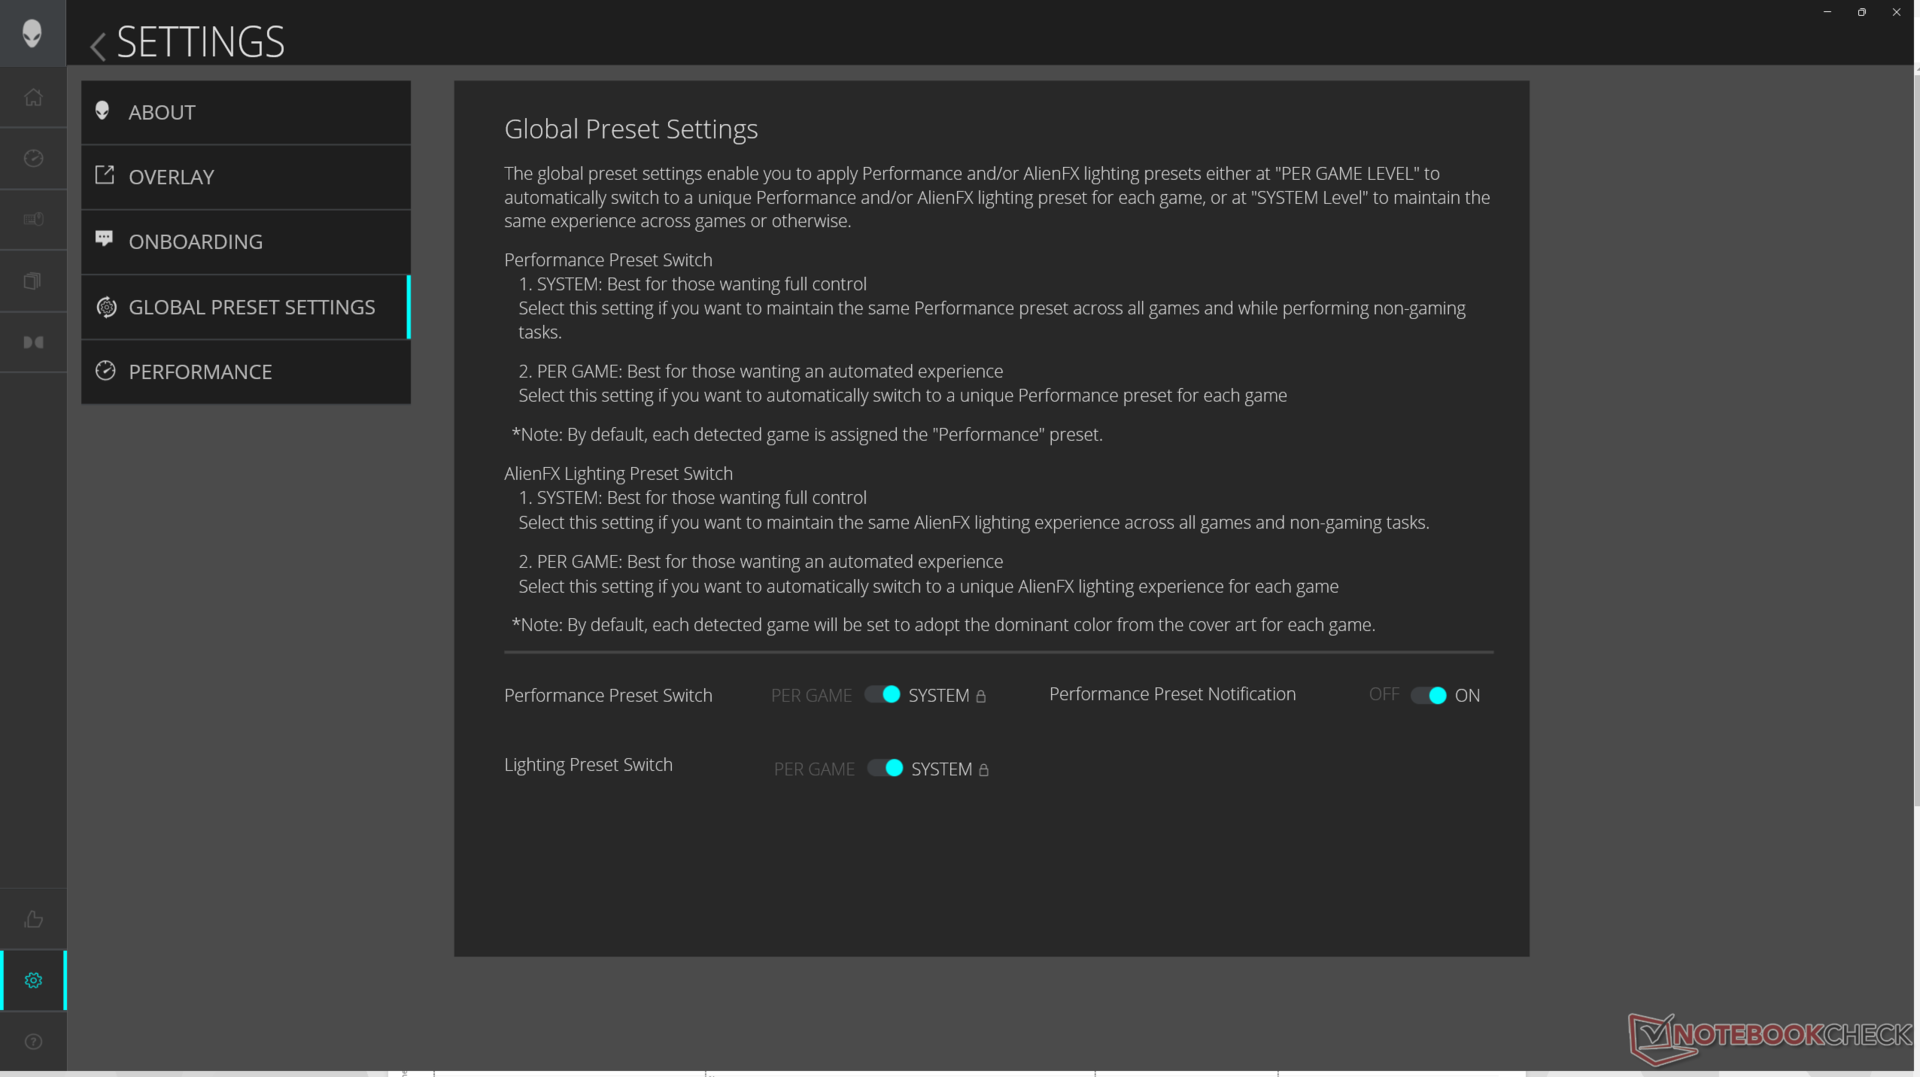
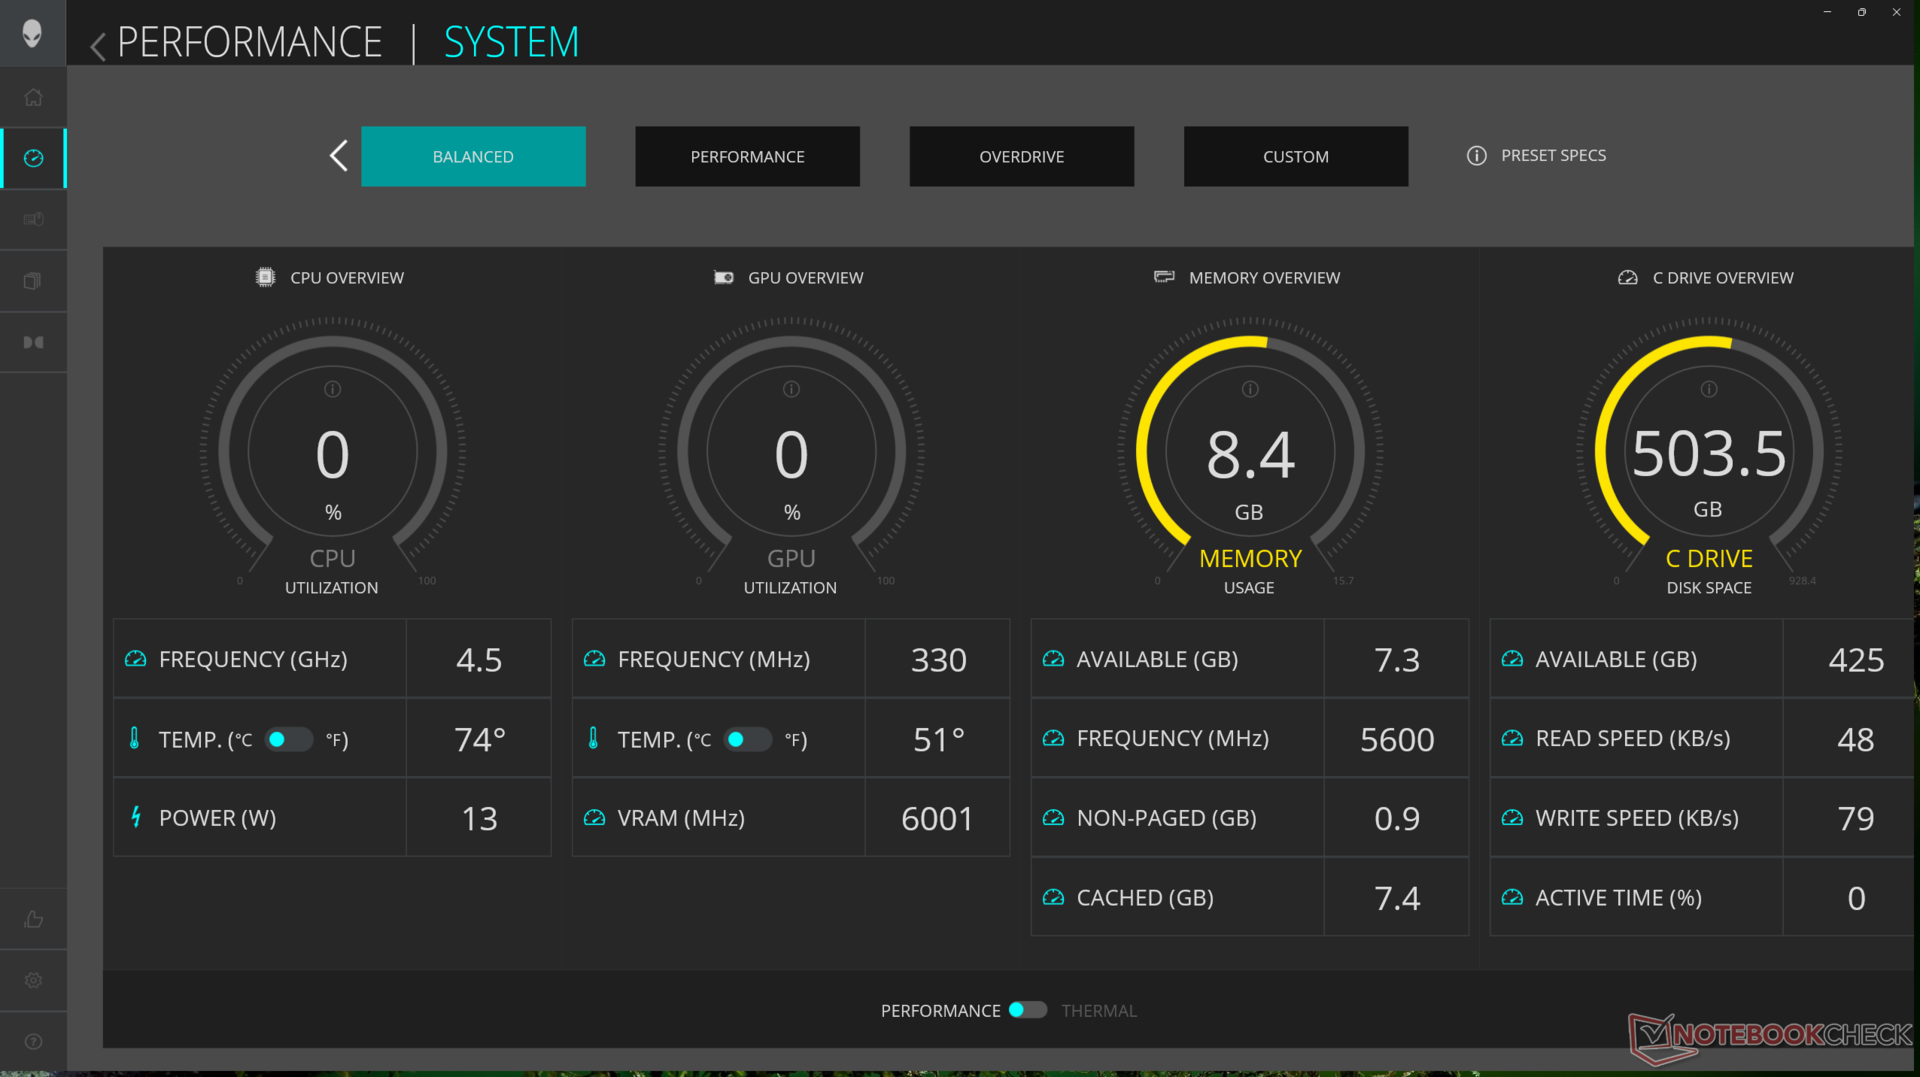
Nous avons mis Alienware Command Center (ACC) en mode Overdrive et Nvidia Control Panel en mode dGPU avant de lancer les benchmarks ci-dessous. L'ACC a été mis à jour pour fonctionner de manière plus fluide et sans les problèmes que nous avions rencontrés sur le m16 R1. Par exemple, il se lance maintenant presque immédiatement au démarrage, tandis que les modes de profil de ventilateur et l'éclairage AlienFX RGB ne changent plus automatiquement sans que l'utilisateur en soit averti.
Néanmoins, nous avons encore rencontré un bug où le système n'entrait pas correctement en mode Veille lorsque le couvercle était fermé, même après avoir revérifié les paramètres d'alimentation de Windows. Il en résulte un ordinateur portable très chaud et une batterie complètement déchargée quelques heures plus tard.
Advanced Optimus et G-Sync sont tous deux pris en charge, ce qui signifie que les utilisateurs peuvent basculer entre les modes iGPU et dGPU sans redémarrage. Notez que le système doit être configuré en mode dGPU pour que G-Sync fonctionne.
Processeur
Notre Core Ultra 7 155H est environ 10 à 15 % plus lent que le Core i7-13700HX sur le m16 R1 de l'année dernière, à la fois pour les opérations simples et multithread. Il est à peu près au même niveau que le récent Core i7-13700HX de la Ryzen 9 8945HS. Comme sur les autres CPU Meteor Lake, le Core Ultra 7 155H intègre un NPU pour accélérer les tâches d'IA comme Microsoft Co-Pilot. La plupart des applications d'IA à l'heure actuelle sont basées sur le cloud et sans option d'exécution locale, cependant, et les capacités d'IA intégrées du nouveau CPU sont donc très limitées pour le moment.
Malgré le déficit de performance par rapport au Core i7-13700HX, le m16 R2 est capable de faire tourner le Core Ultra 7 155H sensiblement plus vite que d'autres ordinateurs portables équipés du même processeur. Par exemple, le Core Ultra 7 155H de la récente MSI Prestige 16 fonctionne presque 20 % plus lentement.
Dell indique qu'il prévoit de proposer prochainement une UGS Ultra 9 185H qui devrait permettre de réduire l'écart de performance avec le Core i7-13700HX. Les Core i7-14700HX ou Core i9-14900HX, plus exigeants, ne sont pas proposés en raison de limitations thermiques ; Dell a donné la priorité à la maximisation du TGP du GPU plutôt qu'au TDP du CPU.
Cinebench R15 Multi Loop
Cinebench R23: Multi Core | Single Core
Cinebench R20: CPU (Multi Core) | CPU (Single Core)
Cinebench R15: CPU Multi 64Bit | CPU Single 64Bit
Blender: v2.79 BMW27 CPU
7-Zip 18.03: 7z b 4 | 7z b 4 -mmt1
Geekbench 6.7: Multi-Core | Single-Core
Geekbench 5.5: Multi-Core | Single-Core
HWBOT x265 Benchmark v2.2: 4k Preset
LibreOffice : 20 Documents To PDF
R Benchmark 2.5: Overall mean
| Geekbench 6.7 / Multi-Core | |
| Lenovo Legion 9 16IRX8 | |
| HP Omen Transcend 16-u1095ng | |
| Alienware m16 R1 Intel | |
| Razer Blade 14 RZ09-0508 | |
| Asus ROG Zephyrus G16 2024 GU605M | |
| Framework Laptop 16 | |
| Lenovo Legion Slim 7 16APH8 | |
| Alienware m16 R2 | |
| Alienware m16 R1 AMD | |
| Moyenne Intel Core Ultra 7 155H (7732 - 13656, n=55) | |
| Geekbench 6.7 / Single-Core | |
| Lenovo Legion 9 16IRX8 | |
| HP Omen Transcend 16-u1095ng | |
| Alienware m16 R1 AMD | |
| Razer Blade 14 RZ09-0508 | |
| Alienware m16 R1 Intel | |
| Framework Laptop 16 | |
| Lenovo Legion Slim 7 16APH8 | |
| Asus ROG Zephyrus G16 2024 GU605M | |
| Alienware m16 R2 | |
| Moyenne Intel Core Ultra 7 155H (1901 - 2473, n=52) | |
Cinebench R23: Multi Core | Single Core
Cinebench R20: CPU (Multi Core) | CPU (Single Core)
Cinebench R15: CPU Multi 64Bit | CPU Single 64Bit
Blender: v2.79 BMW27 CPU
7-Zip 18.03: 7z b 4 | 7z b 4 -mmt1
Geekbench 6.7: Multi-Core | Single-Core
Geekbench 5.5: Multi-Core | Single-Core
HWBOT x265 Benchmark v2.2: 4k Preset
LibreOffice : 20 Documents To PDF
R Benchmark 2.5: Overall mean
* ... Moindre est la valeur, meilleures sont les performances
AIDA64: FP32 Ray-Trace | FPU Julia | CPU SHA3 | CPU Queen | FPU SinJulia | FPU Mandel | CPU AES | CPU ZLib | FP64 Ray-Trace | CPU PhotoWorxx
| Performance rating | |
| Lenovo Legion Slim 7 16APH8 | |
| Alienware m16 R1 Intel | |
| Alienware x16 R1 | |
| HP Omen Transcend 16-u1095ng | |
| Alienware m16 R2 | |
| Asus ROG Zephyrus G16 2024 GU605M | |
| Moyenne Intel Core Ultra 7 155H | |
| AIDA64 / FP32 Ray-Trace | |
| Lenovo Legion Slim 7 16APH8 | |
| Alienware m16 R1 Intel | |
| Alienware m16 R2 | |
| Alienware x16 R1 | |
| HP Omen Transcend 16-u1095ng | |
| Asus ROG Zephyrus G16 2024 GU605M | |
| Moyenne Intel Core Ultra 7 155H (6670 - 18470, n=50) | |
| AIDA64 / FPU Julia | |
| Lenovo Legion Slim 7 16APH8 | |
| Alienware m16 R1 Intel | |
| Alienware m16 R2 | |
| Alienware x16 R1 | |
| HP Omen Transcend 16-u1095ng | |
| Asus ROG Zephyrus G16 2024 GU605M | |
| Moyenne Intel Core Ultra 7 155H (40905 - 93181, n=50) | |
| AIDA64 / CPU SHA3 | |
| Alienware m16 R1 Intel | |
| Lenovo Legion Slim 7 16APH8 | |
| HP Omen Transcend 16-u1095ng | |
| Alienware m16 R2 | |
| Alienware x16 R1 | |
| Asus ROG Zephyrus G16 2024 GU605M | |
| Moyenne Intel Core Ultra 7 155H (1940 - 4436, n=50) | |
| AIDA64 / CPU Queen | |
| HP Omen Transcend 16-u1095ng | |
| Alienware x16 R1 | |
| Lenovo Legion Slim 7 16APH8 | |
| Alienware m16 R1 Intel | |
| Asus ROG Zephyrus G16 2024 GU605M | |
| Alienware m16 R2 | |
| Moyenne Intel Core Ultra 7 155H (64698 - 94181, n=50) | |
| AIDA64 / FPU SinJulia | |
| Lenovo Legion Slim 7 16APH8 | |
| Alienware m16 R1 Intel | |
| HP Omen Transcend 16-u1095ng | |
| Alienware x16 R1 | |
| Asus ROG Zephyrus G16 2024 GU605M | |
| Alienware m16 R2 | |
| Moyenne Intel Core Ultra 7 155H (5639 - 10647, n=50) | |
| AIDA64 / FPU Mandel | |
| Lenovo Legion Slim 7 16APH8 | |
| Alienware m16 R1 Intel | |
| Alienware m16 R2 | |
| Alienware x16 R1 | |
| HP Omen Transcend 16-u1095ng | |
| Asus ROG Zephyrus G16 2024 GU605M | |
| Moyenne Intel Core Ultra 7 155H (18236 - 47685, n=50) | |
| AIDA64 / CPU AES | |
| Alienware m16 R1 Intel | |
| HP Omen Transcend 16-u1095ng | |
| Alienware m16 R2 | |
| Alienware x16 R1 | |
| Asus ROG Zephyrus G16 2024 GU605M | |
| Moyenne Intel Core Ultra 7 155H (45713 - 152179, n=50) | |
| Lenovo Legion Slim 7 16APH8 | |
| AIDA64 / CPU ZLib | |
| Alienware m16 R1 Intel | |
| HP Omen Transcend 16-u1095ng | |
| Alienware x16 R1 | |
| Alienware m16 R2 | |
| Asus ROG Zephyrus G16 2024 GU605M | |
| Lenovo Legion Slim 7 16APH8 | |
| Moyenne Intel Core Ultra 7 155H (557 - 1250, n=50) | |
| AIDA64 / FP64 Ray-Trace | |
| Lenovo Legion Slim 7 16APH8 | |
| Alienware m16 R1 Intel | |
| Alienware x16 R1 | |
| Alienware m16 R2 | |
| HP Omen Transcend 16-u1095ng | |
| Asus ROG Zephyrus G16 2024 GU605M | |
| Moyenne Intel Core Ultra 7 155H (3569 - 9802, n=50) | |
| AIDA64 / CPU PhotoWorxx | |
| Alienware x16 R1 | |
| HP Omen Transcend 16-u1095ng | |
| Asus ROG Zephyrus G16 2024 GU605M | |
| Moyenne Intel Core Ultra 7 155H (32719 - 54223, n=50) | |
| Lenovo Legion Slim 7 16APH8 | |
| Alienware m16 R2 | |
| Alienware m16 R1 Intel | |
Test de stress
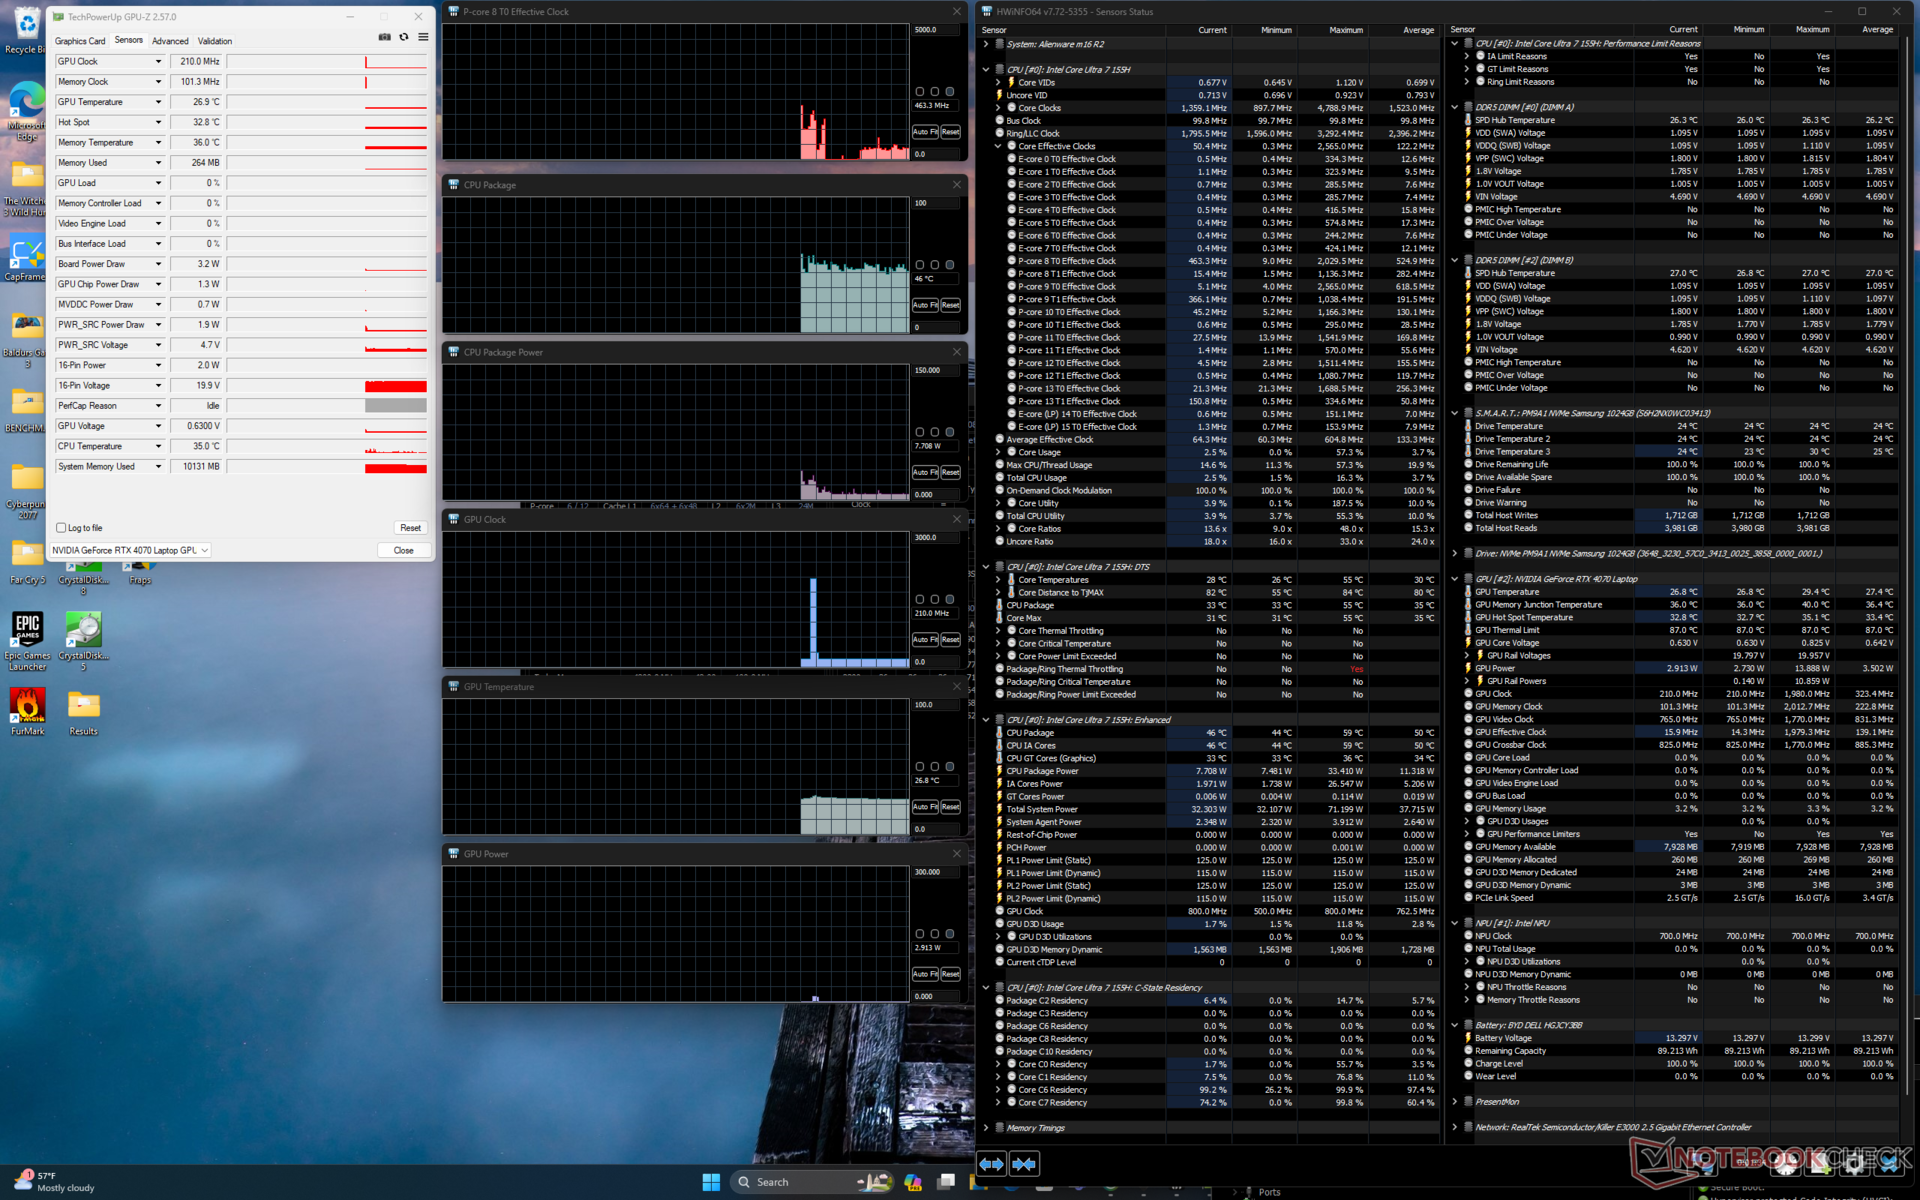
Lors de l'exécution du stress Prime95 en mode Overdrive, le CPU monte à 4,6 GHz et 115 W pendant plusieurs secondes avant de redescendre régulièrement et de se stabiliser à 3,4 GHz et 102 W. La température du cœur, cependant, est extrêmement chaude à 100 C, ce qui suggère que le CPU pousse déjà la solution de refroidissement à ses limites.
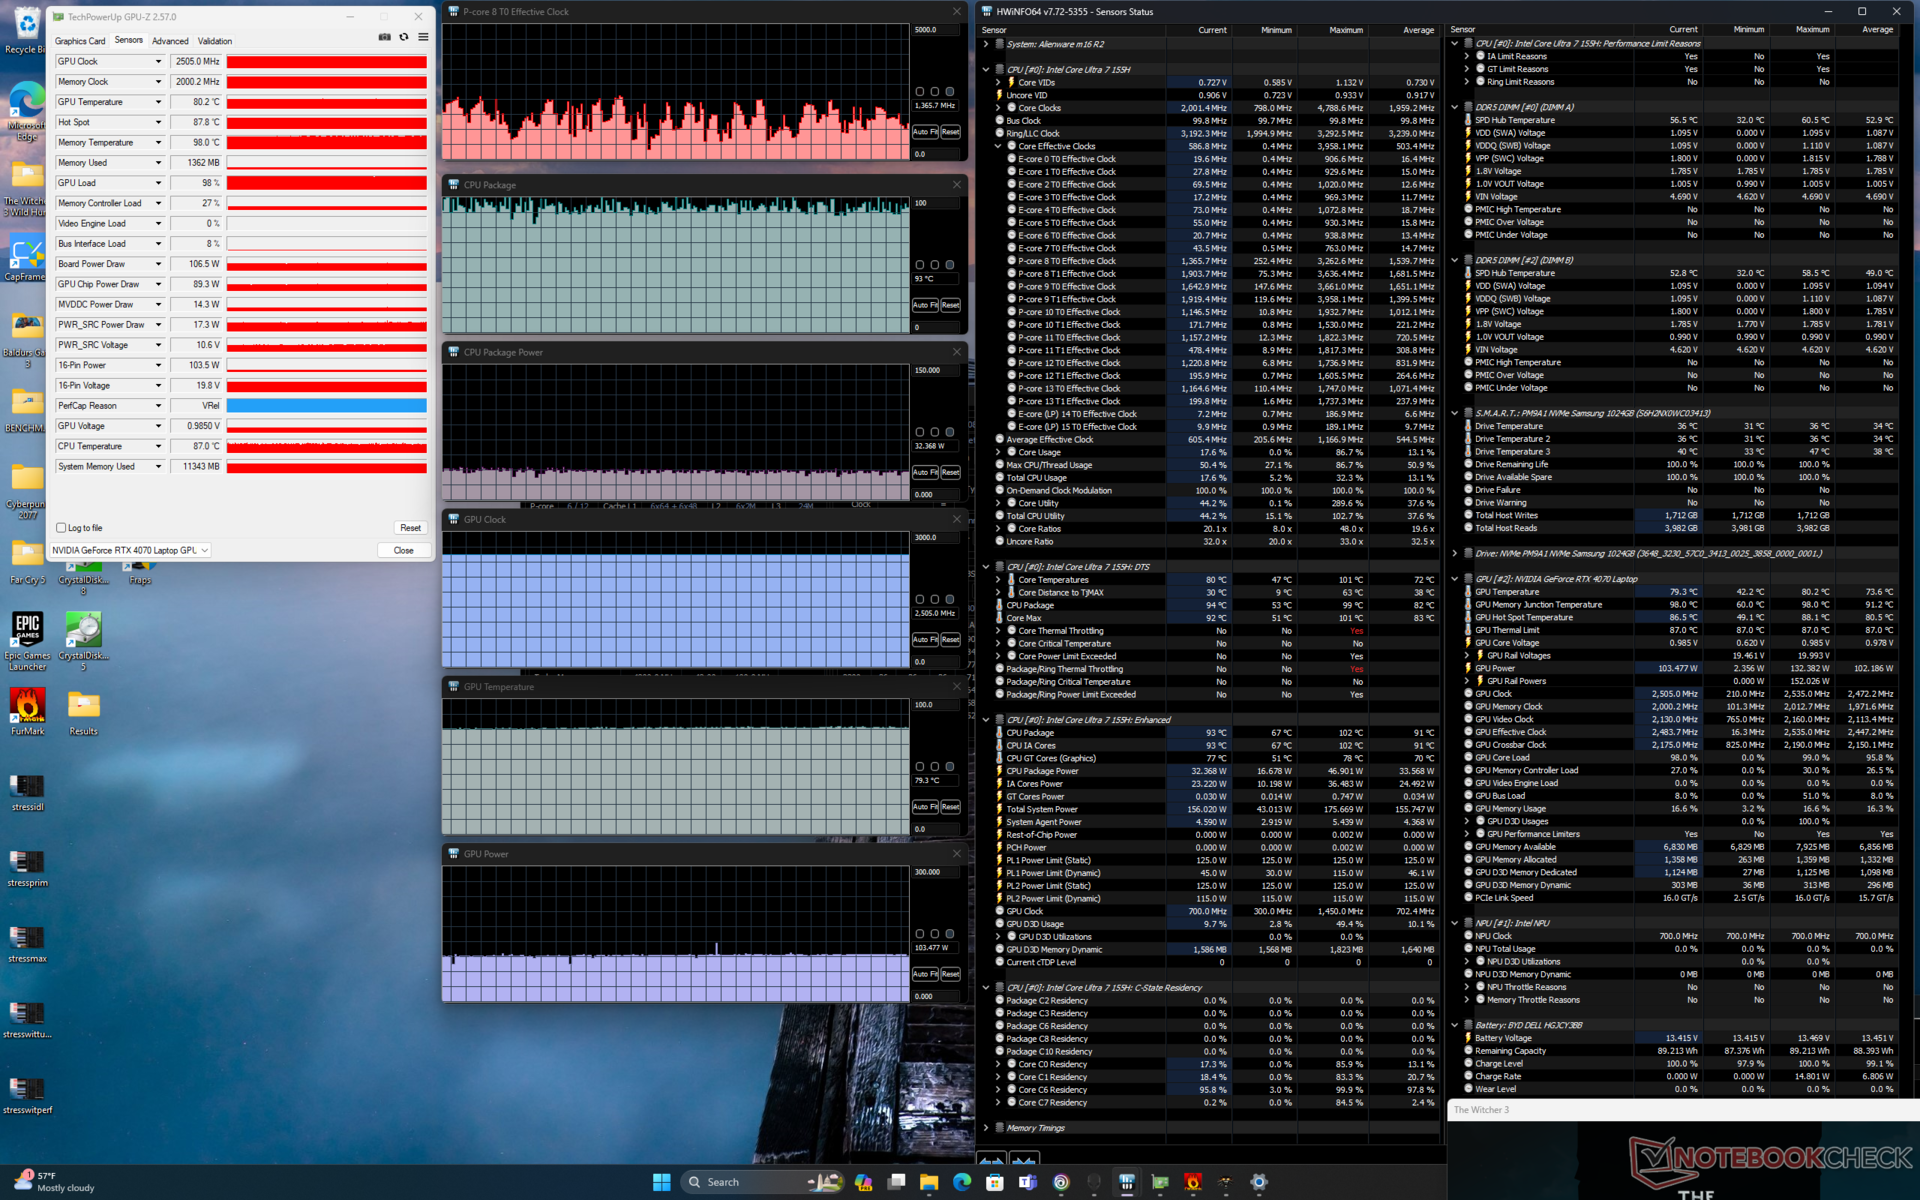
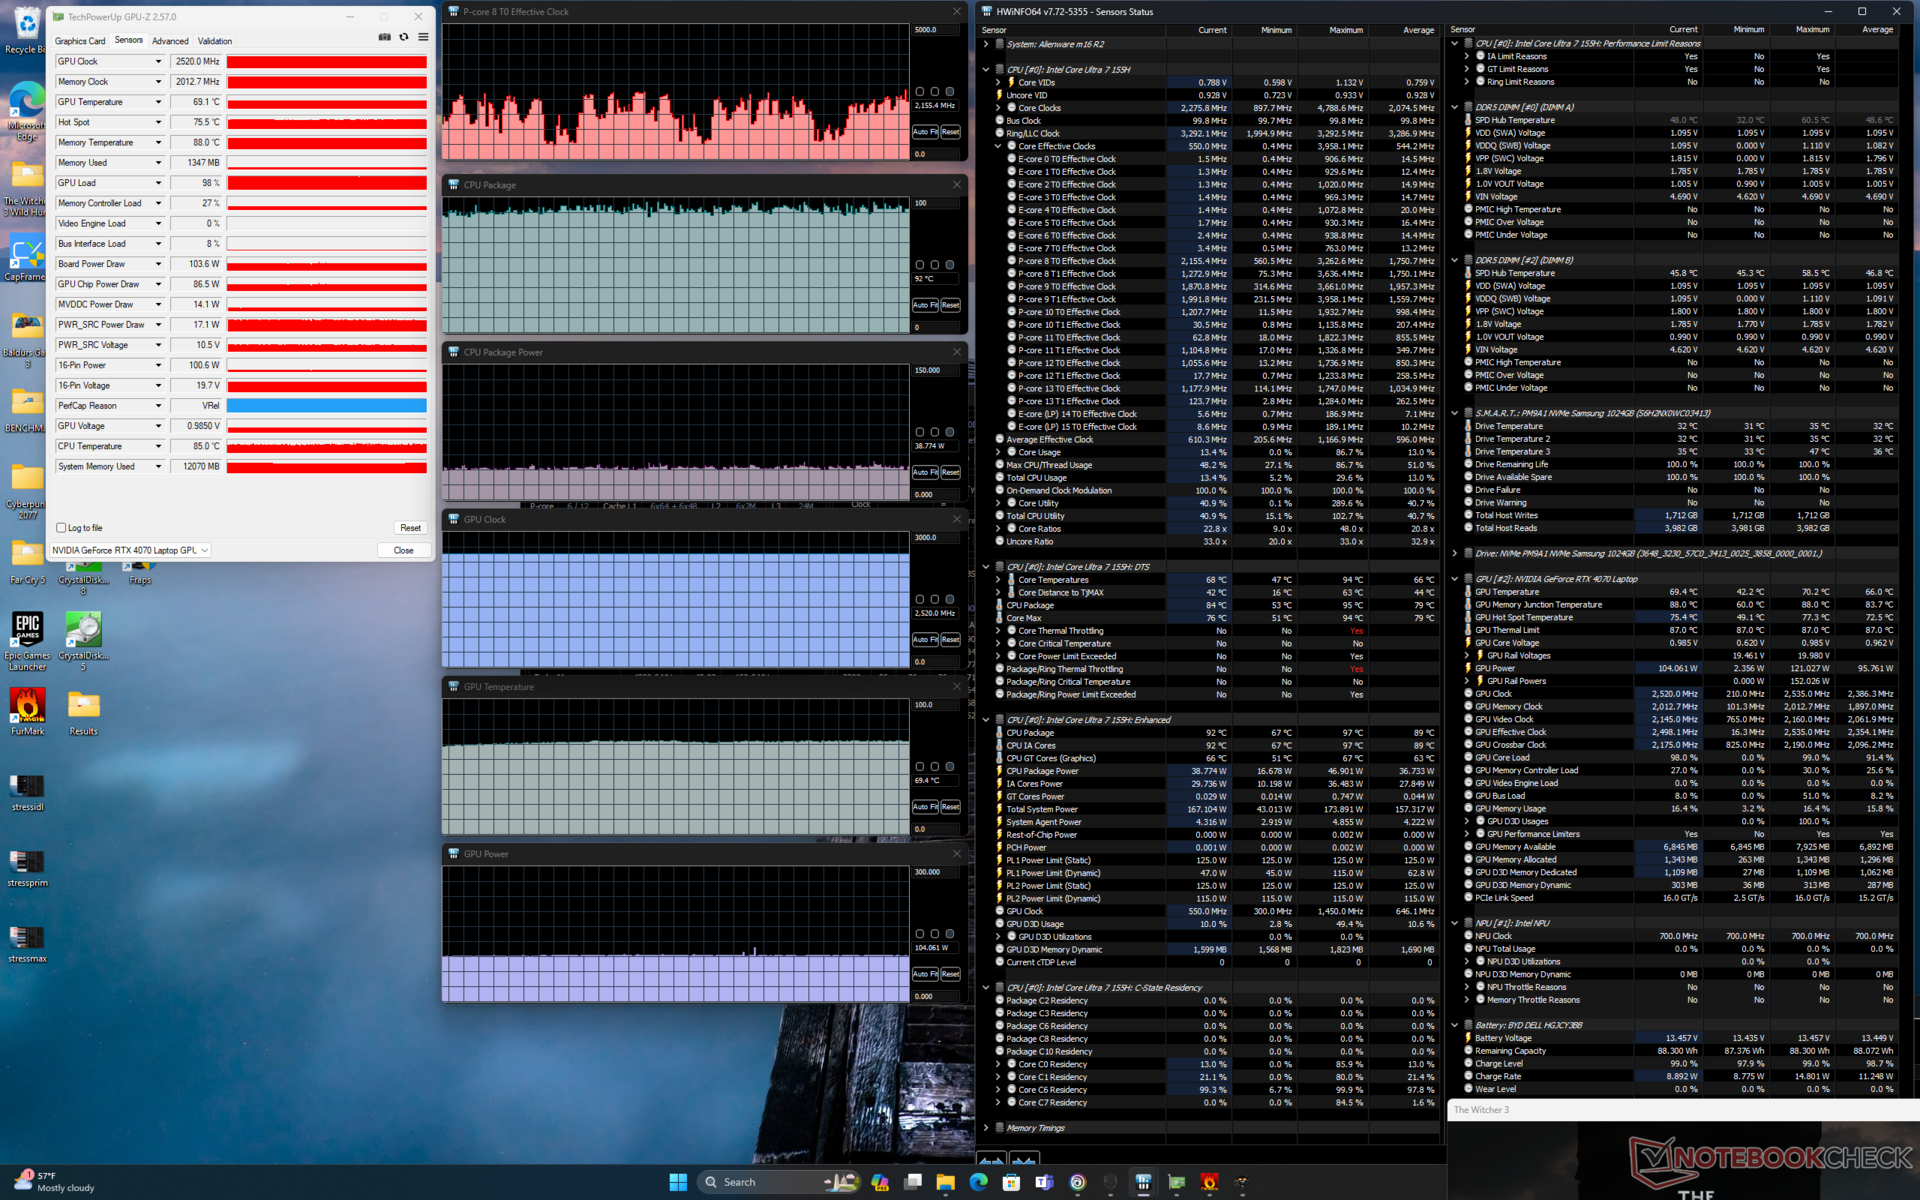
Il est intéressant de noter qu'il n'y a pratiquement aucun changement dans les fréquences d'horloge du GPU ou dans la consommation d'énergie de la carte lorsqu'elle fonctionne en mode équilibré, performance ou overdose Witcher 3 en mode équilibré, performance ou overdrive, ce qui correspond à nos conclusions ci-dessous dans la section sur les performances du GPU. Au contraire, la température du GPU a tendance à diminuer en mode Performance ou Overdrive en raison des plafonds de ventilateur plus élevés dans ces modes. En d'autres termes, les fréquences d'horloge et le TGP en temps réel restent constants alors que le bruit du ventilateur change. Les performances du processeur peuvent varier légèrement d'un mode à l'autre, mais la plupart des jeux ne sont pas contraignants pour le processeur.
Il est intéressant de noter que si le GPU est évalué à 140 W TGP selon le panneau de contrôle Nvidia, il a tendance à se stabiliser à 106 W lors des jeux. Nous avons pu atteindre un maximum temporaire de 121 W.
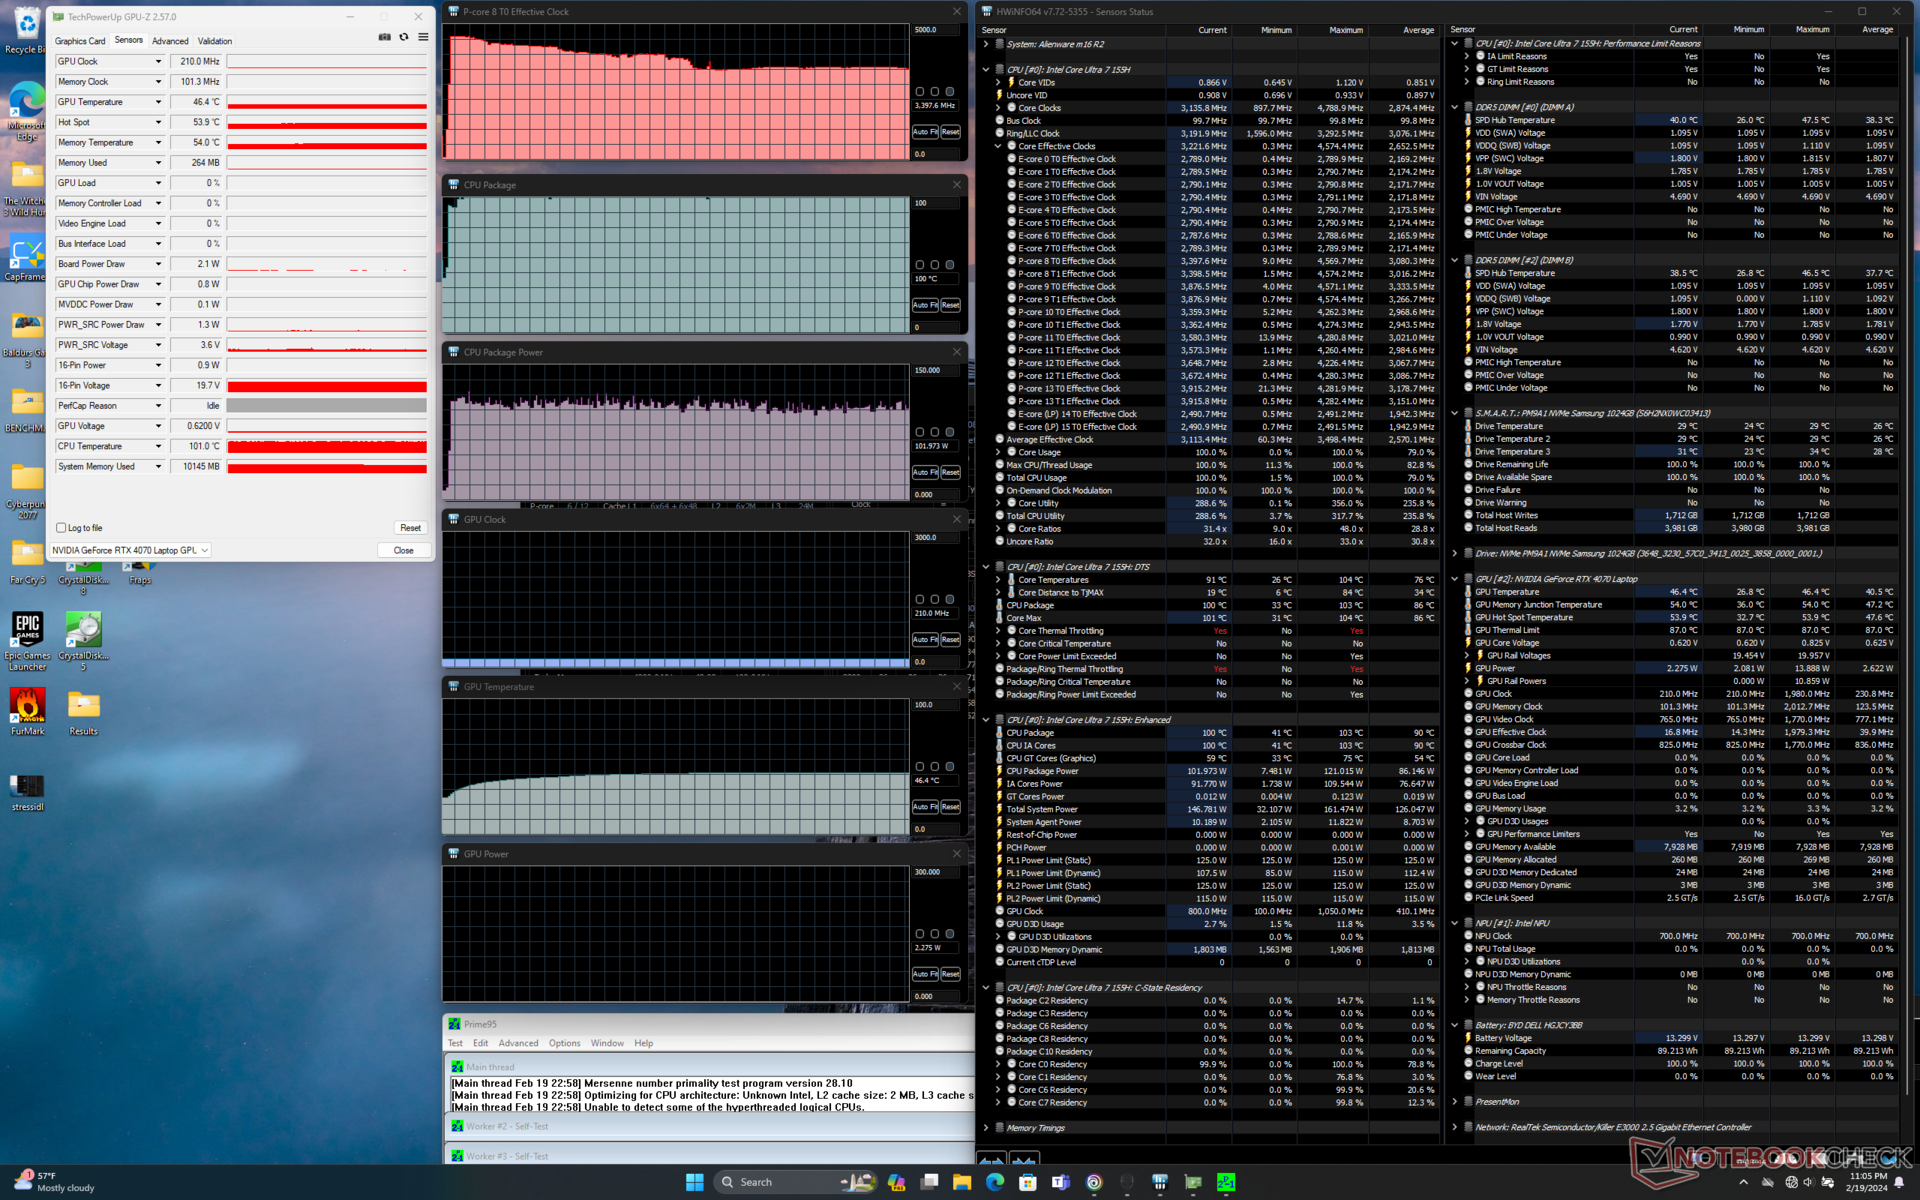
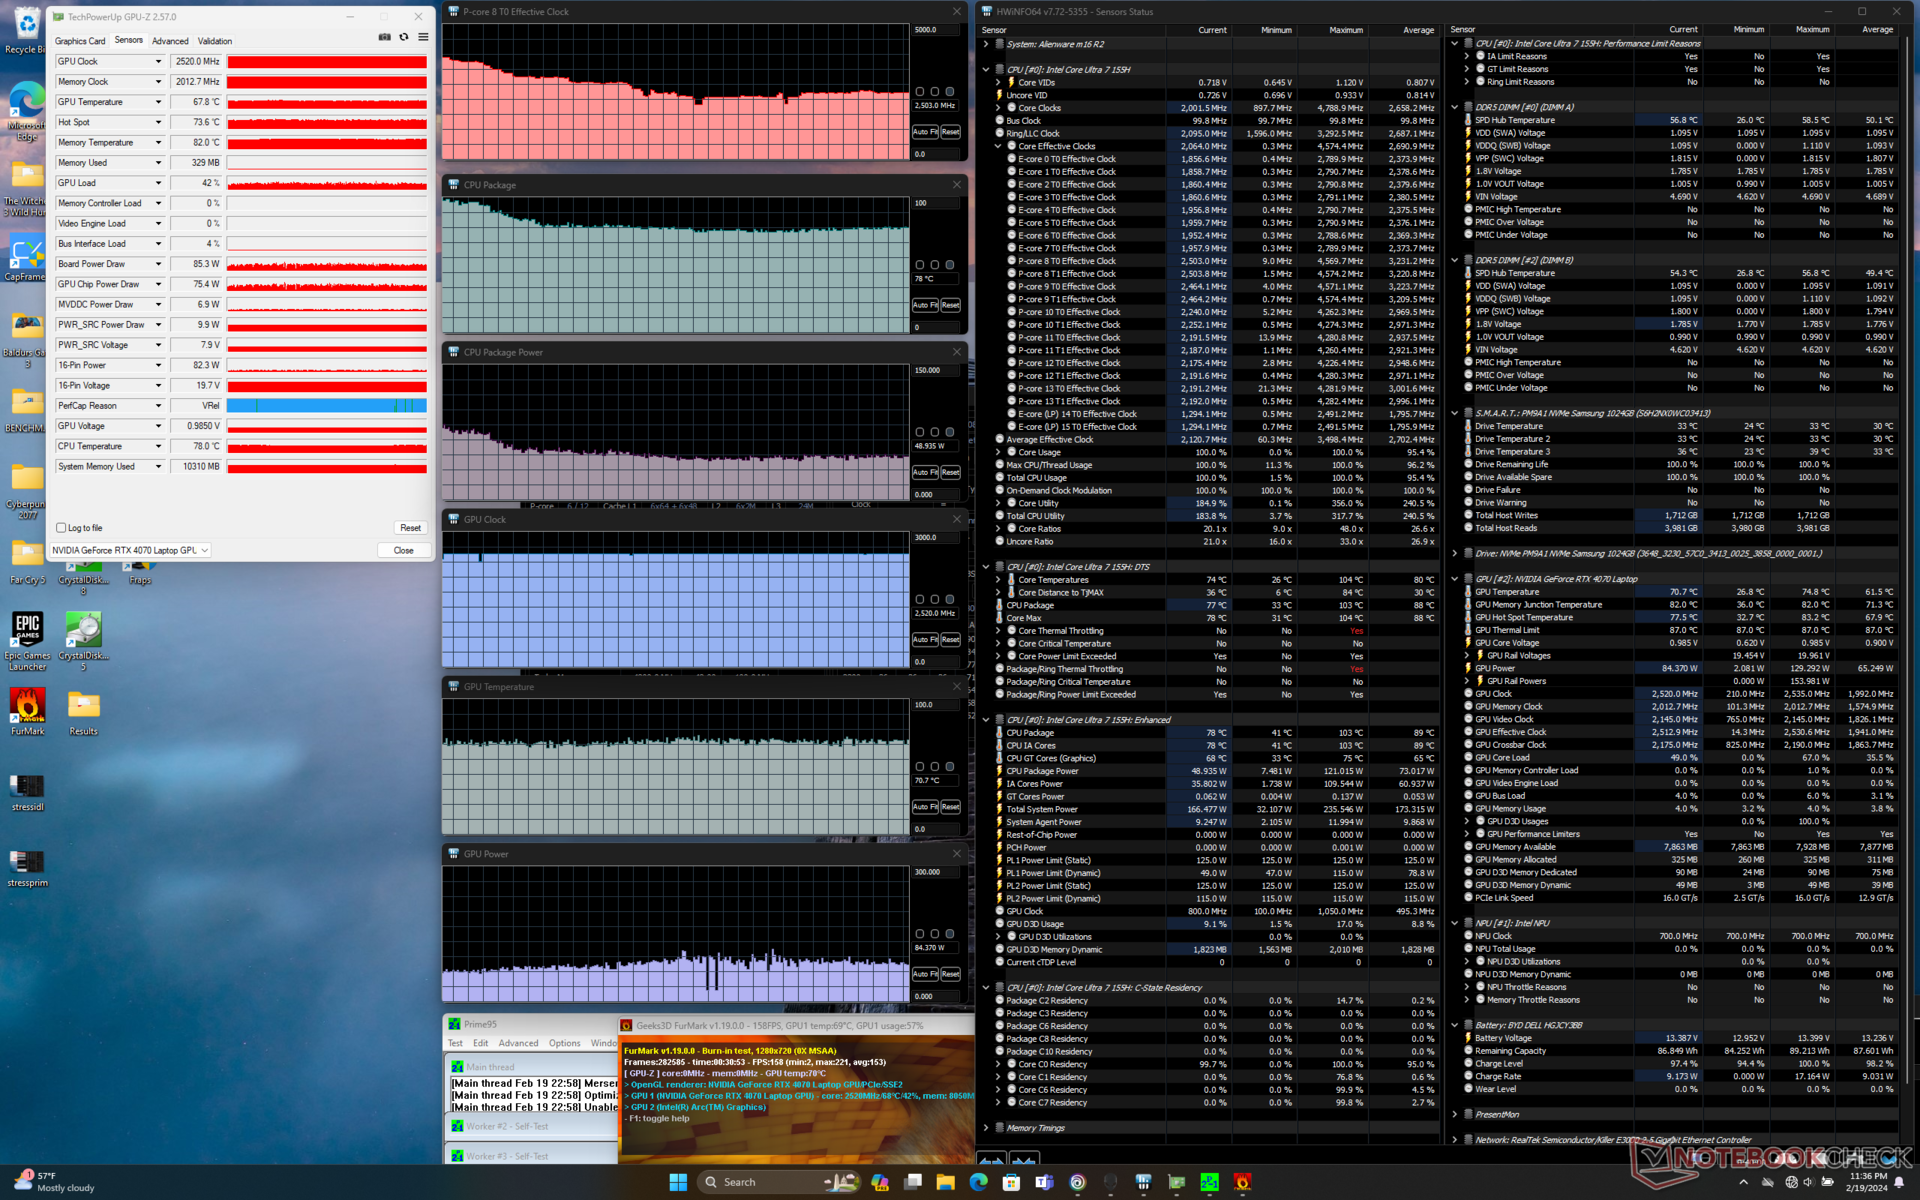

| Horloge du CPU (GHz) | Horloge du GPU (MHz) | Température moyenne du CPU (°C) | Température moyenne du GPU (°C) | |
| Système au repos | -- | -- | 46 | 27 |
| Prime95 Stress | 3.4 | -- | 100 | 47 |
| Prime95 + FurMark Stress | 2.5 | 2520 | 78 | 71 |
| Witcher 3 Stress(mode équilibré) | ~1.8 | 2502 | 93 | 80 |
| Witcher 3 Stress (mode Performance) | ~1.8 | 2520 | 91 | 77 |
| Witcher 3 Stress (mode Overdrive) | ~2.0 | 2520 | 92 | 69 |
Performance du système
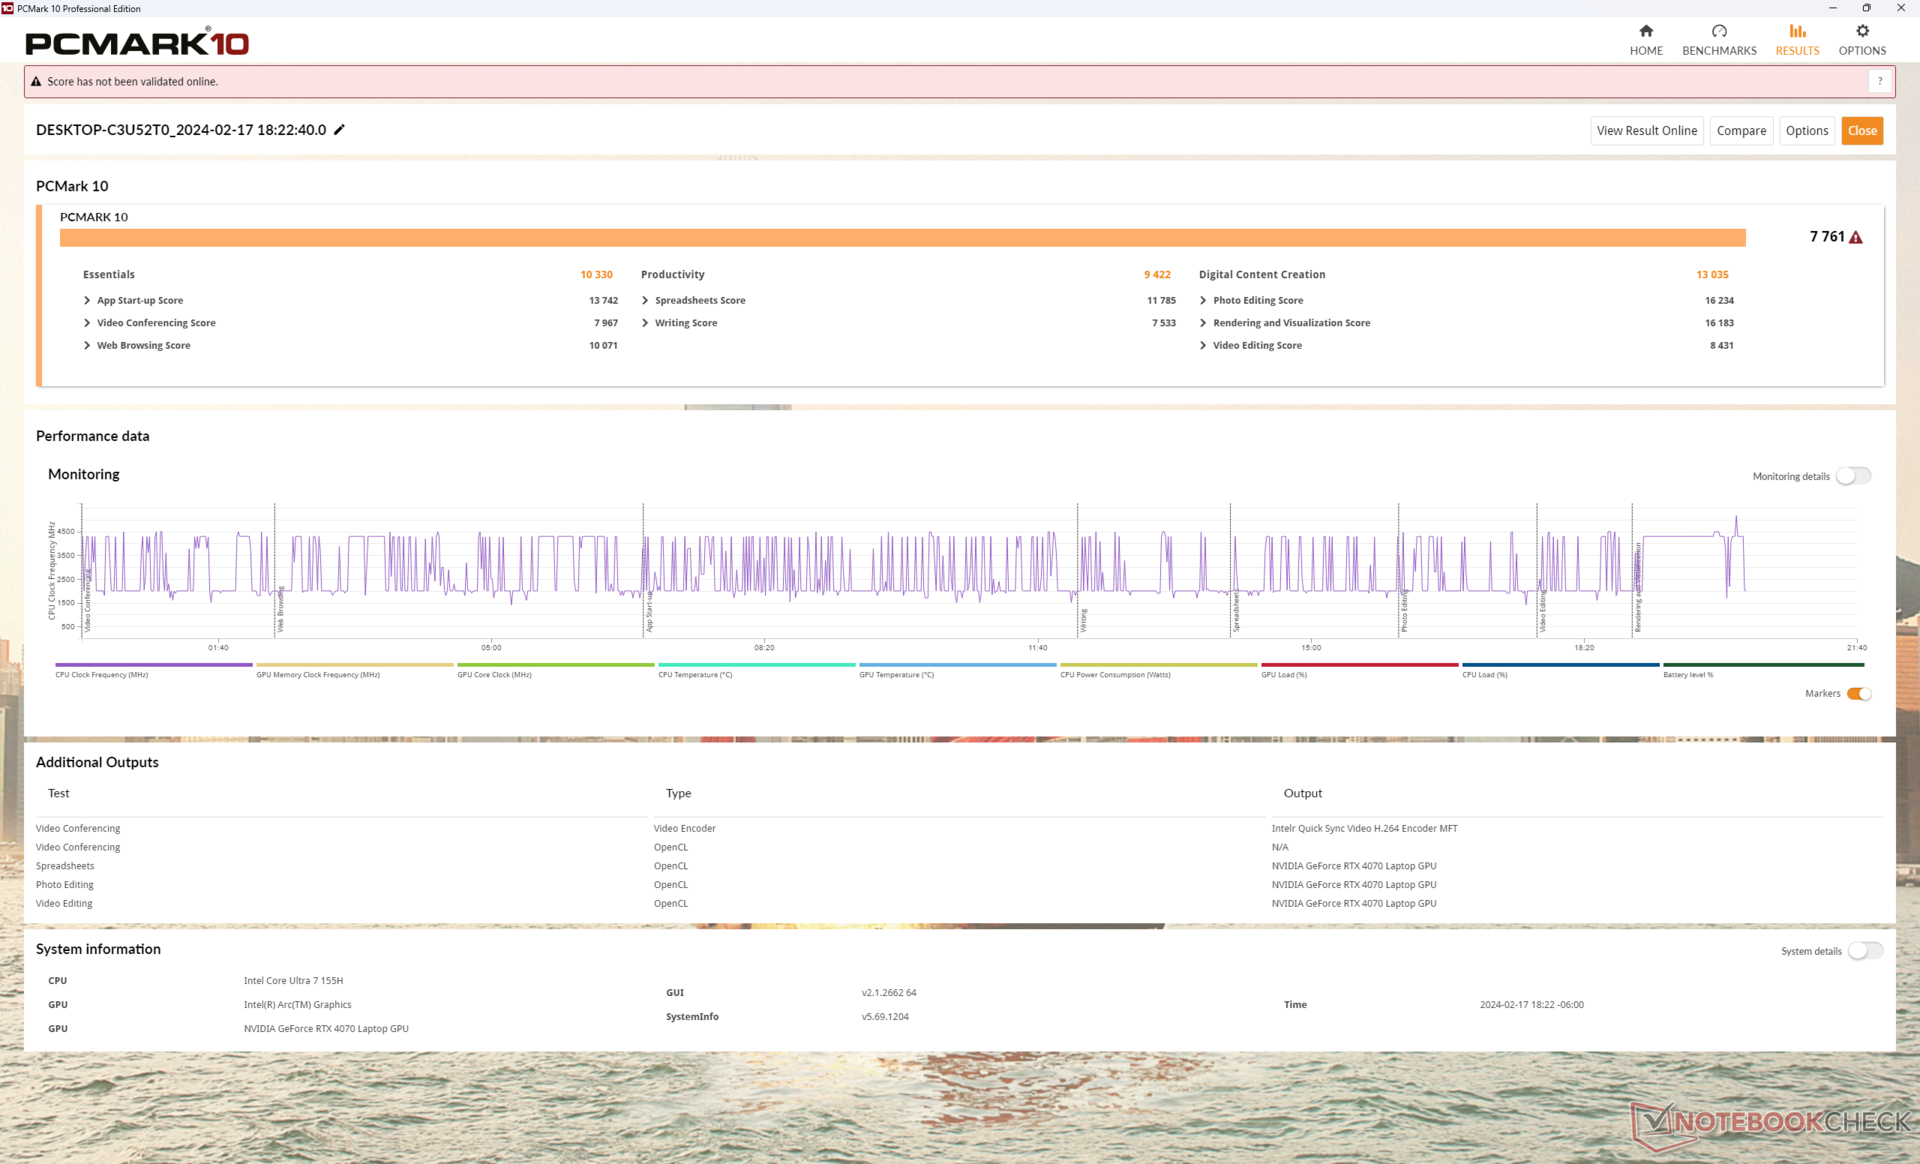
Les résultats de PCMark 10 sont comparables à ceux du m16 R1, à l'exception de notre score inférieur au sous-test de création de contenu numérique, car le m16 R2 est équipé de la RTX 4070, plus lente. Les performances du système sont par ailleurs très similaires et ne montrent pas de gains significatifs dans la plupart des charges quotidiennes malgré la nouvelle génération de CPU.
CrossMark: Overall | Productivity | Creativity | Responsiveness
WebXPRT 3: Overall
WebXPRT 4: Overall
Mozilla Kraken 1.1: Total
| PCMark 10 / Score | |
| Alienware x16 R1 | |
| HP Omen Transcend 16-u1095ng | |
| Alienware m16 R2 | |
| Lenovo Legion Slim 7 16APH8 | |
| Moyenne Intel Core Ultra 7 155H, NVIDIA GeForce RTX 4070 Laptop GPU (7084 - 7761, n=4) | |
| Alienware m16 R1 Intel | |
| Asus ROG Zephyrus G16 2024 GU605M | |
| PCMark 10 / Essentials | |
| Alienware x16 R1 | |
| Alienware m16 R1 Intel | |
| HP Omen Transcend 16-u1095ng | |
| Lenovo Legion Slim 7 16APH8 | |
| Alienware m16 R2 | |
| Moyenne Intel Core Ultra 7 155H, NVIDIA GeForce RTX 4070 Laptop GPU (10038 - 10393, n=4) | |
| Asus ROG Zephyrus G16 2024 GU605M | |
| PCMark 10 / Productivity | |
| HP Omen Transcend 16-u1095ng | |
| Alienware x16 R1 | |
| Lenovo Legion Slim 7 16APH8 | |
| Alienware m16 R1 Intel | |
| Alienware m16 R2 | |
| Moyenne Intel Core Ultra 7 155H, NVIDIA GeForce RTX 4070 Laptop GPU (9192 - 9518, n=4) | |
| Asus ROG Zephyrus G16 2024 GU605M | |
| PCMark 10 / Digital Content Creation | |
| Alienware x16 R1 | |
| Alienware m16 R2 | |
| HP Omen Transcend 16-u1095ng | |
| Moyenne Intel Core Ultra 7 155H, NVIDIA GeForce RTX 4070 Laptop GPU (10100 - 13035, n=4) | |
| Lenovo Legion Slim 7 16APH8 | |
| Asus ROG Zephyrus G16 2024 GU605M | |
| Alienware m16 R1 Intel | |
| CrossMark / Overall | |
| Alienware m16 R1 Intel | |
| Alienware x16 R1 | |
| Alienware m16 R2 | |
| Moyenne Intel Core Ultra 7 155H, NVIDIA GeForce RTX 4070 Laptop GPU (1687 - 1848, n=4) | |
| Asus ROG Zephyrus G16 2024 GU605M | |
| CrossMark / Productivity | |
| Alienware m16 R1 Intel | |
| Alienware x16 R1 | |
| Alienware m16 R2 | |
| Moyenne Intel Core Ultra 7 155H, NVIDIA GeForce RTX 4070 Laptop GPU (1589 - 1750, n=4) | |
| Asus ROG Zephyrus G16 2024 GU605M | |
| CrossMark / Creativity | |
| Alienware m16 R1 Intel | |
| Alienware x16 R1 | |
| Asus ROG Zephyrus G16 2024 GU605M | |
| Moyenne Intel Core Ultra 7 155H, NVIDIA GeForce RTX 4070 Laptop GPU (1860 - 2014, n=4) | |
| Alienware m16 R2 | |
| CrossMark / Responsiveness | |
| Alienware x16 R1 | |
| Alienware m16 R1 Intel | |
| Alienware m16 R2 | |
| Moyenne Intel Core Ultra 7 155H, NVIDIA GeForce RTX 4070 Laptop GPU (1424 - 1683, n=4) | |
| Asus ROG Zephyrus G16 2024 GU605M | |
| WebXPRT 3 / Overall | |
| HP Omen Transcend 16-u1095ng | |
| Alienware m16 R1 Intel | |
| Alienware x16 R1 | |
| Alienware m16 R2 | |
| Asus ROG Zephyrus G16 2024 GU605M | |
| Moyenne Intel Core Ultra 7 155H, NVIDIA GeForce RTX 4070 Laptop GPU (264 - 294, n=4) | |
| WebXPRT 4 / Overall | |
| Alienware m16 R1 Intel | |
| Alienware x16 R1 | |
| Alienware m16 R2 | |
| Asus ROG Zephyrus G16 2024 GU605M | |
| Moyenne Intel Core Ultra 7 155H, NVIDIA GeForce RTX 4070 Laptop GPU (247 - 257, n=4) | |
| Mozilla Kraken 1.1 / Total | |
| Moyenne Intel Core Ultra 7 155H, NVIDIA GeForce RTX 4070 Laptop GPU (546 - 568, n=3) | |
| Asus ROG Zephyrus G16 2024 GU605M | |
| Alienware m16 R2 | |
| Alienware m16 R1 Intel | |
| Alienware x16 R1 | |
| HP Omen Transcend 16-u1095ng | |
* ... Moindre est la valeur, meilleures sont les performances
| PCMark 10 Score | 7761 points | |
Aide | ||
| AIDA64 / Memory Copy | |
| Asus ROG Zephyrus G16 2024 GU605M | |
| Moyenne Intel Core Ultra 7 155H (62397 - 96791, n=50) | |
| HP Omen Transcend 16-u1095ng | |
| Alienware x16 R1 | |
| Lenovo Legion Slim 7 16APH8 | |
| Alienware m16 R2 | |
| Alienware m16 R1 Intel | |
| AIDA64 / Memory Read | |
| Asus ROG Zephyrus G16 2024 GU605M | |
| HP Omen Transcend 16-u1095ng | |
| Moyenne Intel Core Ultra 7 155H (60544 - 90647, n=50) | |
| Alienware m16 R2 | |
| Alienware x16 R1 | |
| Alienware m16 R1 Intel | |
| Lenovo Legion Slim 7 16APH8 | |
| AIDA64 / Memory Write | |
| Lenovo Legion Slim 7 16APH8 | |
| Alienware x16 R1 | |
| HP Omen Transcend 16-u1095ng | |
| Asus ROG Zephyrus G16 2024 GU605M | |
| Moyenne Intel Core Ultra 7 155H (58692 - 93451, n=50) | |
| Alienware m16 R2 | |
| Alienware m16 R1 Intel | |
| AIDA64 / Memory Latency | |
| Moyenne Intel Core Ultra 7 155H (116.2 - 233, n=50) | |
| Asus ROG Zephyrus G16 2024 GU605M | |
| Alienware m16 R2 | |
| Alienware x16 R1 | |
| Lenovo Legion Slim 7 16APH8 | |
| Alienware m16 R1 Intel | |
| HP Omen Transcend 16-u1095ng | |
* ... Moindre est la valeur, meilleures sont les performances
Latence DPC
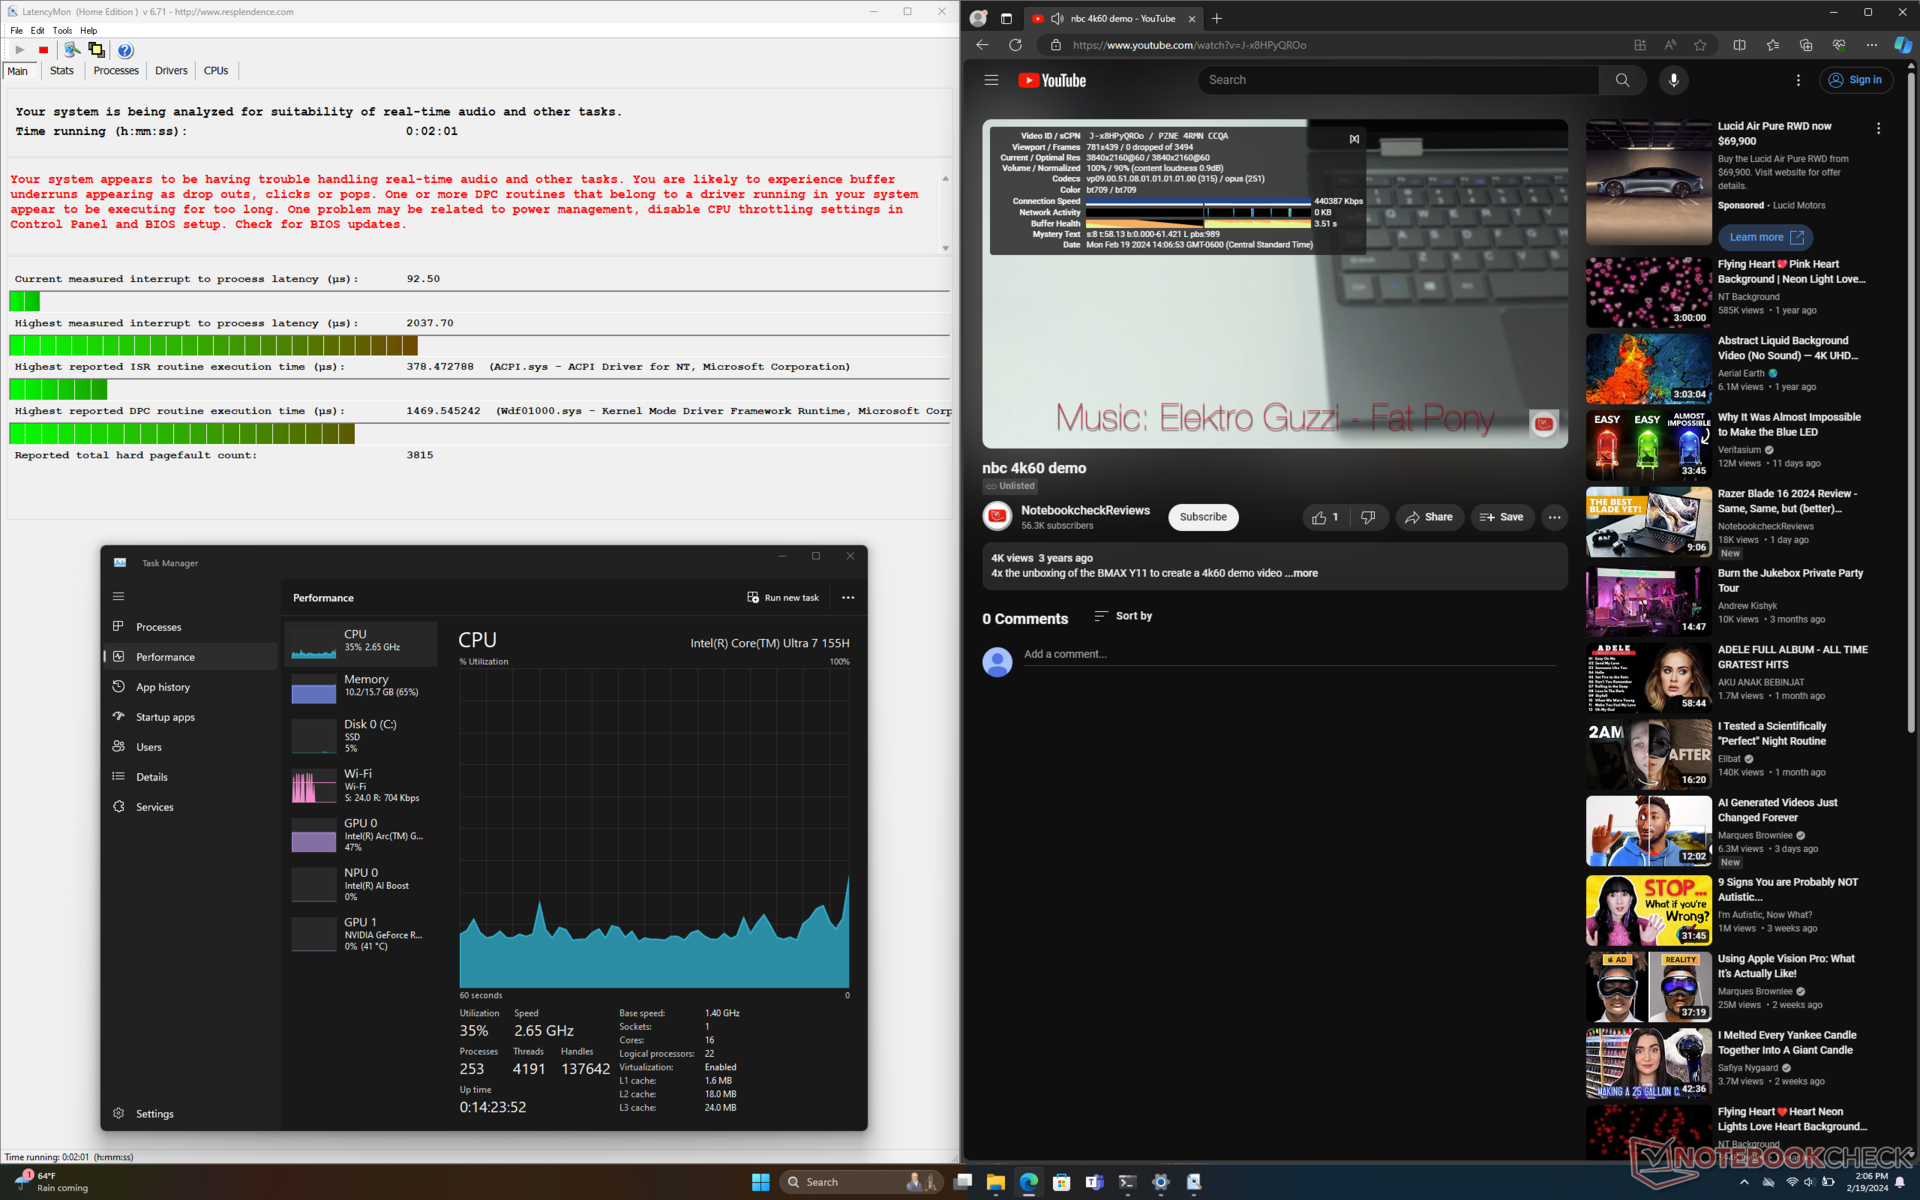
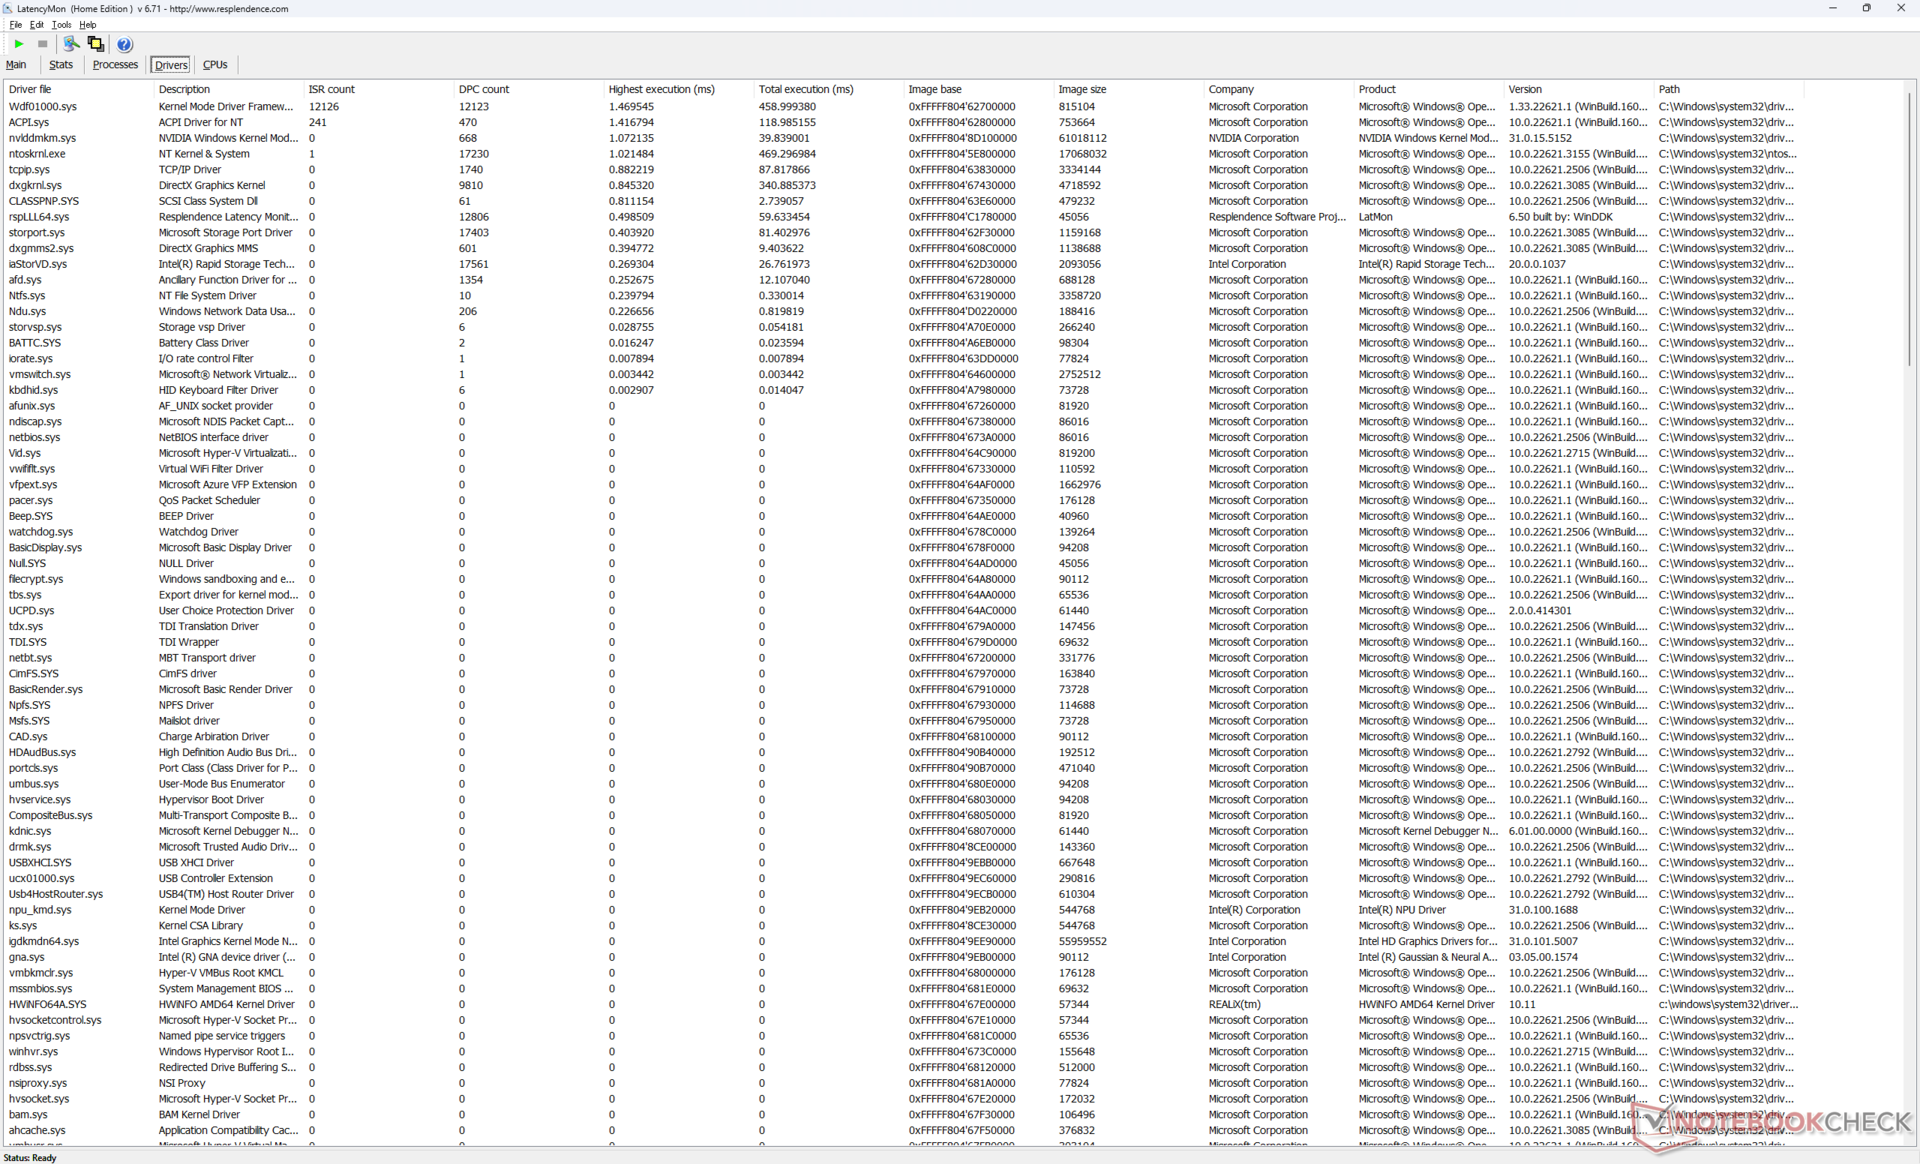
LatencyMon révèle des problèmes de DPC lors de l'ouverture de plusieurs onglets de notre page d'accueil. la lecture de vidéos 4K à 60 FPS est par ailleurs parfaite, sans aucune perte d'images.
| DPC Latencies / LatencyMon - interrupt to process latency (max), Web, Youtube, Prime95 | |
| Alienware m16 R1 Intel | |
| Asus ROG Zephyrus G16 2024 GU605M | |
| Alienware m16 R2 | |
| HP Omen Transcend 16-u1095ng | |
| Alienware x16 R1 | |
| Lenovo Legion Slim 7 16APH8 | |
* ... Moindre est la valeur, meilleures sont les performances
Dispositifs de stockage
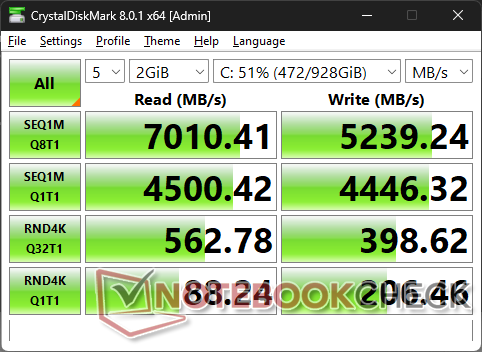
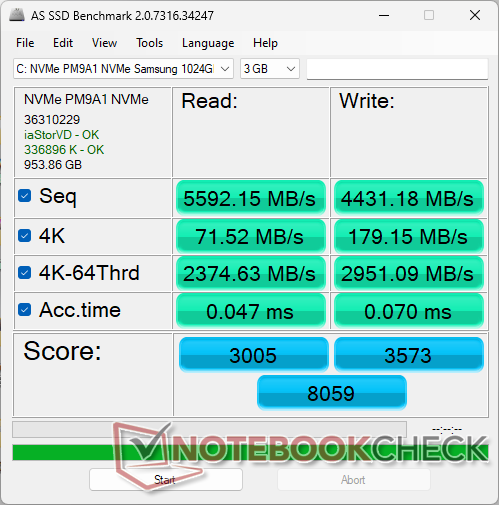
Notre appareil est livré avec le Samsung PM9A1 PCIe4 x4 NVMe SSD au lieu du Kioxia sur le m16 R1 de l'année dernière. Le disque ne devrait pas avoir de problème à maintenir son taux de transfert maximal de 7000 Mo/s sur des périodes prolongées. Un répartiteur de chaleur est inclus pour chacun des deux emplacements M.2 2280.

| Drive Performance rating - Percent | |
| Alienware x16 R1 | |
| Alienware m16 R2 | |
| Alienware m16 R1 Intel | |
| Lenovo Legion Slim 7 16APH8 | |
| HP Omen Transcend 16-u1095ng | |
| Asus ROG Zephyrus G16 2024 GU605M | |
* ... Moindre est la valeur, meilleures sont les performances
Disk Throttling: DiskSpd Read Loop, Queue Depth 8
Performance du GPU
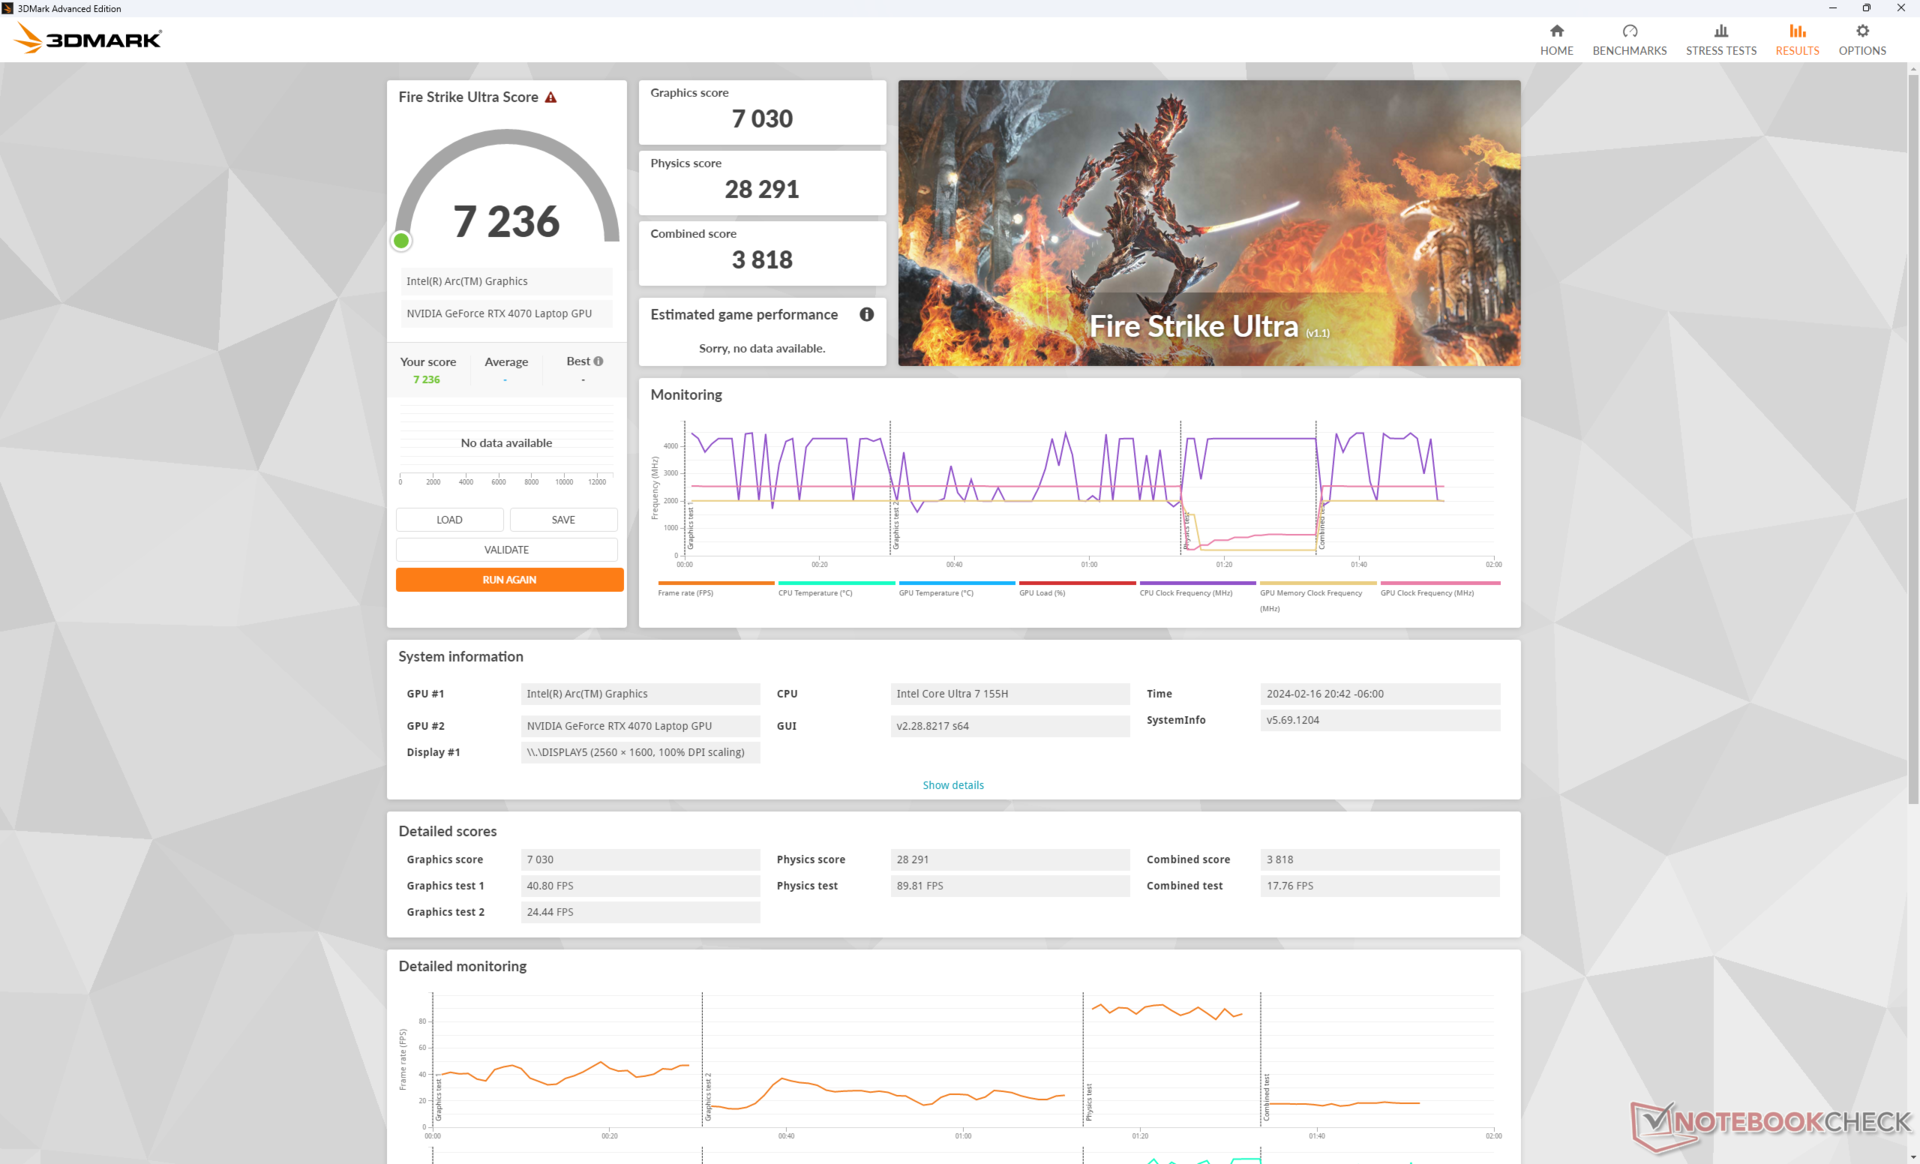
Les performances graphiques de notre ordinateur 140 W GeForce RTX 4070 sont environ 10 % plus rapides que la moyenne des ordinateurs portables de notre base de données équipés du même GPU. Bien qu'il s'agisse d'un déclassement par rapport au m16 R1 de 30 à 45 % en raison de l'absence d'options RTX 4080 ou 4090 , il est au moins bon de voir que la RTX 4070 est plus performante que prévu. Les utilisateurs qui veulent la RTX 4080 ou 4090 devront se tourner vers l'ancienne m16 R1 ou la série Alienware x16, plus chère.
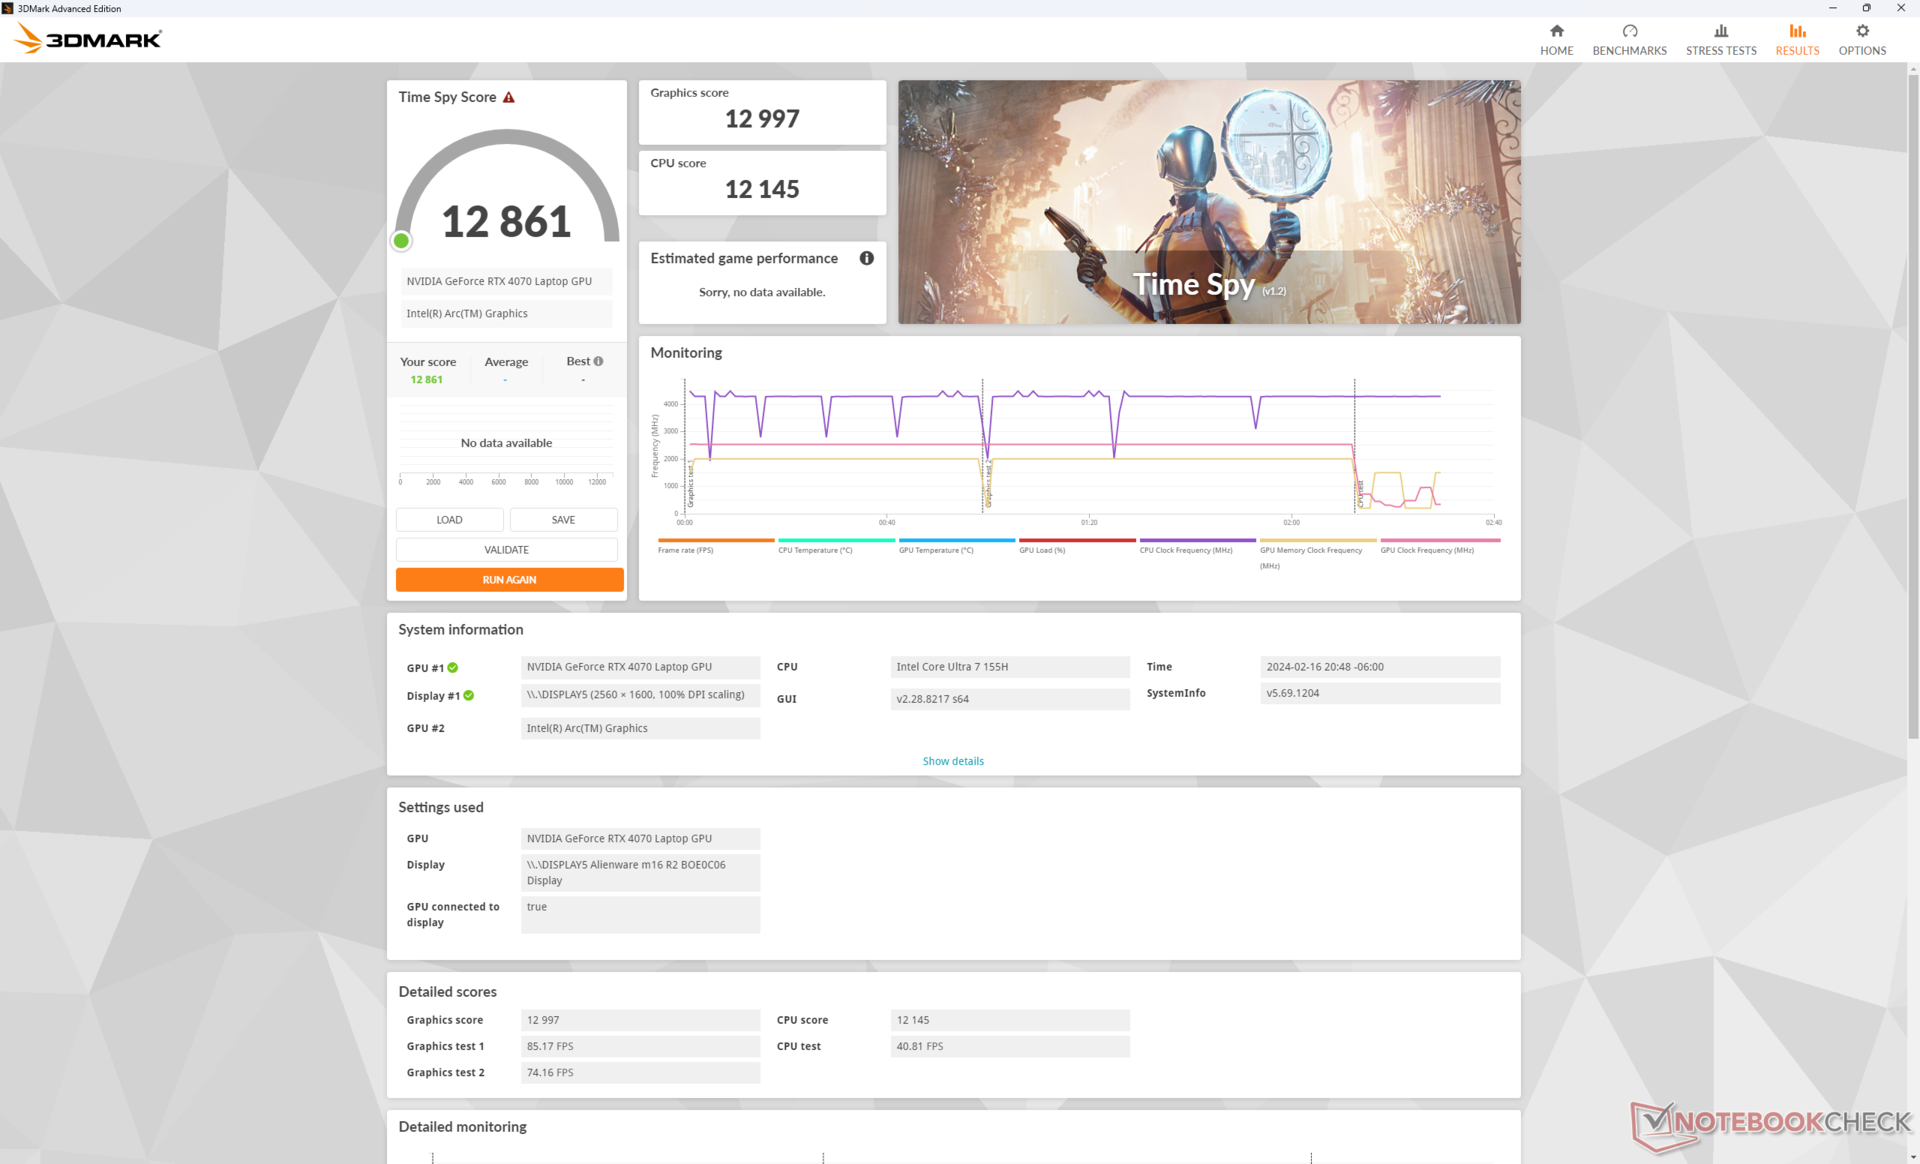
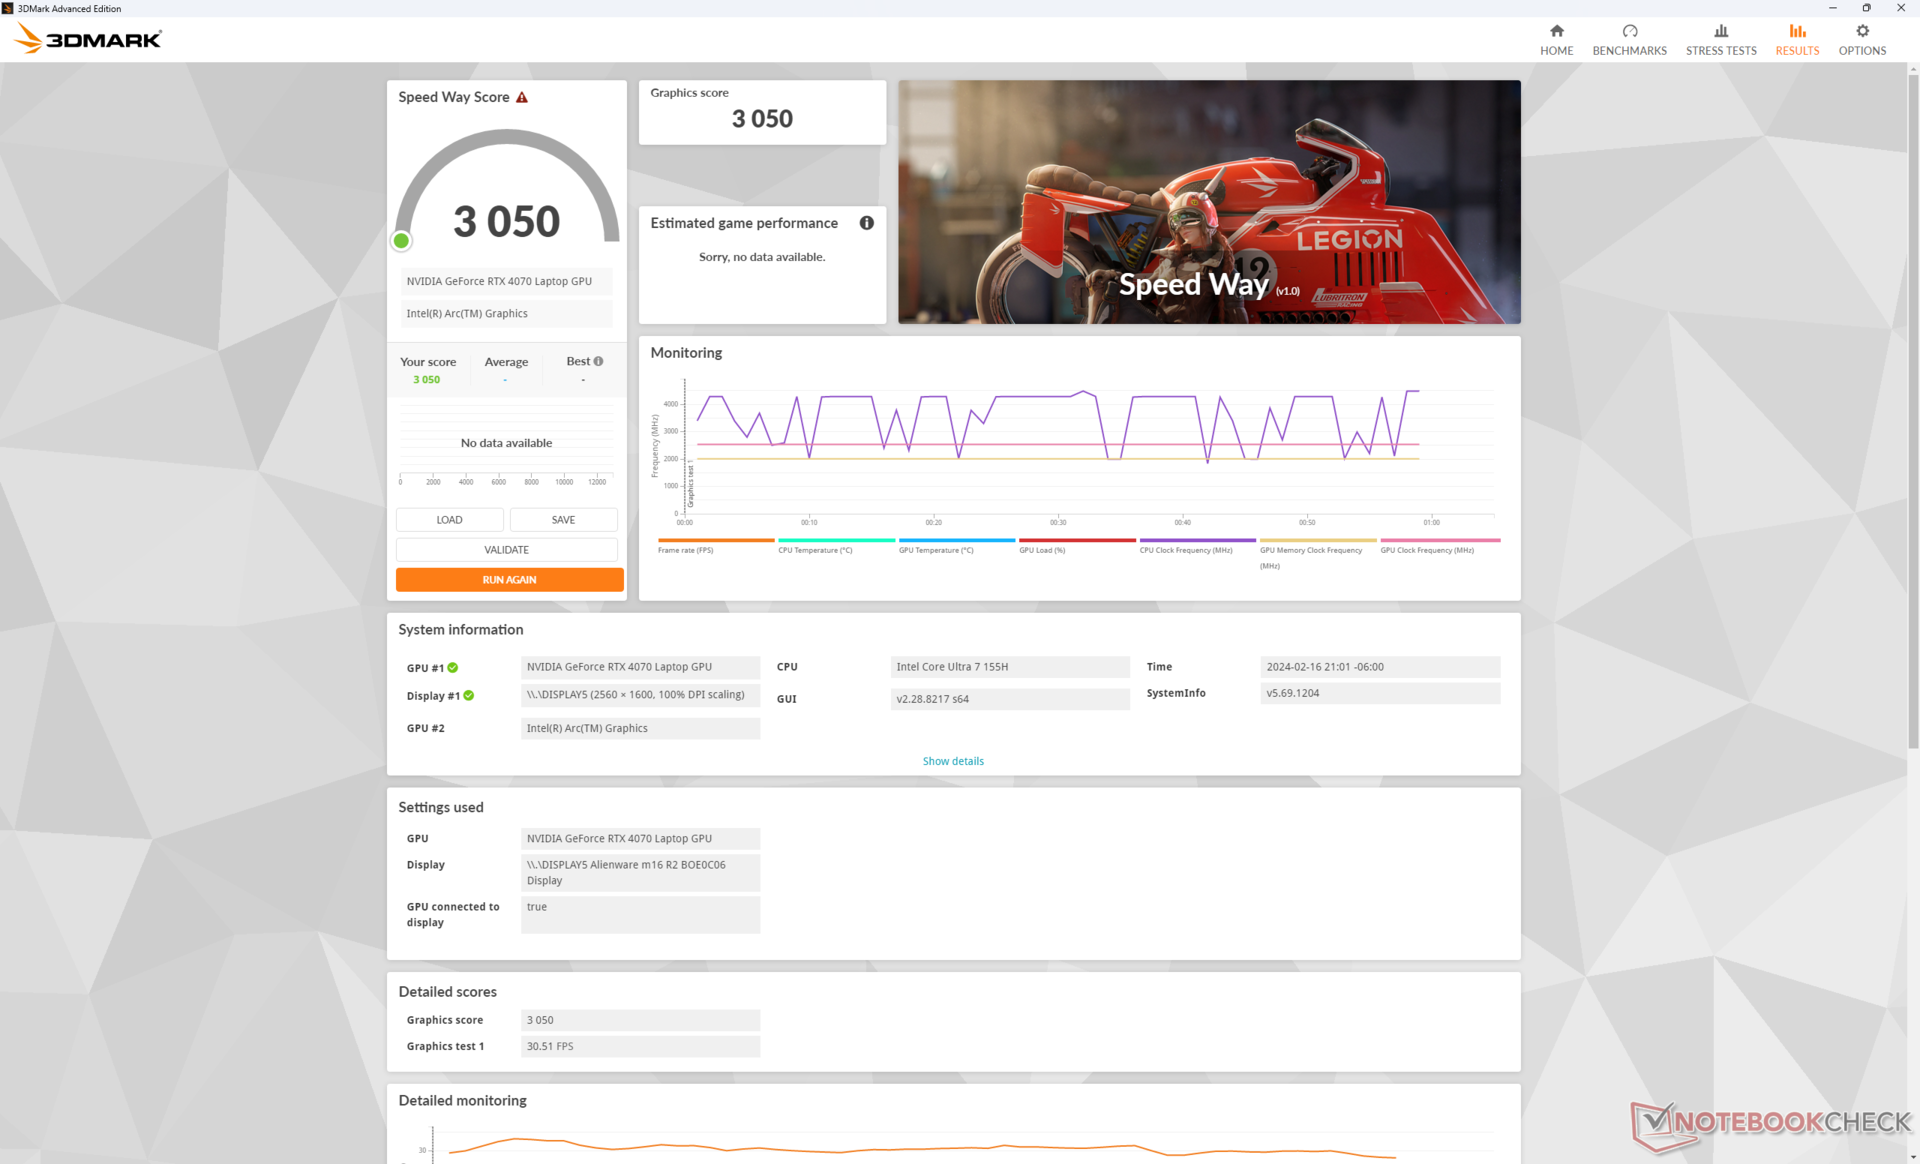
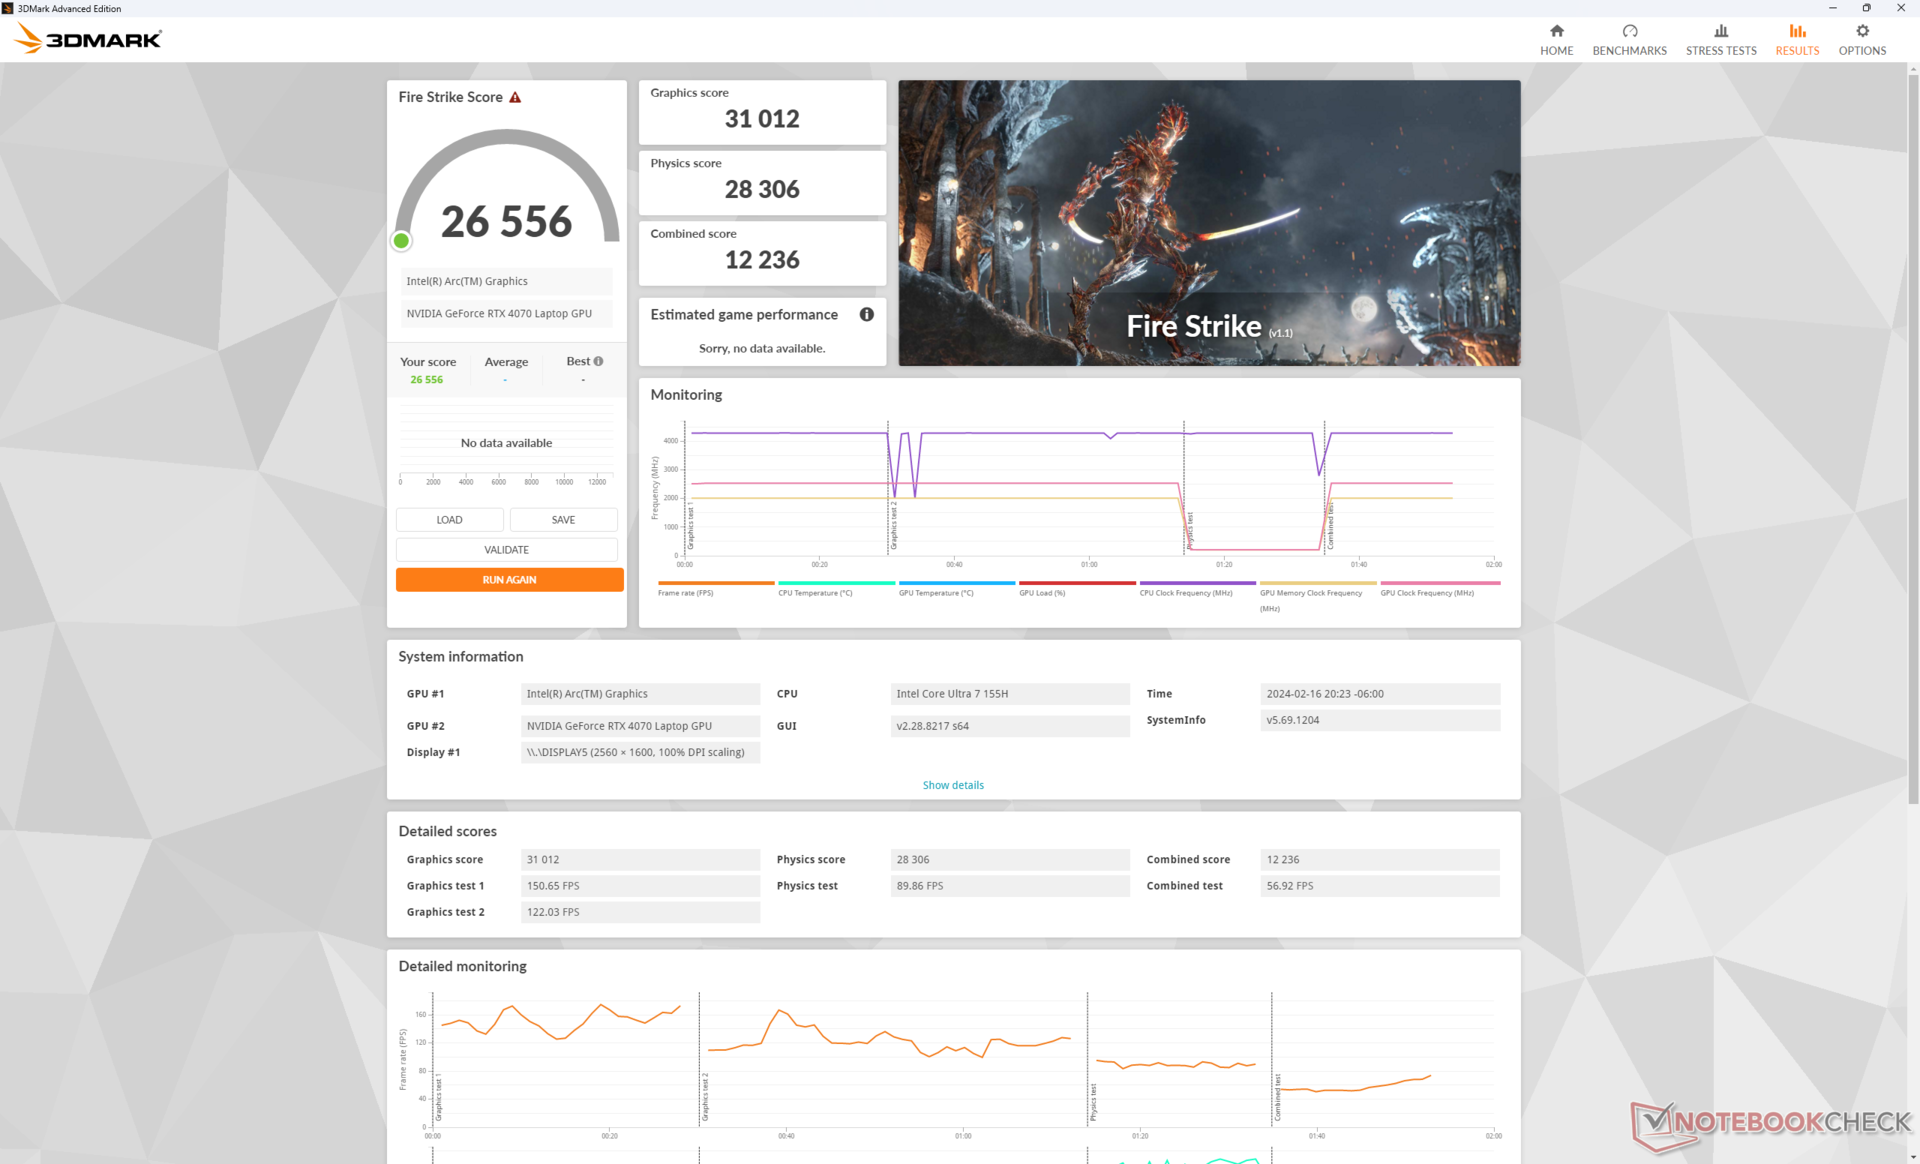
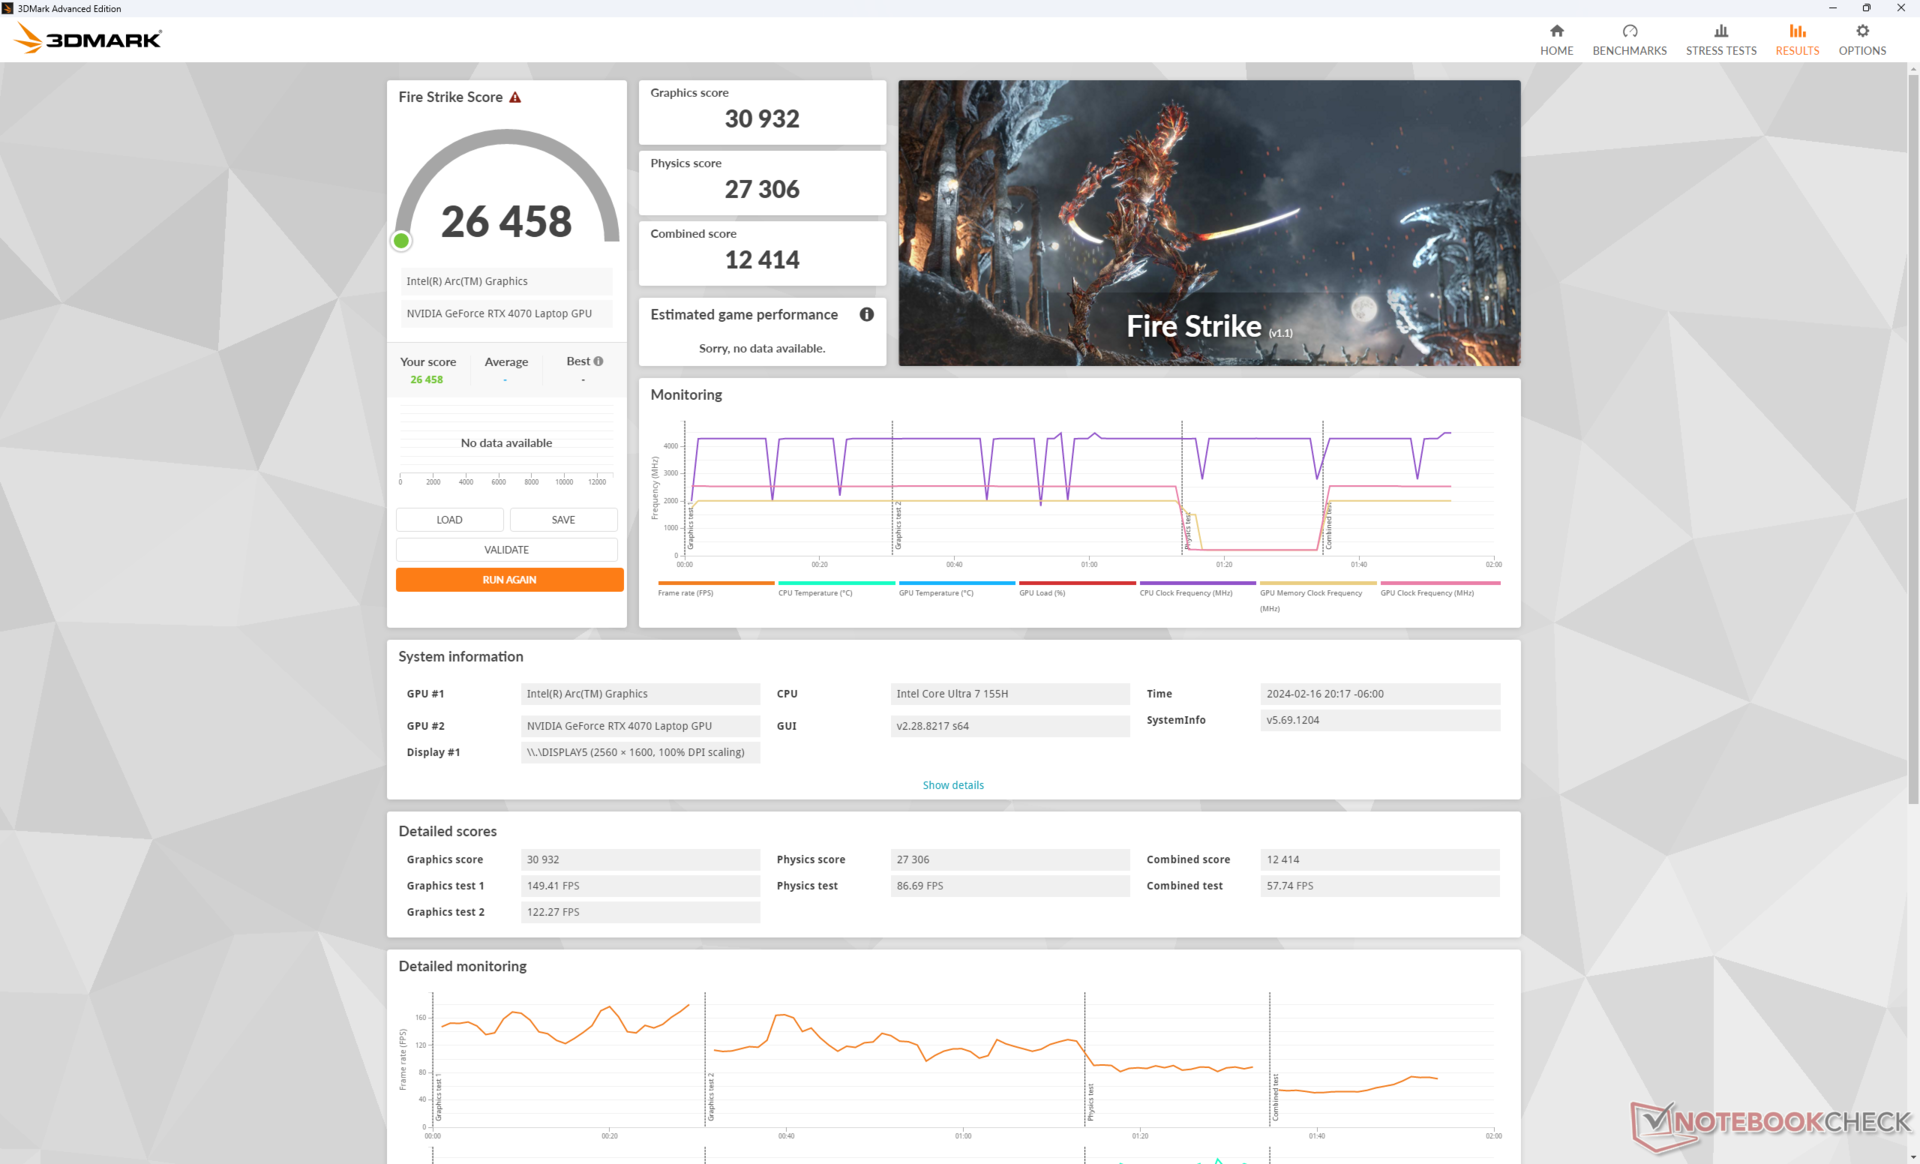
Il est intéressant de noter que les différences de performances entre les modes Overdrive, Performance et Balanced sont au mieux mineures. C'est surprenant car le passage en mode équilibré entraîne généralement une perte de performances de 10 à 30 % sur la plupart des autres ordinateurs portables de jeu, mais les scores sur Fire Strike restent pratiquement constants sur notre Alienware m16 R2. Dell a définitivement modifié les profils de bruit des ventilateurs et les performances qui en découlent au cours du développement de ce modèle.
| Profil de puissance | Score graphique | Score physique | Score combiné |
| Mode Overdrive | 30932 | 27306 | 12414 |
| Mode Performance | 31012 (-0%) | 28306 (-0%) | 12236 (-0%) |
| Mode équilibré | 30603 (-0%) | 28281 (-0%) | 12448 (-0%) |
| Alimentation par batterie | 24398 (-21%) | 24684 (-10%) | 10088 (-19%) |
Rétrogradation vers la RTX 4060 devrait avoir un impact sur les performances de 10 à 15 %.
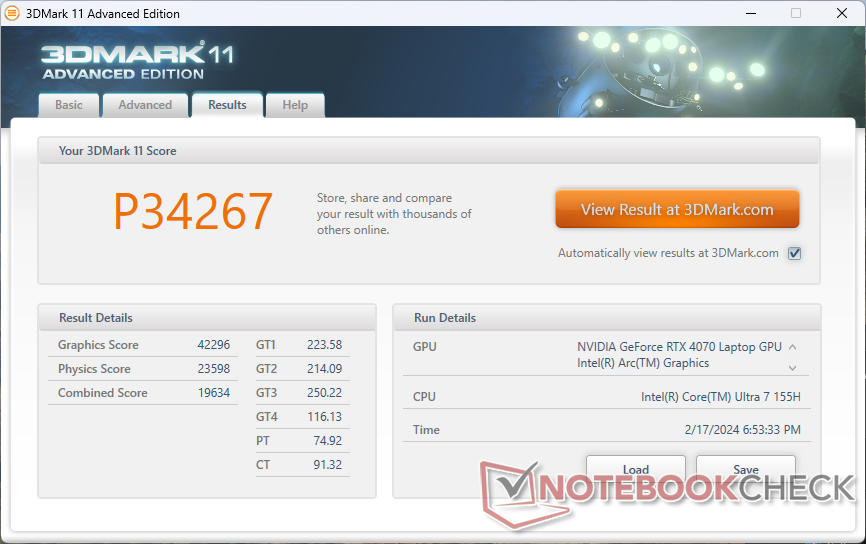
| 3DMark 11 Performance | 34267 points | |
| 3DMark Fire Strike Score | 26458 points | |
| 3DMark Time Spy Score | 12861 points | |
Aide | ||
* ... Moindre est la valeur, meilleures sont les performances
| F1 22 | |
| 1920x1080 Ultra High Preset AA:T AF:16x | |
| Lenovo Legion 9 16IRX8 | |
| Alienware m16 R1 AMD | |
| Alienware m16 R2 | |
| Moyenne NVIDIA GeForce RTX 4070 Laptop GPU (39.2 - 88.7, n=32) | |
| Lenovo Legion 5 16IRX G9 | |
| HP Victus 16-r0076TX | |
| Framework Laptop 16 | |
| 2560x1440 Ultra High Preset AA:T AF:16x | |
| Lenovo Legion 9 16IRX8 | |
| Alienware m16 R1 AMD | |
| Alienware m16 R2 | |
| Moyenne NVIDIA GeForce RTX 4070 Laptop GPU (10.6 - 58.8, n=30) | |
| Lenovo Legion 5 16IRX G9 | |
| Framework Laptop 16 | |
| 3840x2160 Ultra High Preset AA:T AF:16x | |
| Alienware m16 R1 AMD | |
| Alienware m16 R2 | |
| Moyenne NVIDIA GeForce RTX 4070 Laptop GPU (4.7 - 27.6, n=15) | |
| Framework Laptop 16 | |
| The Witcher 3 | |
| 1920x1080 Ultra Graphics & Postprocessing (HBAO+) | |
| Lenovo Legion 9 16IRX8 | |
| Alienware m16 R1 AMD | |
| Alienware m16 R2 | |
| Lenovo Legion 7 16IAX7-82TD004SGE | |
| HP Omen Transcend 16-u1095ng | |
| Moyenne NVIDIA GeForce RTX 4070 Laptop GPU (69.8 - 133.7, n=57) | |
| Asus ROG Zephyrus M16 GU603Z | |
| Lenovo Legion 5 16IRX G9 | |
| HP Victus 16-r0076TX | |
| Lenovo Legion S7 16ARHA7 | |
| Asus ROG Zephyrus M16 GU603H | |
| Dell G16 7620 | |
| Framework Laptop 16 | |
| 3840x2160 High Graphics & Postprocessing (Nvidia HairWorks Off) | |
| Alienware m16 R1 AMD | |
| Alienware m16 R2 | |
| Moyenne NVIDIA GeForce RTX 4070 Laptop GPU (26.5 - 83.5, n=16) | |
| Framework Laptop 16 | |
| Tiny Tina's Wonderlands | |
| 1920x1080 Badass Preset (DX12) | |
| Lenovo Legion 9 16IRX8 | |
| Alienware m16 R1 AMD | |
| Alienware m16 R2 | |
| Moyenne NVIDIA GeForce RTX 4070 Laptop GPU (58.6 - 115.9, n=18) | |
| Framework Laptop 16 | |
| 2560x1440 Badass Preset (DX12) | |
| Lenovo Legion 9 16IRX8 | |
| Alienware m16 R1 AMD | |
| Alienware m16 R2 | |
| Moyenne NVIDIA GeForce RTX 4070 Laptop GPU (49.8 - 79.5, n=17) | |
| Framework Laptop 16 | |
| 3840x2160 Badass Preset (DX12) | |
| Alienware m16 R1 AMD | |
| Moyenne NVIDIA GeForce RTX 4070 Laptop GPU (28.3 - 39.7, n=13) | |
| Alienware m16 R2 | |
| Framework Laptop 16 | |
| Baldur's Gate 3 | |
| 1920x1080 Ultra Preset AA:T | |
| Alienware m16 R2 | |
| Moyenne NVIDIA GeForce RTX 4070 Laptop GPU (66.7 - 128.5, n=30) | |
| Framework Laptop 16 | |
| 2560x1440 Ultra Preset AA:T | |
| Alienware m16 R2 | |
| Moyenne NVIDIA GeForce RTX 4070 Laptop GPU (54.4 - 89.6, n=25) | |
| Framework Laptop 16 | |
| 3840x2160 Ultra Preset AA:T | |
| Alienware m16 R2 | |
| Moyenne NVIDIA GeForce RTX 4070 Laptop GPU (33.4 - 45.2, n=12) | |
| Framework Laptop 16 | |
| Cyberpunk 2077 | |
| 1920x1080 Ultra Preset (FSR off) | |
| Lenovo Legion 9 16IRX8 | |
| Alienware m16 R2 | |
| Lenovo Legion 5 16IRX G9 | |
| Moyenne NVIDIA GeForce RTX 4070 Laptop GPU (30.7 - 90.7, n=40) | |
| Framework Laptop 16 | |
| 2560x1440 Ultra Preset (FSR off) | |
| Lenovo Legion 9 16IRX8 | |
| Alienware m16 R2 | |
| Lenovo Legion 5 16IRX G9 | |
| Moyenne NVIDIA GeForce RTX 4070 Laptop GPU (24.8 - 57.1, n=37) | |
| Framework Laptop 16 | |
| 3840x2160 Ultra Preset (FSR off) | |
| Moyenne NVIDIA GeForce RTX 4070 Laptop GPU (20.2 - 24, n=13) | |
| Alienware m16 R2 | |
| Framework Laptop 16 | |
Witcher 3 FPS Chart
| Bas | Moyen | Élevé | Ultra | QHD | 4K | |
|---|---|---|---|---|---|---|
| The Witcher 3 (2015) | 399.6 | 344.6 | 240.5 | 121.3 | 72 | |
| Dota 2 Reborn (2015) | 166.8 | 149 | 149.5 | 139.7 | 130.6 | |
| Final Fantasy XV Benchmark (2018) | 184.6 | 165.1 | 119.3 | 85.2 | 48.5 | |
| X-Plane 11.11 (2018) | 132.3 | 116 | 90.8 | 78.2 | ||
| Far Cry 5 (2018) | 146 | 134 | 123 | 115 | 61 | |
| Strange Brigade (2018) | 427 | 308 | 255 | 219 | 141.7 | 73.8 |
| Tiny Tina's Wonderlands (2022) | 244 | 202.8 | 138.3 | 107.6 | 74.6 | 34.8 |
| F1 22 (2022) | 235 | 225 | 217 | 83.6 | 52.9 | 26.6 |
| Baldur's Gate 3 (2023) | 168.7 | 148.9 | 129.3 | 128.5 | 88.3 | 44.3 |
| Cyberpunk 2077 (2023) | 125.7 | 114.1 | 95.6 | 83.1 | 52.7 | 21 |
Émissions
Bruit du système
Le bruit du ventilateur s'est considérablement amélioré par rapport au m16 R1. Lors de l'exécution de 3DMark 06 en mode équilibré, par exemple, le m16 R2 reste plus longtemps silencieux à 32 dB(A) alors que le m16 R1 est inutilement bruyant à 52 dB(A) pendant toute la première scène du benchmark. Le m16 R2 est donc plus comparable à des concurrents tels que le Lenovo Legion Slim 7 dans des conditions similaires.
Le bruit du ventilateur pendant les jeux est étroitement lié au profil d'alimentation sélectionné. Par exemple, le bruit du ventilateur s'établit à 52 dB(A), 54 dB(A) et 62 dB(A) en mode équilibré, en mode performance et en mode overdrive Witcher 3 en mode équilibré, en mode performance et en mode overdrive, respectivement. Comme les écarts de performance entre ces trois modes sont très faibles, nous vous recommandons de jouer en mode Performance et d'éviter le mode Overdrive dans la plupart des cas. Le maximum de 62 dB(A) est beaucoup plus fort que ce que nous avons enregistré sur l'Alienware x16 R1, même le plus puissant, mais ce mode est principalement destiné à l'overclocking de l'utilisateur final ; le mode Performance est suffisant pour les paramètres de base.
Degré de la nuisance sonore
| Au repos |
| 25.3 / 25.3 / 25.3 dB(A) |
| Fortement sollicité |
| 31.7 / 62 dB(A) |
 | ||
30 dB silencieux 40 dB(A) audible 50 dB(A) bruyant |
||
min: | ||
| Alienware m16 R2 GeForce RTX 4070 Laptop GPU, Ultra 7 155H, Samsung PM9A1 MZVL21T0HCLR | Alienware m16 R1 Intel GeForce RTX 4060 Laptop GPU, i7-13700HX, Kioxia KXG70ZNV512G | Alienware x16 R1 GeForce RTX 4080 Laptop GPU, i9-13900HK, SK hynix PC801 HFS001TEJ9X101N | HP Omen Transcend 16-u1095ng GeForce RTX 4070 Laptop GPU, i9-14900HX, Kioxia XG8 KXG80ZNV1T02 | Asus ROG Zephyrus G16 2024 GU605M GeForce RTX 4070 Laptop GPU, Ultra 7 155H, WD PC SN560 SDDPNQE-1T00 | Lenovo Legion Slim 7 16APH8 GeForce RTX 4060 Laptop GPU, R7 7840HS, WDC PC SN810 1TB | |
|---|---|---|---|---|---|---|
| Noise | -8% | 1% | -8% | 2% | 0% | |
| arrêt / environnement * (dB) | 24.7 | 25 -1% | 22.7 8% | 24 3% | 23.9 3% | 24 3% |
| Idle Minimum * (dB) | 25.3 | 25 1% | 23.1 9% | 29 -15% | 23.9 6% | 25 1% |
| Idle Average * (dB) | 25.3 | 26 -3% | 25.8 -2% | 30 -19% | 27.8 -10% | 28 -11% |
| Idle Maximum * (dB) | 25.3 | 27 -7% | 25.8 -2% | 31 -23% | 30.1 -19% | 31 -23% |
| Load Average * (dB) | 31.7 | 52 -64% | 39.3 -24% | 45 -42% | 34.2 -8% | 33 -4% |
| Witcher 3 ultra * (dB) | 53.8 | 51 5% | 49.9 7% | 44 18% | 46.4 14% | 47 13% |
| Load Maximum * (dB) | 62 | 53 15% | 54.8 12% | 47 24% | 46.4 25% | 49 21% |
* ... Moindre est la valeur, meilleures sont les performances
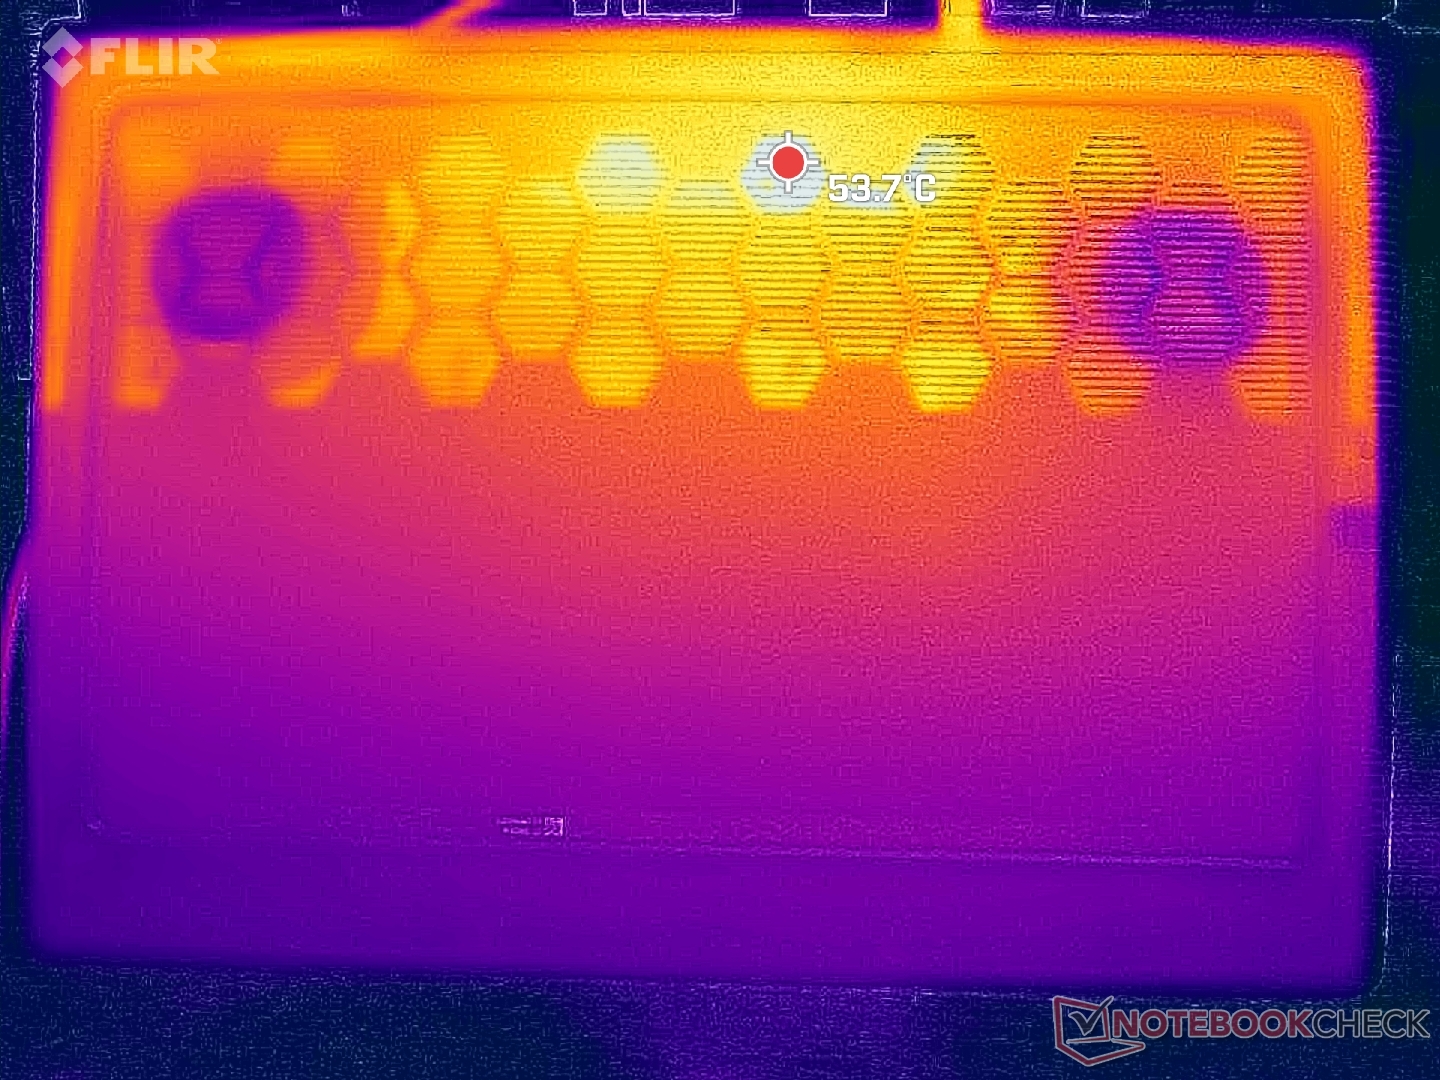
Température
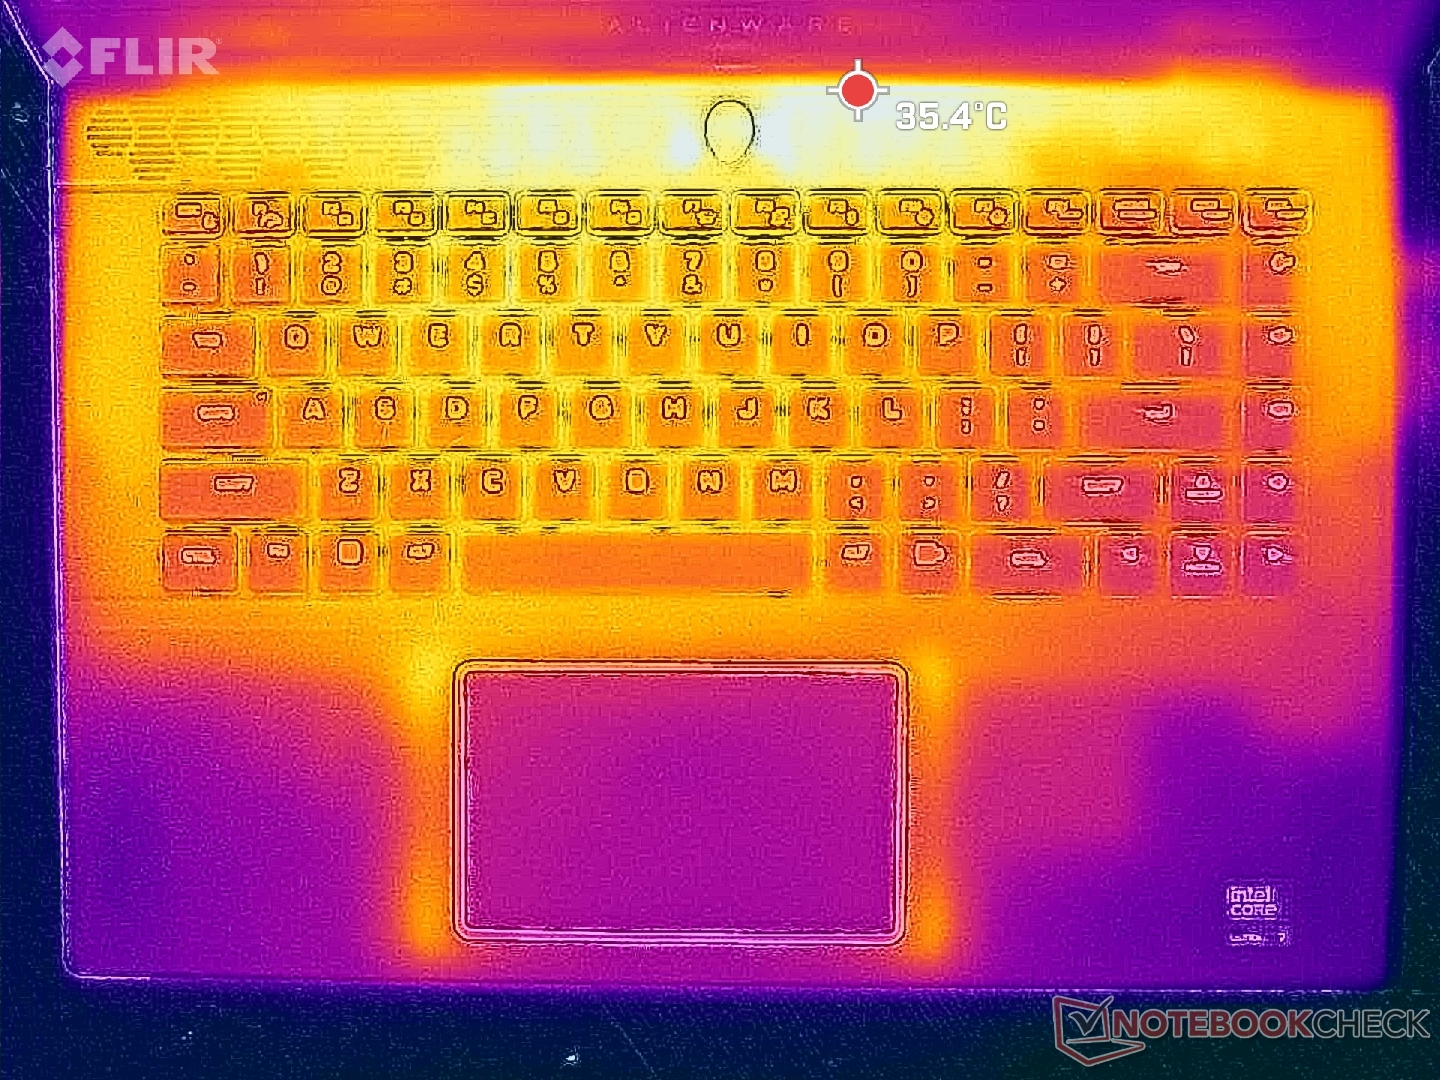
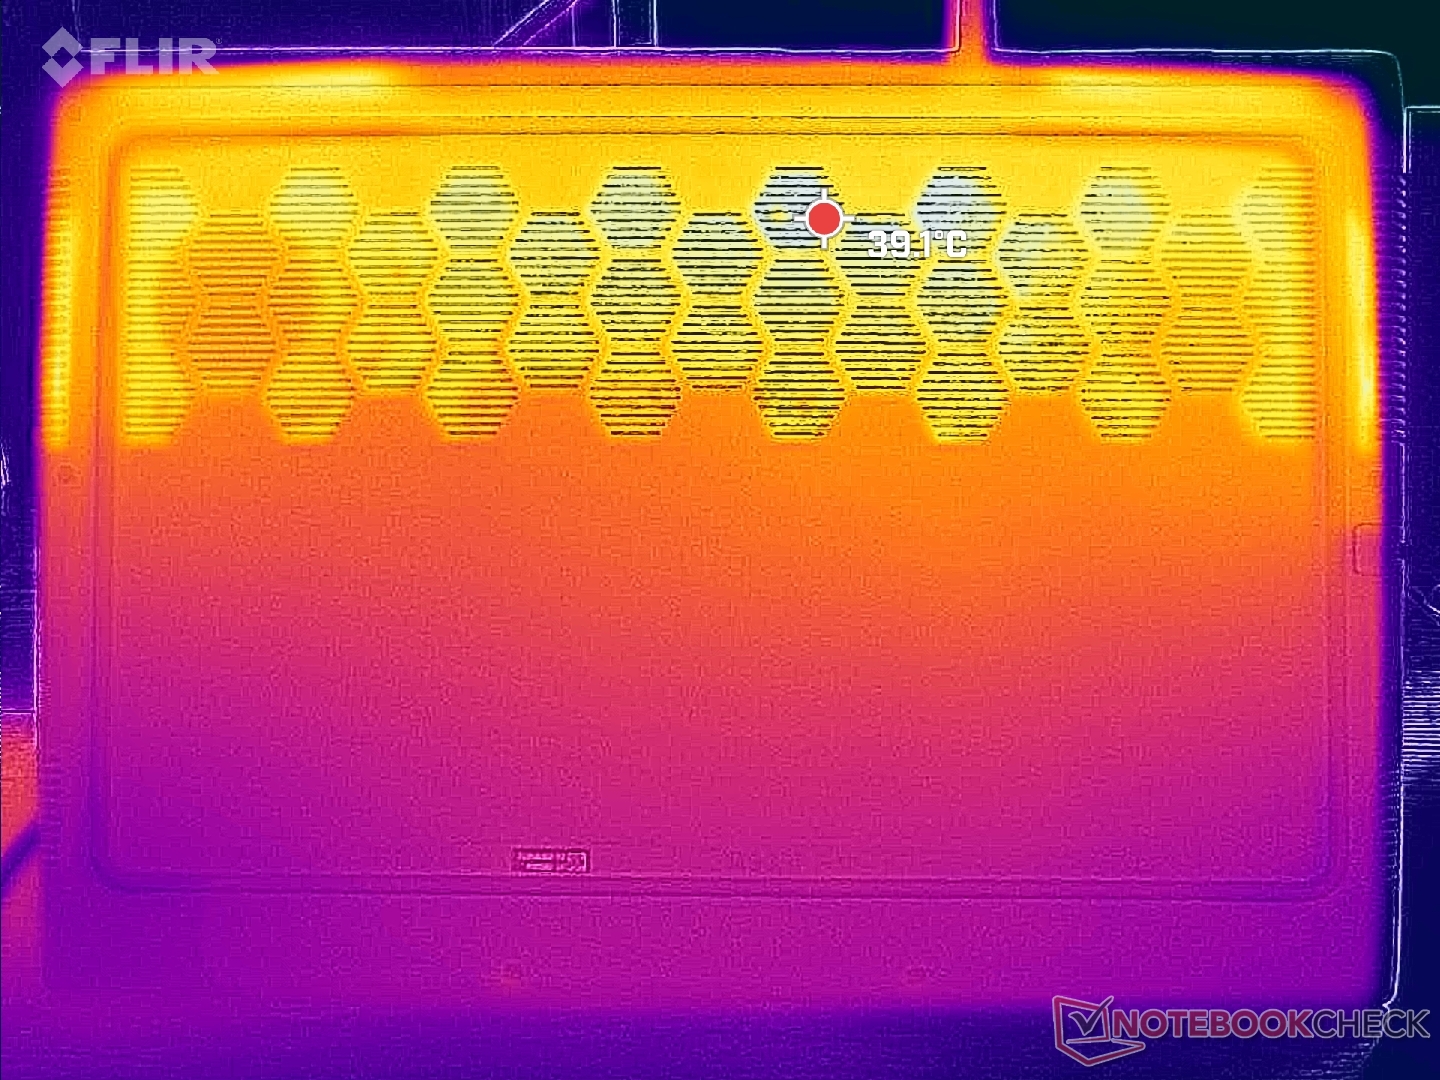
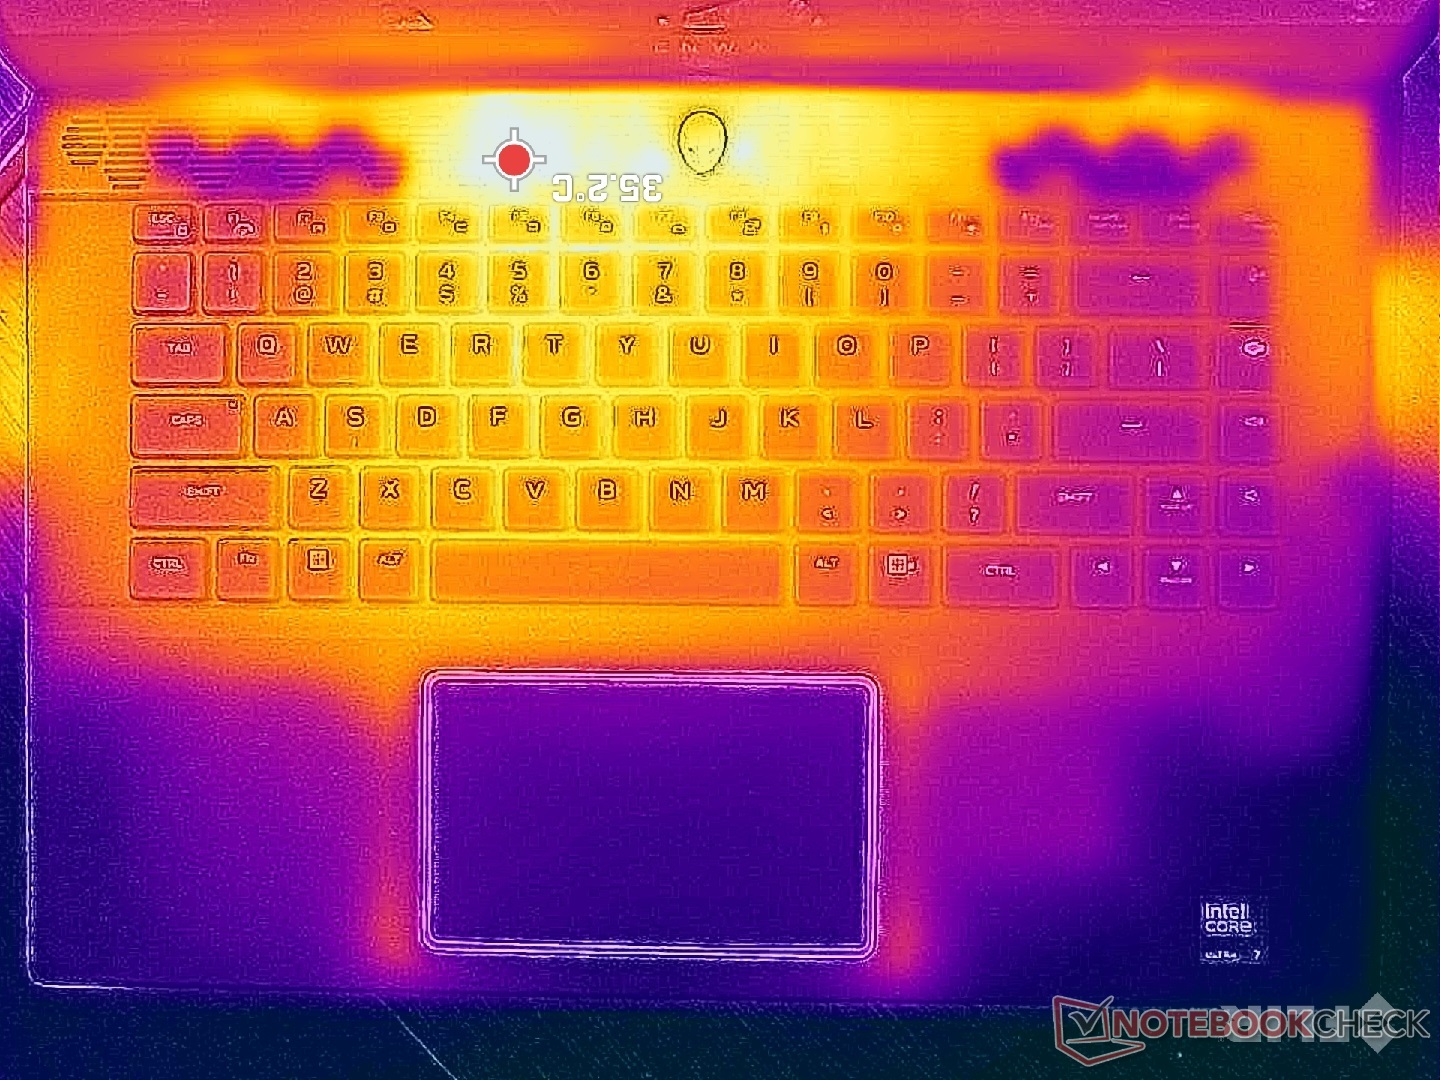
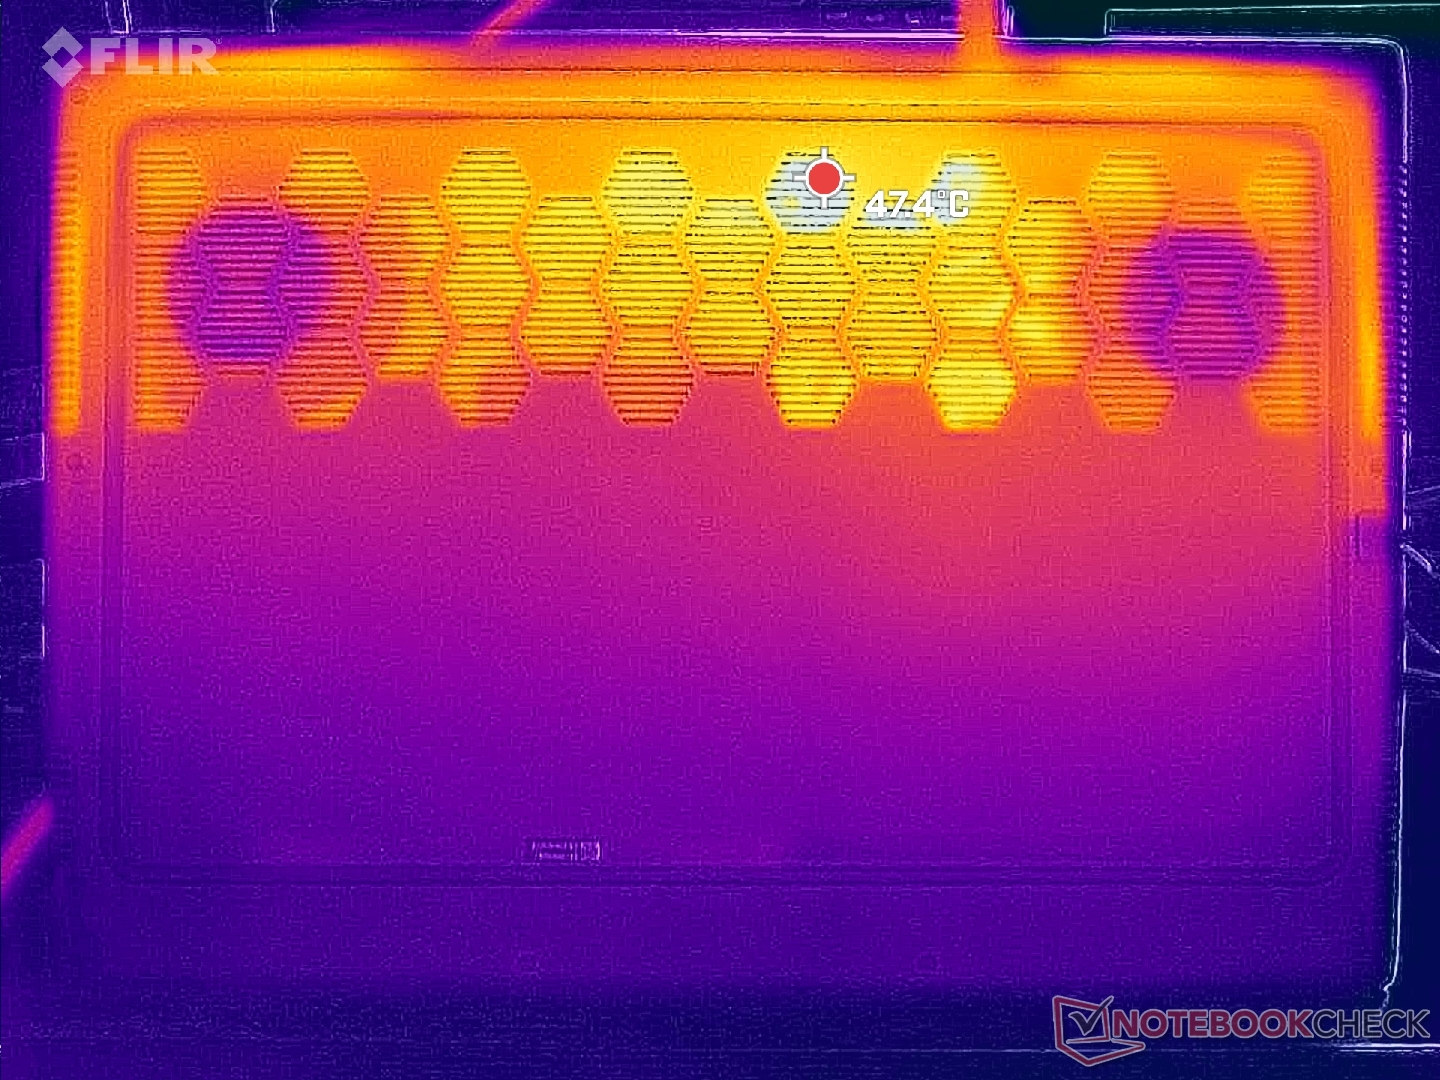
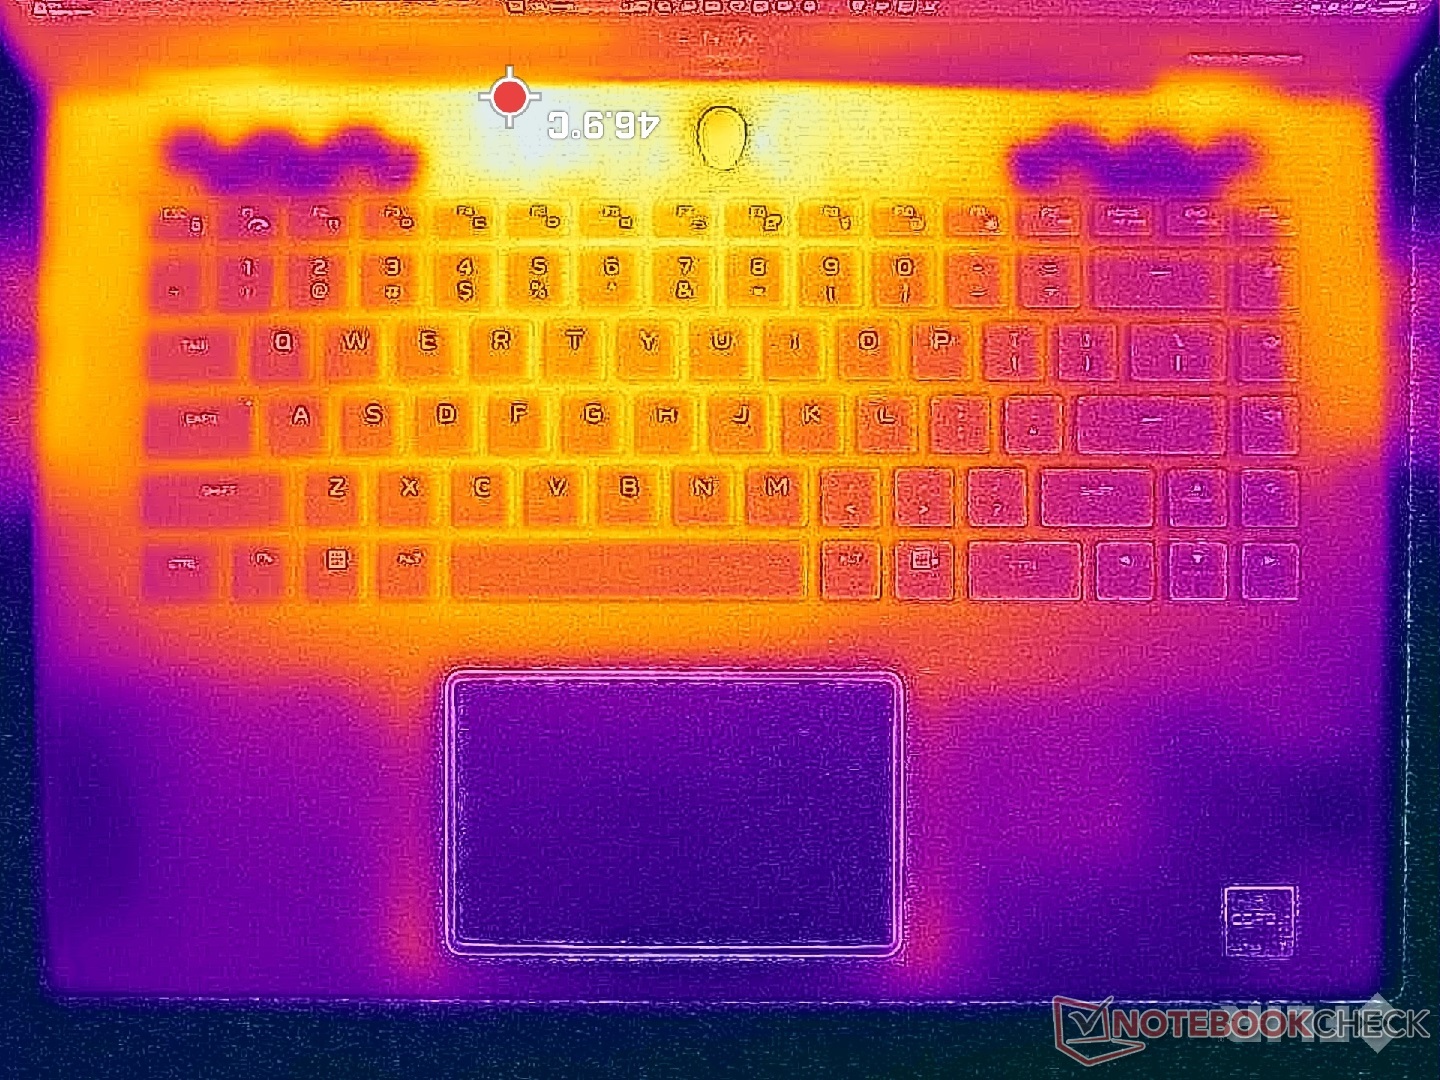
Les points chauds lors de l'exécution de charges exigeantes comme les jeux sont concentrés vers l'arrière du châssis où les mains ne sont pas susceptibles d'entrer en contact. Les repose-poignets et le clavier resteront raisonnablement frais dans une fourchette de 20 C et 30 C, respectivement, tandis que l'arrière peut approcher les 50 C. Les températures de surface moyennes sont plus chaudes que celles que nous avons enregistrées sur le Blade 16 mais plus fraîches que sur le HP Omen Transcend 16 où certaines zones peuvent atteindre plus de 60°C.
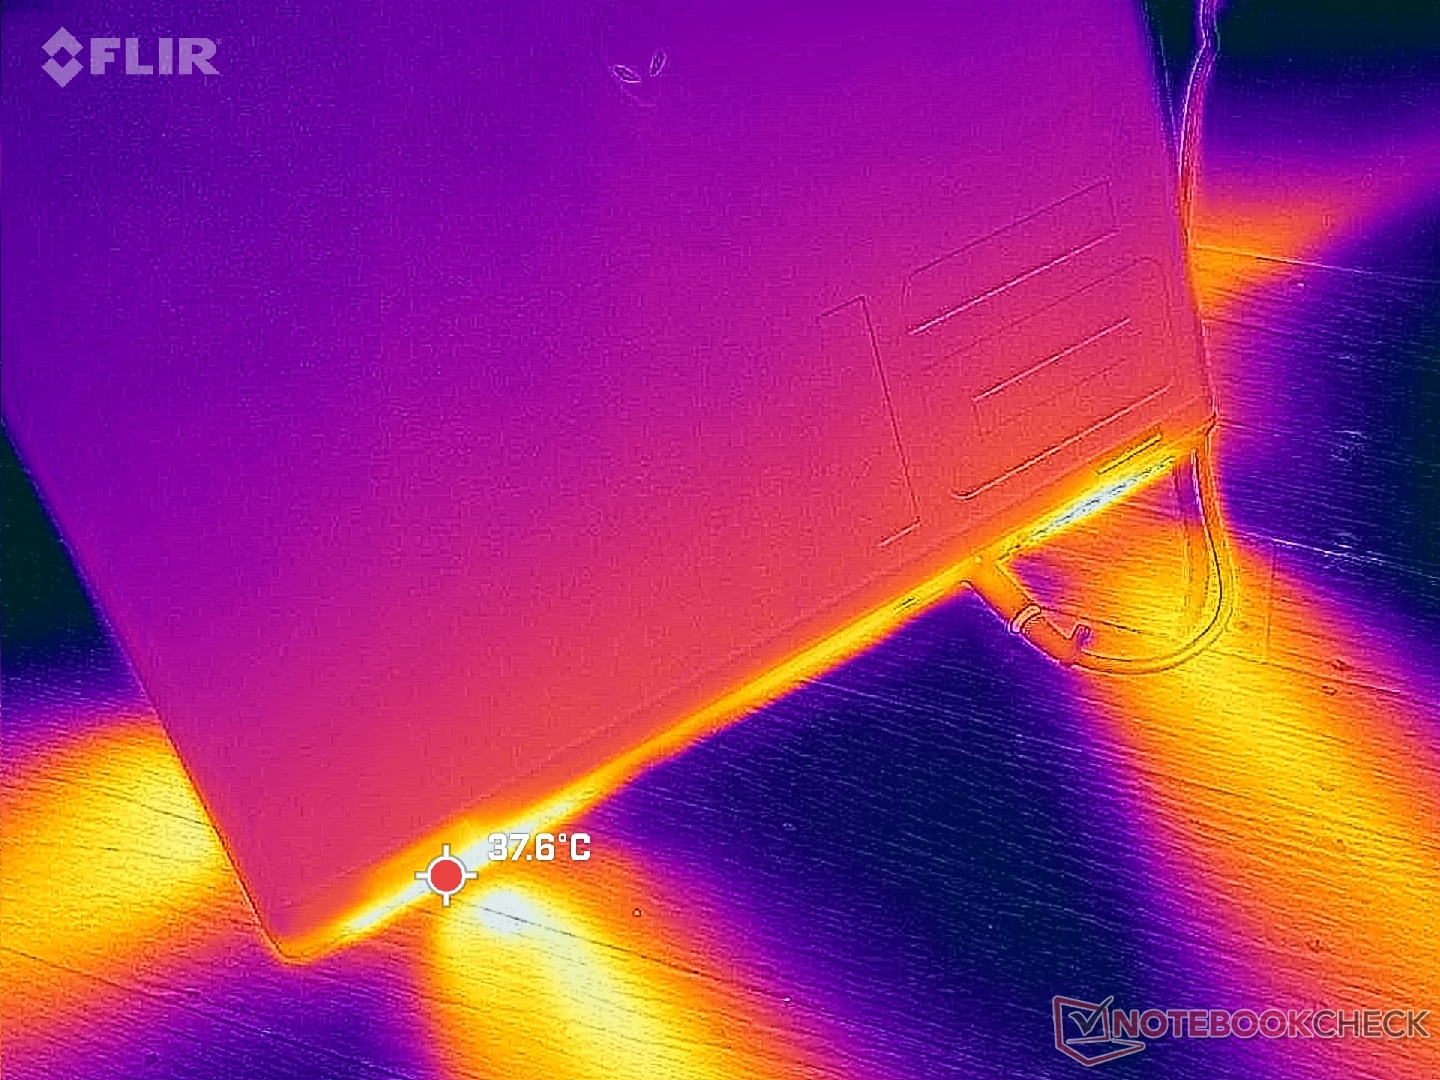
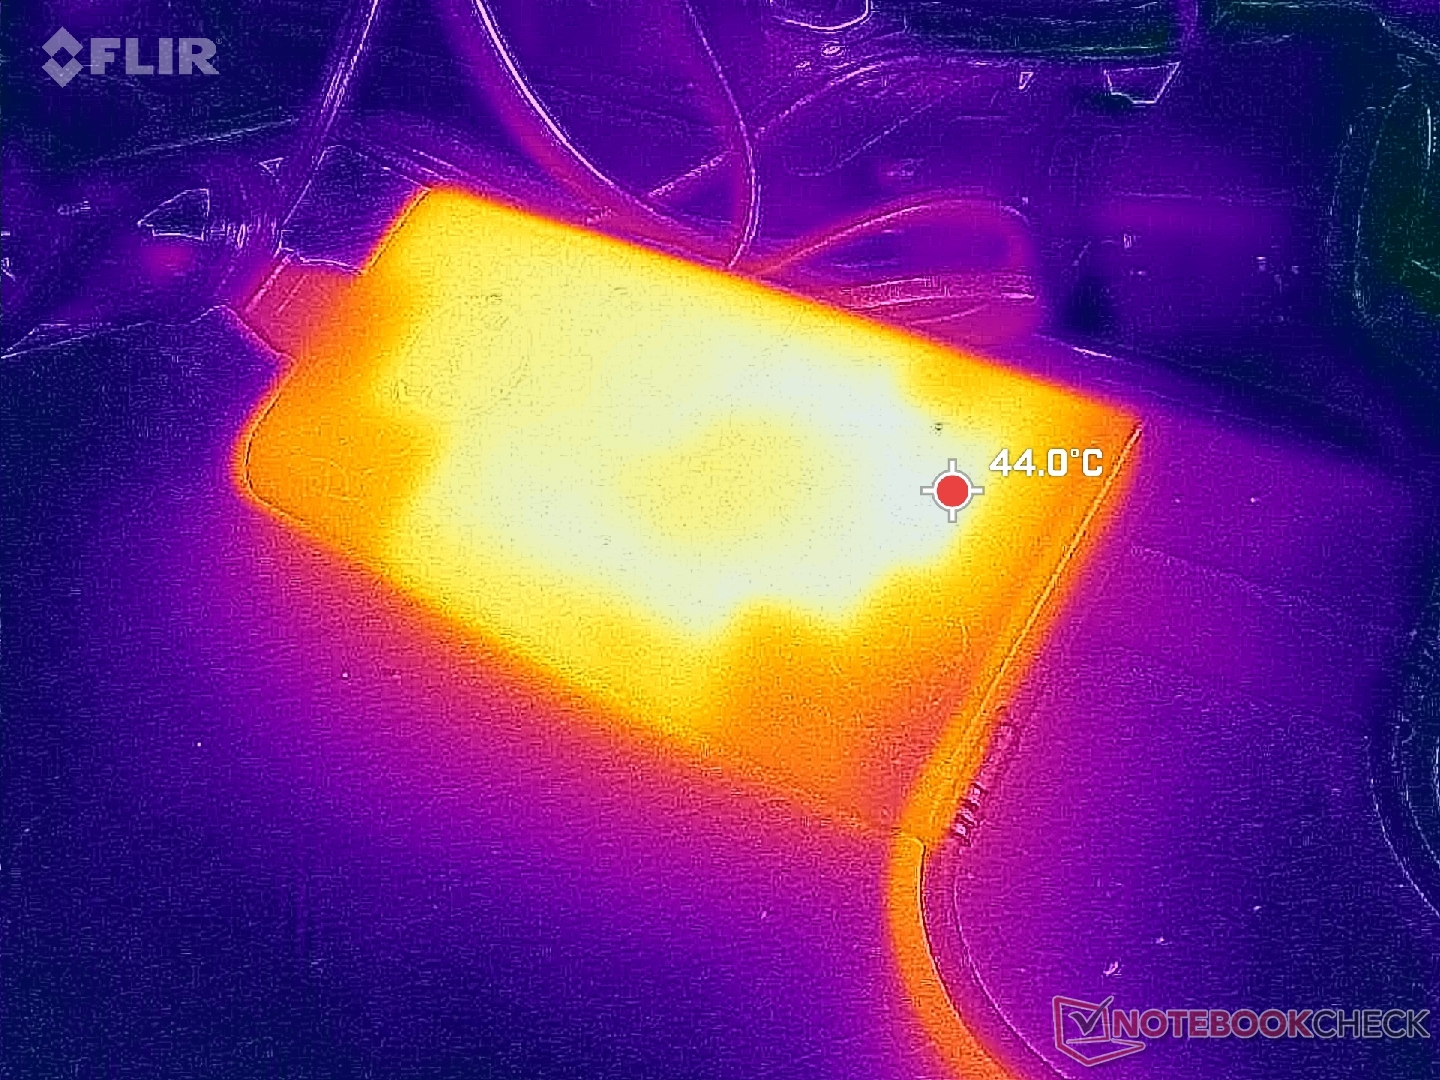
(±) La température maximale du côté supérieur est de 44.8 °C / 113 F, par rapport à la moyenne de 40.4 °C / 105 F, allant de 21.2 à 68.8 °C pour la classe Gaming.
(-) Le fond chauffe jusqu'à un maximum de 48 °C / 118 F, contre une moyenne de 43.2 °C / 110 F
(+) En utilisation inactive, la température moyenne du côté supérieur est de 30.9 °C / 88 F, par rapport à la moyenne du dispositif de 33.9 °C / 93 F.
(+) En jouant à The Witcher 3, la température moyenne du côté supérieur est de 28.7 °C / 84 F, alors que la moyenne de l'appareil est de 33.9 °C / 93 F.
(+) Les repose-poignets et le pavé tactile sont plus froids que la température de la peau avec un maximum de 27.2 °C / 81 F et sont donc froids au toucher.
(±) La température moyenne de la zone de l'appui-paume de dispositifs similaires était de 28.8 °C / 83.8 F (+1.6 °C / #2.8 F).
| Alienware m16 R2 Intel Core Ultra 7 155H, NVIDIA GeForce RTX 4070 Laptop GPU | Alienware m16 R1 Intel Intel Core i7-13700HX, NVIDIA GeForce RTX 4060 Laptop GPU | Alienware x16 R1 Intel Core i9-13900HK, NVIDIA GeForce RTX 4080 Laptop GPU | HP Omen Transcend 16-u1095ng Intel Core i9-14900HX, NVIDIA GeForce RTX 4070 Laptop GPU | Asus ROG Zephyrus G16 2024 GU605M Intel Core Ultra 7 155H, NVIDIA GeForce RTX 4070 Laptop GPU | Lenovo Legion Slim 7 16APH8 AMD Ryzen 7 7840HS, NVIDIA GeForce RTX 4060 Laptop GPU | |
|---|---|---|---|---|---|---|
| Heat | -3% | 3% | 3% | 10% | 8% | |
| Maximum Upper Side * (°C) | 44.8 | 49 -9% | 47.2 -5% | 49 -9% | 50.3 -12% | 46 -3% |
| Maximum Bottom * (°C) | 48 | 48 -0% | 47.8 -0% | 63 -31% | 48 -0% | 46 4% |
| Idle Upper Side * (°C) | 37.2 | 40 -8% | 36.8 1% | 30 19% | 28.8 23% | 33 11% |
| Idle Bottom * (°C) | 42 | 39 7% | 35.8 15% | 29 31% | 29.8 29% | 34 19% |
* ... Moindre est la valeur, meilleures sont les performances
Intervenants
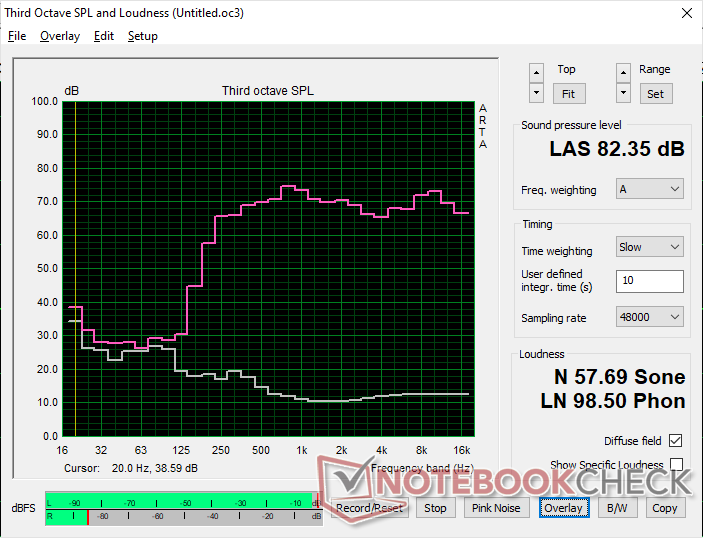
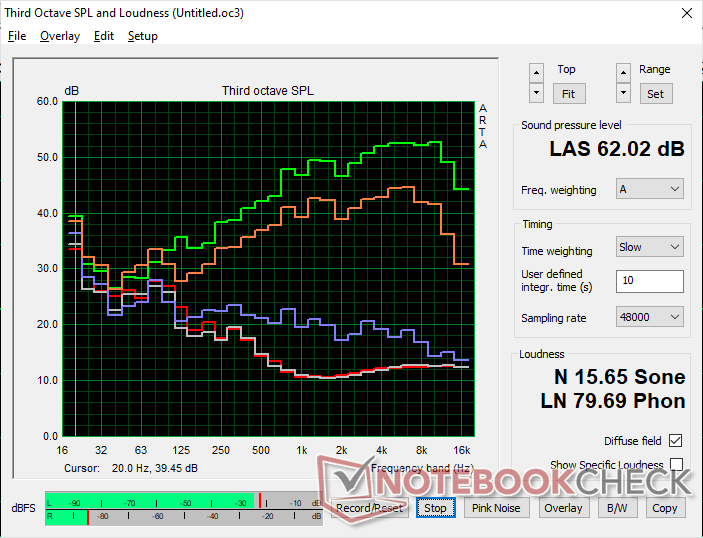
Alienware m16 R2 analyse audio
(+) | les haut-parleurs peuvent jouer relativement fort (82.4# dB)
Basses 100 - 315 Hz
(-) | presque aucune basse - en moyenne 20.1% plus bas que la médiane
(±) | la linéarité des basses est moyenne (11.1% delta à la fréquence précédente)
Médiums 400 - 2000 Hz
(+) | médiane équilibrée - seulement 2.2% de la médiane
(+) | les médiums sont linéaires (3.1% delta à la fréquence précédente)
Aiguës 2 - 16 kHz
(+) | des sommets équilibrés - à seulement 2.2% de la médiane
(+) | les aigus sont linéaires (3.5% delta à la fréquence précédente)
Globalement 100 - 16 000 Hz
(+) | le son global est linéaire (12.9% différence à la médiane)
Par rapport à la même classe
» 17% de tous les appareils testés de cette catégorie étaient meilleurs, 4% similaires, 79% pires
» Le meilleur avait un delta de 6%, la moyenne était de 18%, le pire était de 132%.
Par rapport à tous les appareils testés
» 12% de tous les appareils testés étaient meilleurs, 3% similaires, 85% pires
» Le meilleur avait un delta de 4%, la moyenne était de 23%, le pire était de 134%.
Apple MacBook Pro 16 2021 M1 Pro analyse audio
(+) | les haut-parleurs peuvent jouer relativement fort (84.7# dB)
Basses 100 - 315 Hz
(+) | bonne basse - seulement 3.8% loin de la médiane
(+) | les basses sont linéaires (5.2% delta à la fréquence précédente)
Médiums 400 - 2000 Hz
(+) | médiane équilibrée - seulement 1.3% de la médiane
(+) | les médiums sont linéaires (2.1% delta à la fréquence précédente)
Aiguës 2 - 16 kHz
(+) | des sommets équilibrés - à seulement 1.9% de la médiane
(+) | les aigus sont linéaires (2.7% delta à la fréquence précédente)
Globalement 100 - 16 000 Hz
(+) | le son global est linéaire (4.6% différence à la médiane)
Par rapport à la même classe
» 0% de tous les appareils testés de cette catégorie étaient meilleurs, 0% similaires, 100% pires
» Le meilleur avait un delta de 5%, la moyenne était de 17%, le pire était de 45%.
Par rapport à tous les appareils testés
» 0% de tous les appareils testés étaient meilleurs, 0% similaires, 100% pires
» Le meilleur avait un delta de 4%, la moyenne était de 23%, le pire était de 134%.
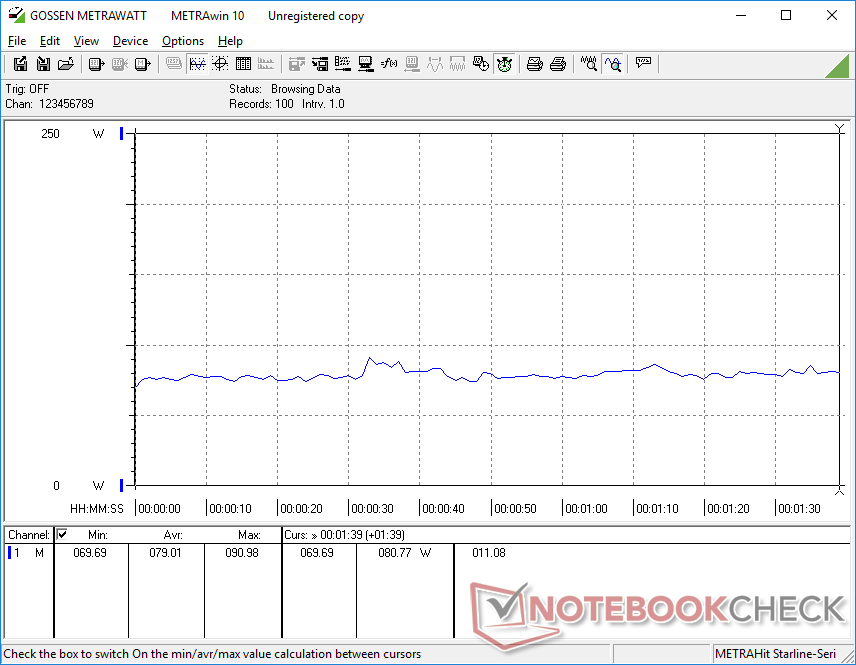
Gestion de l'énergie - Plus économe et moins gourmande en énergie
Consommation électrique
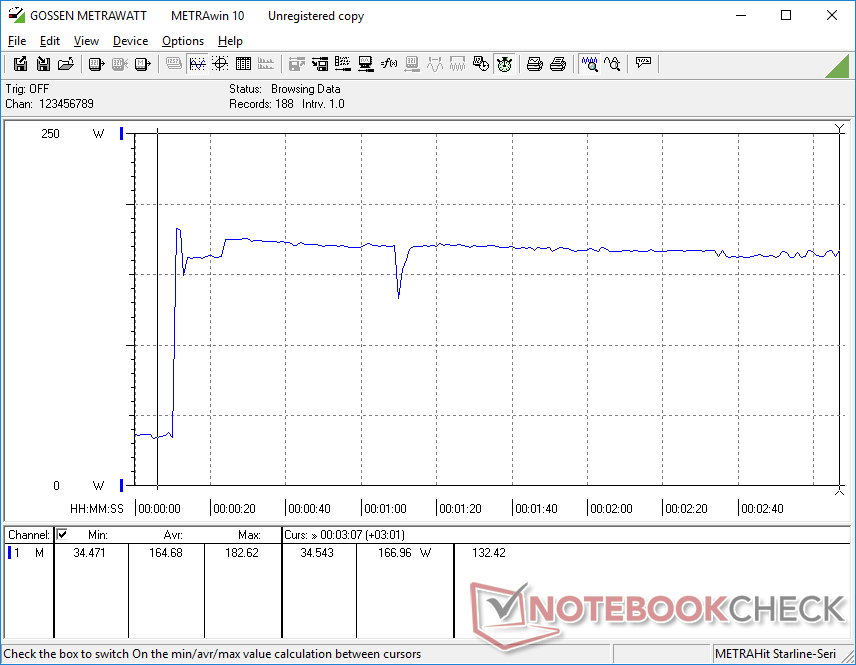
Le ralenti sur l'ordinateur de bureau peut être aussi bas que 8 W lorsque la luminosité est réglée au minimum en mode silencieux et en mode iGPU, ou jusqu'à 40 W lorsque la luminosité est réglée au maximum en mode Overdrive et en mode dGPU. Il est préférable d'utiliser les modes Équilibré et iGPU lorsque la puissance supplémentaire n'est pas nécessaire pour prolonger l'autonomie de la batterie, comme indiqué dans la section suivante.
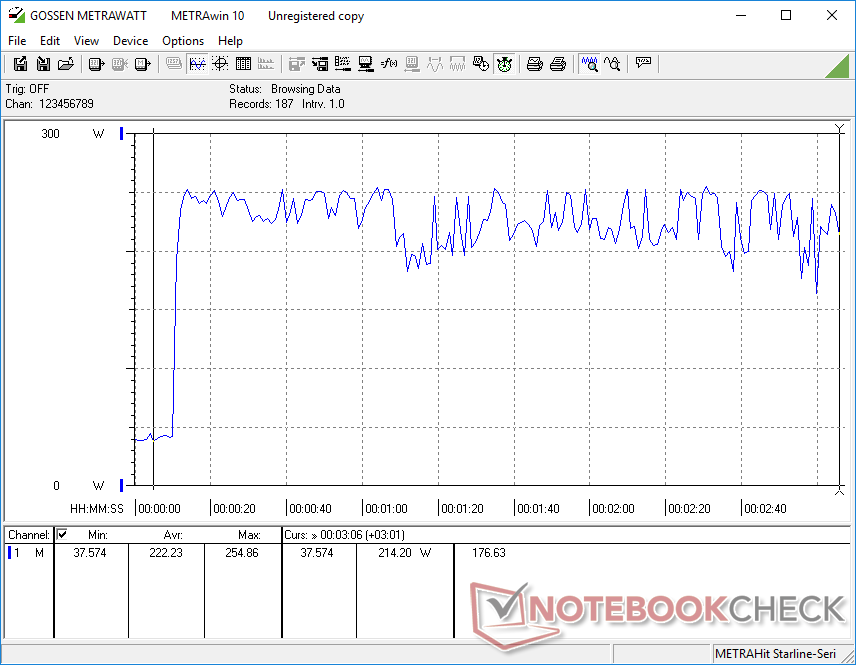
Lorsque vous jouez ou que vous exécutez des charges CPU importantes, la consommation globale devient à peu près la même que celle que nous avons enregistrée sur le m16 R1 équipé de la RTX 4060, pour des performances par watt légèrement supérieures.
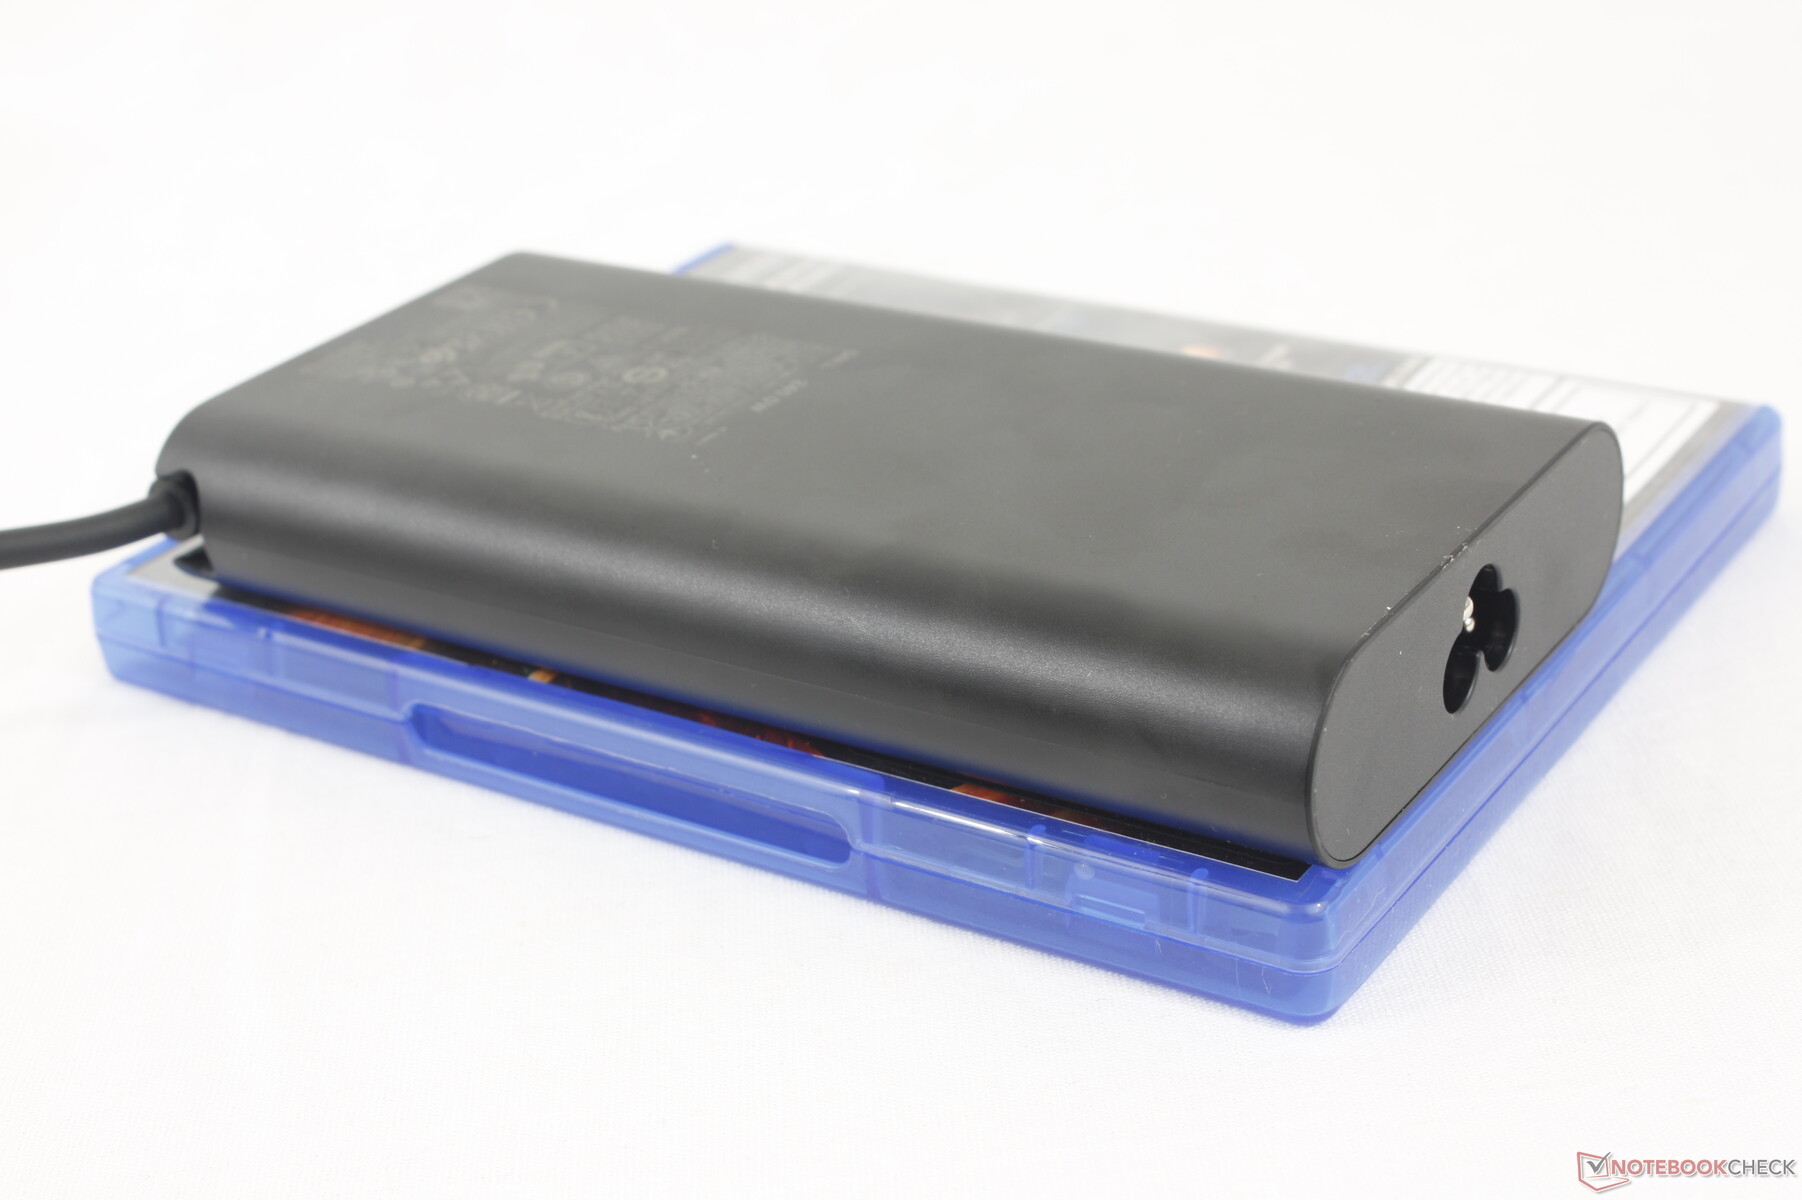
Le m16 R2 peut être configuré pour être livré avec un petit adaptateur GaN de 240 W (~15.2 x 7.7 x 2.3 cm) alors que le m16 R1 est livré avec un adaptateur plus grand (~20 x 10 x 4.5 cm) de 330 W pour accommoder les configurations RTX 4080 et 4090. Certains modèles comme le nôtre peuvent être livrés avec un adaptateur CA de 280 W à la place.

| Éteint/en veille | |
| Au repos | |
| Fortement sollicité |
|
Légende:
min: | |
| Alienware m16 R2 Ultra 7 155H, GeForce RTX 4070 Laptop GPU, Samsung PM9A1 MZVL21T0HCLR, IPS, 2560x1600, 16" | Alienware m16 R1 Intel i7-13700HX, GeForce RTX 4060 Laptop GPU, Kioxia KXG70ZNV512G, IPS, 2560x1600, 16" | Alienware x16 R1 i9-13900HK, GeForce RTX 4080 Laptop GPU, SK hynix PC801 HFS001TEJ9X101N, IPS, 2560x1600, 16" | HP Omen Transcend 16-u1095ng i9-14900HX, GeForce RTX 4070 Laptop GPU, Kioxia XG8 KXG80ZNV1T02, OLED, 2560x1600, 16" | Asus ROG Zephyrus G16 2024 GU605M Ultra 7 155H, GeForce RTX 4070 Laptop GPU, WD PC SN560 SDDPNQE-1T00, OLED, 2560x1600, 16" | Lenovo Legion Slim 7 16APH8 R7 7840HS, GeForce RTX 4060 Laptop GPU, WDC PC SN810 1TB, IPS, 2560x1600, 16" | |
|---|---|---|---|---|---|---|
| Power Consumption | -10% | -77% | -13% | 24% | -67% | |
| Idle Minimum * (Watt) | 8.1 | 10 -23% | 25.2 -211% | 10 -23% | 8.3 -2% | 33 -307% |
| Idle Average * (Watt) | 13 | 14 -8% | 29.9 -130% | 18 -38% | 12.5 4% | 35 -169% |
| Idle Maximum * (Watt) | 40.3 | 21 48% | 49.8 -24% | 32 21% | 12.8 68% | 45 -12% |
| Load Average * (Watt) | 79 | 119 -51% | 105.4 -33% | 128 -62% | 71.3 10% | 59 25% |
| Witcher 3 ultra * (Watt) | 188.1 | 186.7 1% | 263 -40% | 148.4 21% | 127.5 32% | 131 30% |
| Load Maximum * (Watt) | 254.9 | 323 -27% | 313.8 -23% | 242 5% | 169.1 34% | 177 31% |
* ... Moindre est la valeur, meilleures sont les performances
Power Consumption Witcher 3 / Stresstest
Power Consumption external Monitor
Autonomie de la batterie
La capacité de la batterie est en fait légèrement supérieure cette année, avec 90 Wh, malgré un châssis plus petit. Il semble également que Dell ait résolu les problèmes de durée de vie de la batterie que nous connaissions sur de nombreux ordinateurs portables Alienware plus anciens ; la navigation sur le Web en mode équilibré et Optimus durait 8 heures, contre près de la moitié sur l'Alienware m16 R1. Le système peut même surpasser les derniers Asus ROG Zephyrus G16 GU605M de près d'une heure.
Le chargement d'une batterie vide à sa pleine capacité prend environ 90 minutes. En revanche, il faut un peu moins de 40 minutes pour atteindre 85 % de la capacité. Le modèle peut également être rechargé via des adaptateurs USB-C génériques, bien que beaucoup plus lentement.
| Alienware m16 R2 Ultra 7 155H, GeForce RTX 4070 Laptop GPU, 90 Wh | Alienware m16 R1 Intel i7-13700HX, GeForce RTX 4060 Laptop GPU, 86 Wh | Alienware x16 R1 i9-13900HK, GeForce RTX 4080 Laptop GPU, 90 Wh | HP Omen Transcend 16-u1095ng i9-14900HX, GeForce RTX 4070 Laptop GPU, 97 Wh | Asus ROG Zephyrus G16 2024 GU605M Ultra 7 155H, GeForce RTX 4070 Laptop GPU, 90 Wh | Lenovo Legion Slim 7 16APH8 R7 7840HS, GeForce RTX 4060 Laptop GPU, 99.9 Wh | |
|---|---|---|---|---|---|---|
| Autonomie de la batterie | -30% | -47% | -40% | 5% | -12% | |
| Reader / Idle (h) | 12.6 | 6.4 -49% | 7.3 -42% | |||
| WiFi v1.3 (h) | 8.1 | 4.8 -41% | 2.5 -69% | 4.9 -40% | 7.3 -10% | 7.1 -12% |
| Load (h) | 1 | 1 0% | 0.7 -30% | 1.2 20% | ||
| H.264 (h) | 5.6 | 11.2 |
Points positifs
Points négatifs
Verdict - Un nouvel équilibre entre les jeux et le travail hybride
L'Alienware m16 R2 a été créé avec un objectif clair : être plus petit que l'Alienware m16 R1 Alienware m16 R1 même si cela implique de compromettre les performances. Le modèle est définitivement beaucoup plus portable qu'auparavant, mais les utilisateurs perdent les graphiques GeForce RTX 4080/4090, les processeurs Core HX et les touches mécaniques dans le processus. Dell espère qu'en supprimant ces caractéristiques de niveau enthousiaste en faveur d'un design plus petit, le m16 R2 plus mince peut attirer un public plus large de travailleurs hybrides, d'étudiants et de joueurs traditionnels qui ont peut-être ignoré le m16 R1 ou le x16 R1 plus "hardcore" et moins facile à transporter x16 R1.
Le résultat final est un système qui équilibre très bien tous les fronts, des performances à l'autonomie de la batterie en passant par la portabilité, alors que le m16 R1 se concentrait presque entièrement sur les performances au détriment du poids et de la durée d'utilisation. Même le niveau de bruit des ventilateurs et leur comportement ont été améliorés pour être plus appropriés dans les salles de classe ou les bureaux où la puissance supplémentaire n'est pas nécessaire. C'est certainement l'ordinateur portable Alienware le plus complet que nous ayons testé grâce à tous les changements matériels et logiciels.
Si vous vous contentez d'une carte graphique GeForce RTX 4060 ou 4070, l'Alienware m16 R2 est la meilleure option de la série. Si vous avez besoin de plus de puissance et que vous souhaitez préserver la portabilité, le Blade 16, plus onéreux, reste la meilleure solution.
Bien qu'impressionnant et souvent surprenant, le m16 R2 doit faire face à une concurrence féroce dans la catégorie des 16 pouces. Le Razer Blade 16par exemple, est toujours plus léger, plus petit et plus rapide que le m16 R2, avec des couleurs DCI-P3 plus profondes. L'écran Asus ROG Zephyrus G16 est également plus léger et offre davantage d'options d'affichage, mais les performances du GPU sont légèrement inférieures. Dans ce scénario, Dell a fixé le prix de l'Alienware m16 R2 à un niveau inférieur à celui des systèmes Razer et Asus.
Prix et disponibilité
Dell livre dès à présent l'Alienware m16 R2 à partir de 1650$ pour la RTX 4060 ou jusqu'à 1850$+ pour la configuration RTX 4070. La configuration RTX 4050 d'entrée de gamme est également disponible pour 1500$.
Alienware m16 R2
- 02/24/2024 v7 (old)
Allen Ngo
Transparency
La sélection des appareils à examiner est effectuée par notre équipe éditoriale. L'échantillon de test a été prêté à l'auteur par le fabricant ou le détaillant pour les besoins de cet examen. Le prêteur n'a pas eu d'influence sur cette évaluation et le fabricant n'a pas reçu de copie de cette évaluation avant sa publication. Il n'y avait aucune obligation de publier cet article. En tant que média indépendant, Notebookcheck n'est pas soumis à l'autorité des fabricants, des détaillants ou des éditeurs.
Voici comment Notebookcheck teste
Chaque année, Notebookcheck examine de manière indépendante des centaines d'ordinateurs portables et de smartphones en utilisant des procédures standardisées afin de garantir que tous les résultats sont comparables. Nous avons continuellement développé nos méthodes de test depuis environ 20 ans et avons établi des normes industrielles dans le processus. Dans nos laboratoires de test, des équipements de mesure de haute qualité sont utilisés par des techniciens et des rédacteurs expérimentés. Ces tests impliquent un processus de validation en plusieurs étapes. Notre système d'évaluation complexe repose sur des centaines de mesures et de points de référence bien fondés, ce qui garantit l'objectivité.Price comparison

