Test de l'Asus ProArt StudioBook Pro 17 W700G3T (i7-9750H, RTX 3000 Max-Q, FHD) : station de travail mobile imparfaite
Note | Date | Modèle | Poids | Épaisseur | Taille | Résolution | Prix |
|---|---|---|---|---|---|---|---|
| 86.4 % v7 (old) | 06/20 | Asus ProArt StudioBook Pro 17 W700G3T i7-9750H, Quadro RTX 3000 Max-Q | 2.5 kg | 18.4 mm | 17.00" | 1920x1200 | |
| 83.8 % v7 (old) | 06/19 | MSI WS75 9TL-636 i7-9750H, Quadro RTX 4000 (Laptop) | 2.3 kg | 18.95 mm | 17.30" | 1920x1080 | |
| 89.7 % v7 (old) | 04/20 | Apple MacBook Pro 16 2019 i9 5500M i9-9880H, Radeon Pro 5500M | 2 kg | 16.2 mm | 16.00" | 3072x1920 | |
| 84.7 % v7 (old) | 05/20 | Acer ConceptD 5 CN517-71-74YA i7-9750H, GeForce RTX 2060 Mobile | 2.8 kg | 24 mm | 17.30" | 3840x2160 | |
| 87 % v7 (old) | 05/20 | Gigabyte Aero 17 HDR XB i7-10875H, GeForce RTX 2070 Super Max-Q | 2.7 kg | 21 mm | 17.30" | 3840x2160 |
| SD Card Reader | |
| average JPG Copy Test (av. of 3 runs) | |
| Gigabyte Aero 17 HDR XB (Toshiba Exceria Pro SDXC 64 GB UHS-II) | |
| Asus ProArt StudioBook Pro 17 W700G3T (Toshiba Exceria Pro SDXC 64 GB UHS-II) | |
| MSI WS75 9TL-636 (Toshiba Exceria Pro M501 64 GB UHS-II) | |
| Moyenne de la classe Workstation (49.6 - 681, n=14, 2 dernières années) | |
| maximum AS SSD Seq Read Test (1GB) | |
| Gigabyte Aero 17 HDR XB (Toshiba Exceria Pro SDXC 64 GB UHS-II) | |
| Asus ProArt StudioBook Pro 17 W700G3T (Toshiba Exceria Pro SDXC 64 GB UHS-II) | |
| Moyenne de la classe Workstation (87.6 - 1455, n=14, 2 dernières années) | |
| MSI WS75 9TL-636 (Toshiba Exceria Pro M501 64 GB UHS-II) | |


| |||||||||||||||||||||||||
Homogénéité de la luminosité: 88 %
Valeur mesurée au centre, sur batterie: 320 cd/m²
Contraste: 897:1 (Valeurs des noirs: 0.36 cd/m²)
ΔE ColorChecker Calman: 1.1 | ∀{0.5-29.43 Ø4.73}
calibrated: 0.8
ΔE Greyscale Calman: 0.8 | ∀{0.09-98 Ø4.97}
99.8% sRGB (Argyll 1.6.3 3D)
75.7% AdobeRGB 1998 (Argyll 1.6.3 3D)
84.7% AdobeRGB 1998 (Argyll 3D)
99.8% sRGB (Argyll 3D)
96.2% Display P3 (Argyll 3D)
Gamma: 2.23
CCT: 6479 K
| Asus ProArt StudioBook Pro 17 W700G3T 170PUW1-A00, IPS, 1920x1200, 17" | MSI WS75 9TL-636 B173HAN04.2, IPS, 1920x1080, 17.3" | Apple MacBook Pro 16 2019 i9 5500M APPA044, IPS, 3072x1920, 16" | Acer ConceptD 5 CN517-71-74YA AUO B173ZAN03, IPS, 3840x2160, 17.3" | Gigabyte Aero 17 HDR XB AUO B173ZAN03.2 (AUO329B), IPS, 3840x2160, 17.3" | |
|---|---|---|---|---|---|
| Display | -21% | 2% | 3% | ||
| Display P3 Coverage (%) | 96.2 | 64.5 -33% | 86.2 -10% | 86.5 -10% | |
| sRGB Coverage (%) | 99.8 | 91.1 -9% | 100 0% | 100 0% | |
| AdobeRGB 1998 Coverage (%) | 84.7 | 65.8 -22% | 99.1 17% | 100 18% | |
| Response Times | 5% | -23% | -31% | -11% | |
| Response Time Grey 50% / Grey 80% * (ms) | 41.2 ? | 39.2 ? 5% | 52.4 ? -27% | 55 ? -33% | 55.2 ? -34% |
| Response Time Black / White * (ms) | 29.6 ? | 28.4 ? 4% | 34.9 ? -18% | 38 ? -28% | 26 ? 12% |
| PWM Frequency (Hz) | 131700 | ||||
| Screen | -86% | -7% | -40% | 13% | |
| Brightness middle (cd/m²) | 323 | 300 -7% | 519 61% | 410 27% | 487 51% |
| Brightness (cd/m²) | 308 | 288 -6% | 477 55% | 383 24% | 475 54% |
| Brightness Distribution (%) | 88 | 86 -2% | 86 -2% | 88 0% | 95 8% |
| Black Level * (cd/m²) | 0.36 | 0.25 31% | 0.39 -8% | 0.58 -61% | 0.38 -6% |
| Contrast (:1) | 897 | 1200 34% | 1331 48% | 707 -21% | 1282 43% |
| Colorchecker dE 2000 * | 1.1 | 3.9 -255% | 2.28 -107% | 1.91 -74% | 1.19 -8% |
| Colorchecker dE 2000 max. * | 3.3 | 6 -82% | 6.54 -98% | 4.67 -42% | 2.43 26% |
| Colorchecker dE 2000 calibrated * | 0.8 | 2.3 -187% | 0.86 -8% | 1.09 -36% | 0.5 37% |
| Greyscale dE 2000 * | 0.8 | 4.3 -437% | 0.9 -13% | 3 -275% | 1.45 -81% |
| Gamma | 2.23 99% | 2.2 100% | 2145 0% | 2.18 101% | 2.21 100% |
| CCT | 6479 100% | 7391 88% | 6572 99% | 6338 103% | 6557 99% |
| Color Space (Percent of AdobeRGB 1998) (%) | 75.7 | 59.2 -22% | 78 3% | 87 15% | 88 16% |
| Color Space (Percent of sRGB) (%) | 99.8 | 91 -9% | 100 0% | 100 0% | |
| Moyenne finale (programmes/paramètres) | -34% /
-62% | -15% /
-10% | -23% /
-31% | 2% /
8% |
* ... Moindre est la valeur, meilleures sont les performances
Temps de réponse de l'écran
| ↔ Temps de réponse noir à blanc | ||
|---|---|---|
| 29.6 ms ... hausse ↗ et chute ↘ combinées | ↗ 16.4 ms hausse | 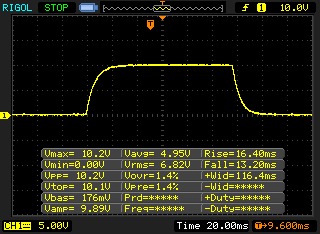 |
| ↘ 13.2 ms chute | ||
| L'écran souffre de latences relativement élevées, insuffisant pour le jeu. En comparaison, tous les appareils testés affichent entre 0.1 (minimum) et 240 (maximum) ms. » 79 % des appareils testés affichent de meilleures performances. Cela signifie que les latences relevées sont moins bonnes que la moyenne (19.9 ms) de tous les appareils testés. | ||
| ↔ Temps de réponse gris 50% à gris 80% | ||
| 41.2 ms ... hausse ↗ et chute ↘ combinées | ↗ 22 ms hausse | 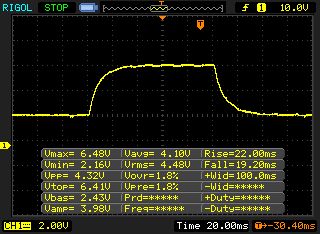 |
| ↘ 19.2 ms chute | ||
| L'écran souffre de latences très élevées, à éviter pour le jeu. En comparaison, tous les appareils testés affichent entre 0.165 (minimum) et 636 (maximum) ms. » 66 % des appareils testés affichent de meilleures performances. Cela signifie que les latences relevées sont moins bonnes que la moyenne (31.1 ms) de tous les appareils testés. | ||
Scintillement / MLI (Modulation de largeur d'impulsion)
| Scintillement / MLI (Modulation de largeur d'impulsion) non décelé | 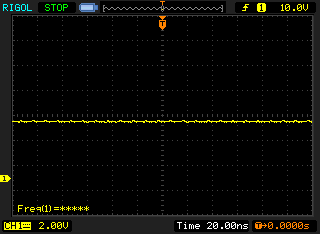 | ||
En comparaison, 52 % des appareils testés n'emploient pas MDI pour assombrir leur écran. Nous avons relevé une moyenne à 7794 (minimum : 5 - maximum : 343500) Hz dans le cas où une MDI était active. | |||
| PCMark 8 Home Score Accelerated v2 | 4322 points | |
| PCMark 8 Creative Score Accelerated v2 | 6968 points | |
| PCMark 8 Work Score Accelerated v2 | 5241 points | |
| PCMark 10 Score | 4918 points | |
Aide | ||

| Unigine Valley 1.0 | |
| 1920x1080 Extreme HD DirectX AA:x8 | |
| MSI WS75 9TL-636 | |
| Asus ProArt StudioBook Pro 17 W700G3T | |
| Moyenne NVIDIA Quadro RTX 3000 Max-Q (n=1) | |
| Moyenne de la classe Workstation (n=12 dernières années) | |
| Lenovo ThinkPad P73-20QR002DGE | |
| 1920x1080 Extreme HD Preset OpenGL AA:x8 | |
| MSI WS75 9TL-636 | |
| Asus ProArt StudioBook Pro 17 W700G3T | |
| Moyenne NVIDIA Quadro RTX 3000 Max-Q (n=1) | |
| Lenovo ThinkPad P73-20QR002DGE | |
| Moyenne de la classe Workstation (n=12 dernières années) | |
| Apple MacBook Pro 16 2019 i9 5500M | |
| 3DMark 11 Performance | 14763 points | |
| 3DMark Ice Storm Standard Score | 79168 points | |
| 3DMark Cloud Gate Standard Score | 32299 points | |
| 3DMark Fire Strike Score | 12130 points | |
| 3DMark Fire Strike Extreme Score | 6117 points | |
| 3DMark Time Spy Score | 5070 points | |
Aide | ||
| Bas | Moyen | Élevé | Ultra | QHD | 4K | |
|---|---|---|---|---|---|---|
| GTA V (2015) | 155 | 150 | 111.8 | 58.5 | 49.4 | 65 |
| The Witcher 3 (2015) | 236 | 166 | 95.9 | 48.5 | 33.8 | |
| Dota 2 Reborn (2015) | 131 | 120 | 115 | 109 | 75.6 | |
| Rise of the Tomb Raider (2016) | 195 | 139 | 96.7 | 80.8 | 34 | |
| X-Plane 11.11 (2018) | 106 | 92 | 78.6 | 64.4 | ||
| Shadow of the Tomb Raider (2018) | 86 | 76 | 71 | 65 | 43 | 21 |
| Hitman 2 (2018) | 66.3 | 63.2 | 57.5 | 55.9 | 44.8 | 24.3 |
| Dirt Rally 2.0 (2019) | 203 | 128 | 101 | 64 | 47.2 | |
| The Division 2 (2019) | 114 | 86 | 68 | 50 | 34 | 17 |
| Ghost Recon Breakpoint (2019) | 75 | 65 | 59 | 45 | 32 | 16 |
| GRID 2019 (2019) | 93 | 72.4 | 66.3 | 51.4 | 46.6 | 21.2 |
| Call of Duty Modern Warfare 2019 (2019) | 142.5 | 93.8 | 81 | 54.3 | 34 | 17.5 |
| Need for Speed Heat (2019) | 82 | 74.7 | 66.7 | 61.9 | 47.5 | 25.9 |
| Star Wars Jedi Fallen Order (2019) | 76.8 | 71.8 | 66.3 | 46.8 | 24.1 | |
| Doom Eternal (2020) | 178.3 | 119.2 | 104.4 | 102.6 | 67.5 | 31.6 |
Degré de la nuisance sonore
| Au repos |
| 29.4 / 29.9 / 29.9 dB(A) |
| Fortement sollicité |
| 31.6 / 31.6 dB(A) |
 | ||
30 dB silencieux 40 dB(A) audible 50 dB(A) bruyant |
||
min: | ||
| Asus ProArt StudioBook Pro 17 W700G3T Quadro RTX 3000 Max-Q, i7-9750H, Samsung SSD PM981 MZVLB1T0HALR | MSI WS75 9TL-636 Quadro RTX 4000 (Laptop), i7-9750H, Samsung SSD PM981 MZVLB1T0HALR | Apple MacBook Pro 16 2019 i9 5500M Radeon Pro 5500M, i9-9880H, Apple SSD AP1024 7171 | Acer ConceptD 5 CN517-71-74YA GeForce RTX 2060 Mobile, i7-9750H, WDC PC SN720 SDAQNTW-1T00 | Gigabyte Aero 17 HDR XB GeForce RTX 2070 Super Max-Q, i7-10875H, Samsung SSD PM981a MZVLB512HBJQ | |
|---|---|---|---|---|---|
| Noise | -14% | -18% | -12% | -35% | |
| arrêt / environnement * (dB) | 29.4 | 29.4 -0% | 29.8 -1% | 29.8 -1% | 30 -2% |
| Idle Minimum * (dB) | 29.4 | 29.4 -0% | 29.9 -2% | 29.7 -1% | 35 -19% |
| Idle Average * (dB) | 29.9 | 30.1 -1% | 29.9 -0% | 29.7 1% | 36 -20% |
| Idle Maximum * (dB) | 29.9 | 30.9 -3% | 29.9 -0% | 29.7 1% | 38 -27% |
| Load Average * (dB) | 31.6 | 40.7 -29% | 43 -36% | 39.9 -26% | 47 -49% |
| Witcher 3 ultra * (dB) | 31.6 | 41.9 -33% | 45.4 -44% | 39.5 -25% | 49 -55% |
| Load Maximum * (dB) | 31.6 | 42.7 -35% | 46.1 -46% | 41 -30% | 54 -71% |
* ... Moindre est la valeur, meilleures sont les performances
(-) La température maximale du côté supérieur est de 45.4 °C / 114 F, par rapport à la moyenne de 38.2 °C / 101 F, allant de 22.2 à 69.8 °C pour la classe Workstation.
(-) Le fond chauffe jusqu'à un maximum de 53.7 °C / 129 F, contre une moyenne de 41.1 °C / 106 F
(+) En utilisation inactive, la température moyenne du côté supérieur est de 21.3 °C / 70 F, par rapport à la moyenne du dispositif de 32 °C / 90 F.
(±) En jouant à The Witcher 3, la température moyenne du côté supérieur est de 36.5 °C / 98 F, alors que la moyenne de l'appareil est de 32 °C / 90 F.
(+) Les repose-poignets et le pavé tactile sont plus froids que la température de la peau avec un maximum de 31.5 °C / 88.7 F et sont donc froids au toucher.
(-) La température moyenne de la zone de l'appui-paume de dispositifs similaires était de 27.8 °C / 82 F (-3.7 °C / #-6.7 F).
Asus ProArt StudioBook Pro 17 W700G3T analyse audio
(±) | le niveau sonore du haut-parleur est moyen mais bon (79# dB)
Basses 100 - 315 Hz
(-) | presque aucune basse - en moyenne 15% plus bas que la médiane
(±) | la linéarité des basses est moyenne (11% delta à la fréquence précédente)
Médiums 400 - 2000 Hz
(+) | médiane équilibrée - seulement 3.4% de la médiane
(+) | les médiums sont linéaires (4.4% delta à la fréquence précédente)
Aiguës 2 - 16 kHz
(+) | des sommets équilibrés - à seulement 4.5% de la médiane
(+) | les aigus sont linéaires (6.9% delta à la fréquence précédente)
Globalement 100 - 16 000 Hz
(±) | la linéarité du son global est moyenne (17.1% de différence avec la médiane)
Par rapport à la même classe
» 50% de tous les appareils testés de cette catégorie étaient meilleurs, 9% similaires, 41% pires
» Le meilleur avait un delta de 7%, la moyenne était de 17%, le pire était de 35%.
Par rapport à tous les appareils testés
» 31% de tous les appareils testés étaient meilleurs, 8% similaires, 61% pires
» Le meilleur avait un delta de 4%, la moyenne était de 24%, le pire était de 134%.
MSI WS75 9TL-636 analyse audio
(±) | le niveau sonore du haut-parleur est moyen mais bon (75.4# dB)
Basses 100 - 315 Hz
(-) | presque aucune basse - en moyenne 25.9% plus bas que la médiane
(±) | la linéarité des basses est moyenne (7.8% delta à la fréquence précédente)
Médiums 400 - 2000 Hz
(±) | médiane supérieure - en moyenne 5.2% supérieure à la médiane
(±) | la linéarité des médiums est moyenne (8.1% delta à la fréquence précédente)
Aiguës 2 - 16 kHz
(+) | des sommets équilibrés - à seulement 3.3% de la médiane
(±) | la linéarité des aigus est moyenne (9.3% delta à la fréquence précédente)
Globalement 100 - 16 000 Hz
(±) | la linéarité du son global est moyenne (27.5% de différence avec la médiane)
Par rapport à la même classe
» 94% de tous les appareils testés de cette catégorie étaient meilleurs, 2% similaires, 4% pires
» Le meilleur avait un delta de 7%, la moyenne était de 17%, le pire était de 35%.
Par rapport à tous les appareils testés
» 84% de tous les appareils testés étaient meilleurs, 3% similaires, 13% pires
» Le meilleur avait un delta de 4%, la moyenne était de 24%, le pire était de 134%.
| Éteint/en veille | |
| Au repos | |
| Fortement sollicité |
|
Légende:
min: | |
| Asus ProArt StudioBook Pro 17 W700G3T i7-9750H, Quadro RTX 3000 Max-Q, Samsung SSD PM981 MZVLB1T0HALR, IPS, 1920x1200, 17" | MSI WS75 9TL-636 i7-9750H, Quadro RTX 4000 (Laptop), Samsung SSD PM981 MZVLB1T0HALR, IPS, 1920x1080, 17.3" | Apple MacBook Pro 16 2019 i9 5500M i9-9880H, Radeon Pro 5500M, Apple SSD AP1024 7171, IPS, 3072x1920, 16" | Acer ConceptD 5 CN517-71-74YA i7-9750H, GeForce RTX 2060 Mobile, WDC PC SN720 SDAQNTW-1T00, IPS, 3840x2160, 17.3" | Gigabyte Aero 17 HDR XB i7-10875H, GeForce RTX 2070 Super Max-Q, Samsung SSD PM981a MZVLB512HBJQ, IPS, 3840x2160, 17.3" | Moyenne NVIDIA Quadro RTX 3000 Max-Q | Moyenne de la classe Workstation | |
|---|---|---|---|---|---|---|---|
| Power Consumption | -24% | 23% | 7% | -41% | 6% | 7% | |
| Idle Minimum * (Watt) | 11.3 | 16.4 -45% | 3.7 67% | 6.2 45% | 16 -42% | 7.7 ? 32% | 8.94 ? 21% |
| Idle Average * (Watt) | 16 | 21.6 -35% | 12.1 24% | 15.2 5% | 19 -19% | 14.6 ? 9% | 13.8 ? 14% |
| Idle Maximum * (Watt) | 16.8 | 22.9 -36% | 17 -1% | 17.4 -4% | 30 -79% | 16.9 ? -1% | 17.5 ? -4% |
| Load Average * (Watt) | 93.6 | 88 6% | 91.5 2% | 95 -1% | 109 -16% | 111.1 ? -19% | 95 ? -1% |
| Witcher 3 ultra * (Watt) | 106 | 137 -29% | 103 3% | 136 -28% | 167 -58% | ||
| Load Maximum * (Watt) | 186.6 | 193 -3% | 102.3 45% | 145 22% | 246 -32% | 173.5 ? 7% | 175.2 ? 6% |
* ... Moindre est la valeur, meilleures sont les performances
| Asus ProArt StudioBook Pro 17 W700G3T i7-9750H, Quadro RTX 3000 Max-Q, 57 Wh | MSI WS75 9TL-636 i7-9750H, Quadro RTX 4000 (Laptop), 82 Wh | Apple MacBook Pro 16 2019 i9 5500M i9-9880H, Radeon Pro 5500M, 99.8 Wh | Acer ConceptD 5 CN517-71-74YA i7-9750H, GeForce RTX 2060 Mobile, 55 Wh | Gigabyte Aero 17 HDR XB i7-10875H, GeForce RTX 2070 Super Max-Q, 94 Wh | Moyenne de la classe Workstation | |
|---|---|---|---|---|---|---|
| Autonomie de la batterie | 1% | 34% | -5% | 20% | 22% | |
| H.264 (h) | 6.9 | 8.2 19% | 9.7 41% | 9.51 ? 38% | ||
| WiFi v1.3 (h) | 5.9 | 6.6 12% | 12 103% | 5.6 -5% | 6.2 5% | 8.53 ? 45% |
| Load (h) | 1.7 | 1.2 -29% | 1 -41% | 2.3 35% | 1.429 ? -16% | |
| Reader / Idle (h) | 12.6 | 9.9 | 26.1 ? | |||
| Witcher 3 ultra (h) | 0.9 |
Points positifs
Points négatifs
Verdict
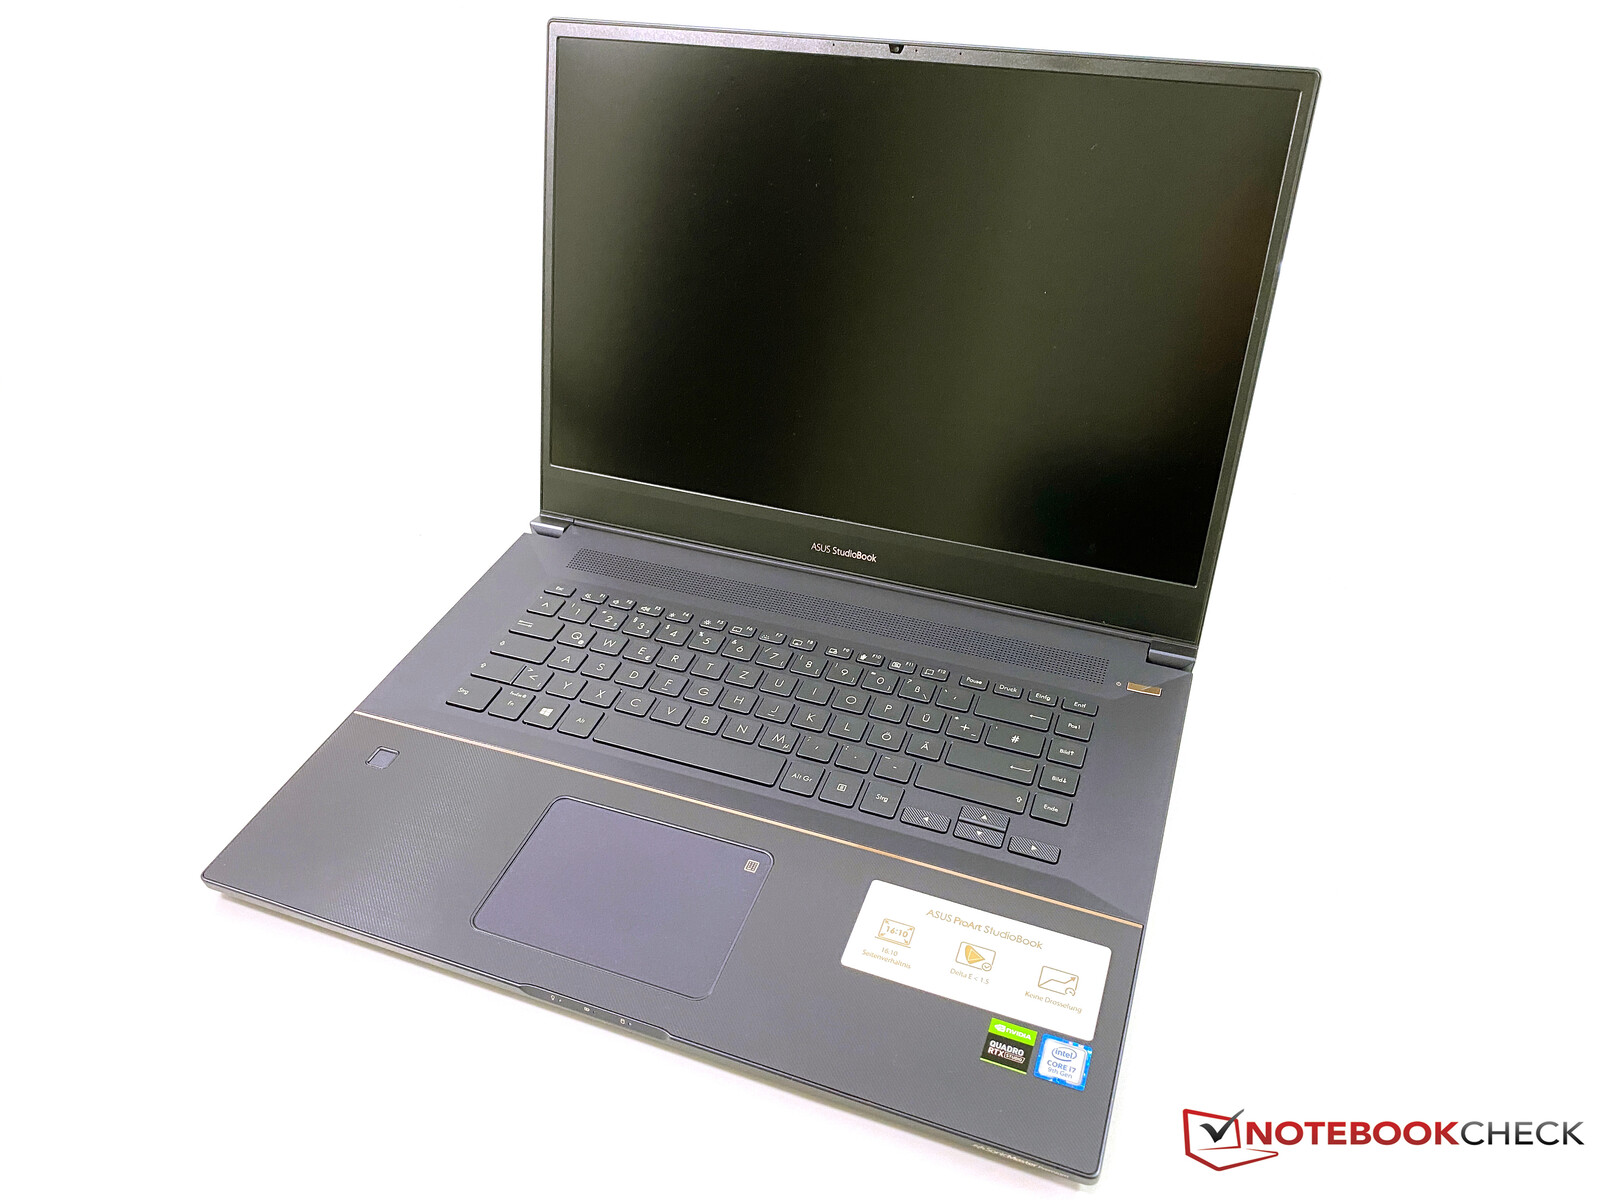
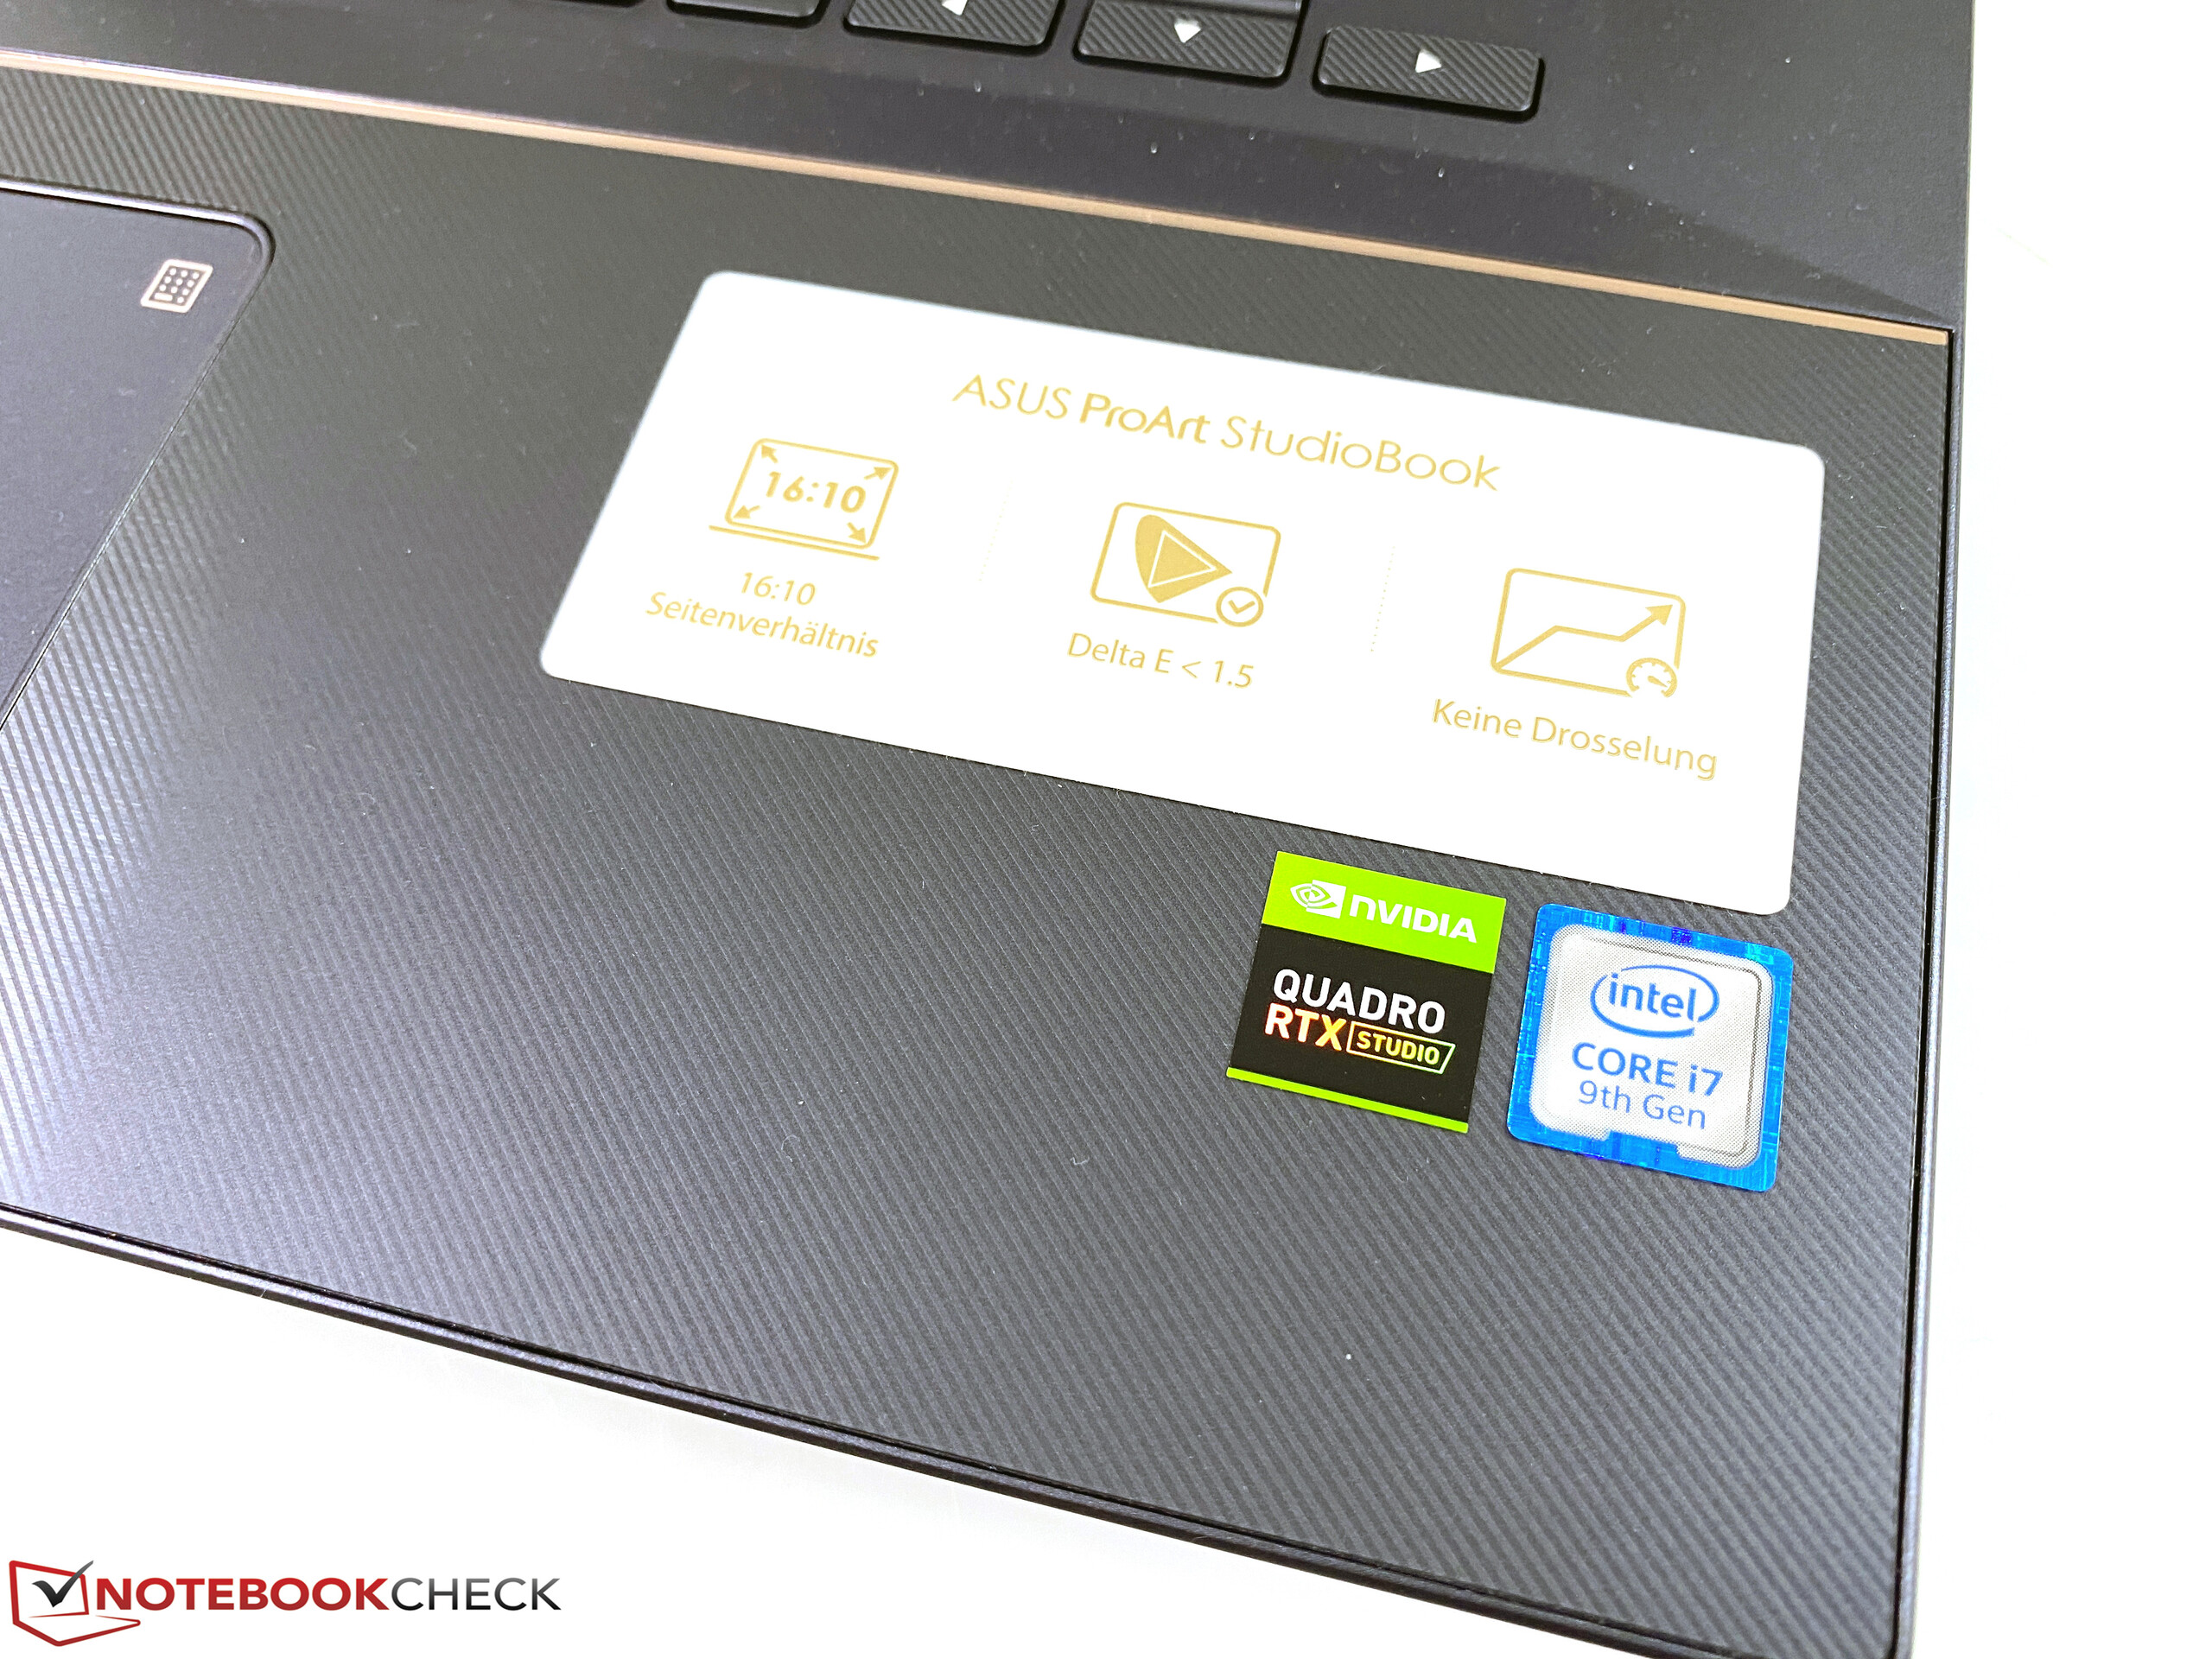
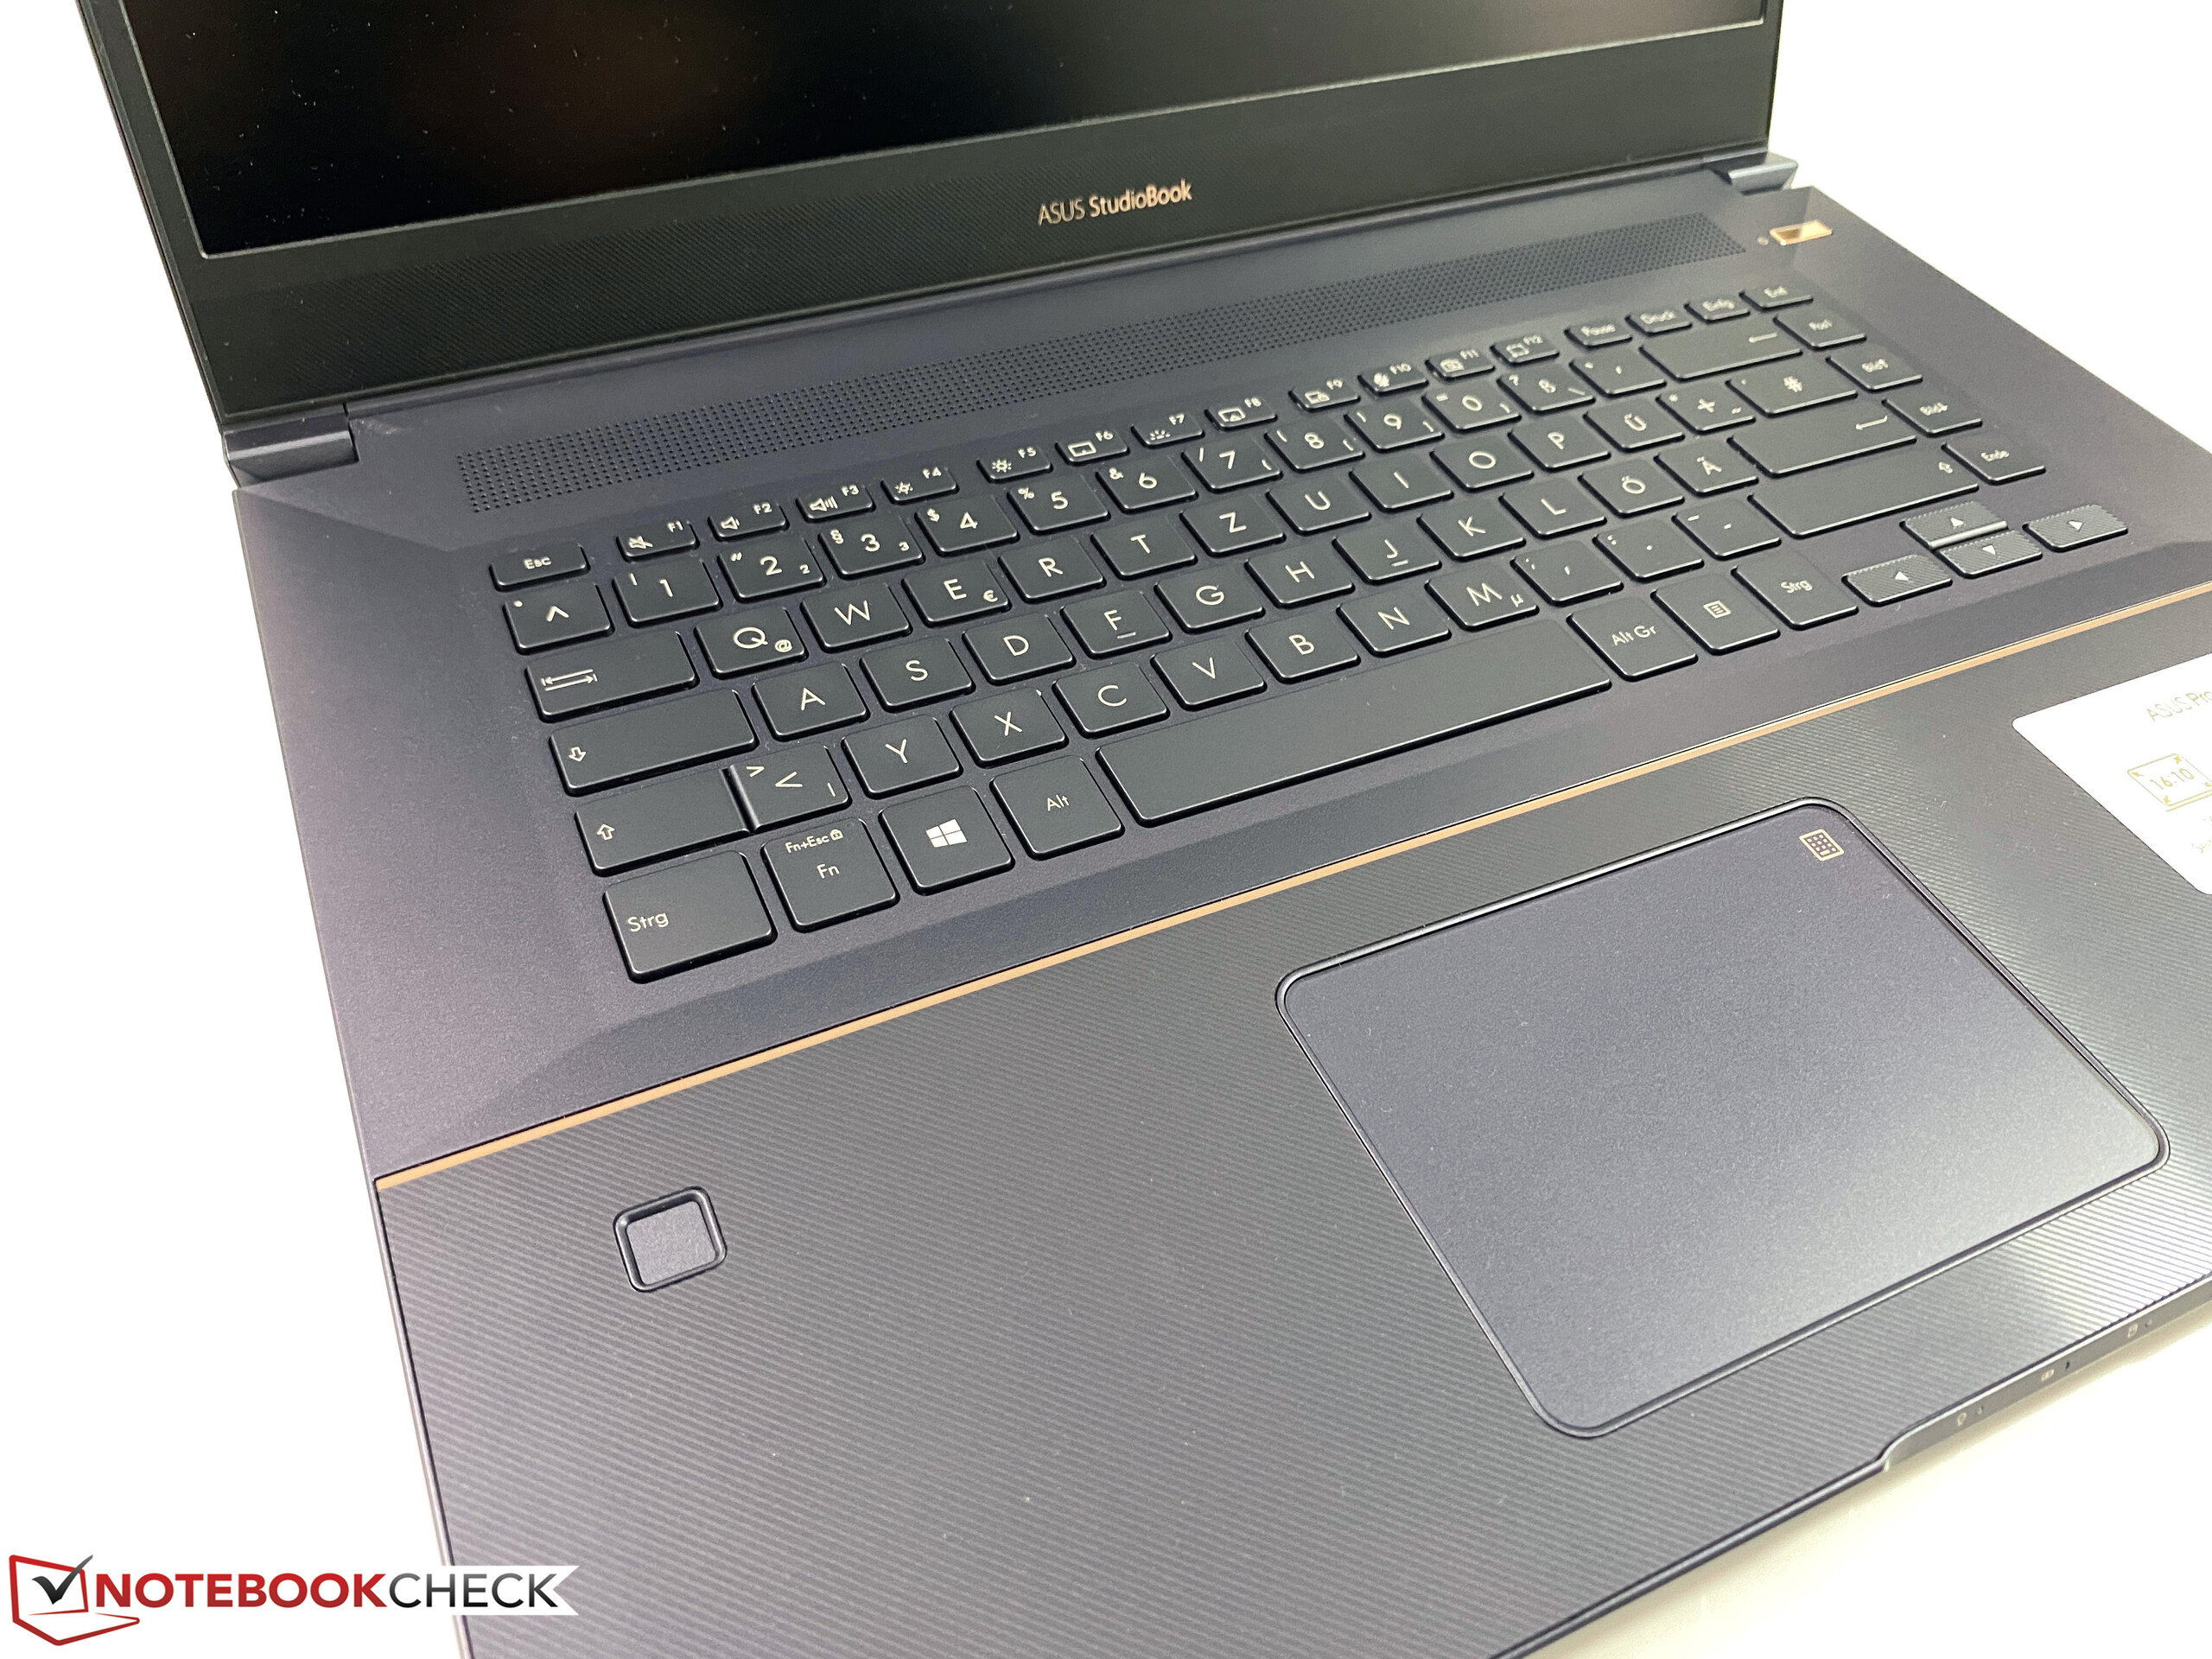
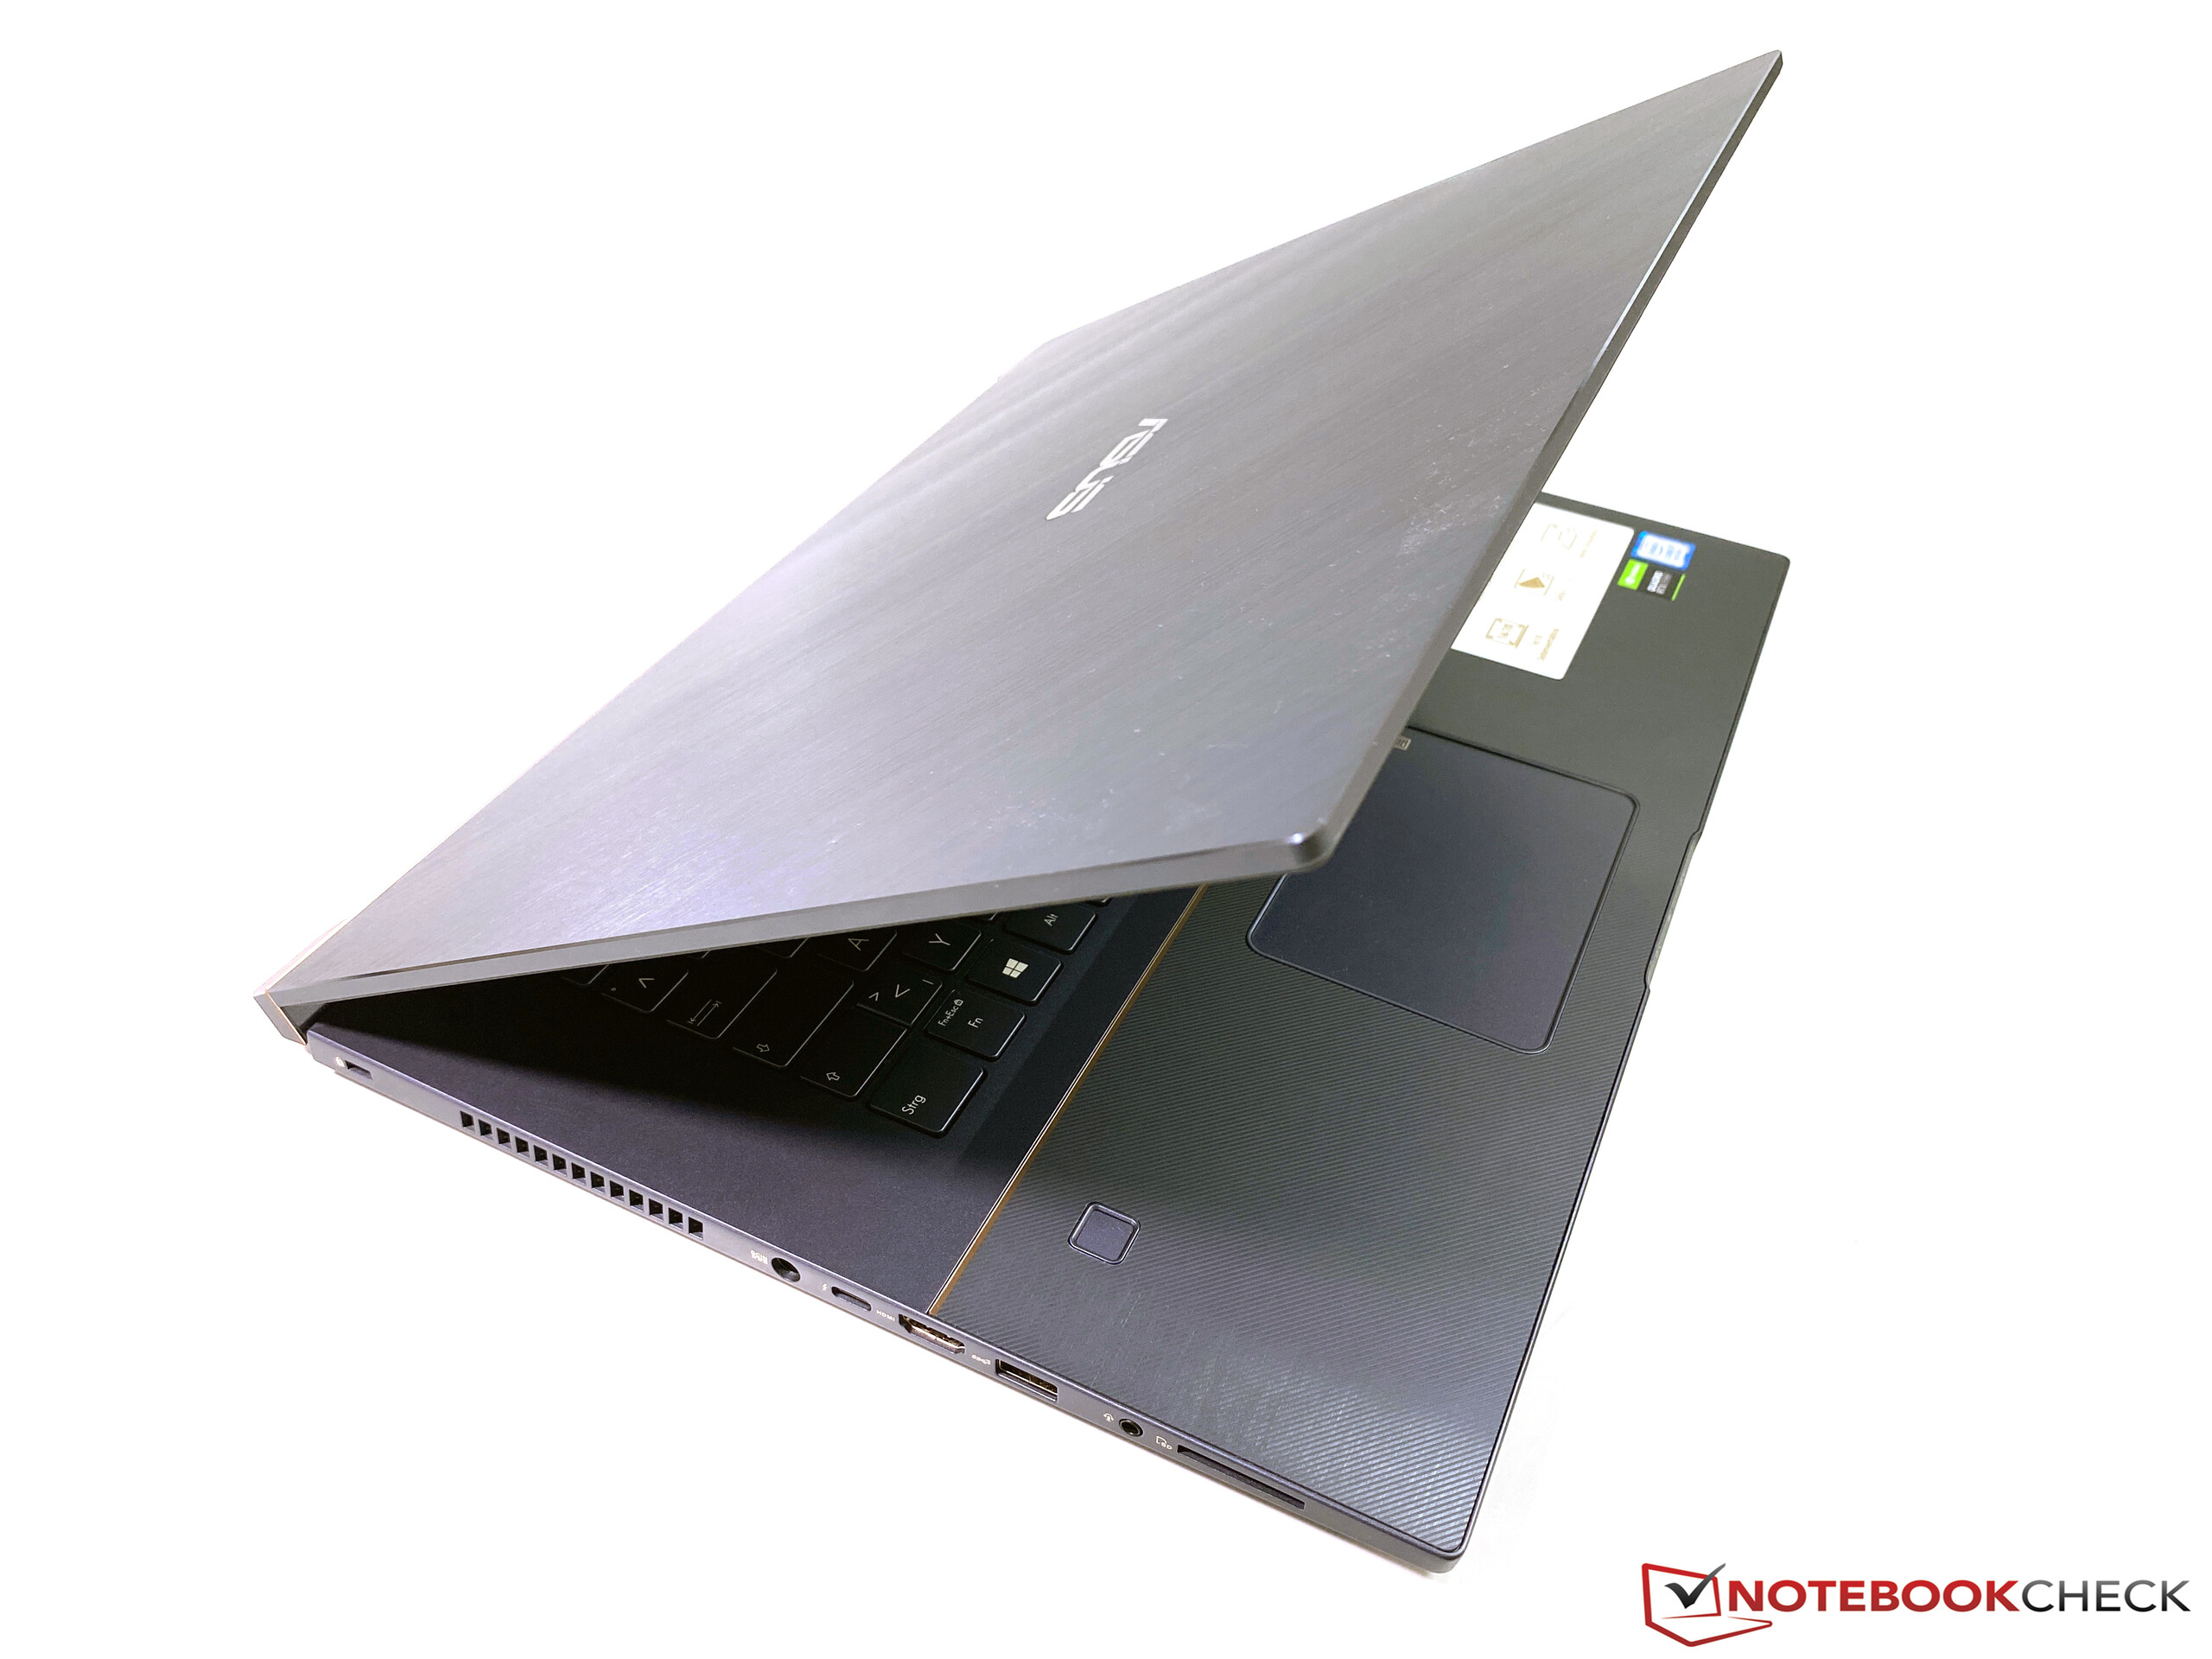
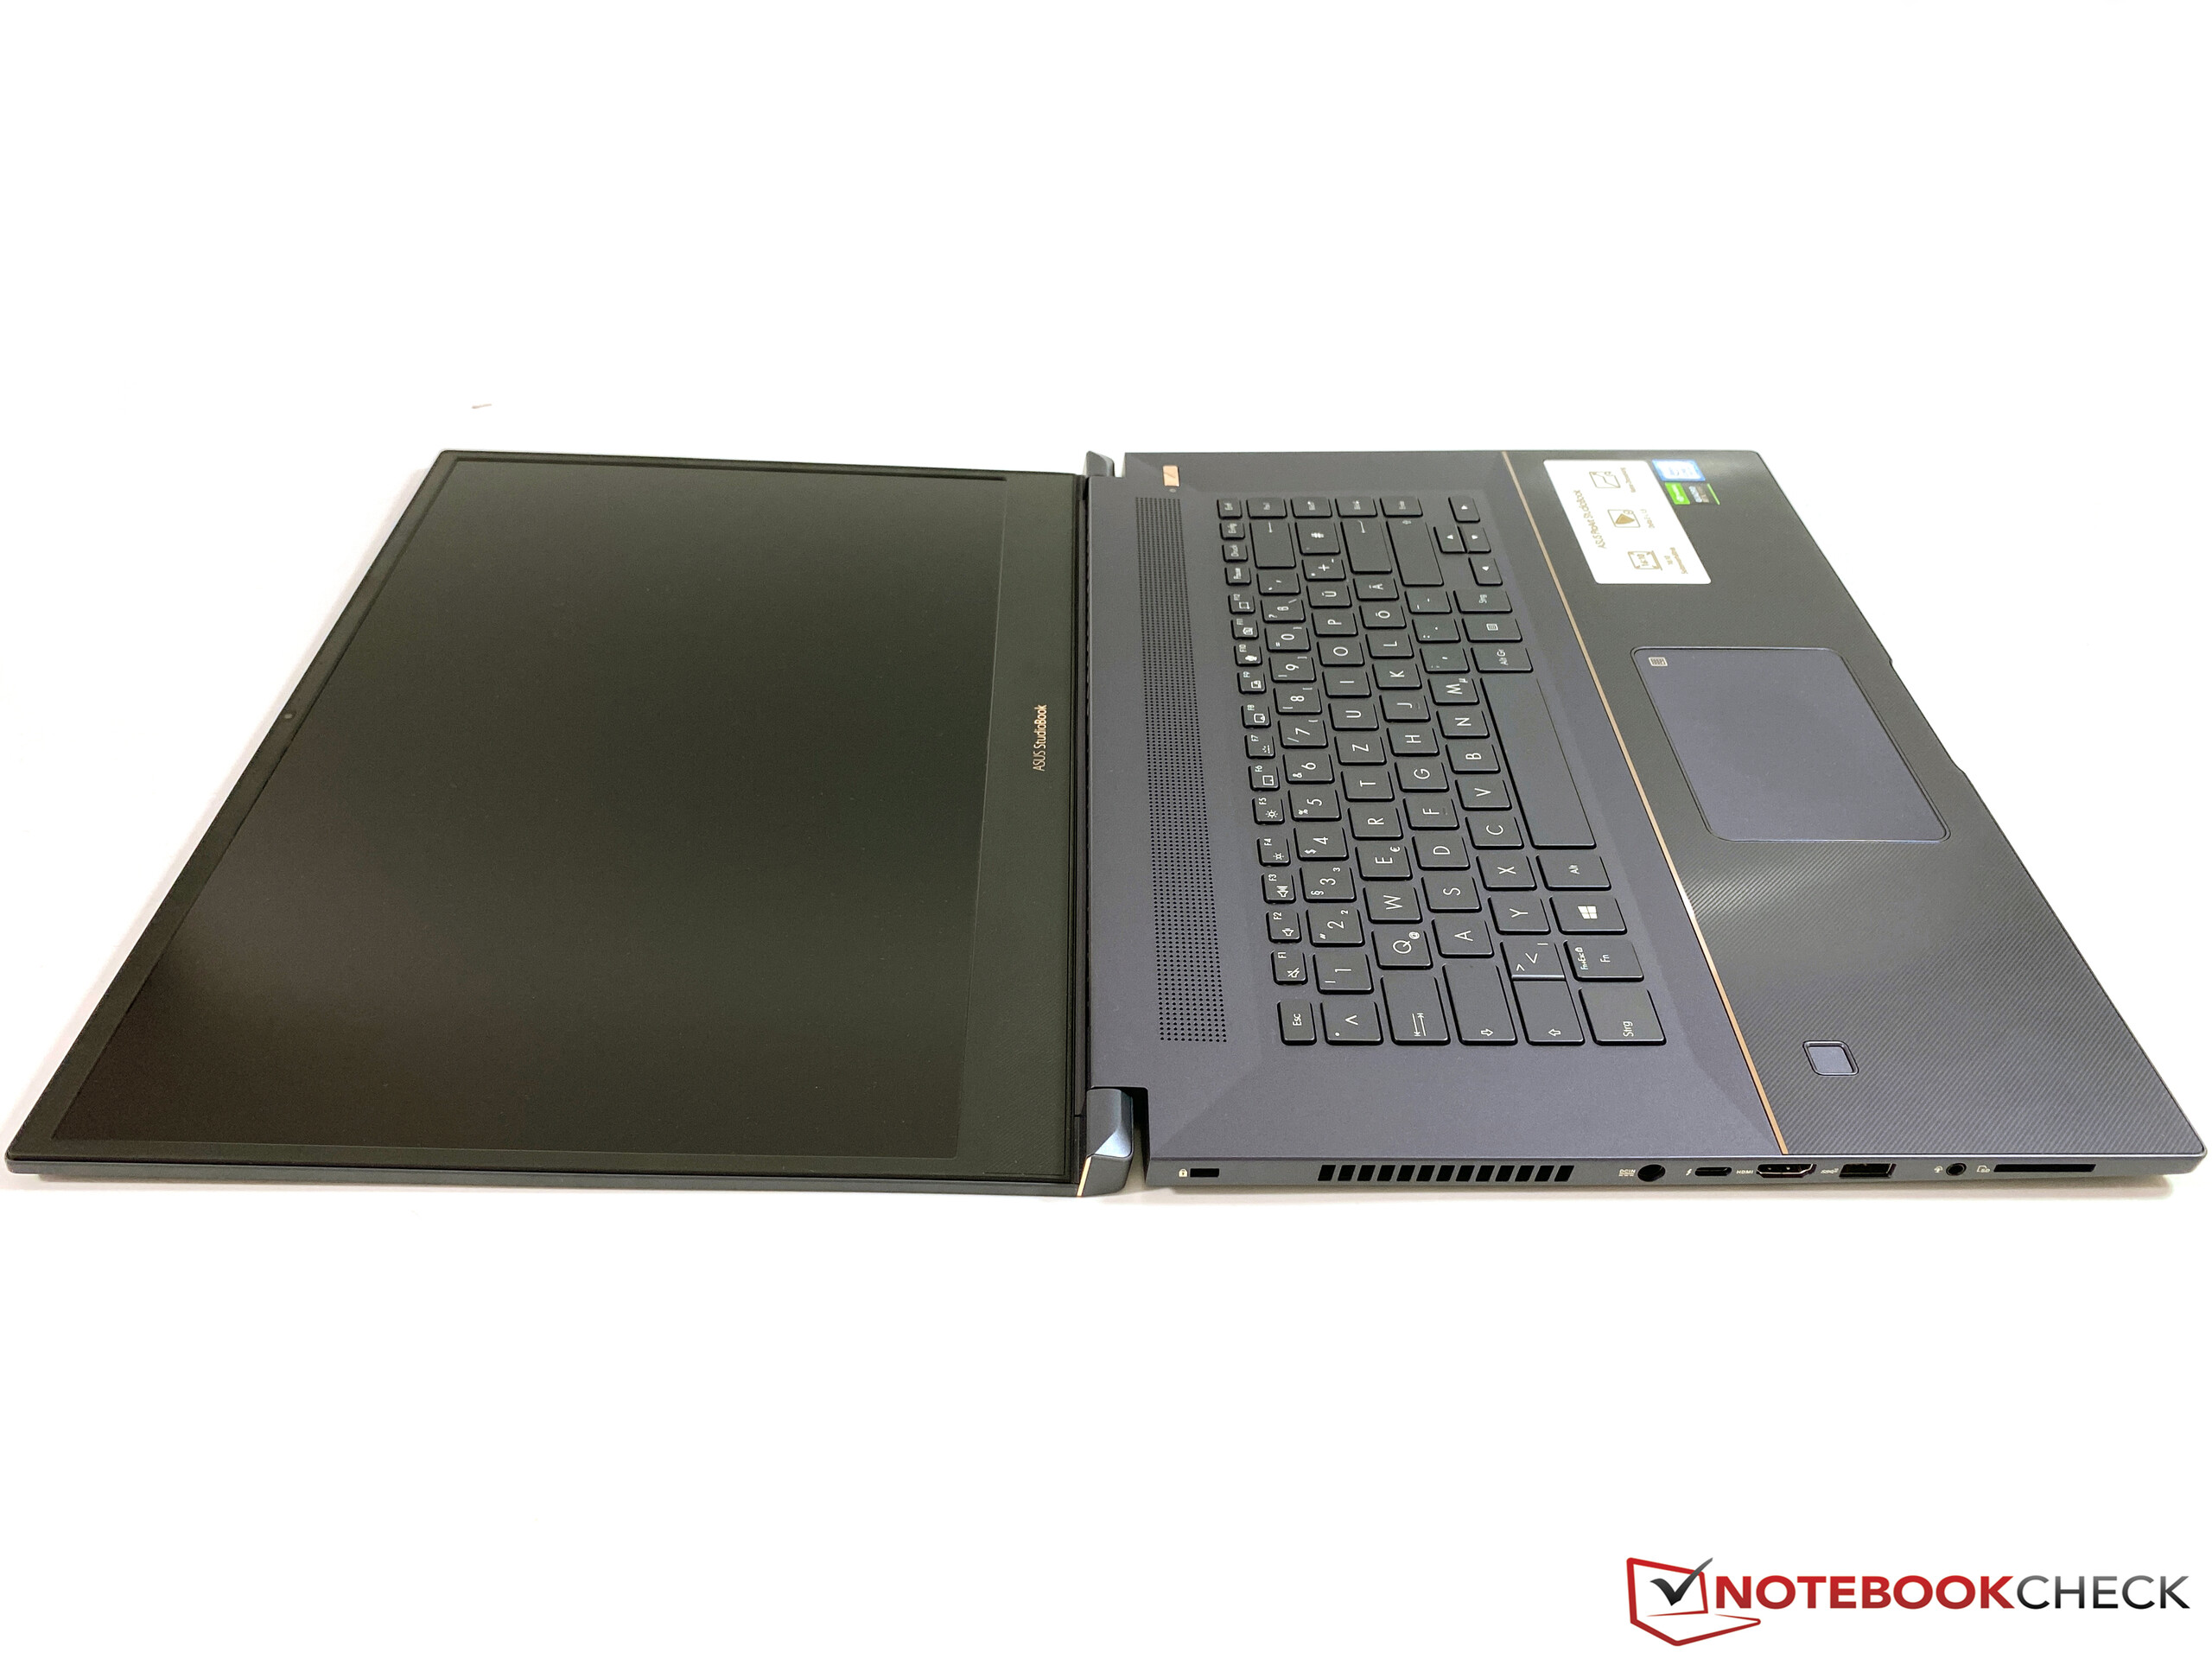
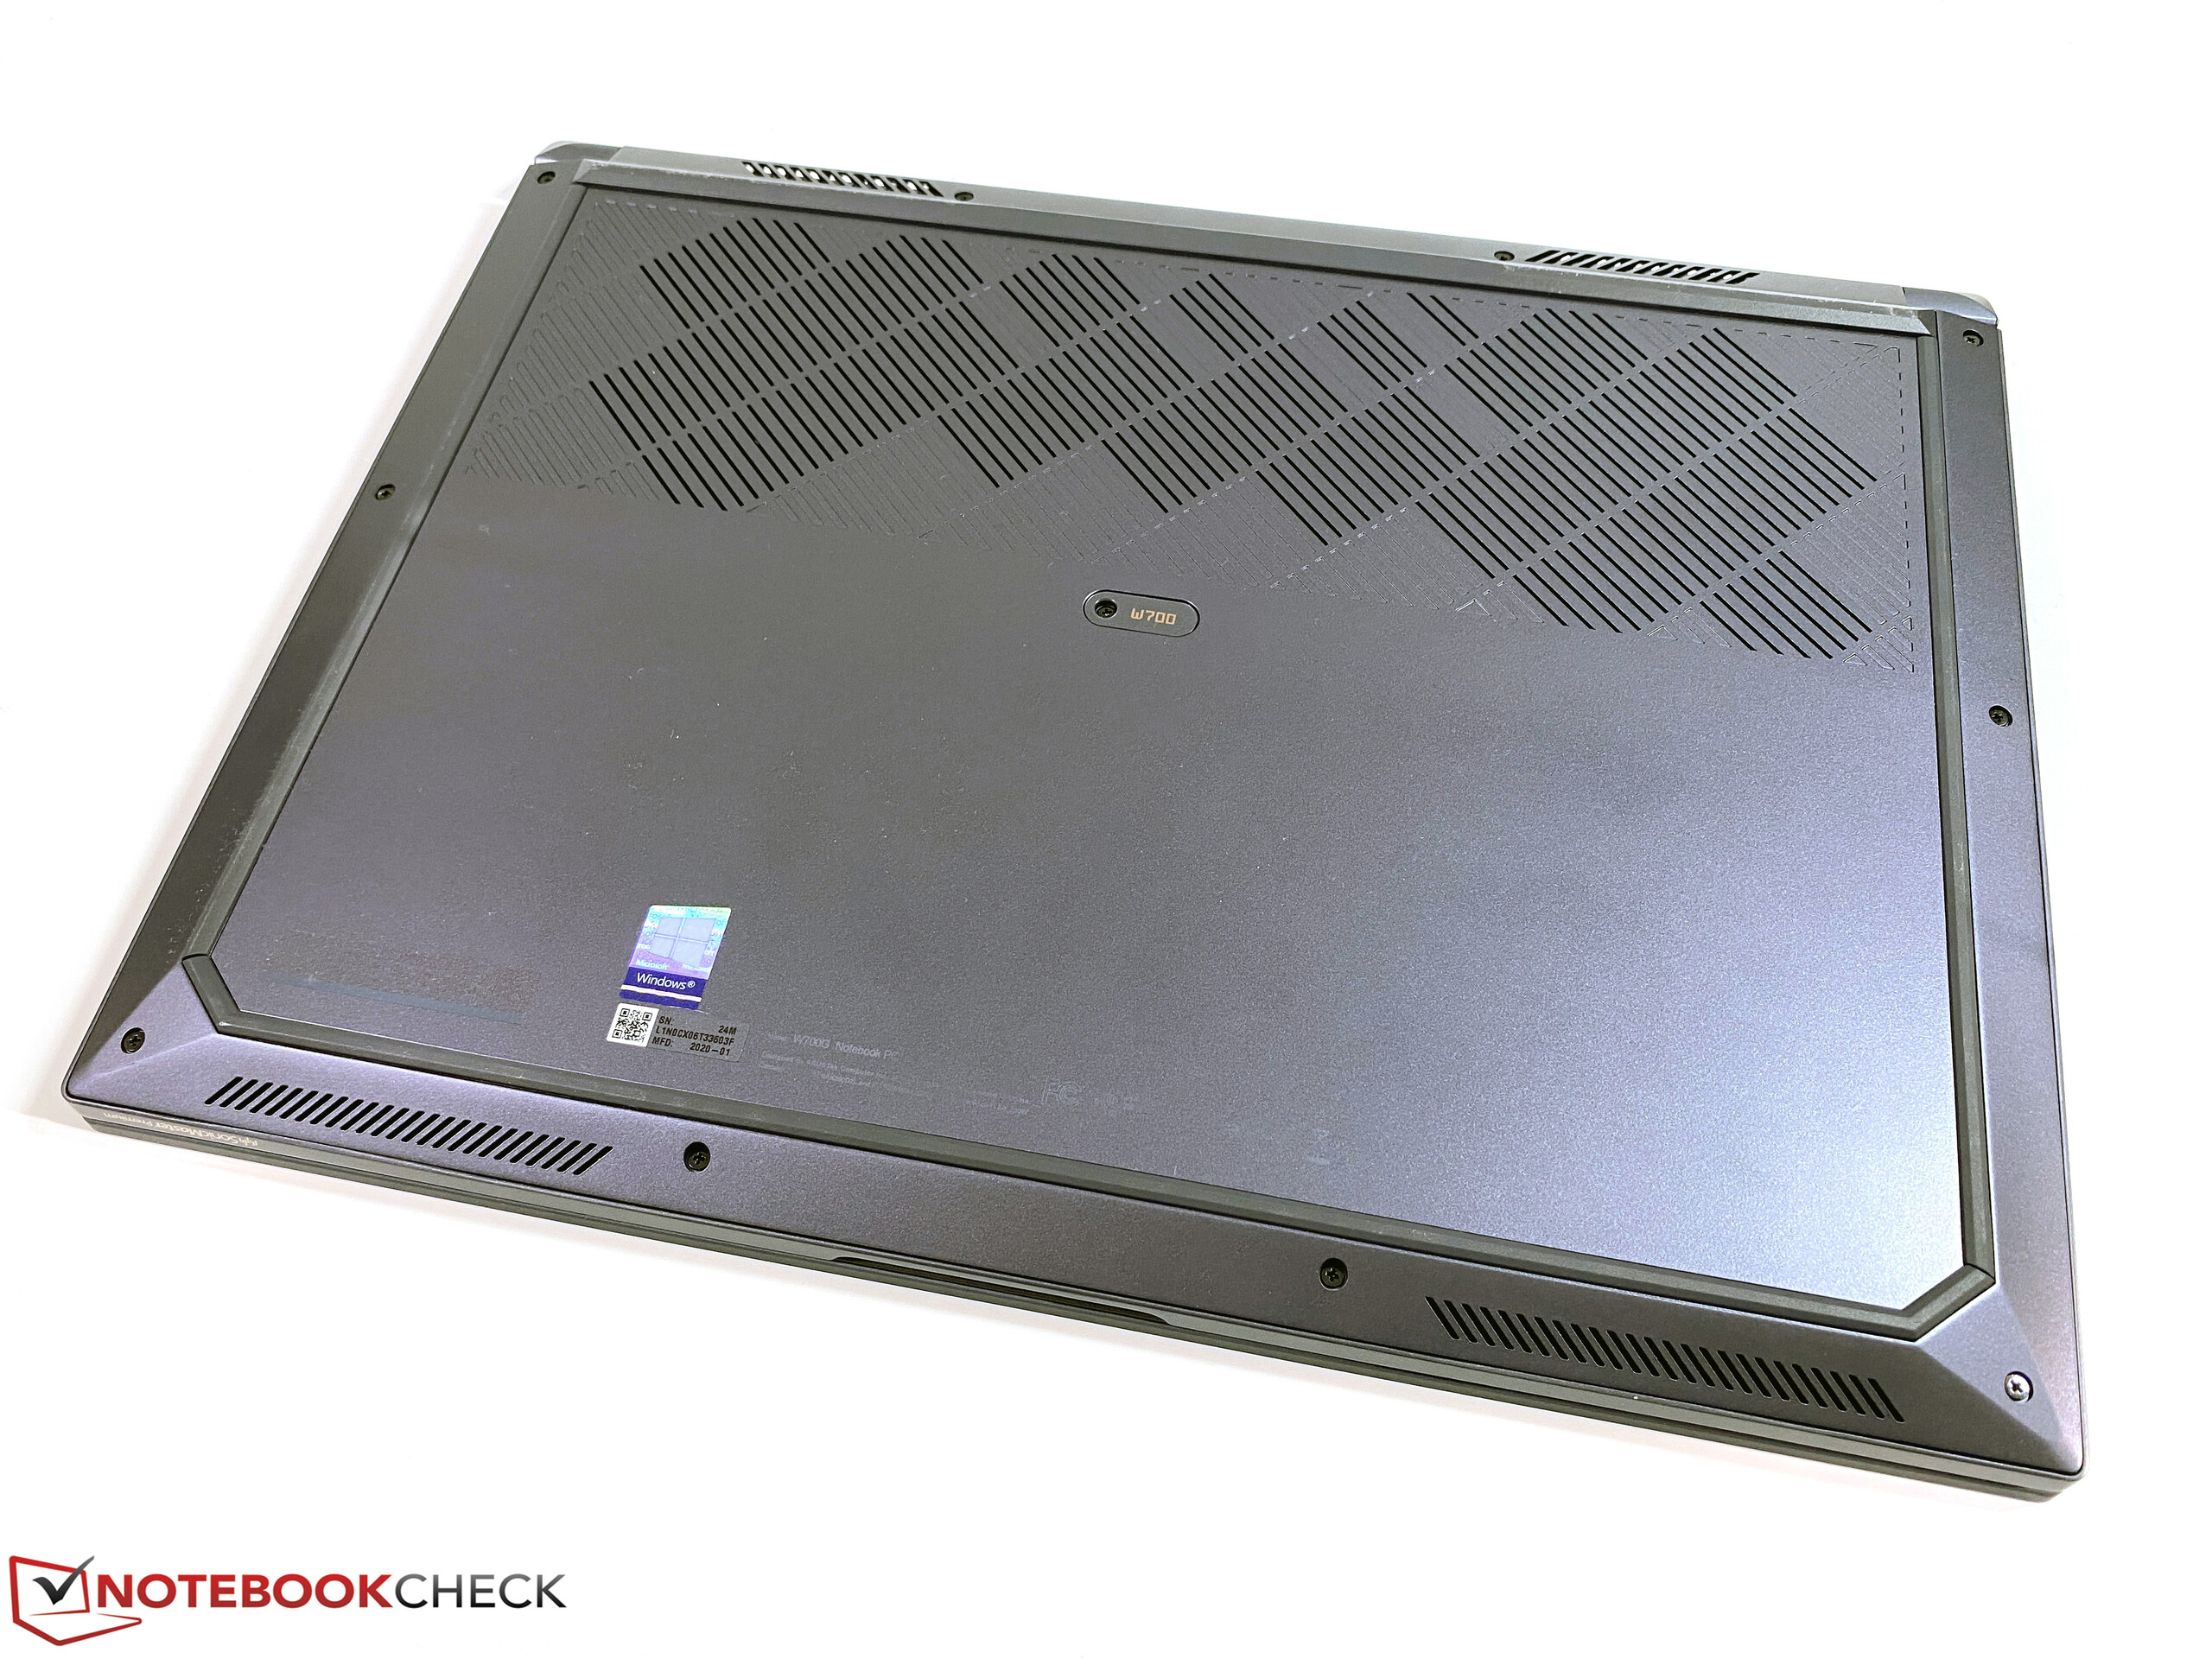
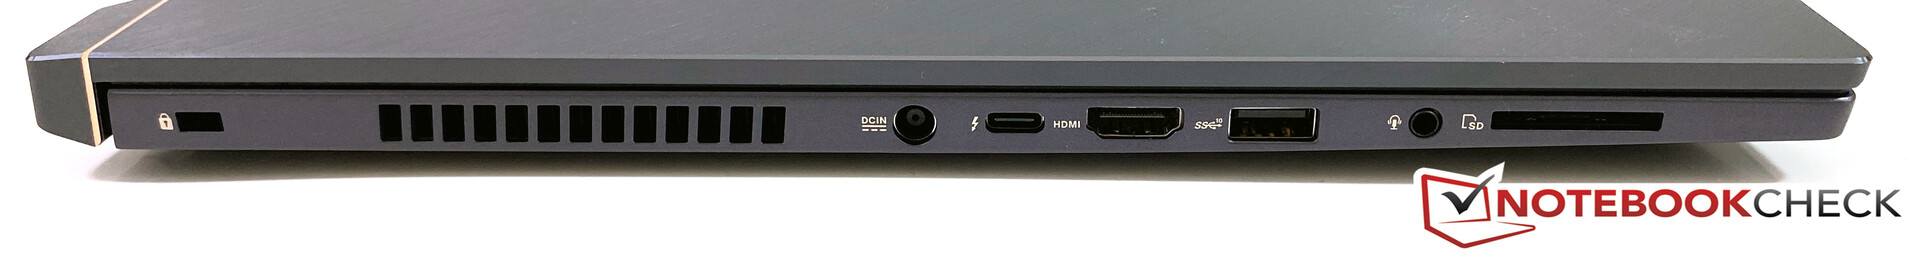
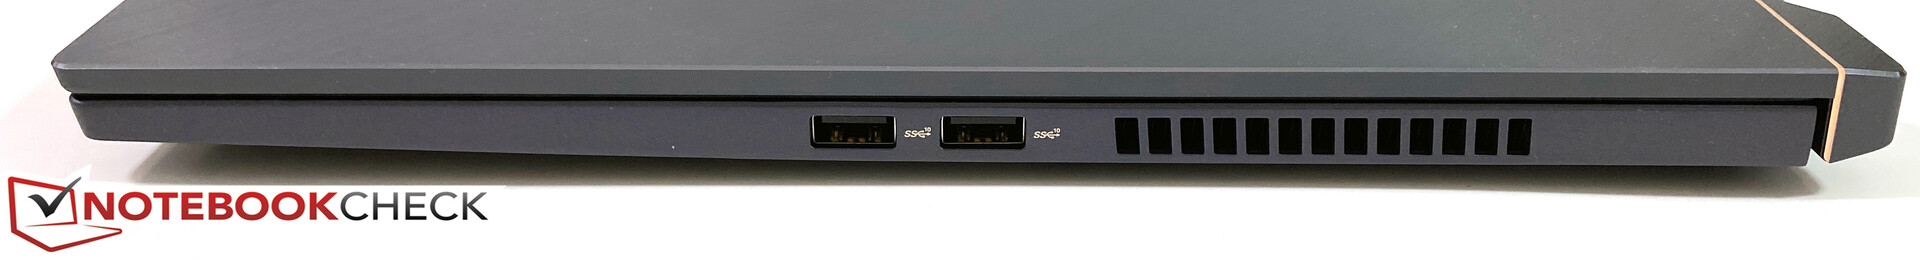
Asus essaye de vendre le StudioBook Pro 17 aux professionnels et aux créatifs. L'appareil de 17 pouces séduit grâce à son châssis fin mais rigide, mais certains détails doivent être améliorés. Cela inclut la disposition des ports, et en particulier l'entrée secteur, sur le côté gauche au centre, s'est constamment révélé gênant au long de nos tests. Les périphériques d'entrée sont corrects, mais avec également des compromis : au lieu d'un pavé numérique dédié (il y aurait eu assez de place pour en intégrer un), il y a un touchpad plutôt petit avec une fonction pavé numérique.
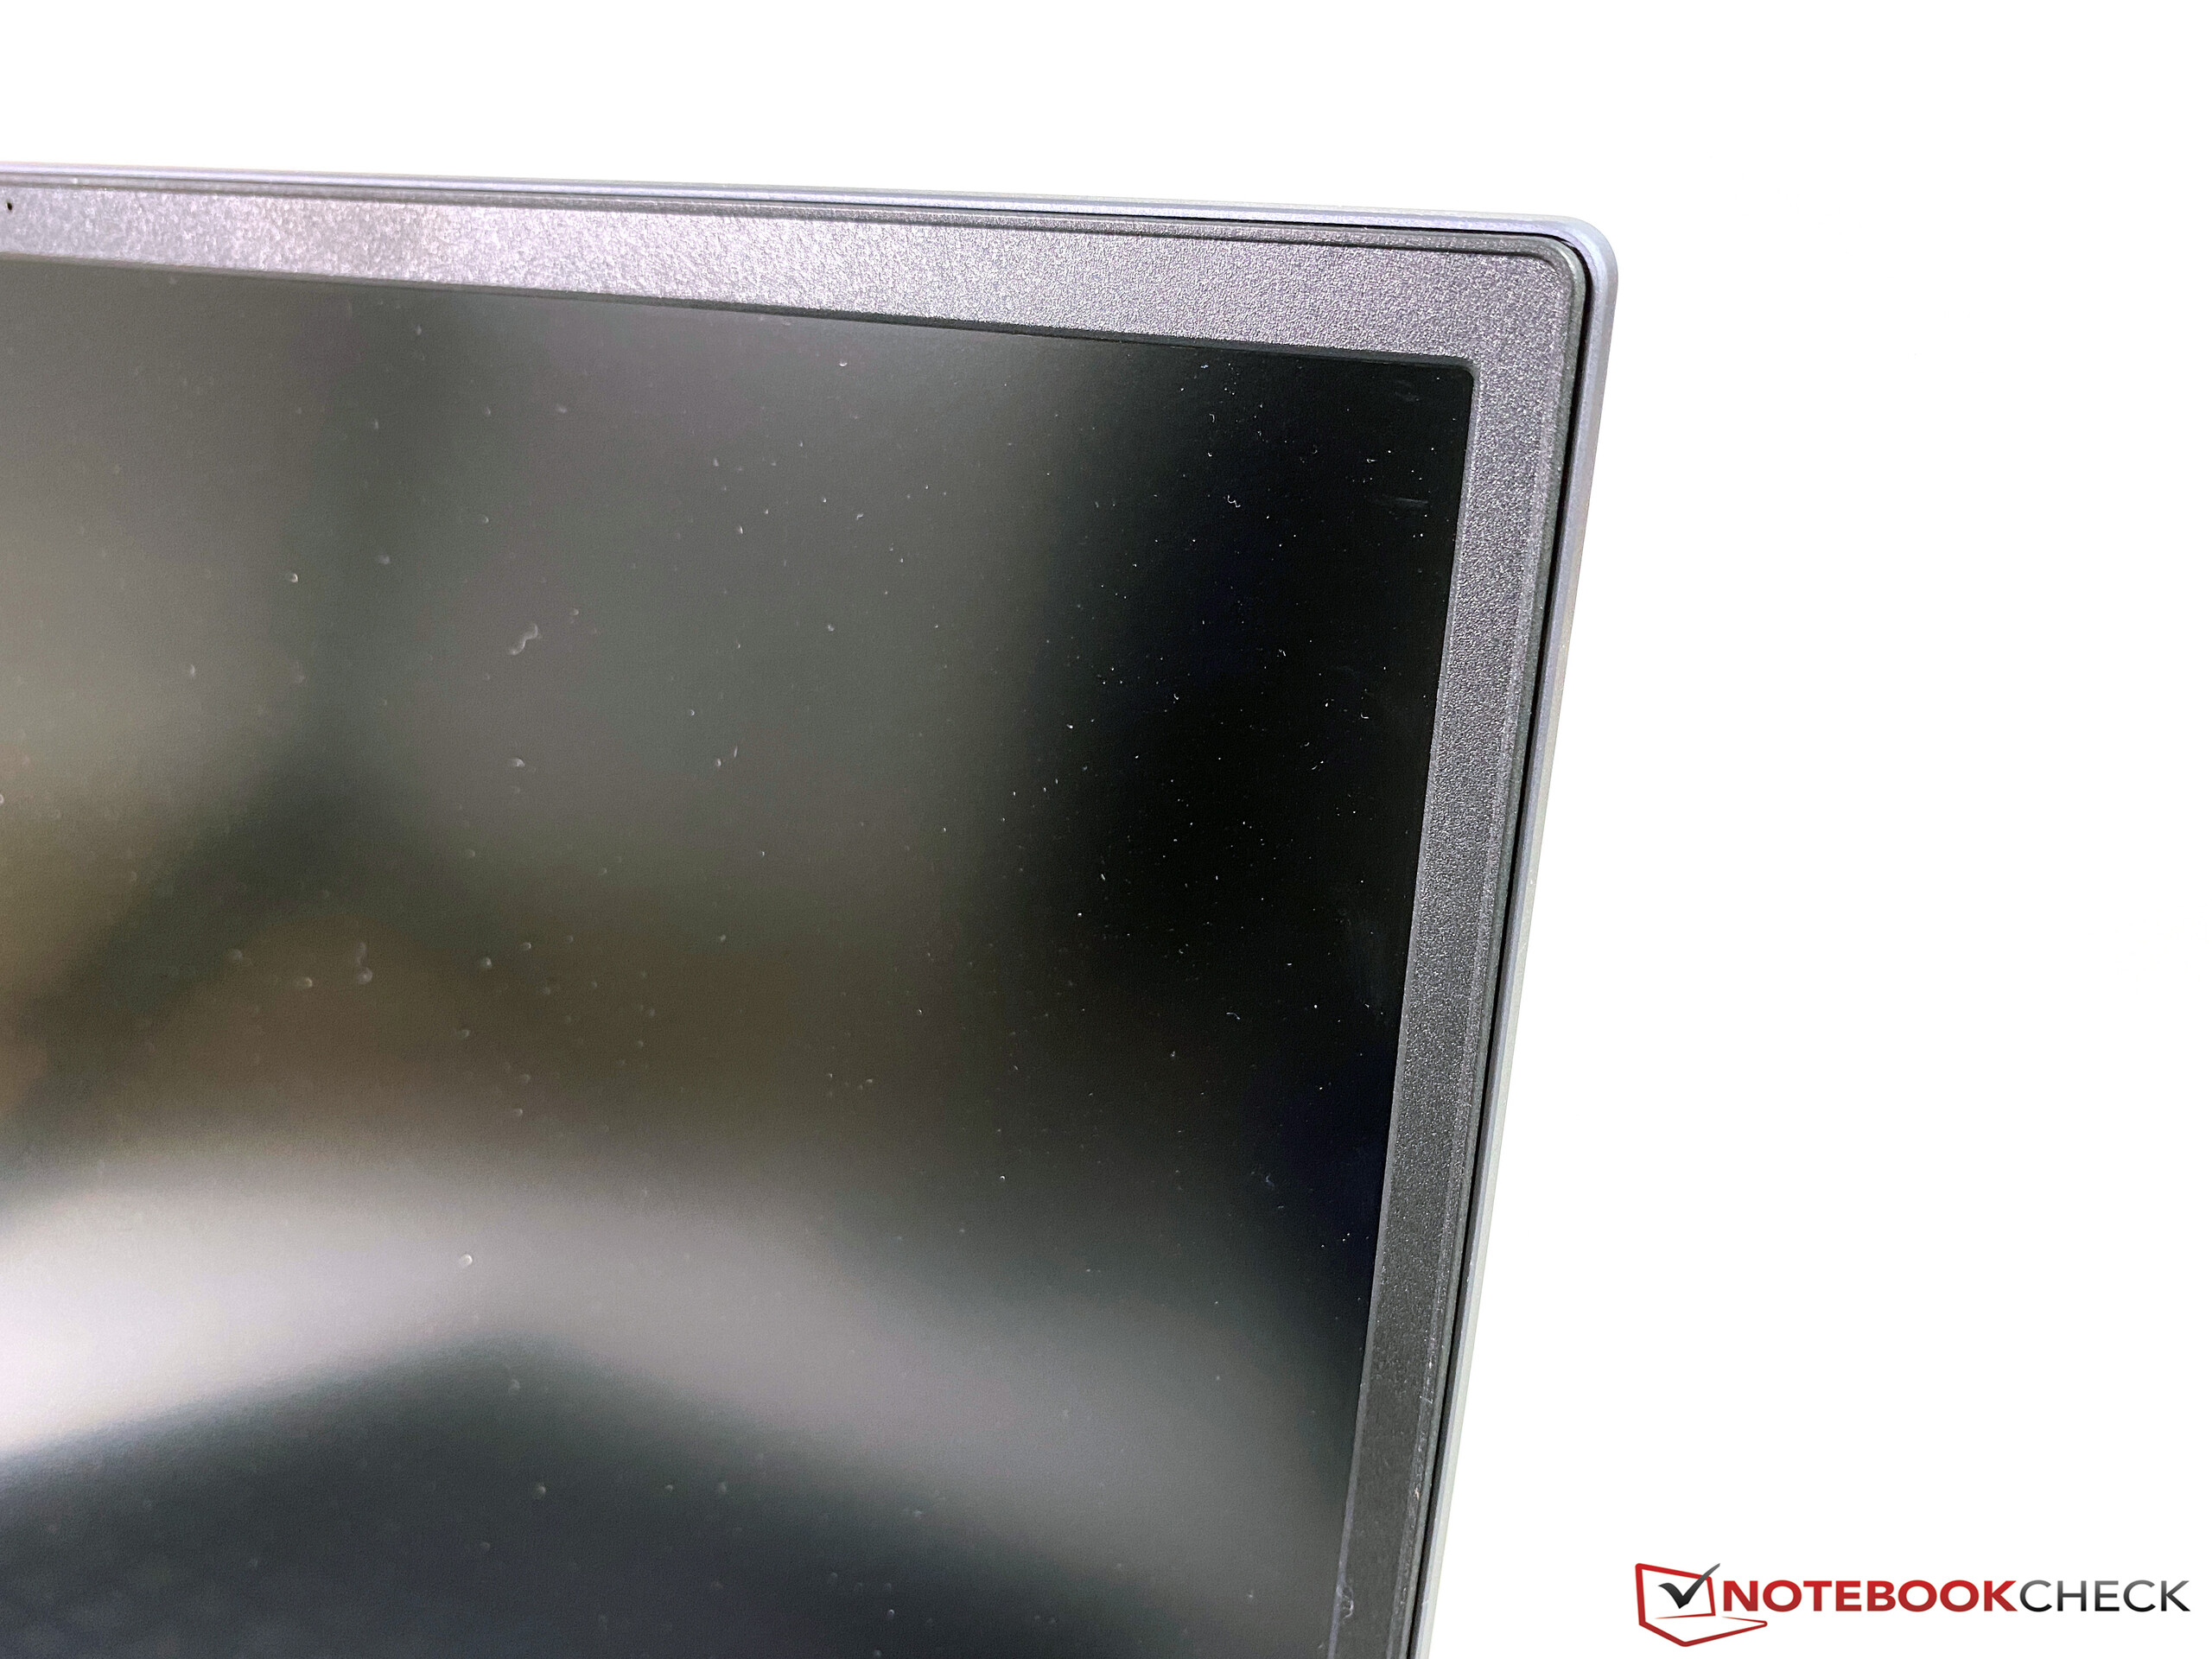
L'écran laisse également une impression mitigée. Nous apprécions qu'il s'agisse d'une dalle matte en 16:10, assez bien calibrée par le fabricant pour la gamme P3. Mais les caractéristiques de base (luminosité, valeur du noir, contraste) sont plutôt décevantes vu son prix élevé - et il n'y a pas d'autres options d'écran.
Une première mouture réussie, mais avec de petits détails qui affectent l'impression d'ensemble, surtout avec le prix élevé à l'esprit. Nous apprécierions que le successeur soit amélioré au regard des profils de performances et du contrôle des ventilateurs.
Les performances, ou plus précisément la gestion des performances, est bonne appareil branché, mais les profils pour ventilateur dans l'appli MyAsus ne sont pas très bien optimisés. Le réglage "Auto" par défaut garde les ventilateurs très discrets (également en cas de sollicitations), mais les performances sont en baisse, surtout quand les deux principaux composants sont utilisés simultanément. Le profil "Turbo" est quant à lui très sensible aux changements de sollicitations, ce qui est en pratique vite gênant. Nous aimerions également voir une intégration de ces options dans le panneau Performances de Windows.
Au final, le StudioBook Pro 17 est une bonne station de travail mobile, mais son prix de presque 3900 € est plutôt raide. D'autres fabricants proposent également des performances graphiques plus élevées dans leurs stations de travail fines.
L’intégralité de cette critique est disponible en anglais en suivant ce lien.
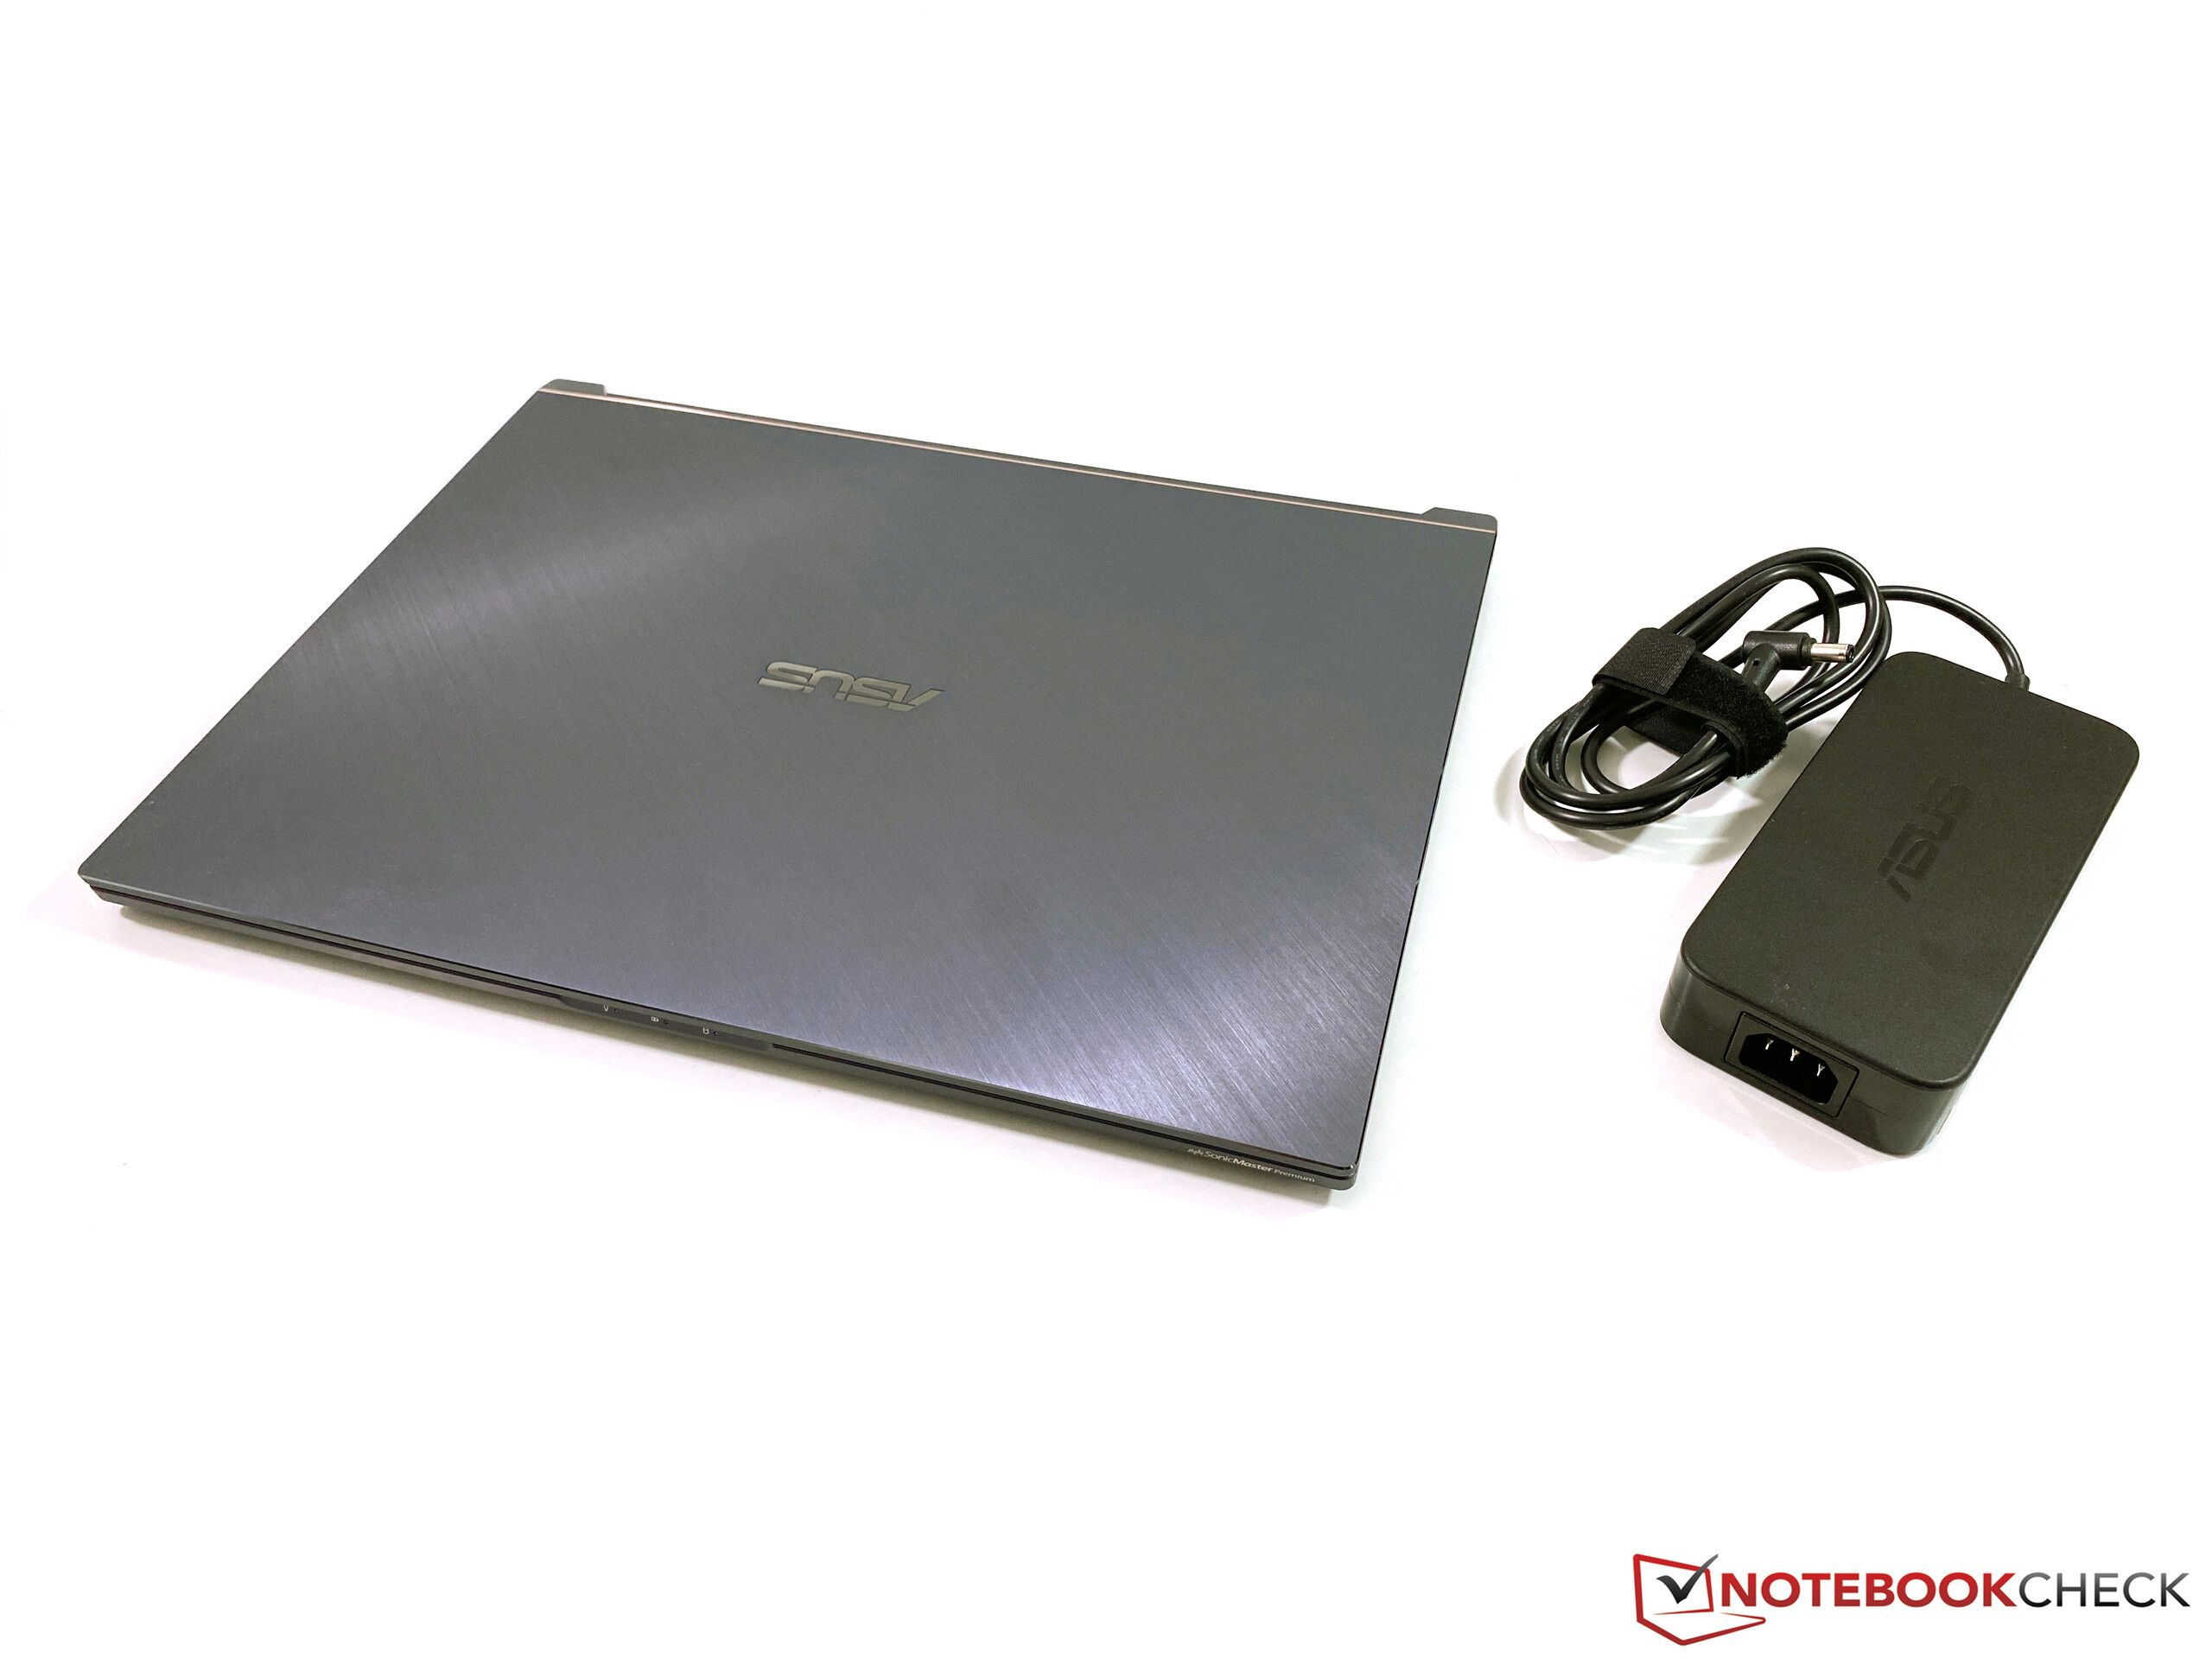
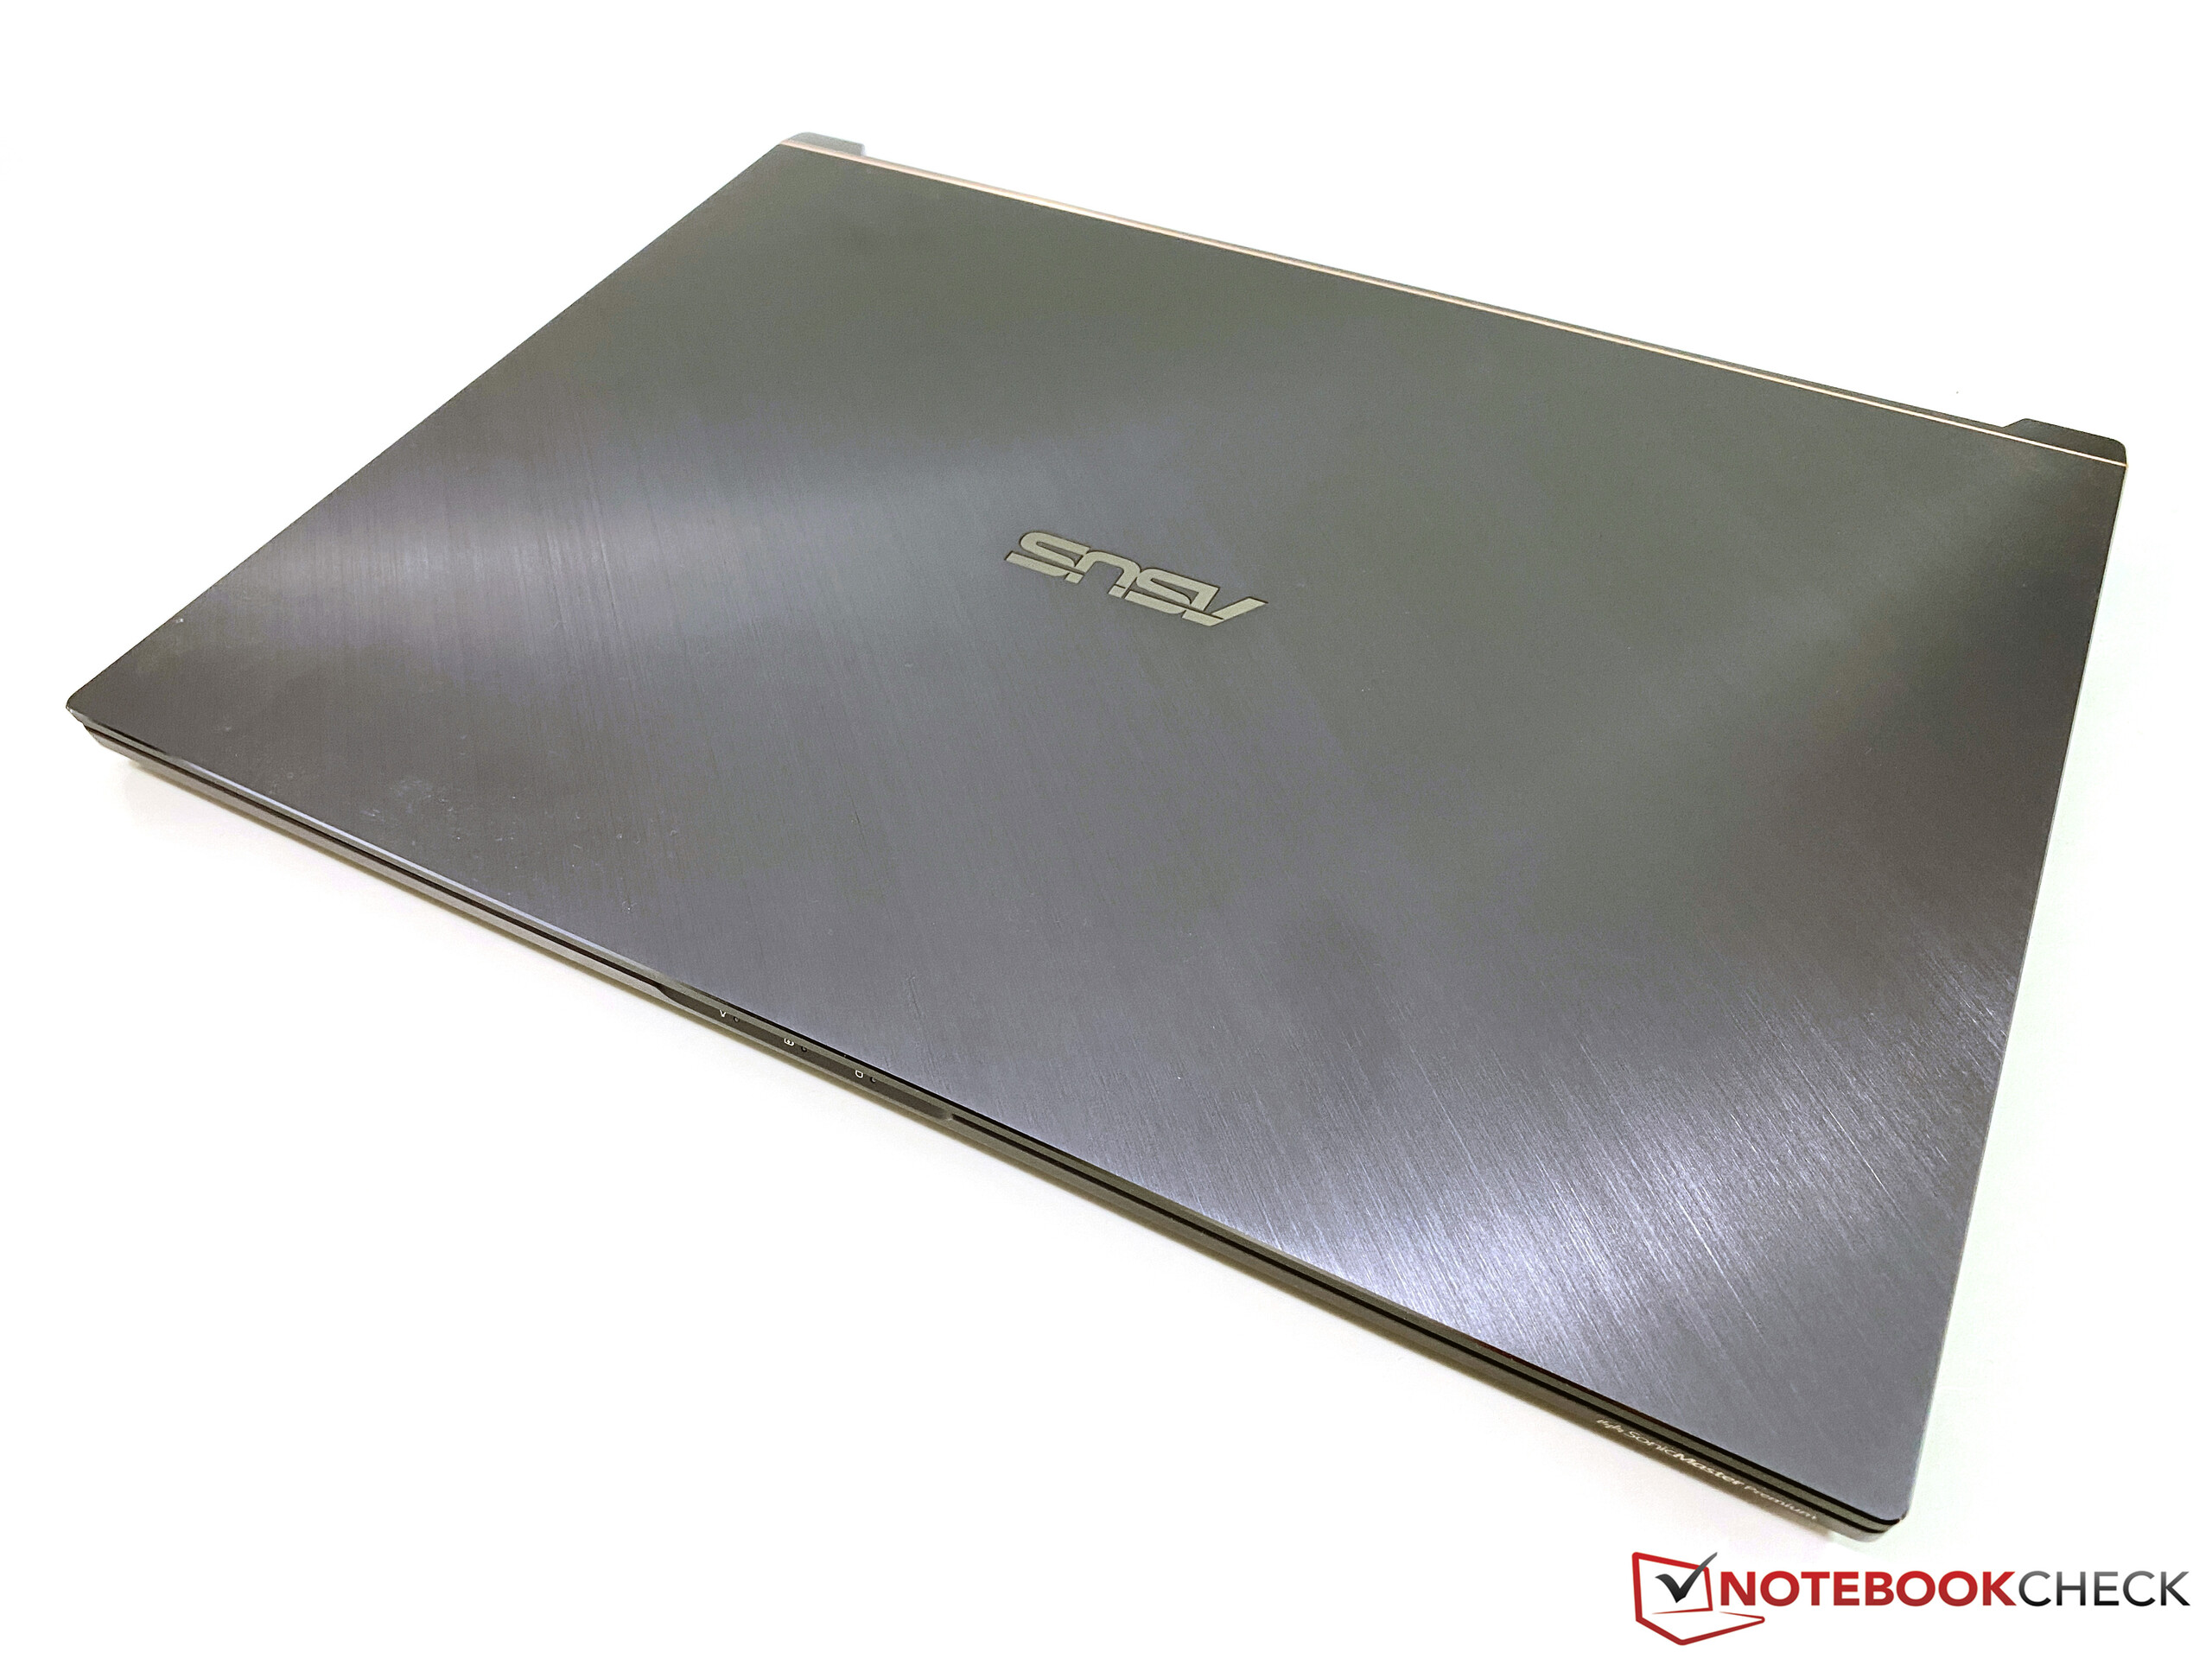
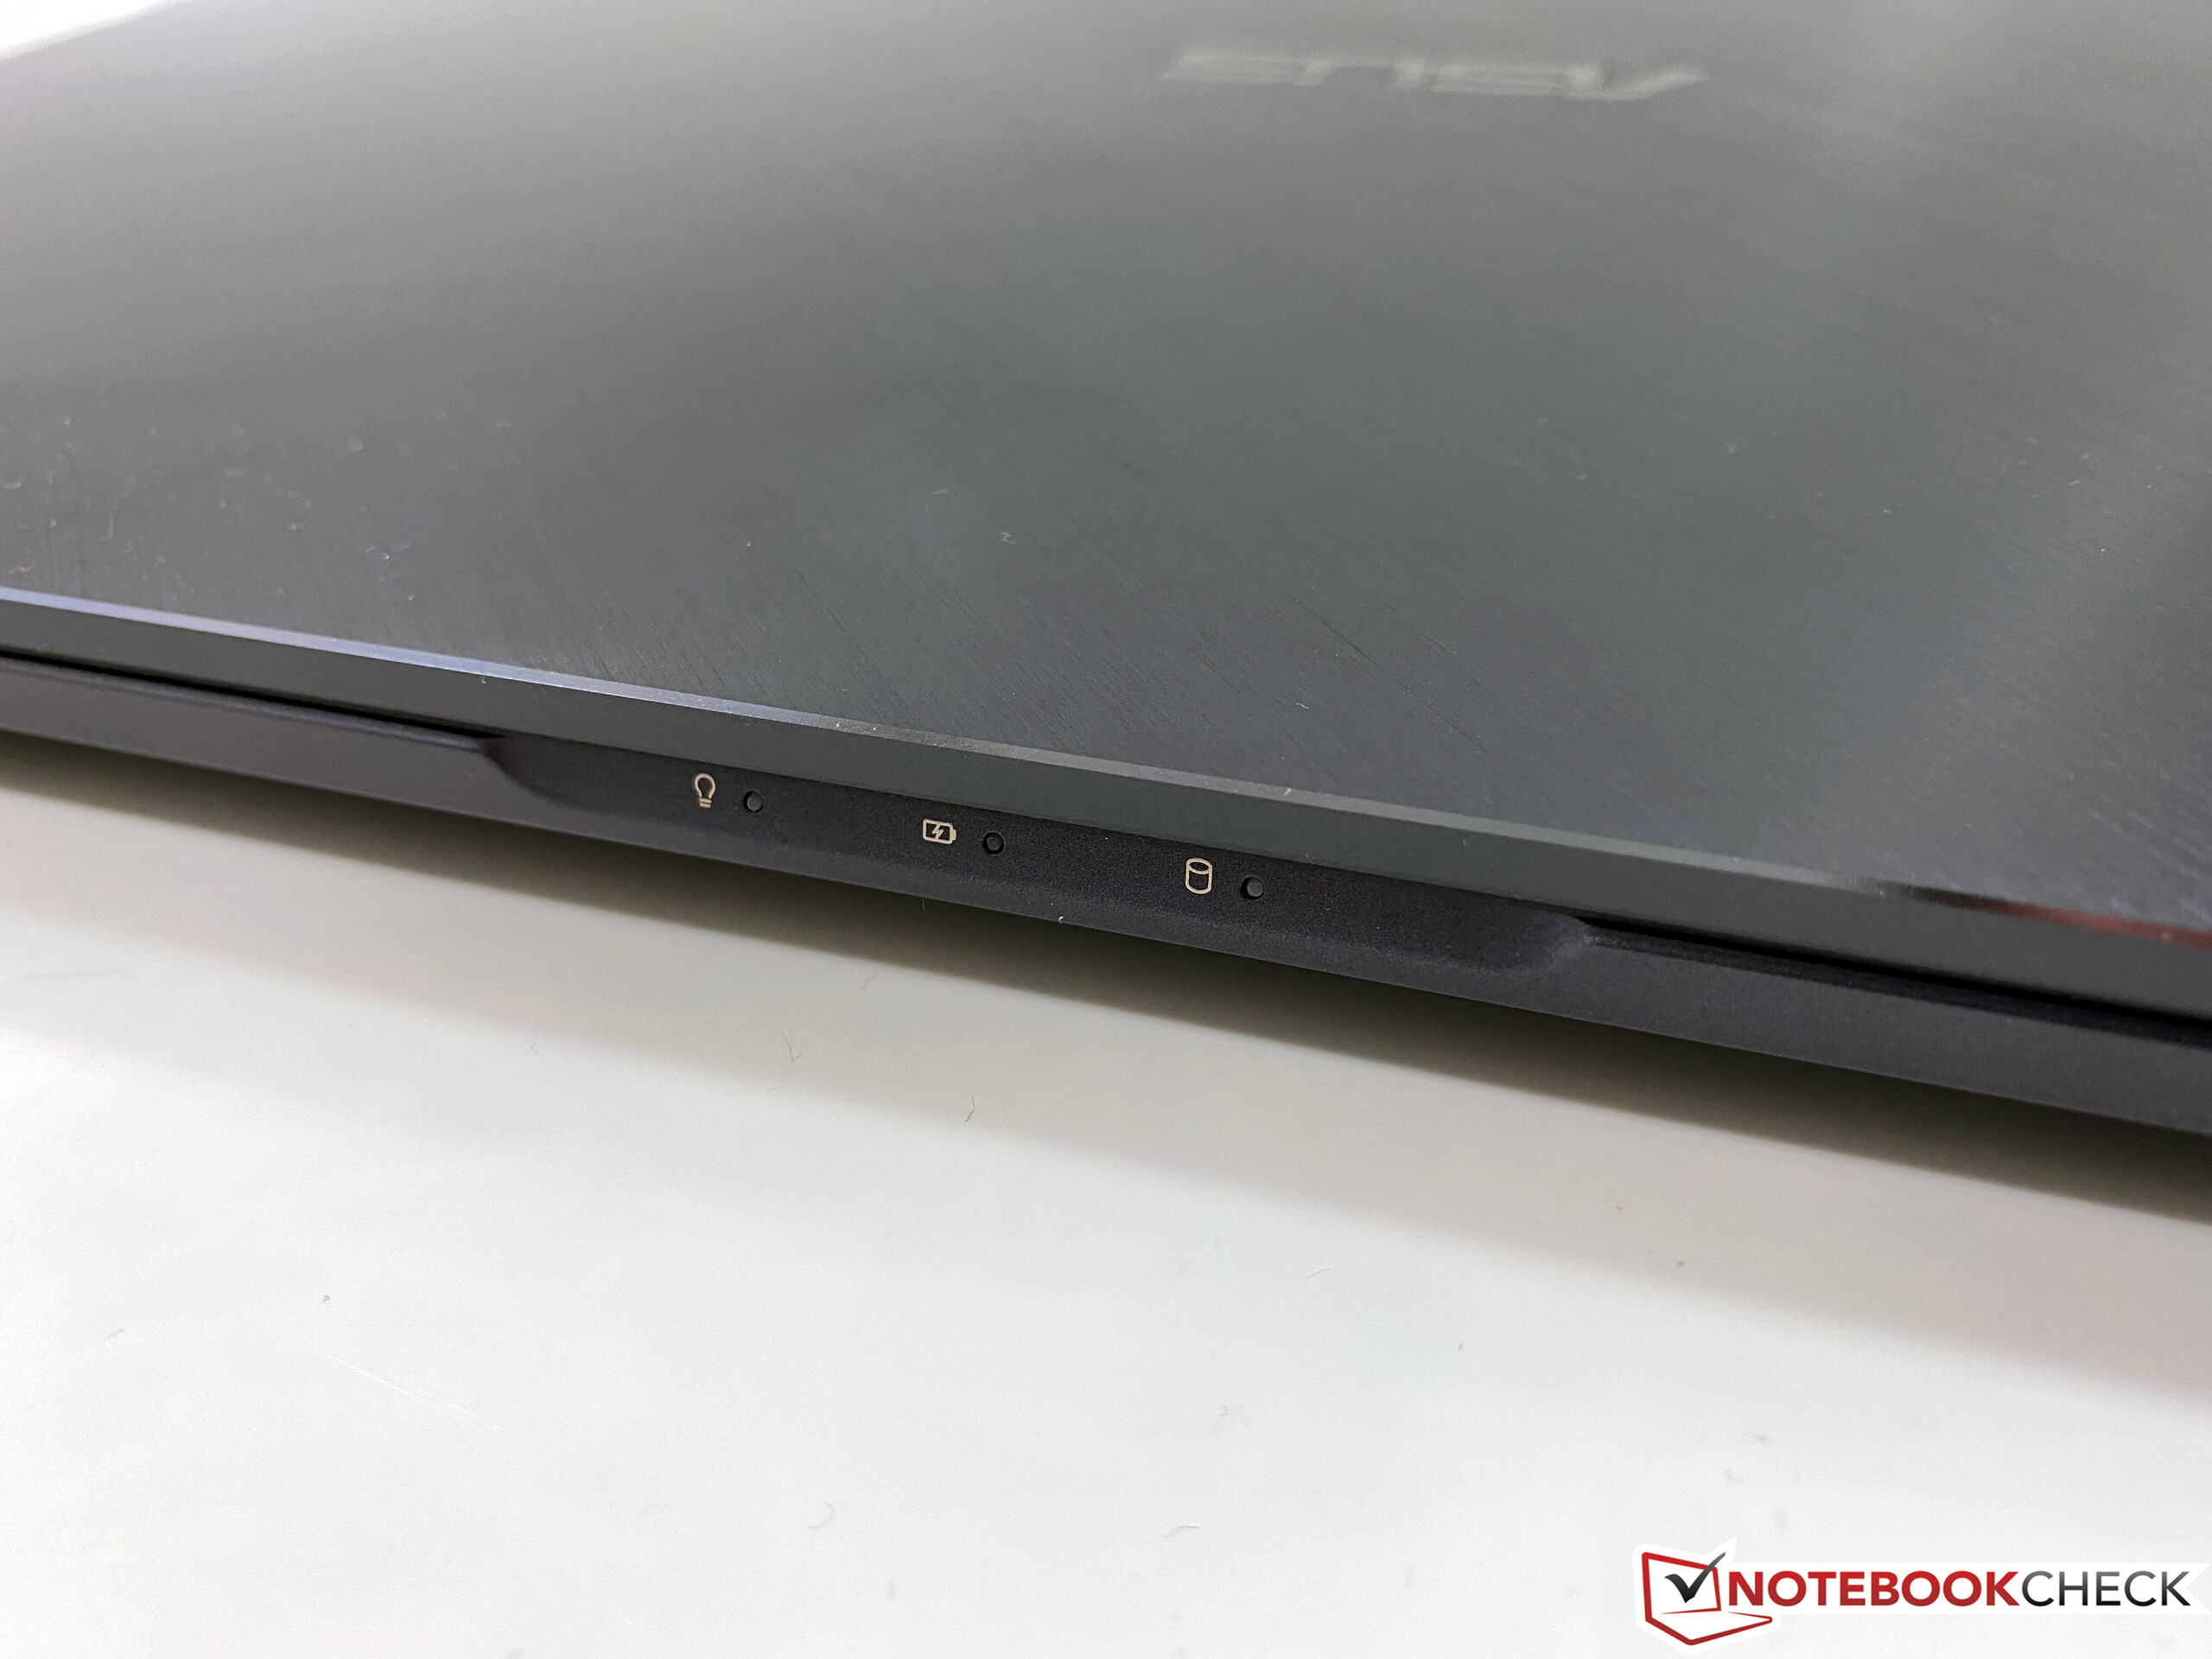
Asus ProArt StudioBook Pro 17 W700G3T
- 05/06/2020 v7 (old)
Andreas Osthoff
Price comparison
