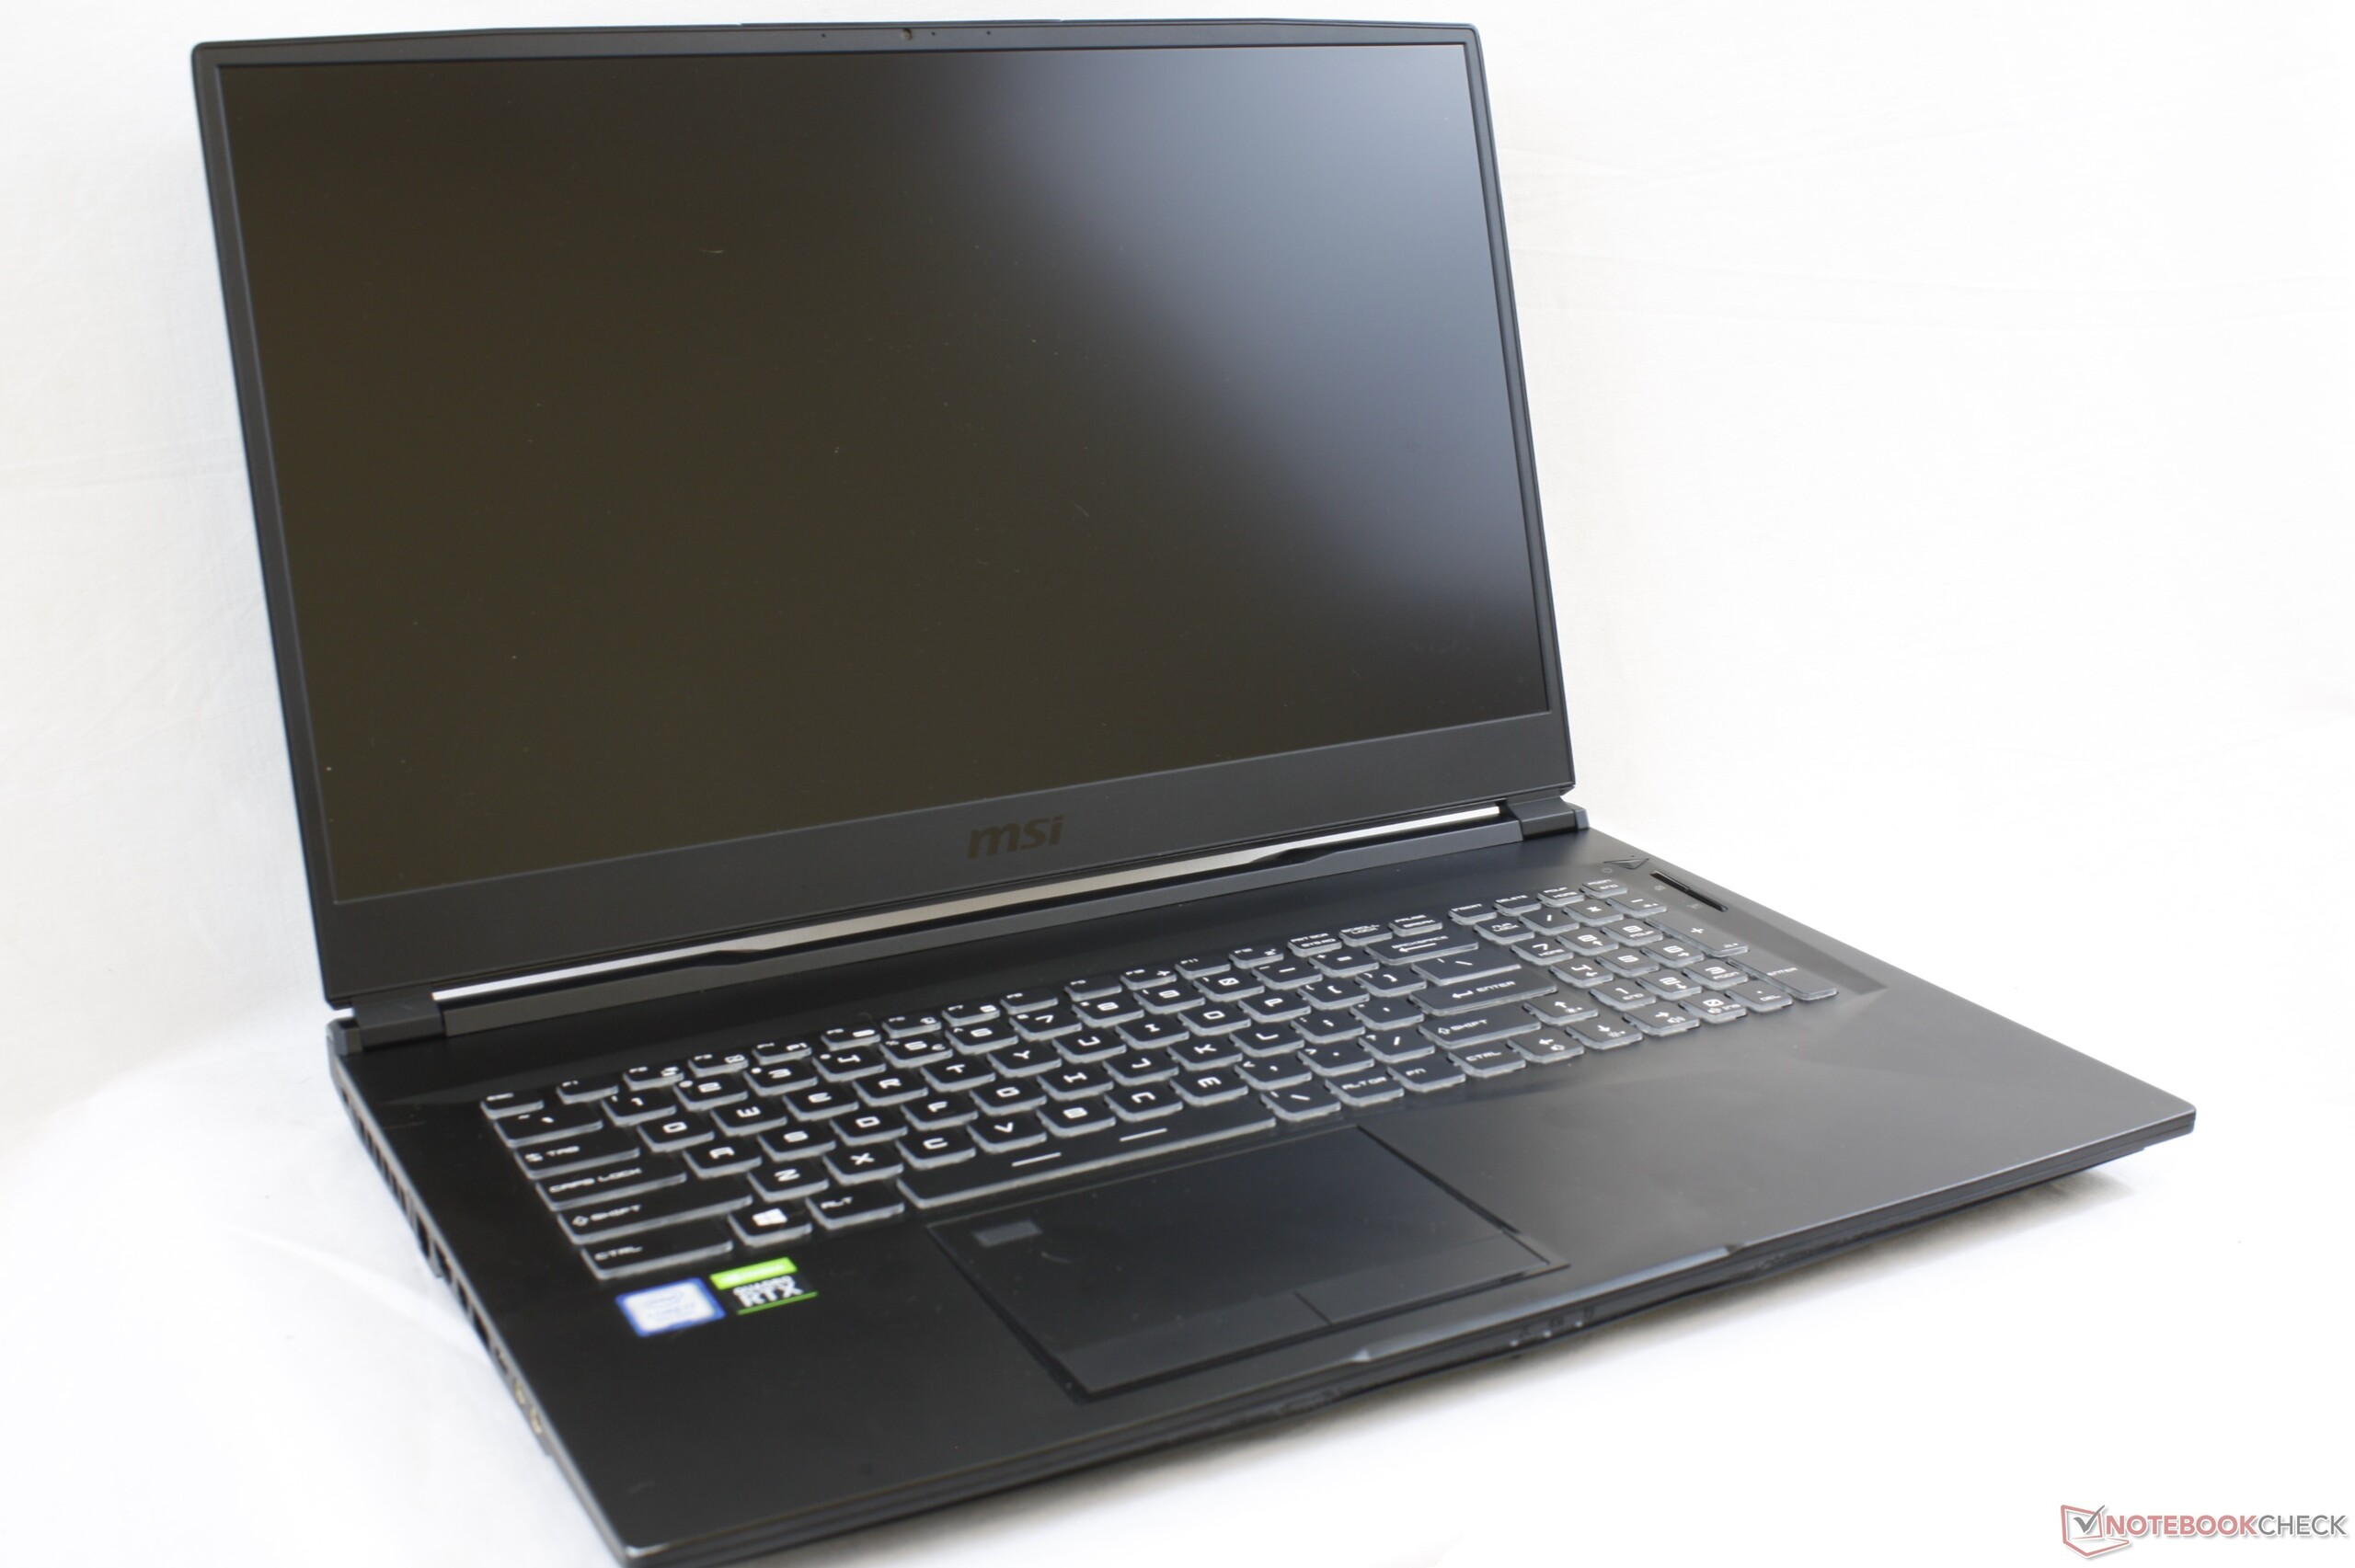
Test du MSI WE75 9TK (i7-9750H, Quadro RTX 3000, FHD) : Core i7 et Quadro RTX
Note | Date | Modèle | Poids | Épaisseur | Taille | Résolution | Prix |
|---|---|---|---|---|---|---|---|
| 84.8 % v7 (old) | 11/19 | MSI WE75 9TK i7-9750H, Quadro RTX 3000 (Laptop) | 2.6 kg | 27.5 mm | 17.30" | 1920x1080 |
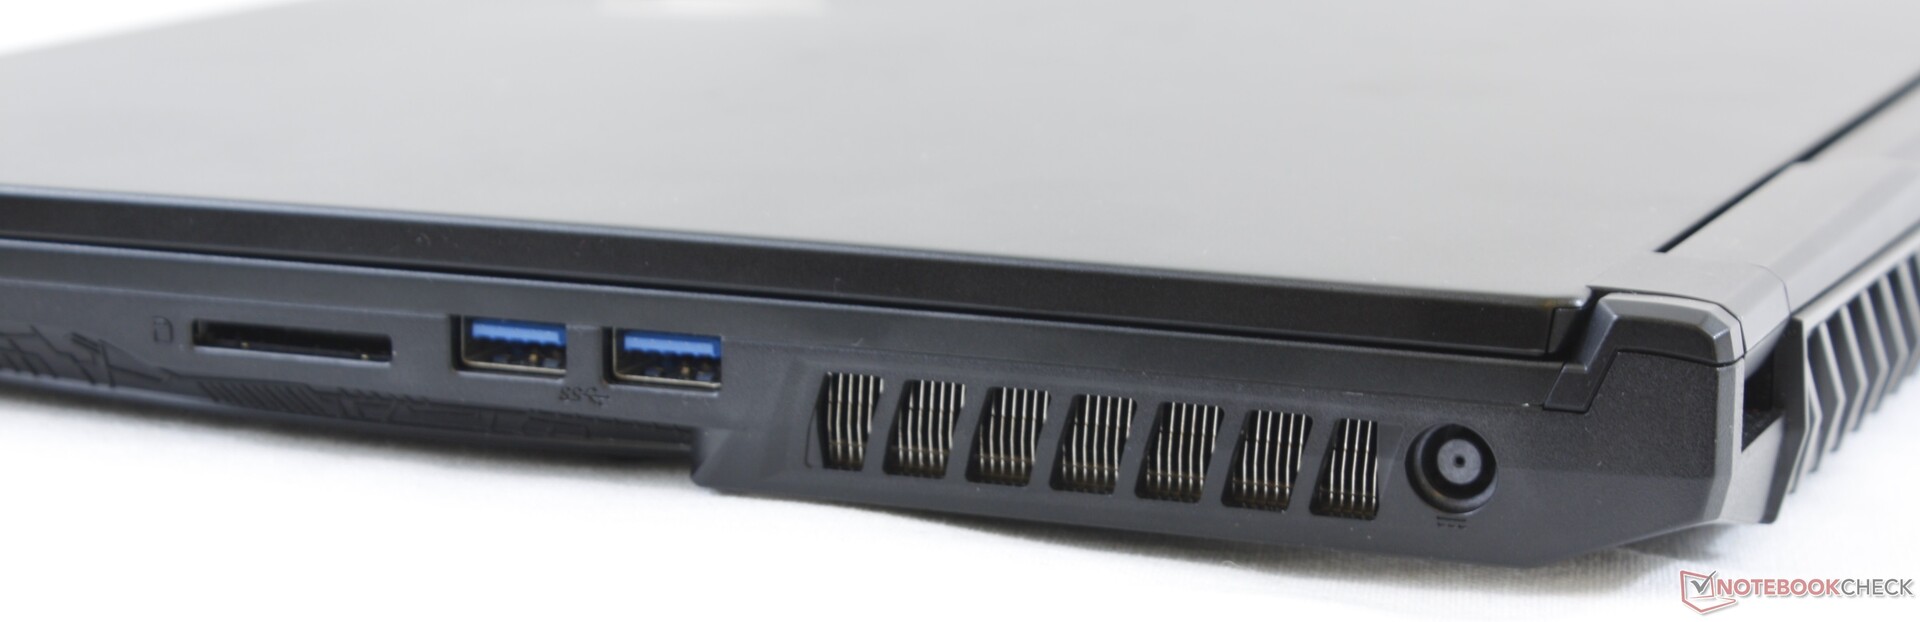
| SD Card Reader | |
| average JPG Copy Test (av. of 3 runs) | |
| Lenovo ThinkPad P73-20QR002DGE (Toshiba Exceria Pro SDXC 64 GB UHS-II) | |
| HP ZBook 17 G5-2ZC48EA (Toshiba Exceria Pro SDXC 64 GB UHS-II) | |
| Razer Blade Pro 17 RTX 2080 Max-Q (Toshiba Exceria Pro SDXC 64 GB UHS-II) | |
| MSI WE75 9TK (Toshiba Exceria Pro SDXC 64 GB UHS-II) | |
| MSI GE75 8SG Raider (Toshiba Exceria Pro SDXC 64 GB UHS-II) | |
| MSI WE72 7RJ (Toshiba Exceria Pro SDXC 64 GB UHS-II) | |
| maximum AS SSD Seq Read Test (1GB) | |
| Lenovo ThinkPad P73-20QR002DGE (Toshiba Exceria Pro SDXC 64 GB UHS-II) | |
| Razer Blade Pro 17 RTX 2080 Max-Q (Toshiba Exceria Pro SDXC 64 GB UHS-II) | |
| HP ZBook 17 G5-2ZC48EA (Toshiba Exceria Pro SDXC 64 GB UHS-II) | |
| MSI WE75 9TK (Toshiba Exceria Pro SDXC 64 GB UHS-II) | |
| MSI GE75 8SG Raider (Toshiba Exceria Pro SDXC 64 GB UHS-II) | |
| MSI WE72 7RJ (Toshiba Exceria Pro SDXC 64 GB UHS-II) | |
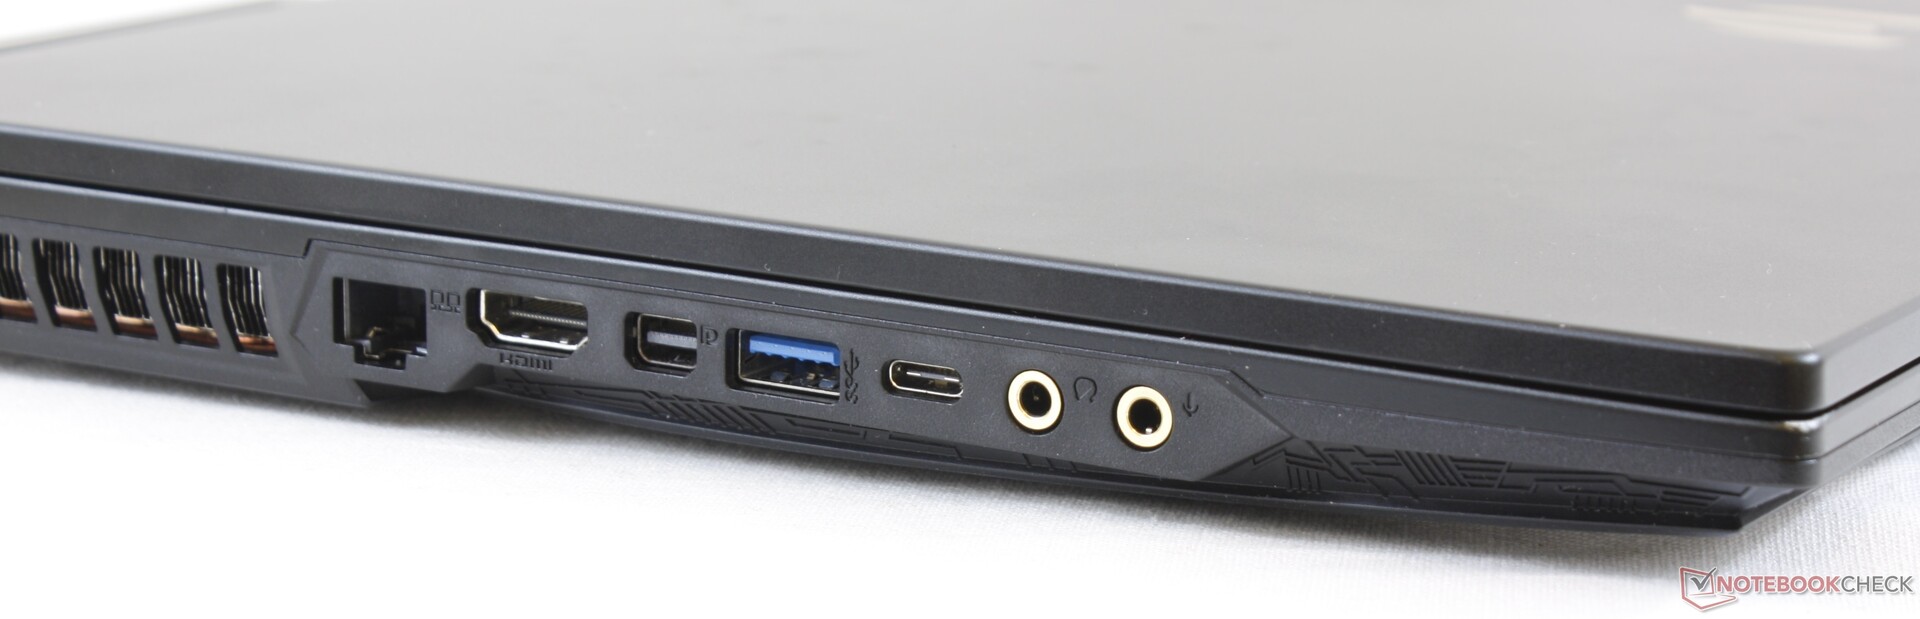
| Networking | |
| iperf3 transmit AX12 | |
| MSI GT76 Titan DT 9SG | |
| Razer Blade Pro 17 RTX 2080 Max-Q | |
| HP ZBook 17 G5-2ZC48EA | |
| Lenovo ThinkPad P73-20QR002DGE | |
| MSI WE72 7RJ | |
| iperf3 receive AX12 | |
| MSI GT76 Titan DT 9SG | |
| Razer Blade Pro 17 RTX 2080 Max-Q | |
| HP ZBook 17 G5-2ZC48EA | |
| Lenovo ThinkPad P73-20QR002DGE | |
| MSI WE72 7RJ | |
| |||||||||||||||||||||||||
Homogénéité de la luminosité: 89 %
Valeur mesurée au centre, sur batterie: 287.3 cd/m²
Contraste: 1105:1 (Valeurs des noirs: 0.26 cd/m²)
ΔE ColorChecker Calman: 2.98 | ∀{0.5-29.43 Ø4.73}
calibrated: 3.06
ΔE Greyscale Calman: 3 | ∀{0.09-98 Ø4.97}
89.5% sRGB (Argyll 1.6.3 3D)
58.1% AdobeRGB 1998 (Argyll 1.6.3 3D)
64.3% AdobeRGB 1998 (Argyll 3D)
89.9% sRGB (Argyll 3D)
63.2% Display P3 (Argyll 3D)
Gamma: 2.28
CCT: 6993 K
| MSI WE75 9TK AU Optronics B173HAN04.2, IPS, 17.3", 1920x1080 | Razer Blade Pro 17 RTX 2080 Max-Q AU Optronics B173HAN04.0, IPS, 17.3", 1920x1080 | MSI WE72 7RJ LP173WF4-SPF1, IPS, 17.3", 1920x1080 | HP ZBook 17 G5-2ZC48EA AUO B173HW01 V0, , 17.3", 1920x1080 | Lenovo ThinkPad P73-20QR002DGE N173HCE-E31, IPS LED, 17.3", 1920x1080 | MSI GT76 Titan DT 9SG Chi Mei N173HCE-G33 (CMN175C), IPS, 17.3", 1920x1080 | |
|---|---|---|---|---|---|---|
| Display | -3% | -0% | 3% | 6% | 1% | |
| Display P3 Coverage (%) | 63.2 | 60.6 -4% | 67.4 7% | 66.3 5% | 67.5 7% | 62.3 -1% |
| sRGB Coverage (%) | 89.9 | 89 -1% | 85.3 -5% | 89.9 0% | 94.2 5% | 93.4 4% |
| AdobeRGB 1998 Coverage (%) | 64.3 | 62.1 -3% | 62.4 -3% | 67.8 5% | 64.3 0% | |
| Response Times | 74% | -16% | -15% | -10% | 71% | |
| Response Time Grey 50% / Grey 80% * (ms) | 30.8 ? | 6.8 ? 78% | 45.2 ? -47% | 42.4 ? -38% | 40 ? -30% | 8 ? 74% |
| Response Time Black / White * (ms) | 31.2 ? | 9.6 ? 69% | 26.4 ? 15% | 28.4 ? 9% | 28 ? 10% | 10 ? 68% |
| PWM Frequency (Hz) | 25000 ? | 26040 ? | ||||
| Screen | 0% | -38% | -13% | -16% | 18% | |
| Brightness middle (cd/m²) | 287.3 | 299.3 4% | 302 5% | 335 17% | 333 16% | 396 38% |
| Brightness (cd/m²) | 280 | 294 5% | 306 9% | 326 16% | 310 11% | 373 33% |
| Brightness Distribution (%) | 89 | 94 6% | 93 4% | 92 3% | 83 -7% | 89 0% |
| Black Level * (cd/m²) | 0.26 | 0.29 -12% | 0.31 -19% | 0.22 15% | 0.39 -50% | 0.33 -27% |
| Contrast (:1) | 1105 | 1032 -7% | 974 -12% | 1523 38% | 854 -23% | 1200 9% |
| Colorchecker dE 2000 * | 2.98 | 2.55 14% | 6.2 -108% | 4.7 -58% | 4.4 -48% | 2.04 32% |
| Colorchecker dE 2000 max. * | 5.08 | 4.73 7% | 10.6 -109% | 8.7 -71% | 7.5 -48% | 3.85 24% |
| Colorchecker dE 2000 calibrated * | 3.06 | 2.9 5% | 2.7 12% | 2 35% | 0.82 73% | |
| Greyscale dE 2000 * | 3 | 3.5 -17% | 7.3 -143% | 6.5 -117% | 5.1 -70% | 2.83 6% |
| Gamma | 2.28 96% | 2.28 96% | 2.08 106% | 2.23 99% | 2.39 92% | 2.49 88% |
| CCT | 6993 93% | 7101 92% | 7020 93% | 6108 106% | 7061 92% | 7113 91% |
| Color Space (Percent of AdobeRGB 1998) (%) | 58.1 | 57 -2% | 56 -4% | 58.7 1% | 61.1 5% | 59 2% |
| Color Space (Percent of sRGB) (%) | 89.5 | 88.7 -1% | 85.2 -5% | 89.7 0% | 94 5% | 94 5% |
| Moyenne finale (programmes/paramètres) | 24% /
9% | -18% /
-28% | -8% /
-11% | -7% /
-11% | 30% /
21% |
* ... Moindre est la valeur, meilleures sont les performances
Temps de réponse de l'écran
| ↔ Temps de réponse noir à blanc | ||
|---|---|---|
| 31.2 ms ... hausse ↗ et chute ↘ combinées | ↗ 18.8 ms hausse | 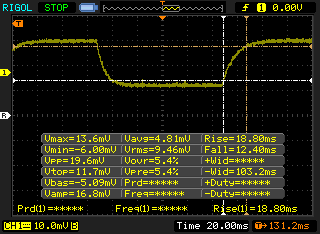 |
| ↘ 12.4 ms chute | ||
| L'écran souffre de latences très élevées, à éviter pour le jeu. En comparaison, tous les appareils testés affichent entre 0.1 (minimum) et 240 (maximum) ms. » 84 % des appareils testés affichent de meilleures performances. Cela signifie que les latences relevées sont moins bonnes que la moyenne (19.9 ms) de tous les appareils testés. | ||
| ↔ Temps de réponse gris 50% à gris 80% | ||
| 30.8 ms ... hausse ↗ et chute ↘ combinées | ↗ 14.4 ms hausse | 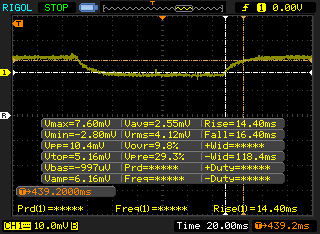 |
| ↘ 16.4 ms chute | ||
| L'écran souffre de latences très élevées, à éviter pour le jeu. En comparaison, tous les appareils testés affichent entre 0.165 (minimum) et 636 (maximum) ms. » 41 % des appareils testés affichent de meilleures performances. Cela signifie que les latences relevées sont similaires à la moyenne (31.1 ms) de tous les appareils testés. | ||
Scintillement / MLI (Modulation de largeur d'impulsion)
| Scintillement / MLI (Modulation de largeur d'impulsion) non décelé | 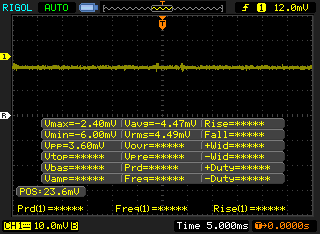 | ||
En comparaison, 52 % des appareils testés n'emploient pas MDI pour assombrir leur écran. Nous avons relevé une moyenne à 7798 (minimum : 5 - maximum : 343500) Hz dans le cas où une MDI était active. | |||
| PCMark 8 | |
| Home Score Accelerated v2 | |
| Razer Blade Pro 17 RTX 2080 Max-Q | |
| HP ZBook 17 G5-2ZC48EA | |
| MSI WE75 9TK | |
| MSI WE72 7RJ | |
| Lenovo ThinkPad P73-20QR002DGE | |
| Work Score Accelerated v2 | |
| Razer Blade Pro 17 RTX 2080 Max-Q | |
| MSI WE75 9TK | |
| Lenovo ThinkPad P73-20QR002DGE | |
| HP ZBook 17 G5-2ZC48EA | |
| MSI WE72 7RJ | |
| PCMark 8 Home Score Accelerated v2 | 4301 points | |
| PCMark 8 Work Score Accelerated v2 | 5570 points | |
| PCMark 10 Score | 5815 points | |
Aide | ||
| MSI WE75 9TK Samsung SSD PM981 MZVLB512HAJQ | Razer Blade Pro 17 RTX 2080 Max-Q Samsung SSD PM981 MZVLB512HAJQ | MSI GT76 Titan DT 9SG 2x Samsung PM961 MZVLW256HEHP (RAID 0) | MSI WE72 7RJ Samsung SM961 MZVPW256 m.2 PCI-e | Lenovo ThinkPad P73-20QR002DGE Intel SSD Pro 7600p SSDPEKKF512G8L | |
|---|---|---|---|---|---|
| AS SSD | -1% | 11% | 2% | 2% | |
| Seq Read (MB/s) | 1308 | 1831 40% | 2646 102% | 2586 98% | 2693 106% |
| Seq Write (MB/s) | 1871 | 1744 -7% | 2214 18% | 1441 -23% | 1542 -18% |
| 4K Read (MB/s) | 48.35 | 45.16 -7% | 30.42 -37% | 53 10% | 62.6 29% |
| 4K Write (MB/s) | 106.6 | 107.1 0% | 95.9 -10% | 148.1 39% | 149.5 40% |
| 4K-64 Read (MB/s) | 1510 | 1240 -18% | 1609 7% | 1517 0% | 871 -42% |
| 4K-64 Write (MB/s) | 1715 | 1695 -1% | 1573 -8% | 826 -52% | 1006 -41% |
| Access Time Read * (ms) | 0.103 | 0.064 38% | 0.128 -24% | 0.041 60% | 0.058 44% |
| Access Time Write * (ms) | 0.106 | 0.037 65% | 0.039 63% | 0.026 75% | 0.067 37% |
| Score Read (Points) | 1689 | 1468 -13% | 1904 13% | 1829 8% | 1203 -29% |
| Score Write (Points) | 2008 | 1977 -2% | 1890 -6% | 1118 -44% | 1309 -35% |
| Score Total (Points) | 4594 | 4197 -9% | 4740 3% | 3831 -17% | 3088 -33% |
| Copy ISO MB/s (MB/s) | 2343 | 2086 -11% | 1600 -32% | 1716 -27% | |
| Copy Program MB/s (MB/s) | 526 | 425.5 -19% | 290 -45% | 542 3% | |
| Copy Game MB/s (MB/s) | 1506 | 555 -63% | 863 -43% | 1375 -9% |
* ... Moindre est la valeur, meilleures sont les performances

| 3DMark 11 Performance | 18138 points | |
| 3DMark Cloud Gate Standard Score | 36407 points | |
| 3DMark Fire Strike Score | 14442 points | |
| 3DMark Time Spy Score | 6080 points | |
Aide | ||
| Bas | Moyen | Élevé | Ultra | |
|---|---|---|---|---|
| BioShock Infinite (2013) | 325.9 | 288.2 | 266.8 | 148.4 |
| The Witcher 3 (2015) | 303.2 | 202.8 | 117 | 59 |
| Shadow of the Tomb Raider (2018) | 135 | 100 | 88 | 79 |
| MSI WE75 9TK Quadro RTX 3000 (Laptop), i7-9750H, Samsung SSD PM981 MZVLB512HAJQ | Razer Blade Pro 17 RTX 2080 Max-Q GeForce RTX 2080 Max-Q, i7-9750H, Samsung SSD PM981 MZVLB512HAJQ | MSI GT76 Titan DT 9SG GeForce RTX 2080 Mobile, i9-9900K, 2x Samsung PM961 MZVLW256HEHP (RAID 0) | MSI WE72 7RJ Quadro M2200, i7-7700HQ, Samsung SM961 MZVPW256 m.2 PCI-e | HP ZBook 17 G5-2ZC48EA Quadro P3200, i7-8850H, Toshiba XG5 KXG50ZNV256G | Lenovo ThinkPad P73-20QR002DGE Quadro RTX 3000 (Laptop), i7-9850H, Intel SSD Pro 7600p SSDPEKKF512G8L | |
|---|---|---|---|---|---|---|
| Noise | -4% | -21% | -13% | 3% | 11% | |
| arrêt / environnement * (dB) | 28.5 | 28.2 1% | 30 -5% | 29.3 -3% | 28.7 -1% | 29.3 -3% |
| Idle Minimum * (dB) | 29 | 28.2 3% | 33 -14% | 36.3 -25% | 28.7 1% | 29.3 -1% |
| Idle Average * (dB) | 29 | 28.2 3% | 34 -17% | 36.3 -25% | 28.7 1% | 29.3 -1% |
| Idle Maximum * (dB) | 31.5 | 30.8 2% | 44 -40% | 36.6 -16% | 30.9 2% | 29.3 7% |
| Load Average * (dB) | 32 | 42 -31% | 47 -47% | 40.4 -26% | 37.3 -17% | 30.2 6% |
| Witcher 3 ultra * (dB) | 44.7 | 51 -14% | 53 -19% | 41.1 8% | 30.7 31% | |
| Load Maximum * (dB) | 56.5 | 53 6% | 59 -4% | 46.6 18% | 41.4 27% | 33.1 41% |
* ... Moindre est la valeur, meilleures sont les performances
Degré de la nuisance sonore
| Au repos |
| 29 / 29 / 31.5 dB(A) |
| Fortement sollicité |
| 32 / 56.5 dB(A) |
 | ||
30 dB silencieux 40 dB(A) audible 50 dB(A) bruyant |
||
min: | ||
(±) La température maximale du côté supérieur est de 40.6 °C / 105 F, par rapport à la moyenne de 38.2 °C / 101 F, allant de 22.2 à 69.8 °C pour la classe Workstation.
(-) Le fond chauffe jusqu'à un maximum de 46 °C / 115 F, contre une moyenne de 41.1 °C / 106 F
(+) En utilisation inactive, la température moyenne du côté supérieur est de 27.5 °C / 82 F, par rapport à la moyenne du dispositif de 32 °C / 90 F.
(±) En jouant à The Witcher 3, la température moyenne du côté supérieur est de 35.1 °C / 95 F, alors que la moyenne de l'appareil est de 32 °C / 90 F.
(+) Les repose-poignets et le pavé tactile sont plus froids que la température de la peau avec un maximum de 29.4 °C / 84.9 F et sont donc froids au toucher.
(±) La température moyenne de la zone de l'appui-paume de dispositifs similaires était de 27.8 °C / 82 F (-1.6 °C / #-2.9 F).
MSI WE75 9TK analyse audio
(+) | les haut-parleurs peuvent jouer relativement fort (85.1# dB)
Basses 100 - 315 Hz
(-) | presque aucune basse - en moyenne 25.4% plus bas que la médiane
(±) | la linéarité des basses est moyenne (10.8% delta à la fréquence précédente)
Médiums 400 - 2000 Hz
(+) | médiane équilibrée - seulement 2.1% de la médiane
(±) | la linéarité des médiums est moyenne (8.4% delta à la fréquence précédente)
Aiguës 2 - 16 kHz
(+) | des sommets équilibrés - à seulement 2.7% de la médiane
(+) | les aigus sont linéaires (5.8% delta à la fréquence précédente)
Globalement 100 - 16 000 Hz
(±) | la linéarité du son global est moyenne (19.8% de différence avec la médiane)
Par rapport à la même classe
» 71% de tous les appareils testés de cette catégorie étaient meilleurs, 4% similaires, 25% pires
» Le meilleur avait un delta de 7%, la moyenne était de 17%, le pire était de 35%.
Par rapport à tous les appareils testés
» 50% de tous les appareils testés étaient meilleurs, 7% similaires, 43% pires
» Le meilleur avait un delta de 4%, la moyenne était de 24%, le pire était de 134%.
Apple MacBook 12 (Early 2016) 1.1 GHz analyse audio
(+) | les haut-parleurs peuvent jouer relativement fort (83.6# dB)
Basses 100 - 315 Hz
(±) | basse réduite - en moyenne 11.3% inférieure à la médiane
(±) | la linéarité des basses est moyenne (14.2% delta à la fréquence précédente)
Médiums 400 - 2000 Hz
(+) | médiane équilibrée - seulement 2.4% de la médiane
(+) | les médiums sont linéaires (5.5% delta à la fréquence précédente)
Aiguës 2 - 16 kHz
(+) | des sommets équilibrés - à seulement 2% de la médiane
(+) | les aigus sont linéaires (4.5% delta à la fréquence précédente)
Globalement 100 - 16 000 Hz
(+) | le son global est linéaire (10.2% différence à la médiane)
Par rapport à la même classe
» 7% de tous les appareils testés de cette catégorie étaient meilleurs, 2% similaires, 91% pires
» Le meilleur avait un delta de 5%, la moyenne était de 18%, le pire était de 53%.
Par rapport à tous les appareils testés
» 5% de tous les appareils testés étaient meilleurs, 1% similaires, 94% pires
» Le meilleur avait un delta de 4%, la moyenne était de 24%, le pire était de 134%.
| Éteint/en veille | |
| Au repos | |
| Fortement sollicité |
|
Légende:
min: | |
| MSI WE75 9TK i7-9750H, Quadro RTX 3000 (Laptop), Samsung SSD PM981 MZVLB512HAJQ, IPS, 1920x1080, 17.3" | Razer Blade Pro 17 RTX 2080 Max-Q i7-9750H, GeForce RTX 2080 Max-Q, Samsung SSD PM981 MZVLB512HAJQ, IPS, 1920x1080, 17.3" | MSI GT76 Titan DT 9SG i9-9900K, GeForce RTX 2080 Mobile, 2x Samsung PM961 MZVLW256HEHP (RAID 0), IPS, 1920x1080, 17.3" | MSI WE72 7RJ i7-7700HQ, Quadro M2200, Samsung SM961 MZVPW256 m.2 PCI-e, IPS, 1920x1080, 17.3" | HP ZBook 17 G5-2ZC48EA i7-8850H, Quadro P3200, Toshiba XG5 KXG50ZNV256G, , 1920x1080, 17.3" | Lenovo ThinkPad P73-20QR002DGE i7-9850H, Quadro RTX 3000 (Laptop), Intel SSD Pro 7600p SSDPEKKF512G8L, IPS LED, 1920x1080, 17.3" | |
|---|---|---|---|---|---|---|
| Power Consumption | -21% | -47% | -3% | 14% | 10% | |
| Idle Minimum * (Watt) | 12.1 | 16.2 -34% | 14 -16% | 15 -24% | 9.3 23% | 8.9 26% |
| Idle Average * (Watt) | 18.4 | 20.4 -11% | 18 2% | 20.1 -9% | 14.4 22% | 12.8 30% |
| Idle Maximum * (Watt) | 18.8 | 26.1 -39% | 23 -22% | 23.8 -27% | 15.8 16% | 16.4 13% |
| Load Average * (Watt) | 95.1 | 96.5 -1% | 114 -20% | 85.6 10% | 89.2 6% | 108.4 -14% |
| Witcher 3 ultra * (Watt) | 135.5 | 182.9 -35% | 283 -109% | 123 9% | 153 -13% | |
| Load Maximum * (Watt) | 203.7 | 214.3 -5% | 443 -117% | 128 37% | 189 7% | 166 19% |
* ... Moindre est la valeur, meilleures sont les performances
| MSI WE75 9TK i7-9750H, Quadro RTX 3000 (Laptop), 65 Wh | Razer Blade Pro 17 RTX 2080 Max-Q i7-9750H, GeForce RTX 2080 Max-Q, 70 Wh | MSI GT76 Titan DT 9SG i9-9900K, GeForce RTX 2080 Mobile, 90 Wh | MSI WE72 7RJ i7-7700HQ, Quadro M2200, 51 Wh | HP ZBook 17 G5-2ZC48EA i7-8850H, Quadro P3200, Wh | Lenovo ThinkPad P73-20QR002DGE i7-9850H, Quadro RTX 3000 (Laptop), 99 Wh | |
|---|---|---|---|---|---|---|
| Autonomie de la batterie | -6% | -15% | -43% | 105% | 84% | |
| Reader / Idle (h) | 11 | 4.9 -55% | 6.8 -38% | 4.5 -59% | 21.9 99% | |
| WiFi v1.3 (h) | 4.9 | 4.7 -4% | 5 2% | 3 -39% | 11.1 127% | |
| Load (h) | 1 | 1.4 40% | 0.9 -10% | 0.7 -30% | 2.1 110% | 1.4 40% |
Points positifs
Points négatifs
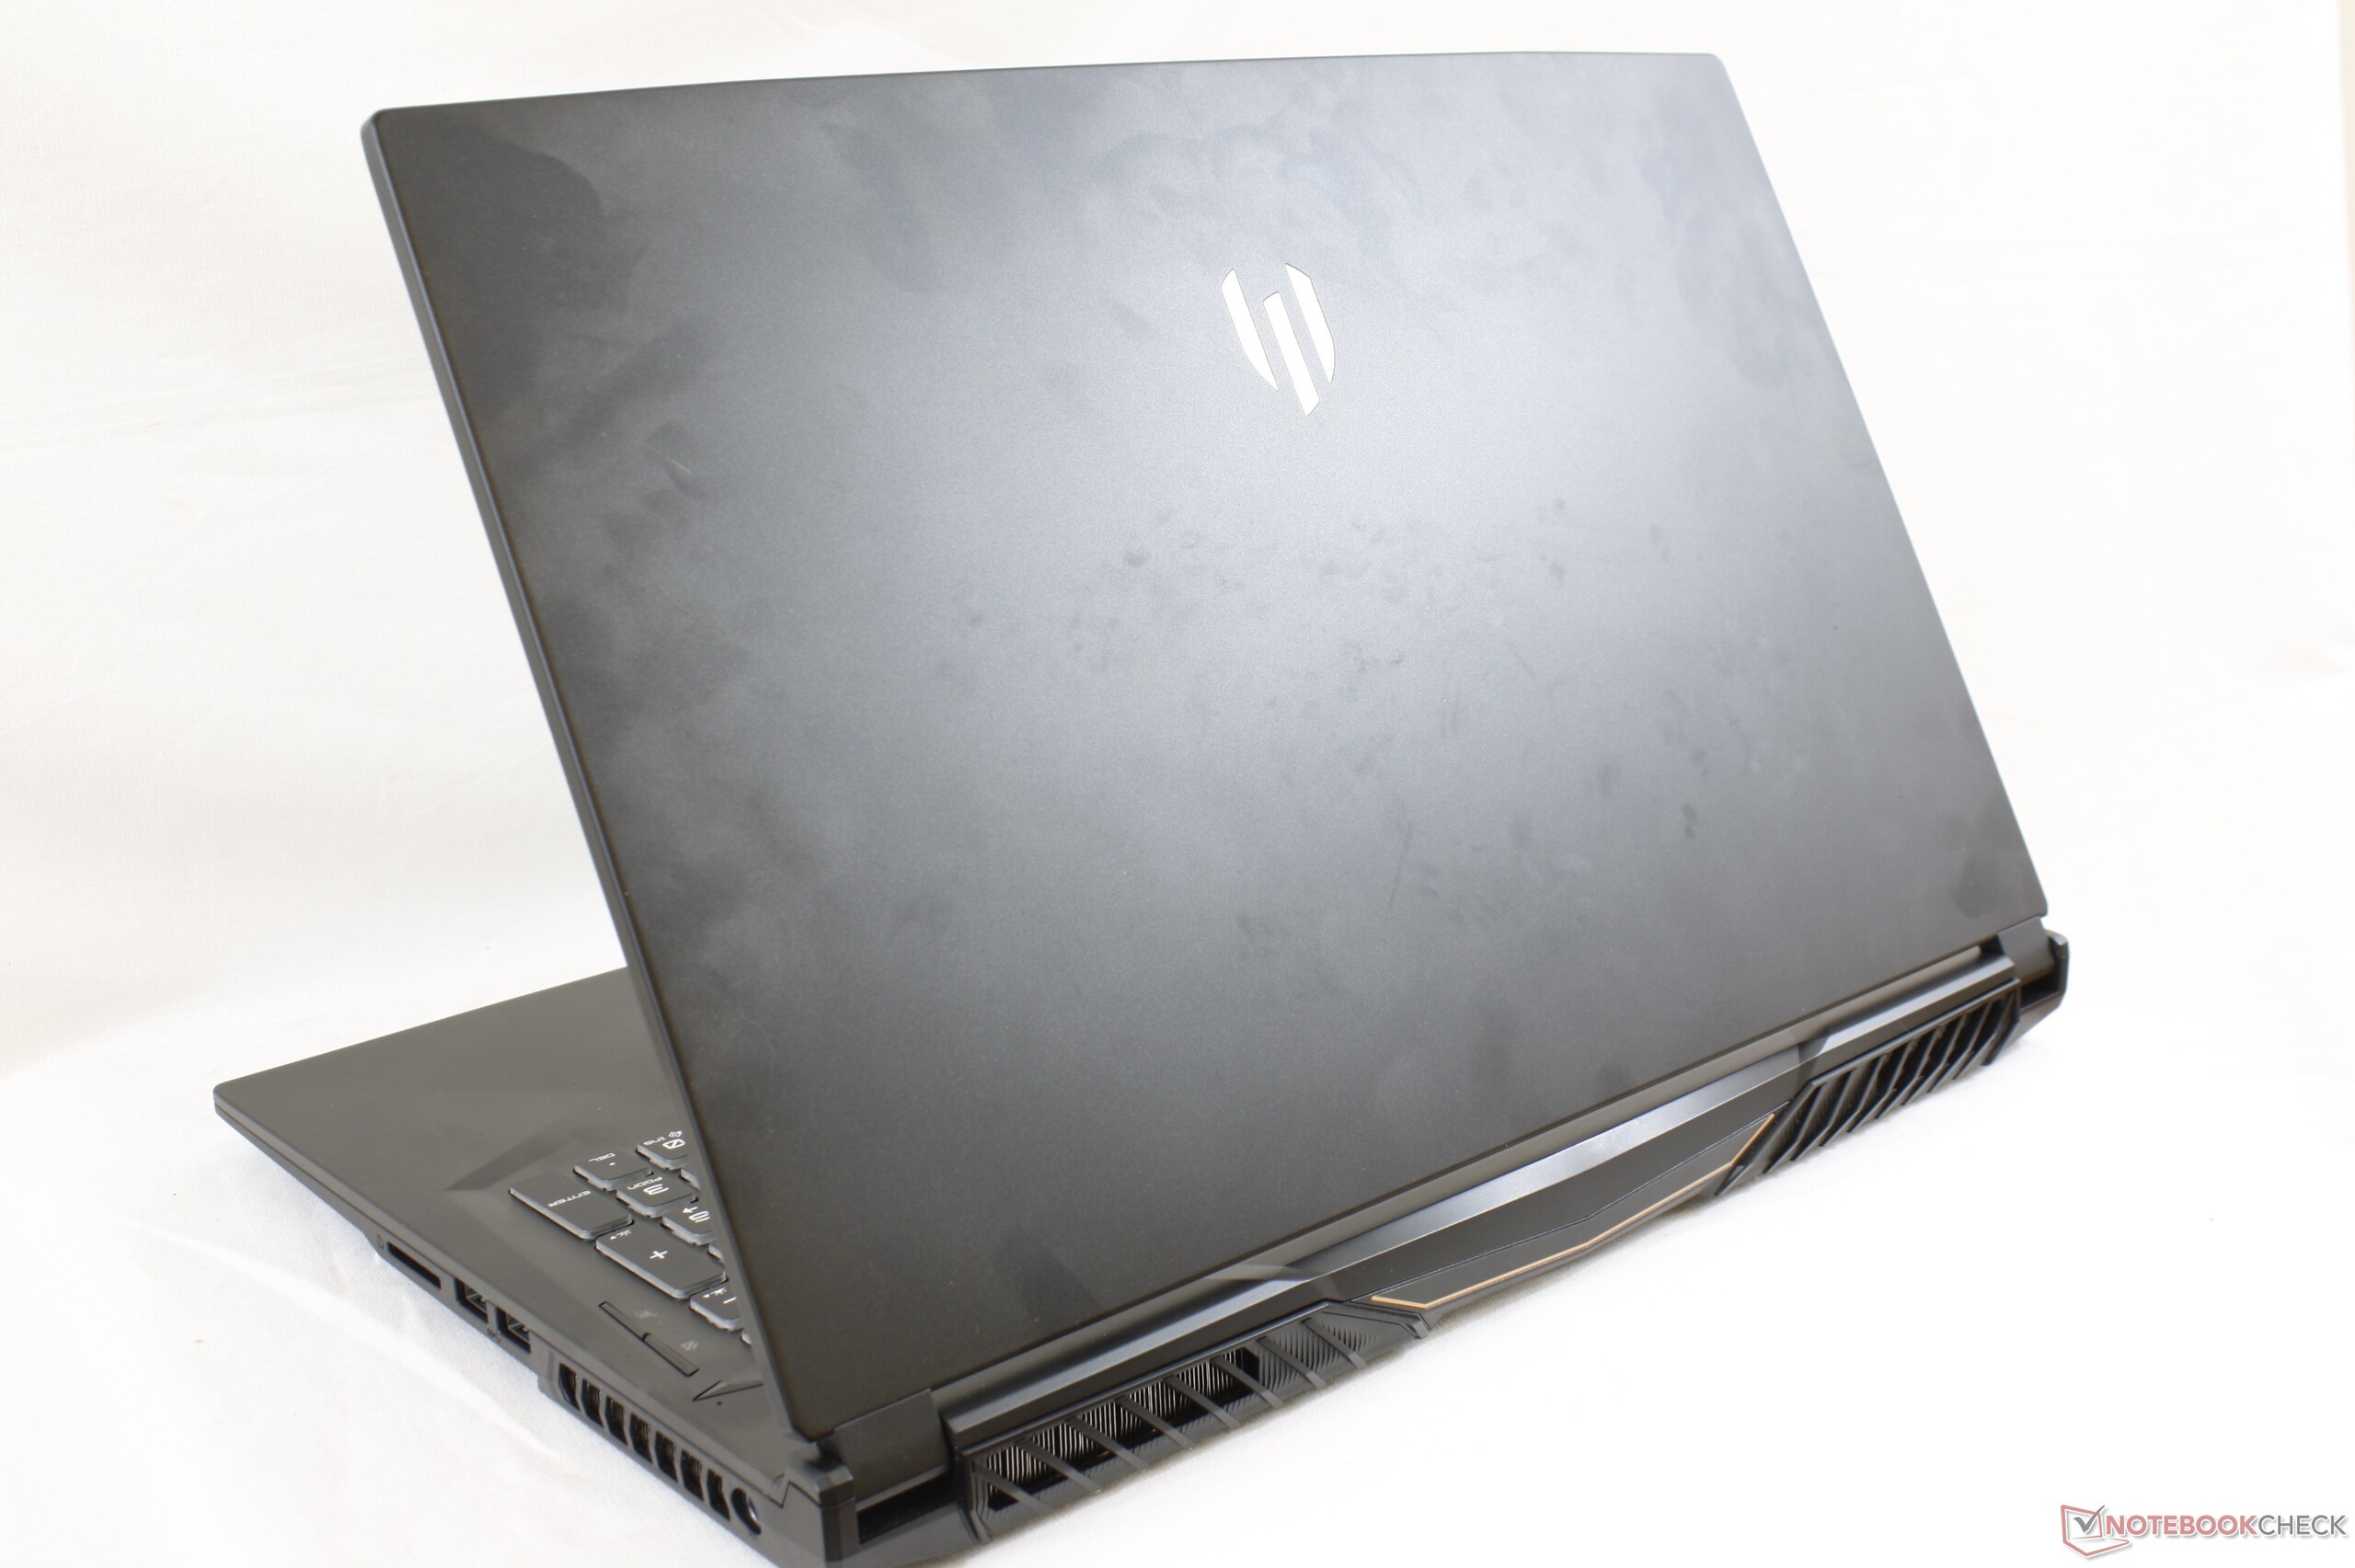
En passant du MSI GE75 au WE75, nous pouvons comprendre le retrait de certaines fonctionnalités. Des éléments comme les bandes rouges, le rétroéclairage RVB individuel par touche, les haut-parleurs supplémentaires, et l’écran 144 Hz ne sont pas des fonctionnalités prioritaires pour les professionnels. Une omission en particulier est cependant plus gênante.
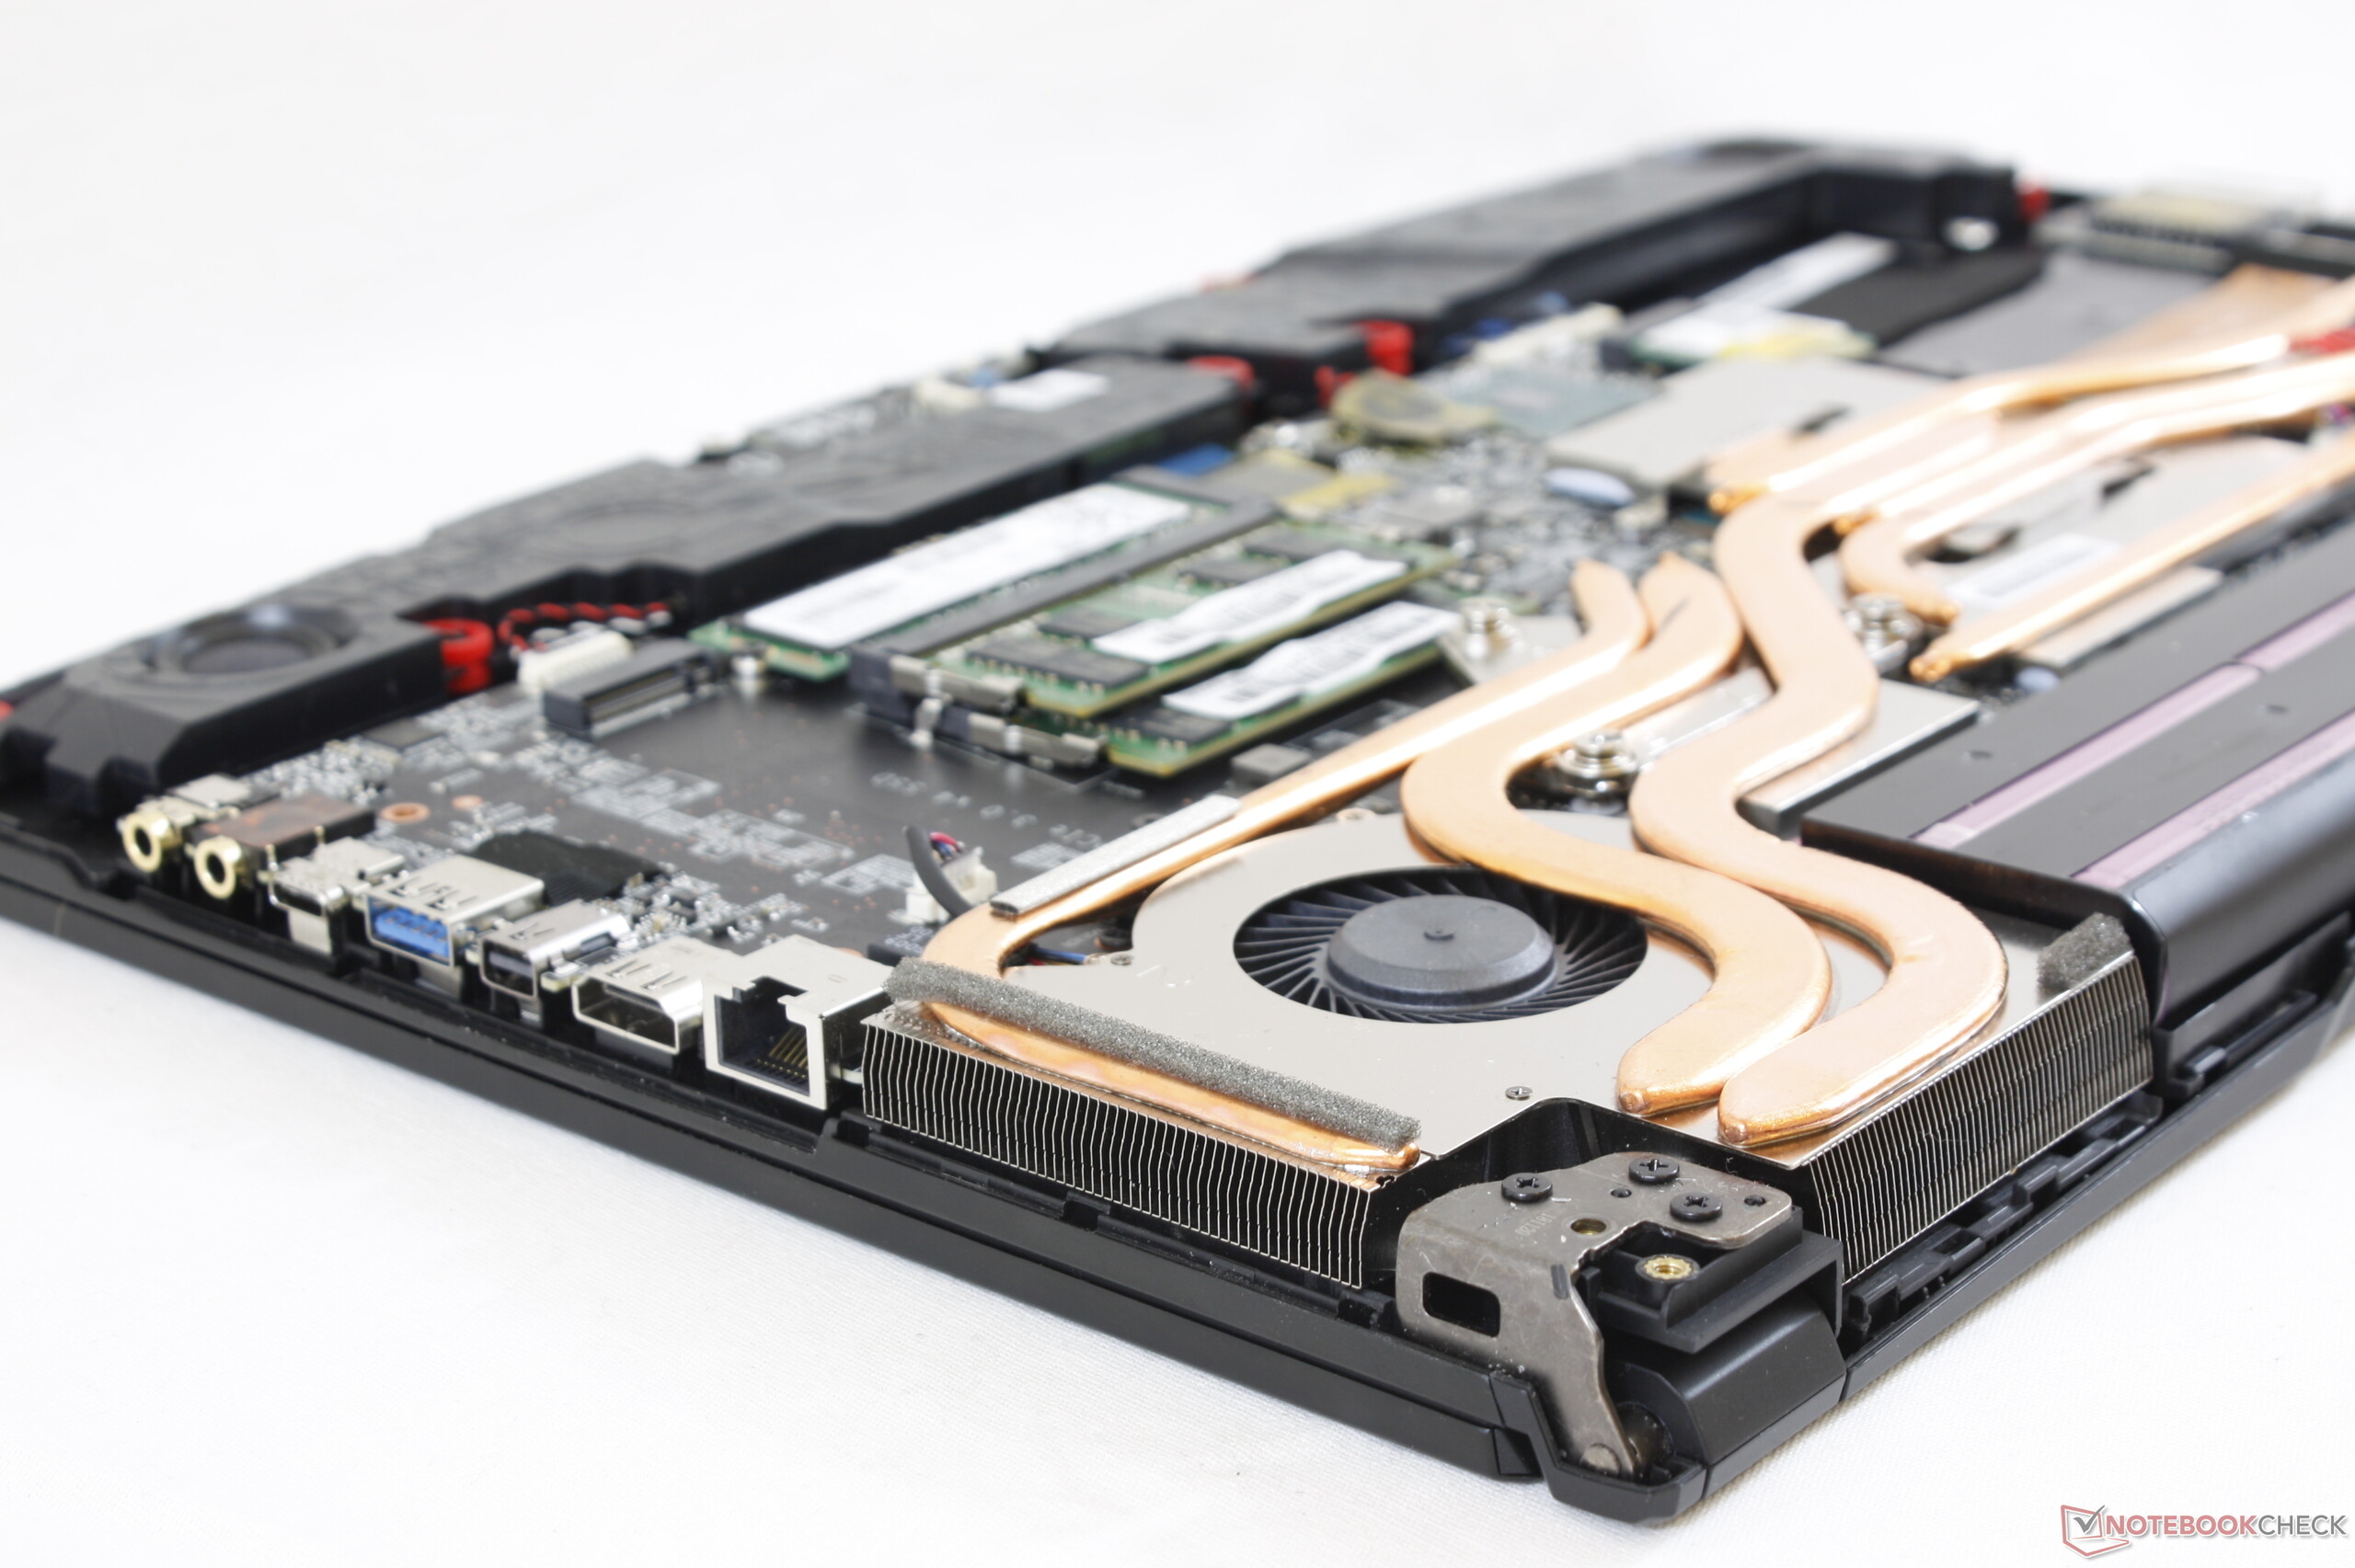
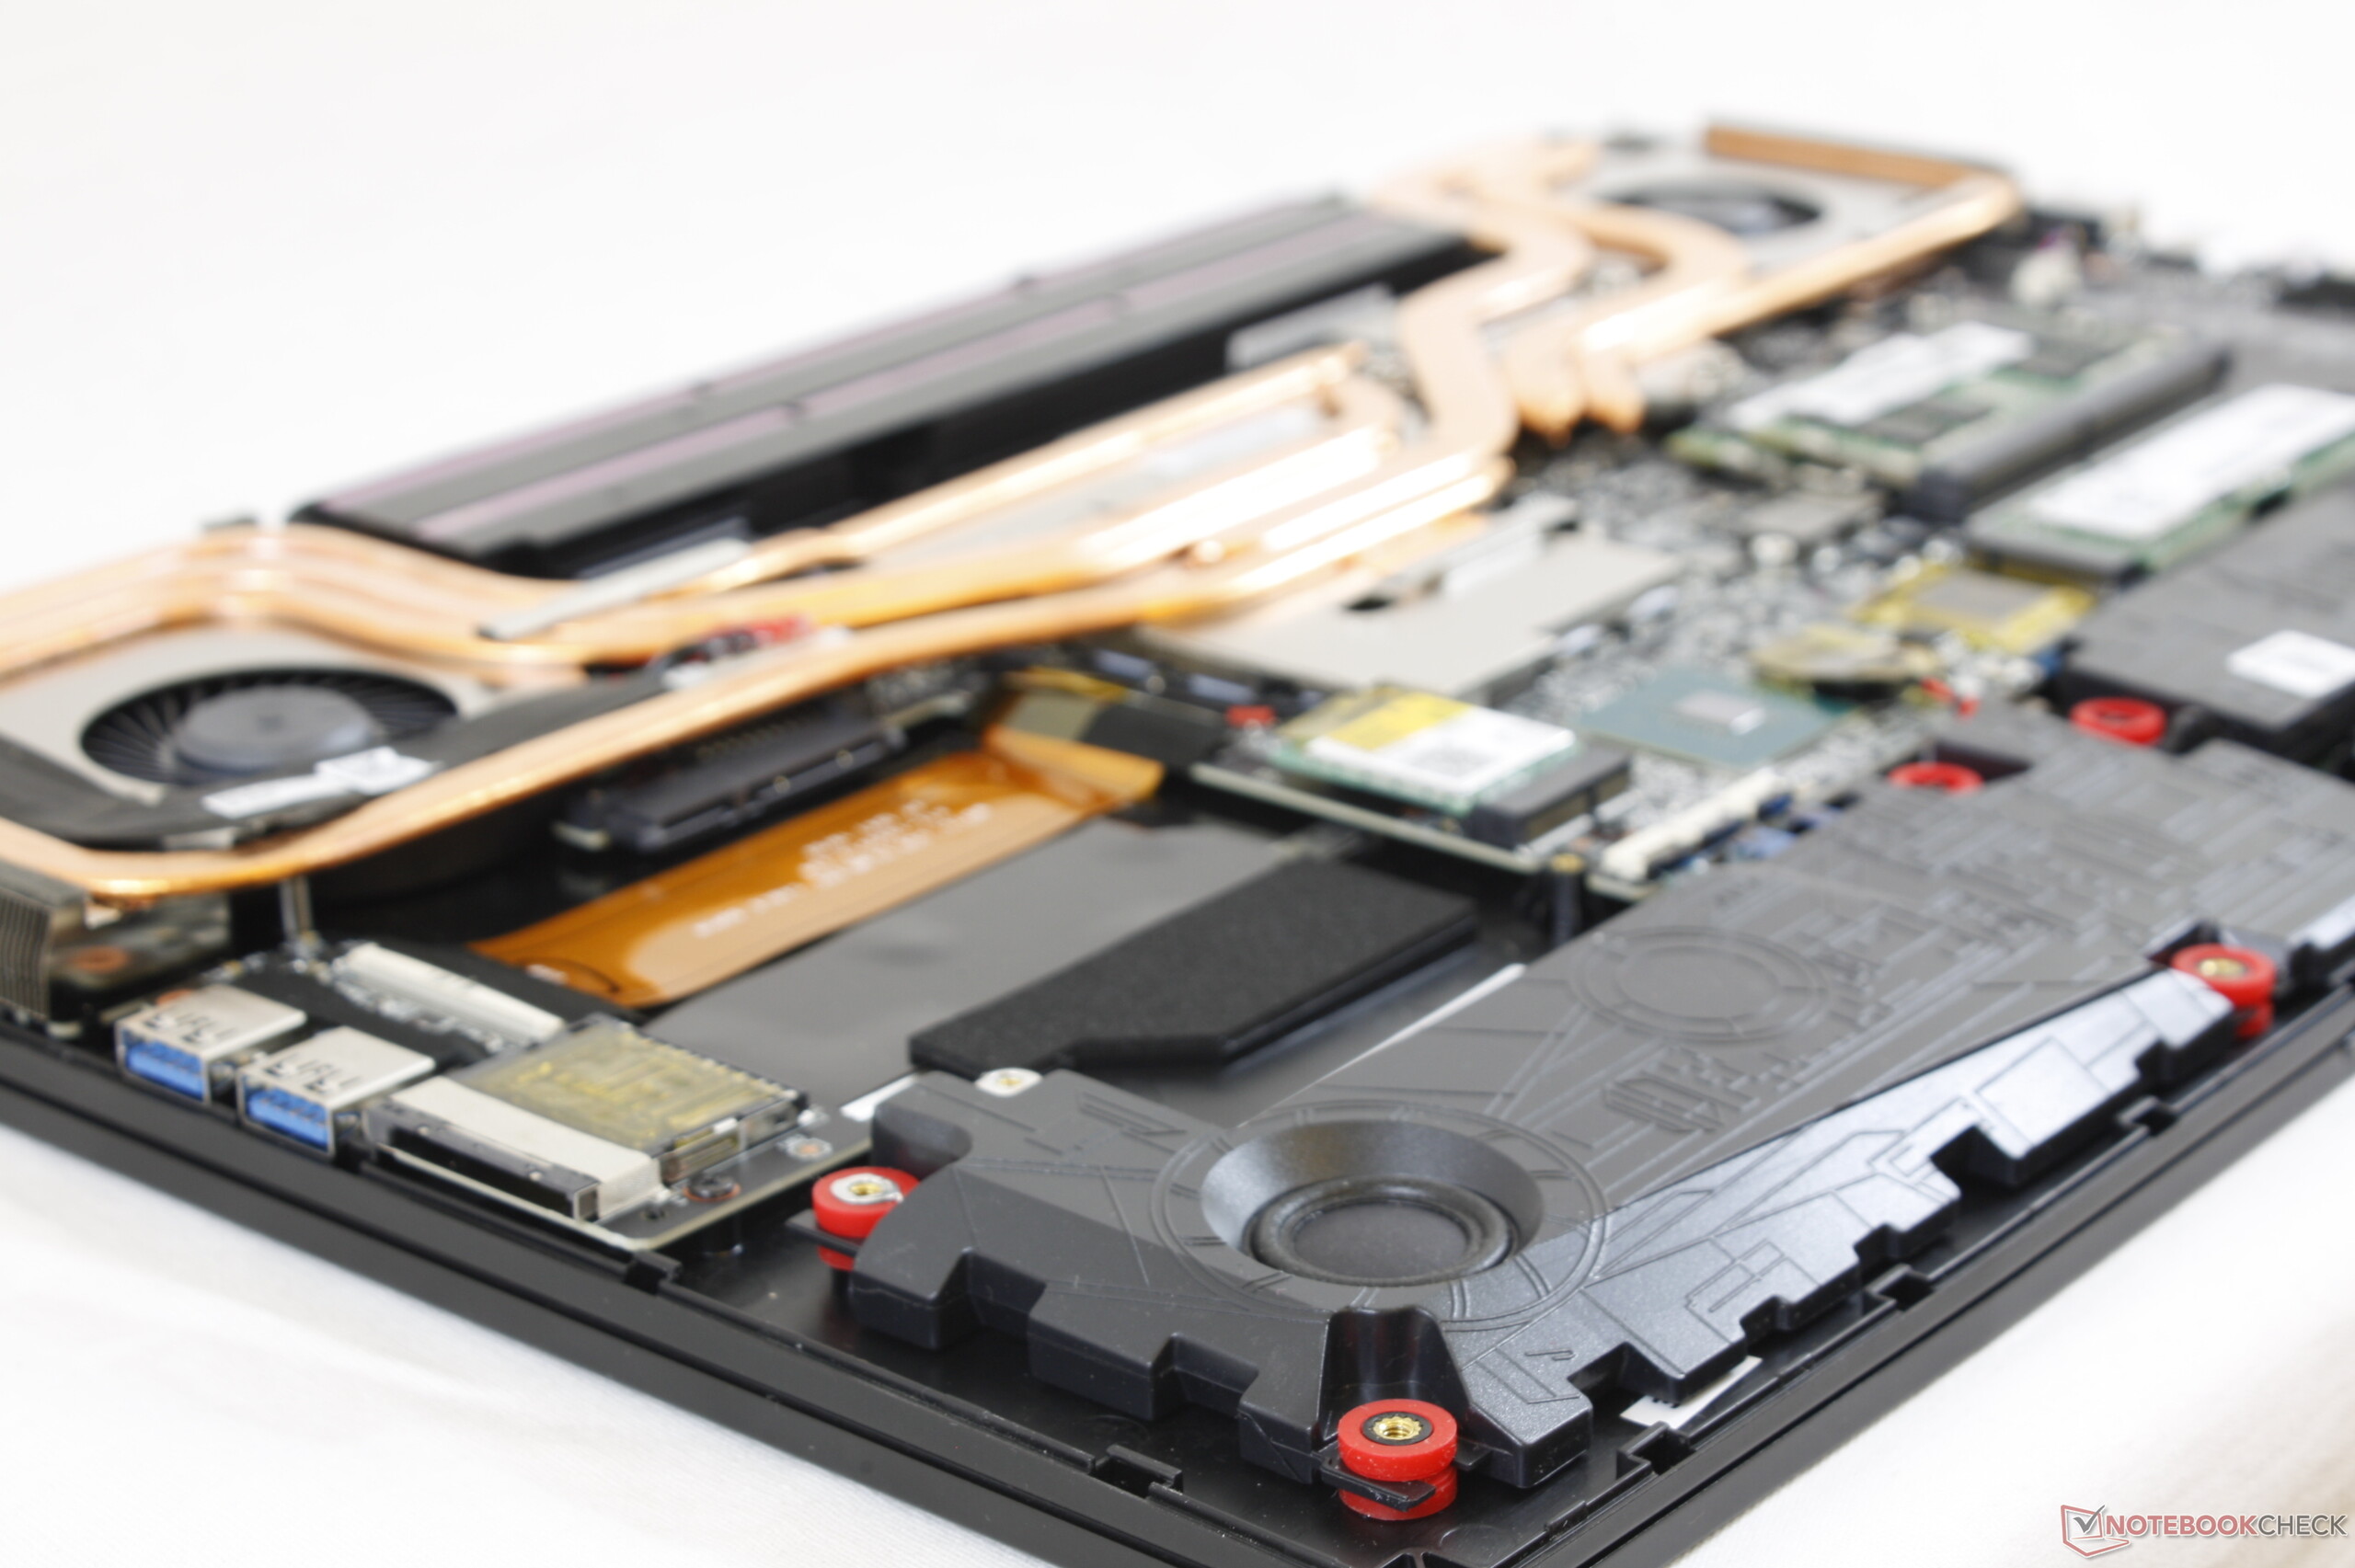
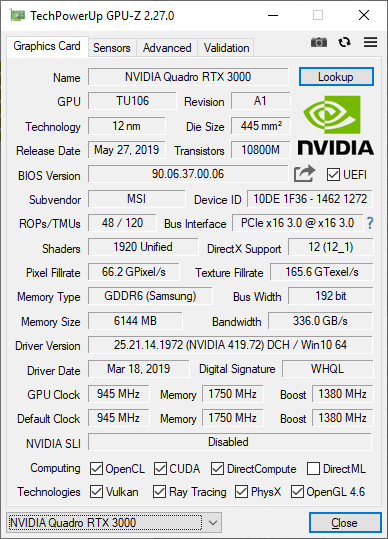
Le GE75 peut être configuré avec des GeForce RTX 2060, 2070 ou 2080, qui sont les équivalentes des Quadro RTX 3000, 4000 et 5000. Mais le WE75 ne peut intégrer qu’une RTX 3000 au moment de ces tests. Le châssis devrait être capable de gérer les Quadro RTX plus puissantes, d’autant que le GPU ne monte qu’à 70 °C quand il est sollicité à 100 %. Le WE75 pourrait donc être plus puissant, mais MSI pourrait avoir repoussé ces versions plus puissantes à une date ultérieure, afin de favoriser les séries WT75 et WS65 plus haut de gammes.
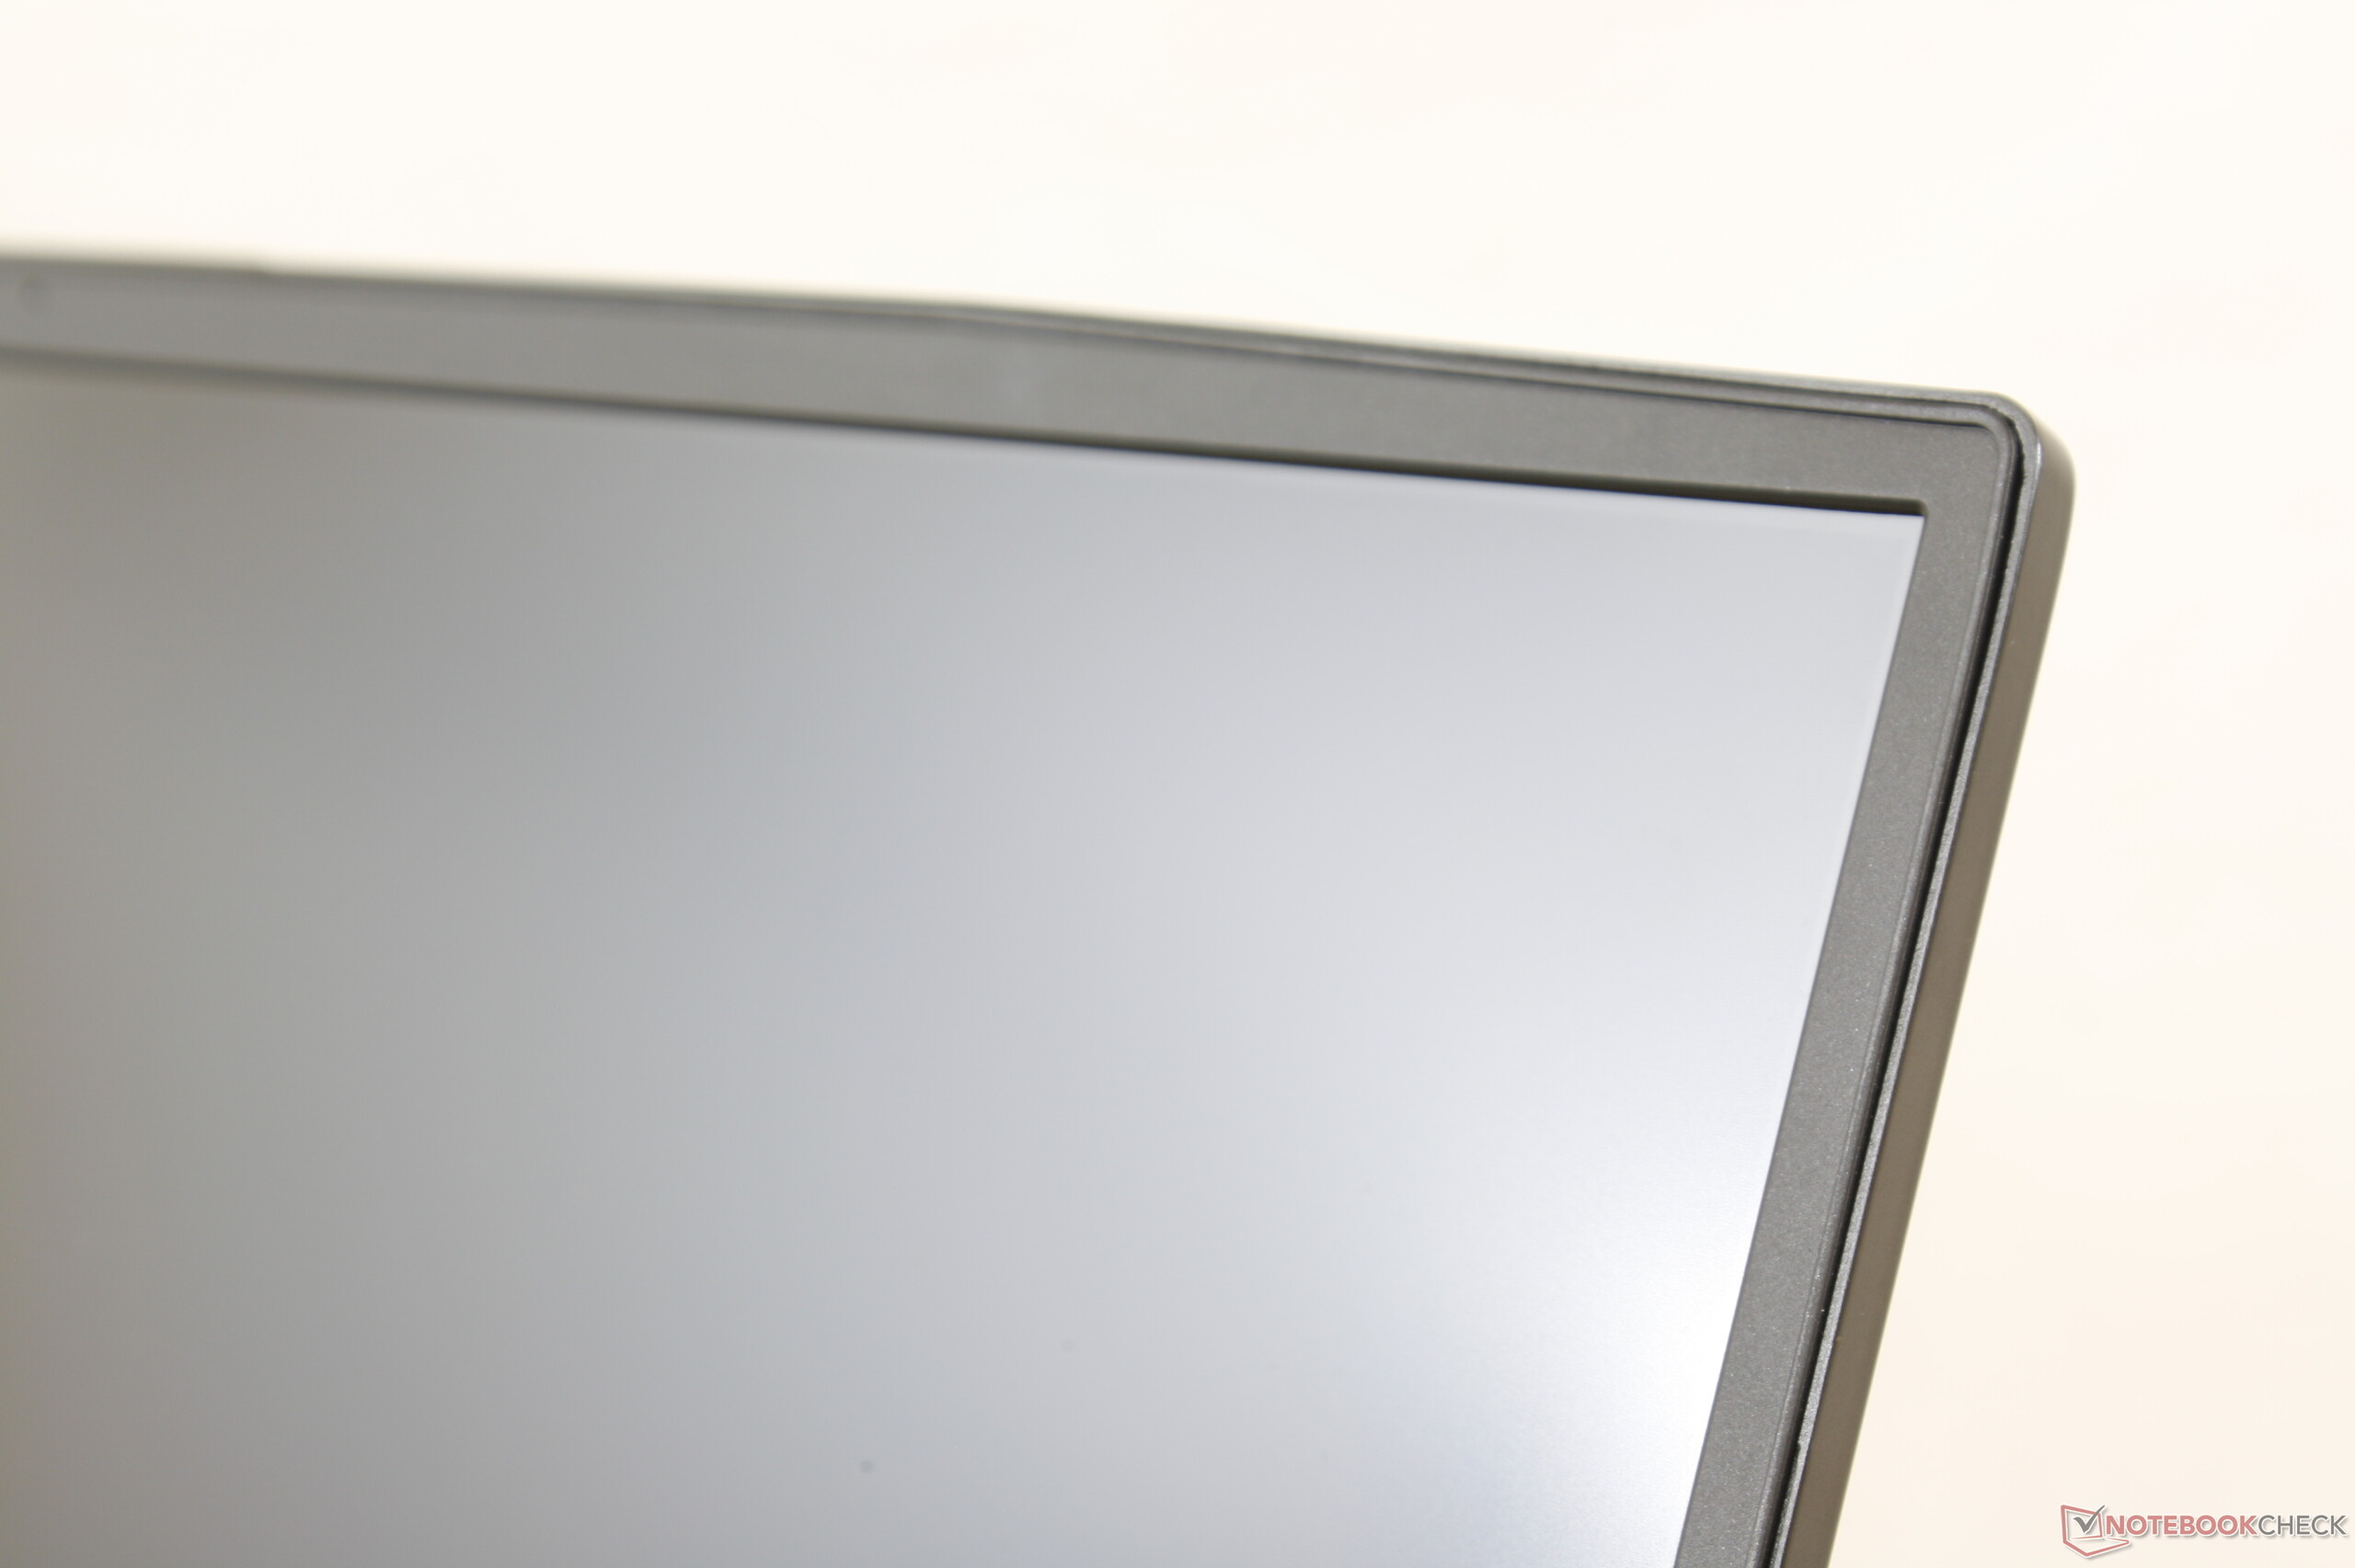
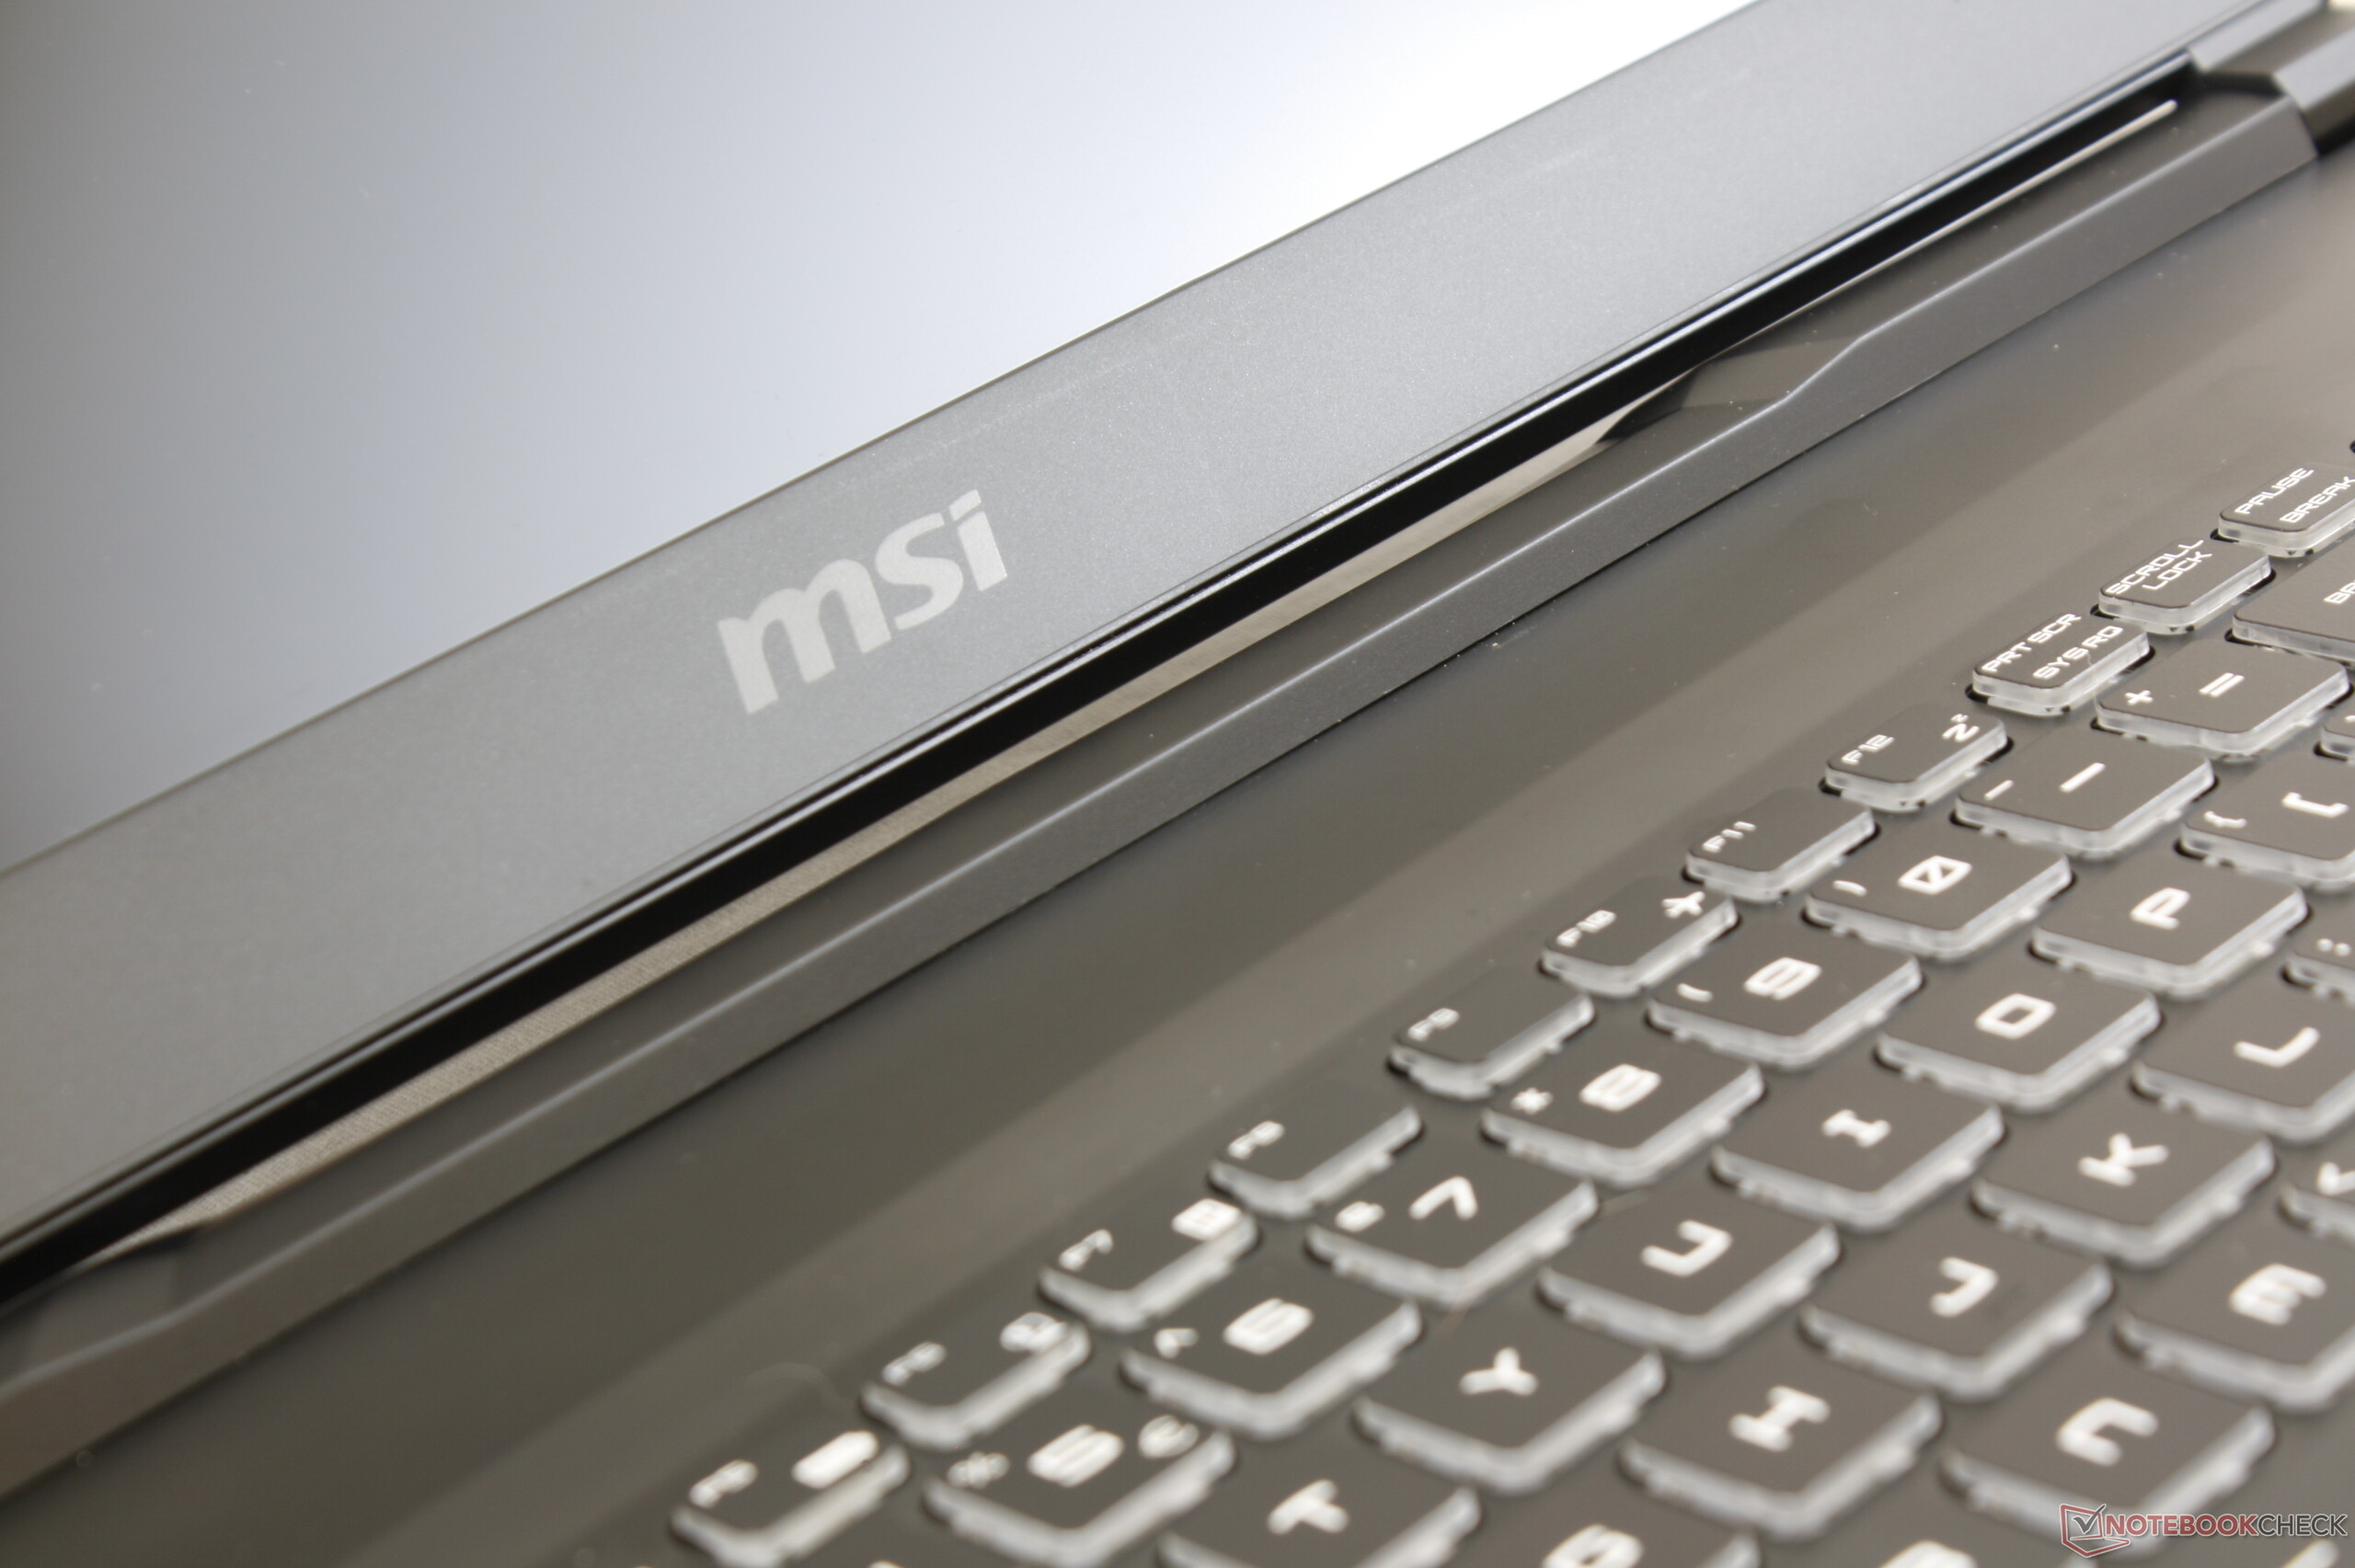
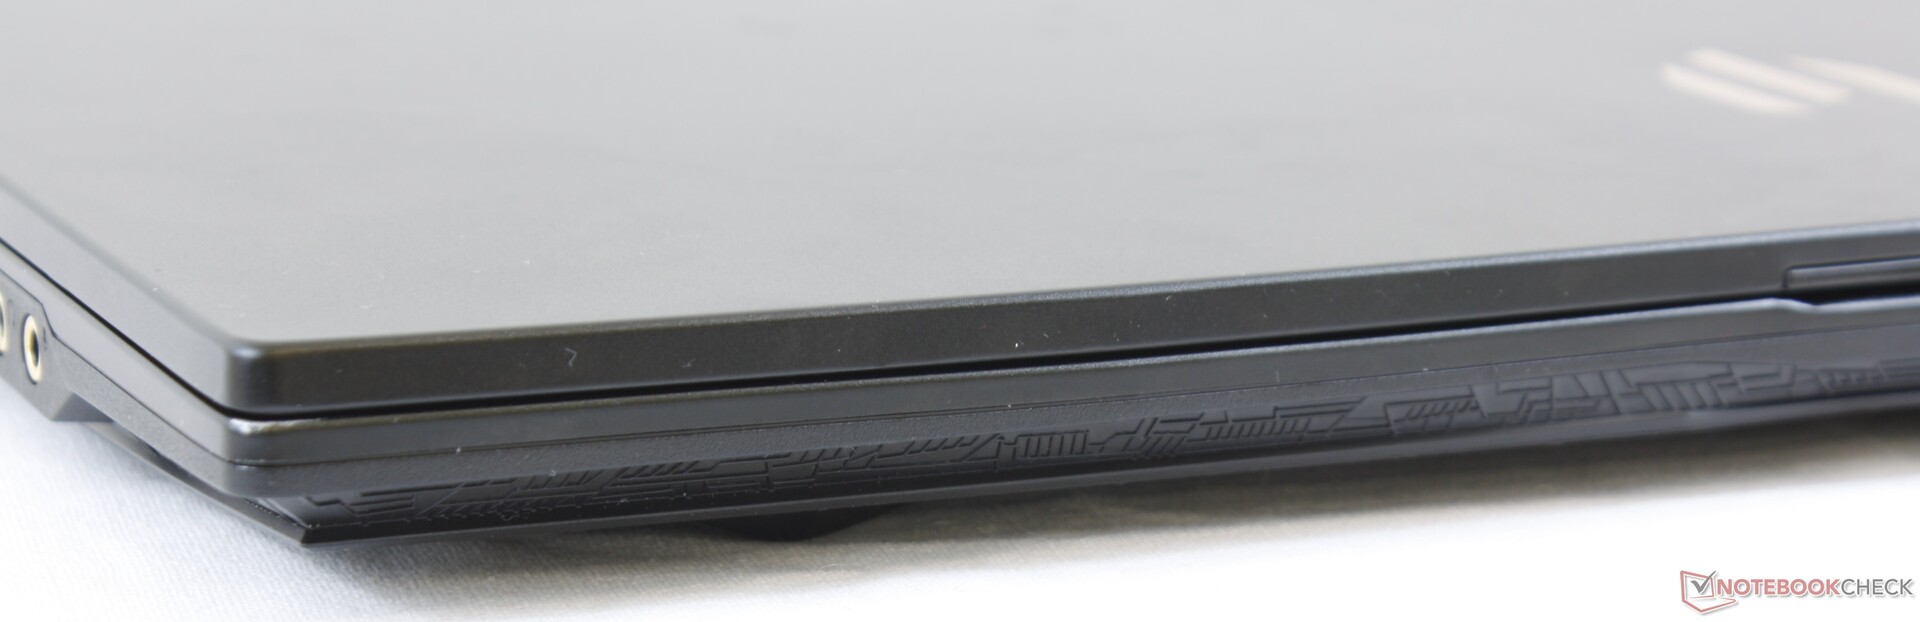
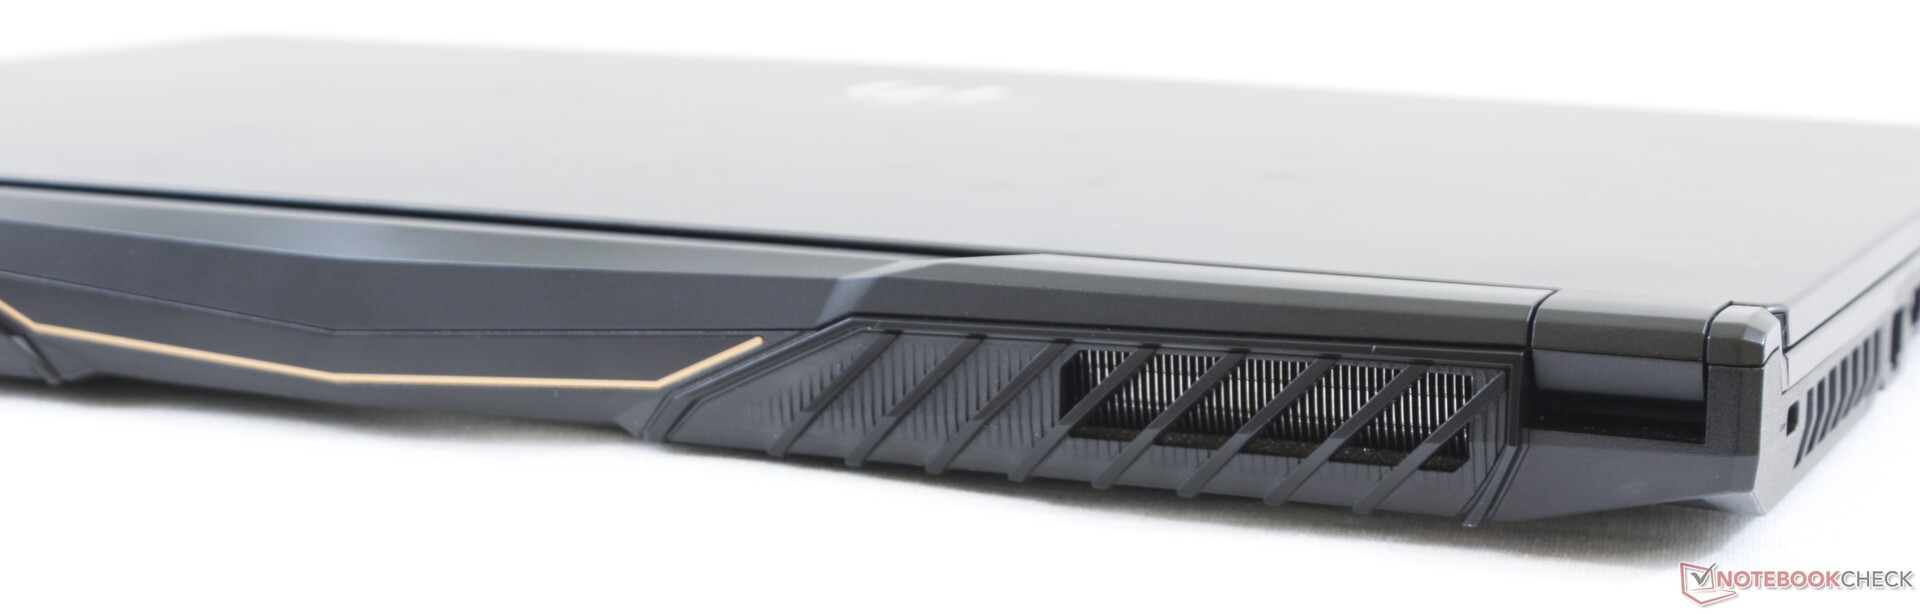
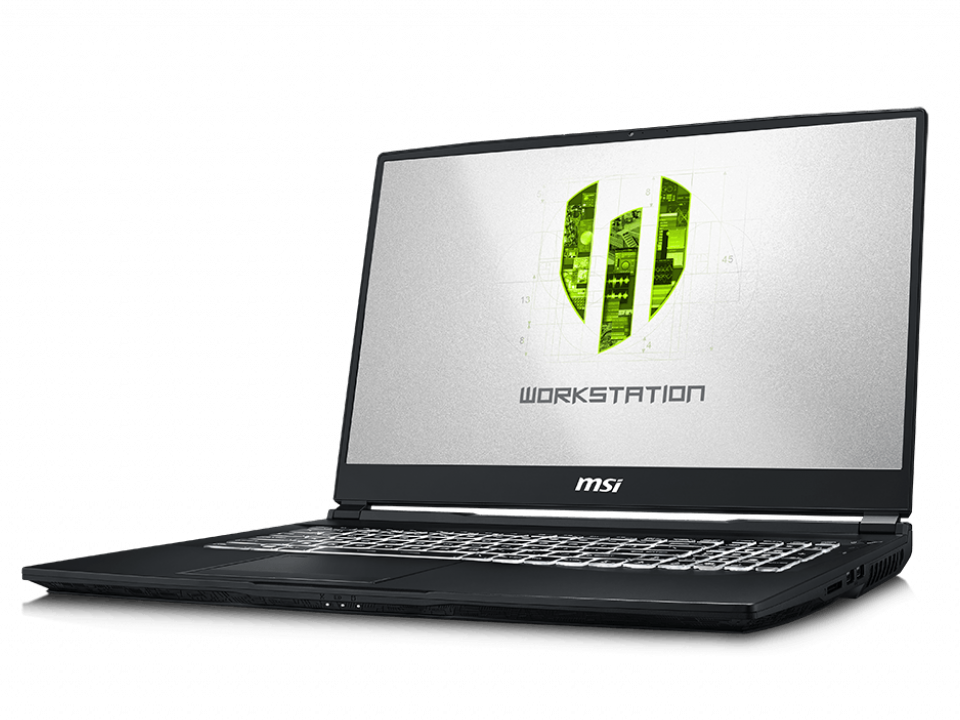
Mis à part cette bizarrerie des versions des cartes graphiques, le WE75 séduit avec ses bordures d’écran étroites, et son poids relativement contenu pour sa catégorie. Il est certainement plus facile à déplacer que les autres stations de travail de 17,3 pouces, qu’il s’agisse de celles de Lenovo, Dell ou HP.
Le WE75 est à la fois léger et séduisant dans une catégorie pleine d’appareil carrés et encombrants, tout en offrant des performances du milieu de gamme. Ceux qui recherchent le plus de performances possibles iront cependant du côté des WT75 et WS65, pour avoir des GPU plus puissants.
L’intégralité de cette critique est disponible en anglais en suivant ce lien.
MSI WE75 9TK
- 11/25/2019 v7 (old)
Allen Ngo
Price comparison
