Test de l'Asus Zephyrus G14 (Ryzen 9, RTX 2060 Max-Q, FHD, 120 Hz) : le Core i9 au bord du gouffre
Note | Date | Modèle | Poids | Épaisseur | Taille | Résolution | Prix |
|---|---|---|---|---|---|---|---|
| 83.6 % v7 (old) | 05/20 | Asus Zephyrus G14 GA401IV R9 4900HS, GeForce RTX 2060 Max-Q | 1.6 kg | 17.9 mm | 14.00" | 1920x1080 | |
| 82.9 % v7 (old) | 10/19 | Asus ROG Zephyrus M15 GU502GU-XB74 i7-9750H, GeForce GTX 1660 Ti Mobile | 2 kg | 18.9 mm | 15.60" | 1920x1080 | |
| 84.2 % v7 (old) | 09/19 | Razer Blade 15 GTX 1660 Ti i7-9750H, GeForce GTX 1660 Ti Mobile | 2.1 kg | 19.9 mm | 15.60" | 1920x1080 | |
| 83.8 % v7 (old) | 06/19 | MSI GS65 Stealth 9SG i7-9750H, GeForce RTX 2080 Max-Q | 2 kg | 18 mm | 15.60" | 1920x1080 | |
| 83 % v7 (old) | 09/19 | Alienware m15 R2 P87F i7-9750H, GeForce RTX 2080 Max-Q | 2.2 kg | 18.3 mm | 15.60" | 1920x1080 | |
| 84.2 % v7 (old) | 03/20 | MSI Prestige 14 A10SC-009 i7-10710U, GeForce GTX 1650 Max-Q | 1.3 kg | 16 mm | 14.00" | 3840x2160 |
| |||||||||||||||||||||||||
Homogénéité de la luminosité: 87 %
Valeur mesurée au centre, sur batterie: 192.3 cd/m²
Contraste: 1239:1 (Valeurs des noirs: 0.26 cd/m²)
ΔE ColorChecker Calman: 2.43 | ∀{0.5-29.43 Ø4.73}
calibrated: 2.29
ΔE Greyscale Calman: 3.3 | ∀{0.09-98 Ø4.97}
91.9% sRGB (Argyll 1.6.3 3D)
60% AdobeRGB 1998 (Argyll 1.6.3 3D)
67.2% AdobeRGB 1998 (Argyll 3D)
92% sRGB (Argyll 3D)
66.5% Display P3 (Argyll 3D)
Gamma: 2.22
CCT: 6902 K
| Asus Zephyrus G14 GA401IV CEC PA LM140LF-1F01, IPS, 14", 1920x1080 | Asus ROG Zephyrus M15 GU502GU-XB74 AU Optronics B156HAN08.2, IPS, 15.6", 1920x1080 | Razer Blade 15 GTX 1660 Ti BOE NV156FHM-N4K, IPS, 15.6", 1920x1080 | MSI GS65 Stealth 9SG Sharp LQ156M1JW03 (SHP14C5), IPS, 15.6", 1920x1080 | Alienware m15 R2 P87F Sharp LQ156M1, IPS, 15.6", 1920x1080 | MSI Prestige 14 A10SC-009 IPS, 14", 3840x2160 | |
|---|---|---|---|---|---|---|
| Display | -1% | -1% | 4% | -0% | ||
| Display P3 Coverage (%) | 66.5 | 66.5 0% | 65.3 -2% | 67.6 2% | 65.3 -2% | |
| sRGB Coverage (%) | 92 | 90.8 -1% | 91.8 0% | 97.5 6% | 95.1 3% | |
| AdobeRGB 1998 Coverage (%) | 67.2 | 66.5 -1% | 66.5 -1% | 68.9 3% | 65.9 -2% | |
| Response Times | 80% | 70% | 68% | 69% | -15% | |
| Response Time Grey 50% / Grey 80% * (ms) | 43.6 ? | 6.4 ? 85% | 13.6 ? 69% | 13.6 ? 69% | 16.4 ? 62% | 55 ? -26% |
| Response Time Black / White * (ms) | 34.8 ? | 8.8 ? 75% | 10 ? 71% | 12 ? 66% | 8.8 ? 75% | 36 ? -3% |
| PWM Frequency (Hz) | 200 ? | 23260 ? | 23810 ? | |||
| Screen | -17% | -17% | 13% | -39% | 24% | |
| Brightness middle (cd/m²) | 322.2 | 297.7 -8% | 312.7 -3% | 282.3 -12% | 324.2 1% | 567 76% |
| Brightness (cd/m²) | 302 | 280 -7% | 305 1% | 269 -11% | 304 1% | 516 71% |
| Brightness Distribution (%) | 87 | 84 -3% | 90 3% | 90 3% | 90 3% | 86 -1% |
| Black Level * (cd/m²) | 0.26 | 0.43 -65% | 0.27 -4% | 0.32 -23% | 0.38 -46% | 0.445 -71% |
| Contrast (:1) | 1239 | 692 -44% | 1158 -7% | 882 -29% | 853 -31% | 1274 3% |
| Colorchecker dE 2000 * | 2.43 | 3.13 -29% | 4.57 -88% | 1.17 52% | 5.01 -106% | 1.55 36% |
| Colorchecker dE 2000 max. * | 5.07 | 7.1 -40% | 6.81 -34% | 3.29 35% | 12.7 -150% | 5.14 -1% |
| Colorchecker dE 2000 calibrated * | 2.29 | 3.06 -34% | 2.91 -27% | 1.06 54% | 1.64 28% | 1.24 46% |
| Greyscale dE 2000 * | 3.3 | 1.9 42% | 4.3 -30% | 1.3 61% | 7.9 -139% | 1.48 55% |
| Gamma | 2.22 99% | 2.23 99% | 2.29 96% | 2.2 100% | 2.35 94% | 2.19 100% |
| CCT | 6902 94% | 6325 103% | 7098 92% | 6643 98% | 8455 77% | 6741 96% |
| Color Space (Percent of AdobeRGB 1998) (%) | 60 | 59.2 -1% | 59.4 -1% | 63.8 6% | 60.8 1% | |
| Color Space (Percent of sRGB) (%) | 91.9 | 90.5 -2% | 91.3 -1% | 97.5 6% | 95.5 4% | |
| Moyenne finale (programmes/paramètres) | 21% /
-2% | 17% /
-3% | 28% /
18% | 10% /
-19% | 5% /
17% |
* ... Moindre est la valeur, meilleures sont les performances
Temps de réponse de l'écran
| ↔ Temps de réponse noir à blanc | ||
|---|---|---|
| 34.8 ms ... hausse ↗ et chute ↘ combinées | ↗ 20.4 ms hausse | 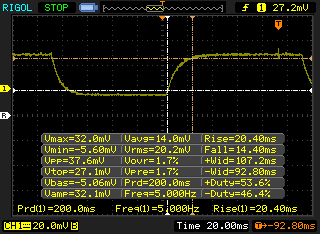 |
| ↘ 14.4 ms chute | ||
| L'écran souffre de latences très élevées, à éviter pour le jeu. En comparaison, tous les appareils testés affichent entre 0.1 (minimum) et 240 (maximum) ms. » 92 % des appareils testés affichent de meilleures performances. Cela signifie que les latences relevées sont moins bonnes que la moyenne (19.9 ms) de tous les appareils testés. | ||
| ↔ Temps de réponse gris 50% à gris 80% | ||
| 43.6 ms ... hausse ↗ et chute ↘ combinées | ↗ 21.2 ms hausse | 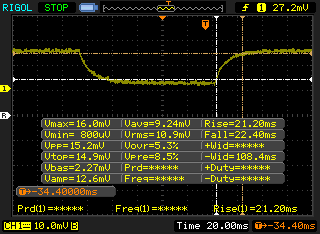 |
| ↘ 22.4 ms chute | ||
| L'écran souffre de latences très élevées, à éviter pour le jeu. En comparaison, tous les appareils testés affichent entre 0.165 (minimum) et 636 (maximum) ms. » 73 % des appareils testés affichent de meilleures performances. Cela signifie que les latences relevées sont moins bonnes que la moyenne (31.1 ms) de tous les appareils testés. | ||
Scintillement / MLI (Modulation de largeur d'impulsion)
| Scintillement / MLI (Modulation de largeur d'impulsion) non décelé | 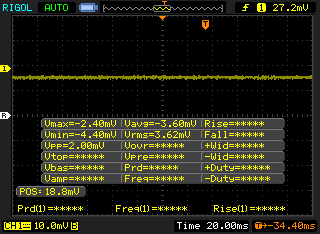 | ||
En comparaison, 52 % des appareils testés n'emploient pas MDI pour assombrir leur écran. Nous avons relevé une moyenne à 7798 (minimum : 5 - maximum : 343500) Hz dans le cas où une MDI était active. | |||
| Cinebench R11.5 | |
| CPU Single 64Bit | |
| Corsair One i160 | |
| AMD Radeon RX Vega 64 | |
| Asus Zephyrus G14 GA401IV | |
| MSI GE75 9SG | |
| CPU Multi 64Bit | |
| AMD Radeon RX Vega 64 | |
| Corsair One i160 | |
| MSI GE75 9SG | |
| Asus Zephyrus G14 GA401IV | |
| wPrime 2.10 - 1024m | |
| MSI GE75 9SG | |
| Corsair One i160 | |
| Asus Zephyrus G14 GA401IV | |
| AMD Radeon RX Vega 64 | |
* ... Moindre est la valeur, meilleures sont les performances
| PCMark 8 Home Score Accelerated v2 | 4815 points | |
| PCMark 8 Work Score Accelerated v2 | 5738 points | |
| PCMark 10 Score | 5751 points | |
Aide | ||
| Asus Zephyrus G14 GA401IV Intel SSD 660p 1TB SSDPEKNW010T8 | Asus ROG Zephyrus M15 GU502GU-XB74 Intel SSD 660p SSDPEKNW512G8 | MSI GS65 Stealth 9SG Samsung SSD PM981 MZVLB512HAJQ | Alienware m15 R2 P87F 2x Toshiba XG6 KXG60ZNV512G (RAID 0) | MSI Prestige 14 A10SC-009 Samsung SSD PM981 MZVLB1T0HALR | |
|---|---|---|---|---|---|
| AS SSD | -30% | 47% | 23% | 60% | |
| Seq Read (MB/s) | 1278 | 1221 -4% | 2005 57% | 1925 51% | 2300 80% |
| Seq Write (MB/s) | 1624 | 911 -44% | 1580 -3% | 2371 46% | 2051 26% |
| 4K Read (MB/s) | 57.8 | 48.24 -17% | 49.33 -15% | 37.2 -36% | 46.23 -20% |
| 4K Write (MB/s) | 163 | 99.2 -39% | 103.8 -36% | 108.9 -33% | 84.6 -48% |
| 4K-64 Read (MB/s) | 582 | 321.4 -45% | 1241 113% | 1177 102% | 1552 167% |
| 4K-64 Write (MB/s) | 849 | 744 -12% | 1730 104% | 1135 34% | 1789 111% |
| Access Time Read * (ms) | 0.036 | 0.071 -97% | 0.054 -50% | 0.065 -81% | 0.049 -36% |
| Access Time Write * (ms) | 0.112 | 0.139 -24% | 0.036 68% | 0.108 4% | 0.045 60% |
| Score Read (Points) | 768 | 492 -36% | 1490 94% | 1407 83% | 1828 138% |
| Score Write (Points) | 1174 | 934 -20% | 1991 70% | 1481 26% | 2079 77% |
| Score Total (Points) | 2372 | 1681 -29% | 4230 78% | 3633 53% | 4831 104% |
| Copy ISO MB/s (MB/s) | 1660 | 906 -45% | 3025 82% | 2073 25% | |
| Copy Program MB/s (MB/s) | 443.5 | 486.6 10% | 713 61% | 576 30% | |
| Copy Game MB/s (MB/s) | 1162 | 952 -18% | 1554 34% | 1426 23% | |
| CrystalDiskMark 5.2 / 6 | -19% | -3% | 20% | 7% | |
| Write 4K (MB/s) | 189.5 | 156 -18% | 91.3 -52% | 108.8 -43% | 163.8 -14% |
| Read 4K (MB/s) | 62.7 | 60.7 -3% | 40.73 -35% | 45.41 -28% | 48.6 -22% |
| Write Seq (MB/s) | 1735 | 968 -44% | 1915 10% | 2467 42% | 2269 31% |
| Read Seq (MB/s) | 1608 | 1619 1% | 2051 28% | 2456 53% | 1963 22% |
| Write 4K Q32T1 (MB/s) | 475.5 | 485 2% | 308.3 -35% | 532 12% | 289.8 -39% |
| Read 4K Q32T1 (MB/s) | 555 | 337.3 -39% | 417.4 -25% | 590 6% | 373.6 -33% |
| Write Seq Q32T1 (MB/s) | 1802 | 969 -46% | 1922 7% | 2801 55% | 2395 33% |
| Read Seq Q32T1 (MB/s) | 1929 | 1825 -5% | 3395 76% | 3172 64% | 3479 80% |
| Moyenne finale (programmes/paramètres) | -25% /
-26% | 22% /
29% | 22% /
22% | 34% /
38% |
* ... Moindre est la valeur, meilleures sont les performances

| 3DMark 06 Standard Score | 37332 points | |
| 3DMark Vantage P Result | 50957 points | |
| 3DMark 11 Performance | 18937 points | |
| 3DMark Ice Storm Standard Score | 85539 points | |
| 3DMark Cloud Gate Standard Score | 38287 points | |
| 3DMark Fire Strike Score | 14649 points | |
| 3DMark Time Spy Score | 6171 points | |
Aide | ||
| Rocket League | |
| 1280x720 Performance | |
| Lenovo Yoga C940-15IRH | |
| Asus Zephyrus G14 GA401IV | |
| MSI RTX 2060 Gaming Z 6G | |
| Asus ROG Zephyrus G15 GA502DU | |
| 1920x1080 High Quality AA:High FX | |
| MSI RTX 2060 Gaming Z 6G | |
| Asus Zephyrus G14 GA401IV | |
| Lenovo Yoga C940-15IRH | |
| Asus ROG Zephyrus G15 GA502DU | |
| Bas | Moyen | Élevé | Ultra | |
|---|---|---|---|---|
| Guild Wars 2 (2012) | 130.3 | 67.3 | 67.4 | |
| BioShock Infinite (2013) | 278.3 | 252.3 | 229.5 | 126.2 |
| The Witcher 3 (2015) | 232.2 | 168.2 | 100.6 | 58.4 |
| Metal Gear Solid V (2015) | 60 | 60 | 60 | 59.2 |
| Dota 2 Reborn (2015) | 120.8 | 115.1 | 107.8 | 103.8 |
| Ashes of the Singularity (2016) | 100.4 | 72.8 | 66.8 | |
| Doom (2016) | 125 | 125 | 118.2 | 111.5 |
| Overwatch (2016) | 299.9 | 299.7 | 229.7 | 146.9 |
| Rocket League (2017) | 246.9 | 249.7 | 219.3 | |
| Middle-earth: Shadow of War (2017) | 155 | 123 | 97 | 76 |
| Fortnite (2018) | 124 | 110.2 | 107.4 | 81.2 |
| Final Fantasy XV Benchmark (2018) | 141 | 82.7 | 62.4 | |
| X-Plane 11.11 (2018) | 94.9 | 81.9 | 69.7 | |
| Monster Hunter World (2018) | 104.5 | 94.2 | 75.6 | 63.6 |
| Shadow of the Tomb Raider (2018) | 118 | 90 | 84 | 74 |
| Assassin´s Creed Odyssey (2018) | 97 | 79 | 65 | 45 |
| Apex Legends (2019) | 143.6 | 142.8 | 126.2 | 116.6 |
| Metro Exodus (2019) | 129.6 | 72.7 | 55.2 | 43.8 |
| The Division 2 (2019) | 154 | 92 | 74 | 56 |
| Anno 1800 (2019) | 81.5 | 81.6 | 61.4 | 36.5 |
| Total War: Three Kingdoms (2019) | 201.1 | 103.3 | 69.2 | 50.7 |
| F1 2019 (2019) | 196 | 137 | 116 | 101 |
| Borderlands 3 (2019) | 117 | 89.5 | 61.9 | 48.3 |
| Ghost Recon Breakpoint (2019) | 123 | 82 | 75 | 55 |
| Need for Speed Heat (2019) | 103.2 | 88.7 | 82.2 | 79 |
| Escape from Tarkov (2020) | 78.5 | 68.5 | 68.2 | 85.3 |
| Hunt Showdown (2020) | 194.2 | 96.3 | 75.7 | |
| Doom Eternal (2020) | 176.1 | 108.7 | 95.7 | 93.3 |
| Asus Zephyrus G14 GA401IV GeForce RTX 2060 Max-Q, R9 4900HS, Intel SSD 660p 1TB SSDPEKNW010T8 | Asus ROG Zephyrus M15 GU502GU-XB74 GeForce GTX 1660 Ti Mobile, i7-9750H, Intel SSD 660p SSDPEKNW512G8 | Razer Blade 15 GTX 1660 Ti GeForce GTX 1660 Ti Mobile, i7-9750H, Samsung SSD PM981 MZVLB256HAHQ | MSI GS65 Stealth 9SG GeForce RTX 2080 Max-Q, i7-9750H, Samsung SSD PM981 MZVLB512HAJQ | Alienware m15 R2 P87F GeForce RTX 2080 Max-Q, i7-9750H, 2x Toshiba XG6 KXG60ZNV512G (RAID 0) | MSI Prestige 14 A10SC-009 GeForce GTX 1650 Max-Q, i7-10710U, Samsung SSD PM981 MZVLB1T0HALR | |
|---|---|---|---|---|---|---|
| Noise | -1% | 1% | 2% | -10% | 1% | |
| arrêt / environnement * (dB) | 28.1 | 28.2 -0% | 28.5 -1% | 28.3 -1% | 28.3 -1% | 30.3 -8% |
| Idle Minimum * (dB) | 30.4 | 28.7 6% | 30.3 -0% | 30.4 -0% | 28.5 6% | 30.3 -0% |
| Idle Average * (dB) | 31.5 | 30.5 3% | 30.5 3% | 30.5 3% | 28.5 10% | 30.3 4% |
| Idle Maximum * (dB) | 33.7 | 31 8% | 30.5 9% | 30.6 9% | 49 -45% | 30.3 10% |
| Load Average * (dB) | 34.3 | 39 -14% | 41 -20% | 37.6 -10% | 49 -43% | 40.2 -17% |
| Witcher 3 ultra * (dB) | 53.5 | 54.2 -1% | 48 10% | 46 14% | 49 8% | |
| Load Maximum * (dB) | 53.5 | 59.6 -11% | 51.9 3% | 55.1 -3% | 55 -3% | 43.5 19% |
* ... Moindre est la valeur, meilleures sont les performances
Degré de la nuisance sonore
| Au repos |
| 30.4 / 31.5 / 33.7 dB(A) |
| Fortement sollicité |
| 34.3 / 53.5 dB(A) |
 | ||
30 dB silencieux 40 dB(A) audible 50 dB(A) bruyant |
||
min: | ||
(+) La température maximale du côté supérieur est de 36 °C / 97 F, par rapport à la moyenne de 40.4 °C / 105 F, allant de 21.2 à 68.8 °C pour la classe Gaming.
(-) Le fond chauffe jusqu'à un maximum de 46.4 °C / 116 F, contre une moyenne de 43.2 °C / 110 F
(+) En utilisation inactive, la température moyenne du côté supérieur est de 25 °C / 77 F, par rapport à la moyenne du dispositif de 33.9 °C / 93 F.
(±) En jouant à The Witcher 3, la température moyenne du côté supérieur est de 34.5 °C / 94 F, alors que la moyenne de l'appareil est de 33.9 °C / 93 F.
(+) Les repose-poignets et le pavé tactile sont plus froids que la température de la peau avec un maximum de 28.2 °C / 82.8 F et sont donc froids au toucher.
(±) La température moyenne de la zone de l'appui-paume de dispositifs similaires était de 28.8 °C / 83.8 F (+0.6 °C / #1 F).
| Éteint/en veille | |
| Au repos | |
| Fortement sollicité |
|
Légende:
min: | |
| Asus Zephyrus G14 GA401IV R9 4900HS, GeForce RTX 2060 Max-Q, Intel SSD 660p 1TB SSDPEKNW010T8, IPS, 1920x1080, 14" | Asus ROG Zephyrus M15 GU502GU-XB74 i7-9750H, GeForce GTX 1660 Ti Mobile, Intel SSD 660p SSDPEKNW512G8, IPS, 1920x1080, 15.6" | MSI GS65 Stealth 9SG i7-9750H, GeForce RTX 2080 Max-Q, Samsung SSD PM981 MZVLB512HAJQ, IPS, 1920x1080, 15.6" | MSI Prestige 14 A10SC-009 i7-10710U, GeForce GTX 1650 Max-Q, Samsung SSD PM981 MZVLB1T0HALR, IPS, 3840x2160, 14" | Razer Blade Stealth i7-1065G7 Iris Plus i7-1065G7, Iris Plus Graphics G7 (Ice Lake 64 EU), Samsung SSD PM981 MZVLB256HAHQ, IPS, 1920x1080, 13.3" | Dell G7 7590 i7-9750H, GeForce RTX 2060 Mobile, Toshiba BG3 KBG30ZMS256G, IPS, 1920x1080, 15.6" | |
|---|---|---|---|---|---|---|
| Power Consumption | -117% | -86% | 13% | 36% | -74% | |
| Idle Minimum * (Watt) | 5.5 | 17.6 -220% | 18.3 -233% | 5.2 5% | 5.9 -7% | 11.2 -104% |
| Idle Average * (Watt) | 9.3 | 24.7 -166% | 22 -137% | 12.2 -31% | 8.1 13% | 16.3 -75% |
| Idle Maximum * (Watt) | 15.8 | 56.3 -256% | 28.8 -82% | 14.3 9% | 11.2 29% | 46.2 -192% |
| Load Average * (Watt) | 92.2 | 111.1 -20% | 93 -1% | 67 27% | 44.3 52% | 123.3 -34% |
| Witcher 3 ultra * (Watt) | 112.4 | 149 -33% | 142.6 -27% | 41.9 63% | 135.6 -21% | |
| Load Maximum * (Watt) | 156.6 | 170 -9% | 215.9 -38% | 67 57% | 50.2 68% | 181.5 -16% |
* ... Moindre est la valeur, meilleures sont les performances
| Asus Zephyrus G14 GA401IV R9 4900HS, GeForce RTX 2060 Max-Q, 76 Wh | Asus ROG Zephyrus M15 GU502GU-XB74 i7-9750H, GeForce GTX 1660 Ti Mobile, 76 Wh | Razer Blade 15 GTX 1660 Ti i7-9750H, GeForce GTX 1660 Ti Mobile, 65 Wh | MSI GS65 Stealth 9SG i7-9750H, GeForce RTX 2080 Max-Q, 82 Wh | Alienware m15 R2 P87F i7-9750H, GeForce RTX 2080 Max-Q, 76 Wh | MSI Prestige 14 A10SC-009 i7-10710U, GeForce GTX 1650 Max-Q, 52 Wh | |
|---|---|---|---|---|---|---|
| Autonomie de la batterie | -41% | -43% | -37% | -52% | -23% | |
| Reader / Idle (h) | 19 | 7.1 -63% | 9.2 -52% | 9.9 -48% | ||
| WiFi v1.3 (h) | 9.6 | 4.5 -53% | 5.5 -43% | 6 -37% | 5.5 -43% | 5.9 -39% |
| Load (h) | 1.8 | 1.7 -6% | 0.7 -61% | 2.1 17% |
Points positifs
Points négatifs
Verdict
Tous ces graphiques et tests AMD comparant le Ryzen 9 au Core i9 se sont avérés exacts ; le Ryzen 9 4900HS 7 nm dépasse d’une bonne marge le Core i9-9880H 14 nm dans les tests multithread, tout en étant au niveau du meilleur que peut proposer le Core i9-9980HK. Quand on se rappelle que le processeur mobile AMD le plus rapide l’an dernier était le Ryzen 7 3750H, on constate que le nouveau Ryzen 9 4900HS représente un bond significatif des performances et des performances par Watt. Intel va avoir du retard à rattraper quand il va lancer sa série concurrente Comet Lake H de 10e génération dans les mois à venir.
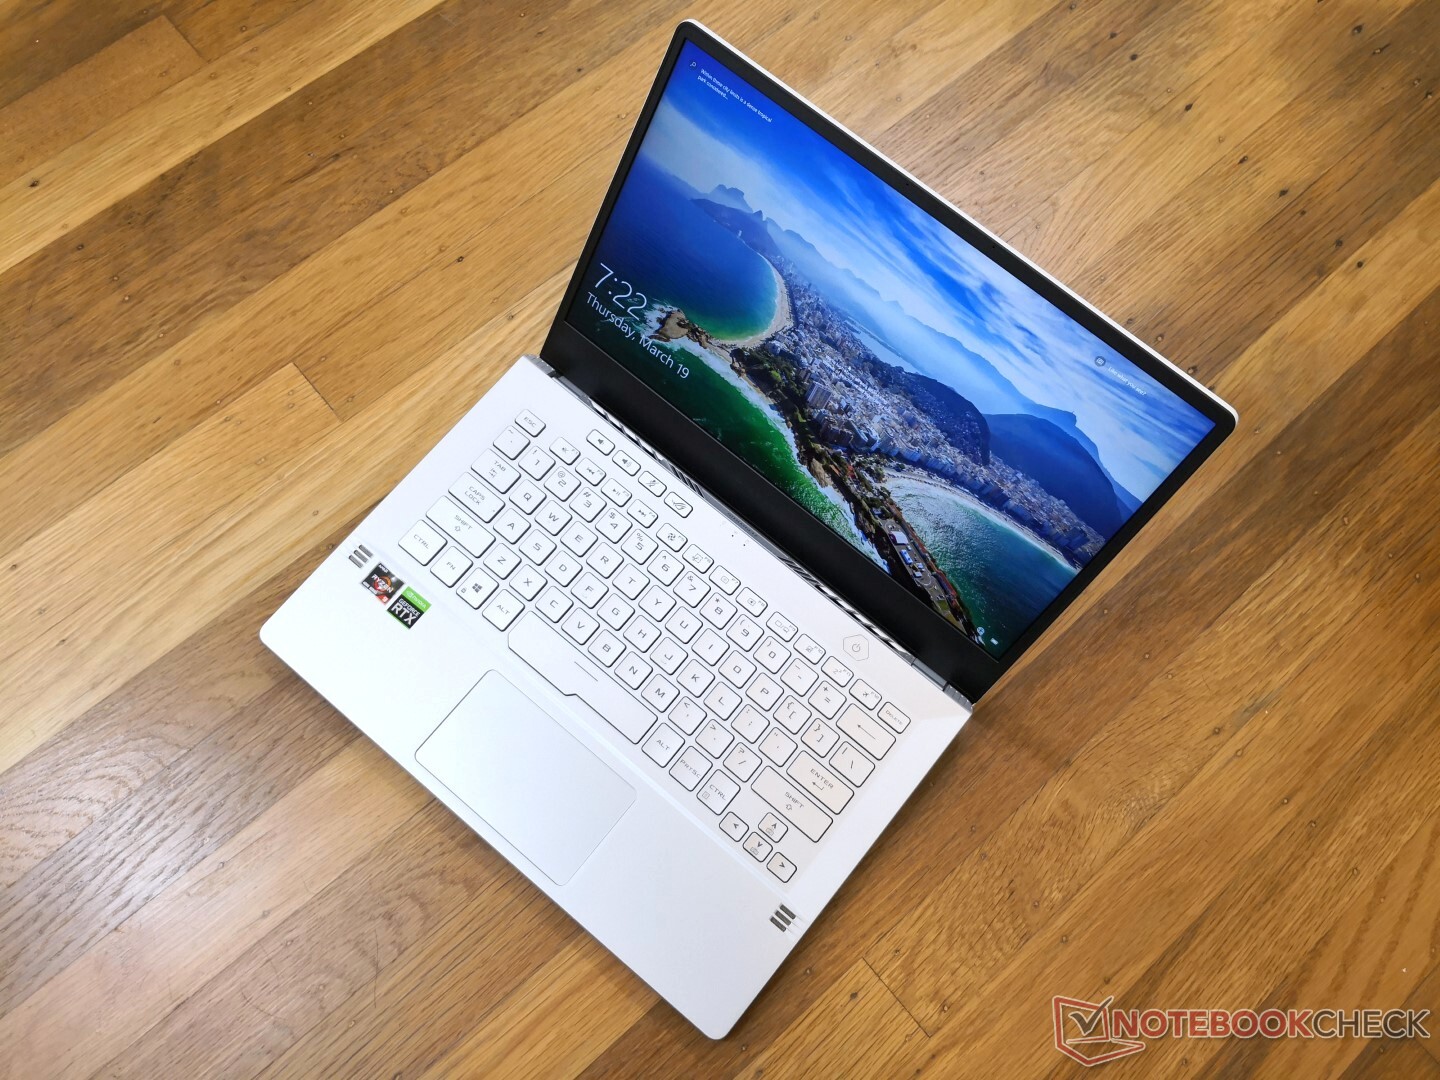
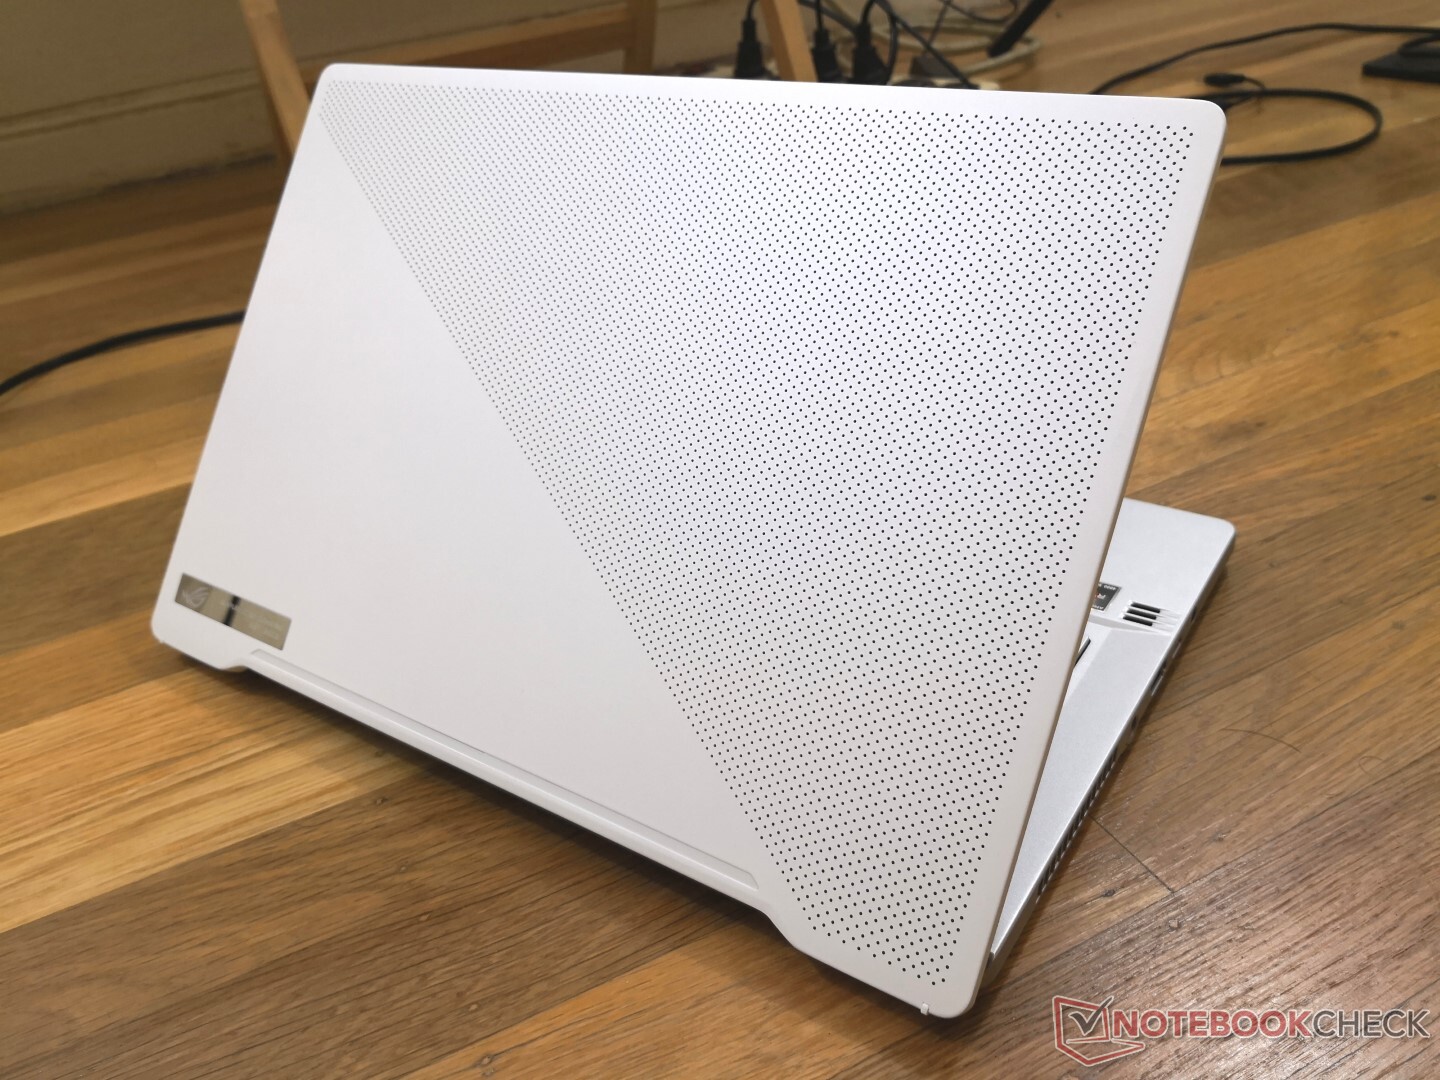
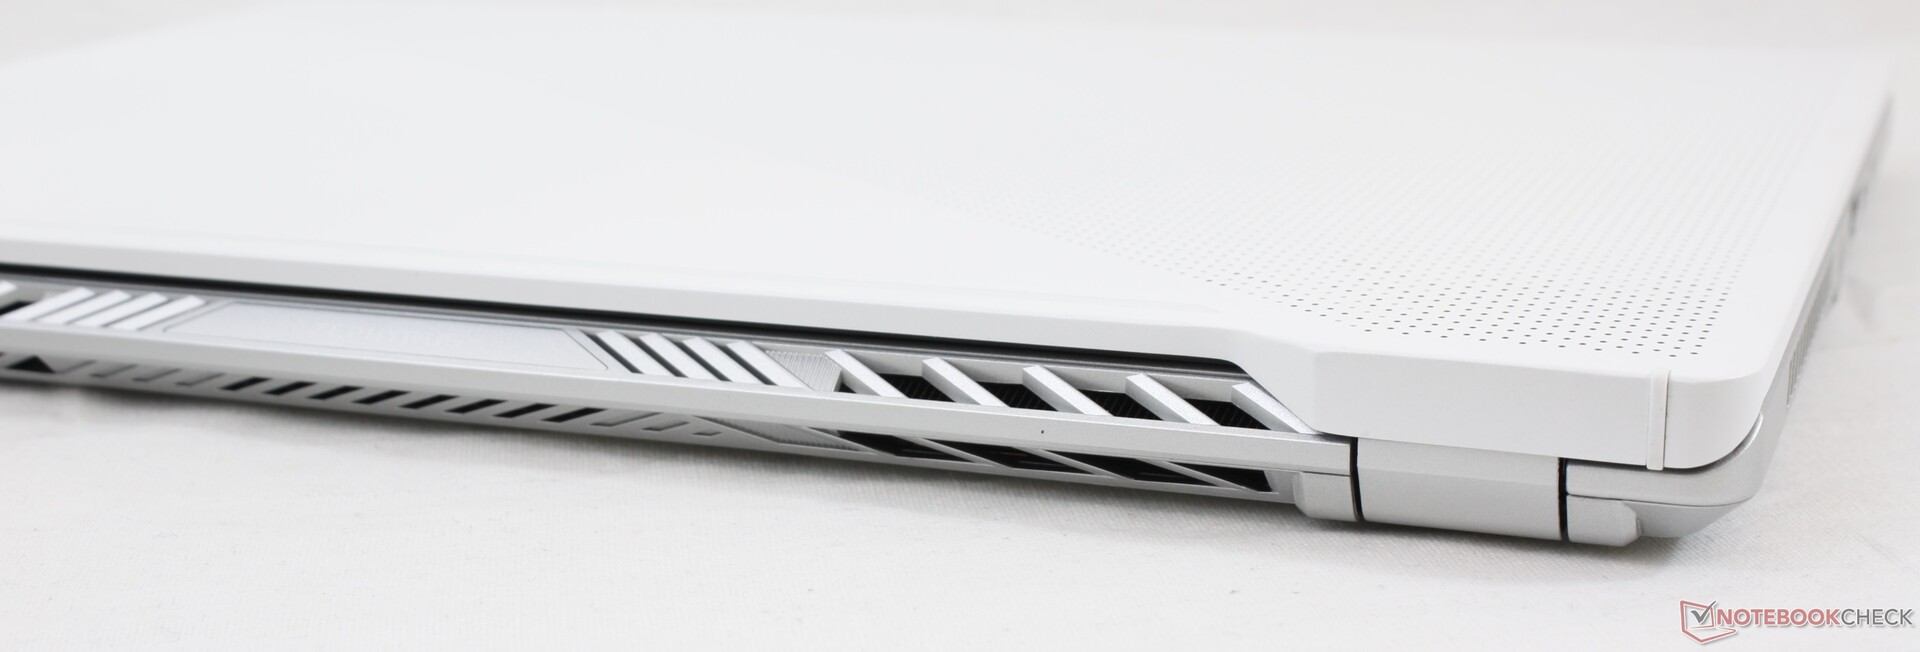
En plus de ce nouveau processeur AMD, nous avons été abasourdis de voir Asus réussir à intégrer autant de puissance dans un châssis de 14 pouces aux bordures d’écran étroites, sans avoir de gros throttling. Nous avons ici des performances supérieures à celles d’un Core i9 dans ce qui n’est pas loin d’être un ultraportable… La maintenance aisée, la RAM et le SSD amovibles, l’écran 120 Hz FreeSync, le rétroéclairage micro LED unique au dos de l’écran et la charge USB C sont autant de cerises sur le gâteau qui rendent le Zephyrus G14 encore plus unique.
Il y a un certain nombre de défauts. Le premier est l’autonomie, qui est au mieux moyenne pour la catégorie (mais peut être améliorée en passant manuellement au 60 Hz pour l’écran). Le deuxième, le bruit des ventilateurs est élevé, et varient beaucoup, jusqu’à être gênant pour jouer sans écouteurs. Le troisième, la partie écran aurait dû être plus rigide, étant plus flexible que sur les ZenBook d’Asus. Et le quatrième et dernier défaut, est dans le temps de réponse de l’écran, qui est de 20 ms du noir au blanc, ce qui est bien moins bon que sur la plupart des 15,6 pouces de jeu, où 3 ou 5 ms sont devenus la norme. C’est hallucinant de pouvoir jouer sur une machine aussi compacte et puissante, mais le ghosting modéré et le bruit des ventilateurs rappelleront vite les limites de la machine.
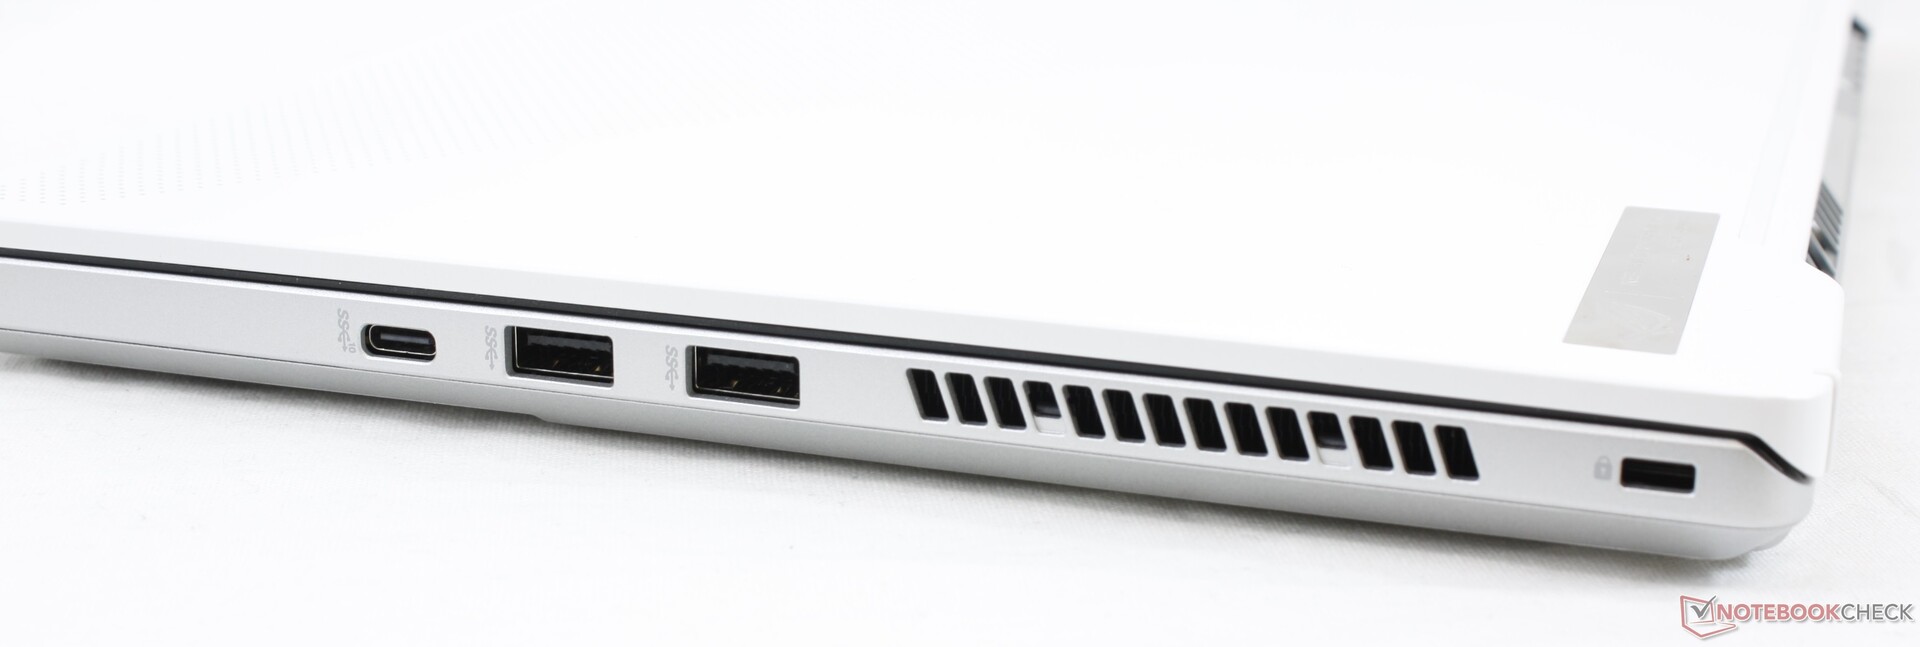
Si vous vous déplacez beaucoup et avez de quoi exploiter toute cette puissante, alors les performances du Zephyrus G14 vous séduiront. Les alternatives les plus proches seront les Razer Blade Stealth de 13,3 pouces ou MSI Prestige 14 de 14 pouces, mais ces PC portables n’intègrent que des processeurs Core U bien plus lents, et une carte graphique GTX 1650 Max-Q.
Le Zephyrus G14 embarque une puissance incroyable, jamais vue dans un format aussi compact. Les défauts de la machine se feront ressentir, mais on peut les ignorer vu le niveau de performances du PC portable…
L’intégralité de cette critique est disponible en anglais en suivant ce lien.
Asus Zephyrus G14 GA401IV
- 06/09/2020 v7 (old)
Allen Ngo
Price comparison
