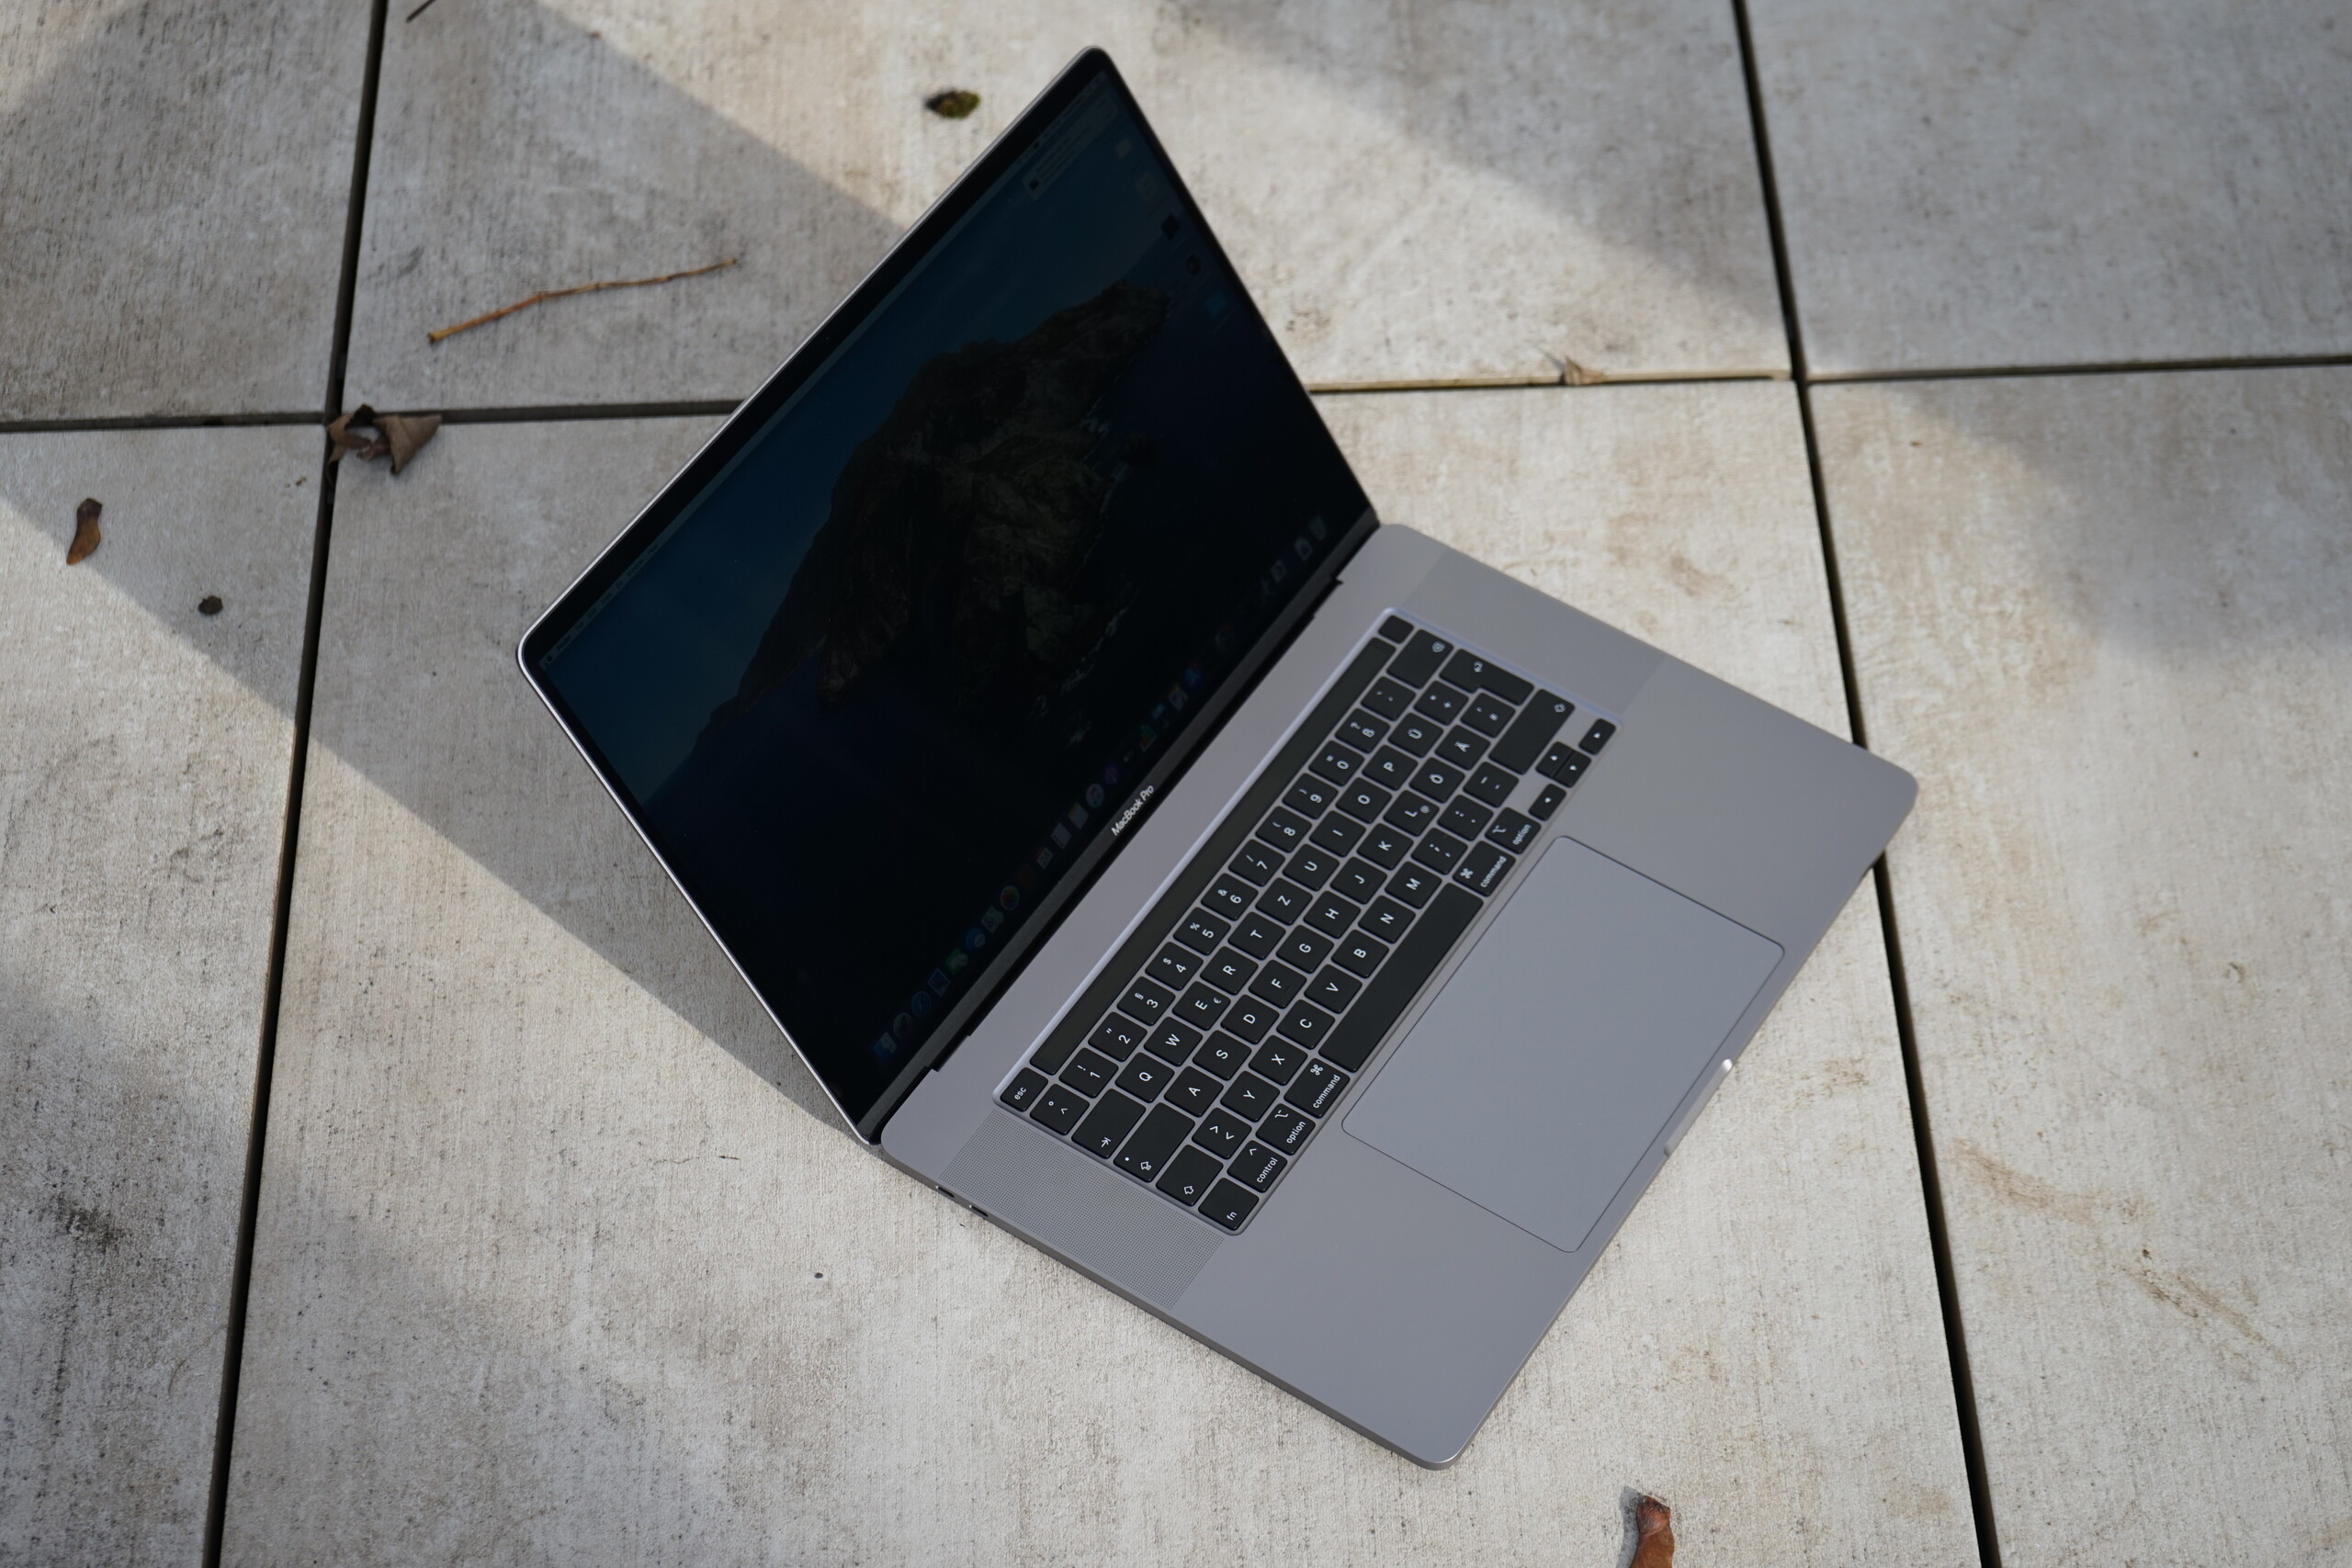
Test de l'Apple MacBook Pro 16 2019 (i9-9880H, Radeon Pro 5500M, FHD+) : portable multimédia convaincant
Note | Date | Modèle | Poids | Épaisseur | Taille | Résolution | Prix |
|---|---|---|---|---|---|---|---|
| 89.7 % v7 (old) | 04/20 | Apple MacBook Pro 16 2019 i9 5500M i9-9880H, Radeon Pro 5500M | 2 kg | 16.2 mm | 16.00" | 3072x1920 | |
| 87.1 % v7 (old) | 02/20 | Lenovo ThinkPad X1 Extreme 2019 20QV000WGE i7-9750H, GeForce GTX 1650 Mobile | 1.7 kg | 18.7 mm | 15.60" | 3840x2160 | |
| 87.8 % v7 (old) | 10/19 | Dell XPS 15 7590 9980HK GTX 1650 i9-9980HK, GeForce GTX 1650 Mobile | 2 kg | 17 mm | 15.60" | 3840x2160 | |
| 89.4 % v7 (old) | 02/20 | Apple MacBook Pro 15 2019 i9 Vega 20 i9-9980HK, Radeon Pro Vega 20 | 1.8 kg | 15.5 mm | 15.40" | 2880x1800 | |
| 87.8 % v6 (old) | 09/18 | Asus ZenBook Pro 15 UX580GE i9-8950HK, GeForce GTX 1050 Ti Mobile | 1.9 kg | 18.9 mm | 15.60" | 3840x2160 | |
| 85 % v7 (old) | 07/19 | MSI P65 Creator 9SF-657 i9-9880H, GeForce RTX 2070 Max-Q | 1.9 kg | 18 mm | 15.60" | 3840x2160 |


| |||||||||||||||||||||||||
Homogénéité de la luminosité: 86 %
Valeur mesurée au centre, sur batterie: 519 cd/m²
Contraste: 1331:1 (Valeurs des noirs: 0.39 cd/m²)
ΔE ColorChecker Calman: 2.28 | ∀{0.5-29.43 Ø4.72}
calibrated: 0.86
ΔE Greyscale Calman: 0.9 | ∀{0.09-98 Ø4.97}
100% sRGB (Calman 2D)
78% AdobeRGB 1998 (Argyll 1.6.3 3D)
Gamma: 2145
CCT: 6572 K
| Apple MacBook Pro 16 2019 i9 5500M APPA044, IPS, 3072x1920, 16" | Dell XPS 15 7590 9980HK GTX 1650 Samsung 156WR04, SDCA029, OLED, 3840x2160, 15.6" | Lenovo ThinkPad X1 Extreme 2019 20QV000WGE NE156QUM-N66, IPS, 3840x2160, 15.6" | Apple MacBook Pro 15 2018 (2.6 GHz, 560X) APPA040, IPS, 2880x1800, 15.4" | Asus ZenBook Pro 15 UX580GE AU Optronics B156ZAN03.1, IPS, 3840x2160, 15.6" | MSI P65 Creator 9SF-657 AU Optronics AUO41EB, IPS, 3840x2160, 15.6" | |
|---|---|---|---|---|---|---|
| Display | ||||||
| Display P3 Coverage (%) | 88.1 | 82 | 98.7 | 85.9 | 84.4 | |
| sRGB Coverage (%) | 99.6 | 99.1 | 99.9 | 100 | 100 | |
| AdobeRGB 1998 Coverage (%) | 91.8 | 96.9 | 86.6 | 99.1 | 98.5 | |
| Response Times | 95% | 12% | 15% | 26% | 7% | |
| Response Time Grey 50% / Grey 80% * (ms) | 52.4 ? | 2.3 ? 96% | 46.4 ? 11% | 43.2 ? 18% | 44 ? 16% | 51 ? 3% |
| Response Time Black / White * (ms) | 34.9 ? | 2.4 ? 93% | 30.4 ? 13% | 31.2 ? 11% | 22.8 ? 35% | 31 ? 11% |
| PWM Frequency (Hz) | 131700 | 59.5 ? | 117000 ? | |||
| Screen | -68% | -85% | 9% | -69% | -66% | |
| Brightness middle (cd/m²) | 519 | 421.2 -19% | 464 -11% | 520 0% | 357.6 -31% | 445 -14% |
| Brightness (cd/m²) | 477 | 417 -13% | 448 -6% | 492 3% | 350 -27% | 462 -3% |
| Brightness Distribution (%) | 86 | 94 9% | 90 5% | 88 2% | 85 -1% | 83 -3% |
| Black Level * (cd/m²) | 0.39 | 0.36 8% | 0.39 -0% | 0.35 10% | 0.5 -28% | |
| Contrast (:1) | 1331 | 1289 -3% | 1333 0% | 1022 -23% | 890 -33% | |
| Colorchecker dE 2000 * | 2.28 | 6.06 -166% | 4.2 -84% | 1.2 47% | 4.12 -81% | 4.75 -108% |
| Colorchecker dE 2000 max. * | 6.54 | 11.89 -82% | 11.4 -74% | 2.3 65% | 9.91 -52% | 7.79 -19% |
| Colorchecker dE 2000 calibrated * | 0.86 | 0.8 7% | 4.23 -392% | |||
| Greyscale dE 2000 * | 0.9 | 2.8 -211% | 7.2 -700% | 1.3 -44% | 1.8 -100% | 4.49 -399% |
| Gamma | 2145 0% | 2.15 102% | 2.17 101% | 2.18 101% | 2.17 101% | 2.49 88% |
| CCT | 6572 99% | 6235 104% | 6345 102% | 6738 96% | 6613 98% | 7374 88% |
| Color Space (Percent of AdobeRGB 1998) (%) | 78 | 81 4% | 85.2 9% | 87.5 12% | 87 12% | |
| Color Space (Percent of sRGB) (%) | 99.6 | 99 | 100 | 100 | ||
| Moyenne finale (programmes/paramètres) | 14% /
-32% | -37% /
-69% | 12% /
10% | -22% /
-53% | -30% /
-53% |
* ... Moindre est la valeur, meilleures sont les performances
Temps de réponse de l'écran
| ↔ Temps de réponse noir à blanc | ||
|---|---|---|
| 34.9 ms ... hausse ↗ et chute ↘ combinées | ↗ 17.8 ms hausse | 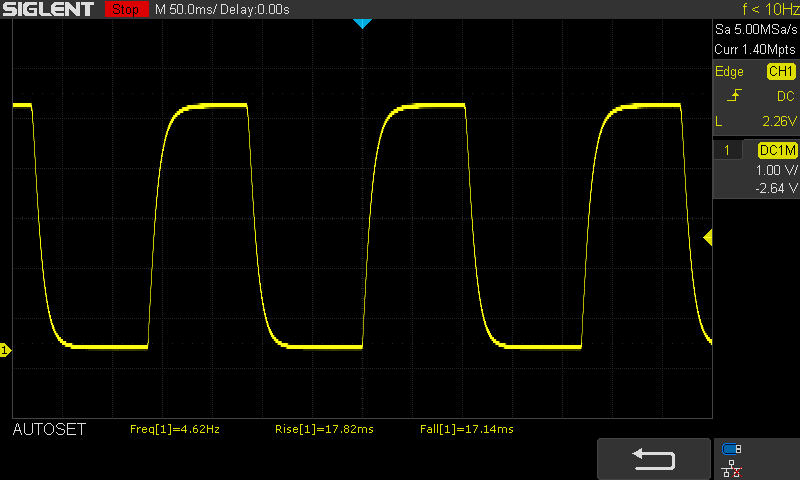 |
| ↘ 17.1 ms chute | ||
| L'écran souffre de latences très élevées, à éviter pour le jeu. En comparaison, tous les appareils testés affichent entre 0.1 (minimum) et 240 (maximum) ms. » 92 % des appareils testés affichent de meilleures performances. Cela signifie que les latences relevées sont moins bonnes que la moyenne (19.8 ms) de tous les appareils testés. | ||
| ↔ Temps de réponse gris 50% à gris 80% | ||
| 52.4 ms ... hausse ↗ et chute ↘ combinées | ↗ 23.9 ms hausse | 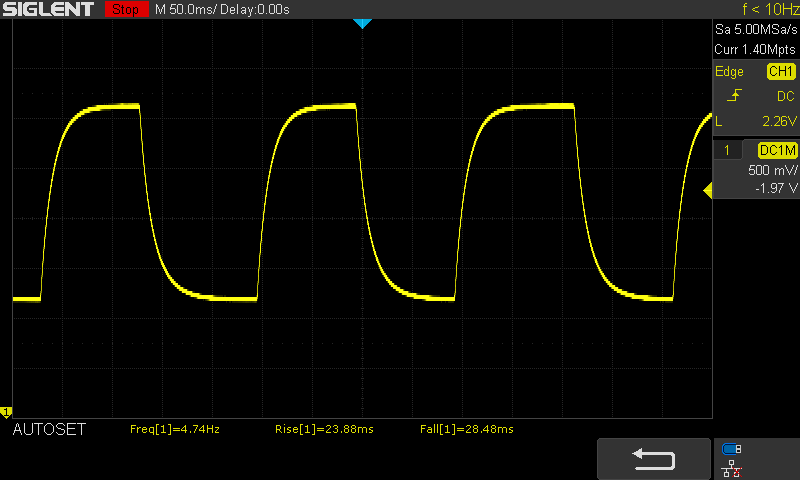 |
| ↘ 28.5 ms chute | ||
| L'écran souffre de latences très élevées, à éviter pour le jeu. En comparaison, tous les appareils testés affichent entre 0.165 (minimum) et 636 (maximum) ms. » 89 % des appareils testés affichent de meilleures performances. Cela signifie que les latences relevées sont moins bonnes que la moyenne (31 ms) de tous les appareils testés. | ||
Scintillement / MLI (Modulation de largeur d'impulsion)
| Scintillement / MLI (Modulation de largeur d'impulsion) décelé | 131700 Hz | 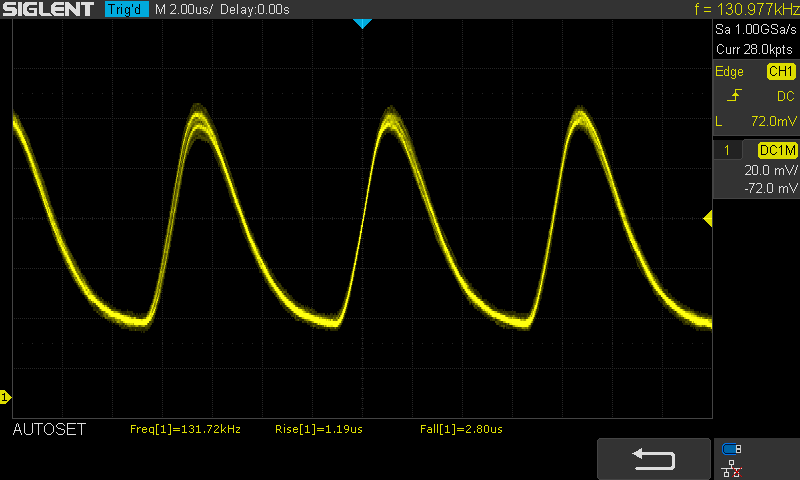 | |
Le rétroéclairage de l'écran scintille à la fréquence de 131700 Hz (certainement du fait de l'utilisation d'une MDI - Modulation de largeur d'impulsion) . La fréquence de rafraîchissement de 131700 Hz est élevée, la grande majorité des utilisateurs ne devrait pas percevoir de scintillements et être sujette à une fatigue oculaire accrue. En comparaison, 52 % des appareils testés n'emploient pas MDI pour assombrir leur écran. Nous avons relevé une moyenne à 7781 (minimum : 5 - maximum : 343500) Hz dans le cas où une MDI était active. | |||
| PCMark 8 Home Score Accelerated v2 | 4900 points | |
| PCMark 8 Creative Score Accelerated v2 | 7359 points | |
| PCMark 8 Work Score Accelerated v2 | 4812 points | |
| PCMark 10 Score | 5500 points | |
Aide | ||
| Apple MacBook Pro 16 2019 i9 5500M Apple SSD AP1024 7171 | Dell XPS 15 7590 9980HK GTX 1650 Toshiba XG6 KXG60ZNV1T02 | Microsoft Surface Laptop 3 15 Ryzen 5 3580U SK hynix BC501 HFM256GDGTNG | Dell Precision 5540 SK hynix PC400 512 GB | Gigabyte Aero 17 XA RP77 Intel SSD 760p SSDPEKKW512G8 | Eurocom Nightsky RX15 Samsung SSD 970 Pro 512GB | |
|---|---|---|---|---|---|---|
| CrystalDiskMark 5.2 / 6 | 30% | -11% | 8% | 52% | 58% | |
| Write 4K (MB/s) | 55.5 | 104.3 88% | 99 78% | 98 77% | 169.6 206% | 153 176% |
| Read 4K (MB/s) | 16.21 | 45.23 179% | 35.63 120% | 41.25 154% | 58 258% | 60.5 273% |
| Write Seq (MB/s) | 1959 | 1729 -12% | 706 -64% | 1295 -34% | 1516 -23% | 1938 -1% |
| Read Seq (MB/s) | 1763 | 1861 6% | 1044 -41% | 1441 -18% | 2362 34% | 1932 10% |
| Write 4K Q32T1 (MB/s) | 398.5 | 509 28% | 326.6 -18% | 429.2 8% | 481.8 21% | 482.5 21% |
| Read 4K Q32T1 (MB/s) | 648 | 388.5 -40% | 270 -58% | 400.1 -38% | 506 -22% | 594 -8% |
| Write Seq Q32T1 (MB/s) | 2727 | 2813 3% | 820 -70% | 1366 -50% | 1530 -44% | 2324 -15% |
| Read Seq Q32T1 (MB/s) | 3242 | 2906 -10% | 2028 -37% | 2201 -32% | 2645 -18% | 3539 9% |
| AS SSD | 34% | -26% | 8% | -17% | 21% | |
| Seq Read (MB/s) | 2531 | 1723 -32% | 1122 -56% | 1743 -31% | 1812 -28% | 2352 -7% |
| Seq Write (MB/s) | 2289 | 1386 -39% | 514 -78% | 930 -59% | 1512 -34% | 2184 -5% |
| 4K Read (MB/s) | 15.85 | 43.25 173% | 34.98 121% | 39.1 147% | 32.68 106% | 28.65 81% |
| 4K Write (MB/s) | 39.88 | 98.3 146% | 96.8 143% | 92.1 131% | 107.7 170% | 61.3 54% |
| 4K-64 Read (MB/s) | 1267 | 1078 -15% | 492 -61% | 956 -25% | 504 -60% | 1317 4% |
| 4K-64 Write (MB/s) | 1749 | 1456 -17% | 339.9 -81% | 863 -51% | 534 -69% | 2156 23% |
| Access Time Read * (ms) | 0.122 | 0.05 59% | 0.056 54% | 0.074 39% | 0.05 59% | 0.101 17% |
| Access Time Write * (ms) | 0.095 | 0.039 59% | 0.11 -16% | 0.053 44% | 0.227 -139% | 0.09 5% |
| Score Read (Points) | 1536 | 1294 -16% | 639 -58% | 1170 -24% | 718 -53% | 1581 3% |
| Score Write (Points) | 2018 | 1693 -16% | 488 -76% | 1048 -48% | 793 -61% | 2435 21% |
| Score Total (Points) | 4317 | 3638 -16% | 1434 -67% | 2781 -36% | 1871 -57% | 4813 11% |
| Copy ISO MB/s (MB/s) | 1995 | 3182 59% | 828 -58% | 946 -53% | 2705 36% | |
| Copy Program MB/s (MB/s) | 584 | 984 68% | 200.5 -66% | 414.3 -29% | 666 14% | |
| Copy Game MB/s (MB/s) | 1135 | 1824 61% | 387.4 -66% | 1263 11% | 1583 39% | |
| PCMark 8 | ||||||
| Storage Score v2 (Points) | 1818 | |||||
| Moyenne finale (programmes/paramètres) | 32% /
33% | -19% /
-21% | 8% /
8% | 18% /
8% | 40% /
35% |
* ... Moindre est la valeur, meilleures sont les performances

| 3DMark 06 Standard Score | 34321 points | |
| 3DMark 11 Performance | 14097 points | |
| 3DMark Cloud Gate Standard Score | 30690 points | |
| 3DMark Fire Strike Score | 9196 points | |
| 3DMark Time Spy Score | 3629 points | |
Aide | ||
SpecViewPerf 13
| Deus Ex Mankind Divided - 1920x1080 Ultra Preset AA:2xMS AF:8x | |
| Moyenne NVIDIA GeForce GTX 1660 Ti Mobile (n=1) | |
| Apple MacBook Pro 16 2019 i9 5500M | |
| Moyenne NVIDIA GeForce GTX 1650 Mobile (n=1) | |
| Apple MacBook Pro 15 2018 (2.6 GHz, 560X) | |
| Rage 2 - 1920x1080 Ultra Preset (Resolution Scale Off) | |
| Moyenne NVIDIA GeForce GTX 1660 Ti Mobile (67.9 - 68.8, n=2) | |
| Moyenne NVIDIA GeForce GTX 1660 Ti Max-Q (58.2 - 64.8, n=2) | |
| MSI Alpha 15 A3DDK | |
| Moyenne NVIDIA GeForce GTX 1650 Mobile (45.1 - 60, n=3) | |
| Apple MacBook Pro 16 2019 i9 5500M | |
| Borderlands 3 - 1920x1080 Badass Overall Quality (DX11) | |
| Moyenne NVIDIA GeForce GTX 1660 Ti Mobile (46.6 - 48.6, n=3) | |
| Moyenne NVIDIA GeForce GTX 1660 Ti Max-Q (41.5 - 42.3, n=2) | |
| MSI Alpha 15 A3DDK | |
| Moyenne NVIDIA GeForce GTX 1650 Mobile (29 - 34.6, n=5) | |
| Apple MacBook Pro 16 2019 i9 5500M | |
| Apple MacBook Pro 15 2018 (2.6 GHz, 560X) | |
| Ghost Recon Breakpoint - 1920x1080 Ultra Preset AA:T | |
| Moyenne NVIDIA GeForce GTX 1660 Ti Mobile (51 - 55, n=2) | |
| Moyenne NVIDIA GeForce GTX 1660 Ti Max-Q (48 - 51, n=2) | |
| Apple MacBook Pro 16 2019 i9 5500M | |
| Moyenne NVIDIA GeForce GTX 1650 Mobile (30 - 37, n=2) | |
| MSI Alpha 15 A3DDK | |
| Apple MacBook Pro 15 2018 (2.6 GHz, 560X) | |
| Bas | Moyen | Élevé | Ultra | QHD | 4K | |
|---|---|---|---|---|---|---|
| Counter-Strike: GO (2012) | 208 | 118 | 71.4 | |||
| GTA V (2015) | 168 | 91.4 | 47.6 | 34.5 | 32.3 | |
| The Witcher 3 (2015) | 68 | 38.8 | ||||
| Dota 2 Reborn (2015) | 137 | 125 | 111 | 107 | 53.9 | |
| World of Warships (2015) | 43.4 | |||||
| Rainbow Six Siege (2015) | 126 | 44.8 | ||||
| Overwatch (2016) | 98 | |||||
| Deus Ex Mankind Divided (2016) | 52 | 27.8 | 16.9 | |||
| Rocket League (2017) | 153 | 107 | 59 | |||
| Final Fantasy XV Benchmark (2018) | 48.4 | 20.4 | ||||
| World of Tanks enCore (2018) | 76 | 49.1 | 24.6 | |||
| Far Cry 5 (2018) | 55 | 40 | 20 | |||
| Shadow of the Tomb Raider (2018) | 120 | 58 | 54 | 46 | 30 | 13 |
| Battlefield V (2018) | 85 | 76 | 62 | 58.9 | 47 | 14.4 |
| Apex Legends (2019) | 63 | 43.5 | ||||
| Far Cry New Dawn (2019) | 86 | 67 | 64 | 57 | 41 | 21 |
| Metro Exodus (2019) | 92 | 47.1 | 34.3 | 28.6 | 22 | |
| Dirt Rally 2.0 (2019) | 90 | 50.2 | 35.8 | |||
| The Division 2 (2019) | 56 | 39 | ||||
| Anno 1800 (2019) | 67 | 44.6 | 21.7 | |||
| Rage 2 (2019) | 113 | 53.7 | 45.2 | 44.4 | 28.4 | |
| Total War: Three Kingdoms (2019) | 175 | 64.1 | 40.5 | 29.7 | 19 | 7 |
| F1 2019 (2019) | 174 | 105 | 97 | 65 | 49 | |
| Control (2019) | 139 | 41.5 | 29.2 | 18.1 | ||
| Borderlands 3 (2019) | 41.4 | 30.8 | 21.4 | 3.8 | ||
| FIFA 20 (2019) | 144 | 124 | 90 | |||
| Ghost Recon Breakpoint (2019) | 50 | 35 | ||||
| GRID 2019 (2019) | 46.3 | 36.6 | 23.2 | |||
| Call of Duty Modern Warfare 2019 (2019) | 34.7 | |||||
| Need for Speed Heat (2019) | 74 | 56.7 | 50.9 | 44.7 | 28 | 12.8 |
| Star Wars Jedi Fallen Order (2019) | 75 | 61 | 54.3 | 35 | 16.2 | |
| Red Dead Redemption 2 (2019) | 97.6 | 55.2 | 35.8 | 20.9 | 0 () | 0 () |
| Fall Guys (2020) | 59.4 | 59.4 | 38.1 | |||
| Hearthstone (2020) | 33.2 | 32 | 59.7 | 59.6 | ||
| Doom Eternal (2020) | 84.8 | 47.5 | 27.5 | 21.9 | 15.1 | |
| Gears Tactics (2020) | 60 | 47.6 | 30.7 | |||
| F1 2020 (2020) | 0 Le jeu ne démarre pas | |||||
| Flight Simulator 2020 (2020) | 47.4 | 28 | 19.2 | 12.2 | ||
| Mafia Definitive Edition (2020) | 52.5 | 37.5 | ||||
| Star Wars Squadrons (2020) | 95.6 | 69.7 | 26.4 | |||
| FIFA 21 (2020) | 151 | 115 | 70 | |||
| Cyberpunk 2077 1.0 (2020) | 54.8 | 29.9 | 23.5 | |||
| Hitman 3 (2021) | 157 | 81.3 | 66.3 | 62 | ||
| Outriders (2021) | 70.7 | 44.4 | 36 | 27.6 | ||
| Resident Evil Village (2021) | 81.7 | 38.9 | 40.6 | |||
| Far Cry 6 (2021) | 0 Le jeu ne démarre pas | |||||
| Riders Republic (2021) | 61 | 41 | 28 | |||
| Call of Duty Vanguard (2021) | 43.1 | 21.7 | ||||
| Forza Horizon 5 (2021) | 85 | 31 |
Degré de la nuisance sonore
| Au repos |
| 29.9 / 29.9 / 29.9 dB(A) |
| Fortement sollicité |
| 43 / 46.1 dB(A) |
 | ||
30 dB silencieux 40 dB(A) audible 50 dB(A) bruyant |
||
min: | ||
(±) La température maximale du côté supérieur est de 42 °C / 108 F, par rapport à la moyenne de 36.8 °C / 98 F, allant de 21 à 71 °C pour la classe Multimedia.
(+) Le fond chauffe jusqu'à un maximum de 38 °C / 100 F, contre une moyenne de 39.1 °C / 102 F
(+) En utilisation inactive, la température moyenne du côté supérieur est de 22.8 °C / 73 F, par rapport à la moyenne du dispositif de 31.3 °C / 88 F.
(+) Les repose-poignets et le pavé tactile sont plus froids que la température de la peau avec un maximum de 27 °C / 80.6 F et sont donc froids au toucher.
(±) La température moyenne de la zone de l'appui-paume de dispositifs similaires était de 28.7 °C / 83.7 F (+1.7 °C / #3.1 F).
Apple MacBook Pro 16 2019 i9 5500M analyse audio
(+) | les haut-parleurs peuvent jouer relativement fort (82.3# dB)
Basses 100 - 315 Hz
(+) | bonne basse - seulement 2.3% loin de la médiane
(+) | les basses sont linéaires (5% delta à la fréquence précédente)
Médiums 400 - 2000 Hz
(+) | médiane équilibrée - seulement 2.7% de la médiane
(+) | les médiums sont linéaires (3.4% delta à la fréquence précédente)
Aiguës 2 - 16 kHz
(+) | des sommets équilibrés - à seulement 2.1% de la médiane
(+) | les aigus sont linéaires (2.6% delta à la fréquence précédente)
Globalement 100 - 16 000 Hz
(+) | le son global est linéaire (6.9% différence à la médiane)
Par rapport à la même classe
» 5% de tous les appareils testés de cette catégorie étaient meilleurs, 1% similaires, 94% pires
» Le meilleur avait un delta de 5%, la moyenne était de 17%, le pire était de 45%.
Par rapport à tous les appareils testés
» 1% de tous les appareils testés étaient meilleurs, 0% similaires, 99% pires
» Le meilleur avait un delta de 4%, la moyenne était de 24%, le pire était de 134%.
Dell XPS 15 7590 9980HK GTX 1650 analyse audio
(+) | les haut-parleurs peuvent jouer relativement fort (88.4# dB)
Basses 100 - 315 Hz
(-) | presque aucune basse - en moyenne 24.9% plus bas que la médiane
(±) | la linéarité des basses est moyenne (14.4% delta à la fréquence précédente)
Médiums 400 - 2000 Hz
(+) | médiane équilibrée - seulement 2.8% de la médiane
(±) | la linéarité des médiums est moyenne (7.8% delta à la fréquence précédente)
Aiguës 2 - 16 kHz
(+) | des sommets équilibrés - à seulement 1.9% de la médiane
(+) | les aigus sont linéaires (5.3% delta à la fréquence précédente)
Globalement 100 - 16 000 Hz
(±) | la linéarité du son global est moyenne (17.8% de différence avec la médiane)
Par rapport à la même classe
» 52% de tous les appareils testés de cette catégorie étaient meilleurs, 7% similaires, 41% pires
» Le meilleur avait un delta de 5%, la moyenne était de 17%, le pire était de 45%.
Par rapport à tous les appareils testés
» 36% de tous les appareils testés étaient meilleurs, 8% similaires, 56% pires
» Le meilleur avait un delta de 4%, la moyenne était de 24%, le pire était de 134%.
Apple MacBook Pro 15 2018 (2.6 GHz, 560X) analyse audio
(+) | les haut-parleurs peuvent jouer relativement fort (85# dB)
Basses 100 - 315 Hz
(+) | bonne basse - seulement 4.7% loin de la médiane
(±) | la linéarité des basses est moyenne (8.3% delta à la fréquence précédente)
Médiums 400 - 2000 Hz
(+) | médiane équilibrée - seulement 1.8% de la médiane
(+) | les médiums sont linéaires (3.5% delta à la fréquence précédente)
Aiguës 2 - 16 kHz
(+) | des sommets équilibrés - à seulement 2.6% de la médiane
(+) | les aigus sont linéaires (5.7% delta à la fréquence précédente)
Globalement 100 - 16 000 Hz
(+) | le son global est linéaire (6.4% différence à la médiane)
Par rapport à la même classe
» 4% de tous les appareils testés de cette catégorie étaient meilleurs, 1% similaires, 95% pires
» Le meilleur avait un delta de 5%, la moyenne était de 17%, le pire était de 45%.
Par rapport à tous les appareils testés
» 1% de tous les appareils testés étaient meilleurs, 0% similaires, 99% pires
» Le meilleur avait un delta de 4%, la moyenne était de 24%, le pire était de 134%.
| Éteint/en veille | |
| Au repos | |
| Fortement sollicité |
|
Légende:
min: | |
| Apple MacBook Pro 16 2019 i9 5500M i9-9880H, Radeon Pro 5500M, Apple SSD AP1024 7171, IPS, 3072x1920, 16" | Apple MacBook Pro 15 2018 (2.6 GHz, 560X) i7-8850H, Radeon Pro 560X, Apple SSD AP0512, IPS, 2880x1800, 15.4" | Dell XPS 15 7590 9980HK GTX 1650 i9-9980HK, GeForce GTX 1650 Mobile, Toshiba XG6 KXG60ZNV1T02, OLED, 3840x2160, 15.6" | MSI P65 Creator 9SF-657 i9-9880H, GeForce RTX 2070 Max-Q, 2x Samsung SSD PM981 MZVLB512HAJQ (RAID 0), IPS, 3840x2160, 15.6" | Lenovo ThinkPad X1 Extreme 2019 20QV000WGE i7-9750H, GeForce GTX 1650 Mobile, Samsung SSD PM981 MZVLB512HAJQ, IPS, 3840x2160, 15.6" | Moyenne de la classe Multimedia | |
|---|---|---|---|---|---|---|
| Power Consumption | 11% | -18% | -67% | -31% | 3% | |
| Idle Minimum * (Watt) | 3.7 | 3.4 8% | 6.2 -68% | 9.4 -154% | 8.5 -130% | 5.64 ? -52% |
| Idle Average * (Watt) | 12.1 | 11 9% | 9.6 21% | 17.4 -44% | 14.7 -21% | 10 ? 17% |
| Idle Maximum * (Watt) | 17 | 14.9 12% | 21.2 -25% | 19.6 -15% | 19.4 -14% | 12.2 ? 28% |
| Load Average * (Watt) | 91.5 | 78.9 14% | 104.3 -14% | 103 -13% | 89.6 2% | 64.8 ? 29% |
| Witcher 3 ultra * (Watt) | 103 | 91.7 11% | 96.1 7% | |||
| Load Maximum * (Watt) | 102.3 | 91.2 11% | 135.3 -32% | 216 -111% | 129.8 -27% | 111.7 ? -9% |
* ... Moindre est la valeur, meilleures sont les performances
| Apple MacBook Pro 16 2019 i9 5500M i9-9880H, Radeon Pro 5500M, 99.8 Wh | Lenovo ThinkPad X1 Extreme 2019 20QV000WGE i7-9750H, GeForce GTX 1650 Mobile, 80 Wh | Dell XPS 15 7590 9980HK GTX 1650 i9-9980HK, GeForce GTX 1650 Mobile, 97 Wh | Asus ZenBook Pro 15 UX580GE i9-8950HK, GeForce GTX 1050 Ti Mobile, 71 Wh | MSI P65 Creator 9SF-657 i9-9880H, GeForce RTX 2070 Max-Q, 82 Wh | Apple MacBook Pro 15 2018 (2.6 GHz, 560X) i7-8850H, Radeon Pro 560X, 83 Wh | Moyenne de la classe Multimedia | |
|---|---|---|---|---|---|---|---|
| Autonomie de la batterie | -31% | 98% | -9% | -20% | 24% | 46% | |
| H.264 (h) | 9.7 | 4.7 -52% | 11.7 21% | 16.4 ? 69% | |||
| WiFi v1.3 (h) | 12 | 4.8 -60% | 7.8 -35% | 6.3 -47% | 6 -50% | 10.2 -15% | 12 ? 0% |
| Witcher 3 ultra (h) | 0.9 | 1.5 67% | |||||
| Load (h) | 1 | 1.2 20% | 3.3 230% | 1.3 30% | 1.1 10% | 1.675 ? 68% |
Points positifs
Points négatifs
Verdict

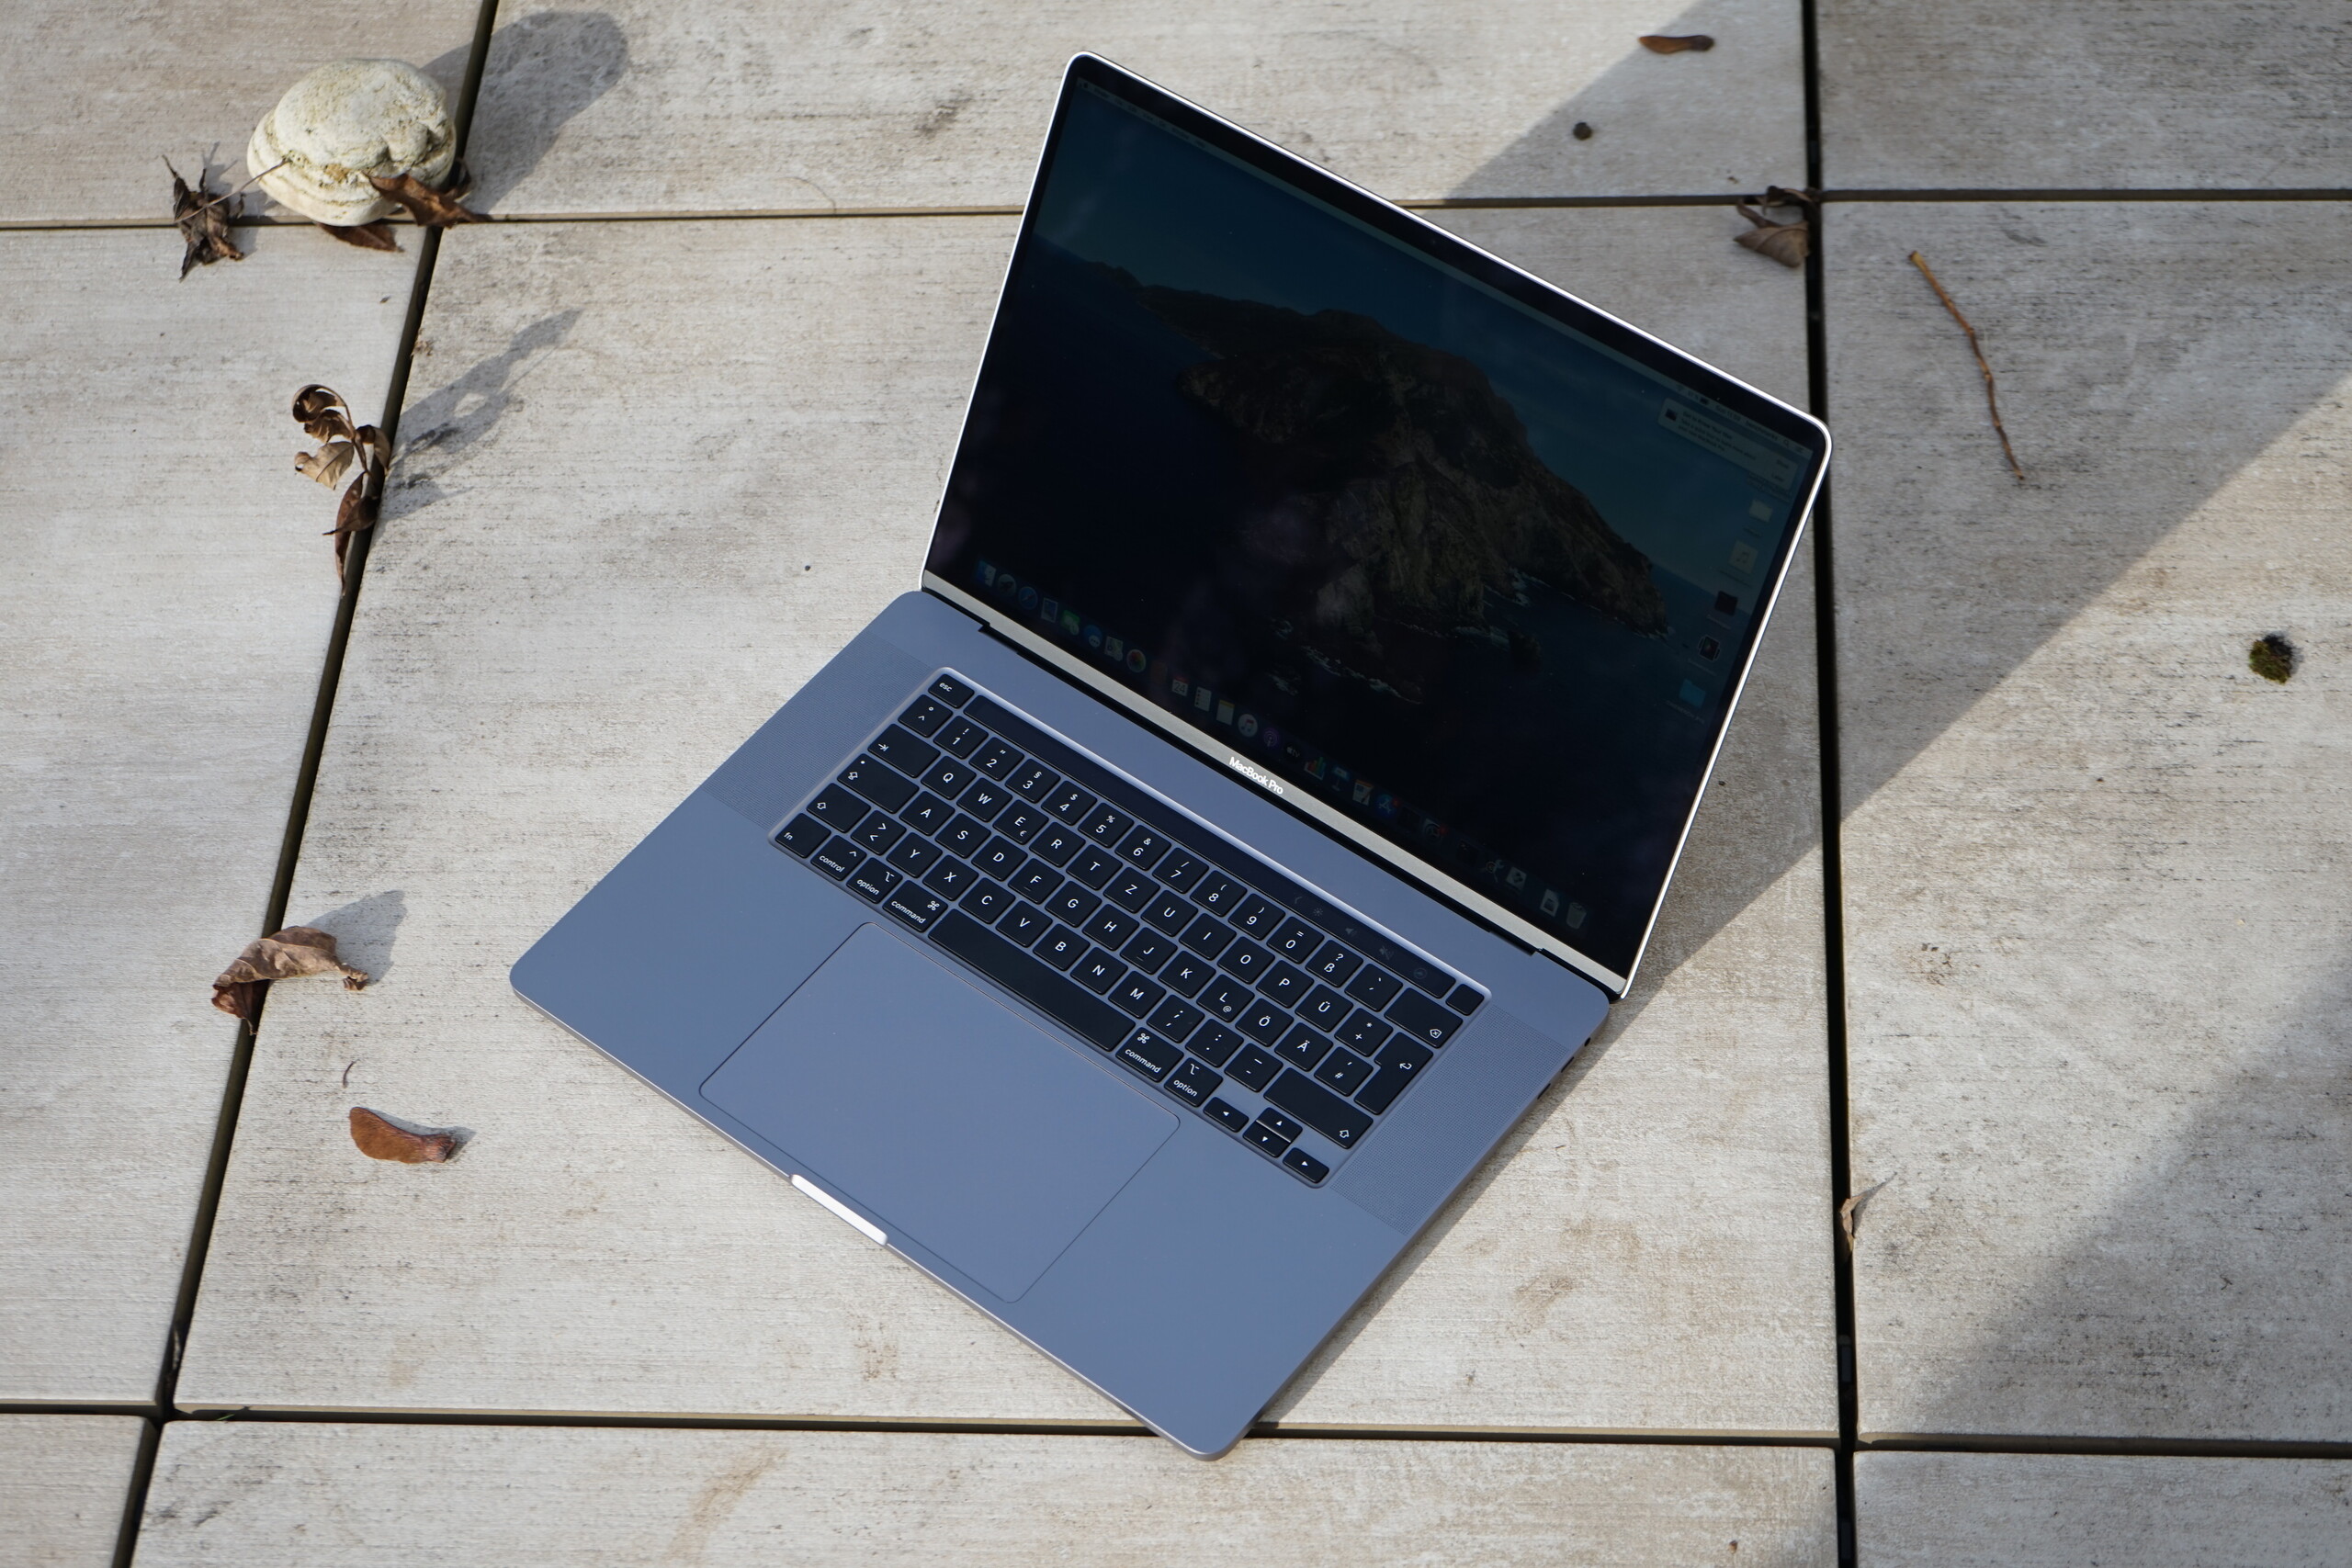
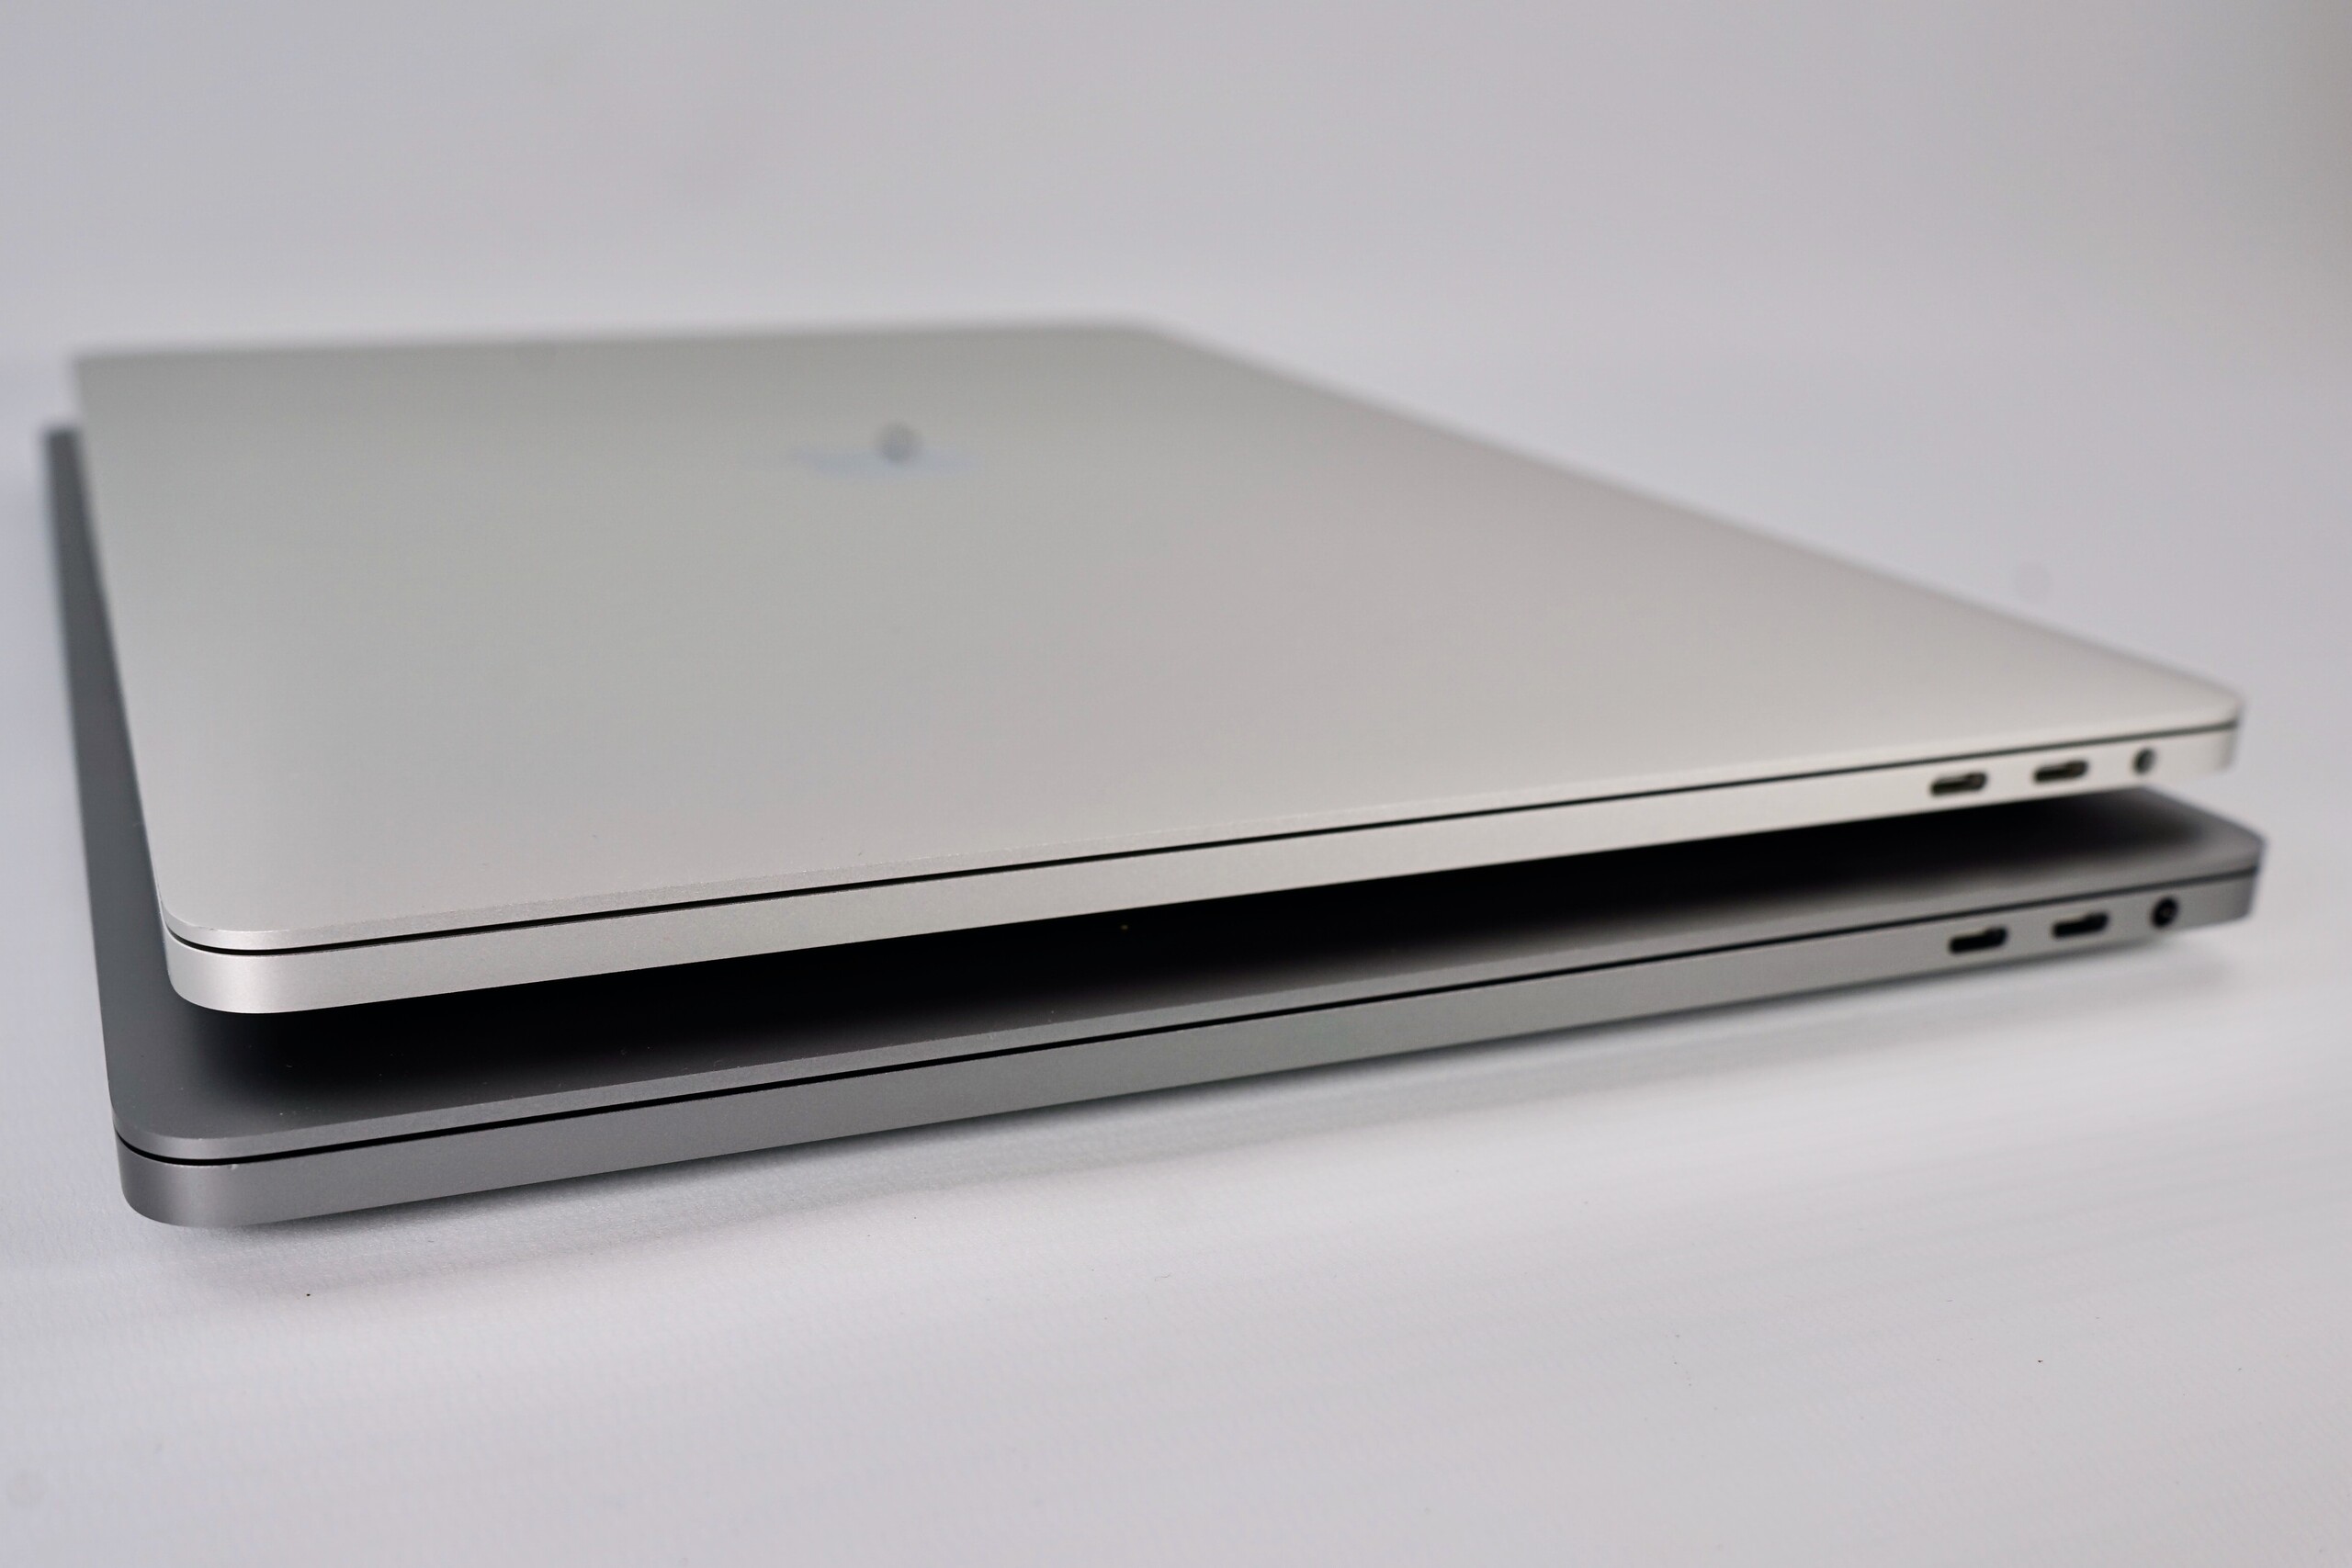
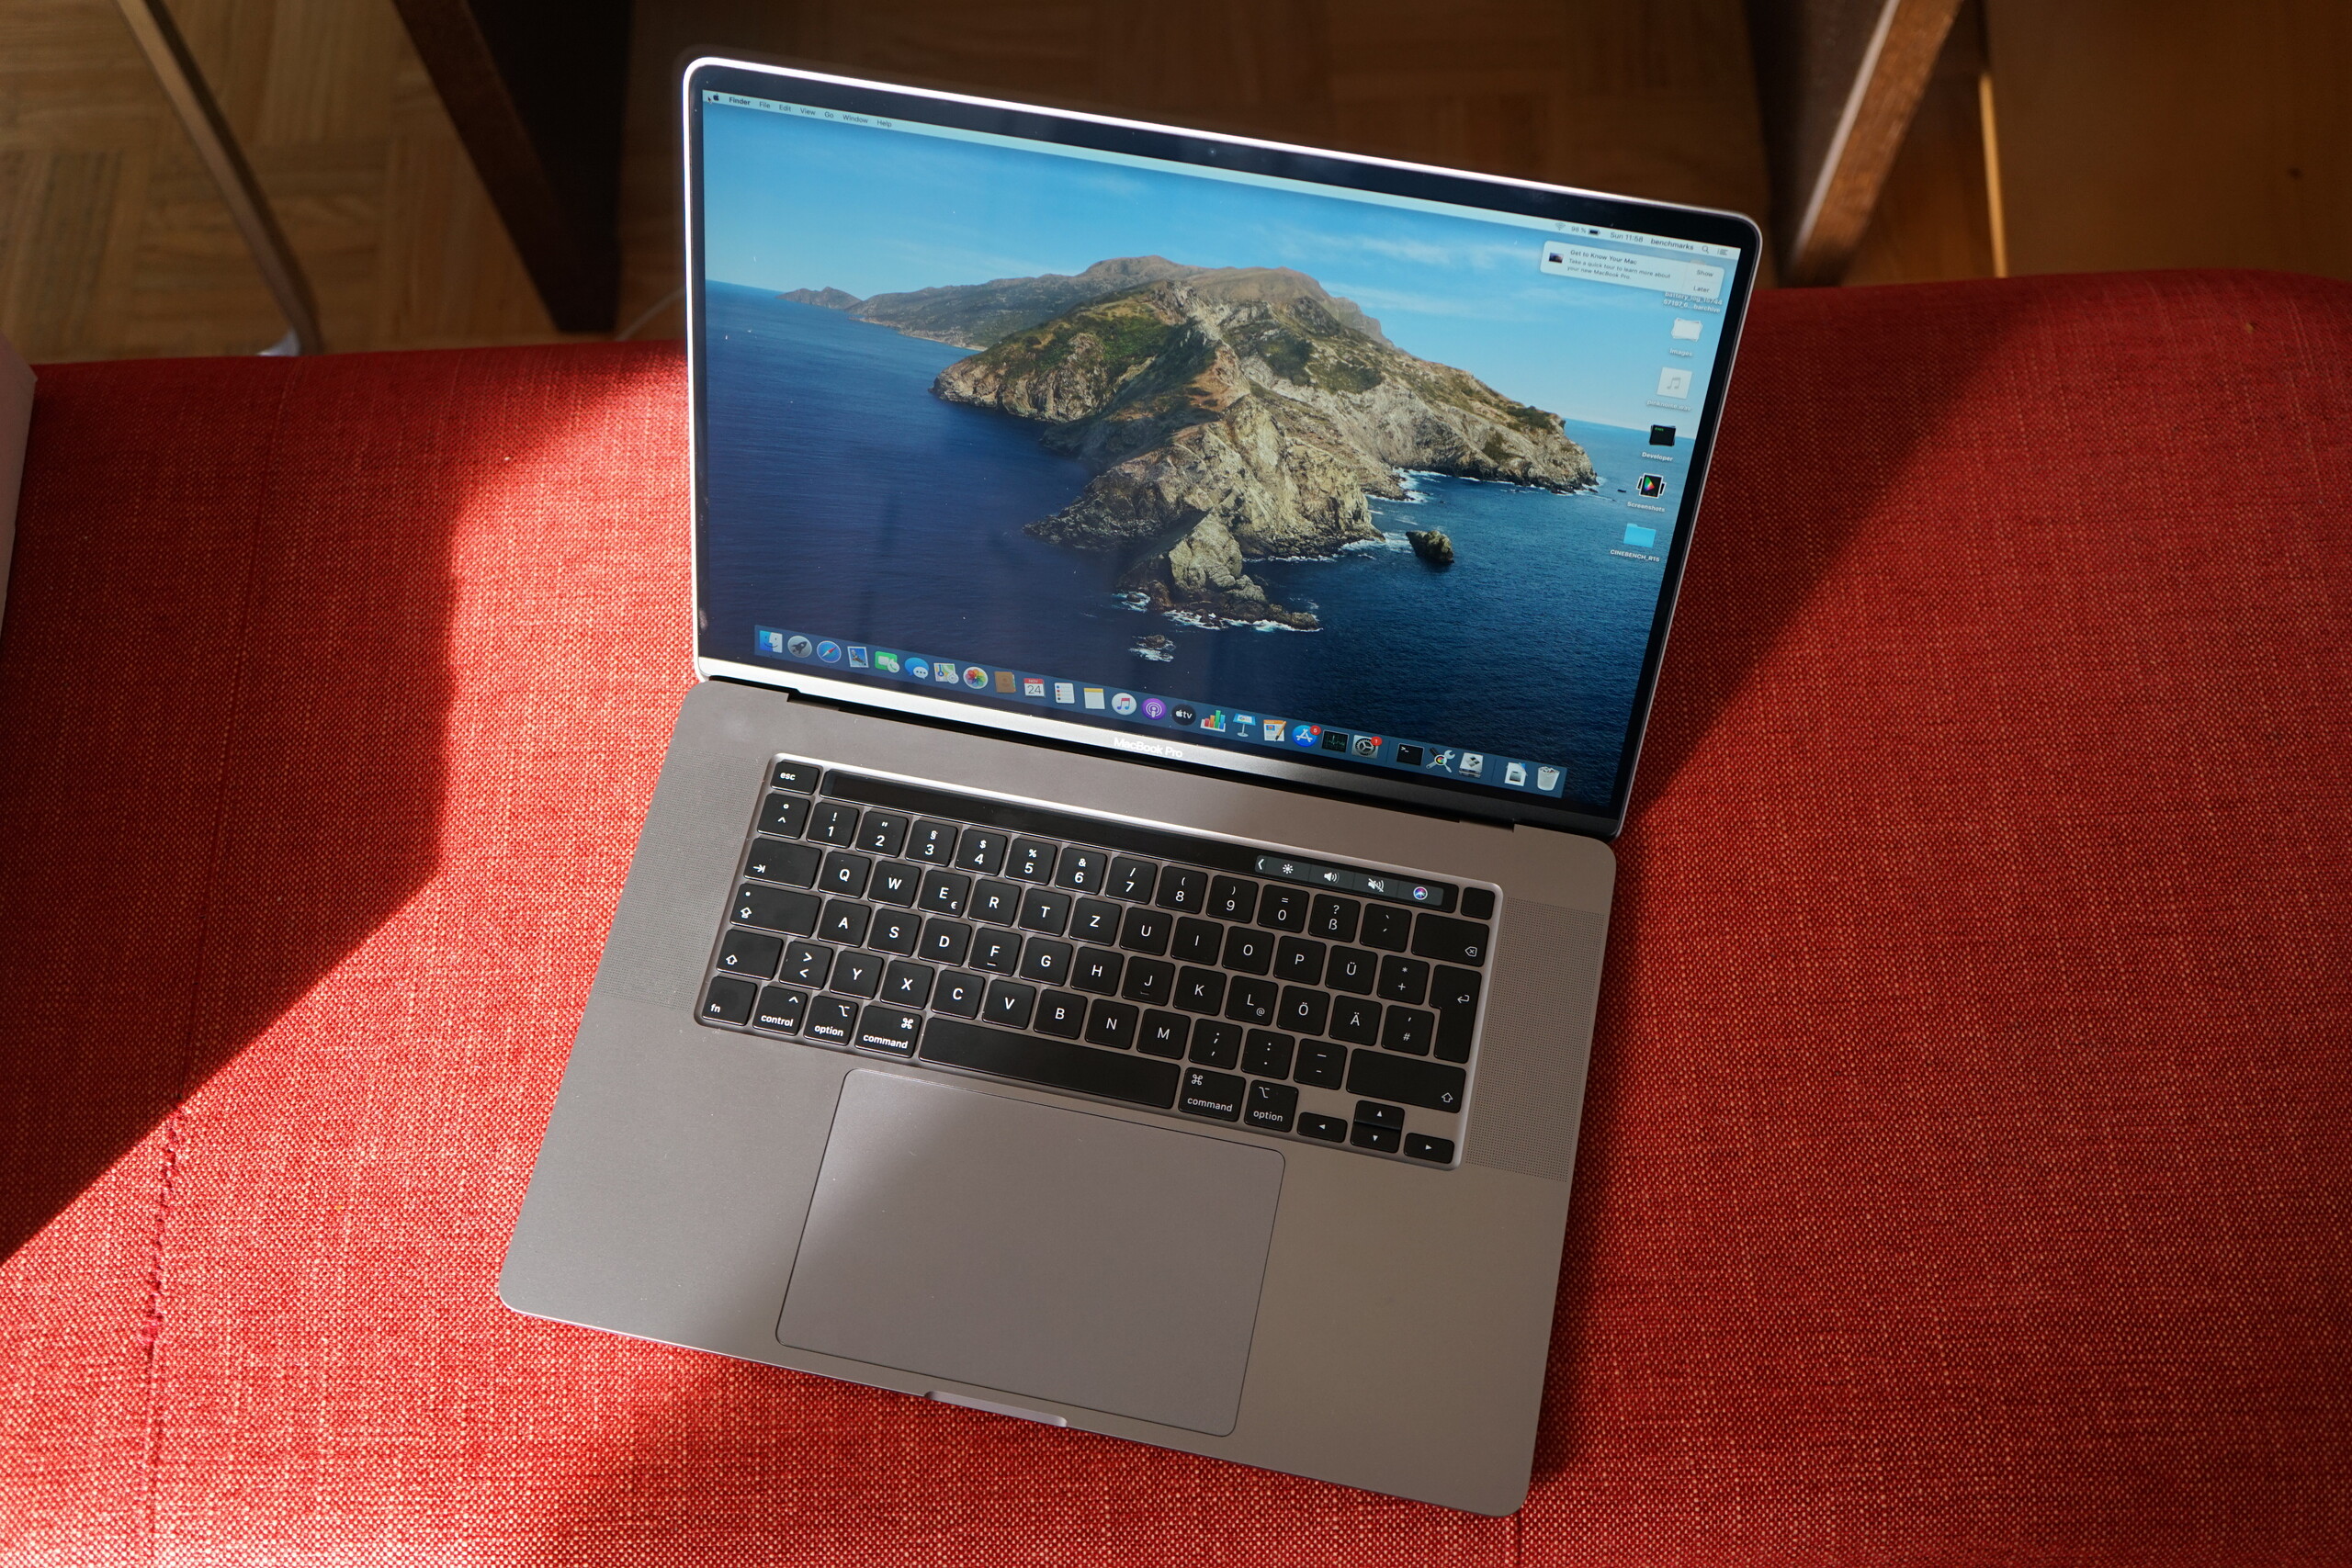
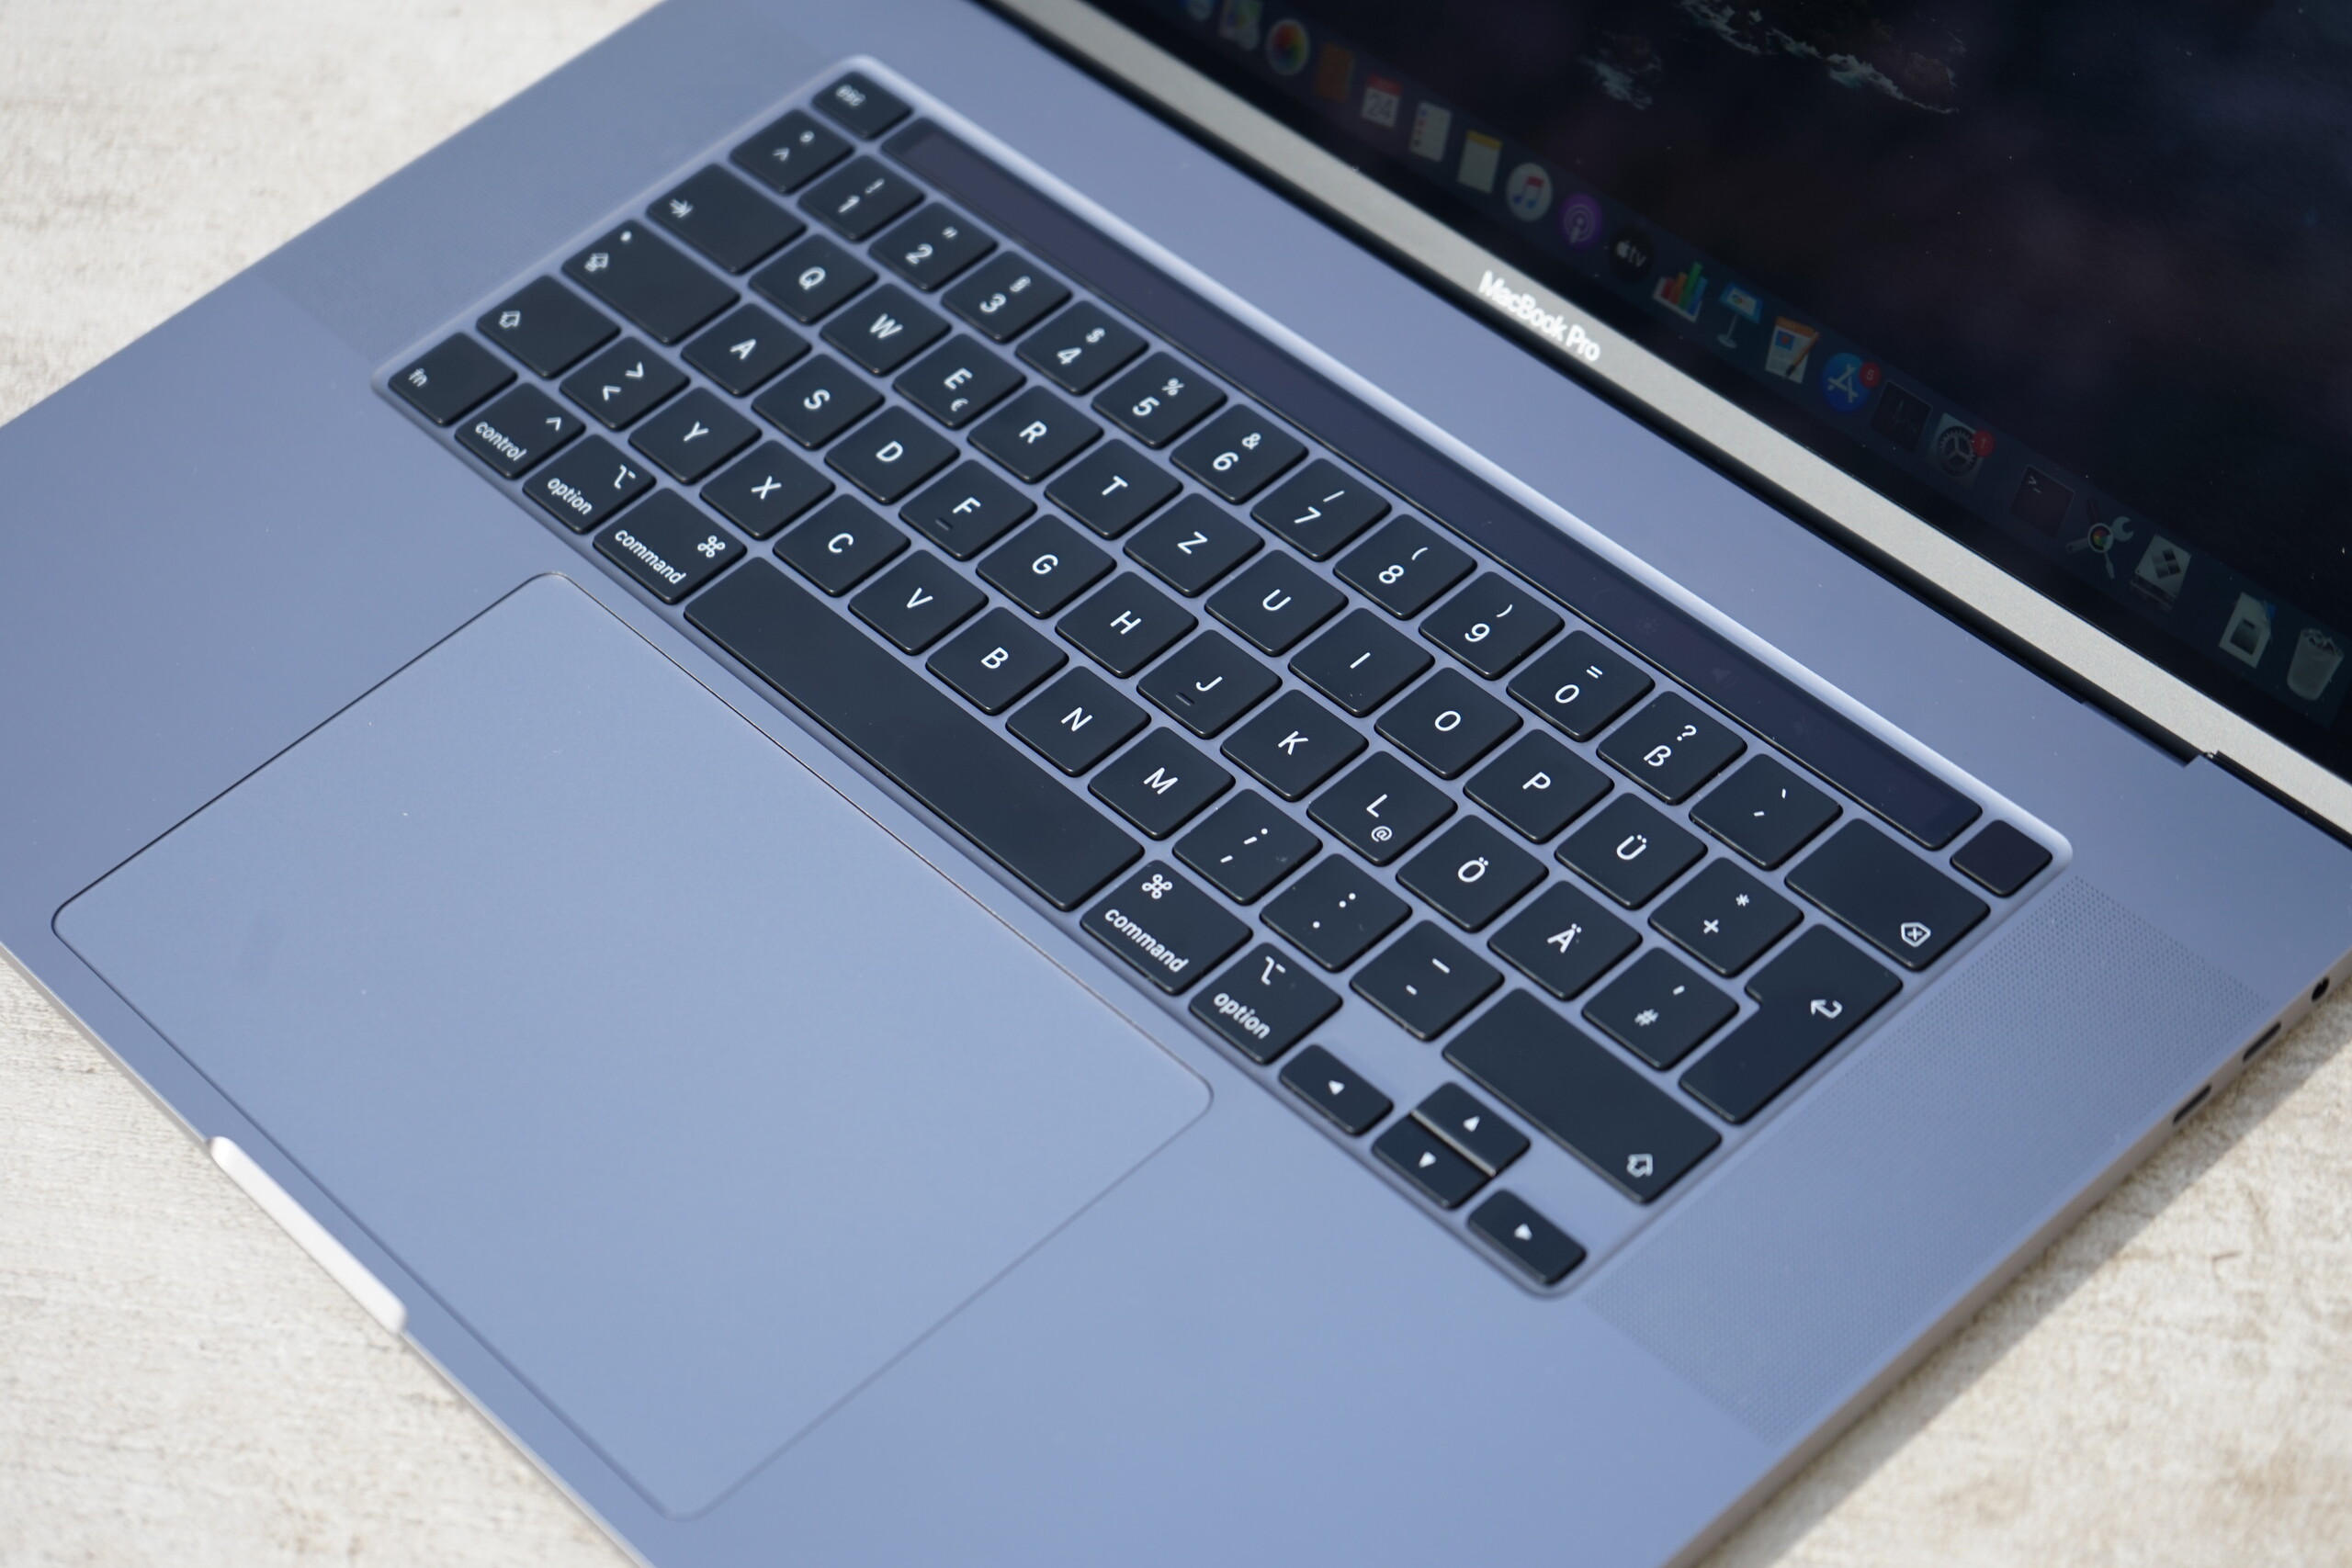
Apple a retravaillé le design de l’ancien 15 pouces avec ce nouveau MacBook Pro de 16 pouces, en faisant de petits mais importants changements. D’abord, la firme a remplacé son mécanisme de clavier butterfly, très critiqué, par des connecteurs ciseaux qui ont fait leurs preuves, fournissent une course plus longue, et devraient être plus durables. Et si la conception du nouveau modèle reprend beaucoup de points du dernier MacBook Pro 15, il est légèrement plus épais et possède un refroidissement plus efficace.
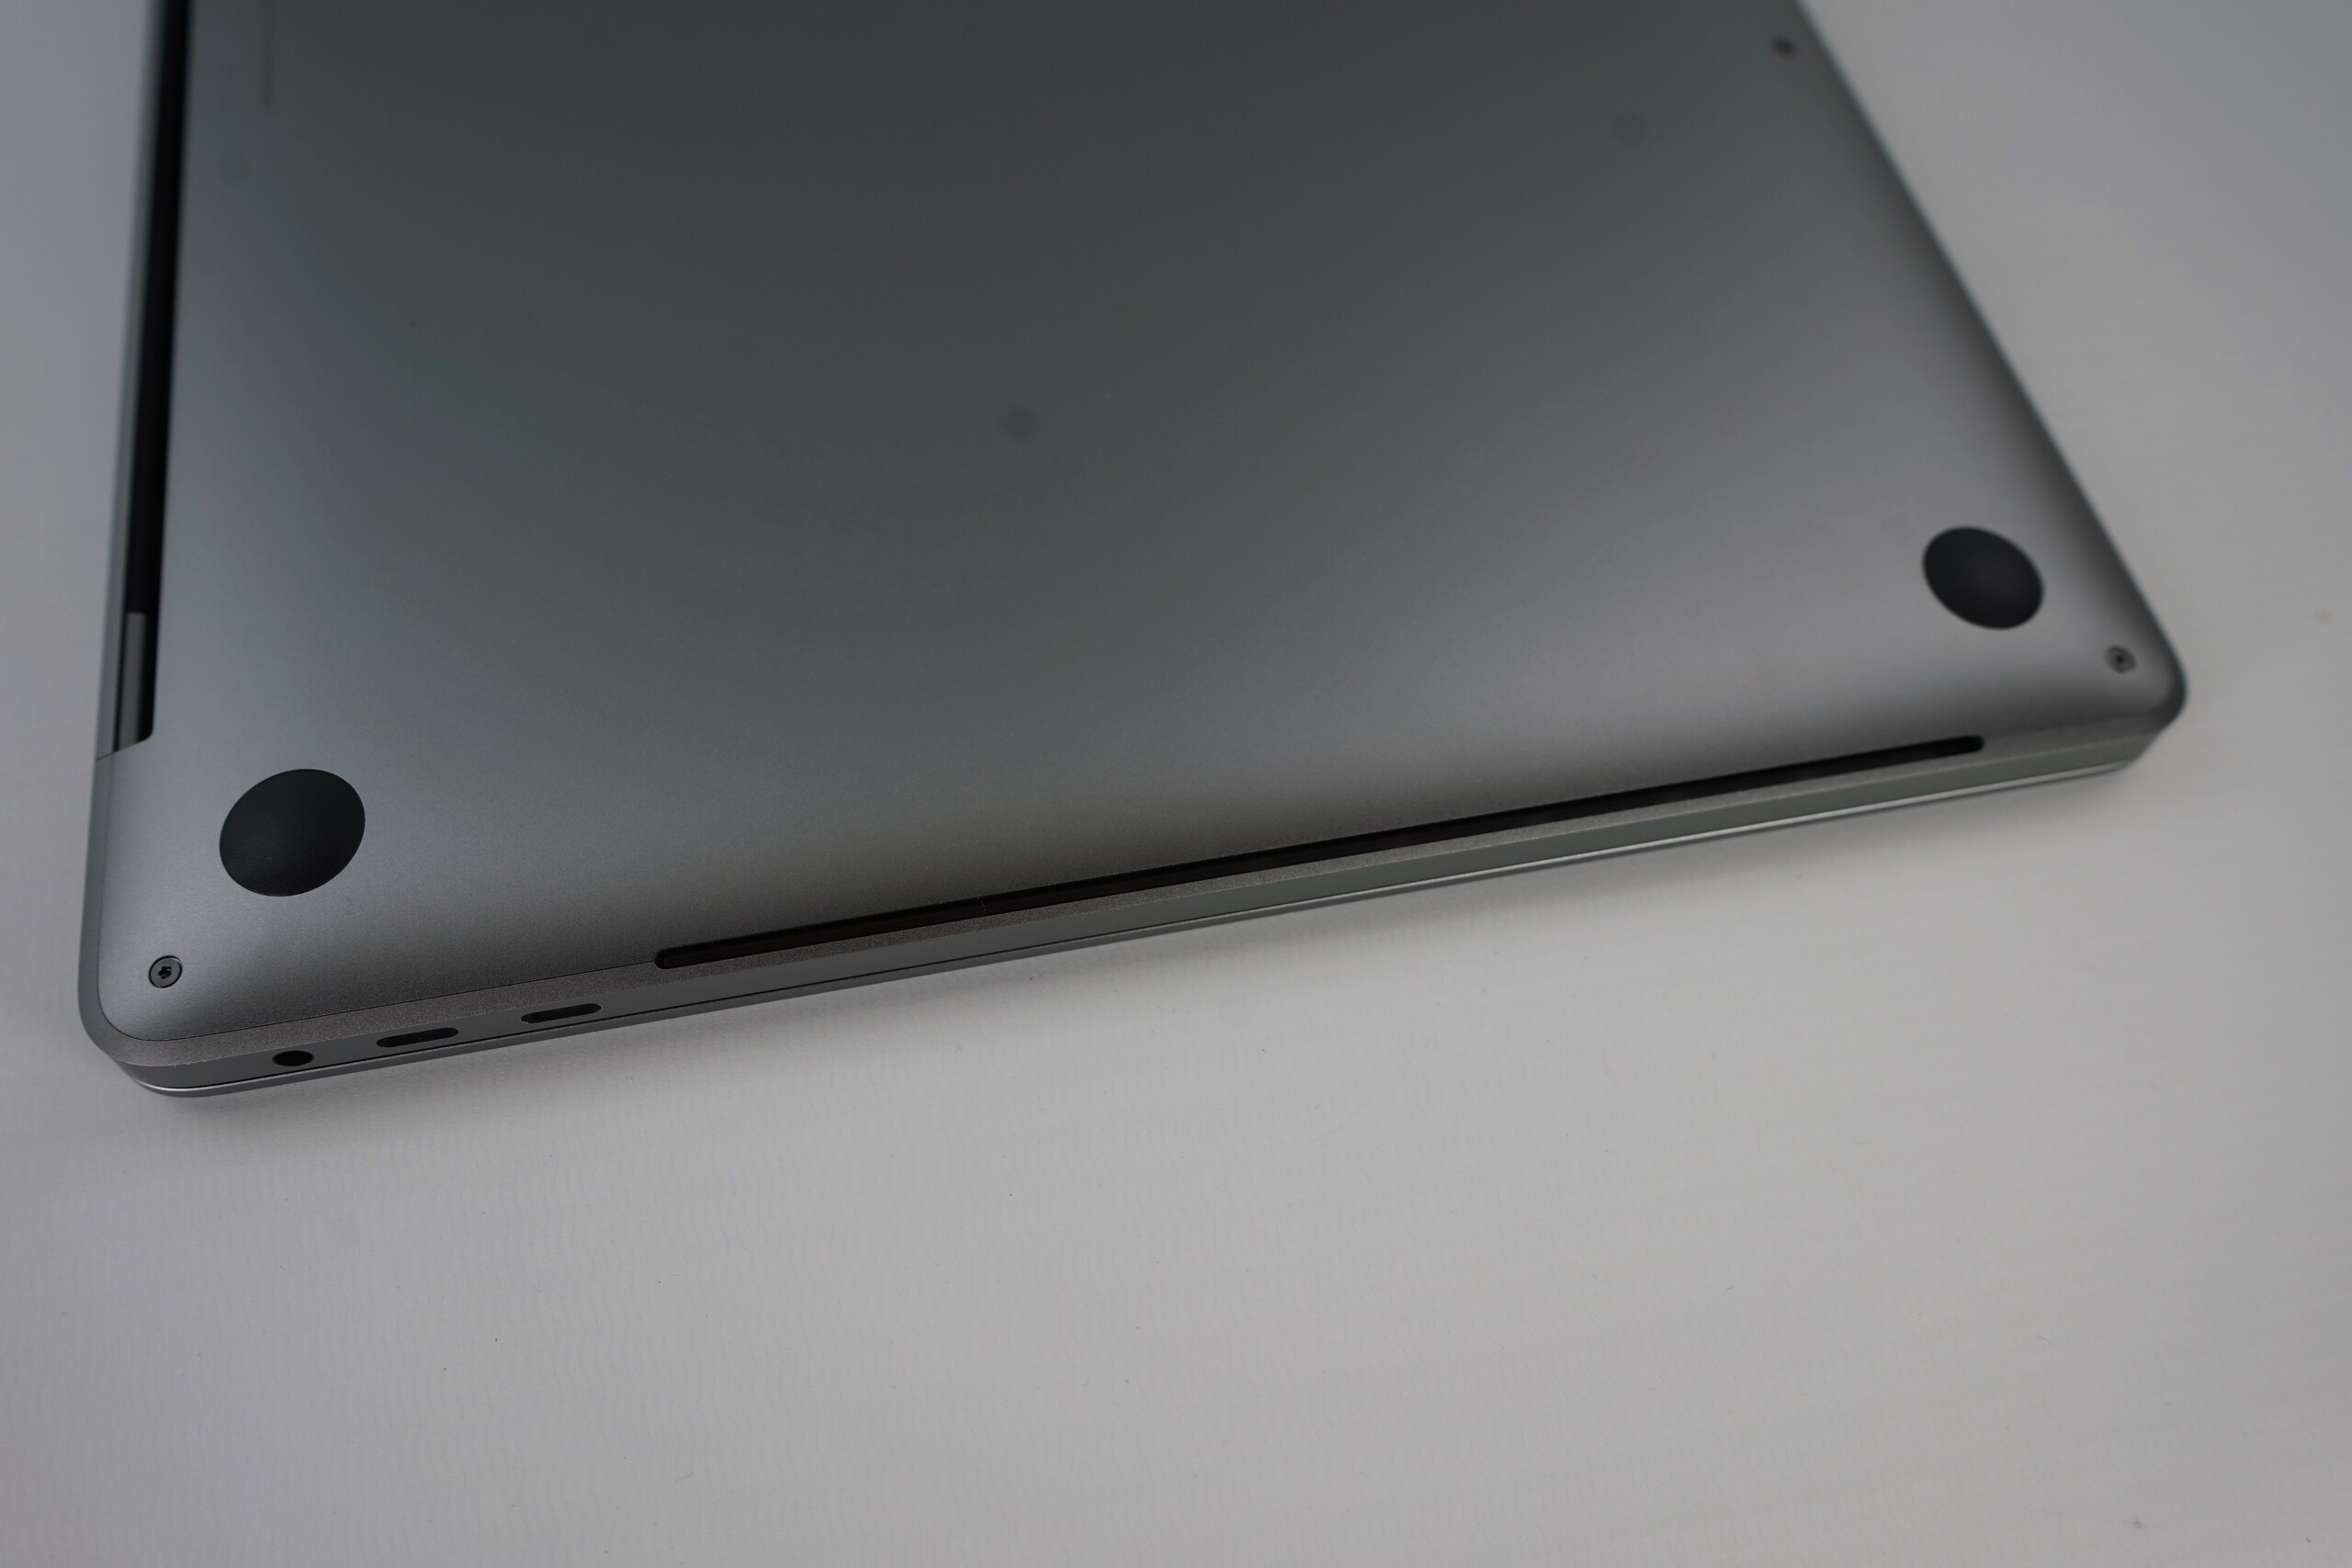
Malheureusement, Apple persiste à n’inclure que quatre ports Thunderbolt 3 et une prise jack. L’Ethernet, le HDMI, un lecteur de carte et un port USB A font tous partie du passé dans l’écosystème Apple, si bien qu’il faudra acheter au moins un adaptateur. De même, les possibilités d’évolution et de réparation sont toujours aussi mauvaises qu’avant, Apple ayant soudé le CPU, le GPU, la RAM, le SSD et la puce Wifi à la carte-mère. Cela signifie qu’il faudra se contenter de la puce Wifi dépassée Broadcom 802.11 ac, et il faudra remplacer la carte-mère si n’importe lequel de ces composants est défaillant.
Le MacBook Pro 16 est un portable multimédia excellent et très complet, avec des possibilités de maintenance réduites.
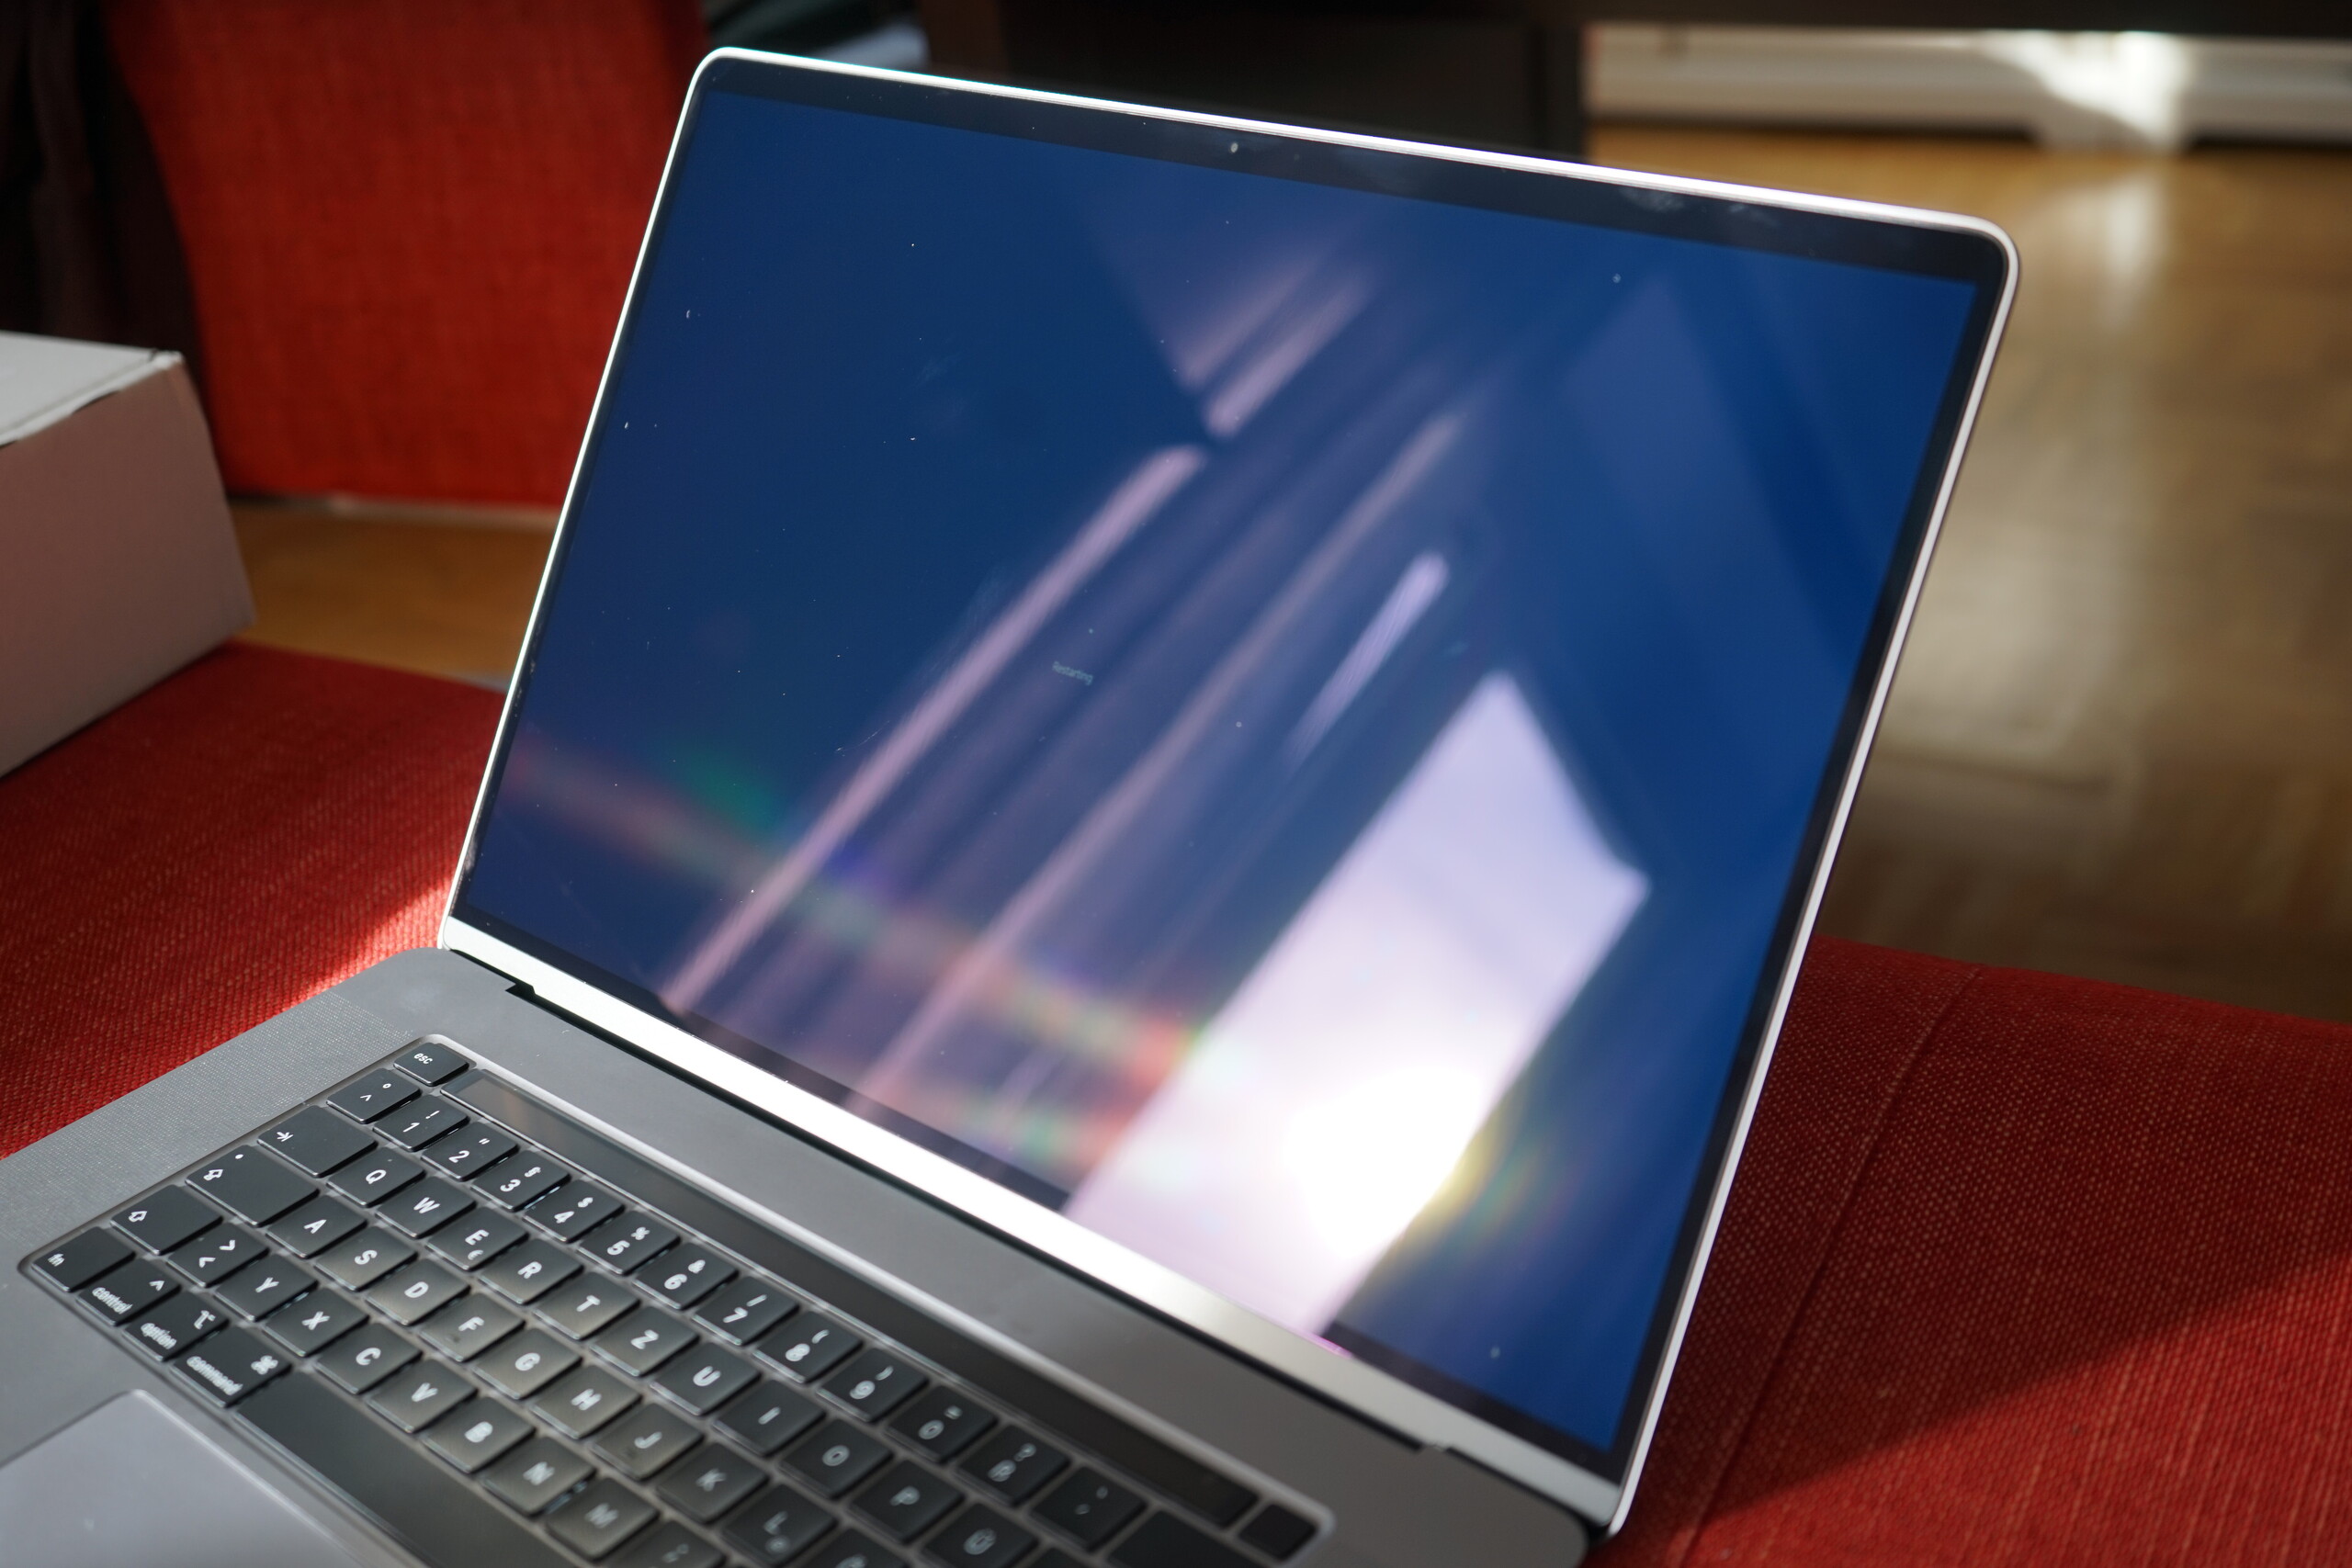
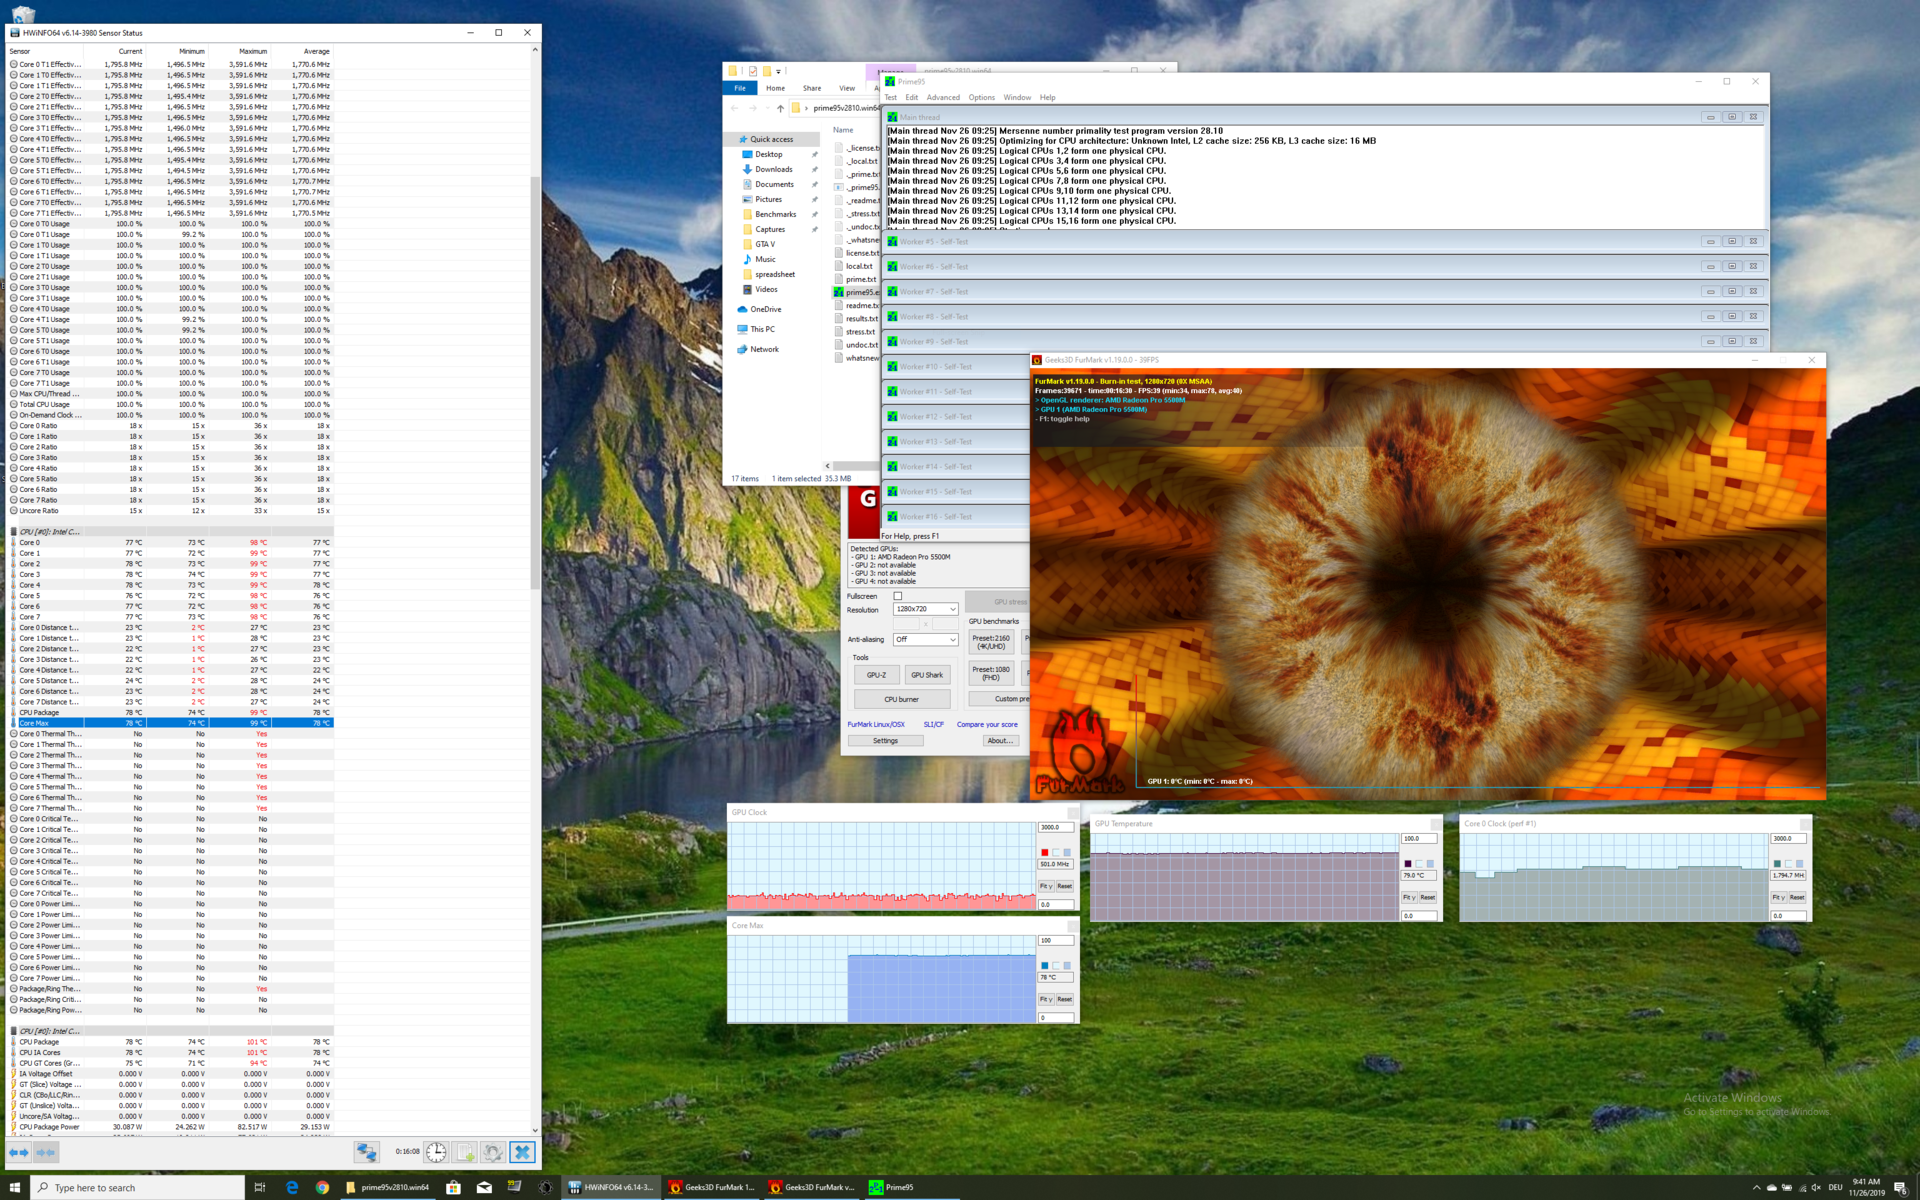
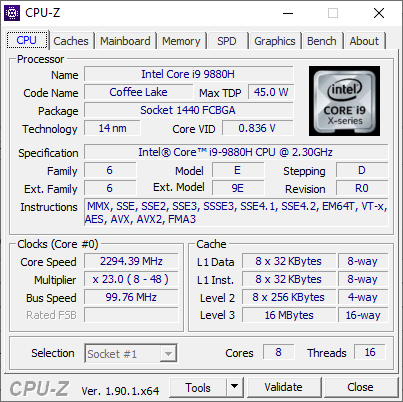
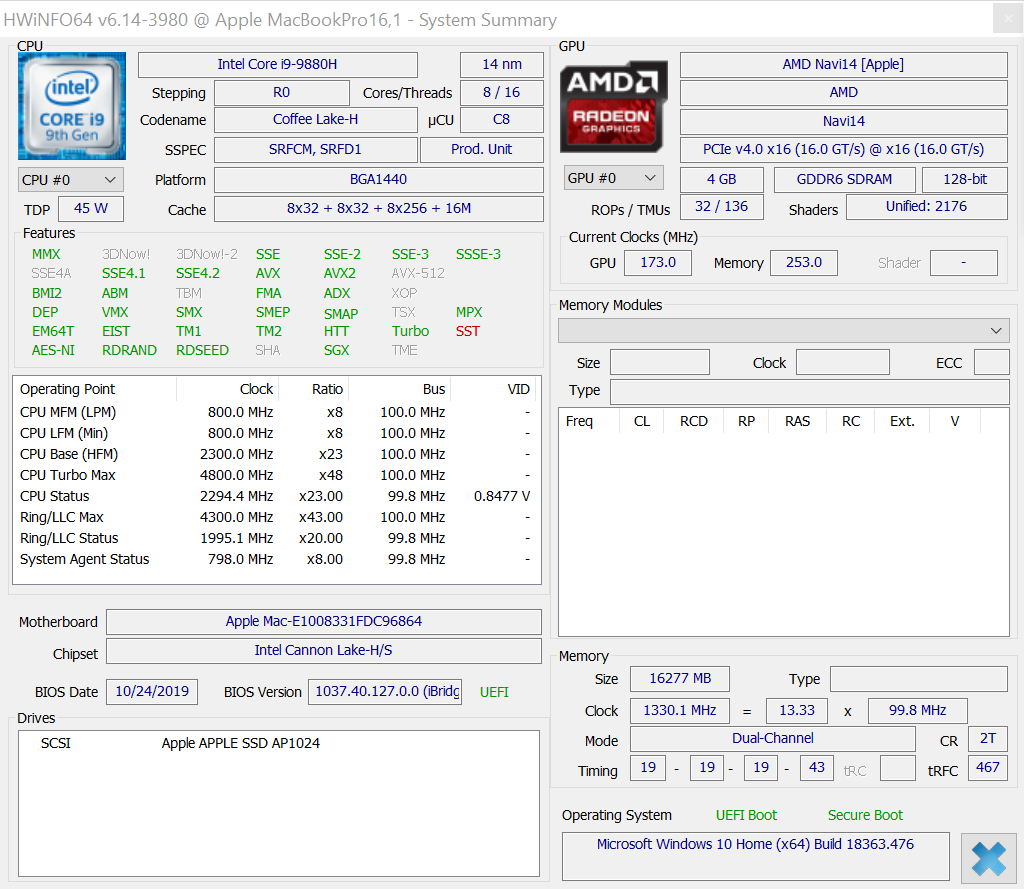
Le nouvel écran de 16 pouces est également sans surprise. La dalle ne prend en charge ni les taux de rafraîchissement de 120 Hz, ni l’Adaptative Sync, mais la qualité d’image est tout aussi bonne que sur les MacBook Pro précédents. Le plus grand châssis a également permis à Apple d’intégrer de bien meilleurs haut-parleurs que sur le prédécesseur de 15 pouces. Un refroidissement plus efficace était également attendu depuis longtemps, et notre modèle possède des performances bien meilleures avec son Core i9-9880H que son prédécesseur. Si la nouvelle carte graphique Navi ne fera pas peur à la concurrence Windows, il s’agit d’une bonne évolution par rapport aux GPU Vega qui équipaient le MacBook Pro 15.
Le MacBook Pro 16 ne détient aucun record d’autonomie, pour un portable multimédia, malgré sa batterie de 100 Wh, son processeur Core i9, son grand écran et sa puce graphique dédiée étant des composants à la consommation élevée. On aura néanmoins environ 2h de plus entre deux charges en navigation web qu’avec le MacBook Pro 15, ce qui est un net progrès. Le MacBook Pro 16 devrait tenir une journée plein de travail entre deux charges, ce qu’aucun des appareils de notre comparatif ne peut faire.
Le MacBook Pro 16 est ainsi un excellent portable multimédia. Il souffre de quelques faiblesses, en particulier de son prix. Et les 2 799 $ demandés n’amènent qu’une garantie d’un an, et n’empêchent pas de devoir acheter au moins un adaptateur USB C…
L’intégralité de cette critique est disponible en anglais en suivant ce lien.
Apple MacBook Pro 16 2019 i9 5500M
- 12/02/2019 v7 (old)
Klaus Hinum, Andreas Osthoff
Price comparison
