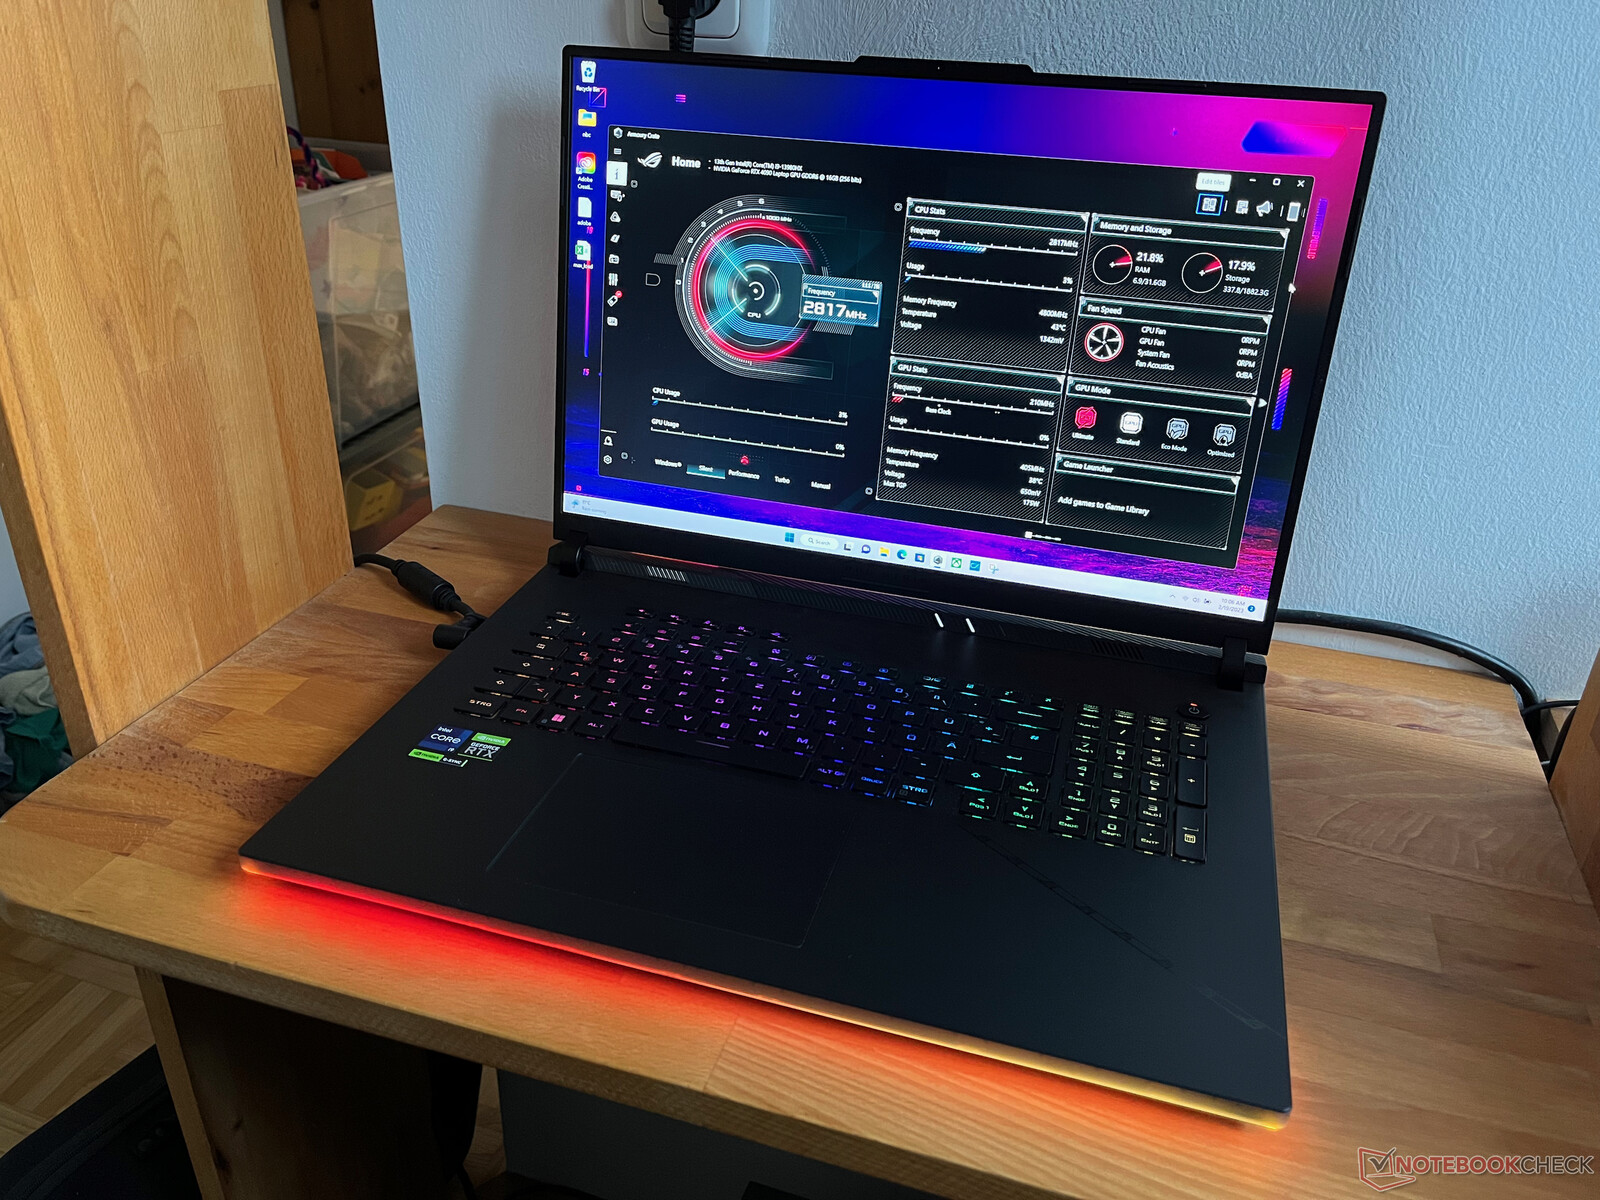
Test de l'Asus ROG Strix Scar 18 2023 G834JY : PC portable de jeu avec RTX 4090
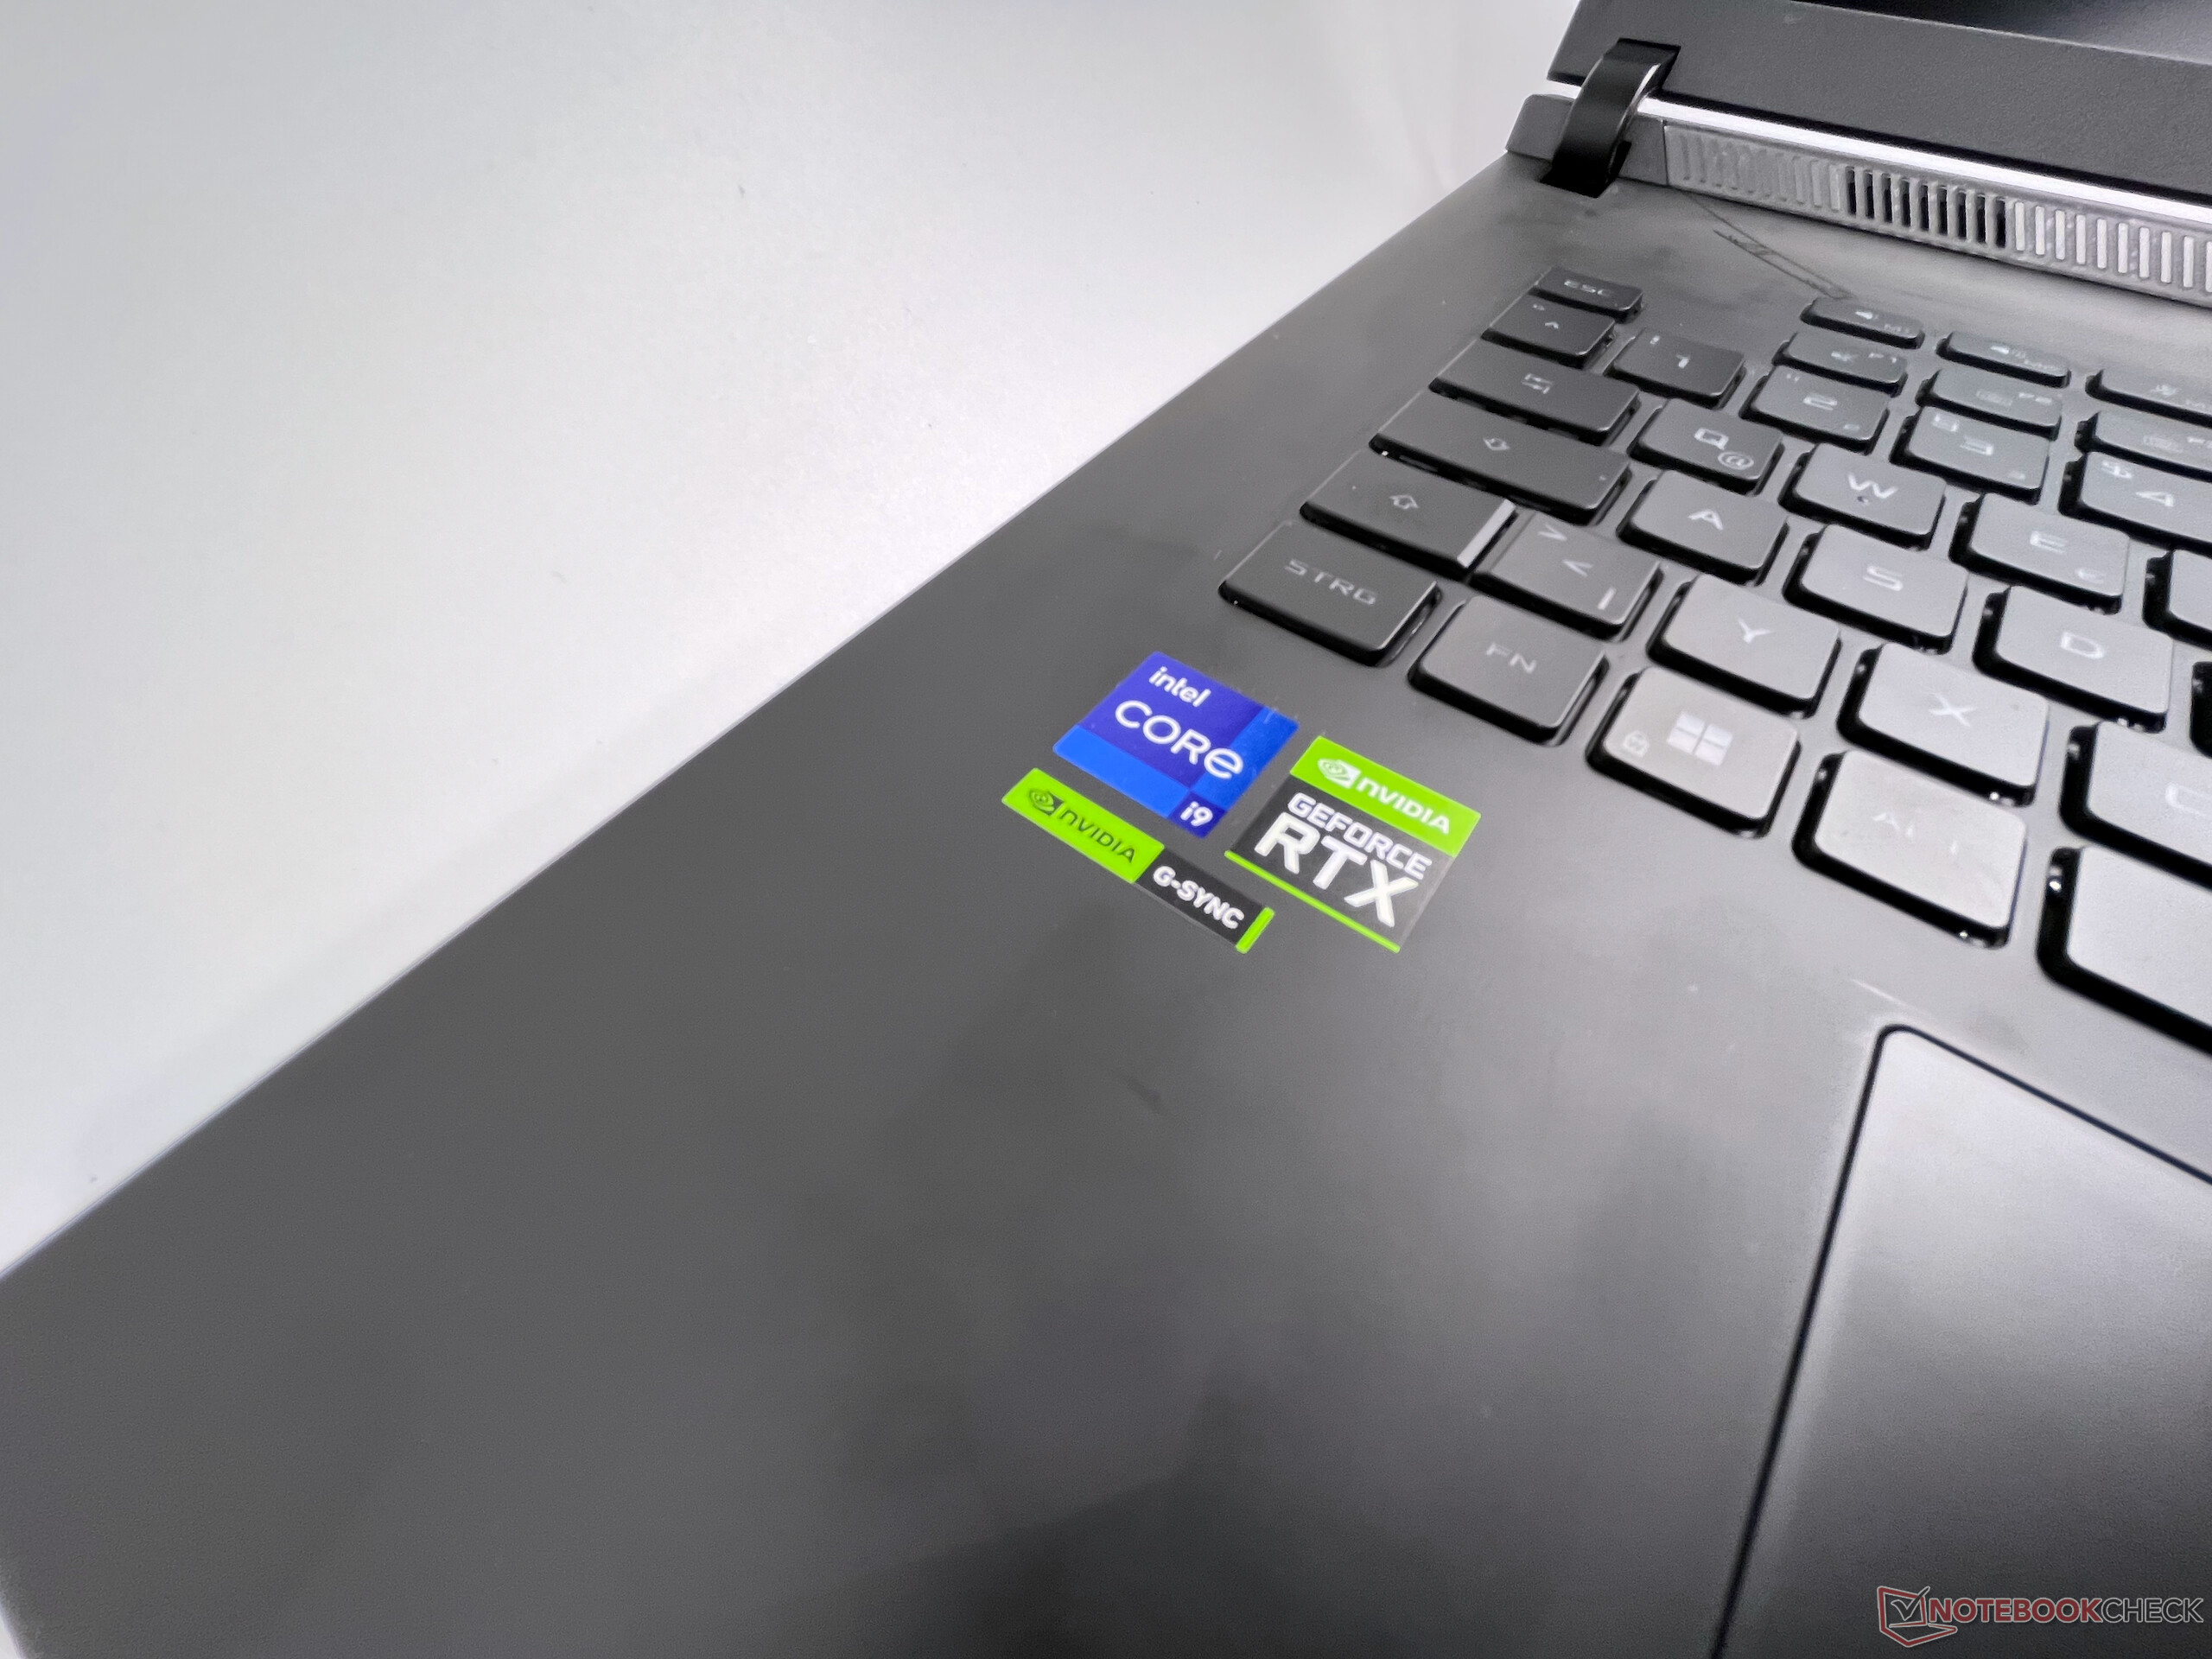
Avec le ROG Strix Scar 18, Asus s'inscrit également dans la tendance du renouveau des monstres de jeu de 18 pouces. Pour le lancement, il y a un nouveau boîtier avec le processeur RTX 4080et GPU RTX 4090 pour ordinateur portableutilisés par notre unité de test. En termes de processeurs, Asus utilise la nouvelle série HX, ce qui signifie que vous obtenez les composants pour ordinateur portable les plus rapides actuellement disponibles sur le marché. Non seulement le grand boîtier est entièrement utilisé par l'écran QHD+ de 18 pouces, mais il abrite également un nouveau système de refroidissement avec trois ventilateurs, qui est censé garder les composants gourmands en énergie sous contrôle. Dans le test suivant, nous examinons en détail le G834JY-N6005W avec RTX 4090, 32 Go de RAM GDDR5 et 2 SSD de 1 To, actuellement disponible en Angleterre.
Comparaison avec les concurrents potentiels
Note | Date | Modèle | Poids | Épaisseur | Taille | Résolution | Prix |
|---|---|---|---|---|---|---|---|
| 86.6 % v7 (old) | 02/23 | Asus ROG Strix Scar 18 2023 G834JY-N6005W i9-13980HX, GeForce RTX 4090 Laptop GPU | 3.1 kg | 30.8 mm | 18.00" | 2560x1600 | |
| 89 % v7 (old) | 02/23 | MSI Titan GT77 HX 13VI i9-13950HX, GeForce RTX 4090 Laptop GPU | 3.5 kg | 23 mm | 17.30" | 3840x2160 | |
| 89.4 % v7 (old) | 02/23 | Lenovo Legion Pro 7 16IRX8H i9-13900HX, GeForce RTX 4080 Laptop GPU | 2.7 kg | 26 mm | 16.00" | 2560x1600 | |
| 91.2 % v7 (old) | 02/23 | Razer Blade 16 Early 2023 i9-13950HX, GeForce RTX 4080 Laptop GPU | 2.4 kg | 21.99 mm | 16.00" | 2560x1600 | |
| 86.9 % v7 (old) | 11/22 | Asus ROG Strix Scar 17 SE G733CX-LL014W i9-12950HX, GeForce RTX 3080 Ti Laptop GPU | 2.9 kg | 28.3 mm | 17.30" | 2560x1440 | |
| 88.3 % v7 (old) | 08/22 | MSI Titan GT77 12UHS i9-12900HX, GeForce RTX 3080 Ti Laptop GPU | 3.3 kg | 23 mm | 17.30" | 1920x1080 | |
| 85.4 % v7 (old) | 03/23 | HP Omen 17-ck2097ng i9-13900HX, GeForce RTX 4080 Laptop GPU | 2.8 kg | 27 mm | 17.30" | 2560x1440 |
Cas
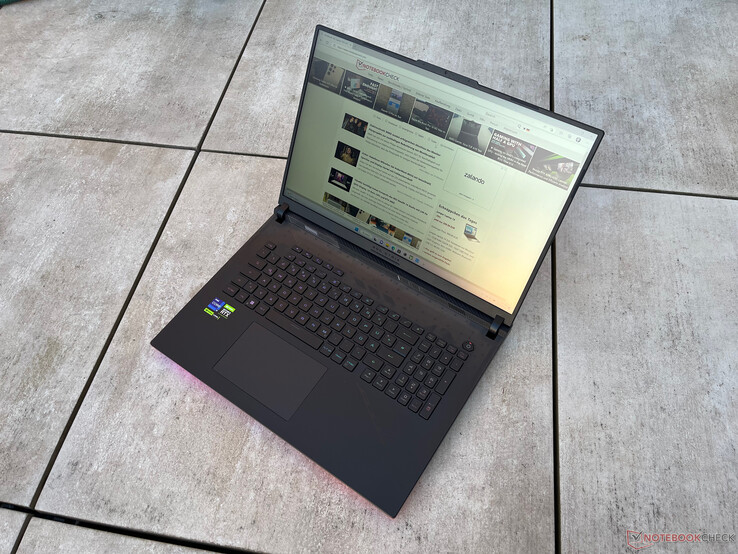
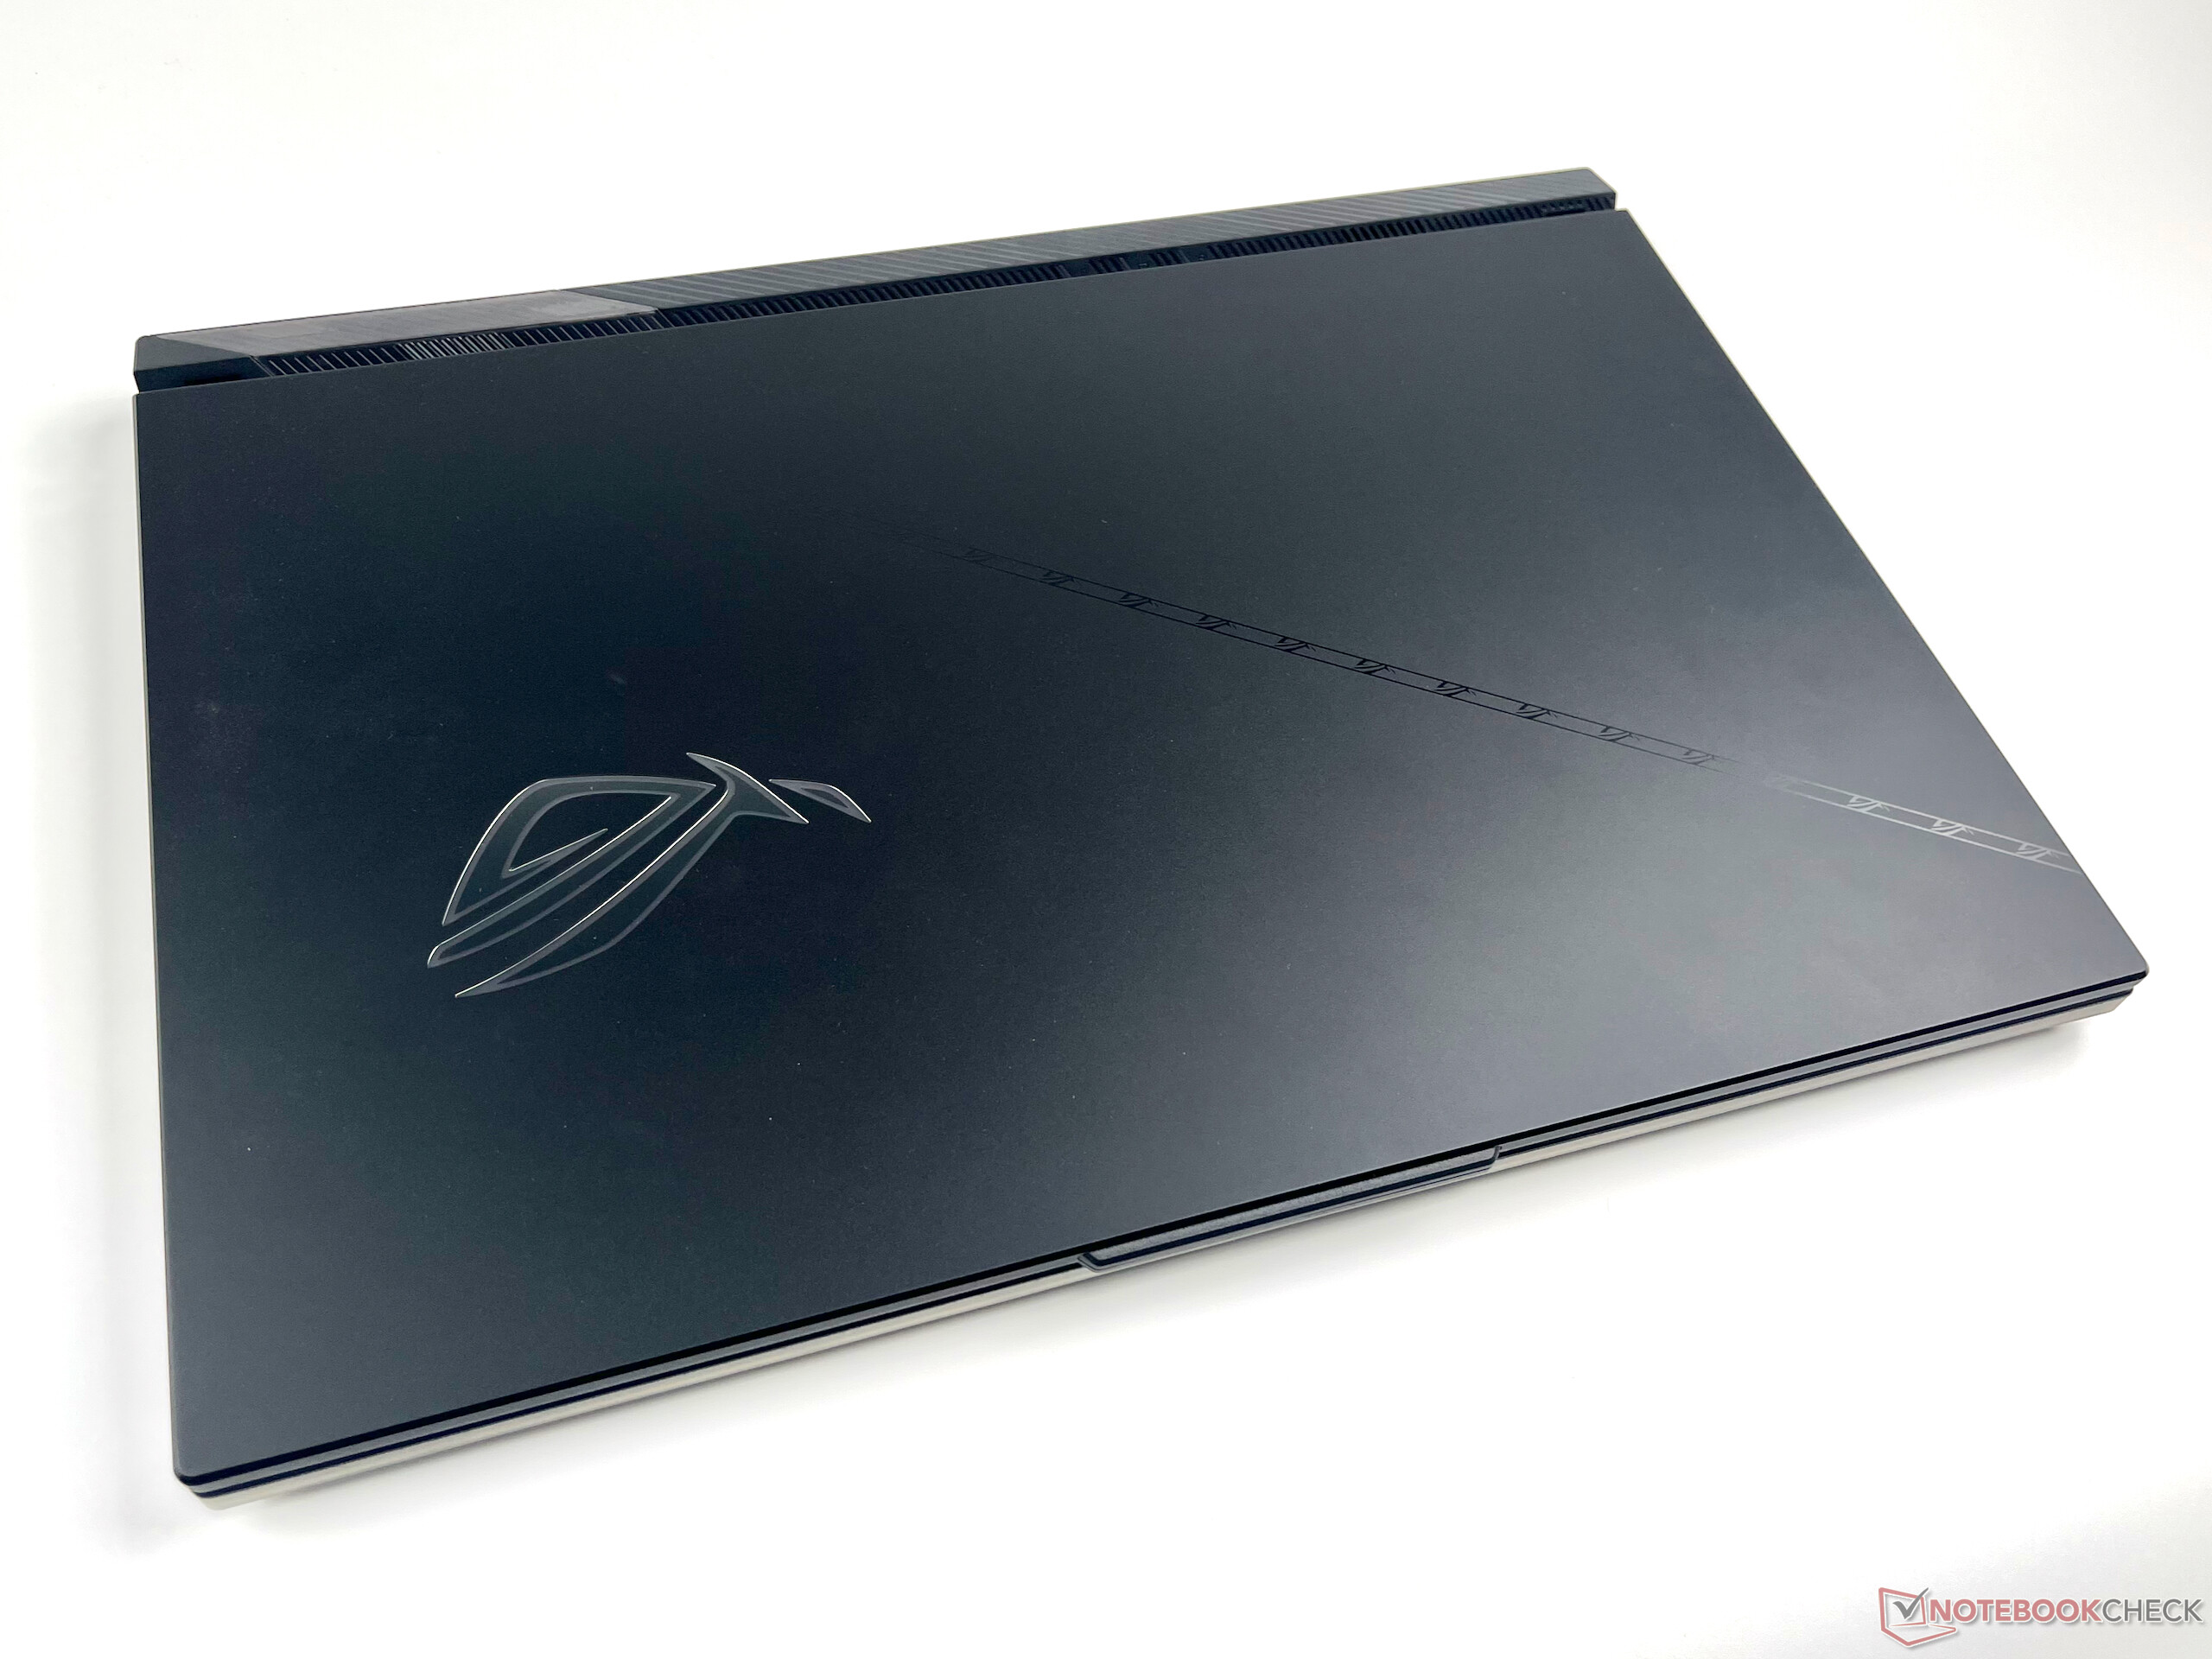
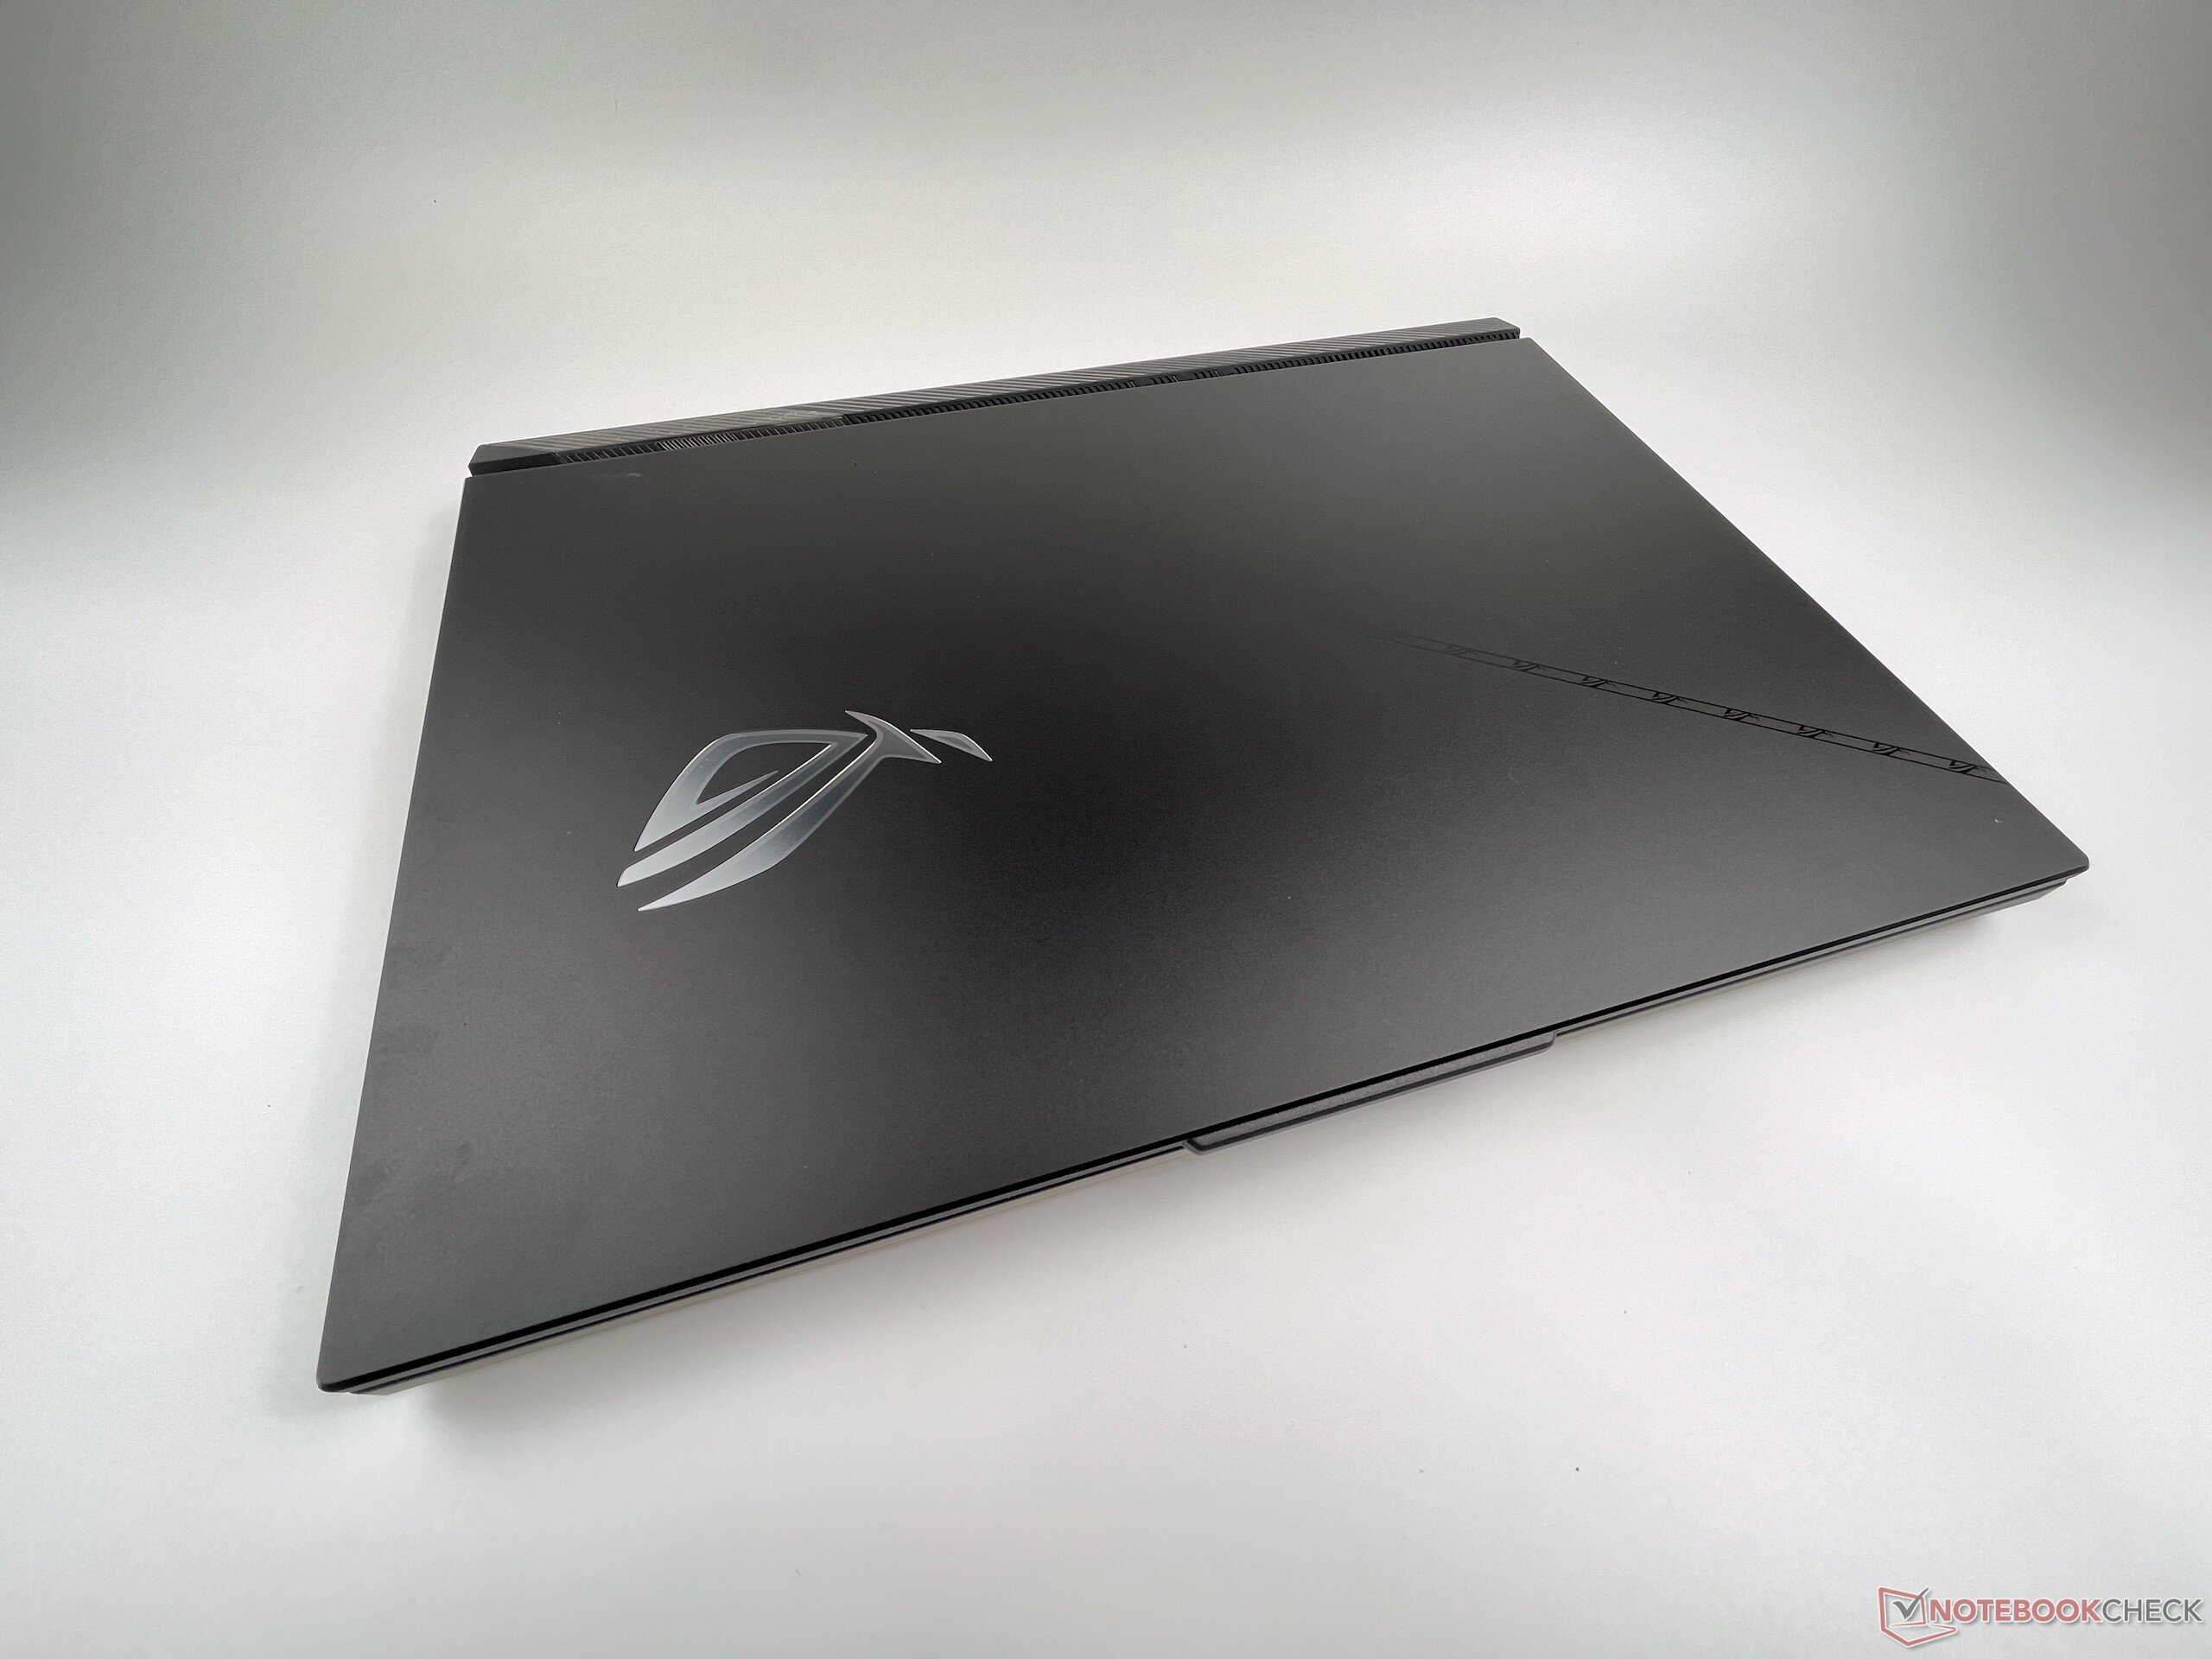
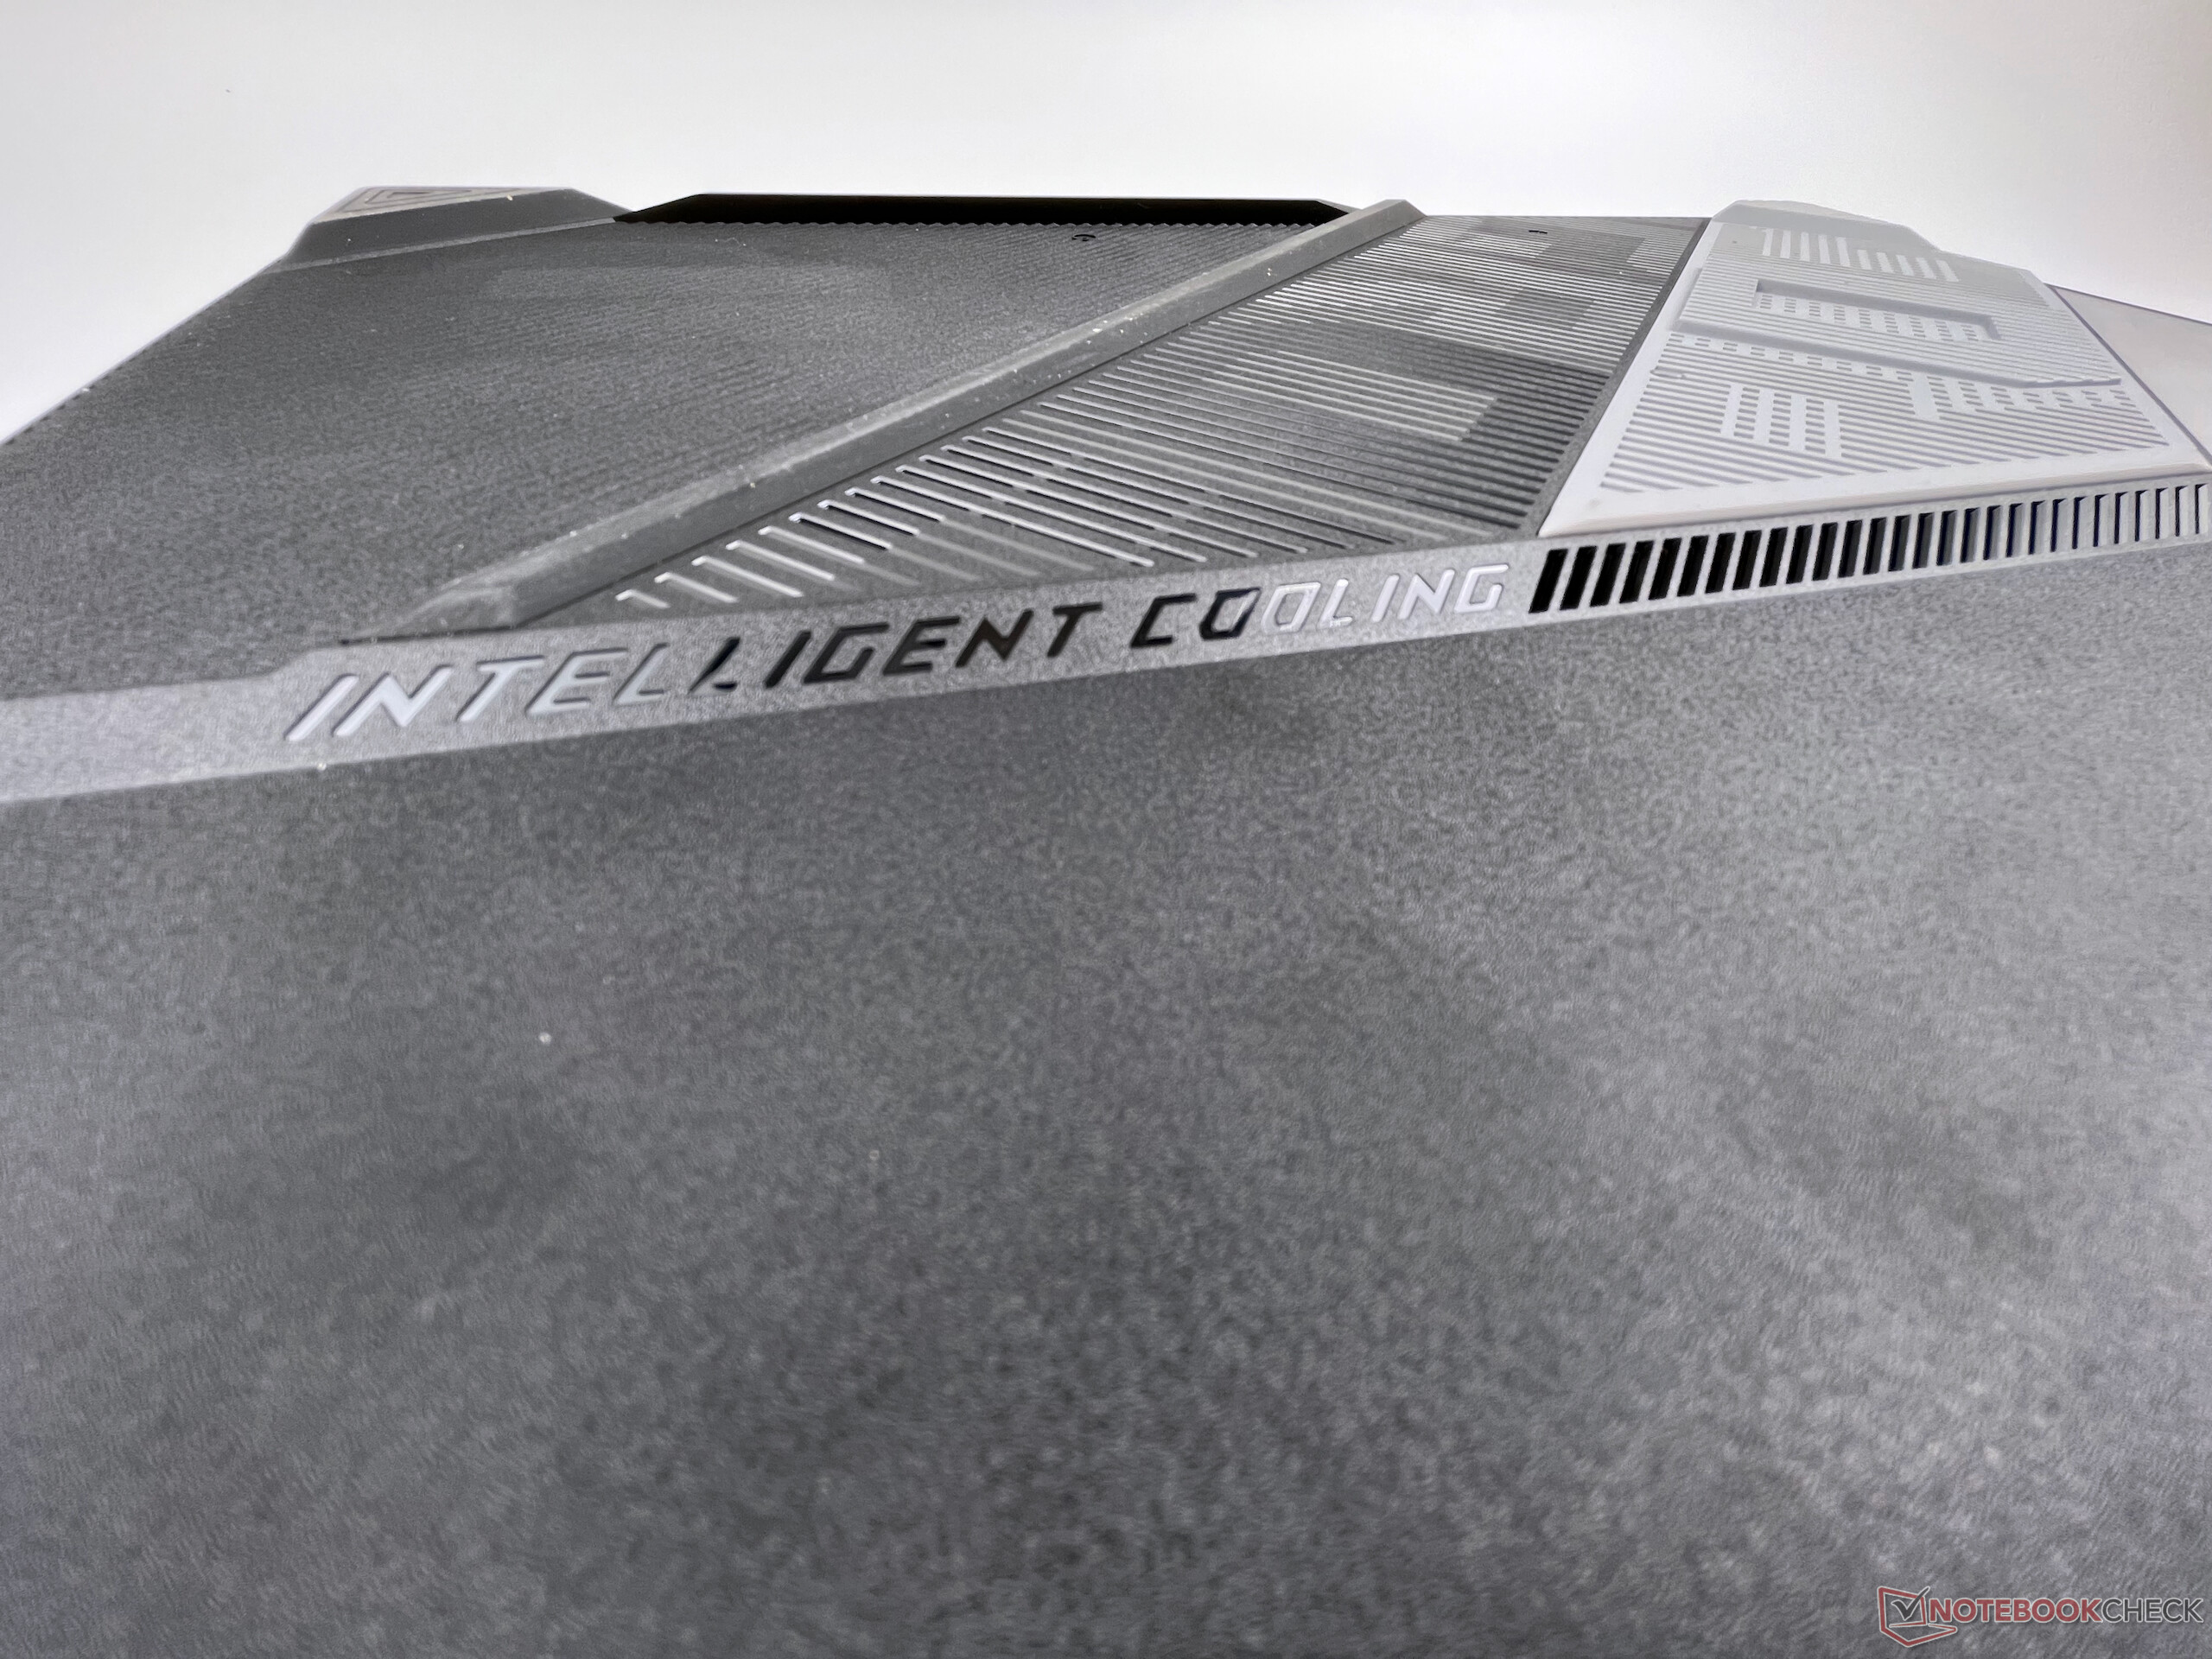
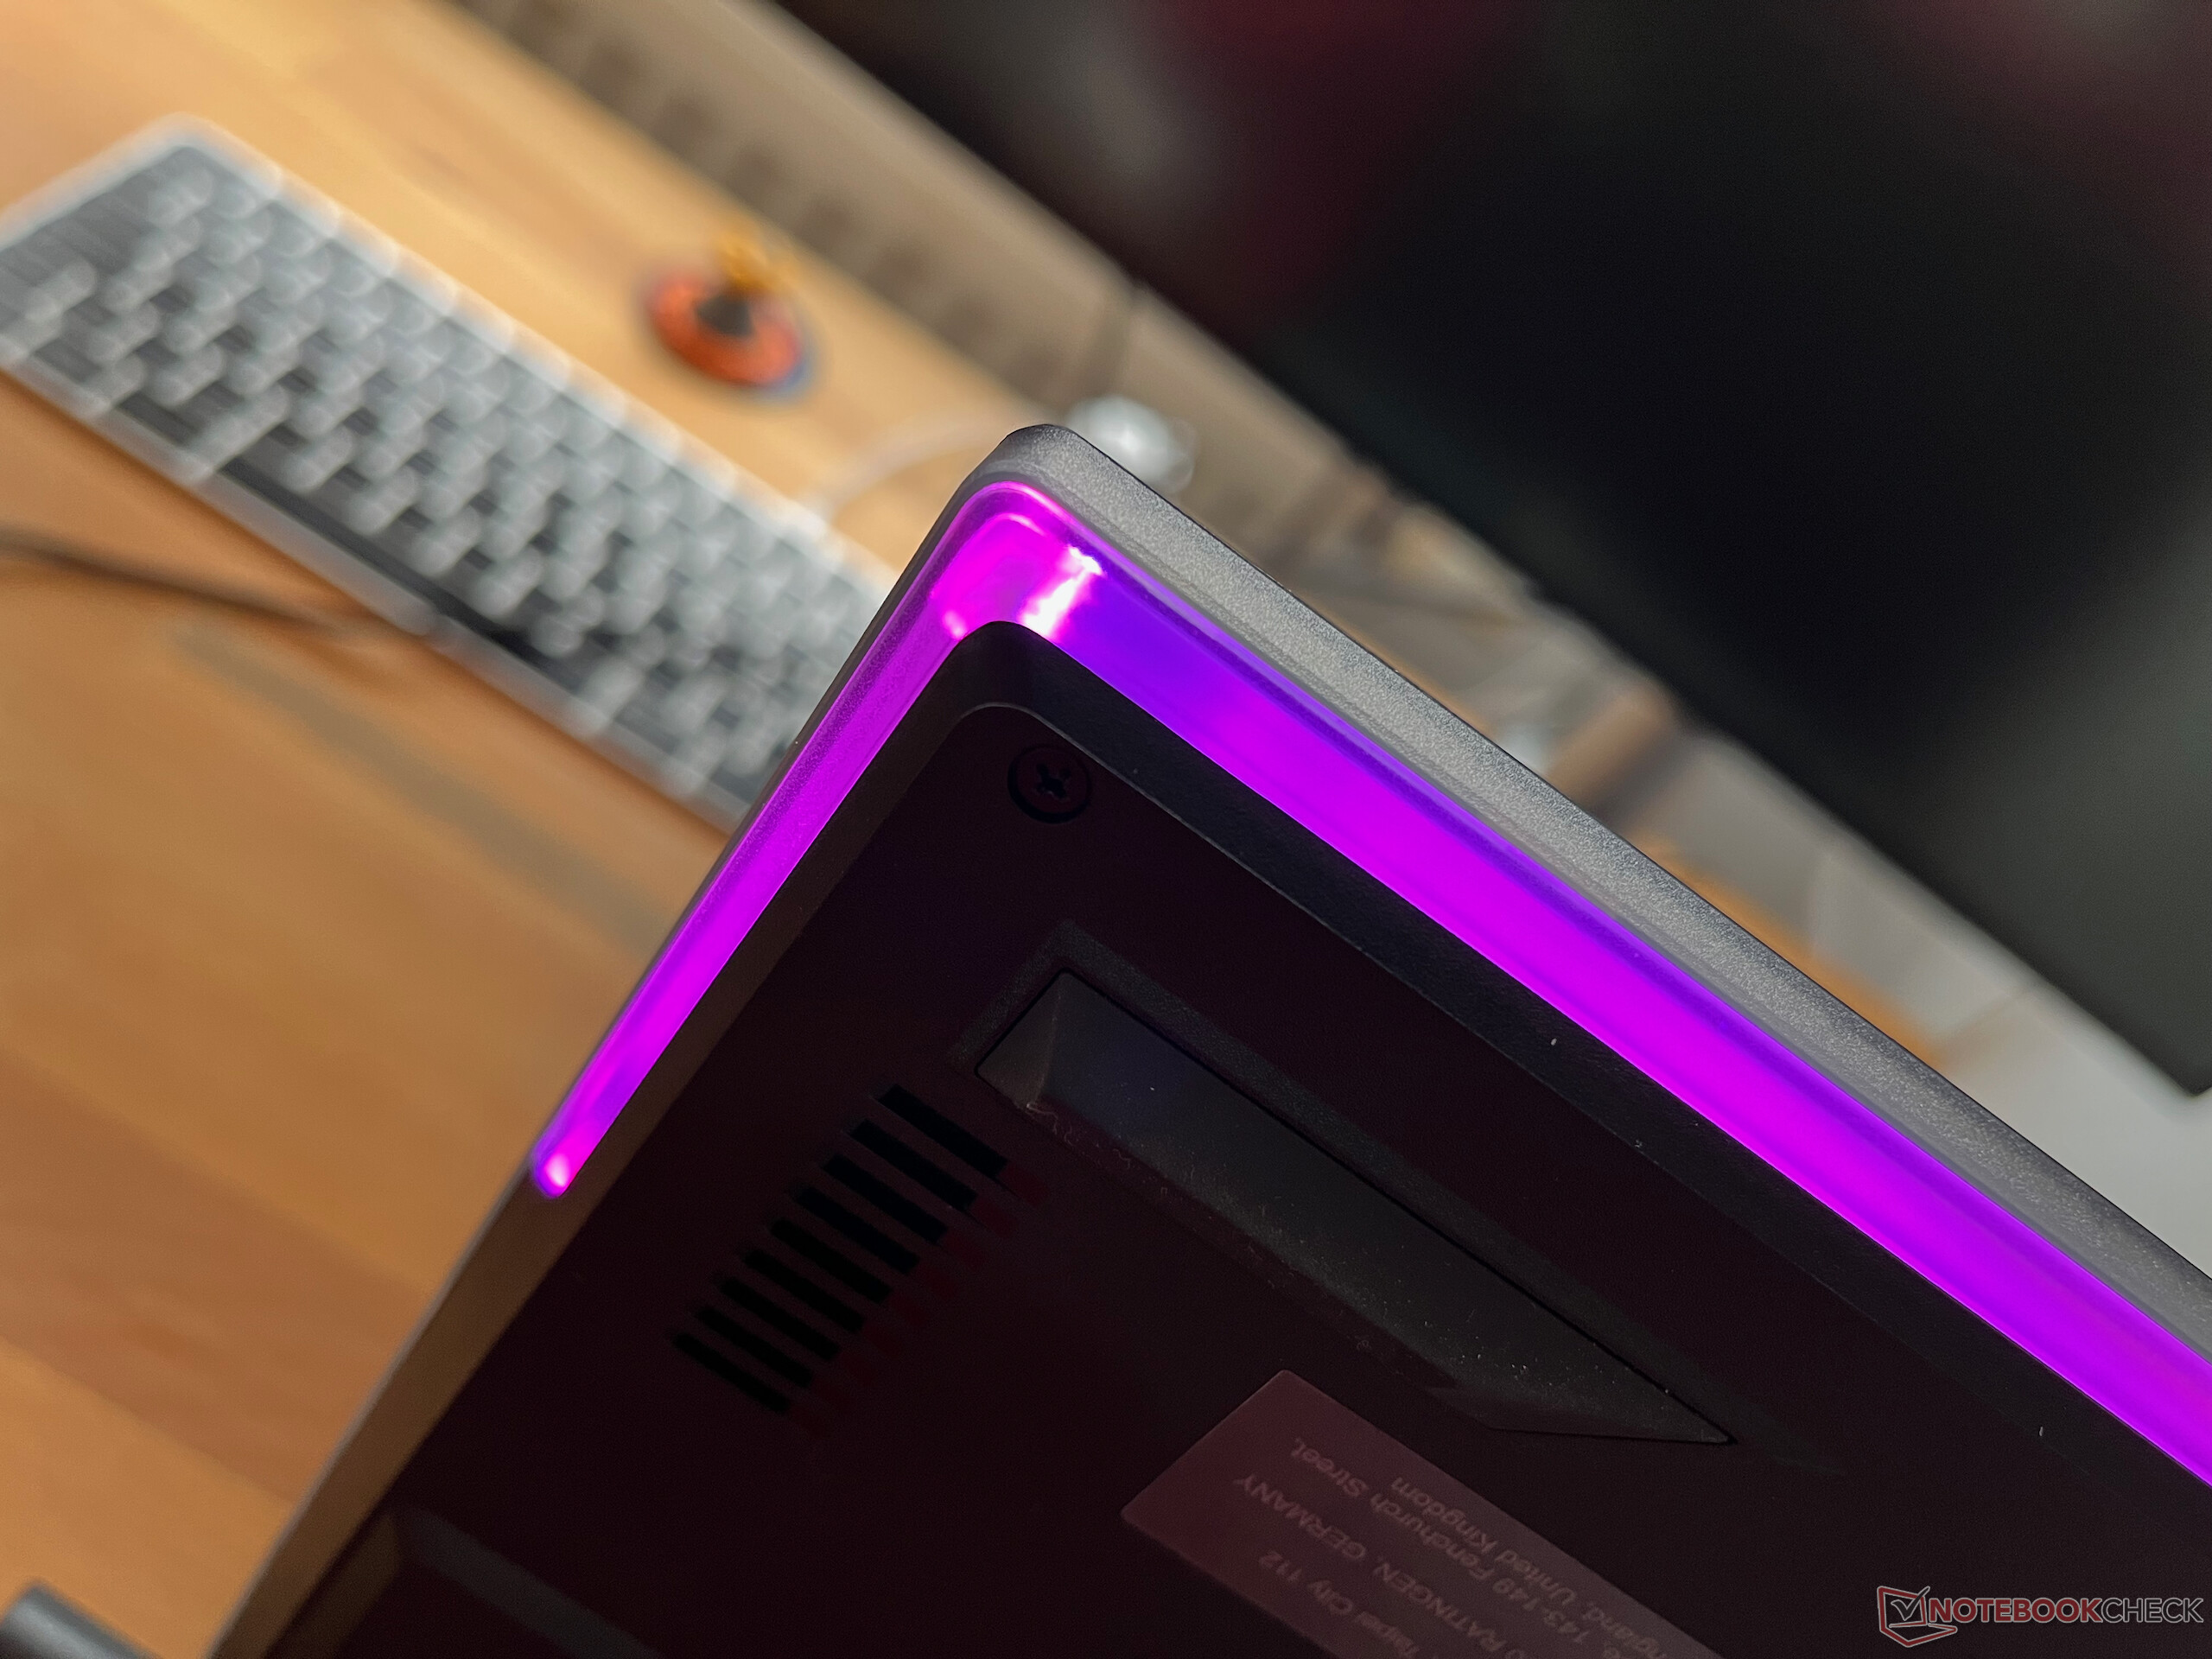
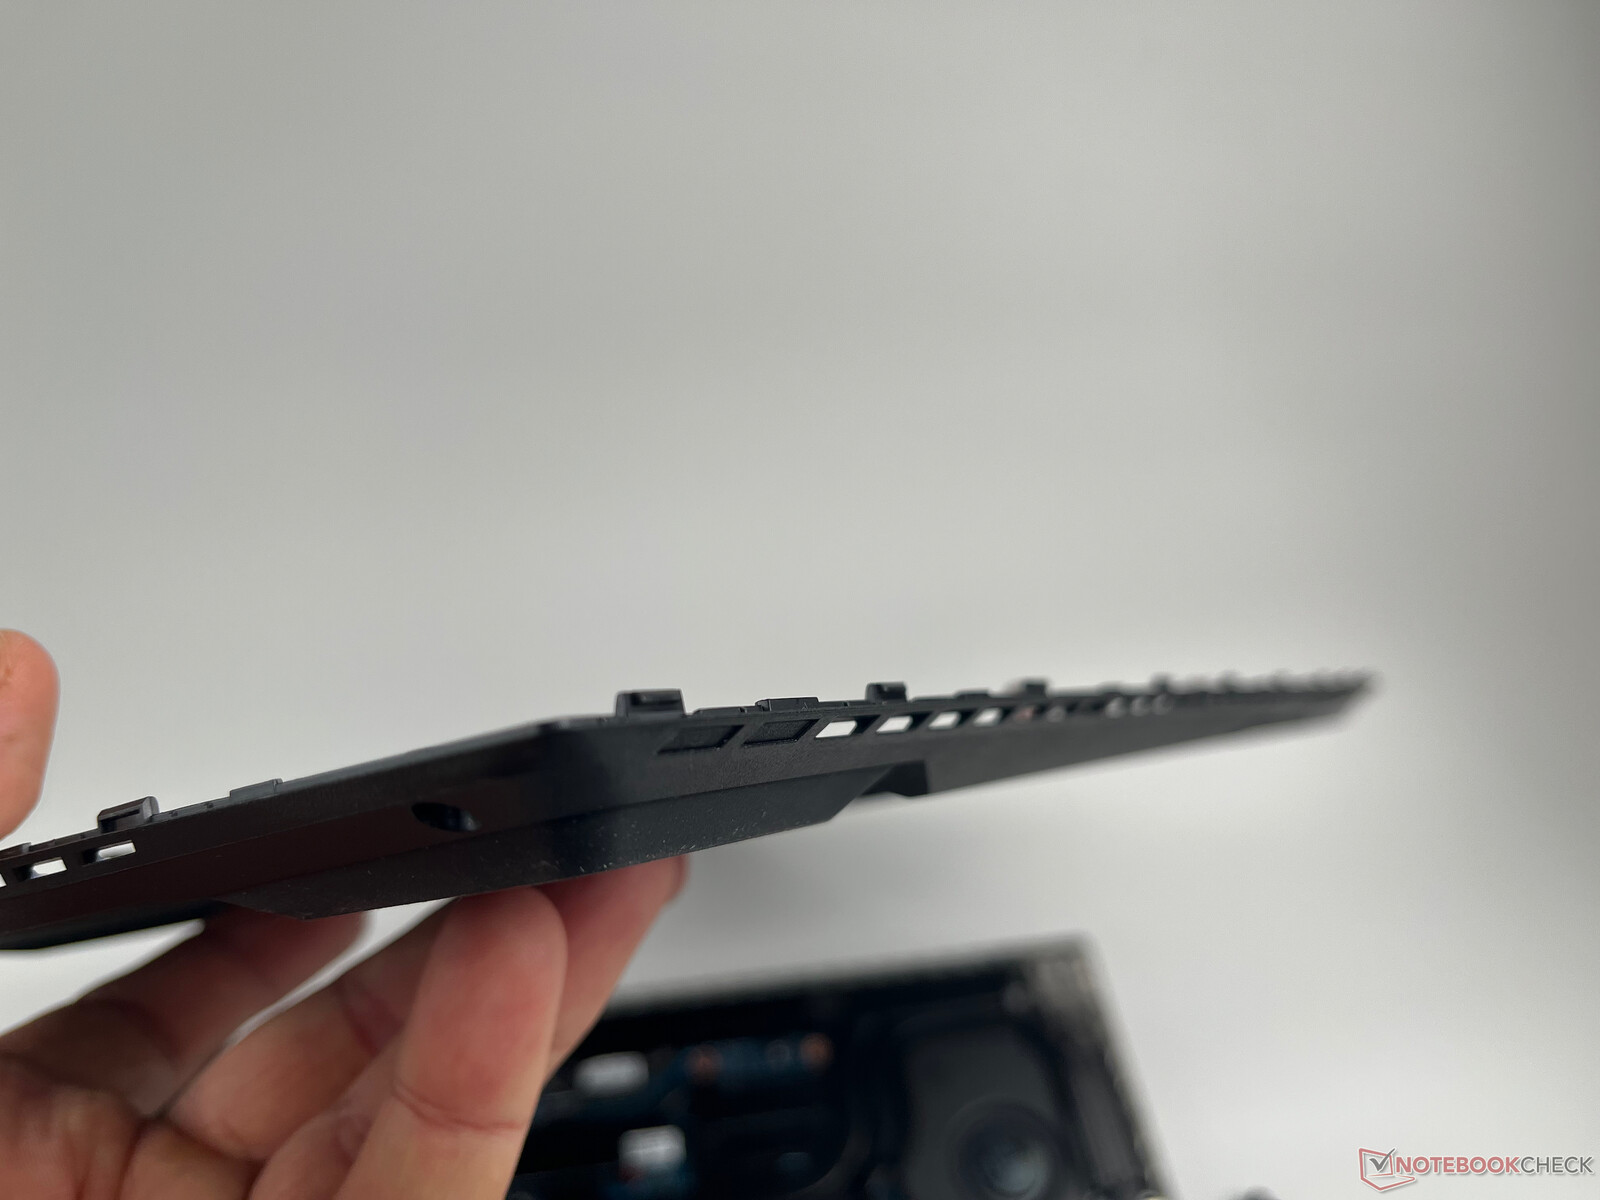
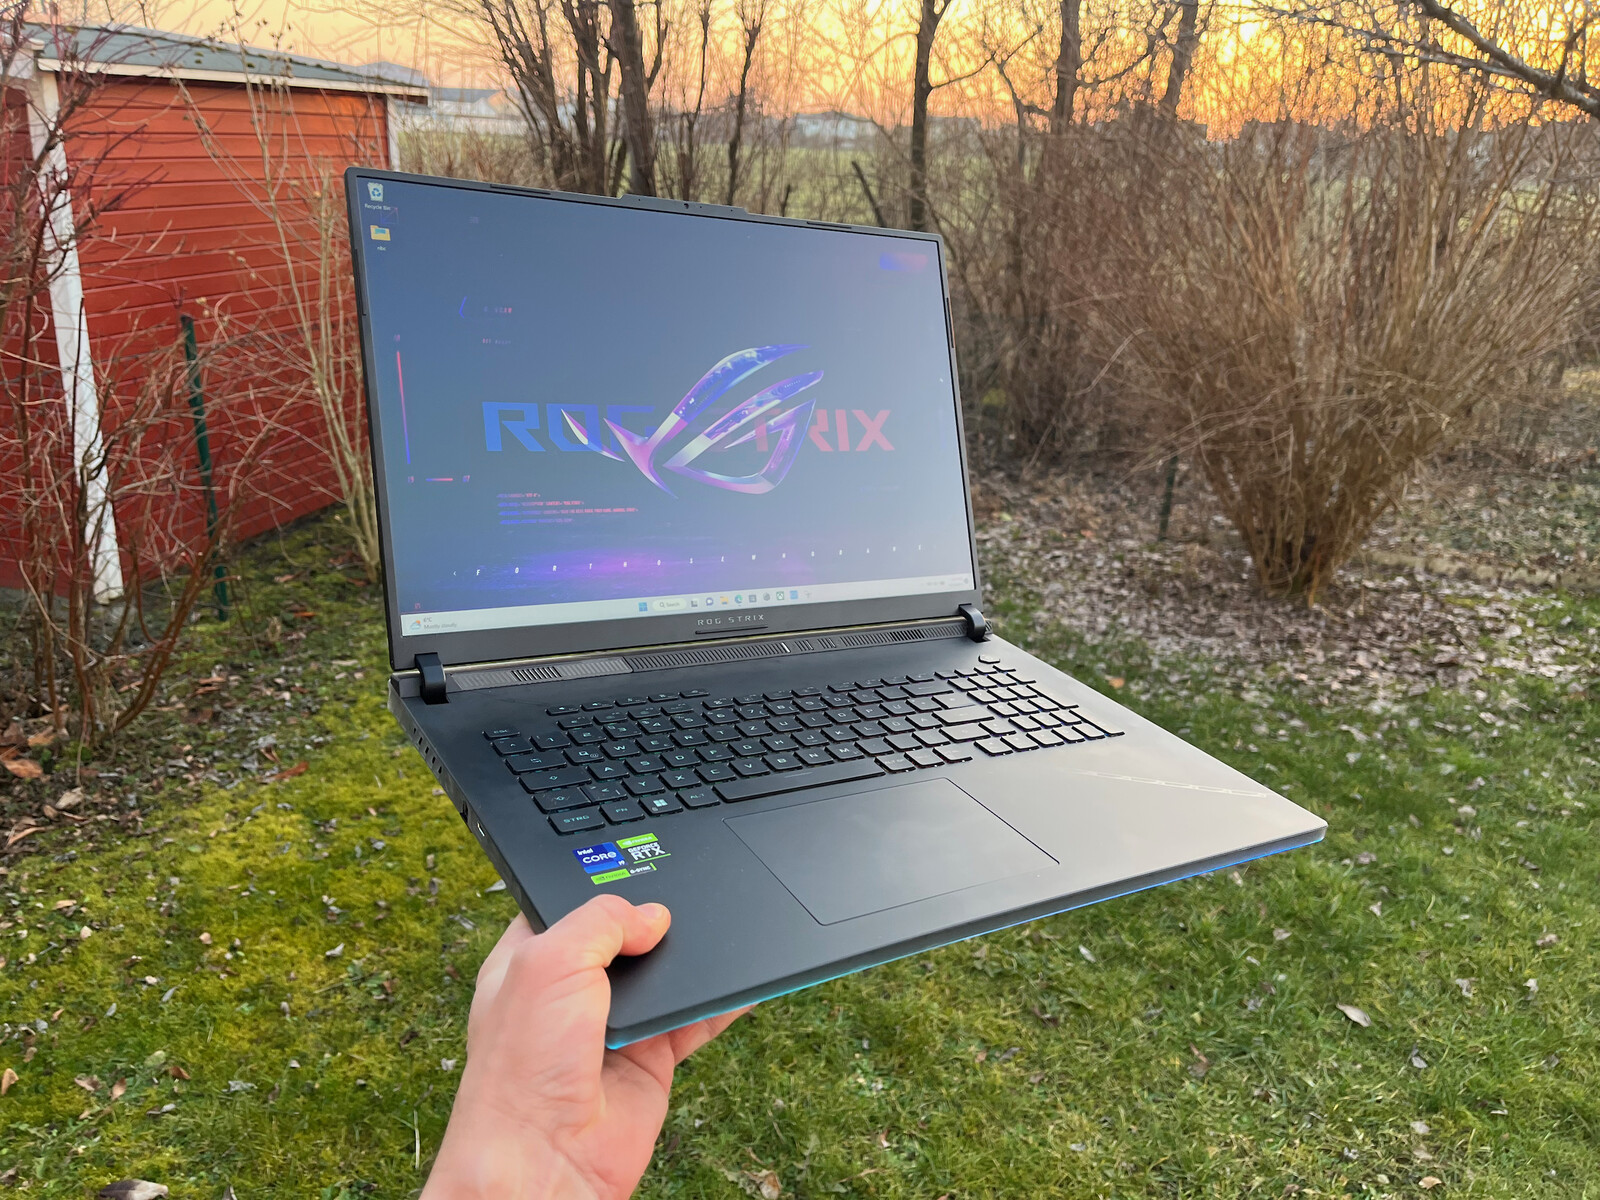
Le boîtier est censé marquer des points grâce à l'utilisation massive de DEL RVB et d'éléments de boîtier transparents. En même temps, le design de base est relativement discret et assez attrayant. Seules les surfaces transparentes sur les côtés semblent un peu bon marché. L'unité de base elle-même est fabriquée en plastique et ne donne pas une impression de haute qualité. Elle se déforme aussi légèrement lorsqu'on la soulève. En revanche, le couvercle de l'écran en aluminium est nettement plus stable et protège suffisamment l'écran.
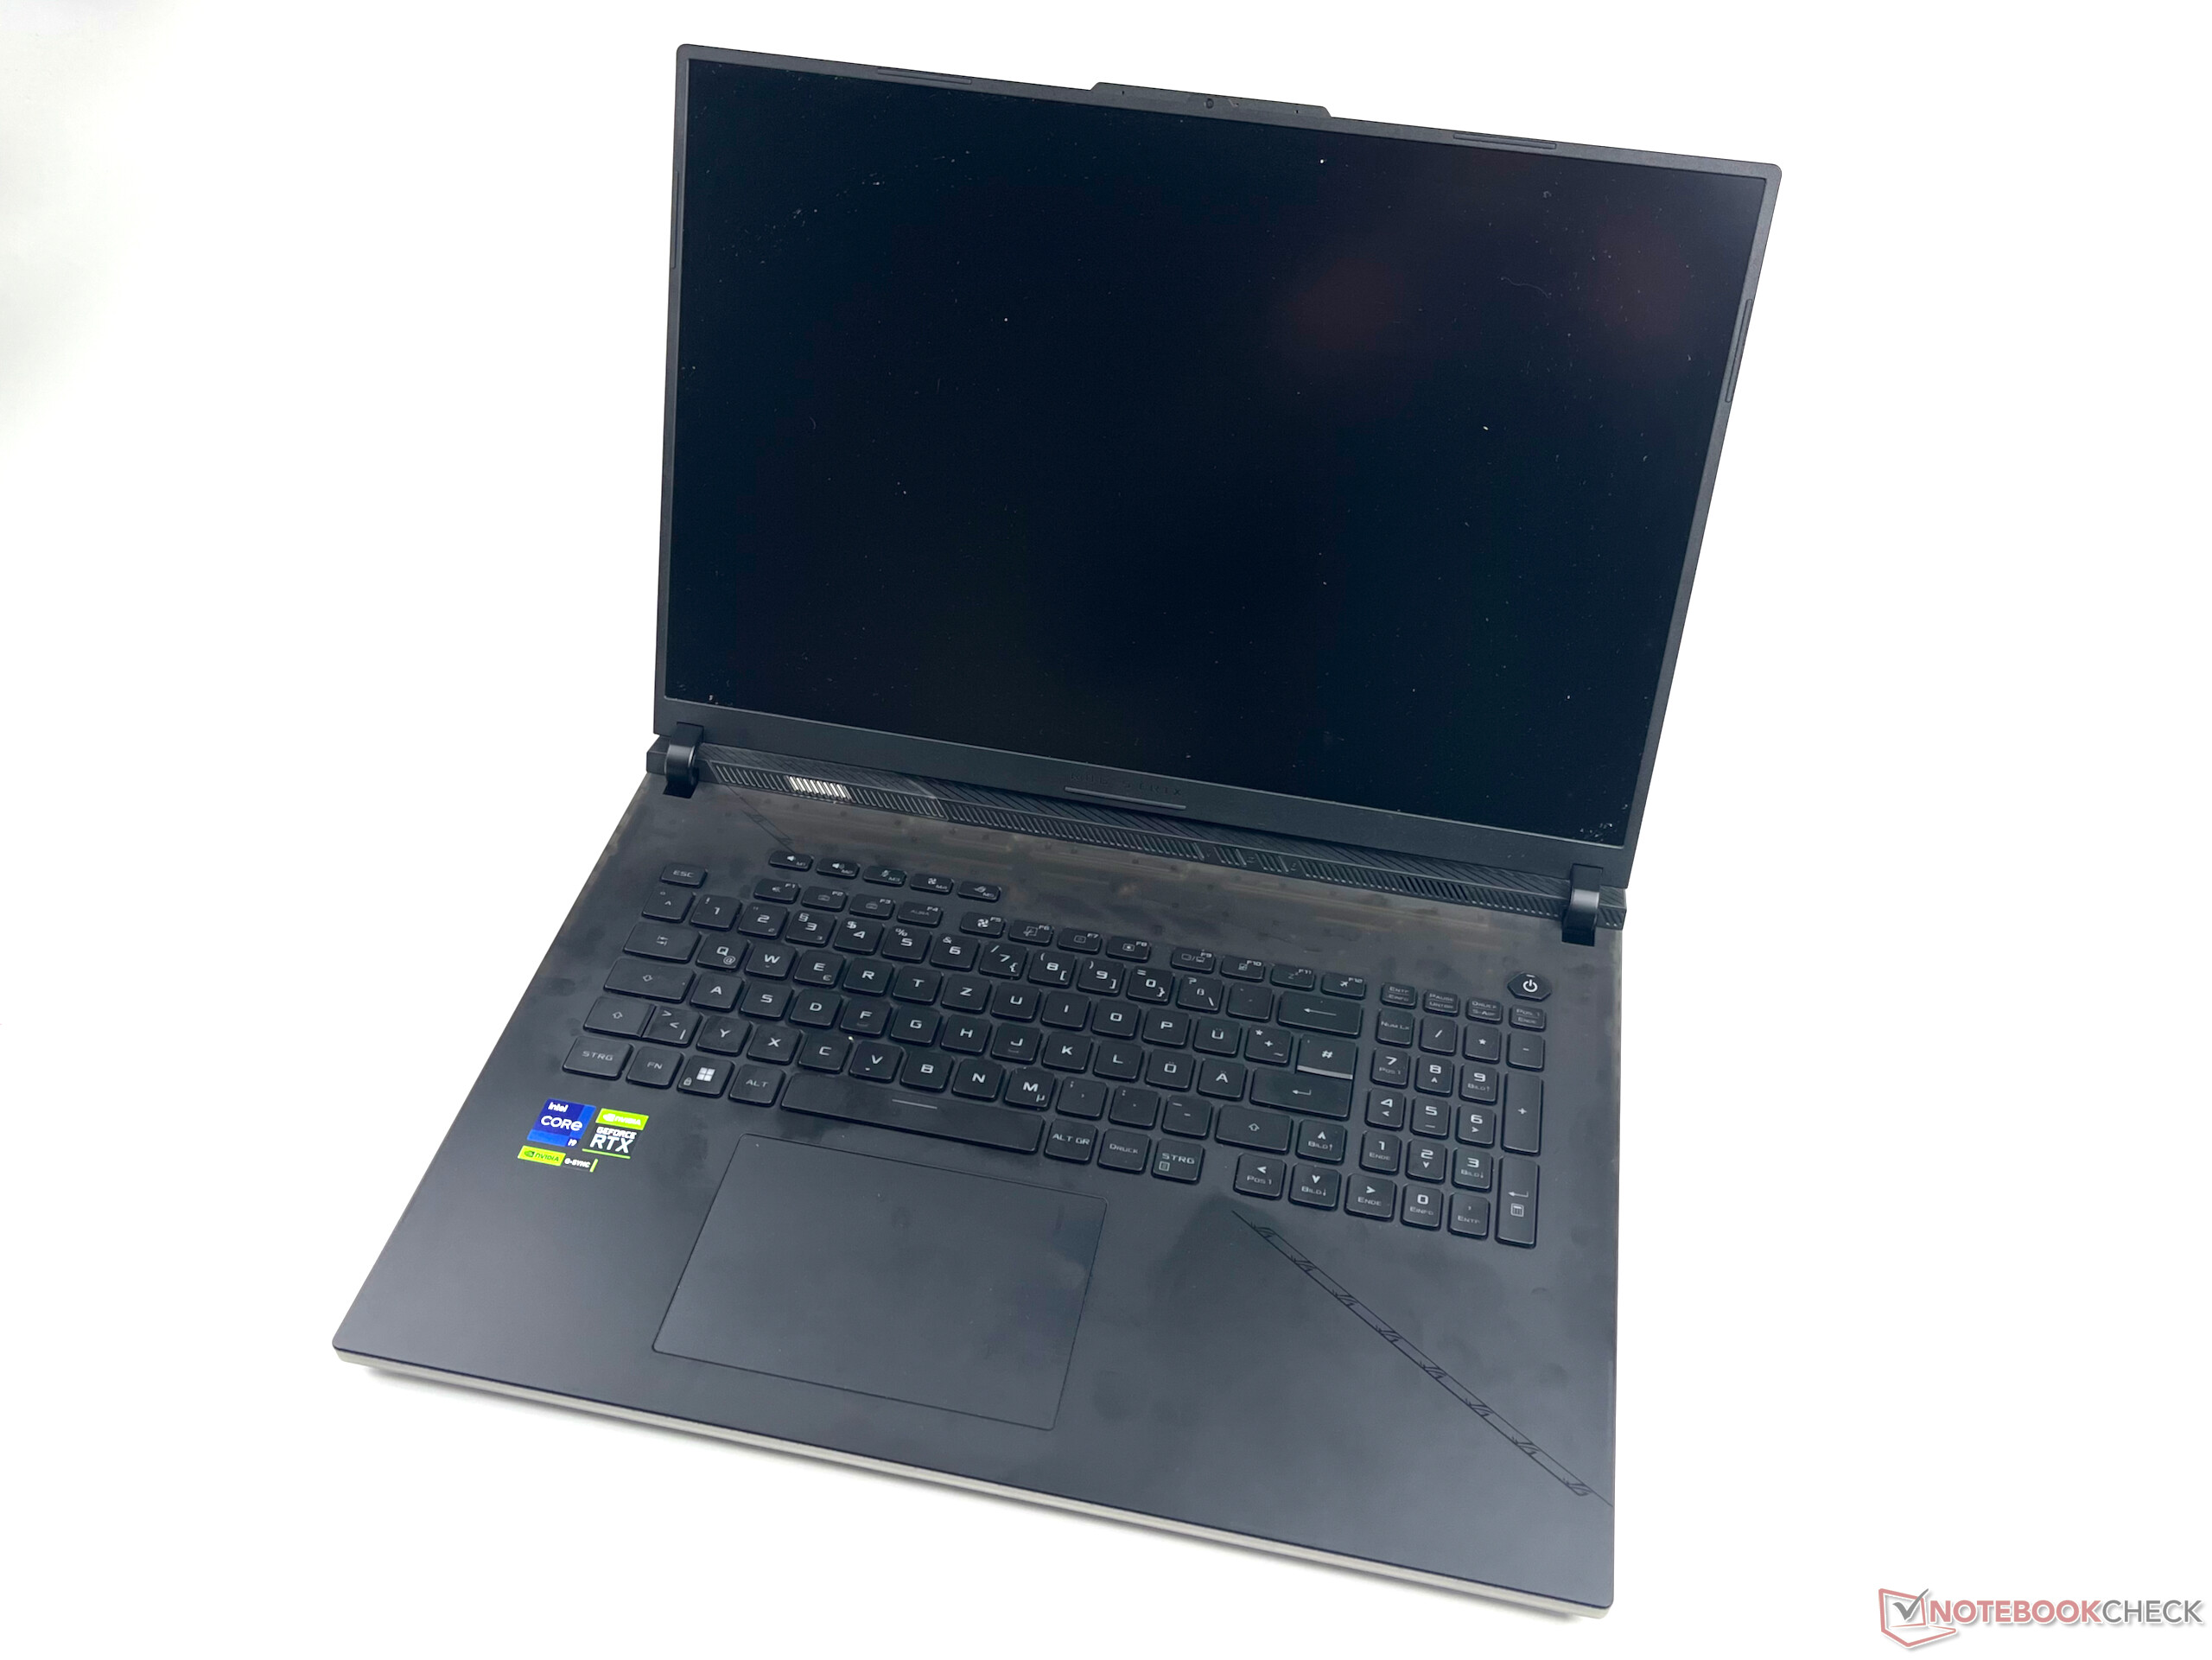
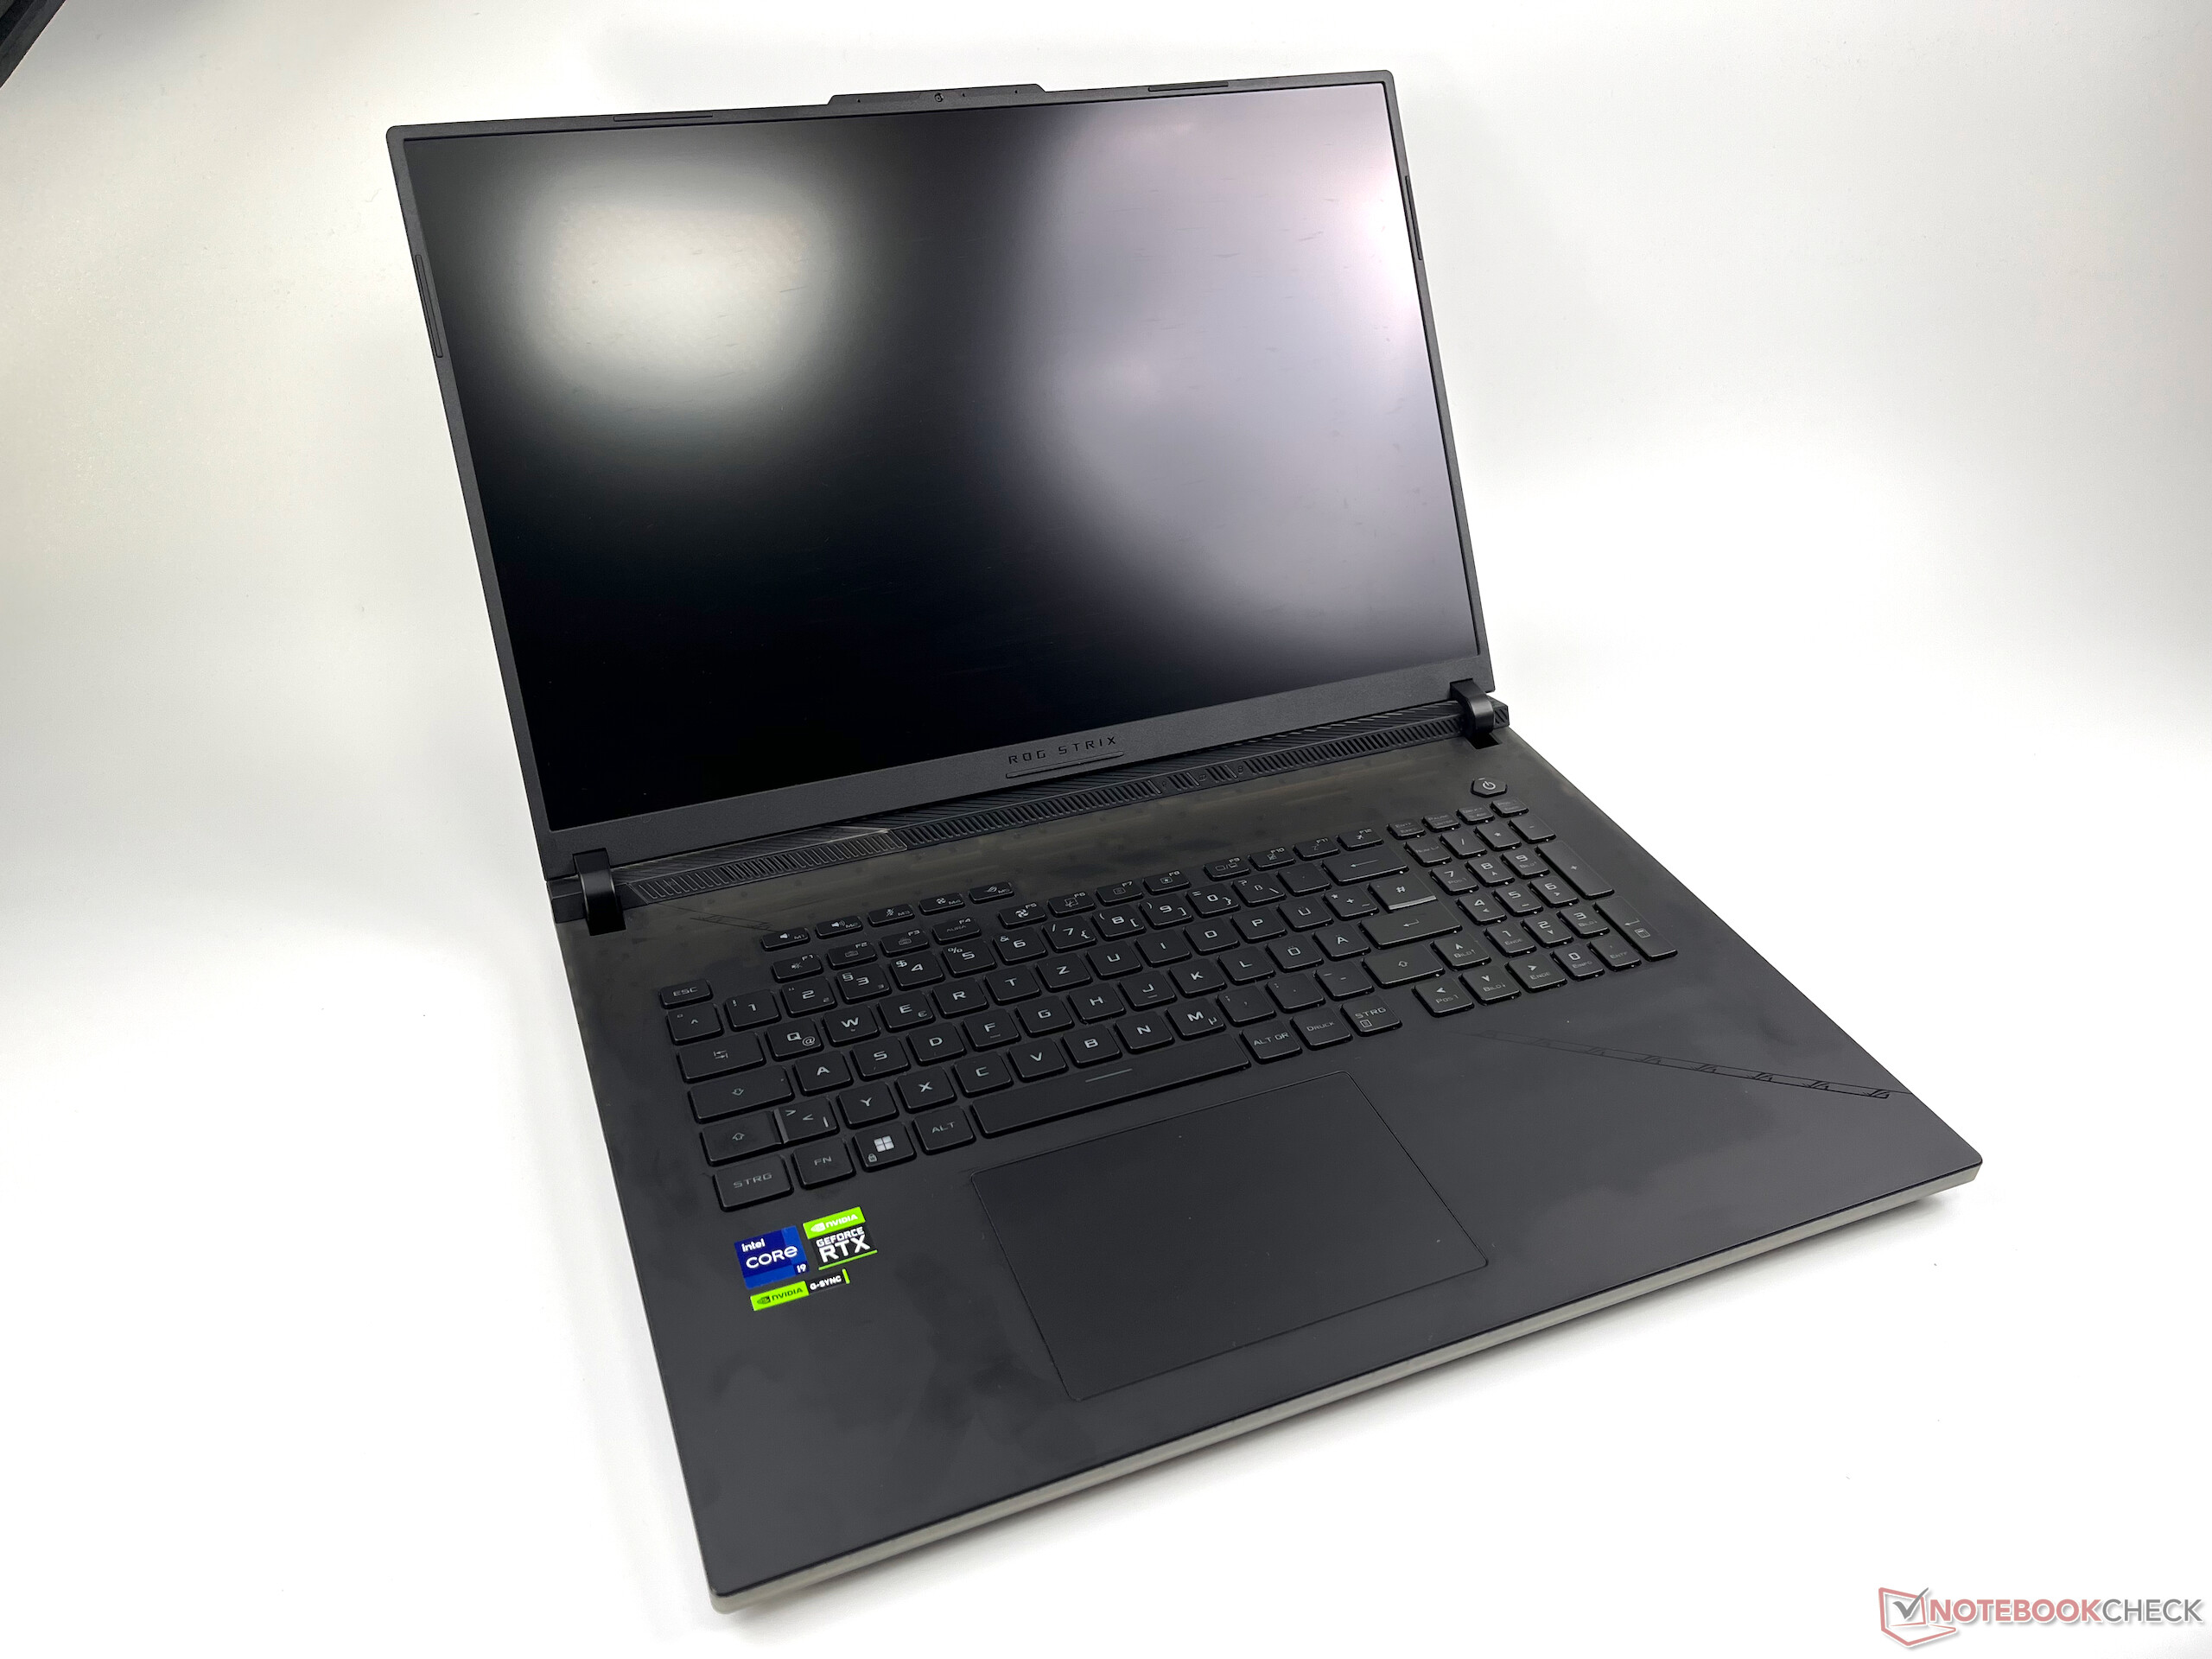

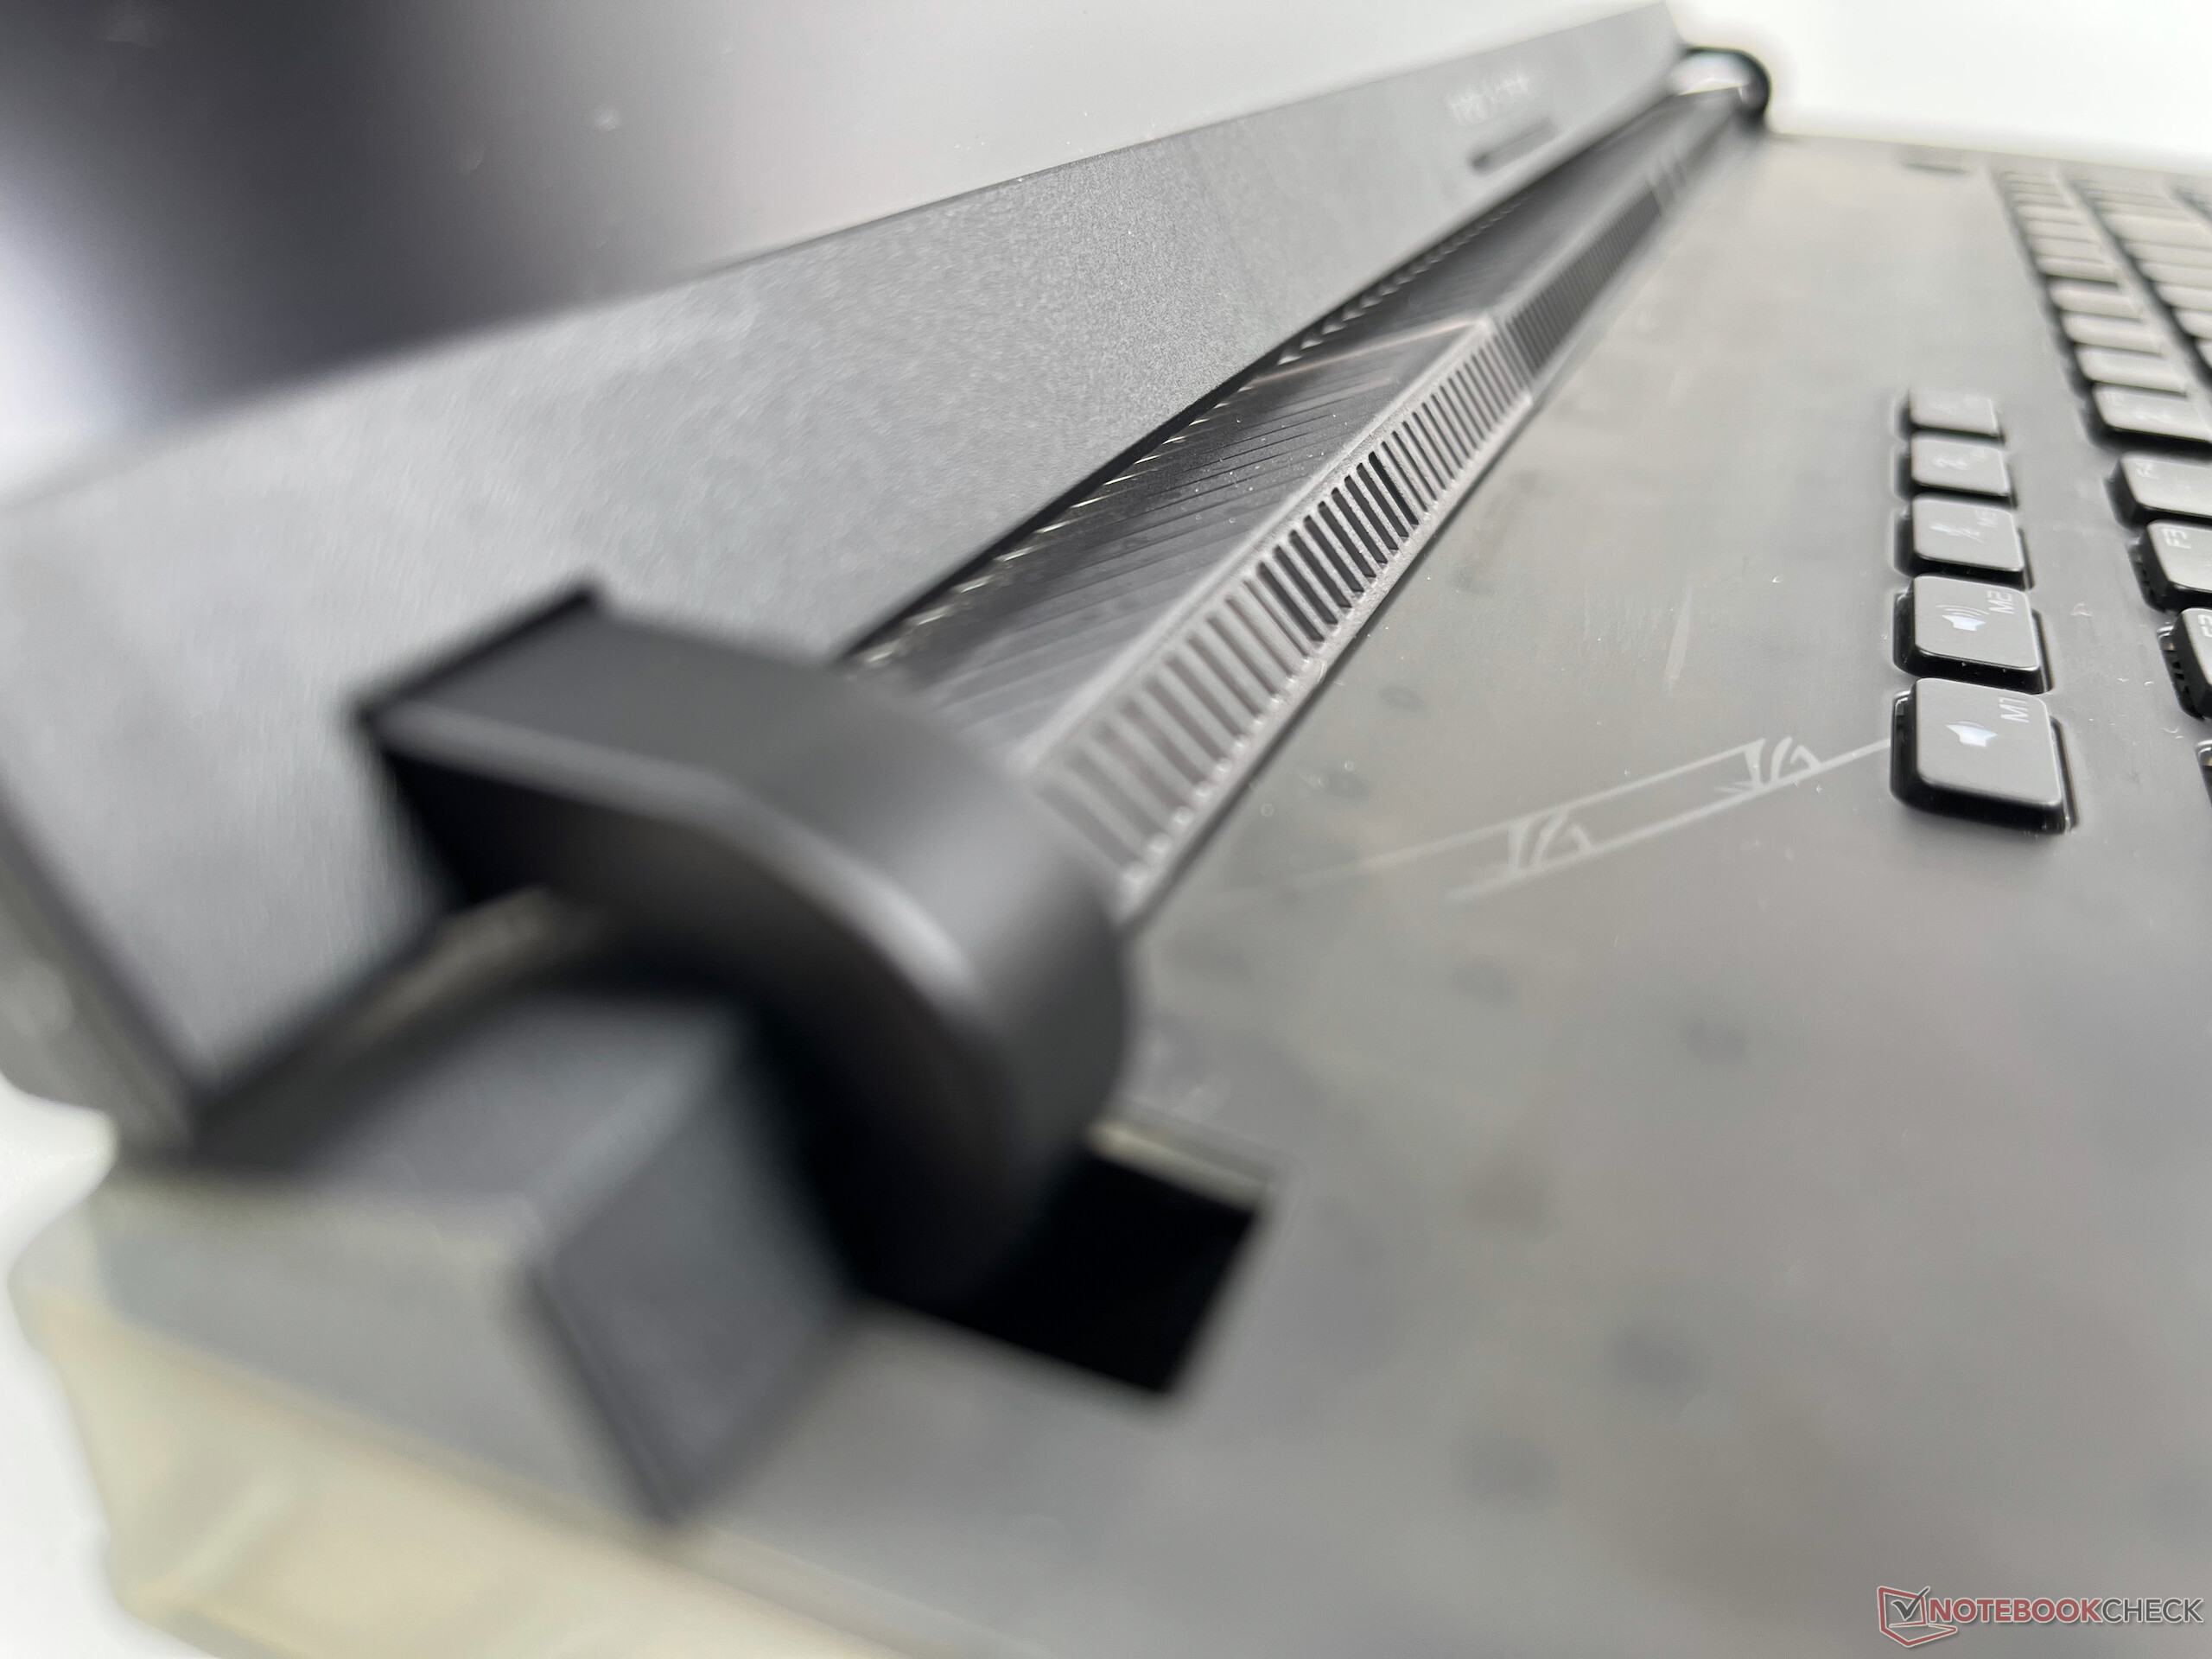
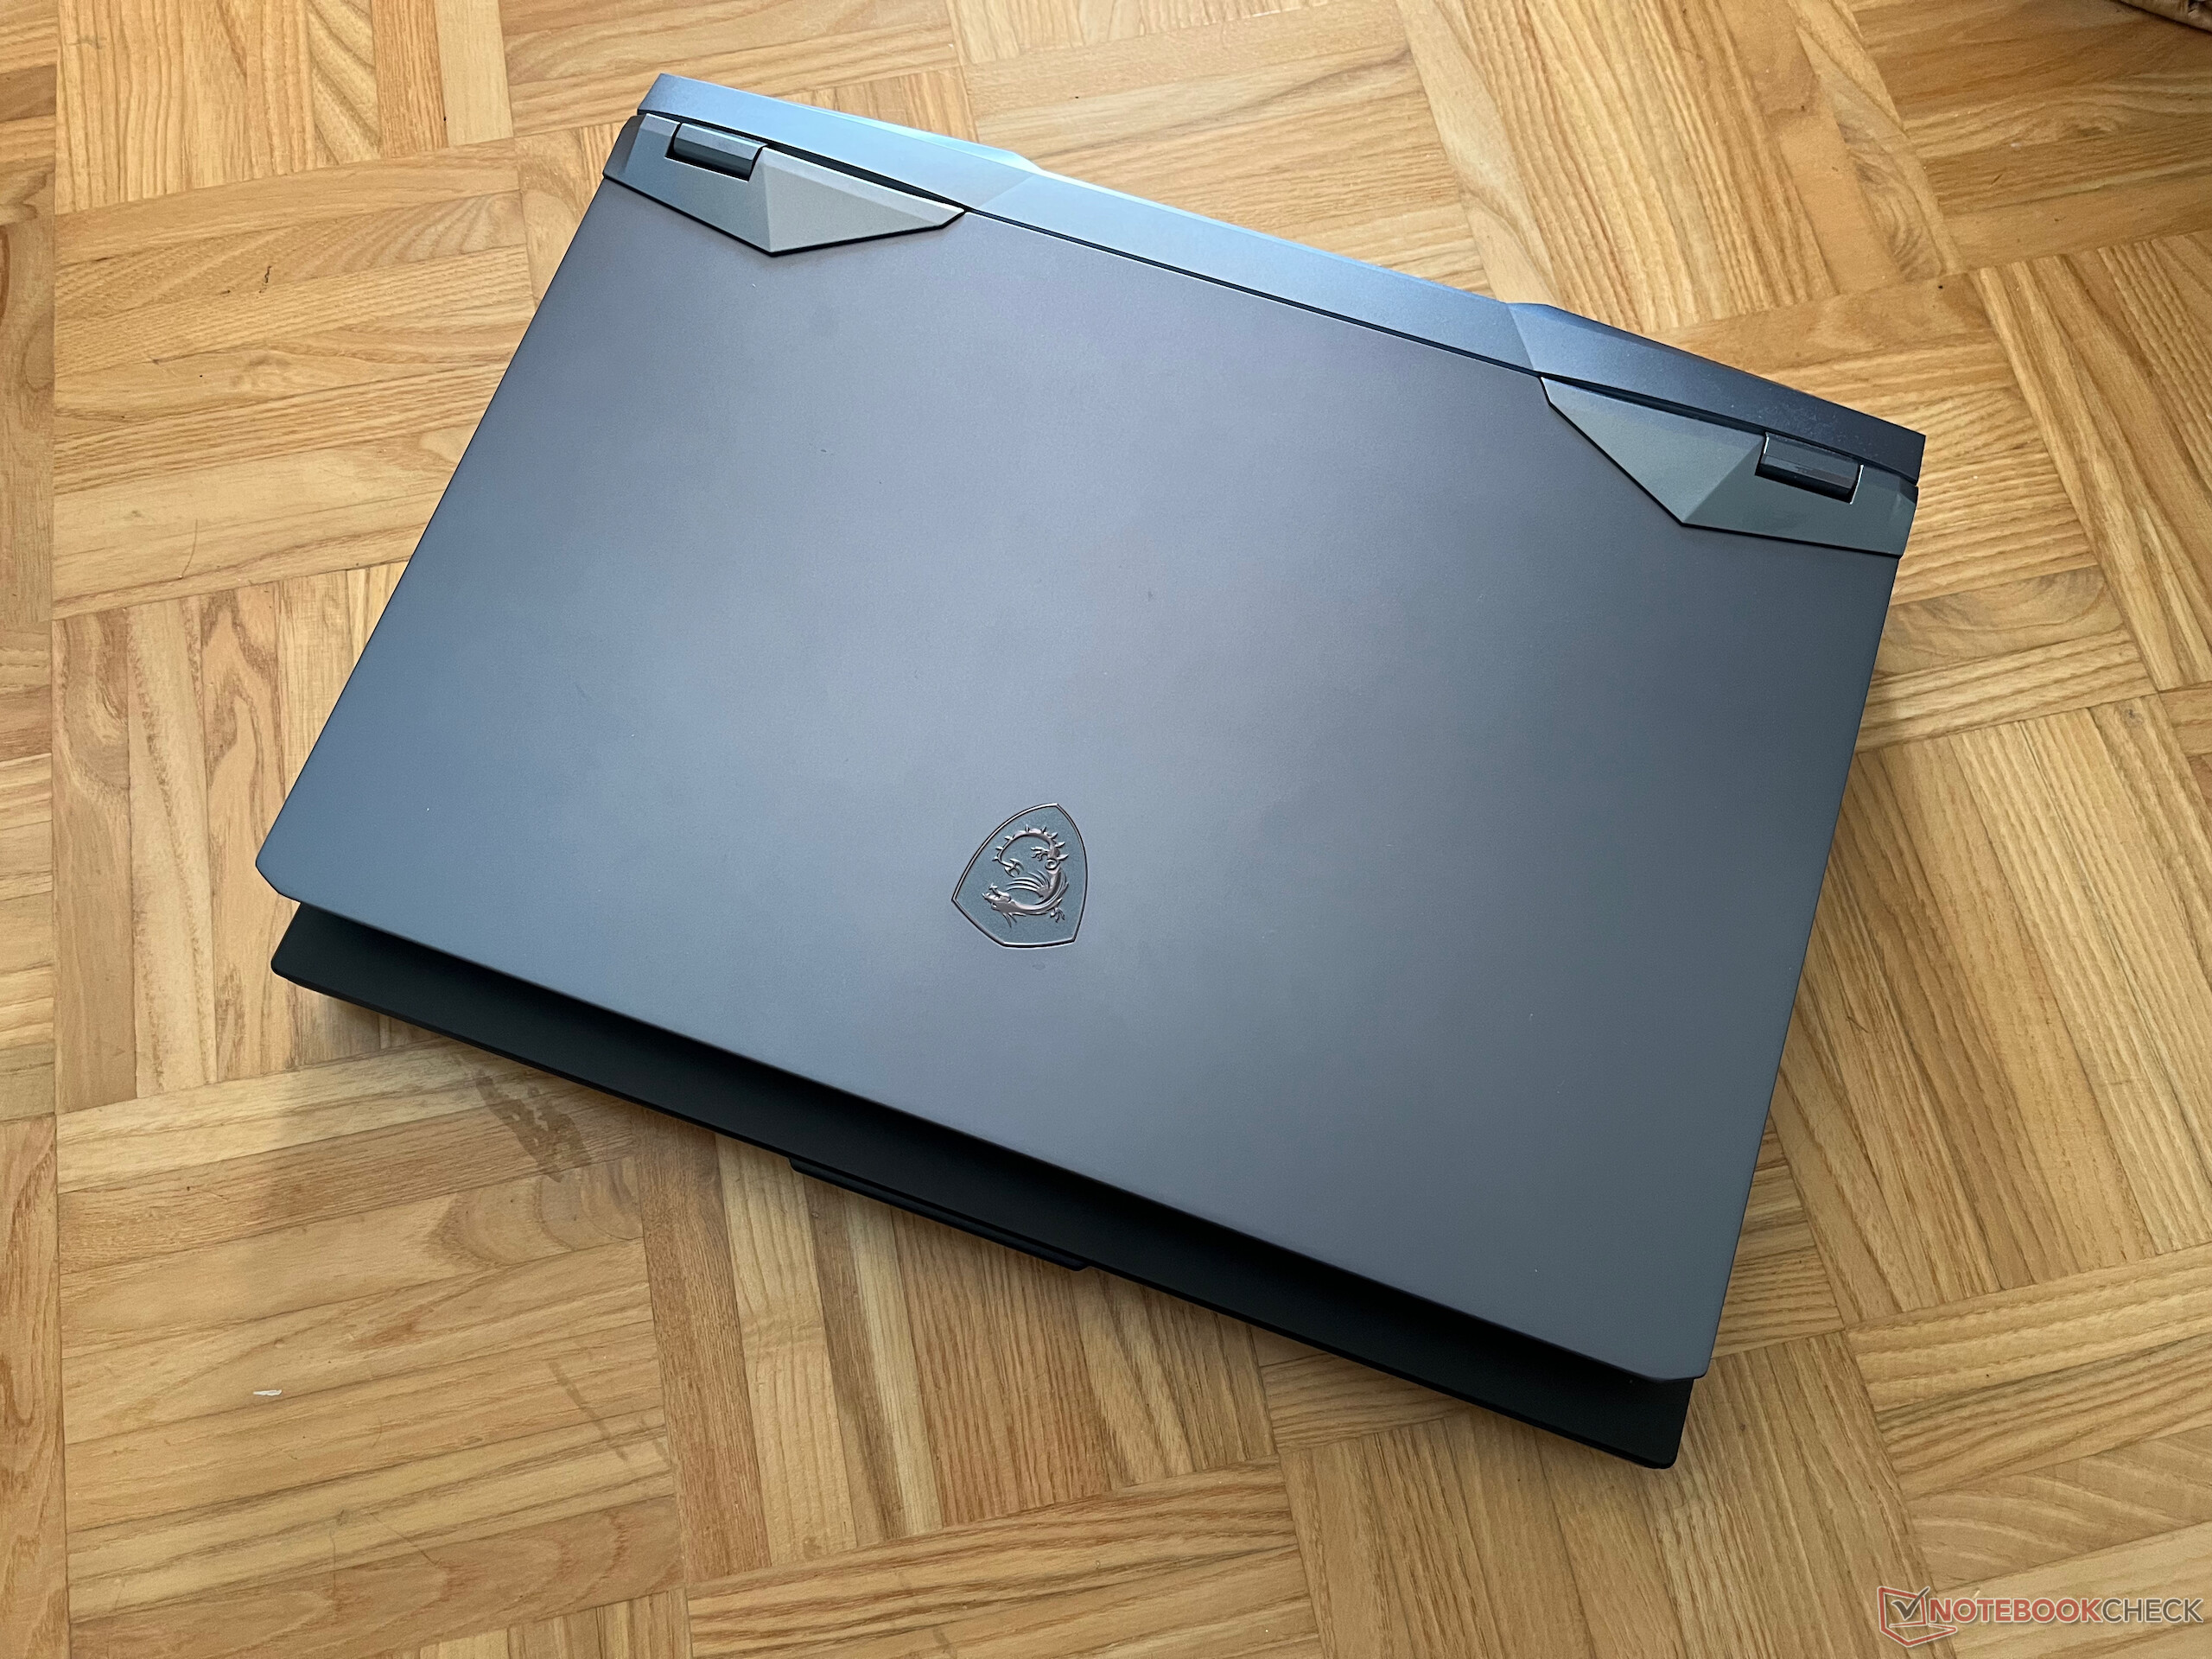
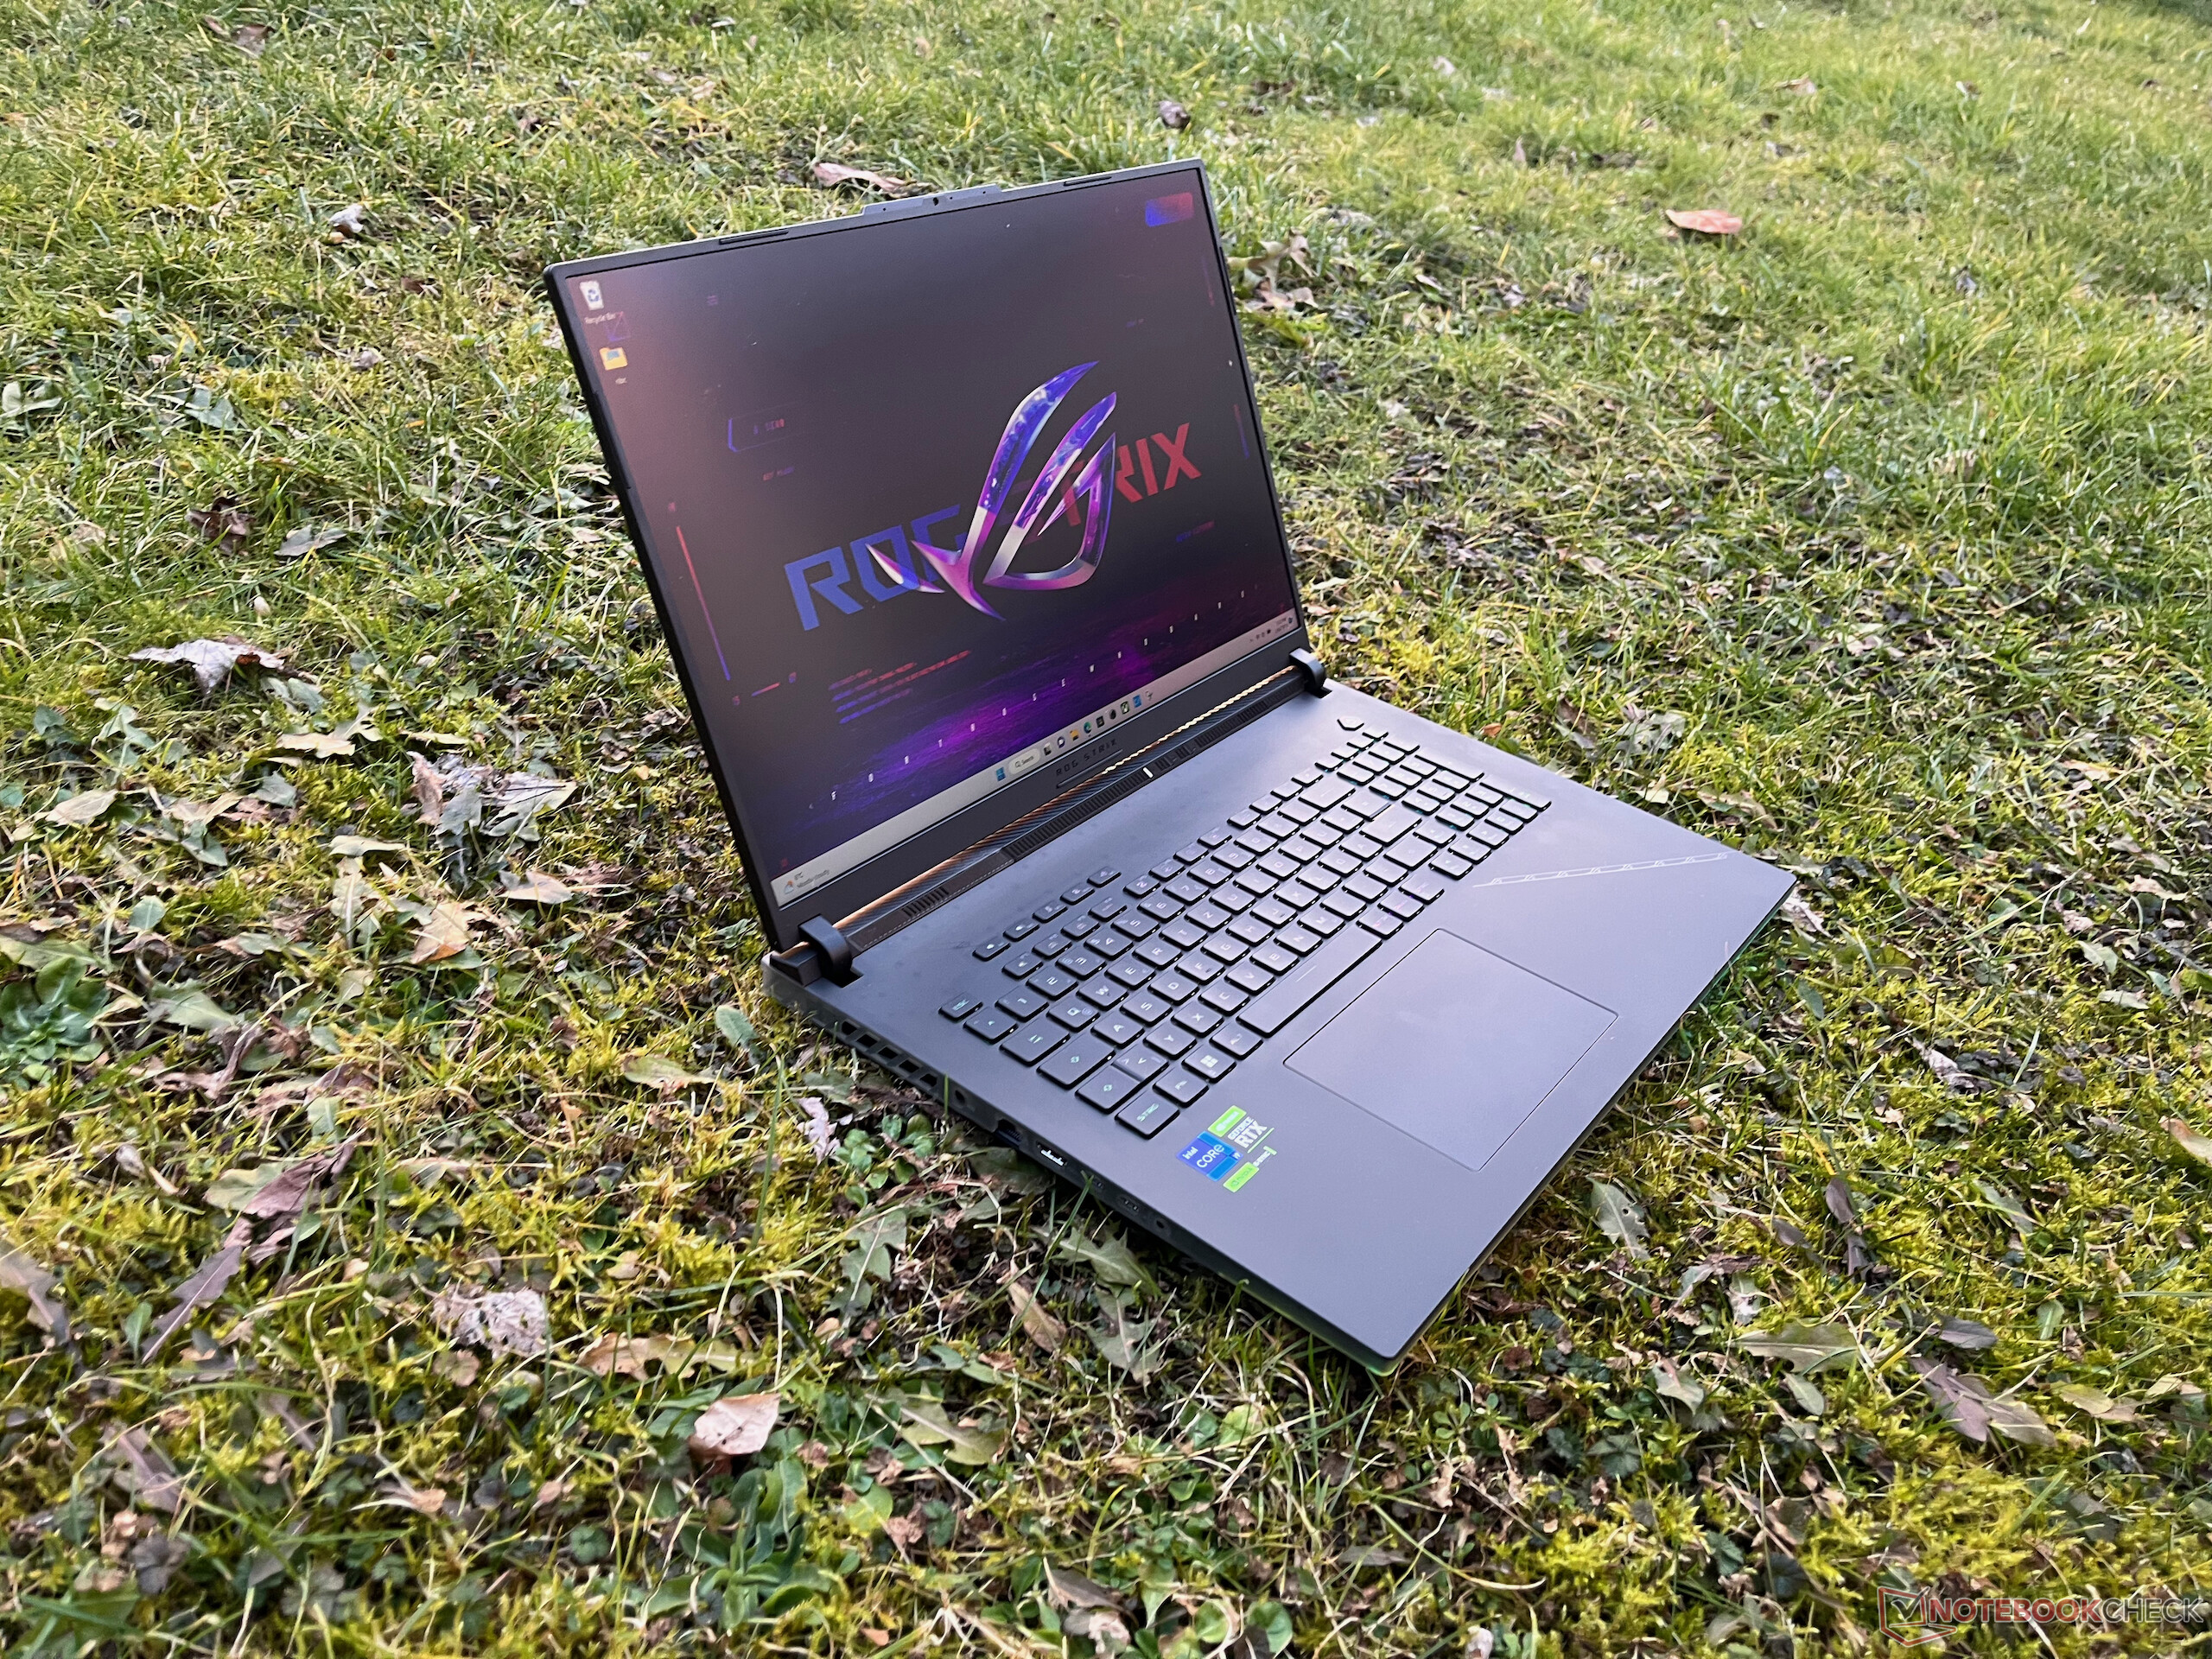
La taille du boîtier est déterminée par l'écran géant de 18 pouces, qui dépasse largement la plupart des ordinateurs portables de 17 pouces. En revanche, l'unité de base n'est pas aussi massive, ce qui fait paraître l'ordinateur portable un peu plus petit qu'il ne l'est en réalité.
Équipement
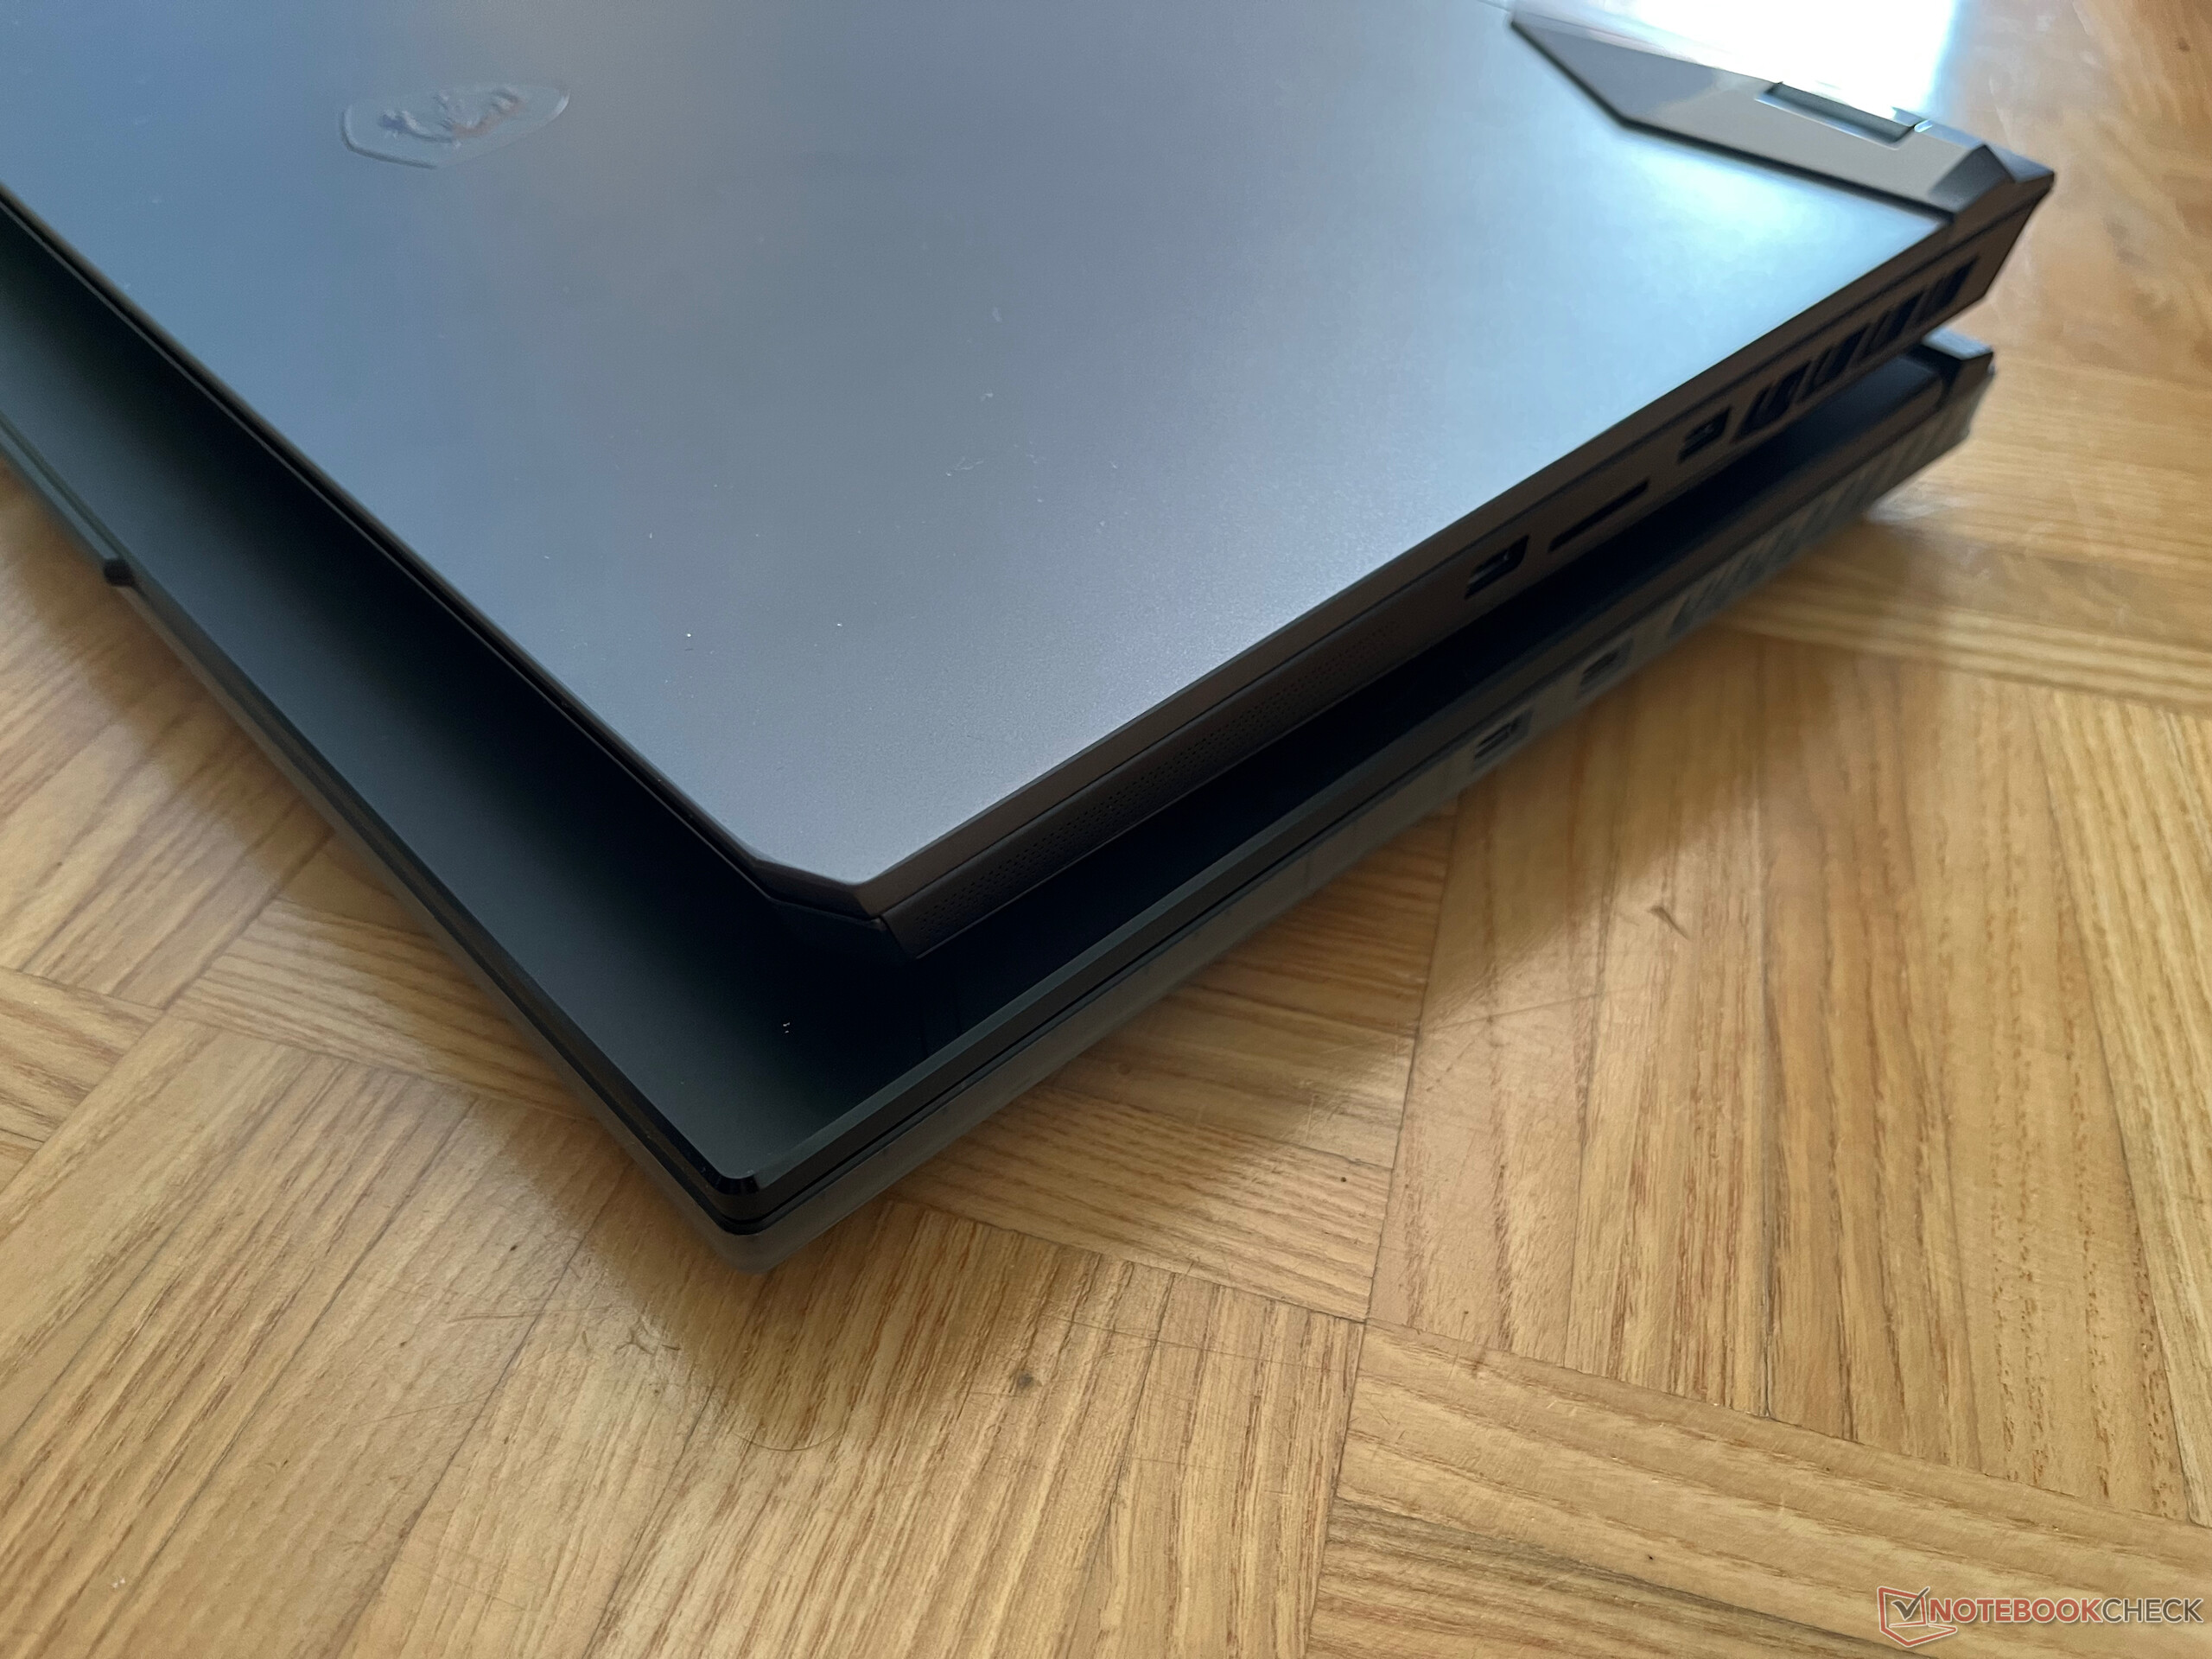
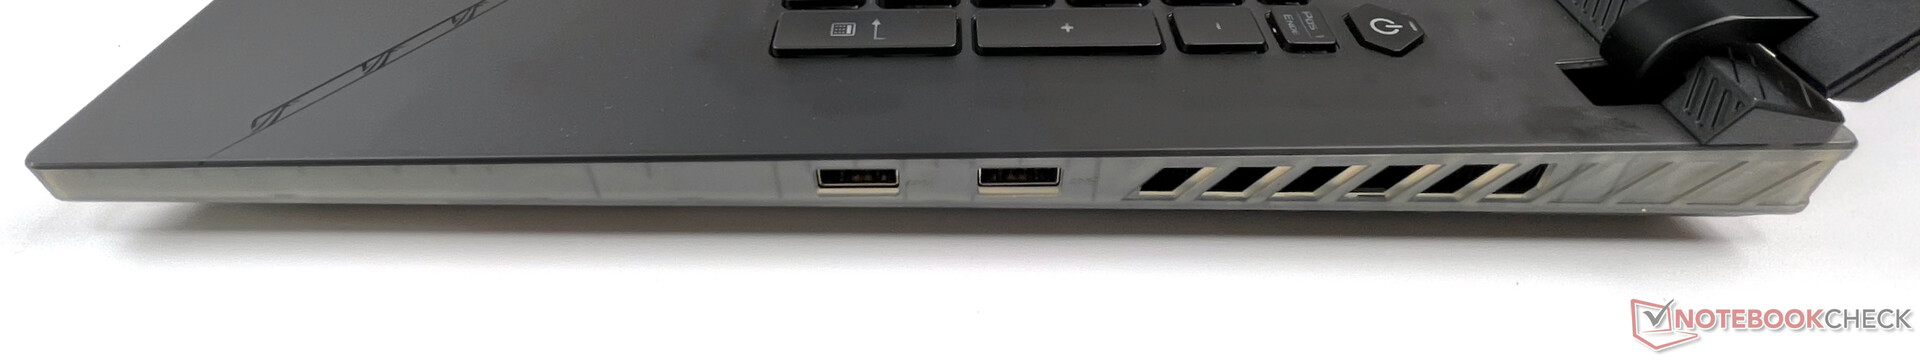
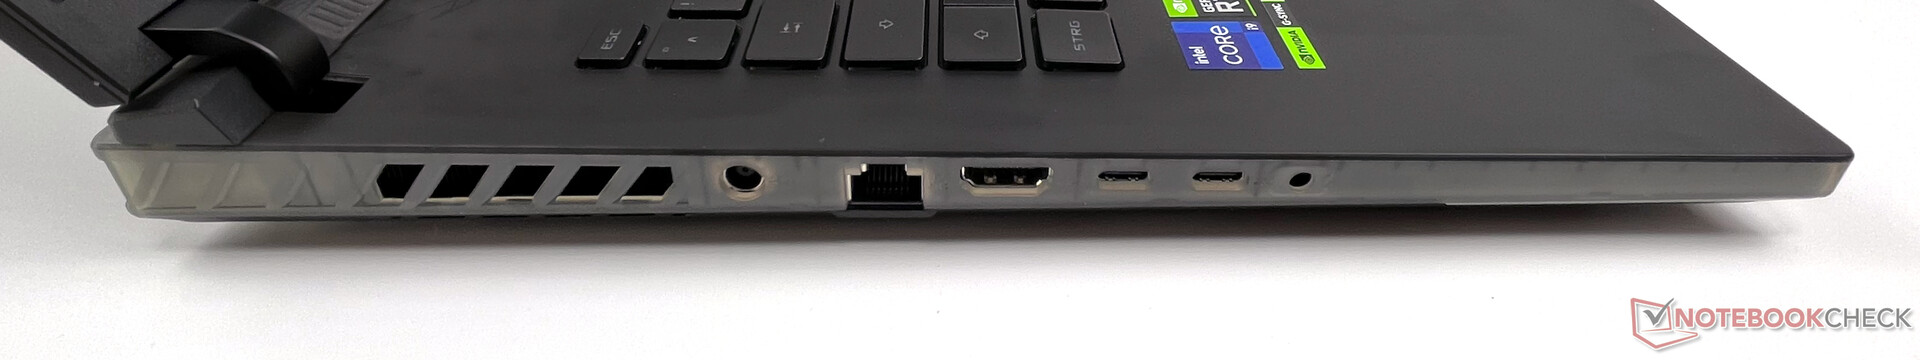
Tous les ports sont situés sur les côtés gauche et droit du boîtier. En outre, les deux connexions USB-A sont placées sur le côté droit, vers le centre, ce qui rend la position des câbles moins qu'idéale pour les utilisateurs de souris droitiers. Pour les gauchers, le câble réseau les gênerait.
Nous avons également quelques reproches à formuler concernant le matériel de connexion. Seul un des deux ports USB-C prend en charge Thunderbolt, et l'autre prend en charge Power Delivery avec certaines limitations. Dans notre test, le chargeur MacBook Air M1 a pu charger l'ordinateur portable à 30 watts, mais sans la notification dans Windows. L'Anker Nano 2 de 45 watts n'a pas du tout chargé l'ordinateur portable. Du côté positif, nous voulons également mentionner la connexion réseau de 2,5 Gbit.
Communication
En termes d'options de communication, Asus propose une carte rapide Intel Wi-Fi 6E AX211 au format M.2 pour les connexions sans fil et une puce Realtek RTL8125 pour les connexions LAN filaires à 2,5 Gbit. Les deux ont fonctionné sans aucune perturbation dans notre test, mais la carte AX211 n'a pas trouvé le réseau 6-GHz de notre routeur Asus ROG Rapture GT-AX11000. Malheureusement, le Wi-Fi 6E est toujours aussi aléatoire dans notre test lorsqu'il s'agit de trouver le réseau.
En revanche, les débits de données dans le réseau Wi-Fi 6 sont excellents et sans aucune chute.
Webcam
La webcam HD 720p intégrée ne répond malheureusement qu'aux exigences les plus basses en matière de vidéotéléphonie. De bonnes conditions de lumière sont importantes ici, car les résultats que nous obtenons avec un rétroéclairage ou dans l'obscurité sont difficilement exploitables.


")
")
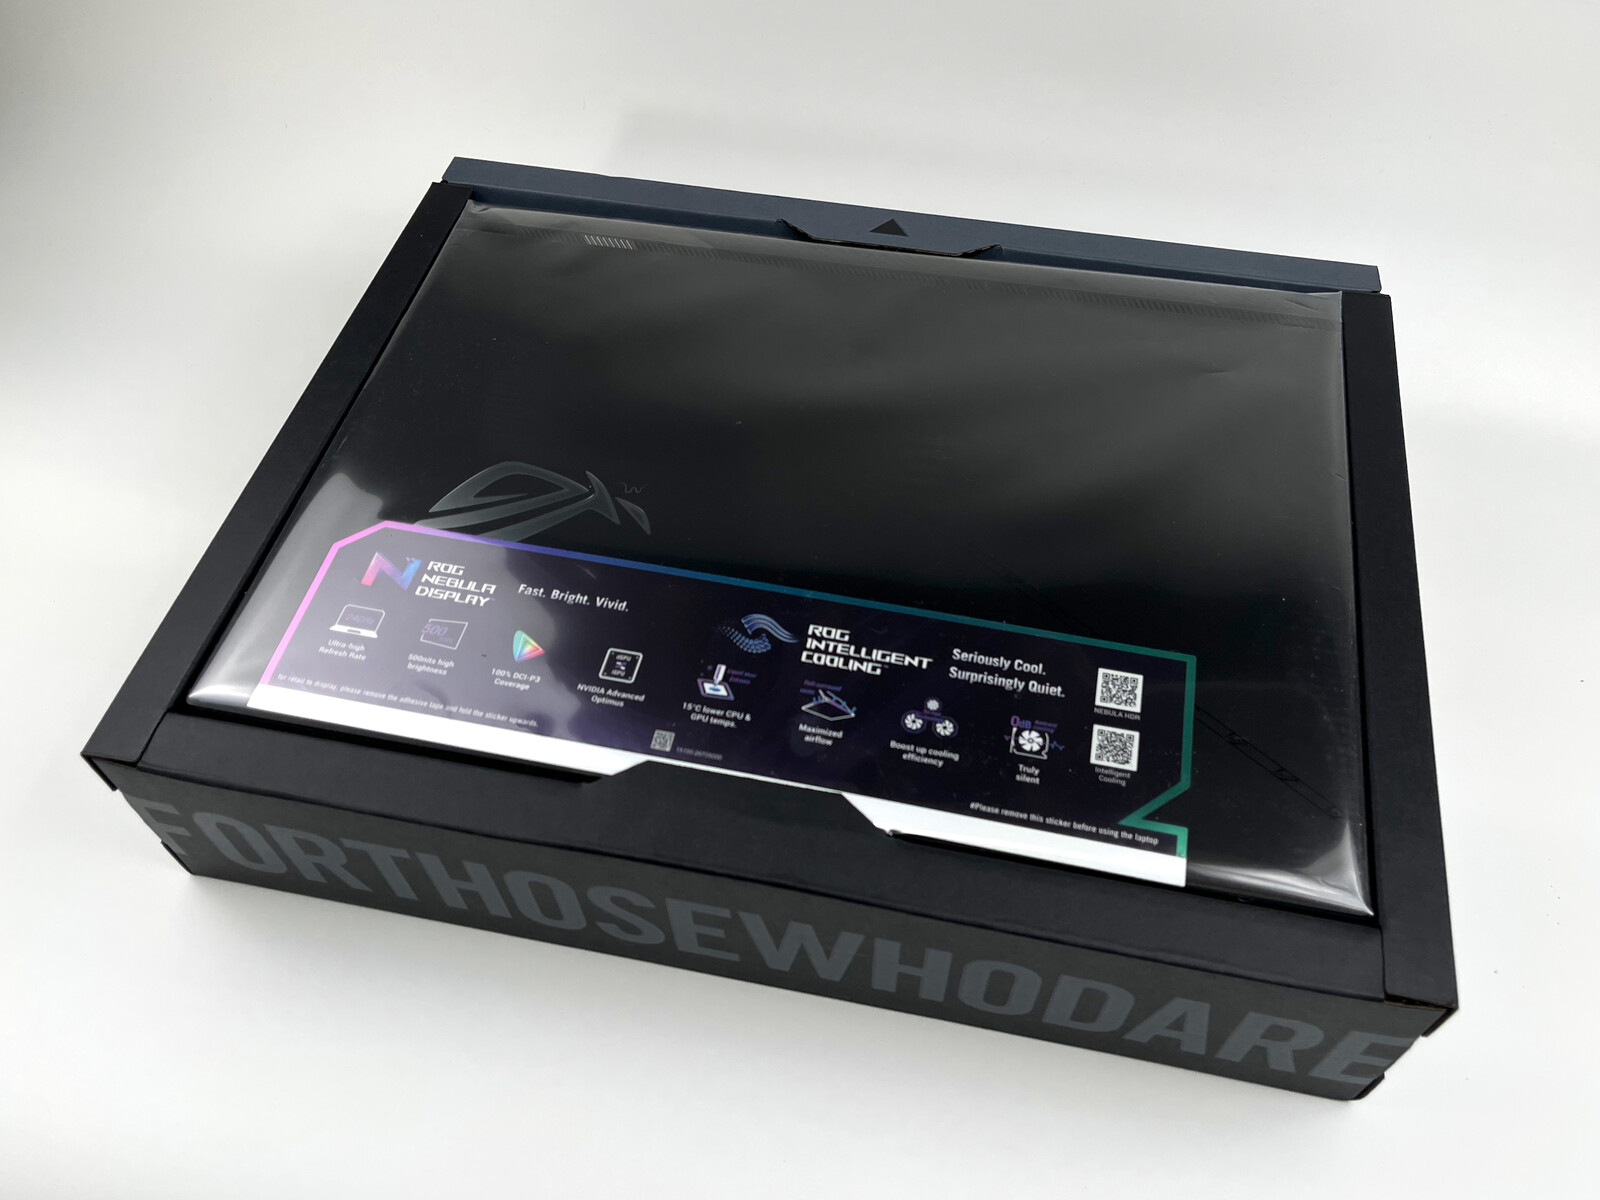
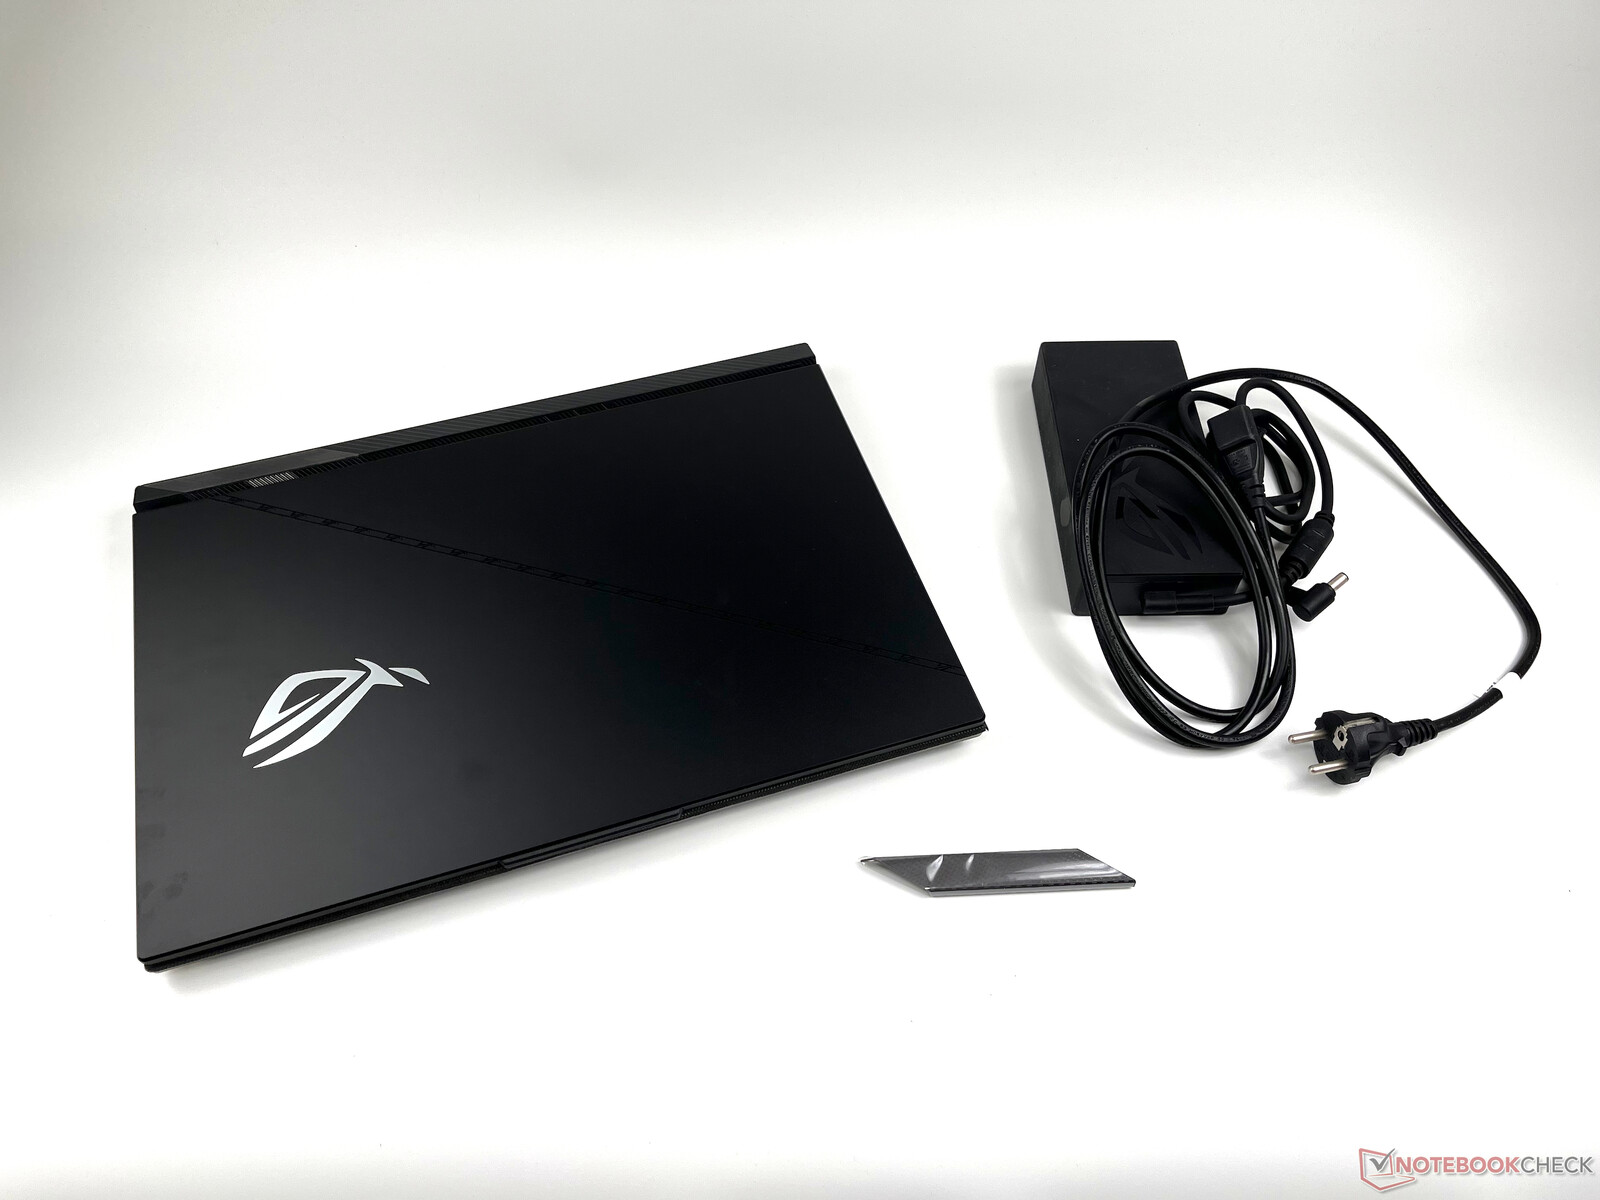
Accessoires
La boîte ne comprend qu'un "Armor Cap" supplémentaire, qui peut être remplacé sur la gauche, sous l'écran. Le capuchon est fixé magnétiquement et pourrait être destiné à vous donner une option pour personnaliser l'appareil.
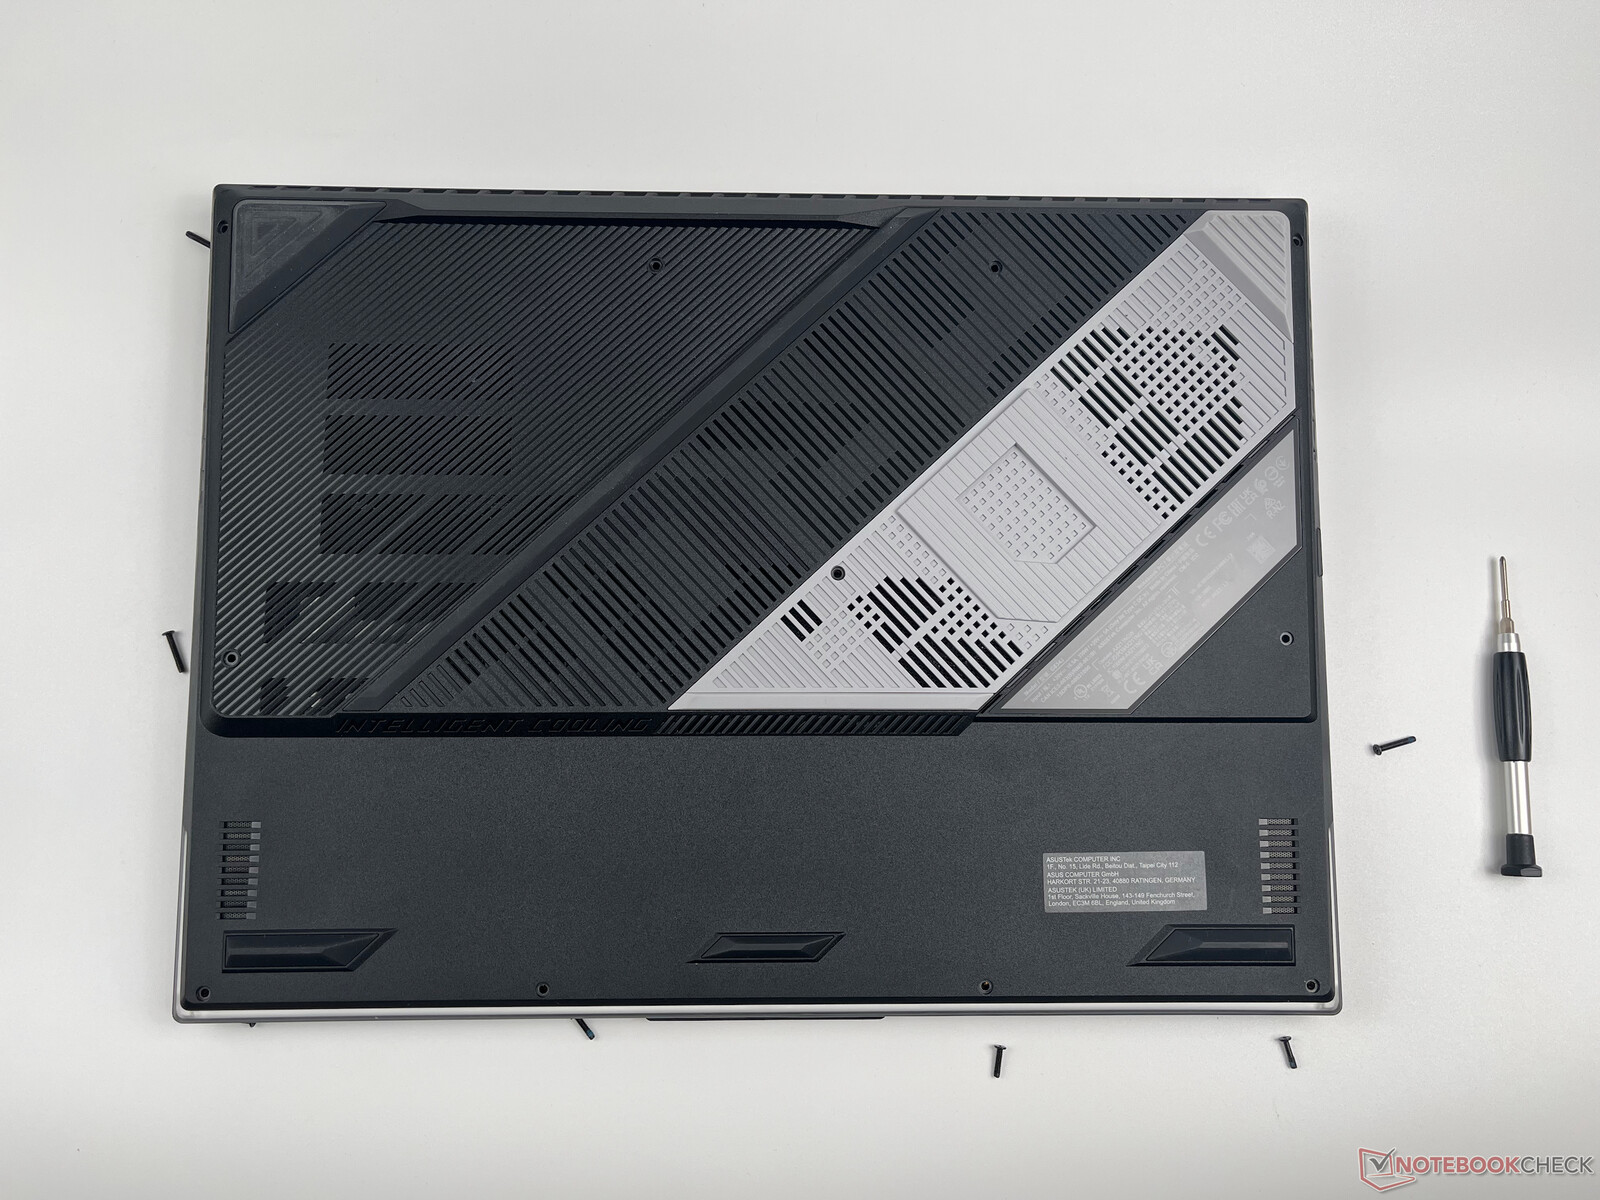
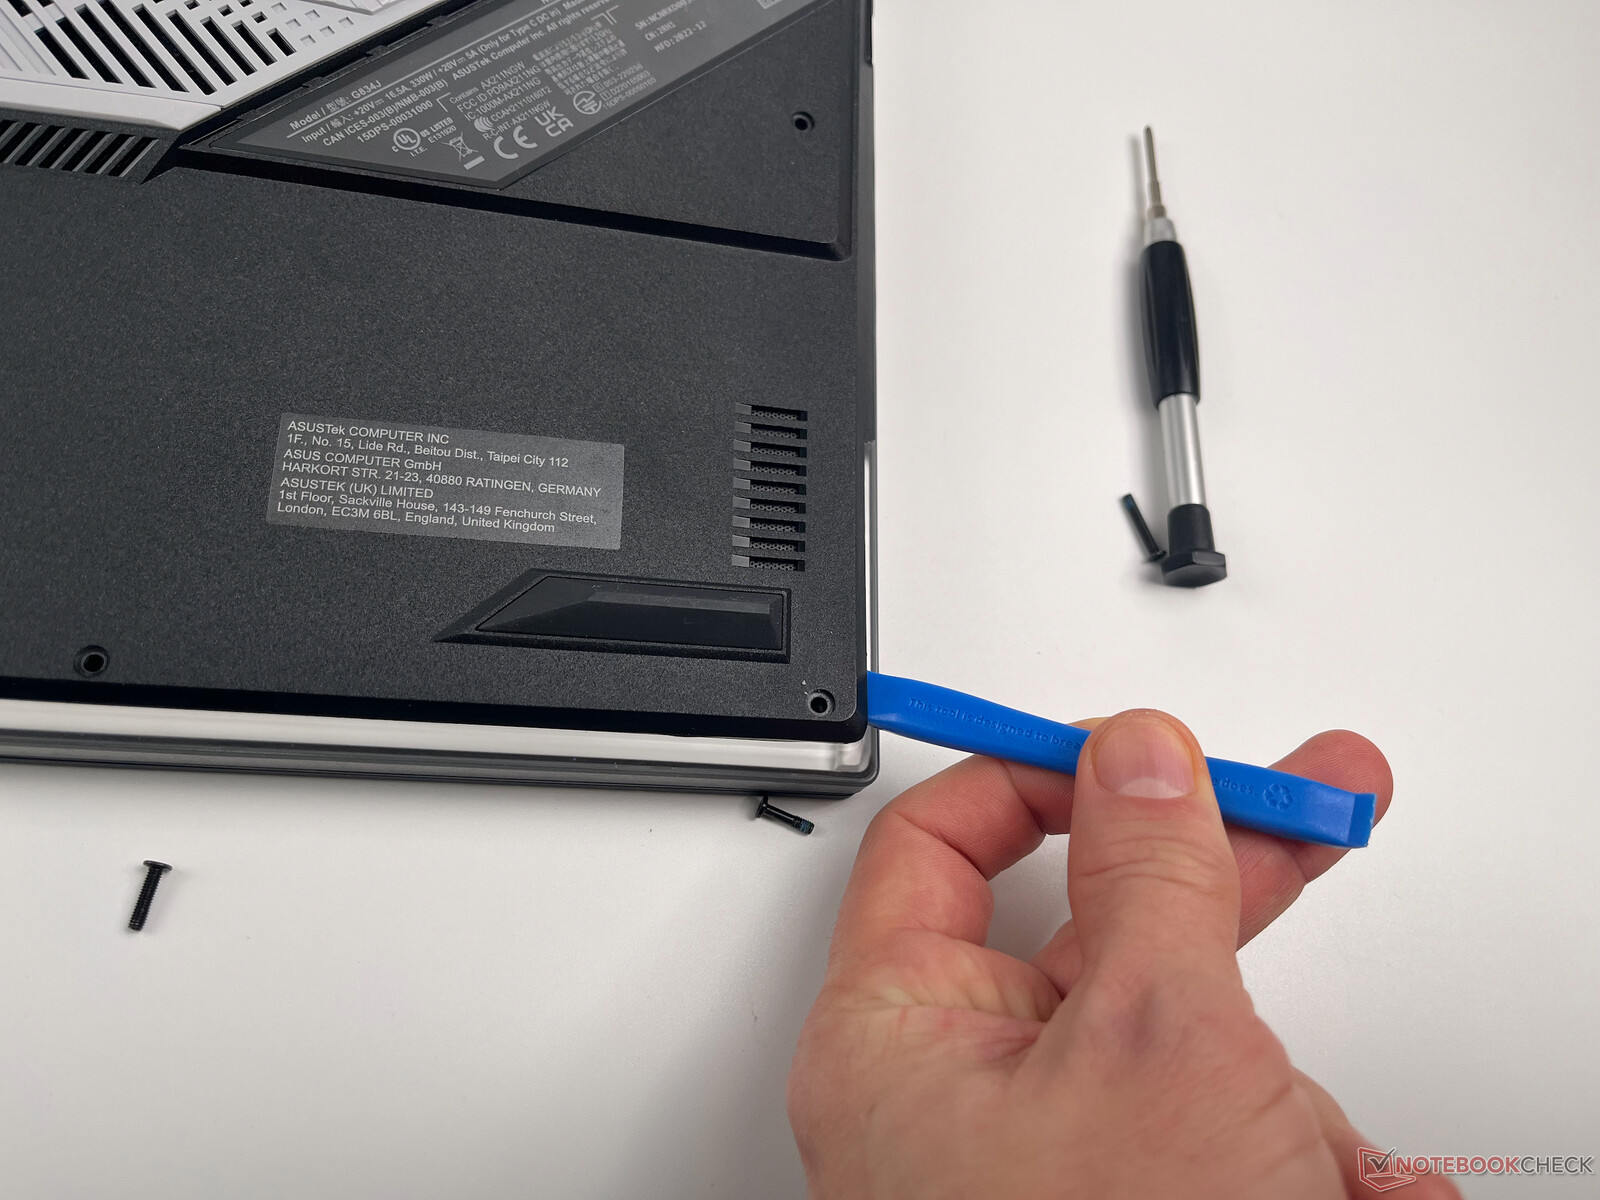
Maintenance
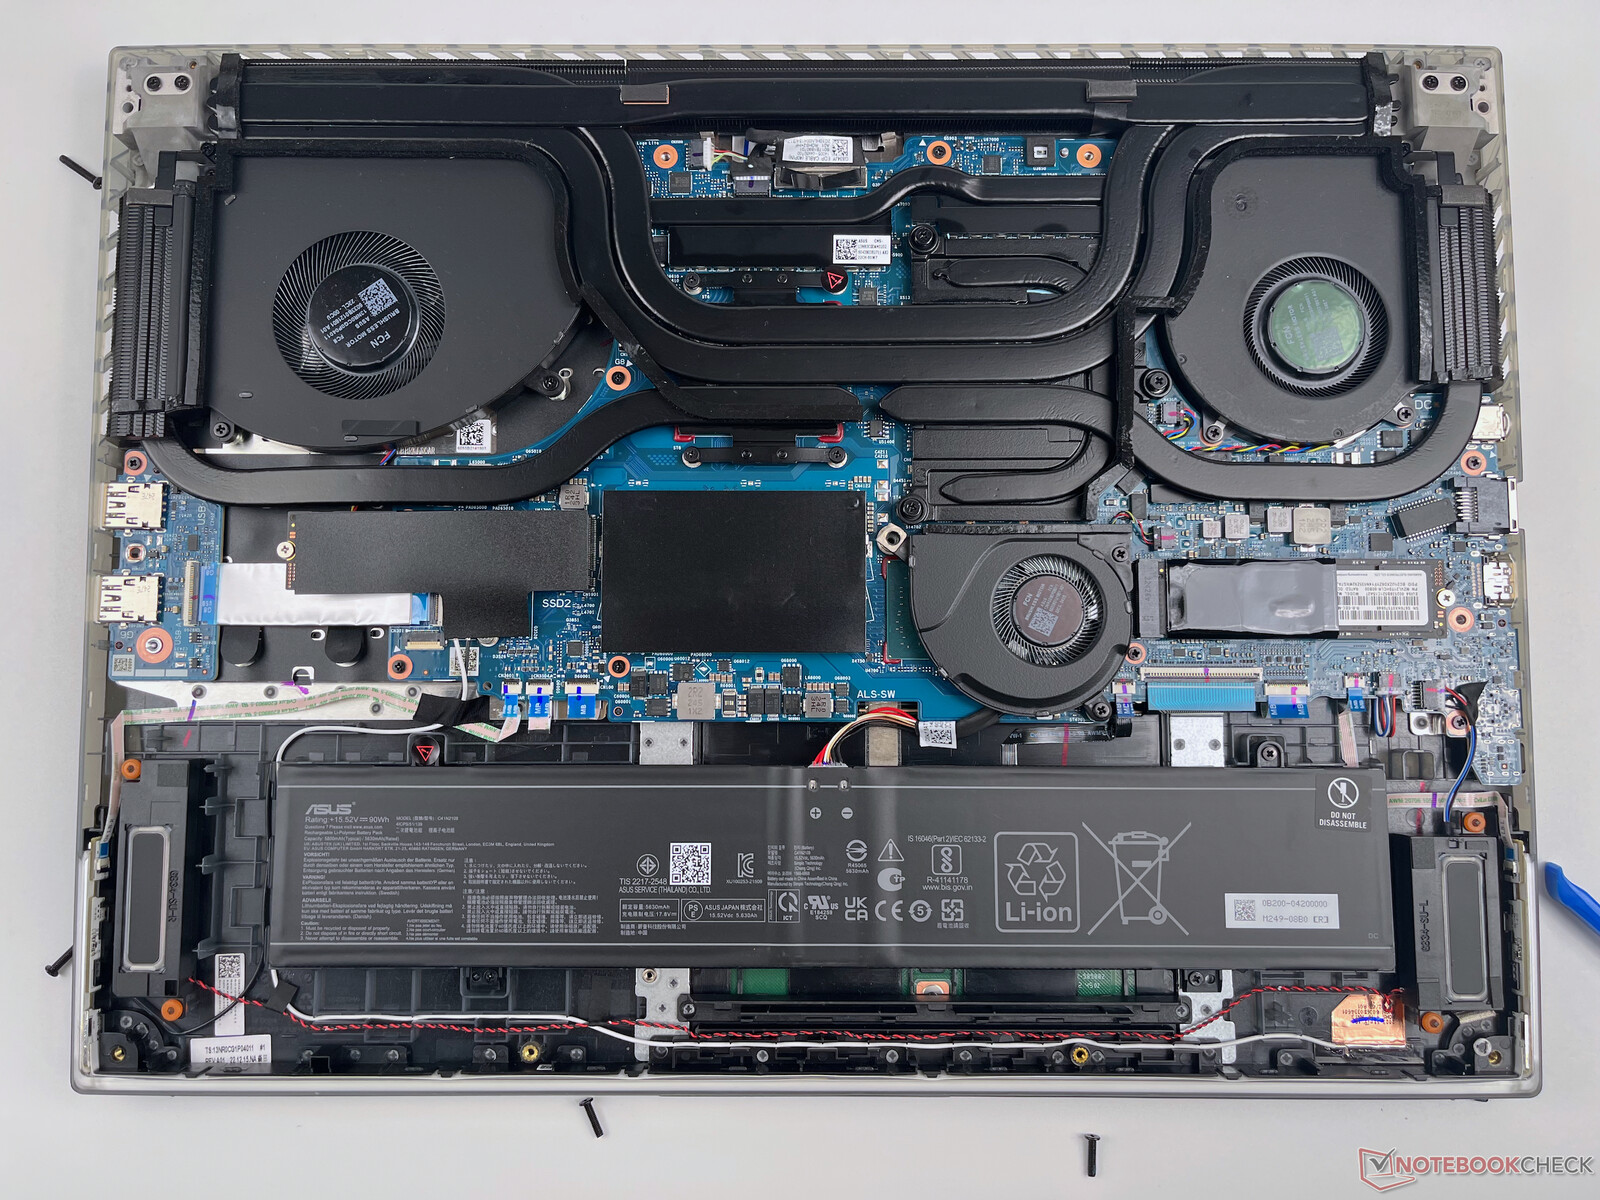
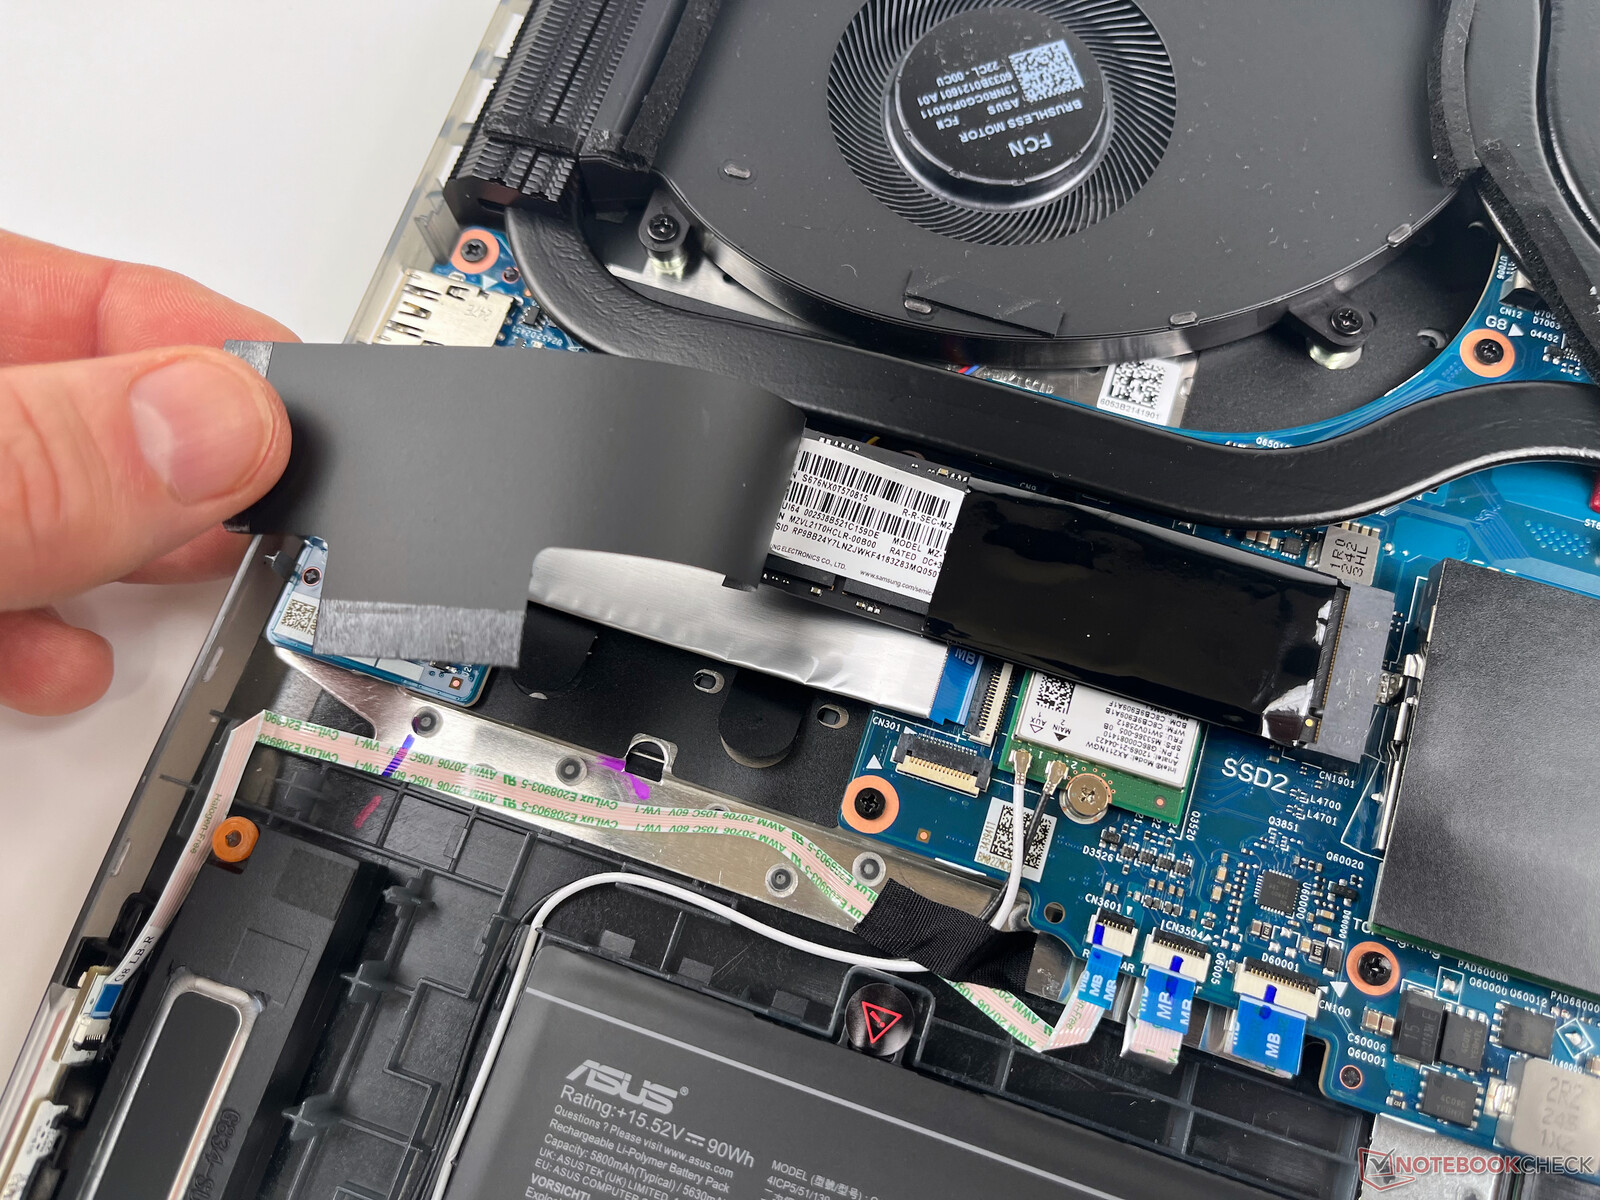
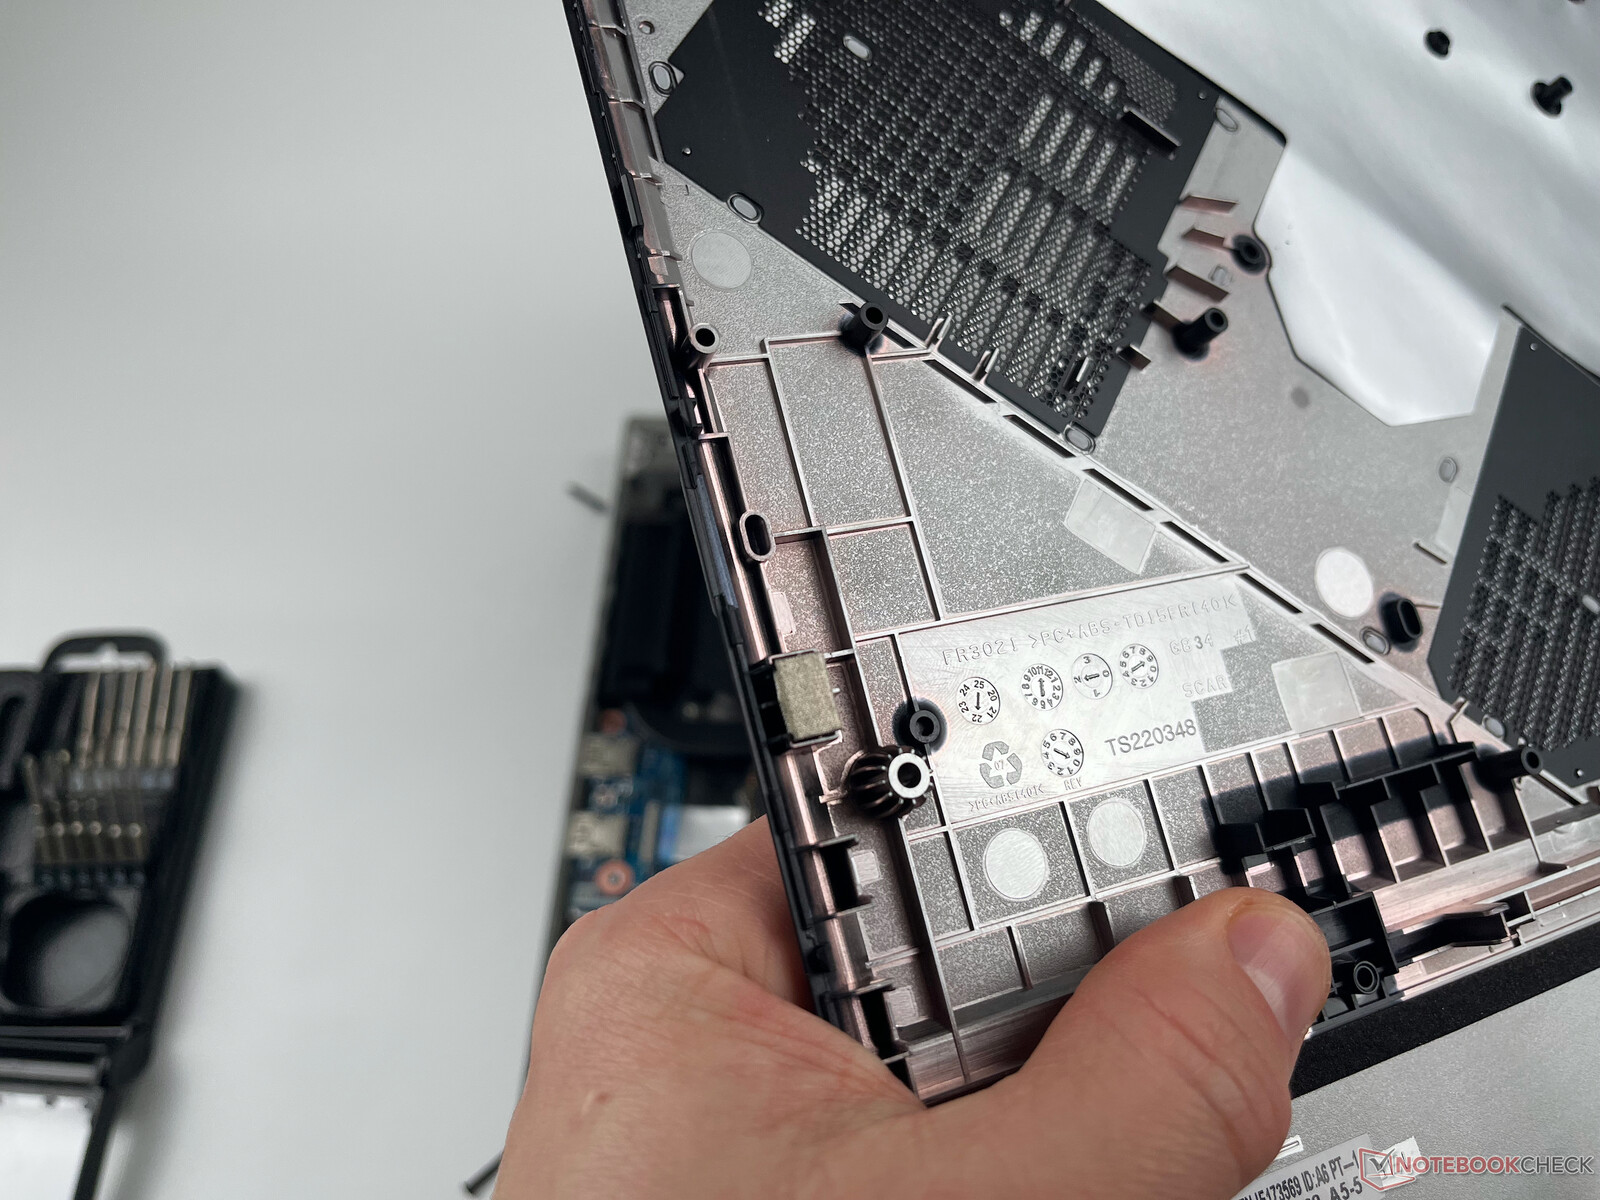
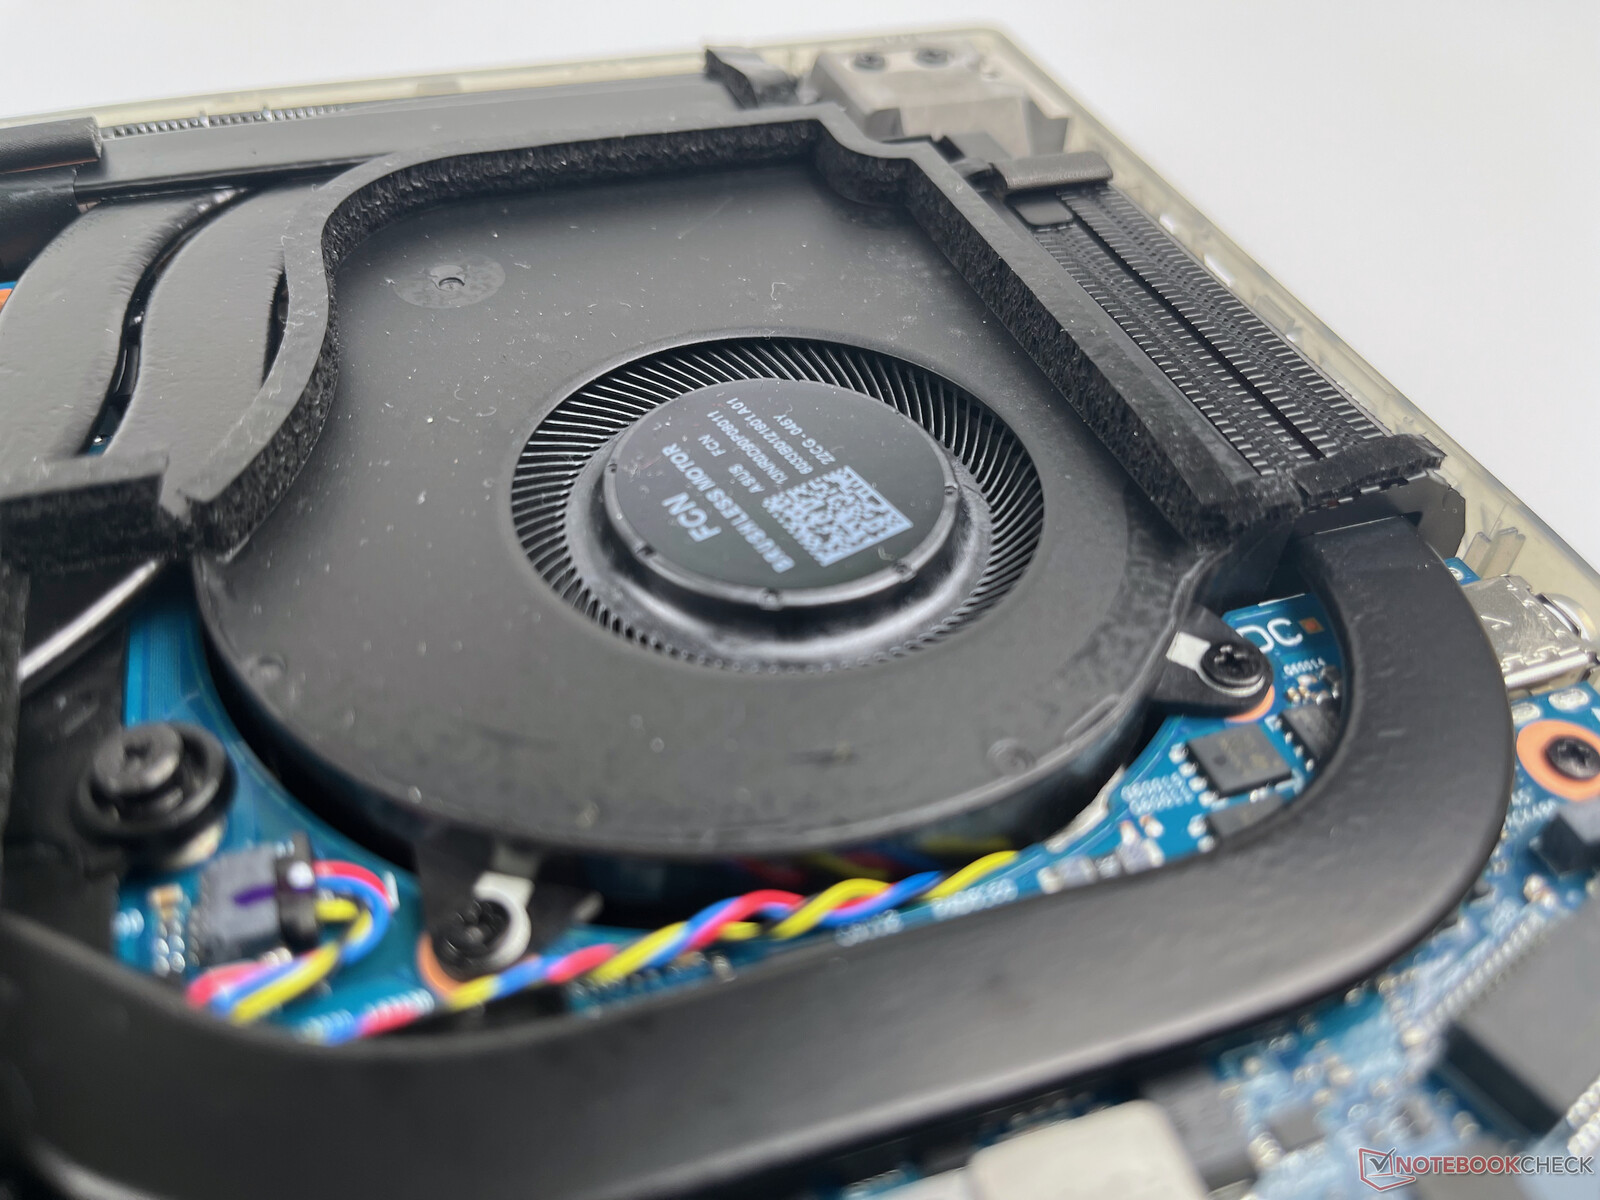
L'intérieur de la série ROG Strix G18 est relativement facilement accessible depuis le fond du boîtier. Vous devez d'abord retirer les nombreuses vis Philips, puis desserrer les clips en plastique sur les bords à l'aide d'un outil pour faire levier. Cela a été relativement facile à faire avec notre unité de test (en commençant par les coins avant), et heureusement, aucun des clips en plastique ne s'est cassé lors de l'ouverture du boîtier.
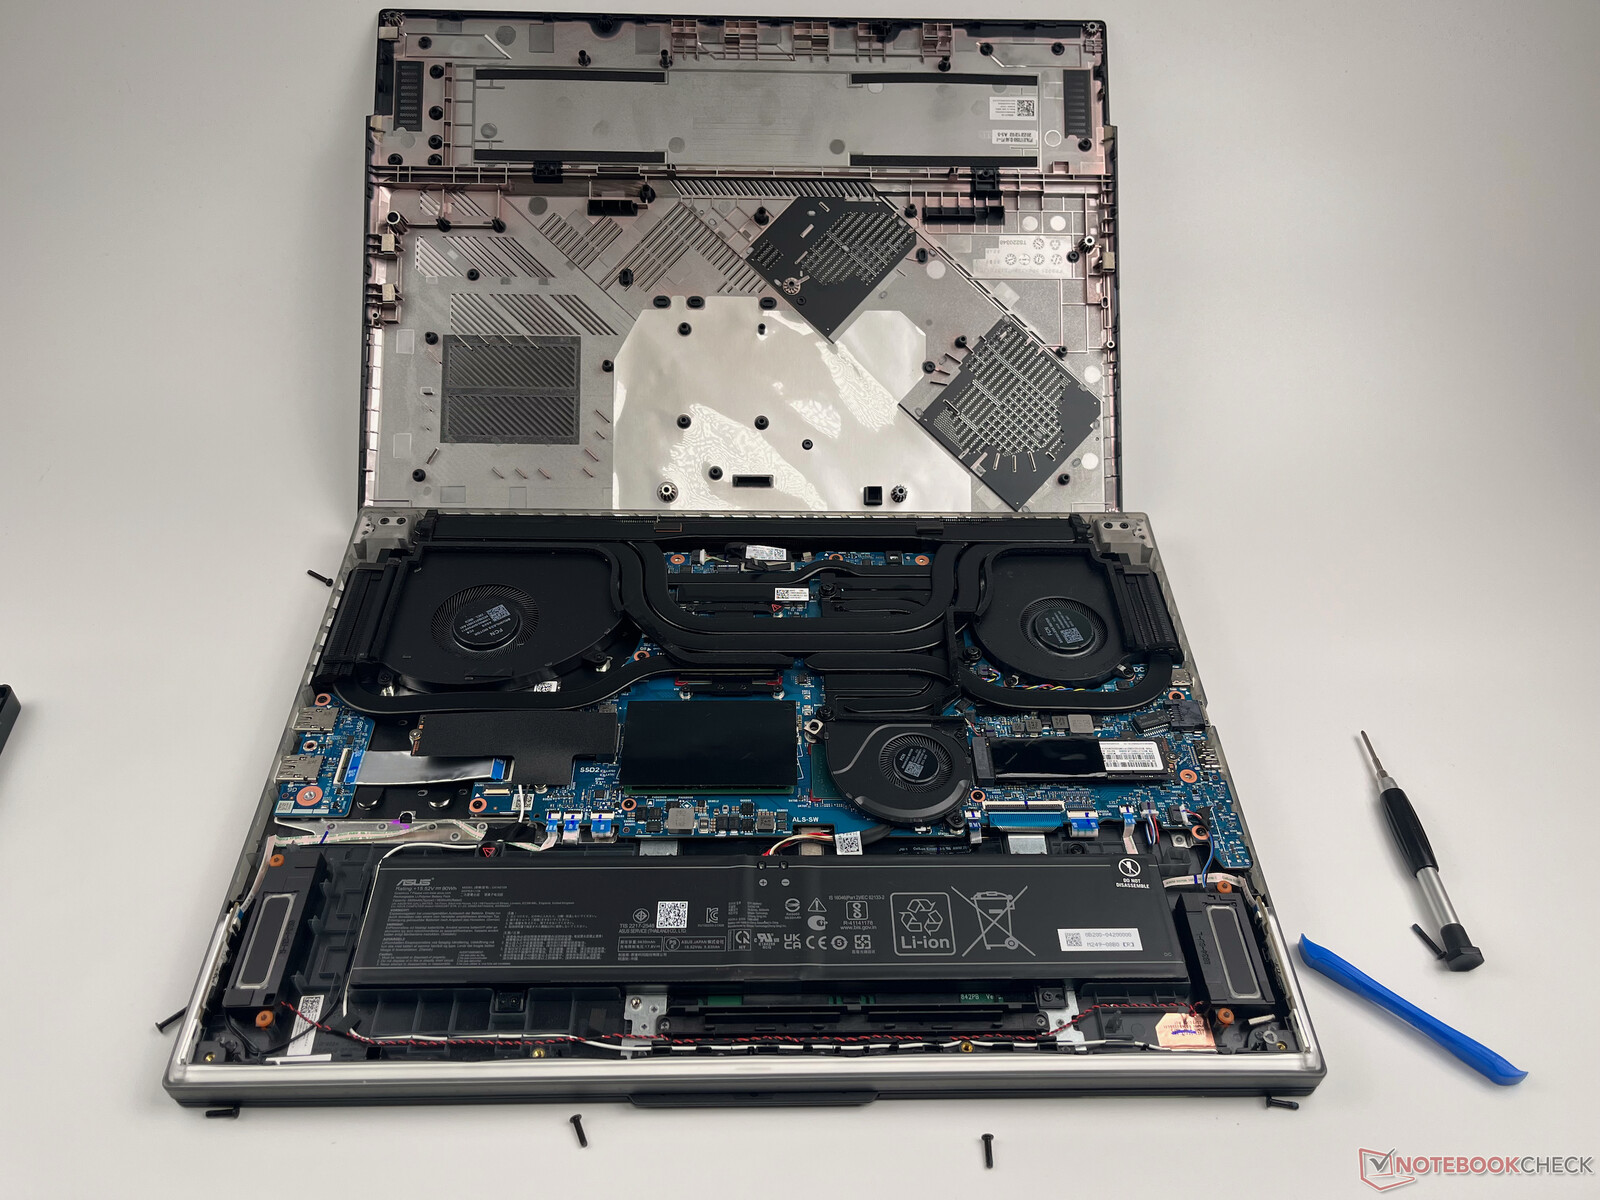
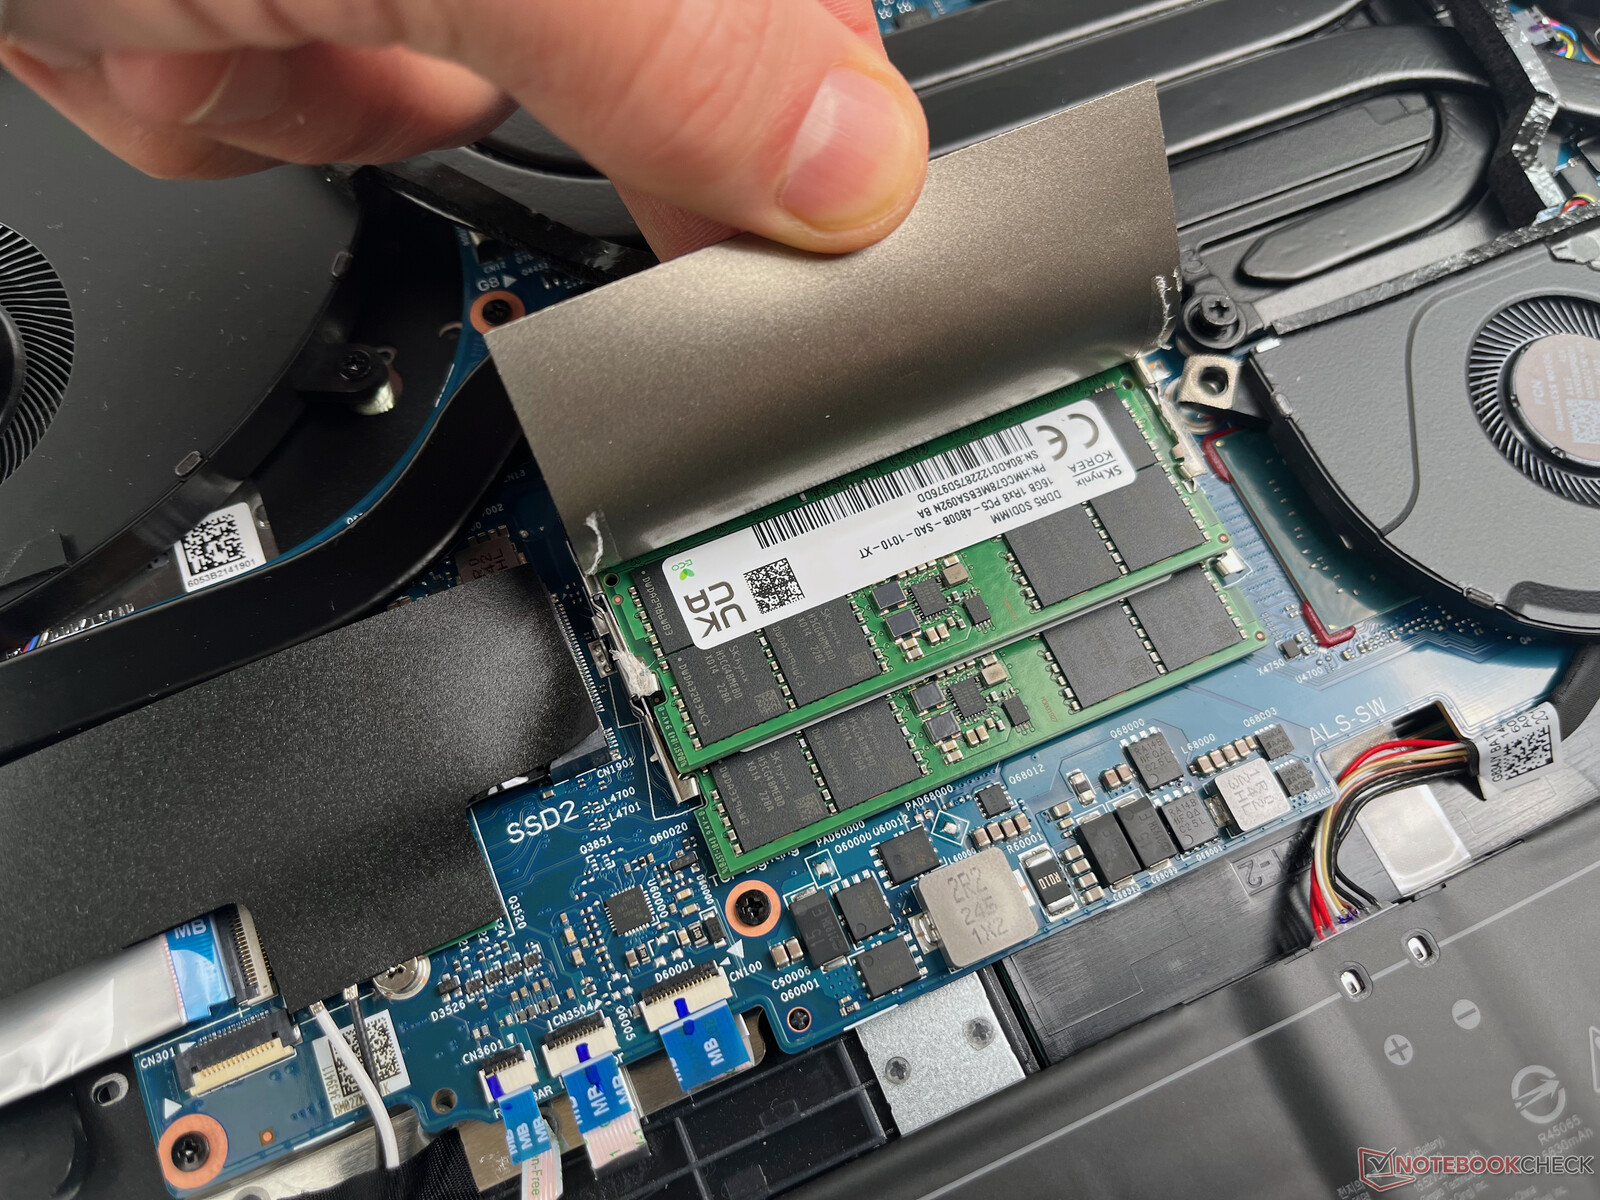
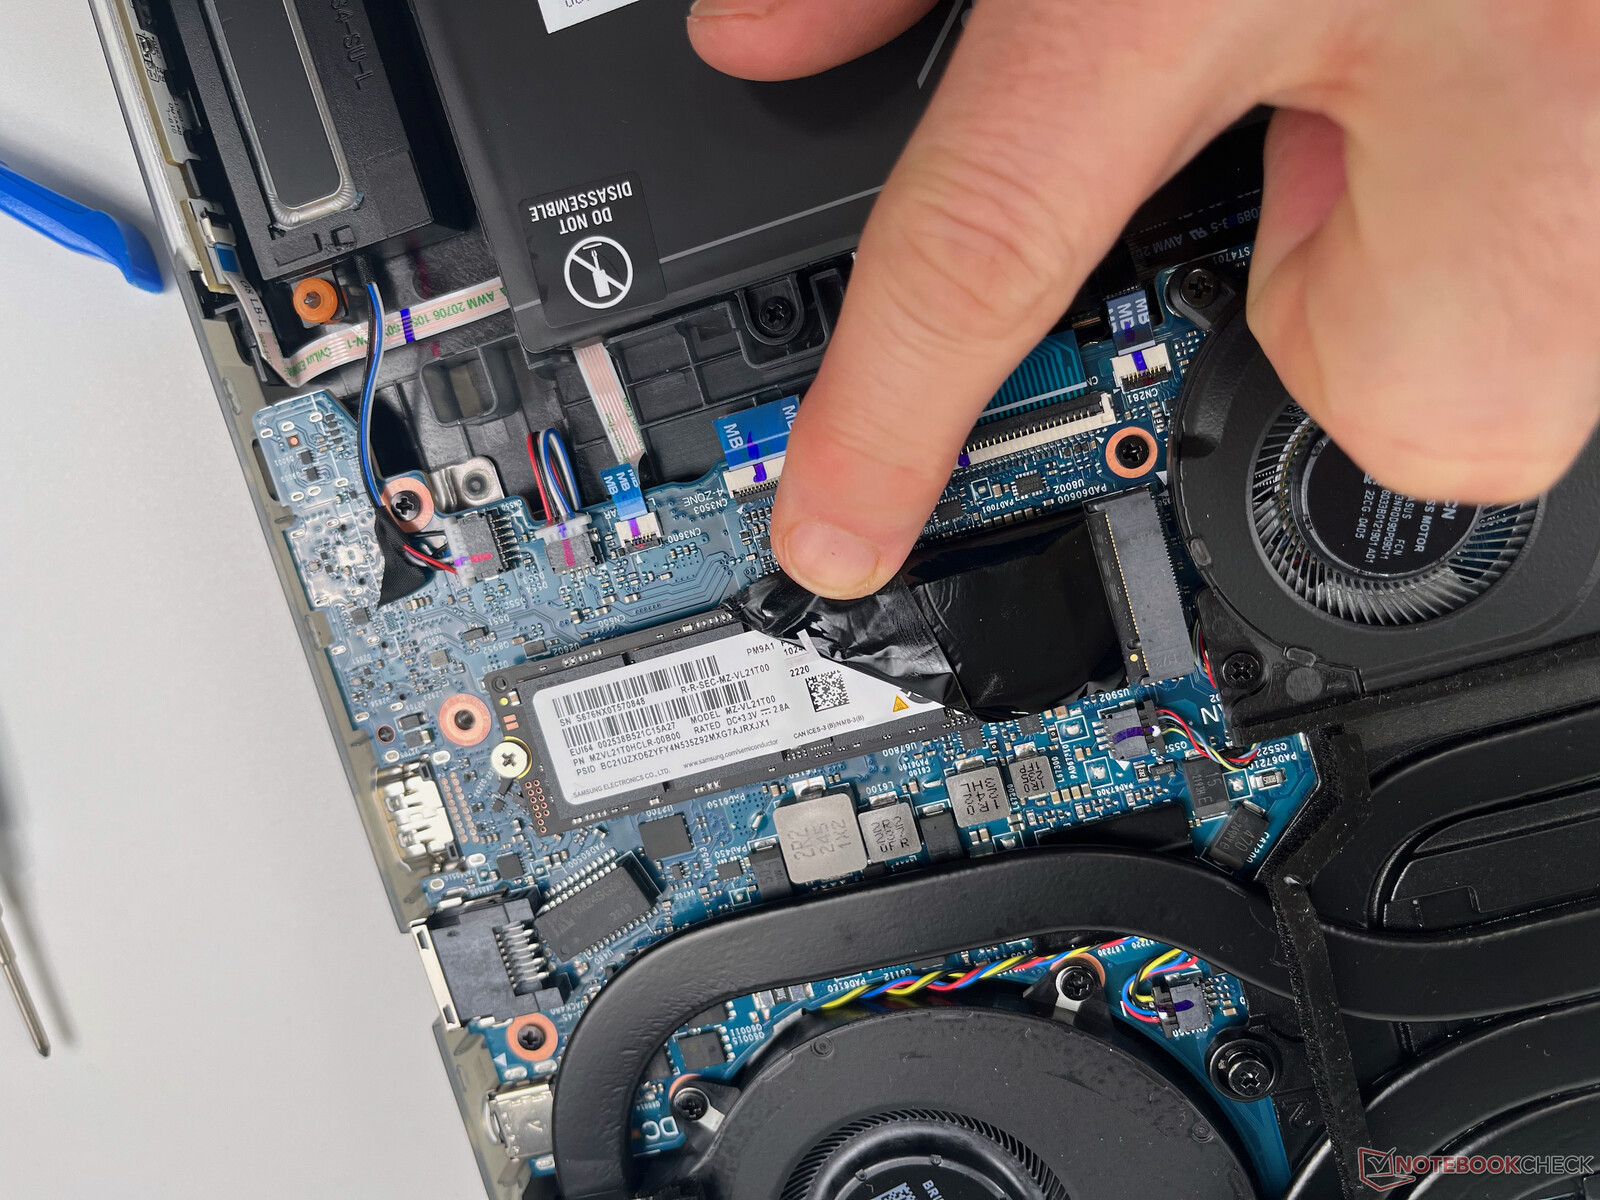
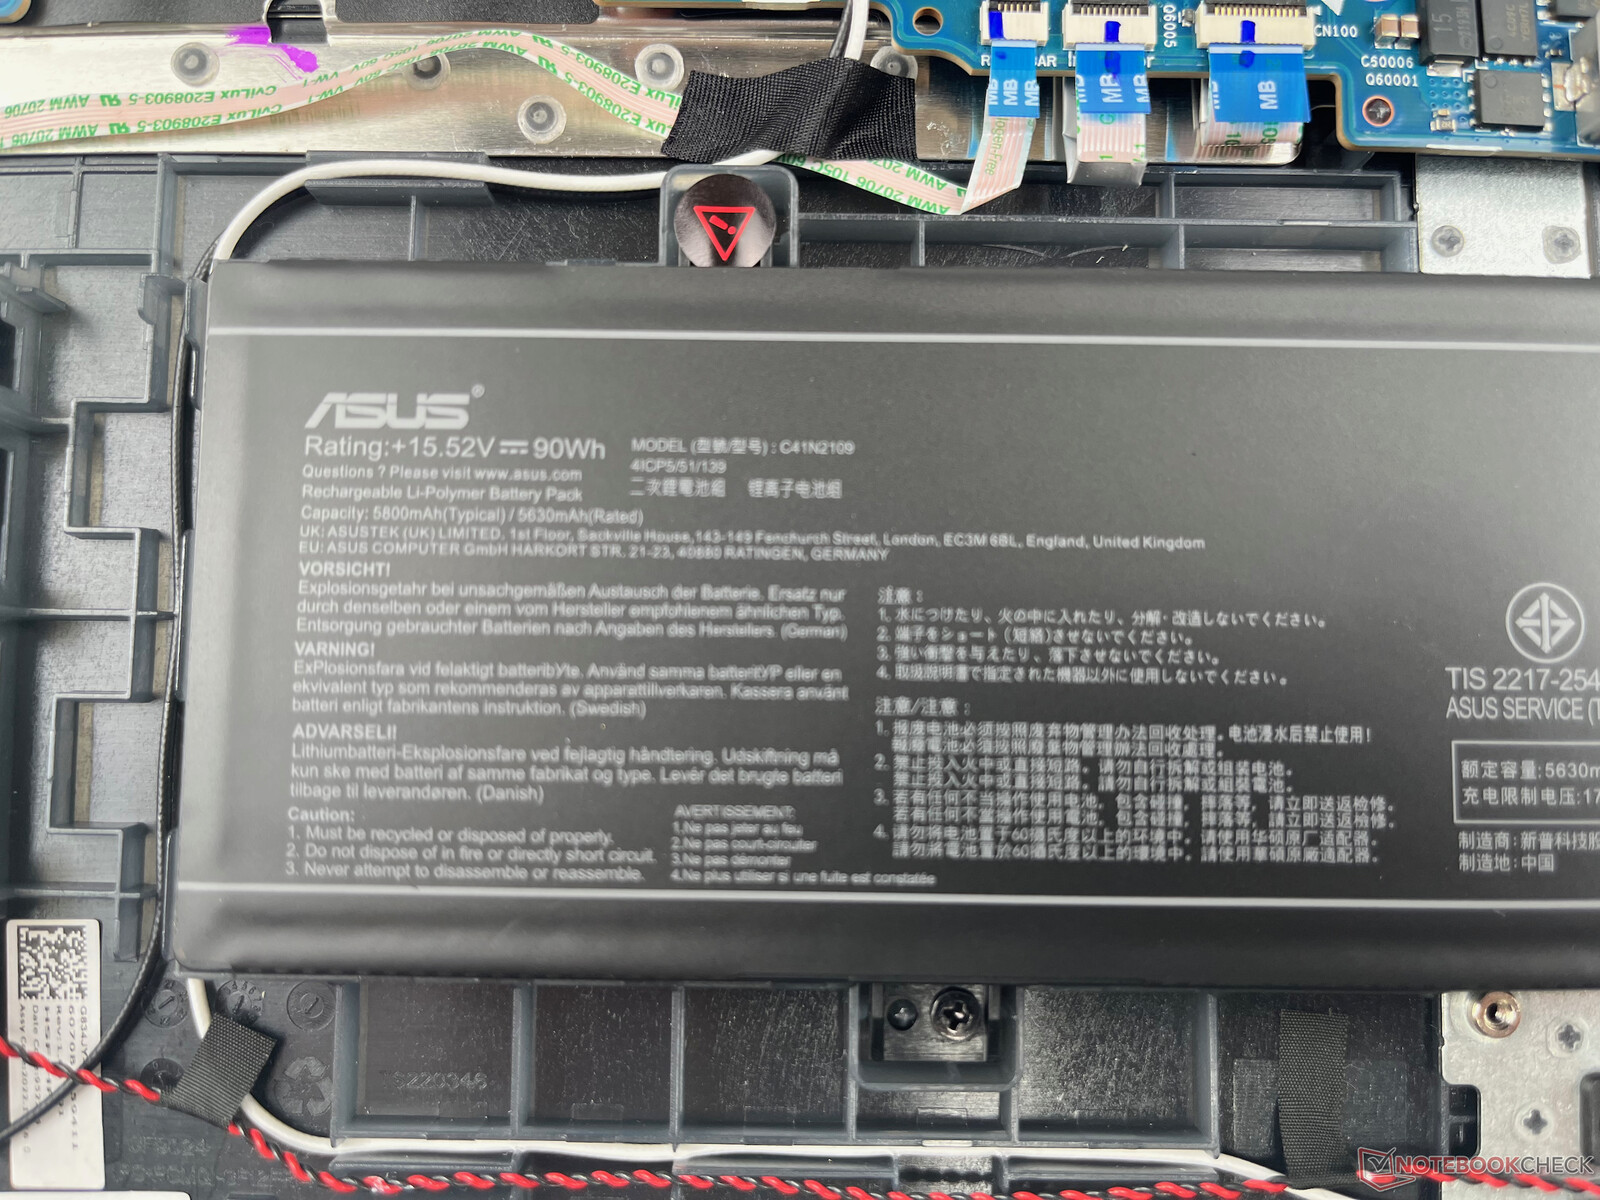
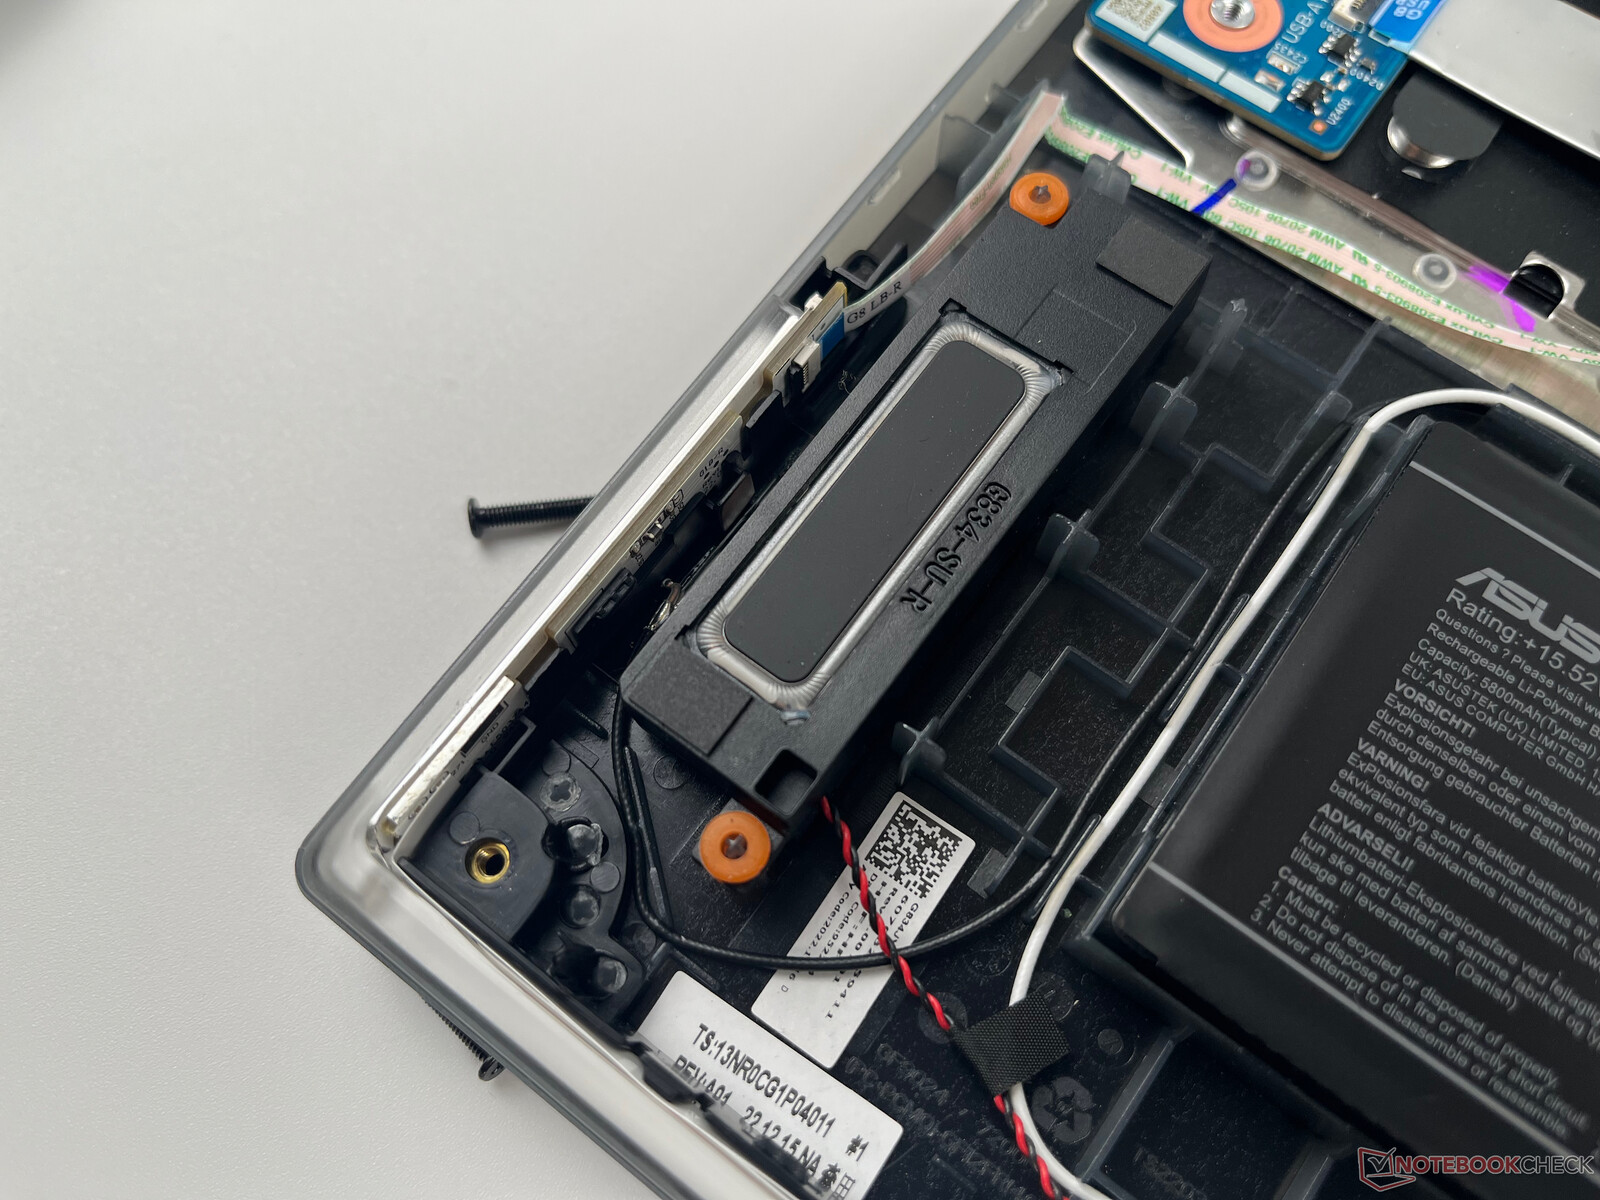
À l'intérieur de l'ordinateur portable, nous voyons deux emplacements M.2-2280 pour des SSD PCIe (tous deux occupés pour le système RAID-0), un emplacement M.2 pour la carte WLAN, et deux emplacements mémoire (également tous deux occupés) pour un maximum de 64 Go de RAM GDDR5. Tous les ventilateurs sont également accessibles et peuvent être nettoyés facilement. La batterie est vissée dans le boîtier, elle devrait donc être relativement facile à remplacer.
Garantie
Asus n'offre que la garantie habituelle d'un an (deux ans pour les modèles proposés en Allemagne). Une garantie pour les pièces de rechange ou autre n'est pas mentionnée.
Input Devices
Clavier
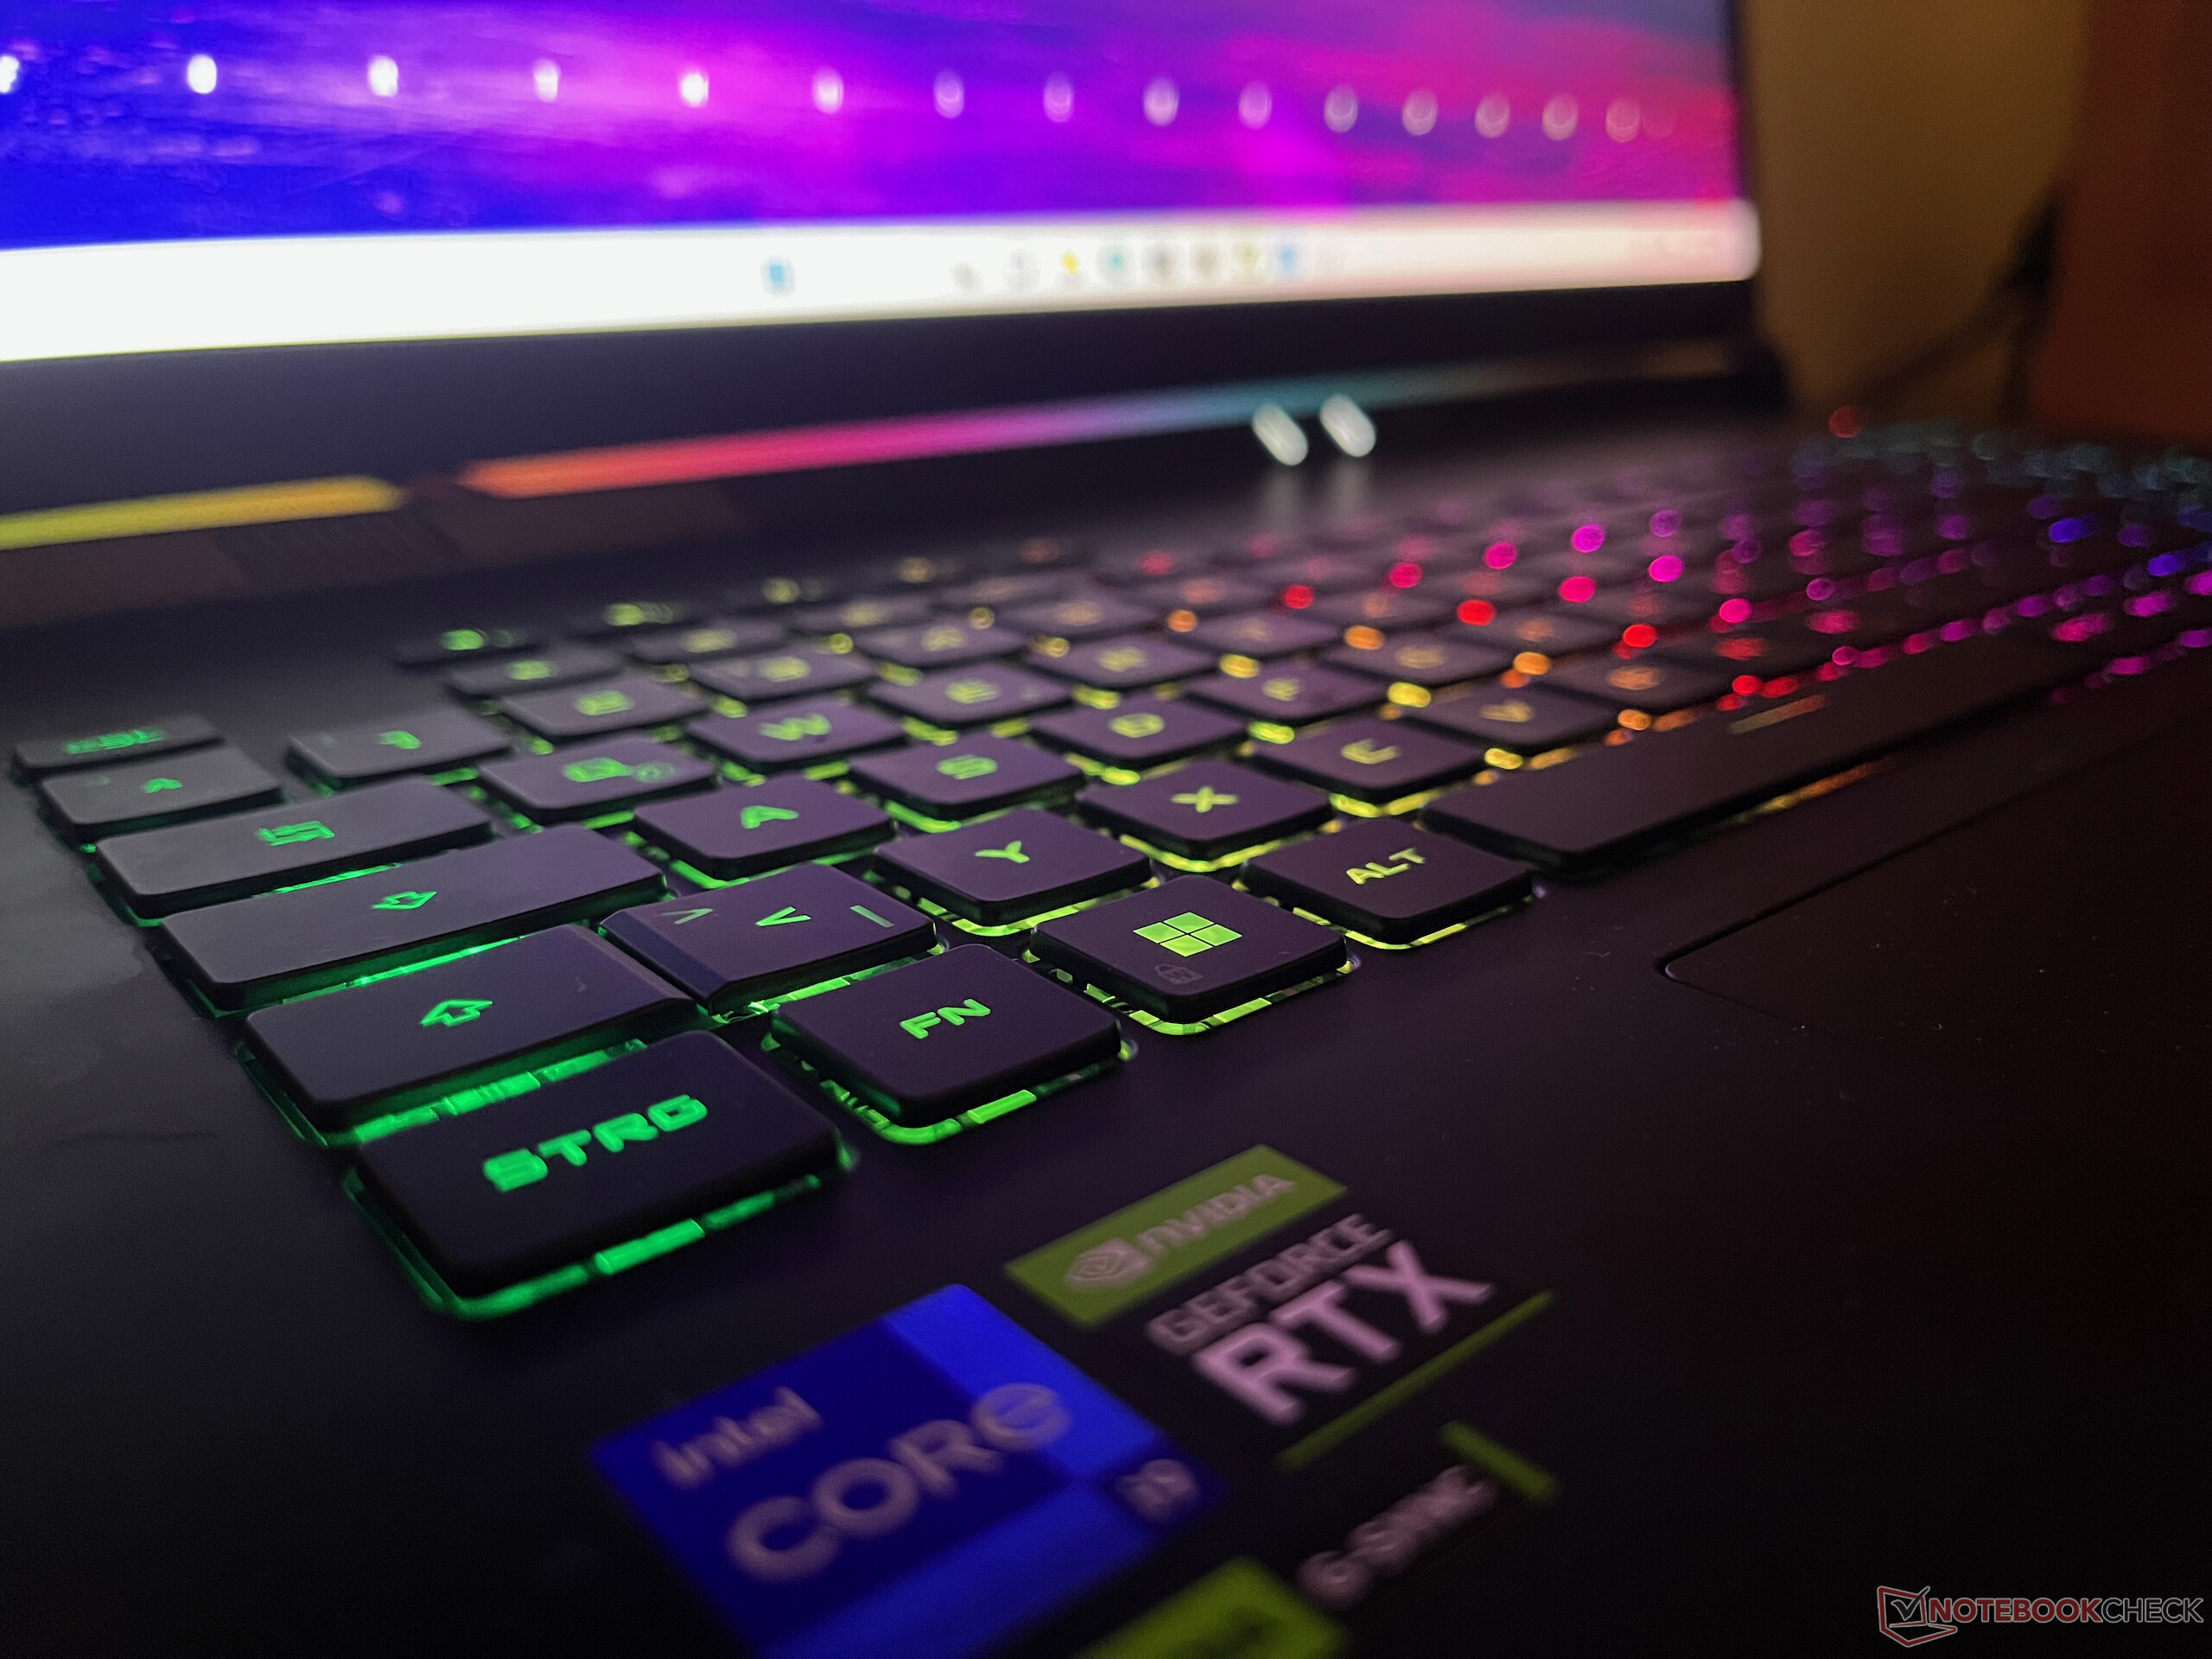
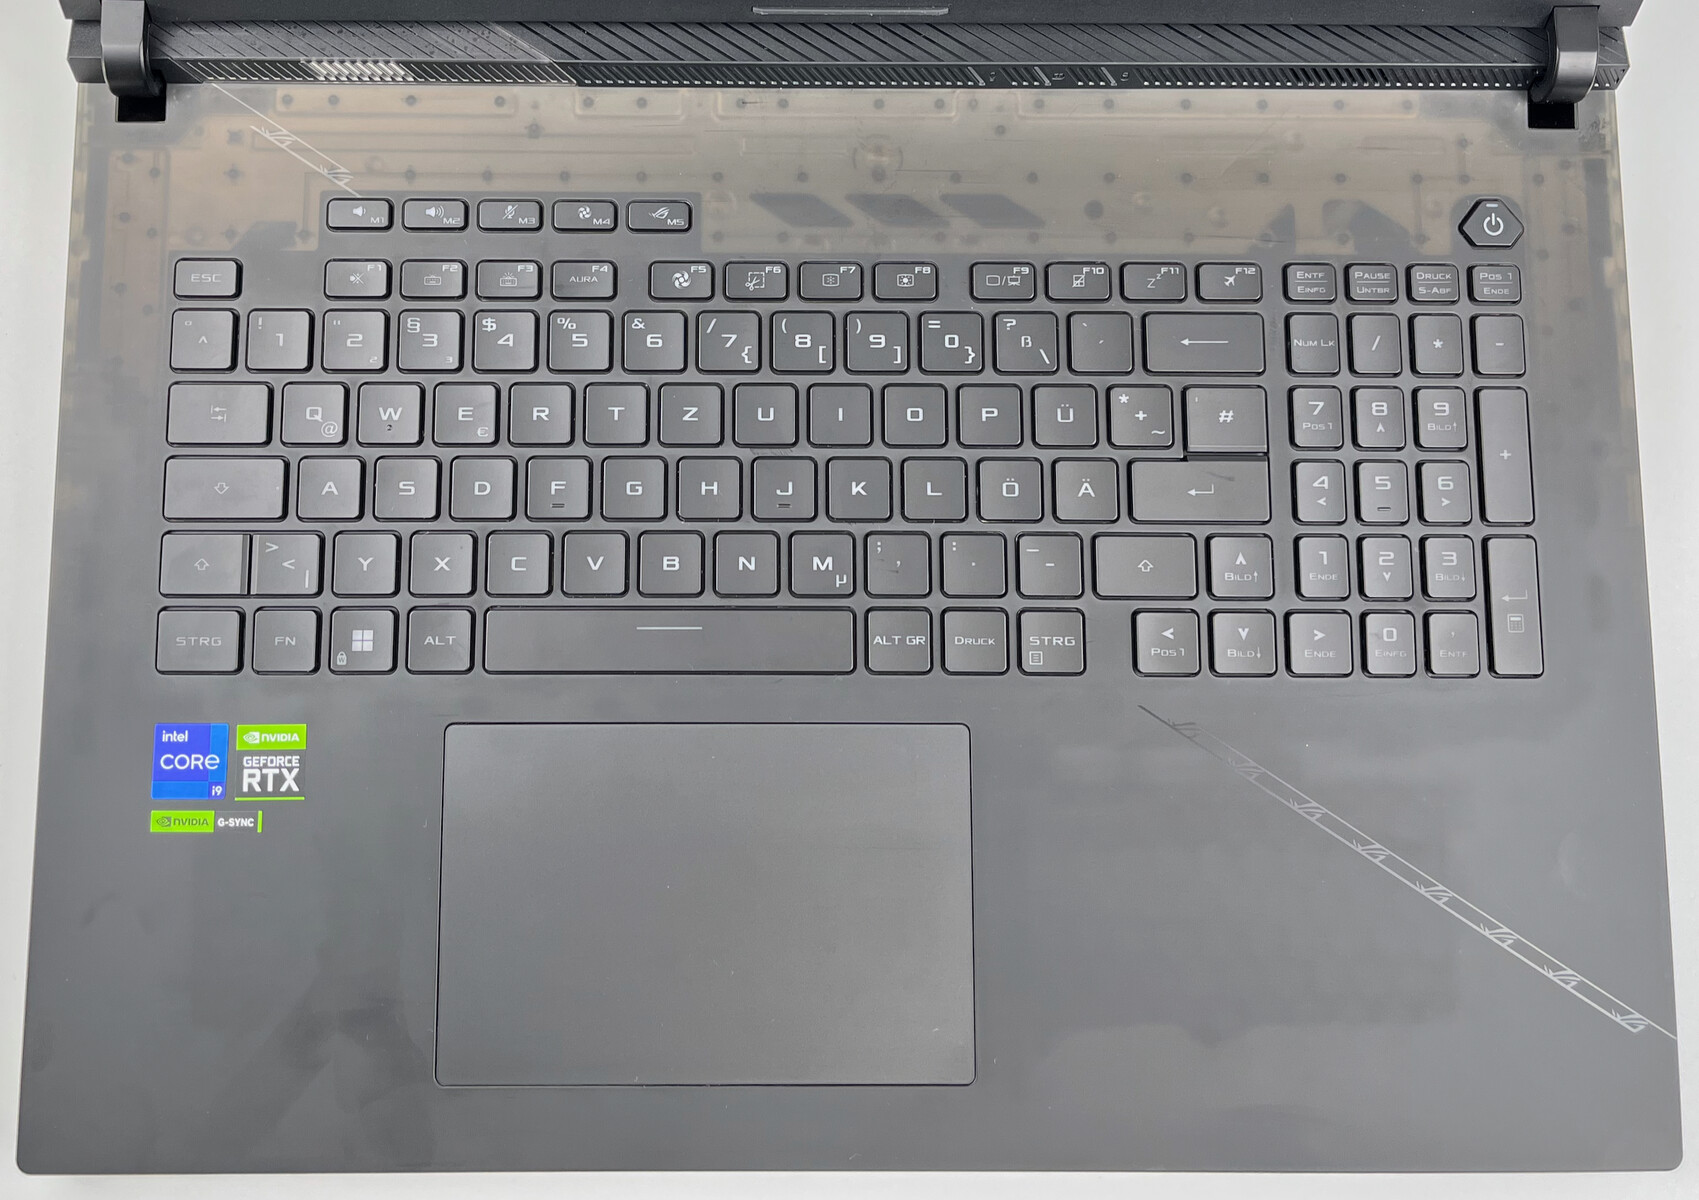
En plus du bloc de chiffres, le clavier complet utilisé ici comprend également cinq touches spéciales au-dessus de la rangée F1-F12 à double usage. Les touches chicklet offrent une course suffisante et une frappe silencieuse. Lors du premier test de frappe, l'auteur a atteint un bon 85 mots par minute avec une précision de 96%. Le rétroéclairage RVB intégré des touches séparées peut être personnalisé par de nombreuses animations. Dans le test de renversement des n-keys, nous ne voyons pas de limitations (24 touches simultanées max. atteintes).
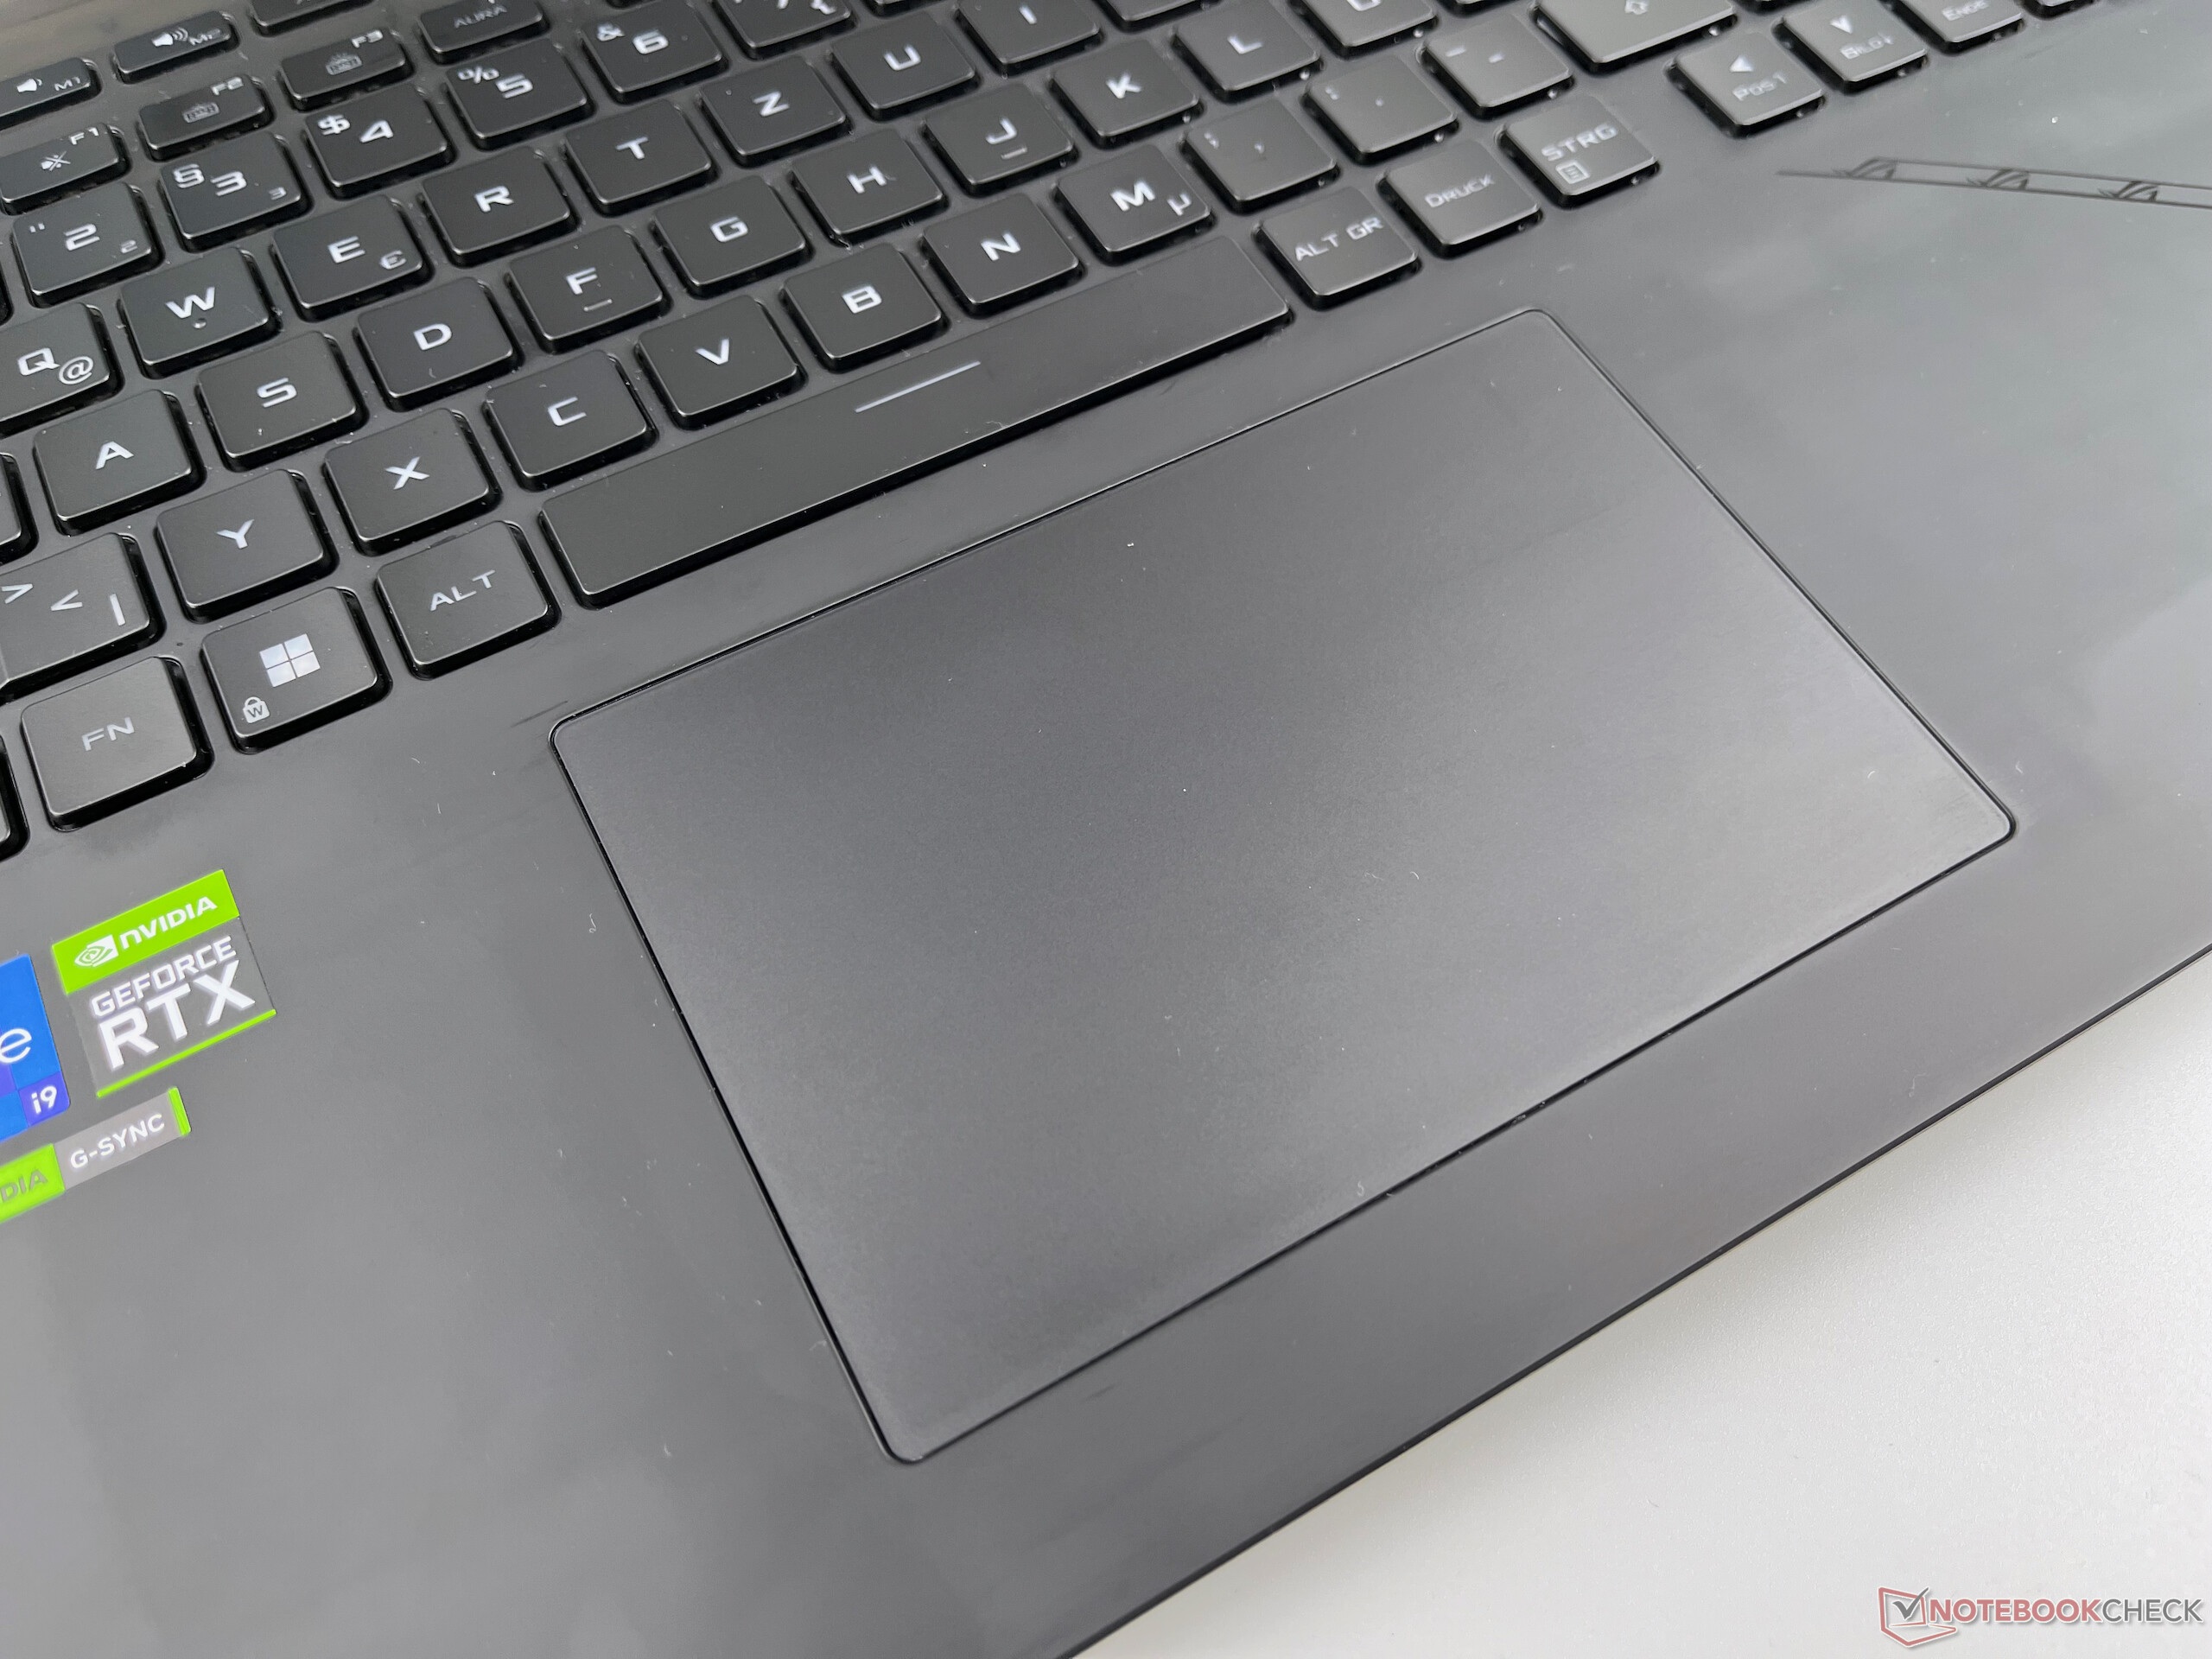
Pavé tactile
Le grand pavé tactile offre une surface en verre et d'excellentes caractéristiques de glissement. Le multitouch a fonctionné sans problème dans notre test, et les 4/5 inférieurs de la zone peuvent également être cliqués confortablement. Cependant, un clic dans le coin inférieur droit est souvent reconnu comme une pression sur la touche droite de la souris, ce qui entraîne des entrées erronées.
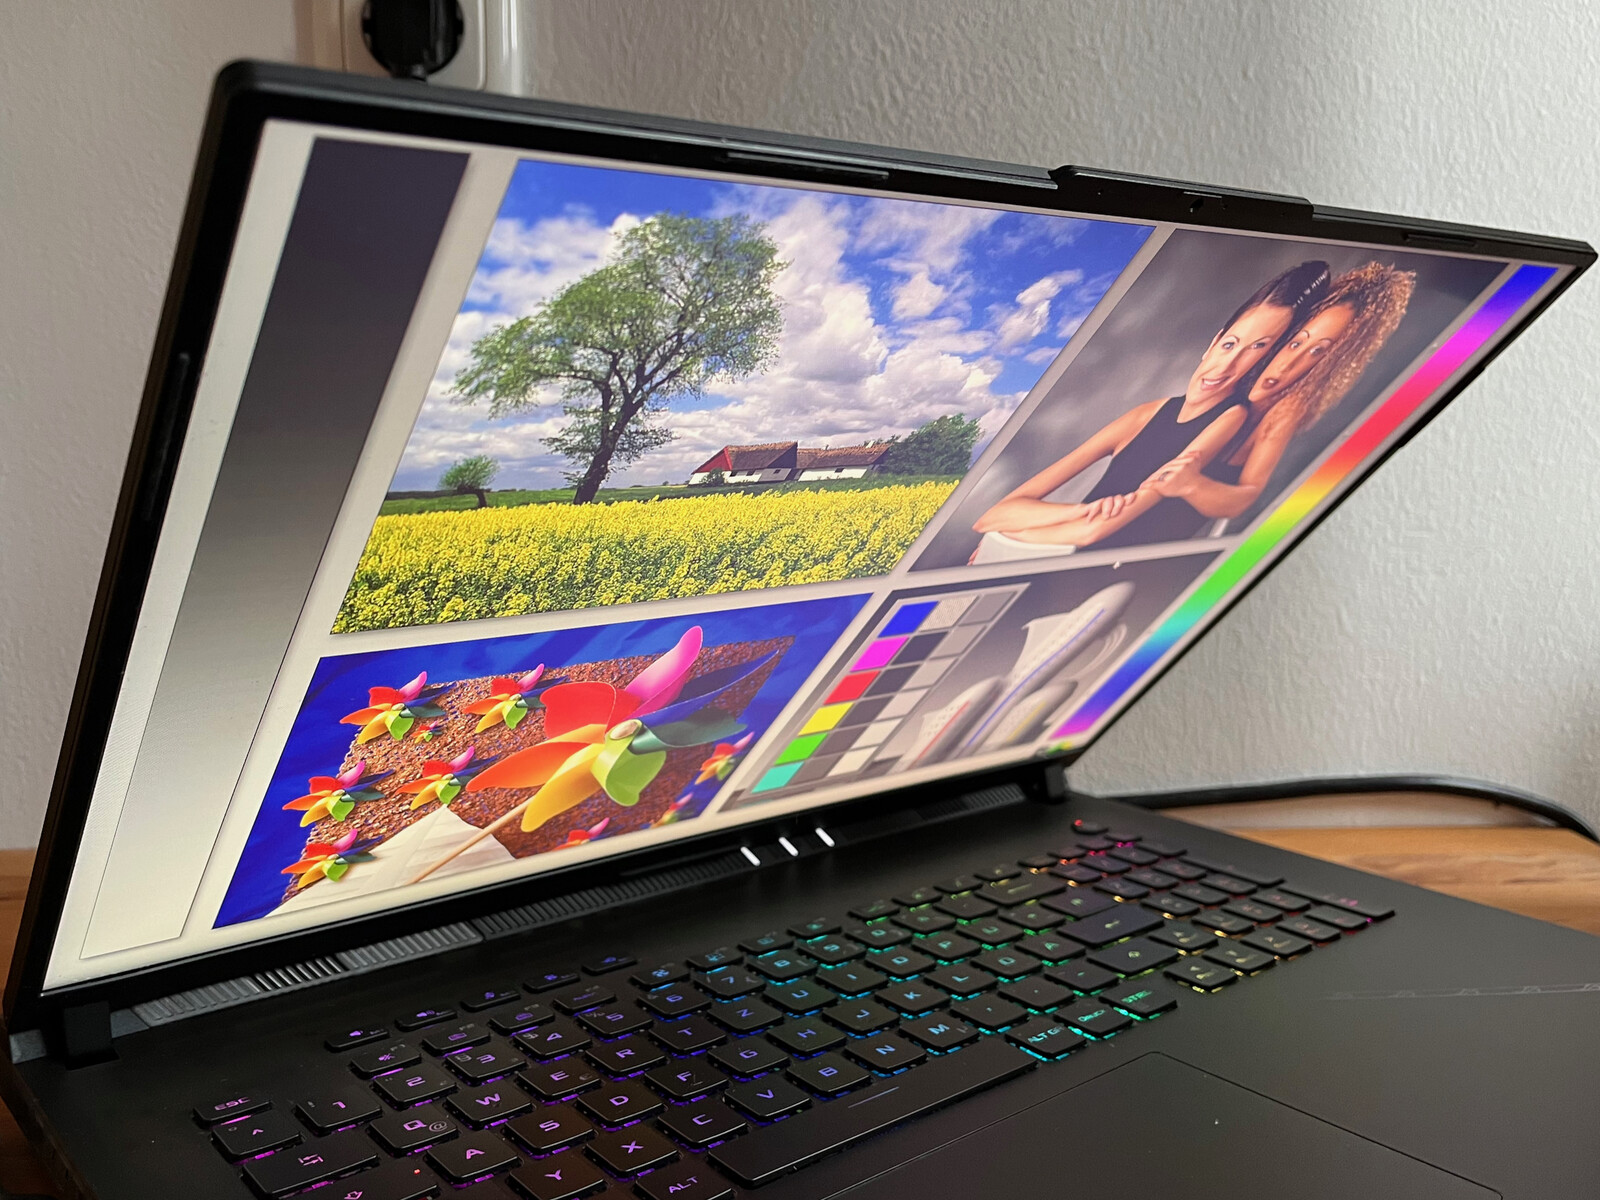
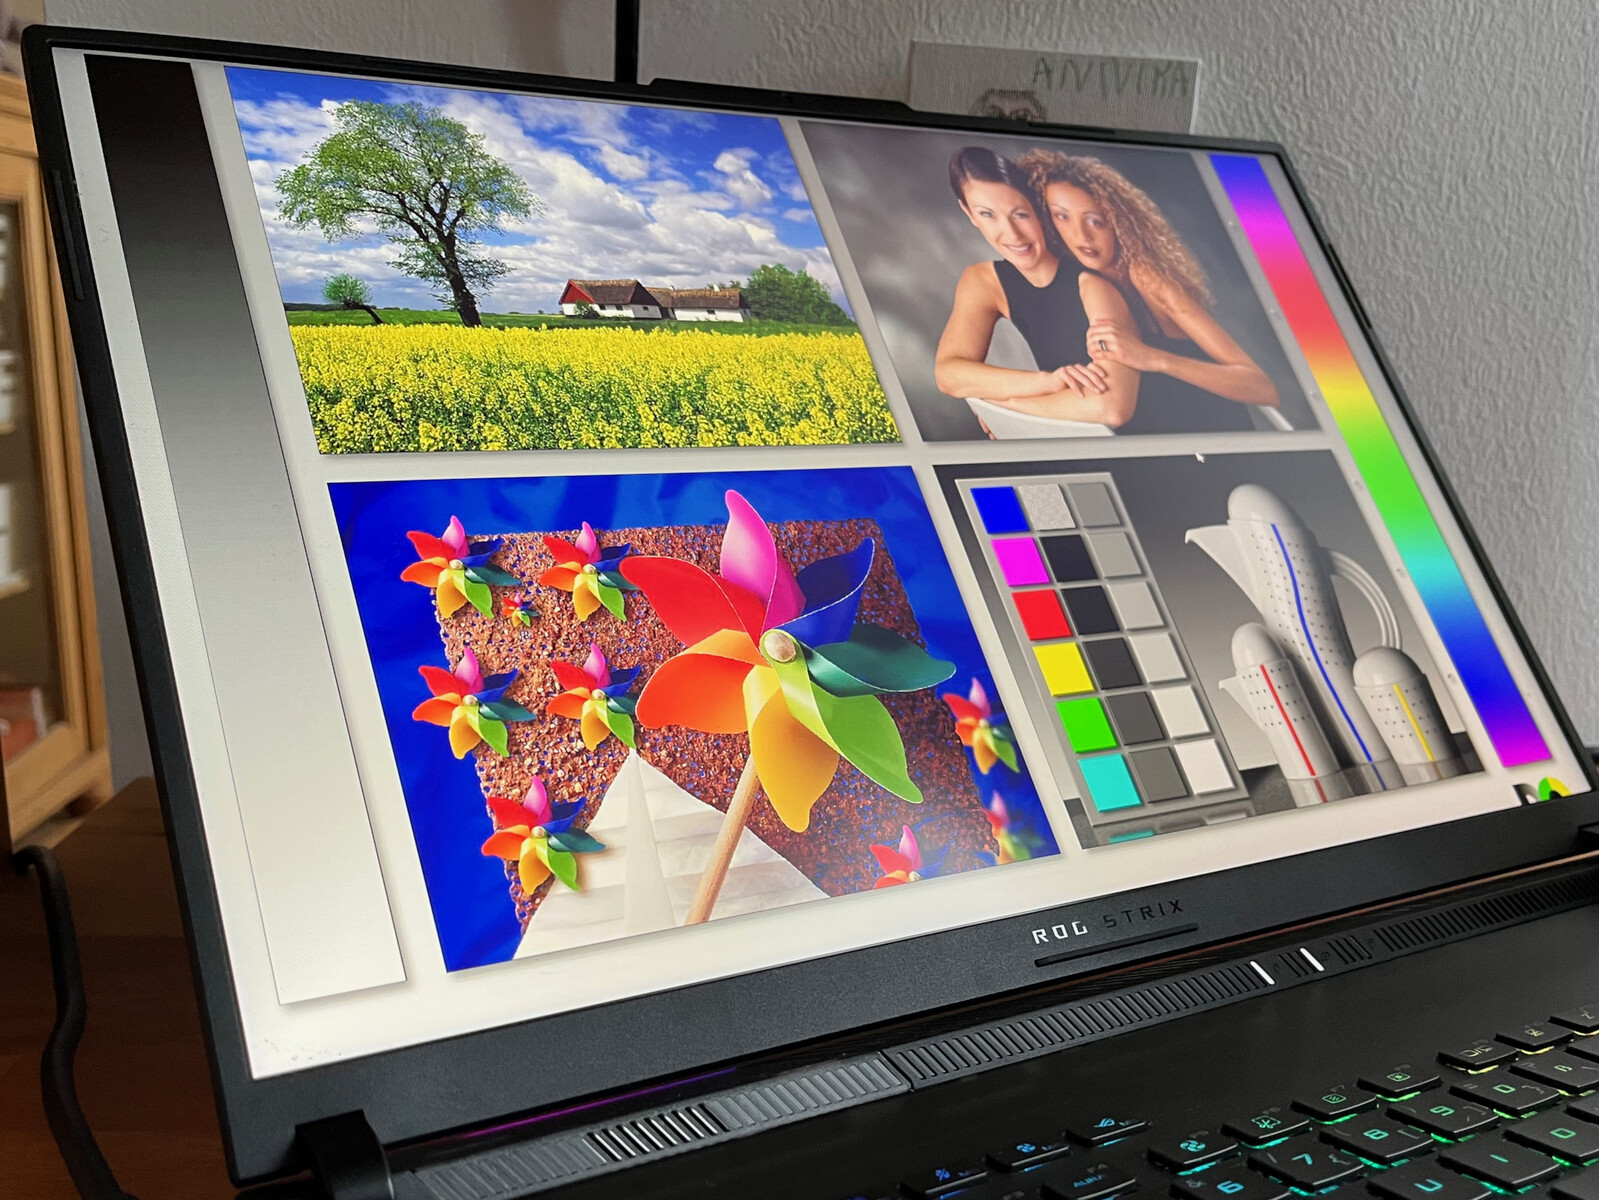
Afficher
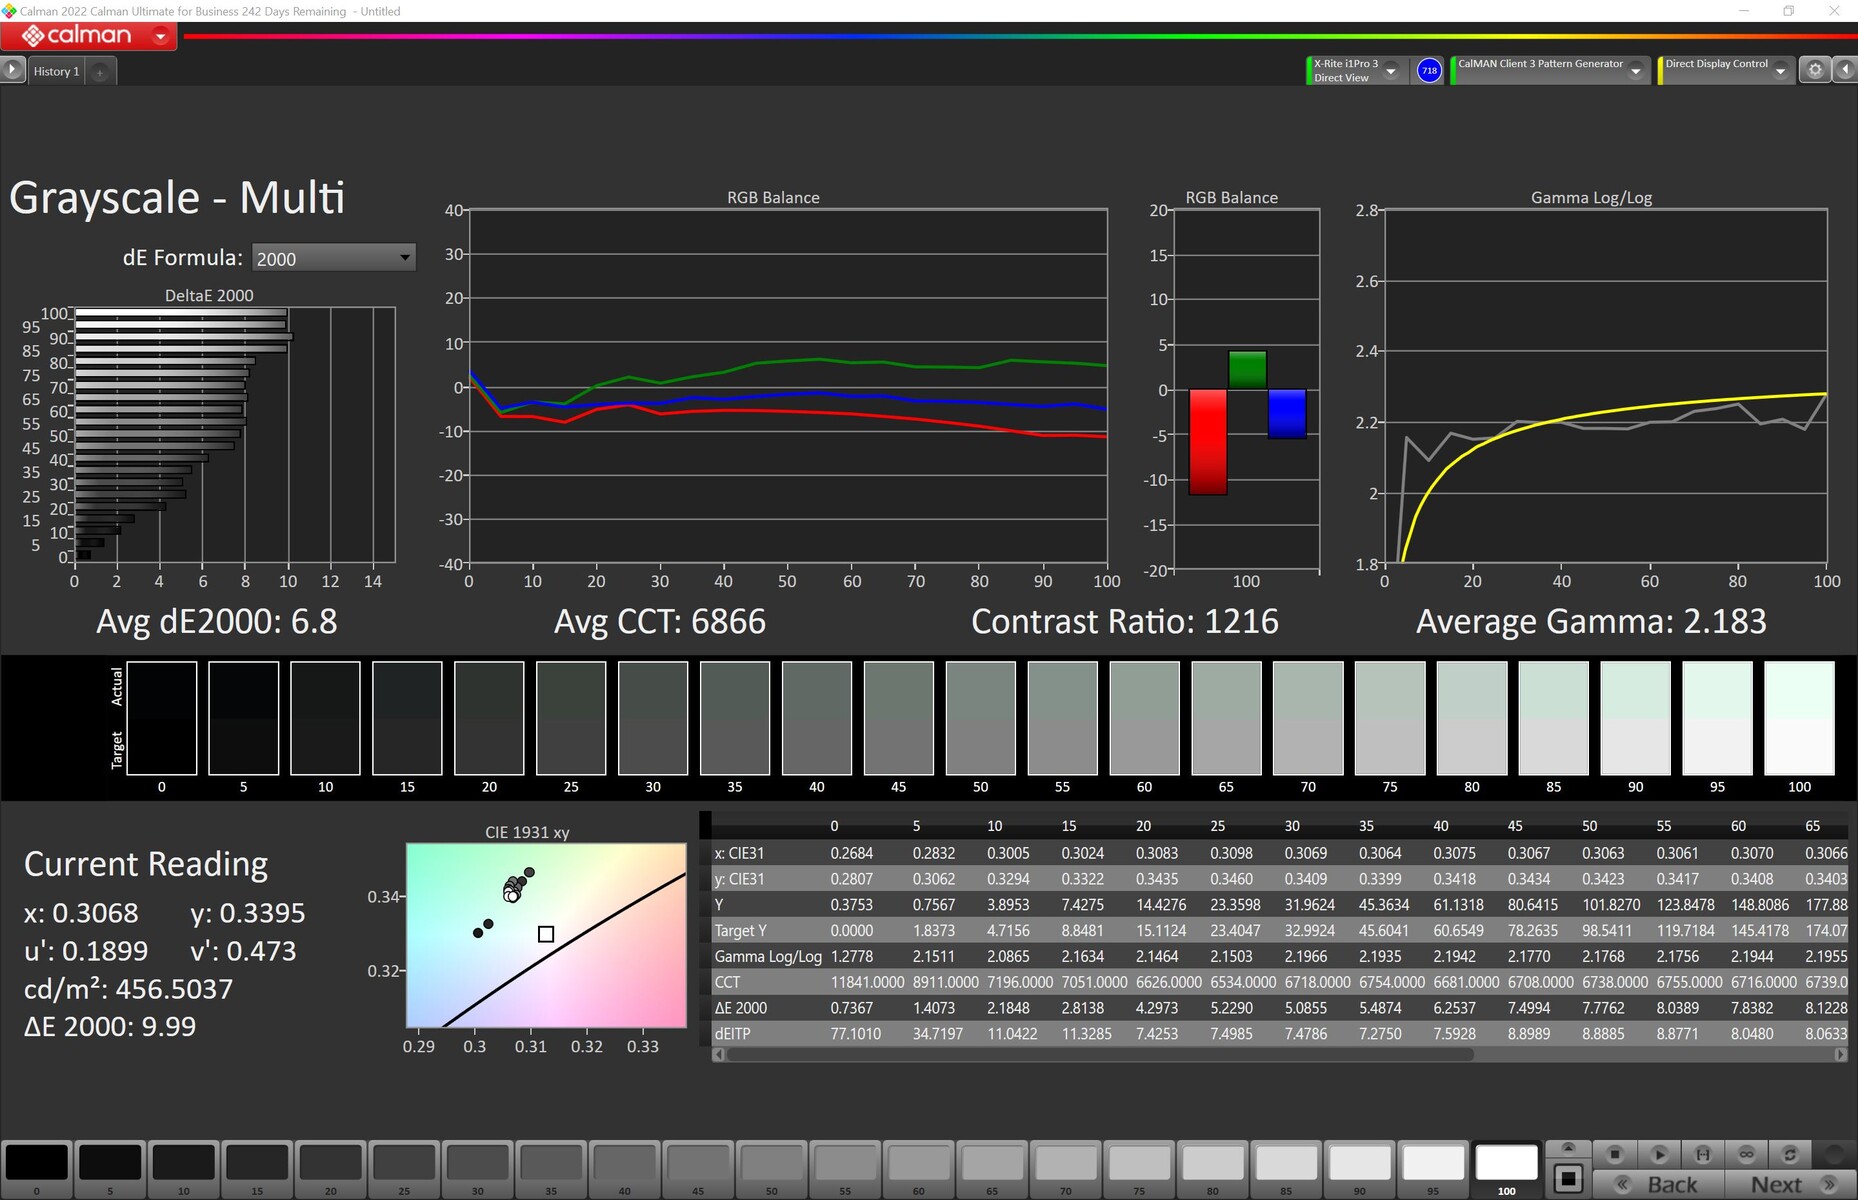
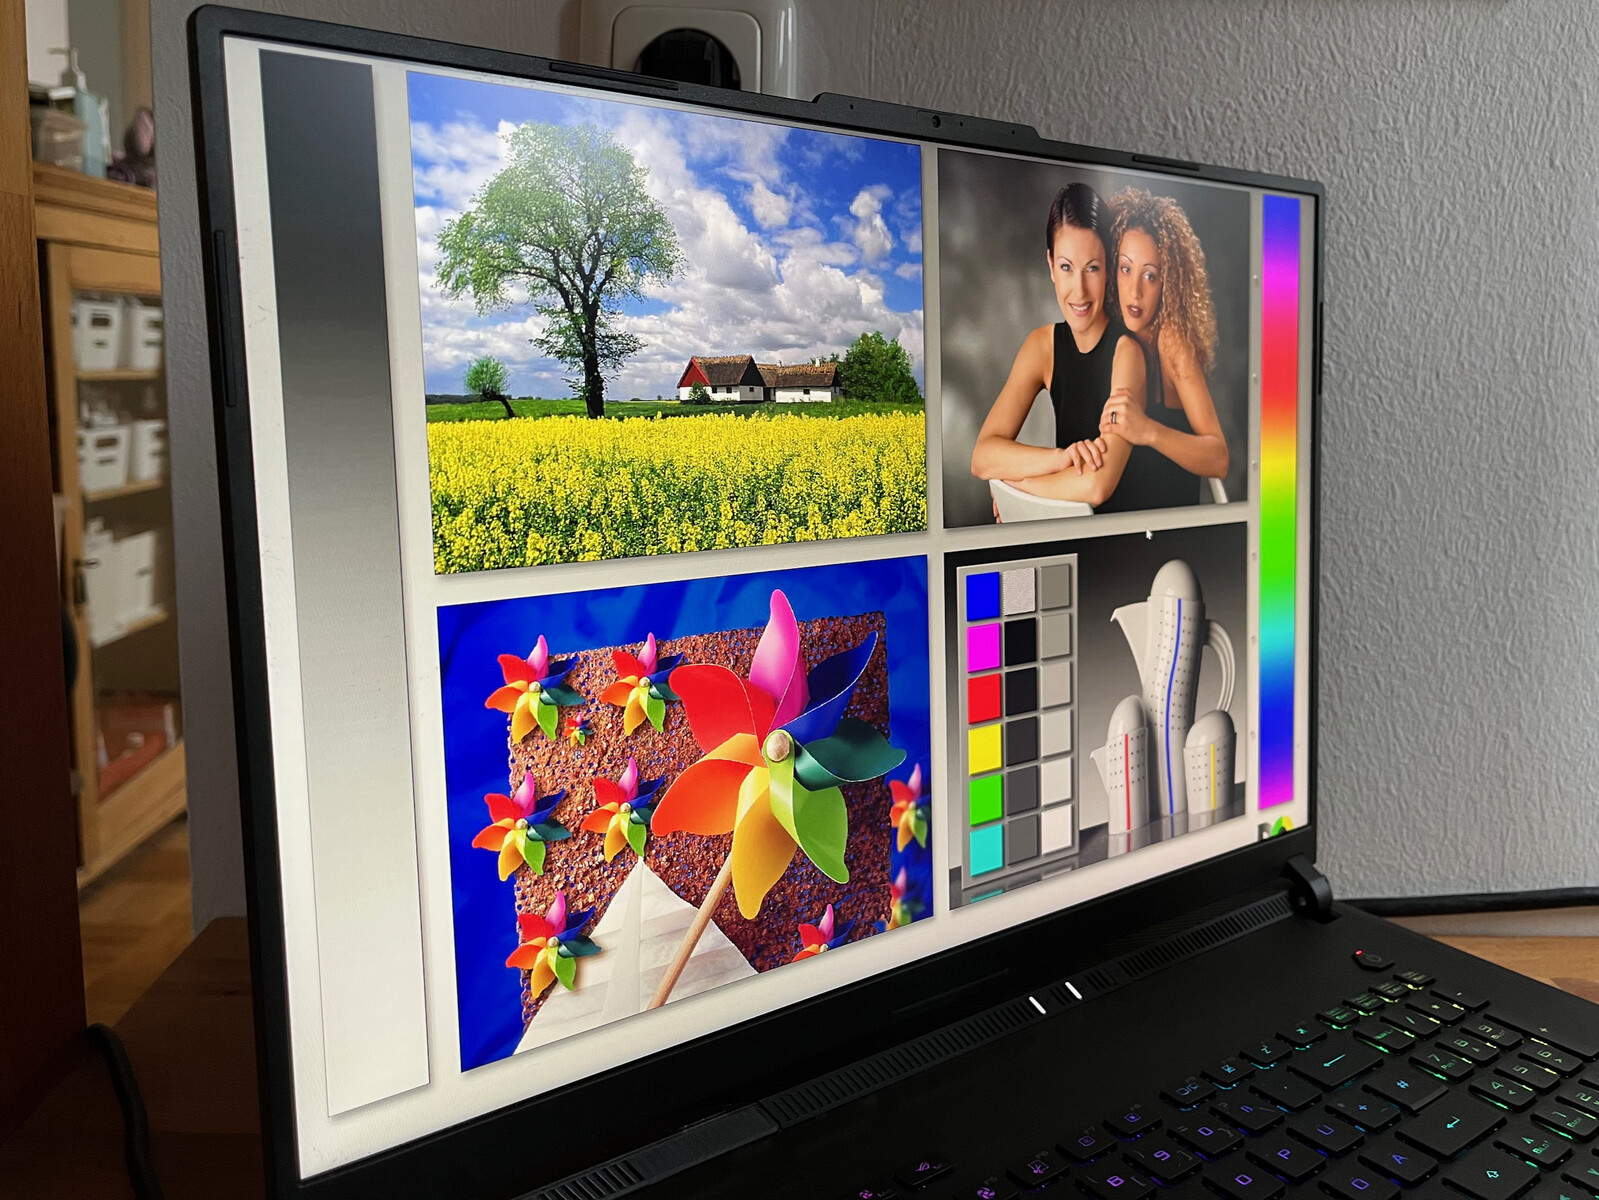
Le nouvel écran de 18 pouces présente de nombreuses caractéristiques telles que G-Sync, 240 Hz, QHD+, des temps de réponse rapides de 3 ms et une couverture de l'espace colorimétrique DCI-P3, selon la fiche technique. En termes de luminosité, le grand écran de 18 pouces n'atteint pas tout à fait les 500 nits promis. Cependant, la luminosité est toujours suffisante en intérieur, et la répartition de la luminosité est également bonne à 86 %. Notre unité de test n'a pas montré de saignement visible du rétroéclairage.
| |||||||||||||||||||||||||
Homogénéité de la luminosité: 86 %
Valeur mesurée au centre, sur batterie: 490 cd/m²
Contraste: 907:1 (Valeurs des noirs: 0.54 cd/m²)
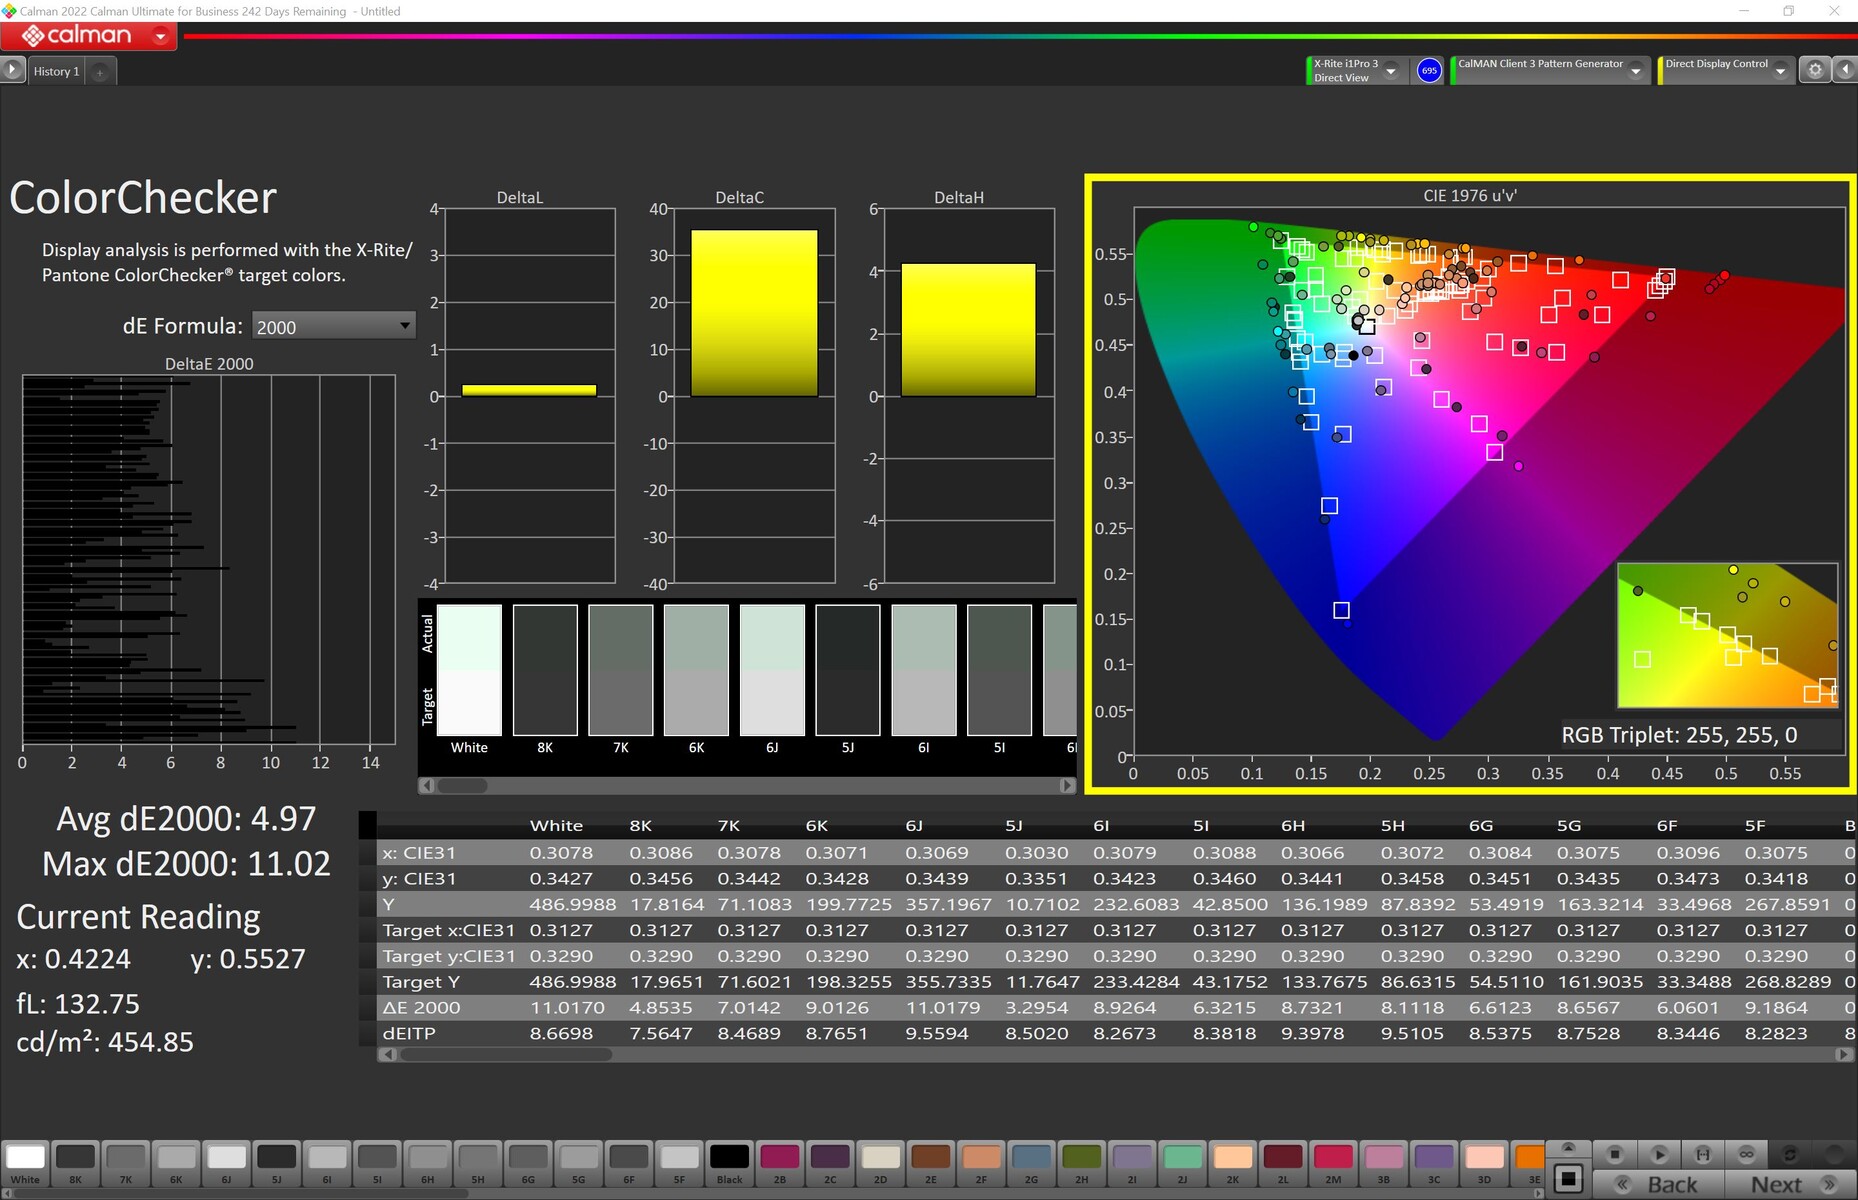
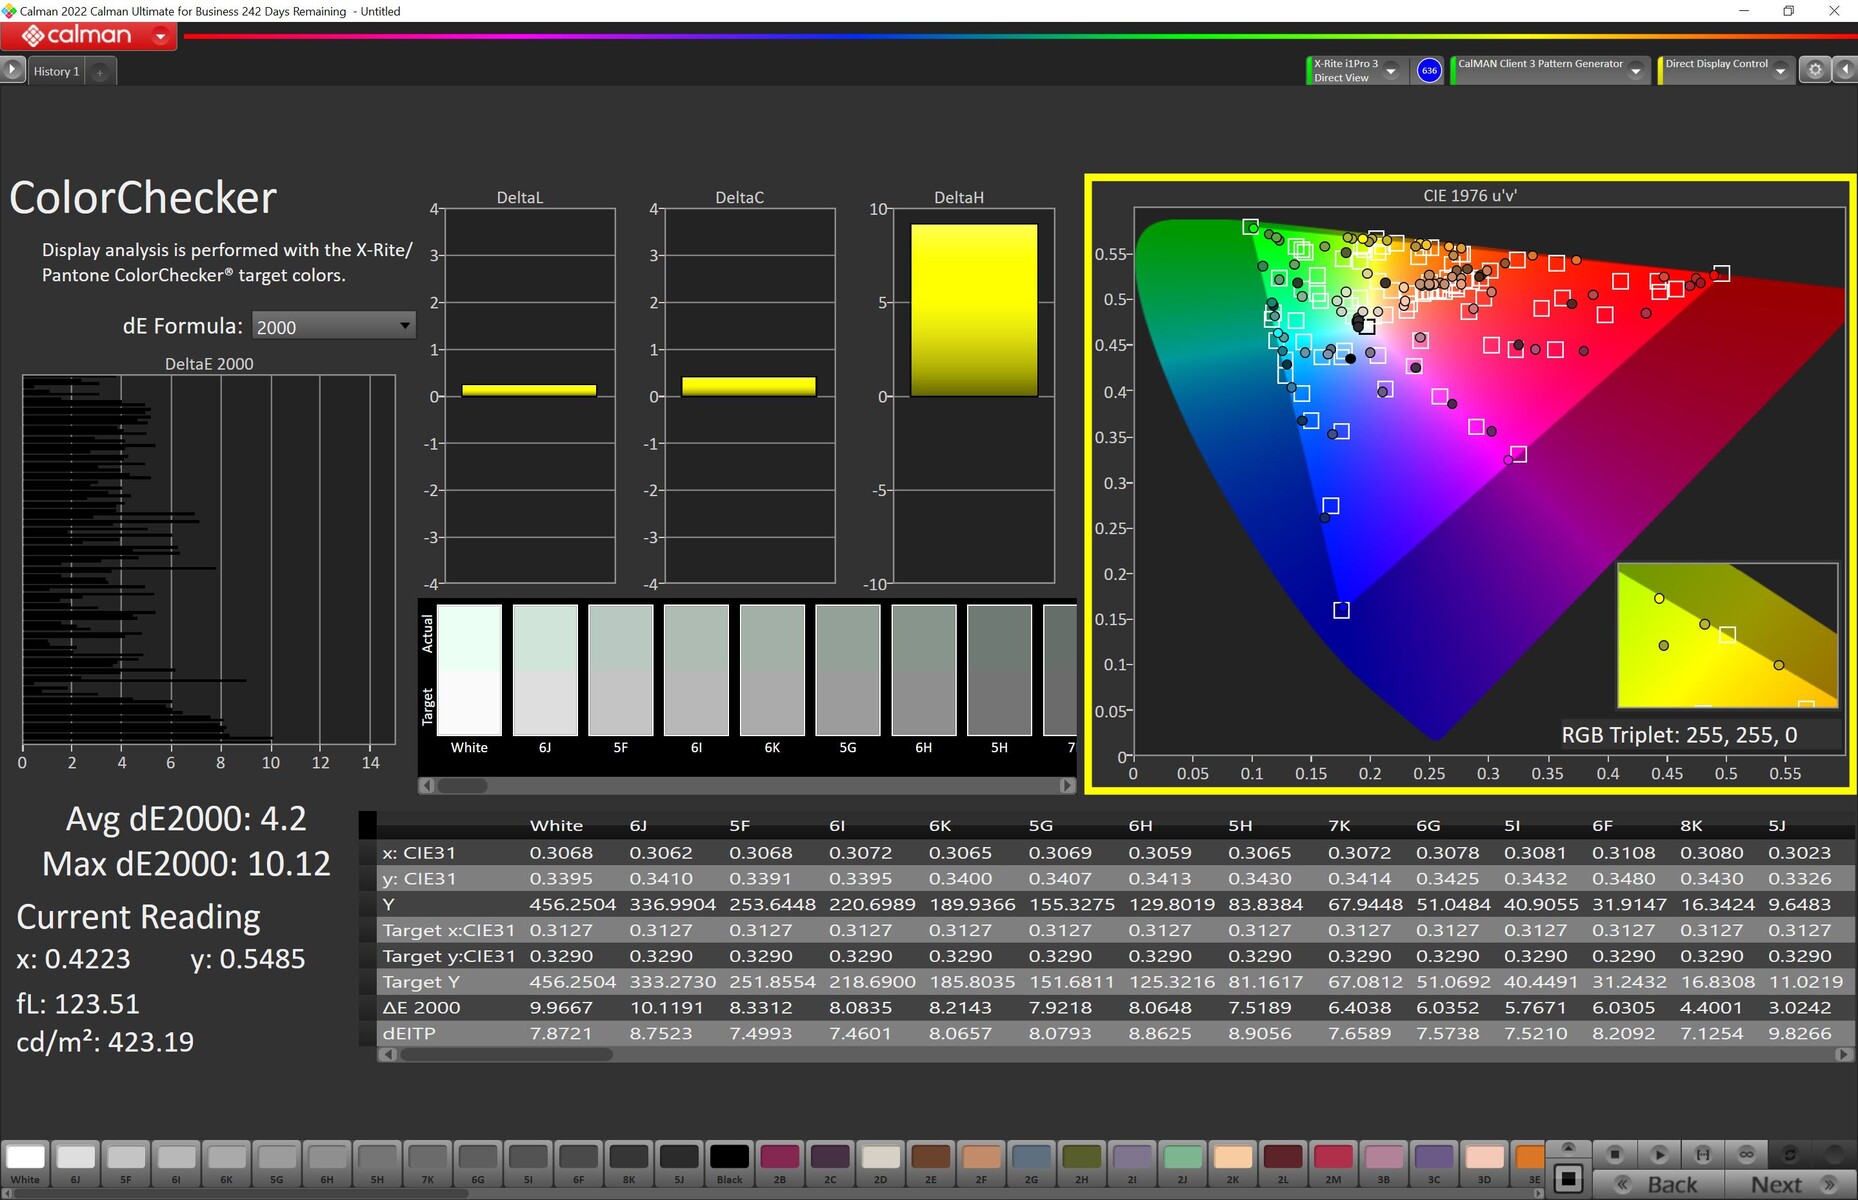
ΔE ColorChecker Calman: 4.97 | ∀{0.5-29.43 Ø4.71}
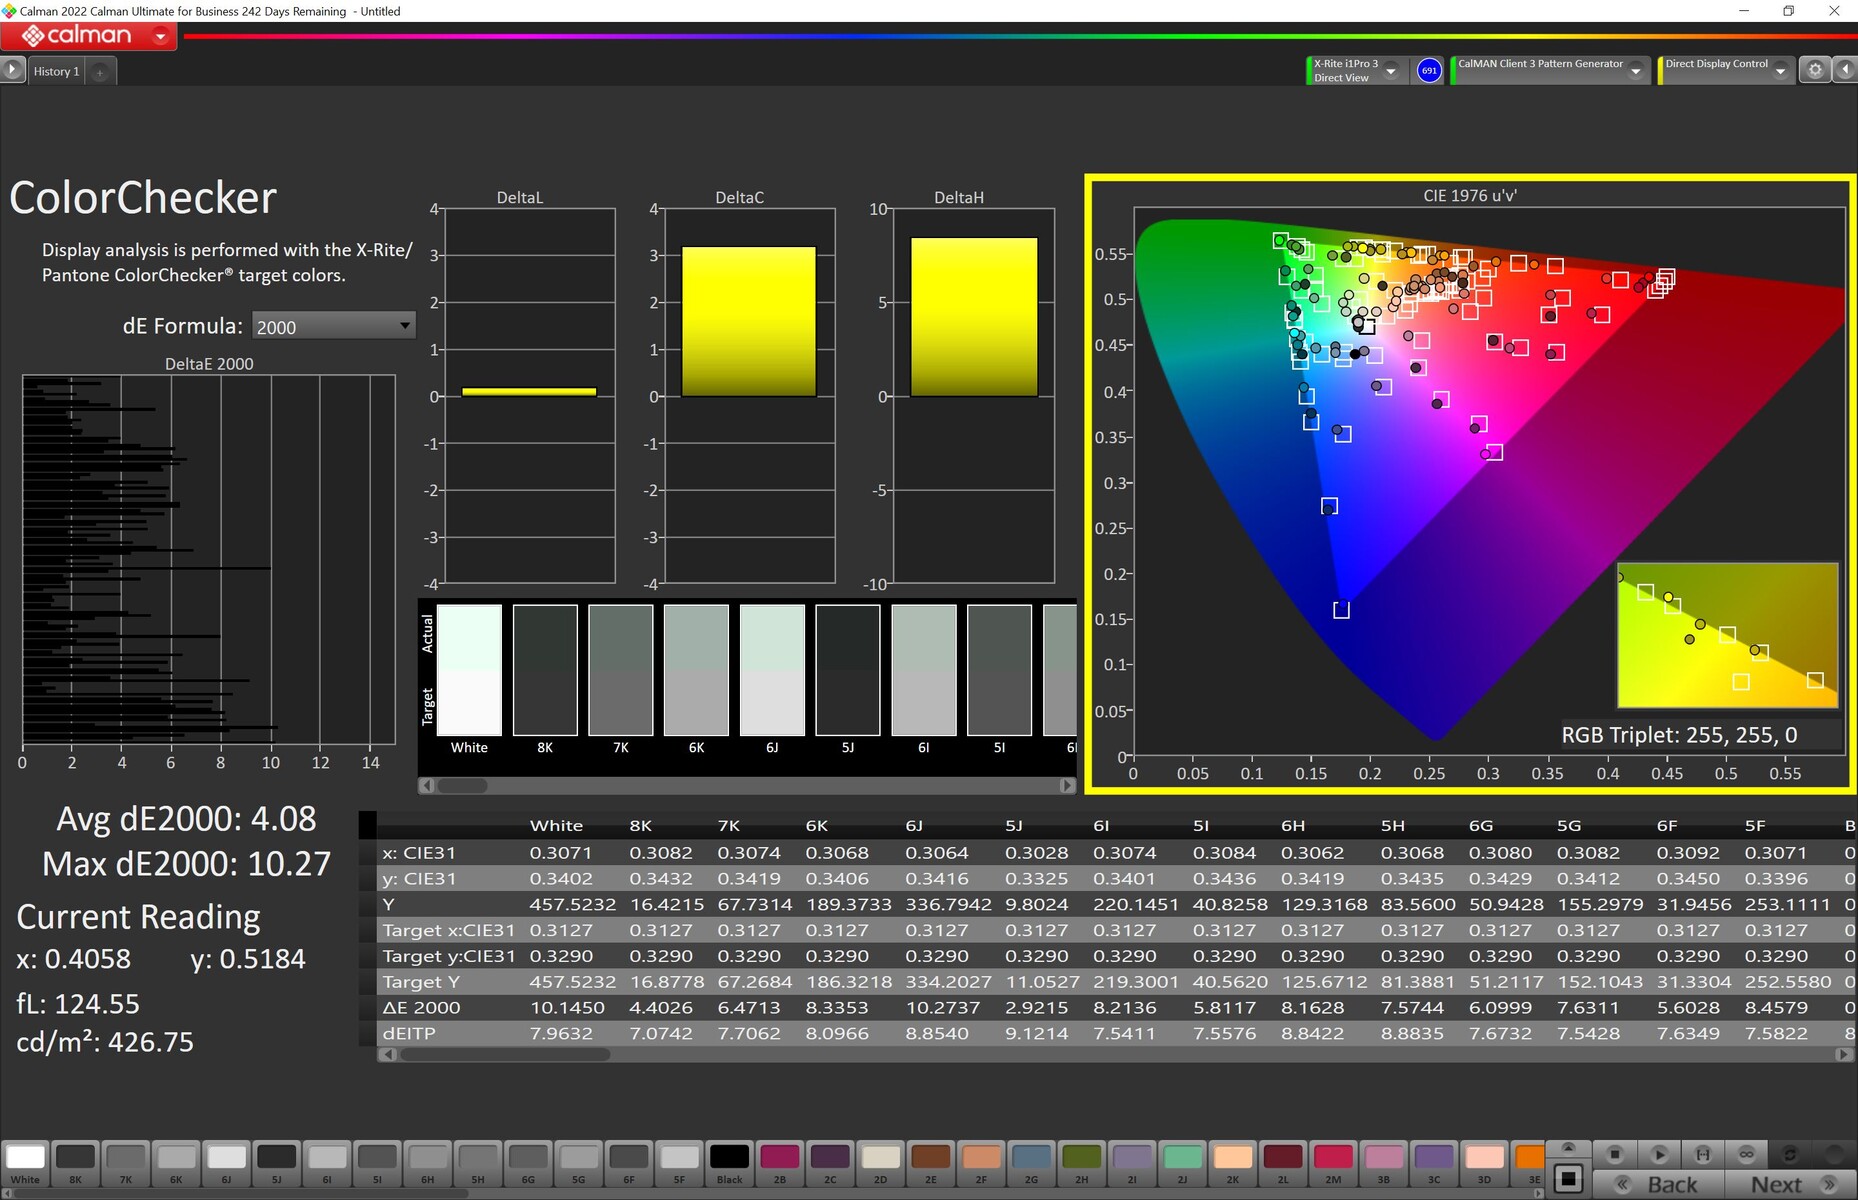
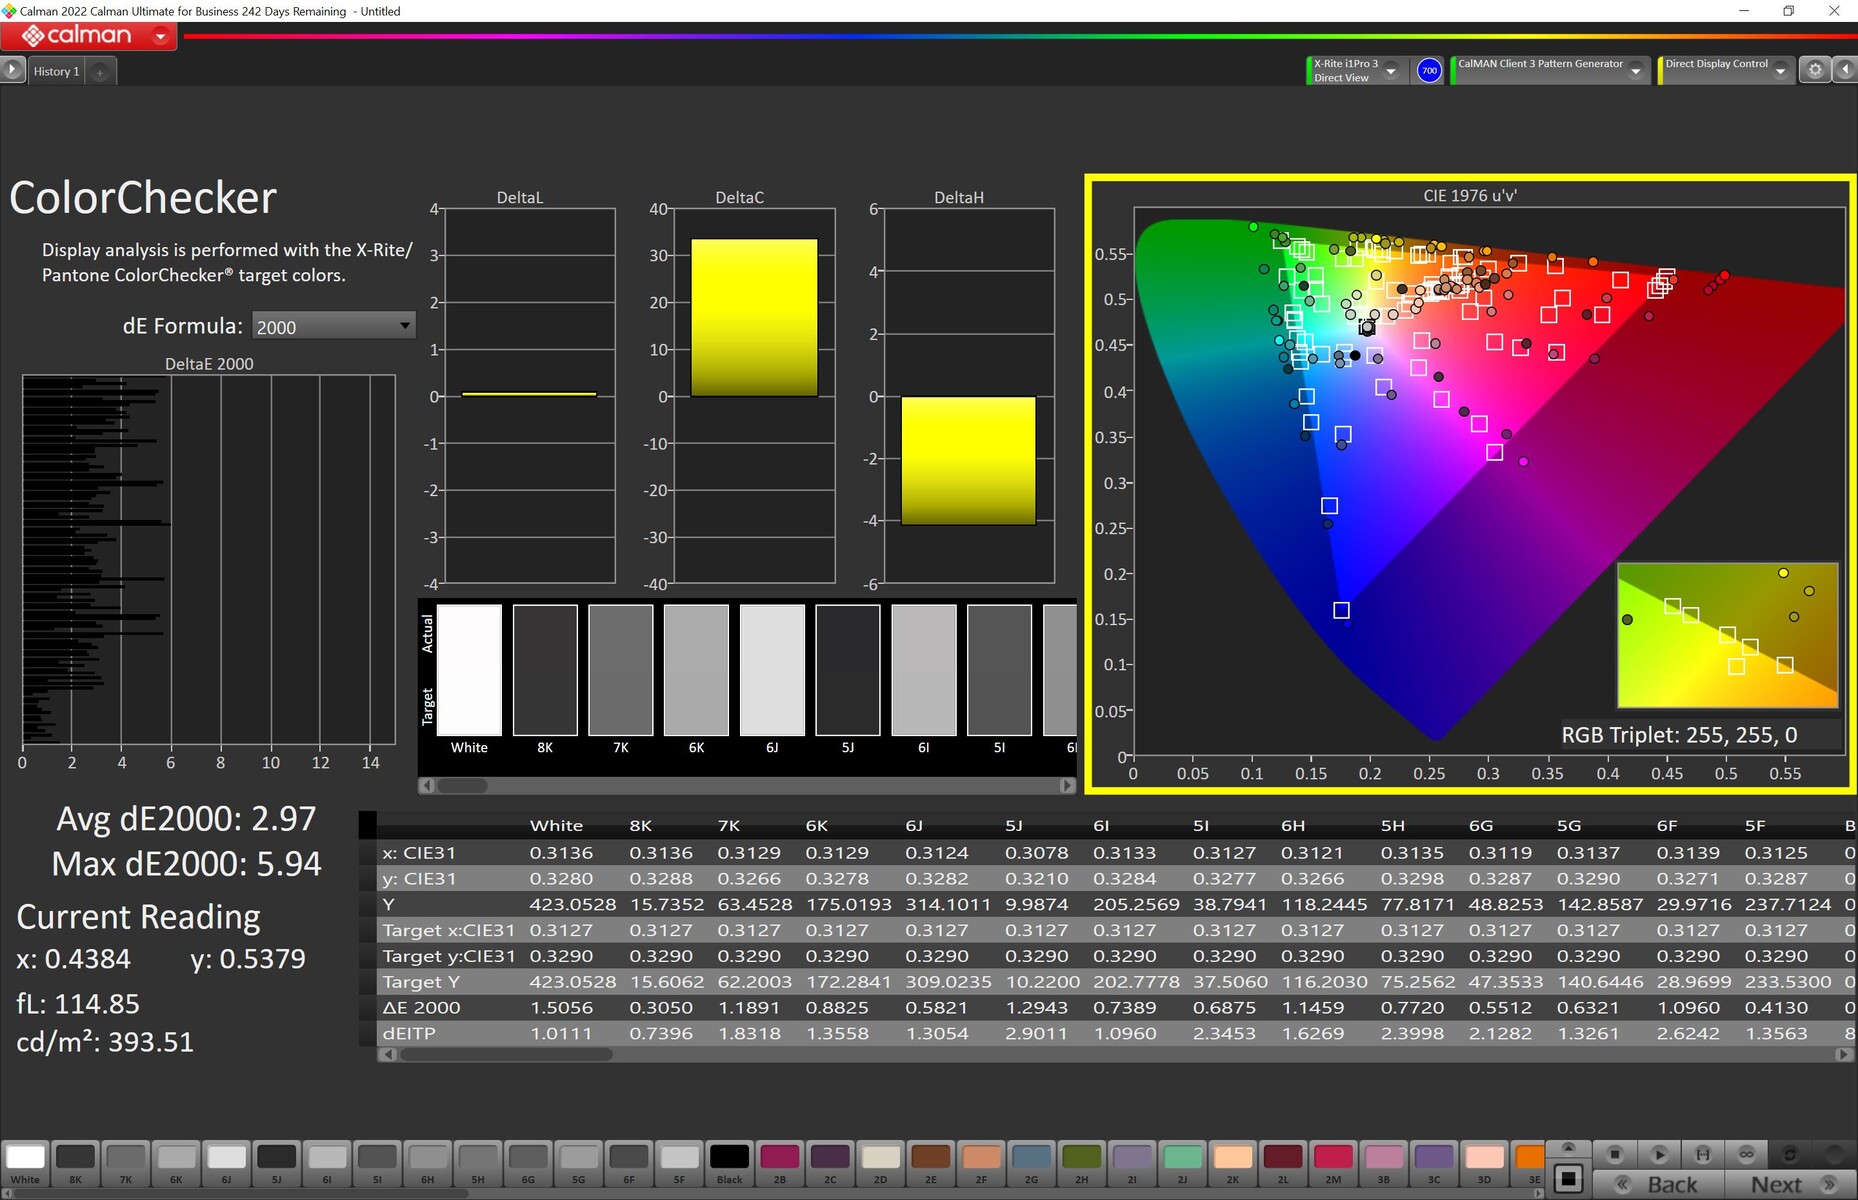
calibrated: 2.97
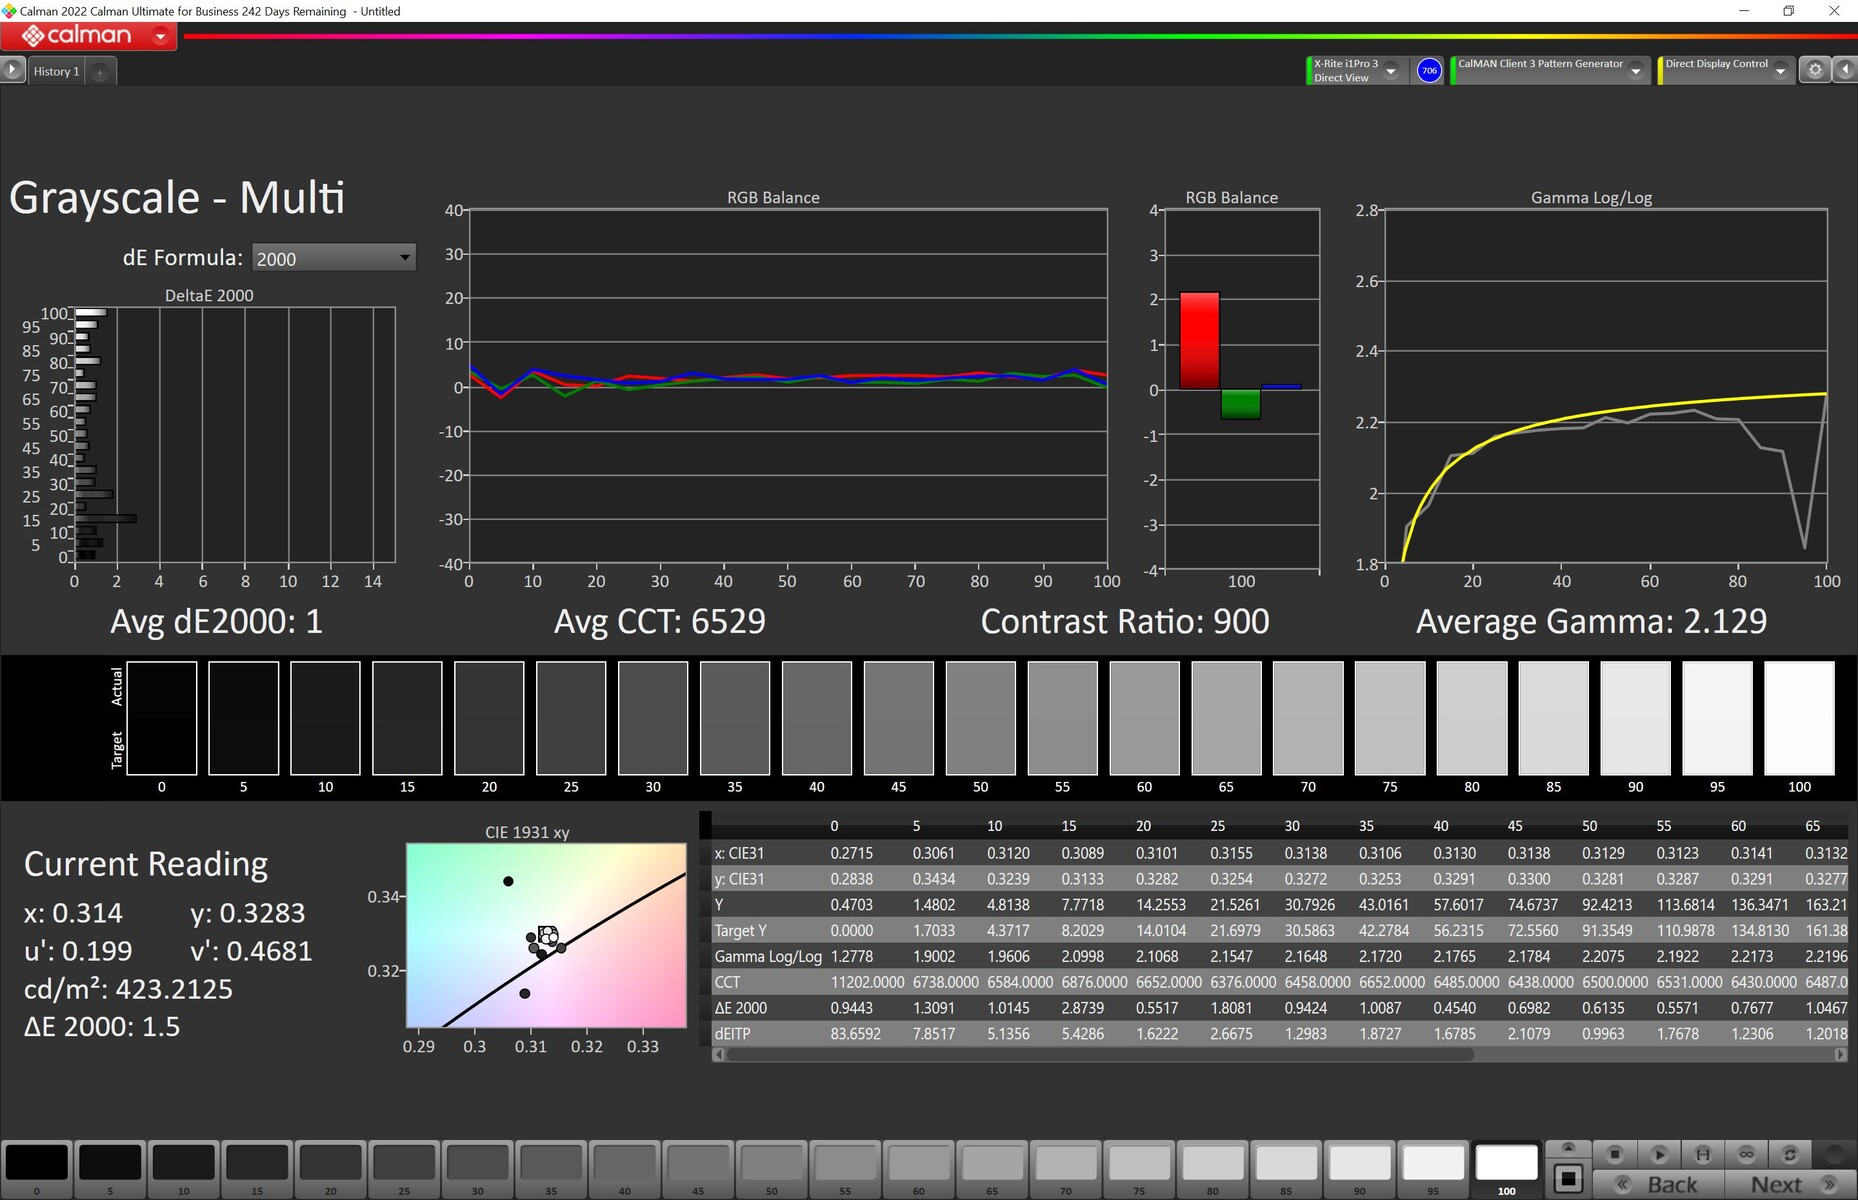
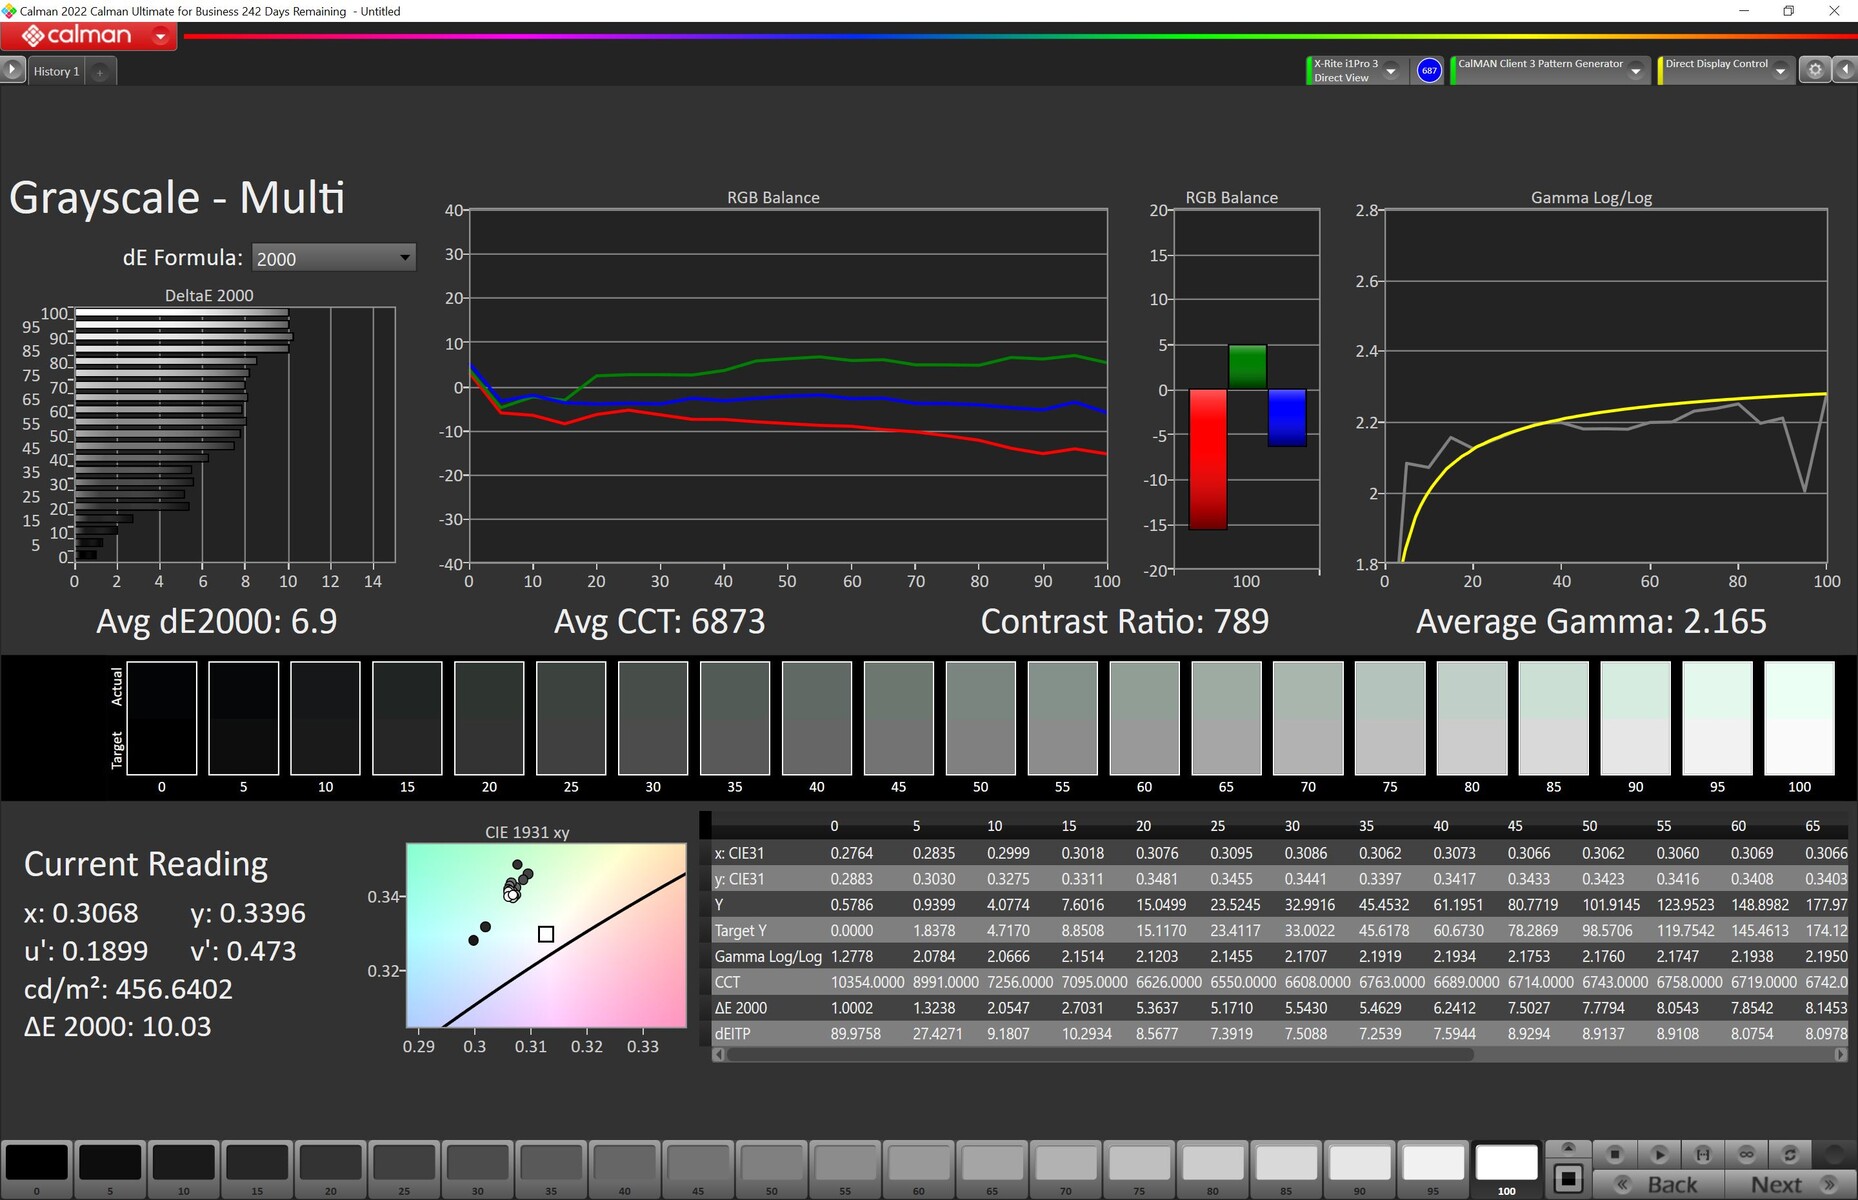
ΔE Greyscale Calman: 7.2 | ∀{0.09-98 Ø4.96}
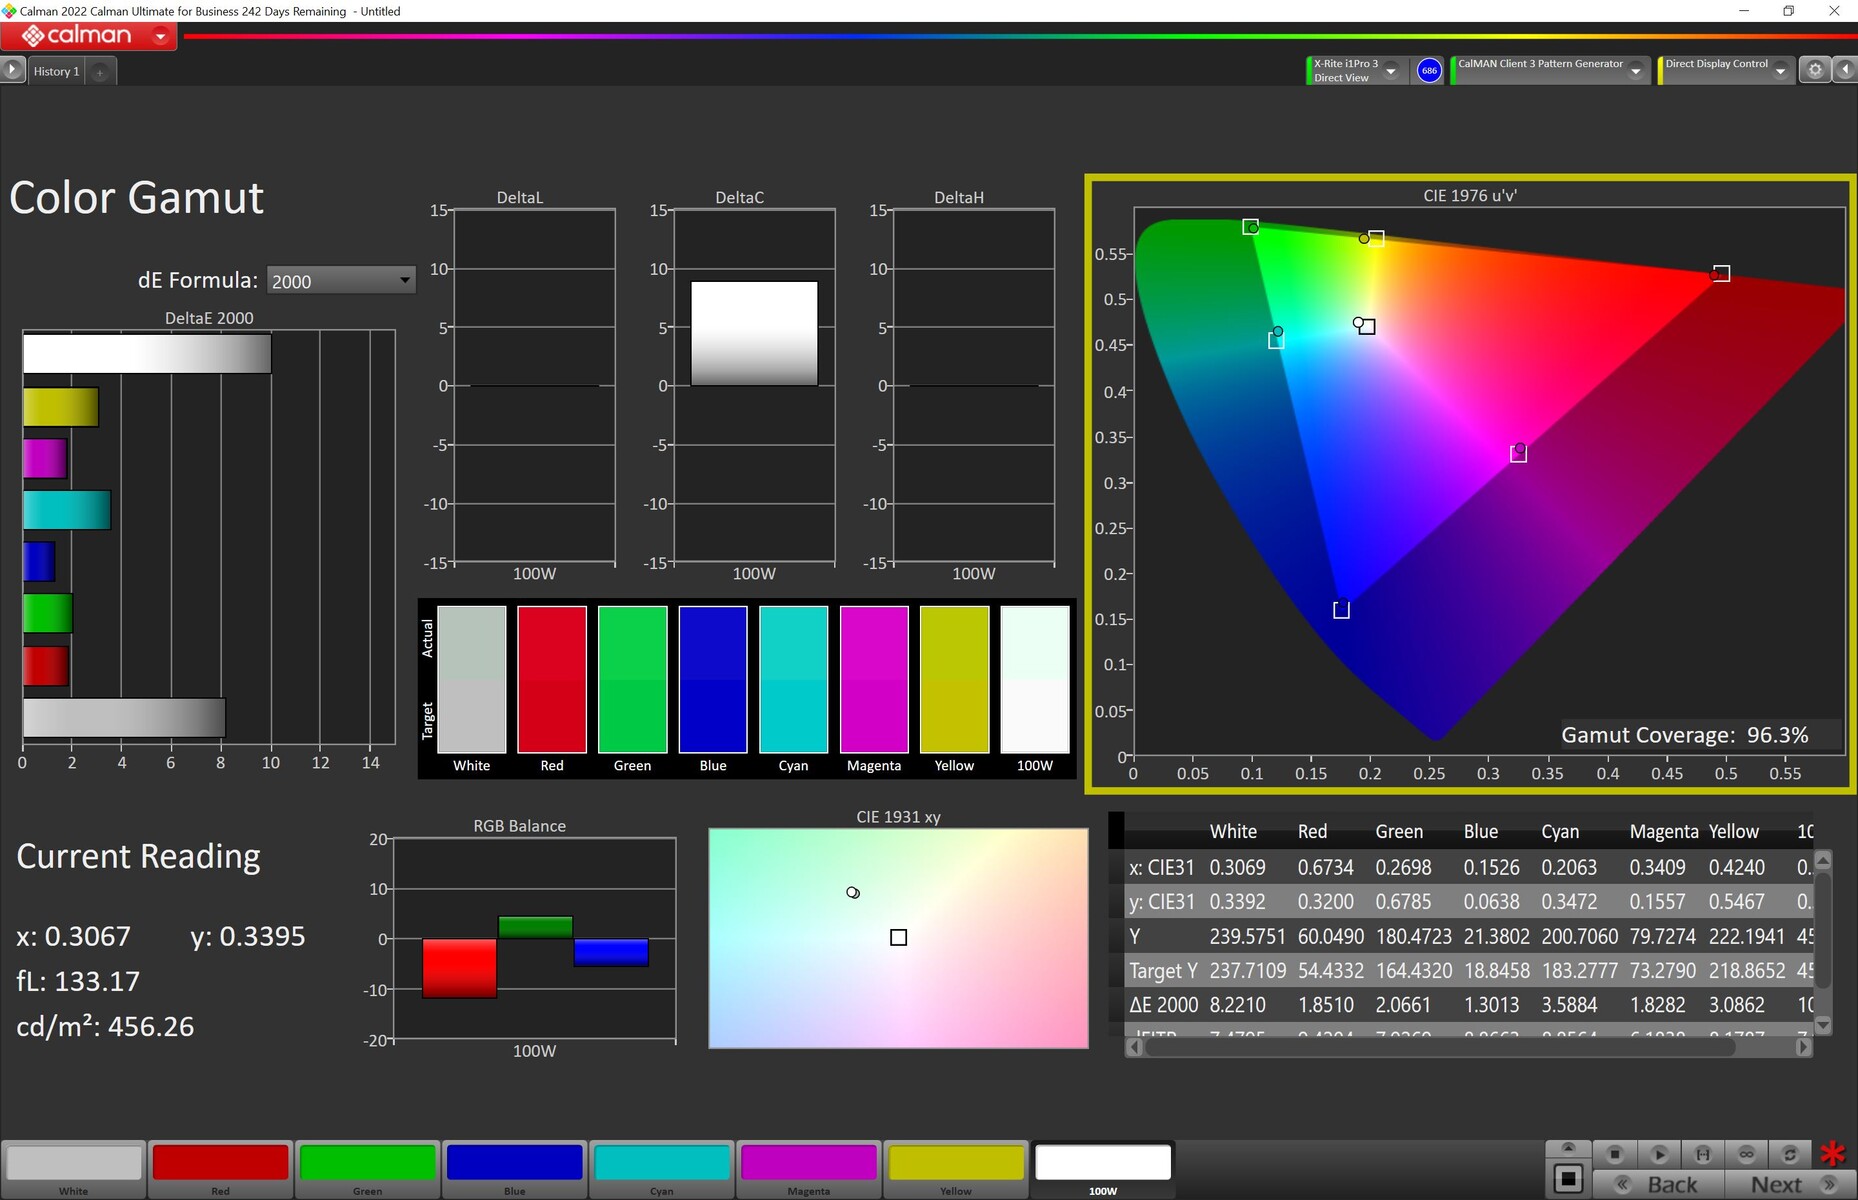
100% sRGB (Calman 2D)
84.9% AdobeRGB 1998 (Argyll 3D)
99.9% sRGB (Argyll 3D)
97.2% Display P3 (Argyll 3D)
Gamma: 2.161
CCT: 6515 K
| Asus ROG Strix Scar 18 2023 G834JY-N6005W NE180QDM-NZ2, IPS, 2560x1600, 18" | Razer Blade 18 RTX 4070 AU Optronics B180QAN01.0, IPS, 2560x1600, 18" | MSI Titan GT77 HX 13VI B173ZAN06.C, Mini-LED, 3840x2160, 17.3" | Asus ROG Strix Scar 17 SE G733CX-LL014W NE173QHM-NZ2, IPS, 2560x1440, 17.3" | |
|---|---|---|---|---|
| Display | 0% | 2% | 0% | |
| Display P3 Coverage (%) | 97.2 | 96.9 0% | 94.9 -2% | 97.1 0% |
| sRGB Coverage (%) | 99.9 | 99.8 0% | 99.9 0% | 99.9 0% |
| AdobeRGB 1998 Coverage (%) | 84.9 | 85.3 0% | 92.4 9% | 84.8 0% |
| Response Times | 15% | -410% | -11% | |
| Response Time Grey 50% / Grey 80% * (ms) | 5.41 ? | 4.2 ? 22% | 38.4 ? -610% | 5.7 ? -5% |
| Response Time Black / White * (ms) | 8.62 ? | 8 ? 7% | 26.6 ? -209% | 10.1 ? -17% |
| PWM Frequency (Hz) | 2380 ? | |||
| Screen | 22% | 74253% | 29% | |
| Brightness middle (cd/m²) | 490 | 549.6 12% | 606 24% | 320 -35% |
| Brightness (cd/m²) | 468 | 524 12% | 602 29% | 303 -35% |
| Brightness Distribution (%) | 86 | 89 3% | 93 8% | 87 1% |
| Black Level * (cd/m²) | 0.54 | 0.53 2% | 0.0001 100% | 0.3 44% |
| Contrast (:1) | 907 | 1037 14% | 6060000 668037% | 1067 18% |
| Colorchecker dE 2000 * | 4.97 | 3.32 33% | 4.8 3% | 1.1 78% |
| Colorchecker dE 2000 max. * | 11.02 | 6.63 40% | 8.2 26% | 2.7 75% |
| Colorchecker dE 2000 calibrated * | 2.97 | 2.7 9% | 1.8 39% | |
| Greyscale dE 2000 * | 7.2 | 2 72% | 6.5 10% | 1.1 85% |
| Gamma | 2.161 102% | 2.29 96% | 2.63 84% | 2.13 103% |
| CCT | 6515 100% | 6319 103% | 6596 99% | 6599 98% |
| Moyenne finale (programmes/paramètres) | 12% /
16% | 24615% /
47676% | 6% /
16% |
* ... Moindre est la valeur, meilleures sont les performances
L'espace colorimétrique mesuré couvre l'espace colorimétrique Display-P3 à 97 % et convient donc également aux tâches exigeantes (après un calibrage). En termes de précision des couleurs, le résultat dépend du préréglage utilisé. Dans l'outil Armory Crate, Asus propose quatre modes différents sous GameVisual : Natif, sRGB, DCI-P3 et Display P3. En mode Natif, l'écran de notre appareil de test présentait une teinte bleue facilement perceptible et mesurable qui se manifestait également par une valeur ΔE de près de 5. Après le calibrage avec notre i1Pro 3, nous avons obtenu un résultat nettement amélioré - notamment aussi dans les valeurs extrêmes. Après l'étalonnage, l'écran est également adapté au traitement d'images.

Dans le panneau NE180QDM-NZ2 utilisé ici, la luminosité de l'écran n'est pas contrôlée par PWM, et nous n'avons pas remarqué de scintillement avec notre appareil de mesure (sur tous les niveaux de luminosité). Nous avons pu confirmer le temps de réponse promis de 3 ms pendant les changements de gris. Pour y parvenir, Asus utilise une surmultiplication minimale, mais nous n'avons pas remarqué d'effets négatifs. En combinaison avec le taux de rafraîchissement de 240-Hz, l'écran est donc idéal pour le jeu.
Temps de réponse de l'écran
| ↔ Temps de réponse noir à blanc | ||
|---|---|---|
| 8.62 ms ... hausse ↗ et chute ↘ combinées | ↗ 3.68 ms hausse | 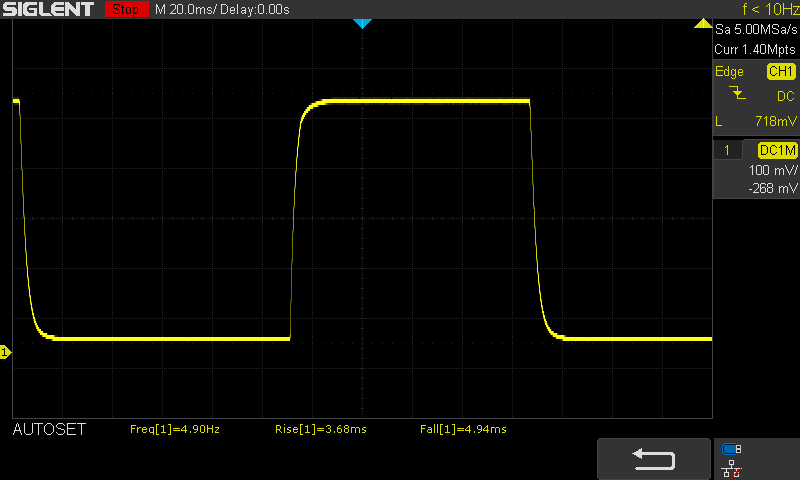 |
| ↘ 4.94 ms chute | ||
| L'écran montre de faibles temps de réponse, un bon écran pour jouer. En comparaison, tous les appareils testés affichent entre 0.1 (minimum) et 240 (maximum) ms. » 24 % des appareils testés affichent de meilleures performances. Cela signifie que les latences relevées sont meilleures que la moyenne (19.8 ms) de tous les appareils testés. | ||
| ↔ Temps de réponse gris 50% à gris 80% | ||
| 5.41 ms ... hausse ↗ et chute ↘ combinées | ↗ 2.57 ms hausse | 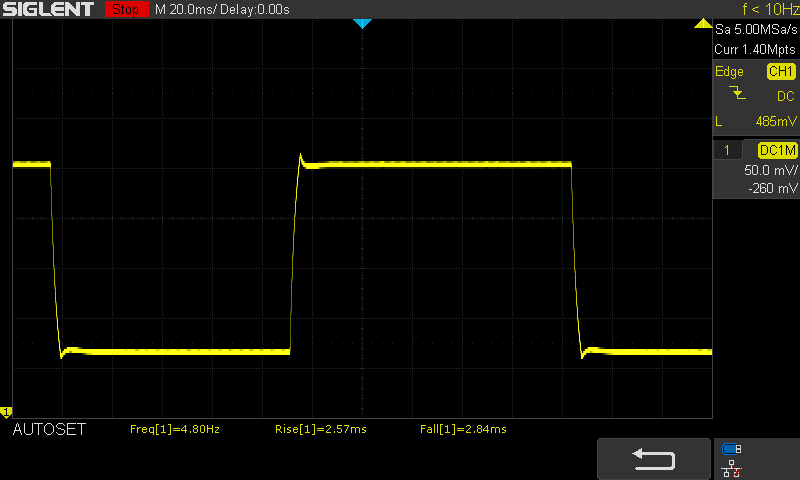 |
| ↘ 2.84 ms chute | ||
| L'écran montre de très faibles temps de réponse, parfait pour le jeu. En comparaison, tous les appareils testés affichent entre 0.165 (minimum) et 636 (maximum) ms. » 18 % des appareils testés affichent de meilleures performances. Cela signifie que les latences relevées sont meilleures que la moyenne (30.9 ms) de tous les appareils testés. | ||
Scintillement / MLI (Modulation de largeur d'impulsion)
| Scintillement / MLI (Modulation de largeur d'impulsion) non décelé |  | ||
En comparaison, 52 % des appareils testés n'emploient pas MDI pour assombrir leur écran. Nous avons relevé une moyenne à 7741 (minimum : 5 - maximum : 343500) Hz dans le cas où une MDI était active. | |||
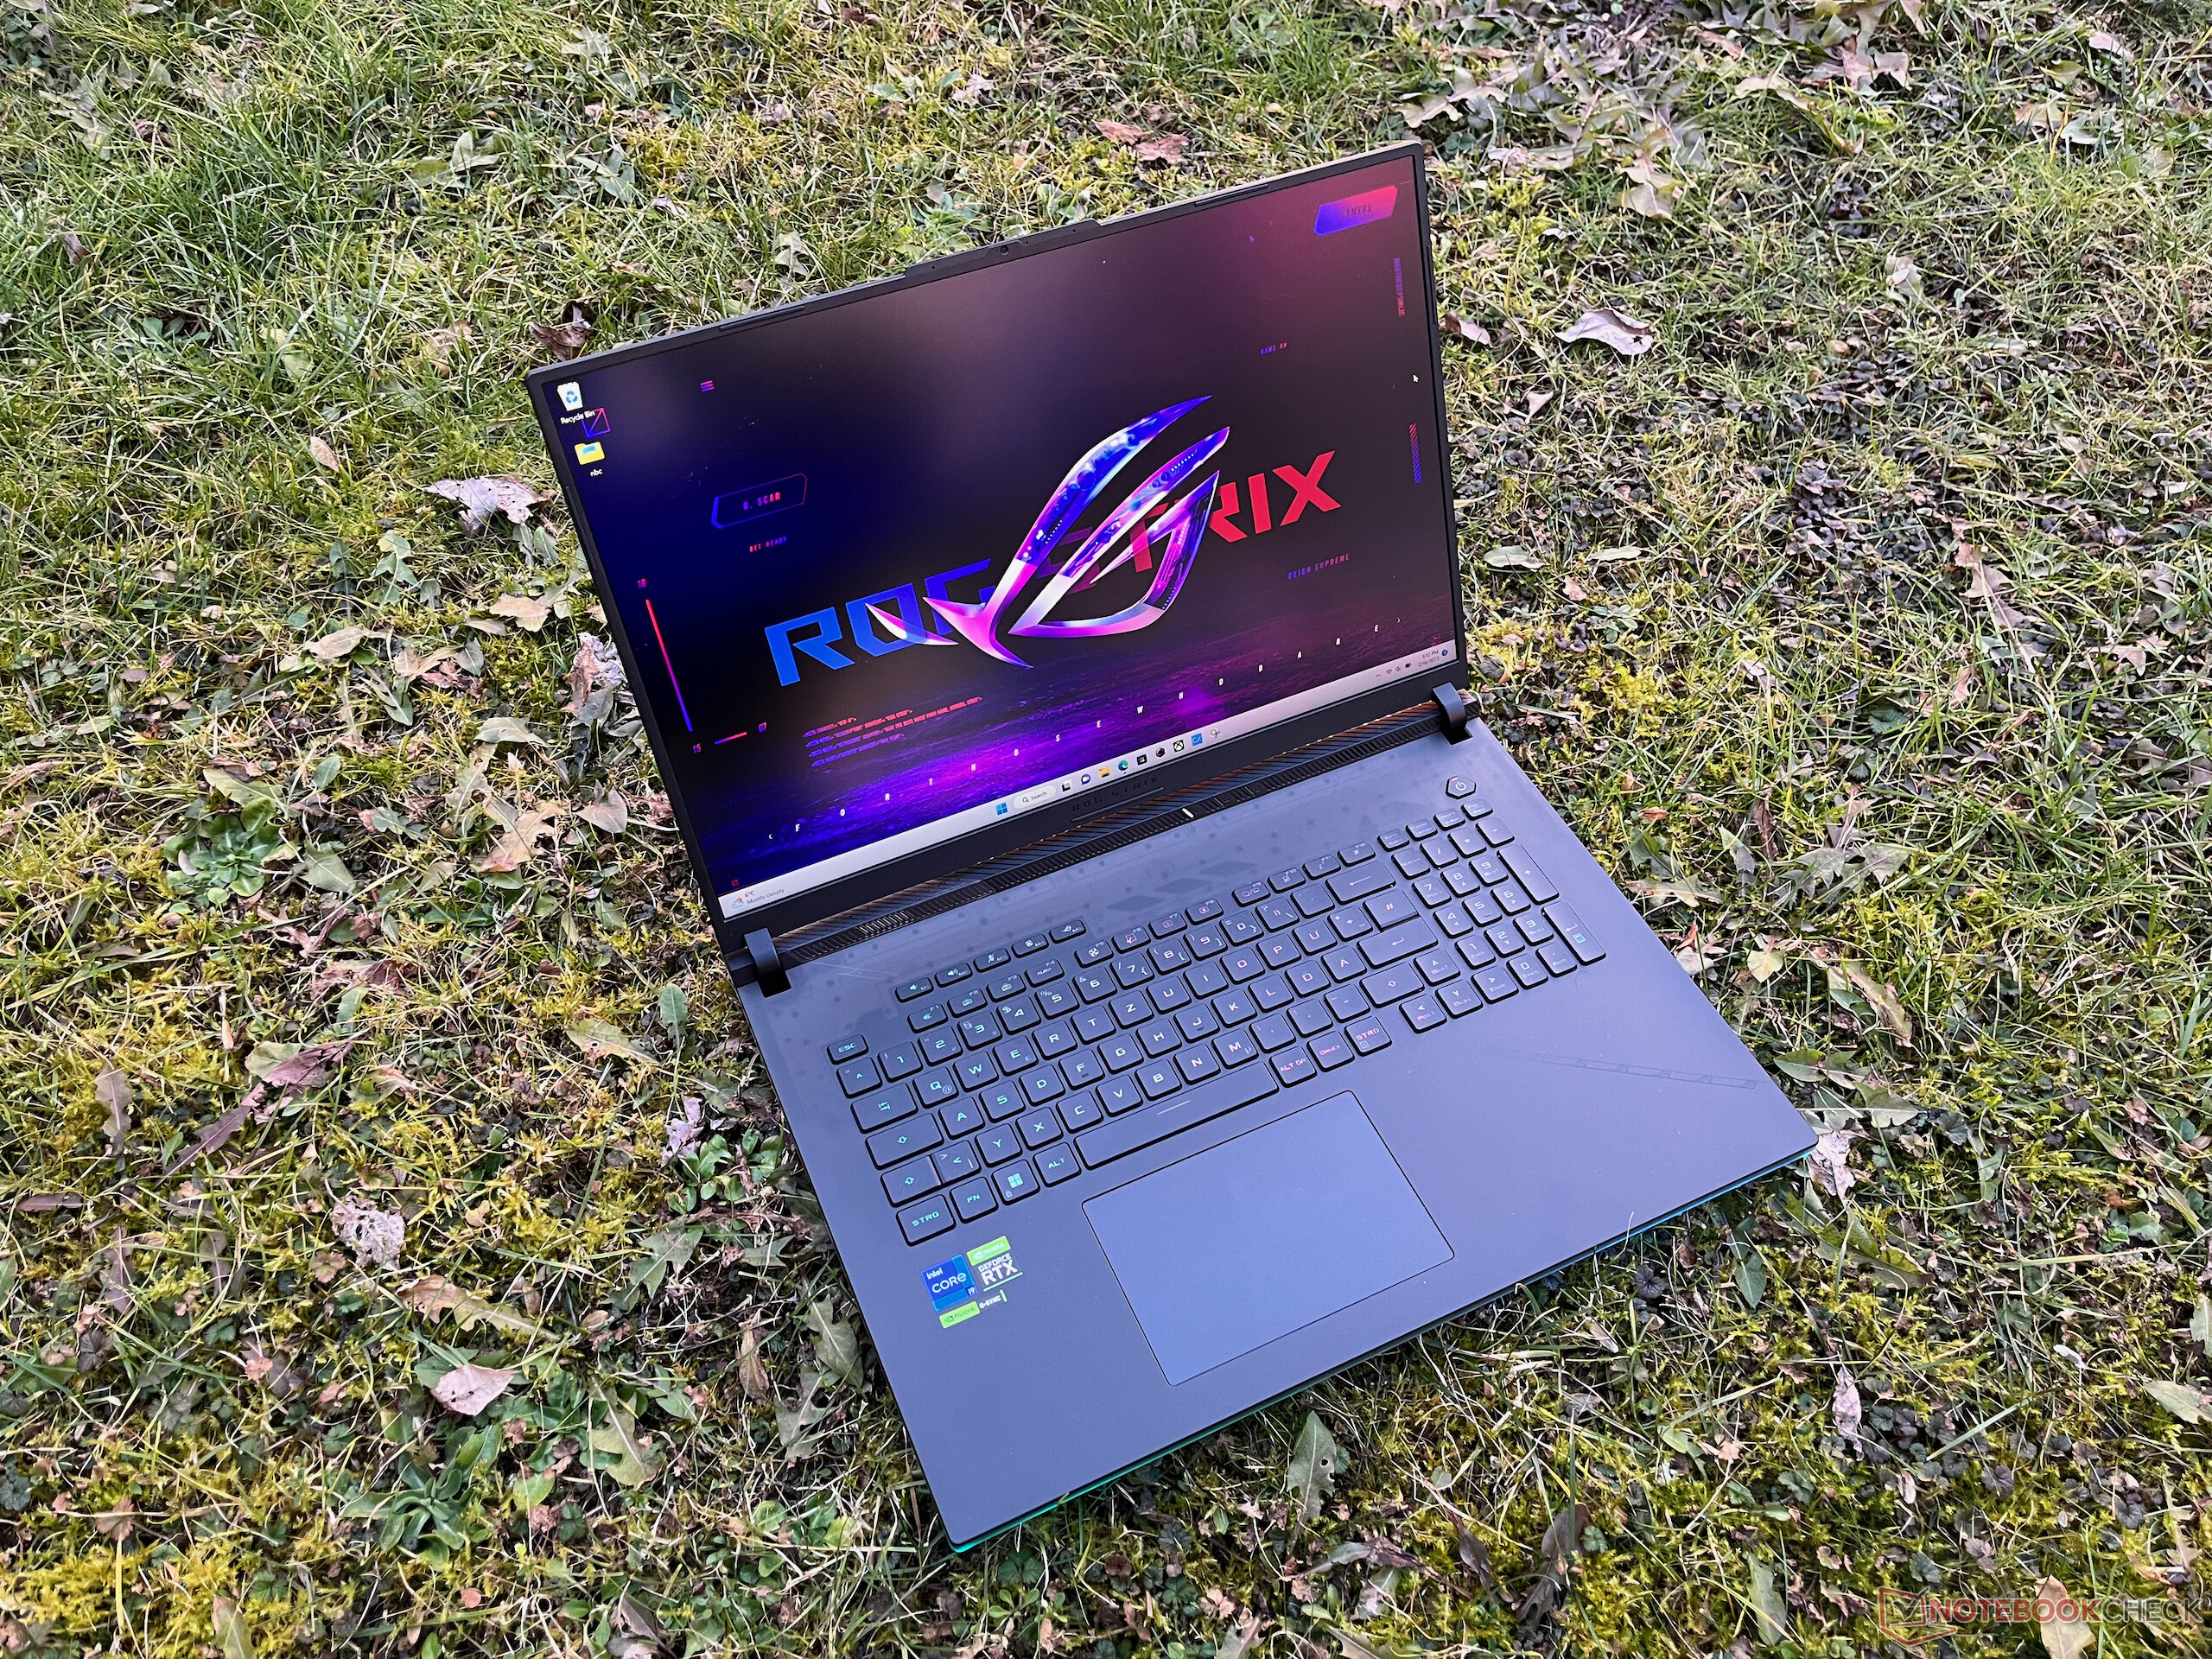
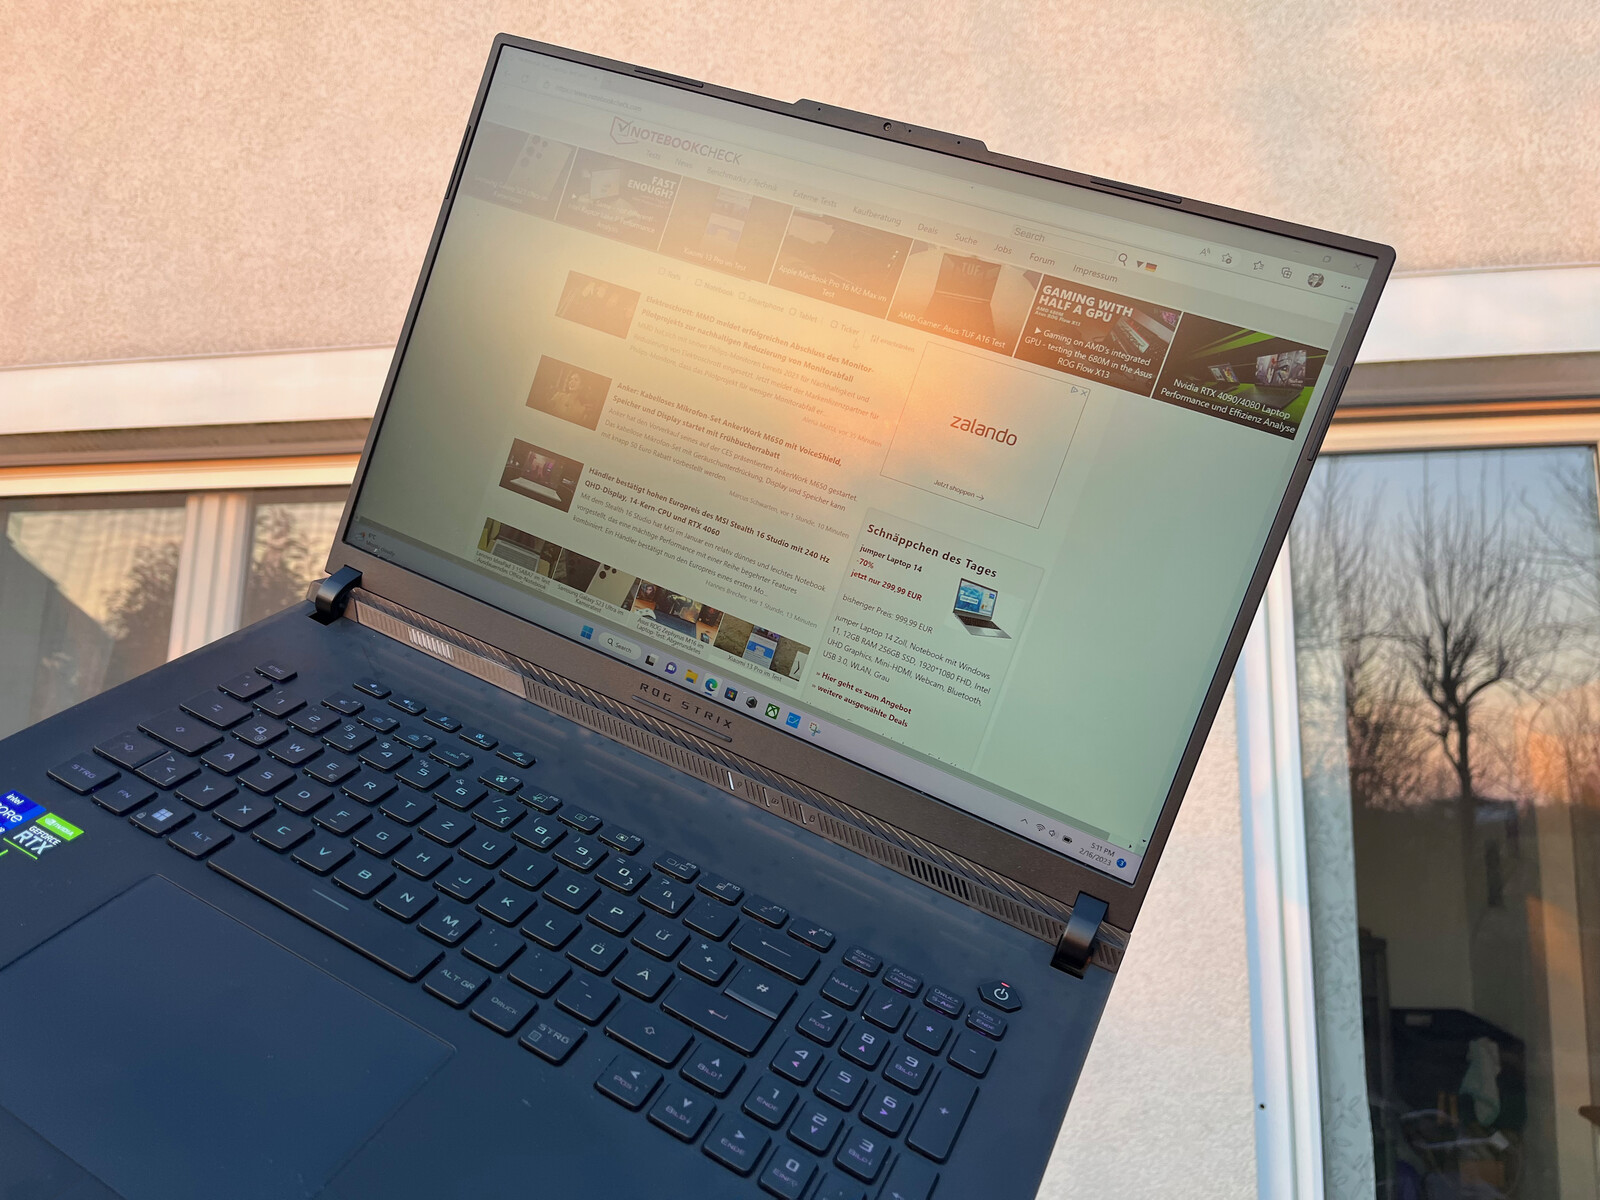
Grâce à la surface d'affichage mate et à la bonne luminosité maximale, le ROG Strix Scar 18 peut théoriquement aussi être utilisé facilement en extérieur. Bien que près de 500 nits soient insuffisants pour le grand soleil d'été, ils sont tout à fait suffisants à l'ombre ou au soleil du soir comme sur notre photo.
Grâce à la dalle de niveau IPS, les angles de vision sont excellents. La perte de luminosité due aux angles de vision abrupts reste dans les limites, et les distorsions de couleur ne sont pas perceptibles subjectivement.

Performance
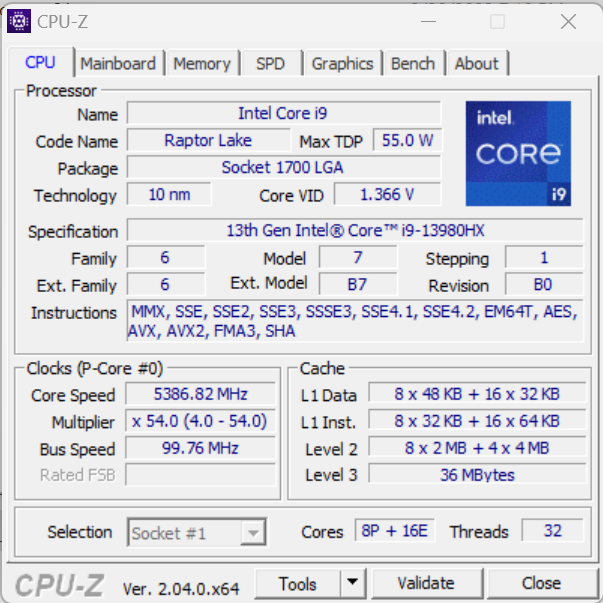
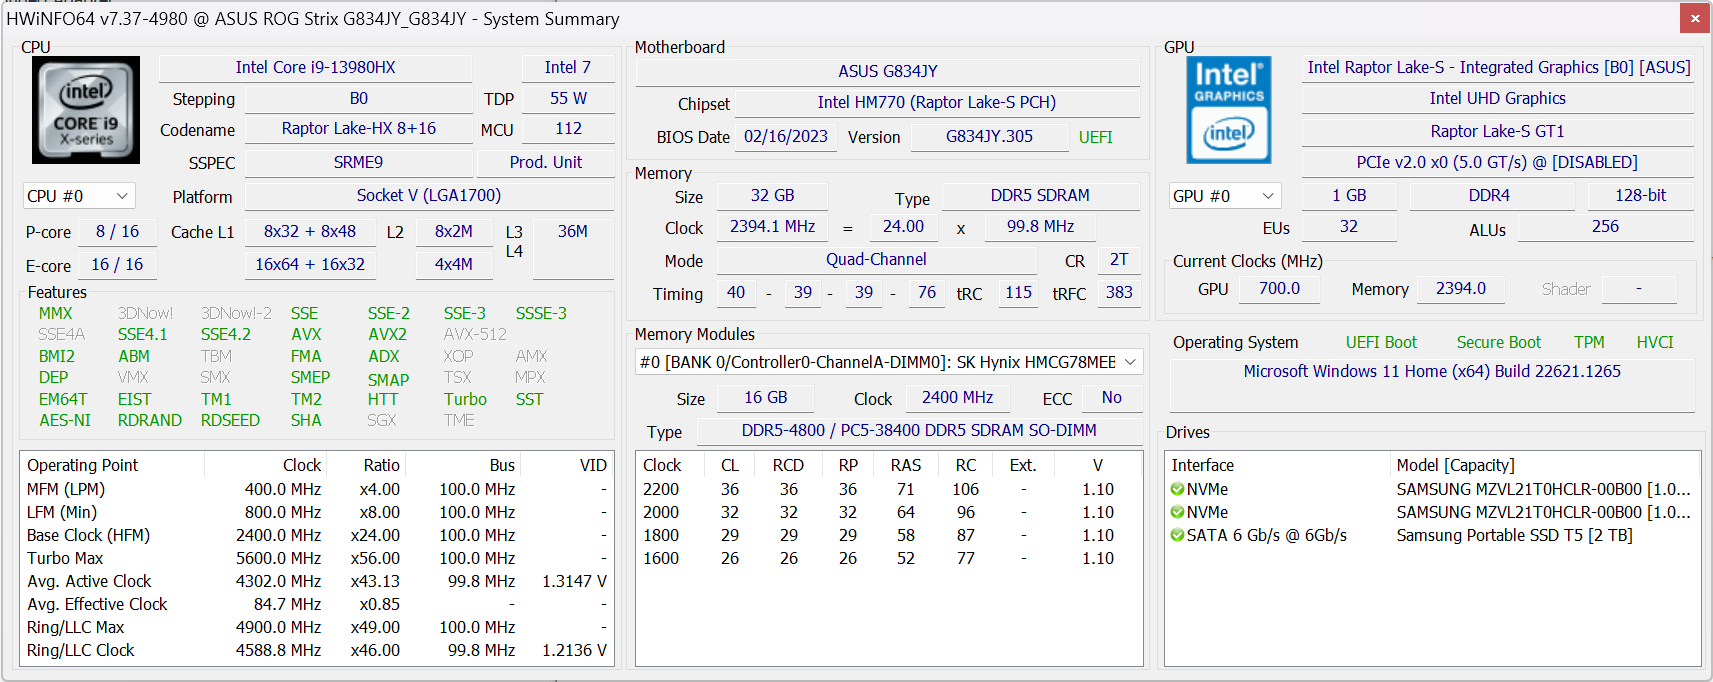
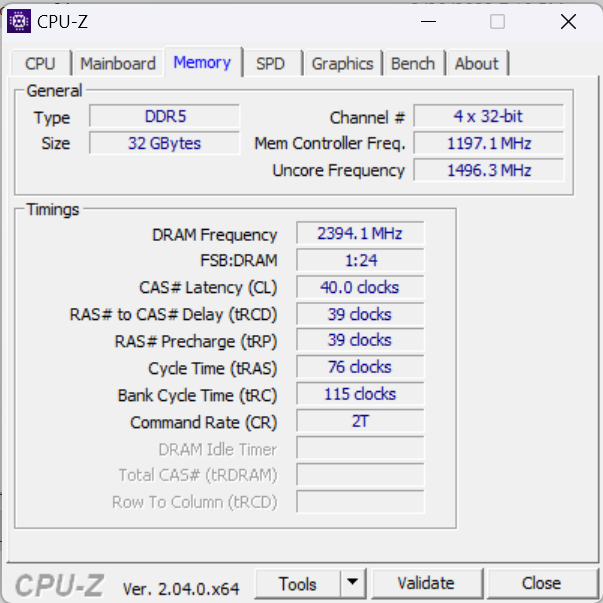
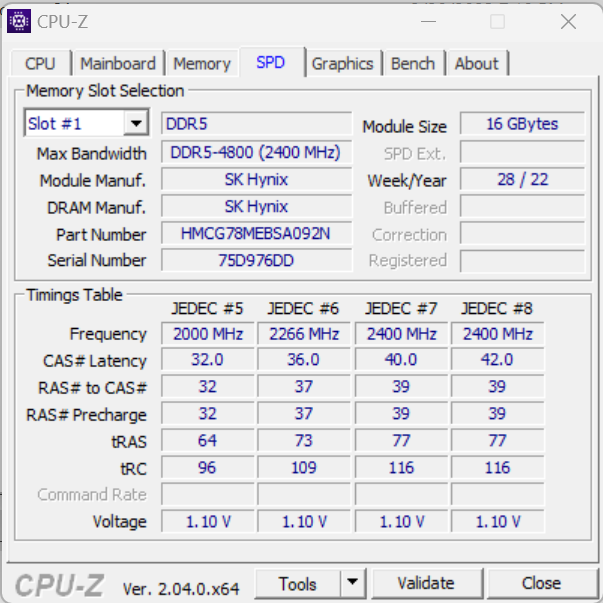
Notre unité de test du Scar 18 est capable de marquer plusieurs fois des points dans les mesures de performance. Asus utilise la carte graphique mobile la plus rapide actuellement, la GeForce RTX 4090, permettant également une consommation maximale de 175 watts. Asus n'a pas non plus lésiné sur le processeur, utilisant le modèle mobile haut de gamme d'Intel. LeIntel Core i9-13980HXest basé sur la nouvelle série Raptor Lake, offrant 24 cœurs et un boost maximal de 5,6 GHz, ce qui est considérable. La quantité de stockage est également considérable avec 32 Go de mémoire vive DDR5. Cependant, avec 4800 Mo/s, la vitesse de stockage est légèrement inférieure à celle de certains modèles de la concurrence. Enfin, on trouve également deux SSD de 1 To dans un système RAID-0.
Conditions d'essai
Nous avons effectué nos tests de performance en mode Turbo et en mode Ultimate GPU. Dans ce dernier, la connexion de la RTX 4090 est fixée via MUX et overclockée de façon minimale de 50 MHz. En outre, nous avons également testé le mode Performance (par défaut dans l'état de livraison) et le mode Standard GPU (commutation MSHybrid Optimus).
Processeur
Le siteIntel Core i9-13980HX est le modèle haut de gamme actuel d'Intel pour les ordinateurs portables. Il est basé sur la nouvelle série Raptor Lake et est techniquement comparable au Core i9-13900K pour ordinateurs de bureau. Le processeur contient 8 cœurs Raptor Cove Performance avec Hyper-Threading et une vitesse d'horloge allant jusqu'à 5,6 GHz. Les cœurs Gracemont Efficiency, plus petits, n'offrent pas d'Hyper-Threading et ont une vitesse d'horloge allant jusqu'à 4 GHz. Au total, le CPU est capable d'utiliser 32 Mo de cache de niveau 2 et est spécifié par Intel à 157 watts (PL2) et 55 watts (PL1) TDP. Asus précise que le CPU fonctionne à 65 watts (PL1), mais les valeurs PL1 et PL2 dans HWInfo64 montrent 175 watts. Dans les benchmarks, le CPU démarre à 175 watts et atteint la limite thermique à 96 °C (205 °F), après quoi le TDP est ramené à 135 watts. En mode silencieux, le TDP est abaissé à 100W / 65W, ce qui entraîne également une réduction significative des performances.
Dans nos benchmarks processeurs, le i9-13980HX du ROG Strix 18 est également capable de se placer à peine devant les CPU 13900HX et 13950HX des concurrents. Toutefois, ce n'est le cas que pour le mode Turbo, et en mode Performance, le Strix Scar 18 ne se place qu'au milieu du peloton des nouveaux CPU 13000HX. Mais même dans ce cas, les anciens appareils équipés de processeurs i9-12950HX sont encore nettement surpassés.
Cinebench R15 Multi Constant Load Test
Cinebench R23: Multi Core | Single Core
Cinebench R20: CPU (Multi Core) | CPU (Single Core)
Cinebench R15: CPU Multi 64Bit | CPU Single 64Bit
Blender: v2.79 BMW27 CPU
7-Zip 18.03: 7z b 4 | 7z b 4 -mmt1
Geekbench 5.5: Multi-Core | Single-Core
HWBOT x265 Benchmark v2.2: 4k Preset
LibreOffice : 20 Documents To PDF
R Benchmark 2.5: Overall mean
| CPU Performance rating | |
| Intel Core i9-13900K @253W | |
| Intel NUC13 Raptor Canyon | |
| Asus ROG Strix Scar 18 2023 G834JY-N6005W | |
| MSI Titan GT77 HX 13VI | |
| Lenovo Legion Pro 7 16IRX8H | |
| Moyenne Intel Core i9-13980HX | |
| Razer Blade 18 RTX 4070 | |
| Schenker XMG Neo 16 Raptor Lake | |
| Asus ROG Strix Scar 18 2023 G834JY-N6005W | |
| Razer Blade 16 Early 2023 | |
| Moyenne de la classe Gaming | |
| MSI Raider GE77 HX 12UHS | |
| Asus ROG Strix Scar 17 SE G733CX-LL014W | |
| Dell Precision 7000 7670 Performance | |
| Cinebench R23 / Multi Core | |
| Intel Core i9-13900K @253W | |
| MSI Titan GT77 HX 13VI | |
| Intel NUC13 Raptor Canyon | |
| Asus ROG Strix Scar 18 2023 G834JY-N6005W | |
| Moyenne Intel Core i9-13980HX (28301 - 33052, n=11) | |
| Lenovo Legion Pro 7 16IRX8H | |
| Schenker XMG Neo 16 Raptor Lake | |
| Schenker XMG Neo 16 Raptor Lake | |
| Schenker XMG Neo 16 Raptor Lake | |
| Razer Blade 18 RTX 4070 | |
| Asus ROG Strix Scar 18 2023 G834JY-N6005W | |
| Moyenne de la classe Gaming (10488 - 42661, n=104, 2 dernières années) | |
| Razer Blade 16 Early 2023 | |
| MSI Raider GE77 HX 12UHS | |
| Asus ROG Strix Scar 17 SE G733CX-LL014W | |
| Dell Precision 7000 7670 Performance | |
| Cinebench R23 / Single Core | |
| Intel Core i9-13900K @253W | |
| Intel NUC13 Raptor Canyon | |
| Asus ROG Strix Scar 18 2023 G834JY-N6005W | |
| MSI Titan GT77 HX 13VI | |
| Asus ROG Strix Scar 18 2023 G834JY-N6005W | |
| Moyenne Intel Core i9-13980HX (1825 - 2169, n=9) | |
| Razer Blade 18 RTX 4070 | |
| Schenker XMG Neo 16 Raptor Lake | |
| Lenovo Legion Pro 7 16IRX8H | |
| Razer Blade 16 Early 2023 | |
| Moyenne de la classe Gaming (1601 - 2415, n=104, 2 dernières années) | |
| MSI Raider GE77 HX 12UHS | |
| Asus ROG Strix Scar 17 SE G733CX-LL014W | |
| Dell Precision 7000 7670 Performance | |
| Cinebench R20 / CPU (Multi Core) | |
| Intel Core i9-13900K @253W | |
| Intel NUC13 Raptor Canyon | |
| MSI Titan GT77 HX 13VI | |
| Asus ROG Strix Scar 18 2023 G834JY-N6005W | |
| Moyenne Intel Core i9-13980HX (10353 - 12437, n=10) | |
| Lenovo Legion Pro 7 16IRX8H | |
| Schenker XMG Neo 16 Raptor Lake | |
| Razer Blade 18 RTX 4070 | |
| Moyenne de la classe Gaming (4029 - 16433, n=103, 2 dernières années) | |
| Asus ROG Strix Scar 18 2023 G834JY-N6005W | |
| MSI Raider GE77 HX 12UHS | |
| Razer Blade 16 Early 2023 | |
| Asus ROG Strix Scar 17 SE G733CX-LL014W | |
| Dell Precision 7000 7670 Performance | |
| Cinebench R20 / CPU (Single Core) | |
| Intel Core i9-13900K @253W | |
| Intel NUC13 Raptor Canyon | |
| Asus ROG Strix Scar 18 2023 G834JY-N6005W | |
| MSI Titan GT77 HX 13VI | |
| Asus ROG Strix Scar 18 2023 G834JY-N6005W | |
| Razer Blade 18 RTX 4070 | |
| Moyenne Intel Core i9-13980HX (717 - 825, n=10) | |
| Lenovo Legion Pro 7 16IRX8H | |
| Moyenne de la classe Gaming (622 - 913, n=103, 2 dernières années) | |
| Schenker XMG Neo 16 Raptor Lake | |
| MSI Raider GE77 HX 12UHS | |
| Razer Blade 16 Early 2023 | |
| Asus ROG Strix Scar 17 SE G733CX-LL014W | |
| Dell Precision 7000 7670 Performance | |
| Cinebench R15 / CPU Multi 64Bit | |
| Intel Core i9-13900K @253W | |
| Intel NUC13 Raptor Canyon | |
| MSI Titan GT77 HX 13VI | |
| Schenker XMG Neo 16 Raptor Lake | |
| Schenker XMG Neo 16 Raptor Lake | |
| Lenovo Legion Pro 7 16IRX8H | |
| Asus ROG Strix Scar 18 2023 G834JY-N6005W | |
| Moyenne Intel Core i9-13980HX (4358 - 5172, n=11) | |
| Razer Blade 16 Early 2023 | |
| Razer Blade 18 RTX 4070 | |
| Asus ROG Strix Scar 18 2023 G834JY-N6005W | |
| Moyenne de la classe Gaming (1578 - 6330, n=102, 2 dernières années) | |
| MSI Raider GE77 HX 12UHS | |
| Asus ROG Strix Scar 17 SE G733CX-LL014W | |
| Dell Precision 7000 7670 Performance | |
| Cinebench R15 / CPU Single 64Bit | |
| Intel Core i9-13900K @253W | |
| Intel NUC13 Raptor Canyon | |
| Asus ROG Strix Scar 18 2023 G834JY-N6005W | |
| Asus ROG Strix Scar 18 2023 G834JY-N6005W | |
| Moyenne Intel Core i9-13980HX (289 - 312, n=11) | |
| Lenovo Legion Pro 7 16IRX8H | |
| MSI Titan GT77 HX 13VI | |
| Moyenne de la classe Gaming (188.8 - 350, n=103, 2 dernières années) | |
| Razer Blade 18 RTX 4070 | |
| Schenker XMG Neo 16 Raptor Lake | |
| Schenker XMG Neo 16 Raptor Lake | |
| MSI Raider GE77 HX 12UHS | |
| Asus ROG Strix Scar 17 SE G733CX-LL014W | |
| Razer Blade 16 Early 2023 | |
| Dell Precision 7000 7670 Performance | |
| Blender / v2.79 BMW27 CPU | |
| Dell Precision 7000 7670 Performance | |
| Asus ROG Strix Scar 17 SE G733CX-LL014W | |
| MSI Raider GE77 HX 12UHS | |
| Moyenne de la classe Gaming (79 - 330, n=101, 2 dernières années) | |
| Razer Blade 16 Early 2023 | |
| Asus ROG Strix Scar 18 2023 G834JY-N6005W | |
| Schenker XMG Neo 16 Raptor Lake | |
| Razer Blade 18 RTX 4070 | |
| Moyenne Intel Core i9-13980HX (97 - 136, n=10) | |
| Lenovo Legion Pro 7 16IRX8H | |
| Asus ROG Strix Scar 18 2023 G834JY-N6005W | |
| Intel NUC13 Raptor Canyon | |
| MSI Titan GT77 HX 13VI | |
| Intel Core i9-13900K @253W | |
| 7-Zip 18.03 / 7z b 4 | |
| Intel Core i9-13900K @253W | |
| MSI Titan GT77 HX 13VI | |
| Intel NUC13 Raptor Canyon | |
| Asus ROG Strix Scar 18 2023 G834JY-N6005W | |
| Lenovo Legion Pro 7 16IRX8H | |
| Schenker XMG Neo 16 Raptor Lake | |
| Moyenne Intel Core i9-13980HX (104616 - 129804, n=10) | |
| Razer Blade 18 RTX 4070 | |
| Asus ROG Strix Scar 18 2023 G834JY-N6005W | |
| Razer Blade 16 Early 2023 | |
| Moyenne de la classe Gaming (33491 - 148086, n=102, 2 dernières années) | |
| MSI Raider GE77 HX 12UHS | |
| Asus ROG Strix Scar 17 SE G733CX-LL014W | |
| Dell Precision 7000 7670 Performance | |
| 7-Zip 18.03 / 7z b 4 -mmt1 | |
| Intel Core i9-13900K @253W | |
| Intel NUC13 Raptor Canyon | |
| Asus ROG Strix Scar 18 2023 G834JY-N6005W | |
| Lenovo Legion Pro 7 16IRX8H | |
| Asus ROG Strix Scar 18 2023 G834JY-N6005W | |
| Moyenne Intel Core i9-13980HX (6230 - 7163, n=10) | |
| MSI Titan GT77 HX 13VI | |
| Razer Blade 18 RTX 4070 | |
| Schenker XMG Neo 16 Raptor Lake | |
| Moyenne de la classe Gaming (4824 - 7436, n=102, 2 dernières années) | |
| Razer Blade 16 Early 2023 | |
| MSI Raider GE77 HX 12UHS | |
| Asus ROG Strix Scar 17 SE G733CX-LL014W | |
| Dell Precision 7000 7670 Performance | |
| Geekbench 5.5 / Multi-Core | |
| Intel Core i9-13900K @253W | |
| Intel NUC13 Raptor Canyon | |
| Lenovo Legion Pro 7 16IRX8H | |
| Asus ROG Strix Scar 18 2023 G834JY-N6005W | |
| Schenker XMG Neo 16 Raptor Lake | |
| MSI Titan GT77 HX 13VI | |
| Moyenne Intel Core i9-13980HX (18475 - 22200, n=10) | |
| Razer Blade 18 RTX 4070 | |
| Asus ROG Strix Scar 18 2023 G834JY-N6005W | |
| Razer Blade 16 Early 2023 | |
| Moyenne de la classe Gaming (6460 - 28263, n=102, 2 dernières années) | |
| MSI Raider GE77 HX 12UHS | |
| Asus ROG Strix Scar 17 SE G733CX-LL014W | |
| Dell Precision 7000 7670 Performance | |
| Geekbench 5.5 / Single-Core | |
| Intel Core i9-13900K @253W | |
| Asus ROG Strix Scar 18 2023 G834JY-N6005W | |
| Intel NUC13 Raptor Canyon | |
| Asus ROG Strix Scar 18 2023 G834JY-N6005W | |
| Moyenne de la classe Gaming (1403 - 2474, n=102, 2 dernières années) | |
| Moyenne Intel Core i9-13980HX (1796 - 2139, n=10) | |
| MSI Titan GT77 HX 13VI | |
| Razer Blade 18 RTX 4070 | |
| Lenovo Legion Pro 7 16IRX8H | |
| Schenker XMG Neo 16 Raptor Lake | |
| MSI Raider GE77 HX 12UHS | |
| Dell Precision 7000 7670 Performance | |
| Asus ROG Strix Scar 17 SE G733CX-LL014W | |
| Razer Blade 16 Early 2023 | |
| HWBOT x265 Benchmark v2.2 / 4k Preset | |
| Intel Core i9-13900K @253W | |
| Intel NUC13 Raptor Canyon | |
| Asus ROG Strix Scar 18 2023 G834JY-N6005W | |
| MSI Titan GT77 HX 13VI | |
| Lenovo Legion Pro 7 16IRX8H | |
| Moyenne Intel Core i9-13980HX (27 - 33.4, n=9) | |
| Razer Blade 18 RTX 4070 | |
| Schenker XMG Neo 16 Raptor Lake | |
| Asus ROG Strix Scar 18 2023 G834JY-N6005W | |
| Moyenne de la classe Gaming (11.5 - 44.4, n=102, 2 dernières années) | |
| Razer Blade 16 Early 2023 | |
| MSI Raider GE77 HX 12UHS | |
| Asus ROG Strix Scar 17 SE G733CX-LL014W | |
| Dell Precision 7000 7670 Performance | |
| LibreOffice / 20 Documents To PDF | |
| Moyenne de la classe Gaming (33.2 - 88.8, n=102, 2 dernières années) | |
| Razer Blade 16 Early 2023 | |
| MSI Titan GT77 HX 13VI | |
| Schenker XMG Neo 16 Raptor Lake | |
| Lenovo Legion Pro 7 16IRX8H | |
| Dell Precision 7000 7670 Performance | |
| Razer Blade 18 RTX 4070 | |
| Moyenne Intel Core i9-13980HX (35 - 51.4, n=10) | |
| MSI Raider GE77 HX 12UHS | |
| Intel NUC13 Raptor Canyon | |
| Asus ROG Strix Scar 18 2023 G834JY-N6005W | |
| Asus ROG Strix Scar 18 2023 G834JY-N6005W | |
| Asus ROG Strix Scar 17 SE G733CX-LL014W | |
| Intel Core i9-13900K @253W | |
| R Benchmark 2.5 / Overall mean | |
| Dell Precision 7000 7670 Performance | |
| Asus ROG Strix Scar 17 SE G733CX-LL014W | |
| MSI Raider GE77 HX 12UHS | |
| Moyenne de la classe Gaming (0.3439 - 0.59, n=102, 2 dernières années) | |
| Razer Blade 16 Early 2023 | |
| MSI Titan GT77 HX 13VI | |
| Lenovo Legion Pro 7 16IRX8H | |
| Moyenne Intel Core i9-13980HX (0.3793 - 0.4462, n=10) | |
| Razer Blade 18 RTX 4070 | |
| Asus ROG Strix Scar 18 2023 G834JY-N6005W | |
| Intel NUC13 Raptor Canyon | |
| Schenker XMG Neo 16 Raptor Lake | |
| Asus ROG Strix Scar 18 2023 G834JY-N6005W | |
| Intel Core i9-13900K @253W | |
Cinebench R23: Multi Core | Single Core
Cinebench R20: CPU (Multi Core) | CPU (Single Core)
Cinebench R15: CPU Multi 64Bit | CPU Single 64Bit
Blender: v2.79 BMW27 CPU
7-Zip 18.03: 7z b 4 | 7z b 4 -mmt1
Geekbench 5.5: Multi-Core | Single-Core
HWBOT x265 Benchmark v2.2: 4k Preset
LibreOffice : 20 Documents To PDF
R Benchmark 2.5: Overall mean
* ... Moindre est la valeur, meilleures sont les performances
AIDA64: FP32 Ray-Trace | FPU Julia | CPU SHA3 | CPU Queen | FPU SinJulia | FPU Mandel | CPU AES | CPU ZLib | FP64 Ray-Trace | CPU PhotoWorxx
| Performance rating | |
| Intel Core i9-13900K @253W | |
| Intel NUC13 Raptor Canyon | |
| Asus ROG Strix Scar 18 2023 G834JY-N6005W | |
| MSI Titan GT77 HX 13VI | |
| Moyenne de la classe Gaming | |
| Lenovo Legion Pro 7 16IRX8H | |
| Moyenne Intel Core i9-13980HX | |
| Schenker XMG Neo 16 Raptor Lake | |
| Razer Blade 18 RTX 4070 | |
| Asus ROG Strix Scar 18 2023 G834JY-N6005W | |
| Razer Blade 16 Early 2023 | |
| MSI Raider GE77 HX 12UHS | |
| Asus ROG Strix Scar 17 SE G733CX-LL014W | |
| Dell Precision 7000 7670 Performance | |
| AIDA64 / FP32 Ray-Trace | |
| Intel Core i9-13900K @253W | |
| Moyenne de la classe Gaming (10227 - 85542, n=102, 2 dernières années) | |
| MSI Titan GT77 HX 13VI | |
| Asus ROG Strix Scar 18 2023 G834JY-N6005W | |
| Intel NUC13 Raptor Canyon | |
| Schenker XMG Neo 16 Raptor Lake | |
| Lenovo Legion Pro 7 16IRX8H | |
| Moyenne Intel Core i9-13980HX (21332 - 29553, n=9) | |
| Razer Blade 18 RTX 4070 | |
| Razer Blade 16 Early 2023 | |
| Razer Blade 16 Early 2023 | |
| Razer Blade 16 Early 2023 | |
| Asus ROG Strix Scar 18 2023 G834JY-N6005W | |
| MSI Raider GE77 HX 12UHS | |
| Asus ROG Strix Scar 17 SE G733CX-LL014W | |
| Dell Precision 7000 7670 Performance | |
| AIDA64 / FPU Julia | |
| Intel Core i9-13900K @253W | |
| Moyenne de la classe Gaming (51376 - 372155, n=102, 2 dernières années) | |
| MSI Titan GT77 HX 13VI | |
| Intel NUC13 Raptor Canyon | |
| Asus ROG Strix Scar 18 2023 G834JY-N6005W | |
| Lenovo Legion Pro 7 16IRX8H | |
| Moyenne Intel Core i9-13980HX (108001 - 148168, n=9) | |
| Razer Blade 18 RTX 4070 | |
| Schenker XMG Neo 16 Raptor Lake | |
| Asus ROG Strix Scar 18 2023 G834JY-N6005W | |
| Razer Blade 16 Early 2023 | |
| Razer Blade 16 Early 2023 | |
| Razer Blade 16 Early 2023 | |
| MSI Raider GE77 HX 12UHS | |
| Asus ROG Strix Scar 17 SE G733CX-LL014W | |
| Dell Precision 7000 7670 Performance | |
| AIDA64 / CPU SHA3 | |
| Intel Core i9-13900K @253W | |
| MSI Titan GT77 HX 13VI | |
| Asus ROG Strix Scar 18 2023 G834JY-N6005W | |
| Intel NUC13 Raptor Canyon | |
| Lenovo Legion Pro 7 16IRX8H | |
| Schenker XMG Neo 16 Raptor Lake | |
| Moyenne Intel Core i9-13980HX (5264 - 7142, n=9) | |
| Moyenne de la classe Gaming (2180 - 10115, n=102, 2 dernières années) | |
| Razer Blade 16 Early 2023 | |
| Razer Blade 16 Early 2023 | |
| Razer Blade 16 Early 2023 | |
| Razer Blade 18 RTX 4070 | |
| Asus ROG Strix Scar 18 2023 G834JY-N6005W | |
| MSI Raider GE77 HX 12UHS | |
| Asus ROG Strix Scar 17 SE G733CX-LL014W | |
| Dell Precision 7000 7670 Performance | |
| AIDA64 / CPU Queen | |
| Intel Core i9-13900K @253W | |
| Intel NUC13 Raptor Canyon | |
| Asus ROG Strix Scar 18 2023 G834JY-N6005W | |
| Asus ROG Strix Scar 18 2023 G834JY-N6005W | |
| MSI Titan GT77 HX 13VI | |
| Moyenne Intel Core i9-13980HX (126758 - 143409, n=9) | |
| Razer Blade 18 RTX 4070 | |
| Schenker XMG Neo 16 Raptor Lake | |
| Razer Blade 16 Early 2023 | |
| Razer Blade 16 Early 2023 | |
| Lenovo Legion Pro 7 16IRX8H | |
| Moyenne de la classe Gaming (49785 - 173351, n=86, 2 dernières années) | |
| Asus ROG Strix Scar 17 SE G733CX-LL014W | |
| Dell Precision 7000 7670 Performance | |
| MSI Raider GE77 HX 12UHS | |
| AIDA64 / FPU SinJulia | |
| Intel Core i9-13900K @253W | |
| Intel NUC13 Raptor Canyon | |
| Asus ROG Strix Scar 18 2023 G834JY-N6005W | |
| MSI Titan GT77 HX 13VI | |
| Schenker XMG Neo 16 Raptor Lake | |
| Moyenne Intel Core i9-13980HX (13785 - 17117, n=9) | |
| Razer Blade 18 RTX 4070 | |
| Asus ROG Strix Scar 18 2023 G834JY-N6005W | |
| Razer Blade 16 Early 2023 | |
| Razer Blade 16 Early 2023 | |
| Razer Blade 16 Early 2023 | |
| Lenovo Legion Pro 7 16IRX8H | |
| Moyenne de la classe Gaming (4424 - 33636, n=102, 2 dernières années) | |
| MSI Raider GE77 HX 12UHS | |
| Asus ROG Strix Scar 17 SE G733CX-LL014W | |
| Dell Precision 7000 7670 Performance | |
| AIDA64 / FPU Mandel | |
| Intel Core i9-13900K @253W | |
| Moyenne de la classe Gaming (25115 - 196829, n=102, 2 dernières années) | |
| MSI Titan GT77 HX 13VI | |
| Asus ROG Strix Scar 18 2023 G834JY-N6005W | |
| Intel NUC13 Raptor Canyon | |
| Lenovo Legion Pro 7 16IRX8H | |
| Moyenne Intel Core i9-13980HX (53398 - 73758, n=9) | |
| Schenker XMG Neo 16 Raptor Lake | |
| Razer Blade 18 RTX 4070 | |
| Asus ROG Strix Scar 18 2023 G834JY-N6005W | |
| Razer Blade 16 Early 2023 | |
| Razer Blade 16 Early 2023 | |
| Razer Blade 16 Early 2023 | |
| MSI Raider GE77 HX 12UHS | |
| Asus ROG Strix Scar 17 SE G733CX-LL014W | |
| Dell Precision 7000 7670 Performance | |
| AIDA64 / CPU AES | |
| Intel Core i9-13900K @253W | |
| MSI Raider GE77 HX 12UHS | |
| Asus ROG Strix Scar 17 SE G733CX-LL014W | |
| Razer Blade 16 Early 2023 | |
| Razer Blade 16 Early 2023 | |
| Razer Blade 16 Early 2023 | |
| MSI Titan GT77 HX 13VI | |
| Asus ROG Strix Scar 18 2023 G834JY-N6005W | |
| Intel NUC13 Raptor Canyon | |
| Lenovo Legion Pro 7 16IRX8H | |
| Moyenne Intel Core i9-13980HX (105169 - 136520, n=9) | |
| Schenker XMG Neo 16 Raptor Lake | |
| Razer Blade 18 RTX 4070 | |
| Asus ROG Strix Scar 18 2023 G834JY-N6005W | |
| Moyenne de la classe Gaming (39258 - 247074, n=102, 2 dernières années) | |
| Dell Precision 7000 7670 Performance | |
| AIDA64 / CPU ZLib | |
| Intel Core i9-13900K @253W | |
| MSI Titan GT77 HX 13VI | |
| Asus ROG Strix Scar 18 2023 G834JY-N6005W | |
| Intel NUC13 Raptor Canyon | |
| Lenovo Legion Pro 7 16IRX8H | |
| Moyenne Intel Core i9-13980HX (1513 - 2039, n=9) | |
| Schenker XMG Neo 16 Raptor Lake | |
| Razer Blade 16 Early 2023 | |
| Razer Blade 16 Early 2023 | |
| Razer Blade 16 Early 2023 | |
| Razer Blade 18 RTX 4070 | |
| Asus ROG Strix Scar 18 2023 G834JY-N6005W | |
| Moyenne de la classe Gaming (574 - 2531, n=102, 2 dernières années) | |
| MSI Raider GE77 HX 12UHS | |
| Asus ROG Strix Scar 17 SE G733CX-LL014W | |
| Dell Precision 7000 7670 Performance | |
| AIDA64 / FP64 Ray-Trace | |
| Intel Core i9-13900K @253W | |
| Moyenne de la classe Gaming (5509 - 45446, n=102, 2 dernières années) | |
| MSI Titan GT77 HX 13VI | |
| Asus ROG Strix Scar 18 2023 G834JY-N6005W | |
| Intel NUC13 Raptor Canyon | |
| Lenovo Legion Pro 7 16IRX8H | |
| Moyenne Intel Core i9-13980HX (11431 - 16325, n=9) | |
| Schenker XMG Neo 16 Raptor Lake | |
| Razer Blade 18 RTX 4070 | |
| Razer Blade 16 Early 2023 | |
| Razer Blade 16 Early 2023 | |
| Razer Blade 16 Early 2023 | |
| Asus ROG Strix Scar 18 2023 G834JY-N6005W | |
| MSI Raider GE77 HX 12UHS | |
| Asus ROG Strix Scar 17 SE G733CX-LL014W | |
| Dell Precision 7000 7670 Performance | |
| AIDA64 / CPU PhotoWorxx | |
| Razer Blade 16 Early 2023 | |
| Razer Blade 16 Early 2023 | |
| Razer Blade 16 Early 2023 | |
| Razer Blade 18 RTX 4070 | |
| Intel Core i9-13900K @253W | |
| Lenovo Legion Pro 7 16IRX8H | |
| MSI Raider GE77 HX 12UHS | |
| Moyenne Intel Core i9-13980HX (37069 - 52949, n=9) | |
| Intel NUC13 Raptor Canyon | |
| Moyenne de la classe Gaming (12271 - 89891, n=102, 2 dernières années) | |
| Schenker XMG Neo 16 Raptor Lake | |
| Asus ROG Strix Scar 18 2023 G834JY-N6005W | |
| Asus ROG Strix Scar 18 2023 G834JY-N6005W | |
| Dell Precision 7000 7670 Performance | |
| Asus ROG Strix Scar 17 SE G733CX-LL014W | |
| MSI Titan GT77 HX 13VI | |
AIDA64: FP32 Ray-Trace | FPU Julia | CPU SHA3 | CPU Queen | FPU SinJulia | FPU Mandel | CPU AES | CPU ZLib | FP64 Ray-Trace | CPU PhotoWorxx
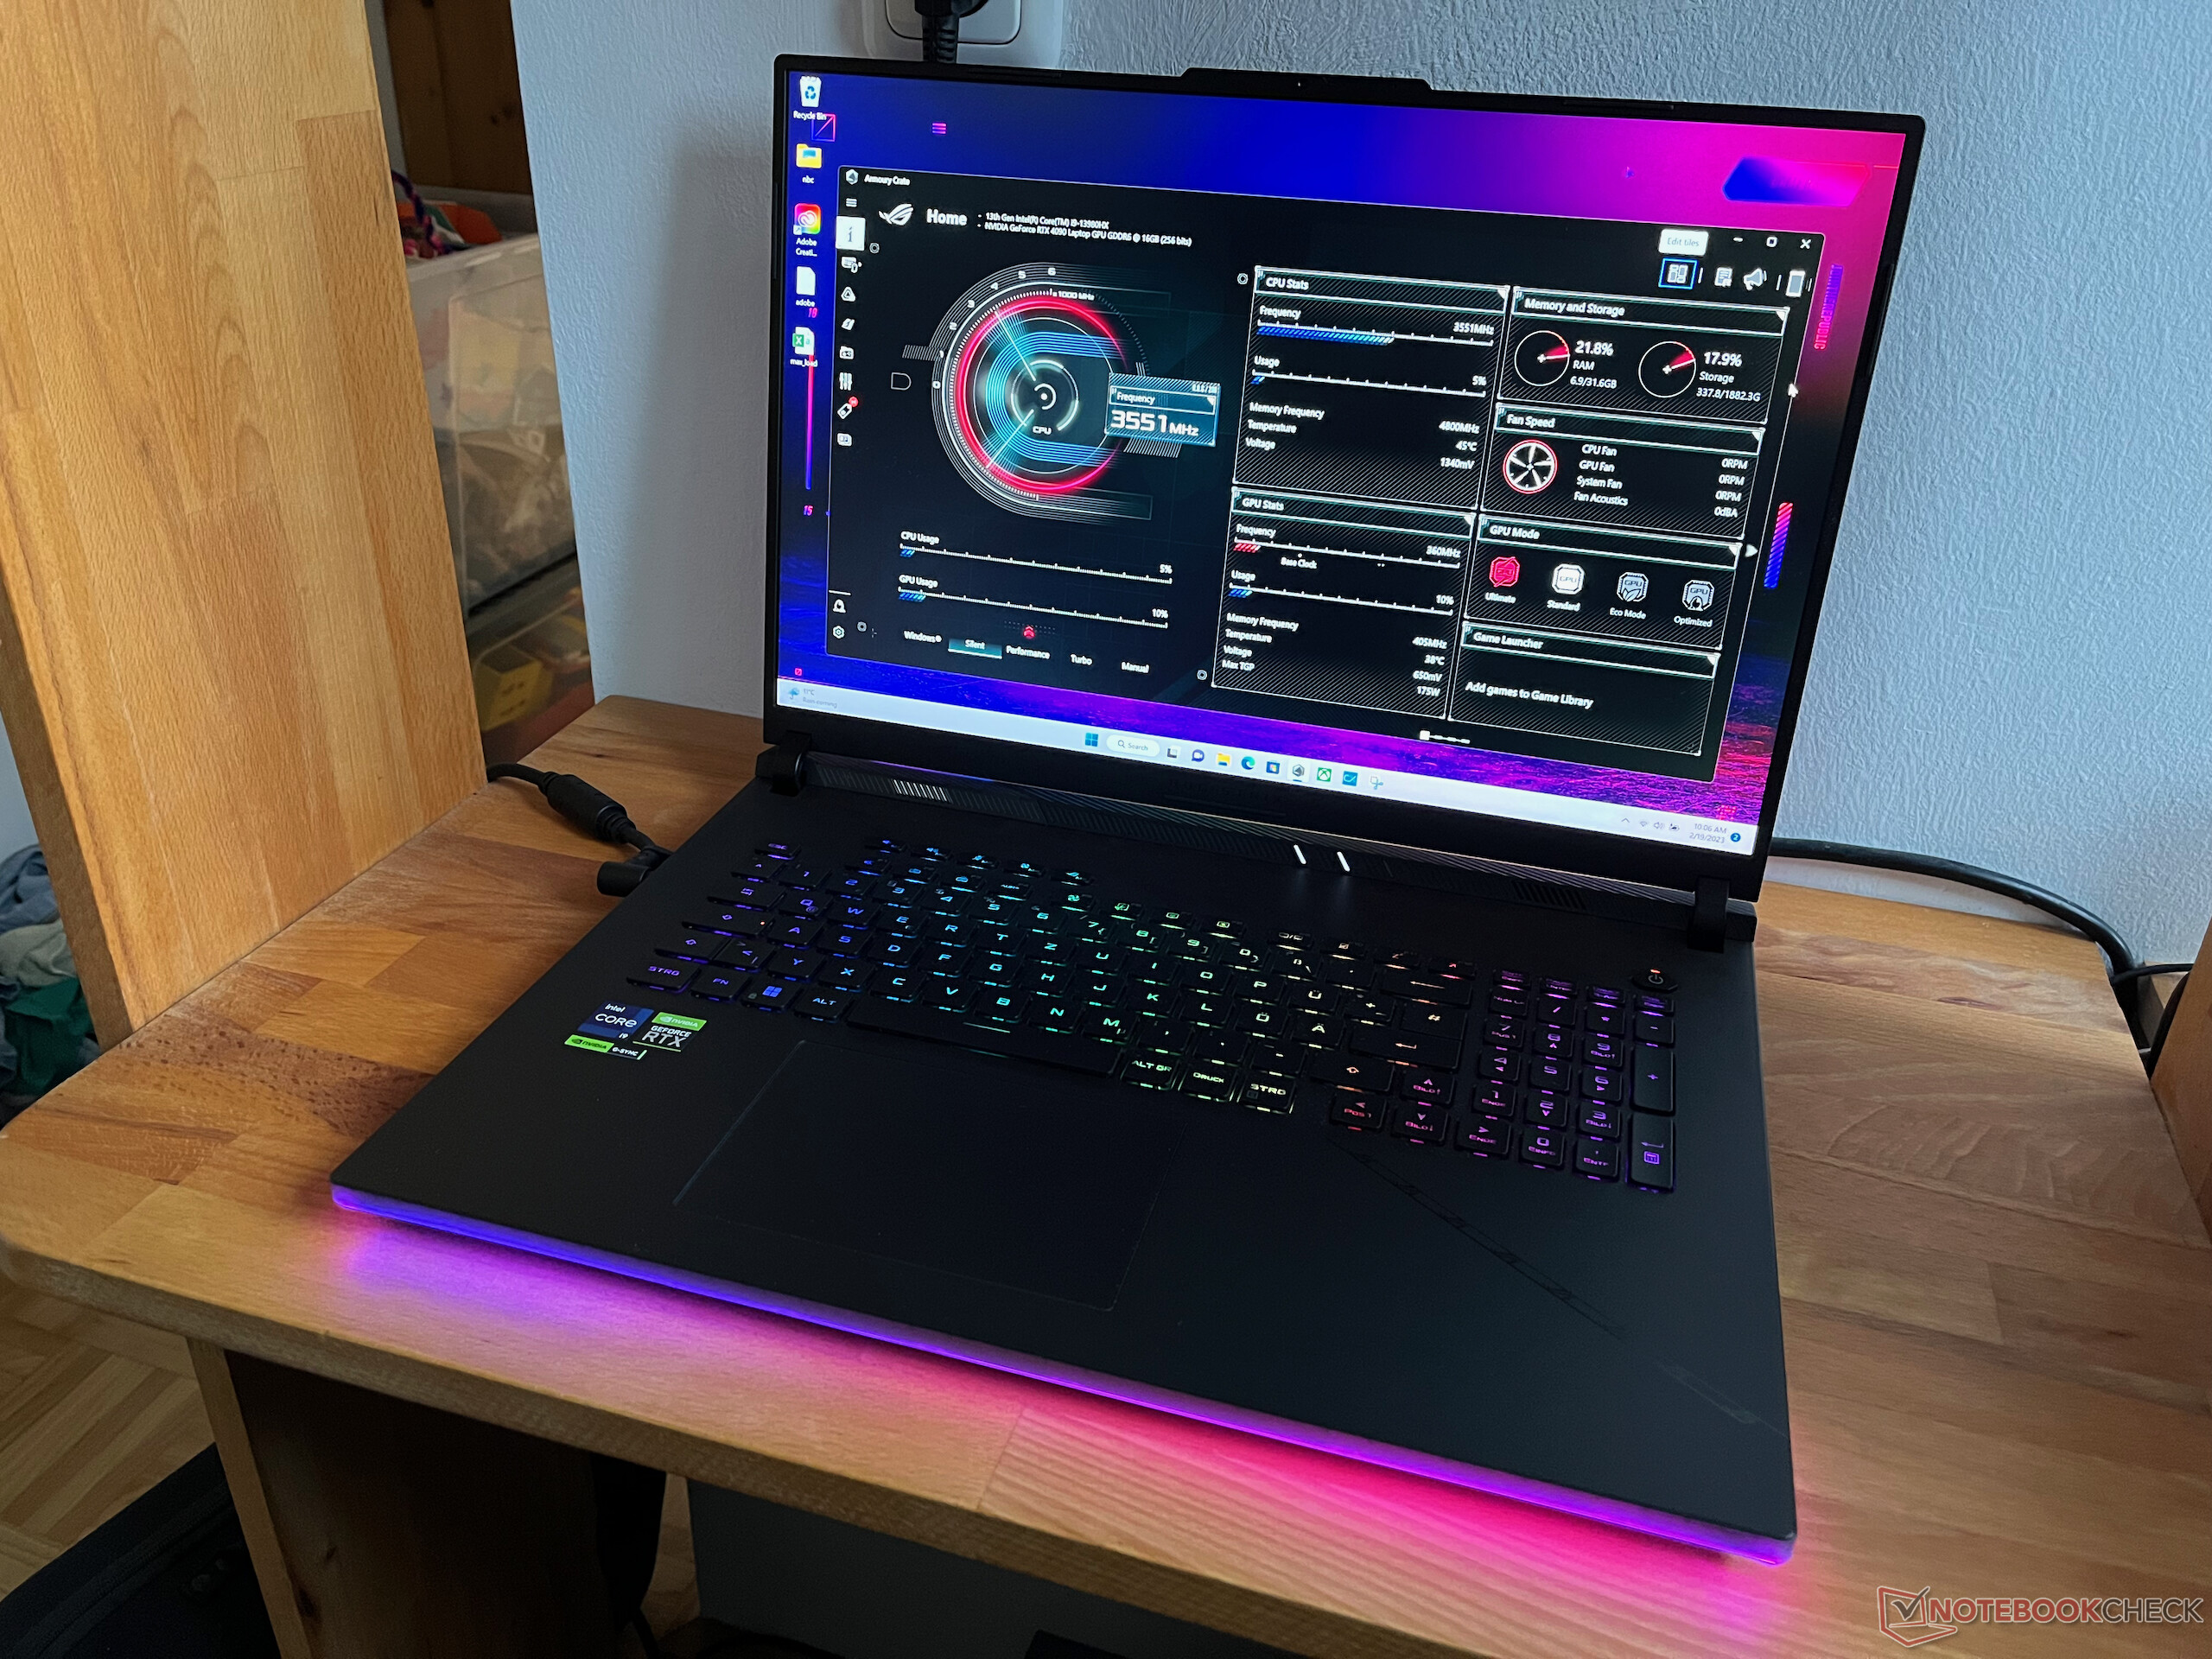
Performance du système
Le matériel puissant est également capable de marquer des points dans les performances générales du système. Dans PCMark 10, le Scar 18 atteint une position de tête qui est actuellement à peine dépassée par les ordinateurs de bureau puissants et le MSI Titan GT77 HX 13VI. Dans CrossMark, le résultat est également dans la catégorie supérieure. Même si certains ordinateurs portables parviennent à devancer la Strix Scar 18, l'écart est très faible, de l'ordre de 4 % au maximum (le MSI Titan GT77 12UHS est actuellement l'ordinateur portable le plus rapide, et l'ordinateur de bureau le plus rapide obtient un résultat supérieur de 24 %).
Dans le benchmark de stockage, vous pouvez facilement voir l'impact du stockage DDR5-4800. Les systèmes dotés d'une mémoire principale DDR5-5600 plus rapide, comme le Razer Blade 16, sont toujours capables d'obtenir un avantage significatif. C'est l'un des rares domaines où Asus n'utilise pas les composants les plus rapides disponibles, mais l'impact est relativement faible dans la pratique.
CrossMark: Overall | Productivity | Creativity | Responsiveness
| PCMark 10 / Score | |
| Intel NUC13 Raptor Canyon | |
| MSI Titan GT77 HX 13VI | |
| Moyenne Intel Core i9-13980HX, NVIDIA GeForce RTX 4090 Laptop GPU (8650 - 9068, n=4) | |
| Asus ROG Strix Scar 18 2023 G834JY-N6005W | |
| Moyenne de la classe Gaming (5828 - 12414, n=93, 2 dernières années) | |
| Razer Blade 16 Early 2023 | |
| Lenovo Legion Pro 7 16IRX8H | |
| Razer Blade 18 RTX 4070 | |
| Asus ROG Strix Scar 17 SE G733CX-LL014W | |
| MSI Raider GE77 HX 12UHS | |
| Dell Precision 7000 7670 Performance | |
| PCMark 10 / Essentials | |
| MSI Titan GT77 HX 13VI | |
| Lenovo Legion Pro 7 16IRX8H | |
| Razer Blade 18 RTX 4070 | |
| Intel NUC13 Raptor Canyon | |
| Dell Precision 7000 7670 Performance | |
| Moyenne Intel Core i9-13980HX, NVIDIA GeForce RTX 4090 Laptop GPU (11215 - 11644, n=3) | |
| Razer Blade 16 Early 2023 | |
| Moyenne de la classe Gaming (8810 - 11935, n=97, 2 dernières années) | |
| Asus ROG Strix Scar 17 SE G733CX-LL014W | |
| MSI Raider GE77 HX 12UHS | |
| PCMark 10 / Productivity | |
| Moyenne de la classe Gaming (6845 - 25323, n=95, 2 dernières années) | |
| Intel NUC13 Raptor Canyon | |
| Lenovo Legion Pro 7 16IRX8H | |
| Moyenne Intel Core i9-13980HX, NVIDIA GeForce RTX 4090 Laptop GPU (10125 - 11067, n=3) | |
| Asus ROG Strix Scar 17 SE G733CX-LL014W | |
| MSI Titan GT77 HX 13VI | |
| MSI Raider GE77 HX 12UHS | |
| Razer Blade 18 RTX 4070 | |
| Razer Blade 16 Early 2023 | |
| Dell Precision 7000 7670 Performance | |
| PCMark 10 / Digital Content Creation | |
| MSI Titan GT77 HX 13VI | |
| Intel NUC13 Raptor Canyon | |
| Moyenne Intel Core i9-13980HX, NVIDIA GeForce RTX 4090 Laptop GPU (15052 - 16012, n=3) | |
| Razer Blade 16 Early 2023 | |
| Moyenne de la classe Gaming (7602 - 19954, n=95, 2 dernières années) | |
| Razer Blade 18 RTX 4070 | |
| Lenovo Legion Pro 7 16IRX8H | |
| Asus ROG Strix Scar 17 SE G733CX-LL014W | |
| MSI Raider GE77 HX 12UHS | |
| Dell Precision 7000 7670 Performance | |
| CrossMark / Overall | |
| Intel Core i9-13900K @253W | |
| Intel NUC13 Raptor Canyon | |
| MSI Raider GE77 HX 12UHS | |
| MSI Titan GT77 HX 13VI | |
| Razer Blade 18 RTX 4070 | |
| Asus ROG Strix Scar 17 SE G733CX-LL014W | |
| Asus ROG Strix Scar 18 2023 G834JY-N6005W | |
| Moyenne Intel Core i9-13980HX, NVIDIA GeForce RTX 4090 Laptop GPU (1935 - 2176, n=4) | |
| Asus ROG Strix Scar 18 2023 G834JY-N6005W | |
| Schenker XMG Neo 16 Raptor Lake | |
| Moyenne de la classe Gaming (1366 - 2409, n=94, 2 dernières années) | |
| Dell Precision 7000 7670 Performance | |
| Razer Blade 16 Early 2023 | |
| CrossMark / Productivity | |
| Intel Core i9-13900K @253W | |
| Intel NUC13 Raptor Canyon | |
| MSI Raider GE77 HX 12UHS | |
| MSI Titan GT77 HX 13VI | |
| Razer Blade 18 RTX 4070 | |
| Asus ROG Strix Scar 17 SE G733CX-LL014W | |
| Asus ROG Strix Scar 18 2023 G834JY-N6005W | |
| Moyenne Intel Core i9-13980HX, NVIDIA GeForce RTX 4090 Laptop GPU (1764 - 2005, n=4) | |
| Asus ROG Strix Scar 18 2023 G834JY-N6005W | |
| Moyenne de la classe Gaming (1386 - 2254, n=94, 2 dernières années) | |
| Schenker XMG Neo 16 Raptor Lake | |
| Dell Precision 7000 7670 Performance | |
| Razer Blade 16 Early 2023 | |
| CrossMark / Creativity | |
| Intel Core i9-13900K @253W | |
| Intel NUC13 Raptor Canyon | |
| Asus ROG Strix Scar 18 2023 G834JY-N6005W | |
| MSI Titan GT77 HX 13VI | |
| Moyenne Intel Core i9-13980HX, NVIDIA GeForce RTX 4090 Laptop GPU (2267 - 2469, n=4) | |
| Razer Blade 18 RTX 4070 | |
| Asus ROG Strix Scar 18 2023 G834JY-N6005W | |
| Schenker XMG Neo 16 Raptor Lake | |
| Asus ROG Strix Scar 17 SE G733CX-LL014W | |
| MSI Raider GE77 HX 12UHS | |
| Moyenne de la classe Gaming (1343 - 2786, n=94, 2 dernières années) | |
| Dell Precision 7000 7670 Performance | |
| Razer Blade 16 Early 2023 | |
| CrossMark / Responsiveness | |
| Intel Core i9-13900K @253W | |
| MSI Raider GE77 HX 12UHS | |
| Asus ROG Strix Scar 17 SE G733CX-LL014W | |
| Intel NUC13 Raptor Canyon | |
| Razer Blade 18 RTX 4070 | |
| MSI Titan GT77 HX 13VI | |
| Moyenne de la classe Gaming (1226 - 2334, n=94, 2 dernières années) | |
| Moyenne Intel Core i9-13980HX, NVIDIA GeForce RTX 4090 Laptop GPU (1556 - 1904, n=4) | |
| Asus ROG Strix Scar 18 2023 G834JY-N6005W | |
| Asus ROG Strix Scar 18 2023 G834JY-N6005W | |
| Schenker XMG Neo 16 Raptor Lake | |
| Dell Precision 7000 7670 Performance | |
| Razer Blade 16 Early 2023 | |
CrossMark: Overall | Productivity | Creativity | Responsiveness
| PCMark 10 Score | 8764 points | |
Aide | ||
| AIDA64 / Memory Copy | |
| Razer Blade 16 Early 2023 | |
| Razer Blade 16 Early 2023 | |
| Razer Blade 16 Early 2023 | |
| Lenovo Legion Pro 7 16IRX8H | |
| Razer Blade 18 RTX 4070 | |
| Intel Core i9-13900K @253W | |
| Moyenne de la classe Gaming (21750 - 129946, n=102, 2 dernières années) | |
| Moyenne Intel Core i9-13980HX (62189 - 80776, n=9) | |
| MSI Raider GE77 HX 12UHS | |
| Intel NUC13 Raptor Canyon | |
| Asus ROG Strix Scar 18 2023 G834JY-N6005W | |
| Schenker XMG Neo 16 Raptor Lake | |
| Asus ROG Strix Scar 18 2023 G834JY-N6005W | |
| Dell Precision 7000 7670 Performance | |
| MSI Titan GT77 HX 13VI | |
| Asus ROG Strix Scar 17 SE G733CX-LL014W | |
| AIDA64 / Memory Read | |
| Razer Blade 16 Early 2023 | |
| Razer Blade 16 Early 2023 | |
| Razer Blade 16 Early 2023 | |
| Razer Blade 18 RTX 4070 | |
| Lenovo Legion Pro 7 16IRX8H | |
| Intel Core i9-13900K @253W | |
| Moyenne Intel Core i9-13980HX (62624 - 89096, n=9) | |
| Schenker XMG Neo 16 Raptor Lake | |
| Asus ROG Strix Scar 18 2023 G834JY-N6005W | |
| Asus ROG Strix Scar 18 2023 G834JY-N6005W | |
| Moyenne de la classe Gaming (22956 - 118858, n=102, 2 dernières années) | |
| Intel NUC13 Raptor Canyon | |
| MSI Raider GE77 HX 12UHS | |
| Asus ROG Strix Scar 17 SE G733CX-LL014W | |
| Dell Precision 7000 7670 Performance | |
| MSI Titan GT77 HX 13VI | |
| AIDA64 / Memory Write | |
| Razer Blade 16 Early 2023 | |
| Razer Blade 16 Early 2023 | |
| Razer Blade 16 Early 2023 | |
| Moyenne de la classe Gaming (22297 - 135096, n=102, 2 dernières années) | |
| Razer Blade 18 RTX 4070 | |
| Intel Core i9-13900K @253W | |
| Lenovo Legion Pro 7 16IRX8H | |
| Moyenne Intel Core i9-13980HX (59912 - 79917, n=9) | |
| Intel NUC13 Raptor Canyon | |
| Schenker XMG Neo 16 Raptor Lake | |
| Asus ROG Strix Scar 18 2023 G834JY-N6005W | |
| MSI Raider GE77 HX 12UHS | |
| Asus ROG Strix Scar 18 2023 G834JY-N6005W | |
| Asus ROG Strix Scar 17 SE G733CX-LL014W | |
| Dell Precision 7000 7670 Performance | |
| MSI Titan GT77 HX 13VI | |
| AIDA64 / Memory Latency | |
| Moyenne de la classe Gaming (75.3 - 165.4, n=102, 2 dernières années) | |
| Razer Blade 16 Early 2023 | |
| Razer Blade 16 Early 2023 | |
| Razer Blade 16 Early 2023 | |
| Intel NUC13 Raptor Canyon | |
| MSI Titan GT77 HX 13VI | |
| Schenker XMG Neo 16 Raptor Lake | |
| Asus ROG Strix Scar 18 2023 G834JY-N6005W | |
| Asus ROG Strix Scar 18 2023 G834JY-N6005W | |
| Moyenne Intel Core i9-13980HX (79.4 - 93.2, n=9) | |
| Asus ROG Strix Scar 17 SE G733CX-LL014W | |
| Dell Precision 7000 7670 Performance | |
| Razer Blade 18 RTX 4070 | |
| MSI Raider GE77 HX 12UHS | |
| Lenovo Legion Pro 7 16IRX8H | |
| Intel Core i9-13900K @253W | |
* ... Moindre est la valeur, meilleures sont les performances
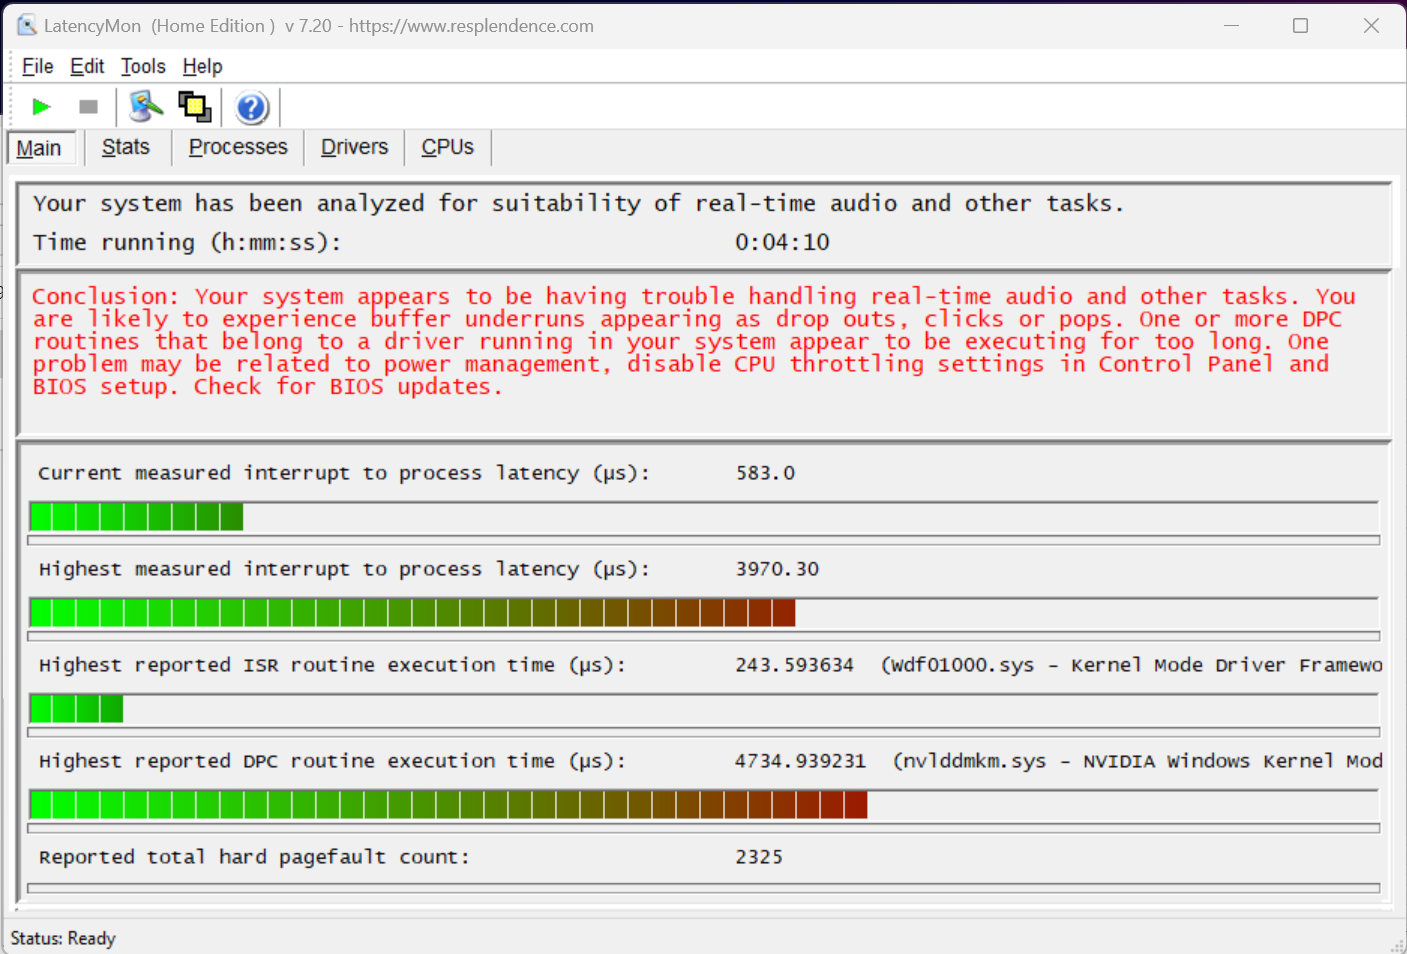
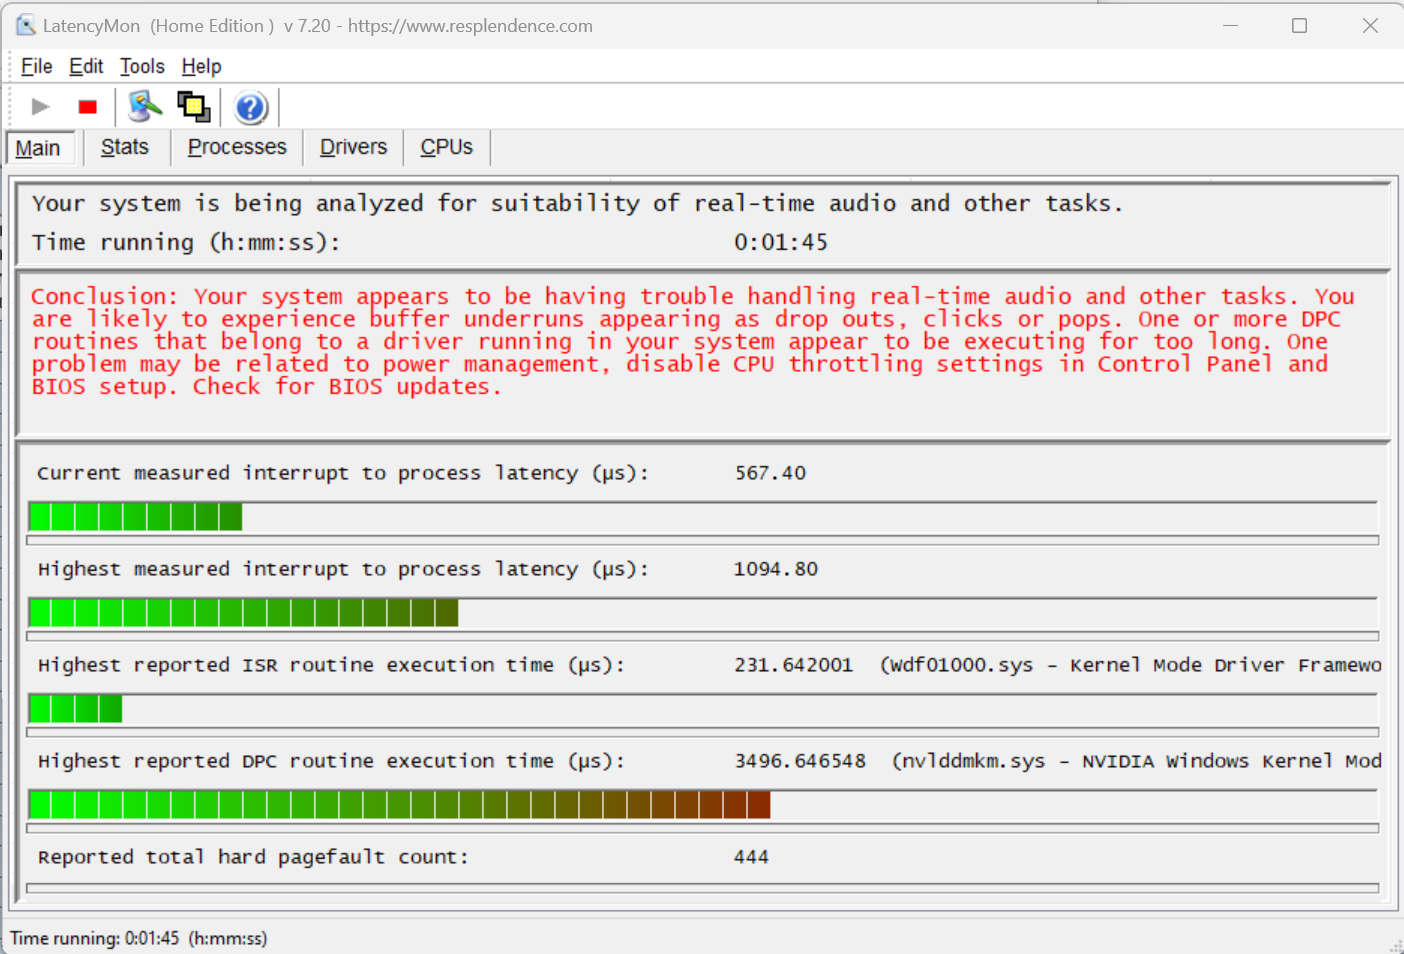
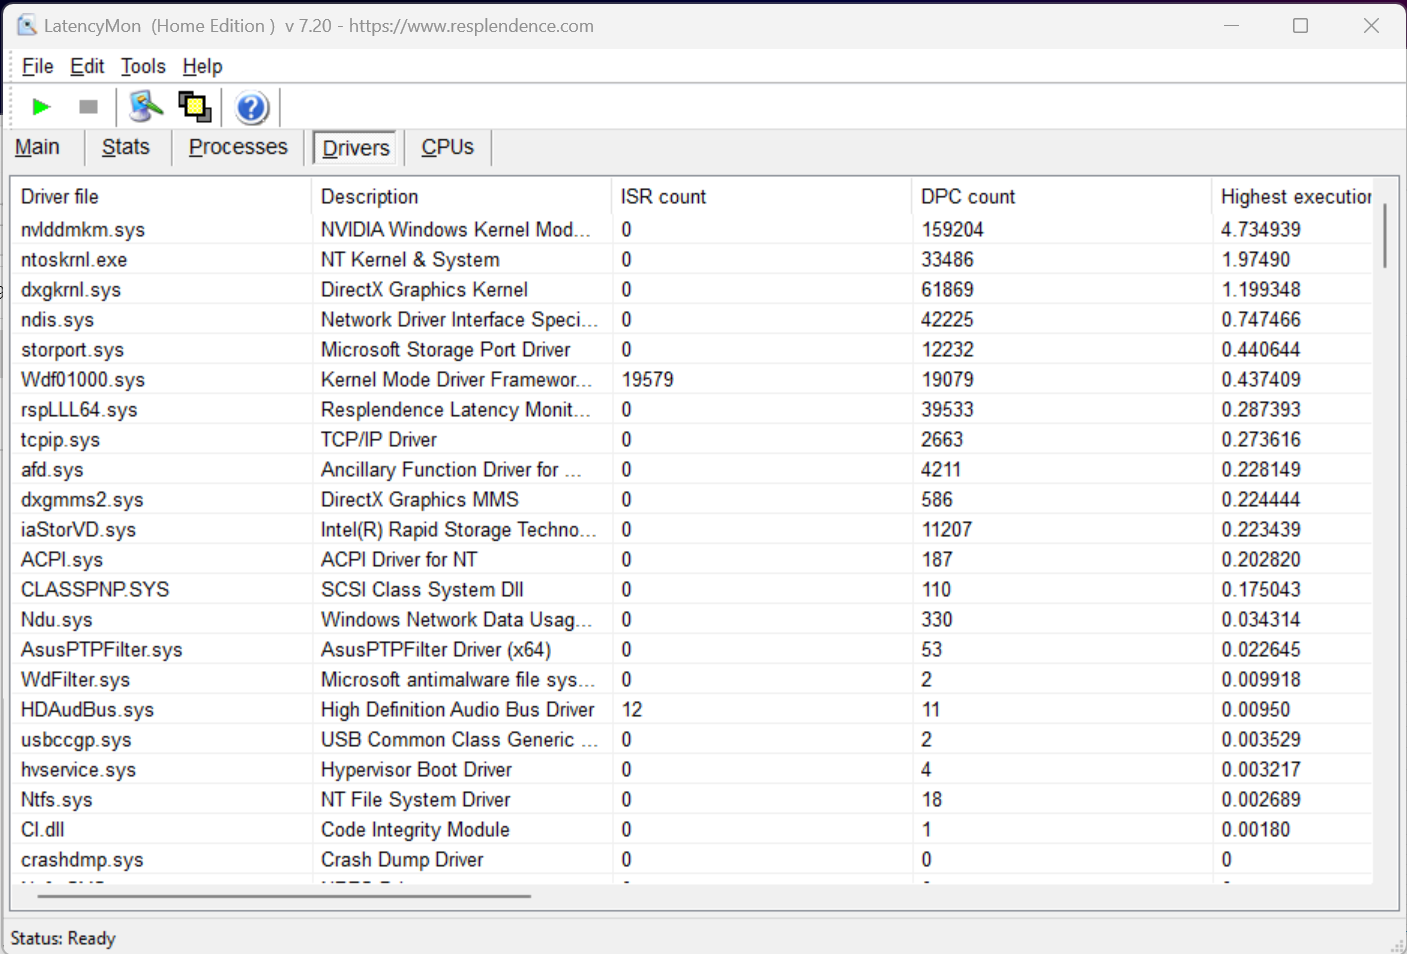
Latences DPC
En ce qui concerne les latences DPC, l'ordinateur portable Asus se place seulement au milieu du peloton de tous les ordinateurs portables testés. Selon LatencyMon, c'est le pilote Nvidia qui est en cause ici, ce qui peut créer quelques problèmes dans les applications en temps réel. Nous avons effectué nos tests en mode Turbo avec le GPU Ultimate (pas d'Optimus), qui est théoriquement mieux adapté que le mode hybride ou le mode économie d'énergie. Malheureusement, la faible performance DPC n'est pas une exception dans cette catégorie d'appareils.
| DPC Latencies / LatencyMon - interrupt to process latency (max), Web, Youtube, Prime95 | |
| MSI Titan GT77 HX 13VI | |
| Asus ROG Strix Scar 17 SE G733CX-LL014W | |
| Razer Blade 16 Early 2023 | |
| Dell Precision 7000 7670 Performance | |
| MSI Raider GE77 HX 12UHS | |
| Razer Blade 18 RTX 4070 | |
| Asus ROG Strix Scar 18 2023 G834JY-N6005W | |
| Lenovo Legion Pro 7 16IRX8H | |
* ... Moindre est la valeur, meilleures sont les performances
Solution de stockage
Asus utilise deux SSD Samsung PM9A1 rapides, chacun avec 1 To de stockage, dans un système RAID-0 dans le Scar 18 G834JY-N6005W. Même si la vitesse est légèrement augmentée avec cela, la probabilité de défaillance et la consommation d'énergie augmentent également. Cependant, dans la comparaison avec le Legion 5 Pro 16IAH7H avec le même système RAID, le Scar d'Asus est surpassé - même par une marge significative. Mais cela n'est pas dû à des problèmes thermiques, et les performances restent constantes à charge constante.

* ... Moindre est la valeur, meilleures sont les performances
Disk Throttling: DiskSpd Read Loop, Queue Depth 8
Carte graphique
La pièce maîtresse de l'Asus ROG Strix Scar 18 est clairement le Nvidia GeForce RTX 4090 GPU pour ordinateur portable. Bien que son nom suggère une similarité avec le RTX 4090 Desktop GPUla version mobile est liée au RTX 4080 de bureau (même puce), et les performances restent inférieures à celles d'un rTX 4070 Ti de bureau. Mais au moins, Asus offre la version la plus rapide de la RTX 4090 Mobile avec 175 watts TGP (150 watts + 25 watts Dynamic Boost) et même un léger overclocking du GPU de 50 MHz.
Comparé à la RTX 4090 dans leMSI Titan GT77 HX 13VIla Strix G18 se place à peine derrière, malgré l'overclocking. Les ordinateurs portables RTX 4080 sont aussi clairement dépassés, et les ordinateurs portables avec l'ancien système RTX 3080 Ti sont aussi dépassés RTX 3080 Ti Laptop GPUrestent loin derrière.
| 3DMark 06 Standard Score | 67702 points | |
| 3DMark 11 Performance | 46985 points | |
| 3DMark Ice Storm Standard Score | 277937 points | |
| 3DMark Cloud Gate Standard Score | 70984 points | |
| 3DMark Fire Strike Score | 36408 points | |
| 3DMark Fire Strike Extreme Score | 24278 points | |
| 3DMark Time Spy Score | 20166 points | |
Aide | ||
* ... Moindre est la valeur, meilleures sont les performances
Performances en matière de jeux
Les benchmarks de jeu révèlent une image similaire à celle des benchmarks synthétiques. La série RTX 4000 a la particularité de prendre en charge le DLSS 3 avec génération d'images. Dans les jeux pris en charge, la RTX 4090 est capable d'obtenir une augmentation significative des taux de trame. Cela rend également possible les effets de raytracing en 4K avec des taux de trame fluides. Cependant, les 240 Hz de l'écran ne peuvent être pleinement utilisés dans les jeux moins exigeants que dans la résolution native de 2 560 x 1 600 pixels.
| GTA V - 1920x1080 Highest AA:4xMSAA + FX AF:16x | |
| Intel NUC13 Raptor Canyon | |
| Lenovo Legion Pro 7 16IRX8H | |
| Asus ROG Strix Scar 18 2023 G834JY-N6005W | |
| Asus ROG Strix Scar 18 2023 G834JY-N6005W | |
| MSI Titan GT77 HX 13VI | |
| Razer Blade 16 Early 2023 | |
| Schenker XMG Neo 16 Raptor Lake | |
| MSI Raider GE77 HX 12UHS | |
| Moyenne de la classe Gaming (67.1 - 186.9, n=90, 2 dernières années) | |
| Asus ROG Strix Scar 17 SE G733CX-LL014W | |
| Razer Blade 18 RTX 4070 | |
| Dell Precision 7000 7670 Performance | |
| Final Fantasy XV Benchmark - 1920x1080 High Quality | |
| MSI Titan GT77 HX 13VI | |
| Schenker XMG Neo 16 Raptor Lake | |
| Intel NUC13 Raptor Canyon | |
| Asus ROG Strix Scar 18 2023 G834JY-N6005W | |
| Asus ROG Strix Scar 18 2023 G834JY-N6005W | |
| Lenovo Legion Pro 7 16IRX8H | |
| Razer Blade 16 Early 2023 | |
| Moyenne de la classe Gaming (64.2 - 215, n=91, 2 dernières années) | |
| MSI Raider GE77 HX 12UHS | |
| Asus ROG Strix Scar 17 SE G733CX-LL014W | |
| Razer Blade 18 RTX 4070 | |
| Dell Precision 7000 7670 Performance | |
| Strange Brigade - 1920x1080 ultra AA:ultra AF:16 | |
| MSI Titan GT77 HX 13VI | |
| Asus ROG Strix Scar 18 2023 G834JY-N6005W | |
| Intel NUC13 Raptor Canyon | |
| Schenker XMG Neo 16 Raptor Lake | |
| Asus ROG Strix Scar 18 2023 G834JY-N6005W | |
| Razer Blade 16 Early 2023 | |
| Lenovo Legion Pro 7 16IRX8H | |
| Moyenne de la classe Gaming (113.6 - 458, n=83, 2 dernières années) | |
| Asus ROG Strix Scar 17 SE G733CX-LL014W | |
| MSI Raider GE77 HX 12UHS | |
| Razer Blade 18 RTX 4070 | |
| Dell Precision 7000 7670 Performance | |
| Dota 2 Reborn - 1920x1080 ultra (3/3) best looking | |
| Intel NUC13 Raptor Canyon | |
| Razer Blade 16 Early 2023 | |
| Asus ROG Strix Scar 18 2023 G834JY-N6005W | |
| Asus ROG Strix Scar 18 2023 G834JY-N6005W | |
| MSI Titan GT77 HX 13VI | |
| Lenovo Legion Pro 7 16IRX8H | |
| Razer Blade 18 RTX 4070 | |
| Schenker XMG Neo 16 Raptor Lake | |
| Asus ROG Strix Scar 17 SE G733CX-LL014W | |
| MSI Raider GE77 HX 12UHS | |
| Moyenne de la classe Gaming (84.8 - 252, n=104, 2 dernières années) | |
| Dell Precision 7000 7670 Performance | |
Dans notre test de charge avec The Witcher 3 et aussi dans le test de stress 3DMark Time Spy, l'Asus G834JY maintient une performance stable sans aucune chute. Les fluctuations visibles dans The Witcher 3 sont dues aux changements entre le jour et la nuit.
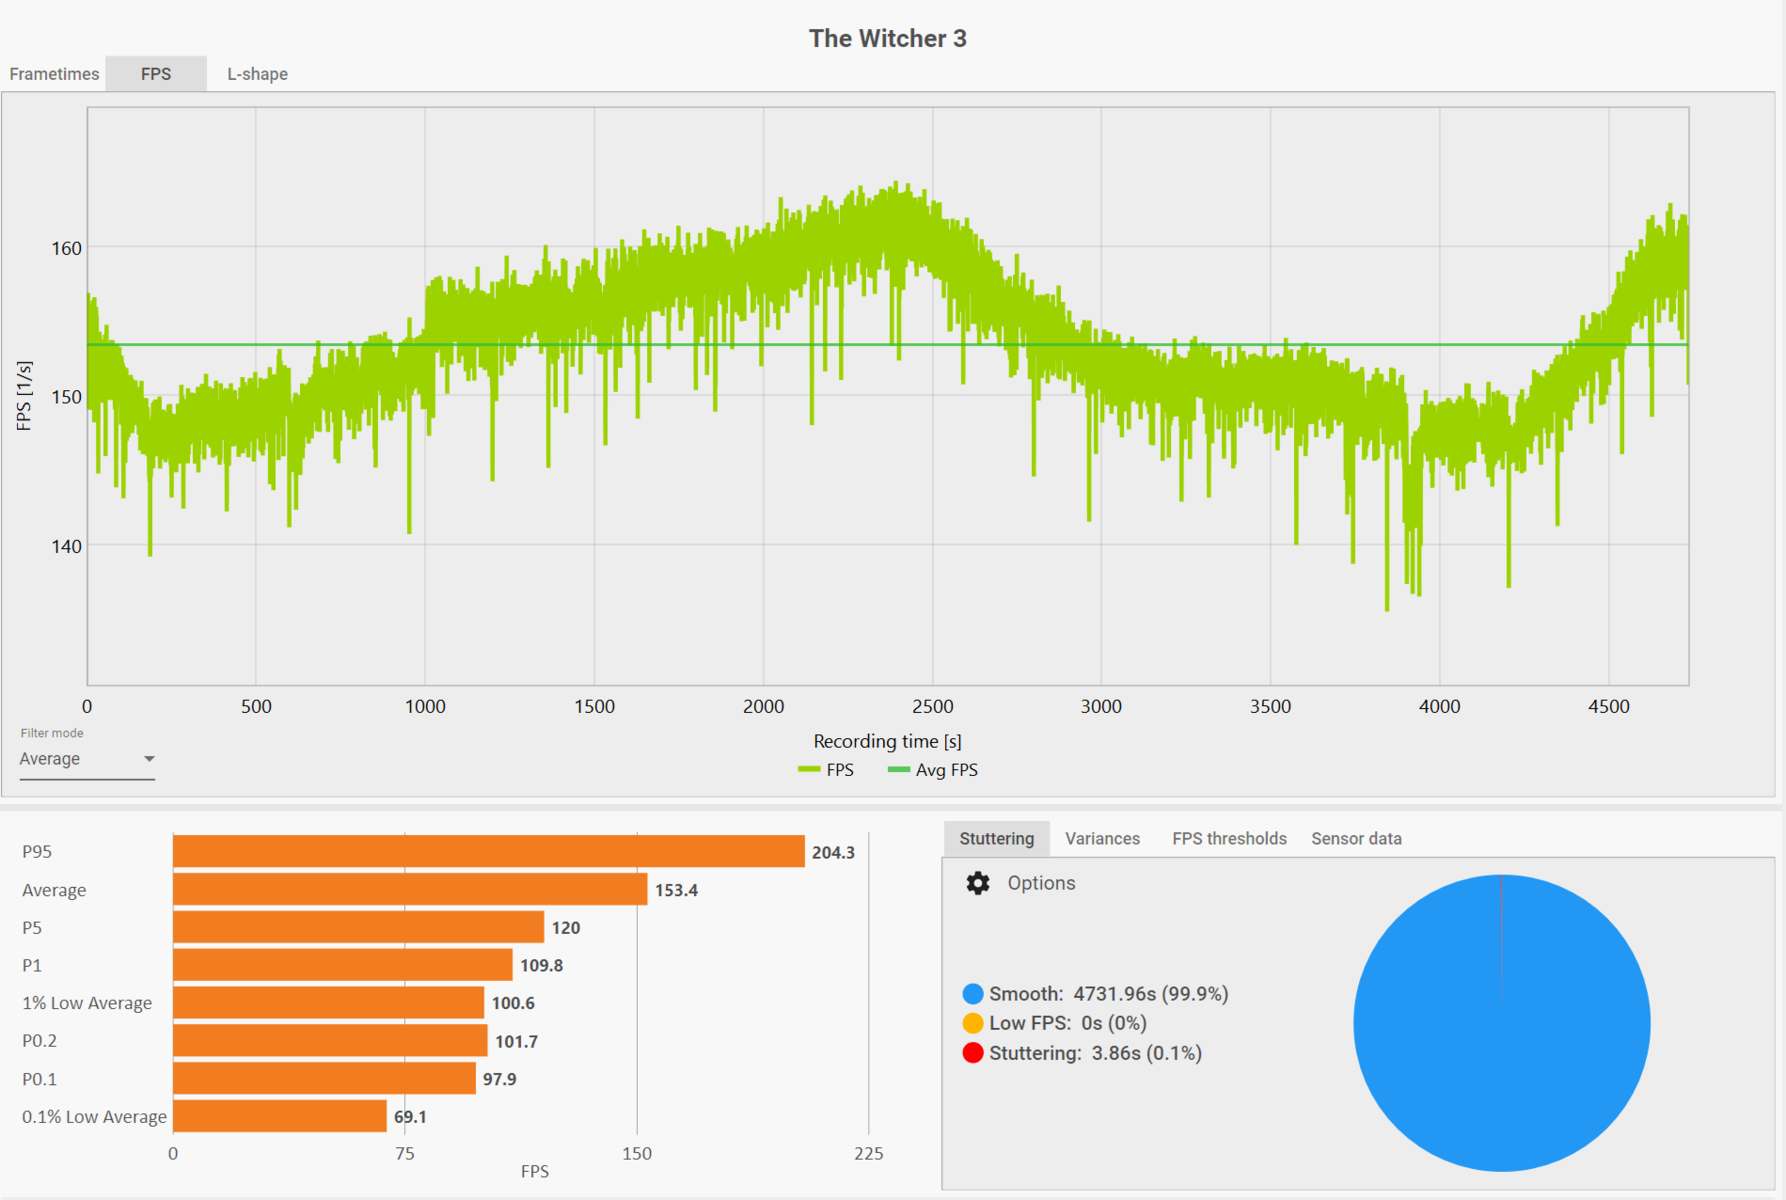
The Witcher 3 FPS Chart
| Bas | Moyen | Élevé | Ultra | QHD | 4K DLSS | 4K | |
|---|---|---|---|---|---|---|---|
| Counter-Strike: GO (2012) | 516 | 314 | |||||
| GTA V (2015) | 187.4 | 185.7 | 184.8 | 141.3 | 139.1 | 175.7 | |
| Dota 2 Reborn (2015) | 237 | 207.7 | 201.75 | 190.2 | 178.6 | ||
| Deus Ex Mankind Divided (2016) | 169 | ||||||
| Final Fantasy XV Benchmark (2018) | 224 | 208 | 177.6 | 146.7 | 90.1 | ||
| X-Plane 11.11 (2018) | 211 | 186.8 | 142.8 | ||||
| Far Cry 5 (2018) | 197 | 181 | 172 | 158 | 153 | 107 | |
| Strange Brigade (2018) | 496 | 403 | 386 | 366 | 292 | 154.7 | |
| Shadow of the Tomb Raider (2018) | 143.7 | 121.2 | 87.3 | ||||
| Control (2019) | 184.4 | 123.2 | 72.6 | ||||
| Horizon Zero Dawn (2020) | 184 | 154 | 145 | 127 | 92 | ||
| Flight Simulator 2020 (2020) | 74 | 74 | 96.8 | 51.2 | |||
| Battlefield 2042 (2021) | 172.6 | 138.9 | 85.4 | ||||
| Halo Infinite (2021) | 128.9 | 77 | 57.3 | ||||
| Elden Ring (2022) | 60 | 60 | 60 | 60 | 60 | 60 | |
| Cyberpunk 2077 1.6 (2022) | 119.7 | 94.5 | |||||
| Vampire Bloodhunt (2022) | 290 | 242 | 138.3 | ||||
| F1 22 (2022) | 319 | 308 | 273 | 124.5 | 75 | 42.4 | |
| FIFA 23 (2022) | 183.7 | 182.6 | 162.4 | ||||
| A Plague Tale Requiem (2022) | 96.8 | 72 | 82.3 | 41 | |||
| Uncharted Legacy of Thieves Collection (2022) | 108.2 | 103.1 | 62.9 | ||||
| Call of Duty Modern Warfare 2 2022 (2022) | 170 | 127 | 112 | 81 | |||
| Spider-Man Miles Morales (2022) | 109.1 | 103.8 | 73.2 | ||||
| Need for Speed Unbound (2022) | 124.2 | 111.8 | 84.3 | ||||
| High On Life (2023) | 180.3 | 120.2 | 52 | ||||
| The Witcher 3 v4 (2023) | 137.6 | 96.6 | 49 |
Émissions
Niveaux de bruit
En charge, les trois ventilateurs intégrés luttent de manière audible contre la puissance des composants. Même si les caractéristiques sonores restent très confortables, jusqu'à 55,8 dB (ventilateurs à 4900, 5500 et 6400 tours/minute), c'est toujours très fort. Pendant le jeu, le son des bons haut-parleurs peut être un peu noyé, ce qui suggère d'utiliser un casque. Si vous utilisez l'écran 240 Hz dans le jeu et qu'il atteint des fréquences d'images élevées, notre unité de test produit malheureusement un gémissement de bobine clairement perceptible. Ce bruit est audible à partir de 100 images par seconde et peut devenir un peu gênant, selon le jeu.
En mode veille, les trois ventilateurs peuvent également rester éteints pendant de longues périodes, mais uniquement en mode silencieux et lors de l'utilisation du GPU intégré. Cependant, la plupart du temps, ils ne restent pas complètement éteints pendant la navigation, mais les niveaux de ventilation les plus bas à 2000 - 3000 RPM sont confortablement silencieux à moins de 33 dB(A).
Degré de la nuisance sonore
| Au repos |
| 23.9 / 32.6 / 32.6 dB(A) |
| Fortement sollicité |
| 35.9 / 55.8 dB(A) |
 | ||
30 dB silencieux 40 dB(A) audible 50 dB(A) bruyant |
||
min: | ||
| Asus ROG Strix Scar 18 2023 G834JY-N6005W GeForce RTX 4090 Laptop GPU, i9-13980HX, 2x Samsung PM9A1 MZVL21T0HCLR (RAID 0) | Razer Blade 18 RTX 4070 GeForce RTX 4070 Laptop GPU, i9-13950HX, SSSTC CA6-8D1024 | Lenovo Legion Pro 7 16IRX8H GeForce RTX 4080 Laptop GPU, i9-13900HX, Samsung PM9A1 MZVL21T0HCLR | Razer Blade 16 Early 2023 GeForce RTX 4080 Laptop GPU, i9-13950HX, SSSTC CA6-8D1024 | MSI Titan GT77 HX 13VI GeForce RTX 4090 Laptop GPU, i9-13950HX, Samsung PM9A1 MZVL22T0HBLB | MSI Raider GE77 HX 12UHS GeForce RTX 3080 Ti Laptop GPU, i9-12900HX, Samsung PM9A1 MZVL22T0HBLB | Asus ROG Strix Scar 17 SE G733CX-LL014W GeForce RTX 3080 Ti Laptop GPU, i9-12950HX, Samsung PM9A1 MZVL22T0HBLB | |
|---|---|---|---|---|---|---|---|
| Noise | 8% | -5% | 11% | -9% | -17% | 13% | |
| arrêt / environnement * (dB) | 23.9 | 23.5 2% | 24 -0% | 23 4% | 24.6 -3% | 26 -9% | 23.9 -0% |
| Idle Minimum * (dB) | 23.9 | 23.8 -0% | 26 -9% | 23 4% | 29.2 -22% | 26 -9% | 23.9 -0% |
| Idle Average * (dB) | 32.6 | 23.8 27% | 28 14% | 23 29% | 29.2 10% | 34 -4% | 23.9 27% |
| Idle Maximum * (dB) | 32.6 | 26.8 18% | 34 -4% | 23.6 28% | 29.2 10% | 46 -41% | 23.9 27% |
| Load Average * (dB) | 35.9 | 37.3 -4% | 47 -31% | 39 -9% | 50.7 -41% | 50 -39% | 34.3 4% |
| Load Maximum * (dB) | 55.8 | 53.5 4% | 56 -0% | 51.3 8% | 61 -9% | 57 -2% | 45.9 18% |
| Witcher 3 ultra * (dB) | 48 | 55 | 51.6 | 53.3 | 55 |
* ... Moindre est la valeur, meilleures sont les performances
Températures
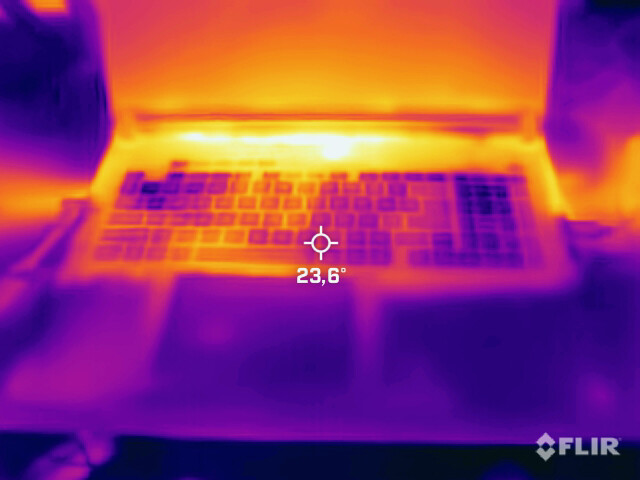
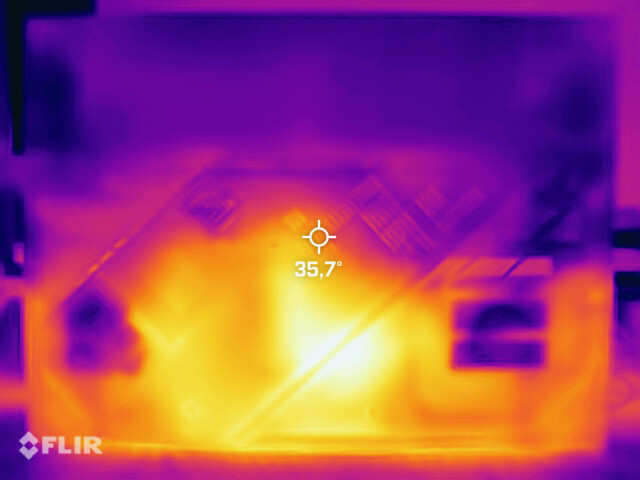
Les résultats sont mitigés en ce qui concerne les températures. Les zones du boîtier qui sont touchées, comme les repose-poignets et le clavier, restent confortablement fraîches, même lors de scénarios de stress prolongés. Mais le point chaud dans la partie supérieure du boîtier devient relativement chaud jusqu'à 55 °C (131 °F) pendant le jeu.
(-) La température maximale du côté supérieur est de 54 °C / 129 F, par rapport à la moyenne de 40.4 °C / 105 F, allant de 21.2 à 68.8 °C pour la classe Gaming.
(-) Le fond chauffe jusqu'à un maximum de 46 °C / 115 F, contre une moyenne de 43.2 °C / 110 F
(+) En utilisation inactive, la température moyenne du côté supérieur est de 27.2 °C / 81 F, par rapport à la moyenne du dispositif de 33.9 °C / 93 F.
(±) En jouant à The Witcher 3, la température moyenne du côté supérieur est de 36 °C / 97 F, alors que la moyenne de l'appareil est de 33.9 °C / 93 F.
(+) Les repose-poignets et le pavé tactile sont plus froids que la température de la peau avec un maximum de 28 °C / 82.4 F et sont donc froids au toucher.
(±) La température moyenne de la zone de l'appui-paume de dispositifs similaires était de 28.8 °C / 83.8 F (+0.8 °C / #1.4 F).
| Asus ROG Strix Scar 18 2023 G834JY-N6005W Intel Core i9-13980HX, NVIDIA GeForce RTX 4090 Laptop GPU | Razer Blade 16 Early 2023 Intel Core i9-13950HX, NVIDIA GeForce RTX 4080 Laptop GPU | MSI Titan GT77 HX 13VI Intel Core i9-13950HX, NVIDIA GeForce RTX 4090 Laptop GPU | MSI Raider GE77 HX 12UHS Intel Core i9-12900HX, NVIDIA GeForce RTX 3080 Ti Laptop GPU | Asus ROG Strix Scar 17 SE G733CX-LL014W Intel Core i9-12950HX, NVIDIA GeForce RTX 3080 Ti Laptop GPU | |
|---|---|---|---|---|---|
| Heat | 9% | 13% | -23% | -4% | |
| Maximum Upper Side * (°C) | 54 | 40 26% | 40.6 25% | 53 2% | 48.8 10% |
| Maximum Bottom * (°C) | 46 | 37.6 18% | 41.1 11% | 58 -26% | 52.4 -14% |
| Idle Upper Side * (°C) | 30 | 32.4 -8% | 26.2 13% | 38 -27% | 30.4 -1% |
| Idle Bottom * (°C) | 31 | 31.4 -1% | 30.3 2% | 43 -39% | 34.1 -10% |
* ... Moindre est la valeur, meilleures sont les performances
Test de stress
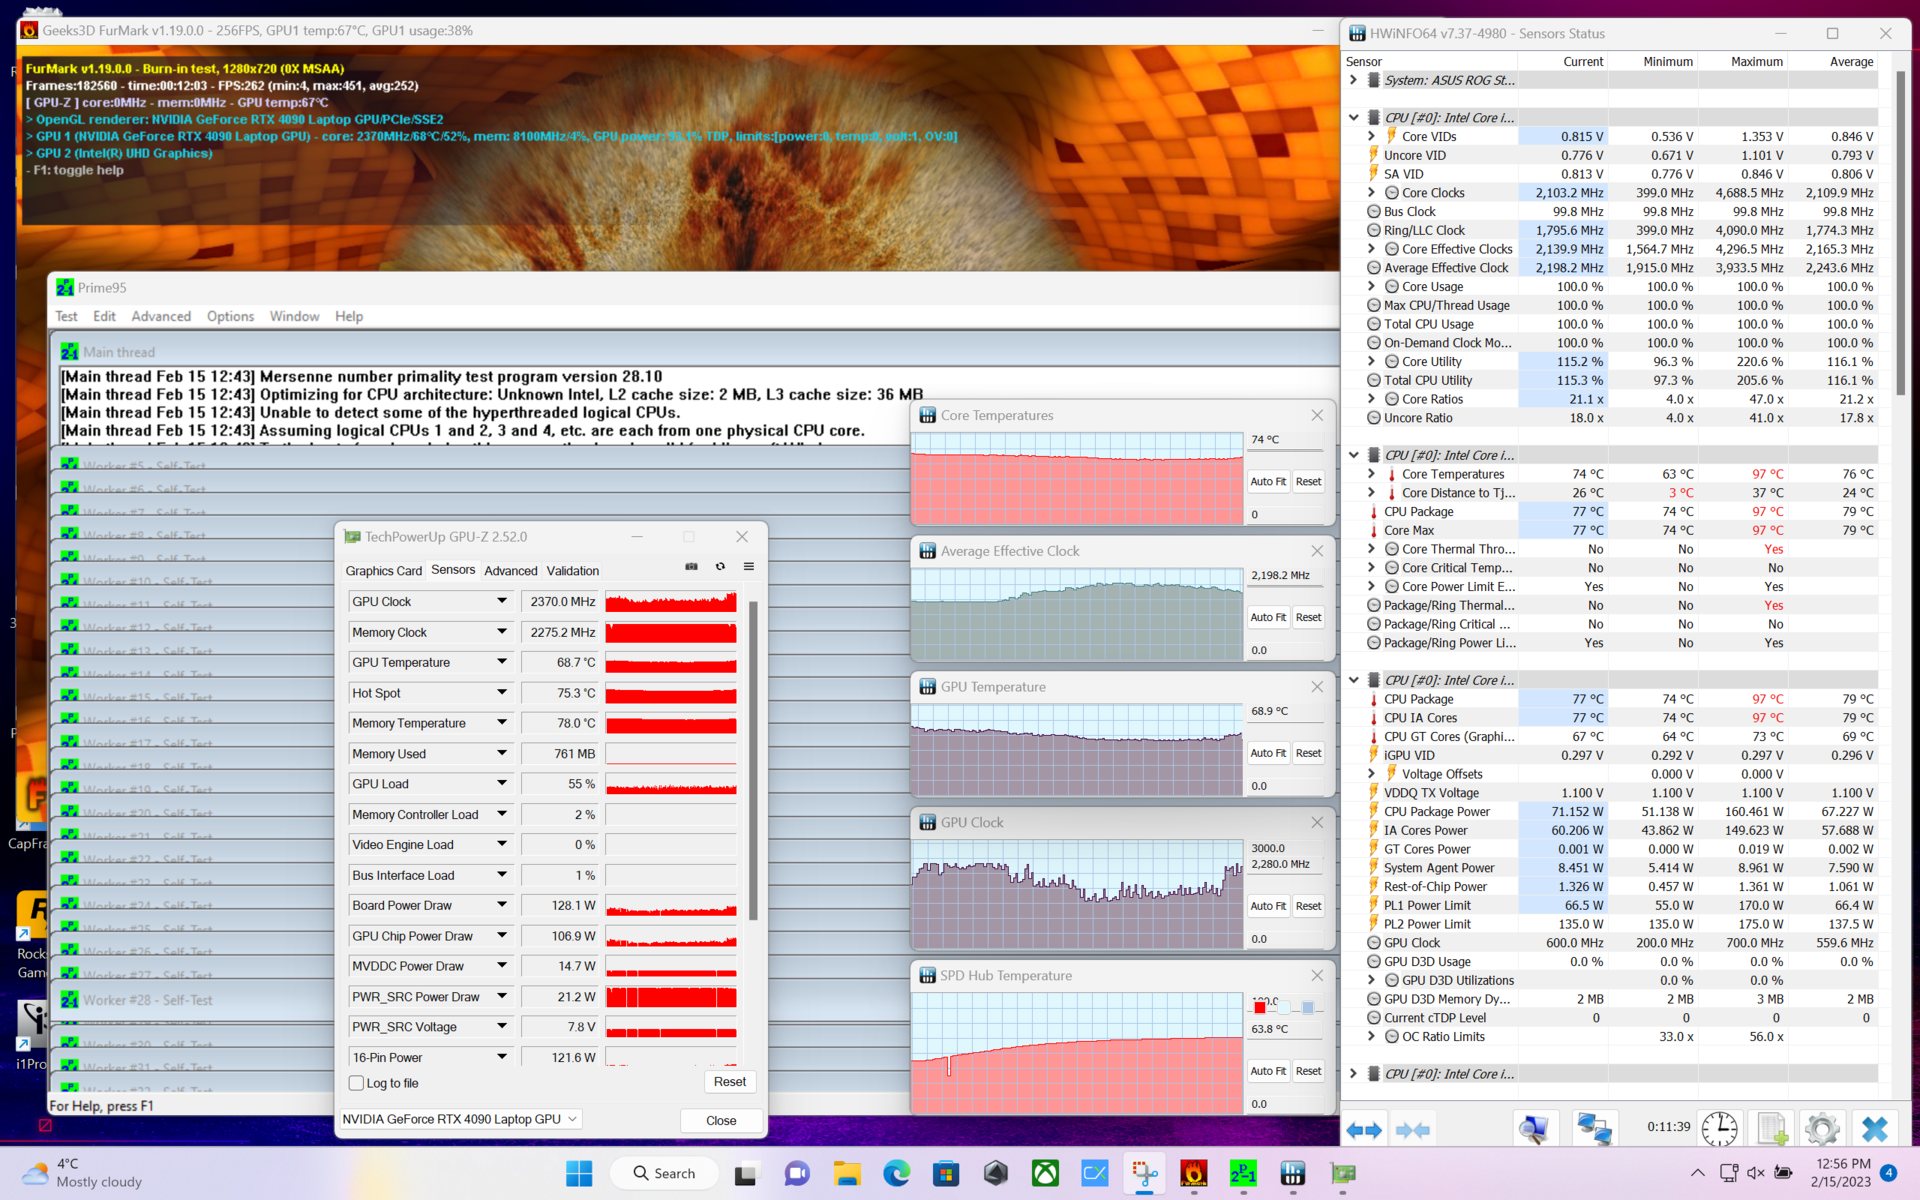
Les températures internes du CPU varient fortement lors du test de stress. Cela peut être attribué aux vitesses d'horloge constamment ajustées qui poussent le CPU près de la marque des 100 °C (212 °F). Dans le GPU, la situation est beaucoup moins critique, et la RTX 4090 n'atteint qu'une température maximale de 70 °C (158 °F).
Pendant le jeu, les températures du CPU restent légèrement moins extrêmes. Nous mesurons entre 81 °C (178 °F, Cyberpunk 2077) et 90 °C (194 °F, The Witcher 3). En revanche, entre 72 °C (162 °F, Cyberpunk 2077) et 77 °C (171 °F, The Witcher 3), le GPU est légèrement plus chaud que lors du test de stress.
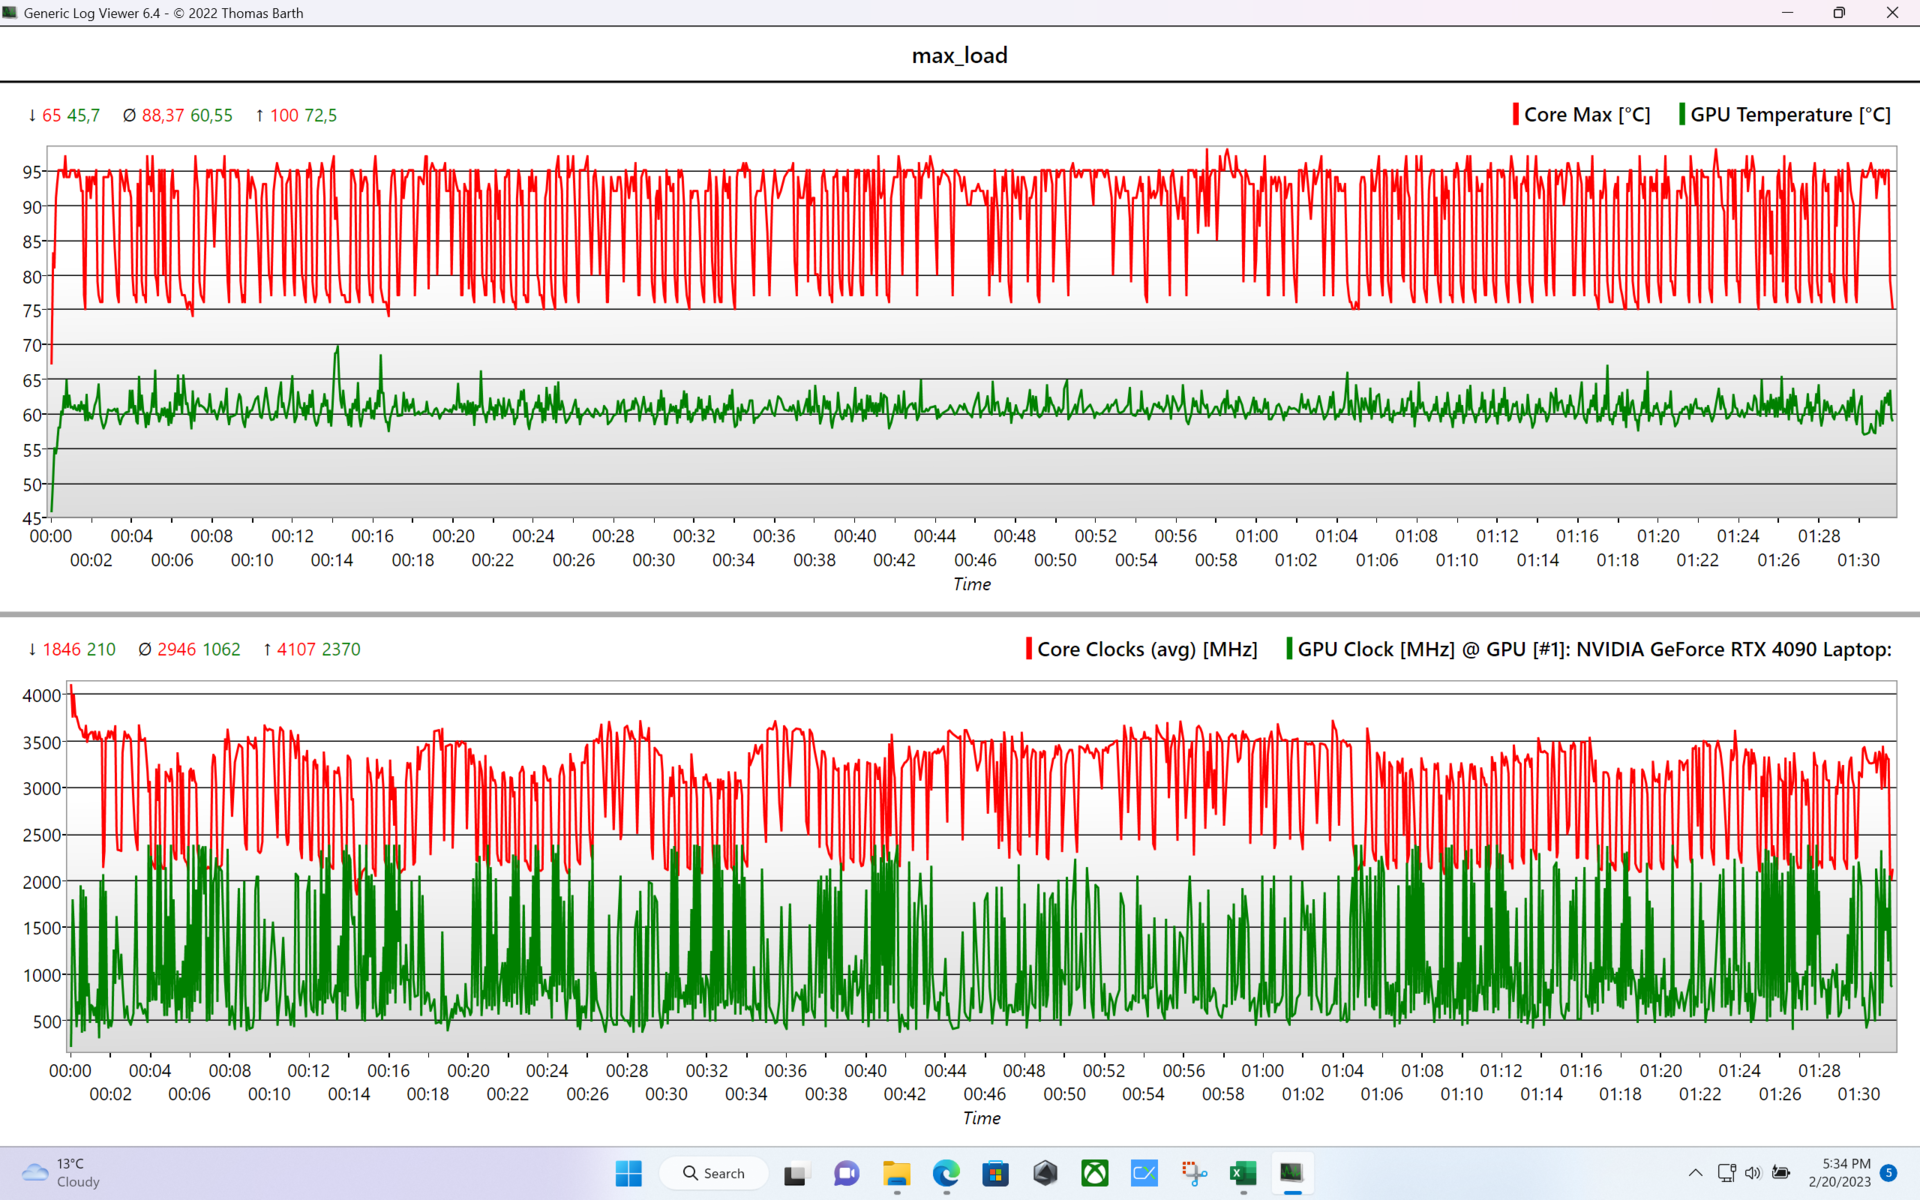
| Horloge du processeur E-Cores (GHz) | Horloge du processeur P-Cores(GHz) | Horloge du GPU (MHz) | Température moyenne du processeur (°C) | Température moyenne du GPU (°C) | |
| Système en veille (silencieux) | 1,4 | 1,8 | 0 | 42 | 0 |
| Système en veille (Turbo) | 1.6 | 2.1 | 210 | 44 | 39 |
| Prime95 Stress (Turbo) | 3 | 3.5 | 210 | 92 | 56 |
| Prime95 + FurMark Stress (Turbo) | 1.6 | 2.1 | 2260 | 80 | 73 |
| Witcher 3 Stress | 3.7 | 4.6 | 1995 | 90 | 77 |
Haut-parleurs
Les haut-parleurs intégrés sont relativement chargés en basses mais offrent une performance subjectivement attrayante qui convient à l'objectif de jeu de l'ordinateur portable. Au quotidien, le volume maximal est également suffisamment élevé.
Asus ROG Strix Scar 18 2023 G834JY-N6005W analyse audio
(+) | les haut-parleurs peuvent jouer relativement fort (82.7# dB)
Basses 100 - 315 Hz
(+) | bonne basse - seulement 4.8% loin de la médiane
(±) | la linéarité des basses est moyenne (7% delta à la fréquence précédente)
Médiums 400 - 2000 Hz
(±) | médiane supérieure - en moyenne 9% supérieure à la médiane
(+) | les médiums sont linéaires (5% delta à la fréquence précédente)
Aiguës 2 - 16 kHz
(+) | des sommets équilibrés - à seulement 3.7% de la médiane
(+) | les aigus sont linéaires (6.1% delta à la fréquence précédente)
Globalement 100 - 16 000 Hz
(±) | la linéarité du son global est moyenne (19% de différence avec la médiane)
Par rapport à la même classe
» 64% de tous les appareils testés de cette catégorie étaient meilleurs, 8% similaires, 28% pires
» Le meilleur avait un delta de 6%, la moyenne était de 18%, le pire était de 132%.
Par rapport à tous les appareils testés
» 45% de tous les appareils testés étaient meilleurs, 7% similaires, 47% pires
» Le meilleur avait un delta de 4%, la moyenne était de 23%, le pire était de 134%.
Apple MacBook Pro 16 2021 M1 Pro analyse audio
(+) | les haut-parleurs peuvent jouer relativement fort (84.7# dB)
Basses 100 - 315 Hz
(+) | bonne basse - seulement 3.8% loin de la médiane
(+) | les basses sont linéaires (5.2% delta à la fréquence précédente)
Médiums 400 - 2000 Hz
(+) | médiane équilibrée - seulement 1.3% de la médiane
(+) | les médiums sont linéaires (2.1% delta à la fréquence précédente)
Aiguës 2 - 16 kHz
(+) | des sommets équilibrés - à seulement 1.9% de la médiane
(+) | les aigus sont linéaires (2.7% delta à la fréquence précédente)
Globalement 100 - 16 000 Hz
(+) | le son global est linéaire (4.6% différence à la médiane)
Par rapport à la même classe
» 0% de tous les appareils testés de cette catégorie étaient meilleurs, 0% similaires, 100% pires
» Le meilleur avait un delta de 5%, la moyenne était de 17%, le pire était de 45%.
Par rapport à tous les appareils testés
» 0% de tous les appareils testés étaient meilleurs, 0% similaires, 100% pires
» Le meilleur avait un delta de 4%, la moyenne était de 23%, le pire était de 134%.
Gestion de l'alimentation
Consommation d'énergie
En raison de la puissance du matériel, la consommation électrique du système est très élevée. Ce qui frappe, c'est la consommation très élevée en mode veille qui alterne toujours entre 5 et 10 watts. La faute en revient peut-être aussi à l'éclairage LED avec animation, même en veille.
| Éteint/en veille | |
| Au repos | |
| Fortement sollicité |
|
Légende:
min: | |
| Asus ROG Strix Scar 18 2023 G834JY-N6005W i9-13980HX, GeForce RTX 4090 Laptop GPU, 2x Samsung PM9A1 MZVL21T0HCLR (RAID 0), IPS, 2560x1600, 18" | Razer Blade 16 Early 2023 i9-13950HX, GeForce RTX 4080 Laptop GPU, SSSTC CA6-8D1024, IPS, 2560x1600, 16" | MSI Titan GT77 HX 13VI i9-13950HX, GeForce RTX 4090 Laptop GPU, Samsung PM9A1 MZVL22T0HBLB, Mini-LED, 3840x2160, 17.3" | MSI Raider GE77 HX 12UHS i9-12900HX, GeForce RTX 3080 Ti Laptop GPU, Samsung PM9A1 MZVL22T0HBLB, IPS, 3840x2160, 17.3" | Asus ROG Strix Scar 17 SE G733CX-LL014W i9-12950HX, GeForce RTX 3080 Ti Laptop GPU, Samsung PM9A1 MZVL22T0HBLB, IPS, 2560x1440, 17.3" | Moyenne de la classe Gaming | |
|---|---|---|---|---|---|---|
| Power Consumption | 9% | 13% | 15% | 6% | 28% | |
| Idle Minimum * (Watt) | 17.3 | 15.2 12% | 14 19% | 13 25% | 19.3 -12% | 13.1 ? 24% |
| Idle Average * (Watt) | 27 | 22.8 16% | 21.6 20% | 19 30% | 26.5 2% | 19 ? 30% |
| Idle Maximum * (Watt) | 46 | 49.8 -8% | 24.8 46% | 29 37% | 27.1 41% | 24.6 ? 47% |
| Load Average * (Watt) | 133 | 121.2 9% | 122.5 8% | 143 -8% | 141 -6% | 111.3 ? 16% |
| Load Maximum * (Watt) | 329 | 273.7 17% | 418 -27% | 352 -7% | 307.9 6% | 260 ? 21% |
| Witcher 3 ultra * (Watt) | 242 | 265 | 247 | 225 |
* ... Moindre est la valeur, meilleures sont les performances
Power Consumption The Witcher 3 / Stress Test
Power Consumption with External Monitor
Autonomie de la batterie
En raison des composants gourmands en énergie, la batterie d'une capacité de 90 Wh n'est pas en mesure de produire des valeurs record. En mode Optimus (avec GPU désactivé), profil Silent, et avec une luminosité abaissée à 150 cd/m², vous pouvez tout de même travailler pendant plusieurs heures hors réseau. Notre test WLAN a duré un peu plus de 7 heures dans ce mode. En revanche, si vous voulez jouer à des jeux en mode batterie, non seulement vous devez vous contenter de performances nettement inférieures, mais l'autonomie n'a duré qu'une heure environ dans notre test (sans limitation de la fréquence d'images) avec The Witcher 3.
La batterie a été complètement rechargée après 1h 40min avec le système éteint ou 1h 45min en mode veille. L'alimentation électrique fournissait alors un maximum de 117 watts.
| Asus ROG Strix Scar 18 2023 G834JY-N6005W i9-13980HX, GeForce RTX 4090 Laptop GPU, 90 Wh | Razer Blade 16 Early 2023 i9-13950HX, GeForce RTX 4080 Laptop GPU, 95.2 Wh | MSI Titan GT77 HX 13VI i9-13950HX, GeForce RTX 4090 Laptop GPU, 99.9 Wh | MSI Raider GE77 HX 12UHS i9-12900HX, GeForce RTX 3080 Ti Laptop GPU, 99.99 Wh | Asus ROG Strix Scar 17 SE G733CX-LL014W i9-12950HX, GeForce RTX 3080 Ti Laptop GPU, 90 Wh | Moyenne de la classe Gaming | |
|---|---|---|---|---|---|---|
| Autonomie de la batterie | 21% | 6% | 30% | -41% | 28% | |
| H.264 (h) | 7 | 6 -14% | 6.5 -7% | 8.27 ? 18% | ||
| WiFi v1.3 (h) | 7.1 | 6.1 -14% | 5.3 -25% | 5.4 -24% | 4.2 -41% | 7.08 ? 0% |
| Witcher 3 ultra (h) | 0.9 | |||||
| Load (h) | 0.9 | 1.4 56% | 1.4 56% | 2 122% | 1.496 ? 66% | |
| Reader / Idle (h) | 8.9 | 9.8 | 7.84 ? |
Points positifs
Points négatifs
Verdict
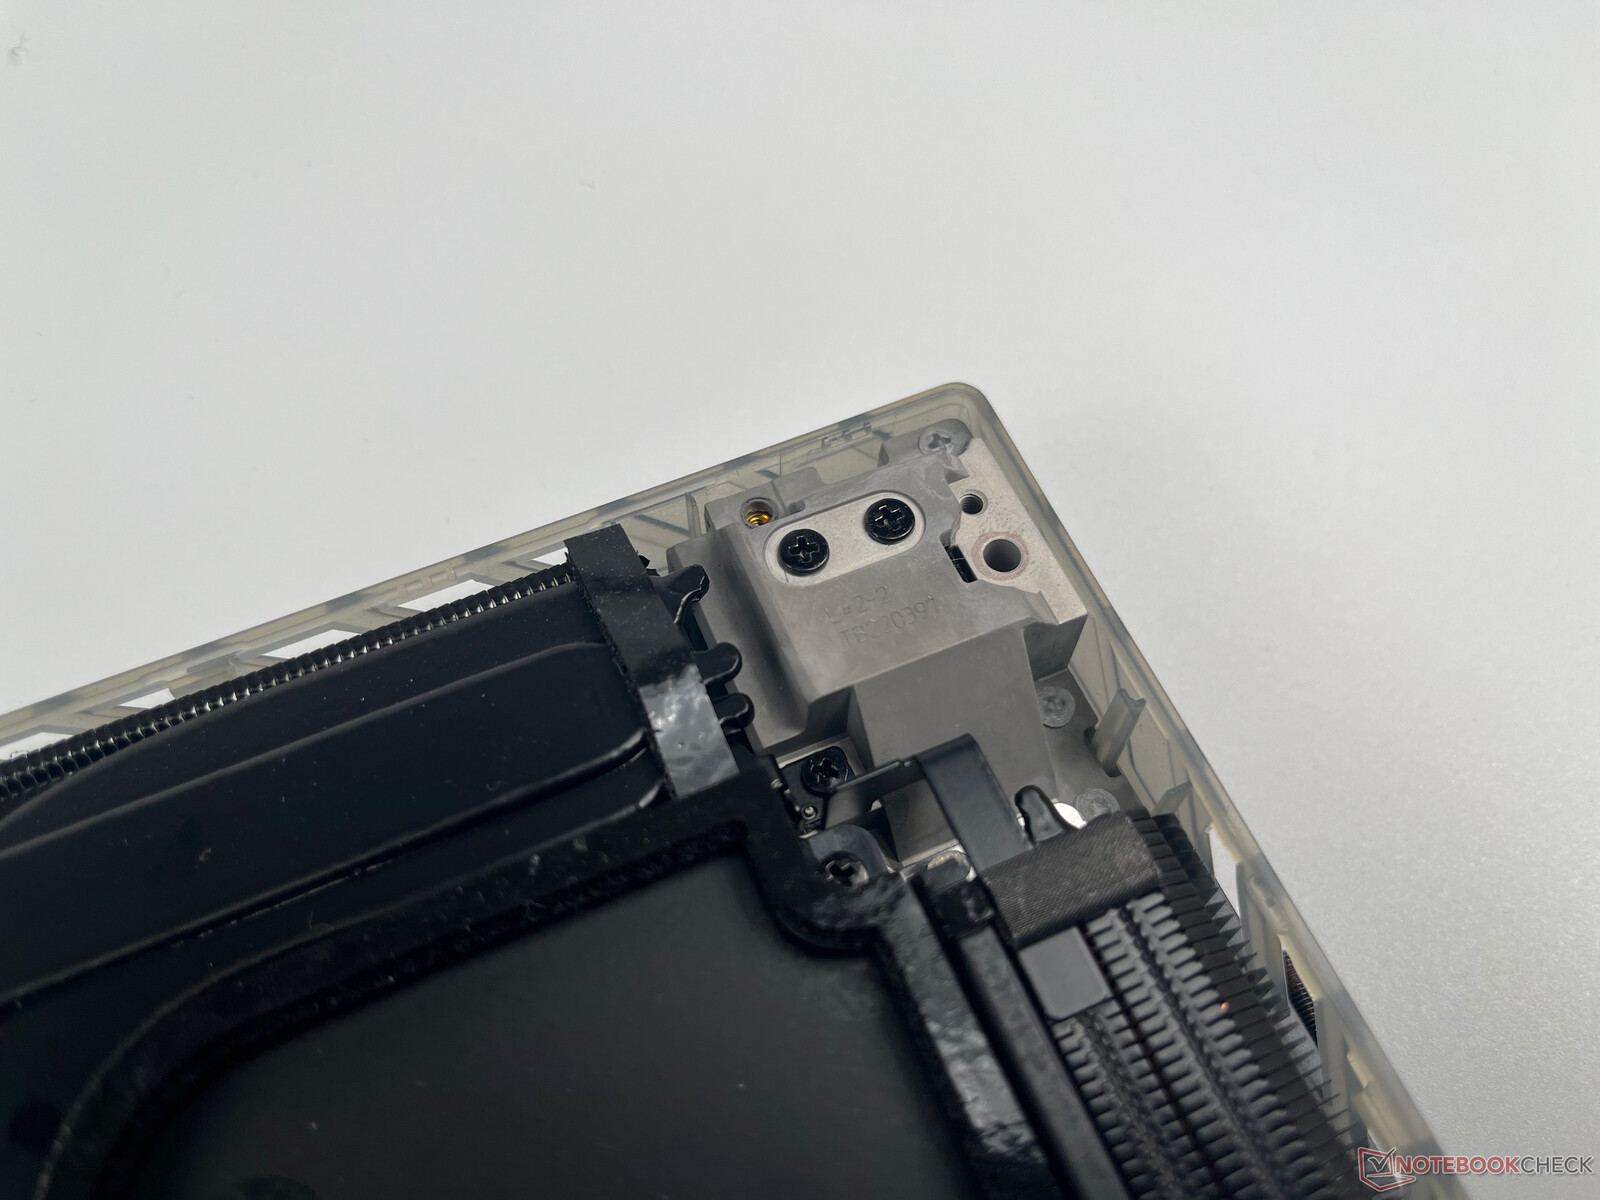
L'Asus ROG Strix SCAR 18 (2023) G834JY est un ordinateur portable de jeu haut de gamme qu'Asus a équipé des composants mobiles les plus puissants actuellement disponibles. Le grand boîtier abrite un très bon écran de 18 pouces qui offre aux joueurs des temps de réponse rapides, G-SYNC et une bonne qualité d'image. Mais le point fort du G834JY est sans aucun doute son matériel puissant avec un Core i9-13980HX, un GPU RTX 4090 pour ordinateur portable GeForce (175 W TGP) et un SSD NVMe RAID-0. Alors que ces composants produisent une quantité massive de chaleur sous charge, Asus garde cela bien en main avec un système de refroidissement à triple ventilateur, un caloduc à chambre à vapeur et une pâte métallique liquide.
Le ROG Strix SCAR 18 est un ensemble bien équilibré avec des performances impressionnantes pour un prix élevé.
Nos seuls points de plainte sont mineurs, comme le gémissement de la bobine de notre unité de test avec des taux de trame élevés, la mauvaise webcam, ou le positionnement des ports, qui peuvent être moins qu'optimaux dans certains cas.
Comme alternatives, vous pouvez obtenir les modèles 18 pouces avec GPU RTX 4090 d'Alienware (m18 R1) et de Razer (Blade 18). MSI propose le modèle un peu plus rapide Titan GT77 HX 13VI avec un écran de 17 pouces. Ceux qui peuvent se contenter de performances légèrement inférieures peuvent jeter un coup d'œil aux modèles basés sur la RTX 4080, qui sont nettement plus abordables. La version G834JZ du Scar 18 pourrait également représenter une alternative intéressante ici.
Prix et disponibilité
Le G834JY-N6000W que nous avons testé est actuellement disponible uniquement en Angleterre pour £3999.99 (prix catalogue). Certains magasins américains proposent le G834JY-XS97 actuellement au prix de 3899,99(en rupture de stock chez Asus), et Amazon propose le G834JY-XS97 pour 5390 $.
Asus ROG Strix Scar 18 2023 G834JY-N6005W
- 03/07/2023 v7 (old)
Klaus Hinum
Transparency
La sélection des appareils à examiner est effectuée par notre équipe éditoriale. L'échantillon de test a été prêté à l'auteur par le fabricant ou le détaillant pour les besoins de cet examen. Le prêteur n'a pas eu d'influence sur cette évaluation et le fabricant n'a pas reçu de copie de cette évaluation avant sa publication. Il n'y avait aucune obligation de publier cet article. En tant que média indépendant, Notebookcheck n'est pas soumis à l'autorité des fabricants, des détaillants ou des éditeurs.
Voici comment Notebookcheck teste
Chaque année, Notebookcheck examine de manière indépendante des centaines d'ordinateurs portables et de smartphones en utilisant des procédures standardisées afin de garantir que tous les résultats sont comparables. Nous avons continuellement développé nos méthodes de test depuis environ 20 ans et avons établi des normes industrielles dans le processus. Dans nos laboratoires de test, des équipements de mesure de haute qualité sont utilisés par des techniciens et des rédacteurs expérimentés. Ces tests impliquent un processus de validation en plusieurs étapes. Notre système d'évaluation complexe repose sur des centaines de mesures et de points de référence bien fondés, ce qui garantit l'objectivité.Price comparison

