Notebookcheck Logo

Test de l'Intel Raptor Lake-HX Refresh : Core i9-14900HX avec plus de performances à cœur unique

Les performances avant l'efficacité. Le Rafraîchissement Raptor Lake-HX d'Intel est une mise à jour de ses processeurs mobiles les plus rapides utilisés dans les ordinateurs portables multimédias et de jeu puissants, promettant de meilleures performances dans les jeux et dans les scénarios à cœur unique. Nous avons testé le nouveau Core i9-14900HX et l'avons comparé à l'ancien Core i9-13900HX ainsi qu'à l'AMD Ryzen 9 7945HX.

En décembre dernier, Intel a dévoilé ses nouveaux processeurs mobiles Core-Ultra de la génération Meteor-Lake (voir ici) qui, pour la première fois, s'appuient sur une conception en tuiles/chiplets et fonctionnent dans une zone comprise entre 28 et 115 watts. Pour ses processeurs mobiles HX plus puissants, Intel continue d'utiliser sa célèbre génération Raptor-Lake et a baptisé les nouvelles puces "Raptor Lake Refresh", l'ancienne appellation "Core i9-14xxxHX" restant inchangée. De manière générale, l'architecture et la configuration des cœurs n'ont pas changé, mais leur fréquence d'horloge turbo maximale a été augmentée. Outre l'augmentation des performances des cœurs uniques, Intel promet que les nouveaux processeurs offriront de meilleures performances en cas de charge mixte simple/multi-cœur, ce qui est nécessaire pour les jeux en particulier. Bien entendu, nous voulons le vérifier et nous allons comparer le nouveau Core i9-14900HX avec les anciens processeurs de la 13ème génération (Core i9-13900HX, Core i9-13950HX, Core i9-13980HX) ainsi que les deux fleurons d'AMD, à savoir le Ryzen 9 7945HX et le Ryzen 9 7945HX3D.

Aperçu de la 14e génération de Raptor Lake-HX

Intel a légèrement modifié sa gamme de modèles Raptor-Lake-HX de la 14e génération, le Core i9-14900HX étant désormais le nouveau processeur mobile phare. Actuellement, il s'agit également de la seule puce HX dotée d'un total de 24 cœurs (32 threads), puisque les Core i9-13950HX et Core i9-13980HX n'ont pas de successeur pour le moment. Nous n'avons pas non plus d'informations sur l'éventualité d'une succession de ces modèles. Sa fréquence d'horloge a changé, puisque ses huit cœurs P peuvent désormais atteindre 5,8 GHz (avec un ou deux cœurs actifs, sinon max. 5,2 GHz), surpassant même les Core i9-13980HX Core i9-13980HX de 200 MHz et le Core i9-13900HX de 400 MHz. La fréquence d'horloge maximale des 16 cœurs E est désormais de 4,1 GHz (au lieu de 4,0 GHz). La taille du cache reste de 36 Mo et Intel indique toujours une puissance de base de 55 watts et une consommation maximale de 157 watts. Nous savons toutefois que les modèles de la 13e génération HX peuvent consommer encore plus.

UGS Raptor Lake-HX (source : Intel)
Caractéristiques de la plateforme Raptor Lake-HX (source : Intel)

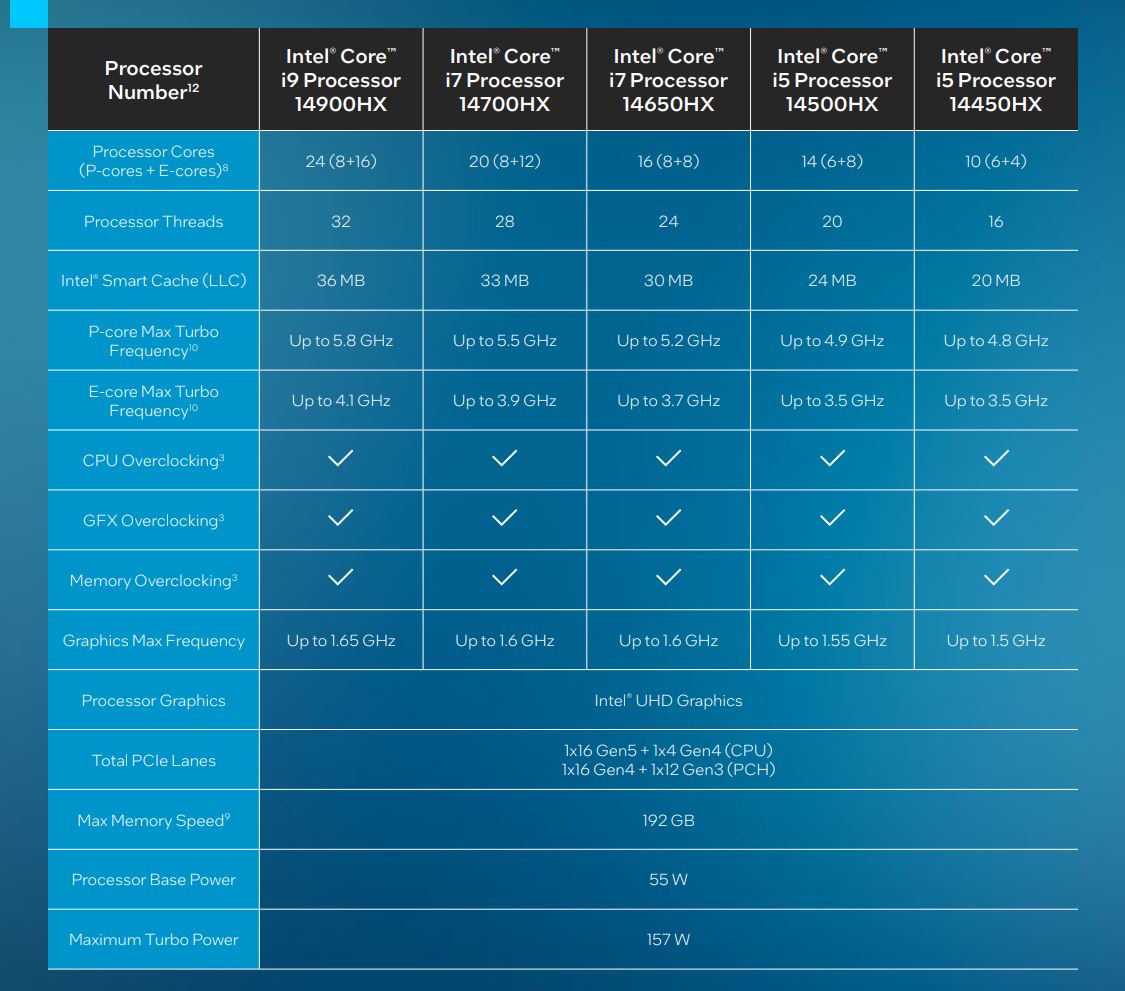
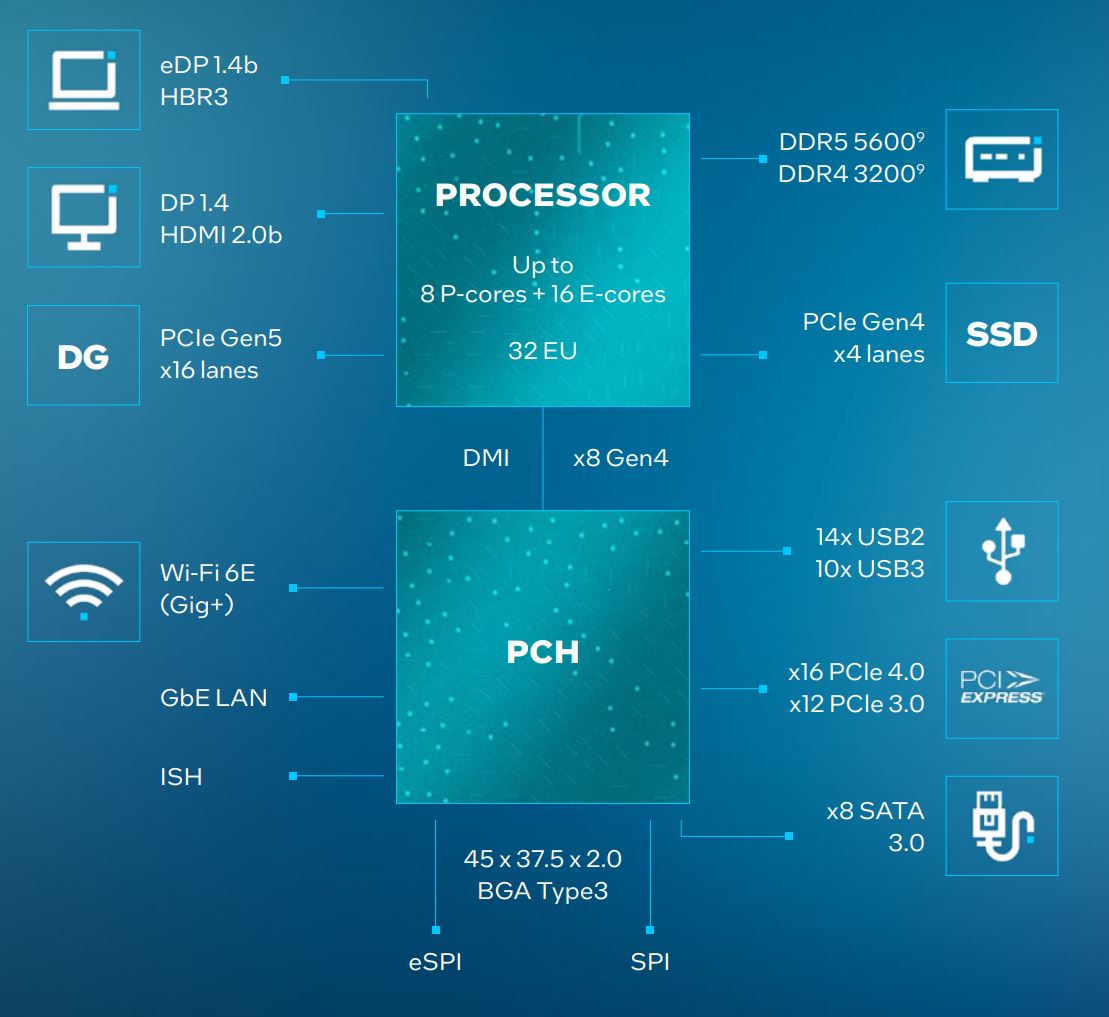
Le Core i7-14700HX a été doté de quatre cœurs E supplémentaires, ce qui fait passer le nombre total de cœurs de 16 à 20 (28 threads). En outre, leur fréquence d'horloge a également été augmentée. La gamme est complétée par le Core i7-14650HX, le Core i5-14500HX et le Core i5-14450HX. Au total, le nombre de processeurs HX est passé de neuf à cinq. Les nouveaux modèles HX supportent un maximum de 192 Go de mémoire vive (DDR5-5600).

Raptor Lake-HX avec Wi-Fi 7 en option
Thunderbolt 5 avec charge de 240 watts via USB-C est compatible en option.

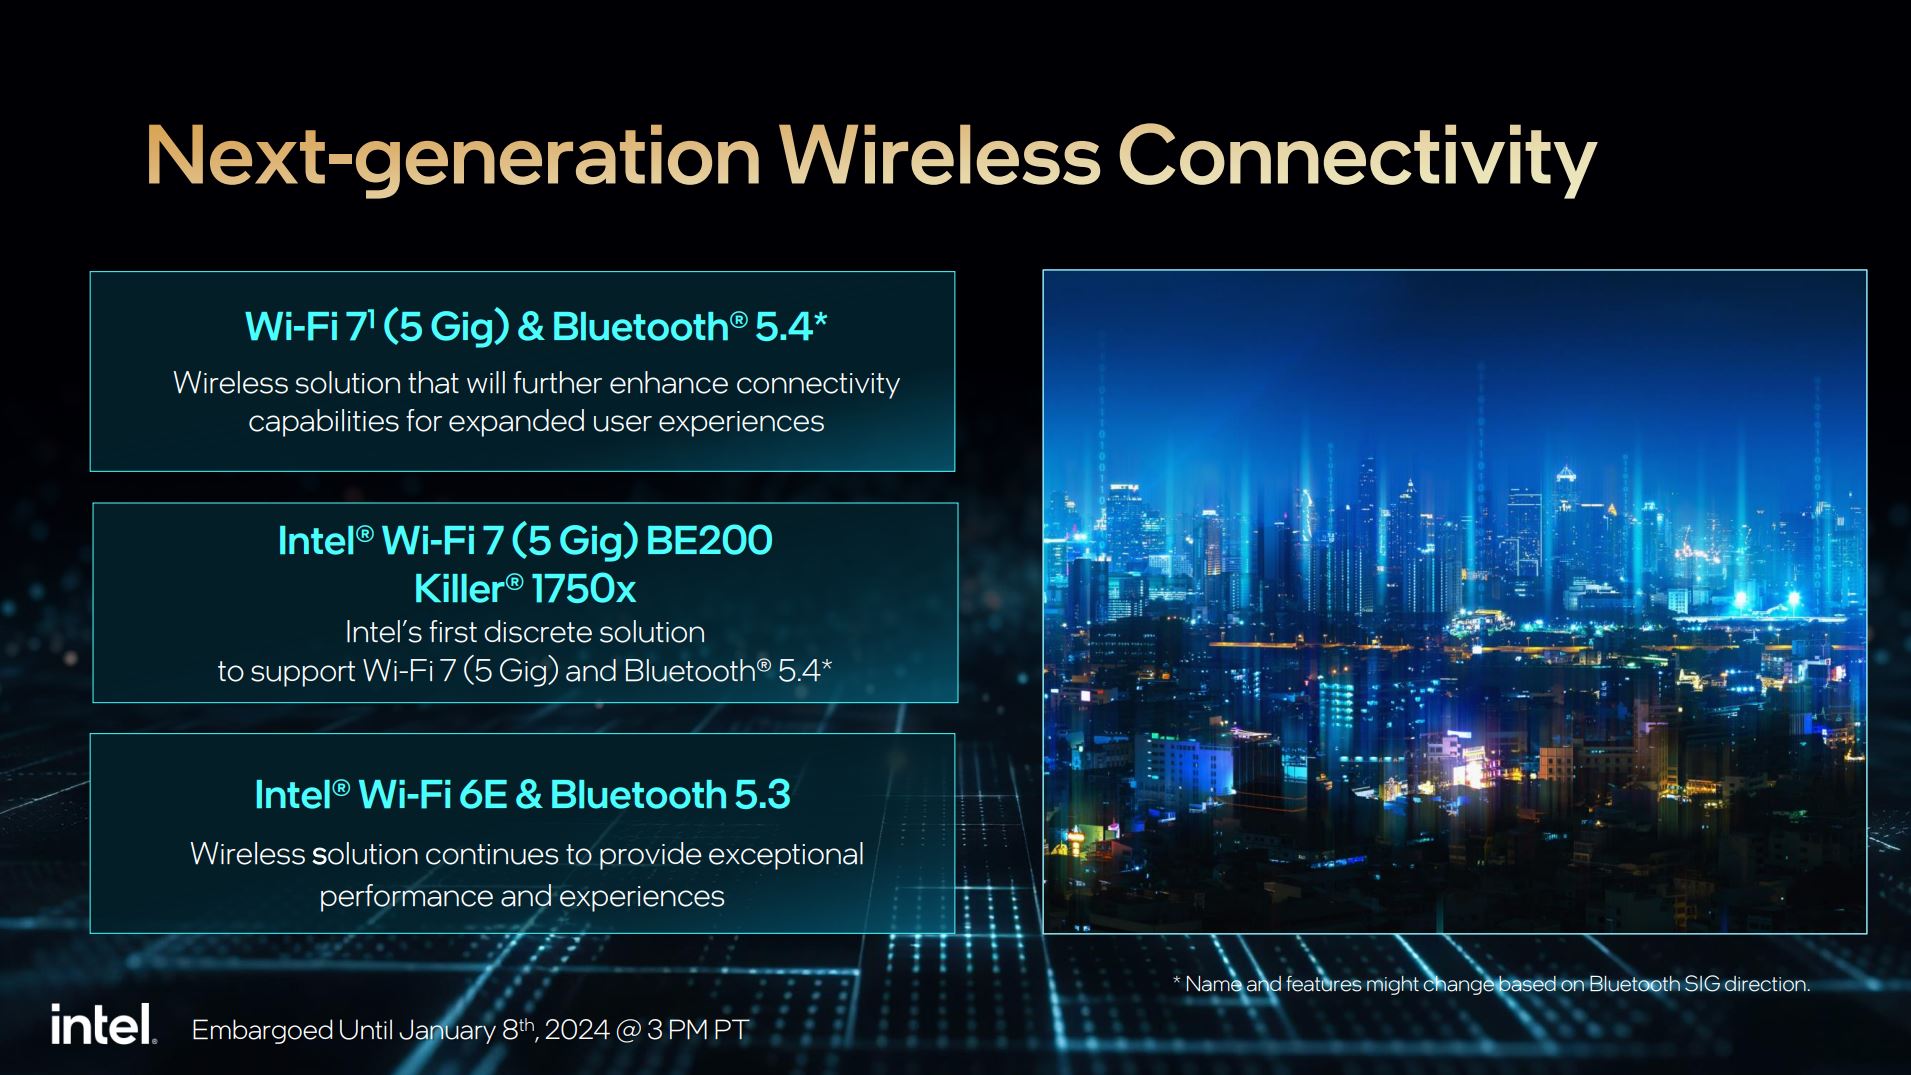
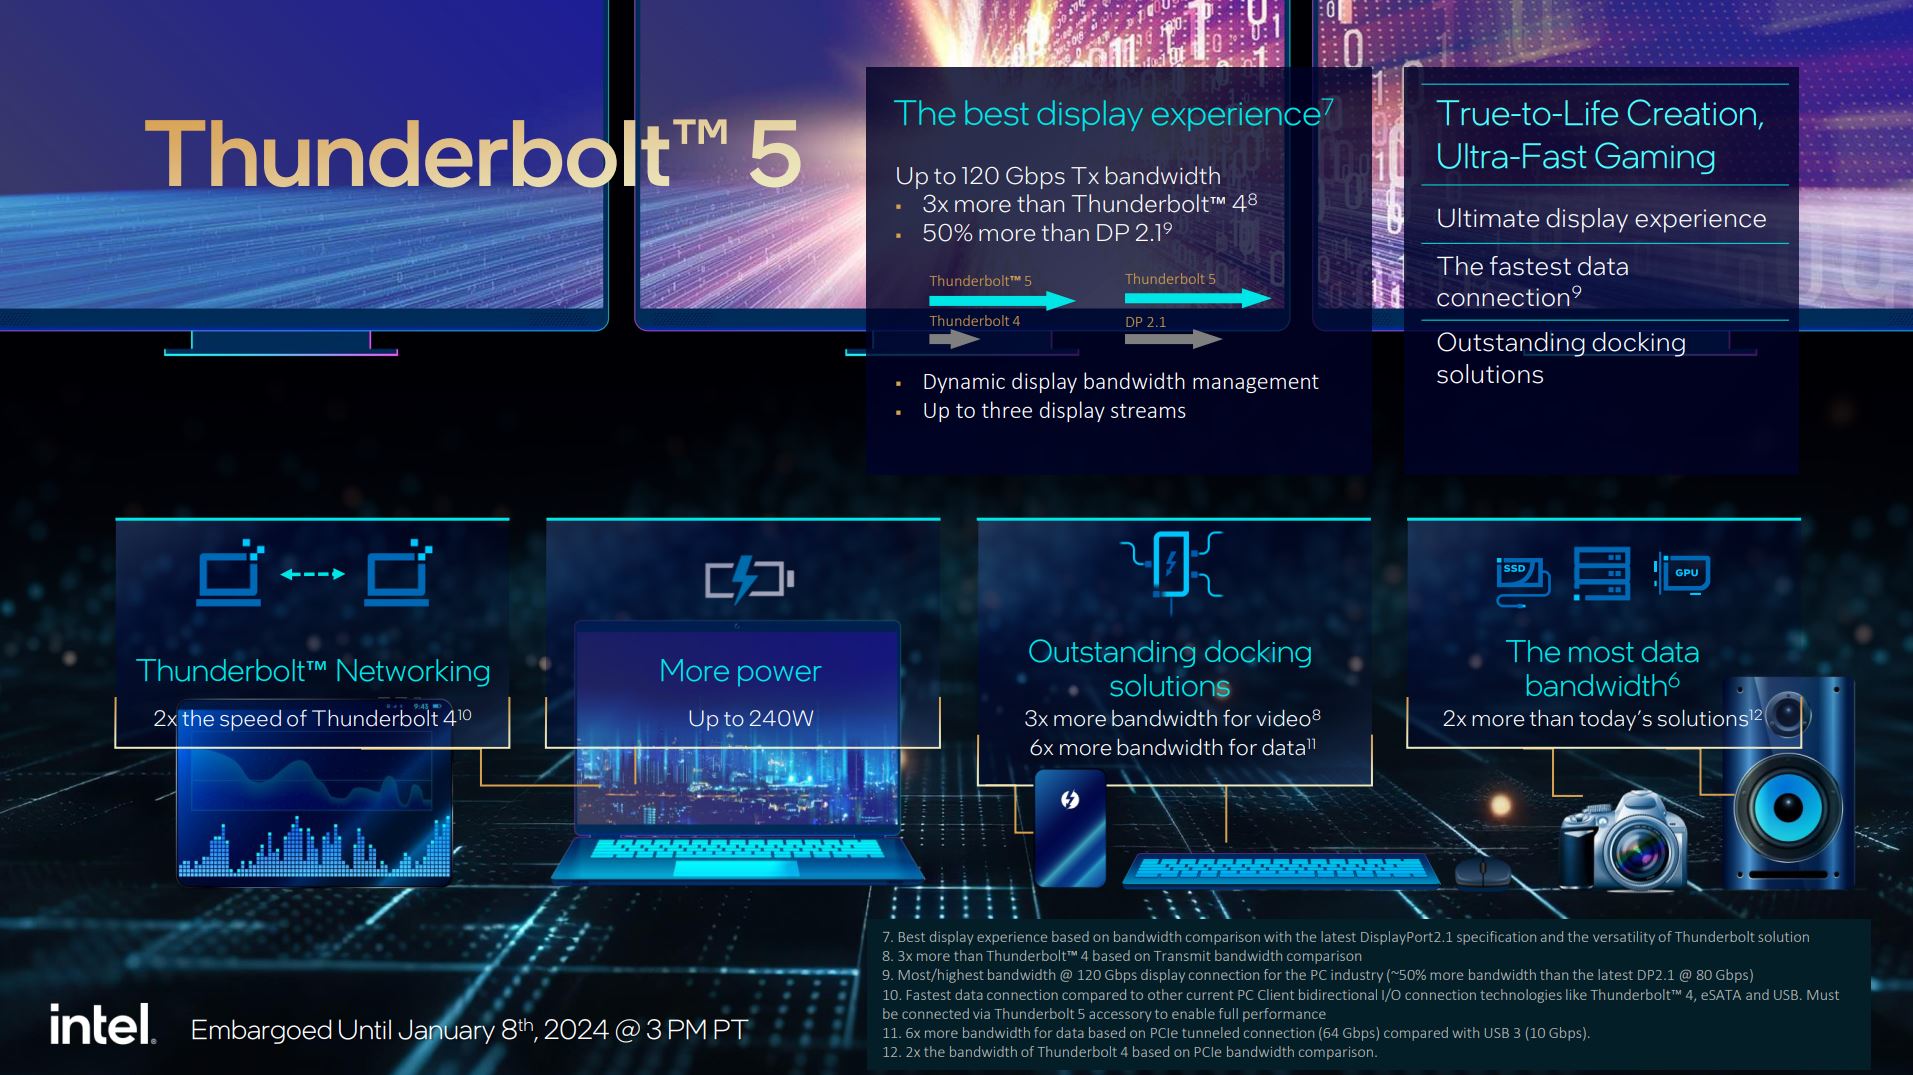
En ce qui concerne la connectivité, les fonctions les plus récentes telles que Wi-Fi 7 ou Thunderbolt 5 sont prises en charge, mais uniquement de manière optionnelle. Dans ce cas, tout dépend des fonctions que les fabricants décident de mettre à la disposition des utilisateurs. De plus, tous les modèles HX peuvent être overclockés et grâce au logiciel XTU d'Intel, cela se fait très confortablement.

Système de test - XMG Neo 17 (E24)

XMG Neo 17 (E24)
XMG Neo 17 (E24)

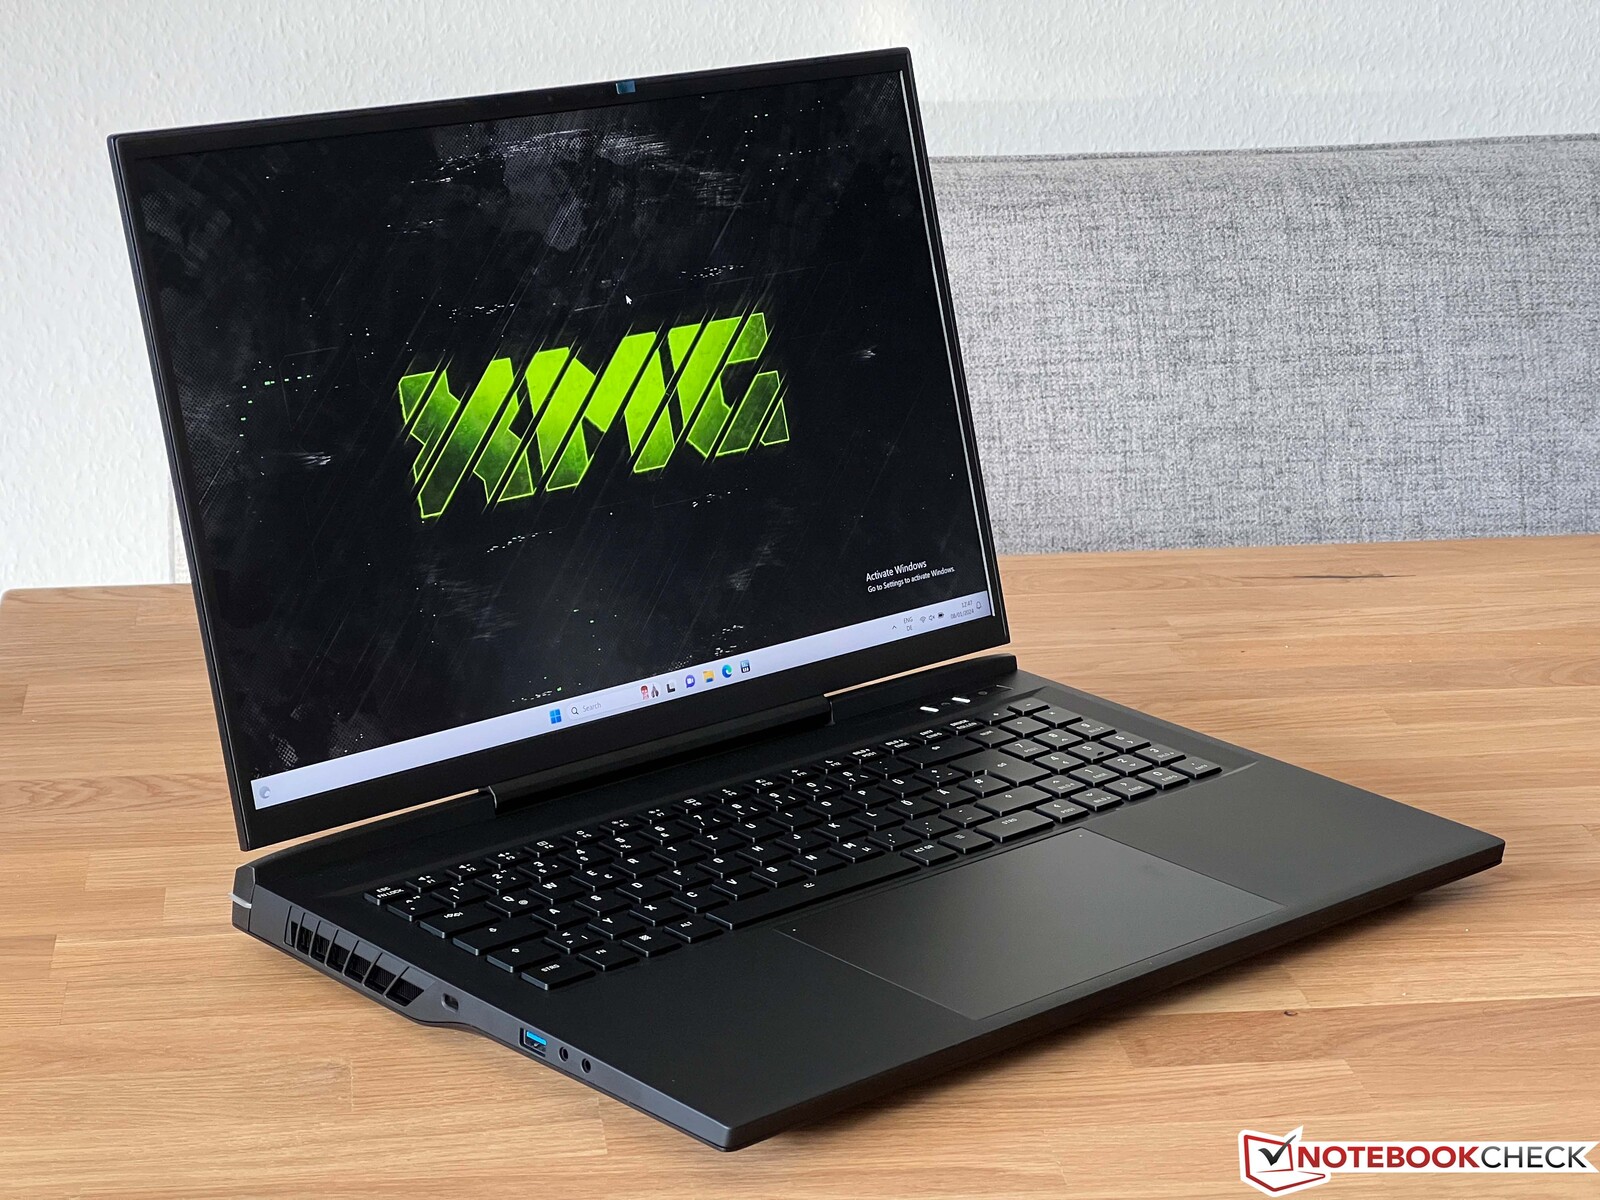
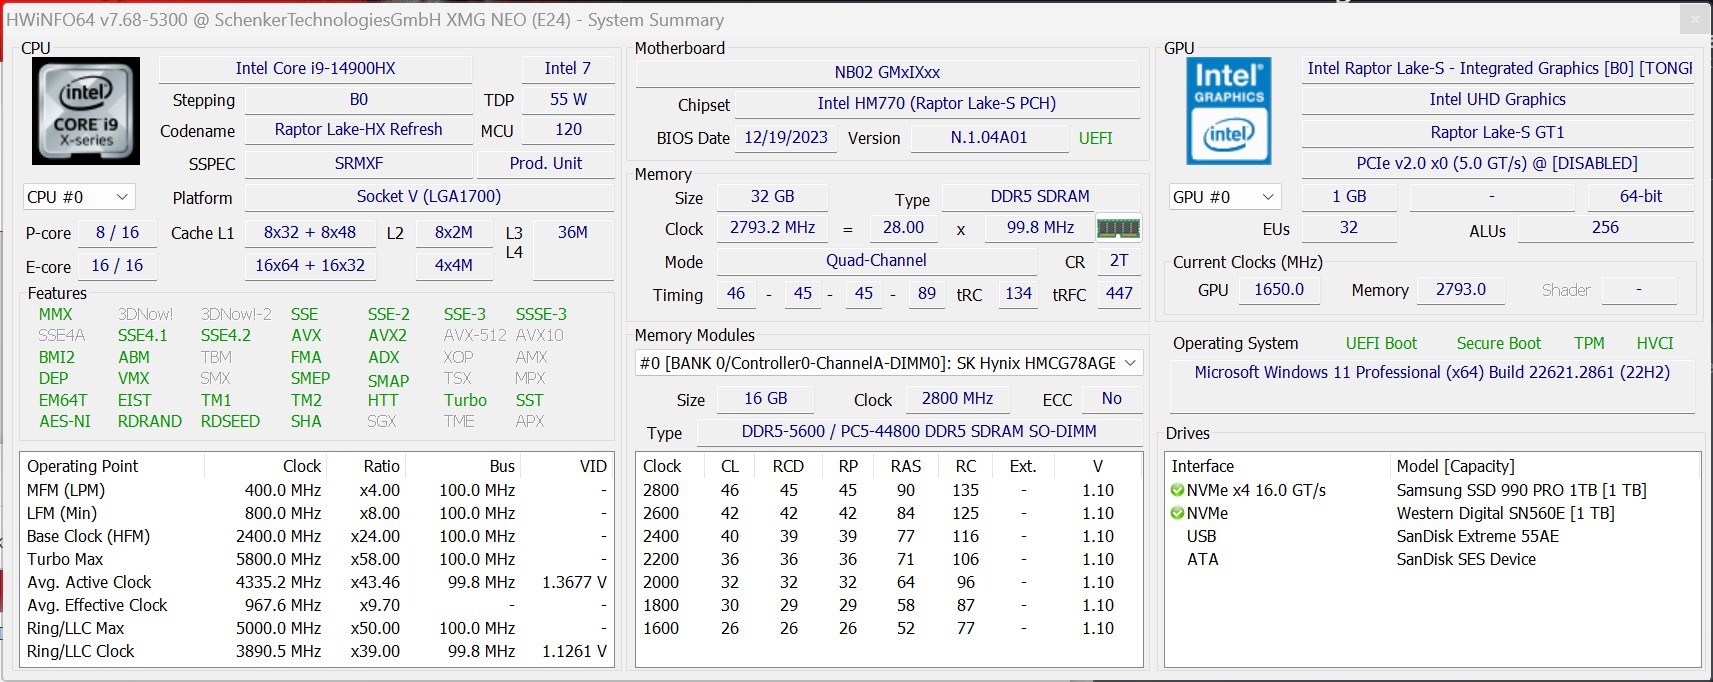
Nous avons reçu un premier échantillon du nouveau système de test, le XMG Neo 17 (E24)équipé d'un Core i9-14900HX, d'un ordinateur portable Nvidia GeForce RTX 4090 et de 32 Go de RAM DDR5-5600. Le nouveau XMG Neo 17 (E24) utilise le même boîtier que la version 2023, mais il y a quelques différences à l'intérieur. Il y a notamment un nouveau mode pure-iGPU, la batterie peut être rechargée via USB-C (100 watts) et le caloduc pour le refroidissement à eau Oasis couvre désormais mieux la zone du CPU. Le Neo 17 vous permet également de réduire la tension du CPU (undervolting) dans le BIOS.

L'appareil continue d'utiliser un écran IPS de 17 pouces compatible G-Sync avec une résolution de 2 560 x 1 600 pixels, un format 16:10 et un taux de rafraîchissement de 240 Hz. Vous avez le choix entre un clavier à membrane silencieux et un clavier mécanique optionnel (Cherry MX Ultra Low Profile Tactile Switches).

HWiNFO XMG Neo 17 (E24)

Le GPU peut à nouveau utiliser un maximum de 150 watts (+25 watts Dynamic Boost), tandis que le processeur fonctionne en permanence à un maximum de 160 watts (PL4 : 250 watts) - bien que nous ayons mesuré 170 watts pendant nos tests. Nous avons effectué les tests suivants sans utiliser le système de refroidissement à eau Oasis. Nous publierons bientôt un test complet du XMG Neo 17 E24.

Remarque : lors de nos mesures de puissance avec un écran externe, la carte graphique dédiée était active - c'était également le cas sur un grand nombre de systèmes de comparaison. La configuration de la sortie vidéo dépend largement de celle du fabricant de l'ordinateur portable, la sortie HDMI du XMG Neo 17 (E24) et son port USB-C sont connectés directement au dGPU.

Performances et efficacité d'un seul cœur

Grâce à son horloge turbo plus élevée (jusqu'à 5,8 GHz), Intel a encore amélioré ses performances à cœur unique, ce qui permet au nouveau Core i9-14900HX de devancer de 3 % le Core i9-1398080X Core i9-13980HX et de 9 % par rapport au plus rapide des Core i9-13900HX Core i9-13900HX le plus rapide lors du test Cinebench R23. Apple le nouveau processeur M3 Max (16 cœurs de processeur) a été battu de 13 %, mais il a devancé le nouveau Core i9-14900HX dans Geekbench 6.2 et le nouveau Cinebench 2024. Le processeur AMD Ryzen 9 7945HX d'AMD a été battu de 15 %.

Cinebench R23: Single Core
Cinebench R20: CPU (Single Core)
Cinebench R15: CPU Single 64Bit
7-Zip 18.03: 7z b 4 -mmt1
Geekbench 5.5: Single-Core
Geekbench 6.2: Single-Core
Cinebench 2024: CPU Single Core
Cinebench R23 / Single Core
Intel Core i9-14900HX
SCHENKER XMG Neo 17 2024 Engineering Sample
2232 Points
Intel Core i9-13980HX
MSI Titan GT77 HX 13VI
2169 Points -3%
Intel Core i9-13950HX
MSI Titan GT77 HX 13VI
2100 Points -6%
Intel Core i9-13900HX
SCHENKER XMG Neo 16 Raptor Lake
2055 Points -8%
Intel Core i9-13900HX
Lenovo Legion Pro 7 16IRX8H
2043 Points -8%
Intel Core i9-13950HX
Razer Blade 16 Early 2023
2029 Points -9%
Apple M3 Max 16-Core
Apple MacBook Pro 16 2023 M3 Max
1968 Points -12%
AMD Ryzen 9 7945HX
Asus Zephyrus Duo 16 GX650PY-NM006W
1940 Points -13%
AMD Ryzen 9 7945HX
Asus ROG Strix G17 G713PI (Turbo Mode)
1936 Points -13%
AMD Ryzen 9 7945HX3D
Asus ROG Strix Scar 17 G733PYV-LL053X
1935 Points -13%
Intel Core i9-12900HX
MSI Titan GT77 12UHS
1913 Points -14%
AMD Ryzen 9 7945HX
Asus ROG Strix G17 G713PI
1863 Points -17%
AMD Ryzen 9 6900HX
Asus ROG Zephyrus Duo 16 GX650RX
1566 Points -30%
AMD Ryzen 9 6900HX
SCHENKER XMG Neo 17 M22
1557 Points -30%
Cinebench R20 / CPU (Single Core)
Intel Core i9-14900HX
SCHENKER XMG Neo 17 2024 Engineering Sample
859 Points
Intel Core i9-13980HX
MSI Titan GT77 HX 13VI
825 Points -4%
Intel Core i9-13950HX
MSI Titan GT77 HX 13VI
803 Points -7%
Intel Core i9-13900HX
Lenovo Legion Pro 7 16IRX8H
788 Points -8%
Intel Core i9-13900HX
SCHENKER XMG Neo 16 Raptor Lake
756 Points -12%
AMD Ryzen 9 7945HX
Asus Zephyrus Duo 16 GX650PY-NM006W
756 Points -12%
AMD Ryzen 9 7945HX3D
Asus ROG Strix Scar 17 G733PYV-LL053X
755 Points -12%
AMD Ryzen 9 7945HX
Asus ROG Strix G17 G713PI (Turbo Mode)
753 Points -12%
Intel Core i9-13950HX
Razer Blade 16 Early 2023
742 Points -14%
Intel Core i9-12900HX
MSI Titan GT77 12UHS
738 Points -14%
AMD Ryzen 9 7945HX
Asus ROG Strix G17 G713PI
712 Points -17%
AMD Ryzen 9 6900HX
SCHENKER XMG Neo 17 M22
605 Points -30%
AMD Ryzen 9 6900HX
Asus ROG Zephyrus Duo 16 GX650RX
595 Points -31%
Apple M3 Max 16-Core
Apple MacBook Pro 16 2023 M3 Max
497 Points -42%
Cinebench R15 / CPU Single 64Bit
Intel Core i9-14900HX
SCHENKER XMG Neo 17 2024 Engineering Sample
320 Points
Intel Core i9-13980HX
MSI Titan GT77 HX 13VI
312 Points -2%
AMD Ryzen 9 7945HX3D
Asus ROG Strix Scar 17 G733PYV-LL053X
311 Points -3%
AMD Ryzen 9 7945HX
Asus Zephyrus Duo 16 GX650PY-NM006W
307 Points -4%
Intel Core i9-13900HX
Lenovo Legion Pro 7 16IRX8H
301 Points -6%
AMD Ryzen 9 7945HX
Asus ROG Strix G17 G713PI (Turbo Mode)
301 Points -6%
Intel Core i9-13950HX
MSI Titan GT77 HX 13VI
300 Points -6%
Intel Core i9-13900HX
SCHENKER XMG Neo 16 Raptor Lake
295 Points -8%
Intel Core i9-13900HX
SCHENKER XMG Neo 16 Raptor Lake
294 Points -8%
AMD Ryzen 9 7945HX
Asus ROG Strix G17 G713PI
294 Points -8%
Intel Core i9-12900HX
MSI Titan GT77 12UHS
278 Points -13%
Intel Core i9-13950HX
Razer Blade 16 Early 2023
274 Points -14%
Apple M3 Max 16-Core
Apple MacBook Pro 16 2023 M3 Max
269 Points -16%
AMD Ryzen 9 6900HX
Asus ROG Zephyrus Duo 16 GX650RX
249 Points -22%
AMD Ryzen 9 6900HX
SCHENKER XMG Neo 17 M22
248 Points -22%
7-Zip 18.03 / 7z b 4 -mmt1
AMD Ryzen 9 7945HX3D
Asus ROG Strix Scar 17 G733PYV-LL053X
7573 MIPS +2%
Intel Core i9-14900HX
SCHENKER XMG Neo 17 2024 Engineering Sample
7405 MIPS
AMD Ryzen 9 7945HX
Asus ROG Strix G17 G713PI (Turbo Mode)
7379 MIPS 0%
AMD Ryzen 9 7945HX
Asus ROG Strix G17 G713PI
7332 MIPS -1%
AMD Ryzen 9 7945HX
Asus Zephyrus Duo 16 GX650PY-NM006W
7319 MIPS -1%
Intel Core i9-13900HX
Lenovo Legion Pro 7 16IRX8H
7035 MIPS -5%
Intel Core i9-13980HX
MSI Titan GT77 HX 13VI
7018 MIPS -5%
Intel Core i9-13950HX
MSI Titan GT77 HX 13VI
6897 MIPS -7%
Intel Core i9-13900HX
SCHENKER XMG Neo 16 Raptor Lake
6800 MIPS -8%
Intel Core i9-13950HX
Razer Blade 16 Early 2023
6445 MIPS -13%
Intel Core i9-12900HX
MSI Titan GT77 12UHS
6256 MIPS -16%
AMD Ryzen 9 6900HX
SCHENKER XMG Neo 17 M22
5872 MIPS -21%
AMD Ryzen 9 6900HX
Asus ROG Zephyrus Duo 16 GX650RX
5727 MIPS -23%
Geekbench 5.5 / Single-Core
Apple M3 Max 16-Core
Apple MacBook Pro 16 2023 M3 Max
2331 Points +7%
Intel Core i9-14900HX
SCHENKER XMG Neo 17 2024 Engineering Sample
2184 Points
Intel Core i9-13980HX
MSI Titan GT77 HX 13VI
2139 Points -2%
AMD Ryzen 9 7945HX3D
Asus ROG Strix Scar 17 G733PYV-LL053X
2133 Points -2%
AMD Ryzen 9 7945HX
Asus Zephyrus Duo 16 GX650PY-NM006W
2132 Points -2%
AMD Ryzen 9 7945HX
Asus ROG Strix G17 G713PI (Turbo Mode)
2103 Points -4%
AMD Ryzen 9 7945HX
Asus ROG Strix G17 G713PI
2053 Points -6%
Intel Core i9-13950HX
MSI Titan GT77 HX 13VI
2043 Points -6%
Intel Core i9-13900HX
Lenovo Legion Pro 7 16IRX8H
2025 Points -7%
Intel Core i9-13900HX
SCHENKER XMG Neo 16 Raptor Lake
2023 Points -7%
Intel Core i9-12900HX
MSI Titan GT77 12UHS
1923 Points -12%
Intel Core i9-13950HX
Razer Blade 16 Early 2023
1805 Points -17%
AMD Ryzen 9 6900HX
Asus ROG Zephyrus Duo 16 GX650RX
1594 Points -27%
AMD Ryzen 9 6900HX
SCHENKER XMG Neo 17 M22
1590 Points -27%
Geekbench 6.2 / Single-Core
Apple M3 Max 16-Core
Apple MacBook Pro 16 2023 M3 Max
3096 Points +2%
Intel Core i9-14900HX
SCHENKER XMG Neo 17 2024 Engineering Sample (6.2.1)
3045 Points
AMD Ryzen 9 7945HX3D
Asus ROG Strix Scar 17 G733PYV-LL053X
2916 Points -4%
Cinebench 2024 / CPU Single Core
Apple M3 Max 16-Core
Apple MacBook Pro 16 2023 M3 Max
139 Points +7%
Intel Core i9-14900HX
SCHENKER XMG Neo 17 2024 Engineering Sample
130 Points
AMD Ryzen 9 7945HX3D
Asus ROG Strix Scar 17 G733PYV-LL053X
115 Points -12%
Cinebench R23: Single Core
Cinebench R20: CPU (Single Core)
Cinebench R15: CPU Single 64Bit
7-Zip 18.03: 7z b 4 -mmt1
Geekbench 5.5: Single-Core
Geekbench 6.2: Single-Core
Cinebench 2024: CPU Single Core
Puissance du boîtier Core i9-14900HX Cinebench R23 Single

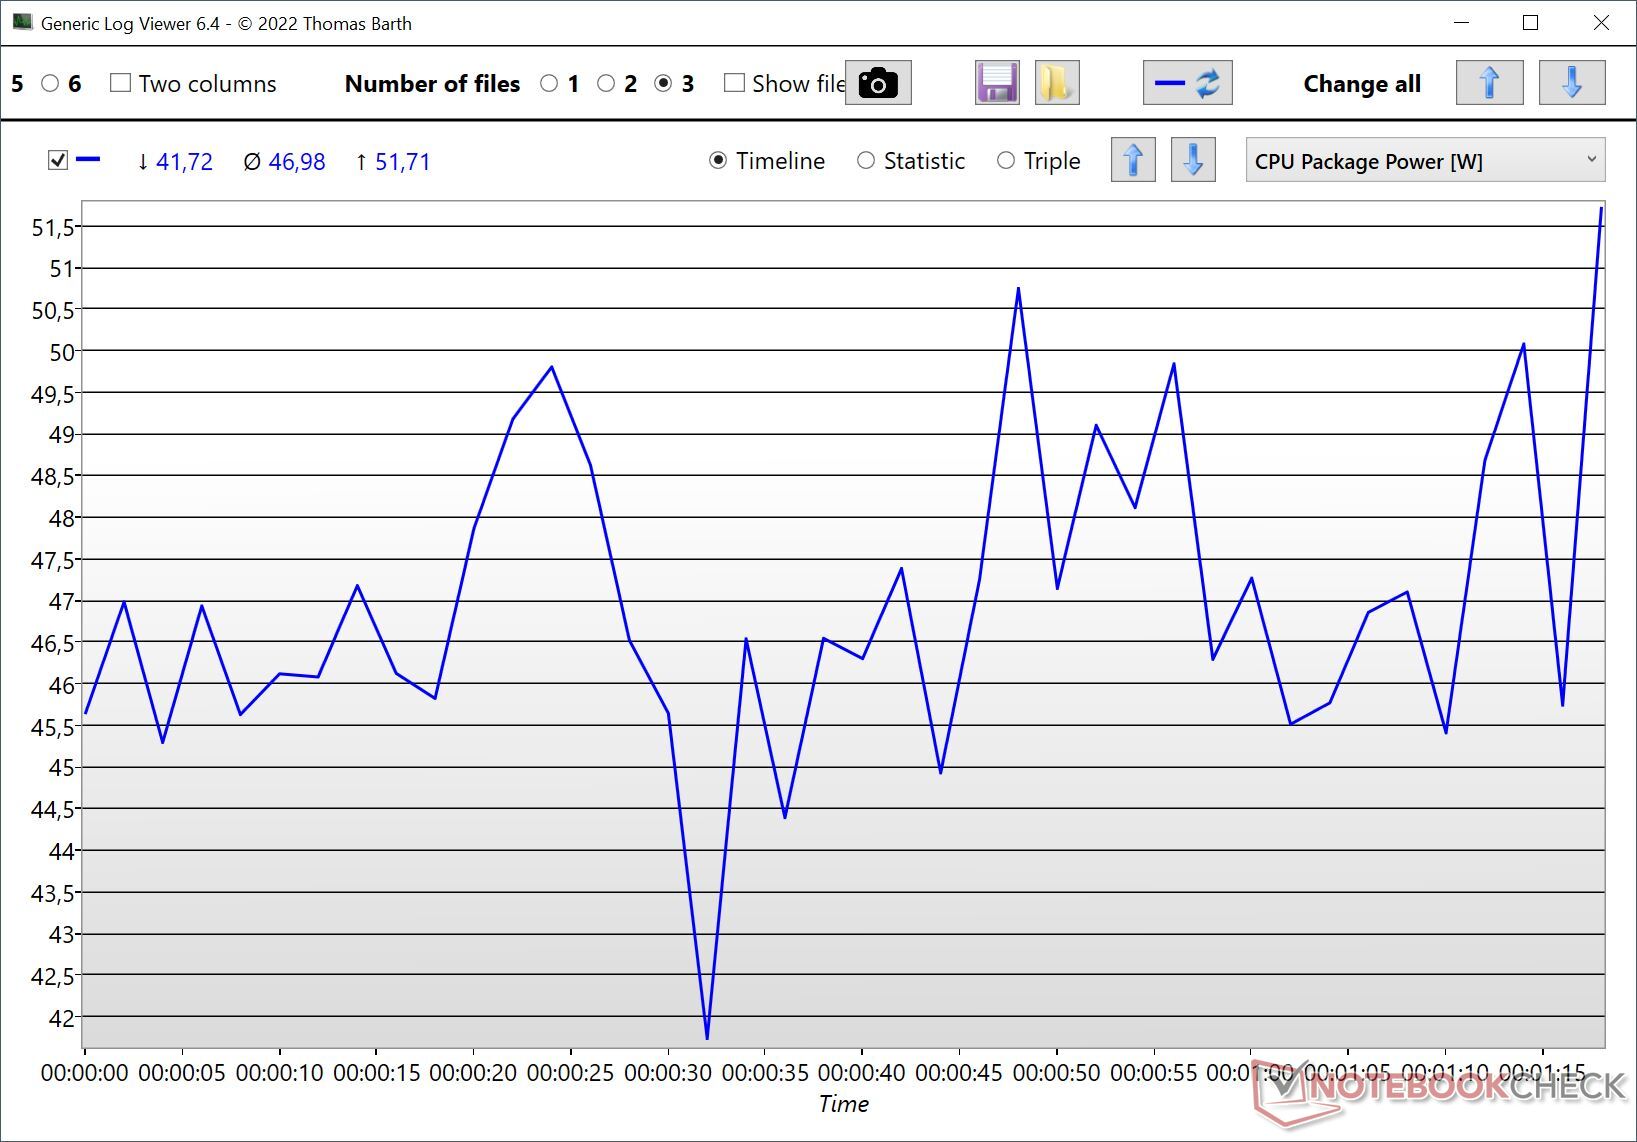
La situation change légèrement lorsque l'on examine la consommation d'énergie. Alors que le cœur de performance des CPU Raptor-Lake de l'année dernière consommait environ 34-36 watts, le nouveau Core i9-14900HX consomme 38 watts en charge monocœur pure en raison de son horloge turbo plus élevée de 5,8 GHz (cœurs IA, la puissance de l'ensemble est encore plus élevée). L'efficacité du processeur AMD est donc bien meilleure, mais les résultats des tests des modèles AMD et du nouveau Core i9-14900HX ont été quelque peu faussés, car le GPU dédié était actif pendant nos mesures de puissance et nous avons mesuré la consommation de l'ensemble du système. Sur les anciens modèles Raptor-Lake-HX, en revanche, seul l'iGPU était actif. Ni Intel ni AMD n'ont de chance face à l'efficacité de l'actuel M3 Max de Apple(~5,5 watts en charge simple).

Power Consumption / Cinebench R23 Single Power Efficiency - external Monitor
Apple M3 Max 16-Core
Apple MacBook Pro 16 2023 M3 Max
113.8 Points per Watt +338%
Intel Core i9-13950HX
MSI Titan GT77 HX 13VI
28.5 Points per Watt +10%
AMD Ryzen 9 7945HX
Asus ROG Strix G17 G713PI
28.2 Points per Watt +8%
Intel Core i9-12900HX
MSI Titan GT77 12UHS
27.8 Points per Watt +7%
AMD Ryzen 9 7945HX3D
Asus ROG Strix Scar 17 G733PYV-LL053X
26.9 Points per Watt +3%
AMD Ryzen 9 7945HX
Asus ROG Strix G17 G713PI
26.8 Points per Watt +3%
AMD Ryzen 9 7945HX
Asus Zephyrus Duo 16 GX650PY-NM006W
26.4 Points per Watt +2%
Intel Core i9-14900HX
SCHENKER XMG Neo 17 2024 Engineering Sample
26 Points per Watt
Power Consumption / Cinebench R23 Single (external Monitor)
Intel Core i9-14900HX
SCHENKER XMG Neo 17 2024 Engineering Sample
85.8 (78.3min, 81.4P1 - 168.8max) Watt *
Intel Core i9-13950HX
MSI Titan GT77 HX 13VI
73.8 (69.8min, 70.2P1 - 100.2max) Watt * +14%
AMD Ryzen 9 7945HX
Asus Zephyrus Duo 16 GX650PY-NM006W
73.4 (69.8min, 69.9P1 - 99.9max) Watt * +14%
AMD Ryzen 9 7945HX
Asus ROG Strix G17 G713PI (Turbo Mode)
72.2 (62.6min, 63.8P1 - 92.5max) Watt * +16%
AMD Ryzen 9 7945HX3D
Asus ROG Strix Scar 17 G733PYV-LL053X
71.9 (70.8min, 71P1 - 86max) Watt * +16%
Intel Core i9-12900HX
MSI Titan GT77 12UHS
68.7 (63.7min, 64.8P1 - 87.6max) Watt * +20%
AMD Ryzen 9 7945HX
Asus ROG Strix G17 G713PI
66.1 (57.7min, 58.2P1 - 93.6max) Watt * +23%
Apple M3 Max 16-Core
Apple MacBook Pro 16 2023 M3 Max
17.3 (16.2min, 16.2P1 - 21.4max) Watt * +80%

* ... Moindre est la valeur, meilleures sont les performances

Performance multicœur

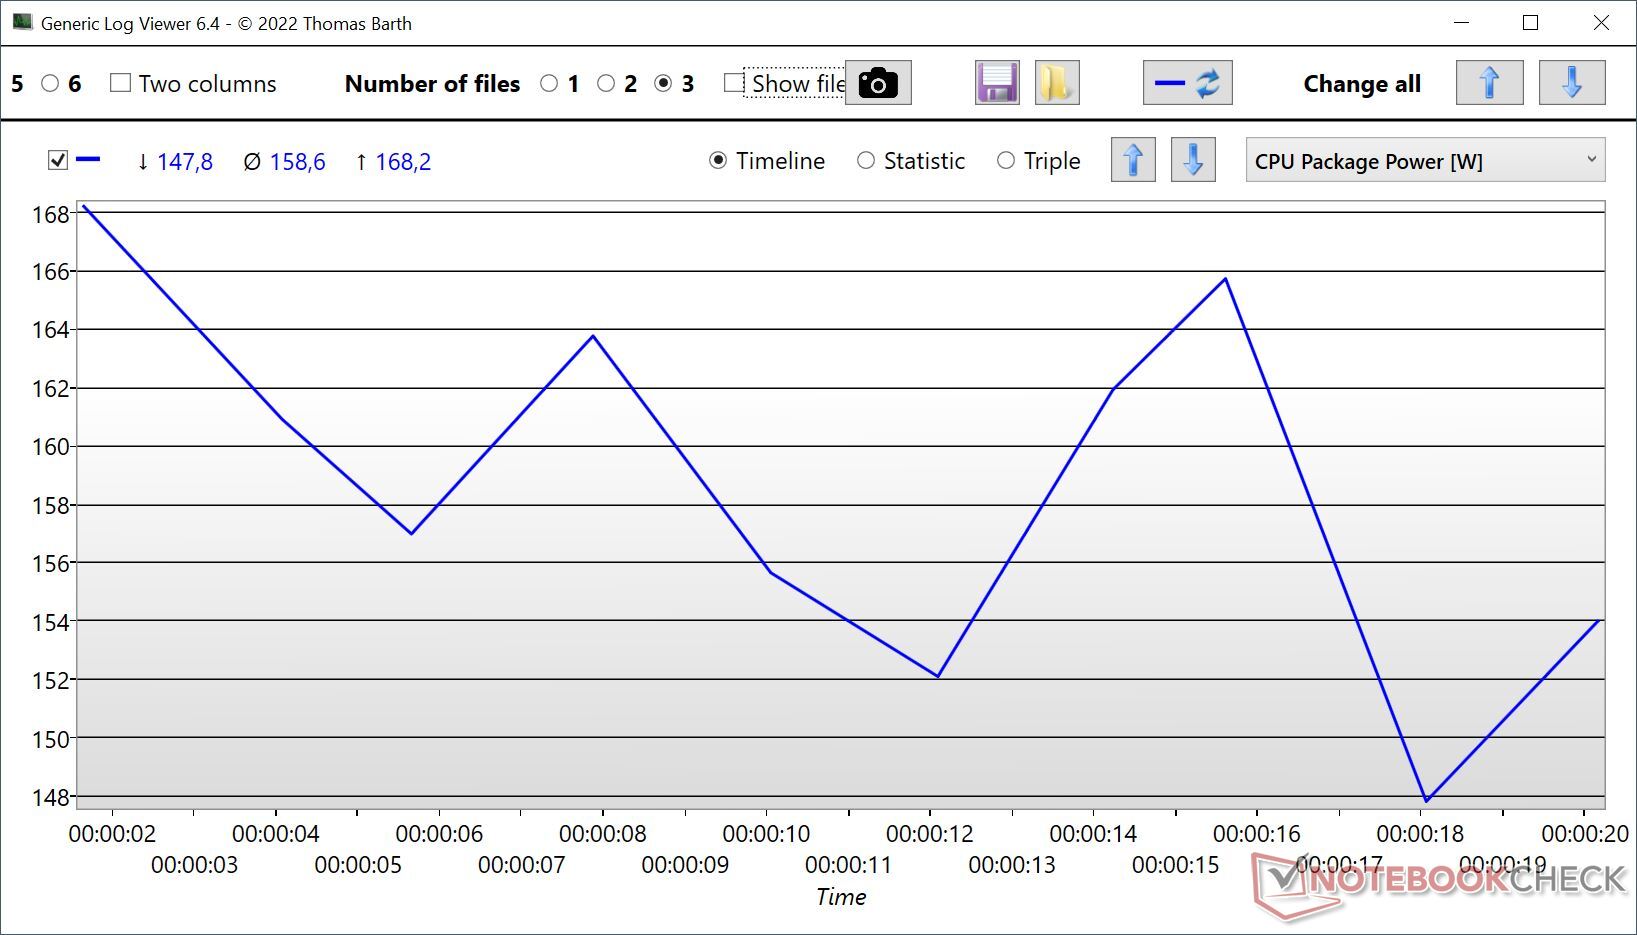
Les performances multicœurs du Raptor Lake-HX Refresh n'ont pas changé du tout et les performances réelles du Core i9-14900HX dépendent des limites de puissance de chaque ordinateur portable. Le XMG Neo 17 (E24) a affiché une puissance moyenne de 160 watts pendant les tests, ce qui explique son léger avantage sur le Core i9-13900HX. Le Core i9-13950HX et le Core i9-13980HX à l'intérieur du MSI Titan GT77 HX avaient un avantage, car ils étaient autorisés à consommer plus de 200 watts au début des tests. Les modèles AMD Ryzen 9 7945HX et Ryzen 9 7945HX3D étaient également un peu plus rapides.

Cinebench R23: Multi Core
Cinebench R20: CPU (Multi Core)
Cinebench R15: CPU Multi 64Bit
Blender: v2.79 BMW27 CPU | v3.3 Classroom CPU
7-Zip 18.03: 7z b 4
Geekbench 5.5: Multi-Core
Cinebench 2024: CPU Multi Core
Geekbench 6.2: Multi-Core
Cinebench R23 / Multi Core
AMD Ryzen 9 7945HX
Asus Zephyrus Duo 16 GX650PY-NM006W
34521 (32987.6min - 34521.3max) Points +7%
AMD Ryzen 9 7945HX
Asus ROG Strix G17 G713PI (Turbo Mode)
34202 Points +6%
Intel Core i9-13950HX
MSI Titan GT77 HX 13VI
33277 Points +3%
Intel Core i9-13980HX
MSI Titan GT77 HX 13VI
33052 Points +2%
AMD Ryzen 9 7945HX3D
Asus ROG Strix Scar 17 G733PYV-LL053X
32782 Points +1%
AMD Ryzen 9 7945HX
Asus ROG Strix G17 G713PI
32379 Points 0%
Intel Core i9-14900HX
SCHENKER XMG Neo 17 2024 Engineering Sample
32336 Points
Intel Core i9-13900HX
Lenovo Legion Pro 7 16IRX8H
30162 Points -7%
Intel Core i9-13900HX
SCHENKER XMG Neo 16 Raptor Lake
28707 (26191.7min - 28706.8max) Points -11%
Intel Core i9-13900HX
SCHENKER XMG Neo 16 Raptor Lake
28010 (26406.1min - 28009.8max) Points -13%
Intel Core i9-13900HX
SCHENKER XMG Neo 16 Raptor Lake
26703 Points -17%
Intel Core i9-13950HX
Razer Blade 16 Early 2023
26736 (22394.1min - 26736.1max) Points -17%
Apple M3 Max 16-Core
Apple MacBook Pro 16 2023 M3 Max
24024 Points -26%
Intel Core i9-12900HX
MSI Titan GT77 12UHS
22982 Points -29%
AMD Ryzen 9 6900HX
Asus ROG Zephyrus Duo 16 GX650RX
14085 Points -56%
Cinebench R20 / CPU (Multi Core)
AMD Ryzen 9 7945HX
Asus ROG Strix G17 G713PI (Turbo Mode)
13769 Points +13%
AMD Ryzen 9 7945HX
Asus Zephyrus Duo 16 GX650PY-NM006W
13457 Points +10%
AMD Ryzen 9 7945HX3D
Asus ROG Strix Scar 17 G733PYV-LL053X
13033 Points +7%
Intel Core i9-13950HX
MSI Titan GT77 HX 13VI
12648 Points +3%
Intel Core i9-13980HX
MSI Titan GT77 HX 13VI
12437 Points +2%
Intel Core i9-14900HX
SCHENKER XMG Neo 17 2024 Engineering Sample
12233 Points
Intel Core i9-13900HX
Lenovo Legion Pro 7 16IRX8H
11500 Points -6%
Intel Core i9-13900HX
SCHENKER XMG Neo 16 Raptor Lake
11289 Points -8%
AMD Ryzen 9 7945HX
Asus ROG Strix G17 G713PI
10025 Points -18%
Intel Core i9-13950HX
Razer Blade 16 Early 2023
8697 Points -29%
Intel Core i9-12900HX
MSI Titan GT77 12UHS
8667 Points -29%
Apple M3 Max 16-Core
Apple MacBook Pro 16 2023 M3 Max
6327 Points -48%
AMD Ryzen 9 6900HX
Asus ROG Zephyrus Duo 16 GX650RX
5489 Points -55%
Cinebench R15 / CPU Multi 64Bit
AMD Ryzen 9 7945HX
Asus ROG Strix G17 G713PI (Turbo Mode)
5663 Points +16%
AMD Ryzen 9 7945HX3D
Asus ROG Strix Scar 17 G733PYV-LL053X
5600 (5177.32min - 5599.89max) Points +15%
AMD Ryzen 9 7945HX
Asus Zephyrus Duo 16 GX650PY-NM006W
5554 (5255.55min - 5554.01max) Points +14%
Intel Core i9-13950HX
MSI Titan GT77 HX 13VI
5227 (4889.98min - 5226.71max) Points +7%
AMD Ryzen 9 7945HX
Asus ROG Strix G17 G713PI
5205 (4749.47min - 5204.94max) Points +7%
Intel Core i9-13980HX
MSI Titan GT77 HX 13VI
5172 (4917.63min - 5171.97max) Points +6%
Intel Core i9-13900HX
SCHENKER XMG Neo 16 Raptor Lake
4913 Points +1%
Intel Core i9-13900HX
SCHENKER XMG Neo 16 Raptor Lake
4875 (4298.3min - 4875.08max) Points 0%
Intel Core i9-14900HX
SCHENKER XMG Neo 17 2024 Engineering Sample
4875 (4783.54min - 4875.08max) Points
Intel Core i9-13900HX
Lenovo Legion Pro 7 16IRX8H
4819 (4429.68min - 4819.28max) Points -1%
Intel Core i9-13950HX
Razer Blade 16 Early 2023
4529 (4463.29min - 4528.99max) Points -7%
Intel Core i9-12900HX
MSI Titan GT77 12UHS
3570 (3259.45min - 3569.52max) Points -27%
Apple M3 Max 16-Core
Apple MacBook Pro 16 2023 M3 Max
3401 (3260min - 3401max) Points -30%
AMD Ryzen 9 6900HX
Asus ROG Zephyrus Duo 16 GX650RX
2292 Points -53%
Blender / v2.79 BMW27 CPU
AMD Ryzen 9 6900HX
Asus ROG Zephyrus Duo 16 GX650RX
220 Seconds * -116%
Apple M3 Max 16-Core
Apple MacBook Pro 16 2023 M3 Max
215 Seconds * -111%
Intel Core i9-12900HX
MSI Titan GT77 12UHS
147 Seconds * -44%
Intel Core i9-13950HX
Razer Blade 16 Early 2023
114 Seconds * -12%
Intel Core i9-13900HX
SCHENKER XMG Neo 16 Raptor Lake
111 Seconds * -9%
Intel Core i9-13900HX
Lenovo Legion Pro 7 16IRX8H
105 Seconds * -3%
Intel Core i9-14900HX
SCHENKER XMG Neo 17 2024 Engineering Sample
102 Seconds *
Intel Core i9-13980HX
MSI Titan GT77 HX 13VI
101 Seconds * +1%
Intel Core i9-13950HX
MSI Titan GT77 HX 13VI
100 Seconds * +2%
AMD Ryzen 9 7945HX
Asus ROG Strix G17 G713PI
100 Seconds * +2%
AMD Ryzen 9 7945HX
Asus ROG Strix G17 G713PI (Turbo Mode)
95 Seconds * +7%
AMD Ryzen 9 7945HX3D
Asus ROG Strix Scar 17 G733PYV-LL053X
95 Seconds * +7%
AMD Ryzen 9 7945HX
Asus Zephyrus Duo 16 GX650PY-NM006W
93 Seconds * +9%
Blender / v3.3 Classroom CPU
Intel Core i9-12900HX
MSI Titan GT77 12UHS
263 Seconds * -47%
Intel Core i9-13950HX
Razer Blade 16 Early 2023 (3.3.3)
207 Seconds * -16%
Intel Core i9-13900HX
SCHENKER XMG Neo 16 Raptor Lake (3.3.3)
200 Seconds * -12%
Apple M3 Max 16-Core
Apple MacBook Pro 16 2023 M3 Max
194 Seconds * -8%
Intel Core i9-13900HX
Lenovo Legion Pro 7 16IRX8H (3.3.3)
192 Seconds * -7%
Intel Core i9-14900HX
SCHENKER XMG Neo 17 2024 Engineering Sample (3.3.3)
179 Seconds *
Intel Core i9-13980HX
MSI Titan GT77 HX 13VI (3.3.3)
176 Seconds * +2%
Intel Core i9-13950HX
MSI Titan GT77 HX 13VI (3.3.3)
175 Seconds * +2%
AMD Ryzen 9 7945HX
Asus ROG Strix G17 G713PI
158 Seconds * +12%
AMD Ryzen 9 7945HX3D
Asus ROG Strix Scar 17 G733PYV-LL053X (3.3.3)
150 Seconds * +16%
AMD Ryzen 9 7945HX
Asus Zephyrus Duo 16 GX650PY-NM006W (3.3.3)
147 Seconds * +18%
7-Zip 18.03 / 7z b 4
AMD Ryzen 9 7945HX
Asus ROG Strix G17 G713PI (Turbo Mode)
140471 MIPS +11%
AMD Ryzen 9 7945HX3D
Asus ROG Strix Scar 17 G733PYV-LL053X
136201 MIPS +7%
AMD Ryzen 9 7945HX
Asus Zephyrus Duo 16 GX650PY-NM006W
135927 MIPS +7%
Intel Core i9-13950HX
MSI Titan GT77 HX 13VI
127295 MIPS 0%
Intel Core i9-14900HX
SCHENKER XMG Neo 17 2024 Engineering Sample
127108 MIPS
Intel Core i9-13980HX
MSI Titan GT77 HX 13VI
125720 MIPS -1%
AMD Ryzen 9 7945HX
Asus ROG Strix G17 G713PI
123364 MIPS -3%
Intel Core i9-13900HX
Lenovo Legion Pro 7 16IRX8H
122254 MIPS -4%
Intel Core i9-13900HX
SCHENKER XMG Neo 16 Raptor Lake
118715 MIPS -7%
Intel Core i9-13950HX
Razer Blade 16 Early 2023
109330 MIPS -14%
Intel Core i9-12900HX
MSI Titan GT77 12UHS
86234 MIPS -32%
AMD Ryzen 9 6900HX
Asus ROG Zephyrus Duo 16 GX650RX
64457 MIPS -49%
Geekbench 5.5 / Multi-Core
Apple M3 Max 16-Core
Apple MacBook Pro 16 2023 M3 Max
22816 Points +6%
Intel Core i9-14900HX
SCHENKER XMG Neo 17 2024 Engineering Sample
21606 Points
Intel Core i9-13900HX
Lenovo Legion Pro 7 16IRX8H
21058 Points -3%
Intel Core i9-13900HX
SCHENKER XMG Neo 16 Raptor Lake
20784 Points -4%
Intel Core i9-13950HX
MSI Titan GT77 HX 13VI
20634 Points -4%
Intel Core i9-13980HX
MSI Titan GT77 HX 13VI
20329 Points -6%
AMD Ryzen 9 7945HX
Asus ROG Strix G17 G713PI (Turbo Mode)
19954 Points -8%
AMD Ryzen 9 7945HX3D
Asus ROG Strix Scar 17 G733PYV-LL053X
19875 Points -8%
AMD Ryzen 9 7945HX
Asus Zephyrus Duo 16 GX650PY-NM006W
19583 Points -9%
AMD Ryzen 9 7945HX
Asus ROG Strix G17 G713PI
18372 Points -15%
Intel Core i9-13950HX
Razer Blade 16 Early 2023
18152 Points -16%
Intel Core i9-12900HX
MSI Titan GT77 12UHS
16250 Points -25%
AMD Ryzen 9 6900HX
Asus ROG Zephyrus Duo 16 GX650RX
10167 Points -53%
Cinebench 2024 / CPU Multi Core
Intel Core i9-14900HX
SCHENKER XMG Neo 17 2024 Engineering Sample
1780 Points
AMD Ryzen 9 7945HX3D
Asus ROG Strix Scar 17 G733PYV-LL053X
1772 Points 0%
Apple M3 Max 16-Core
Apple MacBook Pro 16 2023 M3 Max
1612 Points -9%
Geekbench 6.2 / Multi-Core
Apple M3 Max 16-Core
Apple MacBook Pro 16 2023 M3 Max
21243 Points +14%
Intel Core i9-14900HX
SCHENKER XMG Neo 17 2024 Engineering Sample (6.2.1)
18643 Points
AMD Ryzen 9 7945HX3D
Asus ROG Strix Scar 17 G733PYV-LL053X
16957 Points -9%
Cinebench R23: Multi Core
Cinebench R20: CPU (Multi Core)
Cinebench R15: CPU Multi 64Bit
Blender: v2.79 BMW27 CPU | v3.3 Classroom CPU
7-Zip 18.03: 7z b 4
Geekbench 5.5: Multi-Core
Cinebench 2024: CPU Multi Core
Geekbench 6.2: Multi-Core

* ... Moindre est la valeur, meilleures sont les performances

Puissance de l'ensemble Core i9-14900HX Cinebench R23 Multi

Lorsque vous regardez l'efficacité, vous devez garder à l'esprit que le GPU dédié était actif. En raison des valeurs de consommation totale plus élevées, l'influence est moins importante que lors des tests à cœur unique. Le Core i9-14900HX a peut-être devancé la plupart de ses frères et sœurs d'Intel, mais le Dragon Range Ryzen 9 7945HX d'AMD l'a largement emporté en termes d'efficacité. Il n'est pas surprenant que l'efficacité de Apple ait été la meilleure, mais pour la première fois, le nouveau M3 Max est capable d'atteindre des niveaux de performance proches des processeurs HX plus petits (Core i7).

Power Consumption / Cinebench R23 Multi Power Efficiency - external Monitor
Apple M3 Max 16-Core
Apple MacBook Pro 16 2023 M3 Max
306 Points per Watt +111%
AMD Ryzen 9 7945HX3D
Asus ROG Strix Scar 17 G733PYV-LL053X
207 Points per Watt +43%
AMD Ryzen 9 7945HX
Asus Zephyrus Duo 16 GX650PY-NM006W
194.4 Points per Watt +34%
AMD Ryzen 9 7945HX
Asus ROG Strix G17 G713PI
191.1 Points per Watt +32%
Intel Core i9-13980HX
Asus ROG Strix Scar 18 2023 G834JY-N6005W
160.9 Points per Watt +11%
Intel Core i9-14900HX
SCHENKER XMG Neo 17 2024 Engineering Sample
145 Points per Watt
Intel Core i9-13950HX
Razer Blade 16 Early 2023 RTX 4090
144.1 Points per Watt -1%
Intel Core i9-13900HX
Lenovo Legion Pro 7 RTX4090
141.4 Points per Watt -2%
Intel Core i9-13950HX
MSI Titan GT77 HX 13VI
135.3 Points per Watt -7%
Intel Core i9-12900HX
MSI Titan GT77 12UHS
122.6 Points per Watt -15%
Power Consumption / Cinebench R23 Multi (external Monitor)
Intel Core i9-13950HX
MSI Titan GT77 HX 13VI
246 (227min, 227P1 - 264max) Watt * -10%
Intel Core i9-14900HX
SCHENKER XMG Neo 17 2024 Engineering Sample
223 (216min, 216P1 - 229max) Watt *
Intel Core i9-13900HX
Lenovo Legion Pro 7 RTX4090
220 (215min, 215P1 - 224max) Watt * +1%
Intel Core i9-13950HX
Razer Blade 16 Early 2023 RTX 4090
197.3 (191.9min, 192.7P1 - 200max) Watt * +12%
Intel Core i9-12900HX
MSI Titan GT77 12UHS
187.5 (166.8min, 167.1P1 - 230max) Watt * +16%
Intel Core i9-13900HX
SCHENKER XMG Neo 16 E23
182.4 (172.3min, 172.3P1 - 207max) Watt * +18%
AMD Ryzen 9 7945HX
Asus ROG Strix G17 G713PI (Turbo Mode)
179 (171.5min, 171.8P1 - 181.3max) Watt * +20%
AMD Ryzen 9 7945HX
Asus Zephyrus Duo 16 GX650PY-NM006W
177.6 (166.7min, 166.8P1 - 187.3max) Watt * +20%
Intel Core i9-13980HX
Asus ROG Strix Scar 18 2023 G834JY-N6005W
175.9 (93.7min, 95.8P1 - 193.7max) Watt * +21%
AMD Ryzen 9 7945HX3D
Asus ROG Strix Scar 17 G733PYV-LL053X
158.5 (149.9min, 150.4P1 - 171.1max) Watt * +29%
Intel Core i7-13700HX
Aorus 15X ASF
148.3 (116.3min, 116.3P1 - 185.2max) Watt * +33%
Apple M3 Max 16-Core
Apple MacBook Pro 16 2023 M3 Max
78.6 (71.7min, 73.3P1 - 80.2max) Watt * +65%

* ... Moindre est la valeur, meilleures sont les performances

Performance avec des limites de puissance réduites

Comme c'était déjà le cas dans les articles d'analyse précédents, nous avons également examiné ses performances avec des limites de puissance inférieures et nous avons rassemblé nos résultats dans le tableau suivant. Rapidement, deux choses apparaissent clairement. Premièrement, au bout du compte, le Core i9-14900HX n'est rien d'autre qu'un Core i9-13900HX avec une horloge turbo plus élevée, et avec des limites de puissance plus basses, les deux puces ne diffèrent pas beaucoup. Deuxièmement, vous pouvez clairement voir qu'AMD peut fournir la même performance multi-cœur en utilisant beaucoup moins d'énergie. Le M3 Max Apple M3 Max est également impressionnant : avec une limite de puissance comparable, il est environ 32 % plus rapide que le Core i9-14900HX.

Cinebench R23 Multi
Limite de puissance Core i9-14900HX Core i9-13900HX Core i9-13950HX Core i9-13980HX Ryzen 9 7945HX Ryzen 9 7945HX3D M3 Max 16-Core
170 watts 31,958 31,903
150 watts 30,308 30,655 30,623
130 watts 28 933 28 239 29 141 29 281 34 202
115 watts 27 750 27 369 28 199 28 073 33 361
100 watts 26 323 25 942 26 653 26 507 32 947 32 977
80 watts 23 334 23 216 23 950 23 766 30 907 30 804
55 watts 18 258 18 843 19 772 19 478 26 045 24 024

Consommation d'énergie en cas d'inactivité

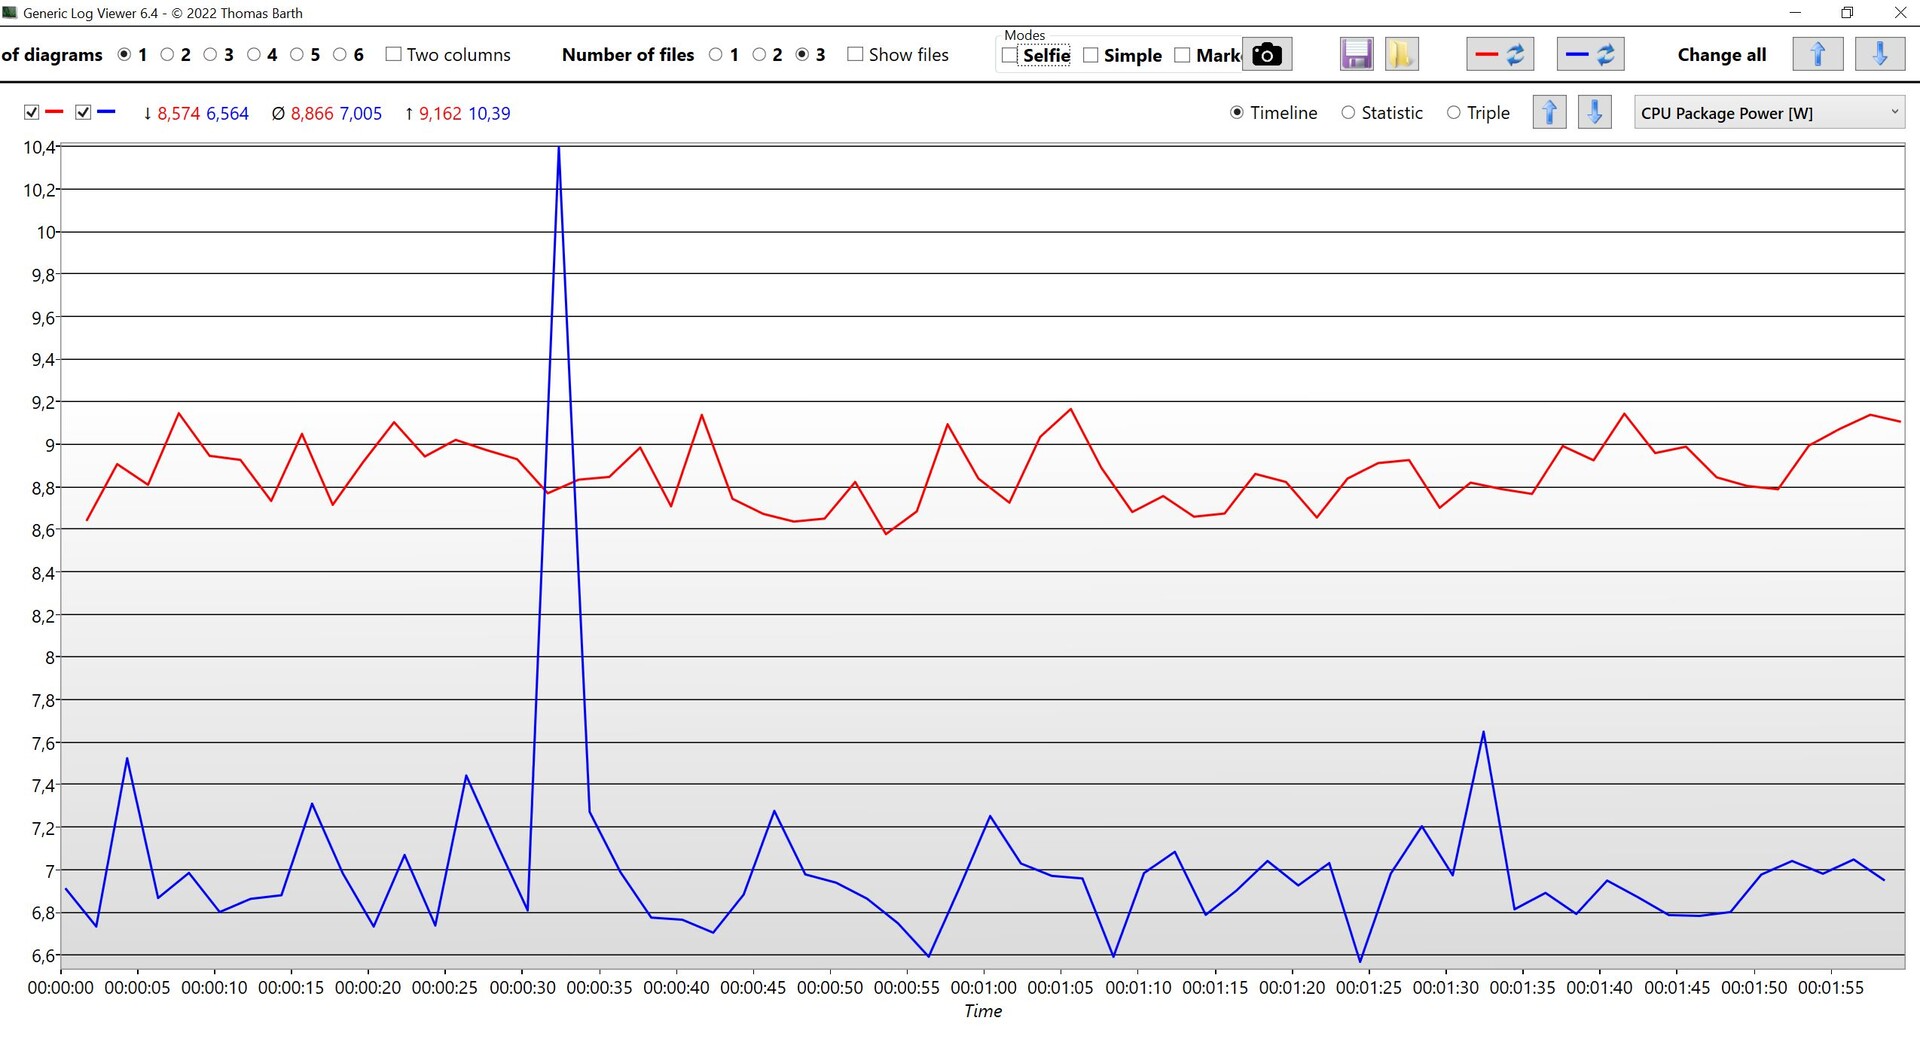
Nous avons également comparé la consommation d'énergie du nouveau Core i9-14900HX en mode inactif à celle du Core i9-14900HX d'AMD Ryzen 9 7945HX3D AMD Ryzen 9 7945HX3Den gardant les paramètres de performance aussi proches que possible sur les deux modèles. Nous avons constaté que le Core i9-14900HX avait un léger avantage, avec une consommation d'environ 7 watts dans un scénario idéal. Le Ryzen 9 7945HX3D, avec son design chiplet, nécessite quant à lui une moyenne de 8,9 watts au repos.

Puissance de l'ensemble du processeur en mode veille (bleu : Core i9-14900HX, rouge : Ryzen 9 7945HX3D)

Performances des jeux

Contrairement aux benchmarks du processeur, le processeur n'est pas toujours pleinement sollicité lors des jeux - au lieu de cela, il y aura probablement un mélange de charge mono/multi-cœur. Le score du processeur lors des tests 3DMark en est un indicateur. En comparant les résultats sur Time Spy, nous avons noté un avantage de 10 % par rapport au processeur Core i9-13900HX et le nouveau Core i9-14900HX est au même niveau que le Core i9-13980HX de l'année dernière Core i9-13980HX.

3DMark - 2560x1440 Time Spy CPU
Lenovo Legion 9 16IRX8
Intel Core i9-13980HX, NVIDIA GeForce RTX 4090 Laptop GPU
17712 Points +4%
Alienware m18 R1
Intel Core i9-13980HX, NVIDIA GeForce RTX 4090 Laptop GPU
17525 Points +3%
MSI Raider GE78 HX 13VI
Intel Core i9-13980HX, NVIDIA GeForce RTX 4090 Laptop GPU
17026 Points 0%
SCHENKER XMG Neo 17 2024 Engineering Sample
Intel Core i9-14900HX, NVIDIA GeForce RTX 4090 Laptop GPU
16982 Points
Asus ROG Strix Scar 18 2023 G834JY-N6005W
Intel Core i9-13980HX, NVIDIA GeForce RTX 4090 Laptop GPU
15908 Points -6%
MSI Titan GT77 HX 13VI
Intel Core i9-13950HX, NVIDIA GeForce RTX 4090 Laptop GPU
15403 Points -9%
Lenovo Legion Pro 7 RTX4090
Intel Core i9-13900HX, NVIDIA GeForce RTX 4090 Laptop GPU
15066 Points -11%
Asus ROG Strix Scar 17 G733PYV-LL053X
AMD Ryzen 9 7945HX3D, NVIDIA GeForce RTX 4090 Laptop GPU
14131 Points -17%
SCHENKER Key 17 Pro (Early 23)
Intel Core i9-13900HX, NVIDIA GeForce RTX 4090 Laptop GPU
14048 Points -17%
Asus ROG Strix Scar 17 G733PY-XS96
AMD Ryzen 9 7945HX, NVIDIA GeForce RTX 4090 Laptop GPU
13140 Points -23%
Lenovo Legion Pro 5 16ARX8
AMD Ryzen 7 7745HX, NVIDIA GeForce RTX 4070 Laptop GPU
11477 Points -32%
Moyenne de la classe
  (353 - 23721, n=2290)
7392 Points -56%

Performances de jeu 1080p

Bien entendu, il n'est pas idéal de comparer les performances de jeu d'un processeur avec différents ordinateurs portables, car il y aura toujours de légères différences dans la configuration des limites de puissance, tant au niveau du processeur que des cartes graphiques. Dans ses documents de presse, Intel a montré ses résultats avec des détails élevés à 1080p, ce qui, à notre avis, n'est pas très réaliste. En effet, aucun processeur HX n'est proposé sans une puissante carte graphique dédiée. En général, les performances du Core i9-14900HX sont bonnes, mais pas tellement meilleures que celles des modèles précédents. La mise à niveau à partir d'un processeur Core i9 HX de la génération précédente n'en vaut certainement pas la peine. Dans certains jeux, le processeur AMD Ryzen 9 7945HX3D avec sa mémoire cache 3D, a un avantage certain, ce qui en fait le meilleur processeur mobile pour les jeux.

The Witcher 3 - 1920x1080 Ultra Graphics & Postprocessing (HBAO+)
Alienware m18 R1
Intel Core i9-13980HX, NVIDIA GeForce RTX 4090 Laptop GPU
213.9 (205min) fps +9%
MSI Raider GE78 HX 13VI
Intel Core i9-13980HX, NVIDIA GeForce RTX 4090 Laptop GPU
213.4 (72.4P0.1, 144.6P1) fps +9%
Lenovo Legion 9 16IRX8
Intel Core i9-13980HX, NVIDIA GeForce RTX 4090 Laptop GPU
208.7 (191min) fps +7%
Asus ROG Strix Scar 17 G733PYV-LL053X
AMD Ryzen 9 7945HX3D, NVIDIA GeForce RTX 4090 Laptop GPU
207 fps +6%
SCHENKER Key 17 Pro (Early 23)
Intel Core i9-13900HX, NVIDIA GeForce RTX 4090 Laptop GPU
206 (176min) fps +5%
Asus ROG Strix Scar 17 G733PY-XS96
AMD Ryzen 9 7945HX, NVIDIA GeForce RTX 4090 Laptop GPU
203.8 (186min) fps +4%
Lenovo Legion Pro 7 RTX4090
Intel Core i9-13900HX, NVIDIA GeForce RTX 4090 Laptop GPU
200 (174min) fps +2%
MSI Titan GT77 HX 13VI
Intel Core i9-13950HX, NVIDIA GeForce RTX 4090 Laptop GPU
198.9 (190min, 191P1) fps +2%
SCHENKER XMG Neo 17 2024 Engineering Sample
Intel Core i9-14900HX, NVIDIA GeForce RTX 4090 Laptop GPU
195.8 (176min, 187P1) fps
Lenovo Legion Pro 5 16ARX8
AMD Ryzen 7 7745HX, NVIDIA GeForce RTX 4070 Laptop GPU
119.8 (114min) fps -39%
Moyenne de la classe
  (1.2 - 328, n=2205)
59.1 fps -70%
GTA V - 1920x1080 Highest Settings possible AA:4xMSAA + FX AF:16x
Asus ROG Strix Scar 17 G733PYV-LL053X
AMD Ryzen 9 7945HX3D, NVIDIA GeForce RTX 4090 Laptop GPU
167.7 (1.87min, 111.1P1) fps +10%
SCHENKER XMG Neo 17 2024 Engineering Sample
Intel Core i9-14900HX, NVIDIA GeForce RTX 4090 Laptop GPU
151.8 (3.32min, 111.1P1) fps
Lenovo Legion 9 16IRX8
Intel Core i9-13980HX, NVIDIA GeForce RTX 4090 Laptop GPU
150.7 (3min, 111.1P1) fps -1%
Alienware m18 R1
Intel Core i9-13980HX, NVIDIA GeForce RTX 4090 Laptop GPU
149 (3.13min, 111.1P1) fps -2%
Lenovo Legion Pro 7 RTX4090
Intel Core i9-13900HX, NVIDIA GeForce RTX 4090 Laptop GPU
143.6 (4.39min, 100P1) fps -5%
SCHENKER Key 17 Pro (Early 23)
Intel Core i9-13900HX, NVIDIA GeForce RTX 4090 Laptop GPU
142.3 (4.44min, 100P1) fps -6%
MSI Raider GE78 HX 13VI
Intel Core i9-13980HX, NVIDIA GeForce RTX 4090 Laptop GPU
142 (2.92min, 90.9P1) fps -6%
Asus ROG Strix Scar 18 2023 G834JY-N6005W
Intel Core i9-13980HX, NVIDIA GeForce RTX 4090 Laptop GPU
141.3 (4.69min, 100P1) fps -7%
MSI Titan GT77 HX 13VI
Intel Core i9-13950HX, NVIDIA GeForce RTX 4090 Laptop GPU
140.9 (3.54min, 83.3P1) fps -7%
Lenovo Legion Pro 5 16ARX8
AMD Ryzen 7 7745HX, NVIDIA GeForce RTX 4070 Laptop GPU
119.9 (3.81min, 76.9P1) fps -21%
Asus ROG Strix Scar 17 G733PY-XS96
AMD Ryzen 9 7945HX, NVIDIA GeForce RTX 4090 Laptop GPU
112.6 (4.54min, 71.4P1) fps -26%
Moyenne de la classe
  (2.1 - 182, n=1312)
62.5 fps -59%
Final Fantasy XV Benchmark - 1920x1080 High Quality
Alienware m18 R1
Intel Core i9-13980HX, NVIDIA GeForce RTX 4090 Laptop GPU
194.8 fps +7%
MSI Titan GT77 HX 13VI
Intel Core i9-13950HX, NVIDIA GeForce RTX 4090 Laptop GPU
187.4 fps +2%
MSI Raider GE78 HX 13VI
Intel Core i9-13980HX, NVIDIA GeForce RTX 4090 Laptop GPU
183.3 fps 0%
SCHENKER Key 17 Pro (Early 23)
Intel Core i9-13900HX, NVIDIA GeForce RTX 4090 Laptop GPU
183.1 fps 0%
SCHENKER XMG Neo 17 2024 Engineering Sample
Intel Core i9-14900HX, NVIDIA GeForce RTX 4090 Laptop GPU
182.9 fps
Lenovo Legion 9 16IRX8
Intel Core i9-13980HX, NVIDIA GeForce RTX 4090 Laptop GPU
181.3 fps -1%
Lenovo Legion Pro 7 RTX4090
Intel Core i9-13900HX, NVIDIA GeForce RTX 4090 Laptop GPU
181.2 fps -1%
Asus ROG Strix Scar 17 G733PYV-LL053X
AMD Ryzen 9 7945HX3D, NVIDIA GeForce RTX 4090 Laptop GPU
180 fps -2%
Asus ROG Strix Scar 18 2023 G834JY-N6005W
Intel Core i9-13980HX, NVIDIA GeForce RTX 4090 Laptop GPU
177.6 fps -3%
Asus ROG Strix Scar 17 G733PY-XS96
AMD Ryzen 9 7945HX, NVIDIA GeForce RTX 4090 Laptop GPU
163.9 fps -10%
Lenovo Legion Pro 5 16ARX8
AMD Ryzen 7 7745HX, NVIDIA GeForce RTX 4070 Laptop GPU
119.9 fps -34%
Moyenne de la classe
  (0.84 - 237, n=1444)
63.7 fps -65%
Strange Brigade - 1920x1080 ultra AA:ultra AF:16
Asus ROG Strix Scar 17 G733PYV-LL053X
AMD Ryzen 9 7945HX3D, NVIDIA GeForce RTX 4090 Laptop GPU
420 (64.7min, 302P1) fps +12%
Lenovo Legion 9 16IRX8
Intel Core i9-13980HX, NVIDIA GeForce RTX 4090 Laptop GPU
387 (23.7min, 277P1) fps +3%
SCHENKER Key 17 Pro (Early 23)
Intel Core i9-13900HX, NVIDIA GeForce RTX 4090 Laptop GPU
378 (20.6min, 257P1) fps +1%
MSI Raider GE78 HX 13VI
Intel Core i9-13980HX, NVIDIA GeForce RTX 4090 Laptop GPU
378 (54.7min, 251P1) fps +1%
SCHENKER XMG Neo 17 2024 Engineering Sample
Intel Core i9-14900HX, NVIDIA GeForce RTX 4090 Laptop GPU
376 (106.6min, 279P1) fps
MSI Titan GT77 HX 13VI
Intel Core i9-13950HX, NVIDIA GeForce RTX 4090 Laptop GPU
373 (29.9min, 272P1) fps -1%
Alienware m18 R1
Intel Core i9-13980HX, NVIDIA GeForce RTX 4090 Laptop GPU
373 (73.3min, 273P1) fps -1%
Asus ROG Strix Scar 18 2023 G834JY-N6005W
Intel Core i9-13980HX, NVIDIA GeForce RTX 4090 Laptop GPU
366 (29.1min, 263P1) fps -3%
Lenovo Legion Pro 7 RTX4090
Intel Core i9-13900HX, NVIDIA GeForce RTX 4090 Laptop GPU
347 (87.7min, 252P1) fps -8%
Lenovo Legion Pro 5 16ARX8
AMD Ryzen 7 7745HX, NVIDIA GeForce RTX 4070 Laptop GPU
223 (89min, 167.8P1) fps -41%
Moyenne de la classe
  (9.7 - 602, n=1184)
123 fps -67%
Dota 2 Reborn - 1920x1080 ultra (3/3) best looking
Asus ROG Strix Scar 17 G733PYV-LL053X
AMD Ryzen 9 7945HX3D, NVIDIA GeForce RTX 4090 Laptop GPU
220 (175min) fps +23%
Alienware m18 R1
Intel Core i9-13980HX, NVIDIA GeForce RTX 4090 Laptop GPU
194.2 (157.6min) fps +9%
Lenovo Legion 9 16IRX8
Intel Core i9-13980HX, NVIDIA GeForce RTX 4090 Laptop GPU
193.1 (162.4min) fps +8%
Asus ROG Strix Scar 18 2023 G834JY-N6005W
Intel Core i9-13980HX, NVIDIA GeForce RTX 4090 Laptop GPU
190.2 (160.9min) fps +6%
MSI Titan GT77 HX 13VI
Intel Core i9-13950HX, NVIDIA GeForce RTX 4090 Laptop GPU
185.9 (157.5min) fps +4%
SCHENKER Key 17 Pro (Early 23)
Intel Core i9-13900HX, NVIDIA GeForce RTX 4090 Laptop GPU
182.5 (149.3min) fps +2%
Lenovo Legion Pro 7 RTX4090
Intel Core i9-13900HX, NVIDIA GeForce RTX 4090 Laptop GPU
182.1 (154.2min) fps +2%
Lenovo Legion Pro 5 16ARX8
AMD Ryzen 7 7745HX, NVIDIA GeForce RTX 4070 Laptop GPU
182 (152.8min) fps +2%
MSI Raider GE78 HX 13VI
Intel Core i9-13980HX, NVIDIA GeForce RTX 4090 Laptop GPU
178.8 (148.8min) fps 0%
SCHENKER XMG Neo 17 2024 Engineering Sample
Intel Core i9-14900HX, NVIDIA GeForce RTX 4090 Laptop GPU
178.8 (152.1min) fps
Asus ROG Strix Scar 17 G733PY-XS96
AMD Ryzen 9 7945HX, NVIDIA GeForce RTX 4090 Laptop GPU
139 (118.5min) fps -22%
Moyenne de la classe
  (4.6 - 268, n=1988)
86 fps -52%
X-Plane 11.11 - 1920x1080 high (fps_test=3)
Asus ROG Strix Scar 17 G733PYV-LL053X
AMD Ryzen 9 7945HX3D, NVIDIA GeForce RTX 4090 Laptop GPU
166.2 fps +23%
Alienware m18 R1
Intel Core i9-13980HX, NVIDIA GeForce RTX 4090 Laptop GPU
143.5 fps +6%
Asus ROG Strix Scar 18 2023 G834JY-N6005W
Intel Core i9-13980HX, NVIDIA GeForce RTX 4090 Laptop GPU
142.8 fps +6%
Lenovo Legion 9 16IRX8
Intel Core i9-13980HX, NVIDIA GeForce RTX 4090 Laptop GPU
140.1 fps +4%
SCHENKER Key 17 Pro (Early 23)
Intel Core i9-13900HX, NVIDIA GeForce RTX 4090 Laptop GPU
136.6 fps +1%
Lenovo Legion Pro 7 RTX4090
Intel Core i9-13900HX, NVIDIA GeForce RTX 4090 Laptop GPU
136.4 fps +1%
SCHENKER XMG Neo 17 2024 Engineering Sample
Intel Core i9-14900HX, NVIDIA GeForce RTX 4090 Laptop GPU
135.3 fps
MSI Titan GT77 HX 13VI
Intel Core i9-13950HX, NVIDIA GeForce RTX 4090 Laptop GPU
134.2 fps -1%
MSI Titan GT77 HX 13VI
Intel Core i9-13950HX, NVIDIA GeForce RTX 4090 Laptop GPU
134.1 fps -1%
MSI Raider GE78 HX 13VI
Intel Core i9-13980HX, NVIDIA GeForce RTX 4090 Laptop GPU
126.4 fps -7%
Lenovo Legion Pro 5 16ARX8
AMD Ryzen 7 7745HX, NVIDIA GeForce RTX 4070 Laptop GPU
117.8 fps -13%
Asus ROG Strix Scar 17 G733PY-XS96
AMD Ryzen 9 7945HX, NVIDIA GeForce RTX 4090 Laptop GPU
94.3 fps -30%
Moyenne de la classe
  (2.65 - 188.1, n=1899)
58.5 fps -57%
Shadow of the Tomb Raider - 1920x1080 Highest Preset AA:T
Asus ROG Strix Scar 17 G733PYV-LL053X
AMD Ryzen 9 7945HX3D, NVIDIA GeForce RTX 4090 Laptop GPU
271 fps +28%
Asus ROG Strix Scar 17 G733PY-XS96
AMD Ryzen 9 7945HX, NVIDIA GeForce RTX 4090 Laptop GPU
228 fps +8%
MSI Raider GE78 HX 13VI
Intel Core i9-13980HX, NVIDIA GeForce RTX 4090 Laptop GPU
219 fps +3%
MSI Titan GT77 HX 13VI
Intel Core i9-13950HX, NVIDIA GeForce RTX 4090 Laptop GPU
214 fps +1%
SCHENKER XMG Neo 17 2024 Engineering Sample
Intel Core i9-14900HX, NVIDIA GeForce RTX 4090 Laptop GPU
212 fps
Lenovo Legion Pro 5 16ARX8
AMD Ryzen 7 7745HX, NVIDIA GeForce RTX 4070 Laptop GPU
168 fps -21%
Asus ROG Strix Scar 18 2023 G834JY-N6005W
Intel Core i9-13980HX, NVIDIA GeForce RTX 4090 Laptop GPU
143.7 fps -32%
Moyenne de la classe
  (6 - 375, n=611)
100.8 fps -52%
F1 22 - 1920x1080 Ultra High Preset AA:T AF:16x
Alienware m18 R1
Intel Core i9-13980HX, NVIDIA GeForce RTX 4090 Laptop GPU
144.7 (124min, 94P1) fps +15%
MSI Titan GT77 HX 13VI
Intel Core i9-13950HX, NVIDIA GeForce RTX 4090 Laptop GPU
138.2 (118min, 84P1) fps +9%
MSI Raider GE78 HX 13VI
Intel Core i9-13980HX, NVIDIA GeForce RTX 4090 Laptop GPU
137.1 (115min, 79P1) fps +9%
Asus ROG Strix Scar 17 G733PYV-LL053X
AMD Ryzen 9 7945HX3D, NVIDIA GeForce RTX 4090 Laptop GPU
135.9 (118min, 98P1) fps +8%
Lenovo Legion 9 16IRX8
Intel Core i9-13980HX, NVIDIA GeForce RTX 4090 Laptop GPU
130.8 (95min, 78P1) fps +4%
Lenovo Legion Pro 7 RTX4090
Intel Core i9-13900HX, NVIDIA GeForce RTX 4090 Laptop GPU
129.2 (105min, 83P1) fps +2%
SCHENKER XMG Neo 17 2024 Engineering Sample
Intel Core i9-14900HX, NVIDIA GeForce RTX 4090 Laptop GPU
126.3 (109min, 83P1) fps
Asus ROG Strix Scar 18 2023 G834JY-N6005W
Intel Core i9-13980HX, NVIDIA GeForce RTX 4090 Laptop GPU
124.5 (107min, 87P1) fps -1%
Asus ROG Strix Scar 17 G733PY-XS96
AMD Ryzen 9 7945HX, NVIDIA GeForce RTX 4090 Laptop GPU
116.3 (86min, 73P1) fps -8%
Lenovo Legion Pro 5 16ARX8
AMD Ryzen 7 7745HX, NVIDIA GeForce RTX 4070 Laptop GPU
84.1 (71min, 59P1) fps -33%
Moyenne de la classe
  (5.09 - 221, n=481)
60.8 fps -52%
F1 23 - 1920x1080 Ultra High Preset AA:T AF:16x
Asus ROG Strix Scar 17 G733PYV-LL053X
AMD Ryzen 9 7945HX3D, NVIDIA GeForce RTX 4090 Laptop GPU
132 (107min, 102P1) fps +11%
MSI Raider GE78 HX 13VI
Intel Core i9-13980HX, NVIDIA GeForce RTX 4090 Laptop GPU
129.8 (104min, 98P1) fps +9%
SCHENKER XMG Neo 17 2024 Engineering Sample
Intel Core i9-14900HX, NVIDIA GeForce RTX 4090 Laptop GPU
119.3 (95min, 90P1) fps
Moyenne de la classe
  (5 - 226, n=199)
57.5 fps -52%
Far Cry 5 - 1920x1080 Ultra Preset AA:T
Asus ROG Strix Scar 17 G733PYV-LL053X
AMD Ryzen 9 7945HX3D, NVIDIA GeForce RTX 4090 Laptop GPU
218 fps +35%
SCHENKER XMG Neo 17 2024 Engineering Sample
Intel Core i9-14900HX, NVIDIA GeForce RTX 4090 Laptop GPU
162 fps
MSI Titan GT77 HX 13VI
Intel Core i9-13950HX, NVIDIA GeForce RTX 4090 Laptop GPU
160 fps -1%
Asus ROG Strix Scar 18 2023 G834JY-N6005W
Intel Core i9-13980HX, NVIDIA GeForce RTX 4090 Laptop GPU
158 (117min) fps -2%
Lenovo Legion 9 16IRX8
Intel Core i9-13980HX, NVIDIA GeForce RTX 4090 Laptop GPU
158 (102min) fps -2%
Asus ROG Strix Scar 17 G733PY-XS96
AMD Ryzen 9 7945HX, NVIDIA GeForce RTX 4090 Laptop GPU
145 (106min) fps -10%
Moyenne de la classe
  (1 - 278, n=1011)
83.8 fps -48%
Far Cry 6 - 1920x1080 Ultra Graphics Quality + HD Textures AA:T
Asus ROG Strix Scar 17 G733PYV-LL053X
AMD Ryzen 9 7945HX3D, NVIDIA GeForce RTX 4090 Laptop GPU
167 fps +7%
SCHENKER XMG Neo 17 2024 Engineering Sample
Intel Core i9-14900HX, NVIDIA GeForce RTX 4090 Laptop GPU
156 fps
MSI Titan GT77 HX 13VI
Intel Core i9-13950HX, NVIDIA GeForce RTX 4090 Laptop GPU
144 fps -8%
Asus ROG Strix Scar 17 G733PY-XS96
AMD Ryzen 9 7945HX, NVIDIA GeForce RTX 4090 Laptop GPU
112 (91min) fps -28%
Lenovo Legion Pro 5 16ARX8
AMD Ryzen 7 7745HX, NVIDIA GeForce RTX 4070 Laptop GPU
110 (74min) fps -29%
Moyenne de la classe
  (4.67 - 223, n=284)
95.4 fps -39%
Call of Duty Modern Warfare 2 2022 - 1920x1080 Extreme Quality Preset AA:T2X Filmic SM
Asus ROG Strix Scar 17 G733PYV-LL053X
AMD Ryzen 9 7945HX3D, NVIDIA GeForce RTX 4090 Laptop GPU
182 fps +8%
Asus ROG Strix Scar 17 G733PY-XS96
AMD Ryzen 9 7945HX, NVIDIA GeForce RTX 4090 Laptop GPU
180 (103min) fps +7%
MSI Raider GE78 HX 13VI
Intel Core i9-13980HX, NVIDIA GeForce RTX 4090 Laptop GPU
177 (102min) fps +5%
MSI Titan GT77 HX 13VI
Intel Core i9-13950HX, NVIDIA GeForce RTX 4090 Laptop GPU
176 fps +5%
Asus ROG Strix Scar 18 2023 G834JY-N6005W
Intel Core i9-13980HX, NVIDIA GeForce RTX 4090 Laptop GPU
170 (98P1) fps +1%
SCHENKER XMG Neo 17 2024 Engineering Sample
Intel Core i9-14900HX, NVIDIA GeForce RTX 4090 Laptop GPU
168 fps
Lenovo Legion Pro 5 16ARX8
AMD Ryzen 7 7745HX, NVIDIA GeForce RTX 4070 Laptop GPU
108 (61min) fps -36%
Moyenne de la classe
  (12 - 285, n=120)
105.1 fps -37%
Cyberpunk 2077 1.6 - 1920x1080 Ultra Preset
Asus ROG Strix Scar 17 G733PYV-LL053X
AMD Ryzen 9 7945HX3D, NVIDIA GeForce RTX 4090 Laptop GPU
157 fps +21%
MSI Raider GE78 HX 13VI
Intel Core i9-13980HX, NVIDIA GeForce RTX 4090 Laptop GPU
135.14 (44.88min) fps +4%
MSI Titan GT77 HX 13VI
Intel Core i9-13950HX, NVIDIA GeForce RTX 4090 Laptop GPU
135 fps +4%
Asus ROG Strix Scar 17 G733PY-XS96
AMD Ryzen 9 7945HX, NVIDIA GeForce RTX 4090 Laptop GPU
133.8 (57.7min) fps +3%
Lenovo Legion 9 16IRX8
Intel Core i9-13980HX, NVIDIA GeForce RTX 4090 Laptop GPU
131.4 (23.8min) fps +1%
SCHENKER XMG Neo 17 2024 Engineering Sample
Intel Core i9-14900HX, NVIDIA GeForce RTX 4090 Laptop GPU
130 fps
Alienware m18 R1
Intel Core i9-13980HX, NVIDIA GeForce RTX 4090 Laptop GPU
127.92 (32.4min) fps -2%
Asus ROG Strix Scar 18 2023 G834JY-N6005W
Intel Core i9-13980HX, NVIDIA GeForce RTX 4090 Laptop GPU
119.7 (69min) fps -8%
Lenovo Legion Pro 5 16ARX8
AMD Ryzen 7 7745HX, NVIDIA GeForce RTX 4070 Laptop GPU
98.9 (35.5min) fps -24%
Moyenne de la classe
  (5 - 241, n=374)
73.2 fps -44%
Cyberpunk 2077 2.0 Phantom Liberty - 1920x1080 Ultra Preset (FSR off)
Asus ROG Strix Scar 17 G733PYV-LL053X
AMD Ryzen 9 7945HX3D, NVIDIA GeForce RTX 4090 Laptop GPU
142.8 fps +16%
Lenovo Legion 9 16IRX8
Intel Core i9-13980HX, NVIDIA GeForce RTX 4090 Laptop GPU
131.22 (31.65min) fps +7%
MSI Raider GE78 HX 13VI
Intel Core i9-13980HX, NVIDIA GeForce RTX 4090 Laptop GPU
127 (36.47min) fps +4%
SCHENKER XMG Neo 17 2024 Engineering Sample
Intel Core i9-14900HX, NVIDIA GeForce RTX 4090 Laptop GPU
122.7 (16.4min) fps
Moyenne de la classe
  (2.3 - 216, n=179)
72.1 fps -41%

Performances de jeu QHD

En résolution QHD, l'influence du processeur est encore plus faible et le GPU devient un facteur décisif. Une fois de plus, les processeurs HX d'Intel se sont tous comportés de la même manière et tous les modèles i9 sont bien adaptés aux jeux. Le Ryzen 9 7945HX3D offre toujours des performances nettement supérieures pour un grand nombre de jeux, par exemple Far Cry 5, GTA V ou F1 2023.

Shadow of the Tomb Raider - 2560x1440 Highest Preset AA:T
Asus ROG Strix Scar 17 G733PYV-LL053X
NVIDIA GeForce RTX 4090 Laptop GPU, R9 7945HX3D, SK hynix PC801 HFS001TEJ9X101N
199 fps +13%
Asus ROG Strix Scar 17 G733PY-XS96
NVIDIA GeForce RTX 4090 Laptop GPU, R9 7945HX, SK hynix PC801 HFS001TEJ9X101N
190 fps +8%
MSI Titan GT77 HX 13VI
NVIDIA GeForce RTX 4090 Laptop GPU, i9-13950HX, Samsung PM9A1 MZVL22T0HBLB
187 fps +6%
Lenovo Legion Pro 7 RTX4090
NVIDIA GeForce RTX 4090 Laptop GPU, i9-13900HX, Samsung PM9A1 MZVL21T0HCLR
185 fps +5%
SCHENKER XMG Neo 17 2024 Engineering Sample
NVIDIA GeForce RTX 4090 Laptop GPU, i9-14900HX
176 fps
Alienware M18 R1 QHD
NVIDIA GeForce RTX 4090 Laptop GPU, i9-13900HX
175 fps -1%
Asus ROG Strix Scar 18 2023 G834JY-N6005W
NVIDIA GeForce RTX 4090 Laptop GPU, i9-13980HX, 2x Samsung PM9A1 MZVL21T0HCLR (RAID 0)
121.2 fps -31%
Lenovo Legion Pro 5 16ARX8
NVIDIA GeForce RTX 4070 Laptop GPU, R7 7745HX, Samsung PM9A1 MZVL21T0HCLR
110 fps -37%
Far Cry 5 - 2560x1440 Ultra Preset AA:T
Asus ROG Strix Scar 17 G733PYV-LL053X
NVIDIA GeForce RTX 4090 Laptop GPU, R9 7945HX3D, SK hynix PC801 HFS001TEJ9X101N
194 fps +24%
MSI Titan GT77 HX 13VI
NVIDIA GeForce RTX 4090 Laptop GPU, i9-13950HX, Samsung PM9A1 MZVL22T0HBLB
159 fps +1%
Lenovo Legion 9 16IRX8
NVIDIA GeForce RTX 4090 Laptop GPU, i9-13980HX, 2x SK Hynix HFS001TEJ9X115N (RAID 0)
157 (111min - 208max) fps 0%
SCHENKER XMG Neo 17 2024 Engineering Sample
NVIDIA GeForce RTX 4090 Laptop GPU, i9-14900HX
157 fps
Asus ROG Strix Scar 18 2023 G834JY-N6005W
NVIDIA GeForce RTX 4090 Laptop GPU, i9-13980HX, 2x Samsung PM9A1 MZVL21T0HCLR (RAID 0)
153 (107min - 197max) fps -3%
Asus ROG Strix Scar 17 G733PY-XS96
NVIDIA GeForce RTX 4090 Laptop GPU, R9 7945HX, SK hynix PC801 HFS001TEJ9X101N
142 (104min - 189max) fps -10%
Far Cry 6 - 2560x1440 Ultra Graphics Quality + HD Textures AA:T
Asus ROG Strix Scar 17 G733PYV-LL053X
NVIDIA GeForce RTX 4090 Laptop GPU, R9 7945HX3D, SK hynix PC801 HFS001TEJ9X101N
146 fps +4%
SCHENKER XMG Neo 17 2024 Engineering Sample
NVIDIA GeForce RTX 4090 Laptop GPU, i9-14900HX
141 fps
MSI Titan GT77 HX 13VI
NVIDIA GeForce RTX 4090 Laptop GPU, i9-13950HX, Samsung PM9A1 MZVL22T0HBLB
135 fps -4%
Alienware M18 R1 QHD
NVIDIA GeForce RTX 4090 Laptop GPU, i9-13900HX
128 (104min - 155max) fps -9%
Asus ROG Strix Scar 17 G733PY-XS96
NVIDIA GeForce RTX 4090 Laptop GPU, R9 7945HX, SK hynix PC801 HFS001TEJ9X101N
109 (88min - 120max) fps -23%
Lenovo Legion Pro 5 16ARX8
NVIDIA GeForce RTX 4070 Laptop GPU, R7 7745HX, Samsung PM9A1 MZVL21T0HCLR
88 (57min - 99max) fps -38%
Final Fantasy XV Benchmark - 2560x1440 High Quality
MSI Titan GT77 HX 13VI
NVIDIA GeForce RTX 4090 Laptop GPU, i9-13950HX, Samsung PM9A1 MZVL22T0HBLB
162.9 fps +6%
Alienware m18 R1
NVIDIA GeForce RTX 4090 Laptop GPU, i9-13980HX, SK hynix PC801 HFS001TEJ9X101N
159.5 fps +4%
Lenovo Legion 9 16IRX8
NVIDIA GeForce RTX 4090 Laptop GPU, i9-13980HX, 2x SK Hynix HFS001TEJ9X115N (RAID 0)
158.4 fps +3%
SCHENKER Key 17 Pro (Early 23)
NVIDIA GeForce RTX 4090 Laptop GPU, i9-13900HX, Samsung 990 Pro 2 TB MZVL72T0HDLB
156.4 fps +2%
Lenovo Legion Pro 7 RTX4090
NVIDIA GeForce RTX 4090 Laptop GPU, i9-13900HX, Samsung PM9A1 MZVL21T0HCLR
154 fps 0%
SCHENKER XMG Neo 17 2024 Engineering Sample
NVIDIA GeForce RTX 4090 Laptop GPU, i9-14900HX
153.5 fps
Asus ROG Strix Scar 17 G733PYV-LL053X
NVIDIA GeForce RTX 4090 Laptop GPU, R9 7945HX3D, SK hynix PC801 HFS001TEJ9X101N
151.2 fps -1%
Asus ROG Strix Scar 17 G733PY-XS96
NVIDIA GeForce RTX 4090 Laptop GPU, R9 7945HX, SK hynix PC801 HFS001TEJ9X101N
151 fps -2%
Asus ROG Strix Scar 18 2023 G834JY-N6005W
NVIDIA GeForce RTX 4090 Laptop GPU, i9-13980HX, 2x Samsung PM9A1 MZVL21T0HCLR (RAID 0)
146.7 fps -4%
Lenovo Legion Pro 5 16ARX8
NVIDIA GeForce RTX 4070 Laptop GPU, R7 7745HX, Samsung PM9A1 MZVL21T0HCLR
119.9 fps -22%
GTA V - 2560x1440 Highest Settings possible AA:4xMSAA + FX AF:16x
Asus ROG Strix Scar 17 G733PYV-LL053X
NVIDIA GeForce RTX 4090 Laptop GPU, R9 7945HX3D, SK hynix PC801 HFS001TEJ9X101N
160.6 (2.82min, 111.1P1 - 363max) fps +11%
Alienware m18 R1
NVIDIA GeForce RTX 4090 Laptop GPU, i9-13980HX, SK hynix PC801 HFS001TEJ9X101N
145.5 (2.46min, 111.1P1 - 281max) fps 0%
Lenovo Legion 9 16IRX8
NVIDIA GeForce RTX 4090 Laptop GPU, i9-13980HX, 2x SK Hynix HFS001TEJ9X115N (RAID 0)
145.3 (4.06min, 100P1 - 332max) fps 0%
SCHENKER XMG Neo 17 2024 Engineering Sample
NVIDIA GeForce RTX 4090 Laptop GPU, i9-14900HX
145.2 (2.65min, 100P1 - 265max) fps
SCHENKER Key 17 Pro (Early 23)
NVIDIA GeForce RTX 4090 Laptop GPU, i9-13900HX, Samsung 990 Pro 2 TB MZVL72T0HDLB
141.5 (28.6min, 100P1 - 268max) fps -3%
Asus ROG Strix Scar 18 2023 G834JY-N6005W
NVIDIA GeForce RTX 4090 Laptop GPU, i9-13980HX, 2x Samsung PM9A1 MZVL21T0HCLR (RAID 0)
139.1 (3.59min, 90.9P1 - 238max) fps -4%
MSI Titan GT77 HX 13VI
NVIDIA GeForce RTX 4090 Laptop GPU, i9-13950HX, Samsung PM9A1 MZVL22T0HBLB
138.5 (3.45min, 76.9P1 - 256max) fps -5%
Lenovo Legion Pro 7 RTX4090
NVIDIA GeForce RTX 4090 Laptop GPU, i9-13900HX, Samsung PM9A1 MZVL21T0HCLR
137.7 (3.84min, 90.9P1 - 304max) fps -5%
Asus ROG Strix Scar 17 G733PY-XS96
NVIDIA GeForce RTX 4090 Laptop GPU, R9 7945HX, SK hynix PC801 HFS001TEJ9X101N
114.8 (5.12min, 71.4P1 - 204max) fps -21%
Lenovo Legion Pro 5 16ARX8
NVIDIA GeForce RTX 4070 Laptop GPU, R7 7745HX, Samsung PM9A1 MZVL21T0HCLR
93.2 (3.72min, 62.5P1 - 175.2max) fps -36%
F1 22 - 2560x1440 Ultra High Preset AA:T AF:16x
Alienware m18 R1
NVIDIA GeForce RTX 4090 Laptop GPU, i9-13980HX, SK hynix PC801 HFS001TEJ9X101N
92.2 (79min, 74P1 - 106max) fps +4%
Asus ROG Strix Scar 17 G733PY-XS96
NVIDIA GeForce RTX 4090 Laptop GPU, R9 7945HX, SK hynix PC801 HFS001TEJ9X101N
92.1 (75min, 60P1 - 107max) fps +4%
Asus ROG Strix Scar 17 G733PYV-LL053X
NVIDIA GeForce RTX 4090 Laptop GPU, R9 7945HX3D, SK hynix PC801 HFS001TEJ9X101N
91.8 (78min, 76P1 - 105max) fps +3%
Lenovo Legion 9 16IRX8
NVIDIA GeForce RTX 4090 Laptop GPU, i9-13980HX, 2x SK Hynix HFS001TEJ9X115N (RAID 0)
90.9 (76min, 56P1 - 105max) fps +2%
Alienware M18 R1 QHD
NVIDIA GeForce RTX 4090 Laptop GPU, i9-13900HX
90.6 (77min, 72P1 - 106max) fps +2%
MSI Titan GT77 HX 13VI
NVIDIA GeForce RTX 4090 Laptop GPU, i9-13950HX, Samsung PM9A1 MZVL22T0HBLB
90.1 (78min, 71P1 - 104max) fps +2%
SCHENKER XMG Neo 17 2024 Engineering Sample
NVIDIA GeForce RTX 4090 Laptop GPU, i9-14900HX
88.7 (77min, 67P1 - 104max) fps
Lenovo Legion Pro 7 RTX4090
NVIDIA GeForce RTX 4090 Laptop GPU, i9-13900HX, Samsung PM9A1 MZVL21T0HCLR
85.2 (72min, 40P1 - 96max) fps -4%
Asus ROG Strix Scar 18 2023 G834JY-N6005W
NVIDIA GeForce RTX 4090 Laptop GPU, i9-13980HX, 2x Samsung PM9A1 MZVL21T0HCLR (RAID 0)
75 (23min, 32P1 - 96max) fps -15%
Lenovo Legion Pro 5 16ARX8
NVIDIA GeForce RTX 4070 Laptop GPU, R7 7745HX, Samsung PM9A1 MZVL21T0HCLR
54.8 (47min, 45P1 - 65max) fps -38%
F1 23 - 2560x1440 Ultra High Preset AA:T AF:16x
Asus ROG Strix Scar 17 G733PYV-LL053X
NVIDIA GeForce RTX 4090 Laptop GPU, R9 7945HX3D, SK hynix PC801 HFS001TEJ9X101N
85.1 (67min, 67P1 - 100max) fps +11%
SCHENKER XMG Neo 17 2024 Engineering Sample
NVIDIA GeForce RTX 4090 Laptop GPU, i9-14900HX
76.9 (59min, 61P1 - 94max) fps
Call of Duty Modern Warfare 2 2022 - 2560x1440 Extreme Quality Preset AA:T2X Filmic SM
Asus ROG Strix Scar 17 G733PYV-LL053X
NVIDIA GeForce RTX 4090 Laptop GPU, R9 7945HX3D, SK hynix PC801 HFS001TEJ9X101N
136 fps +10%
MSI Titan GT77 HX 13VI
NVIDIA GeForce RTX 4090 Laptop GPU, i9-13950HX, Samsung PM9A1 MZVL22T0HBLB
135 fps +9%
Asus ROG Strix Scar 17 G733PY-XS96
NVIDIA GeForce RTX 4090 Laptop GPU, R9 7945HX, SK hynix PC801 HFS001TEJ9X101N
135 (69min) fps +9%
Lenovo Legion Pro 7 RTX4090
NVIDIA GeForce RTX 4090 Laptop GPU, i9-13900HX, Samsung PM9A1 MZVL21T0HCLR
132 (67min) fps +6%
Alienware M18 R1 QHD
NVIDIA GeForce RTX 4090 Laptop GPU, i9-13900HX
132 (69min) fps +6%
Asus ROG Strix Scar 18 2023 G834JY-N6005W
NVIDIA GeForce RTX 4090 Laptop GPU, i9-13980HX, 2x Samsung PM9A1 MZVL21T0HCLR (RAID 0)
127 (65P1) fps +2%
SCHENKER XMG Neo 17 2024 Engineering Sample
NVIDIA GeForce RTX 4090 Laptop GPU, i9-14900HX
124 fps
Lenovo Legion Pro 5 16ARX8
NVIDIA GeForce RTX 4070 Laptop GPU, R7 7745HX, Samsung PM9A1 MZVL21T0HCLR
77 (39min) fps -38%
Cyberpunk 2077 1.6 - 2560x1440 Ultra Preset
Asus ROG Strix Scar 17 G733PYV-LL053X
NVIDIA GeForce RTX 4090 Laptop GPU, R9 7945HX3D, SK hynix PC801 HFS001TEJ9X101N
116 fps +22%
Asus ROG Strix Scar 17 G733PY-XS96
NVIDIA GeForce RTX 4090 Laptop GPU, R9 7945HX, SK hynix PC801 HFS001TEJ9X101N
104.3 (34.5min - 159.2max) fps +9%
Alienware m18 R1
NVIDIA GeForce RTX 4090 Laptop GPU, i9-13980HX, SK hynix PC801 HFS001TEJ9X101N
102.16 (48.9min - 193.9max) fps +7%
Alienware M18 R1 QHD
NVIDIA GeForce RTX 4090 Laptop GPU, i9-13900HX
102.16 (41.4min - 165.62max) fps +7%
Lenovo Legion Pro 7 RTX4090
NVIDIA GeForce RTX 4090 Laptop GPU, i9-13900HX, Samsung PM9A1 MZVL21T0HCLR
100.93 (30.73min - 162.33max) fps +6%
Lenovo Legion 9 16IRX8
NVIDIA GeForce RTX 4090 Laptop GPU, i9-13980HX, 2x SK Hynix HFS001TEJ9X115N (RAID 0)
98.8 (28.3min - 147.2max) fps +4%
MSI Titan GT77 HX 13VI
NVIDIA GeForce RTX 4090 Laptop GPU, i9-13950HX, Samsung PM9A1 MZVL22T0HBLB
98 fps +3%
SCHENKER XMG Neo 17 2024 Engineering Sample
NVIDIA GeForce RTX 4090 Laptop GPU, i9-14900HX
95.3 fps
Asus ROG Strix Scar 18 2023 G834JY-N6005W
NVIDIA GeForce RTX 4090 Laptop GPU, i9-13980HX, 2x Samsung PM9A1 MZVL21T0HCLR (RAID 0)
94.5 (72min - 127max) fps -1%
Lenovo Legion Pro 5 16ARX8
NVIDIA GeForce RTX 4070 Laptop GPU, R7 7745HX, Samsung PM9A1 MZVL21T0HCLR
58.1 (37.8min - 93.4max) fps -39%
Cyberpunk 2077 2.0 Phantom Liberty - 2560x1440 Ultra Preset (FSR off)
Asus ROG Strix Scar 17 G733PYV-LL053X
NVIDIA GeForce RTX 4090 Laptop GPU, R9 7945HX3D, SK hynix PC801 HFS001TEJ9X101N
93.4 fps +6%
Lenovo Legion 9 16IRX8
NVIDIA GeForce RTX 4090 Laptop GPU, i9-13980HX, 2x SK Hynix HFS001TEJ9X115N (RAID 0)
89.55 (28.01min - 139.33max) fps +2%
SCHENKER XMG Neo 17 2024 Engineering Sample
NVIDIA GeForce RTX 4090 Laptop GPU, i9-14900HX
88.2 (17.8min - 124.4max) fps

Verdict - Le Core i9-14900HX n'est qu'une petite mise à jour

L'Intel Core i9-14900HX à l'intérieur du Schenker XMG Neo 17 (E24) examiné. Appareil de test fourni par Schenker Technologies.

Intel a donné à ses processeurs mobiles HX une petite mise à jour pour 2024, mais les nouveaux modèles Raptor-Lake-HX-Refresh ne présentent pas de grands changements ni d'améliorations. D'une manière générale, la gamme a été quelque peu allégée, puisque le fabricant a réduit le nombre de modèles HX de la 13e génération de neuf à cinq. Le Core i9-14900HX est désormais le seul modèle haut de gamme, avec 24 cœurs et 32 threads. Son turbo boost maximal a été porté à 5,8 GHz, ce qui permet d'améliorer les performances des cœurs uniques. Intel a réussi à reprendre la couronne des performances à Apple dans de nombreux tests. Cependant, ses performances supérieures sont tout simplement le résultat d'une consommation plus élevée, ce qui signifie que son efficacité n'est pas la meilleure.

En ce qui concerne les performances multicœurs, elles dépendent principalement des limites de puissance fixées pour chaque ordinateur portable - en général, le nouveau Core i9-14900HX ne se distingue pas beaucoup des anciens modèles Core-i9-HX de la 13e génération. Dans les jeux, le nouveau Refresh Raptor Lake-HX bénéficie également de l'amélioration des performances des cœurs uniques dans un certain nombre de jeux, mais en fin de compte, vous pouvez à peine remarquer une différence, en particulier avec des paramètres de qualité maximum et des résolutions élevées. Les limites de puissance du processeur et de la carte graphique jouent à nouveau un rôle important à cet égard. Le Ryzen 9 7945HX3D

d'AMD avec son V-Cache 3D reste un peu plus rapide dans certains jeux et reste donc le meilleur processeur HX mobile en termes d'efficacité et de performances de jeu. </p>

Intel a augmenté l'horloge turbo maximale du nouveau Core i9-14900HX, améliorant ainsi ses performances à cœur unique en particulier. Le Raptor Lake-HX Refresh ne peut bénéficier d'aucune autre amélioration, mais en raison de la disponibilité catastrophique des CPU HX d'AMD, il n'a pas à en bénéficier.

C'est du moins la théorie, car il n'y a pratiquement pas d'ordinateurs portables équipés du Ryzen 9 7945HX3D sur le marché. Le Core i9-14900HX, en revanche, sera bientôt disponible dans tous les ordinateurs portables haut de gamme destinés aux jeux et au multimédia, ce qui facilitera la domination du marché en 2024. Le processeur est loin d'être mauvais, mais Intel n'a pas vraiment besoin de faire d'énormes efforts dans ce domaine ni de proposer de grandes avancées. Passer d'un modèle Core-i9-HX de 13ème génération n'a absolument aucun sens, alors que passer d'une puce Alder-Lake comme le Core i9-12900HX pourrait avoir plus de sens, car il utilise toujours l'ancienne RTX-3000 gen de Nvidia.

Please share our article, every link counts!
> Revues et rapports de ordinateurs portatifs et smartphones, ordiphones > Critiques > Test de l'Intel Raptor Lake-HX Refresh : Core i9-14900HX avec plus de performances à cœur unique
Andreas Osthoff, 2024-01-10 (Update: 2024-01-10)