Test de l'Alienware m18 R1 : la Radeon RX 7900M d'AMD fait ses débuts

En tant que premier ordinateur portable de jeu de 18 pouces d'Alienware depuis plus d'une décennie, Dell met le paquet sur sa série Alienware M18 R1 en proposant des options Intel, AMD et Nvidia afin d'attirer le plus grand nombre de joueurs possible. Les utilisateurs peuvent choisir entre Intel-Nvidia, AMD-Nvidia ou AMD-AMD en ce qui concerne les CPU et les GPU, ce qui est très rare pour un ordinateur portable de jeu.
L'unité que nous examinons est la dernière configuration AMD-AMD et l'une des premières à proposer la Radeon RX 7900M de 180 W RNDA3 comme alternative à la RTX 4080 mobile qui règne sur GeForce. Le plus remarquable est que le nouveau GPU AMD est inférieur à la configuration RTX 4090 de $1200 USD, toutes options confondues, pour un prix final de $2300 USD, comme nous l'avons vu.
Les alternatives à l'Alienware m18 R1 comprennent d'autres ordinateurs portables de jeu haut de gamme de 18 pouces comme leAsus ROG Strix Scar 18, Razer Blade 18ouAcer Predator Helios 18. MSI ne propose pas encore d'ordinateurs portables de jeu modernes de 18 pouces.
Plus d'avis Dell :
Comparaison avec les concurrents potentiels
Note | Date | Modèle | Poids | Épaisseur | Taille | Résolution | Prix |
|---|---|---|---|---|---|---|---|
| 89.2 % v7 (old) | 11/23 | Alienware m18 R1 AMD R9 7945HX, Radeon RX 7900M | 3.9 kg | 26.7 mm | 18.00" | 1920x1200 | |
| 90.7 % v7 (old) | 04/23 | Alienware m18 R1 i9-13980HX, GeForce RTX 4090 Laptop GPU | 3.9 kg | 26.7 mm | 18.00" | 1920x1200 | |
| 88.3 % v7 (old) | 10/23 | Acer Predator Helios 18 N23Q2 i9-13900HX, GeForce RTX 4080 Laptop GPU | 3.2 kg | 29.15 mm | 18.00" | 2560x1600 | |
| 91.4 % v7 (old) | 02/23 | Razer Blade 18 RTX 4070 i9-13950HX, GeForce RTX 4070 Laptop GPU | 3 kg | 21.9 mm | 18.00" | 2560x1600 | |
| 86.6 % v7 (old) | 02/23 | Asus ROG Strix Scar 18 2023 G834JY-N6005W i9-13980HX, GeForce RTX 4090 Laptop GPU | 3.1 kg | 30.8 mm | 18.00" | 2560x1600 | |
v (old) | MSI Raider GE78 HX 13VI i9-13980HX, GeForce RTX 4090 Laptop GPU | 17.30" | 2560x1600 |
Cas
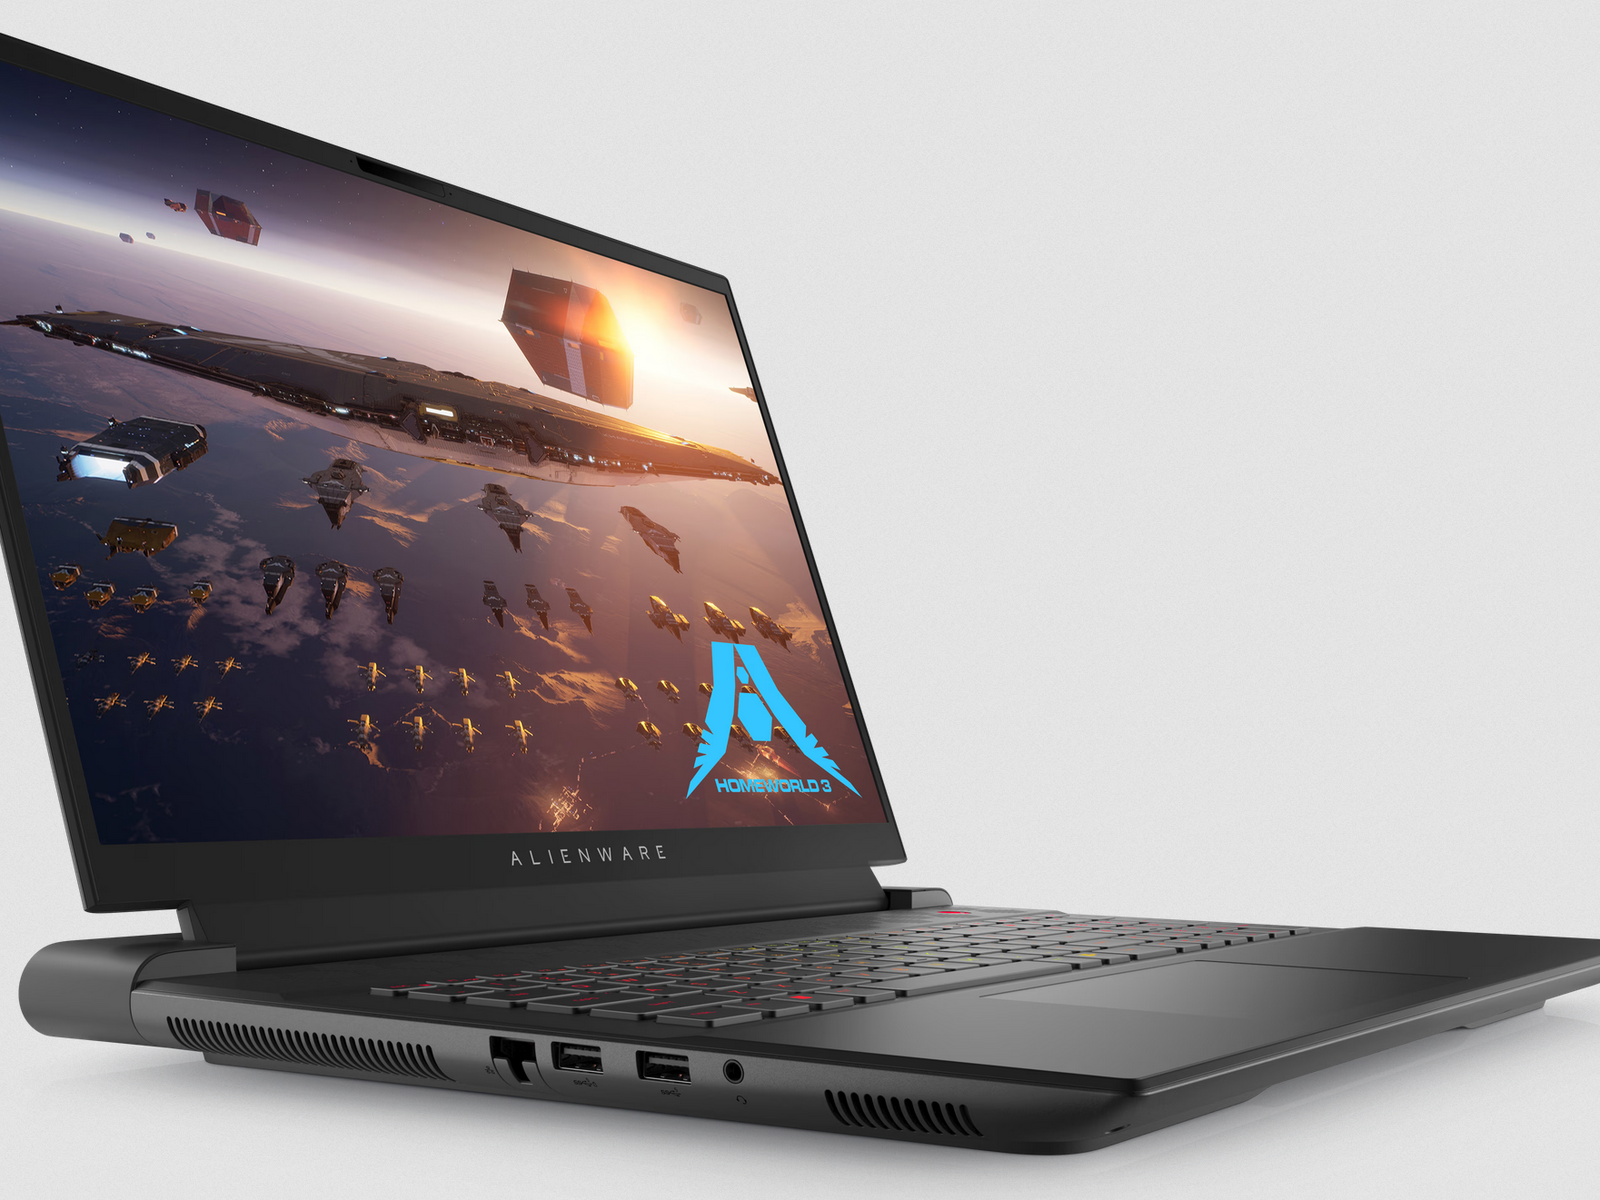
Les versions Intel et AMD de l'Alienware m18 R1 partagent le même design de châssis et les mêmes options de couleur. Ainsi, le seul moyen rapide et facile de distinguer visuellement les deux modèles est de chercher les logos Thunderbolt à côté des ports USB-C le long de l'arrière. Consultez notre avis sur la Configuration Intel-Nvidia pour en savoir plus sur les caractéristiques physiques de l'Alienware m18 R1.
L'USB4 n'est pas pris en charge, ce qui est décevant.
Lecteur de carte SD
| SD Card Reader | |
| average JPG Copy Test (av. of 3 runs) | |
| Razer Blade 18 RTX 4070 (Angelibird AV Pro V60) | |
| Alienware m18 R1 (Angelibird AV Pro V60) | |
| Alienware m18 R1 AMD (Toshiba Exceria Pro SDXC 64 GB UHS-II) | |
| Acer Predator Helios 18 N23Q2 | |
| MSI GE78HX 13VH-070US (Angelibird AV Pro V60) | |
| maximum AS SSD Seq Read Test (1GB) | |
| Alienware m18 R1 AMD (Toshiba Exceria Pro SDXC 64 GB UHS-II) | |
| Alienware m18 R1 (Angelibird AV Pro V60) | |
| Razer Blade 18 RTX 4070 (Angelibird AV Pro V60) | |
| MSI GE78HX 13VH-070US (Angelibird AV Pro V60) | |
| Acer Predator Helios 18 N23Q2 | |
Communication
Webcam


Maintenance
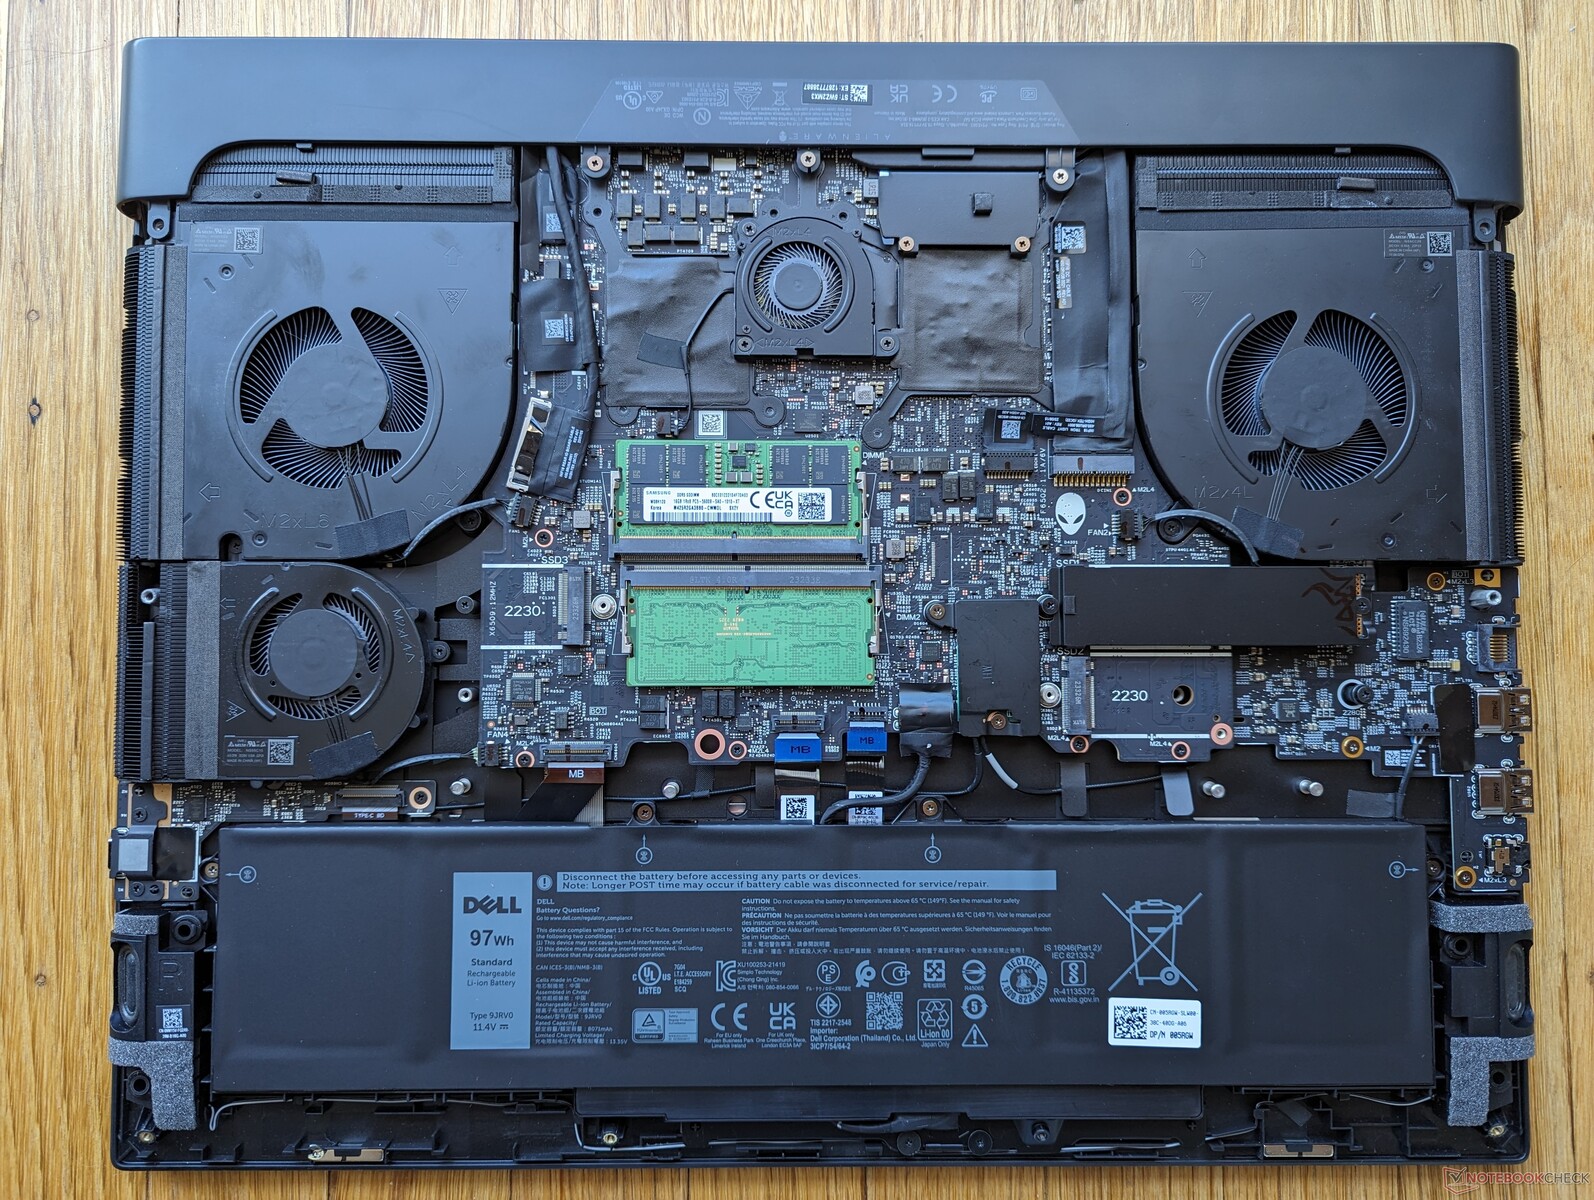
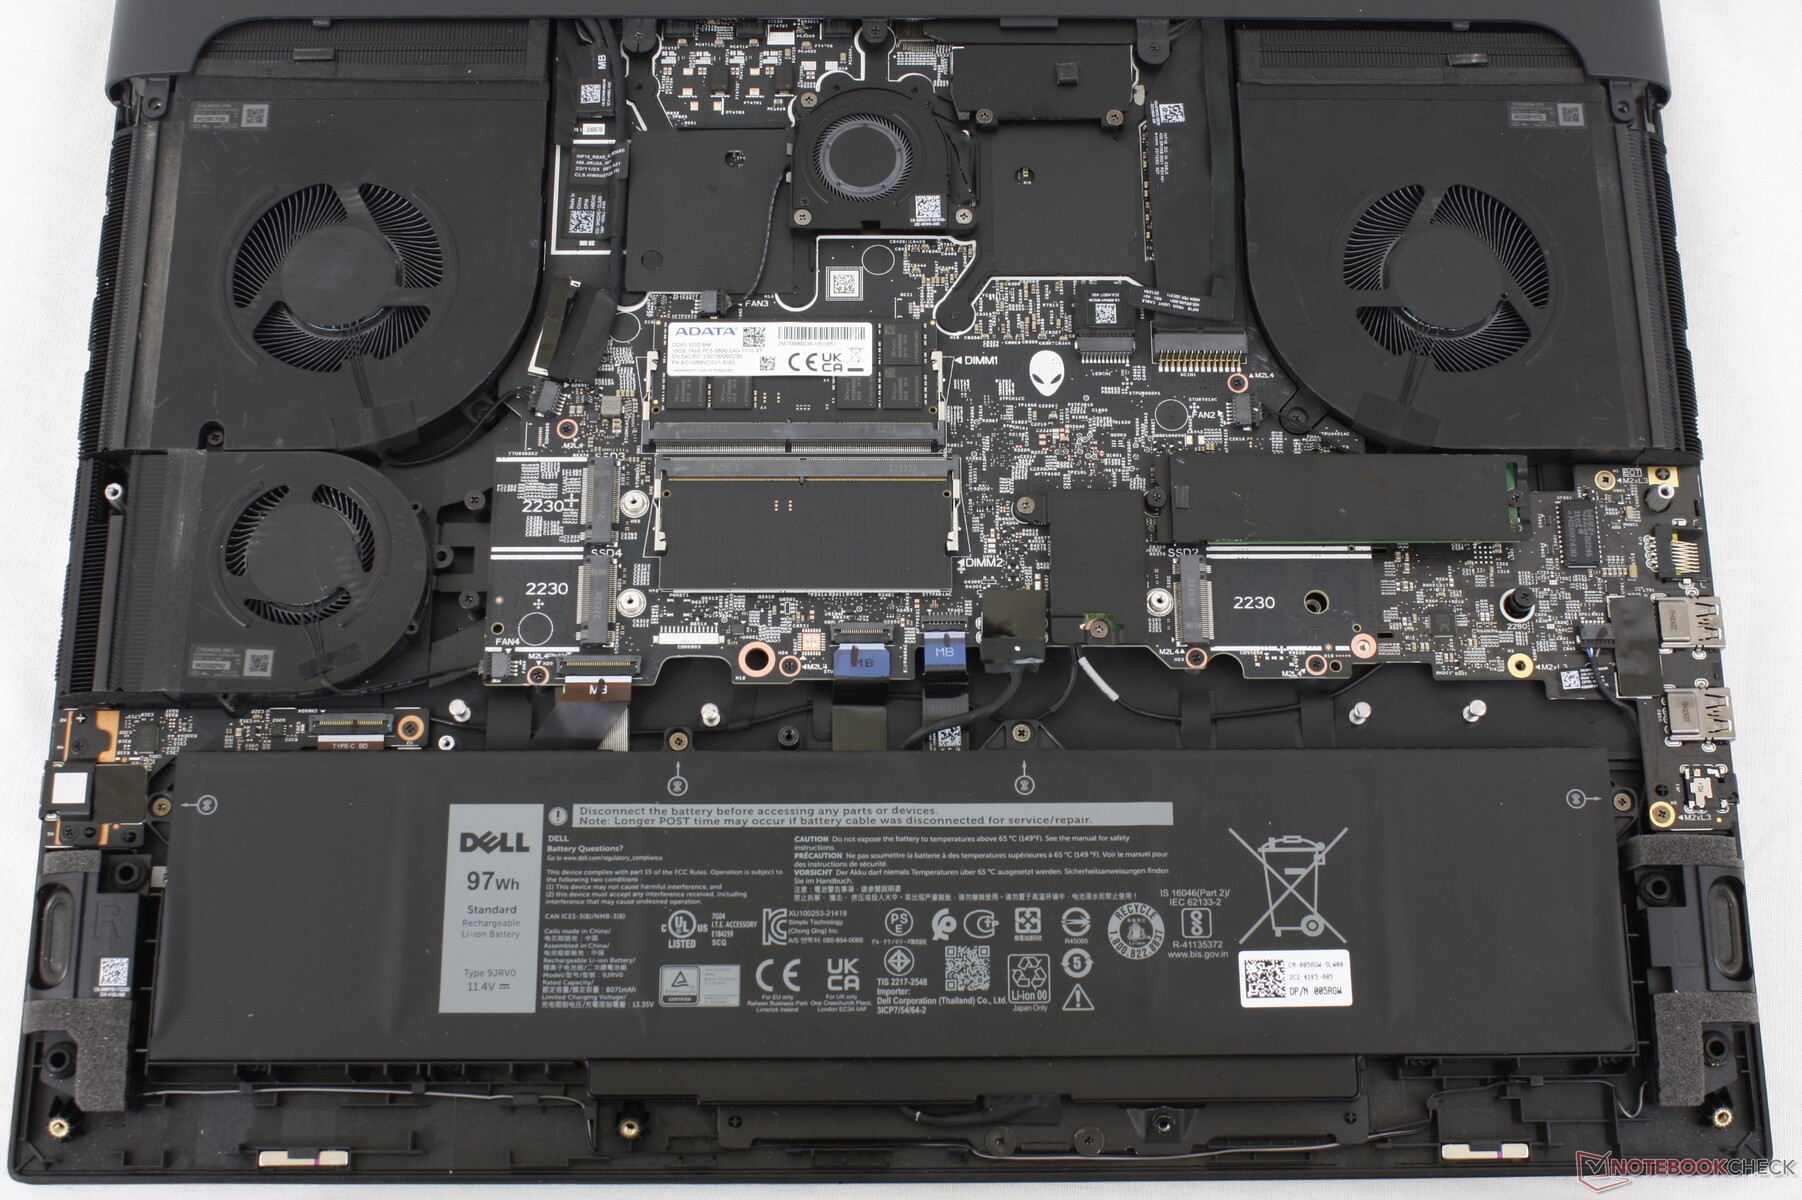
La configuration AMD-AMD ne prend en charge que jusqu'à trois SSD M.2 NVMe, tandis que la configuration Intel-Nvidia en prend en charge jusqu'à quatre, comme le montrent les images de comparaison ci-dessous. Leurs caractéristiques internes sont par ailleurs identiques.
Accessoires et garantie
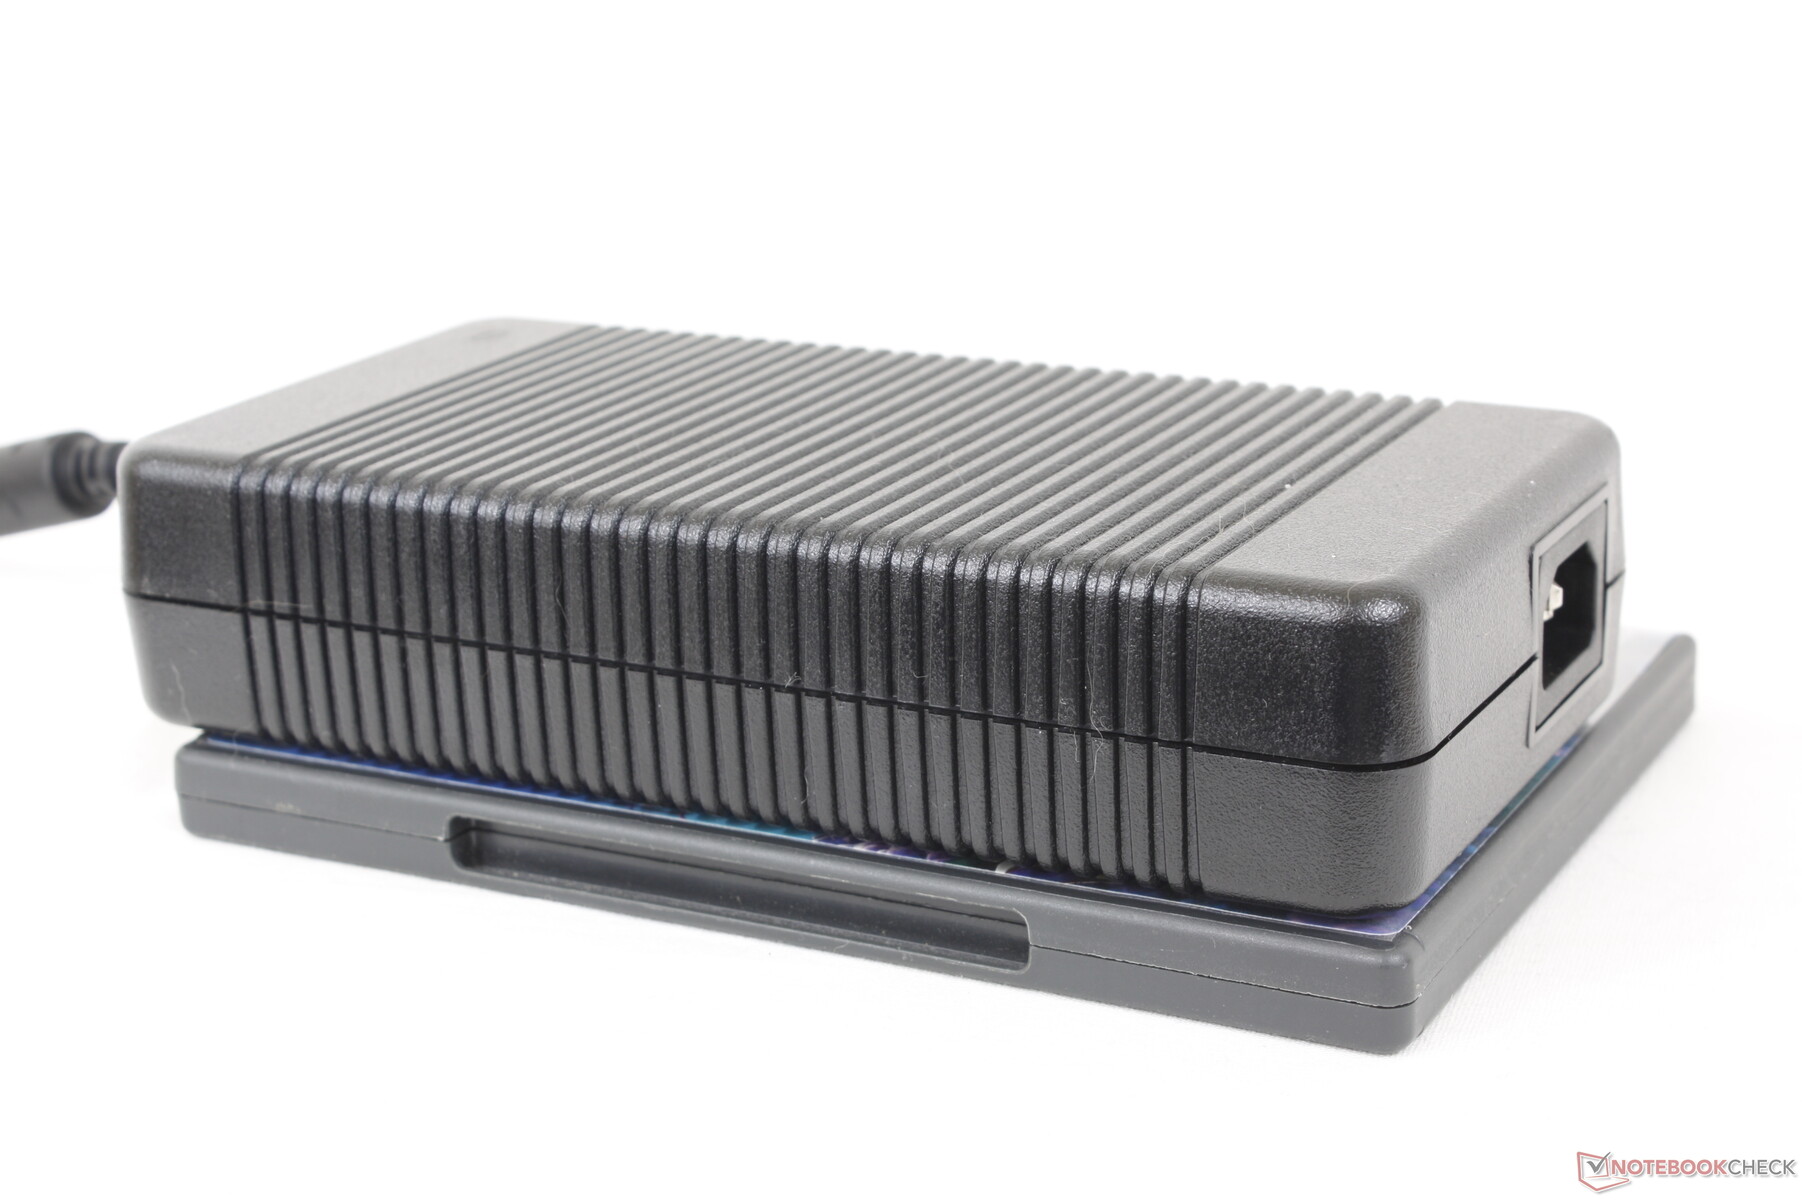
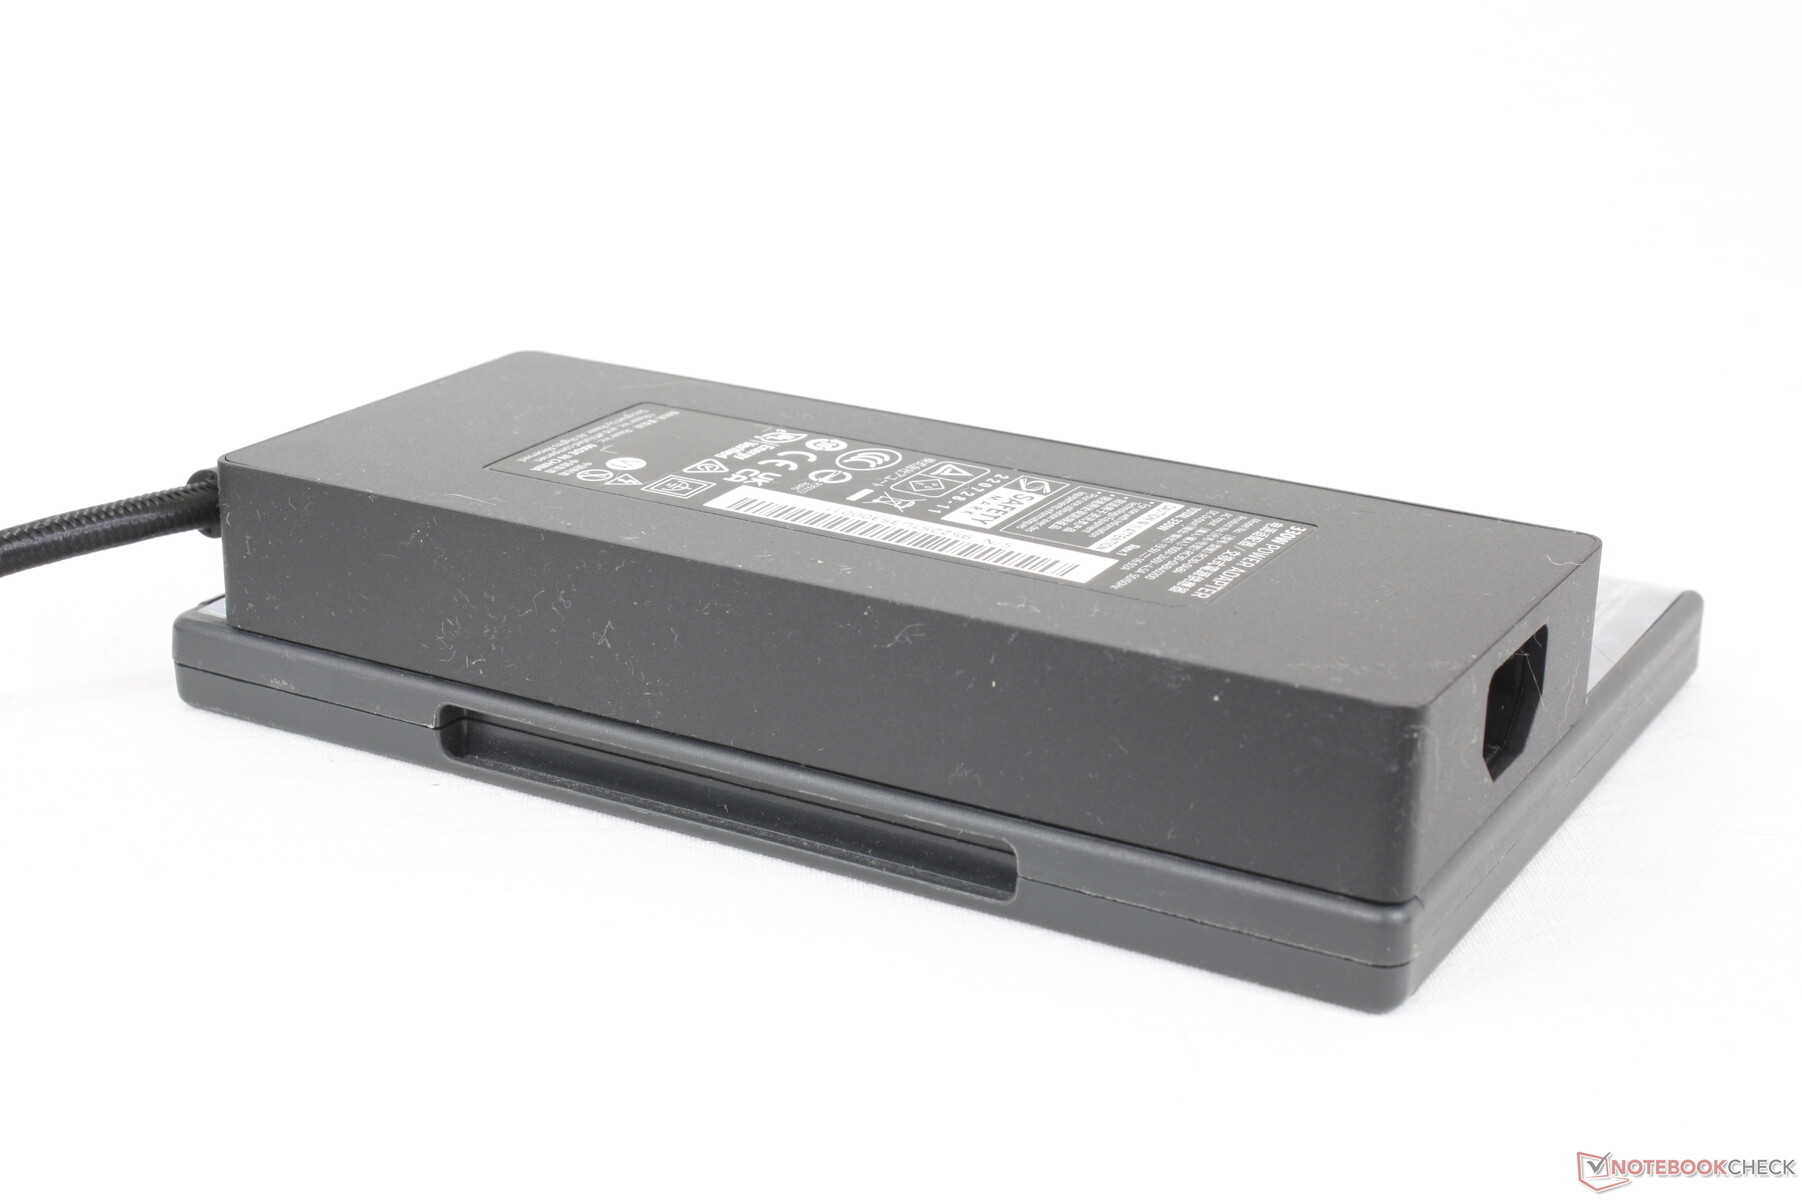
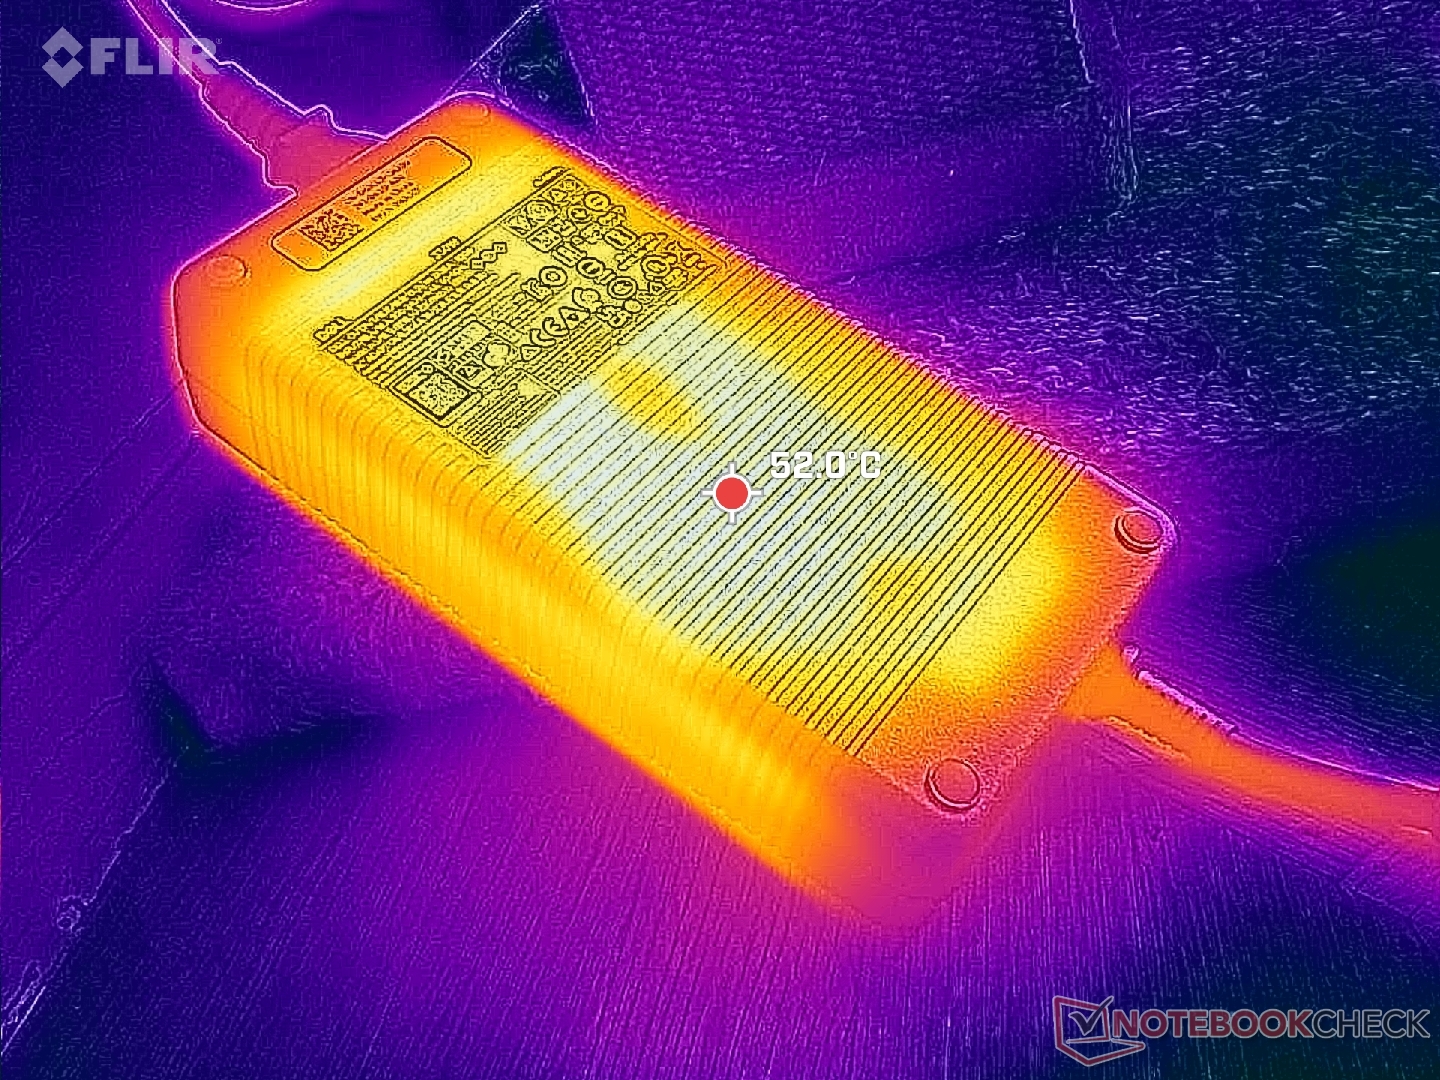
Dell n'est pas encore passé aux adaptateurs AC GaN qui peuvent offrir une puissance par volume plus élevée que les adaptateurs AC traditionnels. L'adaptateur CA de 330 W fourni est donc très encombrant par rapport aux adaptateurs CA GaN de 330 W qui sont actuellement livrés avec la plupart des ordinateurs portables Razer Blade.
La garantie limitée standard d'un an s'applique si vous achetez aux États-Unis.
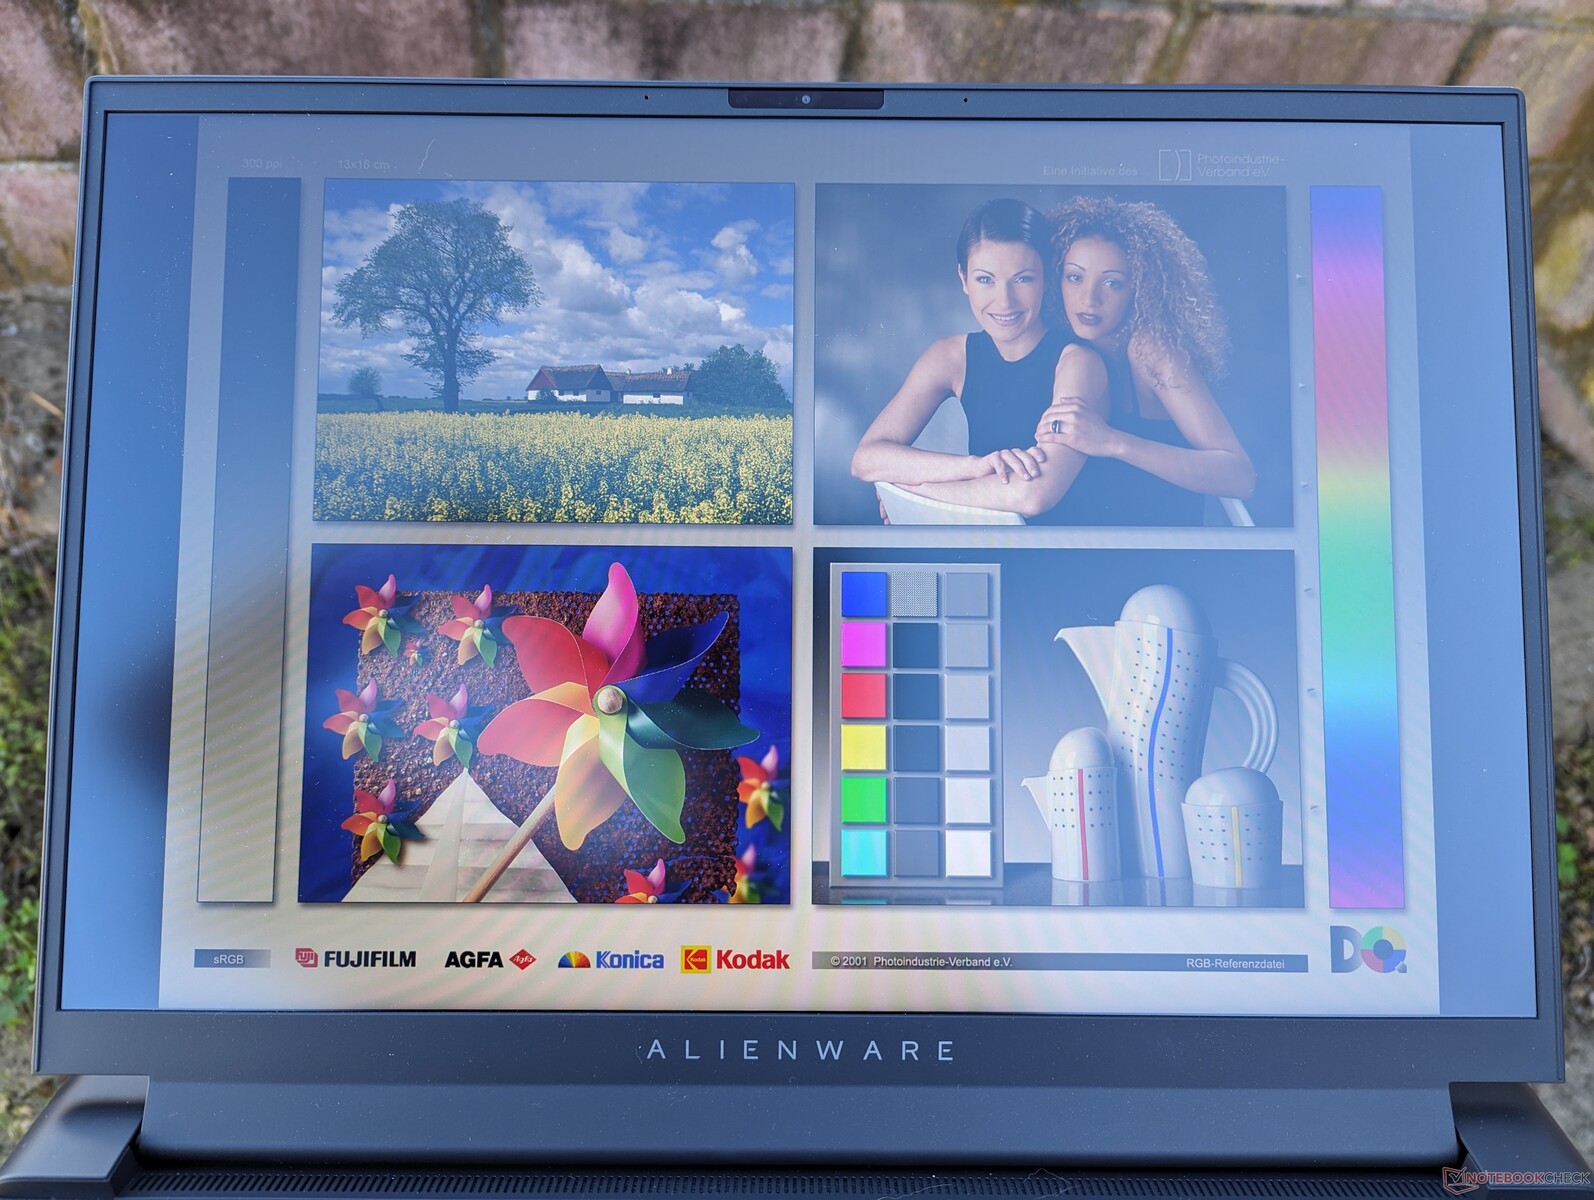
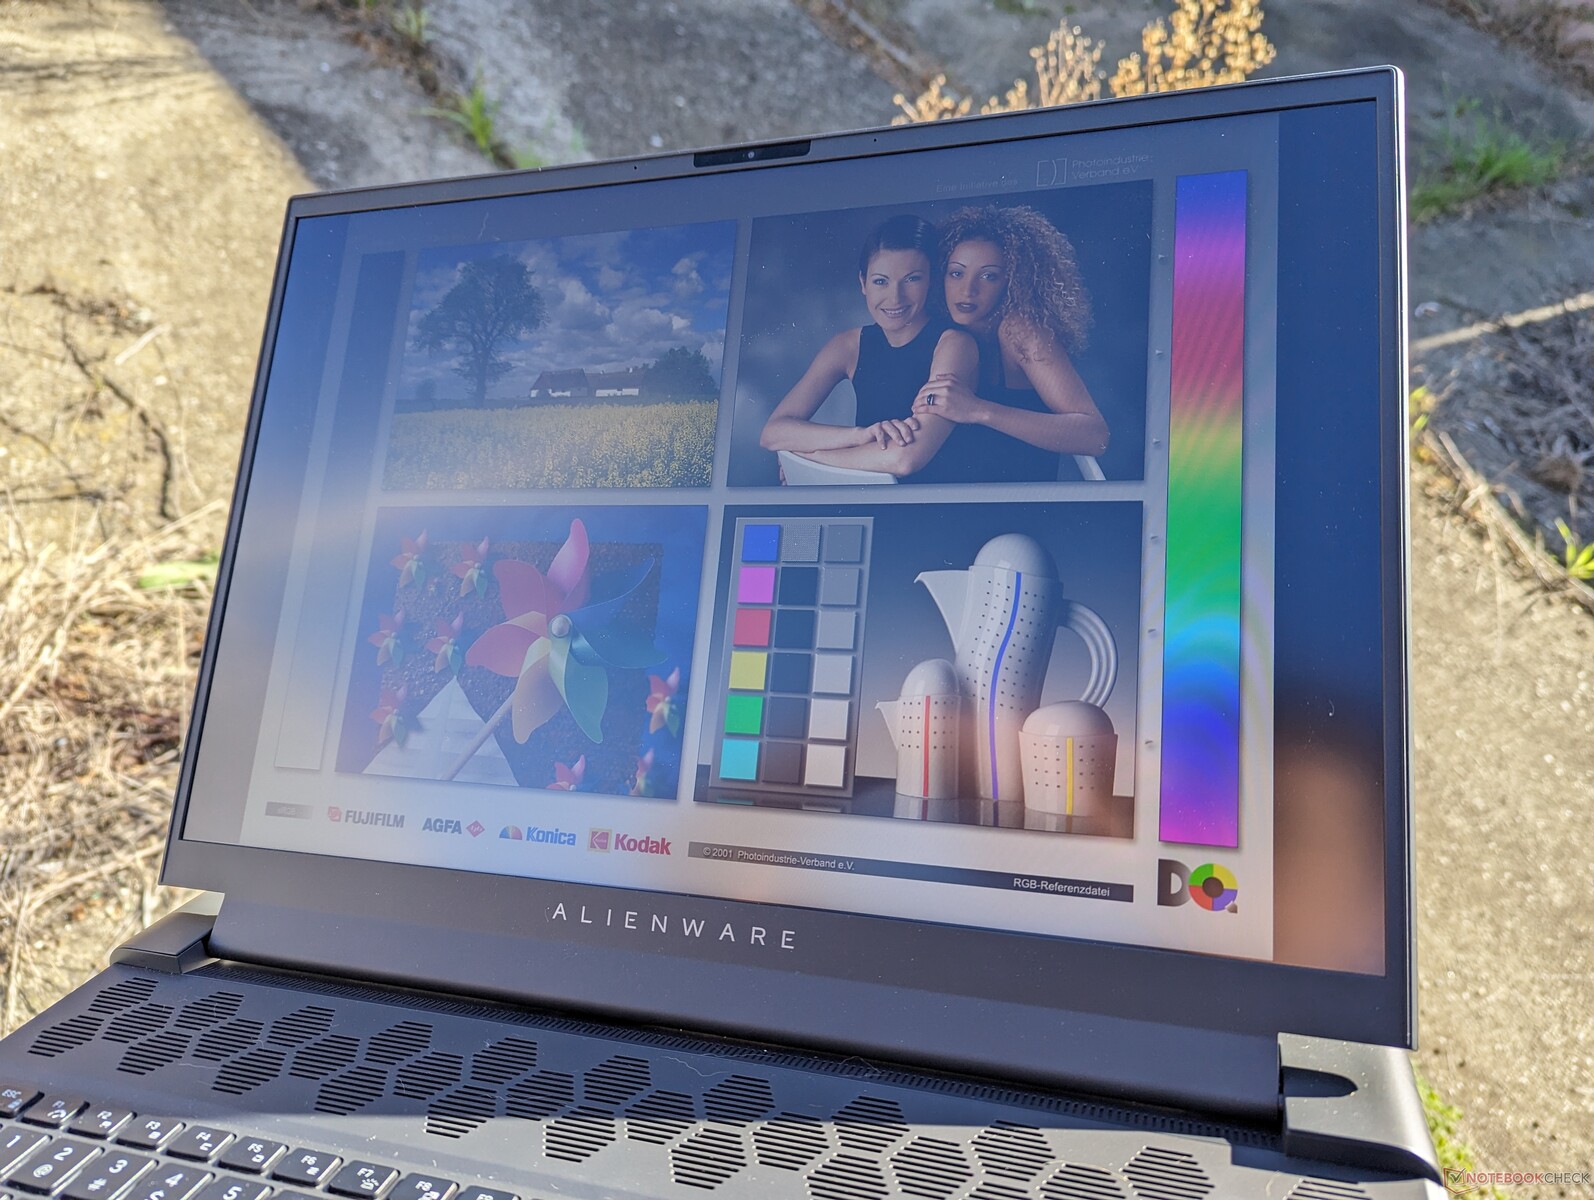
Affichage
Deux options d'affichage FreeSync sont disponibles comme suit :
- 1920 x 1200, 480 Hz, 100% DCI-P3, IPS
- 2560 x 1600, 165 Hz, 100% DCI-P3, IPS
Notre configuration utilise le panneau en gras ci-dessus comme dans notre précédente configuration Intel-Nvidia. Cependant, le fournisseur du panneau est différent cette fois-ci (BOE vs. Chi Mei), ce qui suggère que Dell s'approvisionne en panneaux 480 Hz auprès de plusieurs fournisseurs pour sa série Alienware m18. Heureusement, il n'y a pas de différences majeures entre eux en termes de couverture des couleurs, de temps de réponse ou de contraste pour une expérience visuelle très similaire.
Le taux de rafraîchissement de 480 Hz est le plus rapide disponible sur les ordinateurs portables à l'heure où nous écrivons ces lignes, ce qui permet d'obtenir des mouvements extrêmement fluides avec un minimum d'images fantômes. Néanmoins, les avantages des taux de rafraîchissement rapides deviennent de plus en plus marginaux au fur et à mesure que l'on monte en gamme. Il peut donc être intéressant d'opter pour l'option 1600p à plus haute résolution, même si le taux de rafraîchissement est plus lent, car 165 Hz reste une expérience très fluide.
Il convient de noter que le taux de rafraîchissement natif de 480 Hz peut être réglé sur 240 Hz ou 120 Hz via Windows, mais pas plus bas. Il est dommage qu'il n'y ait pas d'option 60 Hz, car les taux de rafraîchissement élevés ont un impact sur la consommation d'énergie, comme le montre notre section sur la gestion de l'énergie ci-dessous.
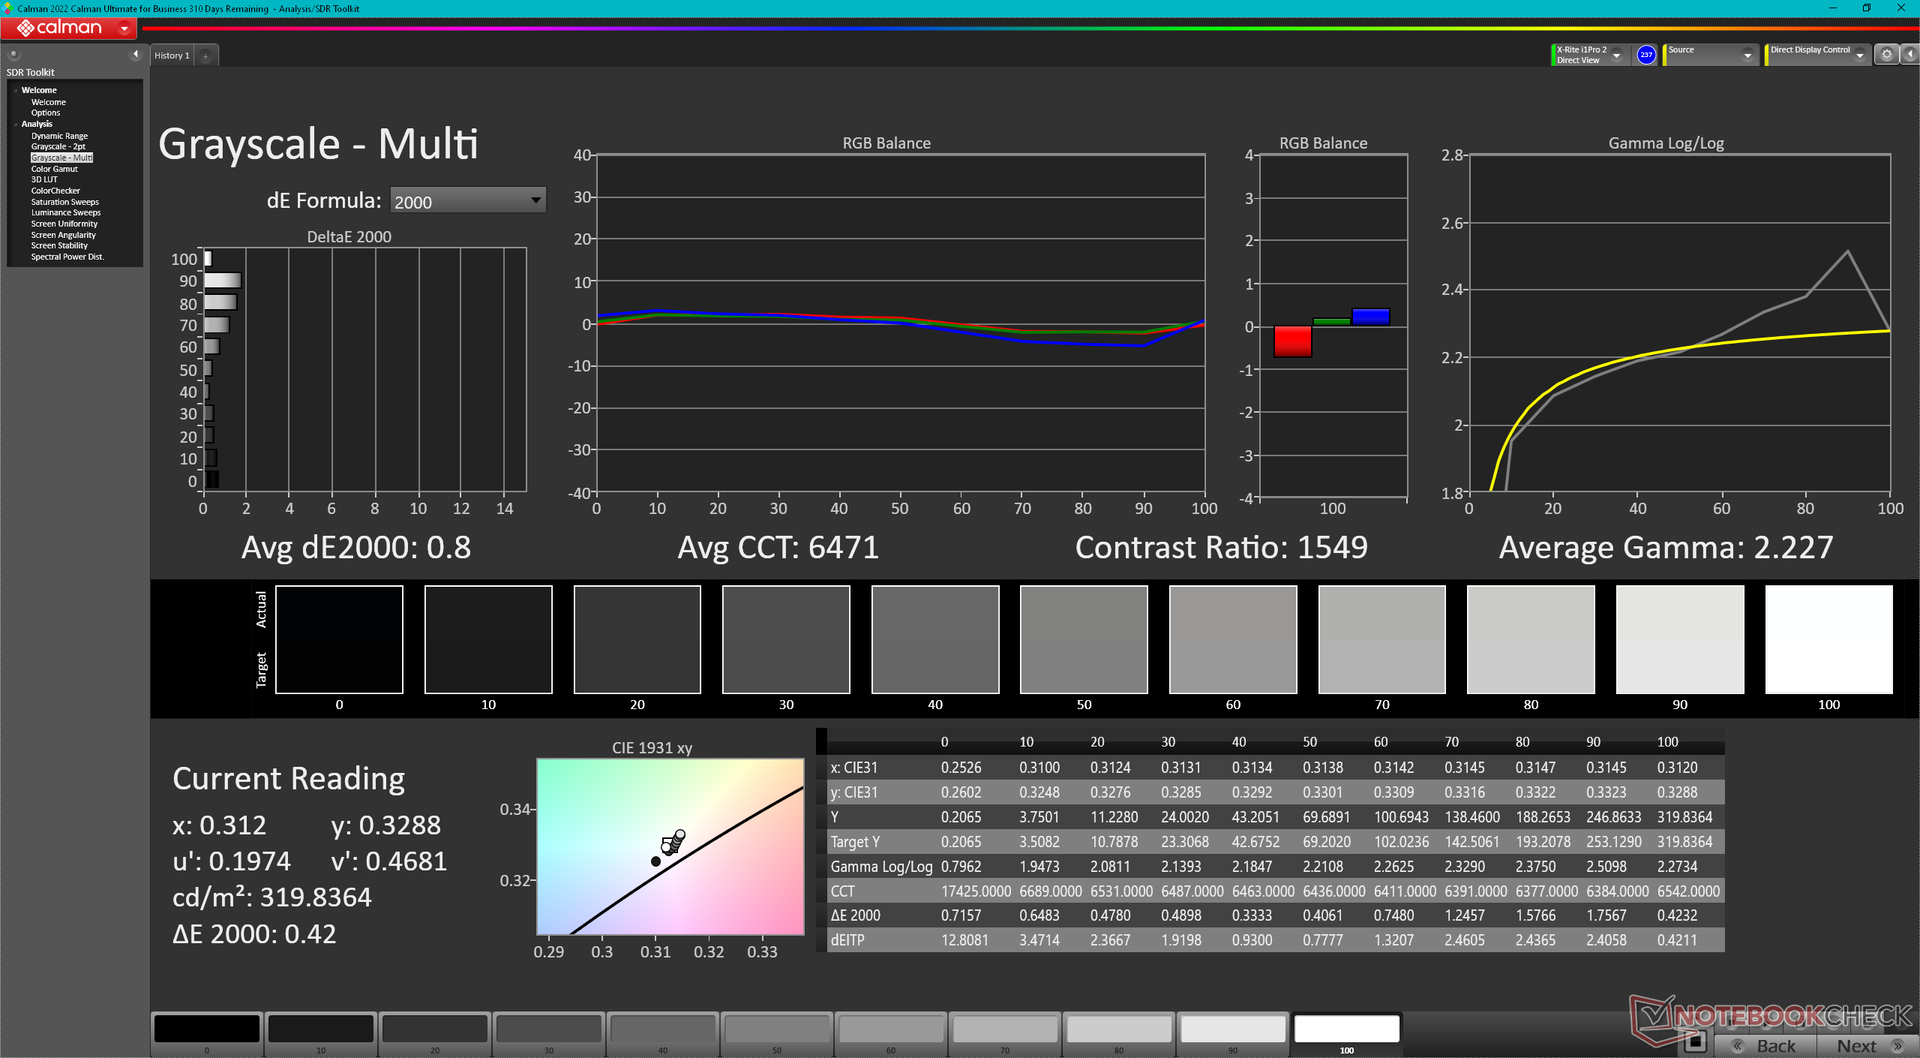
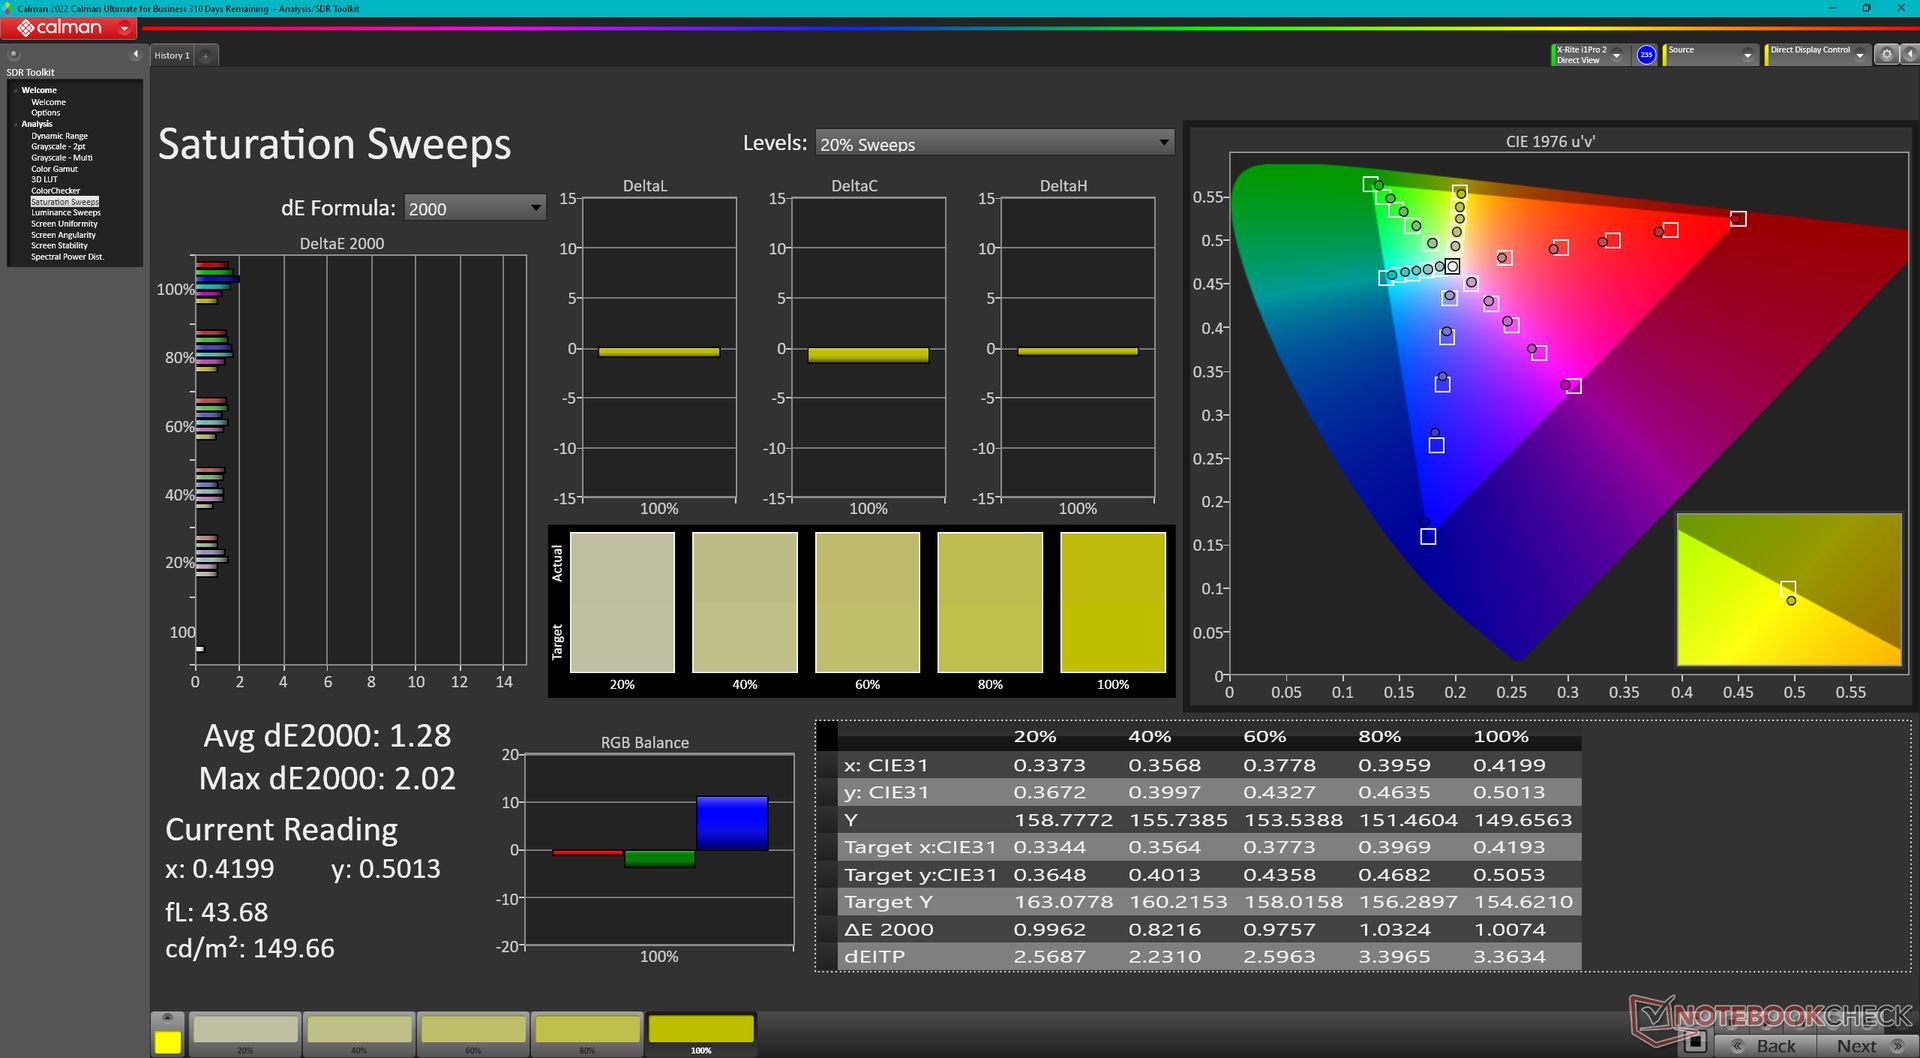
Curieusement, le modèle est calibré en fonction du spectre sRGB alors qu'il prend en charge toutes les couleurs DCI-P3. C'est également le cas dans notre configuration Intel-Nvidia.
| |||||||||||||||||||||||||
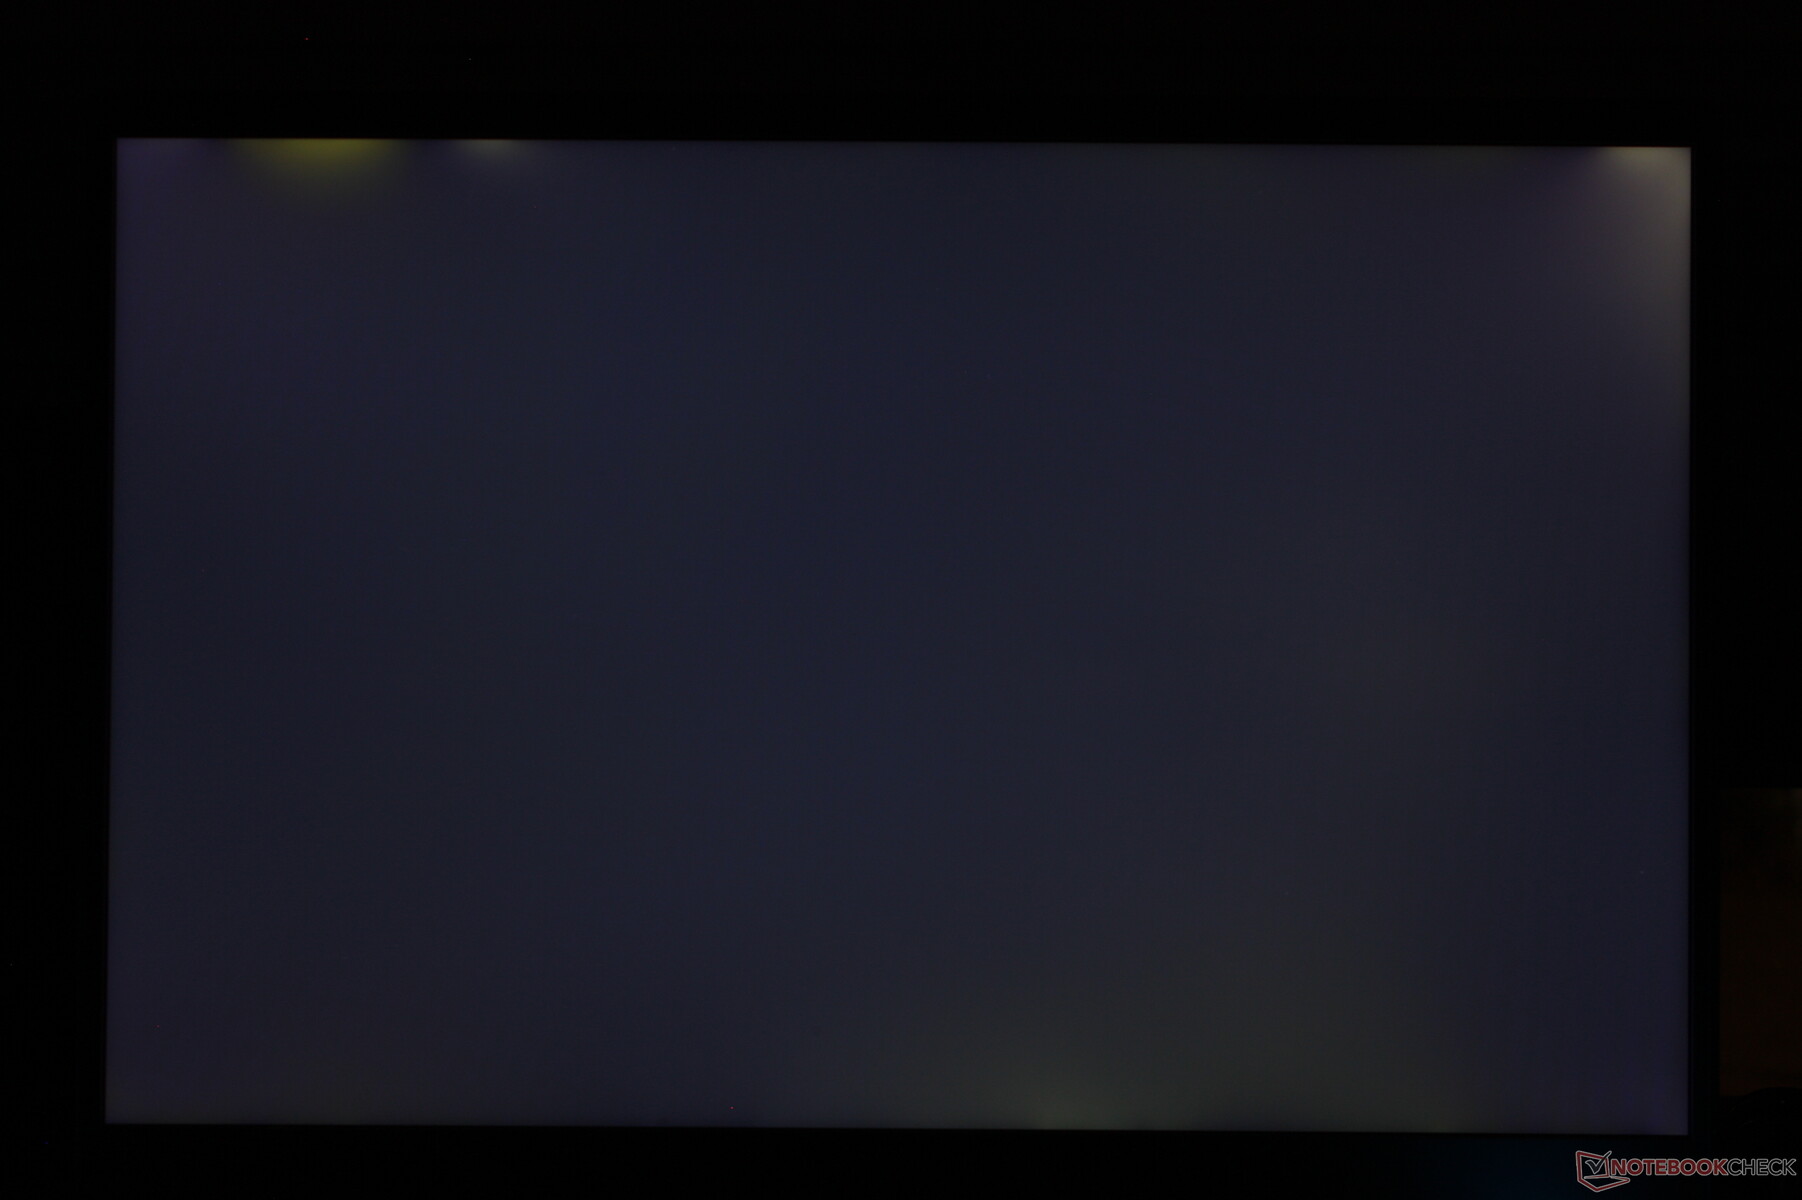
Homogénéité de la luminosité: 87 %
Valeur mesurée au centre, sur batterie: 319.6 cd/m²
Contraste: 1278:1 (Valeurs des noirs: 0.25 cd/m²)
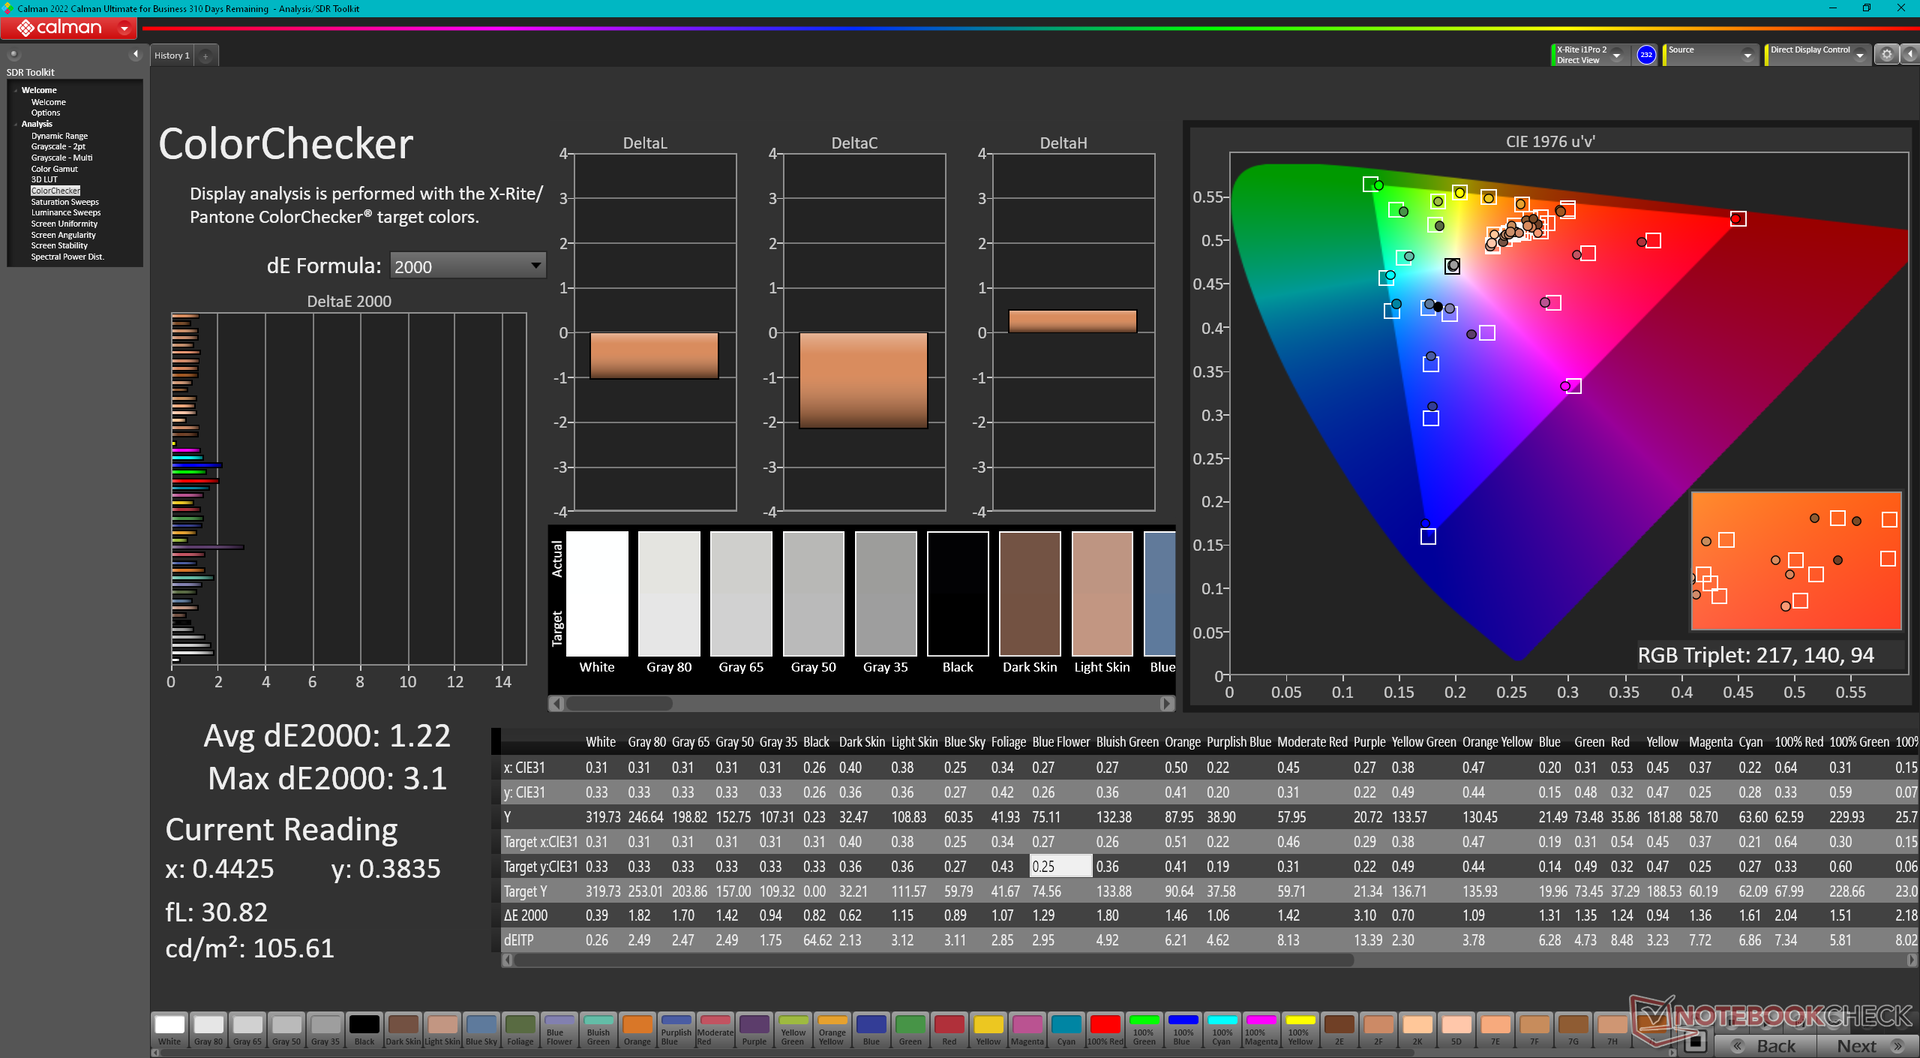
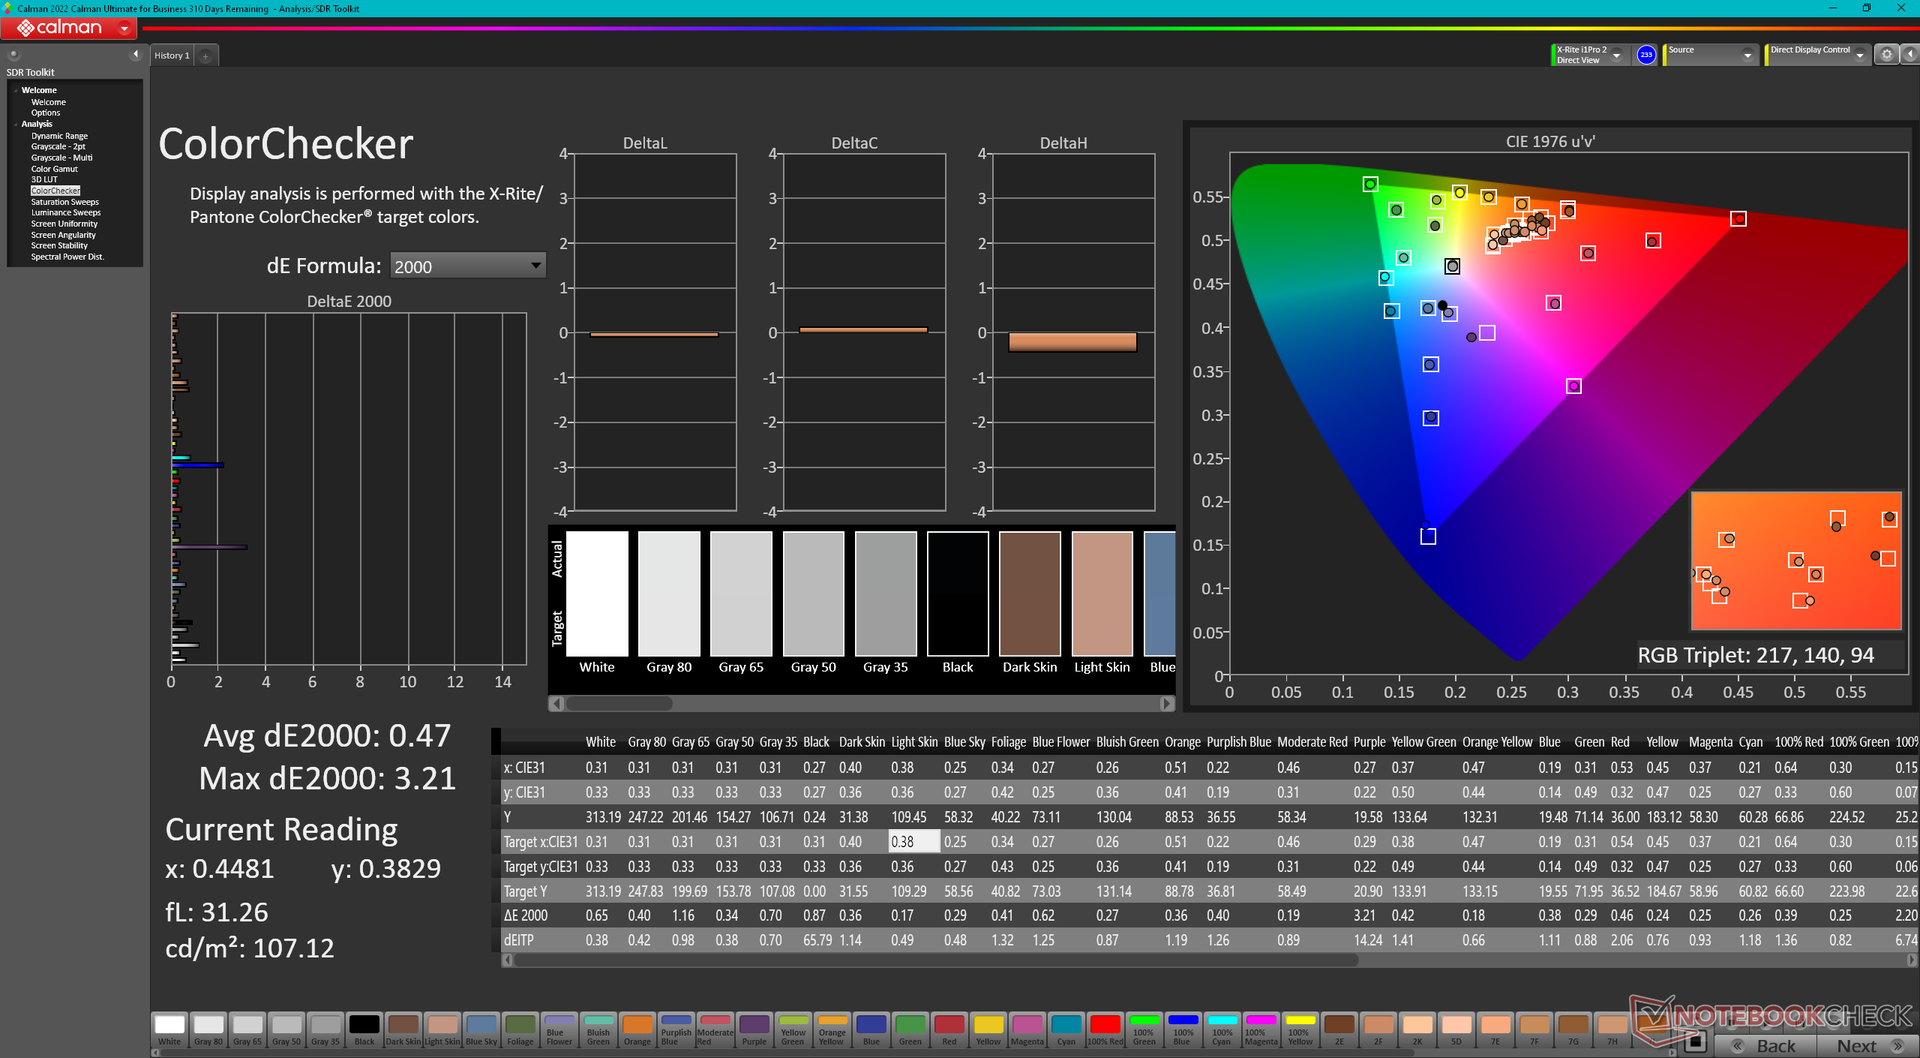
ΔE ColorChecker Calman: 1.22 | ∀{0.5-29.43 Ø4.72}
calibrated: 0.47
ΔE Greyscale Calman: 0.8 | ∀{0.09-98 Ø4.97}
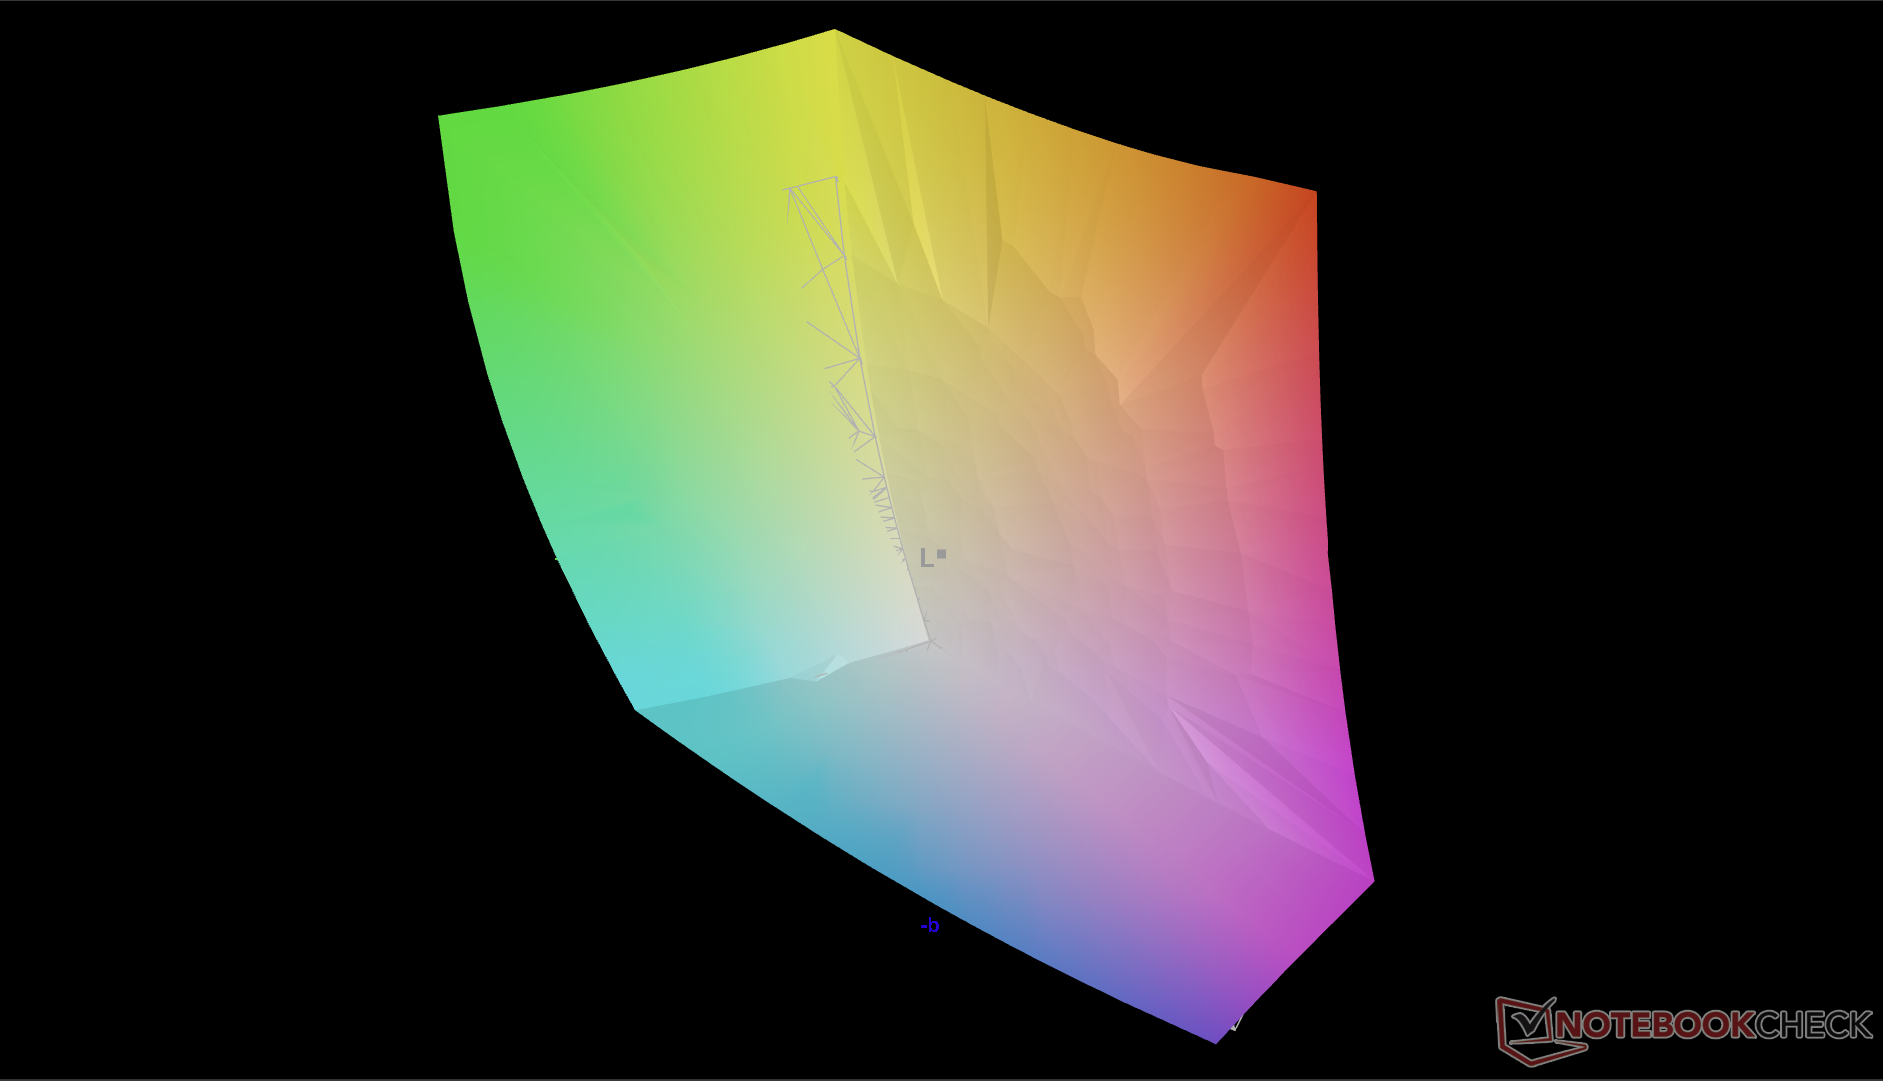
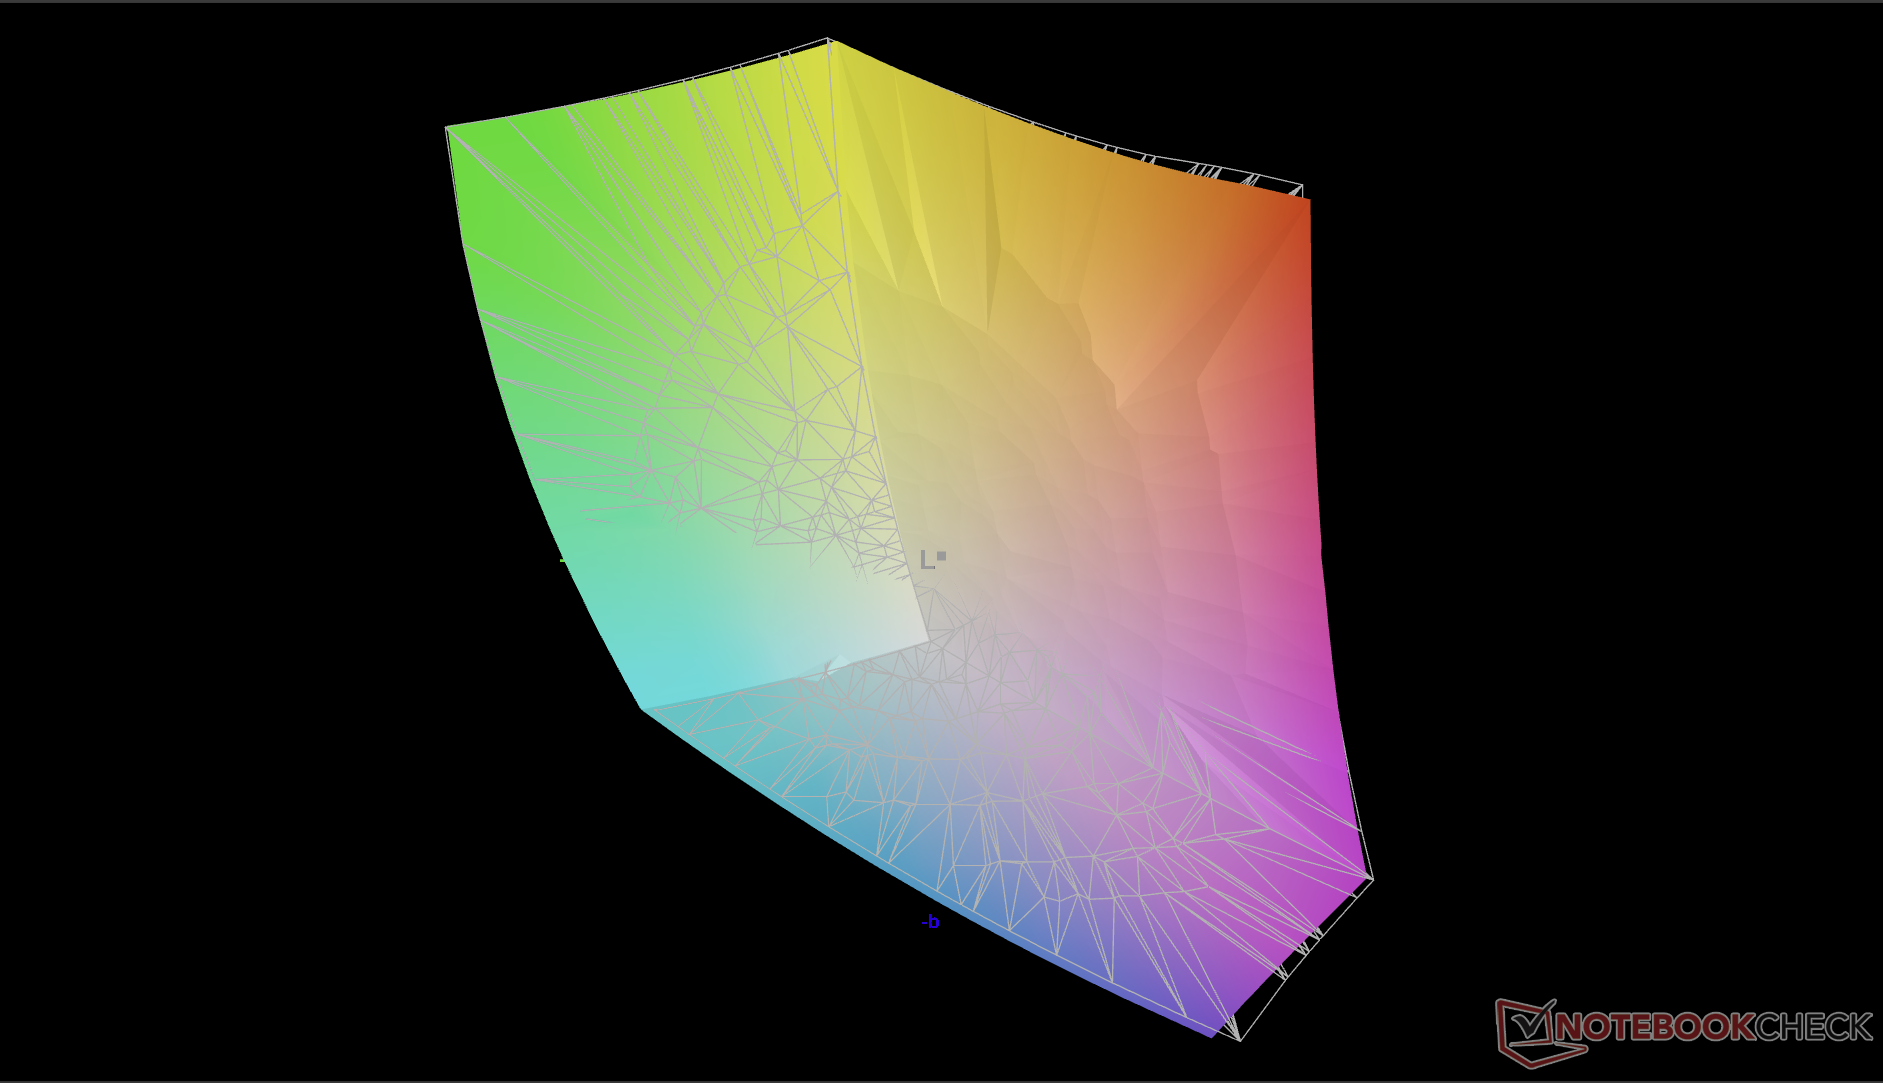
88.7% AdobeRGB 1998 (Argyll 3D)
99.7% sRGB (Argyll 3D)
98.5% Display P3 (Argyll 3D)
Gamma: 2.23
CCT: 6471 K
| Alienware m18 R1 AMD BOE NE18NZ1, IPS, 1920x1200, 18" | Alienware m18 R1 Chi Mei 180JME, IPS, 1920x1200, 18" | Acer Predator Helios 18 N23Q2 AUO45A8 (B180QAN01.2), IPS, 2560x1600, 18" | Razer Blade 18 RTX 4070 AU Optronics B180QAN01.0, IPS, 2560x1600, 18" | Asus ROG Strix Scar 18 2023 G834JY-N6005W NE180QDM-NZ2, IPS, 2560x1600, 18" | MSI GE78HX 13VH-070US AU Optronics B170QAN01.2, IPS, 2560x1600, 17" | |
|---|---|---|---|---|---|---|
| Display | 0% | 1% | -2% | -2% | -1% | |
| Display P3 Coverage (%) | 98.5 | 97.7 -1% | 99.8 1% | 96.9 -2% | 97.2 -1% | 97.6 -1% |
| sRGB Coverage (%) | 99.7 | 100 0% | 100 0% | 99.8 0% | 99.9 0% | 99.9 0% |
| AdobeRGB 1998 Coverage (%) | 88.7 | 89.8 1% | 91.8 3% | 85.3 -4% | 84.9 -4% | 86.5 -2% |
| Response Times | -5% | -128% | -17% | -42% | -9% | |
| Response Time Grey 50% / Grey 80% * (ms) | 2.8 ? | 3 ? -7% | 7.6 ? -171% | 4.2 ? -50% | 5.41 ? -93% | 4.2 ? -50% |
| Response Time Black / White * (ms) | 9.6 ? | 9.9 ? -3% | 17.8 ? -85% | 8 ? 17% | 8.62 ? 10% | 6.4 ? 33% |
| PWM Frequency (Hz) | 2509 | |||||
| Screen | -18% | -130% | -99% | -215% | -145% | |
| Brightness middle (cd/m²) | 319.6 | 372.8 17% | 360 13% | 549.6 72% | 490 53% | 398.6 25% |
| Brightness (cd/m²) | 304 | 367 21% | 355 17% | 524 72% | 468 54% | 384 26% |
| Brightness Distribution (%) | 87 | 97 11% | 92 6% | 89 2% | 86 -1% | 89 2% |
| Black Level * (cd/m²) | 0.25 | 0.32 -28% | 0.21 16% | 0.53 -112% | 0.54 -116% | 0.46 -84% |
| Contrast (:1) | 1278 | 1165 -9% | 1714 34% | 1037 -19% | 907 -29% | 867 -32% |
| Colorchecker dE 2000 * | 1.22 | 1.92 -57% | 3.82 -213% | 3.32 -172% | 4.97 -307% | 4.05 -232% |
| Colorchecker dE 2000 max. * | 3.1 | 3.65 -18% | 7.38 -138% | 6.63 -114% | 11.02 -255% | 8.68 -180% |
| Colorchecker dE 2000 calibrated * | 0.47 | 0.51 -9% | 2.24 -377% | 2.7 -474% | 2.97 -532% | 1.02 -117% |
| Greyscale dE 2000 * | 0.8 | 1.5 -88% | 5.06 -532% | 2 -150% | 7.2 -800% | 6.5 -713% |
| Gamma | 2.23 99% | 2.34 94% | 2.52 87% | 2.29 96% | 2.161 102% | 2.11 104% |
| CCT | 6471 100% | 6607 98% | 5657 115% | 6319 103% | 6515 100% | 7518 86% |
| Moyenne finale (programmes/paramètres) | -8% /
-12% | -86% /
-102% | -39% /
-67% | -86% /
-144% | -52% /
-95% |
* ... Moindre est la valeur, meilleures sont les performances
Les valeurs moyennes du DeltaE sont bien inférieures à 2, ce qui suggère que l'étalonnage par l'utilisateur final ne sera pas nécessaire pour la plupart des utilisateurs.


Temps de réponse de l'écran
| ↔ Temps de réponse noir à blanc | ||
|---|---|---|
| 9.6 ms ... hausse ↗ et chute ↘ combinées | ↗ 4.9 ms hausse | 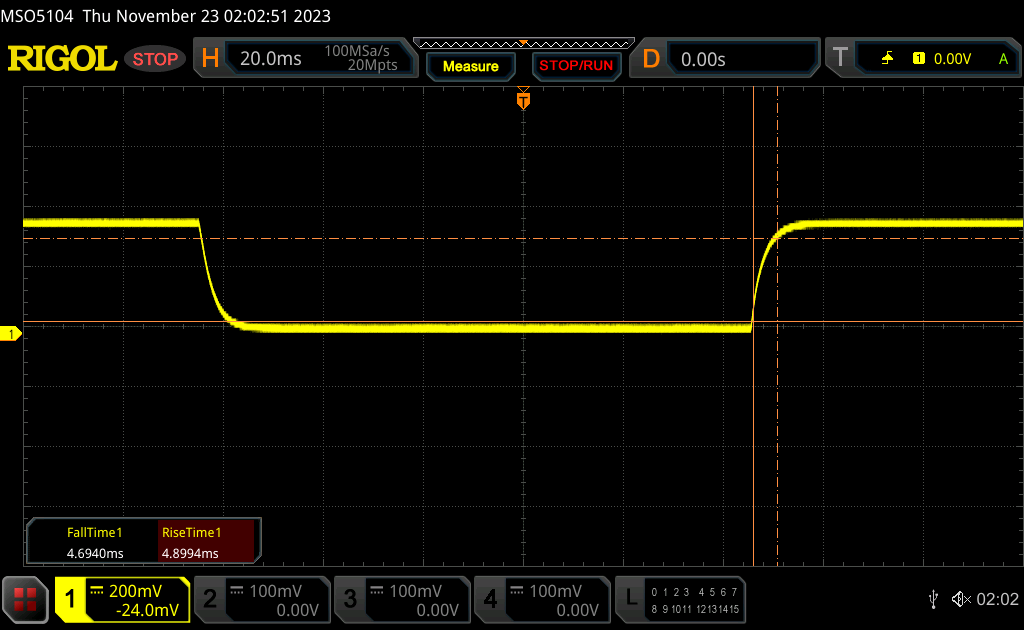 |
| ↘ 4.7 ms chute | ||
| L'écran montre de faibles temps de réponse, un bon écran pour jouer. En comparaison, tous les appareils testés affichent entre 0.1 (minimum) et 240 (maximum) ms. » 26 % des appareils testés affichent de meilleures performances. Cela signifie que les latences relevées sont meilleures que la moyenne (19.8 ms) de tous les appareils testés. | ||
| ↔ Temps de réponse gris 50% à gris 80% | ||
| 2.8 ms ... hausse ↗ et chute ↘ combinées | ↗ 1.2 ms hausse | 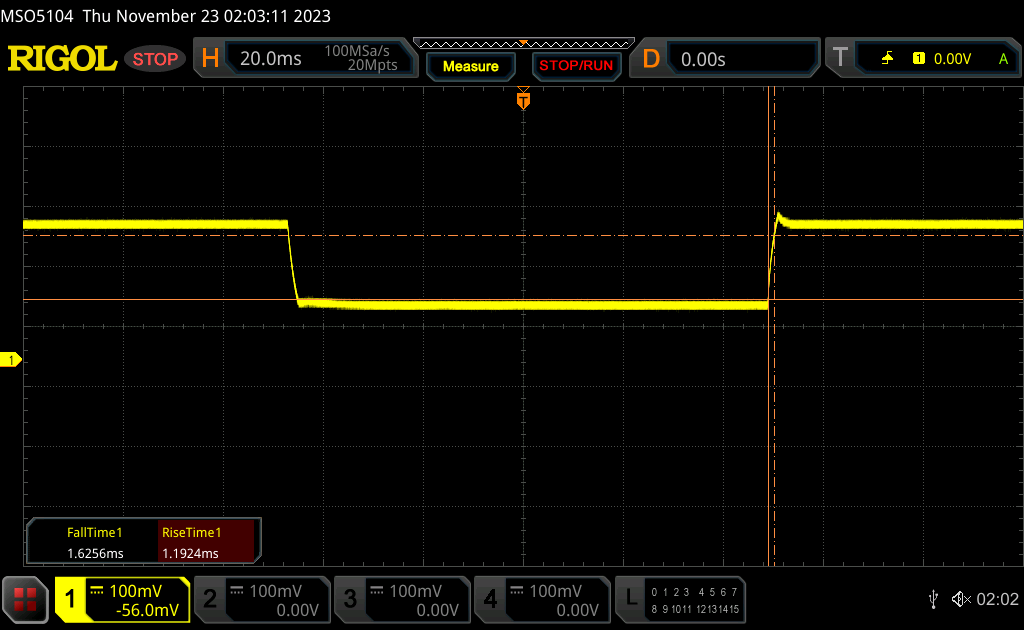 |
| ↘ 1.6 ms chute | ||
| L'écran montre de très faibles temps de réponse, parfait pour le jeu. En comparaison, tous les appareils testés affichent entre 0.165 (minimum) et 636 (maximum) ms. » 12 % des appareils testés affichent de meilleures performances. Cela signifie que les latences relevées sont meilleures que la moyenne (31 ms) de tous les appareils testés. | ||
Scintillement / MLI (Modulation de largeur d'impulsion)
| Scintillement / MLI (Modulation de largeur d'impulsion) non décelé | 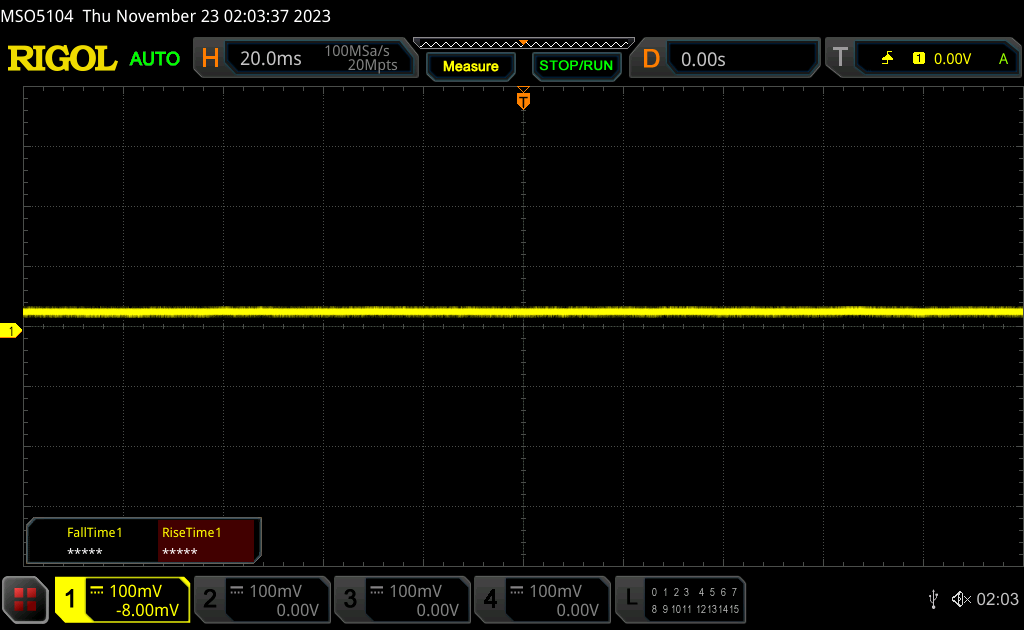 | ||
En comparaison, 52 % des appareils testés n'emploient pas MDI pour assombrir leur écran. Nous avons relevé une moyenne à 7781 (minimum : 5 - maximum : 343500) Hz dans le cas où une MDI était active. | |||
Performance
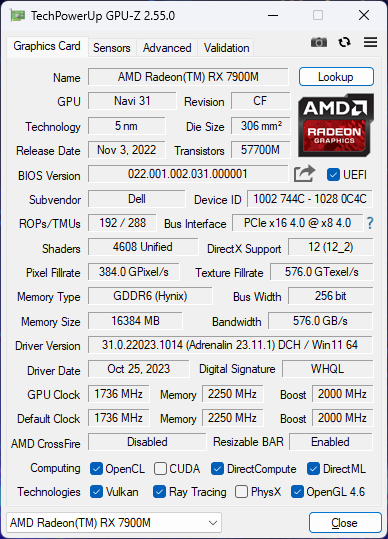
Conditions d'essai
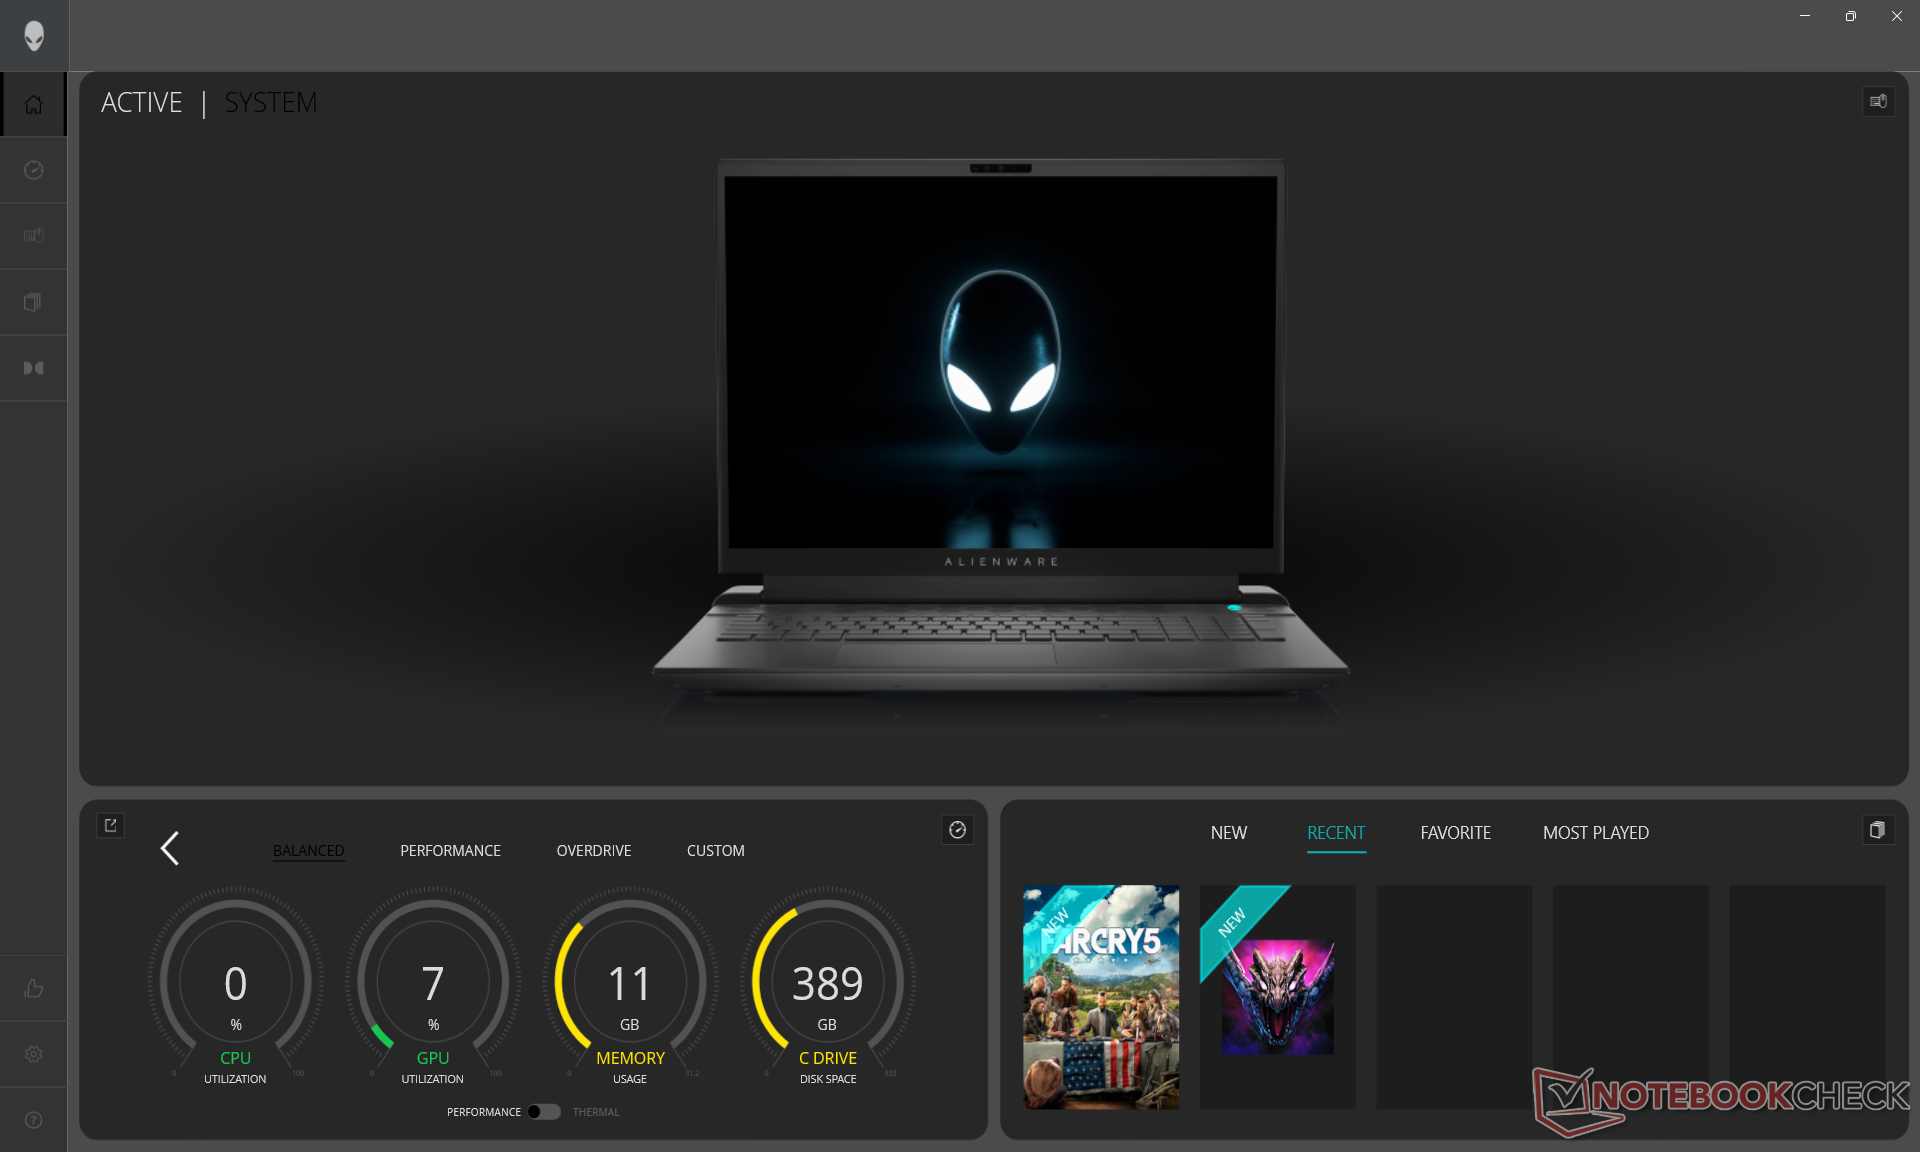
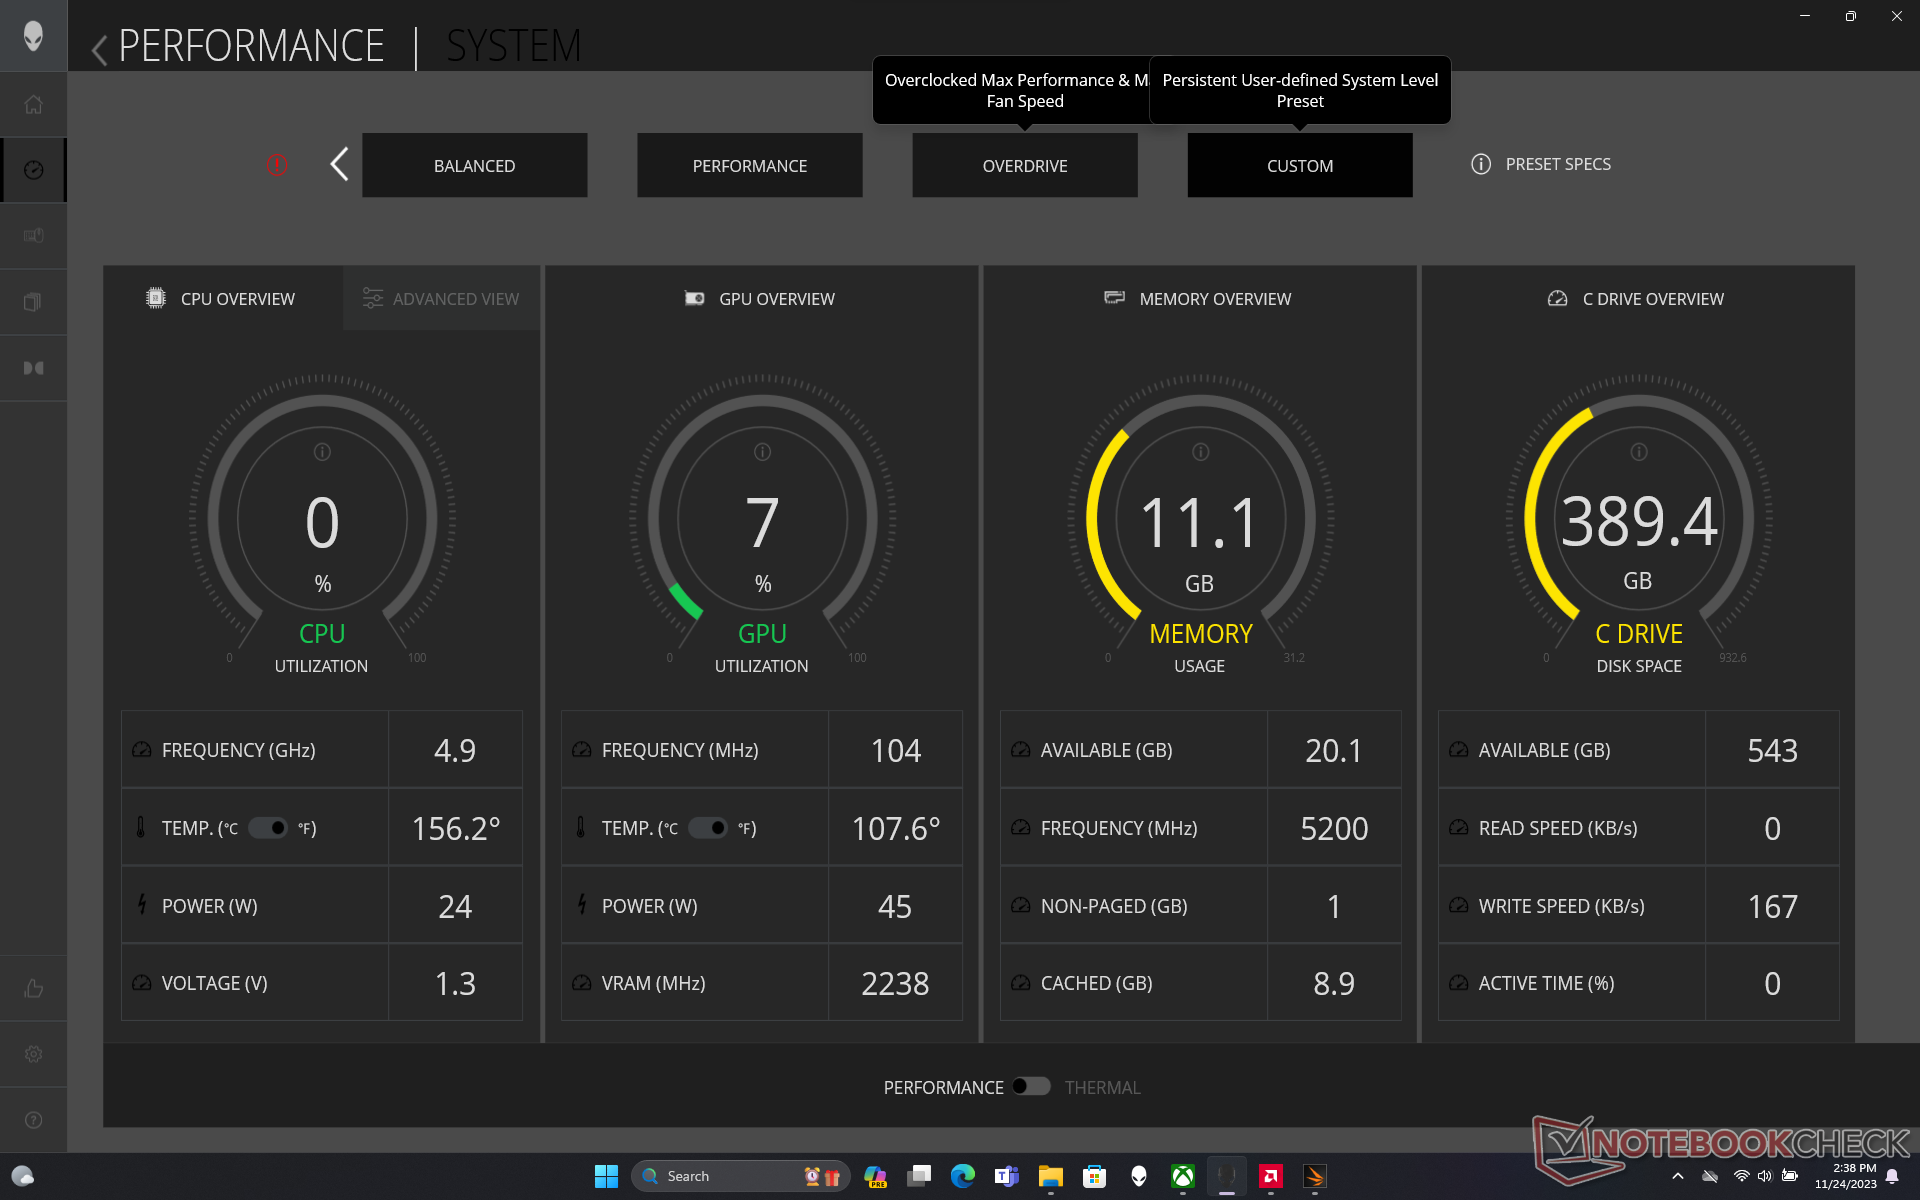
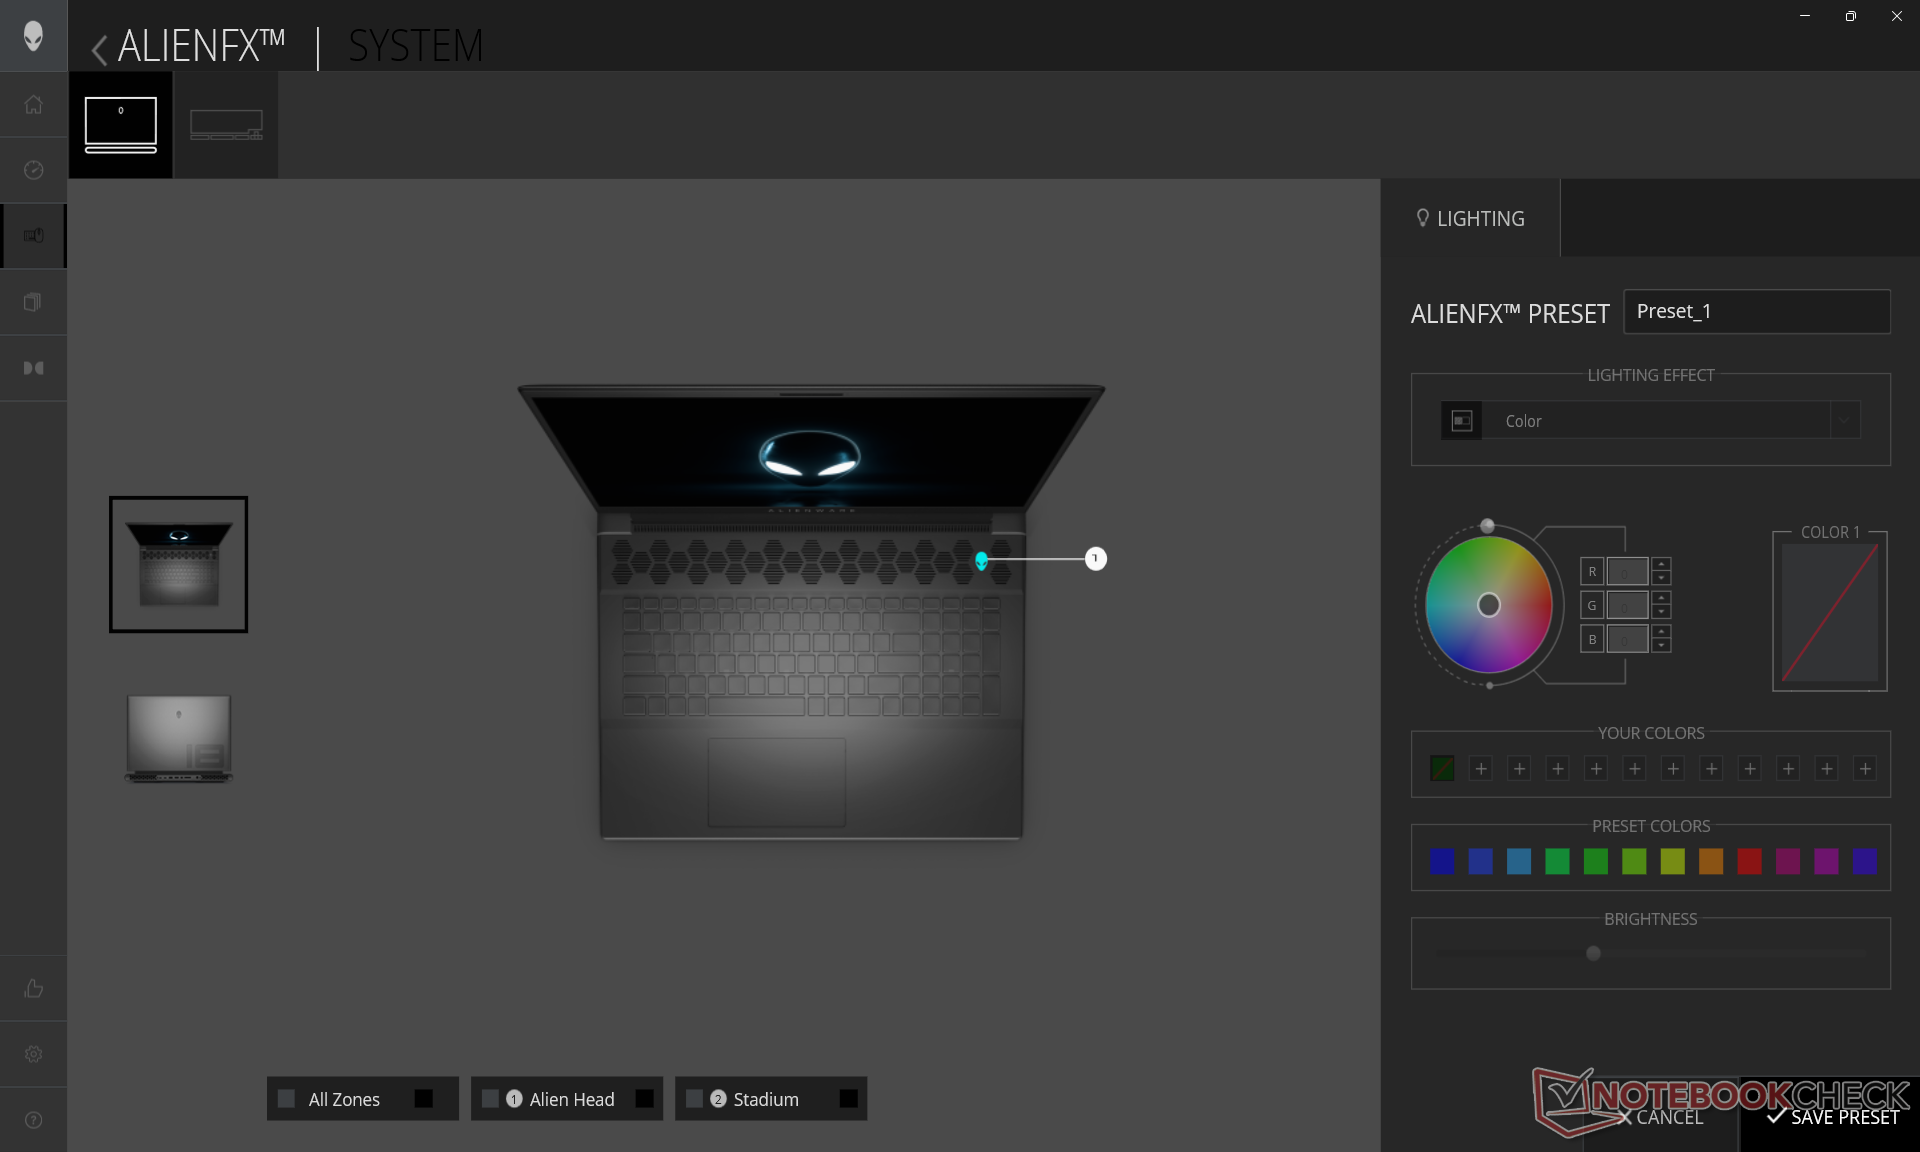
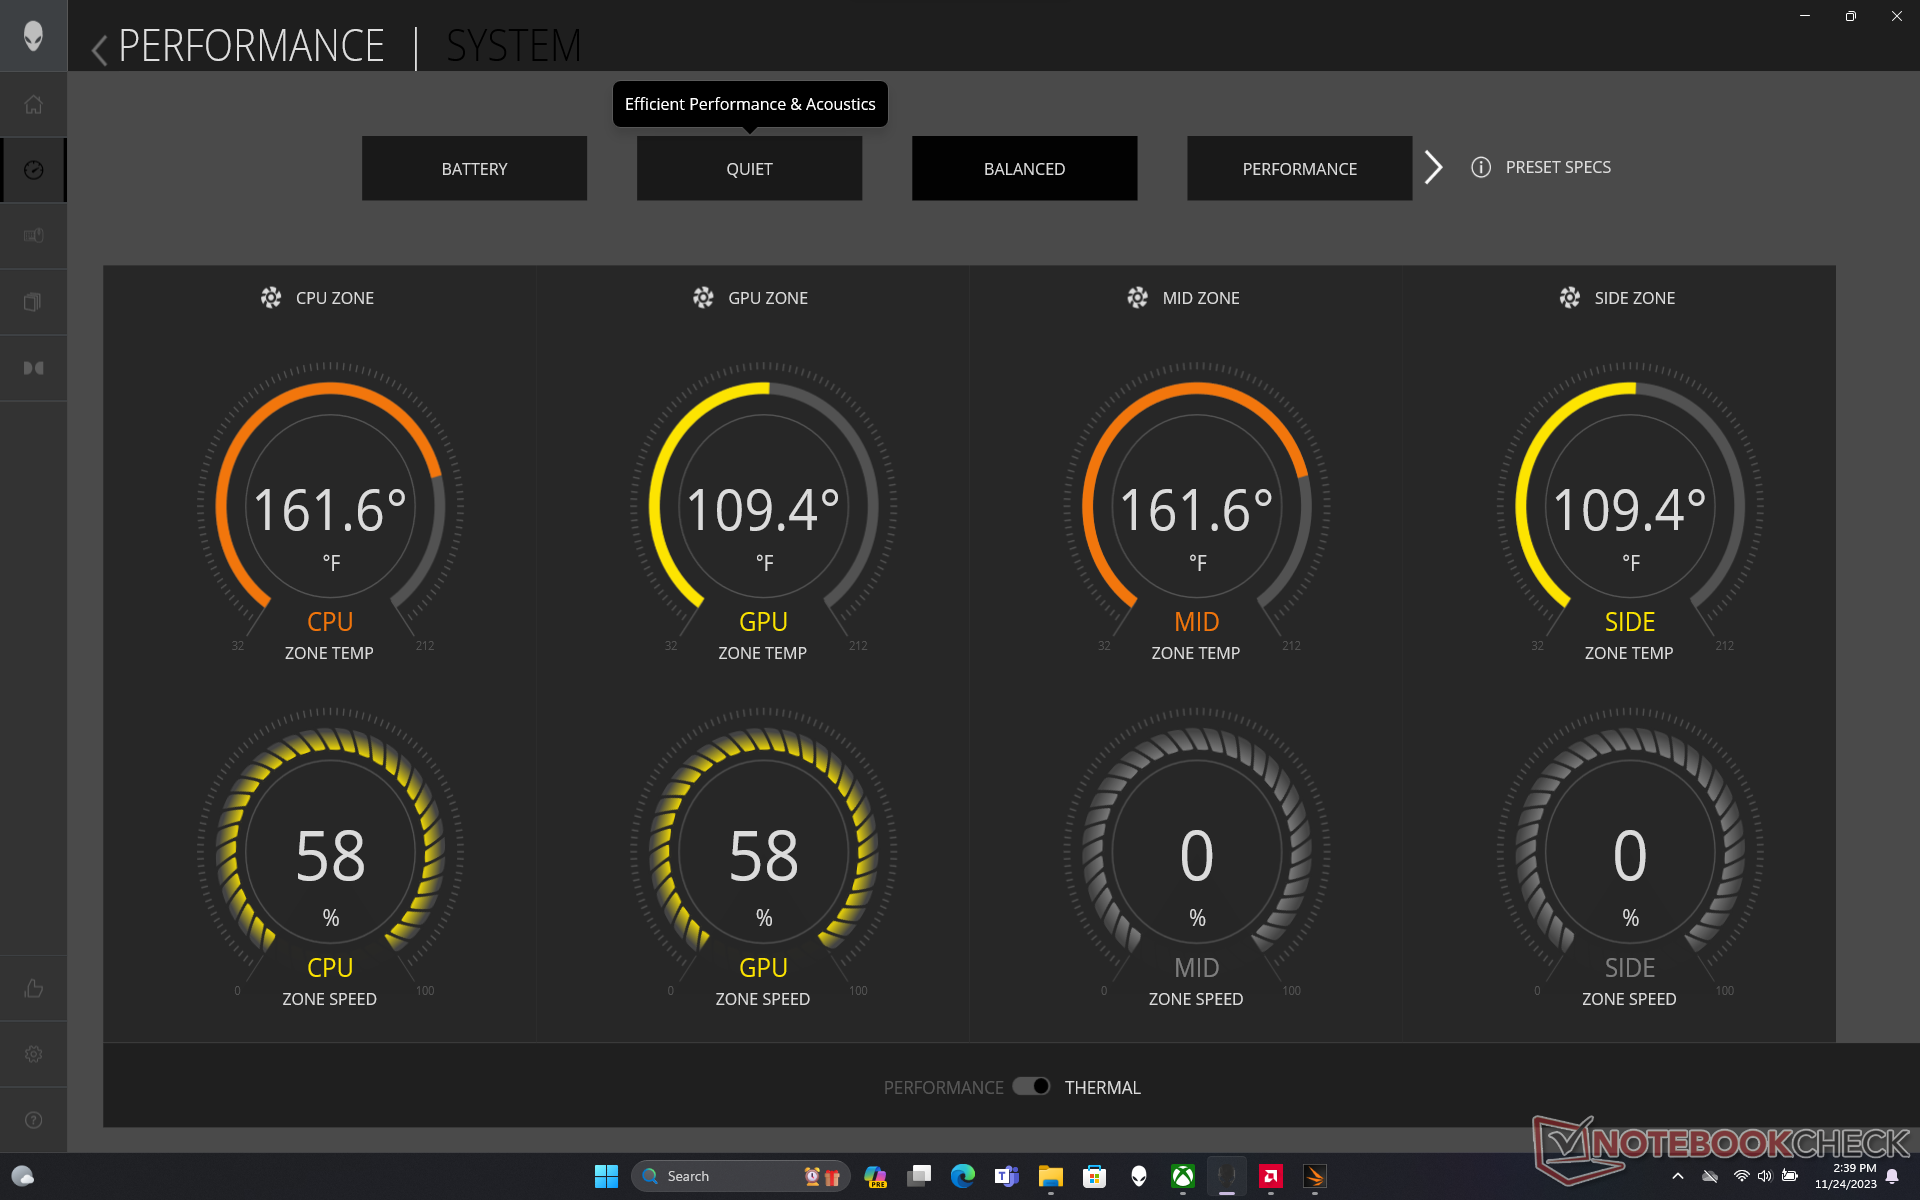
Nous avons réglé Alienware Command Center sur le mode Overdrive avant de lancer les benchmarks ci-dessous. Il est essentiel de se familiariser avec le Command Center pour contrôler les fonctions spécifiques de l'ordinateur portable, notamment l'éclairage RVB, les profils d'alimentation et les profils spécifiques aux jeux.
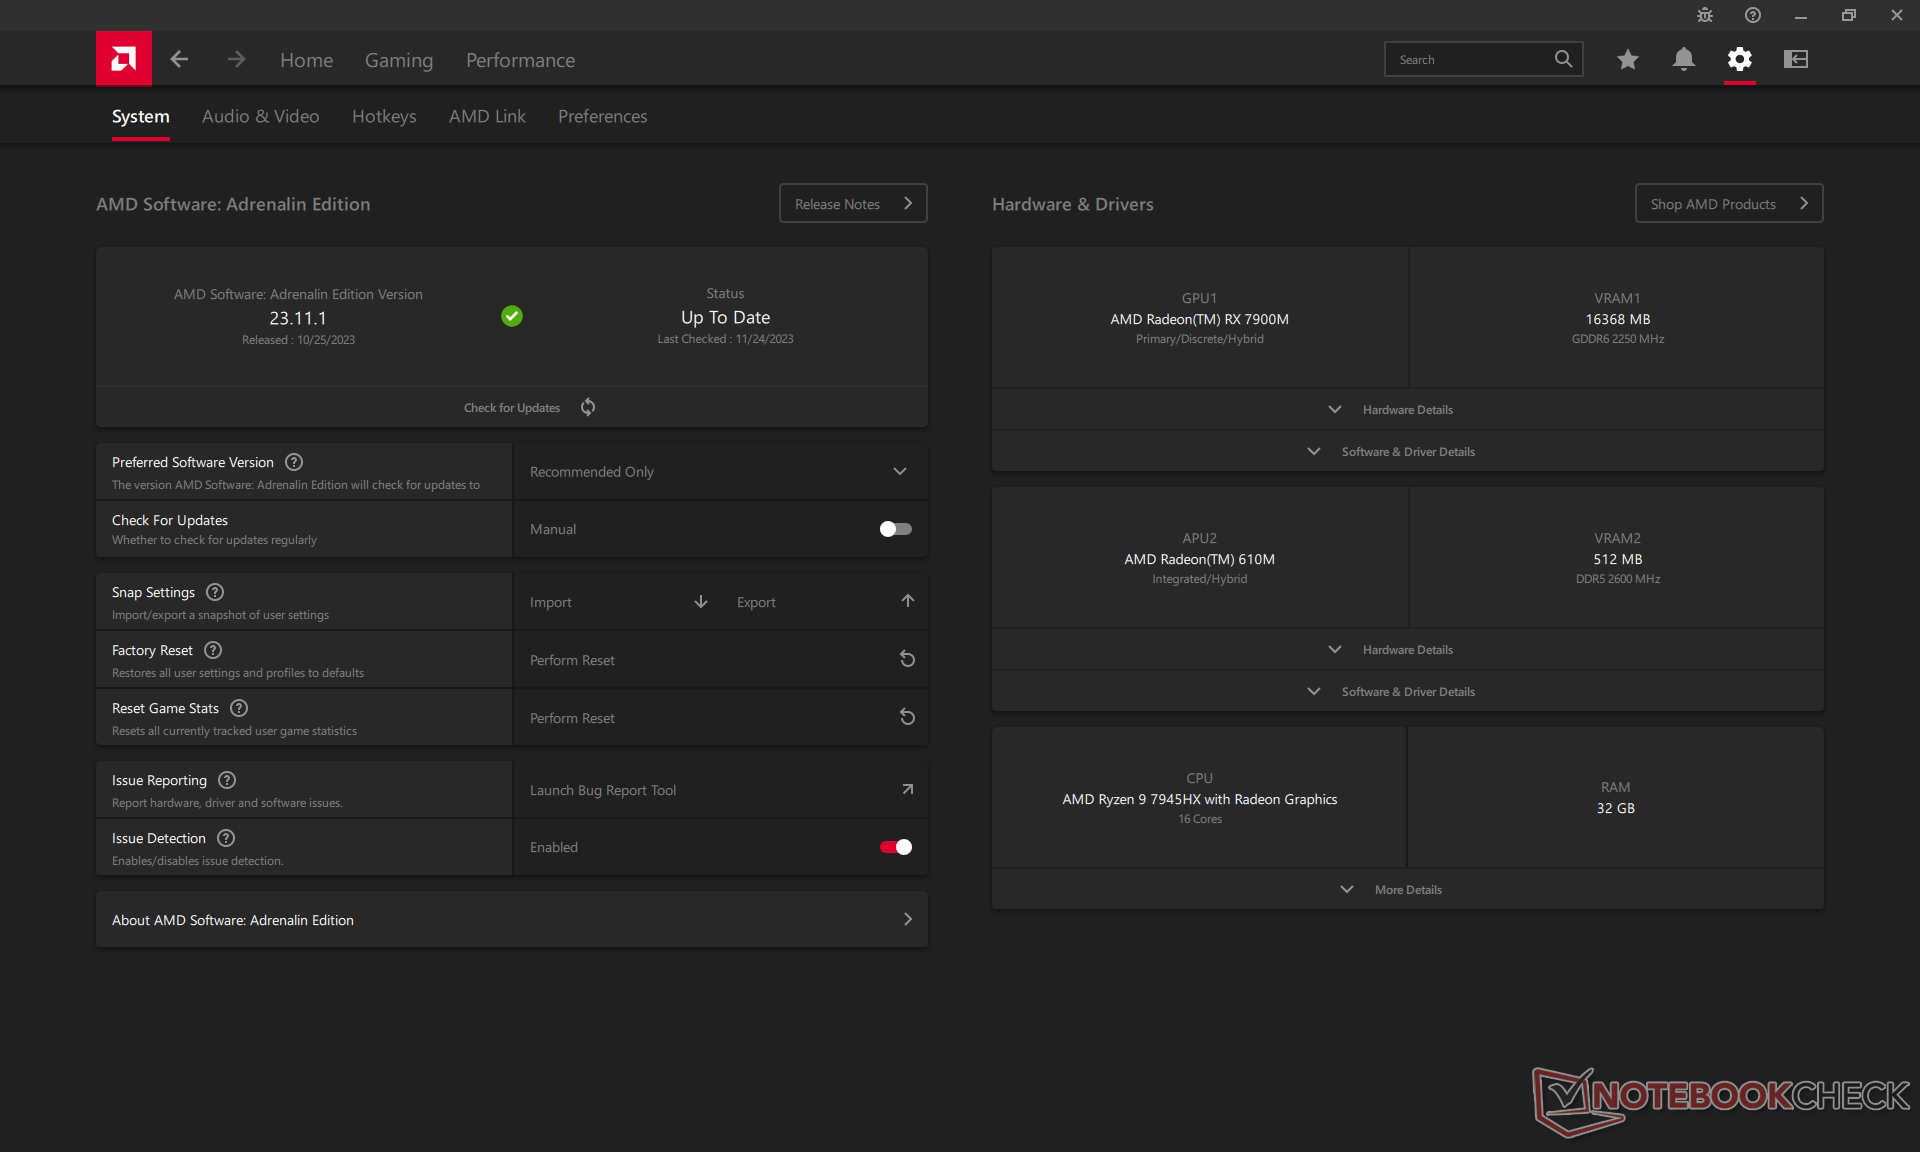
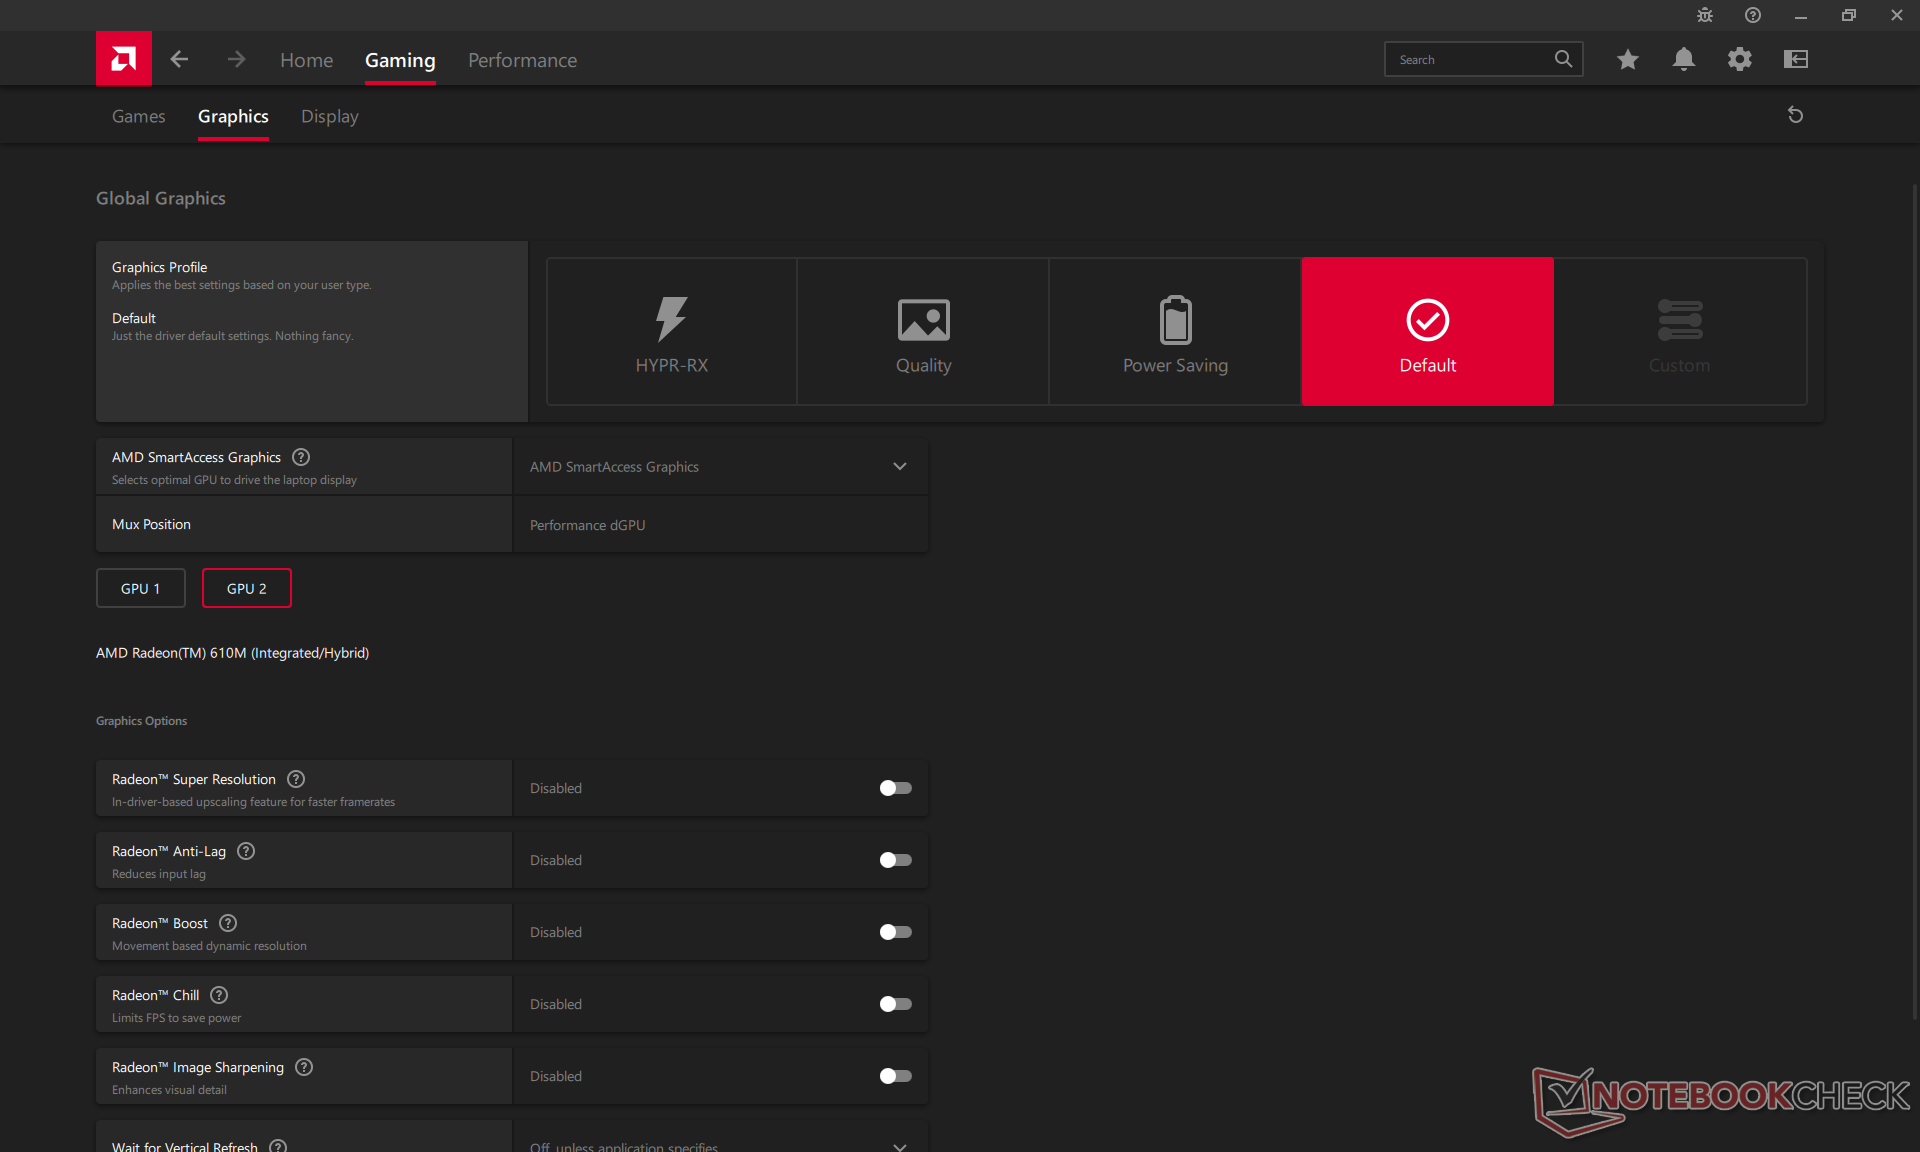
Il est également recommandé de télécharger AMD Adrenalin pour obtenir les derniers pilotes GPU et pour activer/désactiver toutes les fonctionnalités du GPU.
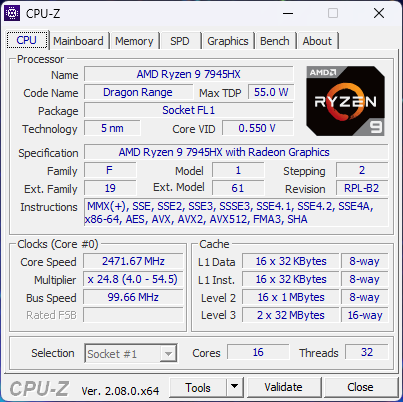
Processeur
Les performances du processeur sont une affaire classique entre AMD et Intel Ryzen 9 7945HX offre des performances multithread brutes de 5 à 10 % supérieures à celles du processeur concurrentCore i9-13980HX concurrent, tout en étant 5 à 10 % plus lent en termes de performances monothread. Il est pratiquement au même niveau que le récent Core i9-13980HX Ryzen 9 7945HX3D pour être l'un des processeurs mobiles les plus rapides disponibles. Si vous passez au processeur Ryzen 9 7845HX ou Ryzen 7 7745HX devrait réduire les performances du processeur d'environ 20 à 25 % et 40 à 50 %, respectivement.
La durabilité des performances est excellente, comme en témoignent les scores constants obtenus lors de l'exécution en boucle de CineBench R15 xT.
Cinebench R15 Multi Loop
Cinebench R23: Multi Core | Single Core
Cinebench R20: CPU (Multi Core) | CPU (Single Core)
Cinebench R15: CPU Multi 64Bit | CPU Single 64Bit
Blender: v2.79 BMW27 CPU
7-Zip 18.03: 7z b 4 | 7z b 4 -mmt1
Geekbench 5.5: Multi-Core | Single-Core
HWBOT x265 Benchmark v2.2: 4k Preset
LibreOffice : 20 Documents To PDF
R Benchmark 2.5: Overall mean
* ... Moindre est la valeur, meilleures sont les performances
AIDA64: FP32 Ray-Trace | FPU Julia | CPU SHA3 | CPU Queen | FPU SinJulia | FPU Mandel | CPU AES | CPU ZLib | FP64 Ray-Trace | CPU PhotoWorxx
| Performance rating | |
| Alienware m18 R1 AMD | |
| Moyenne AMD Ryzen 9 7945HX | |
| Acer Predator Helios 18 N23Q2 | |
| Alienware m18 R1 | |
| MSI GE78HX 13VH-070US | |
| Asus ROG Strix Scar 18 2023 G834JY-N6005W | |
| Razer Blade 18 RTX 4070 | |
| AIDA64 / FP32 Ray-Trace | |
| Alienware m18 R1 AMD | |
| Moyenne AMD Ryzen 9 7945HX (50388 - 60169, n=7) | |
| Alienware m18 R1 | |
| Asus ROG Strix Scar 18 2023 G834JY-N6005W | |
| MSI GE78HX 13VH-070US | |
| Acer Predator Helios 18 N23Q2 | |
| Razer Blade 18 RTX 4070 | |
| AIDA64 / FPU Julia | |
| Alienware m18 R1 AMD | |
| Moyenne AMD Ryzen 9 7945HX (201874 - 252486, n=7) | |
| Alienware m18 R1 | |
| MSI GE78HX 13VH-070US | |
| Asus ROG Strix Scar 18 2023 G834JY-N6005W | |
| Acer Predator Helios 18 N23Q2 | |
| Razer Blade 18 RTX 4070 | |
| AIDA64 / CPU SHA3 | |
| Alienware m18 R1 AMD | |
| Moyenne AMD Ryzen 9 7945HX (8525 - 10389, n=7) | |
| Alienware m18 R1 | |
| Asus ROG Strix Scar 18 2023 G834JY-N6005W | |
| MSI GE78HX 13VH-070US | |
| Acer Predator Helios 18 N23Q2 | |
| Razer Blade 18 RTX 4070 | |
| AIDA64 / CPU Queen | |
| Alienware m18 R1 AMD | |
| Moyenne AMD Ryzen 9 7945HX (175041 - 200651, n=7) | |
| Alienware m18 R1 | |
| Asus ROG Strix Scar 18 2023 G834JY-N6005W | |
| MSI GE78HX 13VH-070US | |
| Razer Blade 18 RTX 4070 | |
| Acer Predator Helios 18 N23Q2 | |
| AIDA64 / FPU SinJulia | |
| Alienware m18 R1 AMD | |
| Moyenne AMD Ryzen 9 7945HX (28794 - 32988, n=7) | |
| Asus ROG Strix Scar 18 2023 G834JY-N6005W | |
| MSI GE78HX 13VH-070US | |
| Alienware m18 R1 | |
| Razer Blade 18 RTX 4070 | |
| Acer Predator Helios 18 N23Q2 | |
| AIDA64 / FPU Mandel | |
| Alienware m18 R1 AMD | |
| Moyenne AMD Ryzen 9 7945HX (105740 - 134044, n=7) | |
| Alienware m18 R1 | |
| Asus ROG Strix Scar 18 2023 G834JY-N6005W | |
| MSI GE78HX 13VH-070US | |
| Acer Predator Helios 18 N23Q2 | |
| Razer Blade 18 RTX 4070 | |
| AIDA64 / CPU AES | |
| Acer Predator Helios 18 N23Q2 | |
| Moyenne AMD Ryzen 9 7945HX (126790 - 325960, n=7) | |
| Alienware m18 R1 AMD | |
| Alienware m18 R1 | |
| MSI GE78HX 13VH-070US | |
| Asus ROG Strix Scar 18 2023 G834JY-N6005W | |
| Razer Blade 18 RTX 4070 | |
| AIDA64 / CPU ZLib | |
| Alienware m18 R1 AMD | |
| Moyenne AMD Ryzen 9 7945HX (2022 - 2409, n=7) | |
| MSI GE78HX 13VH-070US | |
| Asus ROG Strix Scar 18 2023 G834JY-N6005W | |
| Alienware m18 R1 | |
| Acer Predator Helios 18 N23Q2 | |
| Razer Blade 18 RTX 4070 | |
| AIDA64 / FP64 Ray-Trace | |
| Alienware m18 R1 AMD | |
| Moyenne AMD Ryzen 9 7945HX (26875 - 31796, n=7) | |
| Alienware m18 R1 | |
| Asus ROG Strix Scar 18 2023 G834JY-N6005W | |
| MSI GE78HX 13VH-070US | |
| Acer Predator Helios 18 N23Q2 | |
| Razer Blade 18 RTX 4070 | |
| AIDA64 / CPU PhotoWorxx | |
| Alienware m18 R1 | |
| Acer Predator Helios 18 N23Q2 | |
| MSI GE78HX 13VH-070US | |
| Razer Blade 18 RTX 4070 | |
| Asus ROG Strix Scar 18 2023 G834JY-N6005W | |
| Moyenne AMD Ryzen 9 7945HX (31421 - 40095, n=7) | |
| Alienware m18 R1 AMD | |
Performance du système
Les résultats de PCMark sont parmi les plus élevés de tous les ordinateurs portables de jeu et placent notre Alienware m18 sur un pied d'égalité avec les alternatives Intel-Nvidia les plus rapides. Malheureusement, l'expérience utilisateur est loin d'être brillante dans la pratique en raison de tous les bugs que nous avons observés. En voici quelques uns :
- L'écran principal s'éteint parfois sans raison et un redémarrage est nécessaire
- Échec du démarrage si un moniteur externe est connecté
- Échec des tests 3DMark Speed Way et Blender Classroom HIP/AMD
- Consommation d'énergie anormalement élevée en mode veille
Ces problèmes se sont produits plusieurs fois, même avec les dernières mises à jour de Windows et les pilotes AMD installés au moment de la rédaction (31.0.22023.1014).
Les performances de la mémoire sont également nettement plus lentes que celles de nombreux ordinateurs portables de jeu à base de processeur Intel. Cela ne semble pas être un hasard non plus puisque notre Asus ROG Strix Scar 17
avec le même CPU Ryzen 9 que notre Alienware a également retourné des chiffres aussi bas.</p>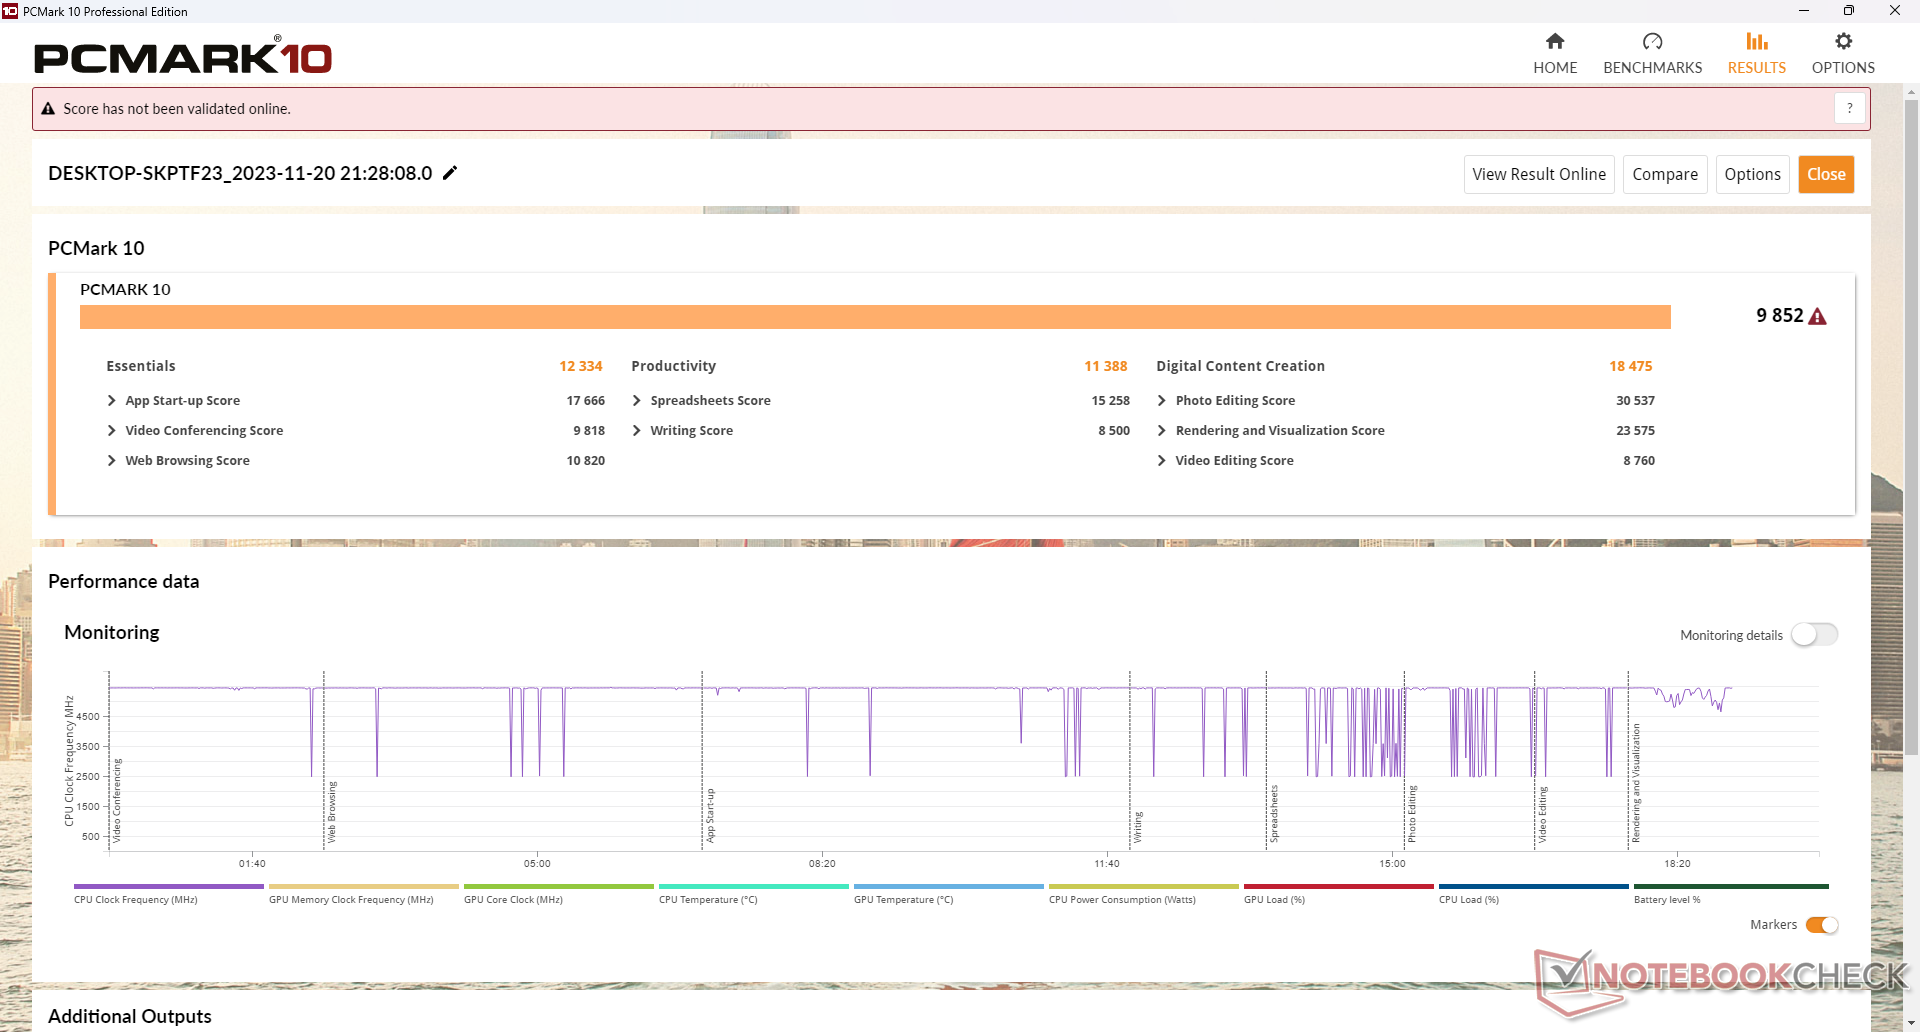
CrossMark: Overall | Productivity | Creativity | Responsiveness
| PCMark 10 / Score | |
| Alienware m18 R1 AMD | |
| Moyenne AMD Ryzen 9 7945HX, AMD Radeon RX 7900M (n=1) | |
| MSI GE78HX 13VH-070US | |
| Asus ROG Strix Scar 18 2023 G834JY-N6005W | |
| Alienware m18 R1 | |
| Acer Predator Helios 18 N23Q2 | |
| Razer Blade 18 RTX 4070 | |
| PCMark 10 / Essentials | |
| Alienware m18 R1 AMD | |
| Moyenne AMD Ryzen 9 7945HX, AMD Radeon RX 7900M (n=1) | |
| Razer Blade 18 RTX 4070 | |
| MSI GE78HX 13VH-070US | |
| Alienware m18 R1 | |
| Acer Predator Helios 18 N23Q2 | |
| PCMark 10 / Productivity | |
| Alienware m18 R1 AMD | |
| Moyenne AMD Ryzen 9 7945HX, AMD Radeon RX 7900M (n=1) | |
| Acer Predator Helios 18 N23Q2 | |
| MSI GE78HX 13VH-070US | |
| Alienware m18 R1 | |
| Razer Blade 18 RTX 4070 | |
| PCMark 10 / Digital Content Creation | |
| Alienware m18 R1 AMD | |
| Moyenne AMD Ryzen 9 7945HX, AMD Radeon RX 7900M (n=1) | |
| Alienware m18 R1 | |
| MSI GE78HX 13VH-070US | |
| Acer Predator Helios 18 N23Q2 | |
| Razer Blade 18 RTX 4070 | |
| CrossMark / Overall | |
| Acer Predator Helios 18 N23Q2 | |
| Alienware m18 R1 | |
| Razer Blade 18 RTX 4070 | |
| Asus ROG Strix Scar 18 2023 G834JY-N6005W | |
| Alienware m18 R1 AMD | |
| Moyenne AMD Ryzen 9 7945HX, AMD Radeon RX 7900M (n=1) | |
| MSI GE78HX 13VH-070US | |
| CrossMark / Productivity | |
| Acer Predator Helios 18 N23Q2 | |
| Alienware m18 R1 | |
| Razer Blade 18 RTX 4070 | |
| Asus ROG Strix Scar 18 2023 G834JY-N6005W | |
| MSI GE78HX 13VH-070US | |
| Alienware m18 R1 AMD | |
| Moyenne AMD Ryzen 9 7945HX, AMD Radeon RX 7900M (n=1) | |
| CrossMark / Creativity | |
| Alienware m18 R1 | |
| Asus ROG Strix Scar 18 2023 G834JY-N6005W | |
| Acer Predator Helios 18 N23Q2 | |
| Razer Blade 18 RTX 4070 | |
| Alienware m18 R1 AMD | |
| Moyenne AMD Ryzen 9 7945HX, AMD Radeon RX 7900M (n=1) | |
| MSI GE78HX 13VH-070US | |
| CrossMark / Responsiveness | |
| Acer Predator Helios 18 N23Q2 | |
| Alienware m18 R1 | |
| Razer Blade 18 RTX 4070 | |
| MSI GE78HX 13VH-070US | |
| Asus ROG Strix Scar 18 2023 G834JY-N6005W | |
| Alienware m18 R1 AMD | |
| Moyenne AMD Ryzen 9 7945HX, AMD Radeon RX 7900M (n=1) | |
| PCMark 10 Score | 9852 points | |
Aide | ||
| AIDA64 / Memory Latency | |
| Alienware m18 R1 AMD | |
| Asus ROG Strix Scar 18 2023 G834JY-N6005W | |
| Asus ROG Strix Scar 17 G733PYV-LL053X | |
| Razer Blade 18 RTX 4070 | |
| MSI GE78HX 13VH-070US | |
| Moyenne AMD Ryzen 9 7945HX (77.1 - 91.3, n=7) | |
| Acer Predator Helios 18 N23Q2 | |
| Alienware m18 R1 | |
* ... Moindre est la valeur, meilleures sont les performances
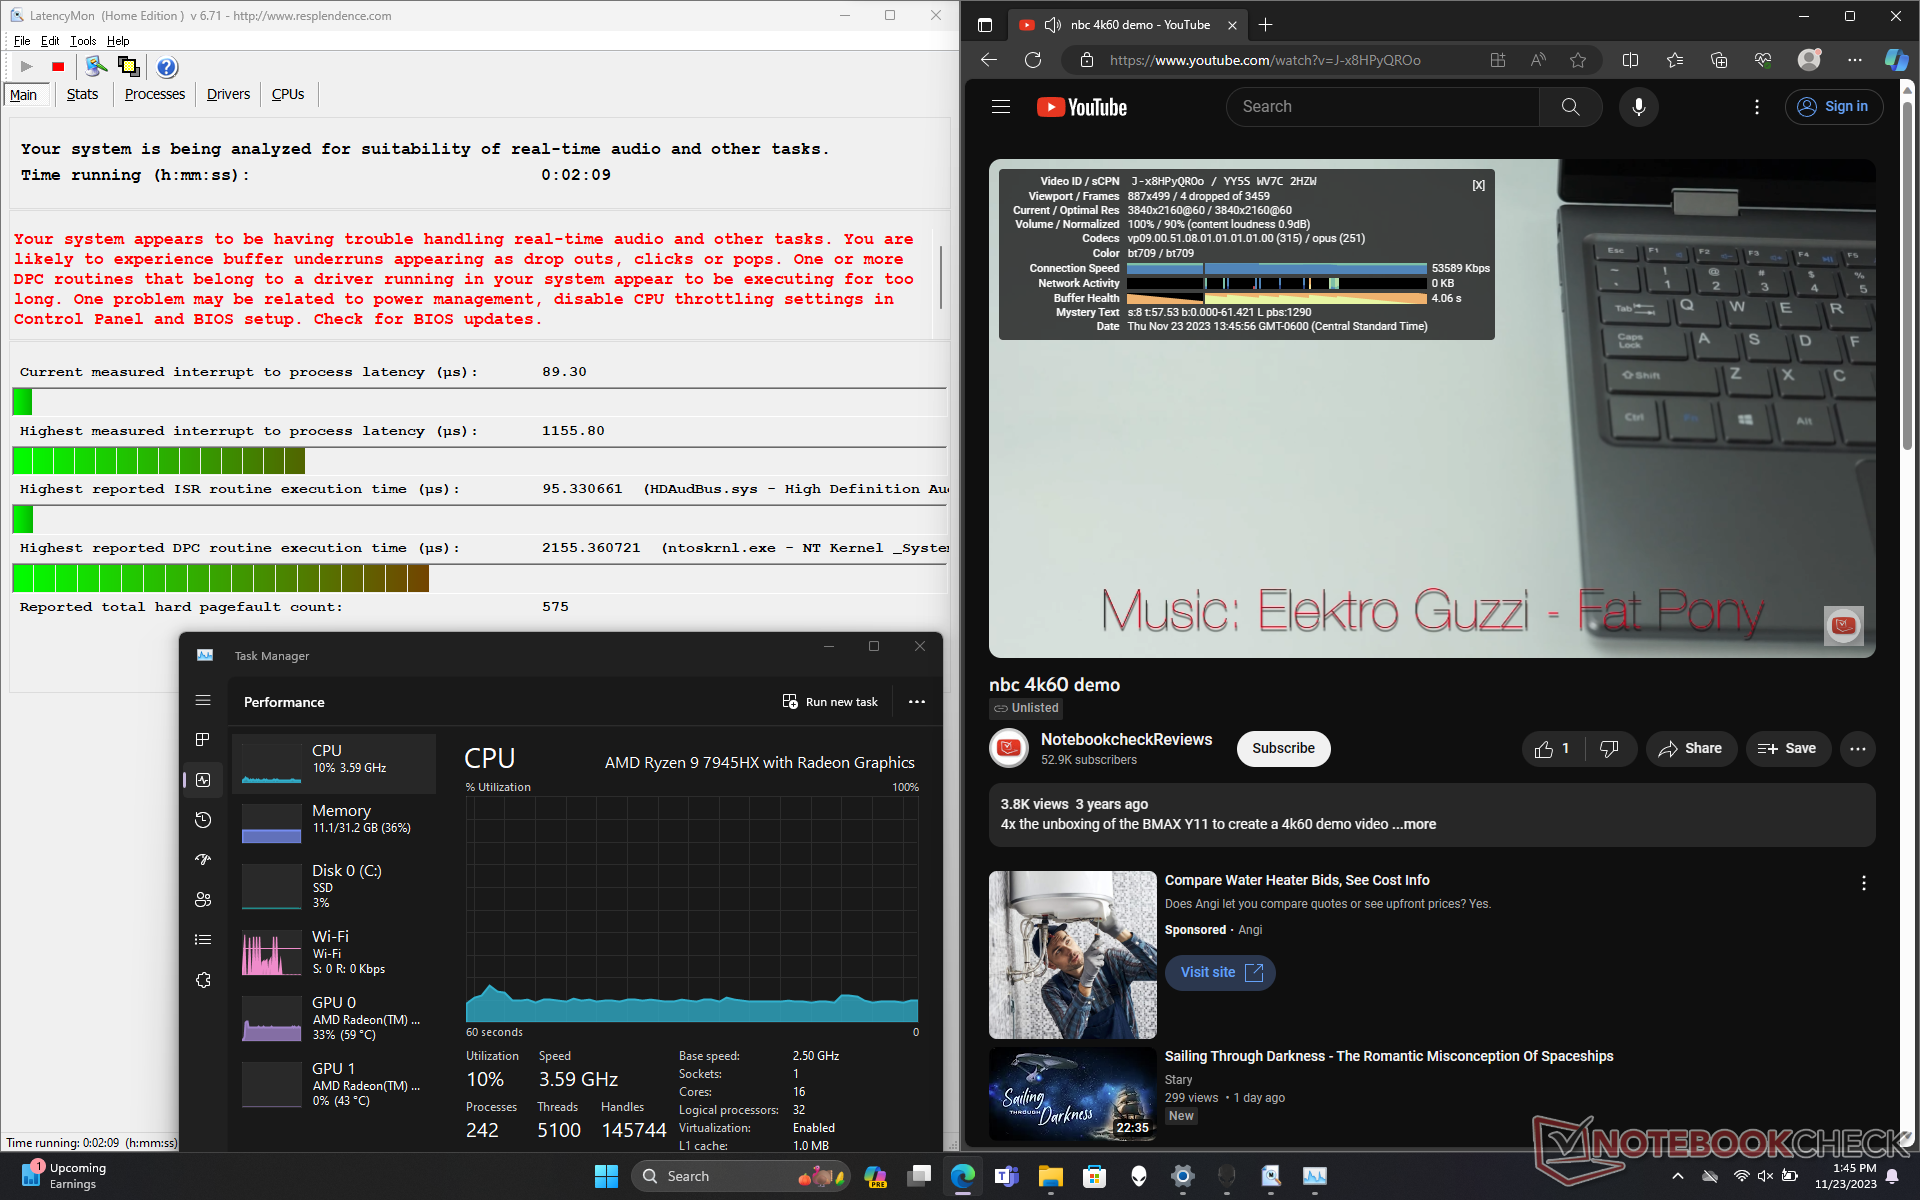
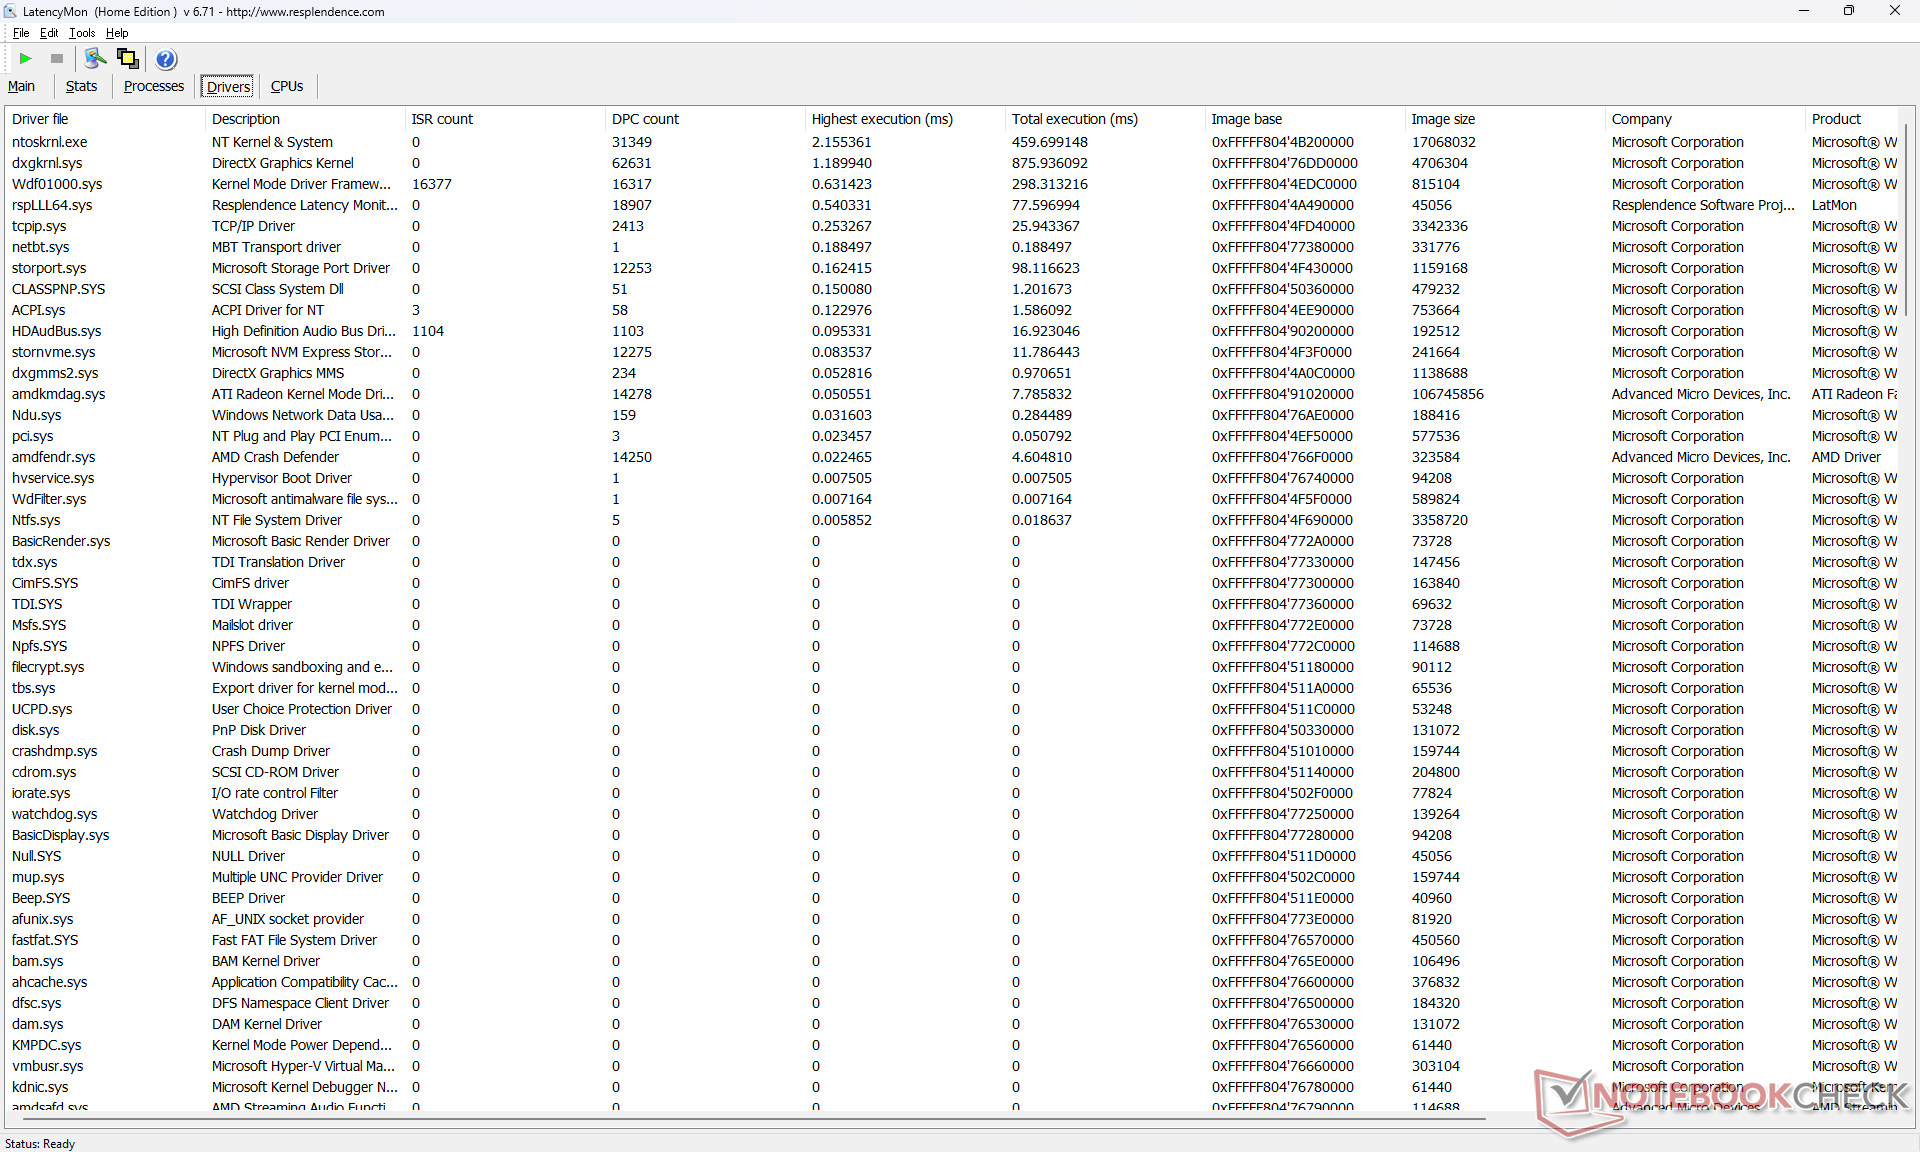
Latence DPC
LatencyMon révèle de légers problèmes de DPC lors de l'ouverture de plusieurs onglets de notre page d'accueil, ce qui n'est pas inhabituel. la lecture vidéo 4K à 60 FPS pourrait être meilleure, cependant, car nous avons pu enregistrer 4 images perdues dans une fenêtre de 60 secondes, contre 0 sur le Blade 18.
| DPC Latencies / LatencyMon - interrupt to process latency (max), Web, Youtube, Prime95 | |
| Acer Predator Helios 18 N23Q2 | |
| MSI GE78HX 13VH-070US | |
| Alienware m18 R1 | |
| Razer Blade 18 RTX 4070 | |
| Alienware m18 R1 AMD | |
| Asus ROG Strix Scar 18 2023 G834JY-N6005W | |
* ... Moindre est la valeur, meilleures sont les performances
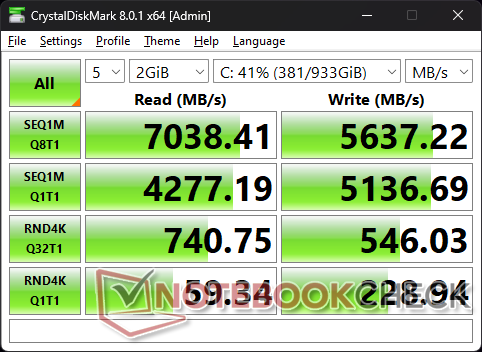
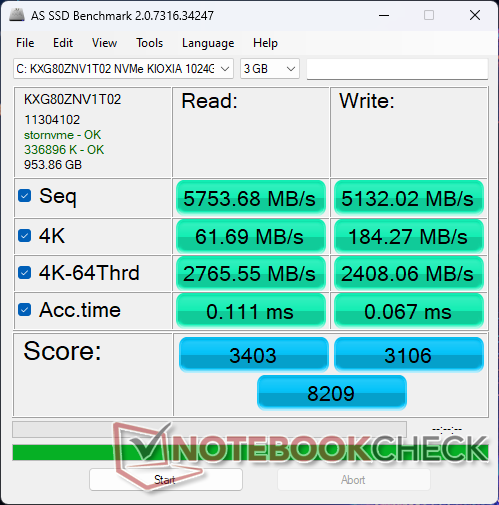
Dispositifs de stockage
Le 1 TBKioxia XG8 KXG80ZNV1T02 est un SSD NVMe PCIe4 x4 haut de gamme similaire à la série PM9A1 de Samsung. Notre disque ne présente aucun problème d'étranglement et maintient des taux de transfert élevés de ~6300 Mo/s pendant de longues périodes.

| Drive Performance rating - Percent | |
| Alienware m18 R1 | |
| Acer Predator Helios 18 N23Q2 | |
| MSI GE78HX 13VH-070US | |
| Razer Blade 18 RTX 4070 | |
| Alienware m18 R1 AMD | |
| Asus ROG Strix Scar 18 2023 G834JY-N6005W | |
* ... Moindre est la valeur, meilleures sont les performances
Disk Throttling: DiskSpd Read Loop, Queue Depth 8
Performance du GPU
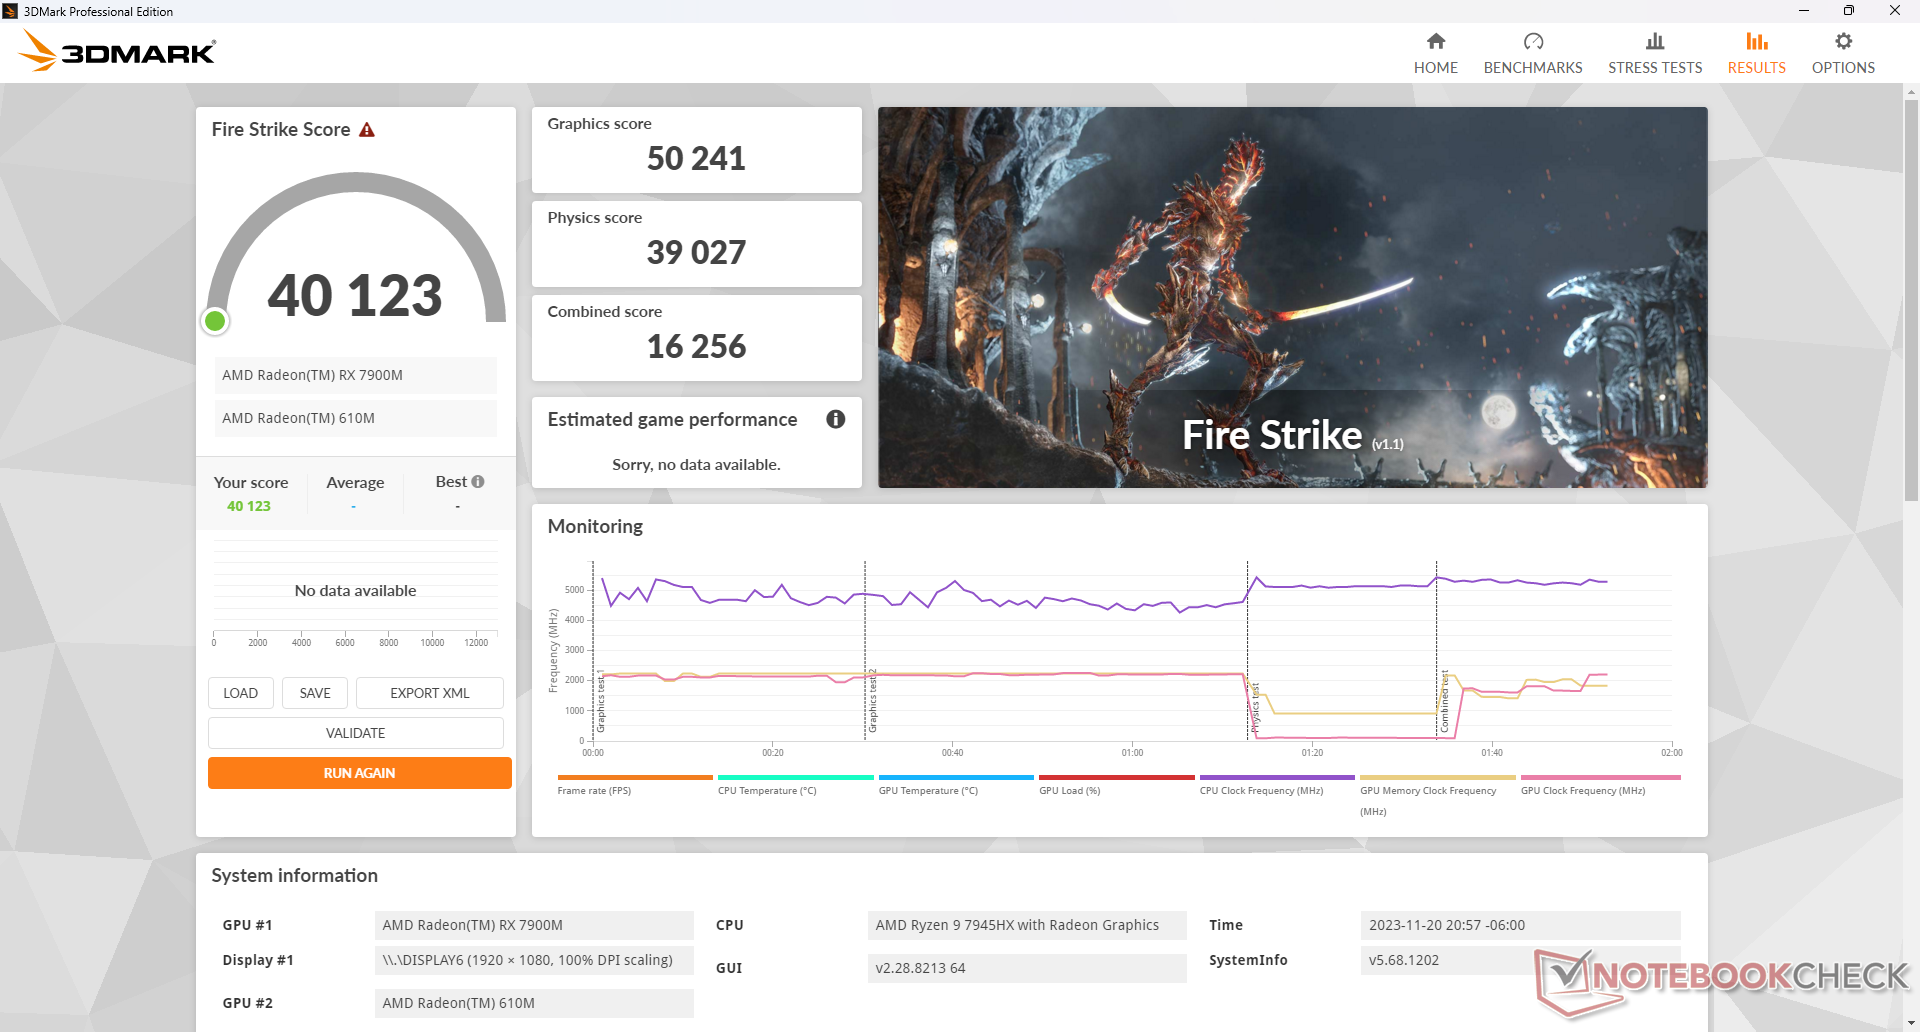
AMD commercialise la Radeon RX 7900M comme un concurrent direct de la mobile GeForce RTX 4080 et nous pensons qu'il s'agit d'une comparaison très juste. les résultats de 3DMark sont comparables à ceux de la RTX 4080 dans le modèle Alienware m16 R1 si ce n'est qu'ils sont légèrement plus rapides dans le test Fire Strike basé sur DX11. L'augmentation des performances brutes par rapport à la Radeon RX 6850M XT de l'année dernière est significatif, de l'ordre de 40 à 60 %. AMD n'avait pas de véritable réponse aux RTX 4070, 4080 ou 4090 mobiles avant le lancement de la Radeon RX 7900M.
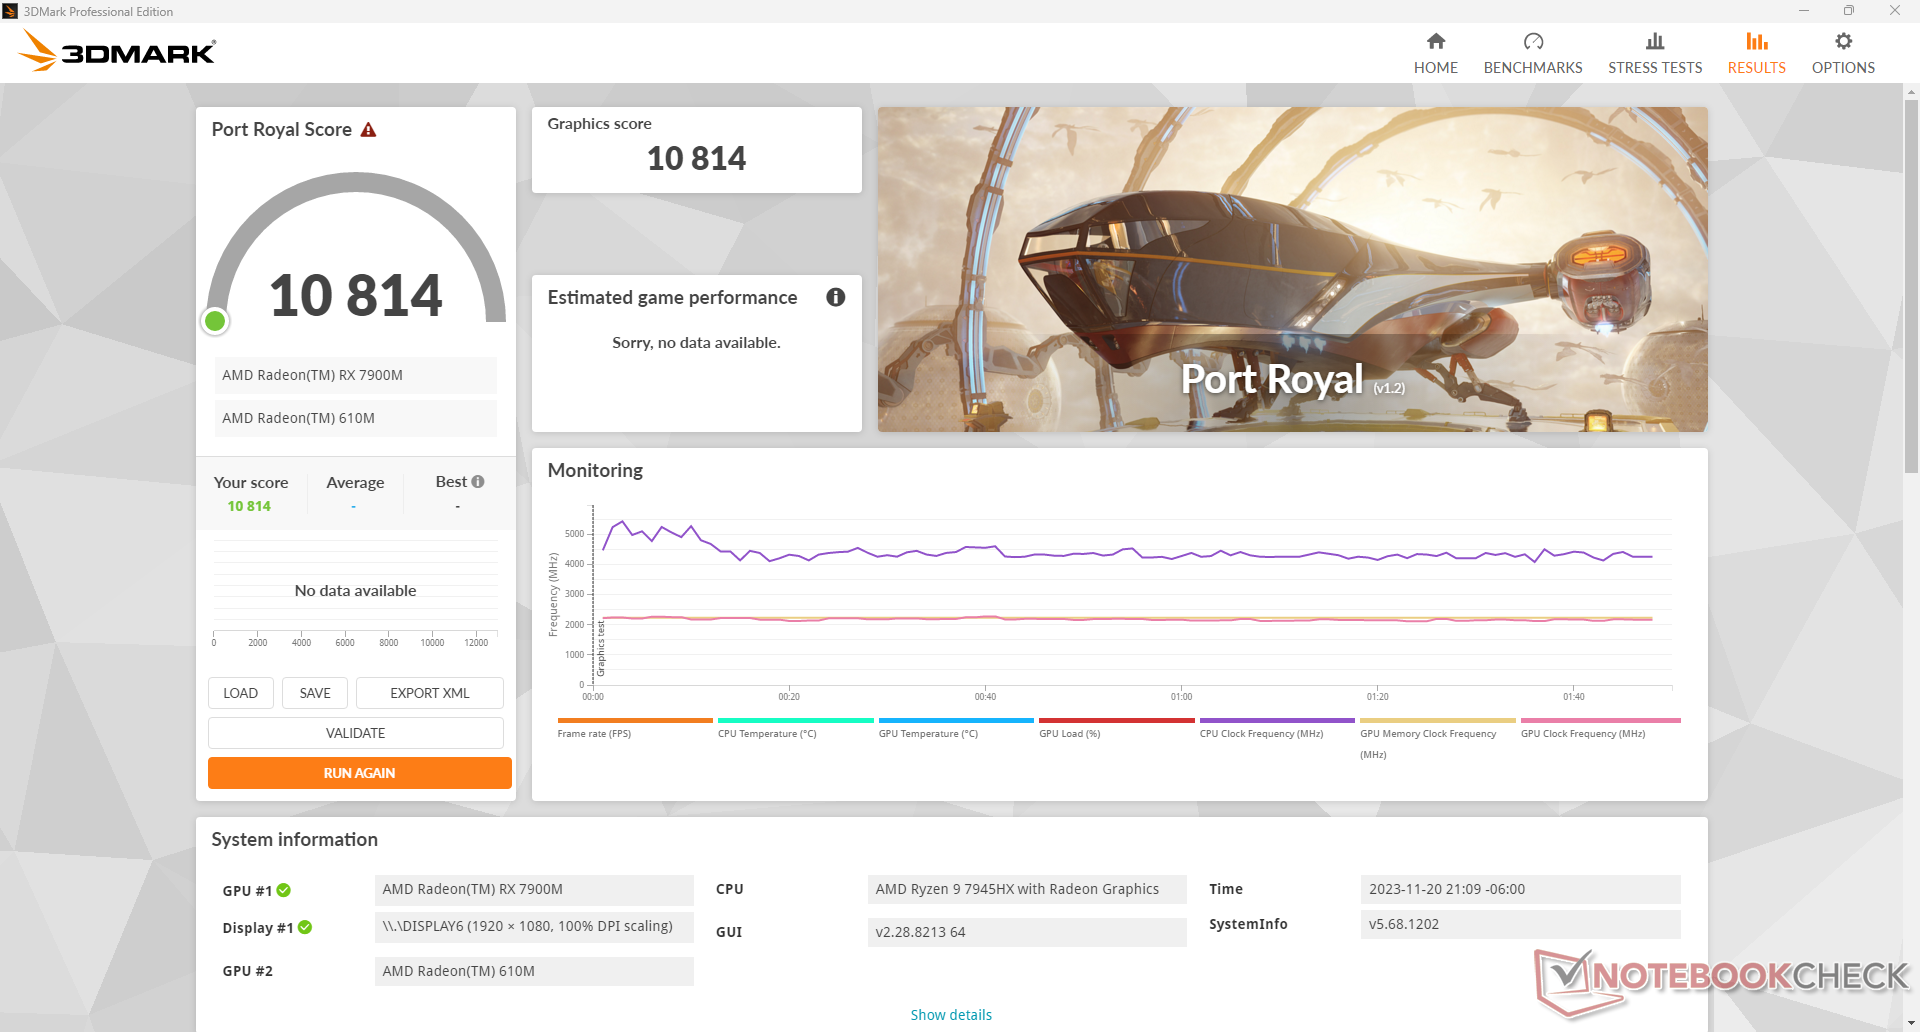
L'accélération RT a toujours été un point faible de la série Radeon, mais elle s'est considérablement améliorée avec la Radeon RX 7900M. Notre score Port Royal est d'environ 10 % par rapport à une carte mobile GeForce RTX 4080, ce qui représente une augmentation de 2 à 2,5 fois par rapport à la Radeon RX 6800M de l'année dernière Radeon RX 6800M. L'activation de la RT n'était auparavant jamais recommandée sur un ordinateur portable équipé d'une Radeon en raison de l'immense perte de performances, mais la Radeon RX 7900M est le tournant que les fans d'AMD attendaient.
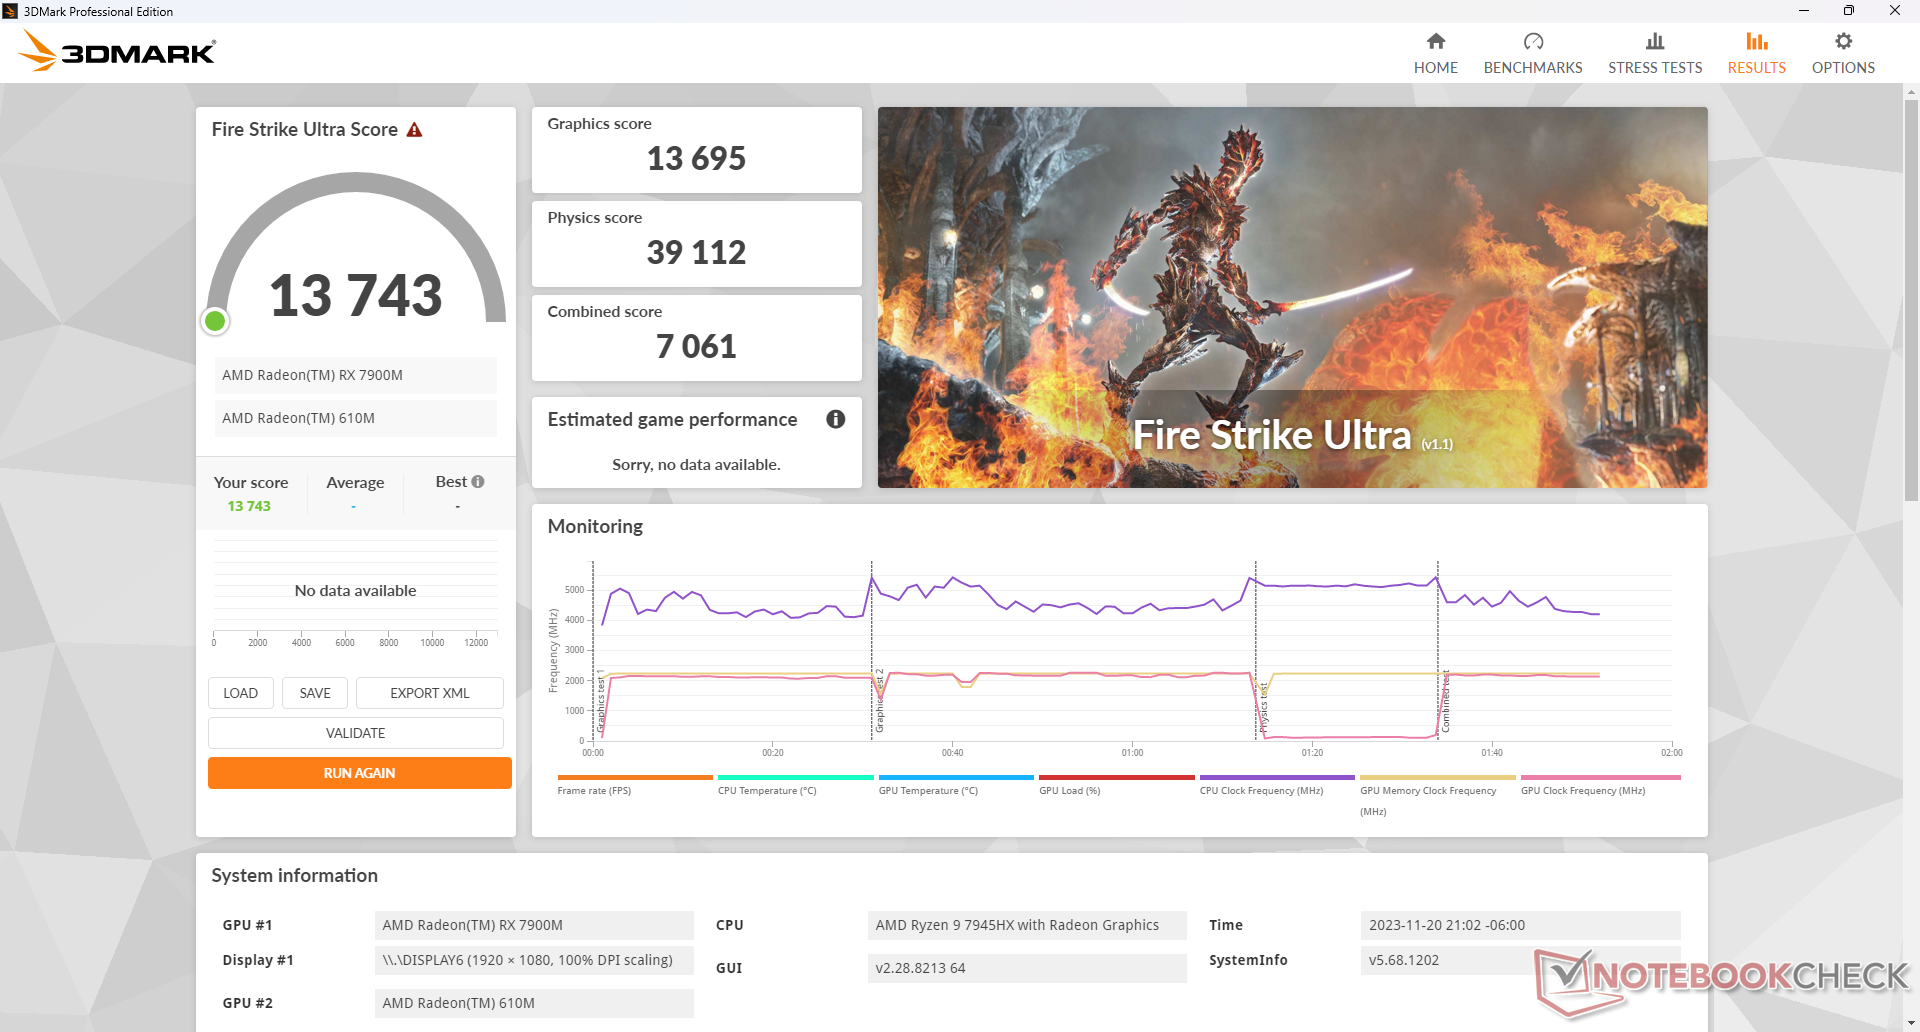
L'exécution en mode Performance ou en mode Équilibré au lieu du mode Overdrive diminue les performances de quelques points de pourcentage seulement, comme le montre notre tableau de résultats Fire Strike ci-dessous. Ces différences mineures sont dignes d'intérêt, car les différences de bruit de ventilateur entre ces modes sont significatives, comme le montre notre section sur le bruit du système ci-dessous.
| Profil de puissance | Score physique | Score graphique | Score combiné |
| Mode Overdrive | 39027 | 50241 | 16256 |
| Mode Performance | 37979 (-3%) | 47187 (-6%) | 16523 (-0%) |
| Mode équilibré | 37590 (-4%) | 48170 (-4%) | 16382 (-0%) |
| Alimentation par batterie | 31494 (-19%) | 10735 (-79%) | 4174 (-74%) |
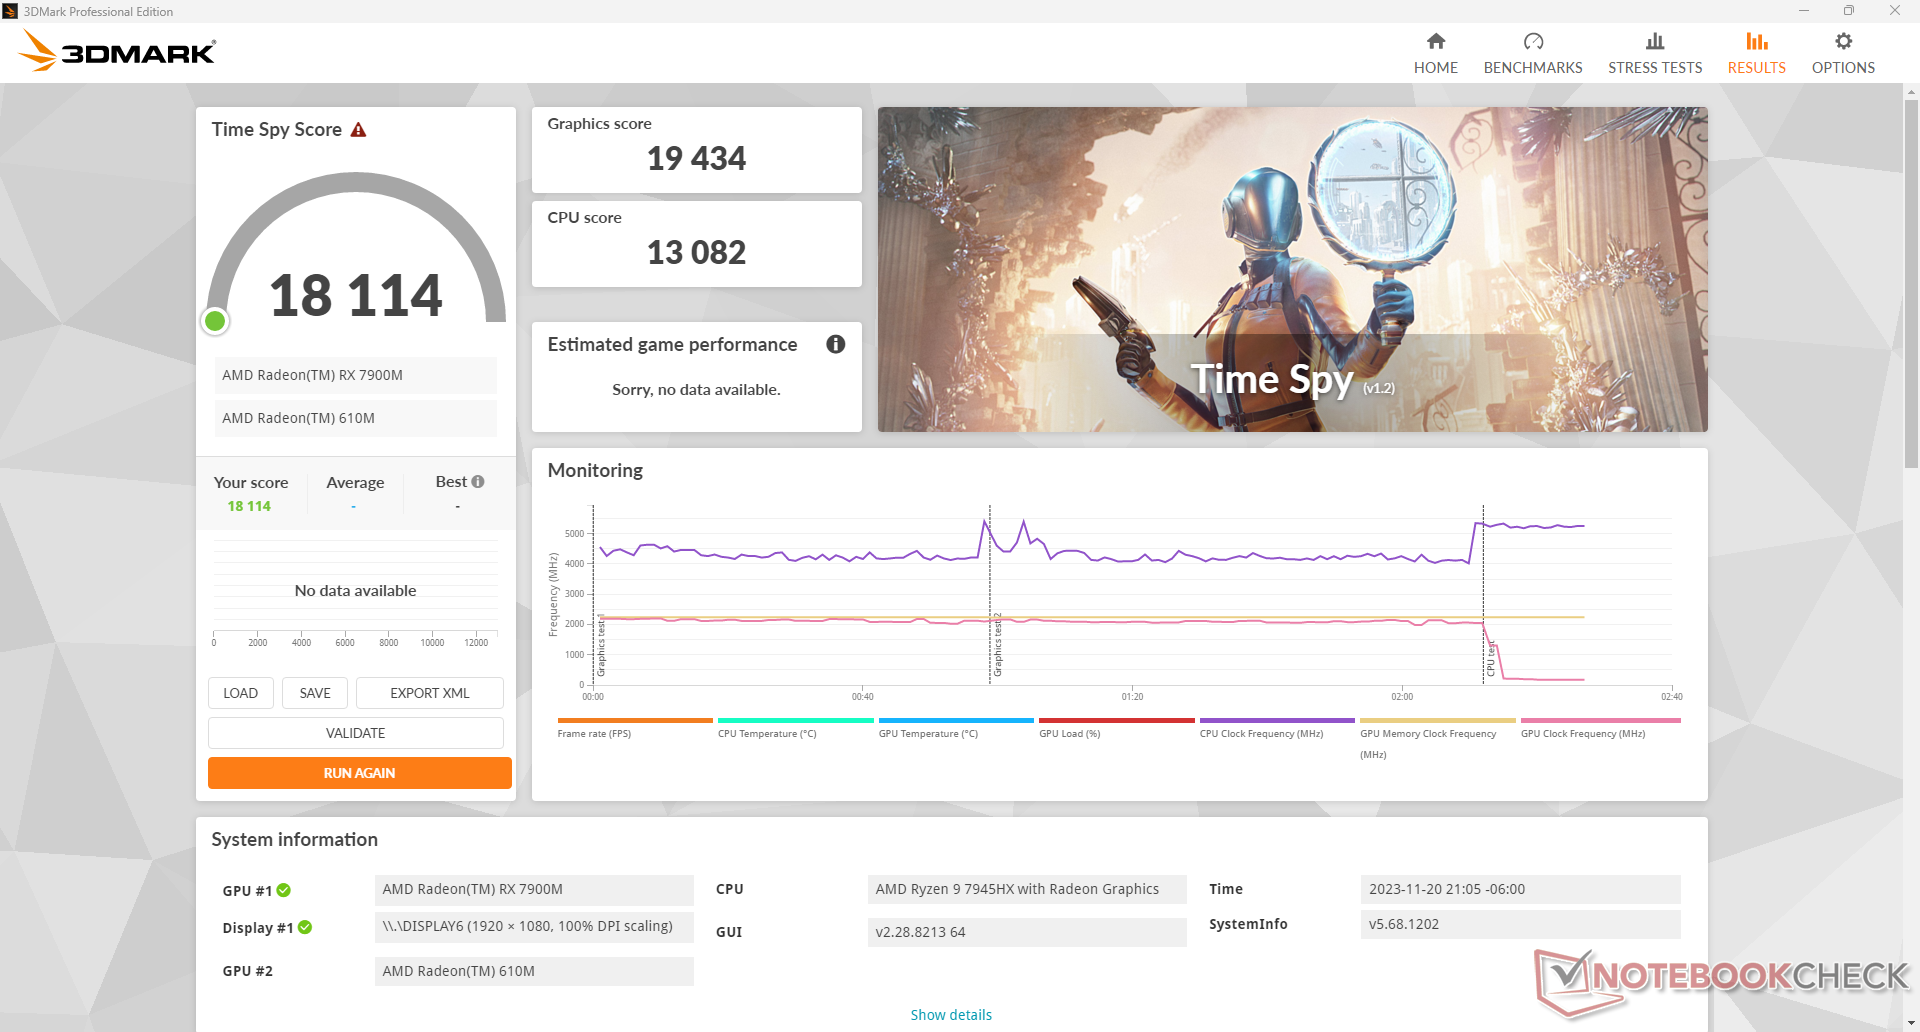
| 3DMark 11 Performance | 41670 points | |
| 3DMark Fire Strike Score | 40123 points | |
| 3DMark Time Spy Score | 18114 points | |
Aide | ||
* ... Moindre est la valeur, meilleures sont les performances
Performances des jeux
Les résultats de 3DMark se traduisent par des performances de jeu réelles. Les taux de trame lors des tests de Cyberpunk 2077 ou de F1 22 se situent à quelques points de pourcentage de la RTX 4080 mobile dans la plupart des scénarios. Si vous activez la RT, cependant, la baisse de performance sera encore plus importante par rapport au GPU Nvidia concurrent. Par exemple, notre Alienware fonctionnerait 15 et 35 % plus lentement que la RTX 4080 mobile en activant la RT dans F1 22 et Cyberpunk 2077, respectivement, même si les deux GPU sont très proches lorsque la RT est désactivée.
AMD a introduit FSR 3 en même temps que le lancement de la Radeon RX 7900M comme réponse directe à DLSS 3. Tout comme la solution de Nvidia, la technologie d'upscaling comprend à la fois la génération d'images et la réduction de la latence pour compenser l'impact important sur les performances lorsque la RT est activée. Malheureusement, FSR 3 n'en est qu'à ses balbutiements et pratiquement aucun jeu ne prend en charge cette fonctionnalité, alors que le nombre de jeux prenant en charge DLSS 3 a eu beaucoup plus de temps pour se développer. À ce jour, même Cyberpunk 2077 ne prend pas en charge la FSR 3. D'autres jeux seront mis à jour avec la prise en charge de la FSR 3 à partir de 2024. En attendant, les possesseurs devront se contenter de la FSR 2, plus ancienne mais plus largement supportée.
Il est intéressant de noter que nous n'avons pas rencontré de bogues qui brisent le jeu malgré tous les problèmes que nous avons notés dans la section Performances du système ci-dessus. D'autres jeux seront testés et ajoutés à la liste ci-dessous au fil du temps.
| Performance rating - Percent | |
| Alienware m18 R1 | |
| Asus ROG Strix Scar 18 2023 G834JY-N6005W -1! | |
| Acer Predator Helios 18 N23Q2 | |
| Alienware m18 R1 AMD | |
| MSI GE78HX 13VH-070US | |
| Razer Blade 18 RTX 4070 | |
| The Witcher 3 - 1920x1080 Ultra Graphics & Postprocessing (HBAO+) | |
| Alienware m18 R1 | |
| MSI GE78HX 13VH-070US | |
| Acer Predator Helios 18 N23Q2 | |
| Alienware m18 R1 AMD | |
| Razer Blade 18 RTX 4070 | |
| GTA V - 1920x1080 Highest AA:4xMSAA + FX AF:16x | |
| Acer Predator Helios 18 N23Q2 | |
| Alienware m18 R1 | |
| Asus ROG Strix Scar 18 2023 G834JY-N6005W | |
| Razer Blade 18 RTX 4070 | |
| Alienware m18 R1 AMD | |
| MSI GE78HX 13VH-070US | |
| Final Fantasy XV Benchmark - 1920x1080 High Quality | |
| Alienware m18 R1 | |
| Acer Predator Helios 18 N23Q2 | |
| Asus ROG Strix Scar 18 2023 G834JY-N6005W | |
| Alienware m18 R1 AMD | |
| MSI GE78HX 13VH-070US | |
| Razer Blade 18 RTX 4070 | |
| Strange Brigade - 1920x1080 ultra AA:ultra AF:16 | |
| Alienware m18 R1 | |
| Asus ROG Strix Scar 18 2023 G834JY-N6005W | |
| Alienware m18 R1 AMD | |
| Acer Predator Helios 18 N23Q2 | |
| MSI GE78HX 13VH-070US | |
| Razer Blade 18 RTX 4070 | |
| Dota 2 Reborn - 1920x1080 ultra (3/3) best looking | |
| Alienware m18 R1 | |
| Asus ROG Strix Scar 18 2023 G834JY-N6005W | |
| Acer Predator Helios 18 N23Q2 | |
| Razer Blade 18 RTX 4070 | |
| Alienware m18 R1 AMD | |
| MSI GE78HX 13VH-070US | |
| Tiny Tina's Wonderlands | |
| 1920x1080 Badass Preset (DX12) | |
| Alienware m18 R1 | |
| AMD Radeon RX 7900 GRE | |
| Alienware m16 R1 AMD | |
| Alienware m18 R1 AMD | |
| Moyenne AMD Radeon RX 7900M (n=1) | |
| Asus TUF Gaming A16 FA617XS | |
| Corsair Voyager a1600 | |
| Asus ROG Zephyrus G14 GA402RJ | |
| 2560x1440 Badass Preset (DX12) | |
| Alienware m18 R1 | |
| AMD Radeon RX 7900 GRE | |
| Alienware m16 R1 AMD | |
| Alienware m18 R1 AMD | |
| Moyenne AMD Radeon RX 7900M (n=1) | |
| Corsair Voyager a1600 | |
| Asus ROG Zephyrus G14 GA402RJ | |
| 3840x2160 Badass Preset (DX12) | |
| Alienware m18 R1 | |
| AMD Radeon RX 7900 GRE | |
| Alienware m16 R1 AMD | |
| Alienware m18 R1 AMD | |
| Moyenne AMD Radeon RX 7900M (n=1) | |
| Corsair Voyager a1600 | |
| Ratchet & Clank Rift Apart | |
| 1920x1080 Very High Preset AA:T | |
| AMD Radeon RX 7900 GRE | |
| Alienware m18 R1 AMD | |
| Moyenne AMD Radeon RX 7900M (n=1) | |
| 2560x1440 Very High Preset AA:T | |
| AMD Radeon RX 7900 GRE | |
| Alienware m18 R1 AMD | |
| Moyenne AMD Radeon RX 7900M (n=1) | |
| 3840x2160 Very High Preset AA:T | |
| AMD Radeon RX 7900 GRE | |
| Alienware m18 R1 AMD | |
| Moyenne AMD Radeon RX 7900M (n=1) | |
| 1920x1080 Very High Preset + Very High Raytracing AA:T | |
| Alienware m18 R1 AMD | |
| Moyenne AMD Radeon RX 7900M (n=1) | |
Les performances chutent parfois à 70 FPS, alors qu'elles atteignaient 180 FPS au ralenti, comme le montre le graphique ci-dessous Witcher 3 comme le montre le graphique ci-dessous. Pendant le jeu, les baisses de performances se manifestent par des bégaiements, même en l'absence de mouvements de jeu. Cela se produit à une fréquence distincte qui suggère un problème d'interruption en arrière-plan qui devrait être résolu.
Le problème de performance ne s'est pas produit lorsque ce test a été répété sur la configuration Intel-Nvidia du même modèle d'Alienware.
Witcher 3 FPS Chart
| Bas | Moyen | Élevé | Ultra | QHD | 4K | |
|---|---|---|---|---|---|---|
| GTA V (2015) | 172.9 | 105 | 105.6 | 146 | ||
| The Witcher 3 (2015) | 167.7 | 116 | ||||
| Dota 2 Reborn (2015) | 162.8 | 146.2 | 122.5 | |||
| Final Fantasy XV Benchmark (2018) | 152.8 | 114.6 | 69.3 | |||
| X-Plane 11.11 (2018) | 83.7 | 64.3 | ||||
| Far Cry 5 (2018) | 128 | 123 | 103 | |||
| Strange Brigade (2018) | 344 | 249 | 130.5 | |||
| Shadow of the Tomb Raider (2018) | 207 | 198 | 139 | 76 | ||
| Cyberpunk 2077 1.6 (2022) | 135 | 93.3 | 44.3 | |||
| Tiny Tina's Wonderlands (2022) | 150.2 | 106.8 | 56 | |||
| F1 22 (2022) | 296 | 102.8 | 69.3 | 36.1 | ||
| Ratchet & Clank Rift Apart (2023) | 86.2 | 83.6 | 54.8 | |||
| Baldur's Gate 3 (2023) | 152.4 | 152.6 | 118.5 | 65.8 | ||
| Cyberpunk 2077 (2023) | 130.7 | 129.6 | 85.2 | 37.7 | ||
| Alan Wake 2 (2023) | 104.8 | 71.7 | 37.3 |
Émissions
Bruit du système
Il n'y a pas de différence majeure dans le bruit des ventilateurs entre nos configurations Intel et AMD. Ce n'est pas nécessairement une bonne chose, cependant, car les ventilateurs de notre unité AMD se mettaient à pulser assez fréquemment et apparemment sans raison lorsque vous naviguiez sur le web ou regardiez des vidéos en streaming. Le système fonctionnait silencieusement à 23 dB(A), puis pulsait brusquement jusqu'à 33,5 dB(A), même avec les profils d'alimentation Quiet ou Battery.
Il est intéressant de noter qu'il n'y a pas de différence de bruit de ventilateur entre les profils d'alimentation Balanced et Performance, puisque nous avons pu enregistrer un maximum de 48 dB(A) lorsque nous jouions avec l'un ou l'autre de ces profils. En revanche, en mode Overdrive, le bruit du ventilateur atteint 54 dB(A). Les utilisateurs peuvent alors envisager de jouer en mode Performance pour obtenir des ventilateurs nettement plus silencieux, même si cela implique de sacrifier 5 à 10 % des performances.
Ne vous attendez pas à ce que l'Alienware soit beaucoup plus silencieux que d'autres ordinateurs portables de jeu de 18 pouces, bien qu'il ait deux fois plus de ventilateurs à l'intérieur. Le système fonctionne toujours à plus de 50 dB(A) lorsque vous jouez, ce qui nécessite pratiquement une bonne paire d'écouteurs.
Degré de la nuisance sonore
| Au repos |
| 23 / 23.4 / 33.5 dB(A) |
| Fortement sollicité |
| 33.5 / 53.6 dB(A) |
 | ||
30 dB silencieux 40 dB(A) audible 50 dB(A) bruyant |
||
min: | ||
| Alienware m18 R1 AMD Radeon RX 7900M, R9 7945HX, Kioxia XG8 KXG80ZNV1T02 | Alienware m18 R1 GeForce RTX 4090 Laptop GPU, i9-13980HX, SK hynix PC801 HFS001TEJ9X101N | Acer Predator Helios 18 N23Q2 GeForce RTX 4080 Laptop GPU, i9-13900HX, Samsung PM9A1 MZVL22T0HBLB | Razer Blade 18 RTX 4070 GeForce RTX 4070 Laptop GPU, i9-13950HX, SSSTC CA6-8D1024 | Asus ROG Strix Scar 18 2023 G834JY-N6005W GeForce RTX 4090 Laptop GPU, i9-13980HX, 2x Samsung PM9A1 MZVL21T0HCLR (RAID 0) | MSI GE78HX 13VH-070US GeForce RTX 4080 Laptop GPU, i9-13950HX, Samsung PM9A1 MZVL22T0HBLB | |
|---|---|---|---|---|---|---|
| Noise | 3% | -4% | 1% | -10% | -8% | |
| arrêt / environnement * (dB) | 22.4 | 22.8 -2% | 23 -3% | 23.5 -5% | 23.9 -7% | 23.4 -4% |
| Idle Minimum * (dB) | 23 | 23 -0% | 23 -0% | 23.8 -3% | 23.9 -4% | 24.2 -5% |
| Idle Average * (dB) | 23.4 | 23 2% | 23 2% | 23.8 -2% | 32.6 -39% | 25.6 -9% |
| Idle Maximum * (dB) | 33.5 | 23 31% | 23 31% | 26.8 20% | 32.6 3% | 31 7% |
| Load Average * (dB) | 33.5 | 35.6 -6% | 45.26 -35% | 37.3 -11% | 35.9 -7% | 43.3 -29% |
| Witcher 3 ultra * (dB) | 53.6 | 51.3 4% | 59.82 -12% | 48 10% | 56.3 -5% | |
| Load Maximum * (dB) | 53.6 | 56.7 -6% | 59.94 -12% | 53.5 -0% | 55.8 -4% | 59.1 -10% |
* ... Moindre est la valeur, meilleures sont les performances
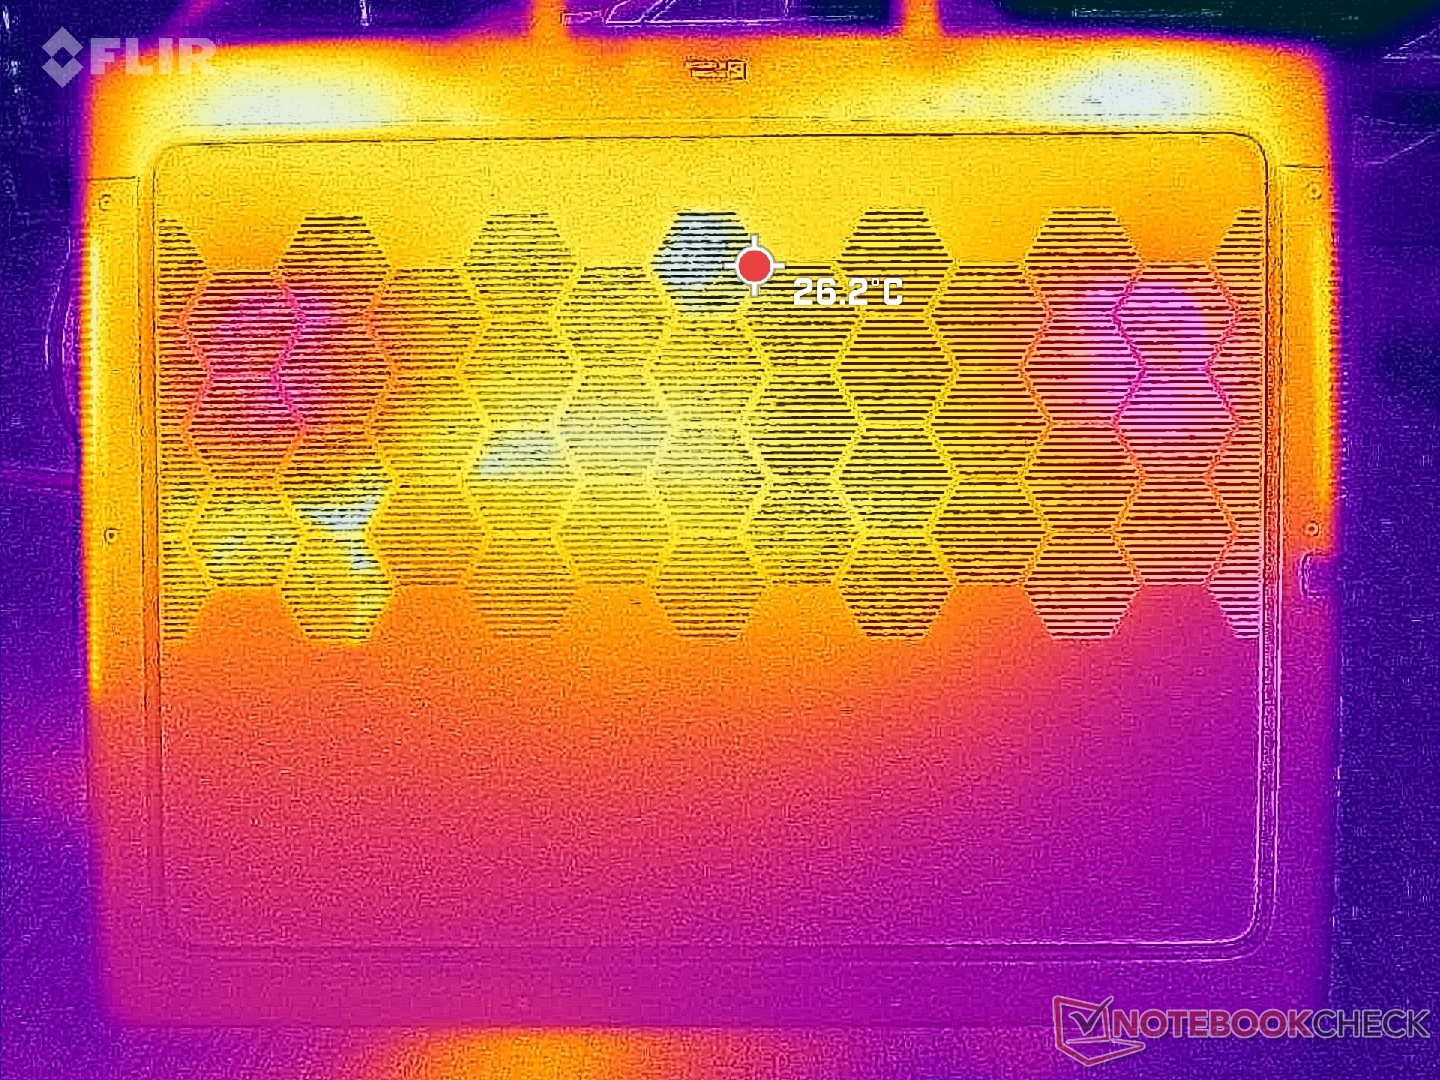
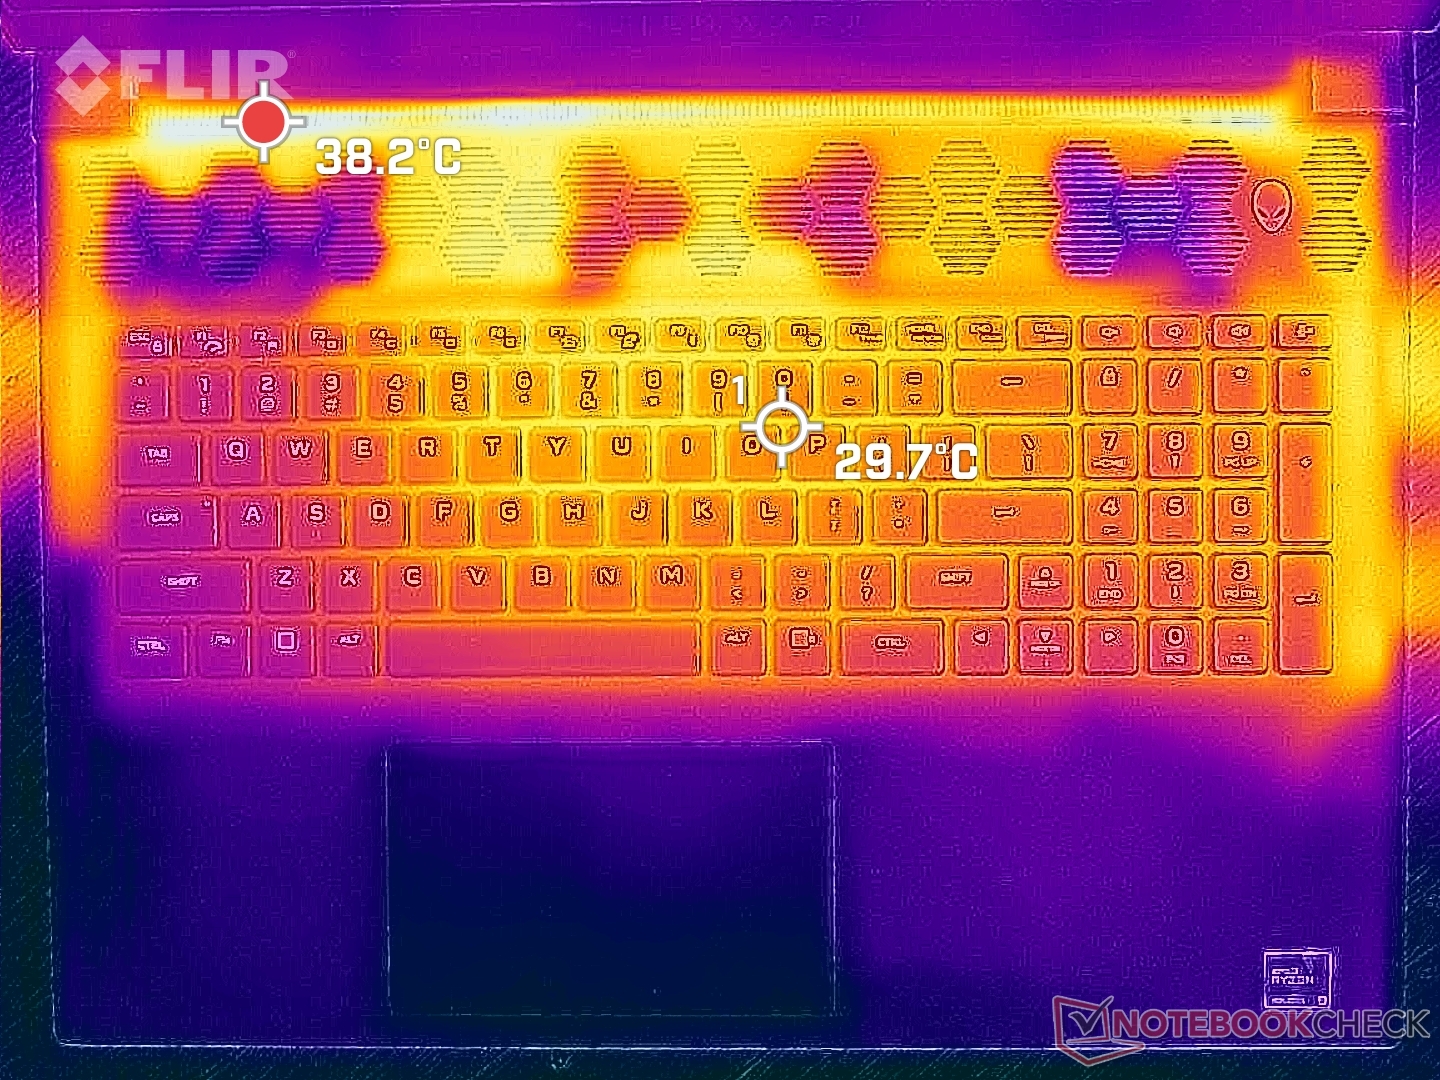
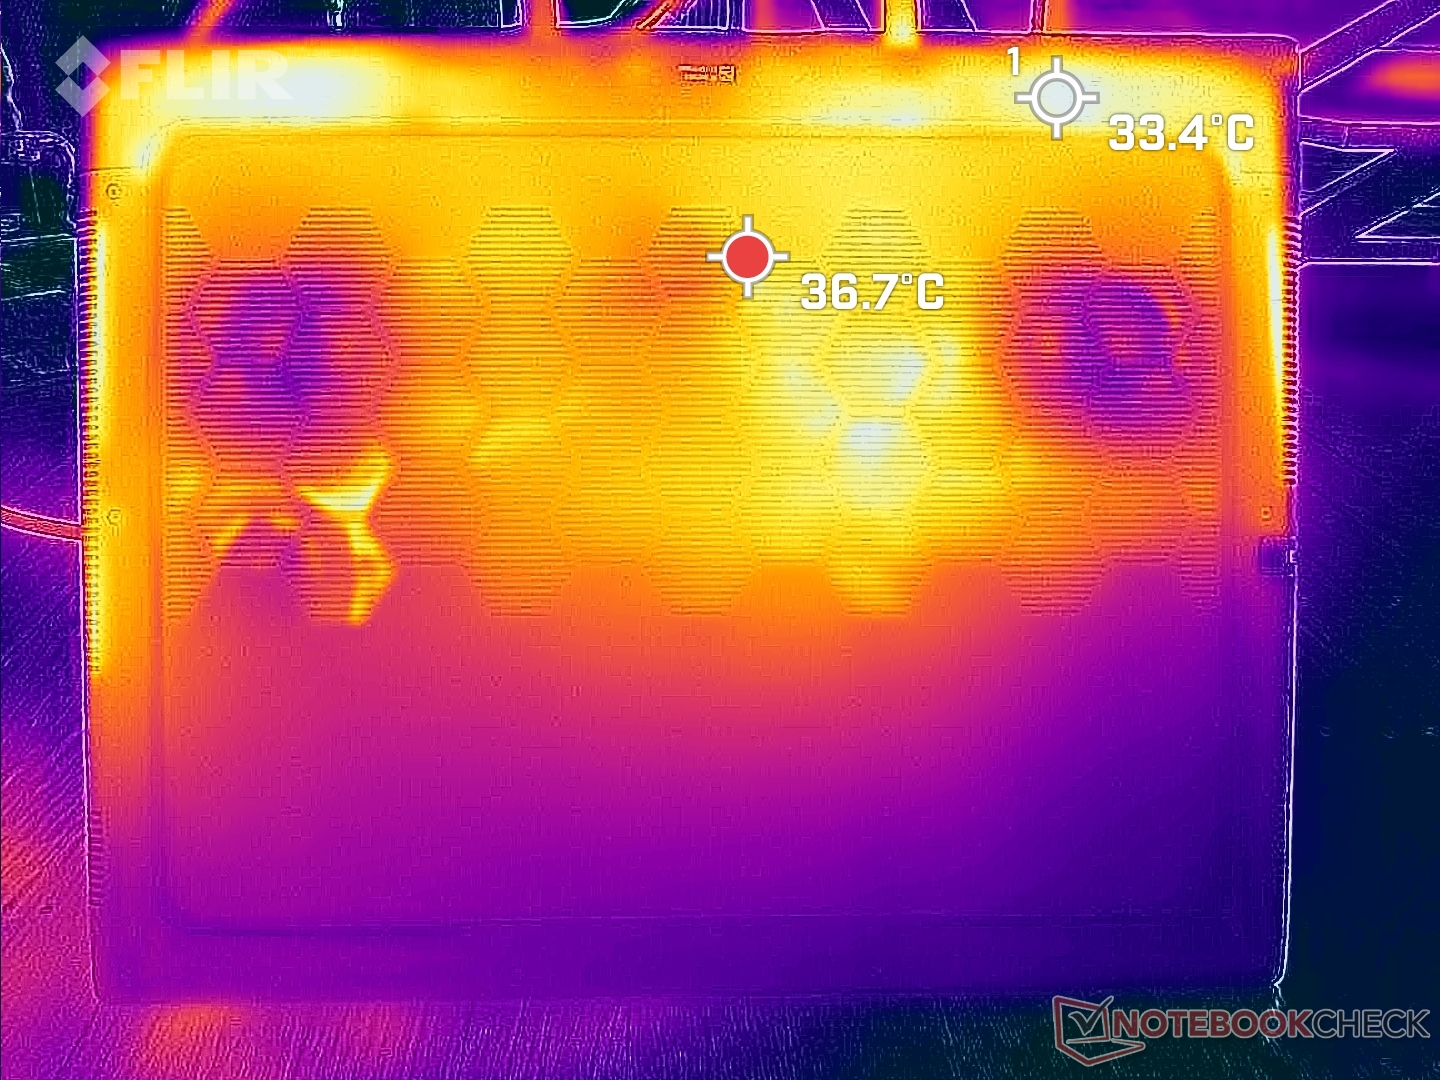
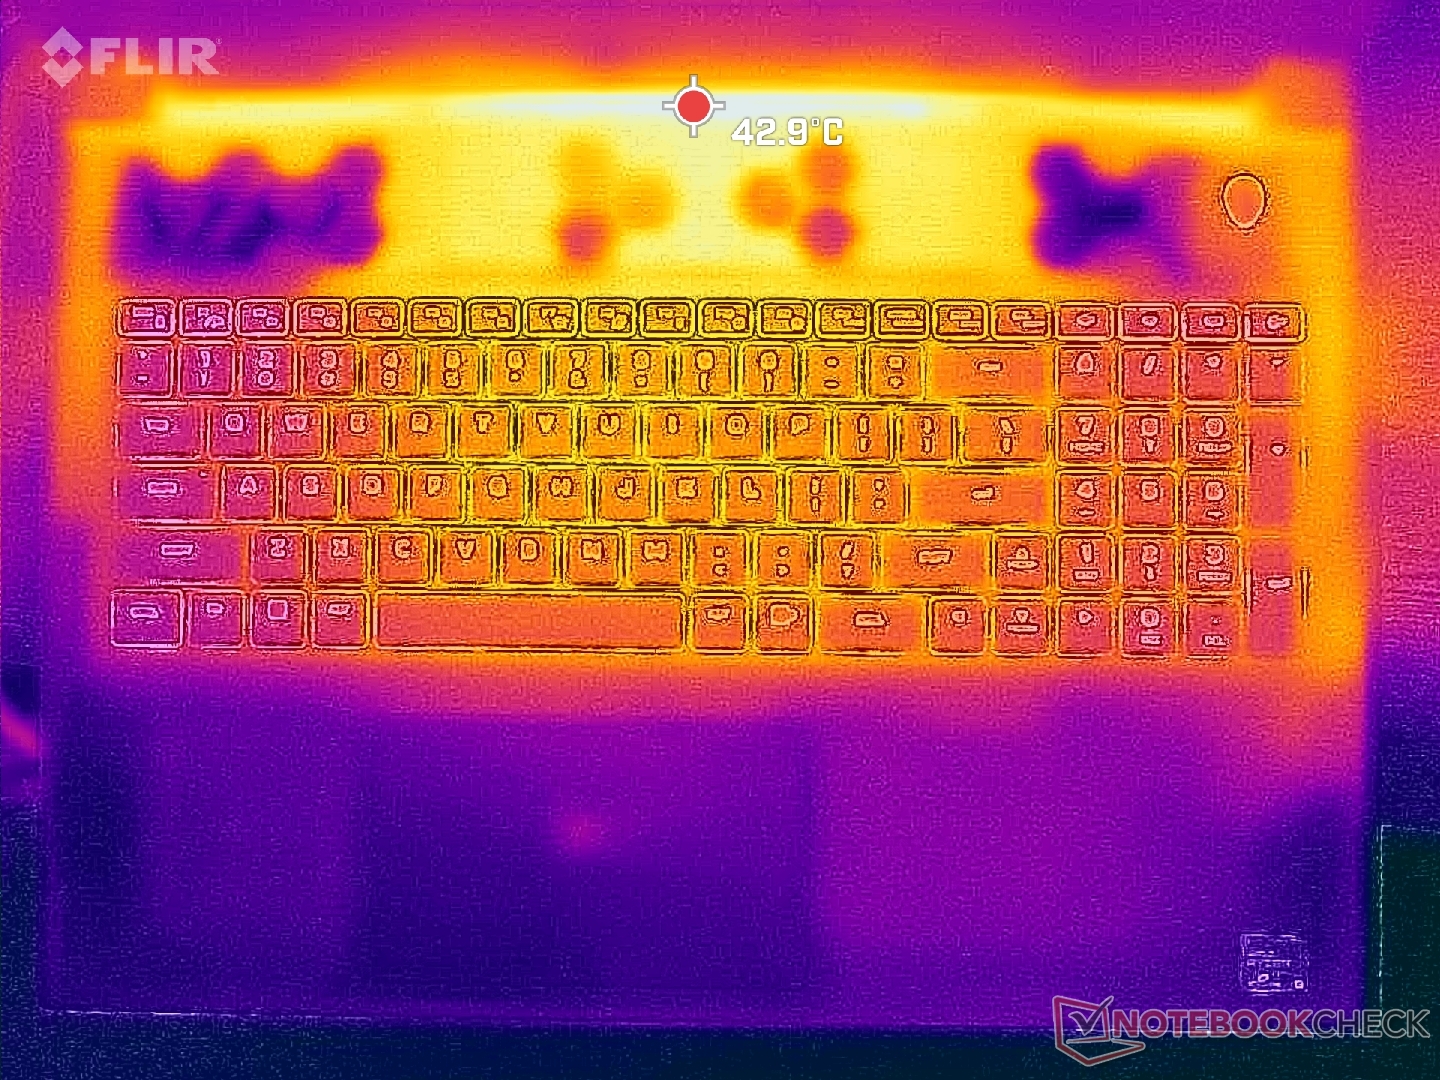
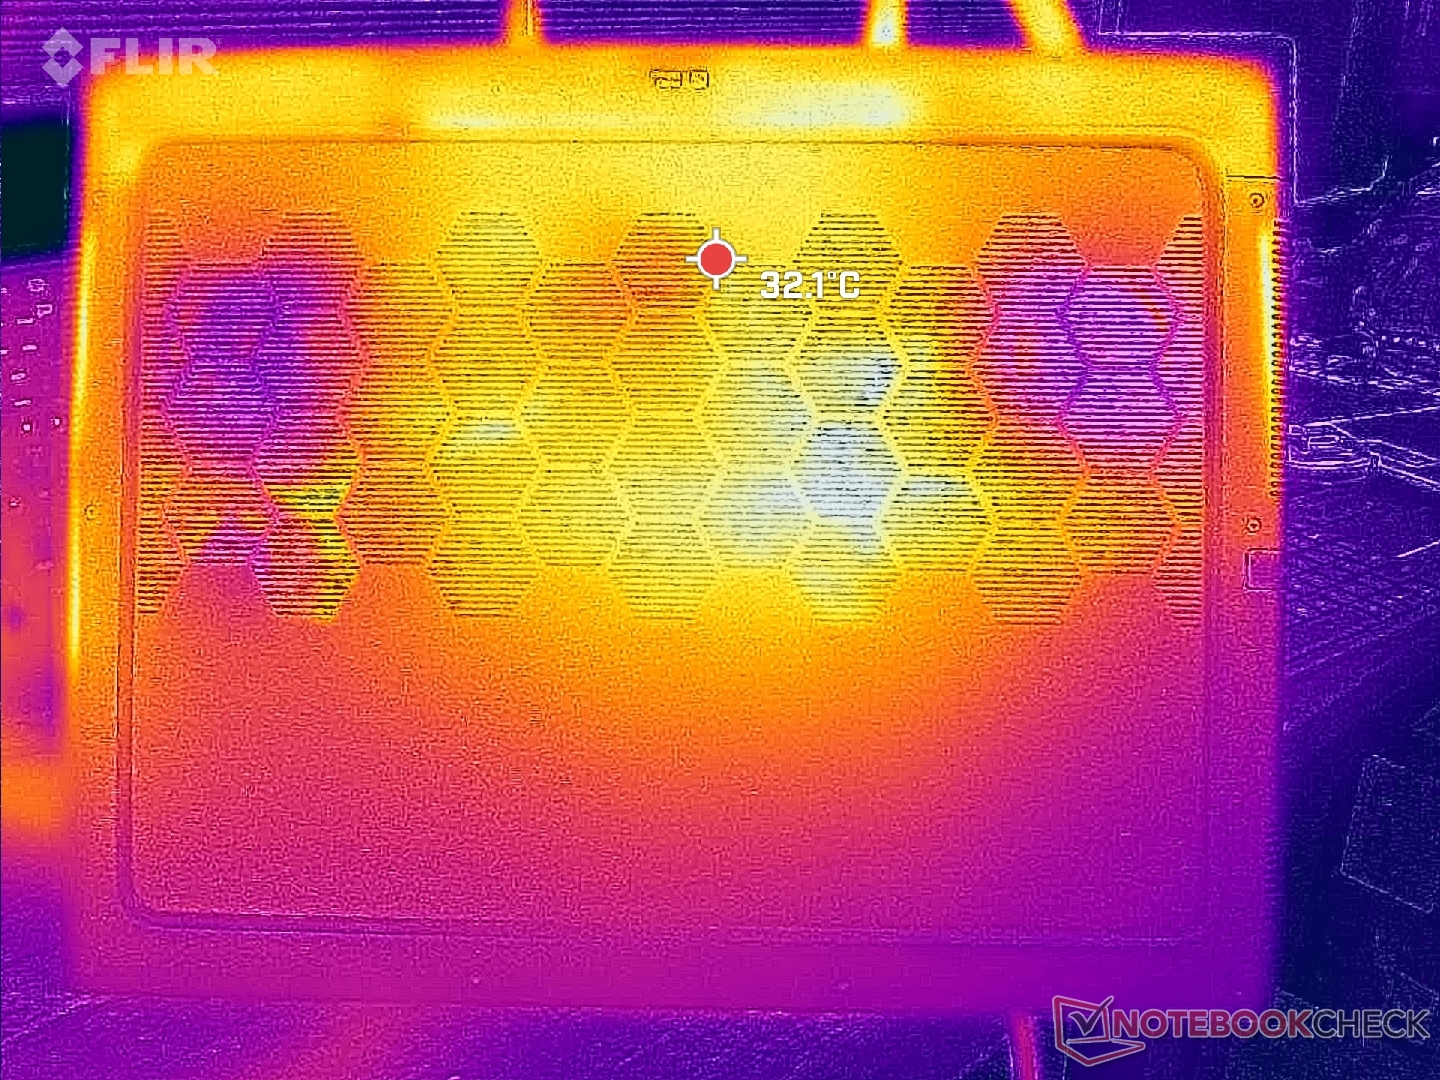
Température
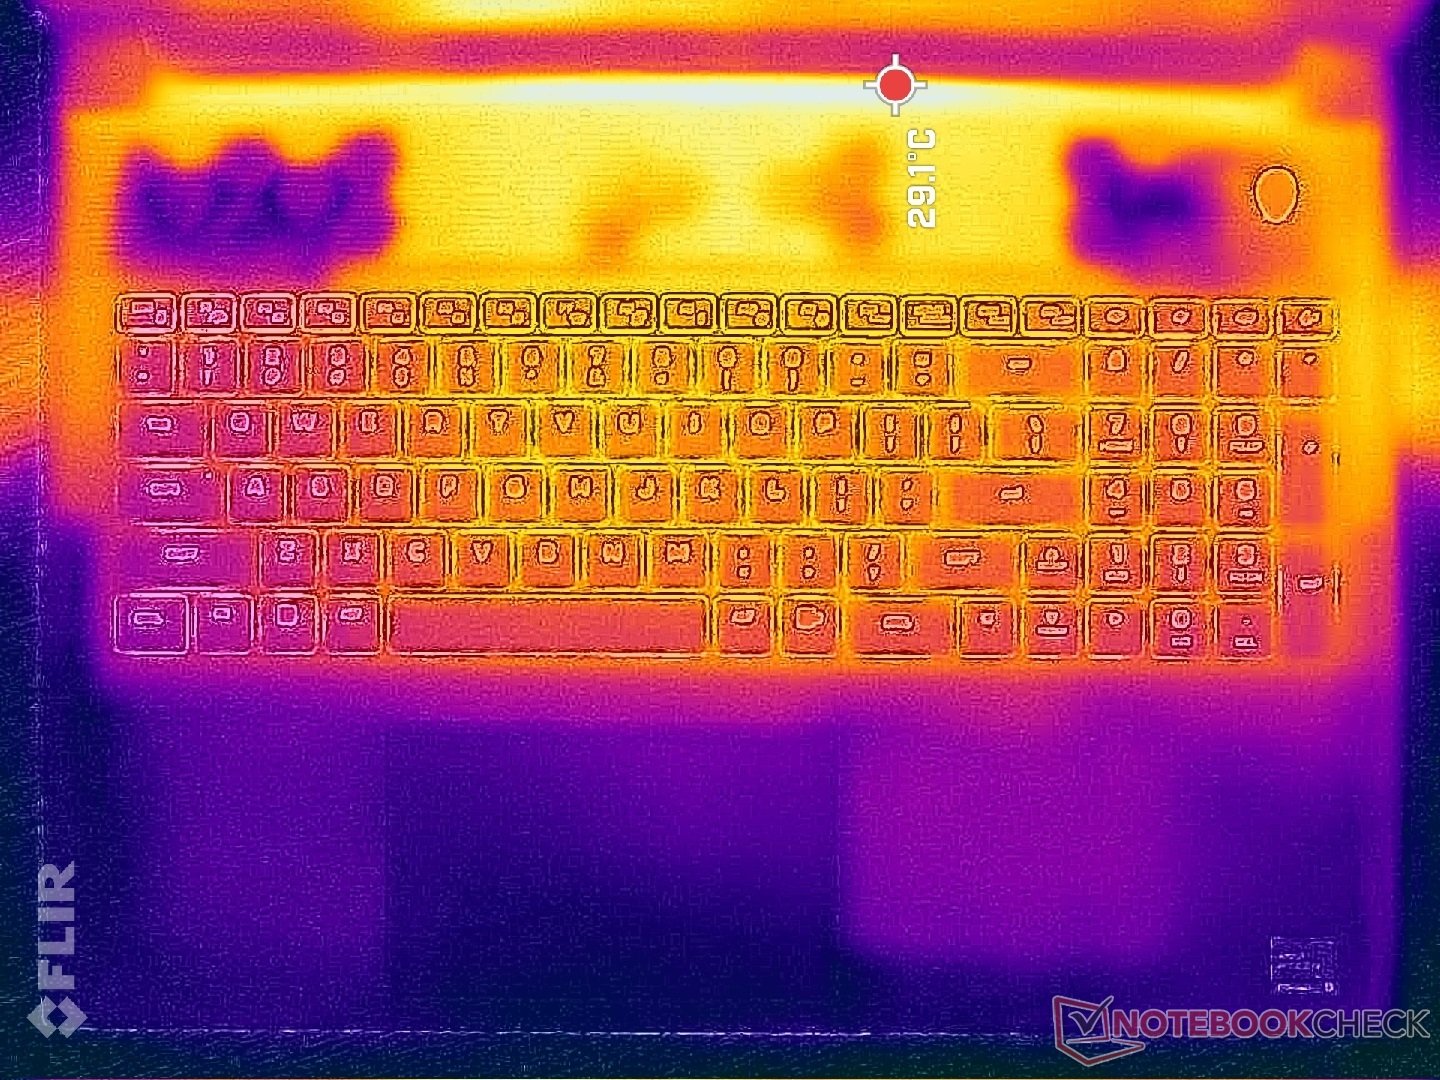
Les températures de surface sont similaires à celles que nous avons enregistrées sur la configuration Intel-Nvidia et restent donc plus fraîches que ce à quoi on pourrait s'attendre en raison de la grande taille de l'écran, des grandes grilles d'aération, du design arrière large et du nombre élevé de ventilateurs internes. Les repose-poignets et le clavier ne deviennent jamais inconfortablement chauds au toucher pendant le jeu, contrairement aux surfaces plus chaudes des ordinateurs portables de jeu plus petits comme le Razer Blade 16.
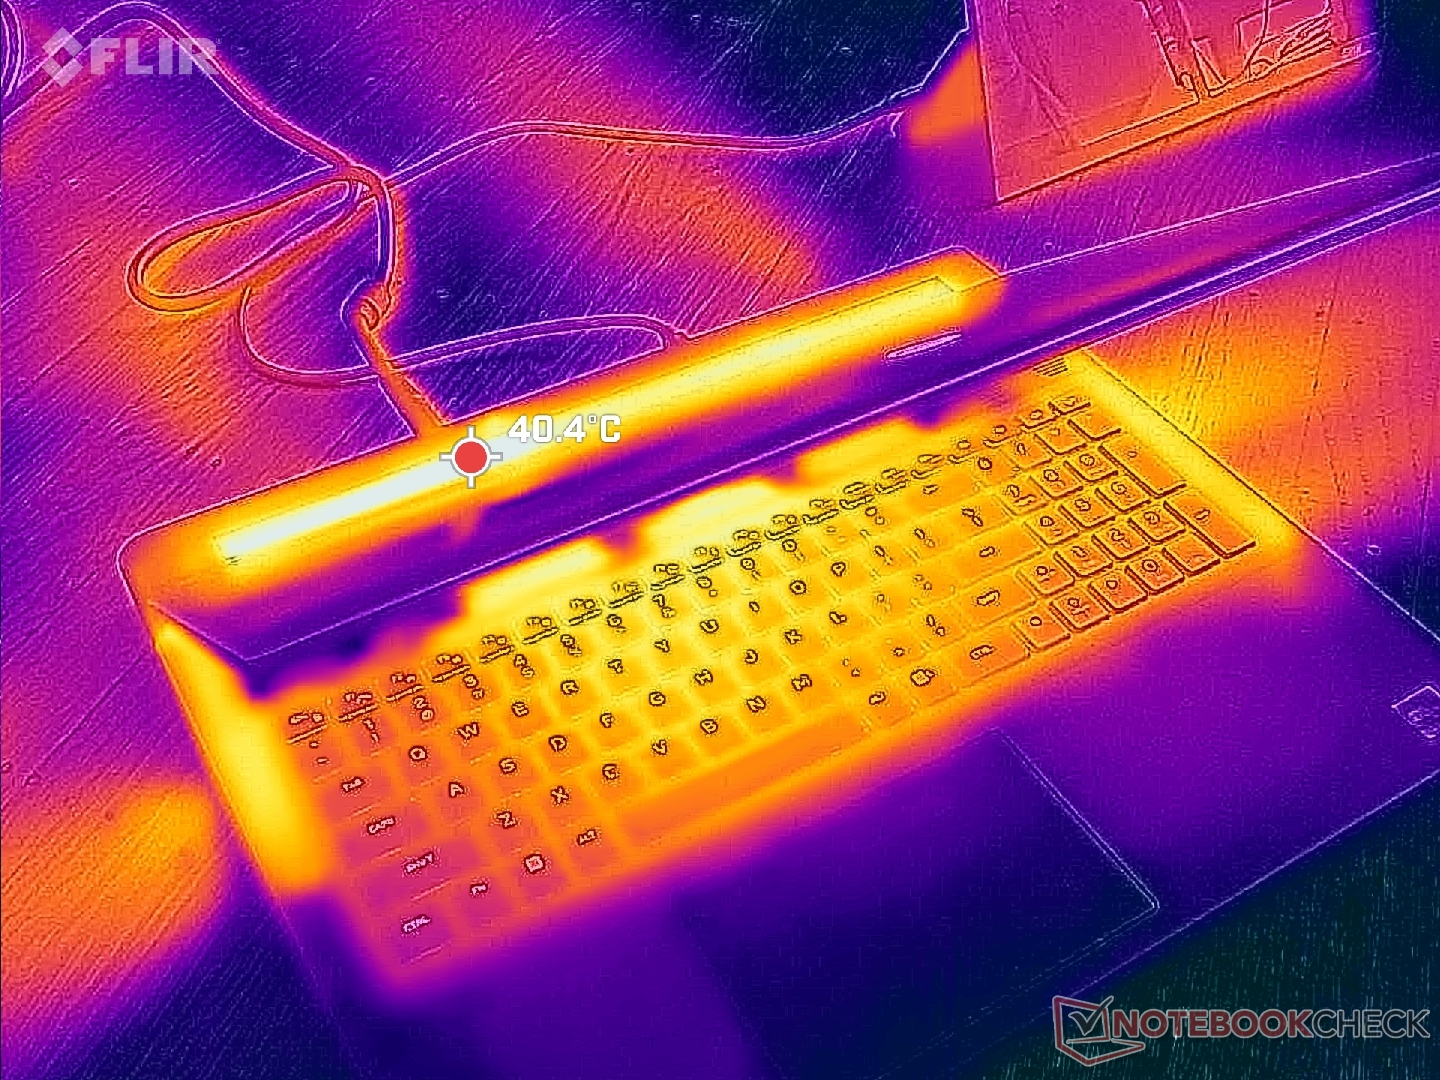
(±) La température maximale du côté supérieur est de 40.2 °C / 104 F, par rapport à la moyenne de 40.4 °C / 105 F, allant de 21.2 à 68.8 °C pour la classe Gaming.
(+) Le fond chauffe jusqu'à un maximum de 37.4 °C / 99 F, contre une moyenne de 43.2 °C / 110 F
(+) En utilisation inactive, la température moyenne du côté supérieur est de 26.6 °C / 80 F, par rapport à la moyenne du dispositif de 33.9 °C / 93 F.
(+) En jouant à The Witcher 3, la température moyenne du côté supérieur est de 30.6 °C / 87 F, alors que la moyenne de l'appareil est de 33.9 °C / 93 F.
(+) Les repose-poignets et le pavé tactile sont plus froids que la température de la peau avec un maximum de 24.6 °C / 76.3 F et sont donc froids au toucher.
(+) La température moyenne de la zone de l'appui-paume de dispositifs similaires était de 28.8 °C / 83.8 F (+4.2 °C / #7.5 F).
| Alienware m18 R1 AMD AMD Ryzen 9 7945HX, AMD Radeon RX 7900M | Alienware m18 R1 Intel Core i9-13980HX, NVIDIA GeForce RTX 4090 Laptop GPU | Acer Predator Helios 18 N23Q2 Intel Core i9-13900HX, NVIDIA GeForce RTX 4080 Laptop GPU | Razer Blade 18 RTX 4070 Intel Core i9-13950HX, NVIDIA GeForce RTX 4070 Laptop GPU | Asus ROG Strix Scar 18 2023 G834JY-N6005W Intel Core i9-13980HX, NVIDIA GeForce RTX 4090 Laptop GPU | MSI GE78HX 13VH-070US Intel Core i9-13950HX, NVIDIA GeForce RTX 4080 Laptop GPU | |
|---|---|---|---|---|---|---|
| Heat | 6% | -18% | -1% | -13% | -3% | |
| Maximum Upper Side * (°C) | 40.2 | 39 3% | 35 13% | 39.2 2% | 54 -34% | 37.4 7% |
| Maximum Bottom * (°C) | 37.4 | 36.4 3% | 56 -50% | 35.6 5% | 46 -23% | 45 -20% |
| Idle Upper Side * (°C) | 31.6 | 29.2 8% | 34 -8% | 31.8 -1% | 30 5% | 29.8 6% |
| Idle Bottom * (°C) | 30.6 | 27.8 9% | 39 -27% | 33.2 -8% | 31 -1% | 32.4 -6% |
* ... Moindre est la valeur, meilleures sont les performances
Test de stress
La température du CPU et la consommation d'énergie du boîtier lors du test Prime95 s'établissent respectivement à ~97 C et ~145 W, ce qui est en fait très similaire à ce que nous avons observé sur la configuration Intel avec le Core i9-13980HK. Le Turbo Boost est néanmoins plus élevé et plus agressif avec le CPU Intel au début du test, comme le montre notre section sur la consommation d'énergie.
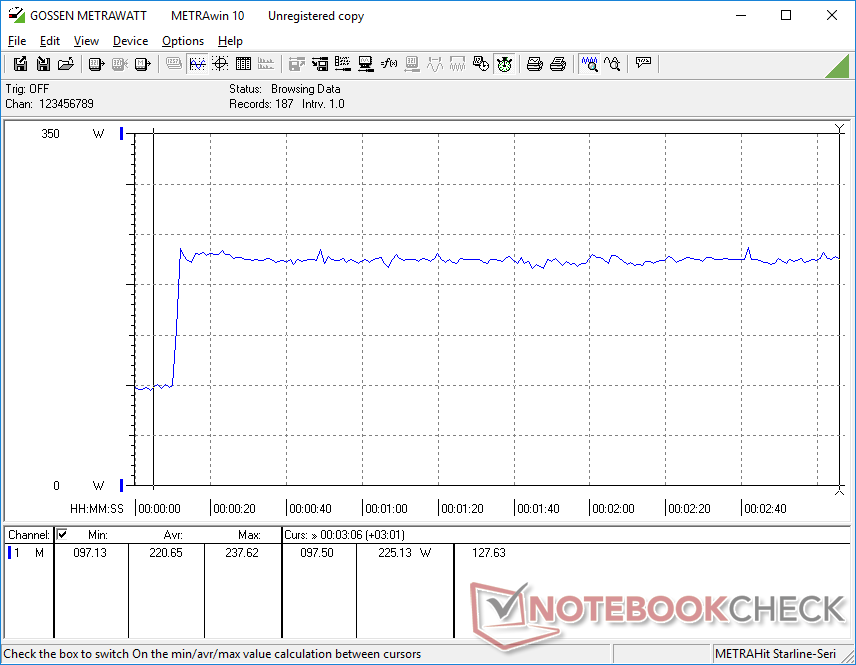
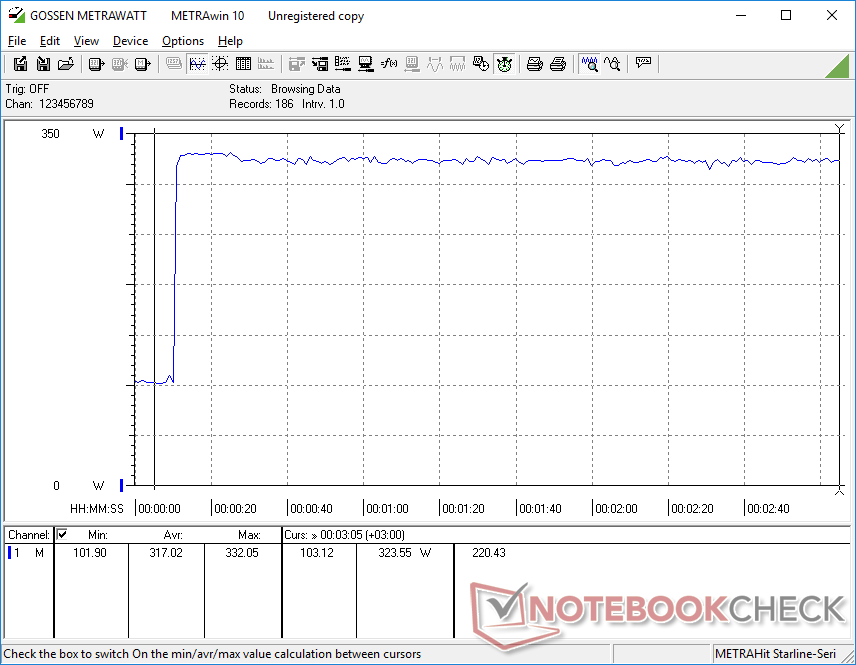
AMD annonce un TGP de 180 W que nous pouvons atteindre en mode Overdrive Witcher 3 en mode Overdrive. En revanche, si vous passez en mode équilibré ou en mode performance, le TGP est ramené à 165 W, comme le montrent les captures d'écran ci-dessous. Les fréquences d'horloge du GPU sont légèrement inférieures, ce qui correspond à nos scores sur Fire Strike mentionnés ci-dessus, ce qui signifie que le mode Overdrive, très bruyant, est obligatoire pour obtenir des performances maximales.
En répétant le Witcher 3 avec notre configuration Intel-Nvidia RTX 4090 donnerait une consommation d'énergie de la carte GPU comparativement plus faible de 161 W pour montrer une performance par watt supérieure à celle de notre Radeon RX 7900M.
Notez que les températures du CPU et du GPU sont légèrement plus basses en mode Overdrive qu'en mode Balanced ou Performance, car les ventilateurs sont nettement plus bruyants.
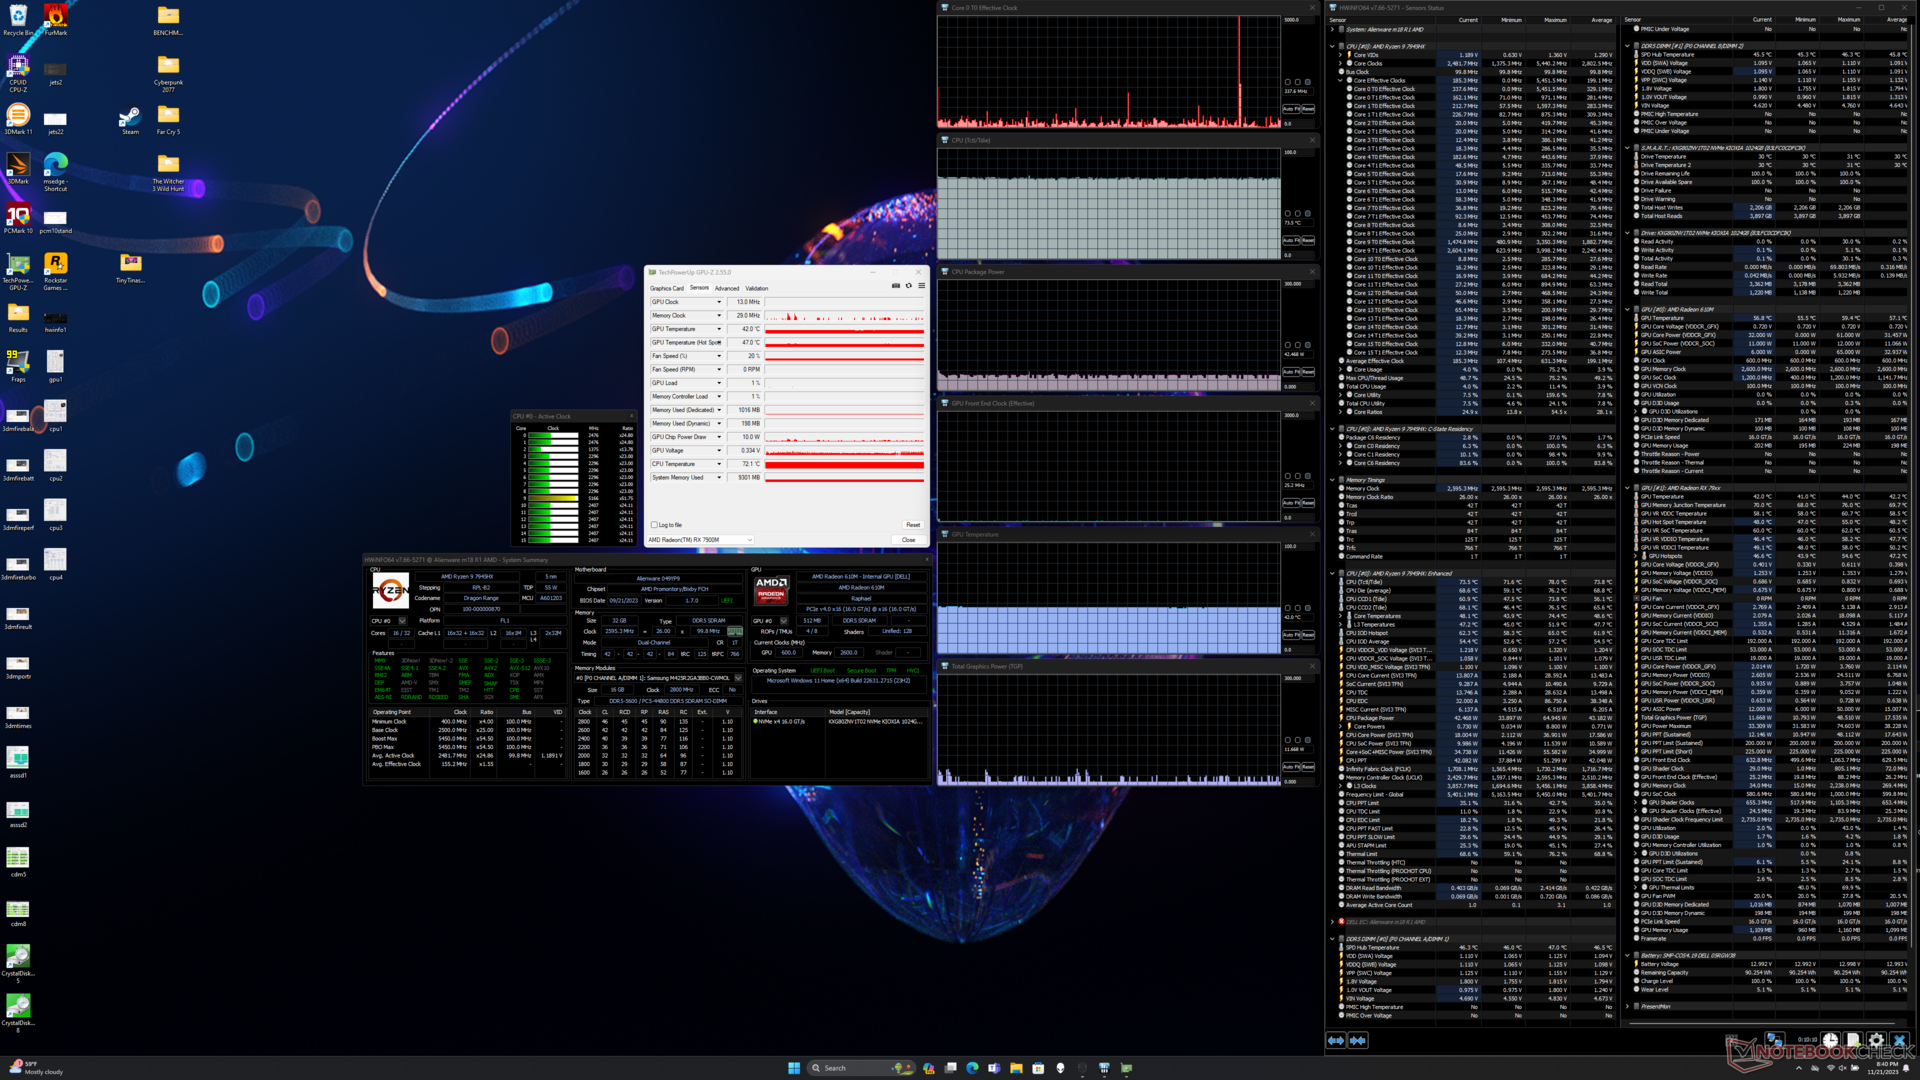
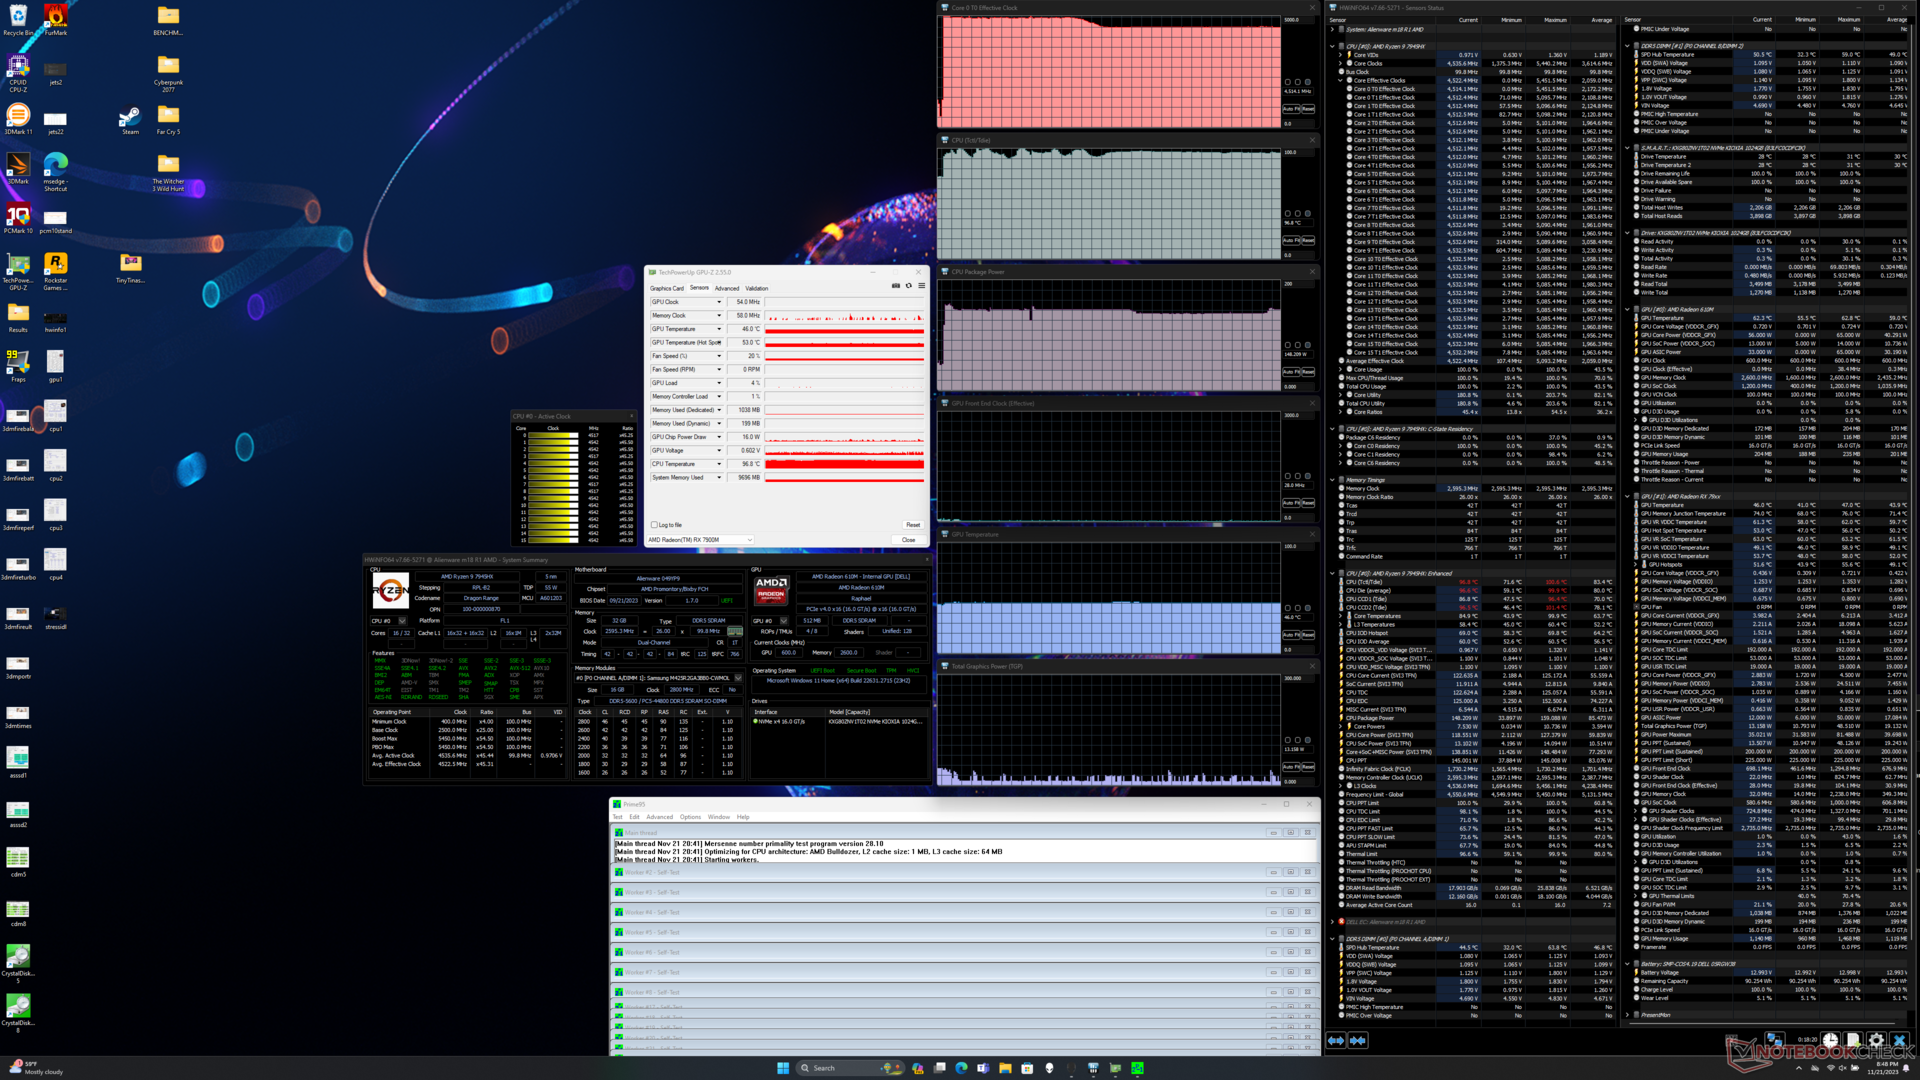
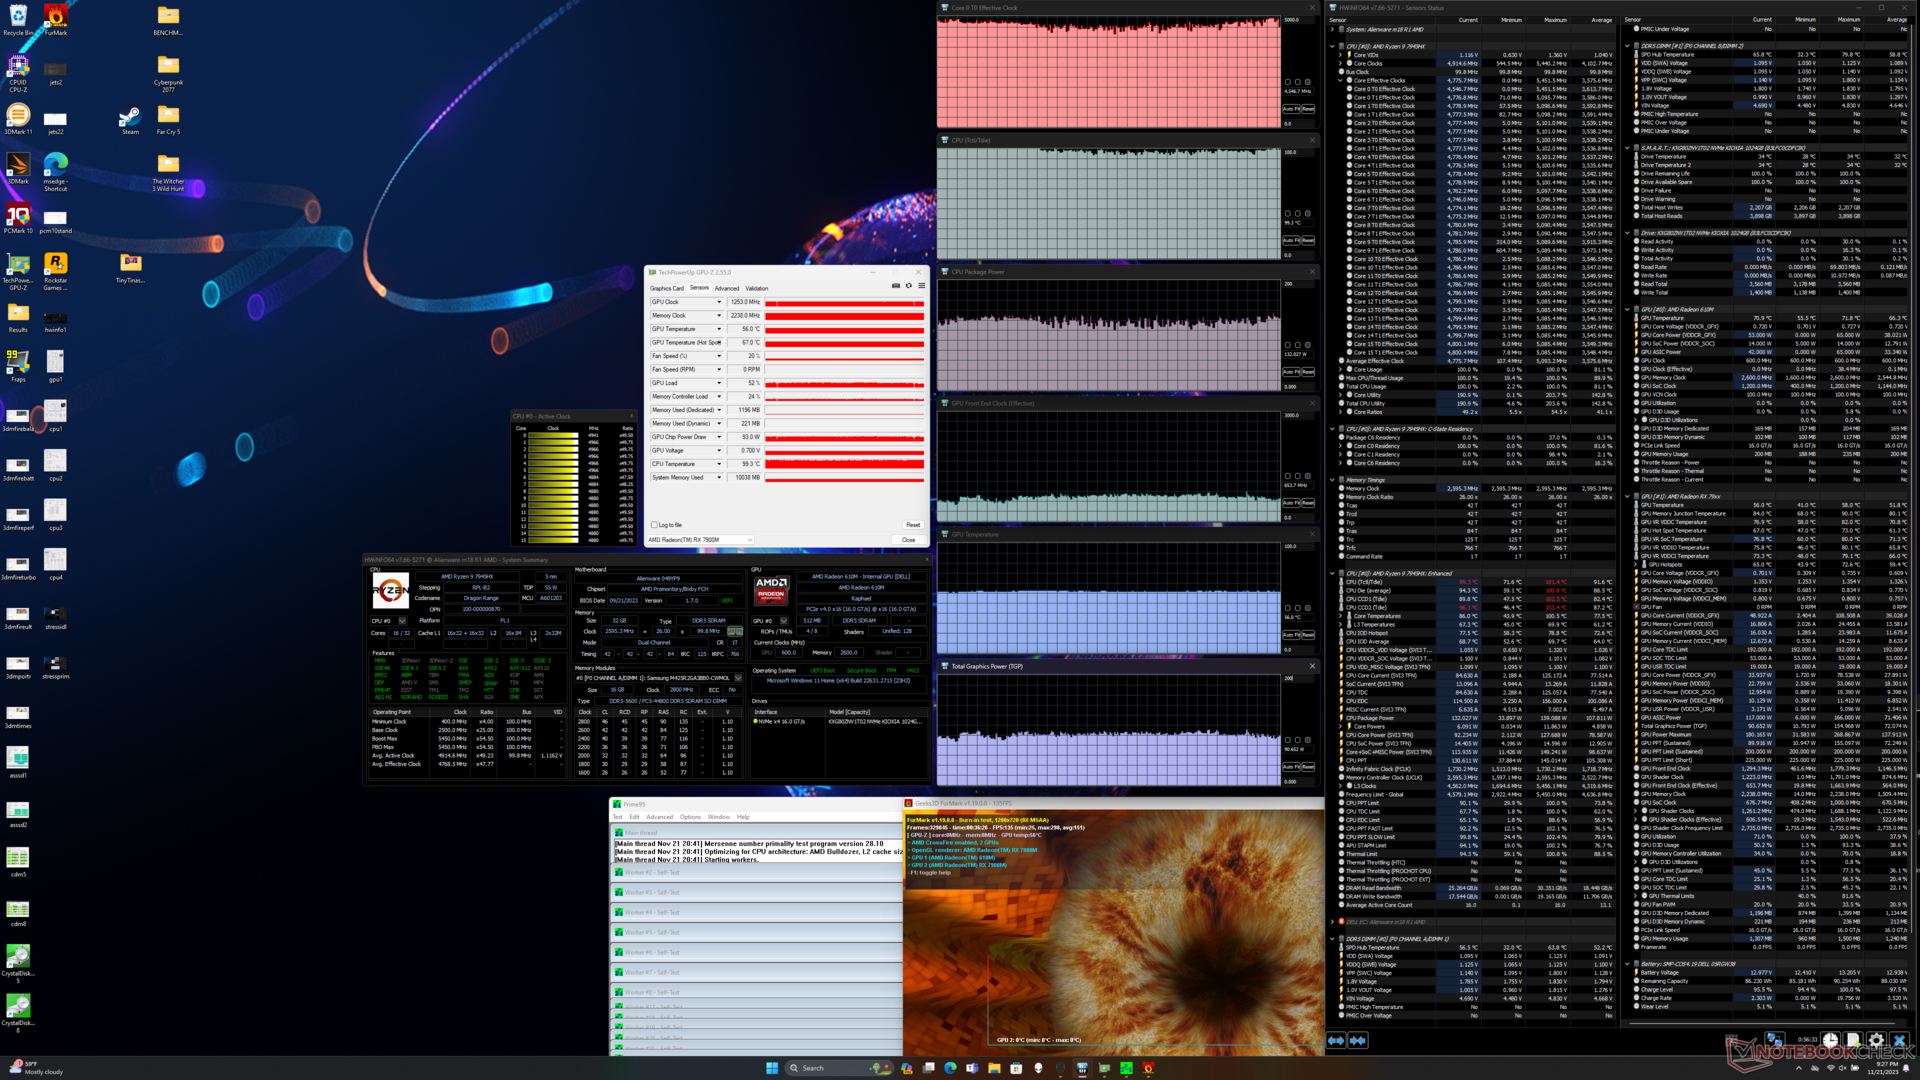
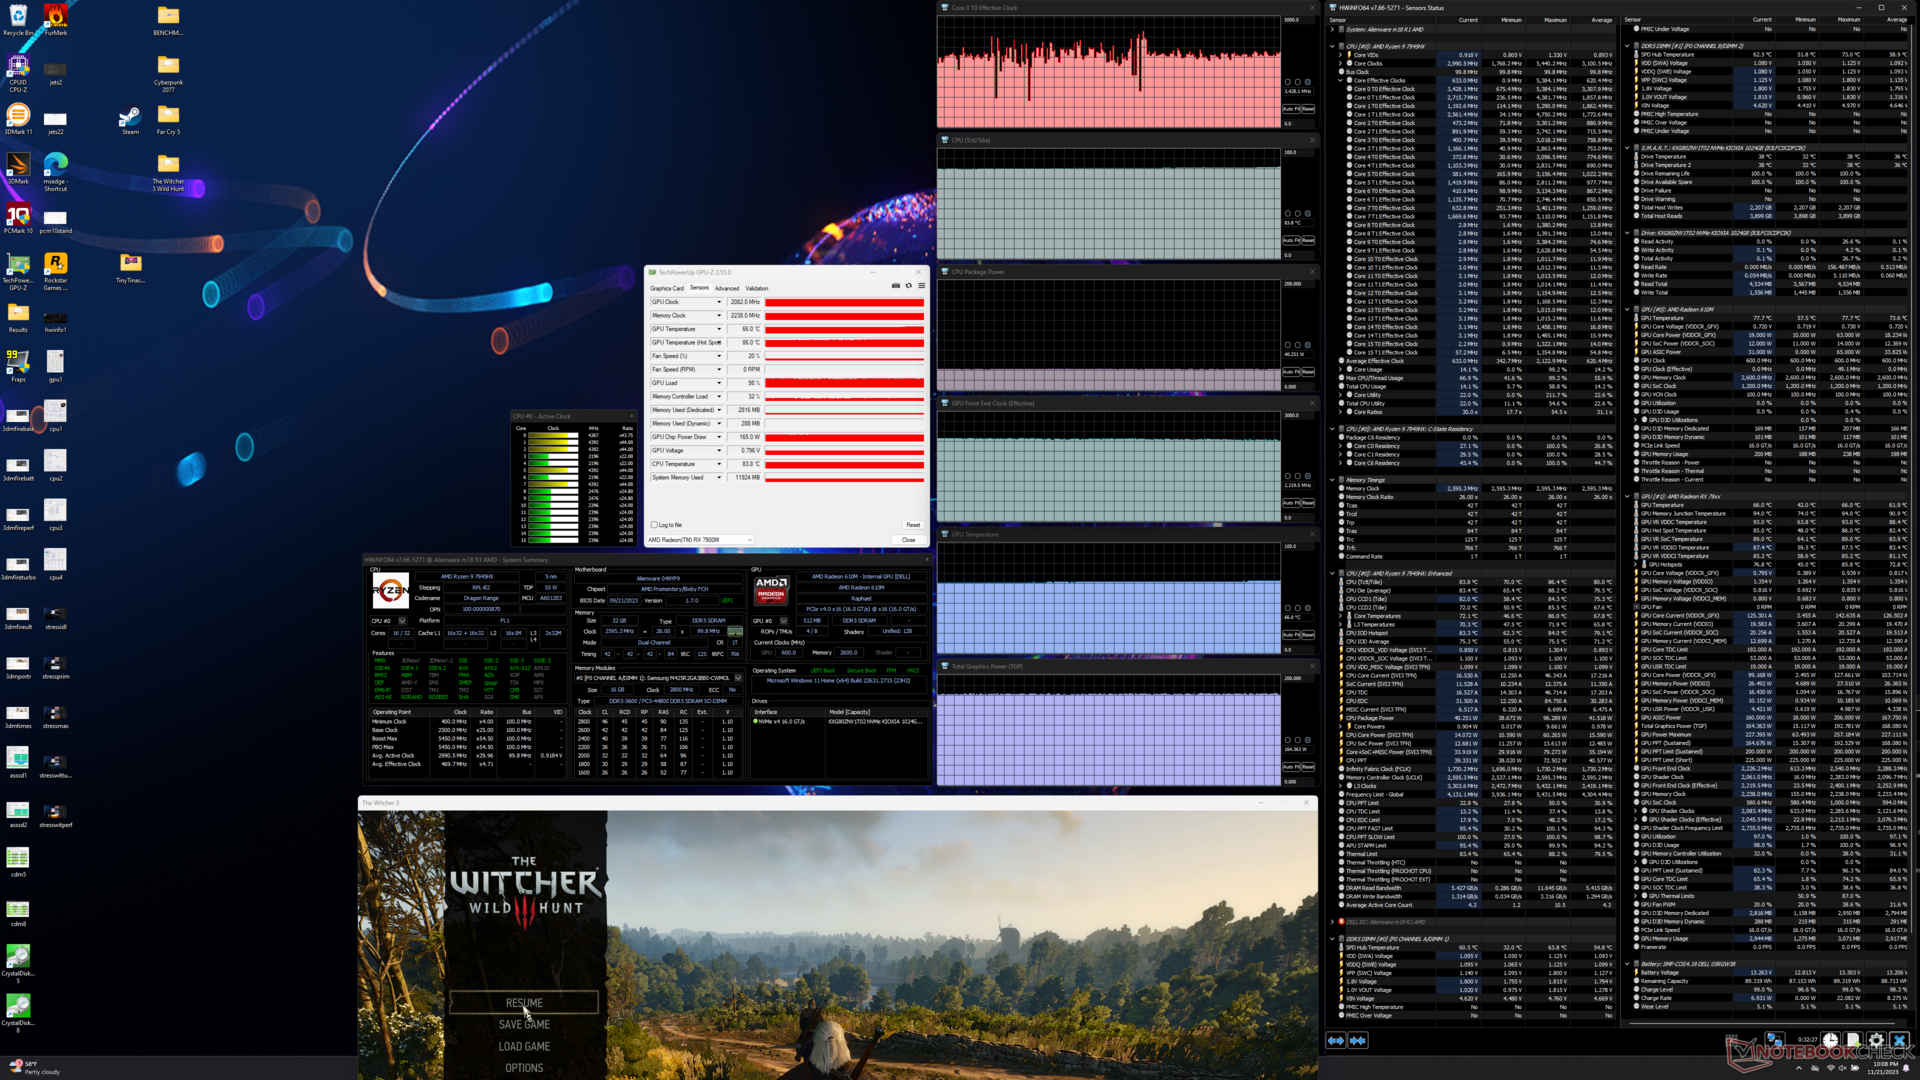
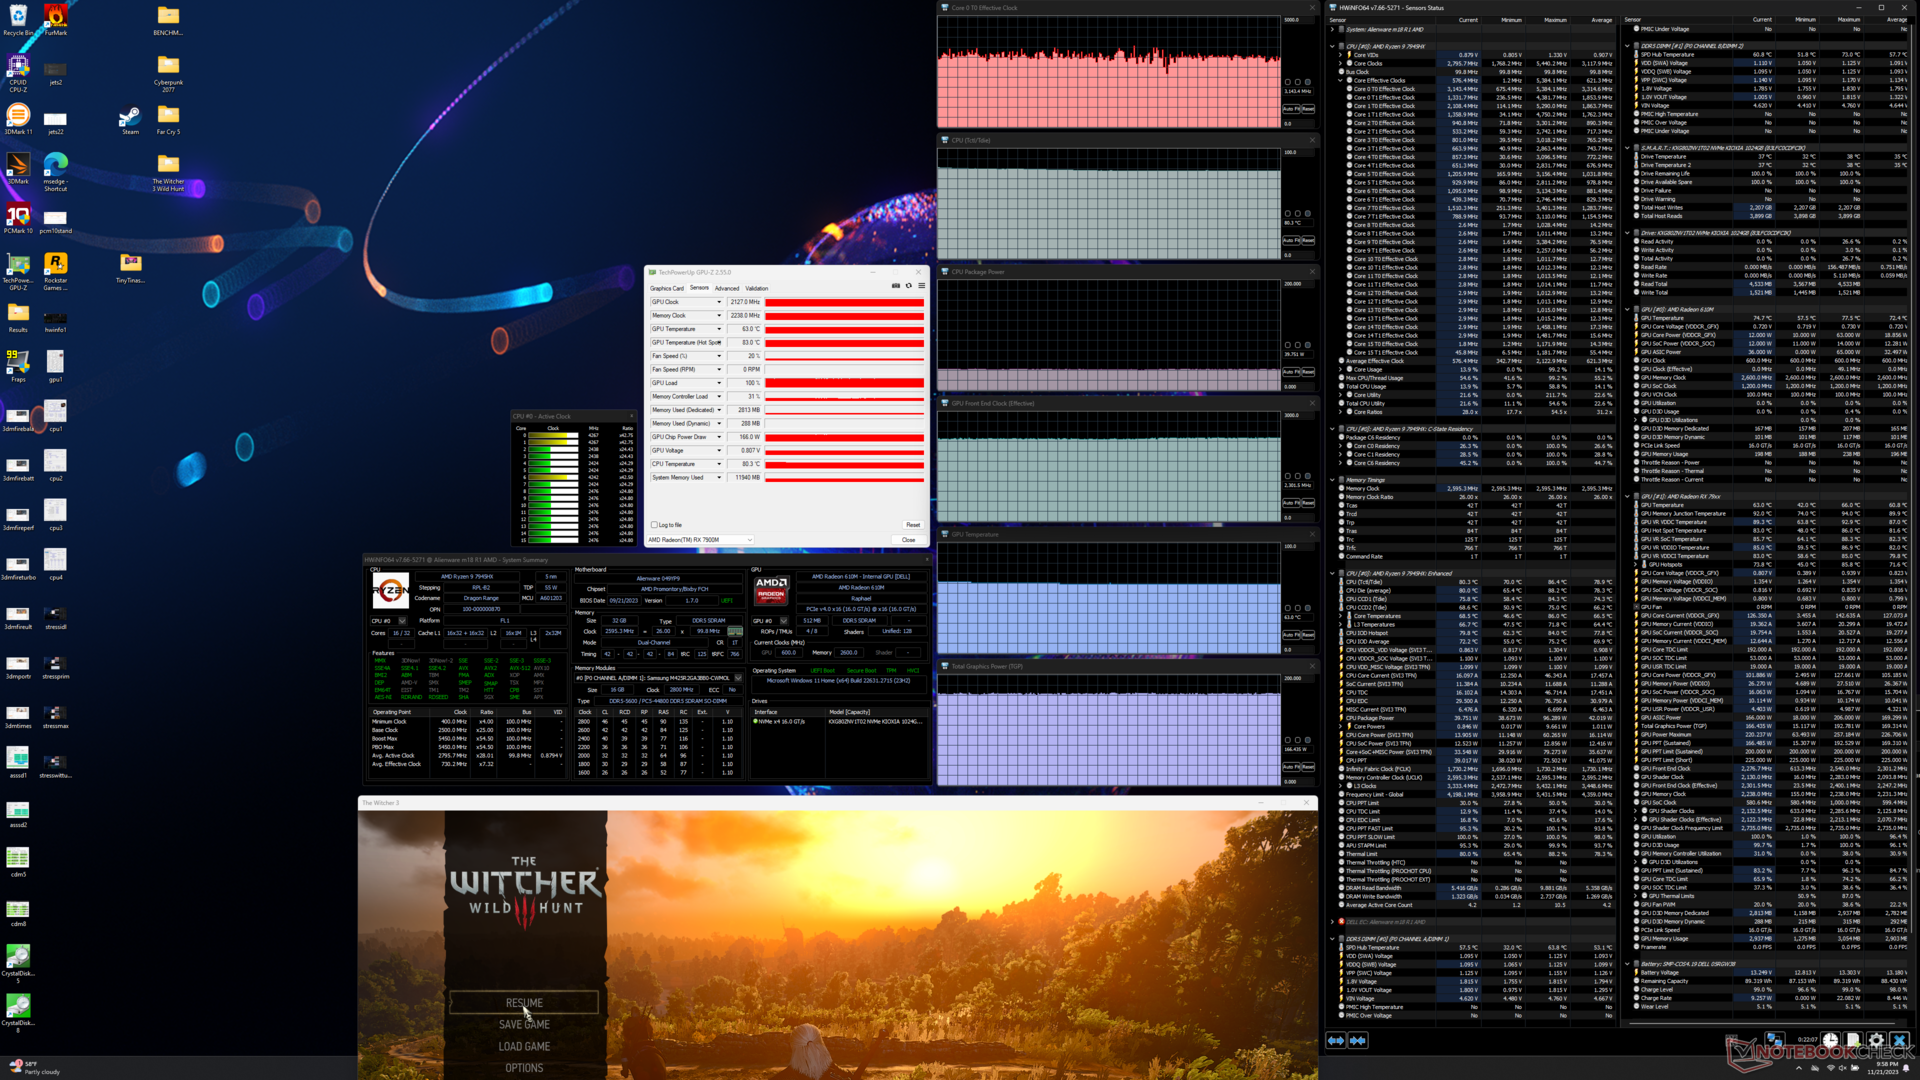
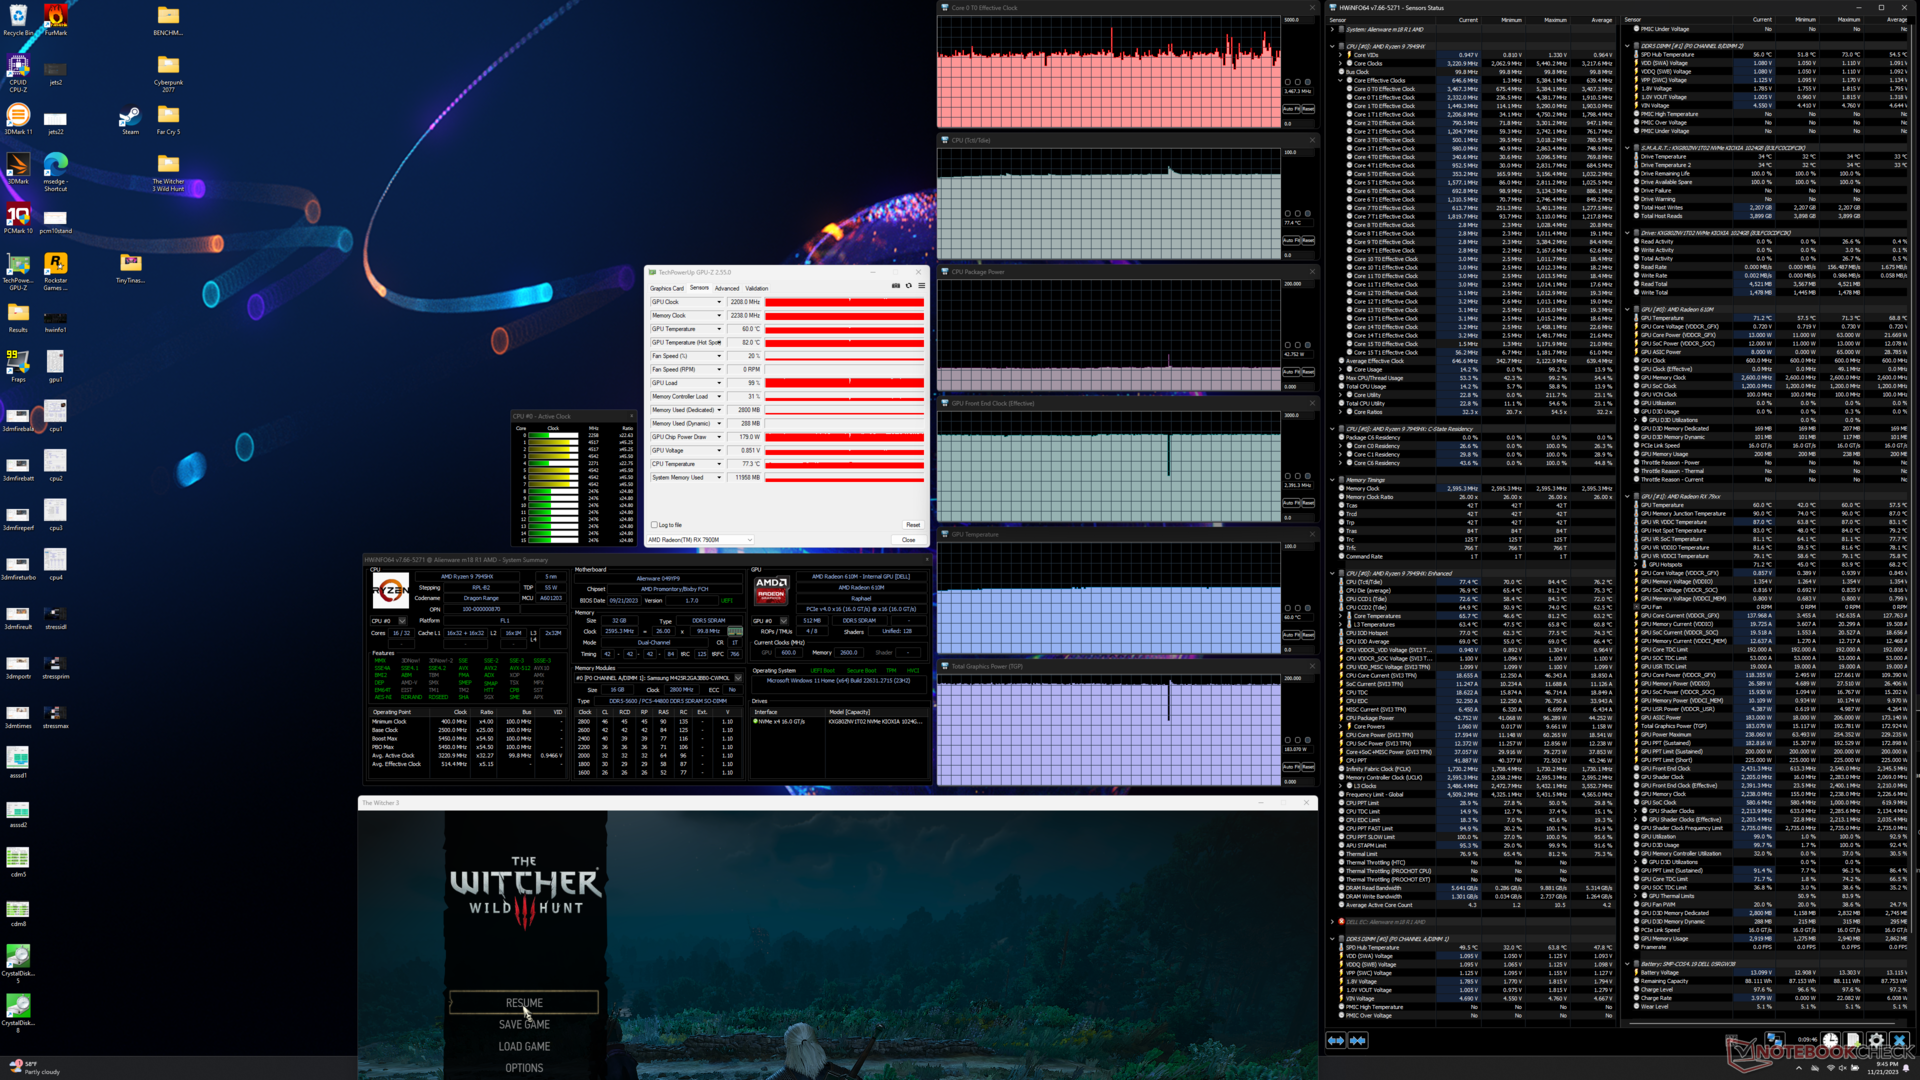
| Horloge du CPU (GHz) | Horloge du GPU (MHz) | Température moyenne du CPU (°C) | Température moyenne du GPU (°C) | |
| Système en veille | -- | -- | 74 | 47 |
| Prime95 Stress | 4.5 - 4.9 | -- | 97 | 53 |
| Prime95 + FurMark Stress | ~4.6 | 1253 | 99 | 67 |
| Witcher 3 Stress(mode Overdrive) | ~3.5 | 2208 | 77 | 82 |
| Witcher 3 Stress (mode Performance) | ~3,2 | 2127 | 80 | 83 |
| Witcher 3 Stress (mode équilibré) | ~3.4 | 2082 | 84 | 86 |
Intervenants
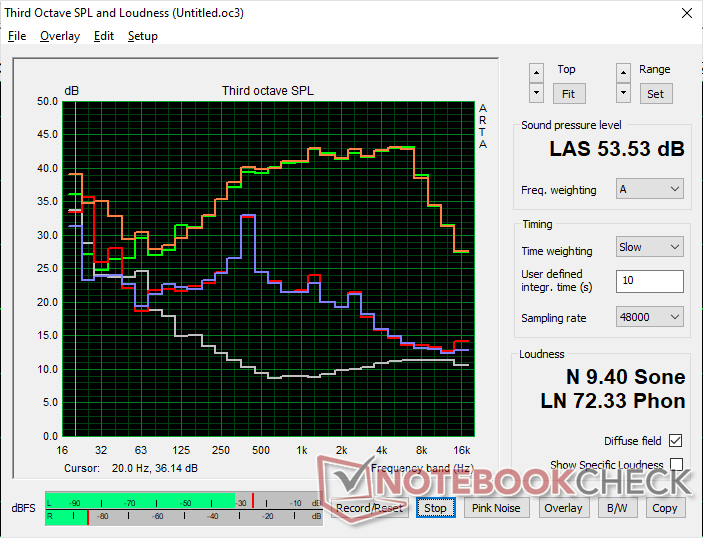
Alienware m18 R1 AMD analyse audio
(+) | les haut-parleurs peuvent jouer relativement fort (84.2# dB)
Basses 100 - 315 Hz
(-) | presque aucune basse - en moyenne 22.7% plus bas que la médiane
(-) | les basses ne sont pas linéaires (15.8% delta à la fréquence précédente)
Médiums 400 - 2000 Hz
(+) | médiane équilibrée - seulement 1.5% de la médiane
(+) | les médiums sont linéaires (3.8% delta à la fréquence précédente)
Aiguës 2 - 16 kHz
(+) | des sommets équilibrés - à seulement 3.6% de la médiane
(+) | les aigus sont linéaires (5.5% delta à la fréquence précédente)
Globalement 100 - 16 000 Hz
(±) | la linéarité du son global est moyenne (16.5% de différence avec la médiane)
Par rapport à la même classe
» 42% de tous les appareils testés de cette catégorie étaient meilleurs, 7% similaires, 51% pires
» Le meilleur avait un delta de 6%, la moyenne était de 18%, le pire était de 132%.
Par rapport à tous les appareils testés
» 28% de tous les appareils testés étaient meilleurs, 6% similaires, 66% pires
» Le meilleur avait un delta de 4%, la moyenne était de 24%, le pire était de 134%.
Apple MacBook Pro 16 2021 M1 Pro analyse audio
(+) | les haut-parleurs peuvent jouer relativement fort (84.7# dB)
Basses 100 - 315 Hz
(+) | bonne basse - seulement 3.8% loin de la médiane
(+) | les basses sont linéaires (5.2% delta à la fréquence précédente)
Médiums 400 - 2000 Hz
(+) | médiane équilibrée - seulement 1.3% de la médiane
(+) | les médiums sont linéaires (2.1% delta à la fréquence précédente)
Aiguës 2 - 16 kHz
(+) | des sommets équilibrés - à seulement 1.9% de la médiane
(+) | les aigus sont linéaires (2.7% delta à la fréquence précédente)
Globalement 100 - 16 000 Hz
(+) | le son global est linéaire (4.6% différence à la médiane)
Par rapport à la même classe
» 0% de tous les appareils testés de cette catégorie étaient meilleurs, 0% similaires, 100% pires
» Le meilleur avait un delta de 5%, la moyenne était de 17%, le pire était de 45%.
Par rapport à tous les appareils testés
» 0% de tous les appareils testés étaient meilleurs, 0% similaires, 100% pires
» Le meilleur avait un delta de 4%, la moyenne était de 24%, le pire était de 134%.
Gestion de l'énergie
Consommation électrique
La consommation d'énergie est un va-et-vient entre les configurations AMD-AMD et Intel-Nvidia de l'Alienware m18 R1. D'un côté, le Ryzen 7 7945HX est plus efficace que le Core i9-13980HX ; il est capable de réaliser le benchmark CineBench R15 xT à peu près dans le même temps que le Core i9 tout en demandant 50 à 60 W d'énergie en moins. En revanche, la Radeon RX 7900M est moins efficace que les RTX 4080 ou 4090 de GeForce; l'exécution de FurMark, par exemple, consommerait environ 50 W de plus sur notre configuration AMD. Les performances globales par watt peuvent donc pencher en faveur d'une configuration plutôt qu'une autre, en fonction de l'intensité du CPU ou du GPU de vos applications.
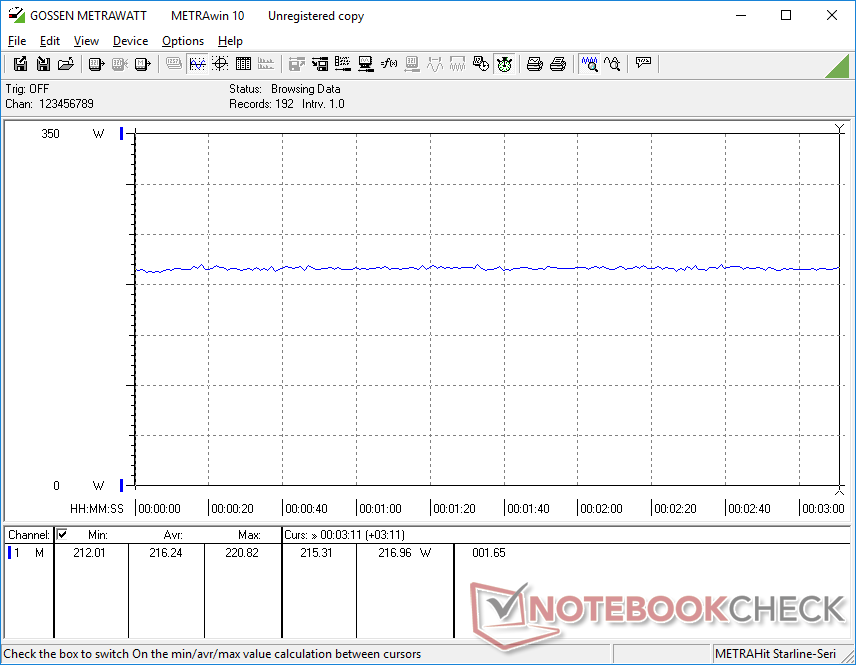
L'utilisation simultanée du CPU et du GPU à 100 % consommerait jusqu'à 333 W de l'adaptateur secteur de 330 W, comme nous l'avons observé avec la configuration Intel-Nvidia. Cependant, le CPU Intel Core i9 a tendance à consommer plus d'énergie que notre Ryzen 9 et donc la consommation globale a tendance à être plus élevée que notre configuration tout AMD lorsque vous jouez. Ceci peut être observé lors de l'exécution de Witcher 3 comme le montre le tableau ci-dessous.
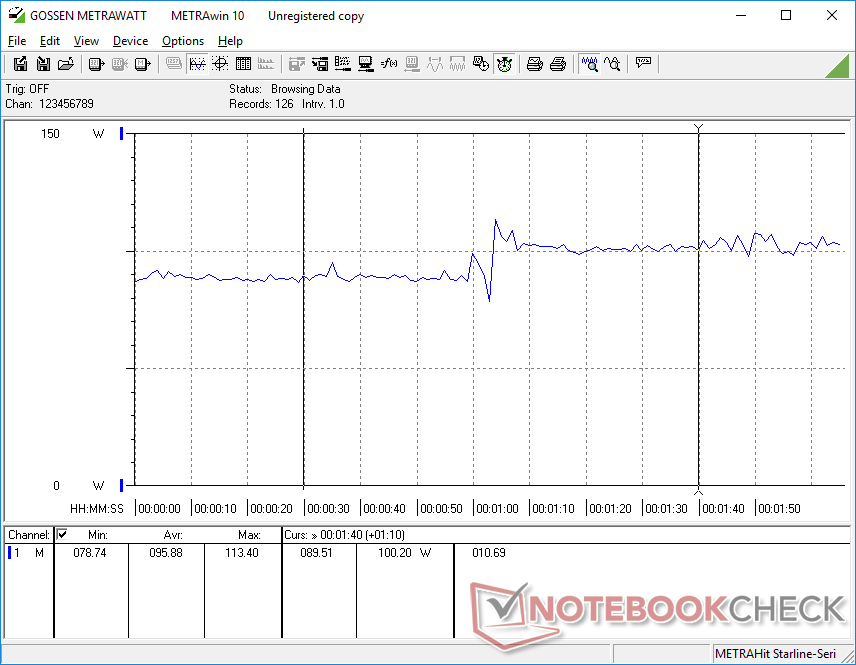
La consommation au ralenti sur le bureau n'est pas optimisée, ce qui peut contribuer à la très courte durée de vie de la batterie. Nous sommes parfois en mesure de mesurer un niveau de consommation aussi élevé que 101 W même lorsque le profil d'alimentation est équilibré et qu'aucune application active n'est en cours d'exécution. La consommation en mode veille est également très élevée (25 W), alors qu'elle devrait être de l'ordre de 1 ou 2 watts.
Nous vous recommandons de réduire le taux de rafraîchissement de 480 Hz à 120 Hz si la consommation d'énergie vous préoccupe, car ce simple changement permet d'économiser jusqu'à 11 W, comme le montre le graphique ci-dessous. Il est dommage que cet écran n'offre pas d'options de taux de rafraîchissement variable.
| Éteint/en veille | |
| Au repos | |
| Fortement sollicité |
|
Légende:
min: | |
| Alienware m18 R1 AMD R9 7945HX, Radeon RX 7900M, Kioxia XG8 KXG80ZNV1T02, IPS, 1920x1200, 18" | HP Omen 16-wf000 i7-13700HX, GeForce RTX 4080 Laptop GPU, SK hynix PC801 HFS002TEJ9X101N, IPS, 2560x1440, 16.1" | Alienware m18 R1 i9-13980HX, GeForce RTX 4090 Laptop GPU, SK hynix PC801 HFS001TEJ9X101N, IPS, 1920x1200, 18" | Acer Predator Helios 18 N23Q2 i9-13900HX, GeForce RTX 4080 Laptop GPU, Samsung PM9A1 MZVL22T0HBLB, IPS, 2560x1600, 18" | Razer Blade 18 RTX 4070 i9-13950HX, GeForce RTX 4070 Laptop GPU, SSSTC CA6-8D1024, IPS, 2560x1600, 18" | MSI GE78HX 13VH-070US i9-13950HX, GeForce RTX 4080 Laptop GPU, Samsung PM9A1 MZVL22T0HBLB, IPS, 2560x1600, 17" | |
|---|---|---|---|---|---|---|
| Power Consumption | 32% | 13% | 31% | 25% | 29% | |
| Idle Minimum * (Watt) | 30.3 | 21.8 28% | 21.6 29% | 16 47% | 24.5 19% | 16.1 47% |
| Idle Average * (Watt) | 55.6 | 26 53% | 25.2 55% | 19 66% | 34.1 39% | 24 57% |
| Idle Maximum * (Watt) | 101.1 | 36 64% | 56.7 44% | 21.3 79% | 47.7 53% | 34 66% |
| Load Average * (Watt) | 160.3 | 115.5 28% | 164.1 -2% | 124 23% | 140 13% | 123.6 23% |
| Witcher 3 ultra * (Watt) | 216 | 214 1% | 311 -44% | 289 -34% | 202 6% | 286 -32% |
| Load Maximum * (Watt) | 332.1 | 269.7 19% | 338.9 -2% | 319 4% | 261 21% | 285.7 14% |
* ... Moindre est la valeur, meilleures sont les performances
Power Consumption Witcher 3 / Stresstest
Power Consumption external Monitor
Autonomie de la batterie
Les durées d'utilisation sont très faibles, même pour un ordinateur portable de jeu de grande taille. Même dans le meilleur des cas, lorsque tout est éteint ou réglé au minimum (AlienFX désactivé, luminosité minimale de l'écran, taux de rafraîchissement de 120 Hz, aucune application en cours, sans fil désactivé, mode d'économie de la batterie), nous n'avons pu enregistrer qu'un peu moins de 4,5 heures d'autonomie avant l'arrêt automatique de l'ordinateur. Cette durée tombe à 95 minutes lorsque vous naviguez sur le web, par rapport à la tablette Acer Predator Helios 18 ou le Razer Blade 18 qui peuvent chacun durer quelques heures de plus.
Le chargement de la batterie vide à la pleine capacité avec l'adaptateur secteur inclus prend environ 2 à 2,5 heures. Le modèle ne prend pas en charge la charge via USB-C, contrairement à la plupart des autres ordinateurs portables de jeu modernes, de sorte que vous êtes essentiellement lié à l'énorme adaptateur secteur de 330 W lorsque vous voyagez.
| Alienware m18 R1 AMD R9 7945HX, Radeon RX 7900M, 97 Wh | Alienware m18 R1 i9-13980HX, GeForce RTX 4090 Laptop GPU, 97 Wh | Acer Predator Helios 18 N23Q2 i9-13900HX, GeForce RTX 4080 Laptop GPU, 90 Wh | Razer Blade 18 RTX 4070 i9-13950HX, GeForce RTX 4070 Laptop GPU, 91.7 Wh | Asus ROG Strix Scar 18 2023 G834JY-N6005W i9-13980HX, GeForce RTX 4090 Laptop GPU, 90 Wh | MSI GE78HX 13VH-070US i9-13950HX, GeForce RTX 4080 Laptop GPU, 99 Wh | |
|---|---|---|---|---|---|---|
| Autonomie de la batterie | 77% | 179% | 109% | 218% | 171% | |
| Reader / Idle (h) | 4.5 | 5.6 24% | 7 56% | 7.3 62% | ||
| WiFi v1.3 (h) | 1.4 | 4.3 207% | 4.4 214% | 4 186% | 7.1 407% | 6.1 336% |
| Load (h) | 0.7 | 0.7 0% | 1.7 143% | 1.3 86% | 0.9 29% | 1.5 114% |
| H.264 (h) | 4.8 | 7 | ||||
| Witcher 3 ultra (h) | 0.9 |
Points positifs
Points négatifs
Verdict - Le challenger mobile GeForce RTX 4080 que nous attendons depuis longtemps
À ce jour, la configuration Core i9-13900HX/RTX 4080 de l'Alienware m18 R1 avec 32 Go de RAM, 1 TB SSD et un écran 1200p coûte 2950 USD. La configuration Ryzen 9 7945HX/RX 7900M avec exactement la même mémoire vive, le même disque dur et le même écran est vendue au prix de 2300 USD. L'option tout AMD offre des performances CPU plus rapides et des performances GPU quasiment identiques pour près de 700 USD de moins. Il va sans dire que la performance par dollar est clairement l'argument de vente le plus fort de la nouvelle UGS AMD et l'une des principales raisons de laisser tomber Intel et Nvidia. La différence de prix est si importante que l'on pourrait même oublier tous les problèmes que nous avons rencontrés sur notre première unité de test juste pour économiser des centaines d'euros.
Les ordinateurs portables de jeu équipés de la carte RTX 4080 ( GeForce ) ont bénéficié de prix exorbitants tout au long de l'année. La Radeon RX 7900M d'AMD, très économique, est le candidat idéal pour ramener ces prix sur terre.
Malgré cela, les bugs ne sont pas négligeables. L'extinction de l'écran, les problèmes de démarrage, les sauts d'images en lecture vidéo, les bégaiements dans les jeux et la consommation d'énergie anormalement élevée au ralenti sont autant de problèmes qui devraient être résolus. Par conséquent, il n'est pas nécessaire de se précipiter pour acheter l'Alienware m18 R1 tout AMD en attendant que les correctifs et la prise en charge de la FSR 3 soient progressivement mis en place.
Il y a encore des raisons de choisir Intel-Nvidia plutôt qu'AMD-AMD une fois que tous les bugs auront été résolus. Aussi impressionnante que soit la Radeon 7900M, la RTX 4080 mobile est toujours plus rapide en moyenne, surtout si vous aimez jouer avec la RT activée. Ceux qui veulent ce qu'il y a de mieux et de plus rapide, quel qu'en soit le prix, devraient donc s'en tenir à la série GeForce. Pour le reste des mortels au budget plus serré, la Radeon 7900M semble être une alternative solide à la RTX 4080 que beaucoup attendent. Espérons que ce GPU fera son apparition sur de nombreux autres ordinateurs portables de jeu dans un avenir proche, et pas seulement sur une poignée d'entre eux.
Prix et disponibilité
Dell propose dès à présent l'Alienware m18 R1 dans tous les niveaux de configuration. Best Buy propose également la configuration Ryzen 9/7900M pour 2800 USD.
Alienware m18 R1 AMD
- 11/26/2023 v7 (old)
Allen Ngo
Transparency
La sélection des appareils à examiner est effectuée par notre équipe éditoriale. L'échantillon de test a été prêté à l'auteur par le fabricant ou le détaillant pour les besoins de cet examen. Le prêteur n'a pas eu d'influence sur cette évaluation et le fabricant n'a pas reçu de copie de cette évaluation avant sa publication. Il n'y avait aucune obligation de publier cet article. En tant que média indépendant, Notebookcheck n'est pas soumis à l'autorité des fabricants, des détaillants ou des éditeurs.
Voici comment Notebookcheck teste
Chaque année, Notebookcheck examine de manière indépendante des centaines d'ordinateurs portables et de smartphones en utilisant des procédures standardisées afin de garantir que tous les résultats sont comparables. Nous avons continuellement développé nos méthodes de test depuis environ 20 ans et avons établi des normes industrielles dans le processus. Dans nos laboratoires de test, des équipements de mesure de haute qualité sont utilisés par des techniciens et des rédacteurs expérimentés. Ces tests impliquent un processus de validation en plusieurs étapes. Notre système d'évaluation complexe repose sur des centaines de mesures et de points de référence bien fondés, ce qui garantit l'objectivité.Price comparison

