Test du Razer Blade 18 : plus petit que de nombreux portables de jeu de 17 pouces
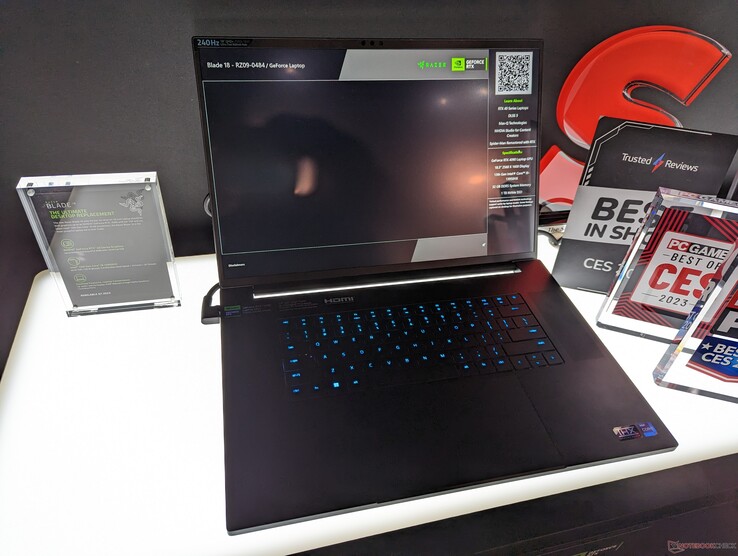
Dévoilé au CES 2023, le Blade 18 offre la plus grande taille d'écran jamais vue pour un ordinateur portable Blade tout en arborant le design familier du châssis Razer. Le lancement du modèle coïncide avec le lancement de la série mobile Intel Core 13e génération et de la série mobile Nvidia GeForce 40 Ada Lovelace, tout comme avec le récent Blade 16.
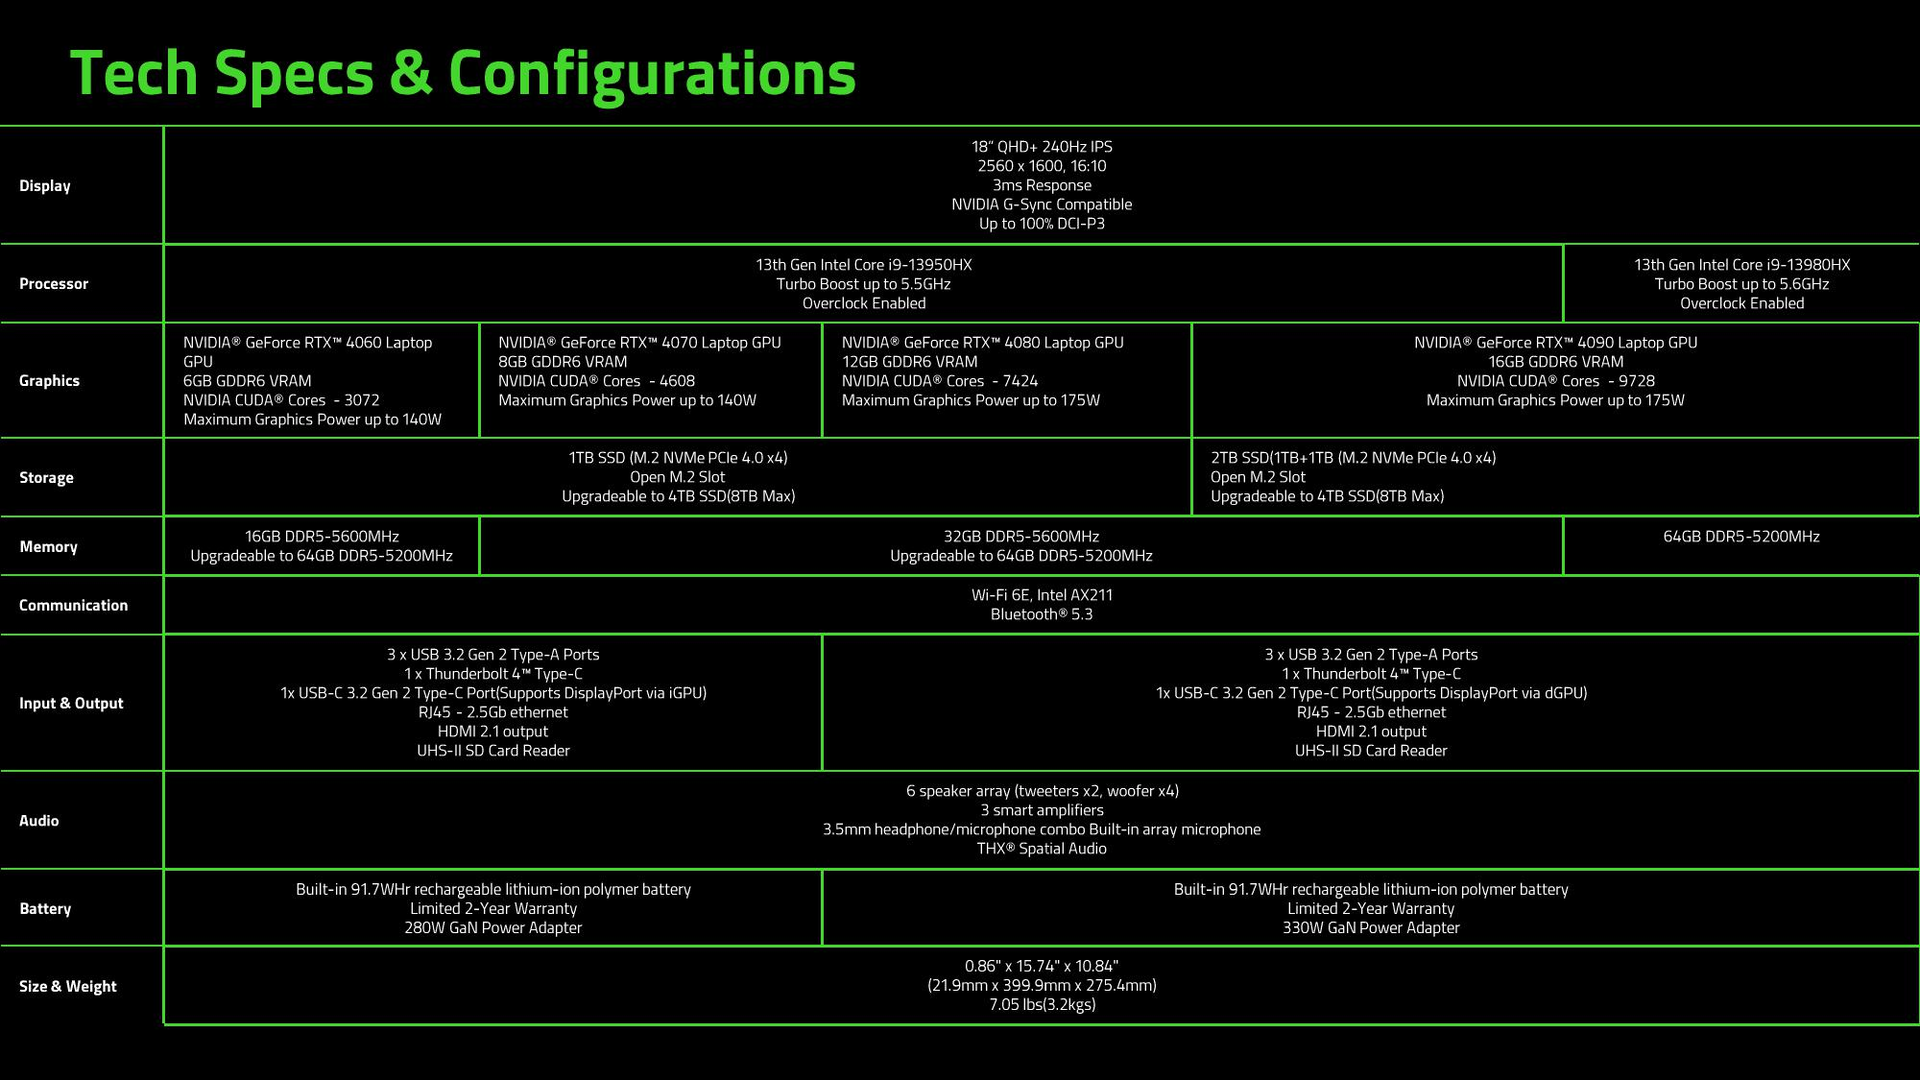
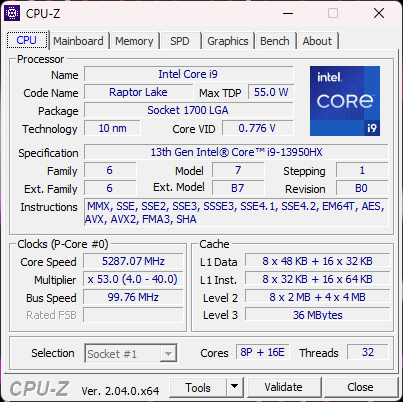
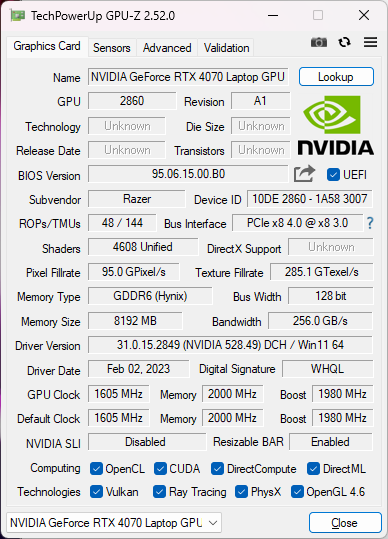
Les configurations vont du CPU Core i9-13950HX et du GPU RTX 4060 de 140 W GeForce jusqu'au Core i9-13980HX et au RTX 4090 de 175 W. Toutes les configurations sont équipées de la même dalle IPS 16:10 QHD+ 240 Hz. Notre unité d'examen spécifique est une configuration intermédiaire avec le RTX 4070 de 140 W au prix de détail d'environ 3200 USD.
les ordinateurs portables de 18 pouces sont peu courants, le MSI GT83 Titan, vieux de 6 ans, en étant un exemple notable. Asus et Dell devraient lancer respectivement le ROG Strix Scar 18 et le Alienware m18 pour concurrencer directement le Razer Blade 18.
Plus de commentaires sur Razer :
Comparaison avec les concurrents potentiels
Note | Date | Modèle | Poids | Épaisseur | Taille | Résolution | Prix |
|---|---|---|---|---|---|---|---|
| 91.4 % v7 (old) | 02/23 | Razer Blade 18 RTX 4070 i9-13950HX, GeForce RTX 4070 Laptop GPU | 3 kg | 21.9 mm | 18.00" | 2560x1600 | |
| 89.9 % v7 (old) | 07/22 | Razer Blade 17 Early 2022 i9-12900H, GeForce RTX 3080 Ti Laptop GPU | 2.8 kg | 19.9 mm | 17.30" | 3840x2160 | |
| 89 % v7 (old) | 02/23 | MSI Titan GT77 HX 13VI i9-13950HX, GeForce RTX 4090 Laptop GPU | 3.5 kg | 23 mm | 17.30" | 3840x2160 | |
| 83.3 % v7 (old) | 01/23 | Gigabyte G7 KE i5-12500H, GeForce RTX 3060 Laptop GPU | 2.6 kg | 25 mm | 17.30" | 1920x1080 | |
| 86.1 % v7 (old) | 01/23 | Alienware m17 R5 (R9 6900HX, RX 6850M XT) R9 6900HX, Radeon RX 6850M XT | 3.4 kg | 26.7 mm | 17.00" | 3840x2160 | |
| 86.9 % v7 (old) | 11/22 | Asus ROG Strix Scar 17 SE G733CX-LL014W i9-12950HX, GeForce RTX 3080 Ti Laptop GPU | 2.9 kg | 28.3 mm | 17.30" | 2560x1440 |
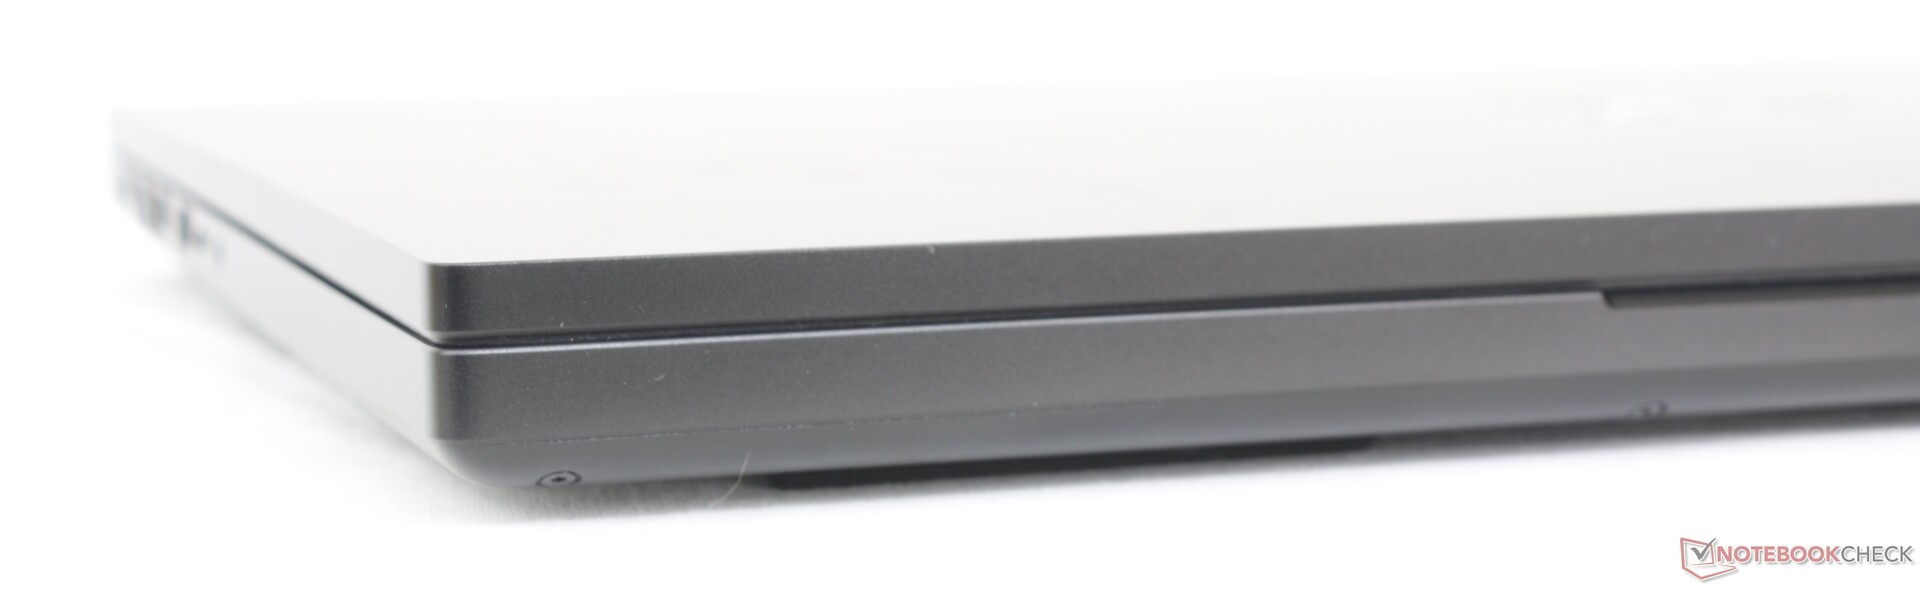
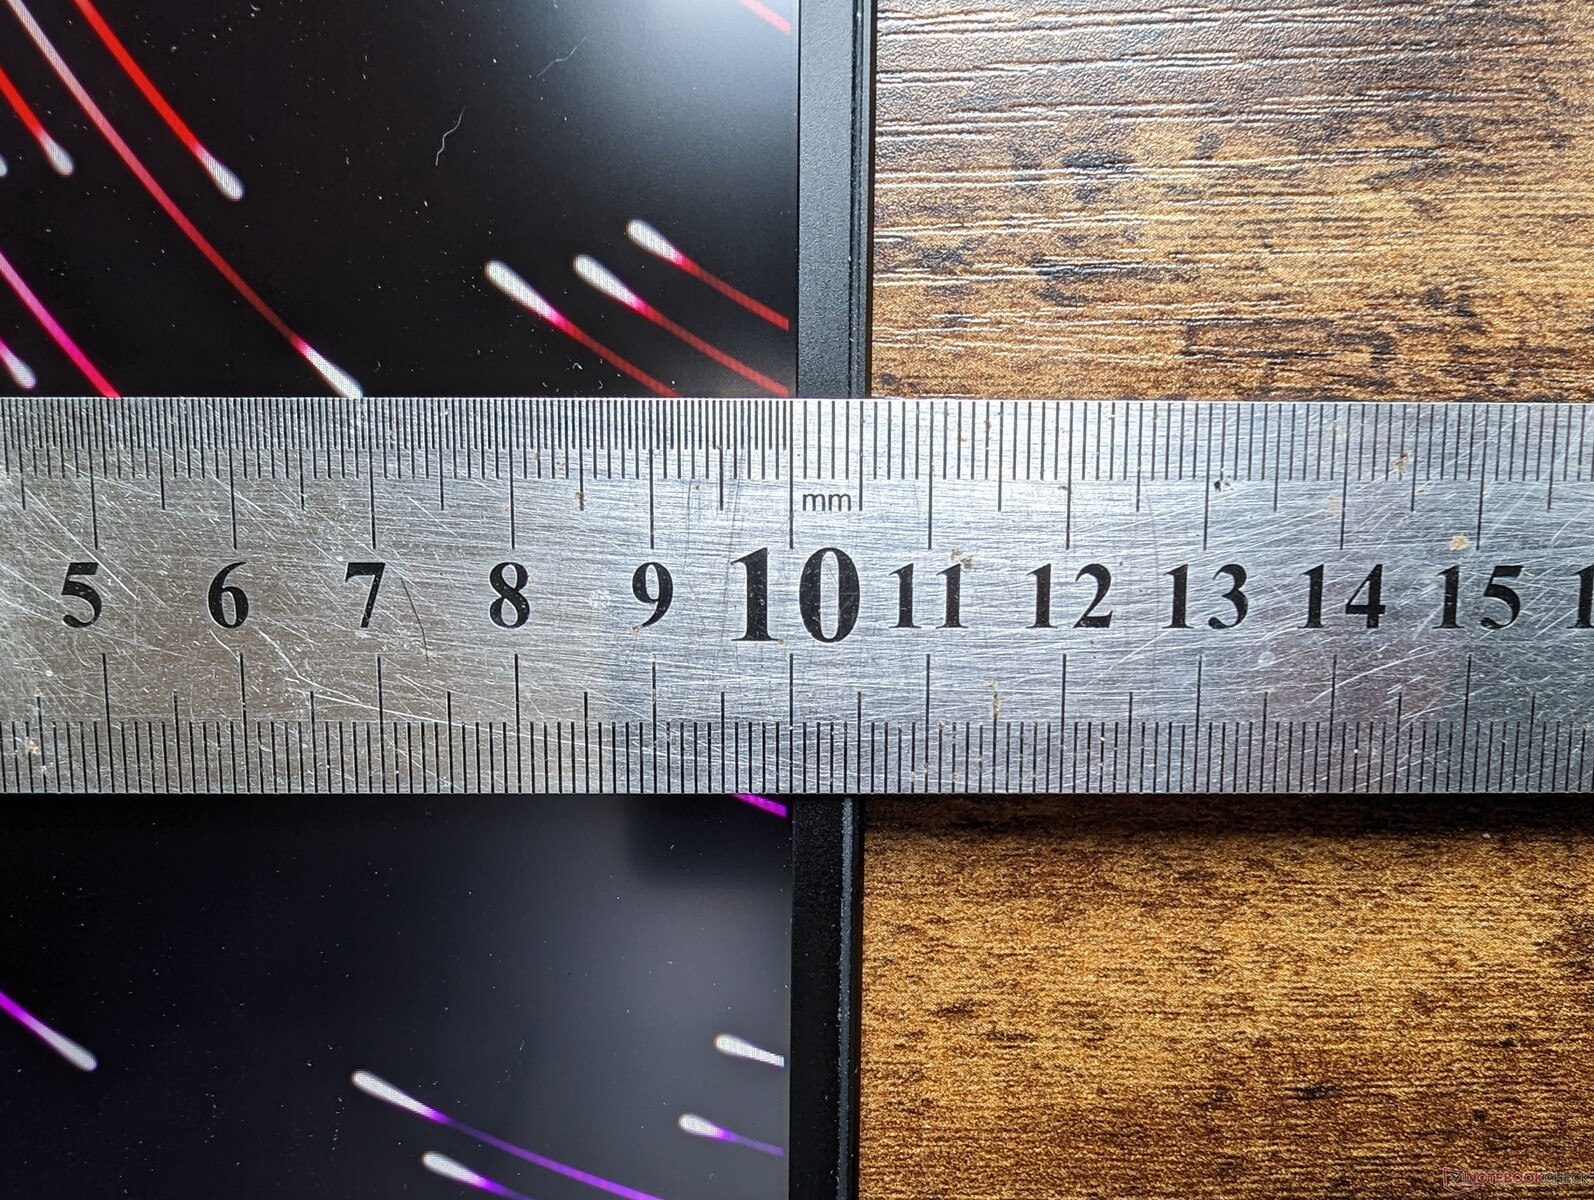
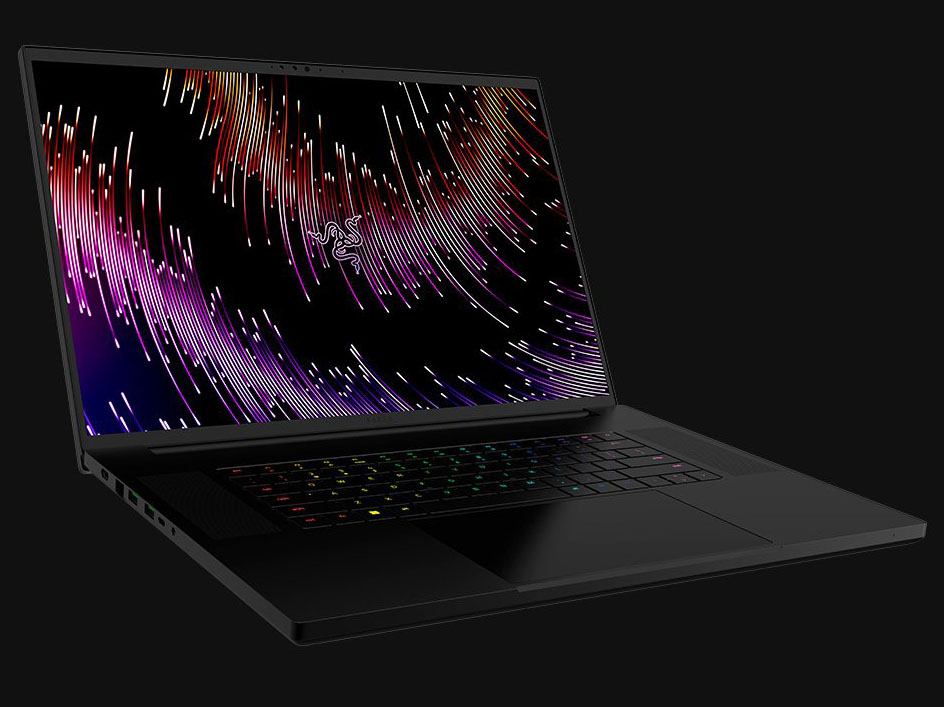
Affaire - A peine plus grande que la Blade 17
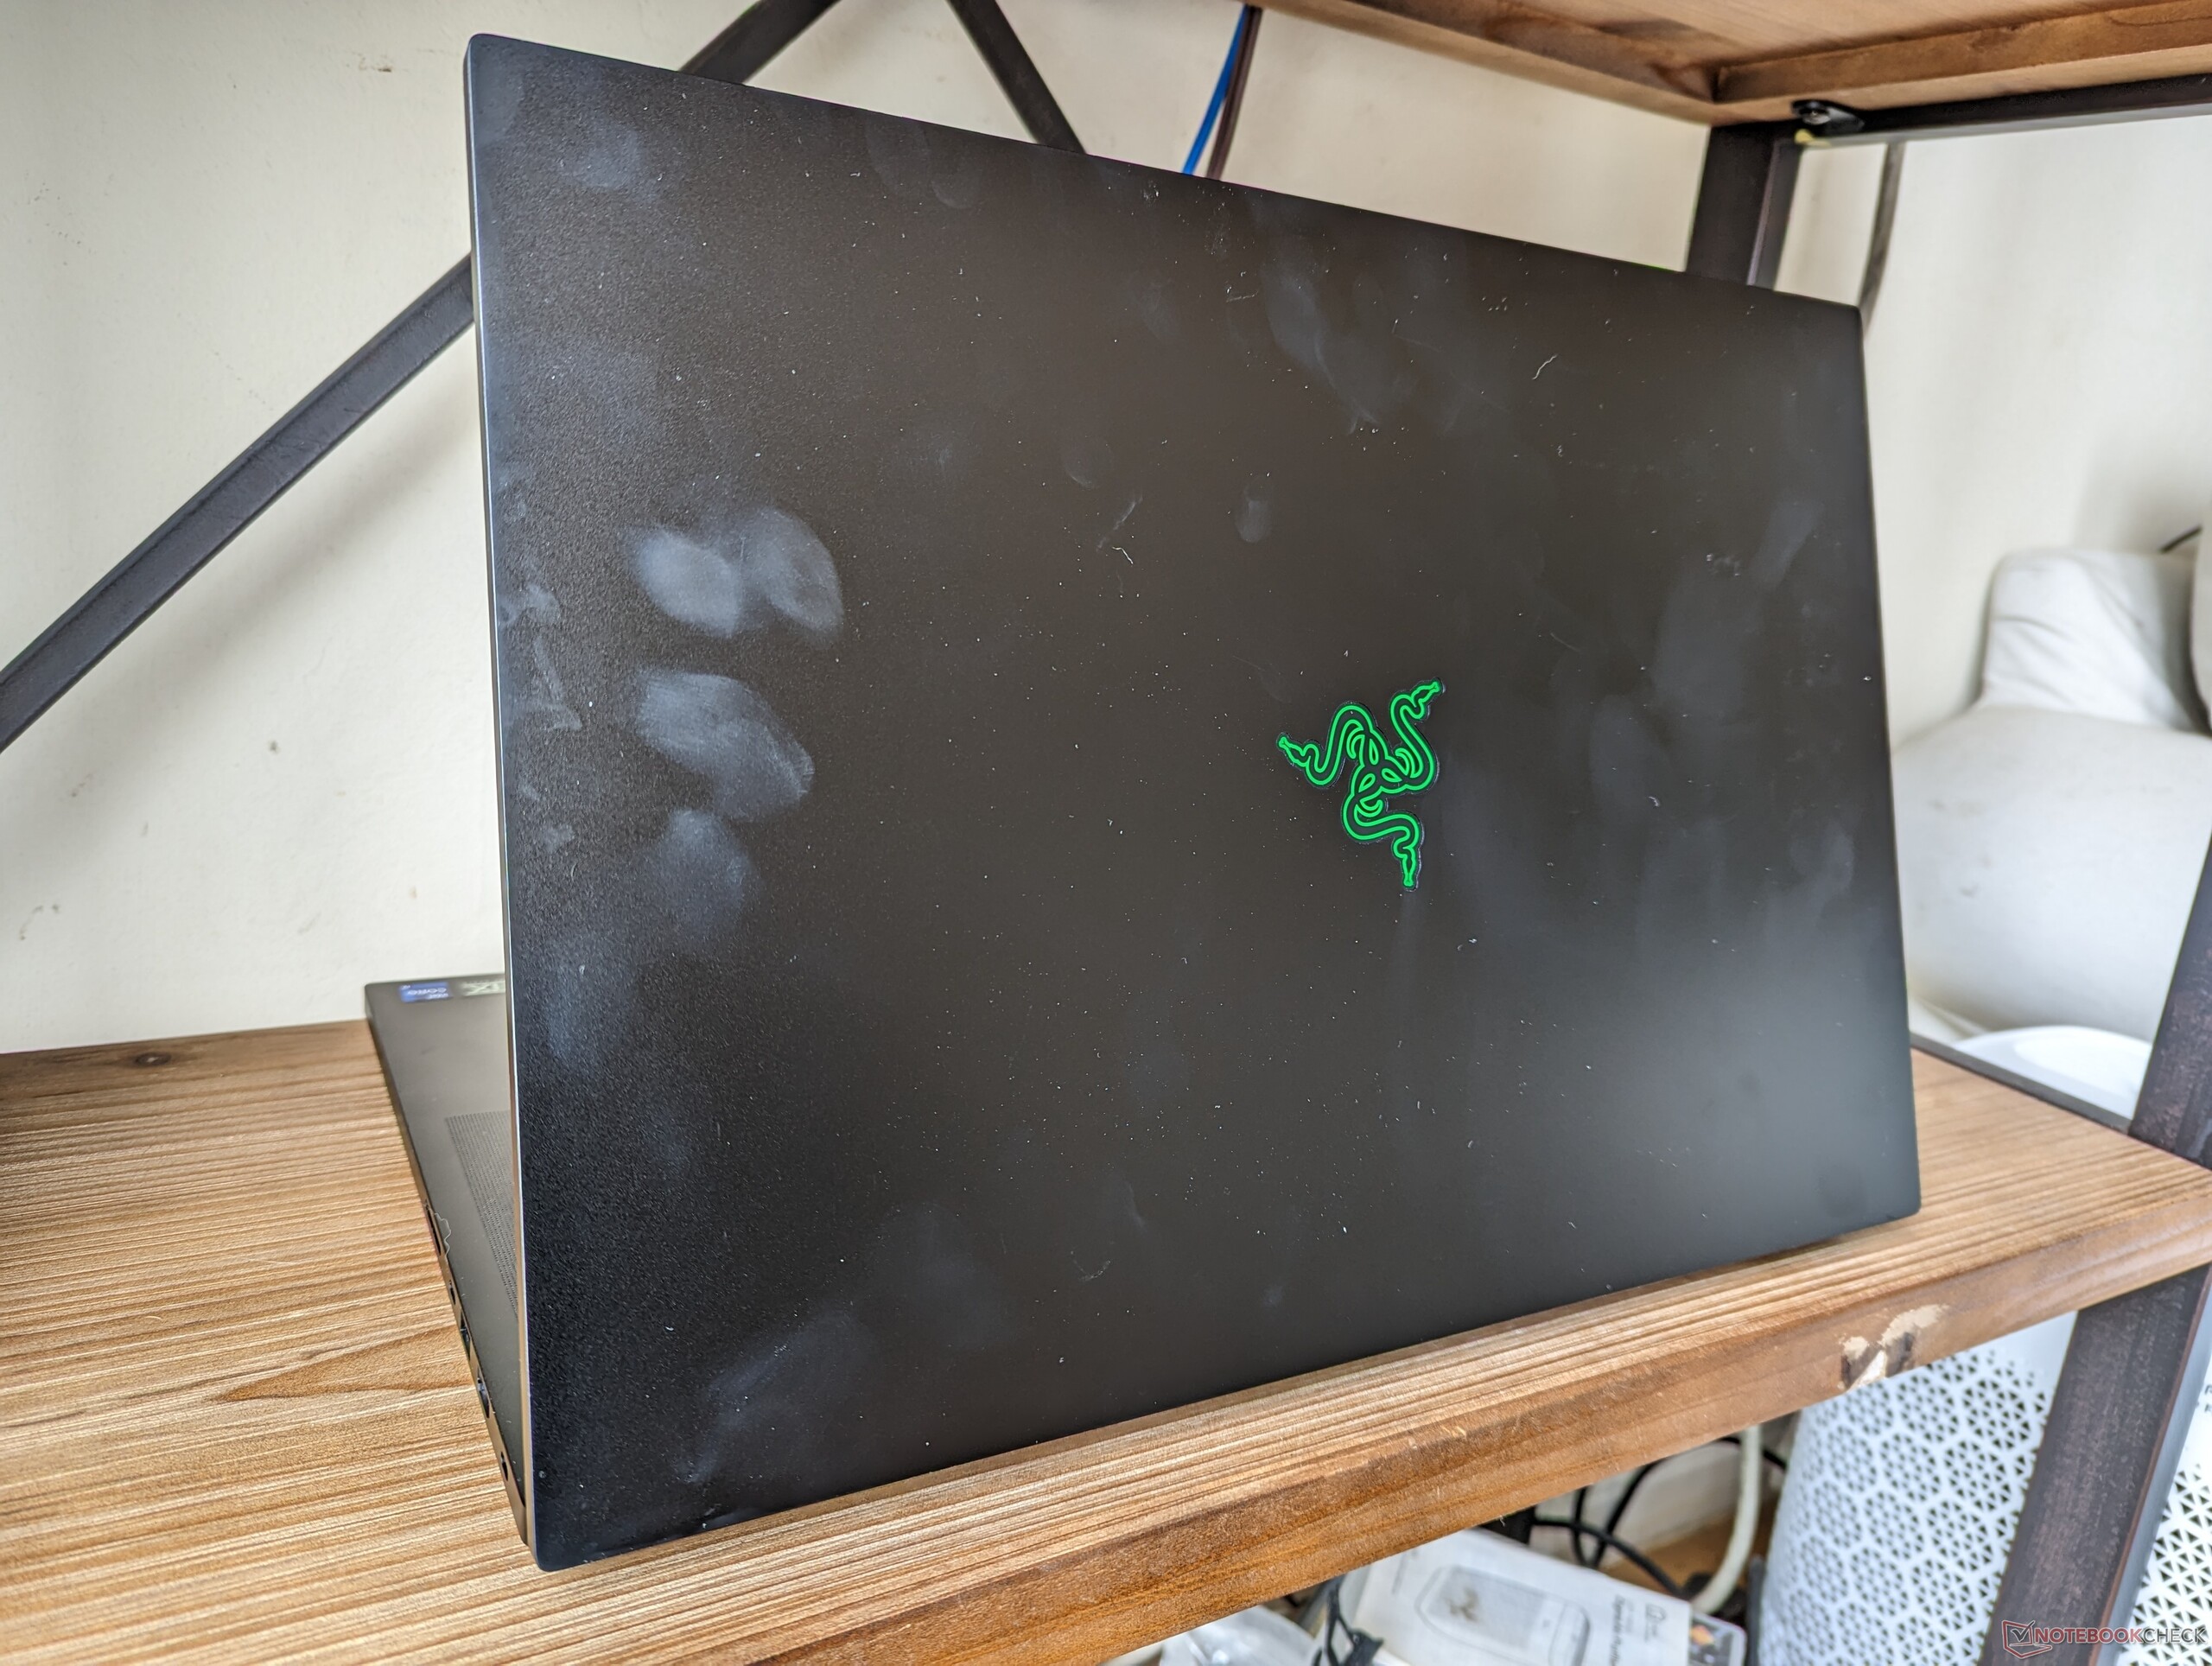
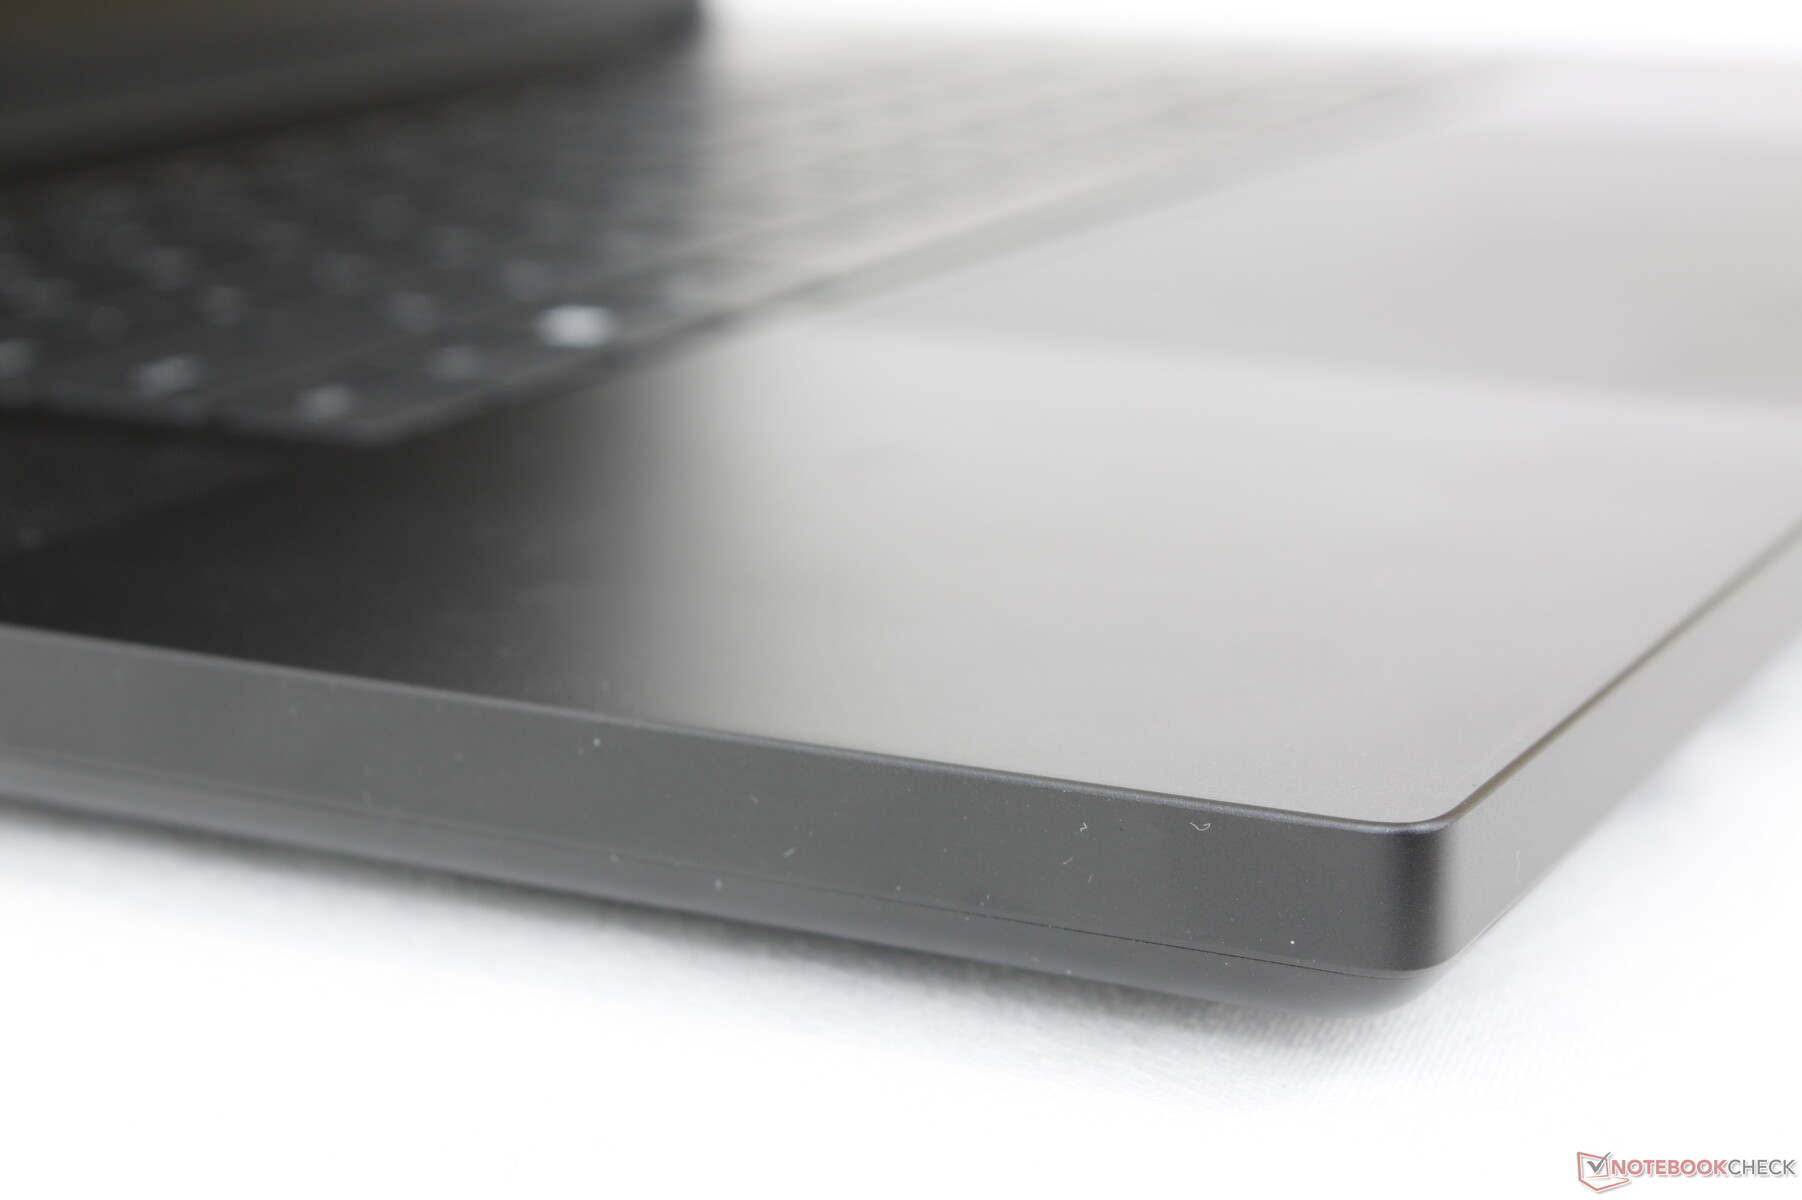
Le Blade 18 est peut-être une nouvelle taille d'écran, mais il ne réserve pas de nouvelles surprises en termes de conception du châssis. Le modèle ressemble et se sent comme un Blade 17 de haut en bas. La plus grande différence visuelle concerne la lunette du menton beaucoup plus petite sur le Blade 18 par rapport au Blade 17 pour un rapport écran/corps plus élevé.
Le facteur de forme plus grand de 18 pouces n'a heureusement pas d'impact sur la rigidité du châssis. La base et le couvercle sont aussi solides que sur le Blade 17 pour une impression de MacBook Pro. Les charnières en particulier tiennent bien le coup malgré le grand écran, mais leur angle maximal est toujours bien en deçà des 180 degrés. Le point le plus faible de l'ordinateur est peut-être au centre du couvercle extérieur, où la surface se déforme plus facilement sous la pression.
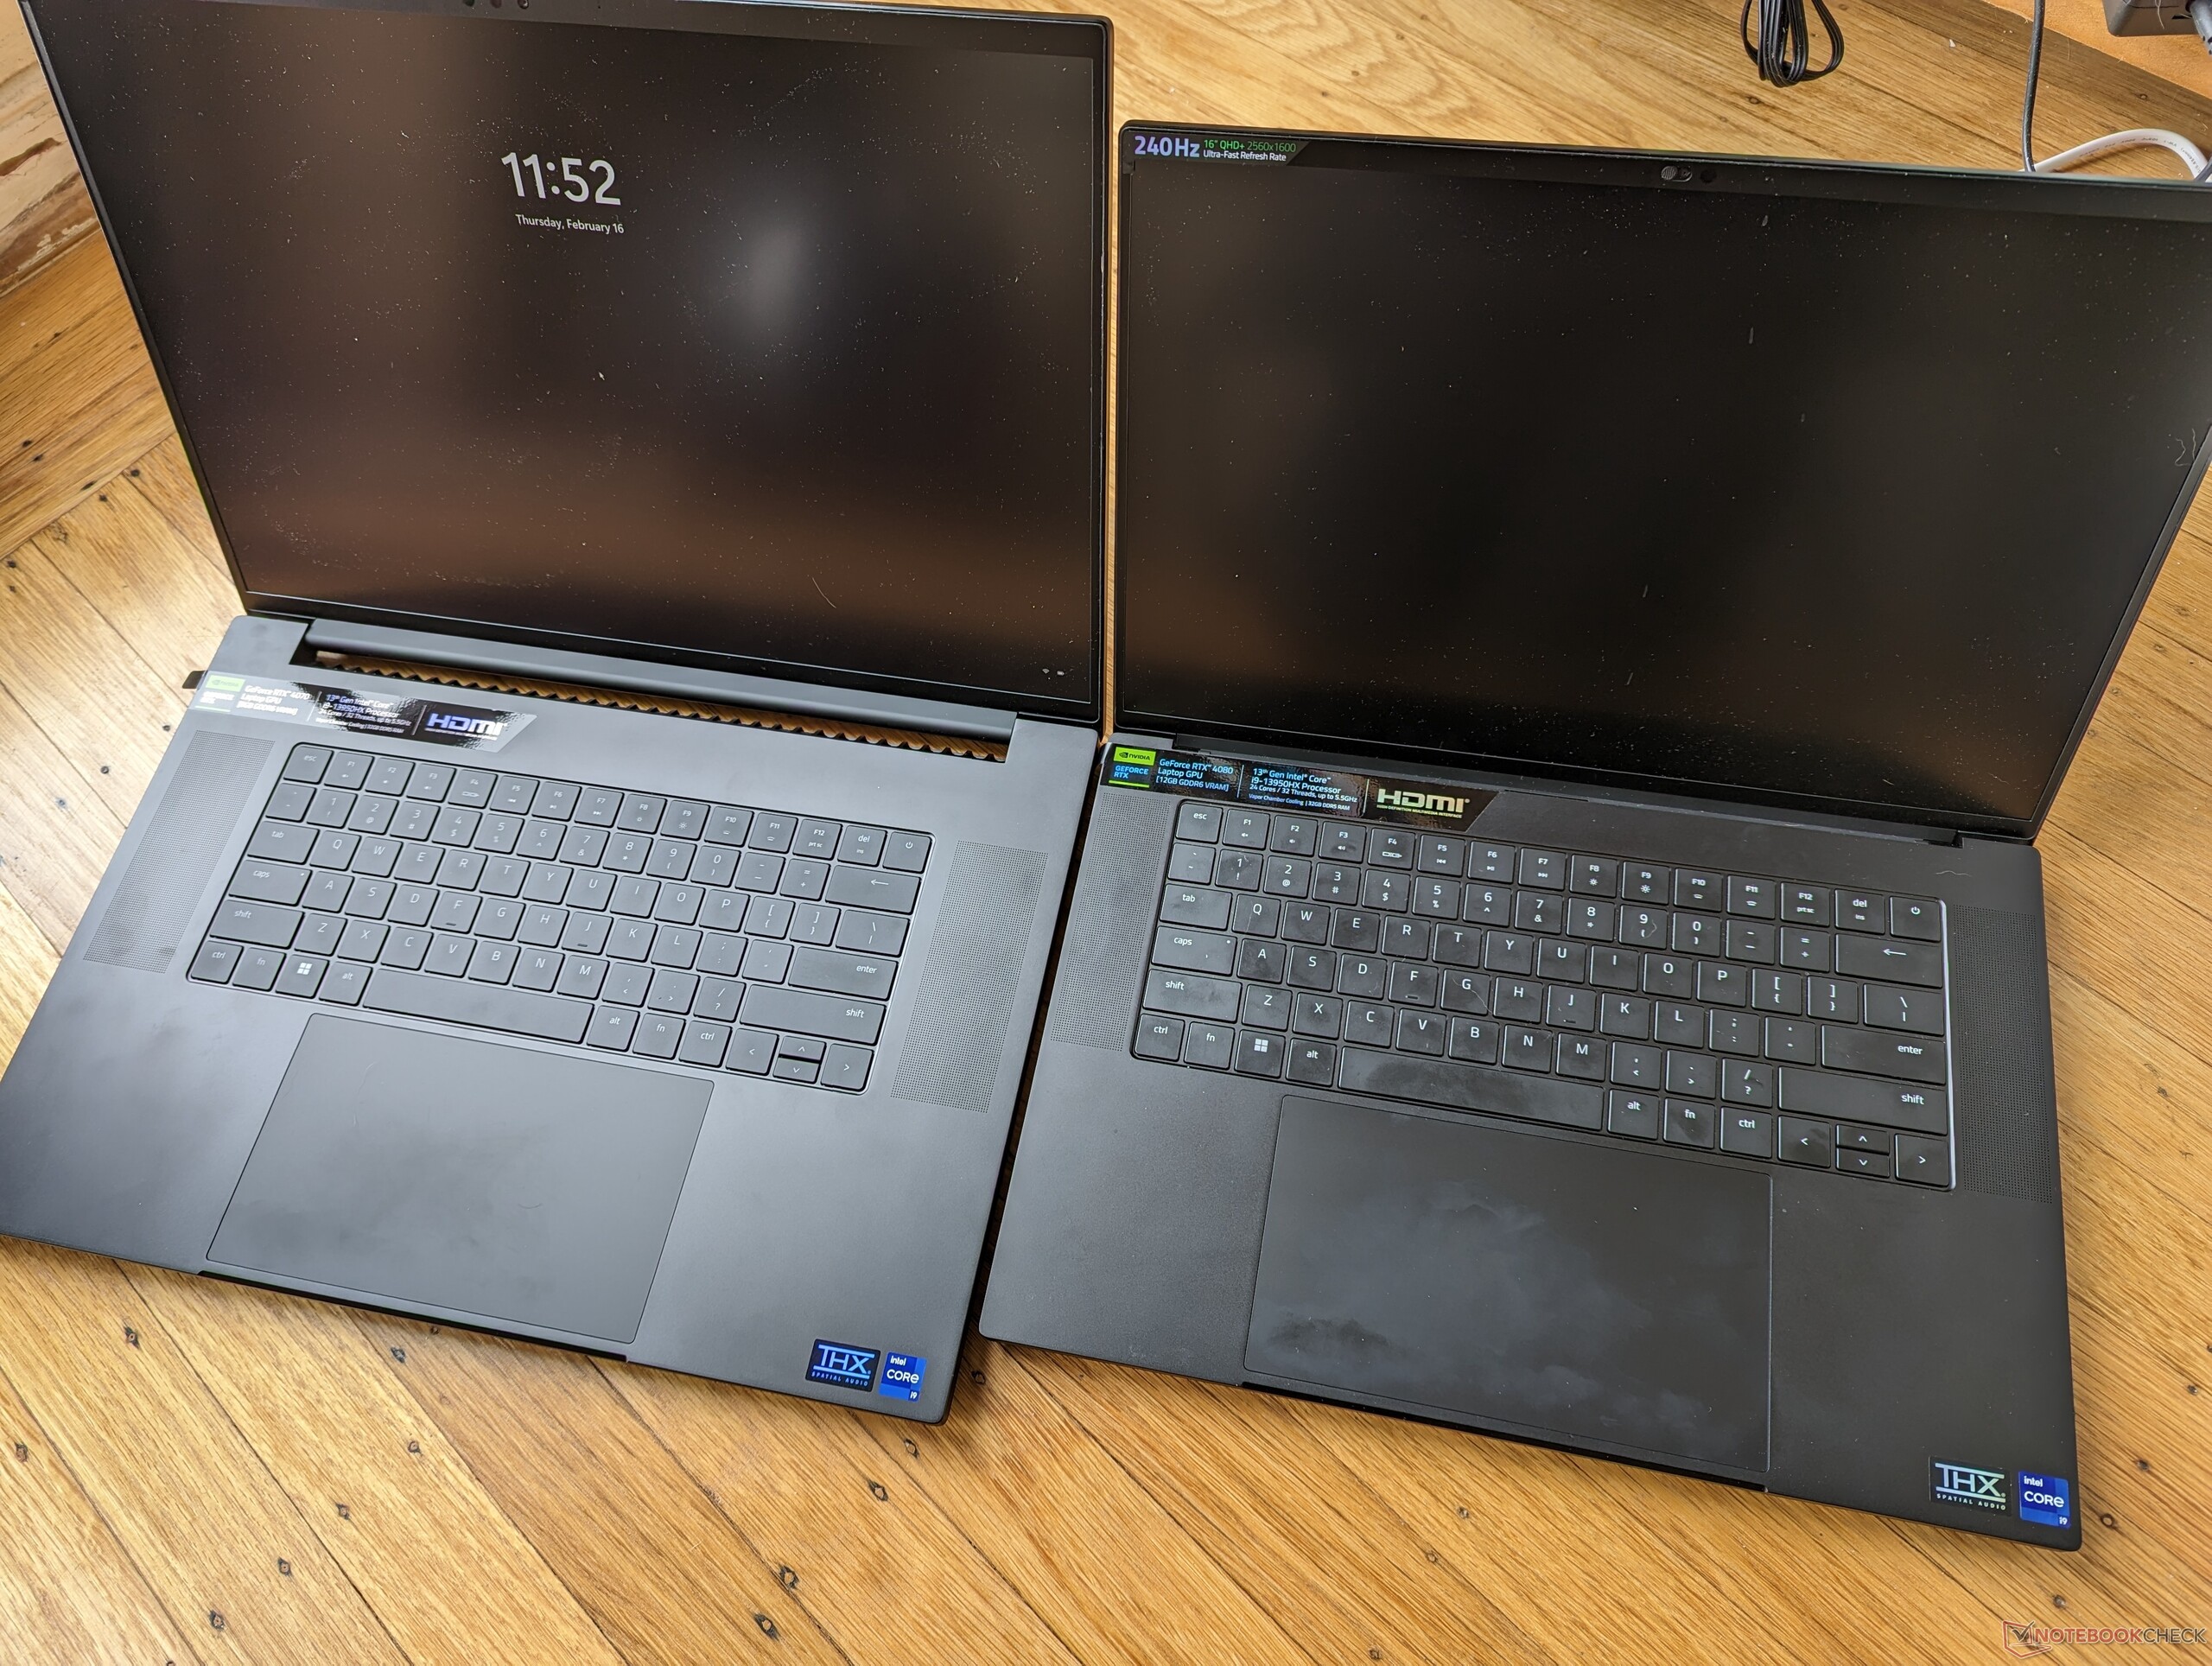
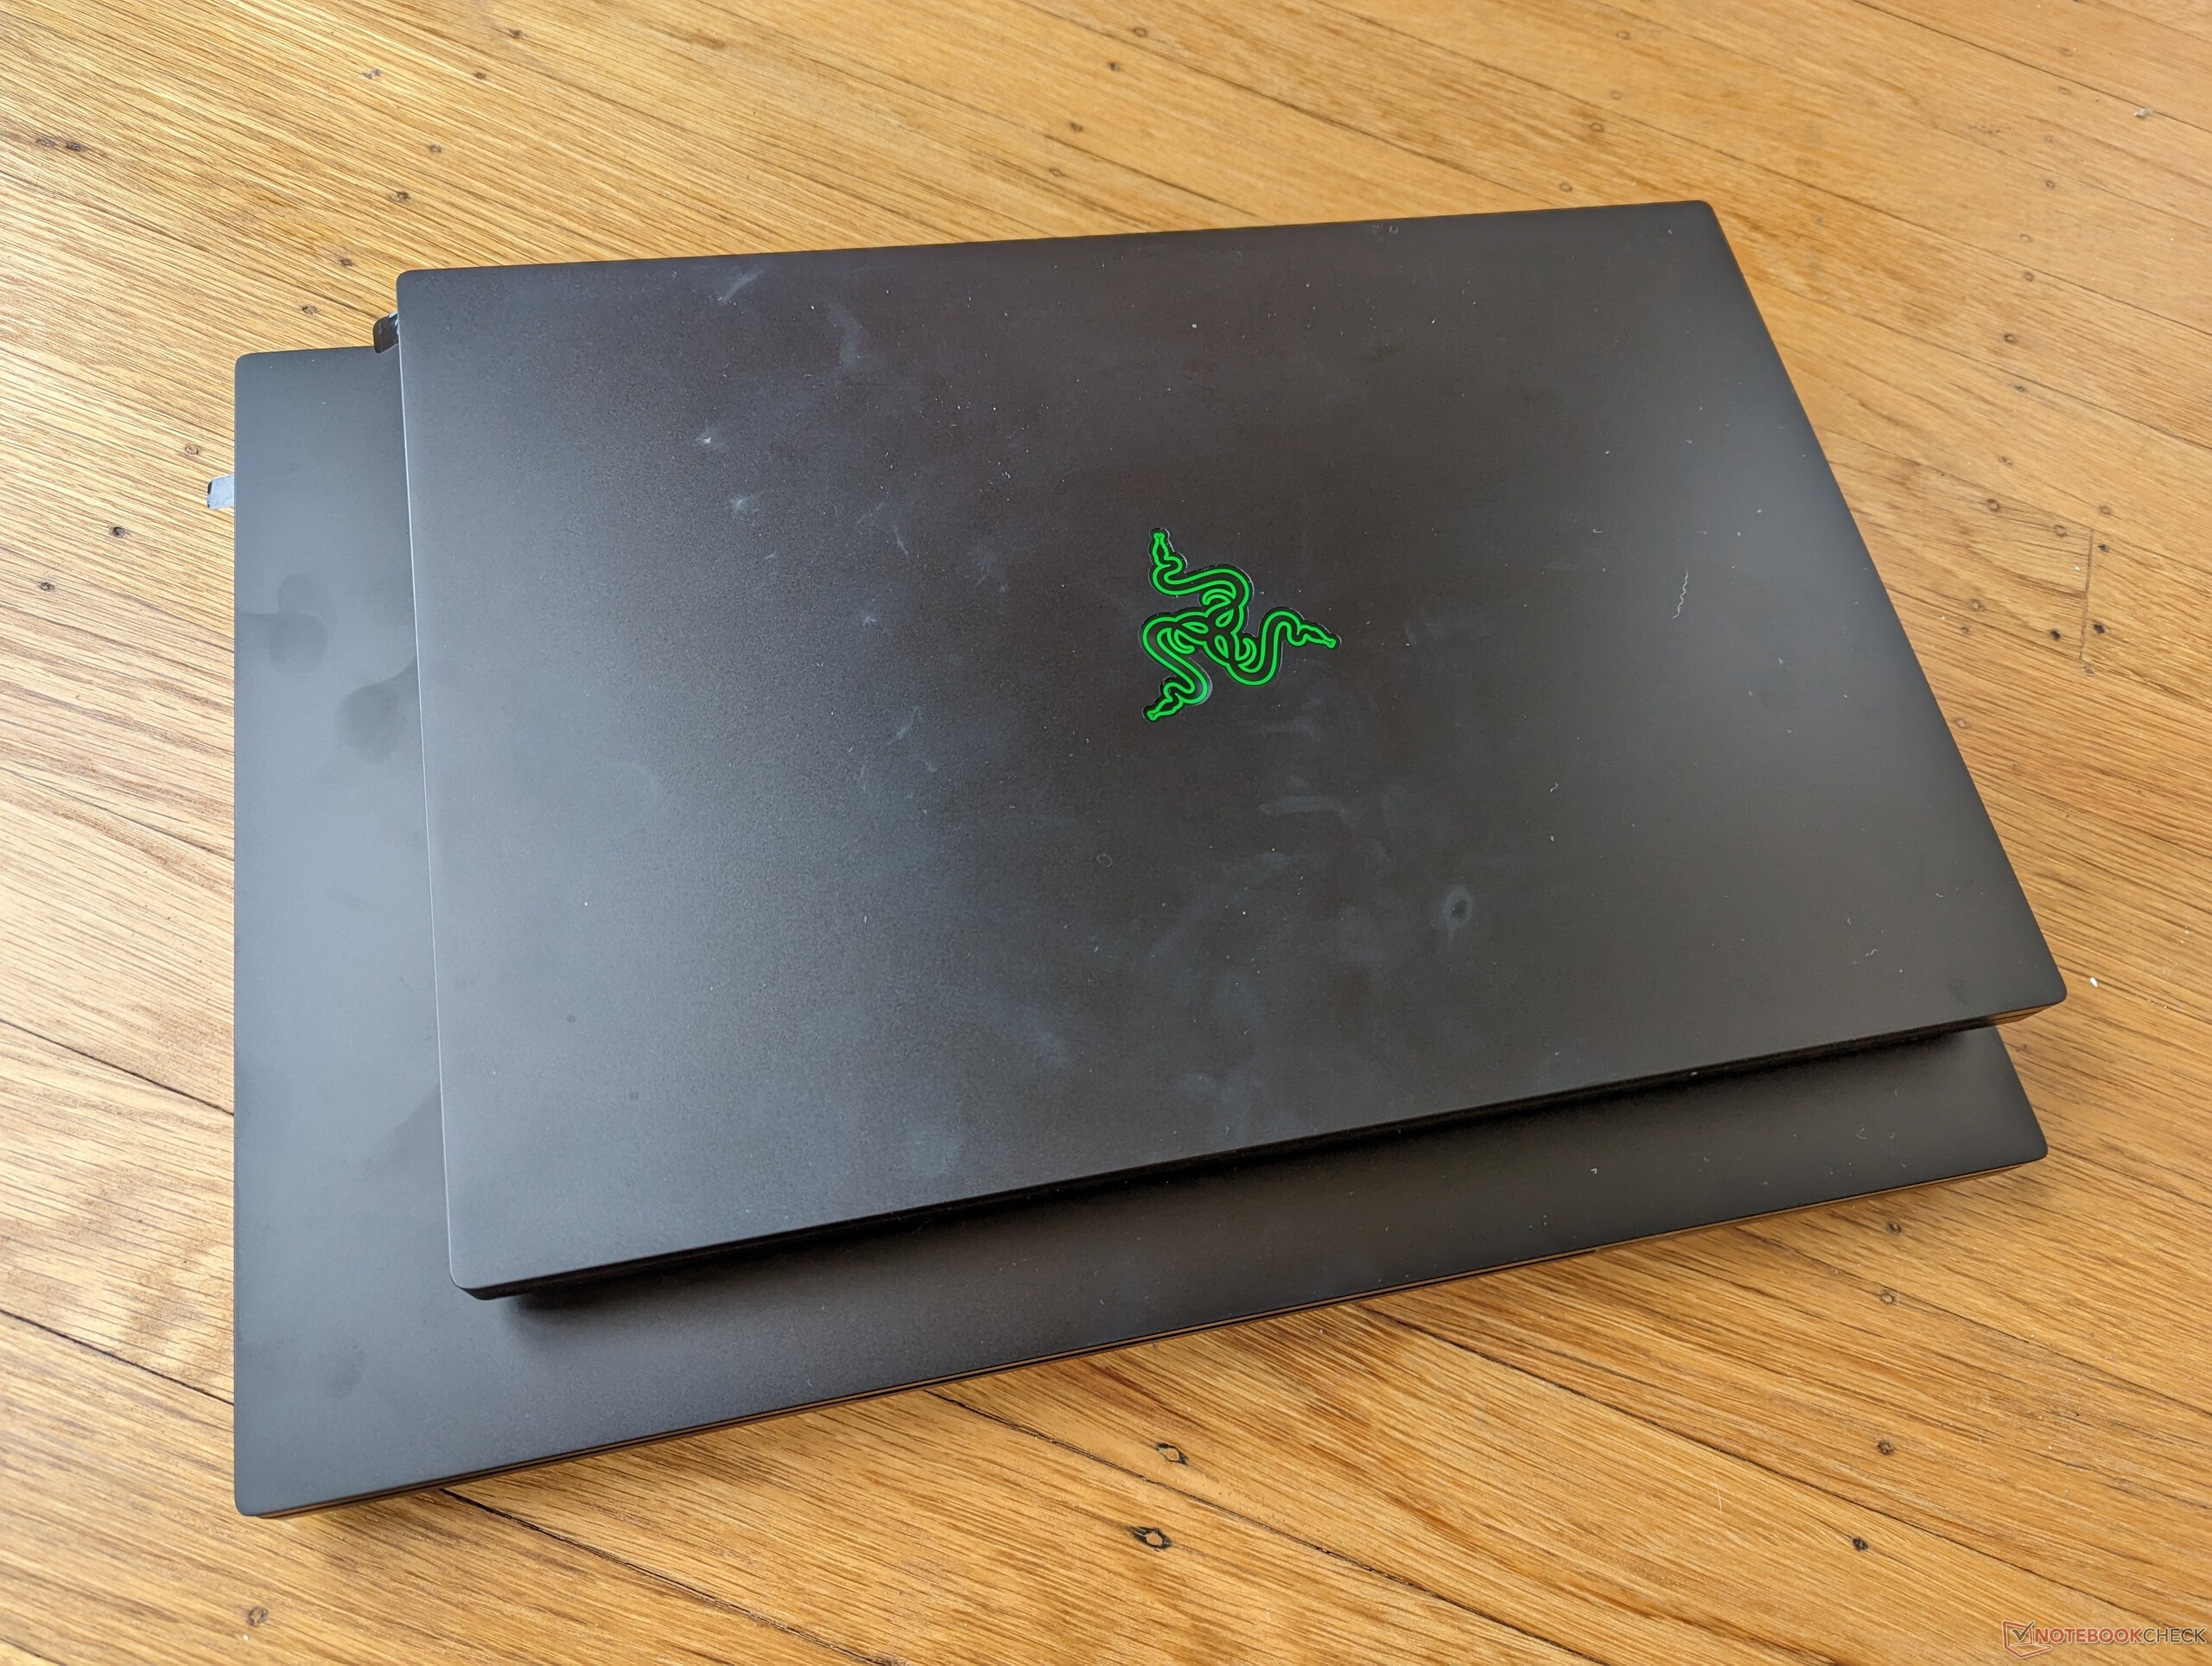
Razer est fier de souligner que le Blade 18 est seulement 18 % plus grand en volume et 7 % plus lourd que le Blade 17 de 2022, malgré leurs différences de taille d'écran. Ainsi, le nouveau modèle de 18 pouces ne semble pas aussi encombrant qu'on pourrait le penser au départ. En fait, certains ordinateurs portables de jeu de 17,3 pouces sont plus grands ou même plus lourds que le Blade 18, notamment leAsus ROG Strix Scar 17 SE ou Alienware m17 R5.

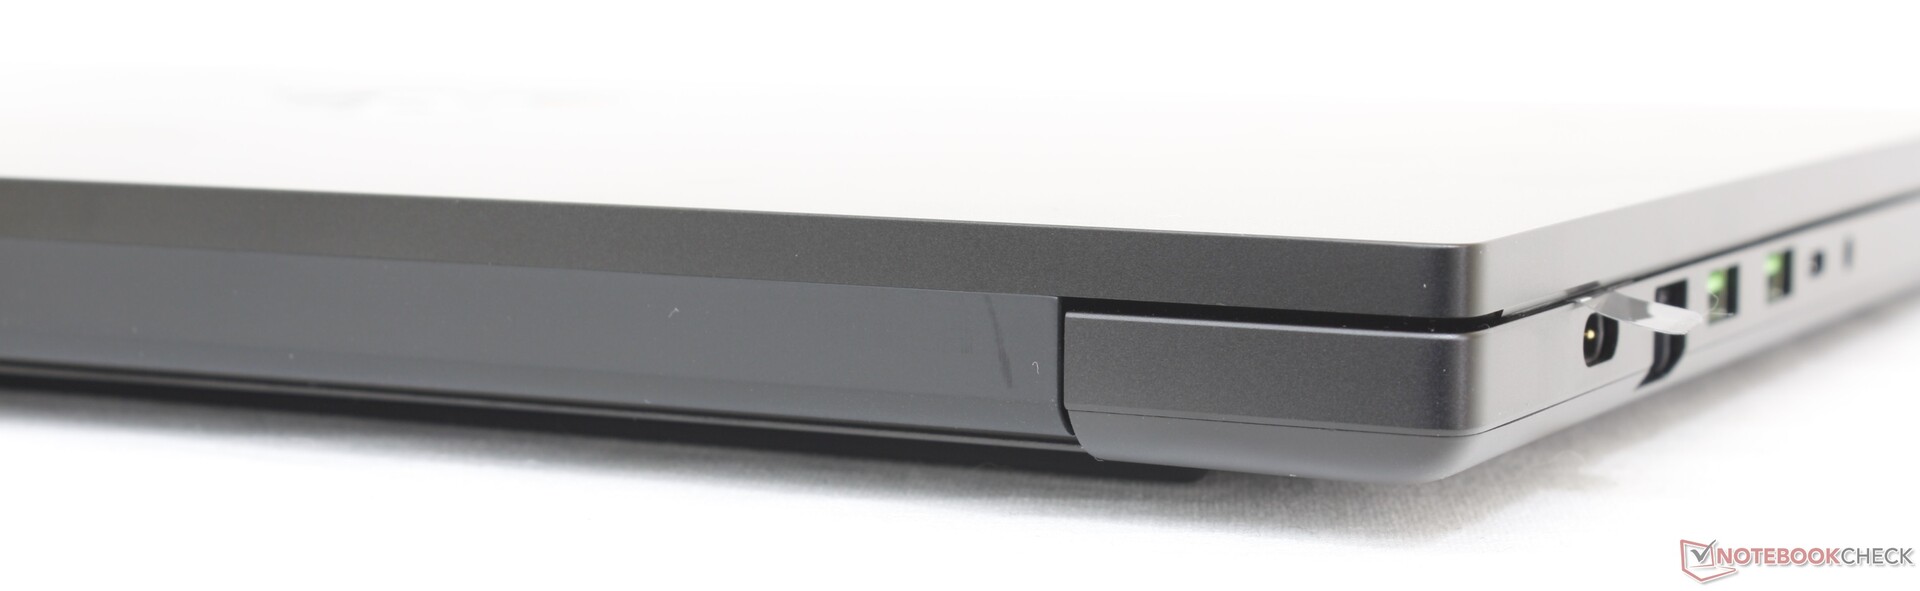
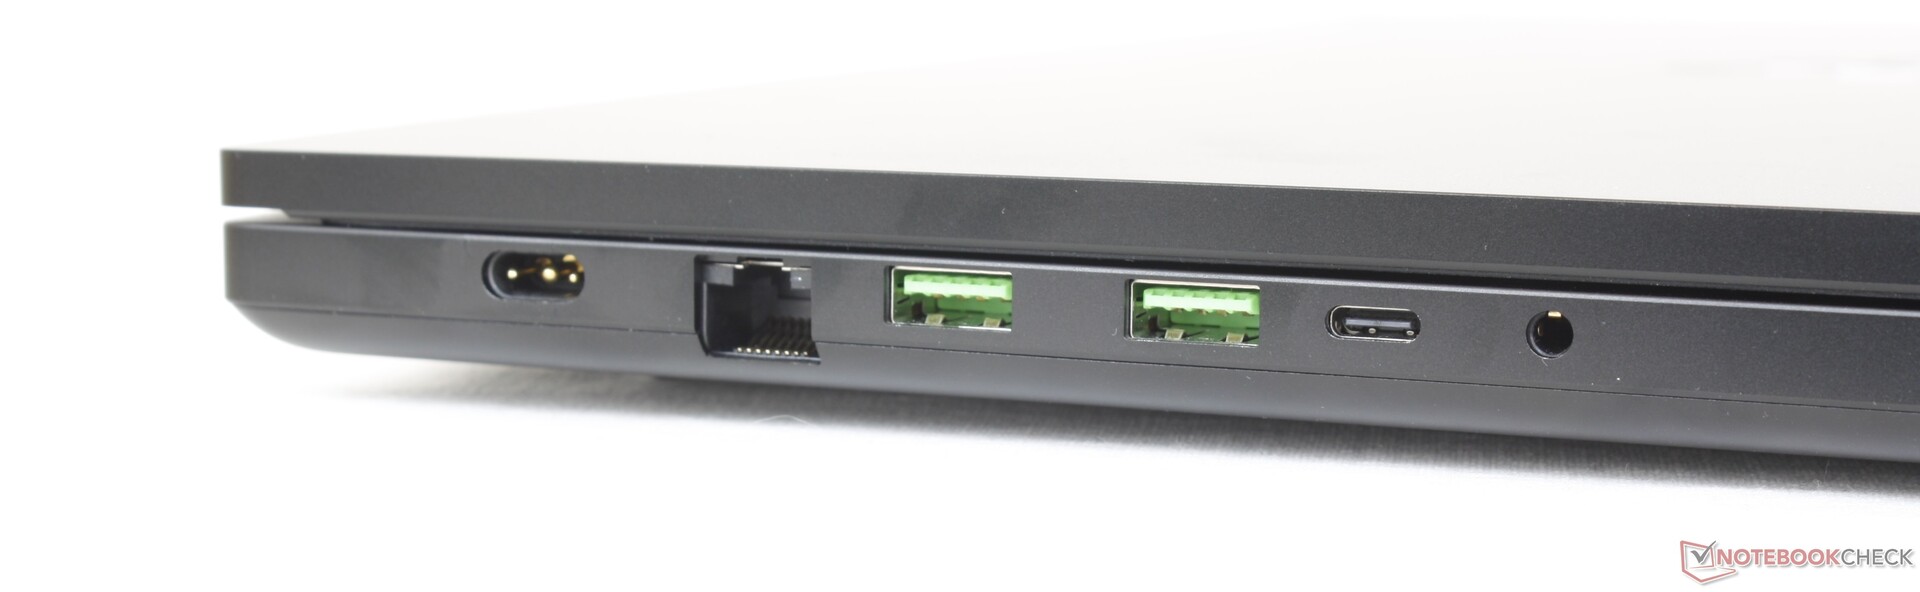
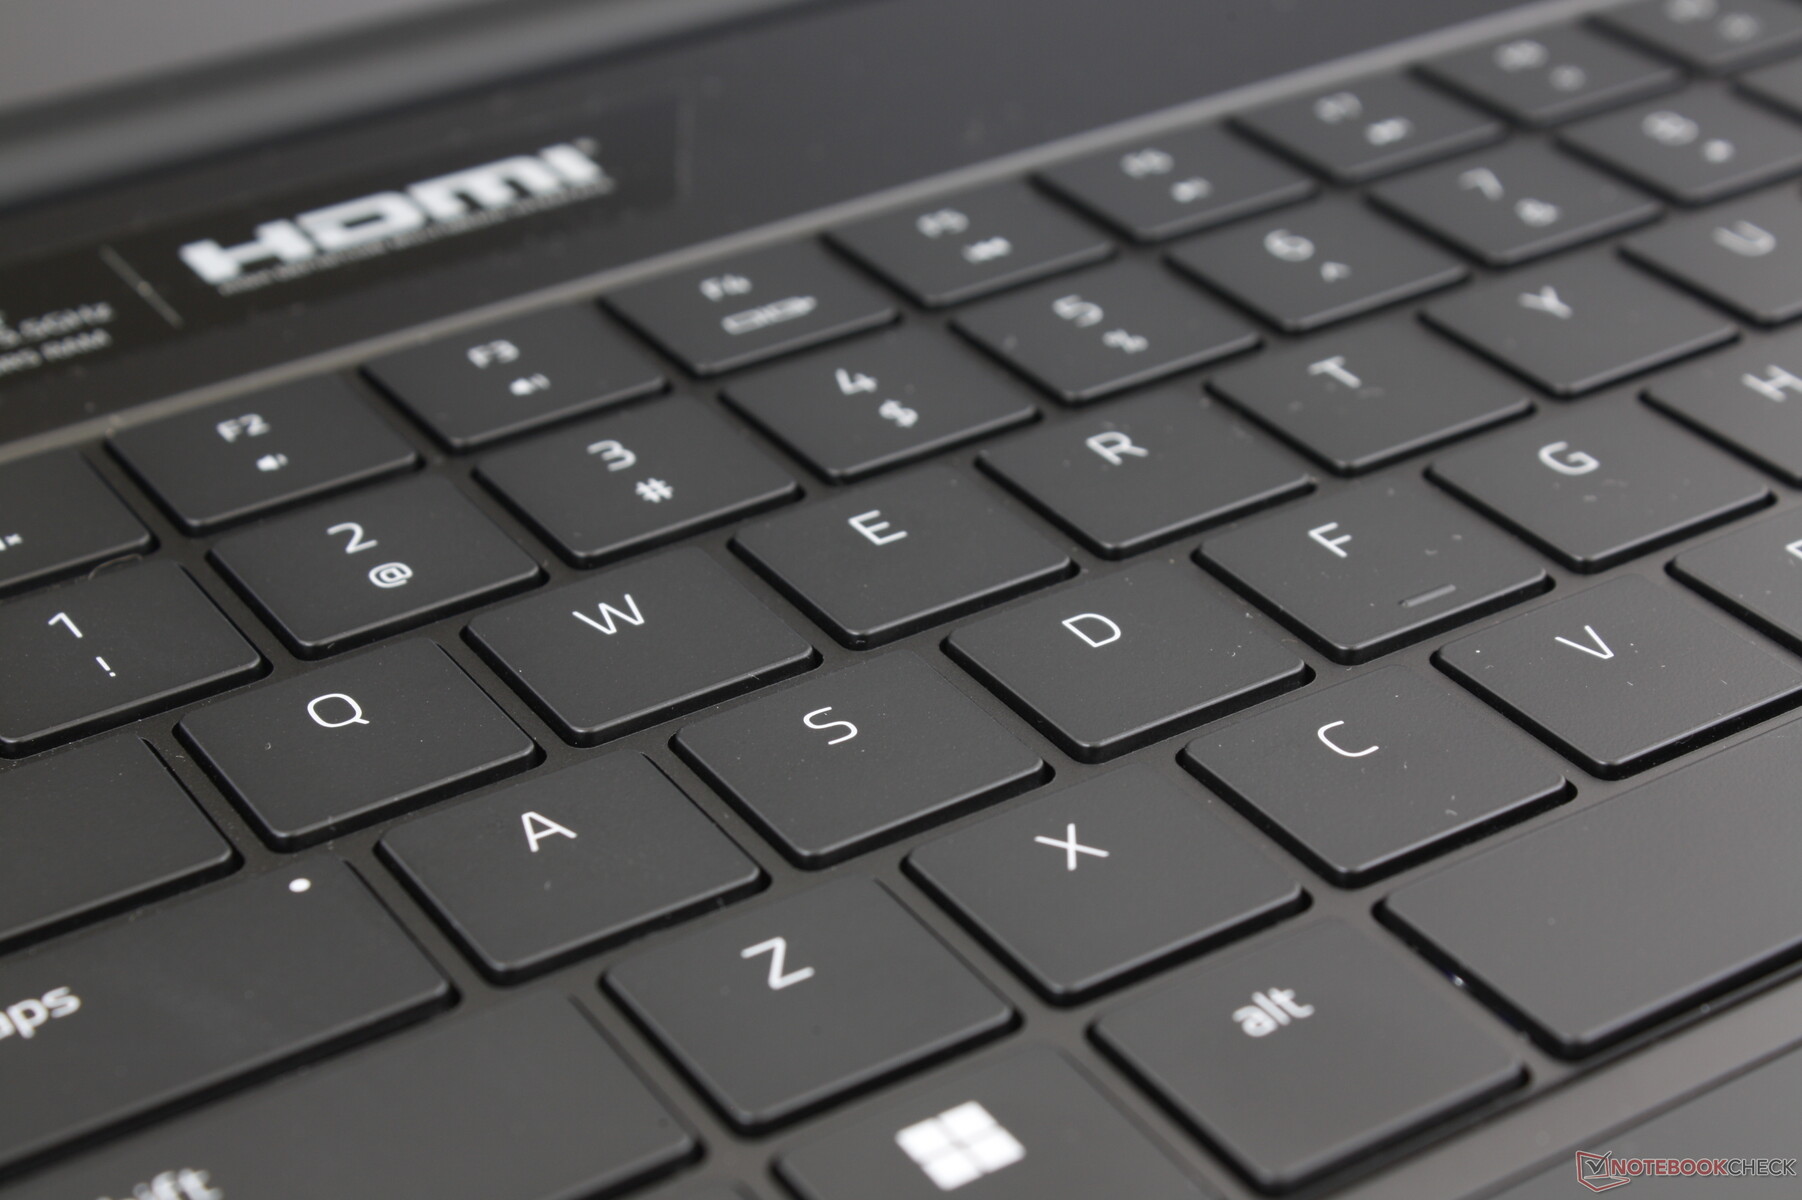
Connectivité - Comme d'habitude
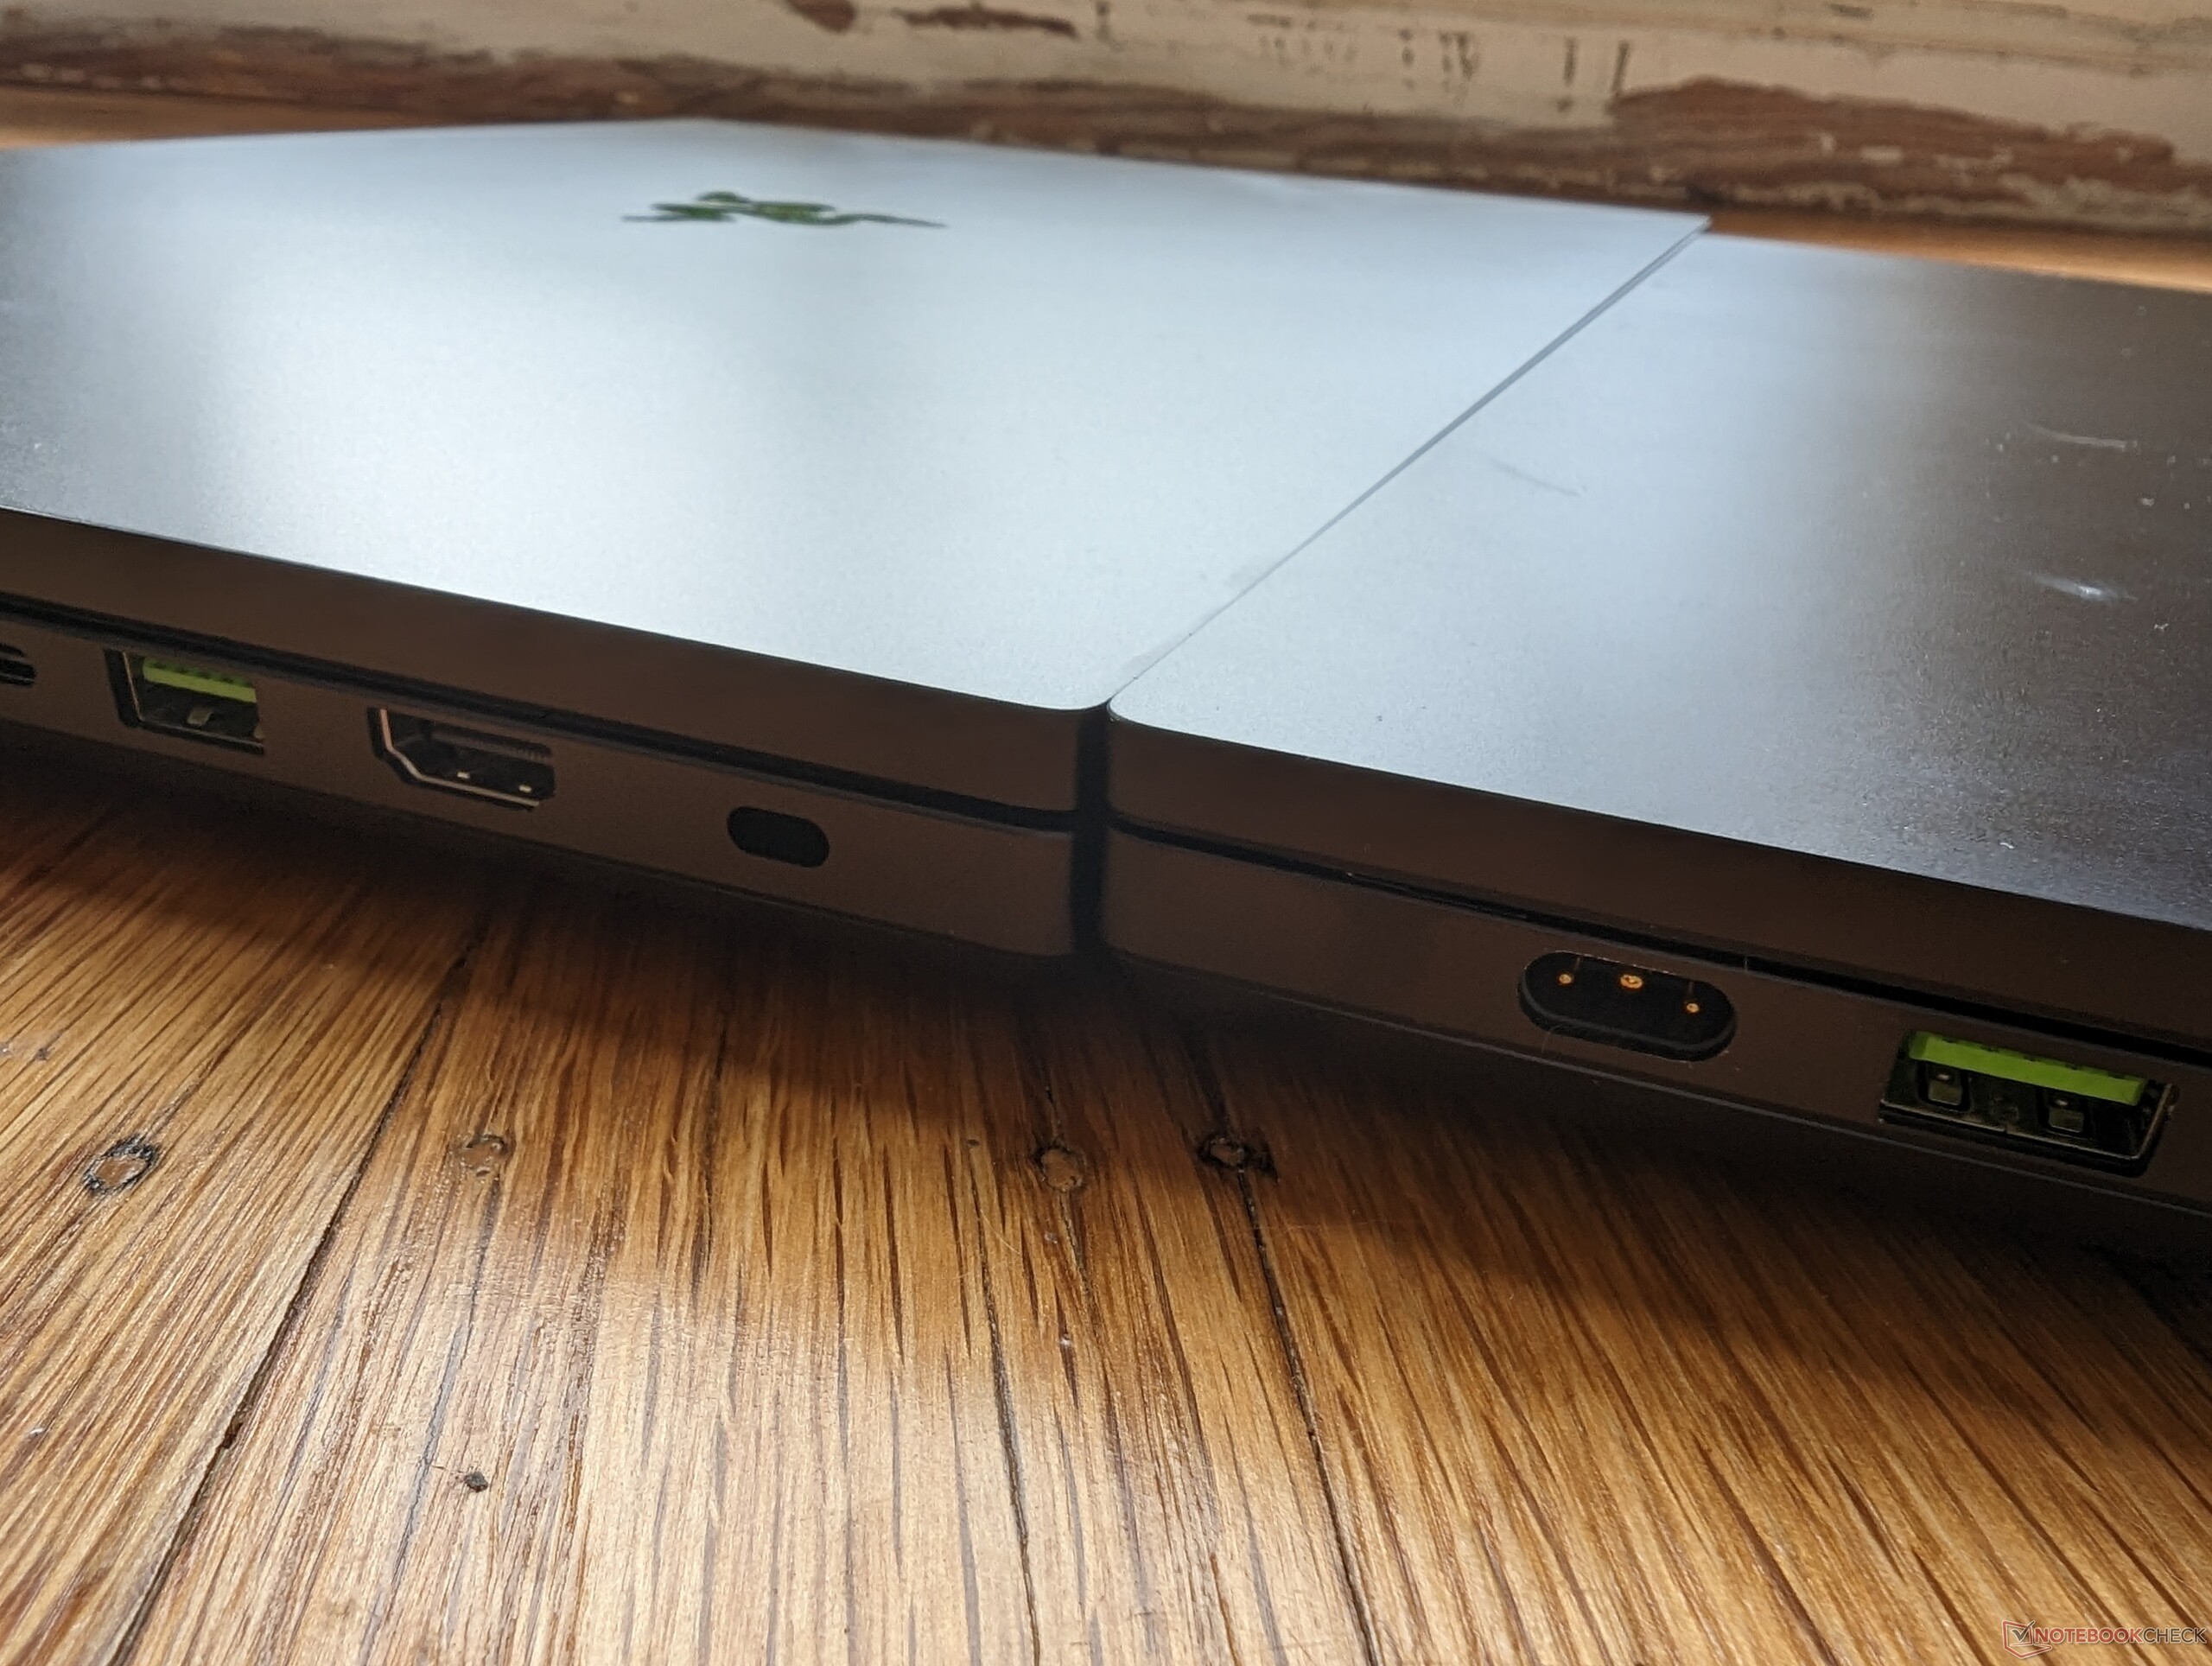
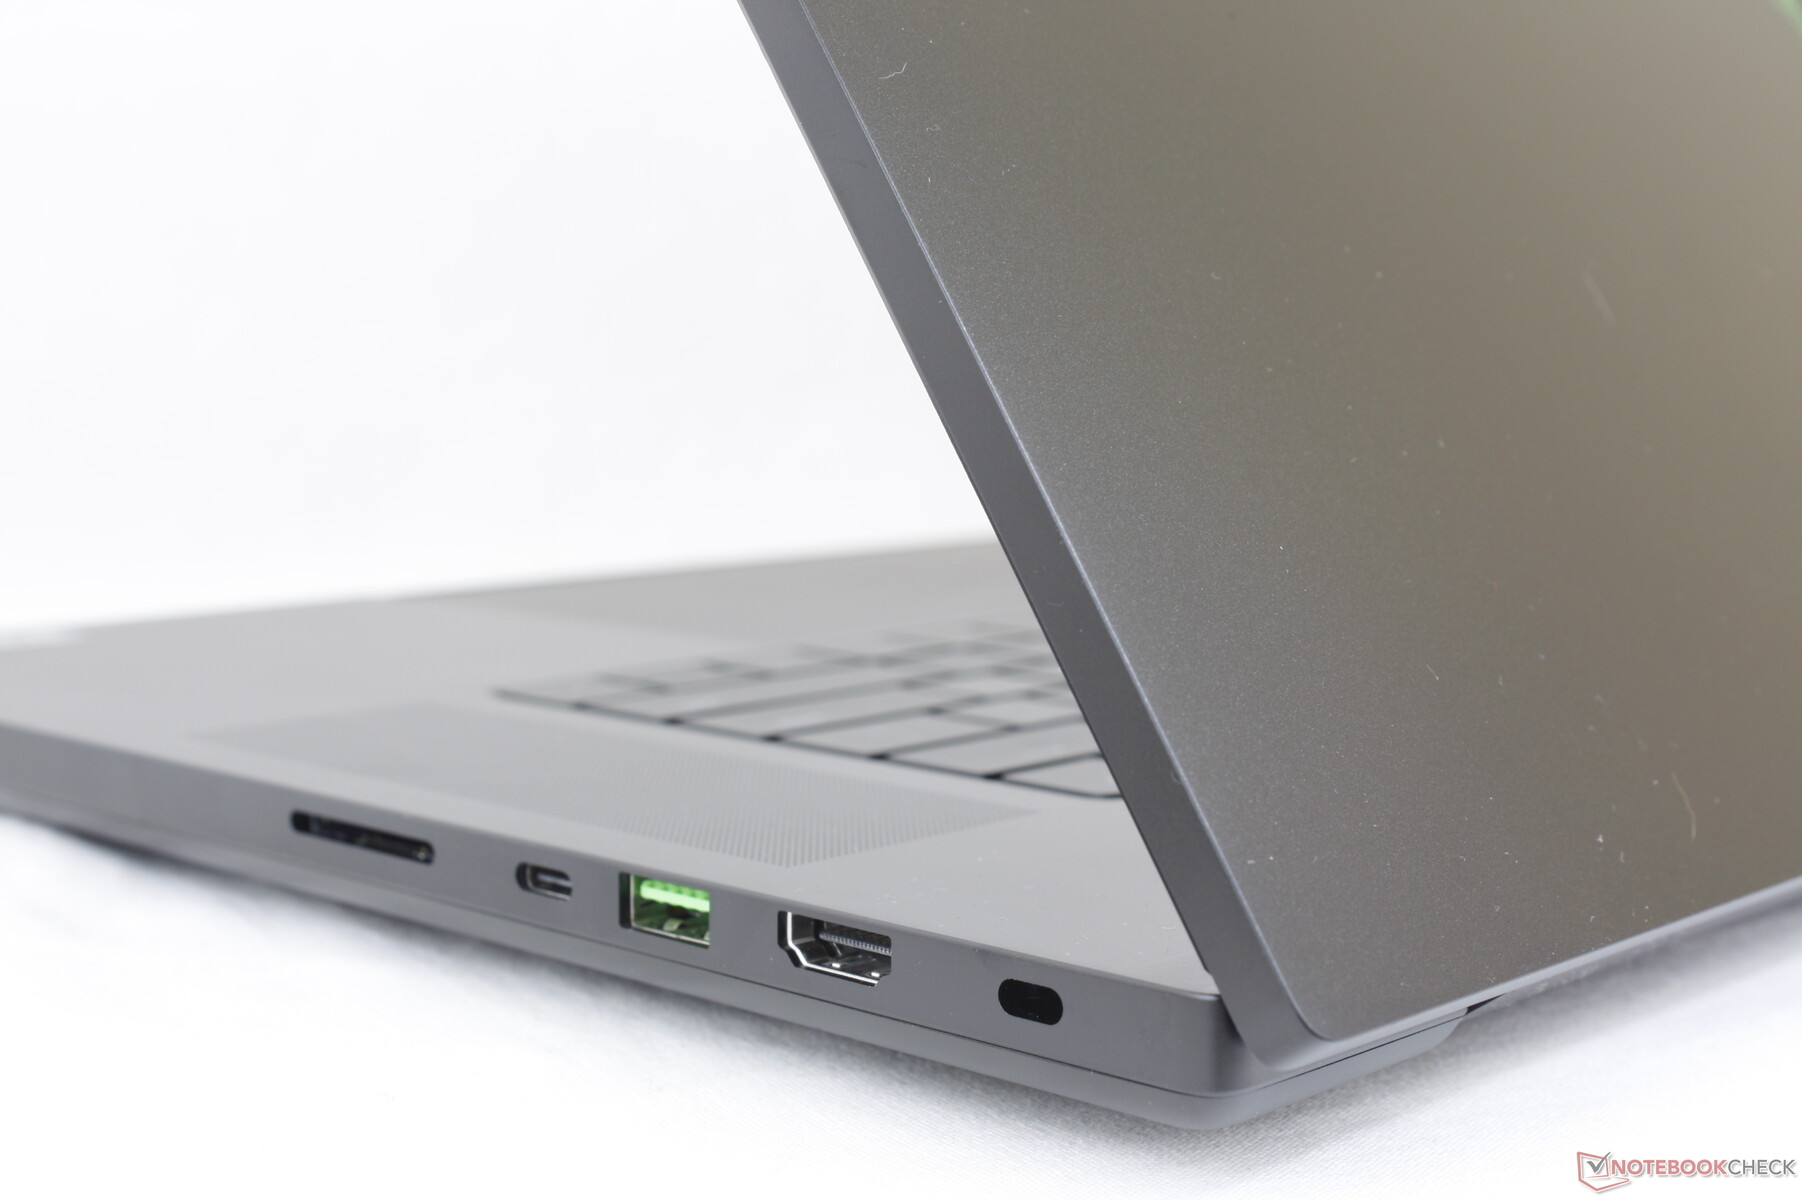
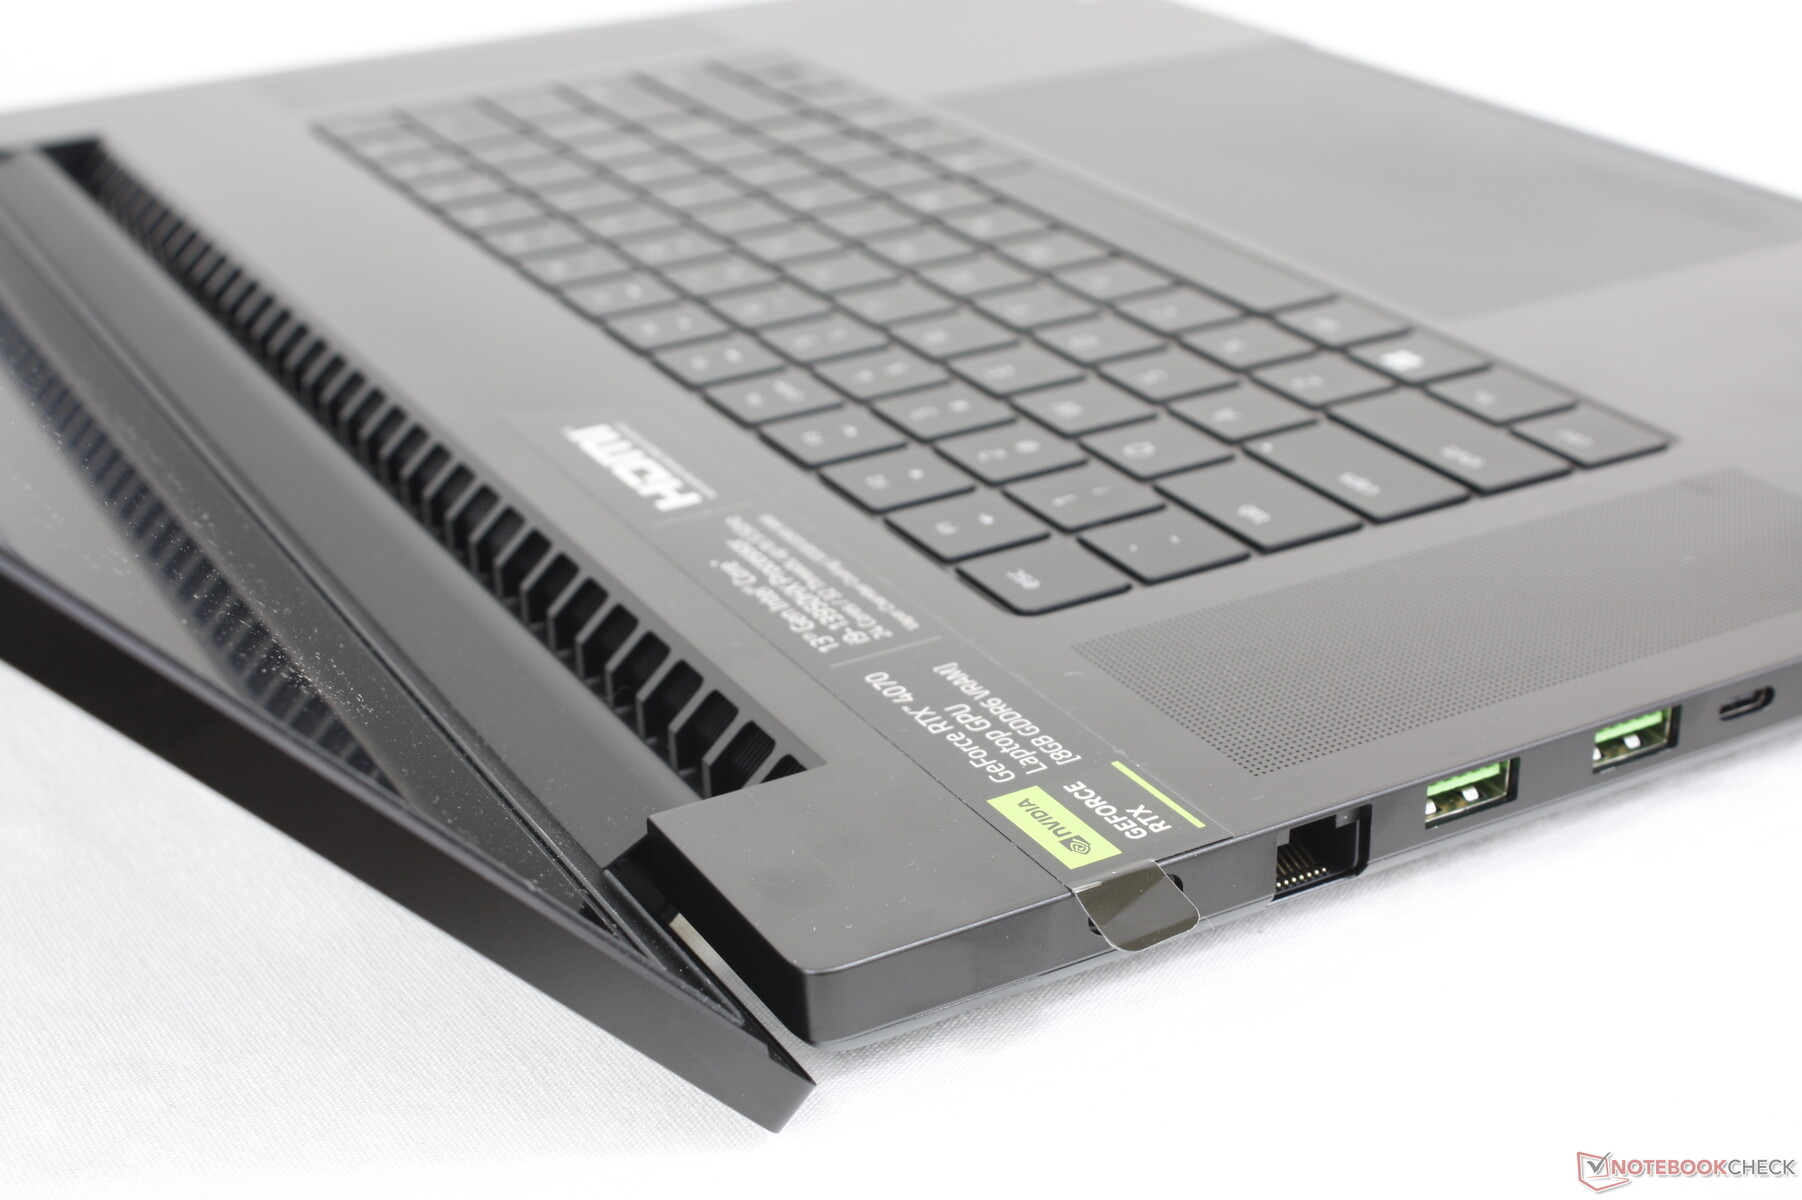
Le nouveau modèle hérite de tous les ports du Blade 17 pour une sélection saine d'options de connectivité. Malgré cela, nous aurions aimé en voir un peu plus pour mieux distinguer le Blade 18 de ses petits frères et sœurs. Par exemple, un port d'entrée HDMI aurait ajouté plus de polyvalence à l'écran spacieux de 18 pouces.
N'oubliez pas que seul l'un des deux ports USB-C est compatible avec les périphériques Thunderbolt.
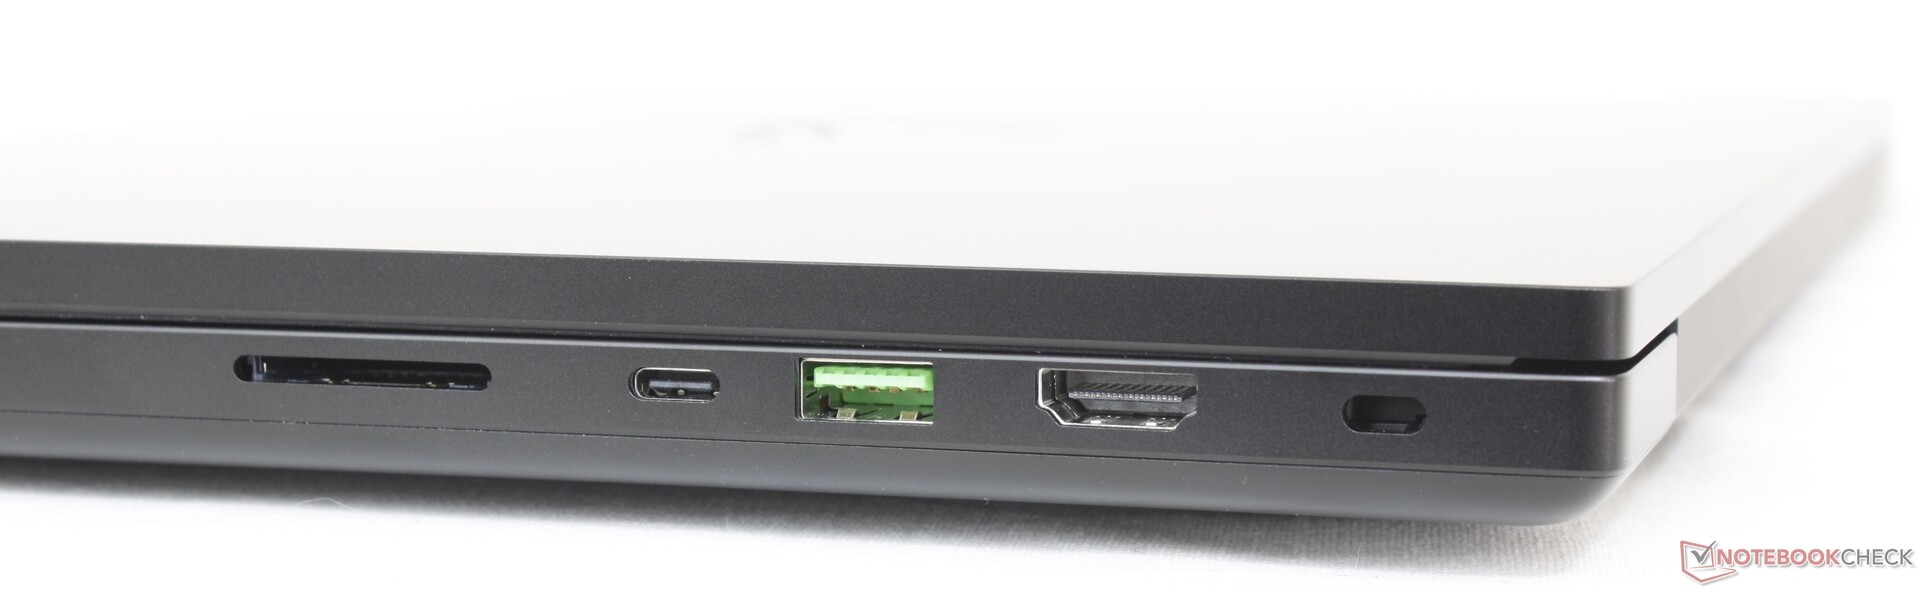
Lecteur de carte SD
Nous sommes capables de transférer 1 Go d'images de notre carte de test UHS-II vers le bureau en seulement 5 secondes, contre ~13 secondes pour laMSI Titan GT77.
| SD Card Reader | |
| average JPG Copy Test (av. of 3 runs) | |
| Razer Blade 18 RTX 4070 (Angelibird AV Pro V60) | |
| Razer Blade 17 Early 2022 (AV PRO microSD 128 GB V60) | |
| Razer Blade 16 Early 2023 (AV PRO microSD 128 GB V60) | |
| MSI Titan GT77 HX 13VI (Angelibird AV Pro V60) | |
| maximum AS SSD Seq Read Test (1GB) | |
| Razer Blade 18 RTX 4070 (Angelibird AV Pro V60) | |
| Razer Blade 16 Early 2023 (AV PRO microSD 128 GB V60) | |
| Gigabyte G7 KE (AV PRO microSD 128 GB V60) | |
| MSI Titan GT77 HX 13VI (Angelibird AV Pro V60) | |
Communication
Un Intel AX211 est fourni en standard pour la connectivité Wi-Fi 6E et Bluetooth 5.3 alors que le Blade 17 est livré avec le Killer AX1690i en comparaison. Le Killer AX1690i est le dérivé spécifique au jeu du Intel AX211 et les utilisateurs ne devraient donc pas voir de différences de performances significatives entre les deux.
| Networking | |
| iperf3 transmit AXE11000 6GHz | |
| Asus ROG Strix Scar 17 SE G733CX-LL014W | |
| Razer Blade 18 RTX 4070 | |
| iperf3 receive AXE11000 6GHz | |
| Asus ROG Strix Scar 17 SE G733CX-LL014W | |
| Razer Blade 18 RTX 4070 | |
| iperf3 receive AXE11000 | |
| Razer Blade 17 Early 2022 | |
| Gigabyte G7 KE | |
| MSI Titan GT77 HX 13VI | |
| Razer Blade 18 RTX 4070 | |
| Alienware m17 R5 (R9 6900HX, RX 6850M XT) | |
| iperf3 transmit AXE11000 | |
| Gigabyte G7 KE | |
| MSI Titan GT77 HX 13VI | |
| Razer Blade 18 RTX 4070 | |
| Alienware m17 R5 (R9 6900HX, RX 6850M XT) | |
Webcam - Maintenant avec 5 MP
Razer a fait passer la webcam de 2 MP sur le Blade 17 à 5 MP sur le Blade 18. Nous nous attendons à ce que le fabricant commence à mettre à jour ses petits modèles Blade avec le même capteur de 5 MP à un moment donné dans un avenir proche. Les images sont plus nettes avec le capteur de 5 MP, tandis que les couleurs n'ont pas beaucoup changé. L'IR est fourni en standard pour le support de Windows Hello.
Étrangement, il n'y a pas d'obturateur physique de confidentialité de la webcam même si le Blade 16 en intègre un. Il n'y a même pas de bouton d'arrêt numérique ou de touche de raccourci.


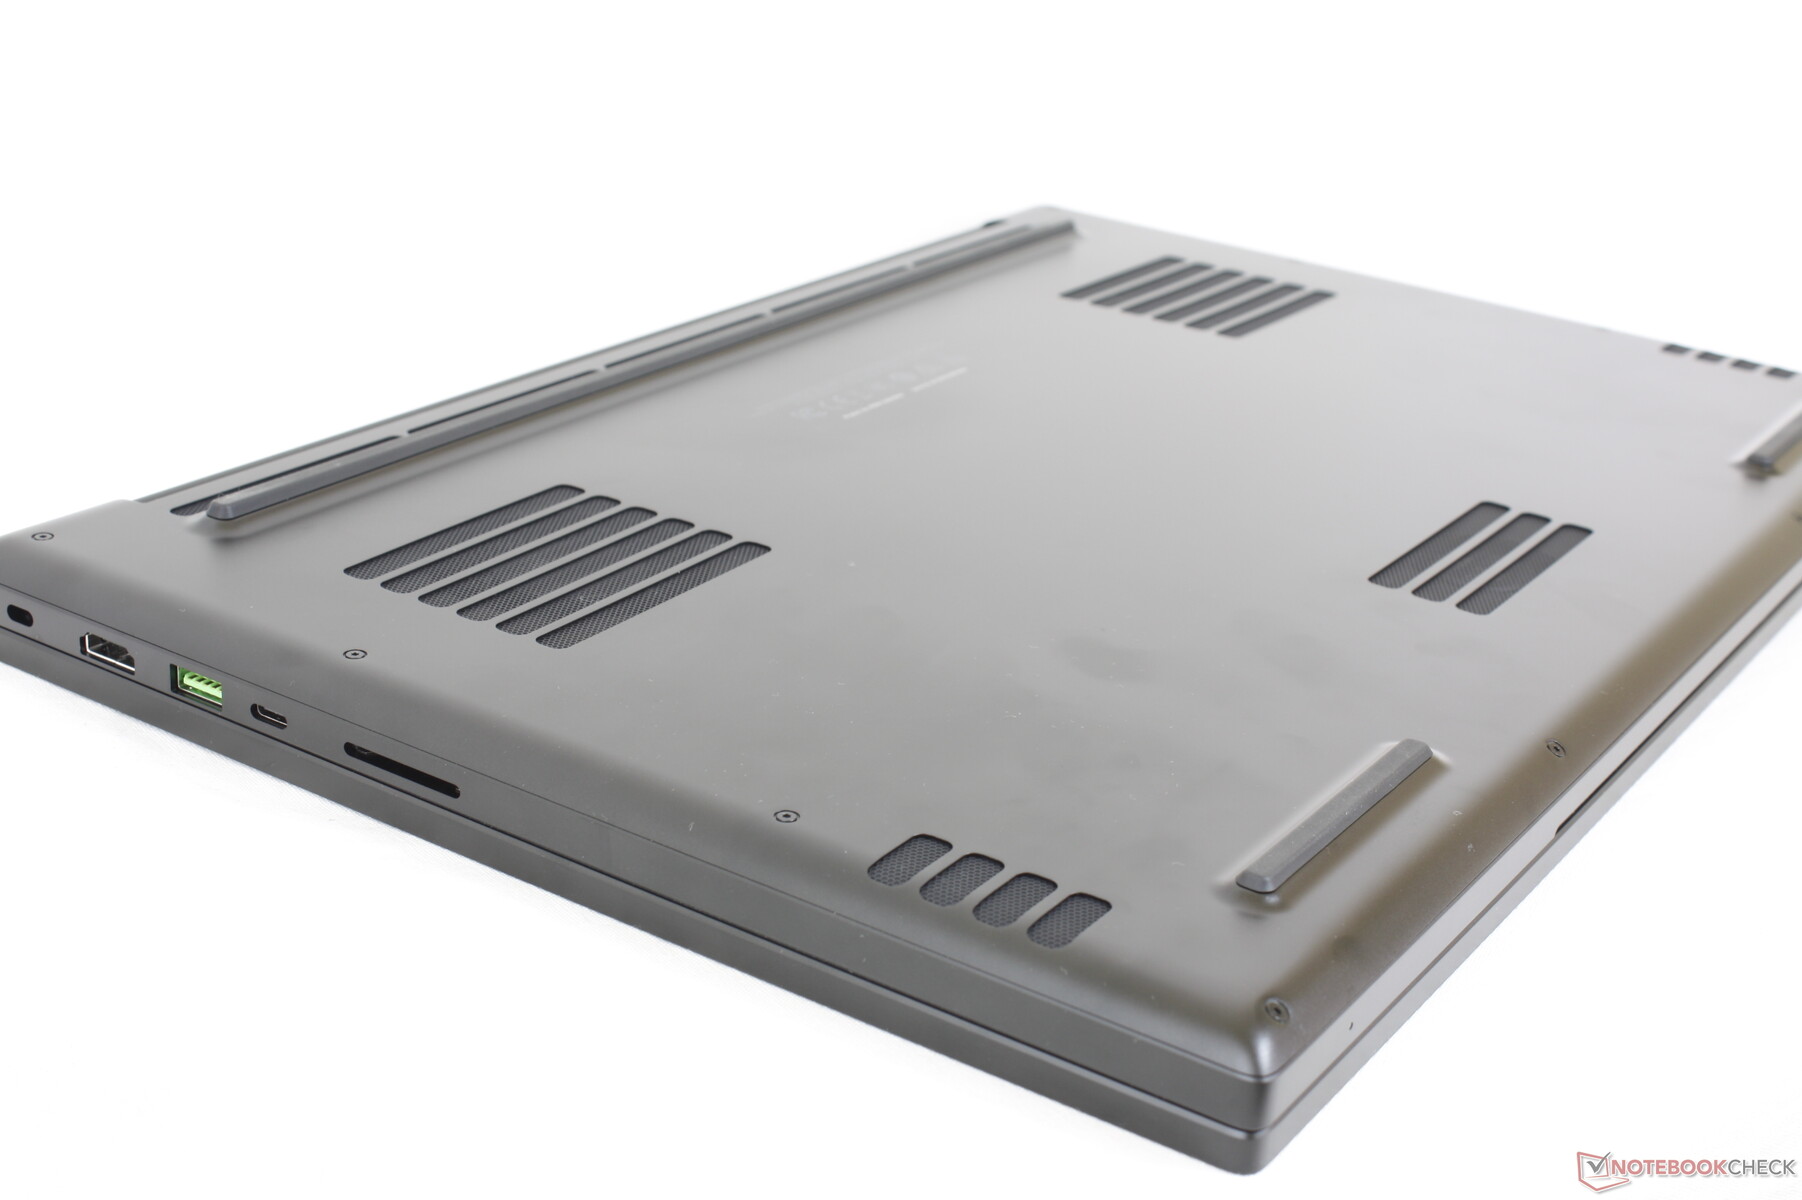
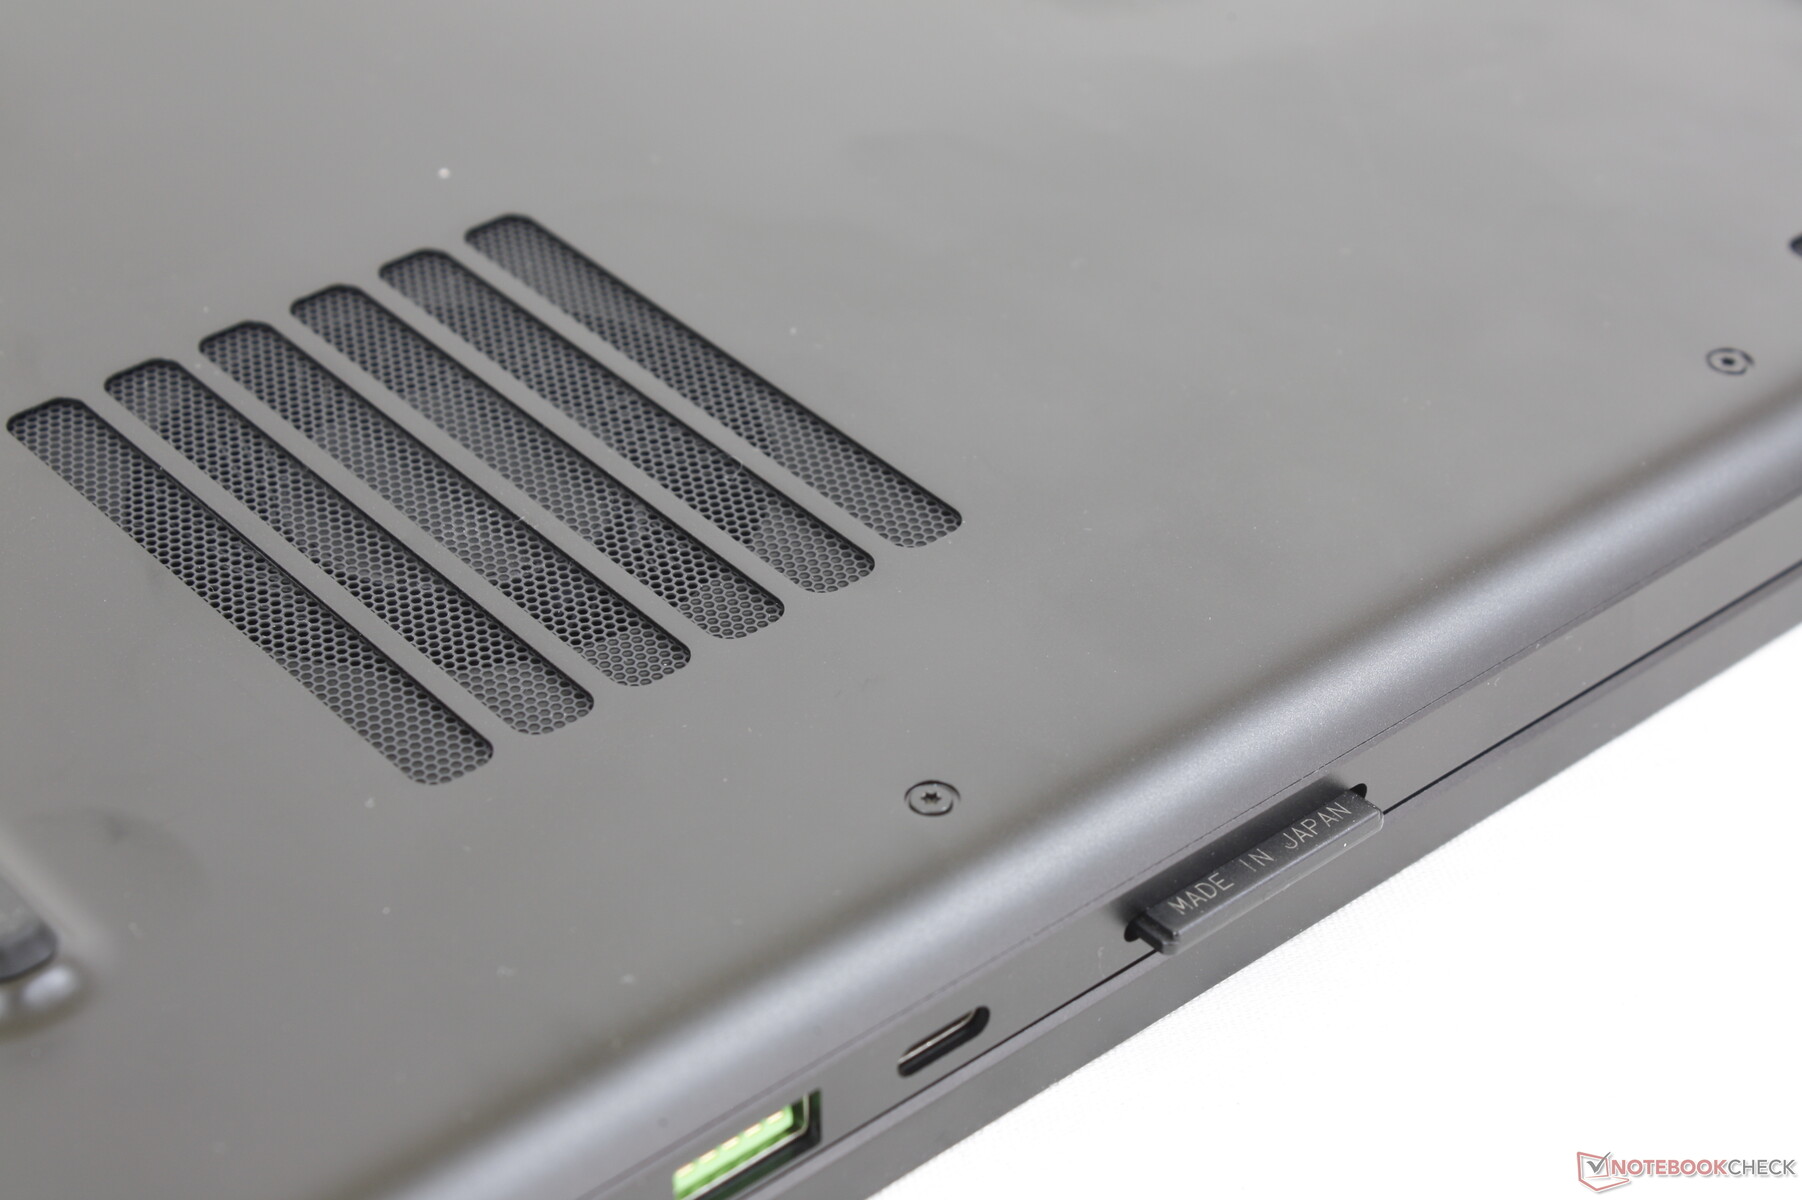
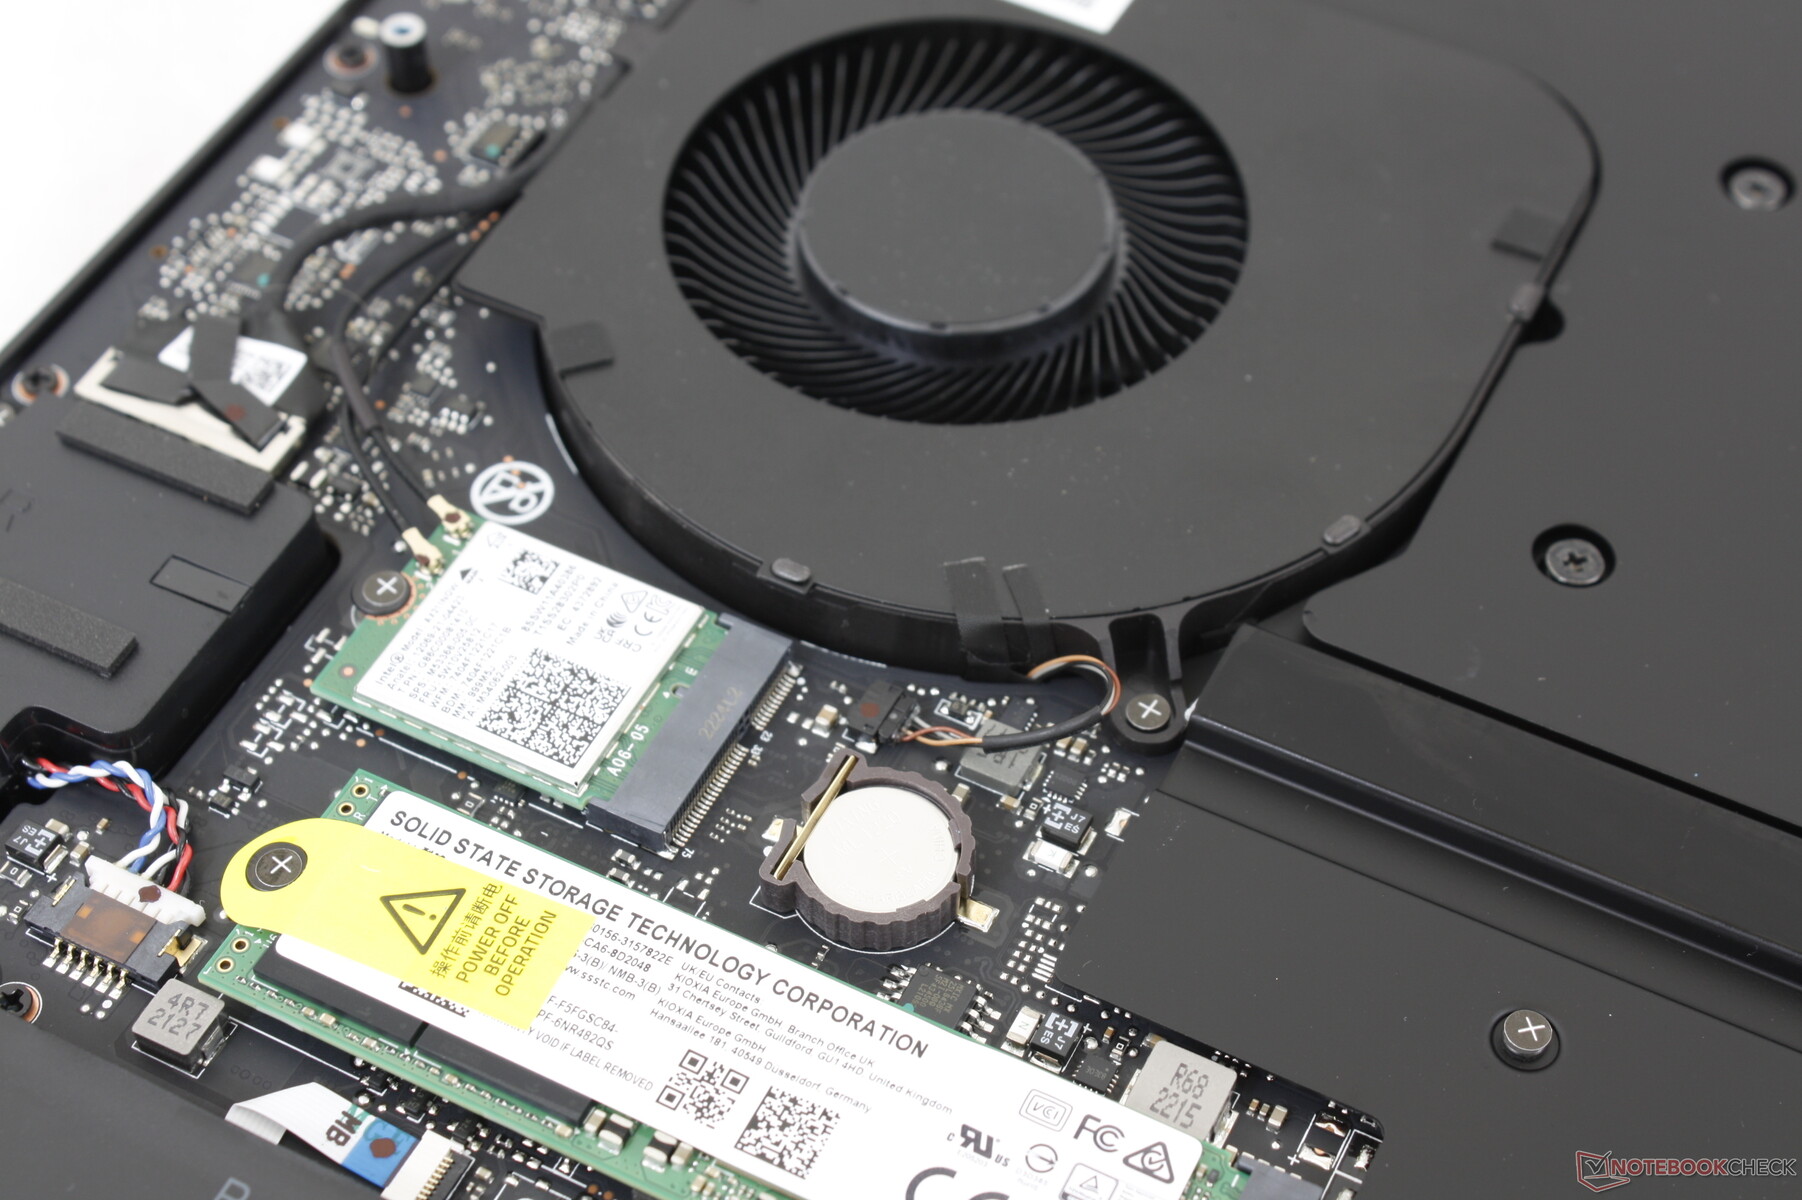
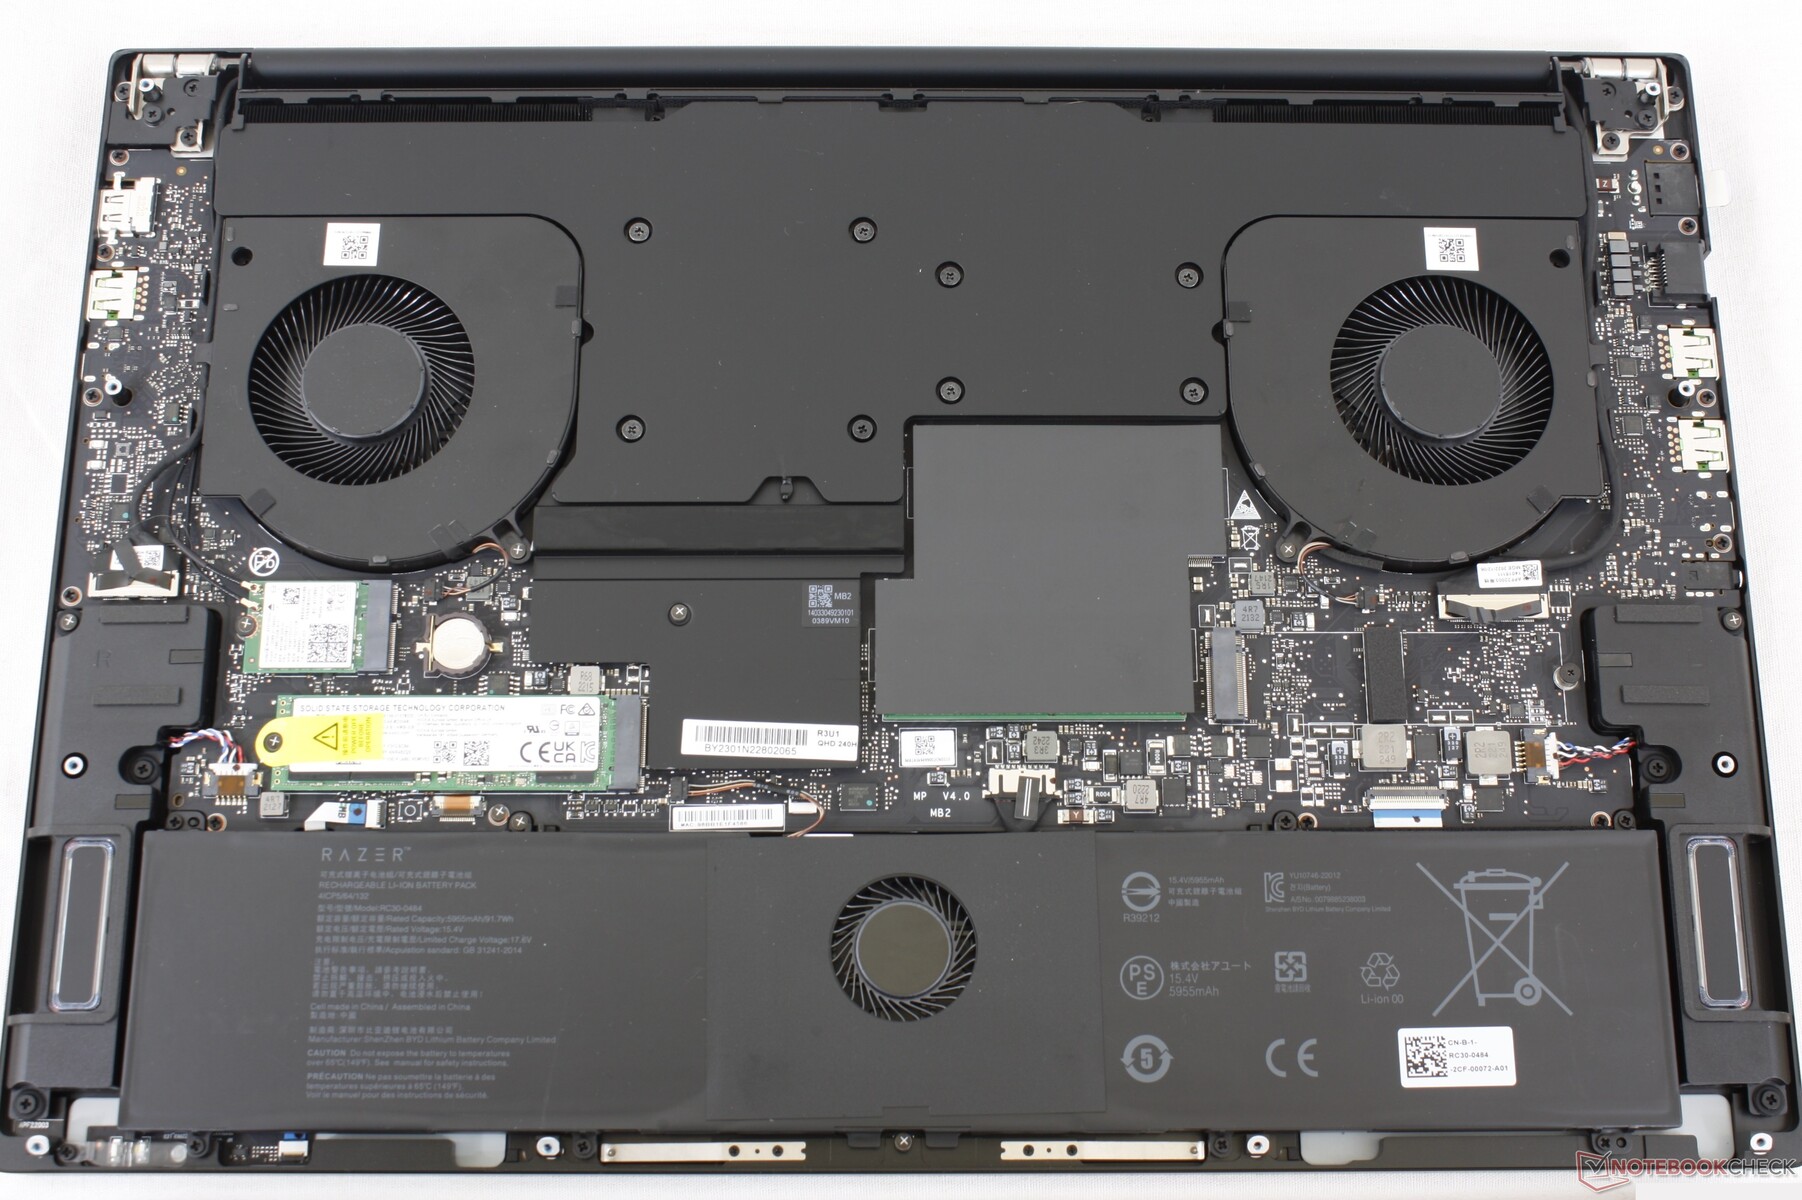
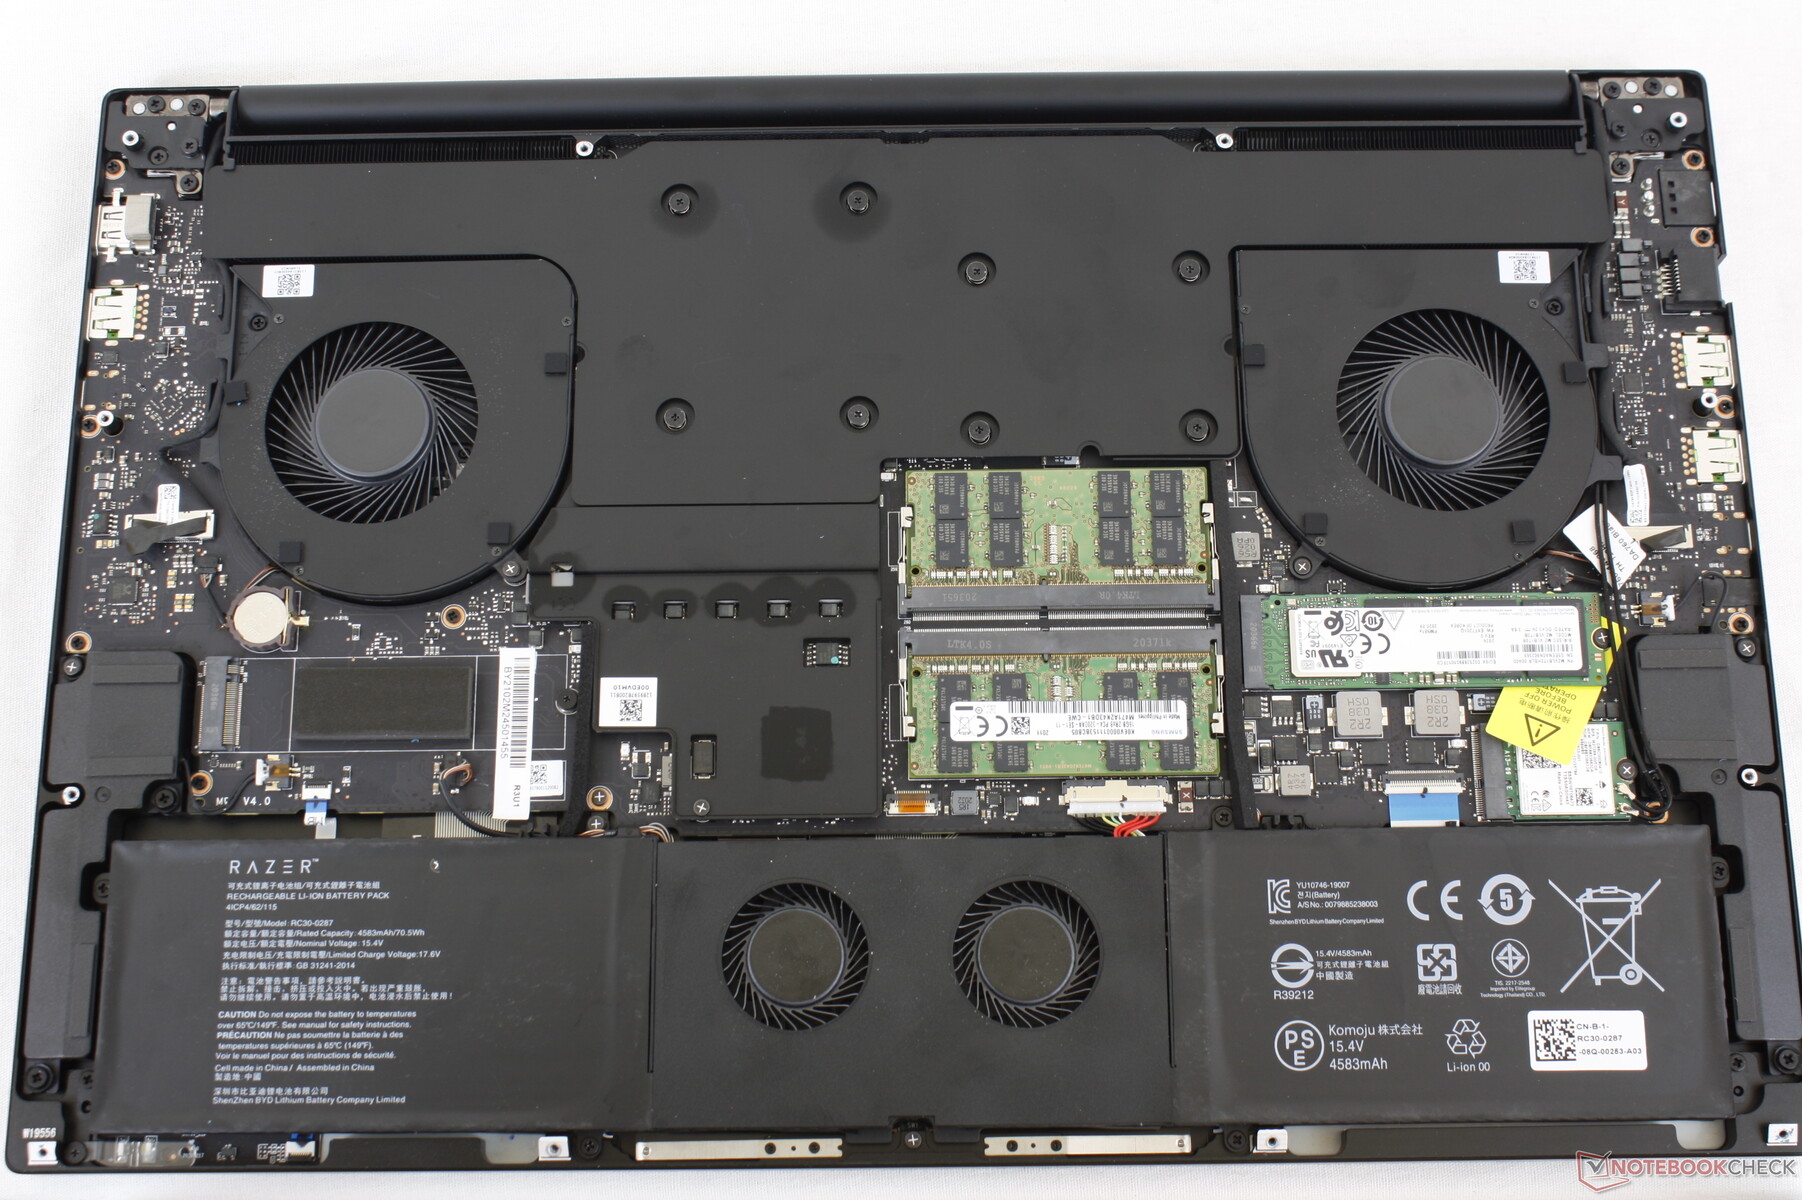
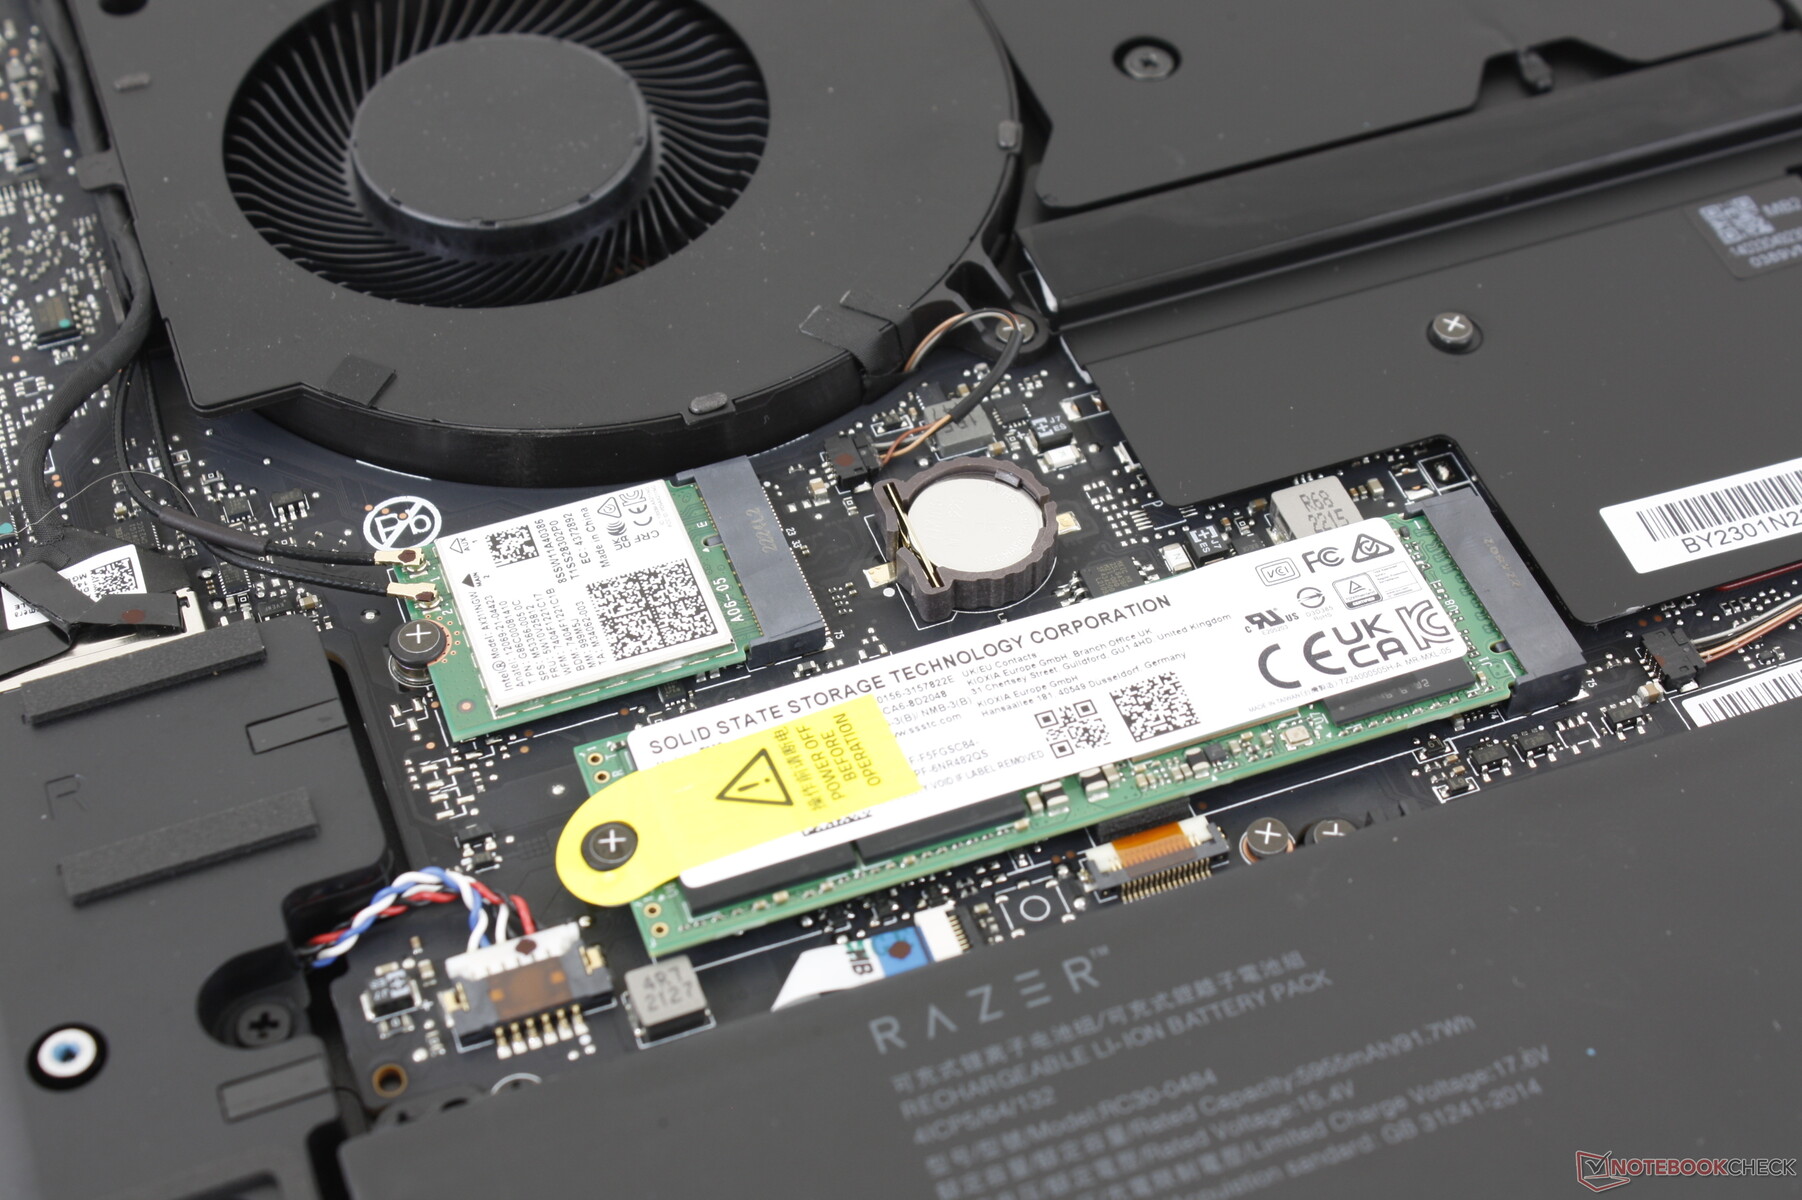
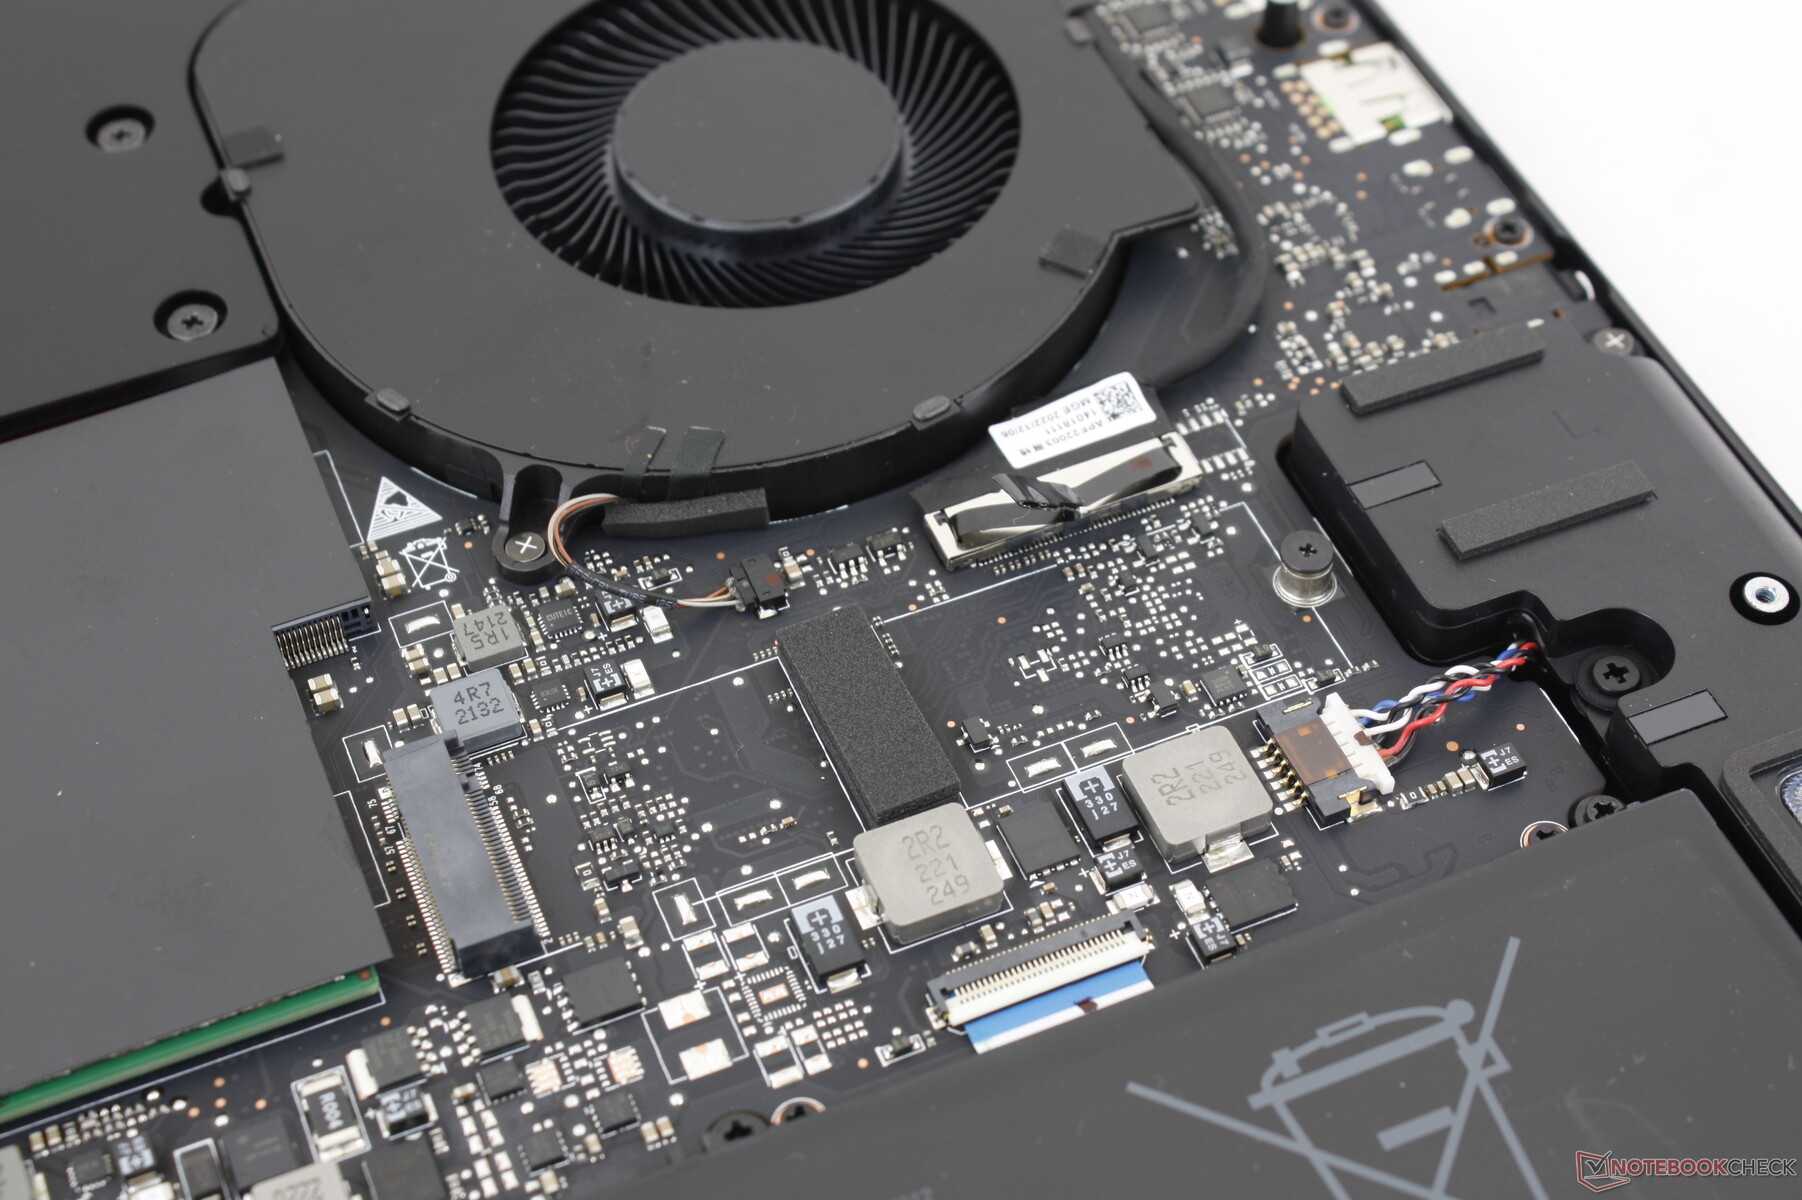
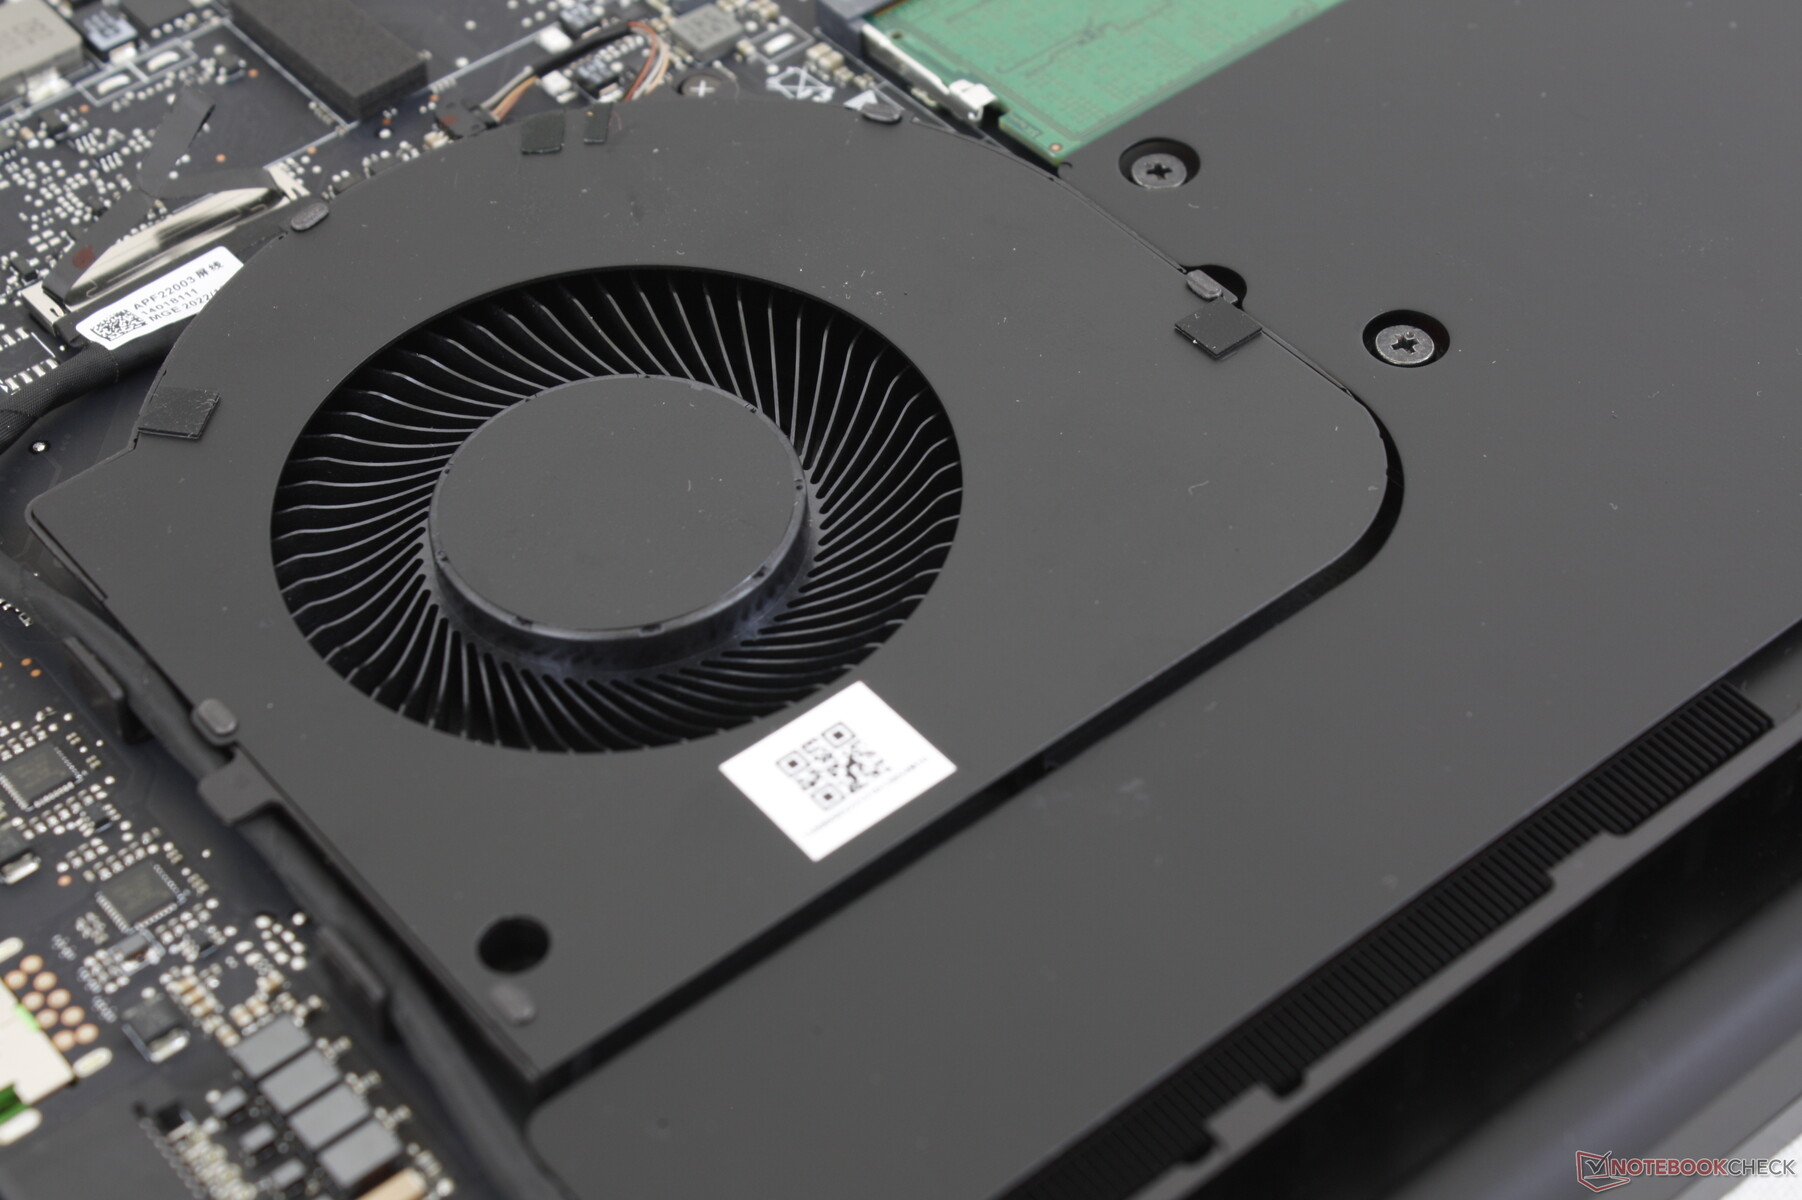
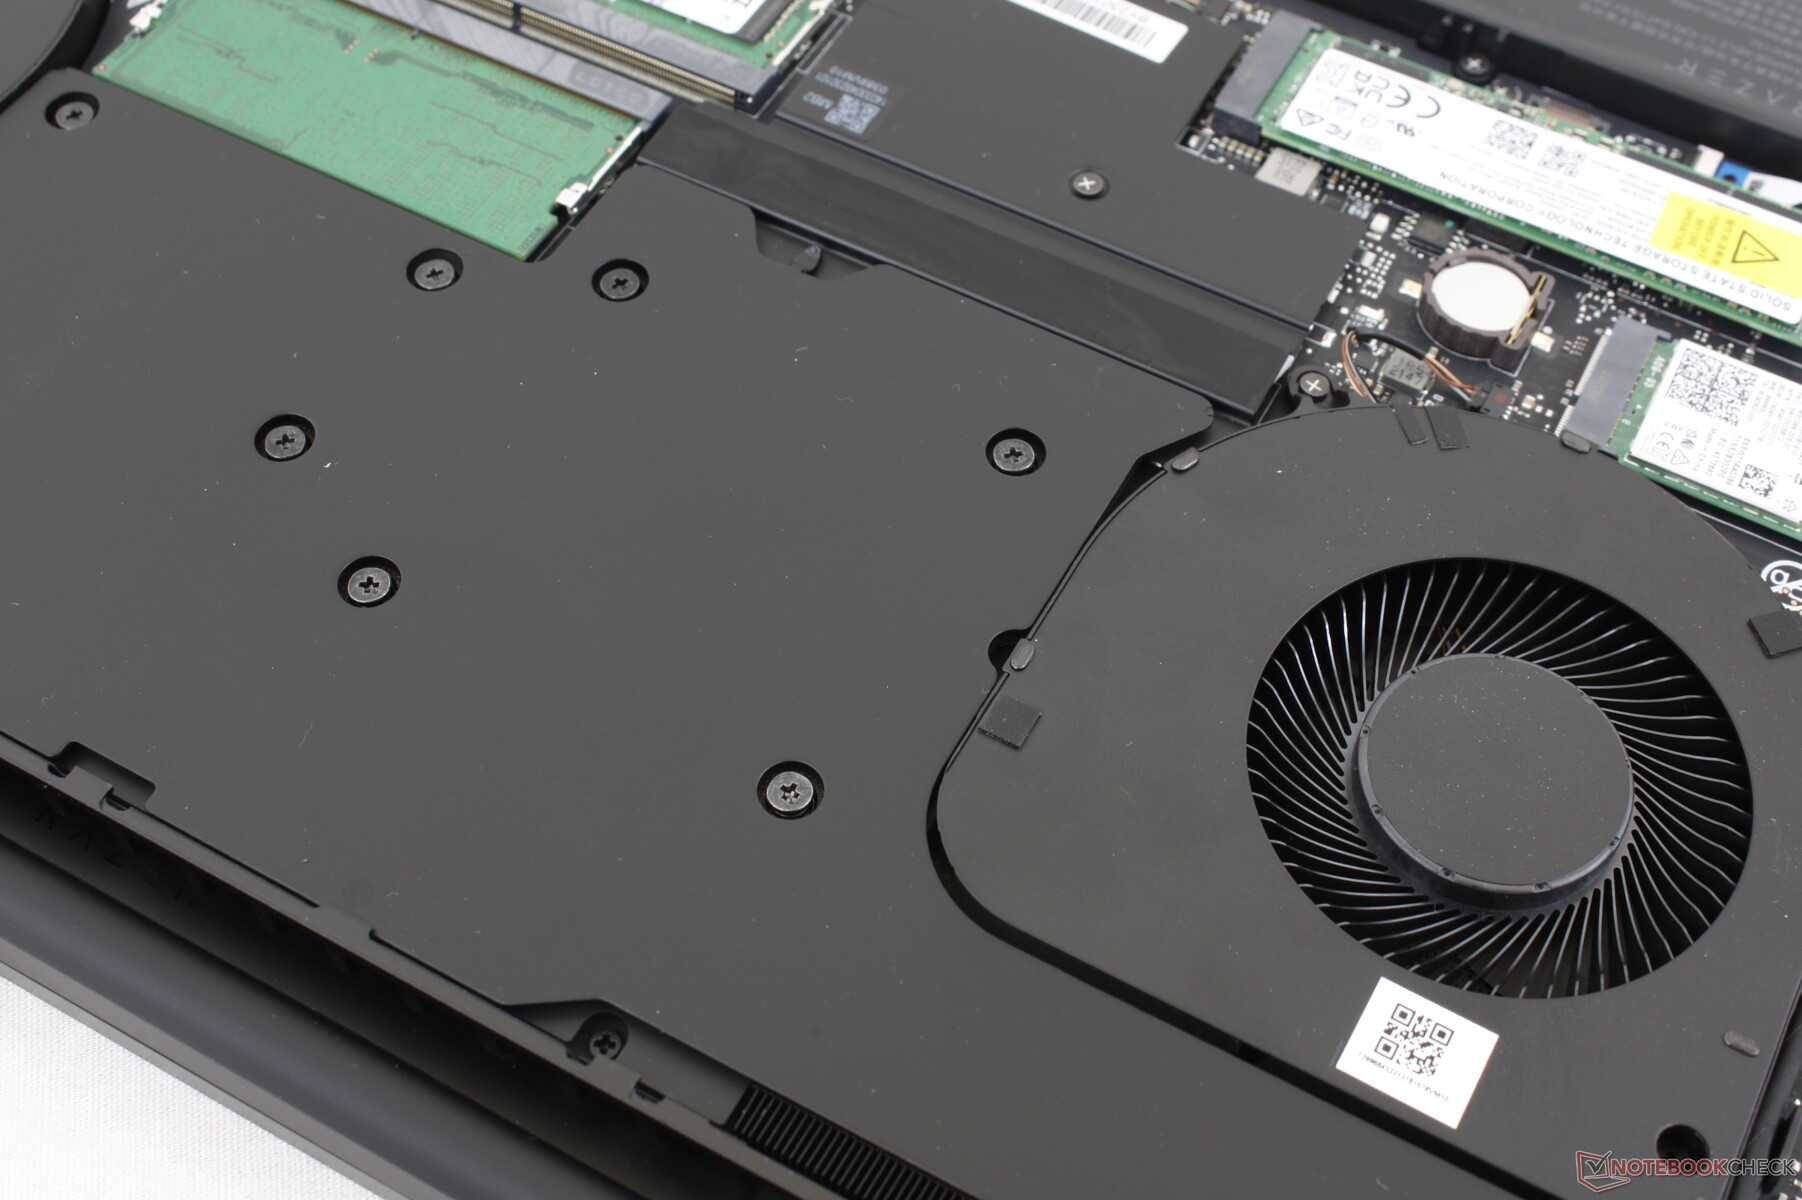
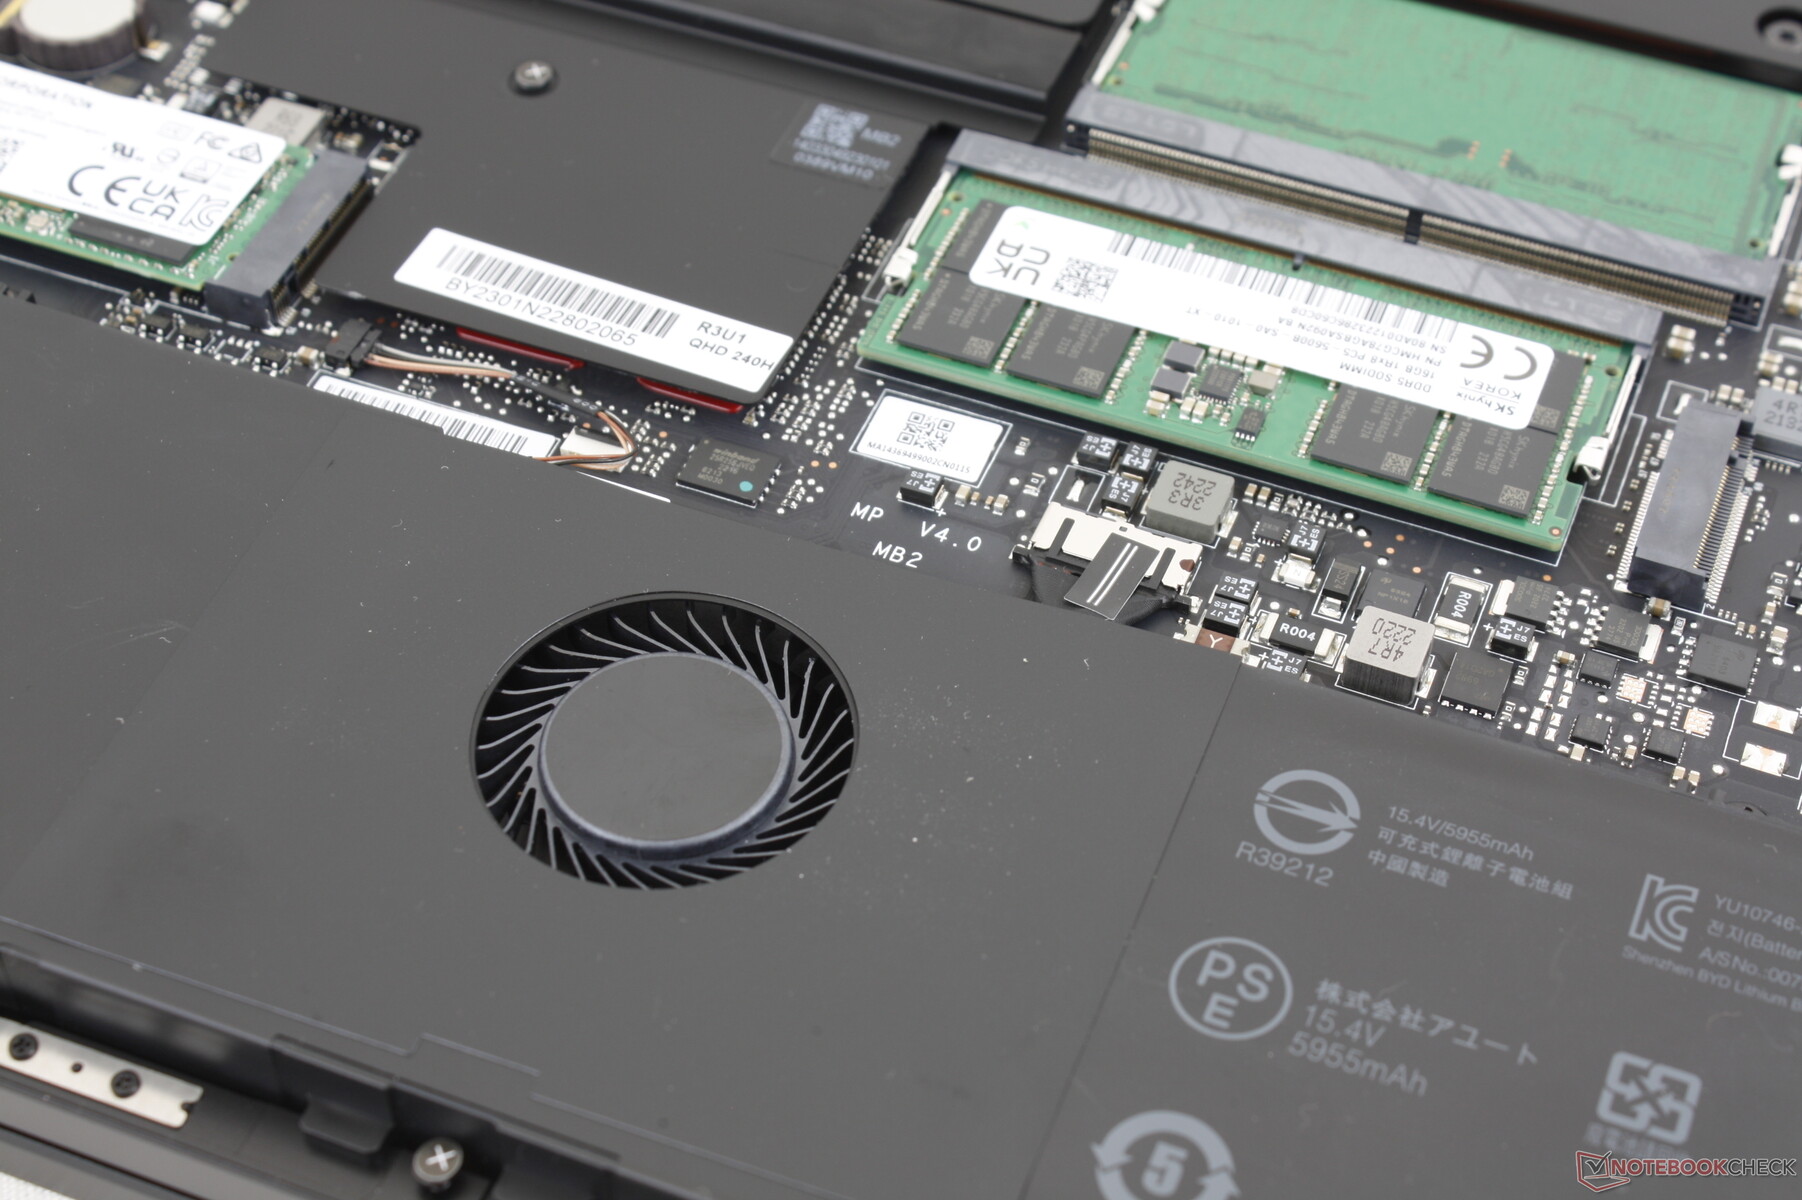
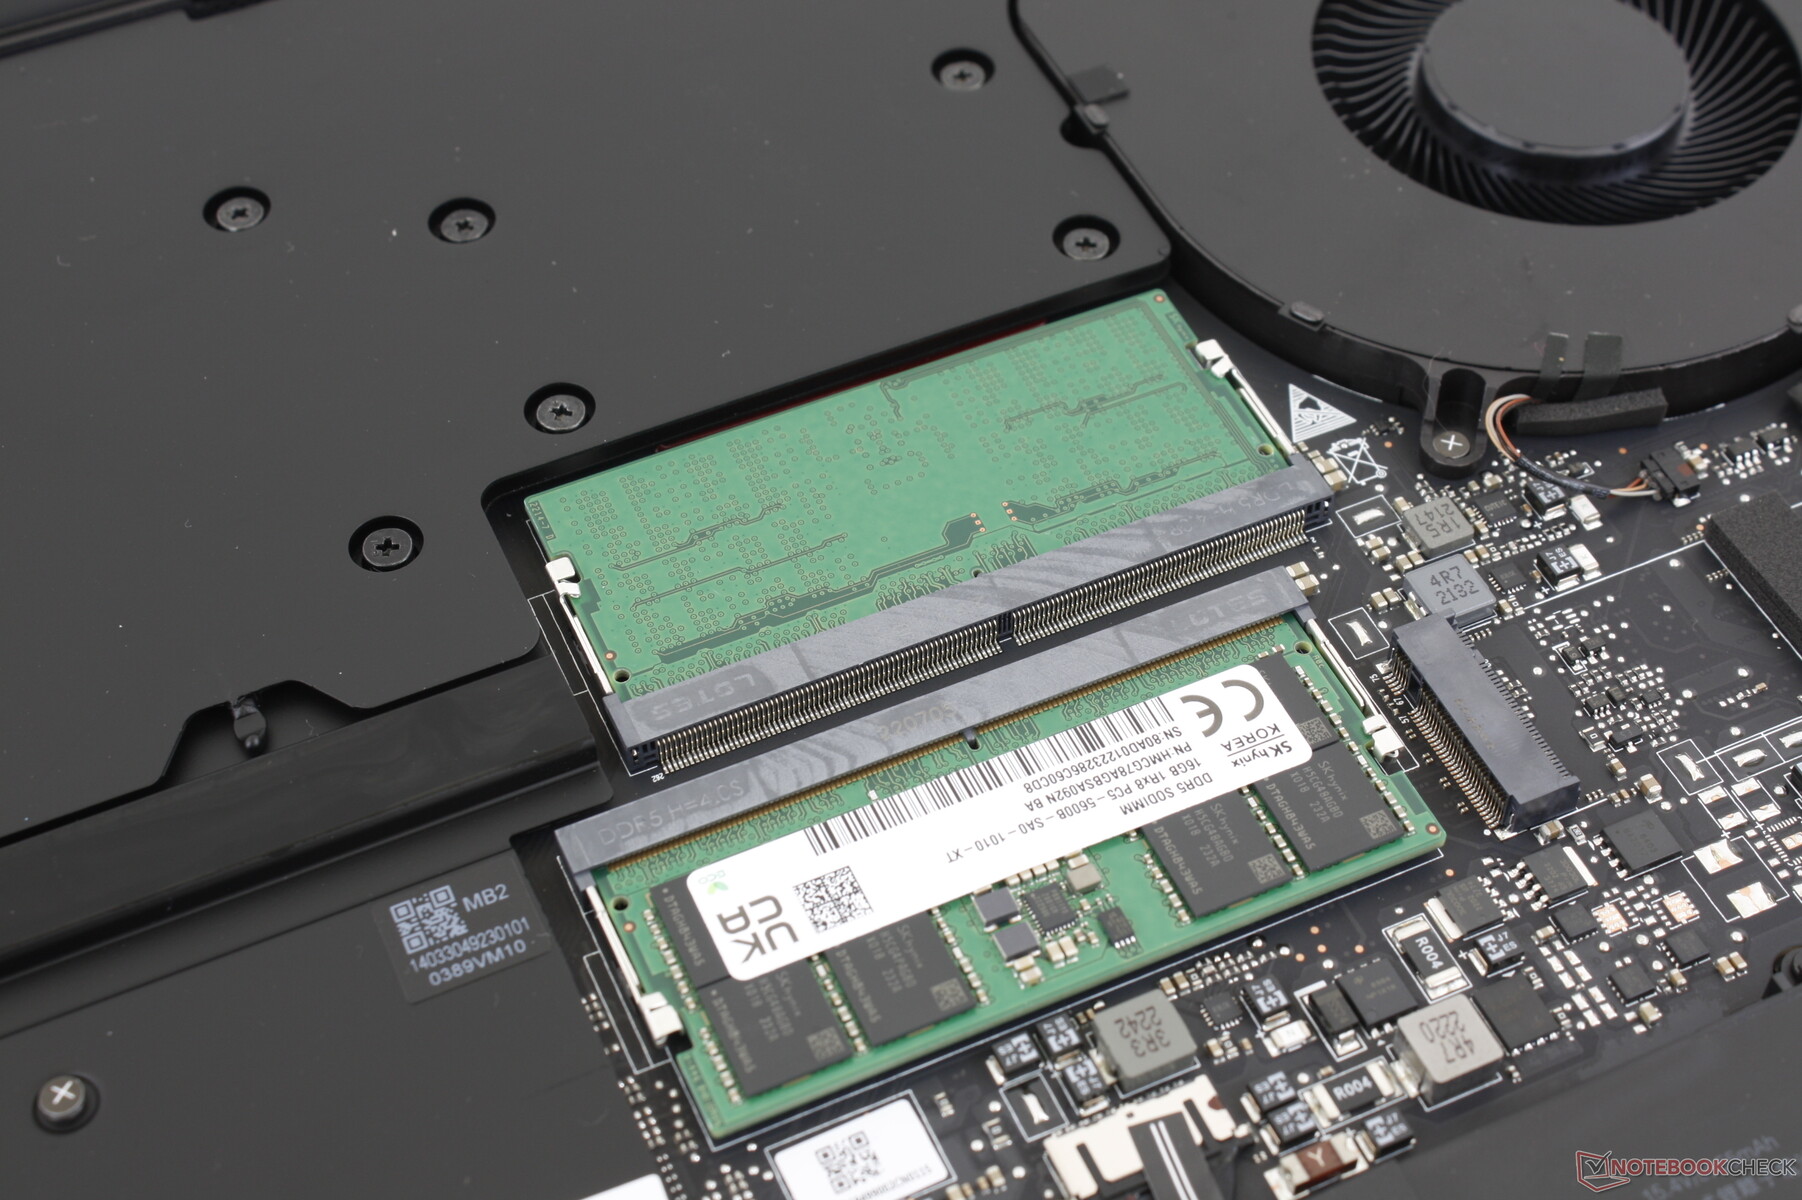
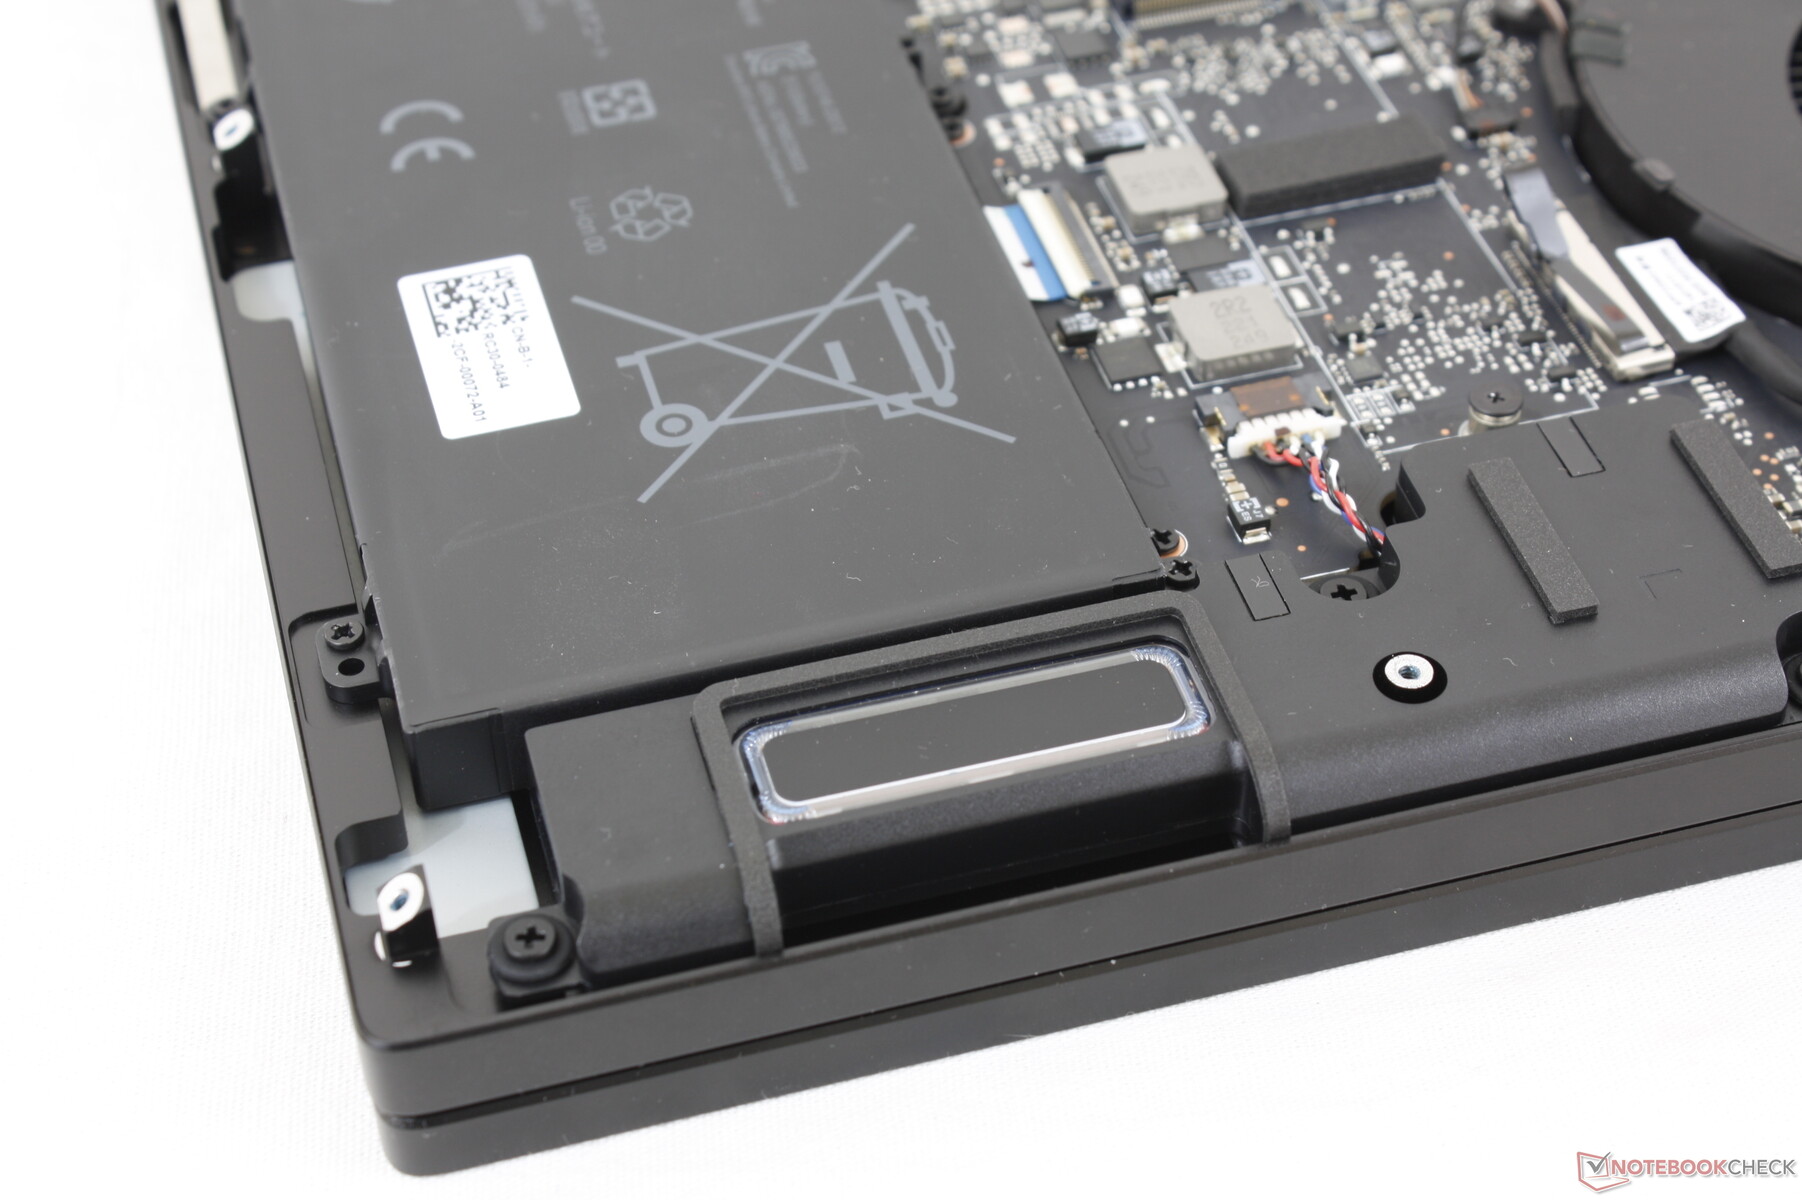
Maintenance
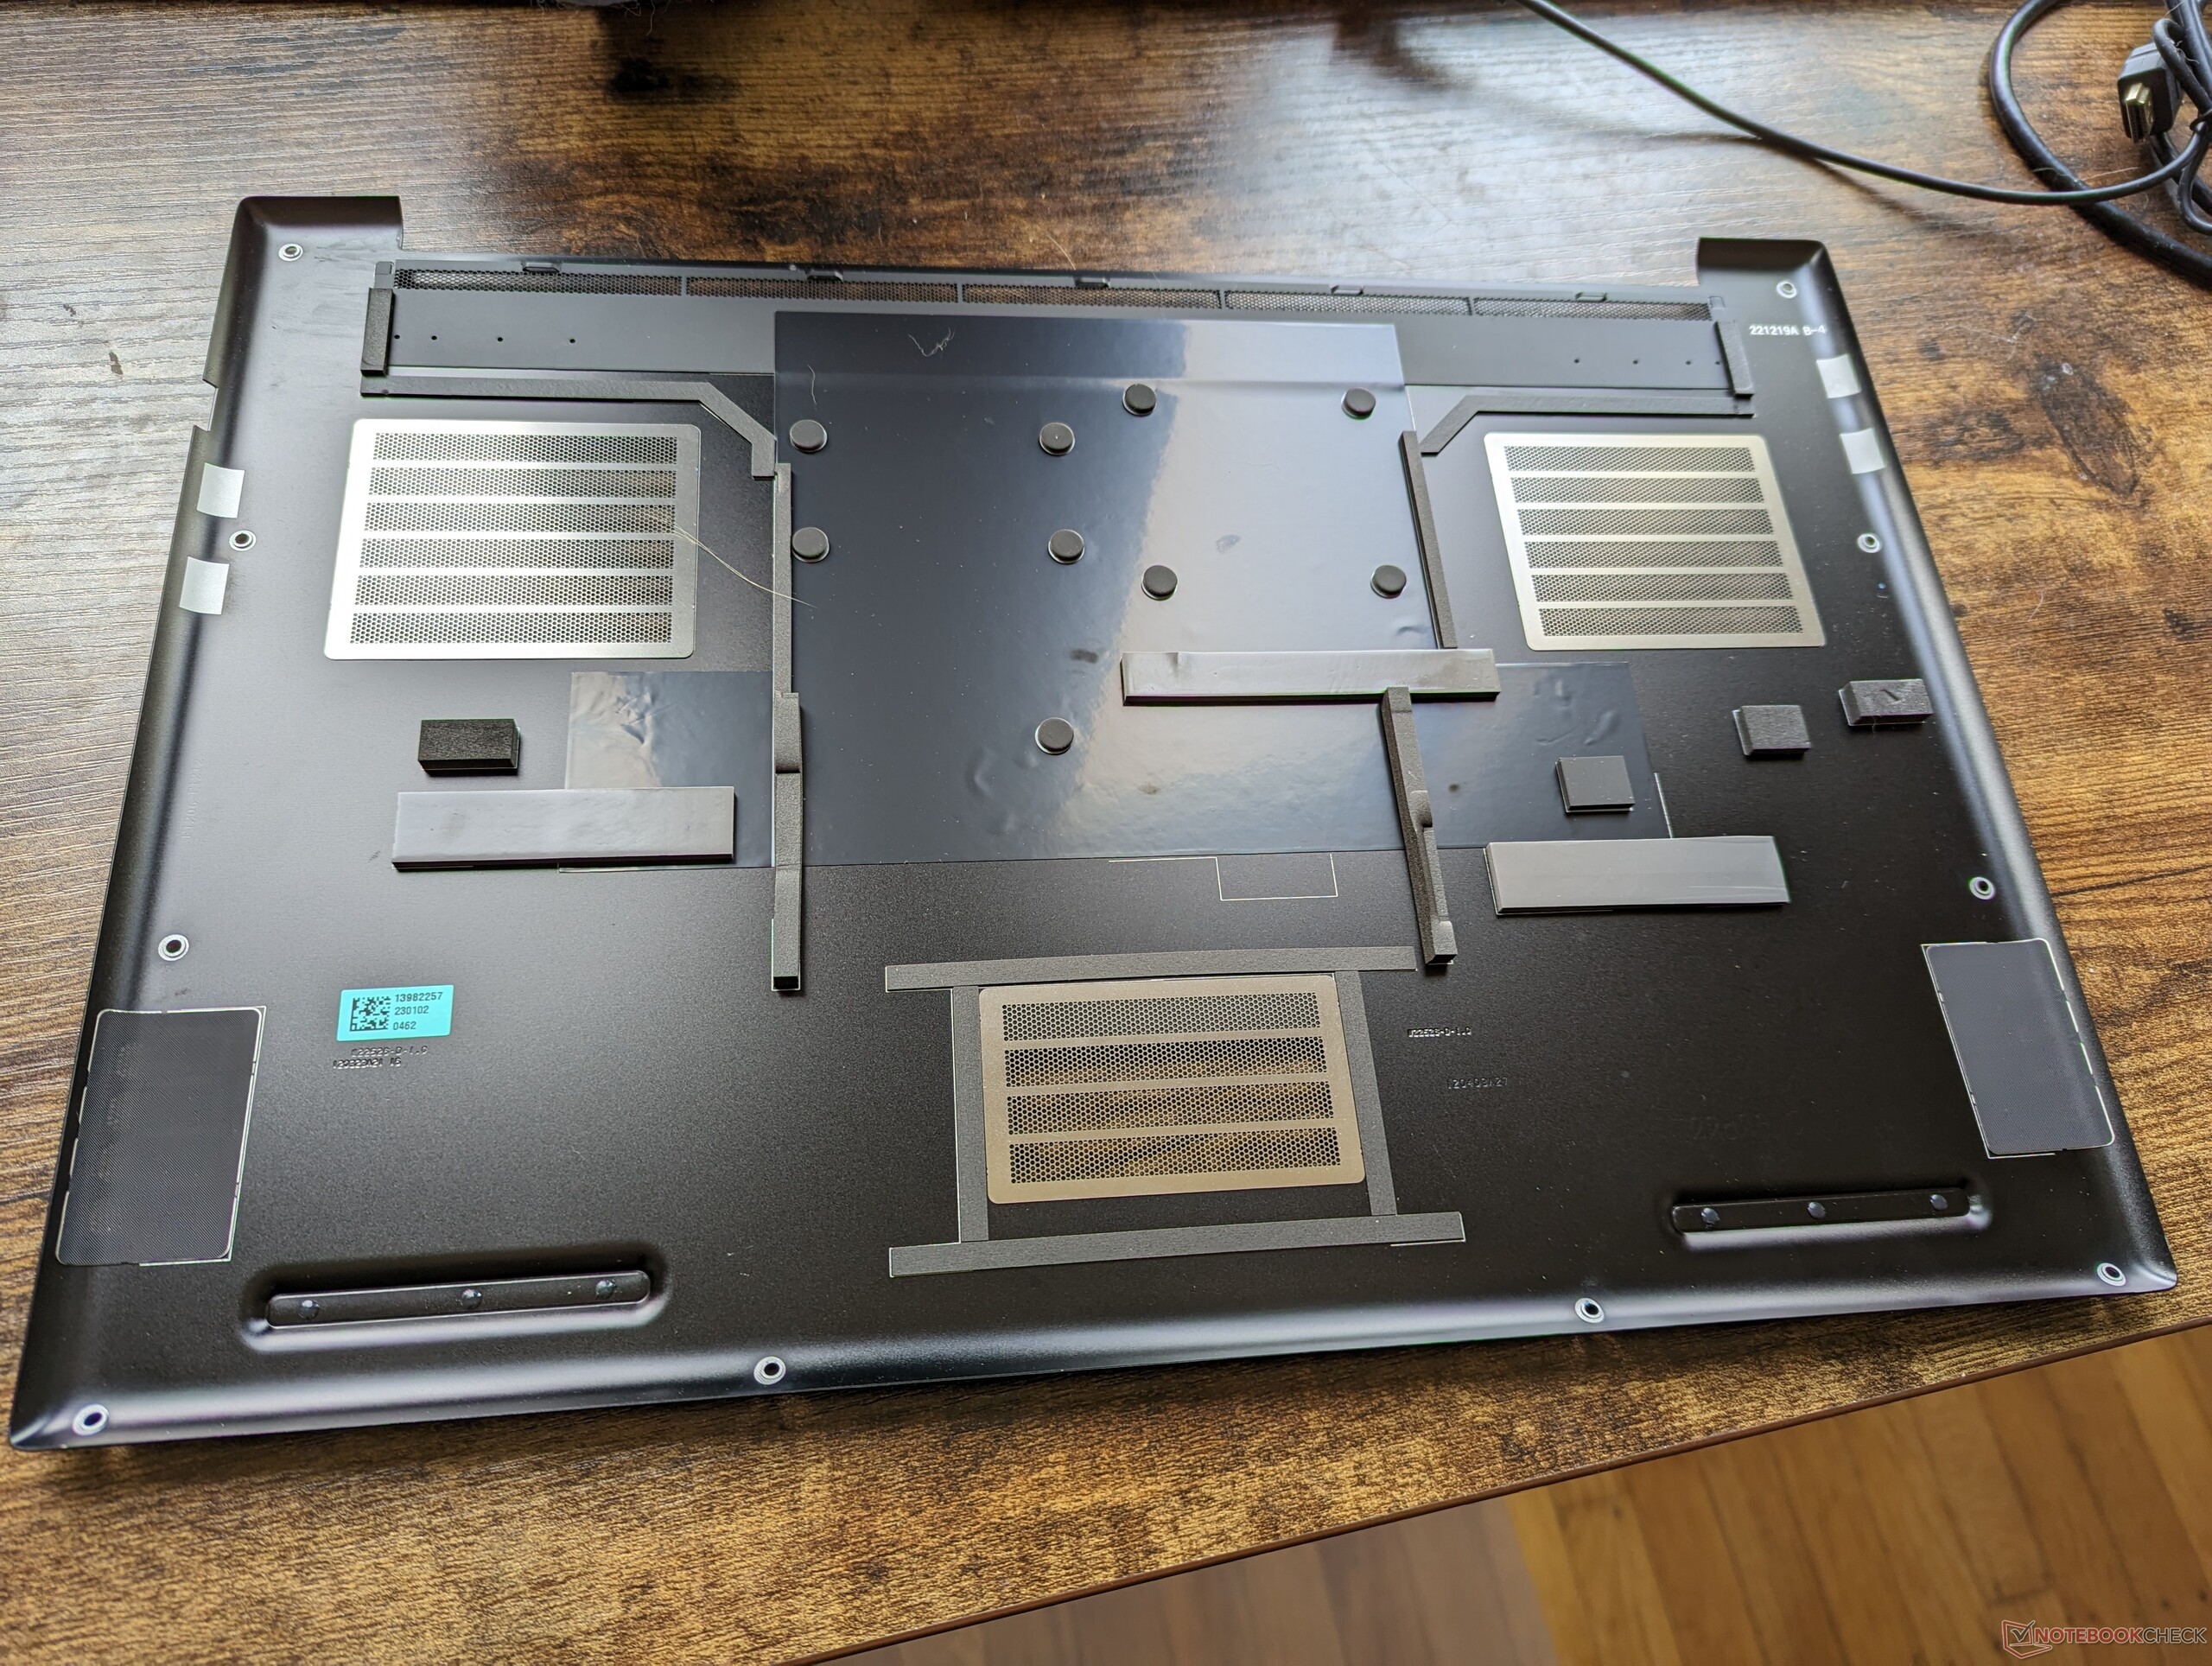
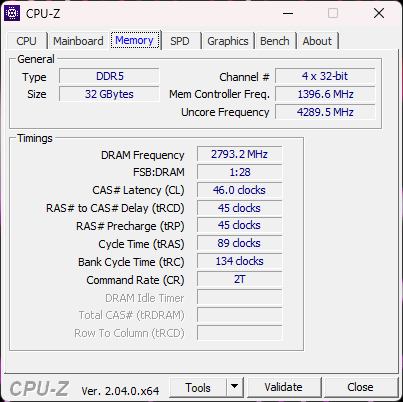
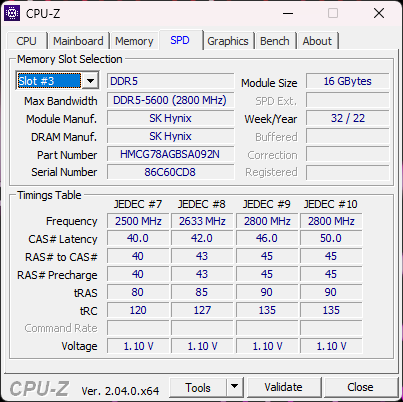
Le panneau inférieur est fixé par dix vis Torx T5 pour faciliter l'entretien. Les utilisateurs ont un accès direct à deux emplacements pour SSD M.2 2280, deux emplacements SODIMM pouvant accueillir jusqu'à 32 Go de DDR5-5600 ou 64 Go de DDR5-5200, et le module WLAN amovible. La conception actuelle du Blade 18 intègre notamment un ventilateur supplémentaire directement sous le pavé tactile, comme c'était le cas pour les anciens modèles Blade 17.
Accessoires et garantie
Il n'y a pas d'extras dans la boîte de détail. Une garantie fabricant limitée d'un an s'applique, tandis que la batterie interne bénéficie d'une garantie séparée de deux ans si elle est achetée aux États-Unis.
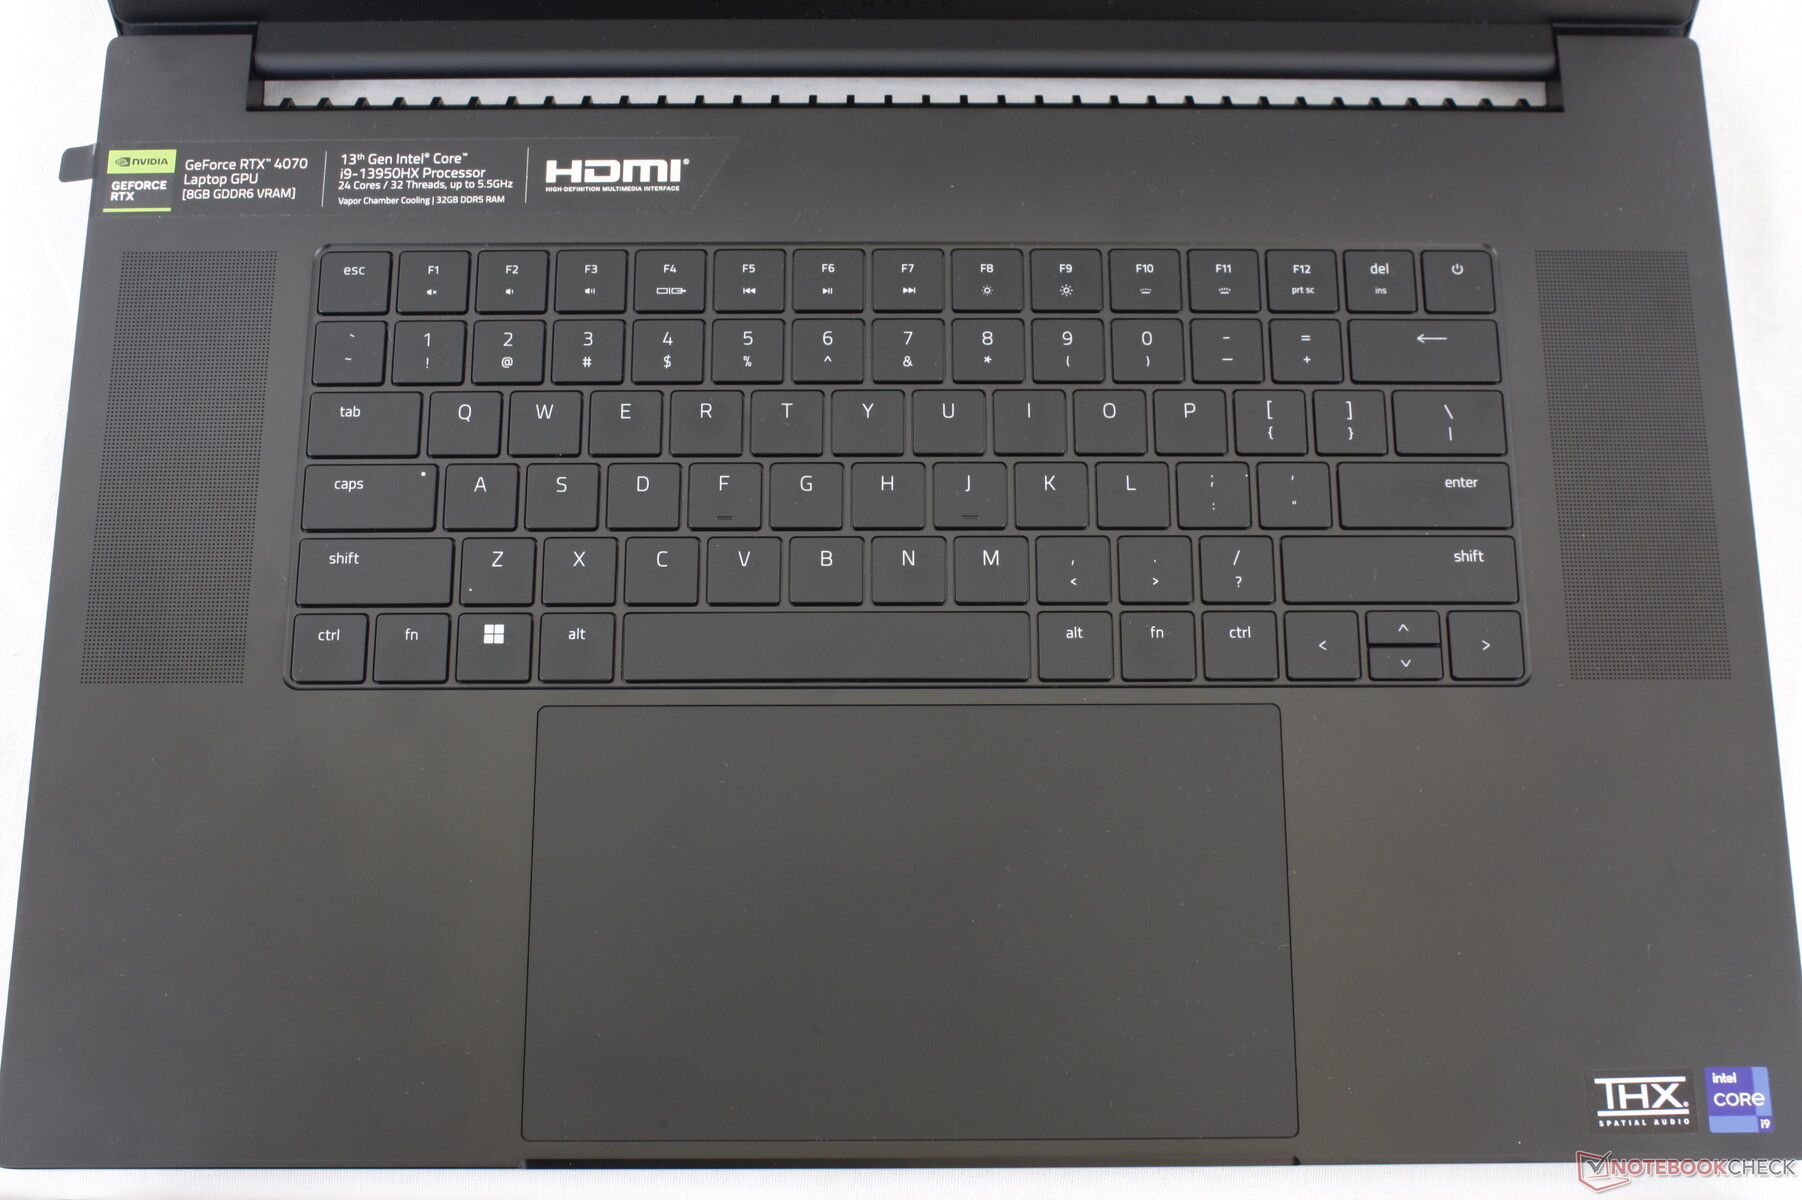
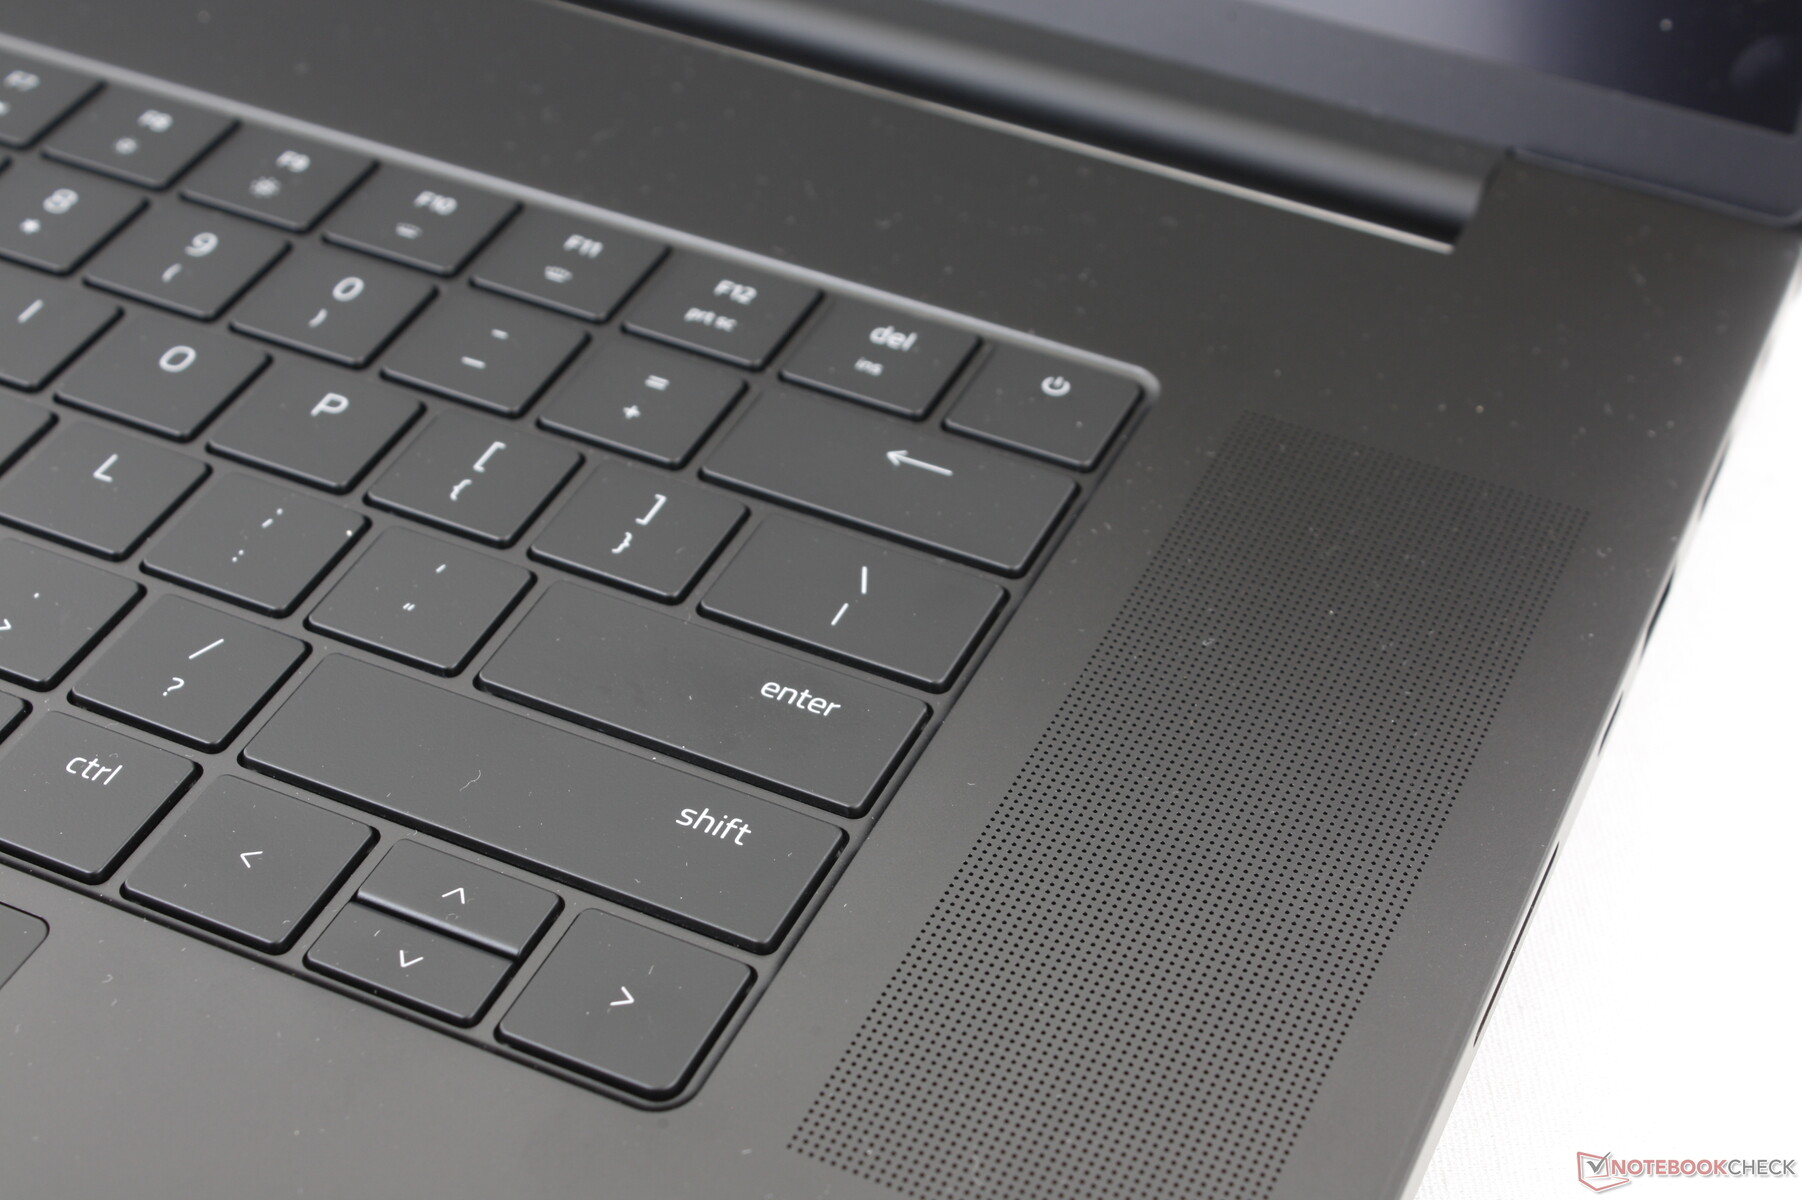
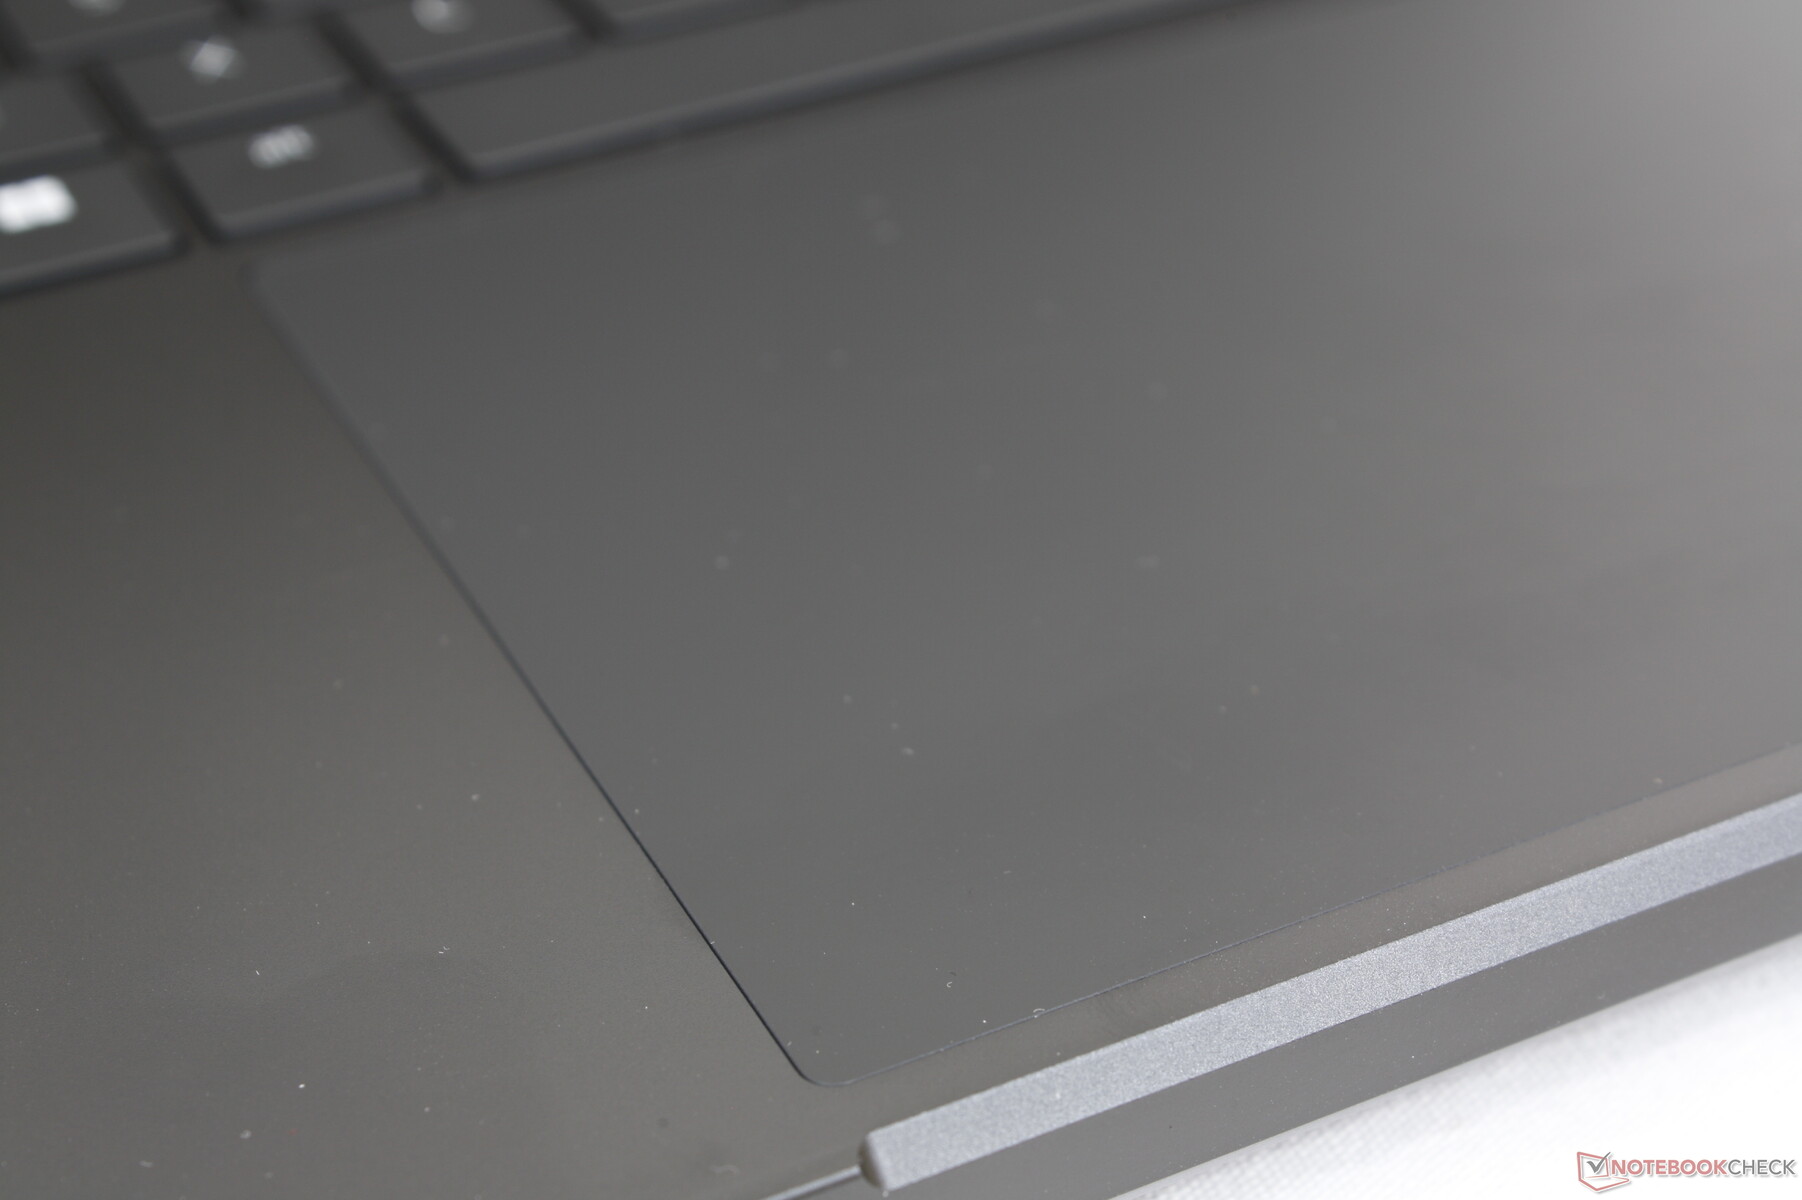
Périphériques d'entrée - Identique au Blade 16
Clavier et pavé tactile
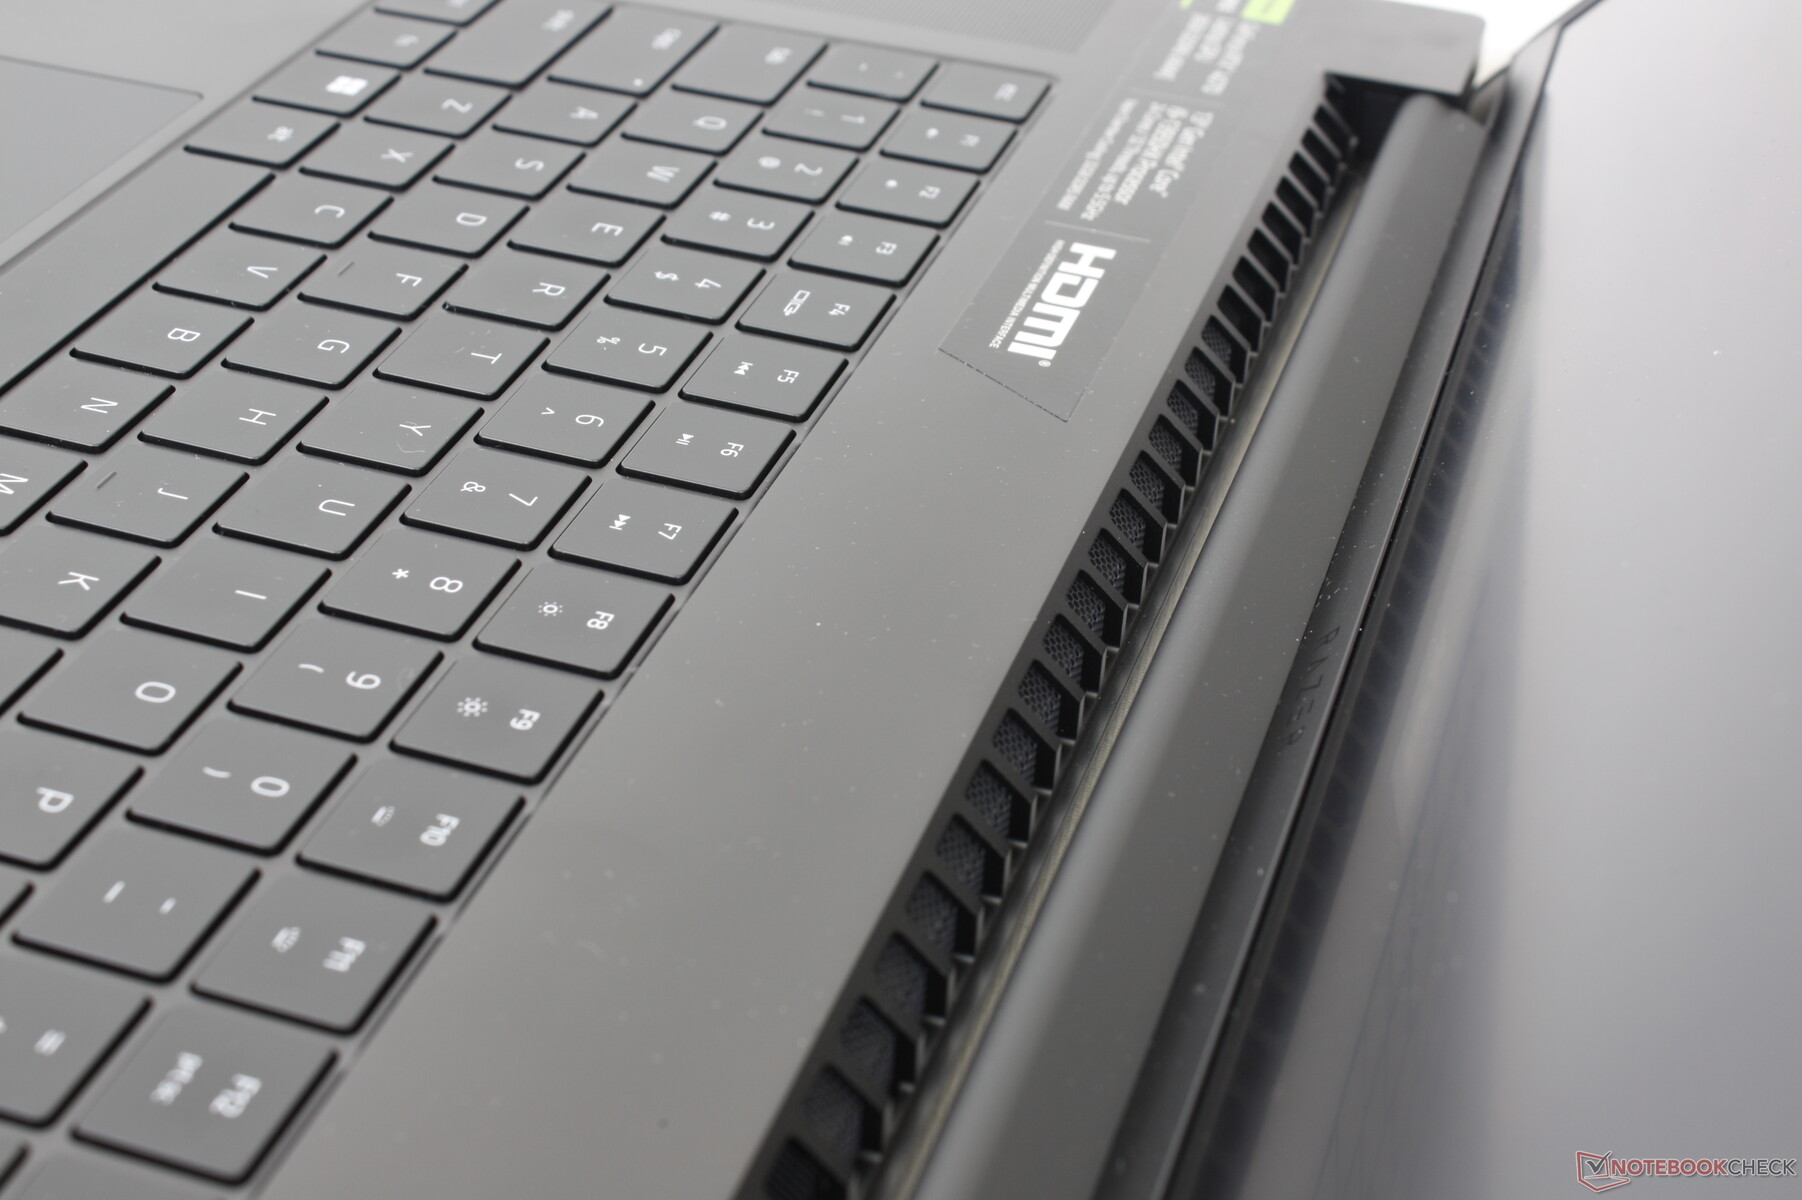
Le clavier et le clickpad sont les mêmes que sur le Blade 16 malgré les différences de taille d'écran entre les deux modèles. Même les dimensions du pavé tactile (17 x 9,7 cm) et du clavier n'ont pas changé, ce qui explique nos commentaires existants commentaires existants sur l'expérience de frappe du Blade 16 s'appliquent ici au Blade 18. Il est dommage que Razer n'ait pas utilisé la surface supplémentaire pour des touches fléchées plus grandes ou un éventuel pavé numérique.
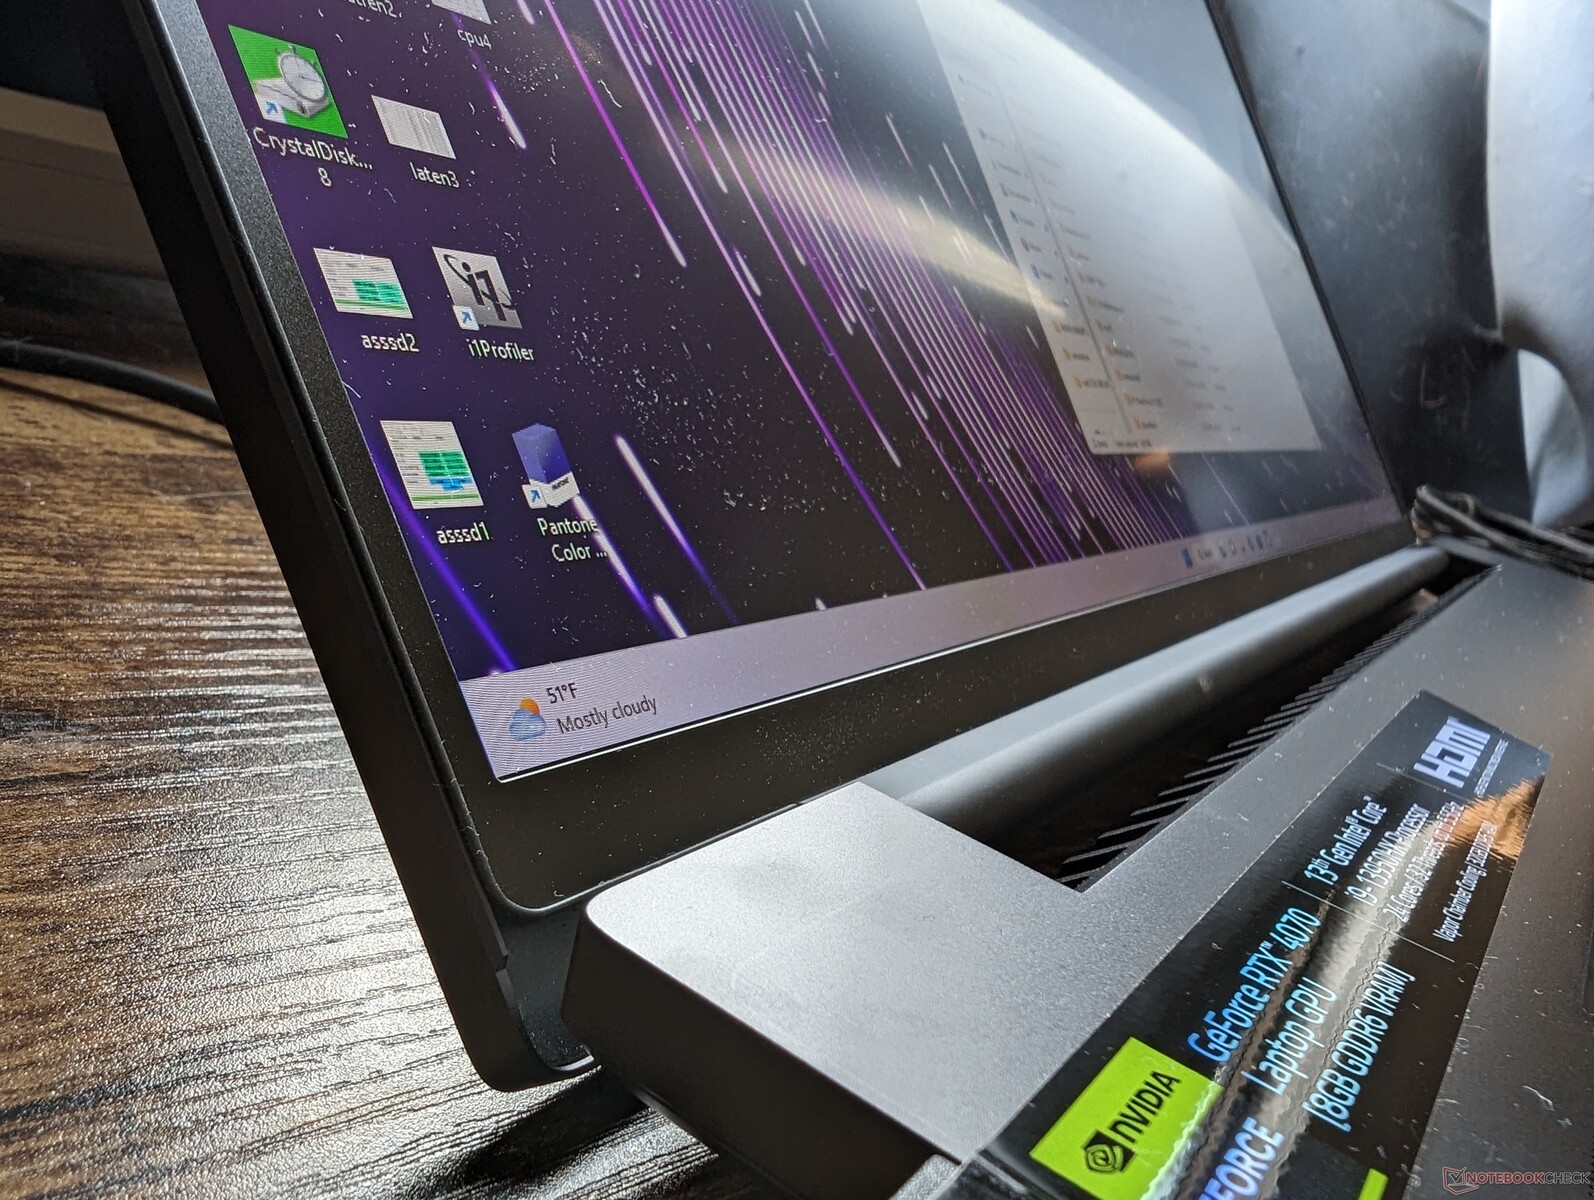
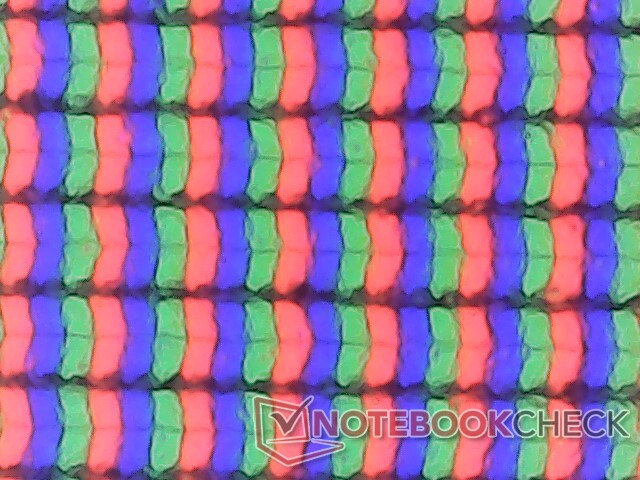
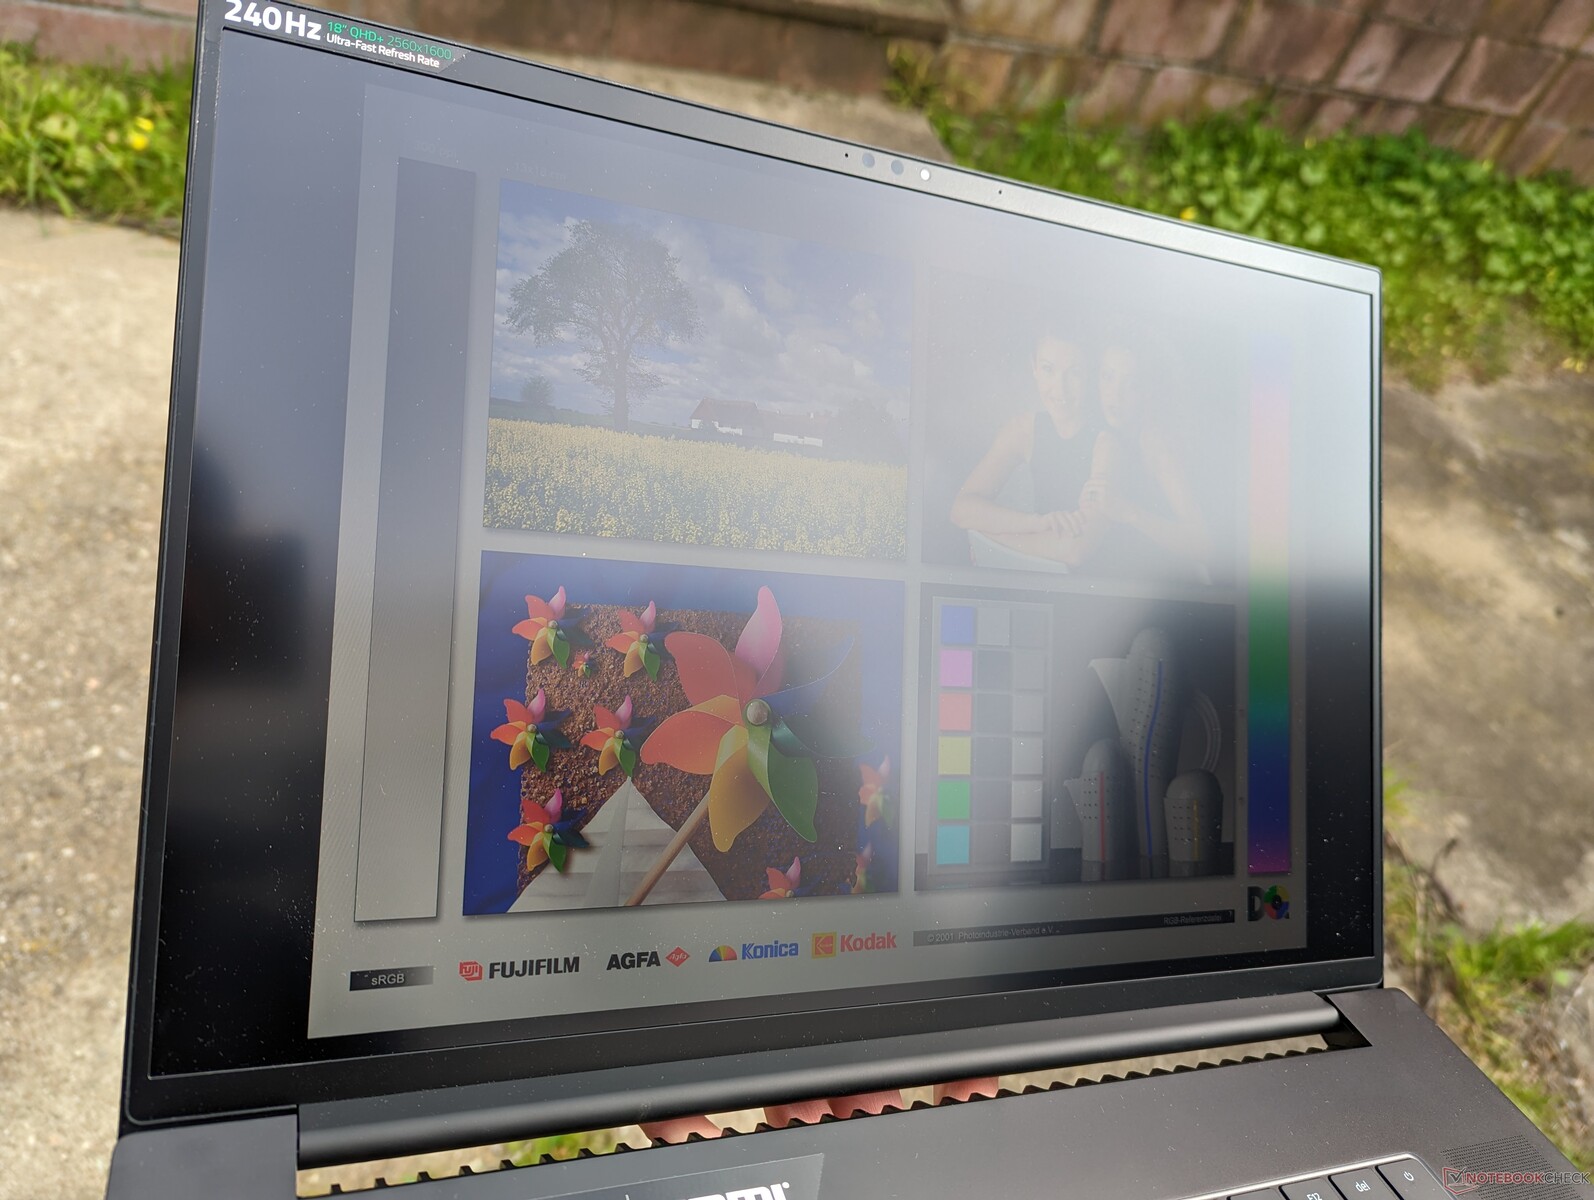
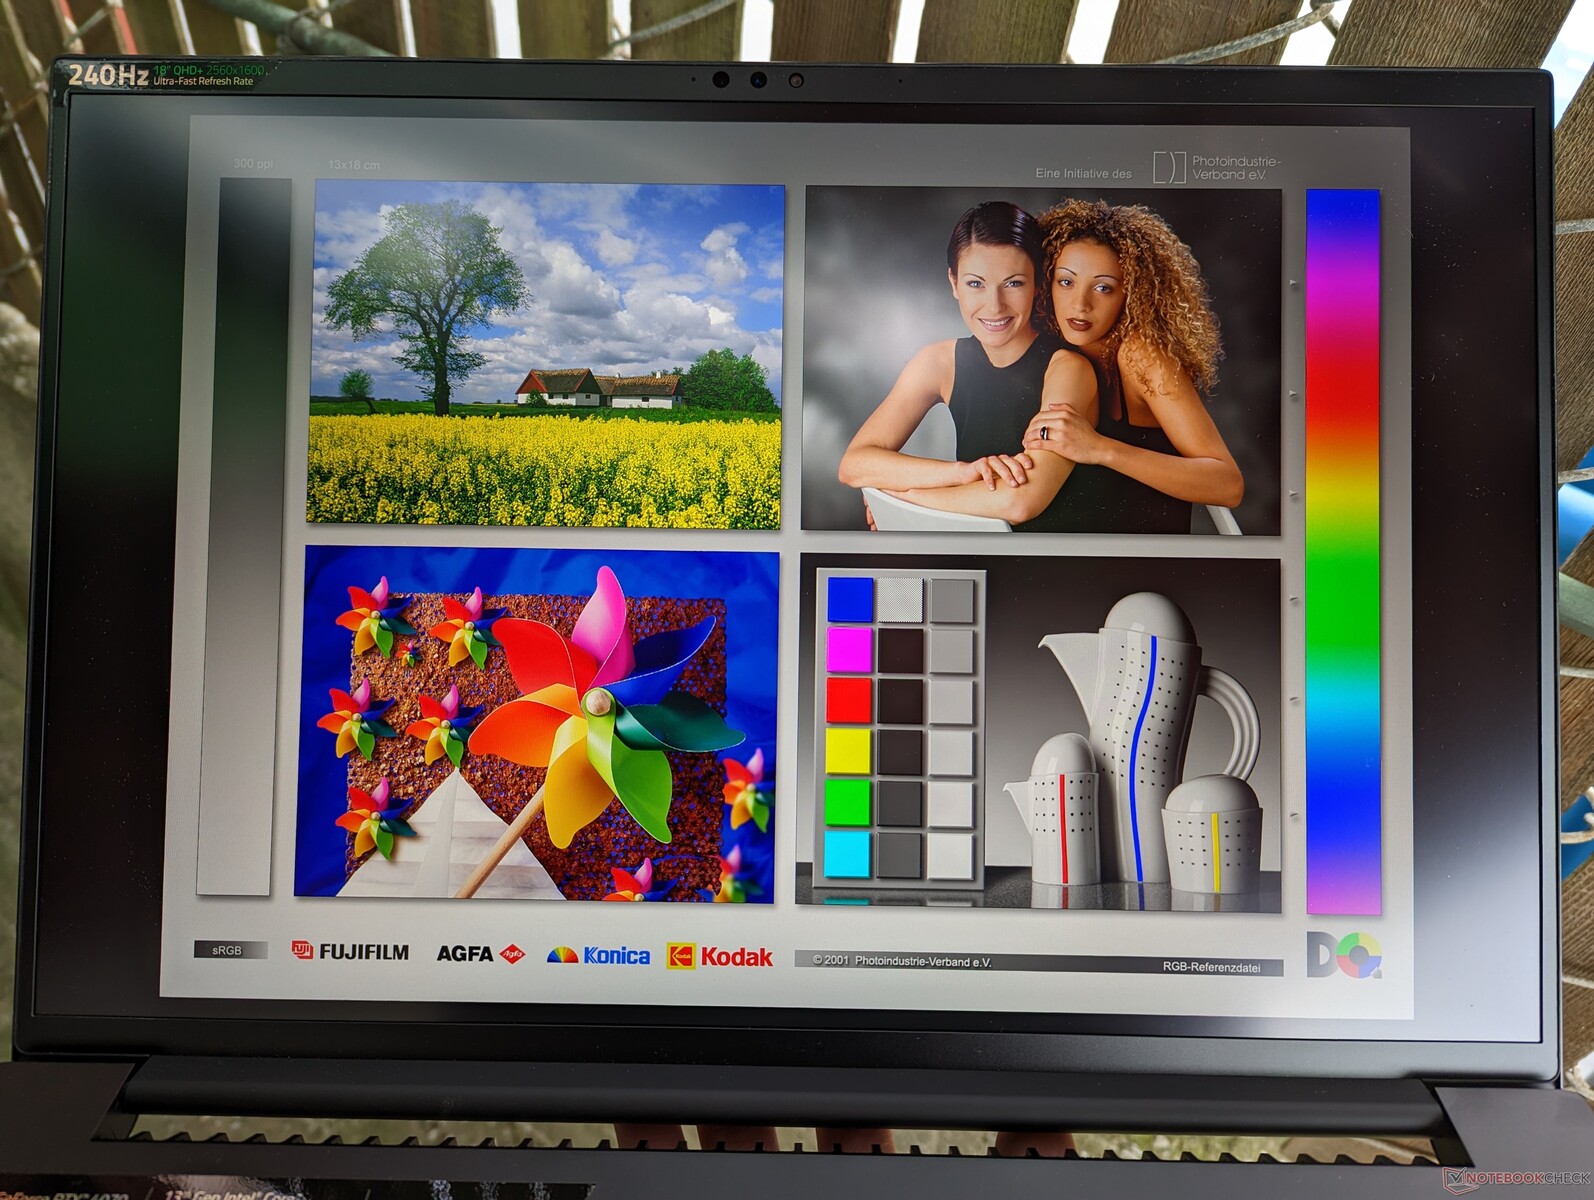
Affichage - Très spacieux
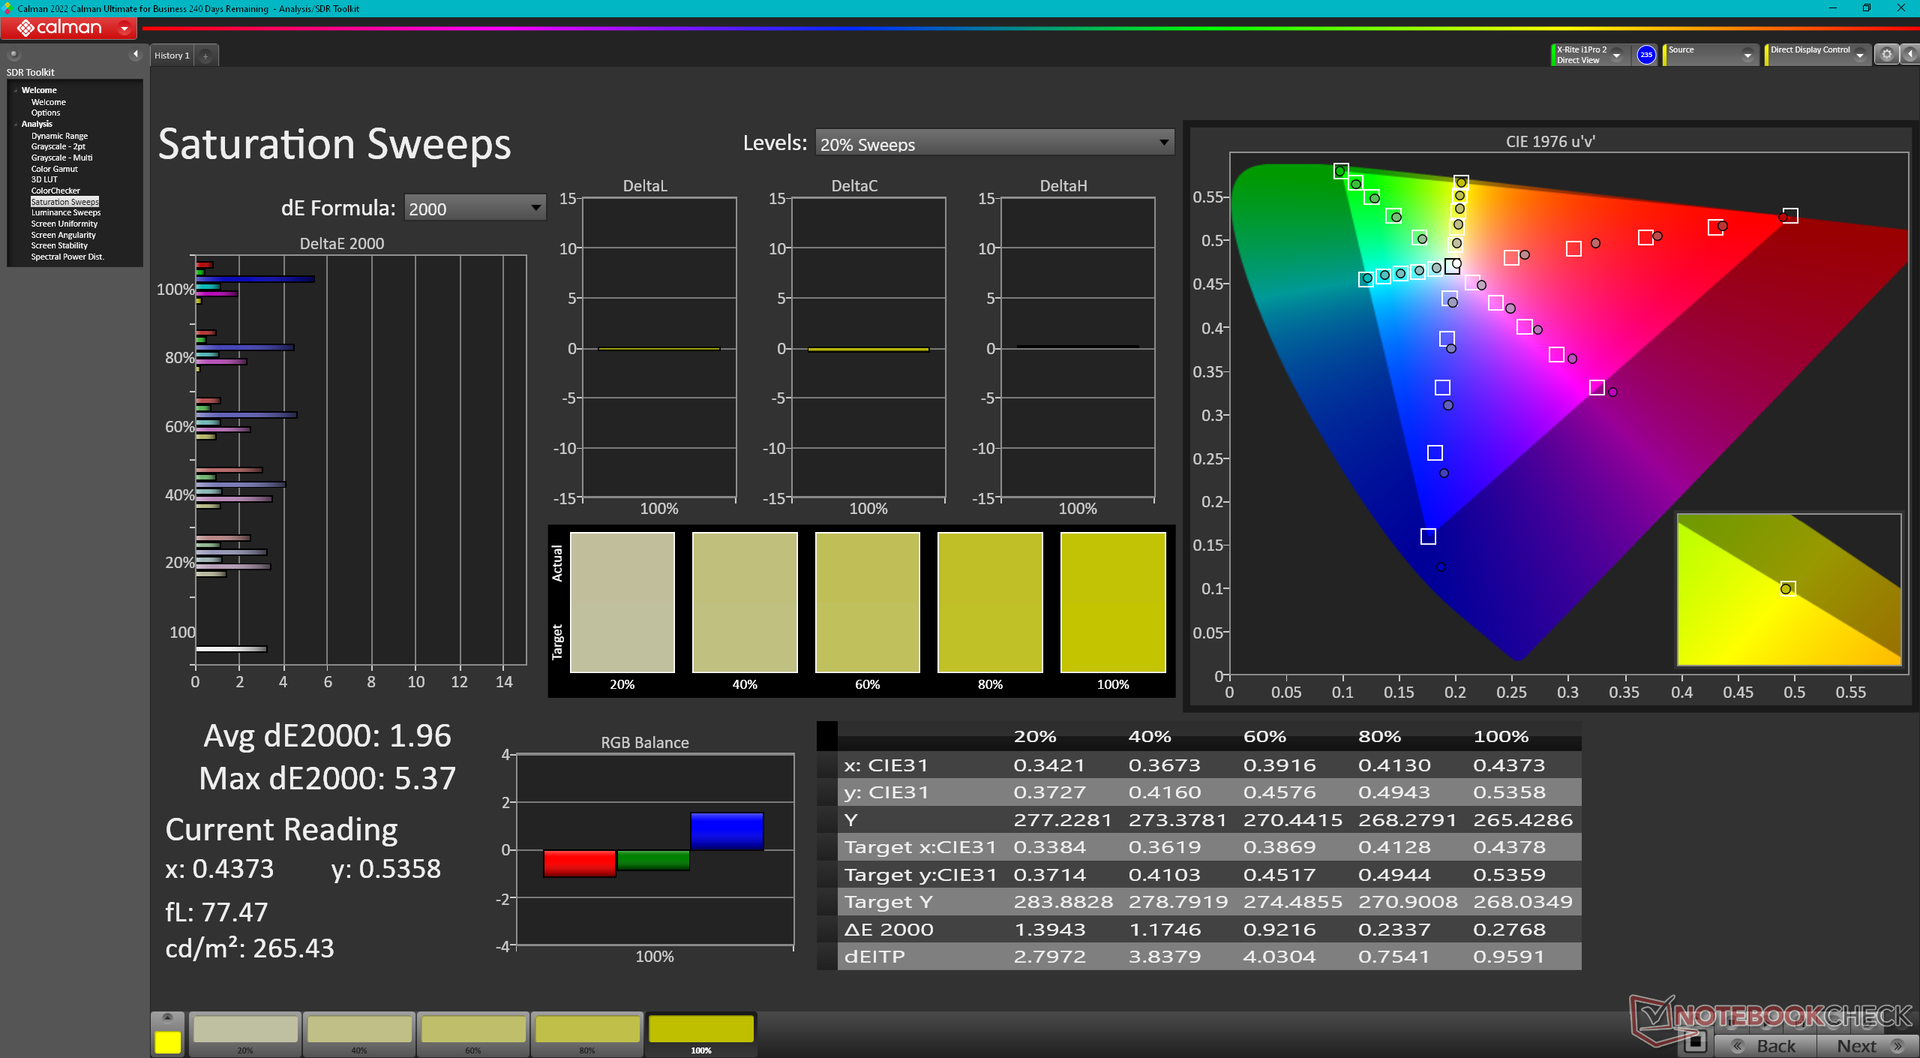
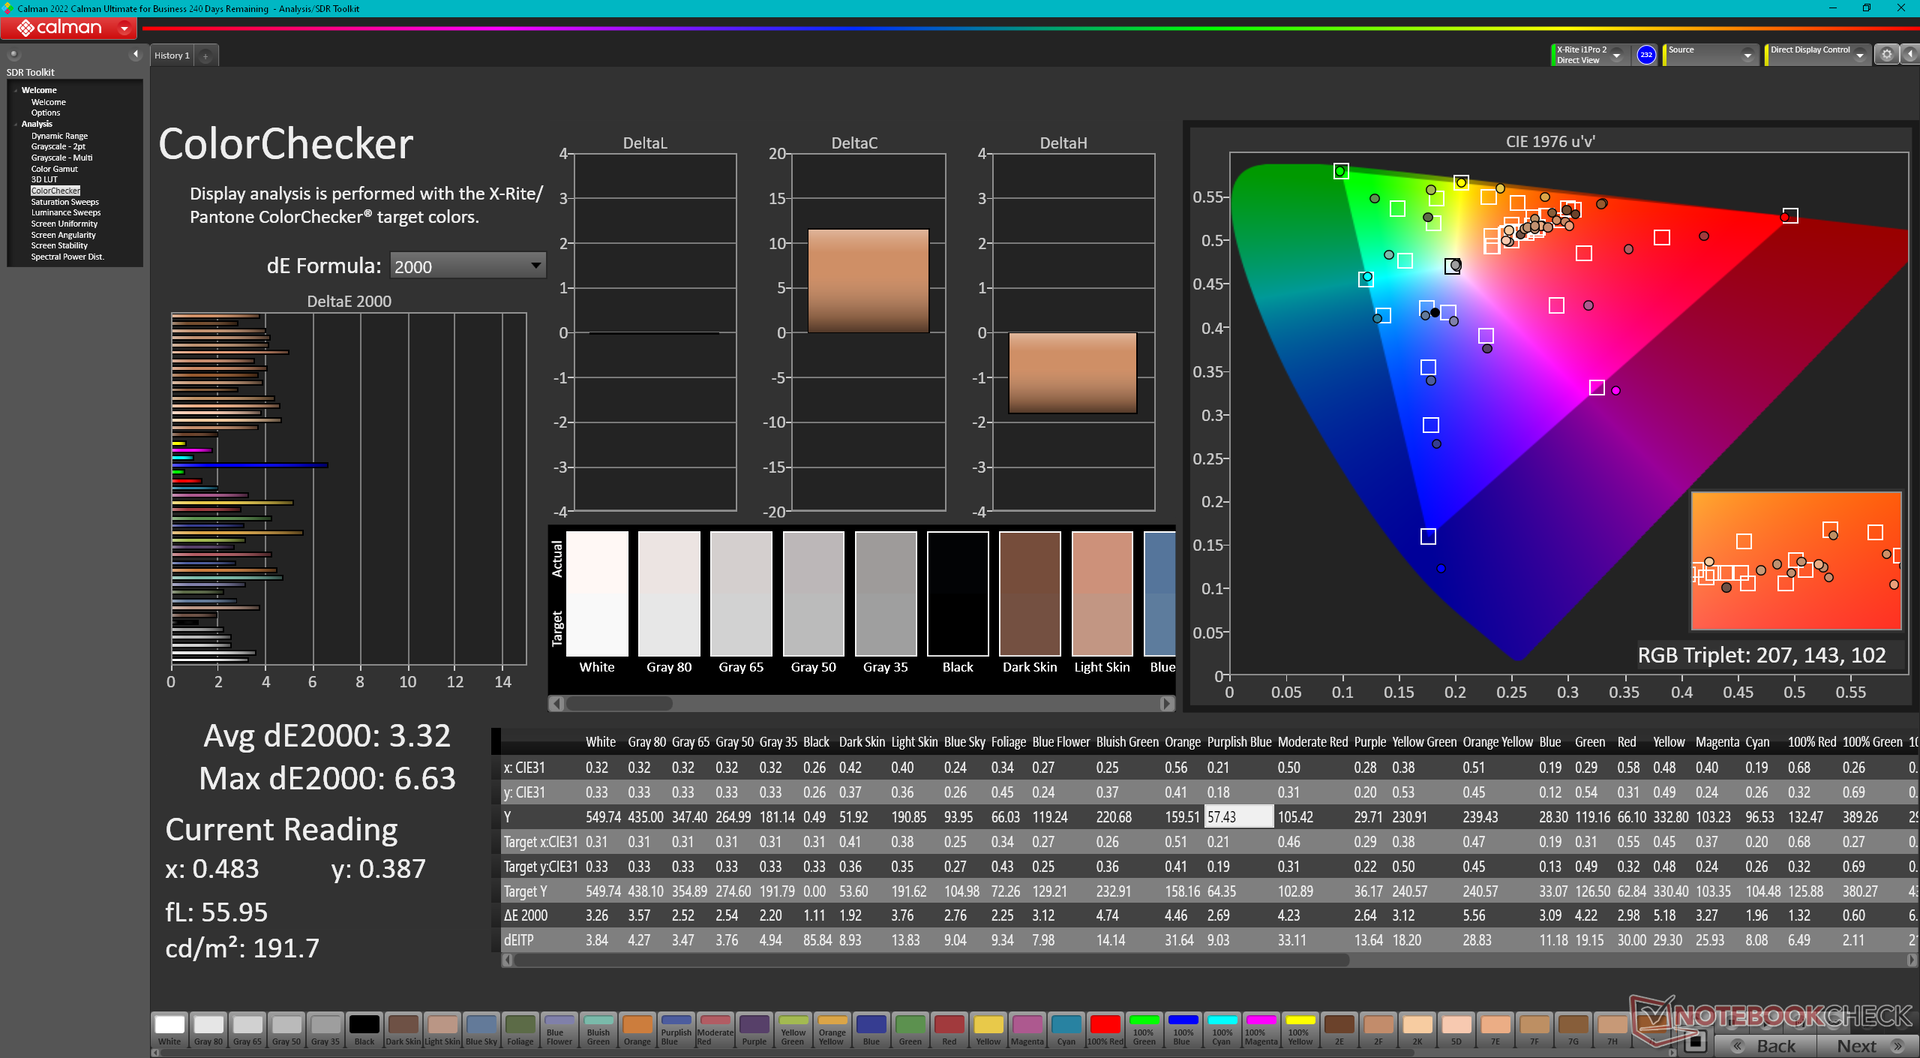
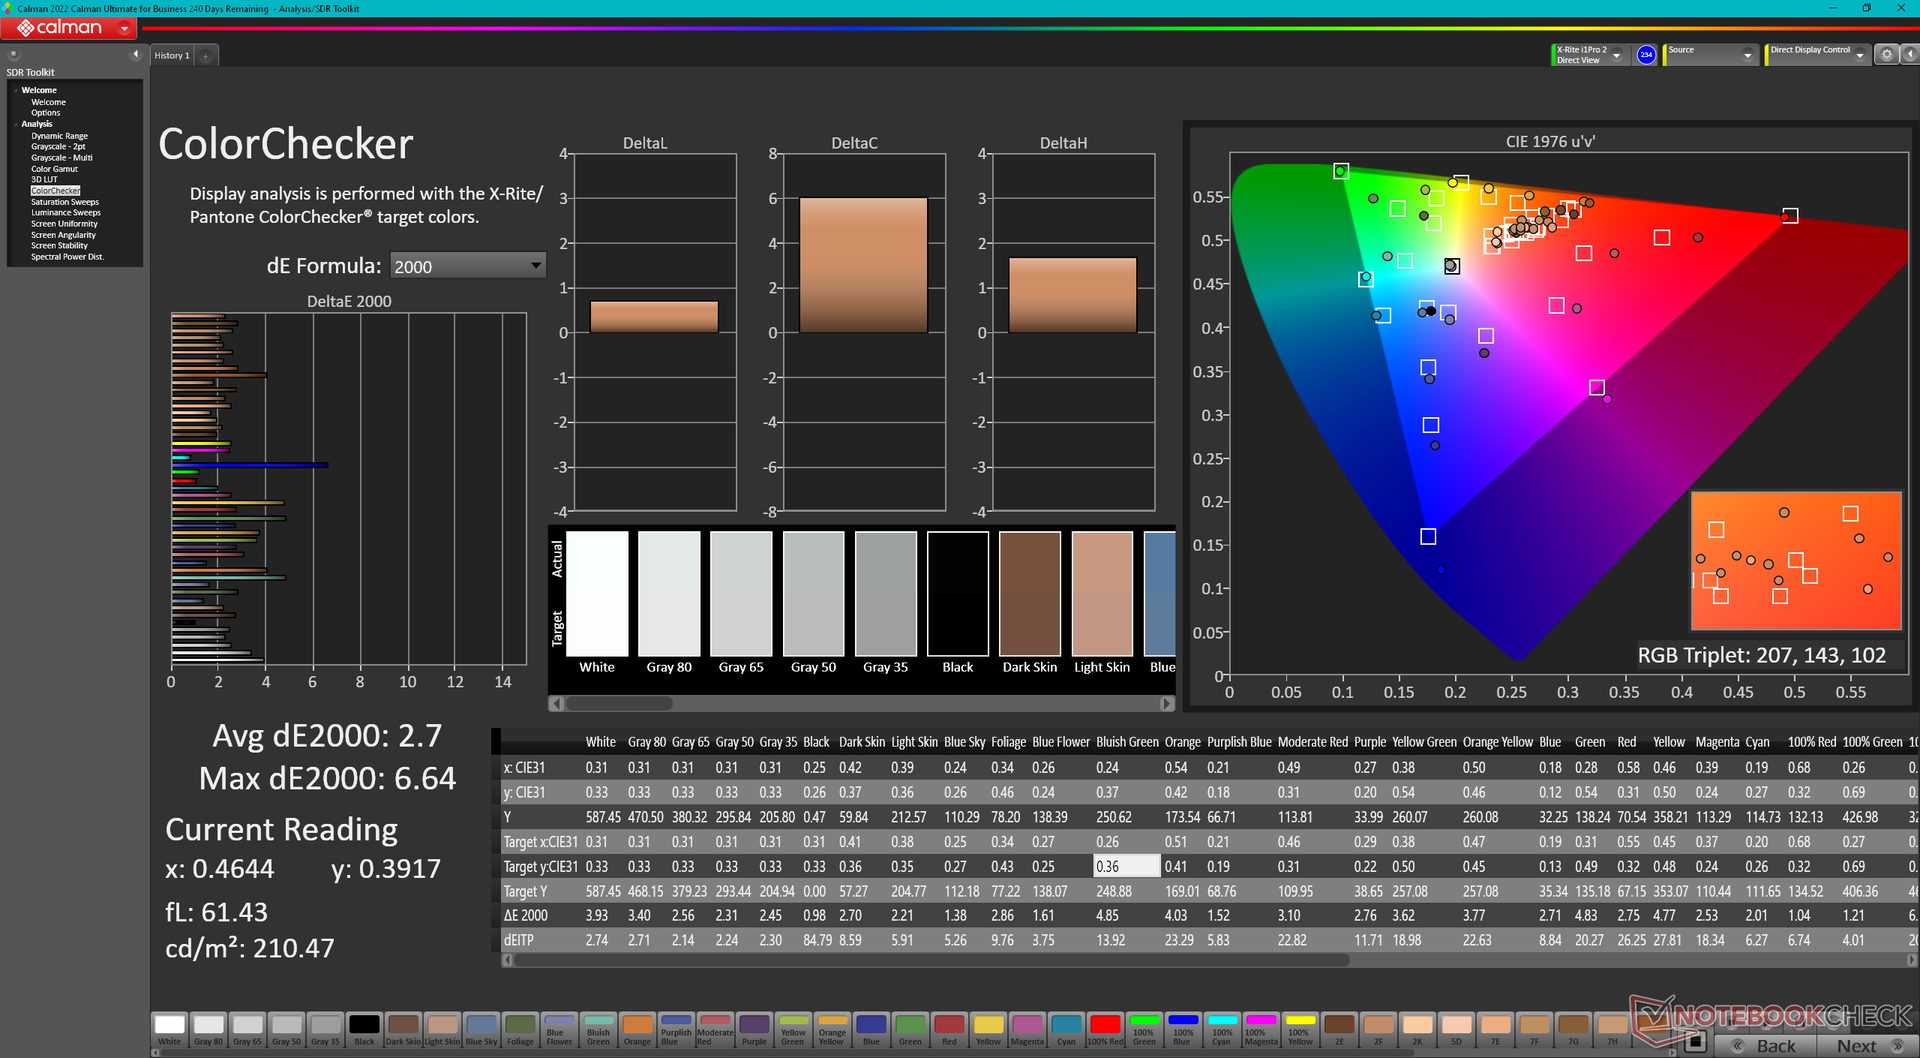
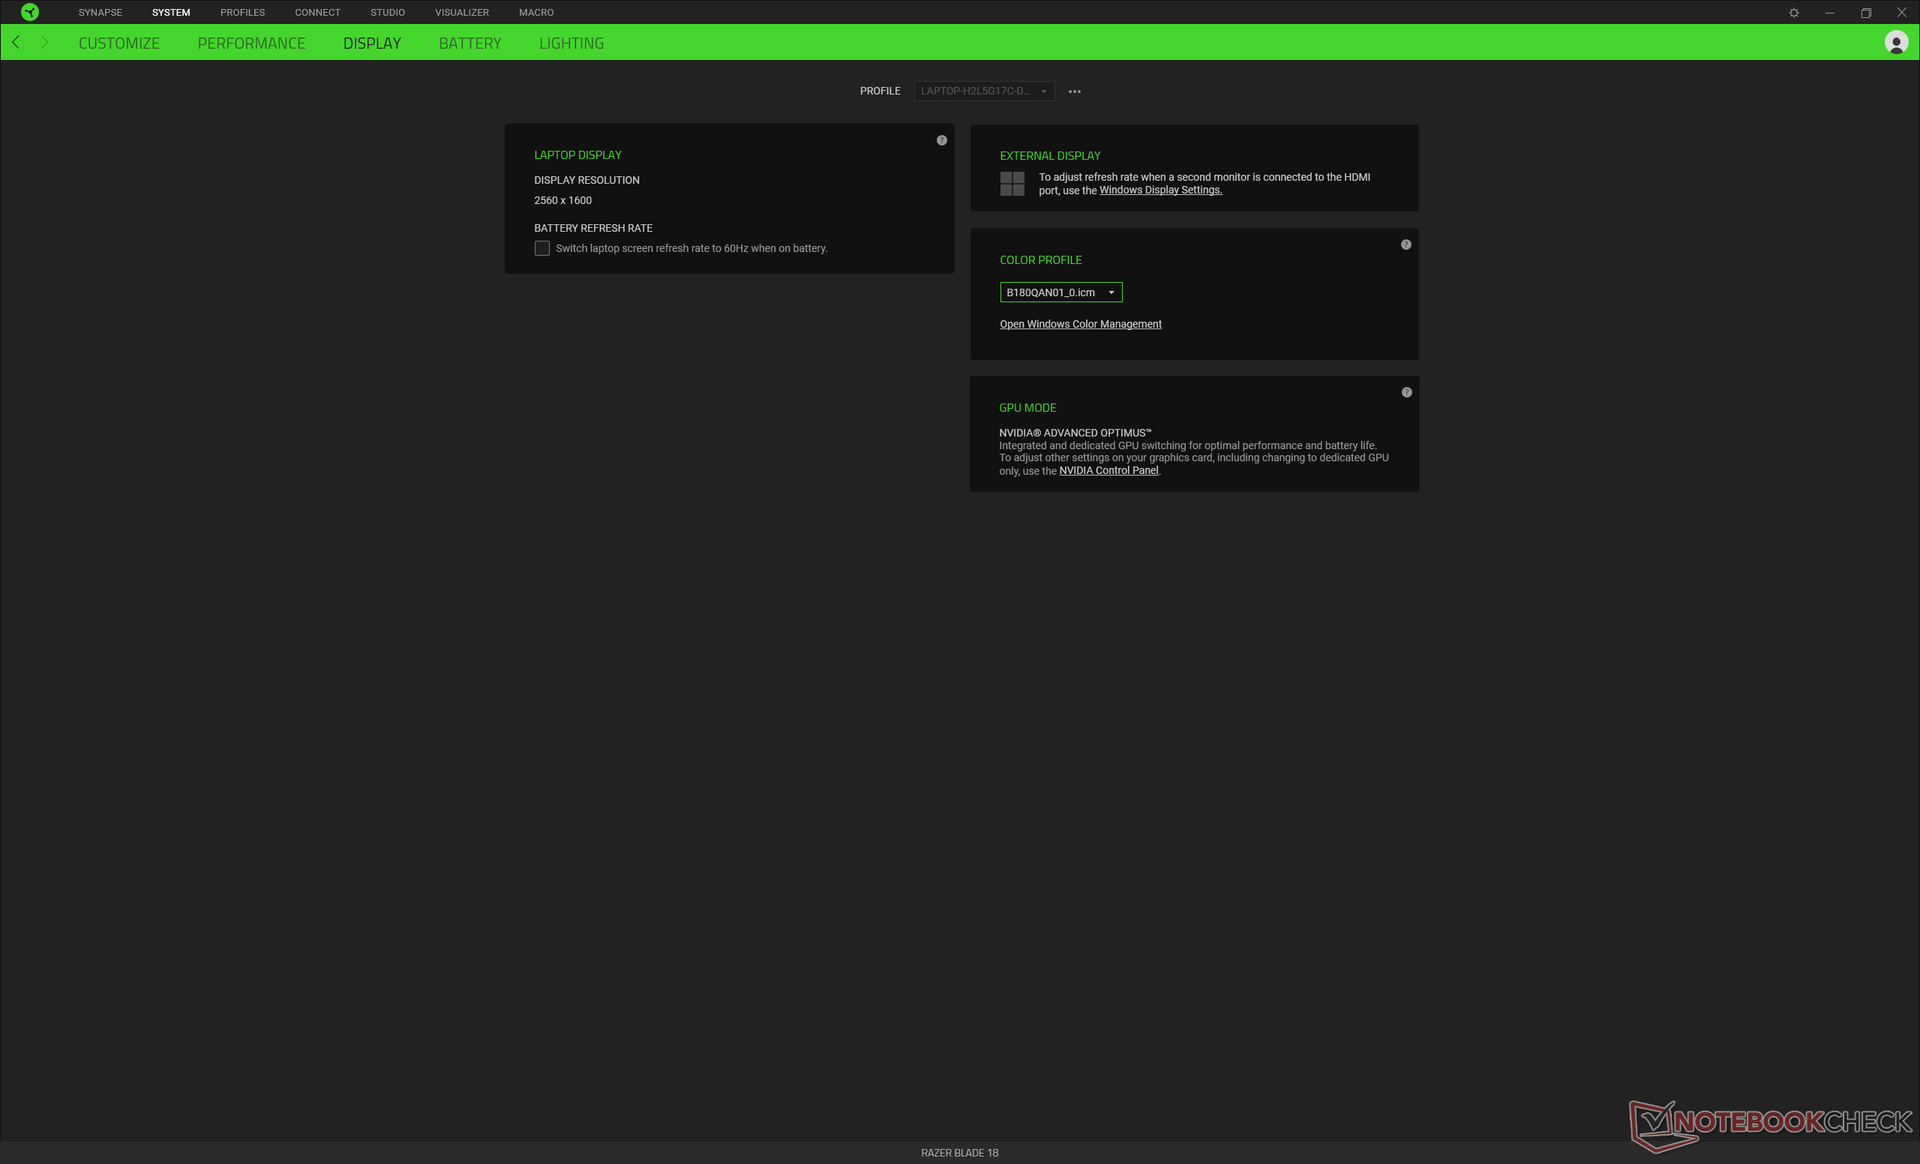
Le Blade 18 n'est pas livré avec une deuxième option de panneau au lancement, probablement en raison d'un approvisionnement limité. En fait, l'Asus ROG Strix Scar 18 de 18,0 pouces utilisera probablement la même dalle IPS AU Optronics B180QAN01.0 que sur le Blade 18. Cela dit, il s'agit toujours d'une dalle de haute qualité dotée des caractéristiques habituelles des ordinateurs portables de jeu haut de gamme, notamment une fréquence de rafraîchissement native de 240 Hz, des temps de réponse rapides de 3 ms, une couverture complète des couleurs DCI-P3, une luminosité de 500 nits et un calibrage d'usine. Nos mesures indépendantes avec un colorimètre et un oscilloscope X-Rite ont confirmé ces affirmations.
Malheureusement, l'écran de notre unité de test clignotait occasionnellement entre différents niveaux de luminosité, sans raison apparente. Ce scintillement n'est pas lié à la modulation de largeur d'impulsion, car le panneau n'utilise pas la modulation de largeur d'impulsion pour le contrôle de la luminosité. Il s'agit probablement d'un défaut de l'écran, mais nous ne pouvons pas encore confirmer s'il s'agit d'un problème logiciel ou matériel. Apparemment, certains consommateurs qui ont déjà acheté le Blade 18 ont rencontré des problèmes de scintillement similaires. Cette section sera mise à jour dès que nous aurons une réponse officielle de Razer.
| |||||||||||||||||||||||||
Homogénéité de la luminosité: 89 %
Valeur mesurée au centre, sur batterie: 549.6 cd/m²
Contraste: 1037:1 (Valeurs des noirs: 0.53 cd/m²)
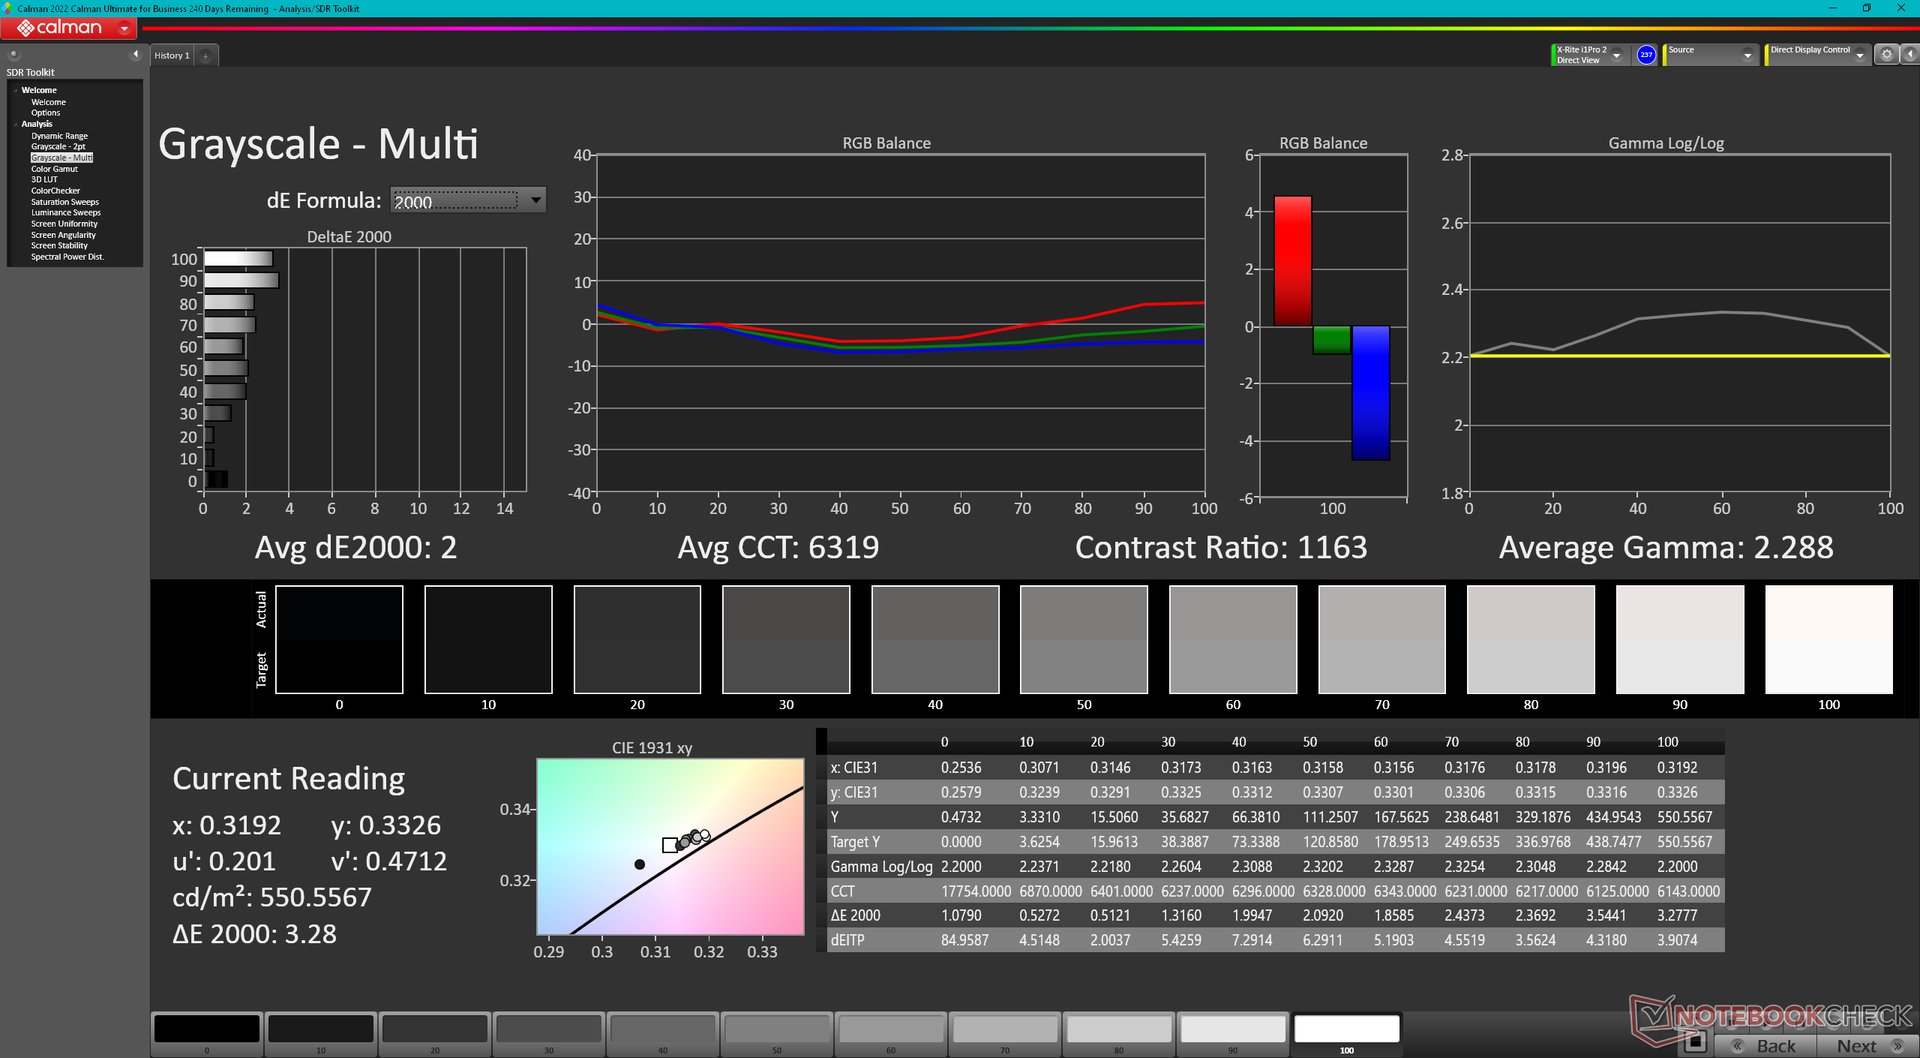
ΔE ColorChecker Calman: 3.32 | ∀{0.5-29.43 Ø4.71}
calibrated: 2.7
ΔE Greyscale Calman: 2 | ∀{0.09-98 Ø4.96}
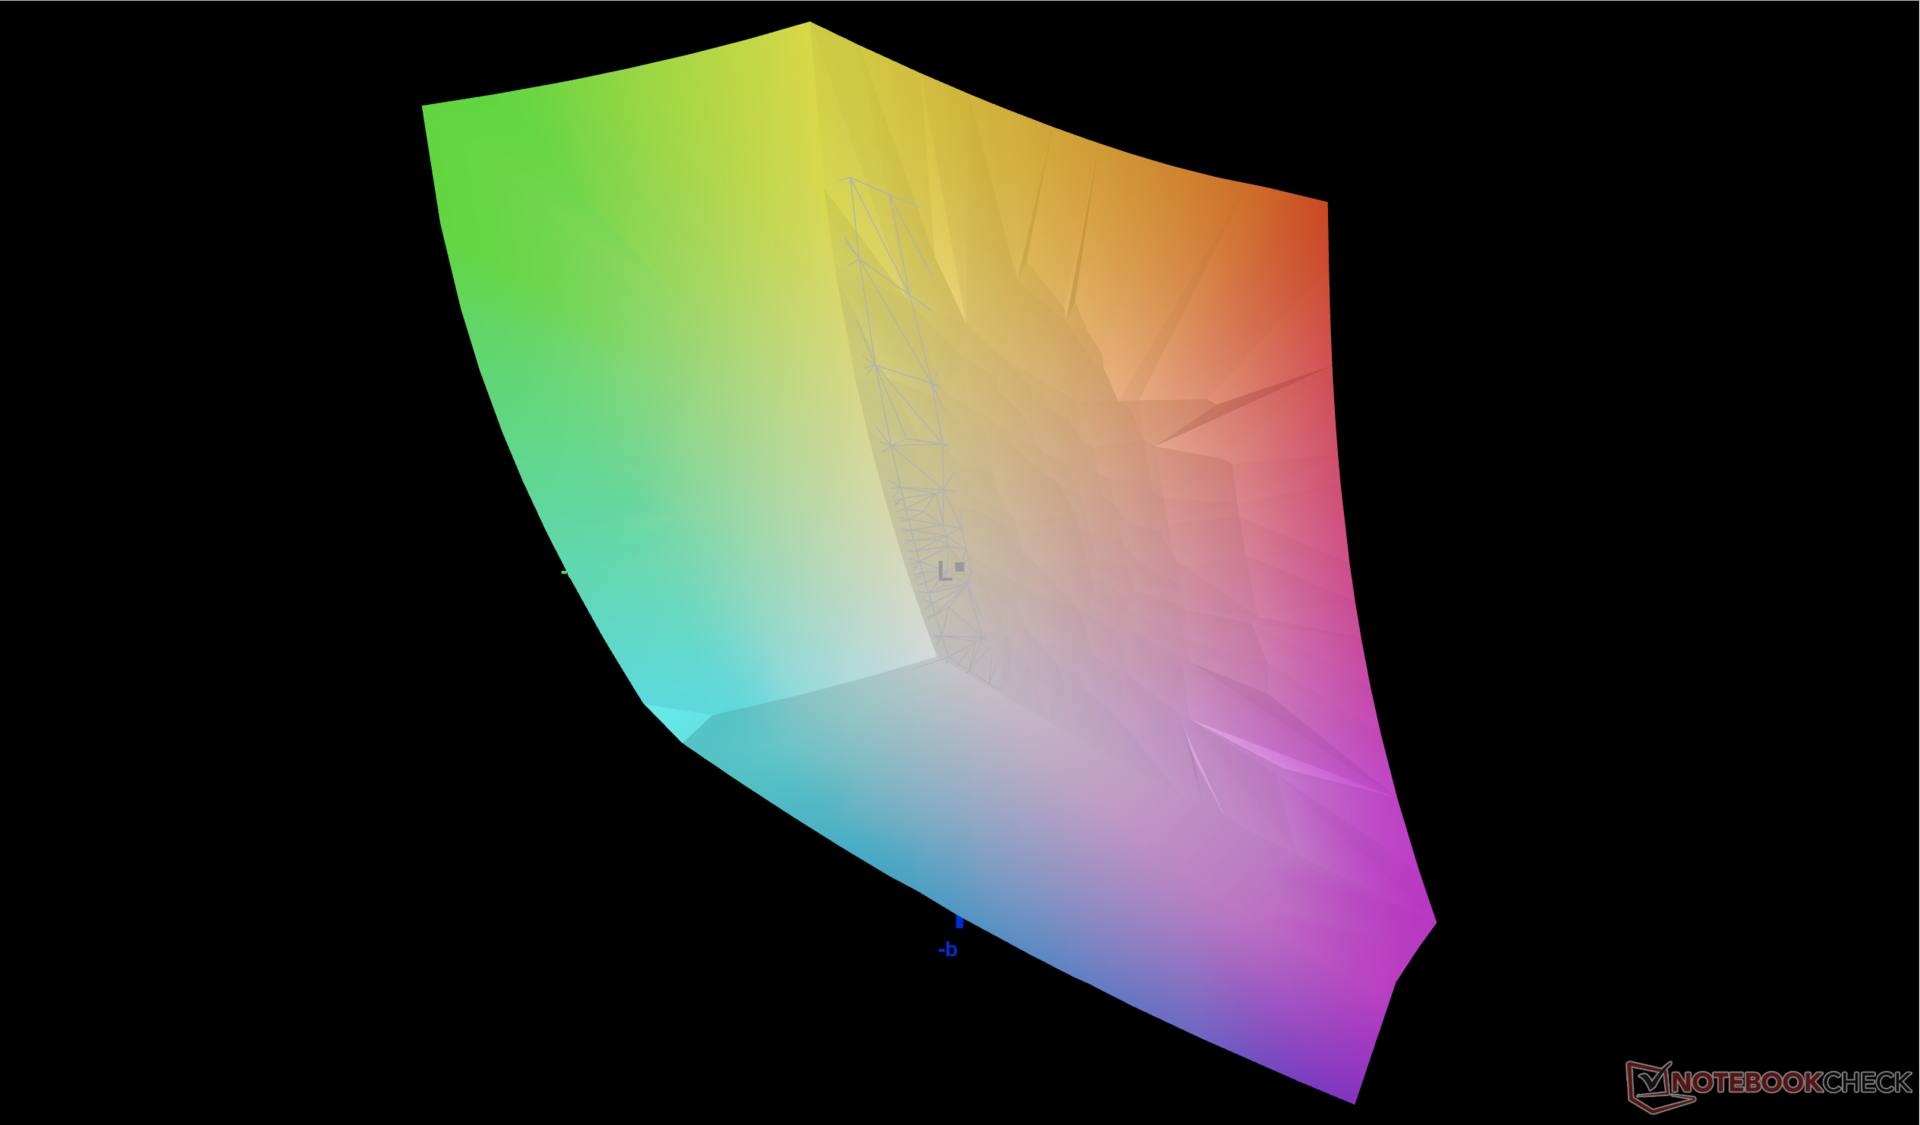
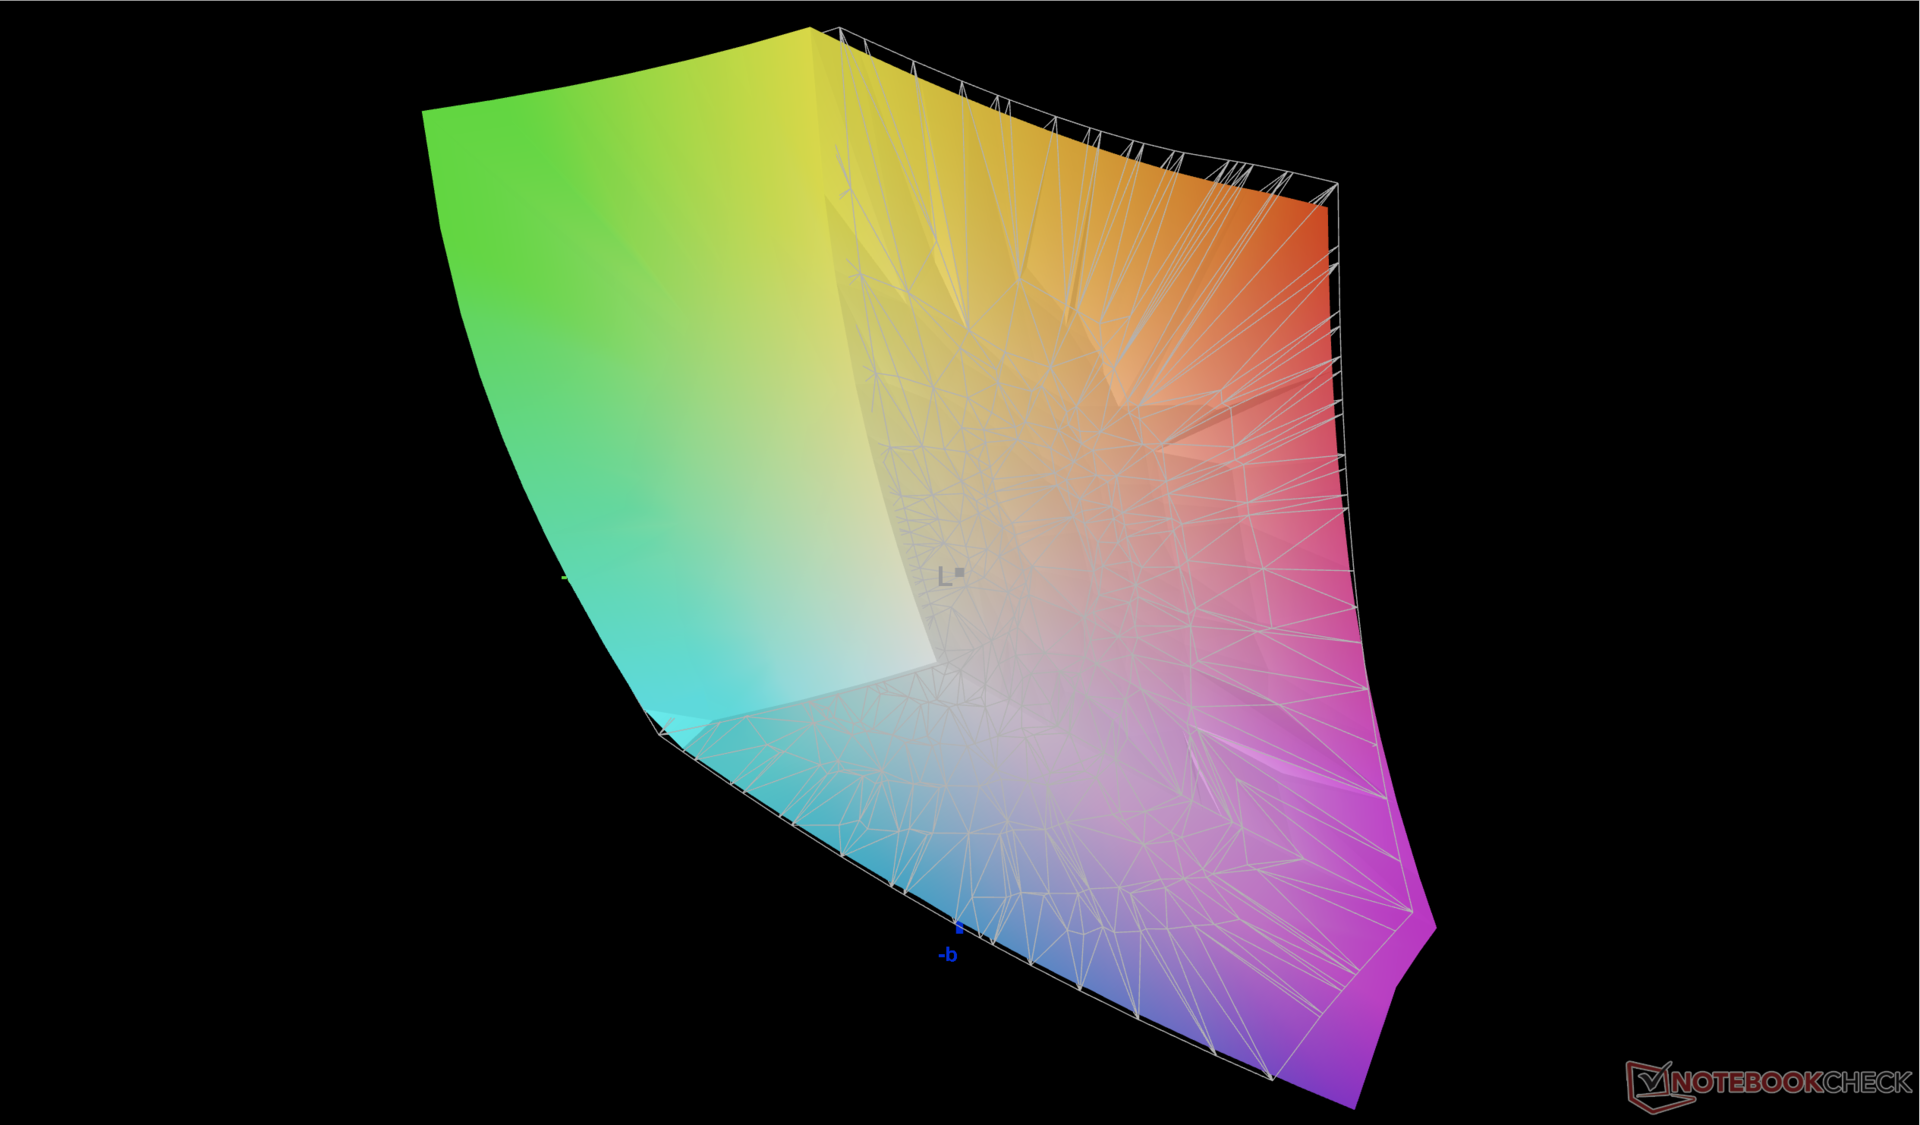
85.3% AdobeRGB 1998 (Argyll 3D)
99.8% sRGB (Argyll 3D)
96.9% Display P3 (Argyll 3D)
Gamma: 2.29
CCT: 6319 K
| Razer Blade 18 RTX 4070 AU Optronics B180QAN01.0, IPS, 2560x1600, 18" | Razer Blade 17 Early 2022 AU Optronics B173ZAN06.9, IPS, 3840x2160, 17.3" | MSI Titan GT77 HX 13VI B173ZAN06.C, Mini-LED, 3840x2160, 17.3" | Gigabyte G7 KE AU Optronics B173HAN05.1, IPS, 1920x1080, 17.3" | Alienware m17 R5 (R9 6900HX, RX 6850M XT) AU Optronics AUODBA3, IPS, 3840x2160, 17" | Asus ROG Strix Scar 17 SE G733CX-LL014W NE173QHM-NZ2, IPS, 2560x1440, 17.3" | |
|---|---|---|---|---|---|---|
| Display | 2% | 2% | -14% | 1% | -0% | |
| Display P3 Coverage (%) | 96.9 | 99.4 3% | 94.9 -2% | 70.4 -27% | 97.2 0% | 97.1 0% |
| sRGB Coverage (%) | 99.8 | 100 0% | 99.9 0% | 99.8 0% | 99.6 0% | 99.9 0% |
| AdobeRGB 1998 Coverage (%) | 85.3 | 87.3 2% | 92.4 8% | 71.7 -16% | 88.4 4% | 84.8 -1% |
| Response Times | -25% | -524% | -12% | -168% | -31% | |
| Response Time Grey 50% / Grey 80% * (ms) | 4.2 ? | 7.5 ? -79% | 38.4 ? -814% | 5 ? -19% | 16.4 ? -290% | 5.7 ? -36% |
| Response Time Black / White * (ms) | 8 ? | 5.6 ? 30% | 26.6 ? -233% | 8.3 ? -4% | 11.6 ? -45% | 10.1 ? -26% |
| PWM Frequency (Hz) | 2380 ? | |||||
| Screen | 24% | 64905% | 19% | -40% | 16% | |
| Brightness middle (cd/m²) | 549.6 | 503 -8% | 606 10% | 307 -44% | 484 -12% | 320 -42% |
| Brightness (cd/m²) | 524 | 486 -7% | 602 15% | 301 -43% | 449 -14% | 303 -42% |
| Brightness Distribution (%) | 89 | 84 -6% | 93 4% | 93 4% | 87 -2% | 87 -2% |
| Black Level * (cd/m²) | 0.53 | 0.44 17% | 0.0001 100% | 0.2 62% | 0.55 -4% | 0.3 43% |
| Contrast (:1) | 1037 | 1143 10% | 6060000 584278% | 1535 48% | 880 -15% | 1067 3% |
| Colorchecker dE 2000 * | 3.32 | 1.08 67% | 4.8 -45% | 1.32 60% | 4.8 -45% | 1.1 67% |
| Colorchecker dE 2000 max. * | 6.63 | 4.54 32% | 8.2 -24% | 4.6 31% | 7.48 -13% | 2.7 59% |
| Colorchecker dE 2000 calibrated * | 2.7 | 0.6 78% | 1.8 33% | 1.03 62% | 4.74 -76% | |
| Greyscale dE 2000 * | 2 | 1.3 35% | 6.5 -225% | 2.1 -5% | 5.5 -175% | 1.1 45% |
| Gamma | 2.29 96% | 2.151 102% | 2.63 84% | 2.247 98% | 2.42 91% | 2.13 103% |
| CCT | 6319 103% | 6541 99% | 6596 99% | 6815 95% | 6148 106% | 6599 98% |
| Moyenne finale (programmes/paramètres) | 0% /
12% | 21461% /
41650% | -2% /
8% | -69% /
-49% | -5% /
5% |
* ... Moindre est la valeur, meilleures sont les performances
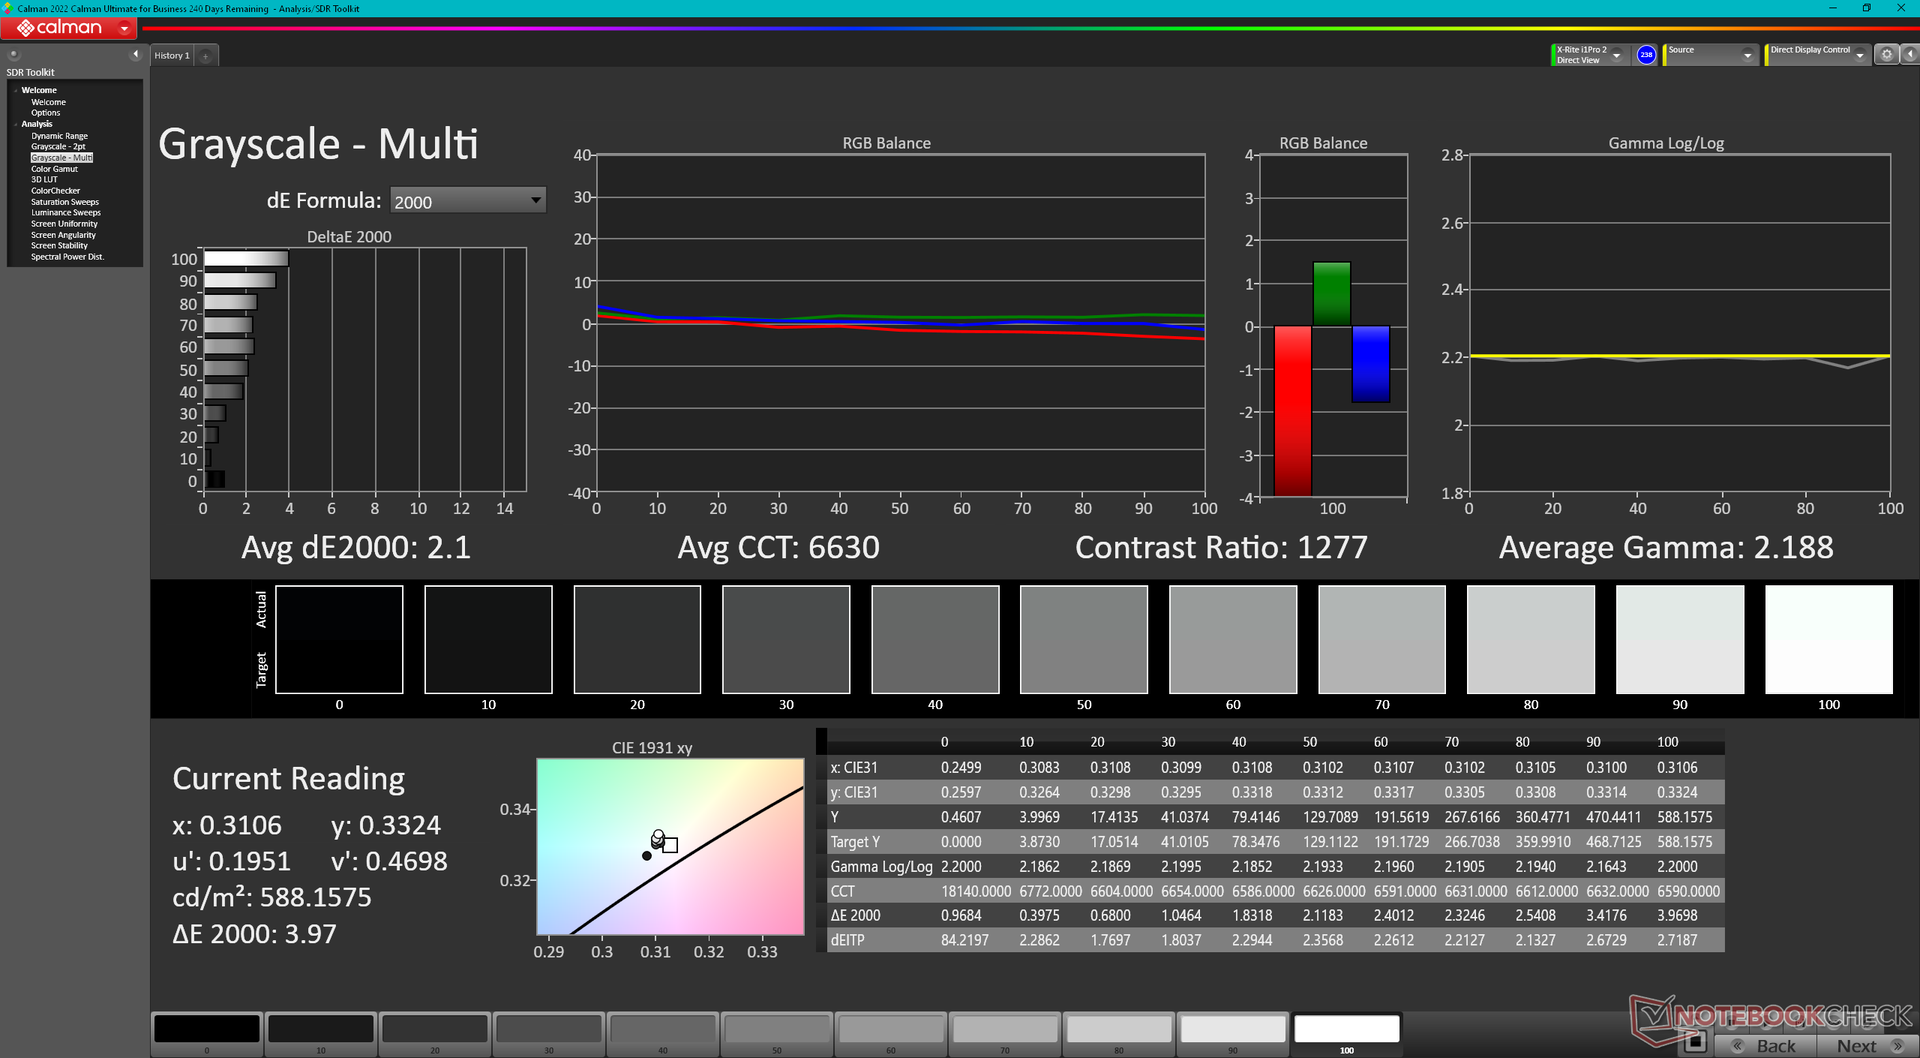
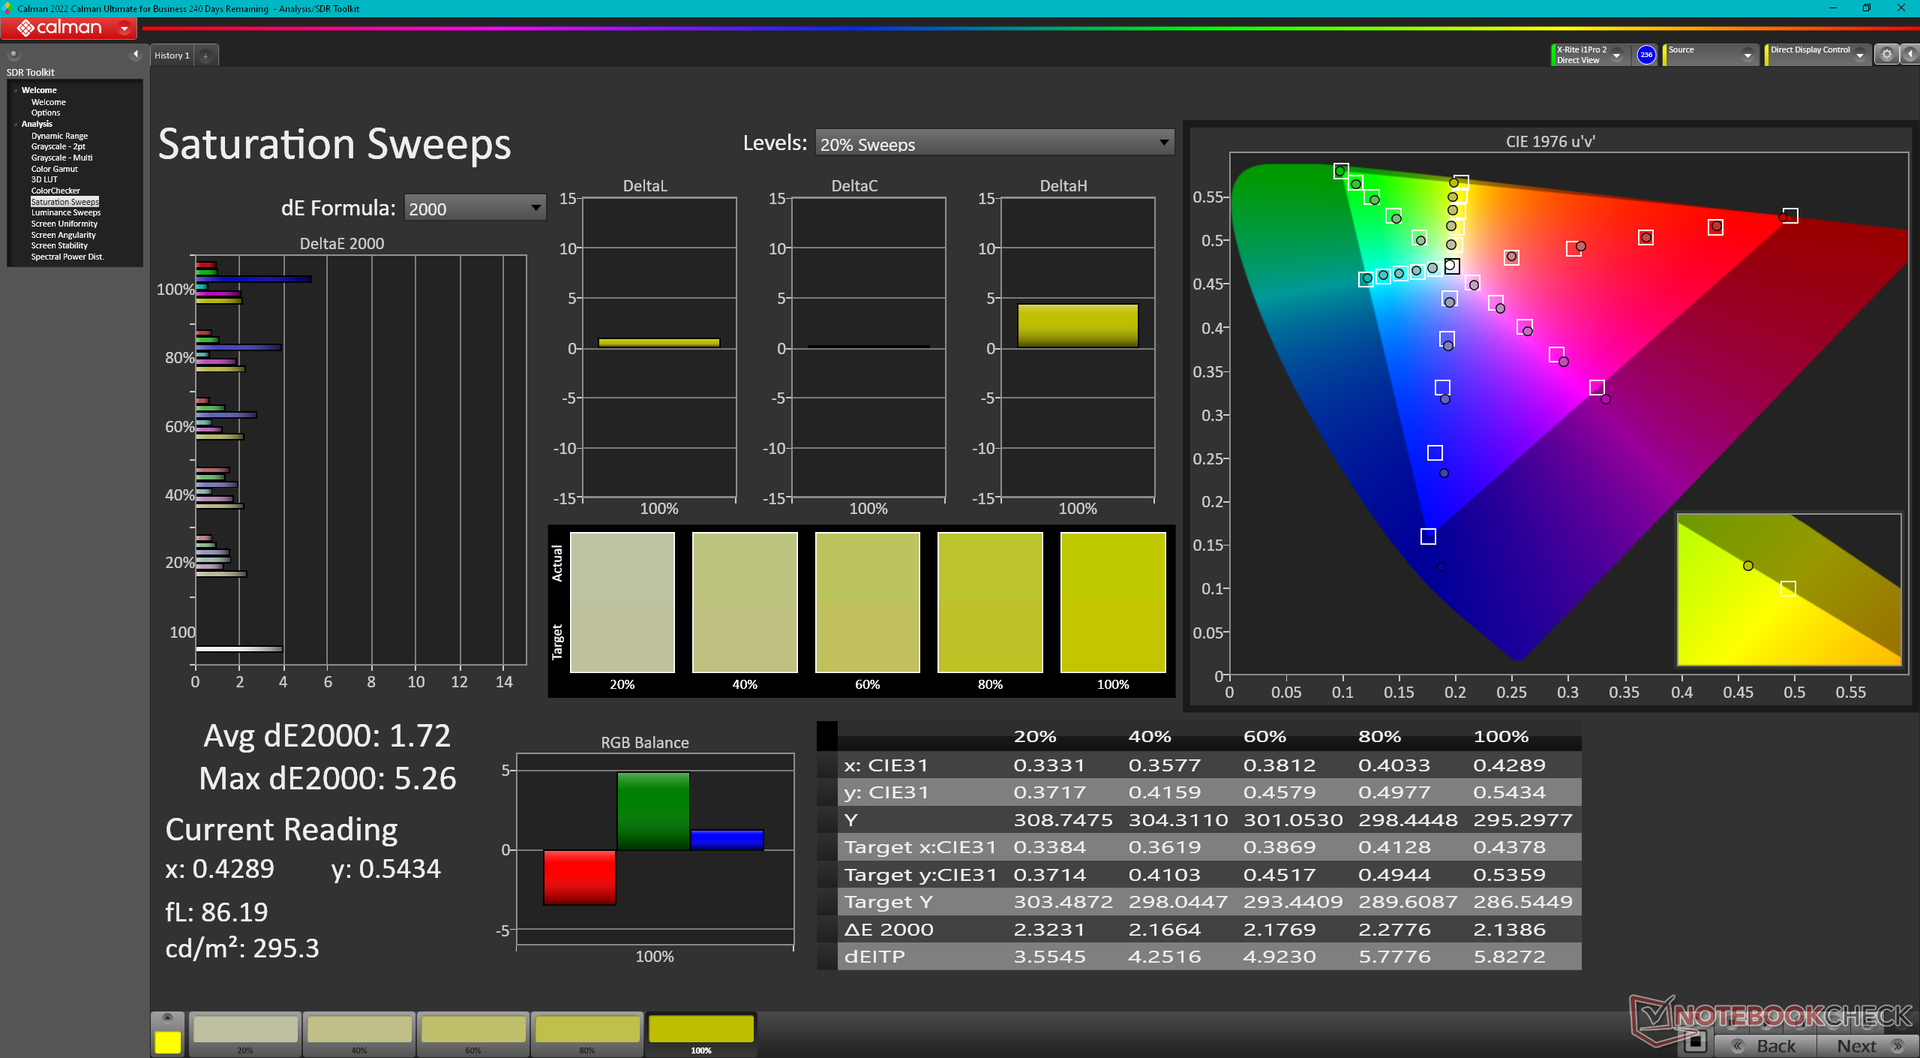
Les valeurs moyennes de deltaE en niveaux de gris et en couleurs ne sont que de 2,0 et 3,32 respectivement, car la dalle est livrée pré-calibrée par rapport à la norme P3. Tenter de calibrer davantage le panneau nous-mêmes n'améliorerait pas les couleurs de façon significative. Le bleu, cependant, semble être représenté de manière plus imprécise que toutes les autres couleurs primaires ou secondaires.
Temps de réponse de l'écran
| ↔ Temps de réponse noir à blanc | ||
|---|---|---|
| 8 ms ... hausse ↗ et chute ↘ combinées | ↗ 3.8 ms hausse | 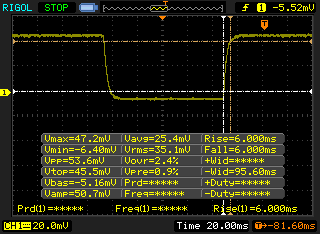 |
| ↘ 4.2 ms chute | ||
| L'écran montre de faibles temps de réponse, un bon écran pour jouer. En comparaison, tous les appareils testés affichent entre 0.1 (minimum) et 240 (maximum) ms. » 22 % des appareils testés affichent de meilleures performances. Cela signifie que les latences relevées sont meilleures que la moyenne (19.8 ms) de tous les appareils testés. | ||
| ↔ Temps de réponse gris 50% à gris 80% | ||
| 4.2 ms ... hausse ↗ et chute ↘ combinées | ↗ 2.1 ms hausse | 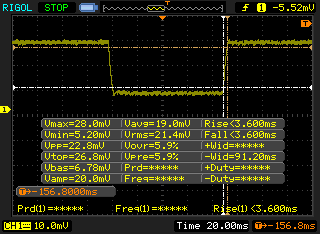 |
| ↘ 2.1 ms chute | ||
| L'écran montre de très faibles temps de réponse, parfait pour le jeu. En comparaison, tous les appareils testés affichent entre 0.165 (minimum) et 636 (maximum) ms. » 16 % des appareils testés affichent de meilleures performances. Cela signifie que les latences relevées sont meilleures que la moyenne (31 ms) de tous les appareils testés. | ||
Scintillement / MLI (Modulation de largeur d'impulsion)
| Scintillement / MLI (Modulation de largeur d'impulsion) non décelé | 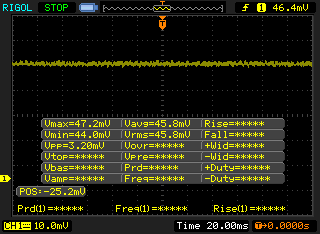 | ||
En comparaison, 52 % des appareils testés n'emploient pas MDI pour assombrir leur écran. Nous avons relevé une moyenne à 7754 (minimum : 5 - maximum : 343500) Hz dans le cas où une MDI était active. | |||
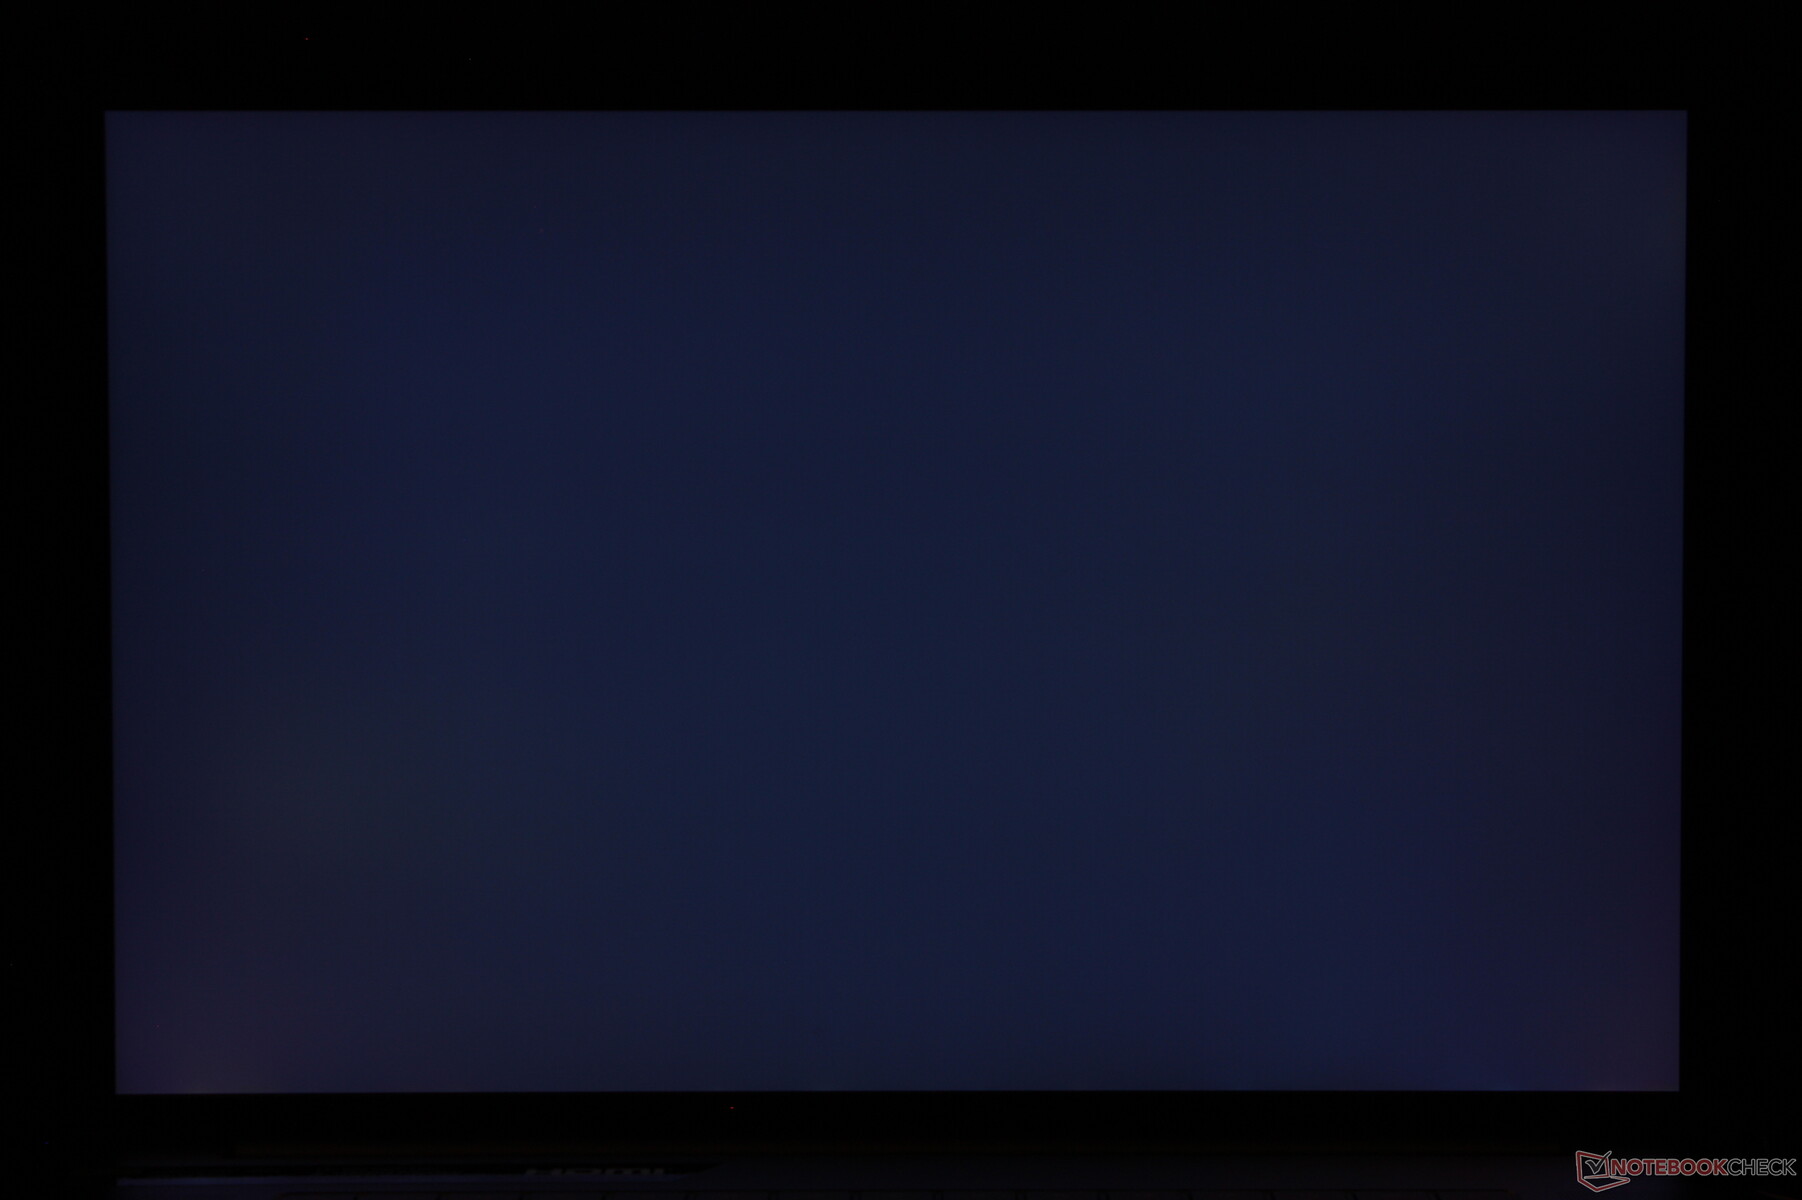
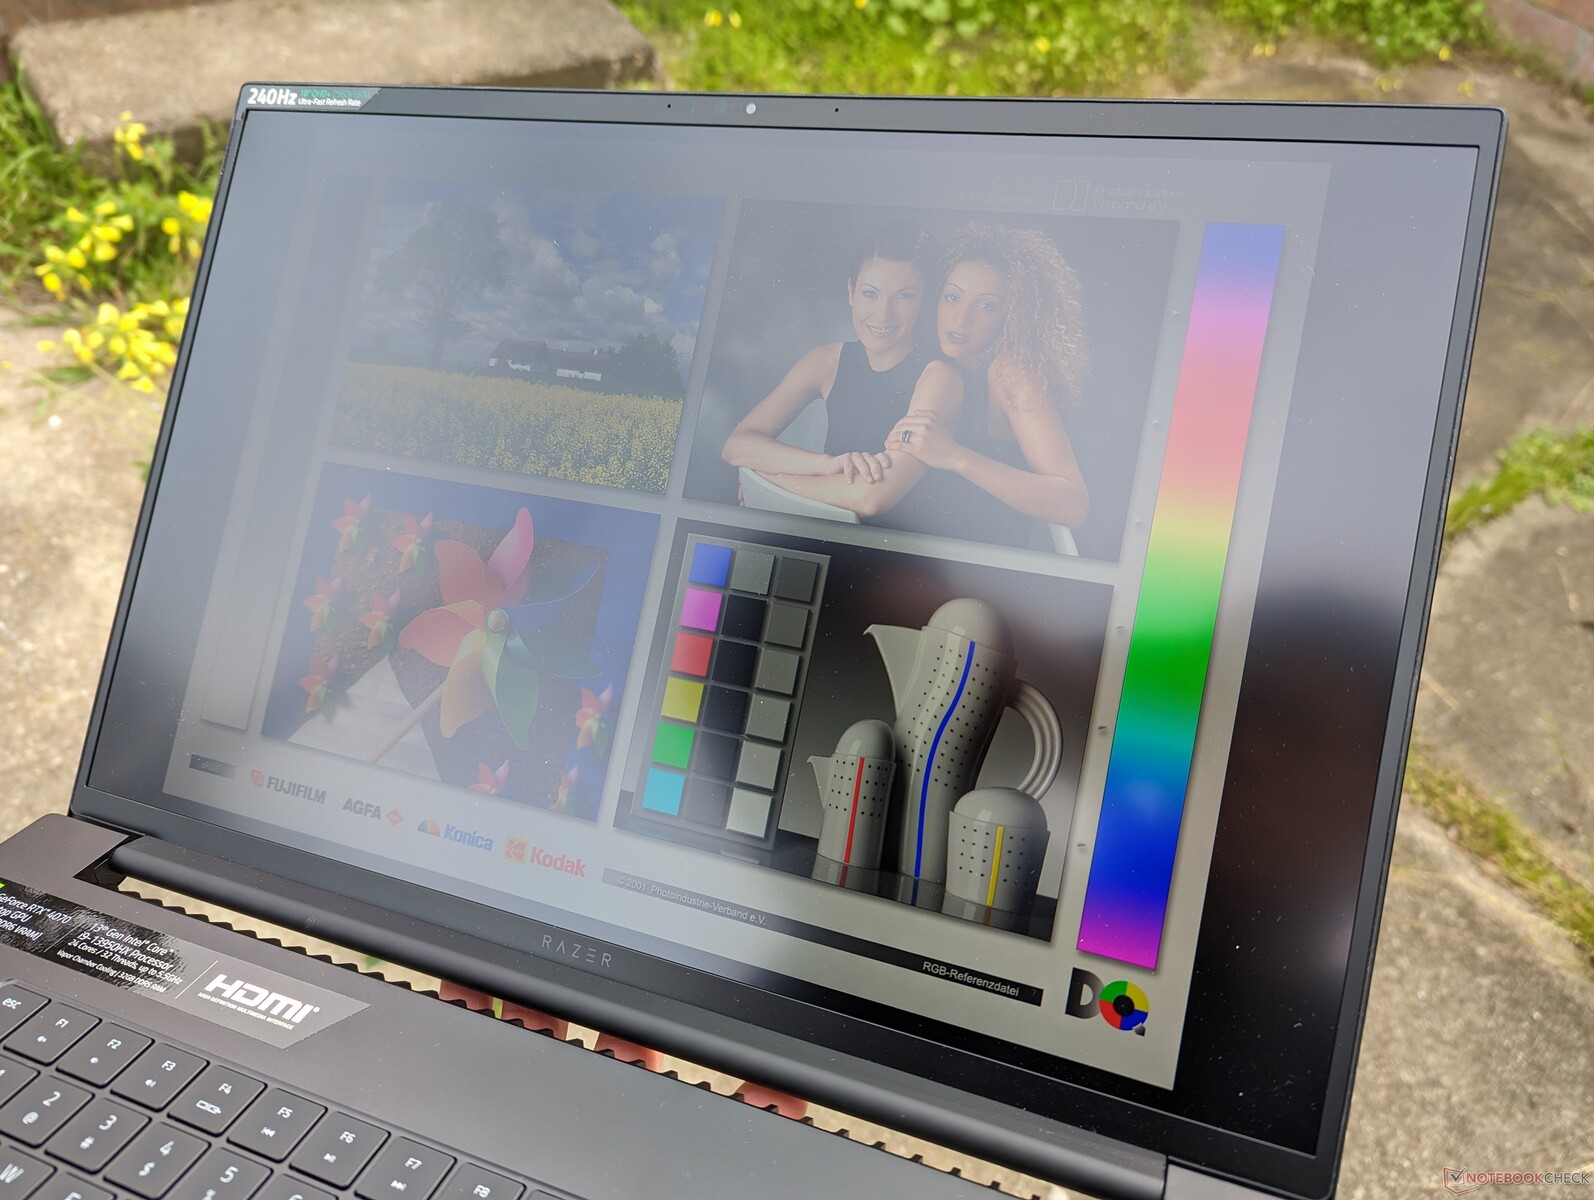
La visibilité en extérieur est similaire à celle du Blade 17 puisque leurs écrans visent chacun un maximum de 500-nit. L'ombre est toujours recommandée pour des couleurs optimales et pour réduire l'éblouissement autant que possible.
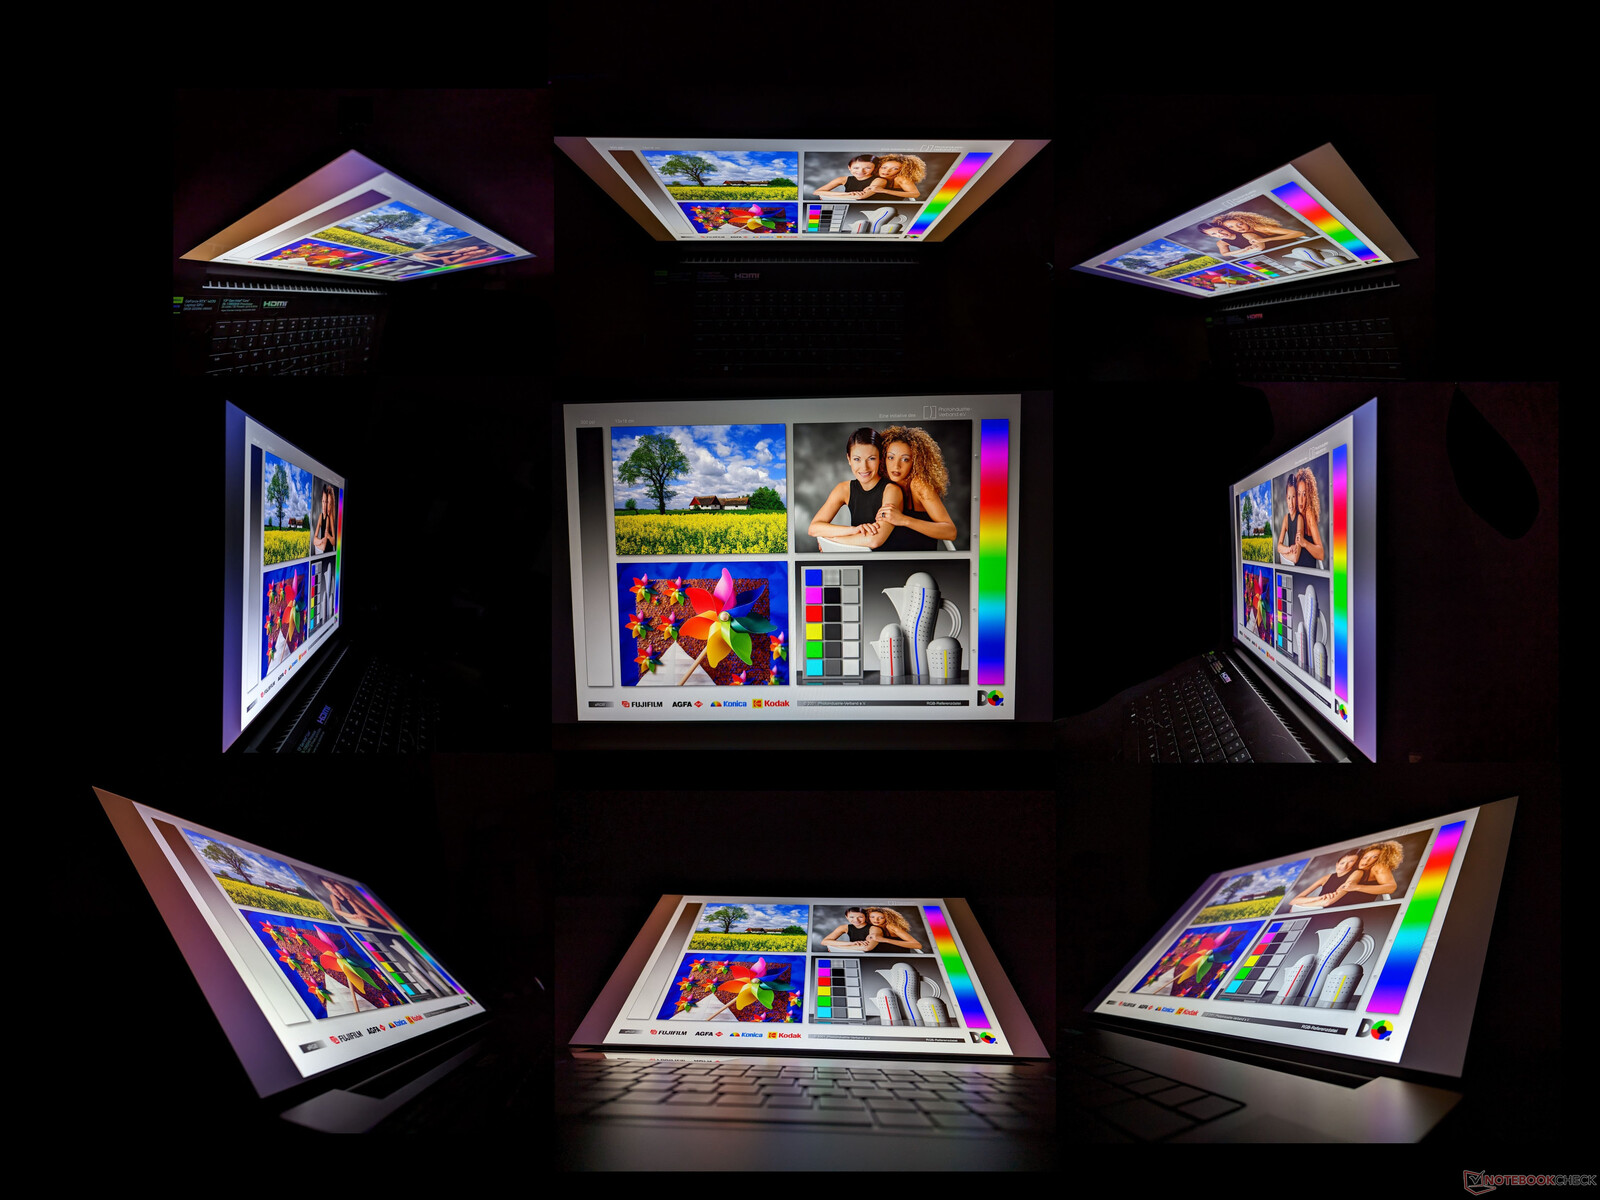
Les angles de vision sont larges, comme prévu pour un panneau IPS. Les couleurs et le contraste ne changent que si l'on regarde sous des angles extrêmes.
Performances - Intel Raptor Lake + Nvidia Ada Lovelace
Conditions d'essai
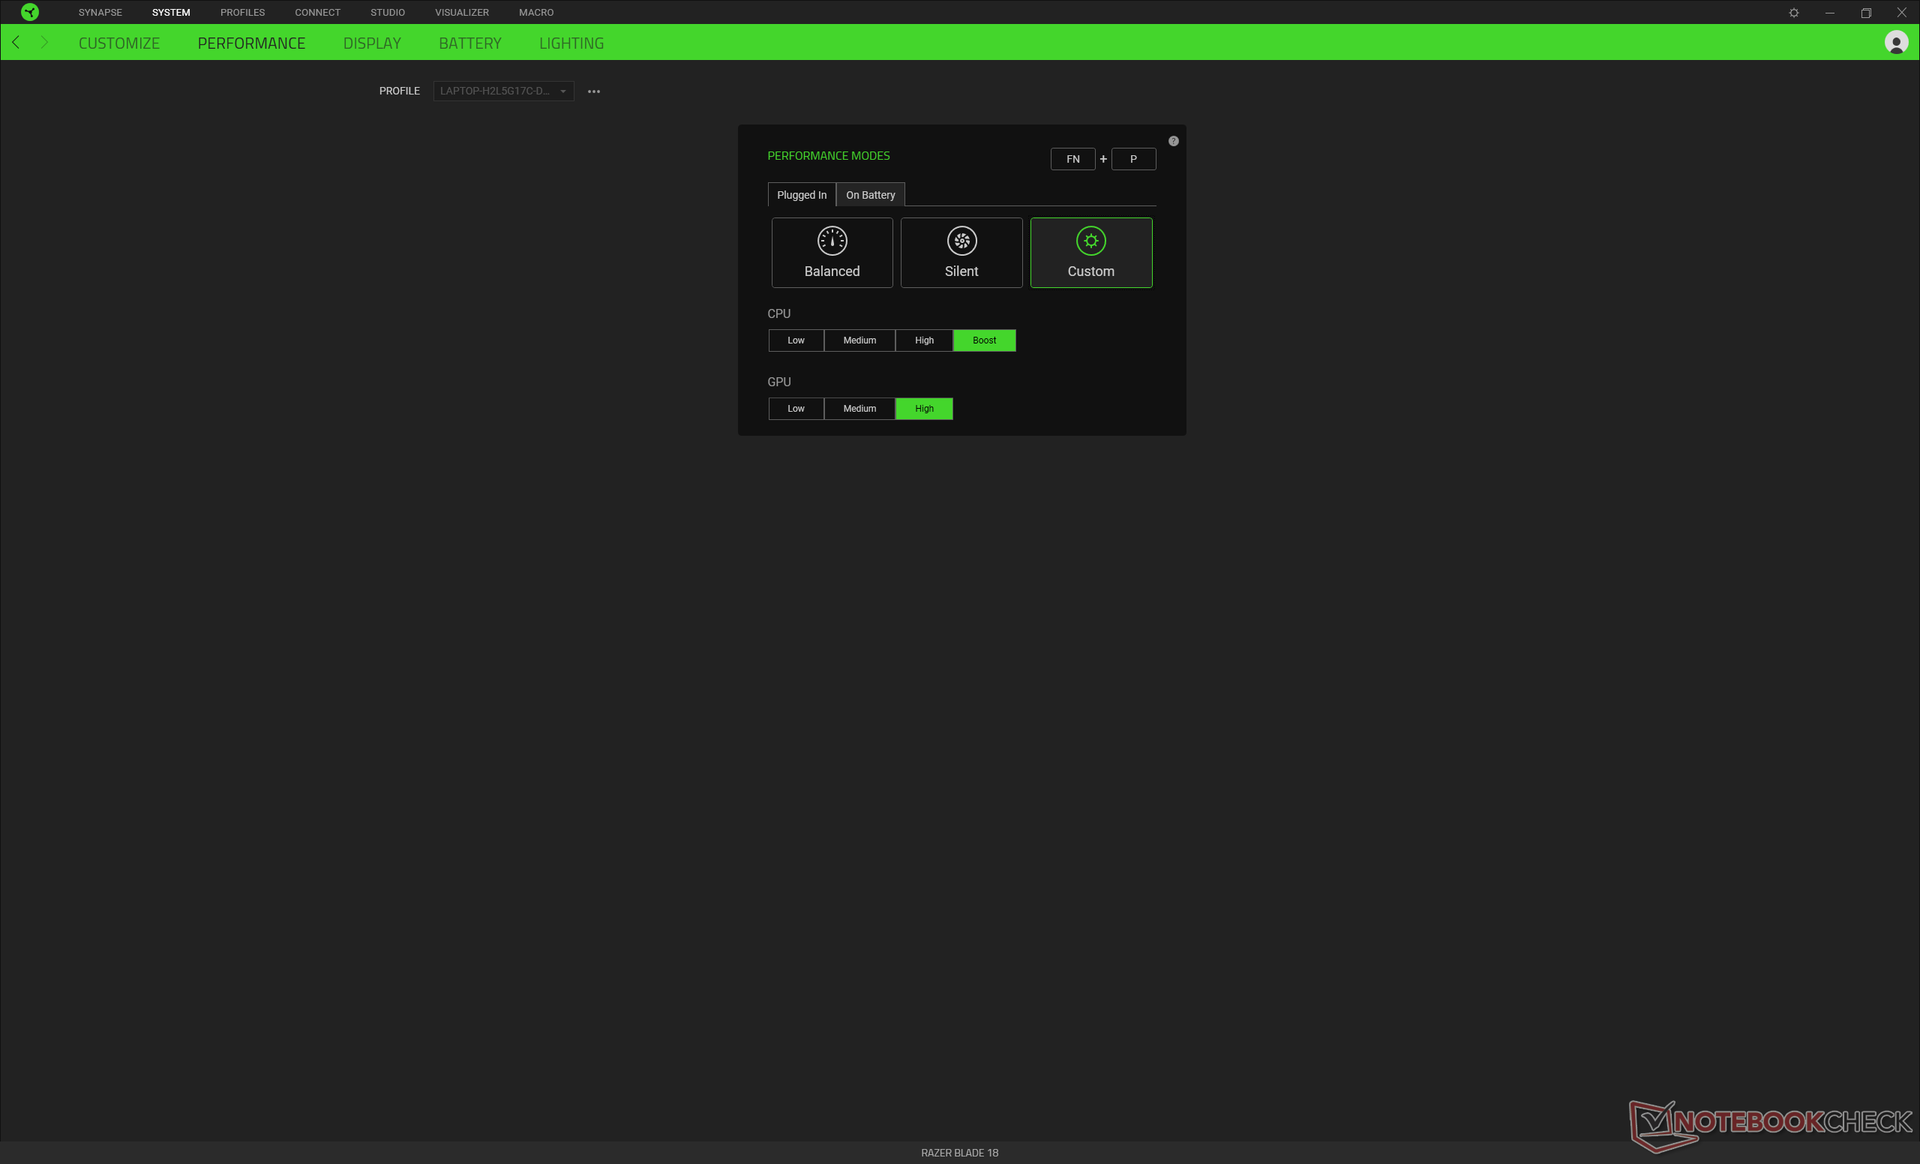
Nous avons réglé notre appareil en mode Performance via Windows et le CPU et le GPU respectivement en mode Boost et High via le logiciel Razer Synapse, comme indiqué ci-dessous. Il est recommandé aux utilisateurs de se familiariser avec Synapse, car c'est la plaque tournante pour le réglage des effets d'éclairage RVB, des profils de performance, des macros et d'autres fonctions auxiliaires. Le logiciel n'est pas toujours fiable, malheureusement, car il peut parfois ne pas répondre ou ne pas se lancer du tout en l'absence de connectivité Internet.
Le Blade 18 ne prend pas en charge MUX ou Advanced Optimus, contrairement au Blade 16. Notre appareil ne prend pas non plus en charge G-Sync, malgré la publicité de Razer. Nous avons contacté Razer au sujet de l'absence de G-Sync et nous mettrons à jour cette section le cas échéant.
Processeur
Les performances du processeur se situent à quelques points de pourcentage seulement de celles de la Blade 16 ou de la GT77, toutes deux équipées du même Core i9-13950HX le même processeur Core i9-13950HX. Ainsi, le processeur ne semble pas souffrir de problèmes majeurs d'accélération. Les performances multithread sont environ 45 % plus rapides que celles de la génération précédente duCore i9-12950HX pour être au même niveau qu'un Core i9-12900K. Le saut de performance d'une génération à l'autre est significatif à cet égard.
Les résultats habituels de notre test en boucle CineBench R15 xT ne sont pas inclus ci-dessous car les scores sont inhabituellement bas et non représentatifs des performances du processeur. L'exécution de CineBench R15 active à la fois le CPU et le dGPU et donc la performance du CPU peut parfois être limitée par le dGPU. Ce problème peut être observé sur quelques autres ordinateurs portables également. CineBench R23 est un benchmark CPU pur qui n'active pas le dGPU et donc ces résultats sont fournis ci-dessous.
Cinebench R23 Multi Loop
Cinebench R23: Multi Core | Single Core
Cinebench R20: CPU (Multi Core) | CPU (Single Core)
Cinebench R15: CPU Multi 64Bit | CPU Single 64Bit
Blender: v2.79 BMW27 CPU
7-Zip 18.03: 7z b 4 | 7z b 4 -mmt1
Geekbench 5.5: Multi-Core | Single-Core
HWBOT x265 Benchmark v2.2: 4k Preset
LibreOffice : 20 Documents To PDF
R Benchmark 2.5: Overall mean
* ... Moindre est la valeur, meilleures sont les performances
AIDA64: FP32 Ray-Trace | FPU Julia | CPU SHA3 | CPU Queen | FPU SinJulia | FPU Mandel | CPU AES | CPU ZLib | FP64 Ray-Trace | CPU PhotoWorxx
| Performance rating | |
| MSI Titan GT77 HX 13VI | |
| Razer Blade 18 RTX 4070 | |
| Moyenne Intel Core i9-13950HX | |
| Asus ROG Strix Scar 17 SE G733CX-LL014W | |
| Alienware m17 R5 (R9 6900HX, RX 6850M XT) | |
| Gigabyte G7 KE | |
| Razer Blade 17 Early 2022 | |
| AIDA64 / FP32 Ray-Trace | |
| MSI Titan GT77 HX 13VI | |
| Razer Blade 18 RTX 4070 | |
| Moyenne Intel Core i9-13950HX (17993 - 28957, n=9) | |
| Asus ROG Strix Scar 17 SE G733CX-LL014W | |
| Alienware m17 R5 (R9 6900HX, RX 6850M XT) | |
| Gigabyte G7 KE | |
| Razer Blade 17 Early 2022 | |
| AIDA64 / FPU Julia | |
| MSI Titan GT77 HX 13VI | |
| Razer Blade 18 RTX 4070 | |
| Moyenne Intel Core i9-13950HX (89362 - 144303, n=9) | |
| Alienware m17 R5 (R9 6900HX, RX 6850M XT) | |
| Asus ROG Strix Scar 17 SE G733CX-LL014W | |
| Gigabyte G7 KE | |
| Razer Blade 17 Early 2022 | |
| AIDA64 / CPU SHA3 | |
| MSI Titan GT77 HX 13VI | |
| Razer Blade 18 RTX 4070 | |
| Moyenne Intel Core i9-13950HX (4518 - 7093, n=9) | |
| Asus ROG Strix Scar 17 SE G733CX-LL014W | |
| Alienware m17 R5 (R9 6900HX, RX 6850M XT) | |
| Gigabyte G7 KE | |
| Razer Blade 17 Early 2022 | |
| AIDA64 / CPU Queen | |
| MSI Titan GT77 HX 13VI | |
| Razer Blade 18 RTX 4070 | |
| Moyenne Intel Core i9-13950HX (131931 - 140103, n=8) | |
| Alienware m17 R5 (R9 6900HX, RX 6850M XT) | |
| Asus ROG Strix Scar 17 SE G733CX-LL014W | |
| Razer Blade 17 Early 2022 | |
| Gigabyte G7 KE | |
| AIDA64 / FPU SinJulia | |
| MSI Titan GT77 HX 13VI | |
| Razer Blade 18 RTX 4070 | |
| Moyenne Intel Core i9-13950HX (12318 - 17057, n=9) | |
| Alienware m17 R5 (R9 6900HX, RX 6850M XT) | |
| Asus ROG Strix Scar 17 SE G733CX-LL014W | |
| Gigabyte G7 KE | |
| Razer Blade 17 Early 2022 | |
| AIDA64 / FPU Mandel | |
| MSI Titan GT77 HX 13VI | |
| Razer Blade 18 RTX 4070 | |
| Moyenne Intel Core i9-13950HX (44372 - 71038, n=9) | |
| Alienware m17 R5 (R9 6900HX, RX 6850M XT) | |
| Asus ROG Strix Scar 17 SE G733CX-LL014W | |
| Gigabyte G7 KE | |
| Razer Blade 17 Early 2022 | |
| AIDA64 / CPU AES | |
| Asus ROG Strix Scar 17 SE G733CX-LL014W | |
| Moyenne Intel Core i9-13950HX (99981 - 204491, n=9) | |
| MSI Titan GT77 HX 13VI | |
| Razer Blade 18 RTX 4070 | |
| Gigabyte G7 KE | |
| Alienware m17 R5 (R9 6900HX, RX 6850M XT) | |
| Razer Blade 17 Early 2022 | |
| AIDA64 / CPU ZLib | |
| MSI Titan GT77 HX 13VI | |
| Razer Blade 18 RTX 4070 | |
| Moyenne Intel Core i9-13950HX (1263 - 2069, n=9) | |
| Asus ROG Strix Scar 17 SE G733CX-LL014W | |
| Gigabyte G7 KE | |
| Alienware m17 R5 (R9 6900HX, RX 6850M XT) | |
| Razer Blade 17 Early 2022 | |
| AIDA64 / FP64 Ray-Trace | |
| MSI Titan GT77 HX 13VI | |
| Razer Blade 18 RTX 4070 | |
| Moyenne Intel Core i9-13950HX (9649 - 15573, n=9) | |
| Asus ROG Strix Scar 17 SE G733CX-LL014W | |
| Alienware m17 R5 (R9 6900HX, RX 6850M XT) | |
| Gigabyte G7 KE | |
| Razer Blade 17 Early 2022 | |
| AIDA64 / CPU PhotoWorxx | |
| Razer Blade 18 RTX 4070 | |
| Moyenne Intel Core i9-13950HX (40233 - 50864, n=9) | |
| Asus ROG Strix Scar 17 SE G733CX-LL014W | |
| MSI Titan GT77 HX 13VI | |
| Razer Blade 17 Early 2022 | |
| Alienware m17 R5 (R9 6900HX, RX 6850M XT) | |
| Gigabyte G7 KE | |
Performance du système
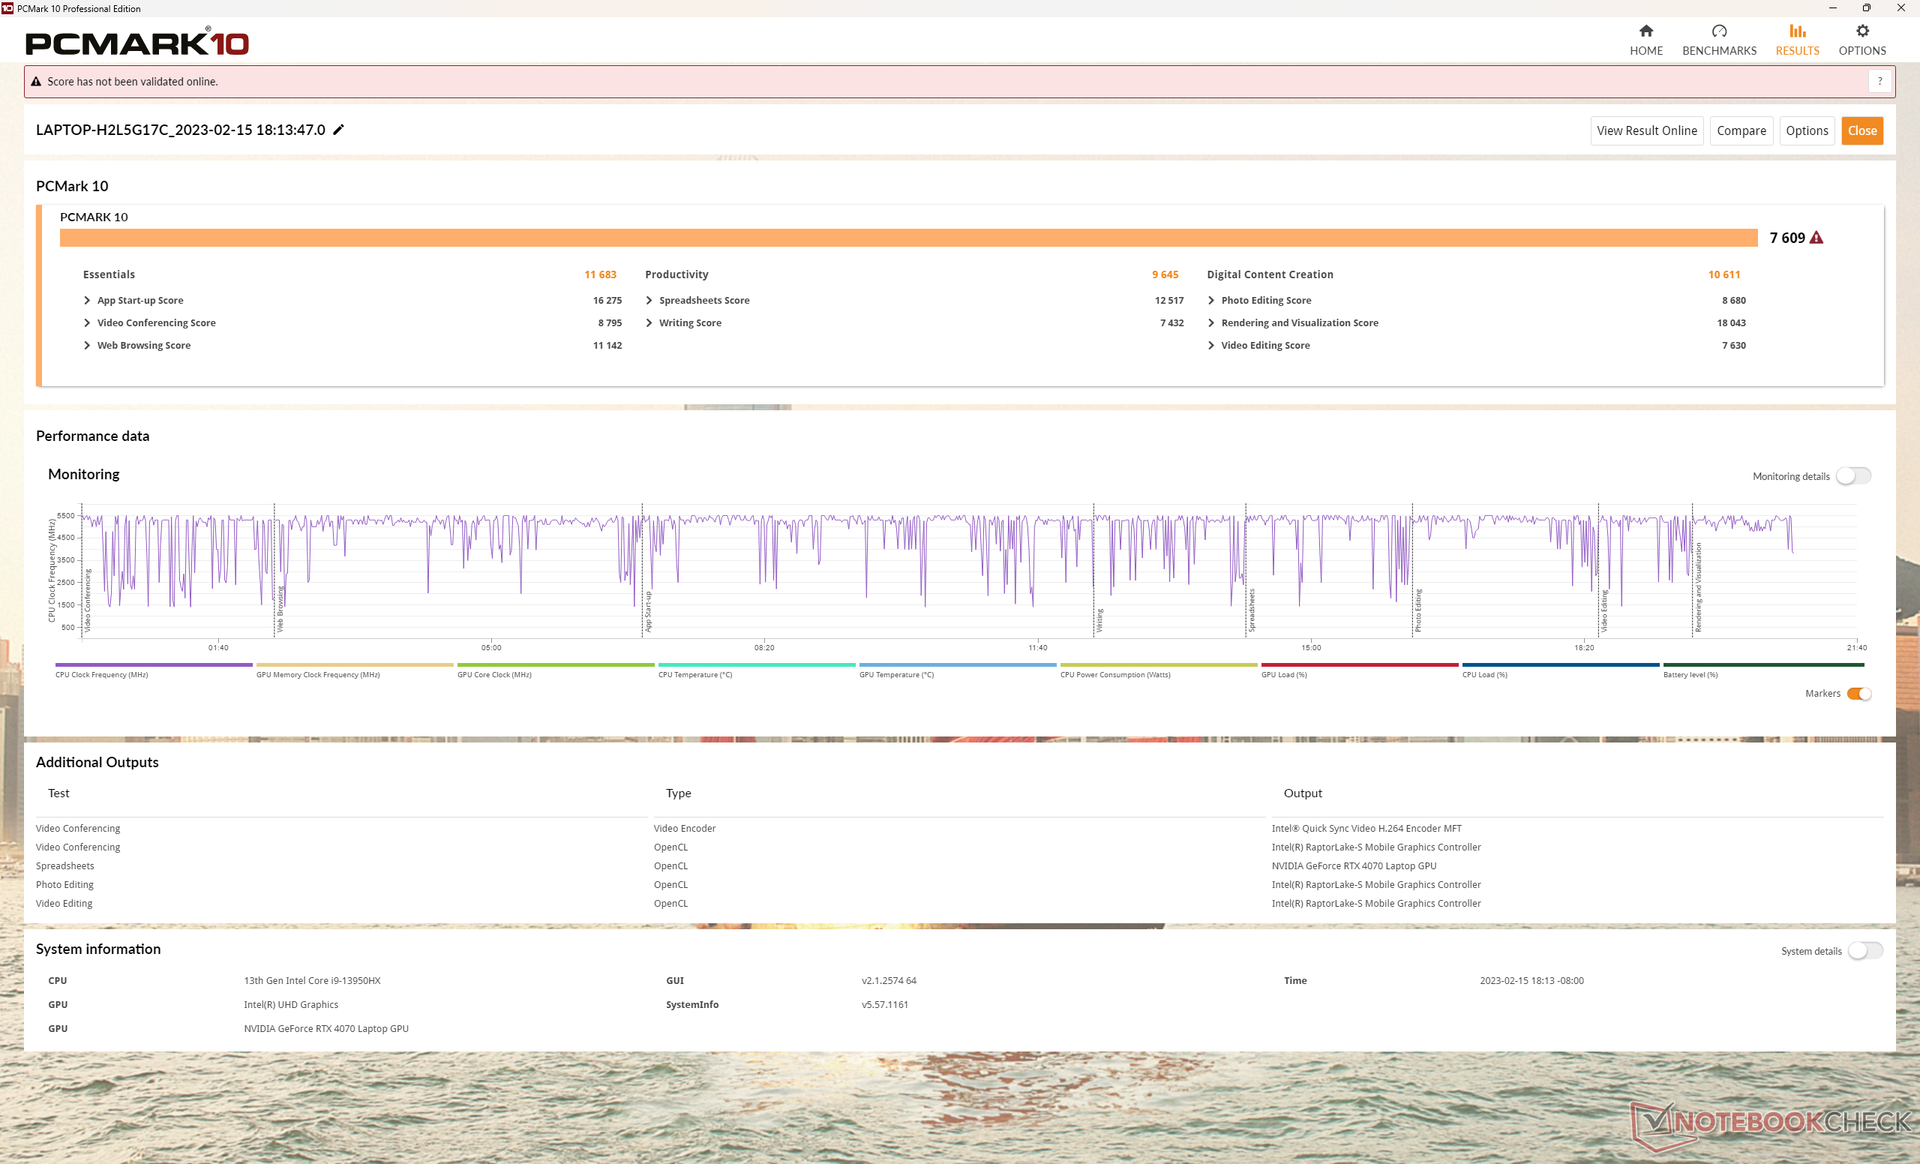
Les scores PCMark 10 sont systématiquement plus élevés que sur le 2022 Blade 17 même si les marges sont mineures. Le site Blade 16 et la MSI GT77 obtiennent de meilleurs résultats car elles sont toutes deux équipées de GPU RTX 4080 et 4090 plus rapides, respectivement.
CrossMark: Overall | Productivity | Creativity | Responsiveness
| PCMark 10 / Score | |
| MSI Titan GT77 HX 13VI | |
| Razer Blade 18 RTX 4070 | |
| Moyenne Intel Core i9-13950HX, NVIDIA GeForce RTX 4070 Laptop GPU (n=1) | |
| Alienware m17 R5 (R9 6900HX, RX 6850M XT) | |
| Asus ROG Strix Scar 17 SE G733CX-LL014W | |
| Razer Blade 17 Early 2022 | |
| Gigabyte G7 KE | |
| PCMark 10 / Essentials | |
| MSI Titan GT77 HX 13VI | |
| Razer Blade 18 RTX 4070 | |
| Moyenne Intel Core i9-13950HX, NVIDIA GeForce RTX 4070 Laptop GPU (n=1) | |
| Asus ROG Strix Scar 17 SE G733CX-LL014W | |
| Gigabyte G7 KE | |
| Razer Blade 17 Early 2022 | |
| Alienware m17 R5 (R9 6900HX, RX 6850M XT) | |
| PCMark 10 / Productivity | |
| Asus ROG Strix Scar 17 SE G733CX-LL014W | |
| MSI Titan GT77 HX 13VI | |
| Razer Blade 18 RTX 4070 | |
| Moyenne Intel Core i9-13950HX, NVIDIA GeForce RTX 4070 Laptop GPU (n=1) | |
| Razer Blade 17 Early 2022 | |
| Alienware m17 R5 (R9 6900HX, RX 6850M XT) | |
| Gigabyte G7 KE | |
| PCMark 10 / Digital Content Creation | |
| MSI Titan GT77 HX 13VI | |
| Alienware m17 R5 (R9 6900HX, RX 6850M XT) | |
| Razer Blade 18 RTX 4070 | |
| Moyenne Intel Core i9-13950HX, NVIDIA GeForce RTX 4070 Laptop GPU (n=1) | |
| Razer Blade 17 Early 2022 | |
| Asus ROG Strix Scar 17 SE G733CX-LL014W | |
| Gigabyte G7 KE | |
| CrossMark / Overall | |
| MSI Titan GT77 HX 13VI | |
| Razer Blade 18 RTX 4070 | |
| Moyenne Intel Core i9-13950HX, NVIDIA GeForce RTX 4070 Laptop GPU (n=1) | |
| Asus ROG Strix Scar 17 SE G733CX-LL014W | |
| Gigabyte G7 KE | |
| Razer Blade 17 Early 2022 | |
| Alienware m17 R5 (R9 6900HX, RX 6850M XT) | |
| CrossMark / Productivity | |
| MSI Titan GT77 HX 13VI | |
| Razer Blade 18 RTX 4070 | |
| Moyenne Intel Core i9-13950HX, NVIDIA GeForce RTX 4070 Laptop GPU (n=1) | |
| Asus ROG Strix Scar 17 SE G733CX-LL014W | |
| Gigabyte G7 KE | |
| Razer Blade 17 Early 2022 | |
| Alienware m17 R5 (R9 6900HX, RX 6850M XT) | |
| CrossMark / Creativity | |
| MSI Titan GT77 HX 13VI | |
| Razer Blade 18 RTX 4070 | |
| Moyenne Intel Core i9-13950HX, NVIDIA GeForce RTX 4070 Laptop GPU (n=1) | |
| Asus ROG Strix Scar 17 SE G733CX-LL014W | |
| Razer Blade 17 Early 2022 | |
| Gigabyte G7 KE | |
| Alienware m17 R5 (R9 6900HX, RX 6850M XT) | |
| CrossMark / Responsiveness | |
| Gigabyte G7 KE | |
| Asus ROG Strix Scar 17 SE G733CX-LL014W | |
| Razer Blade 18 RTX 4070 | |
| Moyenne Intel Core i9-13950HX, NVIDIA GeForce RTX 4070 Laptop GPU (n=1) | |
| MSI Titan GT77 HX 13VI | |
| Razer Blade 17 Early 2022 | |
| Alienware m17 R5 (R9 6900HX, RX 6850M XT) | |
| PCMark 10 Score | 7609 points | |
Aide | ||
| AIDA64 / Memory Copy | |
| Razer Blade 18 RTX 4070 | |
| Moyenne Intel Core i9-13950HX (61938 - 78813, n=9) | |
| MSI Titan GT77 HX 13VI | |
| Asus ROG Strix Scar 17 SE G733CX-LL014W | |
| Razer Blade 17 Early 2022 | |
| Alienware m17 R5 (R9 6900HX, RX 6850M XT) | |
| Gigabyte G7 KE | |
| AIDA64 / Memory Read | |
| Razer Blade 18 RTX 4070 | |
| Moyenne Intel Core i9-13950HX (62368 - 86831, n=9) | |
| Asus ROG Strix Scar 17 SE G733CX-LL014W | |
| MSI Titan GT77 HX 13VI | |
| Razer Blade 17 Early 2022 | |
| Alienware m17 R5 (R9 6900HX, RX 6850M XT) | |
| Gigabyte G7 KE | |
| AIDA64 / Memory Write | |
| Razer Blade 18 RTX 4070 | |
| Moyenne Intel Core i9-13950HX (59501 - 80441, n=9) | |
| Asus ROG Strix Scar 17 SE G733CX-LL014W | |
| MSI Titan GT77 HX 13VI | |
| Razer Blade 17 Early 2022 | |
| Alienware m17 R5 (R9 6900HX, RX 6850M XT) | |
| Gigabyte G7 KE | |
| AIDA64 / Memory Latency | |
| Alienware m17 R5 (R9 6900HX, RX 6850M XT) | |
| MSI Titan GT77 HX 13VI | |
| Gigabyte G7 KE | |
| Moyenne Intel Core i9-13950HX (84.4 - 99.5, n=9) | |
| Asus ROG Strix Scar 17 SE G733CX-LL014W | |
| Razer Blade 18 RTX 4070 | |
* ... Moindre est la valeur, meilleures sont les performances
Latence DPC
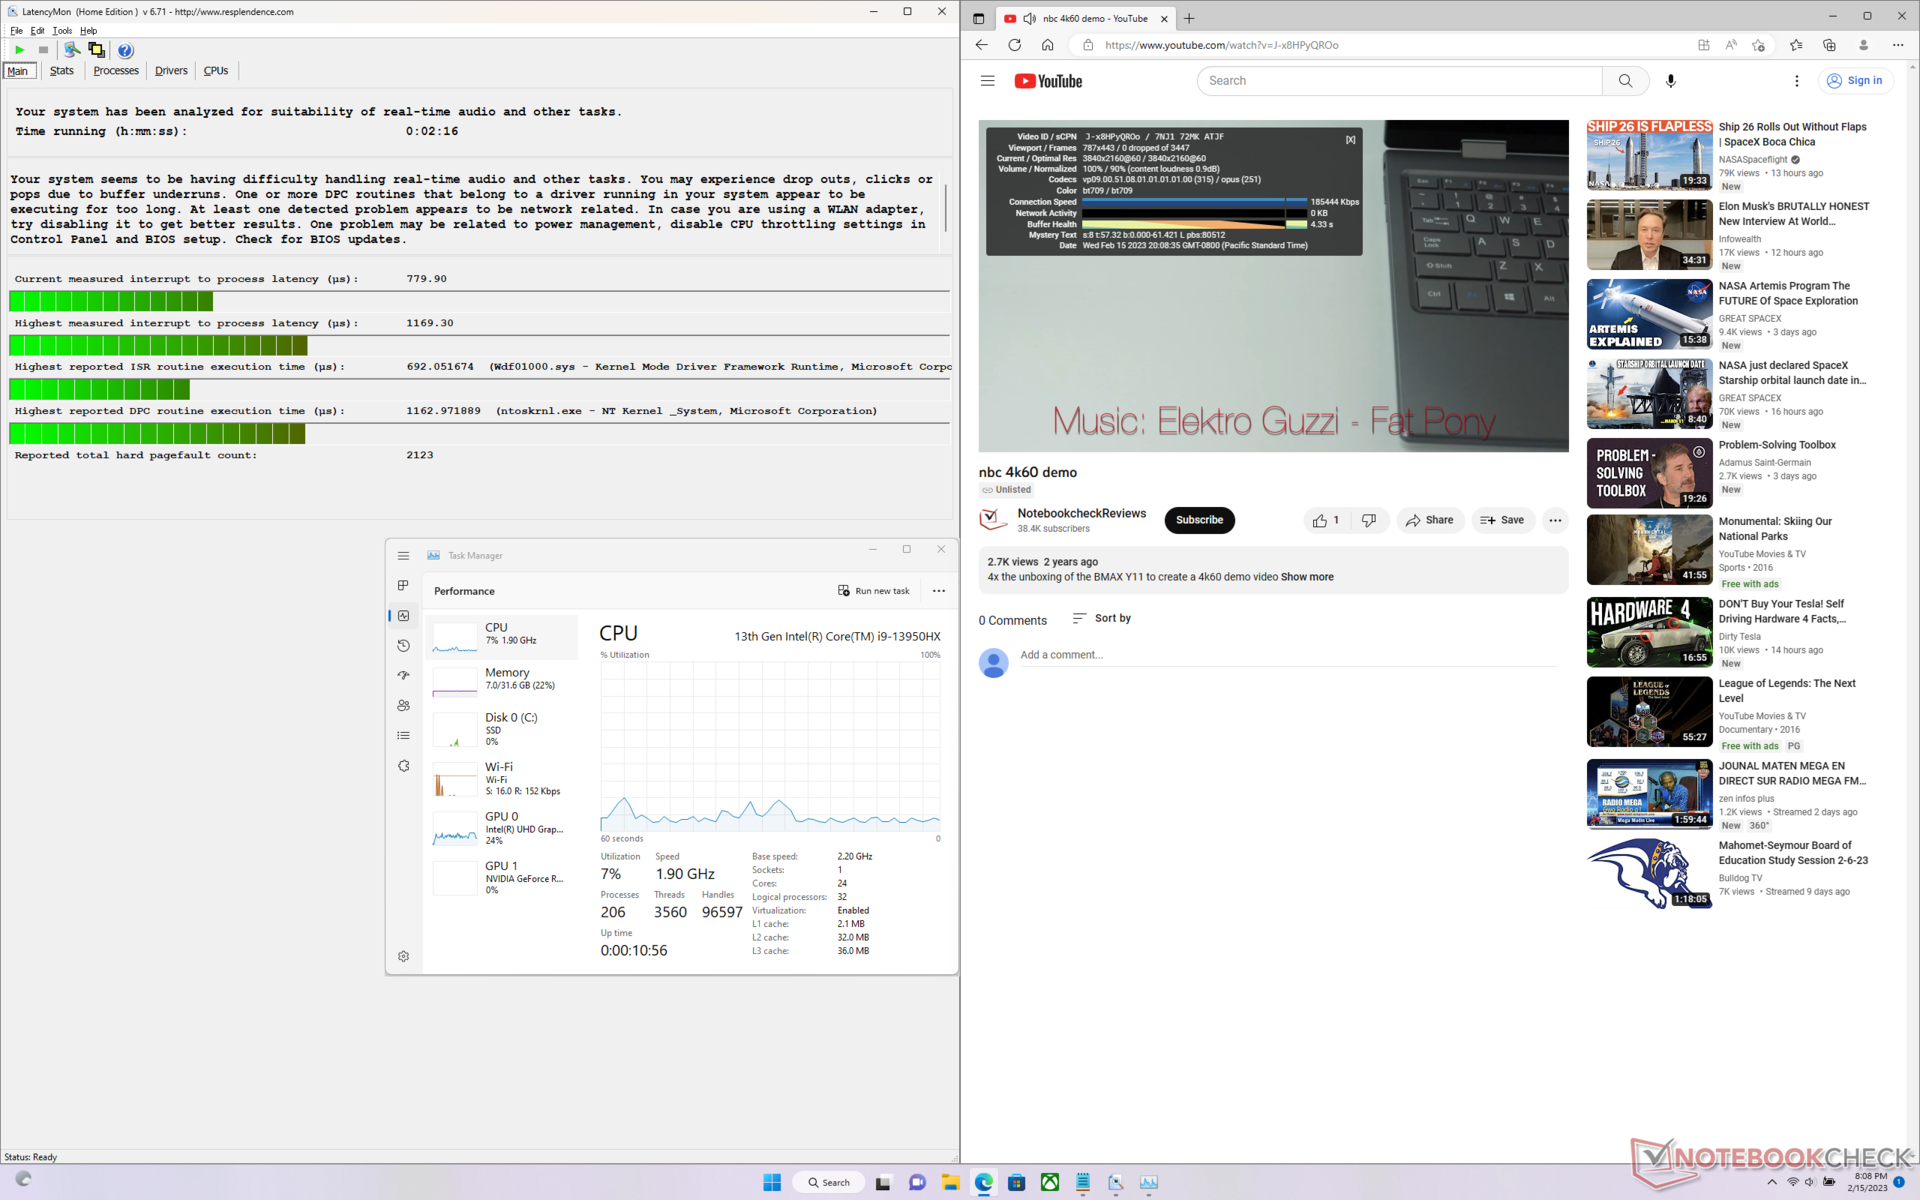
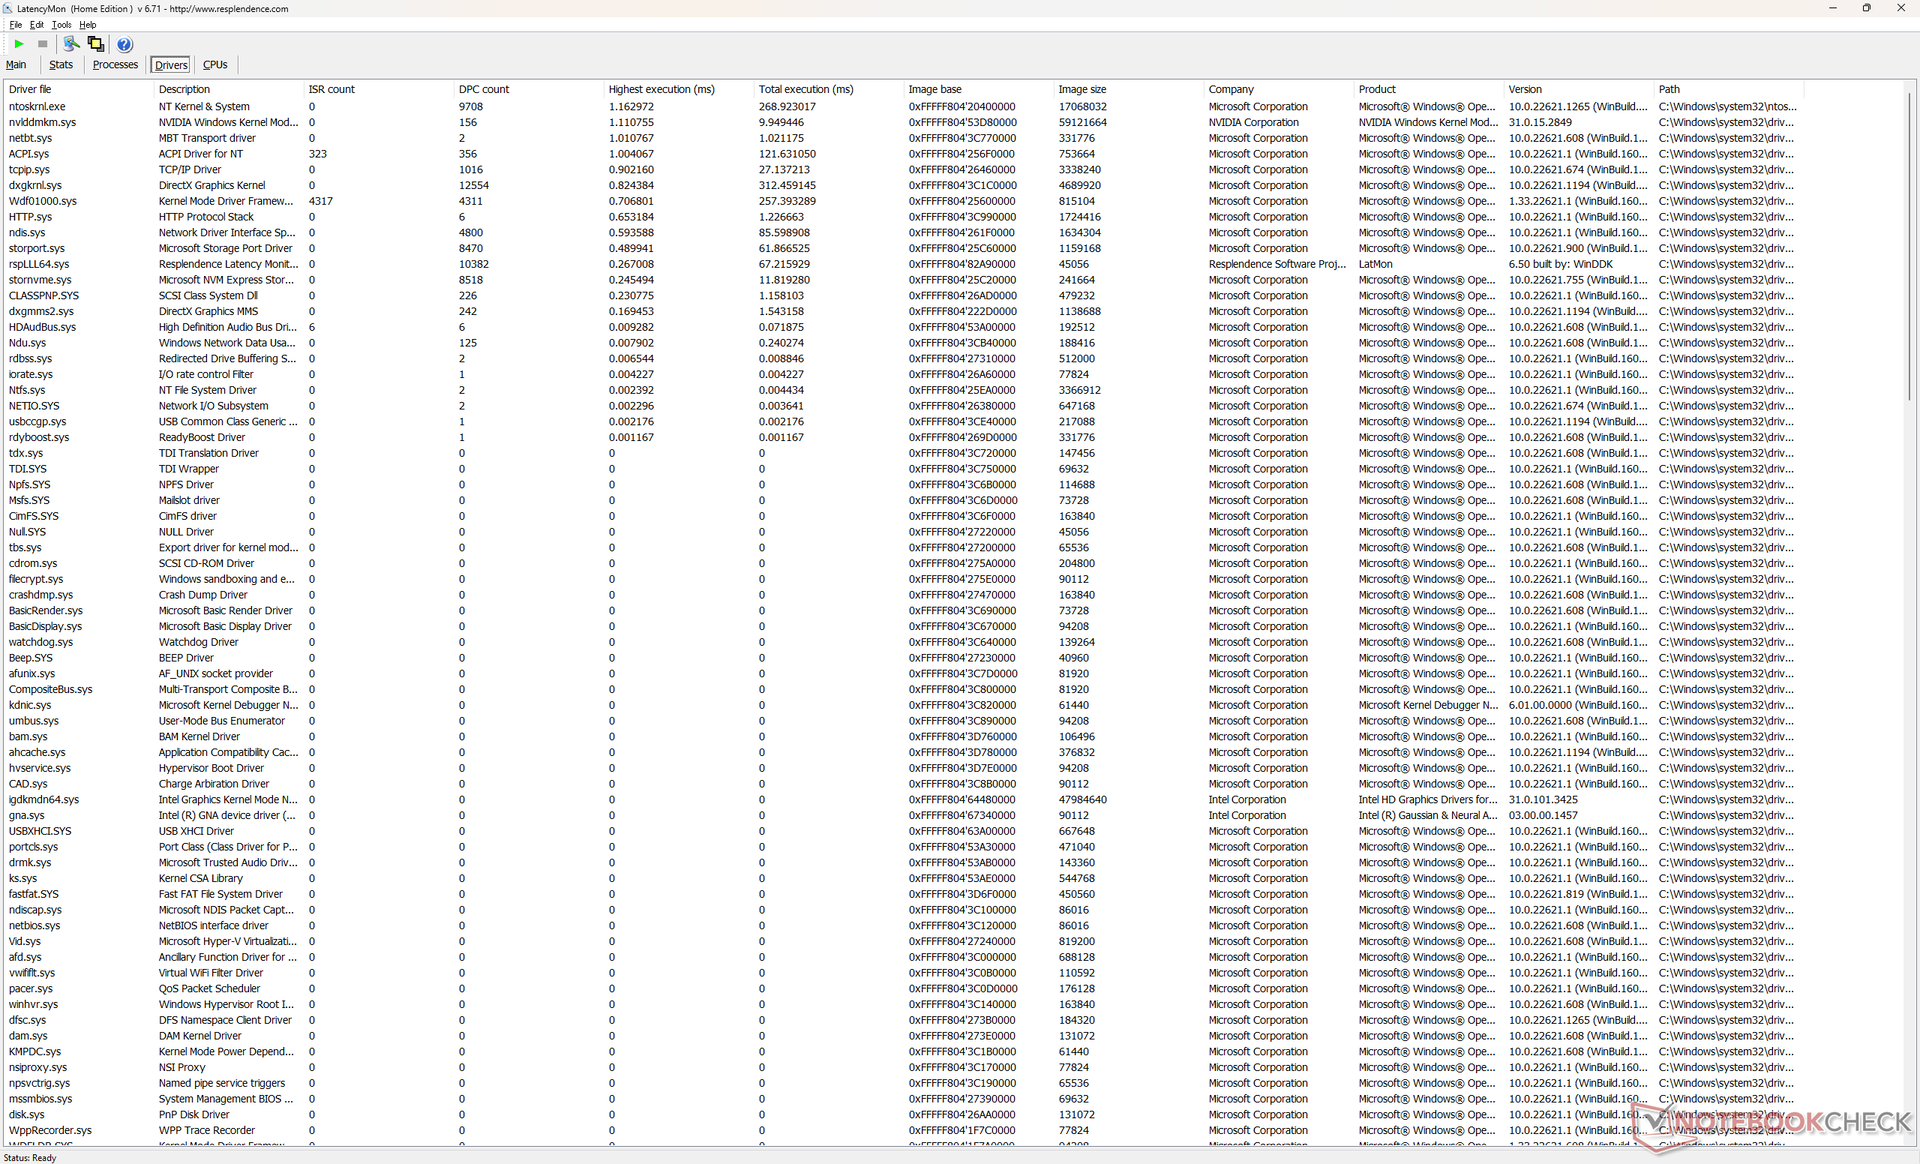
LatencyMon révèle de légers problèmes de CPD lors de l'ouverture de plusieurs onglets de navigateur de notre page d'accueil. la lecture de vidéos 4K à 60 FPS est par ailleurs irréprochable avec une faible utilisation du CPU et du GPU.
| DPC Latencies / LatencyMon - interrupt to process latency (max), Web, Youtube, Prime95 | |
| MSI Titan GT77 HX 13VI | |
| Asus ROG Strix Scar 17 SE G733CX-LL014W | |
| Gigabyte G7 KE | |
| Alienware m17 R5 (R9 6900HX, RX 6850M XT) | |
| Razer Blade 18 RTX 4070 | |
| Razer Blade 17 Early 2022 | |
* ... Moindre est la valeur, meilleures sont les performances
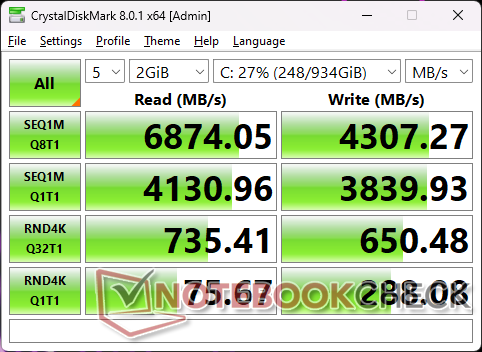
Périphériques de stockage - Jusqu'à deux SSDs
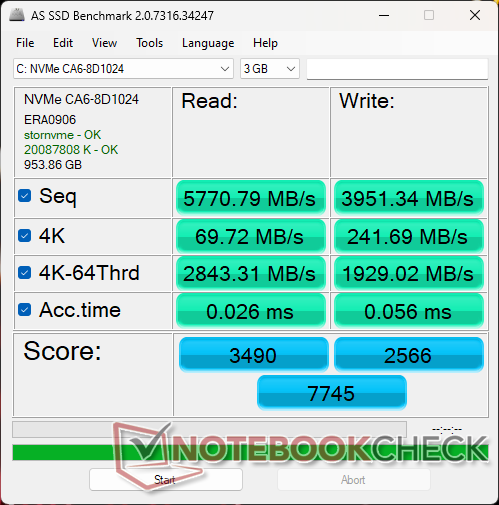
Notre unité de test est livrée avec le même 1 TB SSSTC CA6-8D1024 PCIe4 x4 NVMe SSD que l'on trouve sur le modèle Alienware m17 R5. Les taux de transfert sont comparables à ceux du populaire Samsung PM9A1, avec des taux de lecture et d'écriture séquentiels stables approchant respectivement 6900 Mo/s et 4300 Mo/s. Razer inclut un tampon thermique pour chacun des deux emplacements SSD afin de dissiper la chaleur sur le panneau inférieur métallique.

| Drive Performance rating - Percent | |
| Asus ROG Strix Scar 17 SE G733CX-LL014W | |
| Gigabyte G7 KE | |
| Razer Blade 17 Early 2022 | |
| MSI Titan GT77 HX 13VI | |
| Razer Blade 18 RTX 4070 | |
| Alienware m17 R5 (R9 6900HX, RX 6850M XT) | |
* ... Moindre est la valeur, meilleures sont les performances
Disk Throttling: DiskSpd Read Loop, Queue Depth 8
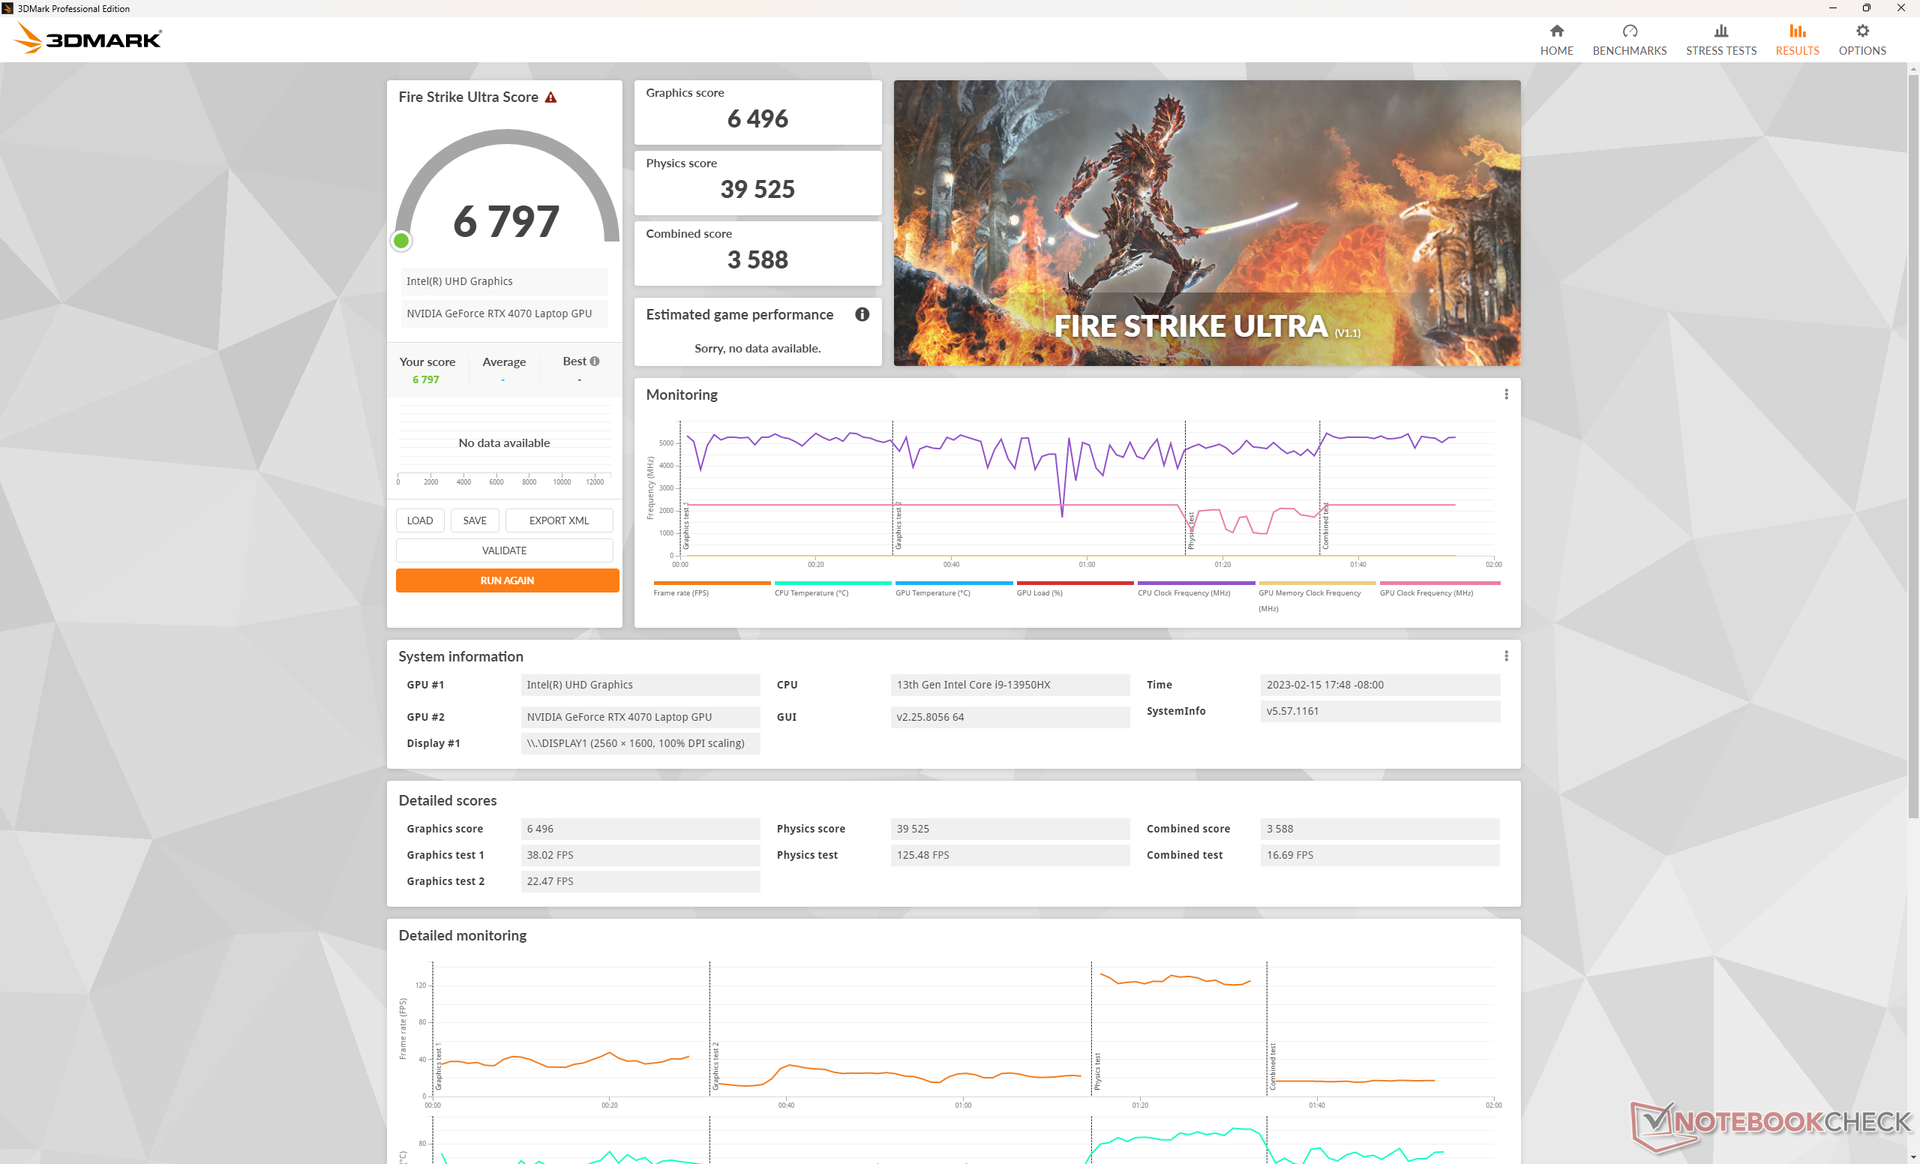
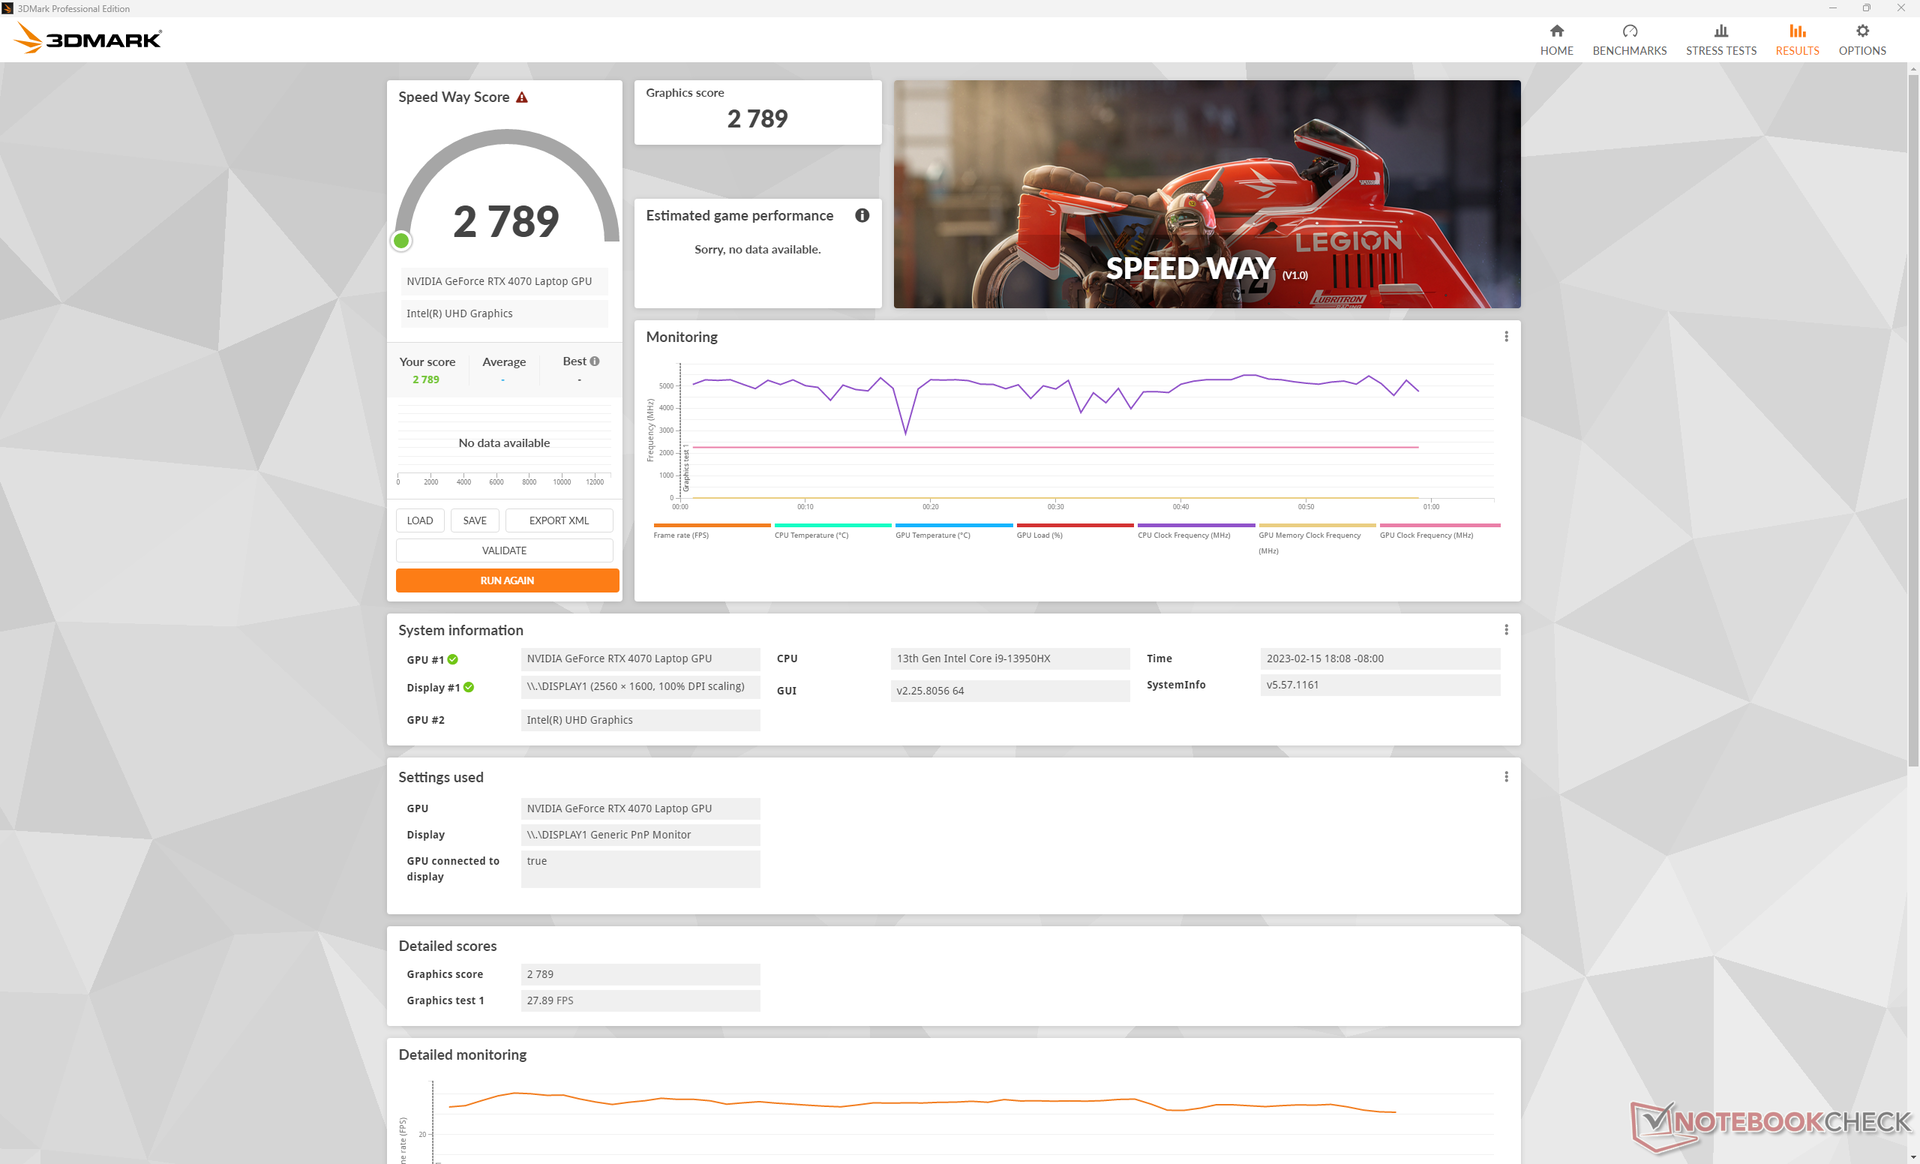
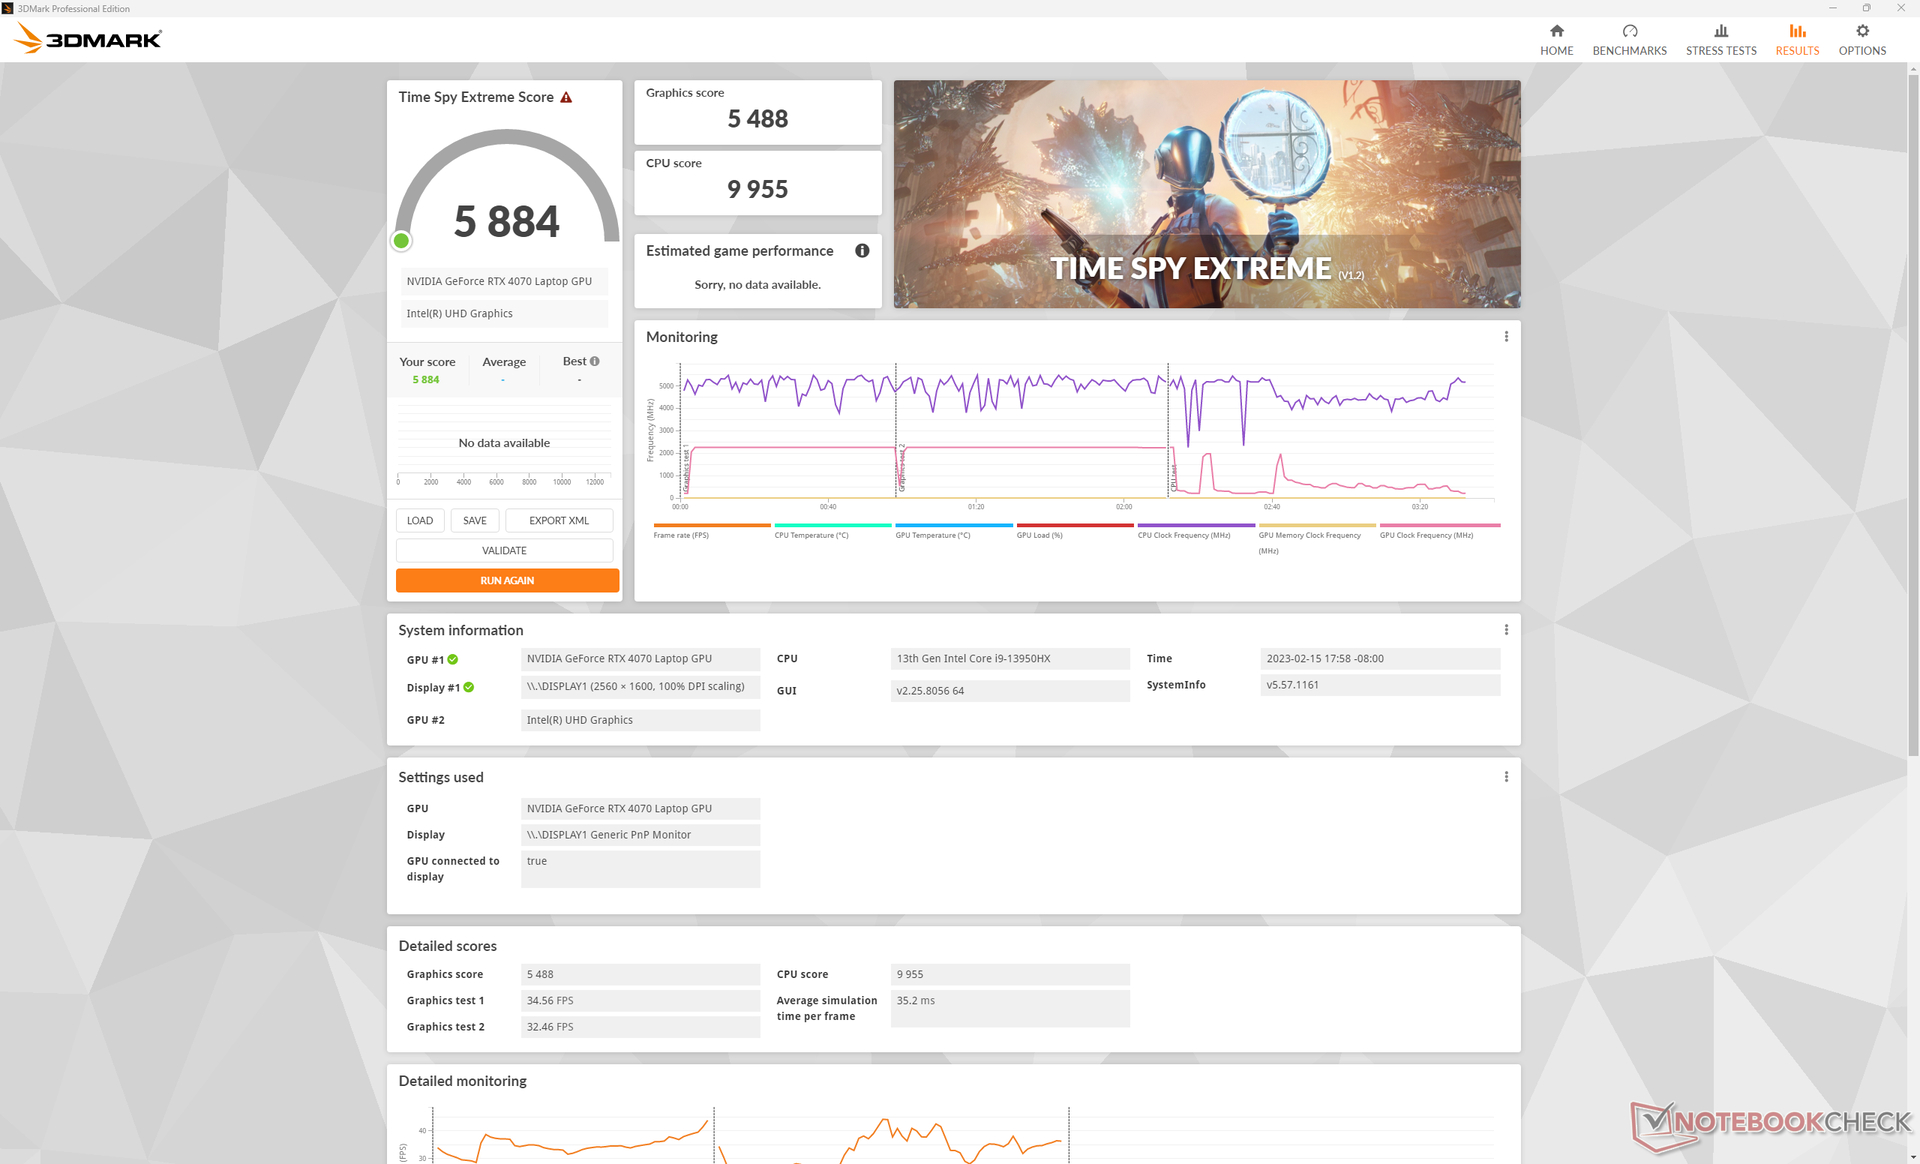
Performances du GPU - Performances similaires à celles d'un ordinateur de bureau GeForce RTX 3070
Les 140 Wmobile GeForce RTX 4070 se situe confortablement entre le rTX 3080 mobile etrTX 3080 Ti mobile en termes de performances brutes. Elle n'est qu'environ 10 à 20 % plus rapide que la rTX 3070 mobilesortante, ce qui est un peu décevant si l'on considère que la rTX 4080 mobile mobile est environ 40 à 50 % plus rapide que la rTX 3080 mobile. Cela signifie que l'écart de performance entre la RTX 4070 mobile et la RTX 4080 mobile est plus important, de 40 à 60 %.
Comparé aux GPU de bureau, le RTX 4070 mobile est environ 5 à 10 % plus lent que le rTX 3070 de bureau qui a été lancé il y a trois ans.
L'un des principaux arguments de vente des GPU GeForce 40 est leur prise en charge de la génération d'images ou DLSS 3. Malheureusement, notre unité de test Blade 18 RTX 4070 a présenté des problèmes lors de l'exécution des jeux pris en charge avec DLSS 3 activé sur un moniteur HDMI ou USB-C 4K externe. Les taux de trame ont chuté à <30 FPS sur tous les titres testés, sans raison apparente, alors que le Blade 16 RTX 4080 n'avait pas de tels problèmes. Curieusement, DLSS 3 fonctionne parfaitement bien sur l'écran interne du Blade 18. Nous avons contacté Razer pour trouver une solution potentielle et nous mettrons à jour cette section le cas échéant. Pour l'instant, il est préférable de jouer sur l'écran interne si DLSS 3 est activé.
D'autres jeux seront évalués dans les jours qui suivent.
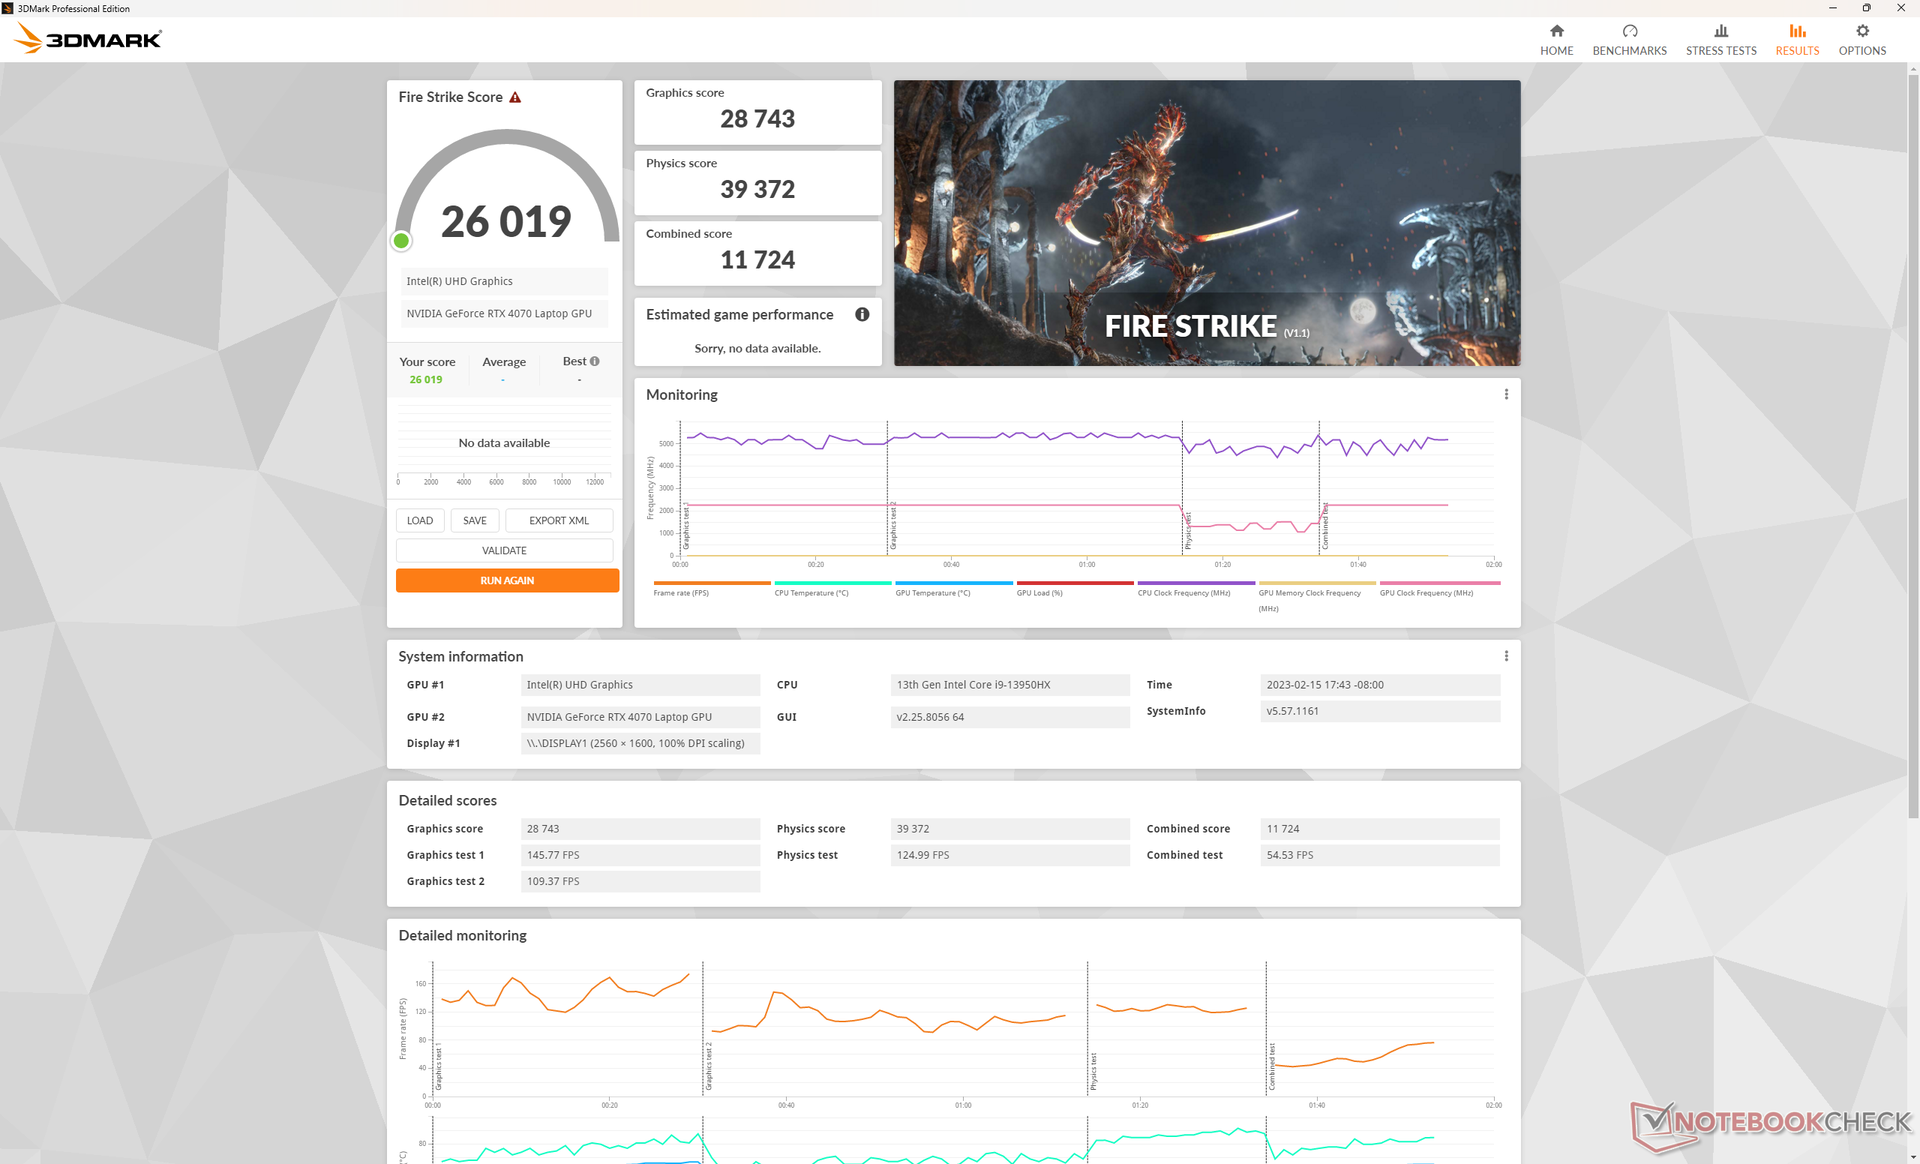
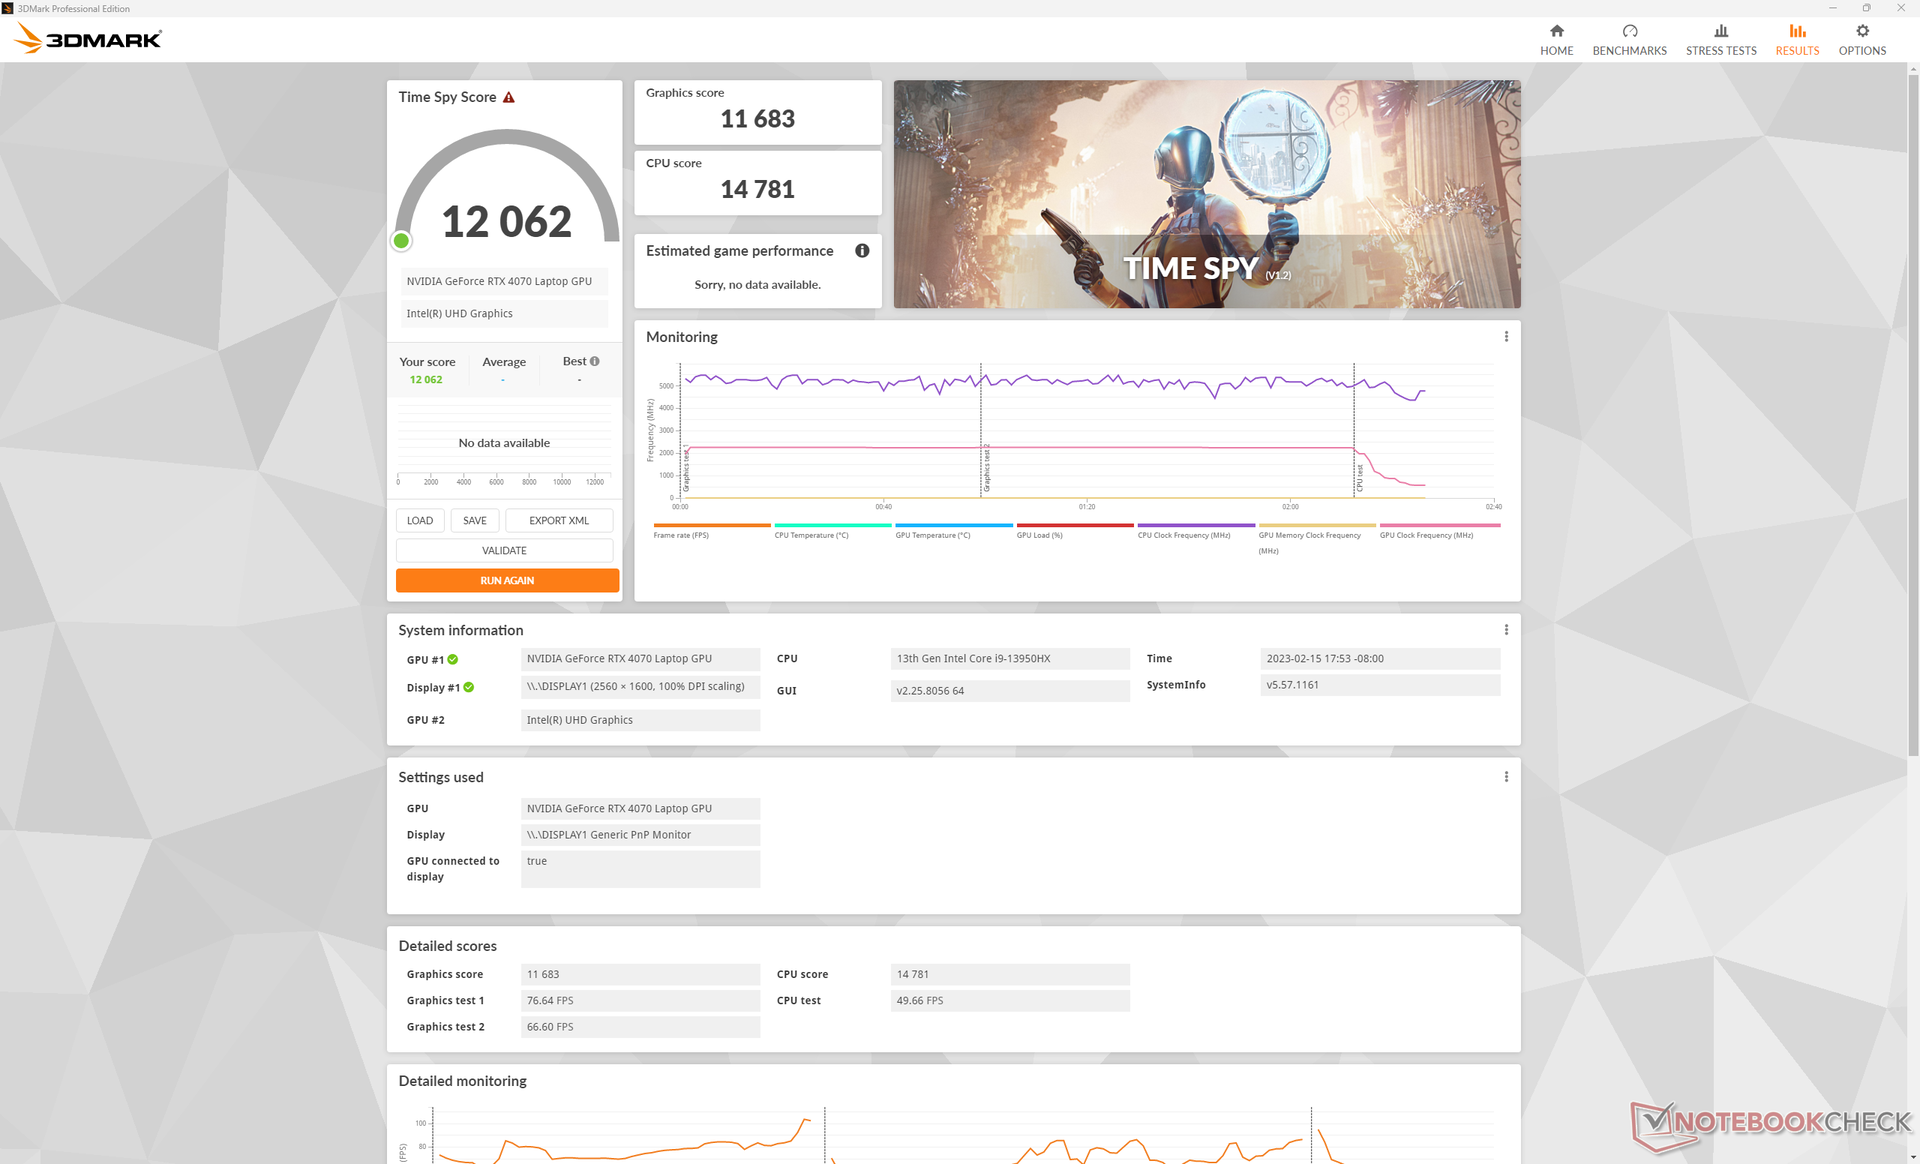
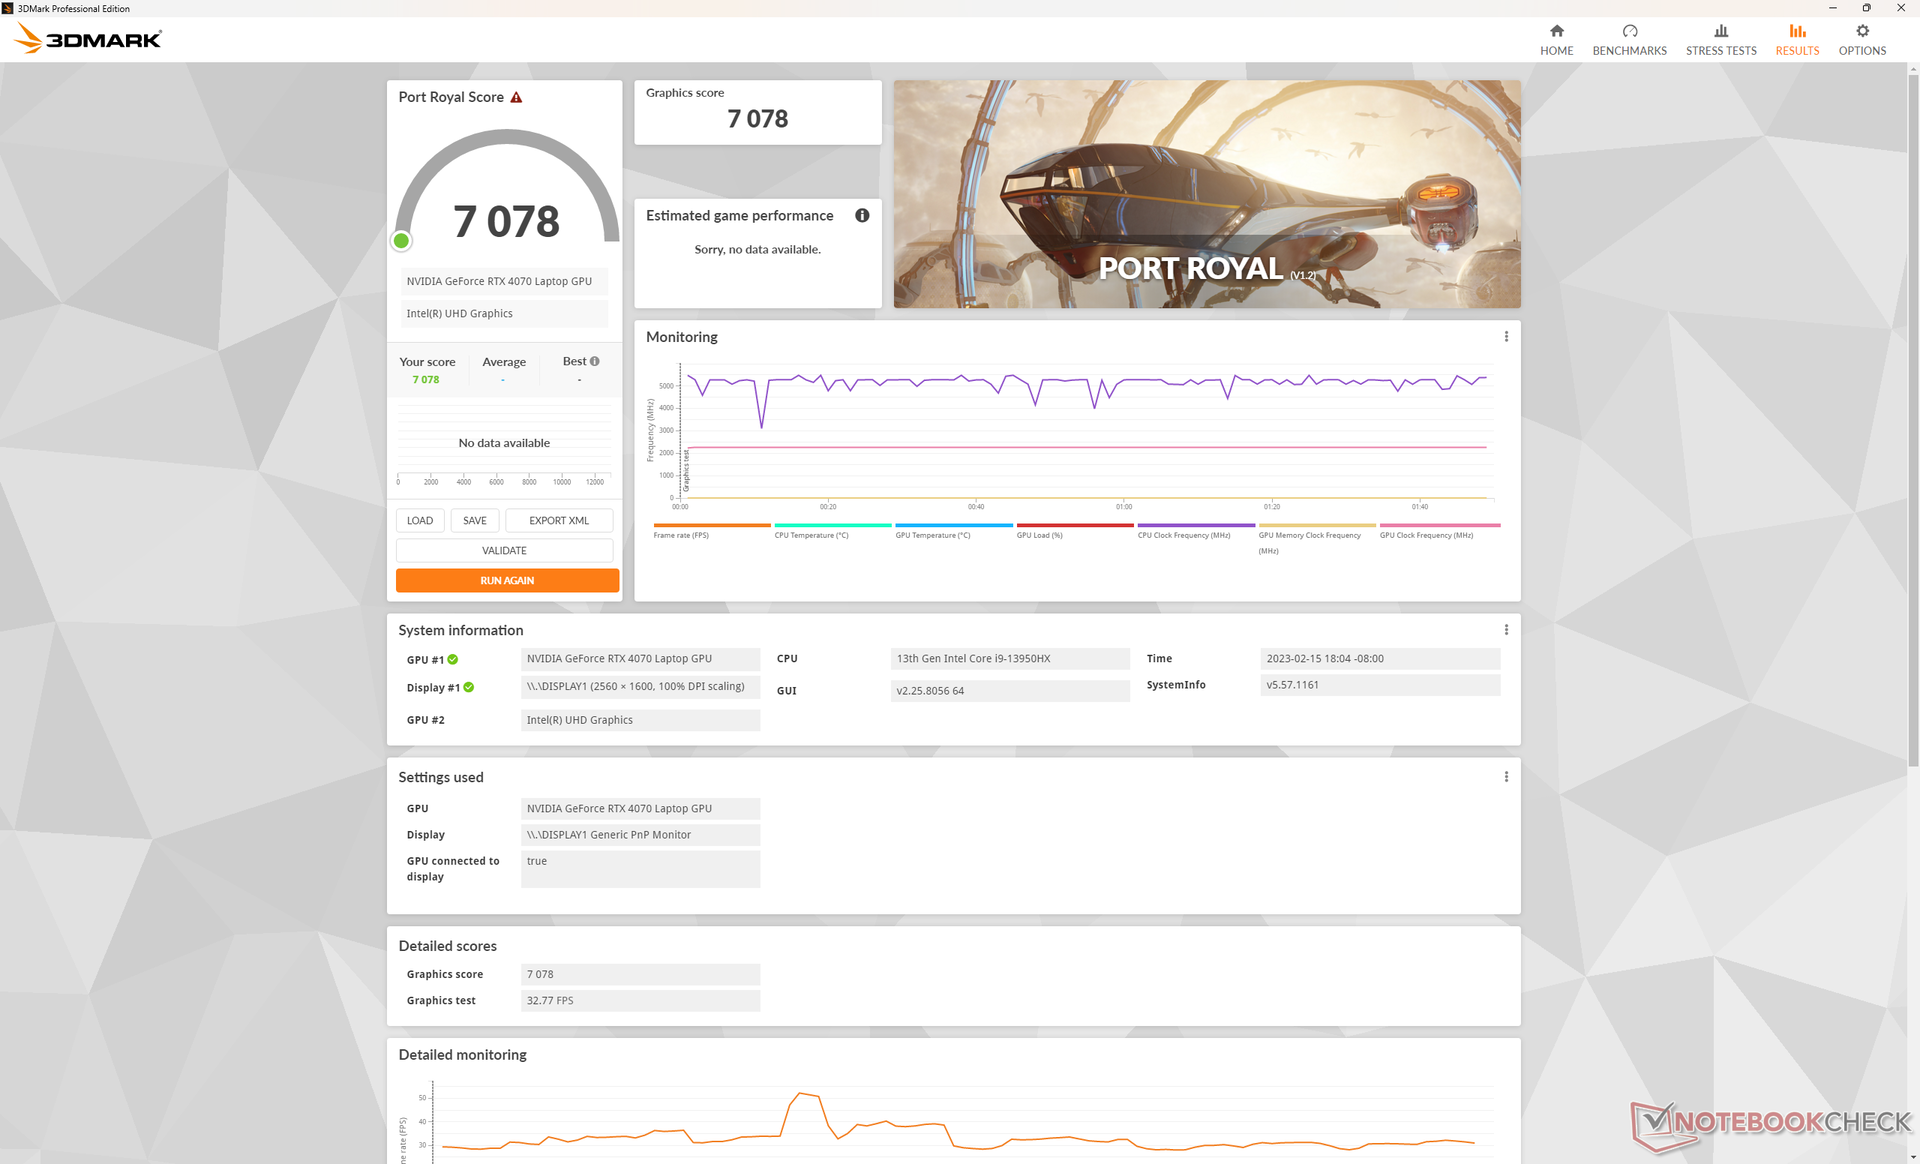
| 3DMark 11 Performance | 34754 points | |
| 3DMark Fire Strike Score | 26019 points | |
| 3DMark Time Spy Score | 12062 points | |
Aide | ||
* ... Moindre est la valeur, meilleures sont les performances
La marche au ralenti sur Witcher 3 pendant une heure permet d'obtenir des taux d'images stables, sans baisse récurrente des performances, ce qui suggère qu'il n'y a pas d'interruption des applications en arrière-plan ou d'étranglement majeur.
Witcher 3 FPS Chart
| Bas | Moyen | Élevé | Ultra | QHD | 4K | |
|---|---|---|---|---|---|---|
| GTA V (2015) | 186.1 | 184.7 | 181.6 | 121.4 | 87.6 | 88.5 |
| The Witcher 3 (2015) | 617 | 405.9 | 240.9 | 113.9 | 72.5 | |
| Dota 2 Reborn (2015) | 225 | 200 | 191 | 178.6 | 145.5 | |
| Final Fantasy XV Benchmark (2018) | 231 | 166.9 | 115.2 | 82 | 46.6 | |
| X-Plane 11.11 (2018) | 203 | 178.9 | 137.9 | 117.7 | ||
| Strange Brigade (2018) | 464 | 315 | 243 | 208 | 136.7 | 71.9 |
| Metro Exodus (2019) | 208.9 | 139.8 | 109.7 | 86.8 | 69 | 44 |
| Borderlands 3 (2019) | 258.5 | 200.1 | 131.8 | 100.3 | 68.7 | 35.7 |
| Hitman 3 (2021) | 294.3 | 234 | 208.4 | 197.4 | 129.9 | 68.5 |
| Cyberpunk 2077 1.6 (2022) | 147.8 | 125.7 | 111.5 | 92.1 | 54 | 23.3 |
Émissions
Bruit du système - Silencieux quand on ne joue pas
Les ventilateurs internes sont silencieux lors de l'exécution de charges peu exigeantes comme le streaming vidéo ou la navigation sur Internet. Le bruit du ventilateur se situe généralement juste en dessous de 27 dB(A) contre un arrière-plan silencieux de 23,5 dB(A) pour être essentiellement inaudible dans la plupart des conditions. C'est plus silencieux que prévu compte tenu de la taille et de la puissance sous le bois.
L'exécution de charges plus élevées, comme des jeux, augmentera le régime du ventilateur lentement mais régulièrement avant de se stabiliser à 48 dB(A). En cas d'utilisation à 100 %, le bruit du ventilateur peut même atteindre 54 dB(A). La gamme basse de 50 dB(A) est typique de la plupart des ordinateurs portables de jeu, y compris le GT77 ou le Blade 17 de Razer. Le Blade 18 est à peu près aussi bruyant que ses petits frères et sœurs lorsqu'il joue, malgré leur différence de taille.
Degré de la nuisance sonore
| Au repos |
| 23.8 / 23.8 / 26.8 dB(A) |
| Fortement sollicité |
| 37.3 / 53.5 dB(A) |
 | ||
30 dB silencieux 40 dB(A) audible 50 dB(A) bruyant |
||
min: | ||
| Razer Blade 18 RTX 4070 GeForce RTX 4070 Laptop GPU, i9-13950HX, SSSTC CA6-8D1024 | Razer Blade 17 Early 2022 GeForce RTX 3080 Ti Laptop GPU, i9-12900H, Samsung PM9A1 MZVL21T0HCLR | MSI Titan GT77 HX 13VI GeForce RTX 4090 Laptop GPU, i9-13950HX, Samsung PM9A1 MZVL22T0HBLB | Gigabyte G7 KE GeForce RTX 3060 Laptop GPU, i5-12500H, Gigabyte AG470S1TB-SI B10 | Alienware m17 R5 (R9 6900HX, RX 6850M XT) Radeon RX 6850M XT, R9 6900HX, SSSTC CA6-8D1024 | Asus ROG Strix Scar 17 SE G733CX-LL014W GeForce RTX 3080 Ti Laptop GPU, i9-12950HX, Samsung PM9A1 MZVL22T0HBLB | |
|---|---|---|---|---|---|---|
| Noise | -12% | -17% | -26% | 0% | 5% | |
| arrêt / environnement * (dB) | 23.5 | 26 -11% | 24.6 -5% | 27 -15% | 23 2% | 23.9 -2% |
| Idle Minimum * (dB) | 23.8 | 26 -9% | 29.2 -23% | 27 -13% | 23 3% | 23.9 -0% |
| Idle Average * (dB) | 23.8 | 27 -13% | 29.2 -23% | 35 -47% | 28.11 -18% | 23.9 -0% |
| Idle Maximum * (dB) | 26.8 | 32 -19% | 29.2 -9% | 38 -42% | 28.11 -5% | 23.9 11% |
| Load Average * (dB) | 37.3 | 50 -34% | 50.7 -36% | 52 -39% | 30.62 18% | 34.3 8% |
| Witcher 3 ultra * (dB) | 48 | 51 -6% | 53.3 -11% | 56 -17% | 49.75 -4% | |
| Load Maximum * (dB) | 53.5 | 51 5% | 61 -14% | 59 -10% | 50.17 6% | 45.9 14% |
* ... Moindre est la valeur, meilleures sont les performances
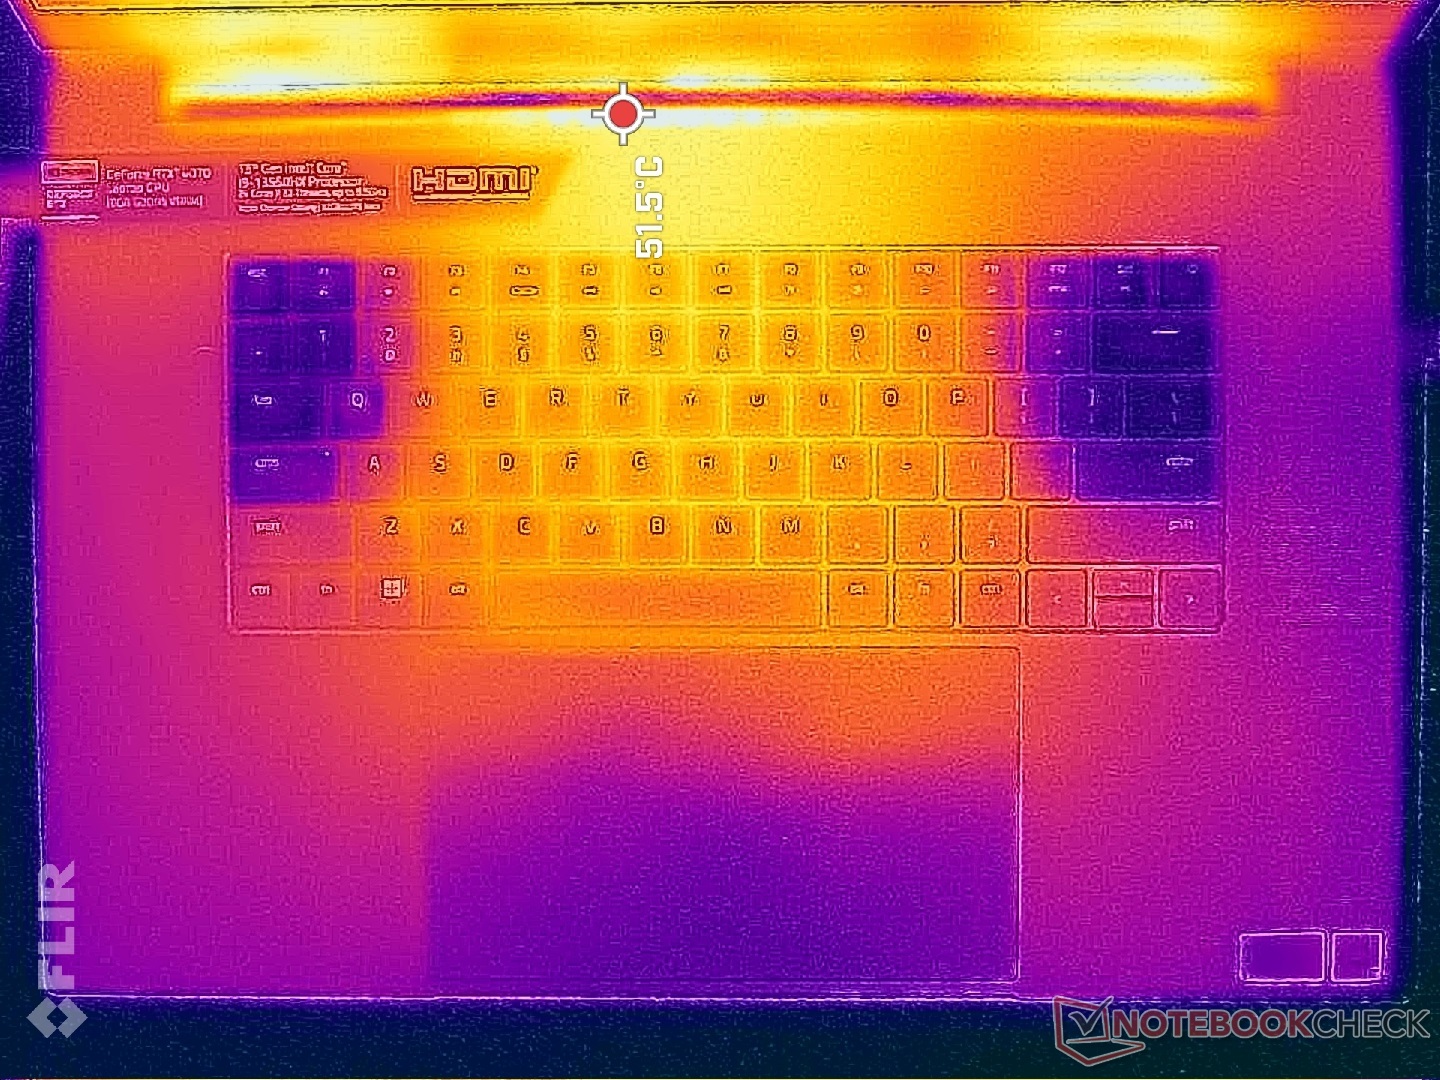
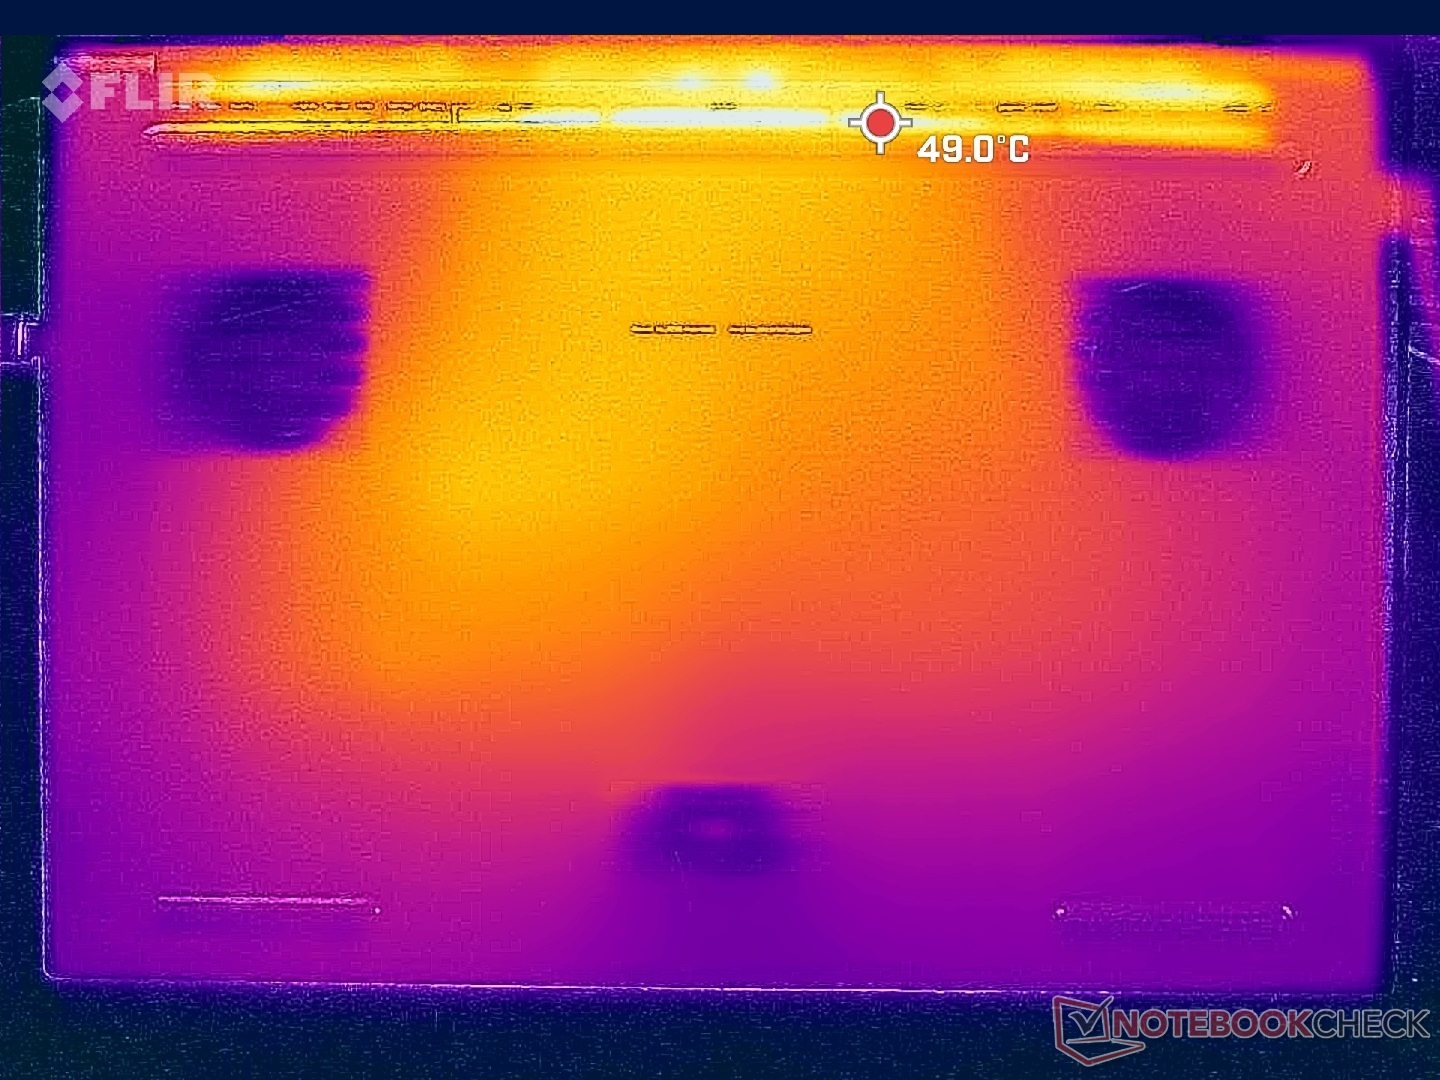
Température
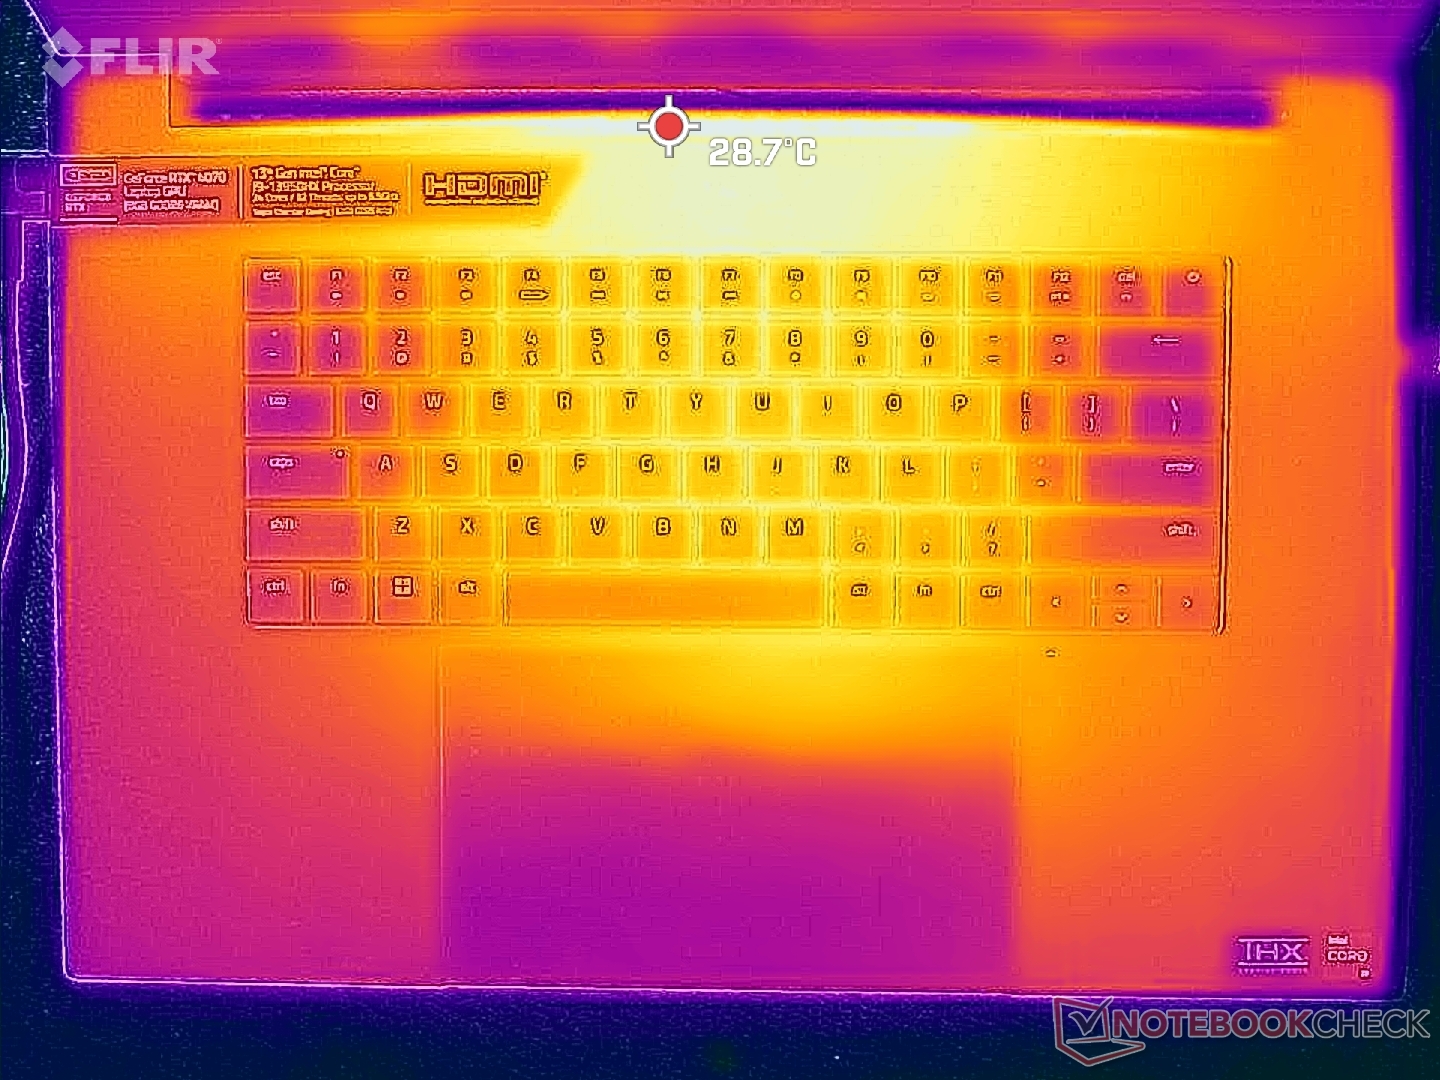
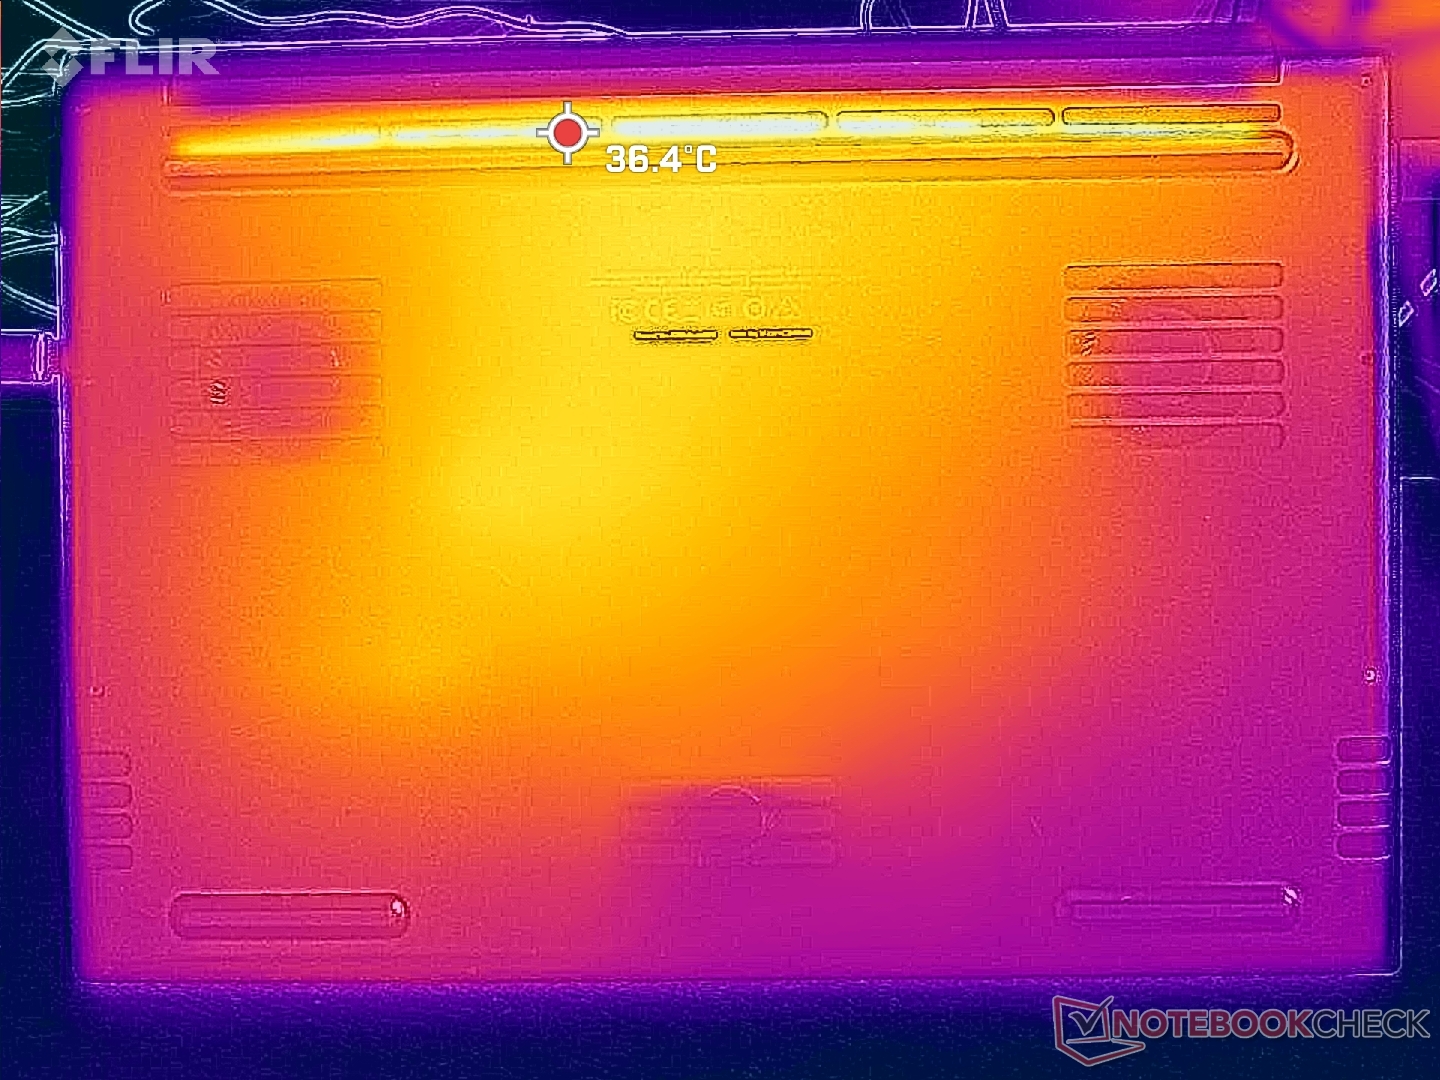
Les températures de surface sont relativement fraîches pour un ordinateur portable de jeu, probablement en raison du grand facteur de forme de 18 pouces, du refroidisseur à chambre à vapeur avec trois ventilateurs, et du GPU TGP de 140 W. Les configurations RTX 4080 ou 4090 plus rapides seront probablement plus chaudes que ce que nous avons enregistré ici car elles ont toutes un plafond plus élevé de 175 W.
Les points chauds lors du fonctionnement Witcher 3 ne dépassent pas 36 C sur le dessus et 33 C sur le dessous, comparé à 50 C à 57 C sur les configurations de l Alienware m17 R5. Le Blade 18 avec RTX 4070 est l'un des portables de jeu les plus frais que nous ayons testé jusqu'à présent et il est clair que le châssis a été construit pour gérer des options plus puissantes que notre configuration RTX 4070.
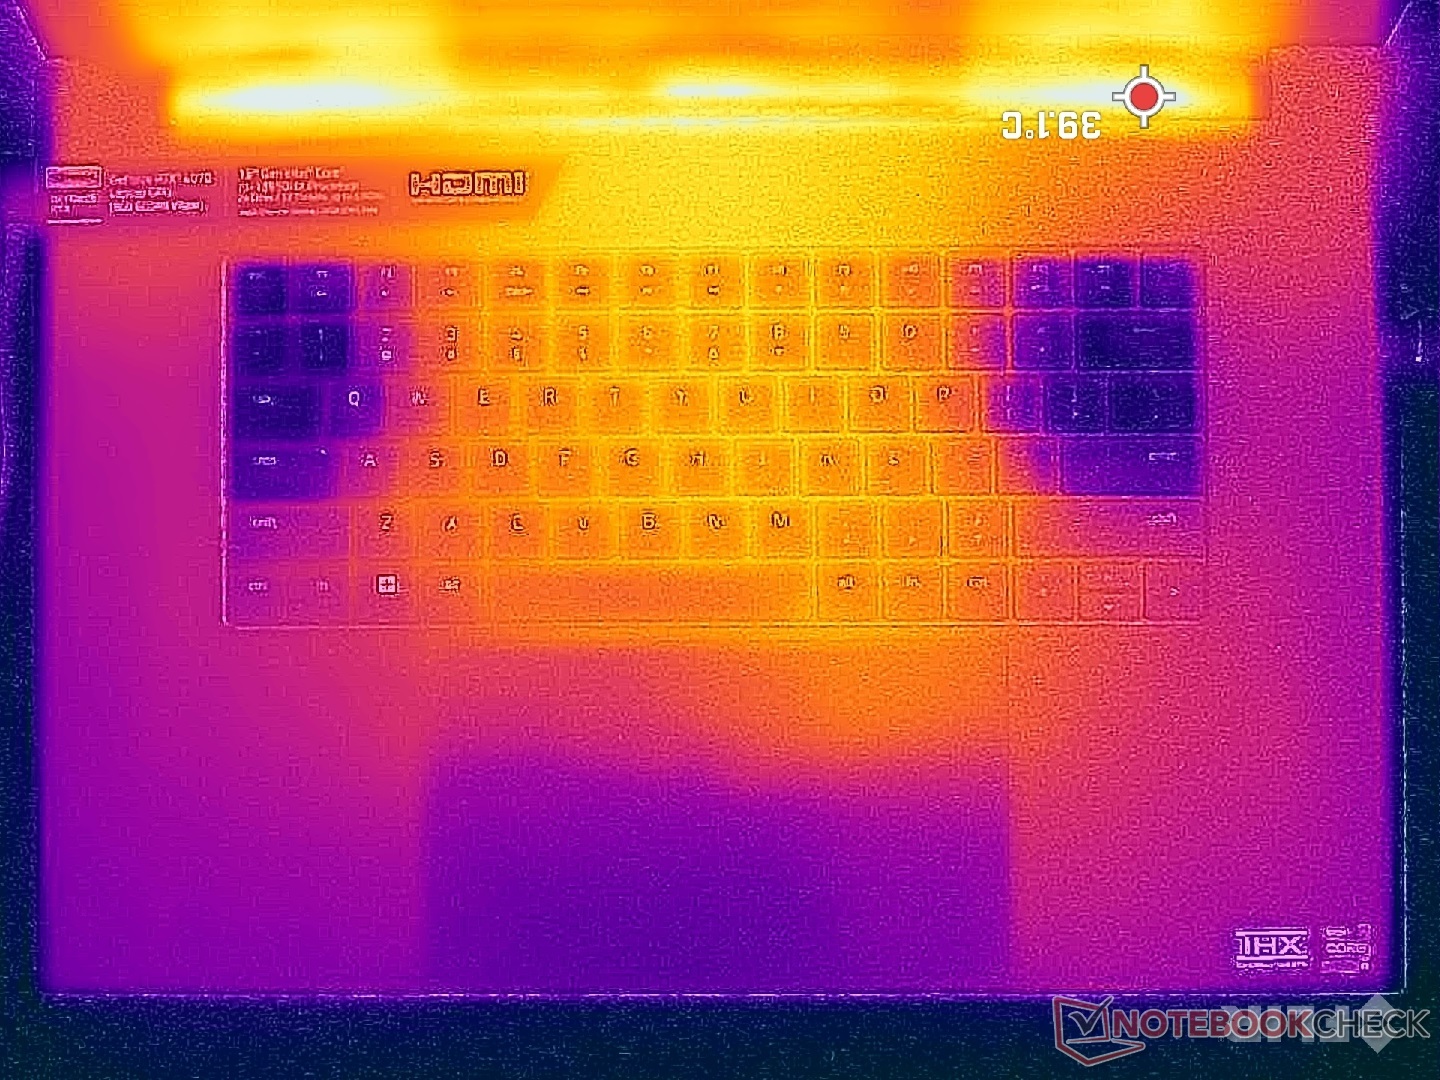
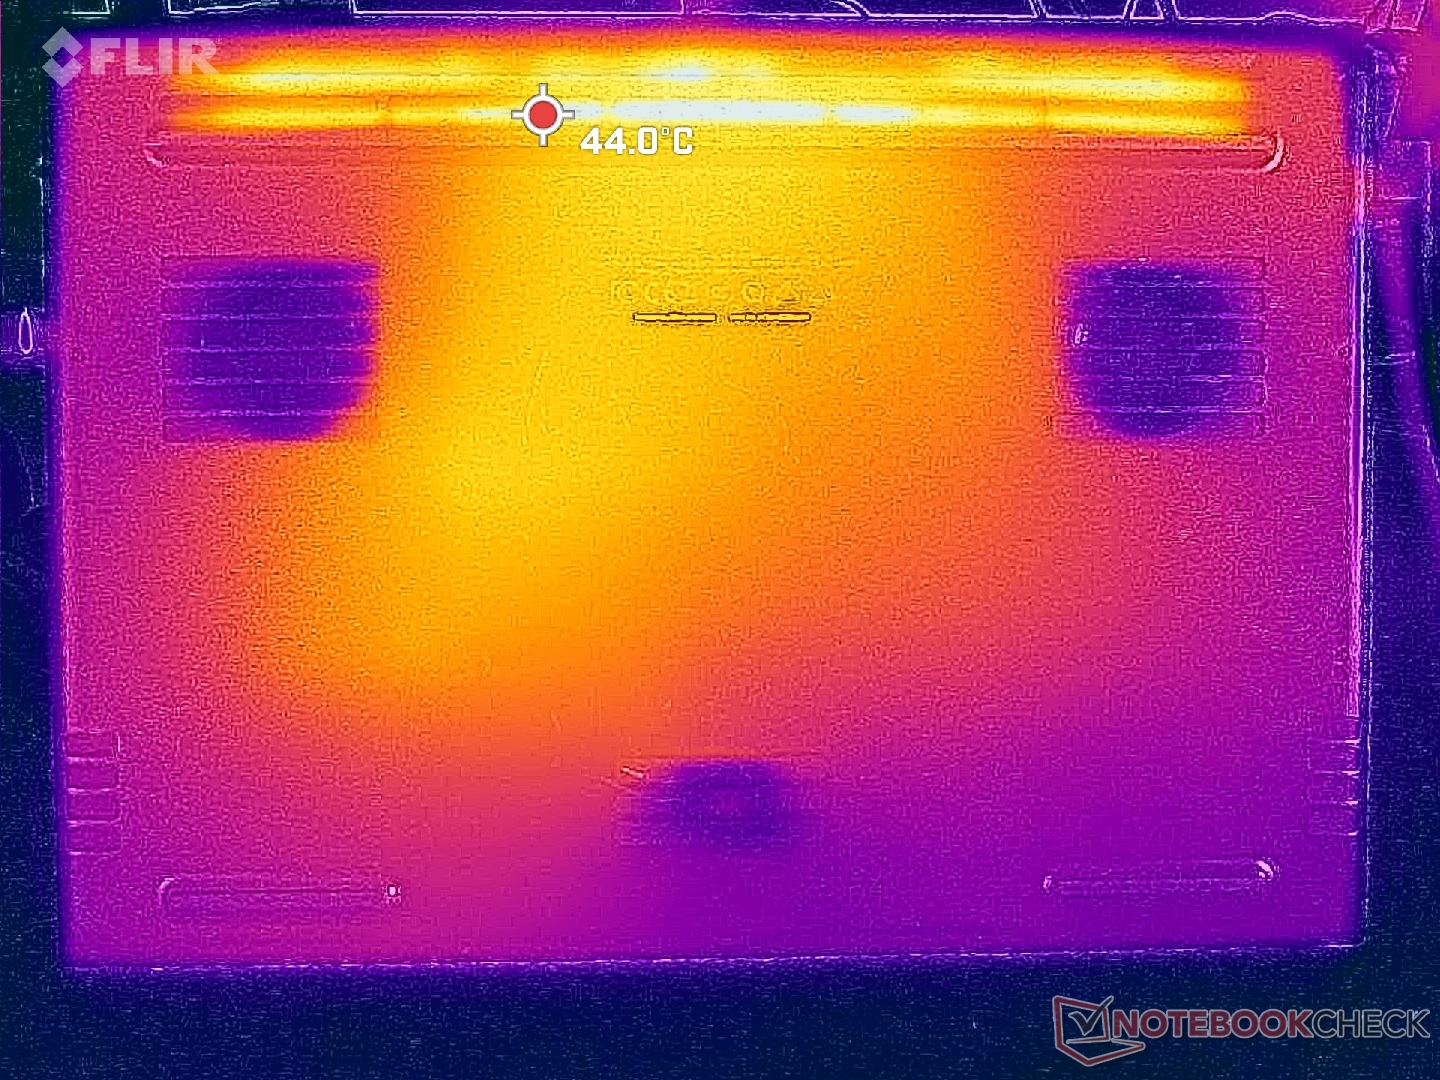
Les températures de surface au ralenti sont légèrement plus élevées que prévu puisque les ventilateurs ont tendance à tourner au ralenti pendant les faibles charges. Le Blade 18 ne devient jamais inconfortable pour la peau tant que le bord arrière est bien ventilé.
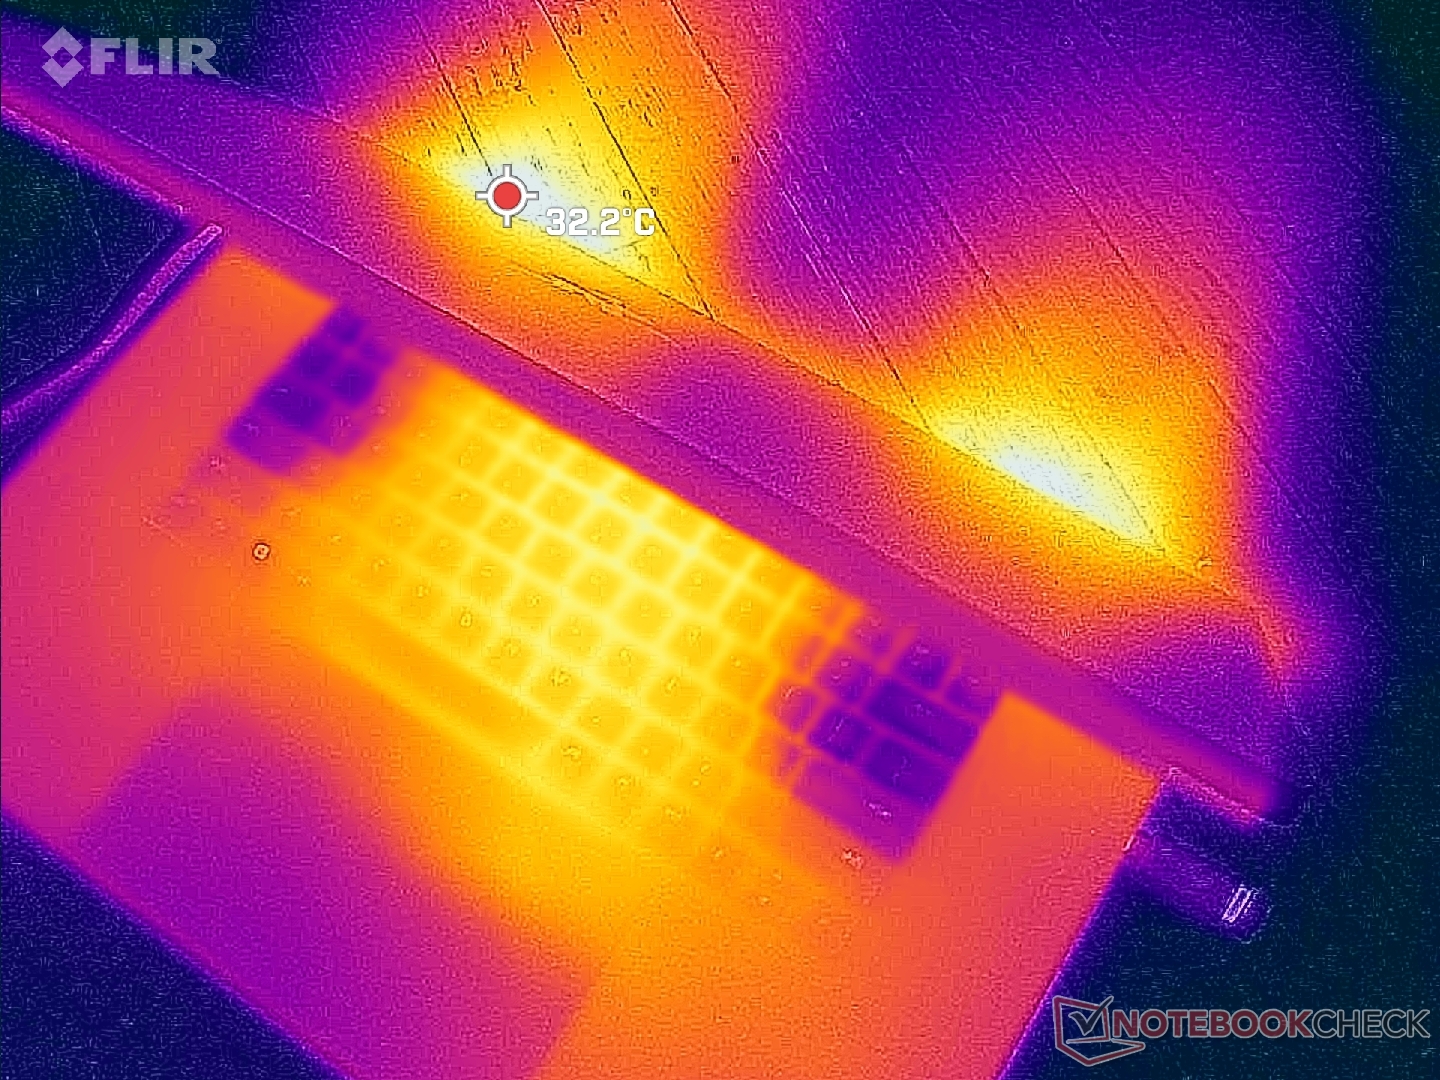
(+) La température maximale du côté supérieur est de 39.2 °C / 103 F, par rapport à la moyenne de 40.4 °C / 105 F, allant de 21.2 à 68.8 °C pour la classe Gaming.
(+) Le fond chauffe jusqu'à un maximum de 35.6 °C / 96 F, contre une moyenne de 43.2 °C / 110 F
(+) En utilisation inactive, la température moyenne du côté supérieur est de 28.1 °C / 83 F, par rapport à la moyenne du dispositif de 33.9 °C / 93 F.
(+) En jouant à The Witcher 3, la température moyenne du côté supérieur est de 28.9 °C / 84 F, alors que la moyenne de l'appareil est de 33.9 °C / 93 F.
(+) Les repose-poignets et le pavé tactile sont plus froids que la température de la peau avec un maximum de 26 °C / 78.8 F et sont donc froids au toucher.
(+) La température moyenne de la zone de l'appui-paume de dispositifs similaires était de 28.8 °C / 83.8 F (+2.8 °C / #5 F).
| Razer Blade 18 RTX 4070 Intel Core i9-13950HX, NVIDIA GeForce RTX 4070 Laptop GPU | Razer Blade 17 Early 2022 Intel Core i9-12900H, NVIDIA GeForce RTX 3080 Ti Laptop GPU | MSI Titan GT77 HX 13VI Intel Core i9-13950HX, NVIDIA GeForce RTX 4090 Laptop GPU | Gigabyte G7 KE Intel Core i5-12500H, NVIDIA GeForce RTX 3060 Laptop GPU | Alienware m17 R5 (R9 6900HX, RX 6850M XT) AMD Ryzen 9 6900HX, AMD Radeon RX 6850M XT | Asus ROG Strix Scar 17 SE G733CX-LL014W Intel Core i9-12950HX, NVIDIA GeForce RTX 3080 Ti Laptop GPU | |
|---|---|---|---|---|---|---|
| Heat | -28% | 2% | -17% | -18% | -18% | |
| Maximum Upper Side * (°C) | 39.2 | 50 -28% | 40.6 -4% | 52 -33% | 53 -35% | 48.8 -24% |
| Maximum Bottom * (°C) | 35.6 | 56 -57% | 41.1 -15% | 54 -52% | 56 -57% | 52.4 -47% |
| Idle Upper Side * (°C) | 31.8 | 36 -13% | 26.2 18% | 28 12% | 30 6% | 30.4 4% |
| Idle Bottom * (°C) | 33.2 | 38 -14% | 30.3 9% | 32 4% | 29 13% | 34.1 -3% |
* ... Moindre est la valeur, meilleures sont les performances
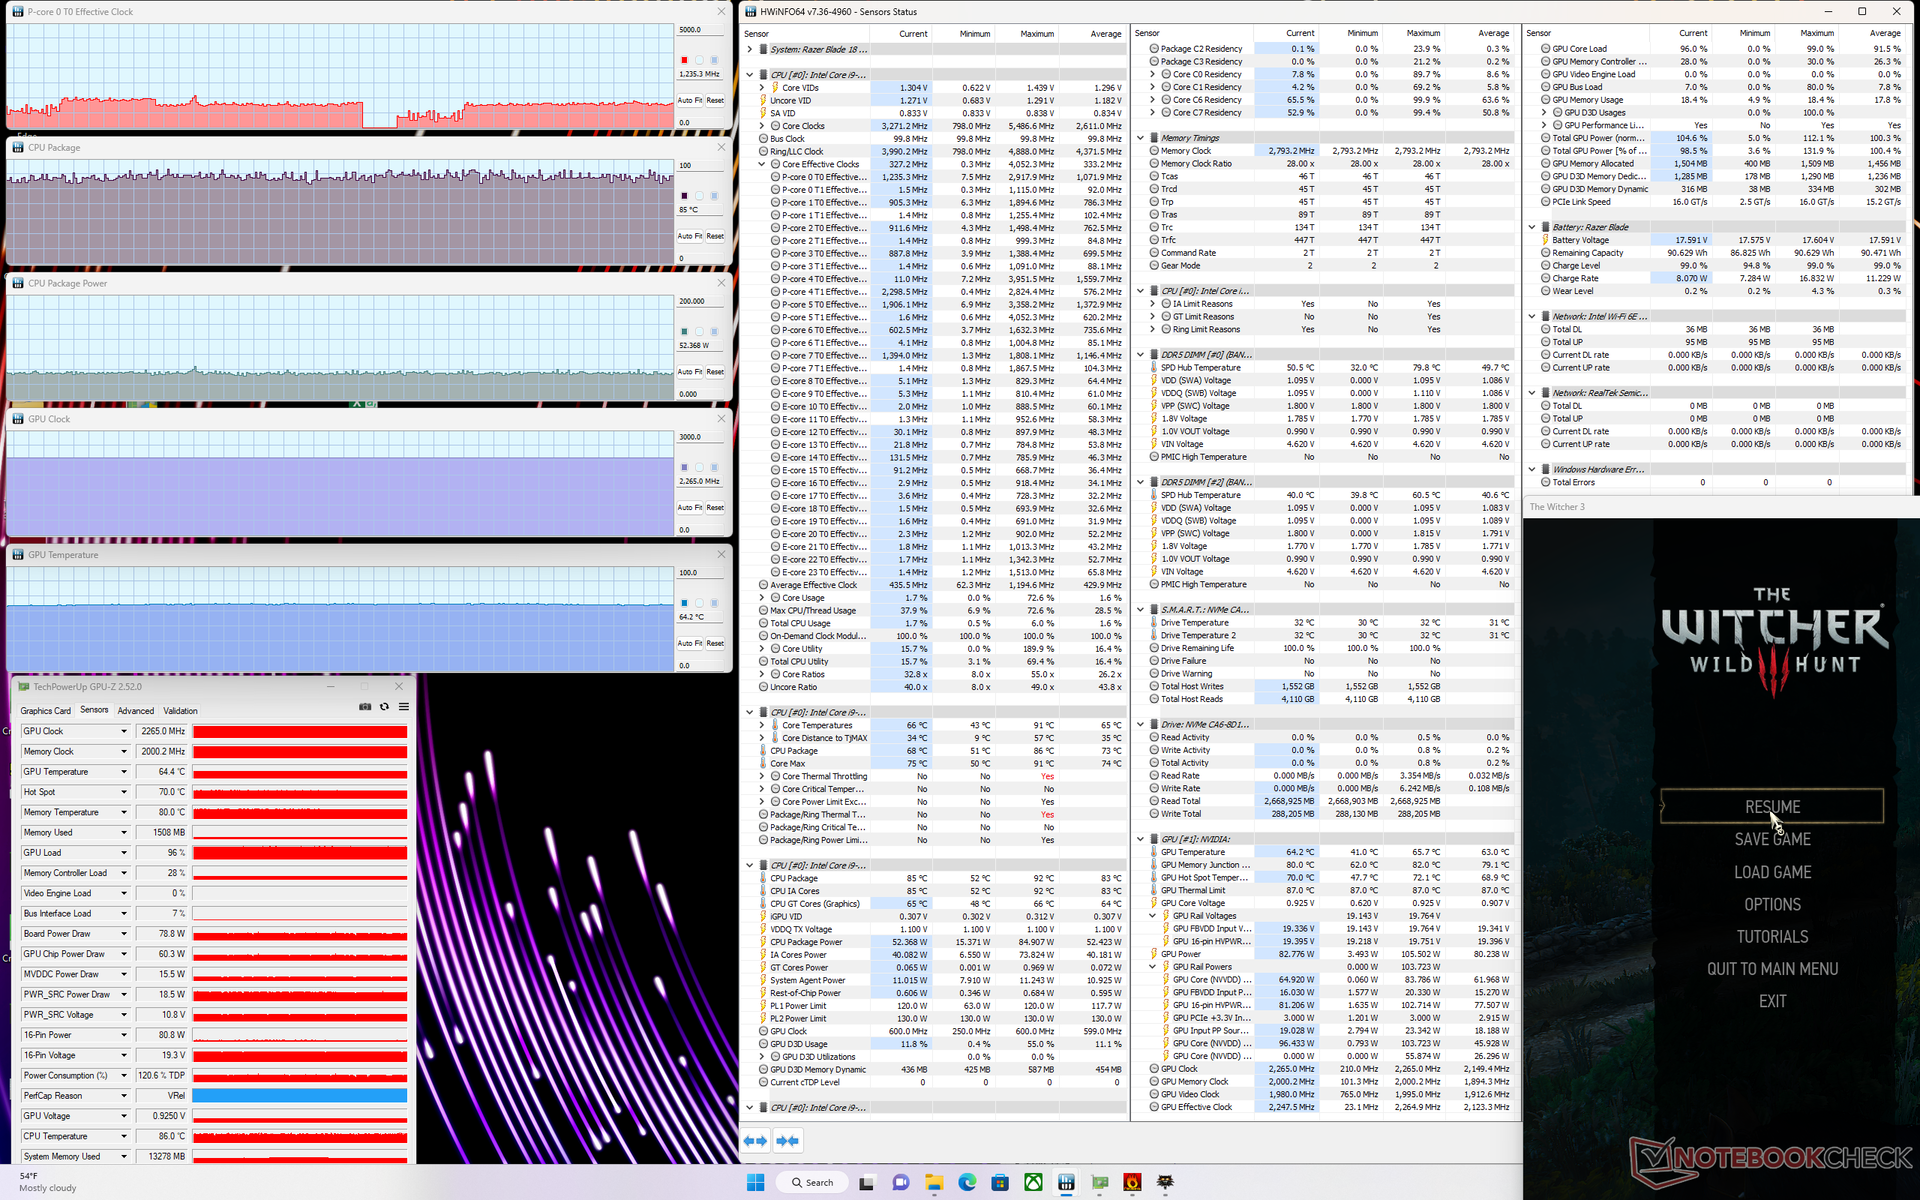
Test de stress
Lors de l'exécution de Prime95 pour solliciter le processeur, les fréquences d'horloge et la consommation d'énergie de la carte atteignaient respectivement 3,8 GHz et 140 W, avant de retomber à 3,1 GHz et dans la fourchette de 110 à 120 W environ 70 secondes plus tard. La température du cœur se stabilise à 87 °C, contre 82 °C sur la Blade 16 équipée du même CPU.
La fréquence d'horloge, la température et la consommation d'énergie du GPU se stabiliseraient à 2265 MHz, 64 C et 80 à 90 W, respectivement, lors de l'utilisation de l'ordinateur Witcher 3. Le GPU lui-même est évalué pour un TGP de 140 W et donc la fourchette de ~80 W est beaucoup plus basse que prévu, même lorsqu'il est réglé sur le mode Performance. Nous ne sommes capables d'atteindre un pic de 100 W pour le GPU qu'en exécutant un jeu plus exigeant comme Cyberpunk 2077. En comparaison, le GPU RTX 4080 de la Blade 16 se stabilise à ~160 W par rapport à son objectif de 175 W TGP lors du même test Witcher 3 test.
Le fonctionnement sur batterie limite les performances. Un test 3DMark 11 sur batterie donnerait des scores de physique et de graphisme de 10336 et 18043 points, respectivement, contre 25874 et 39733 points sur secteur.
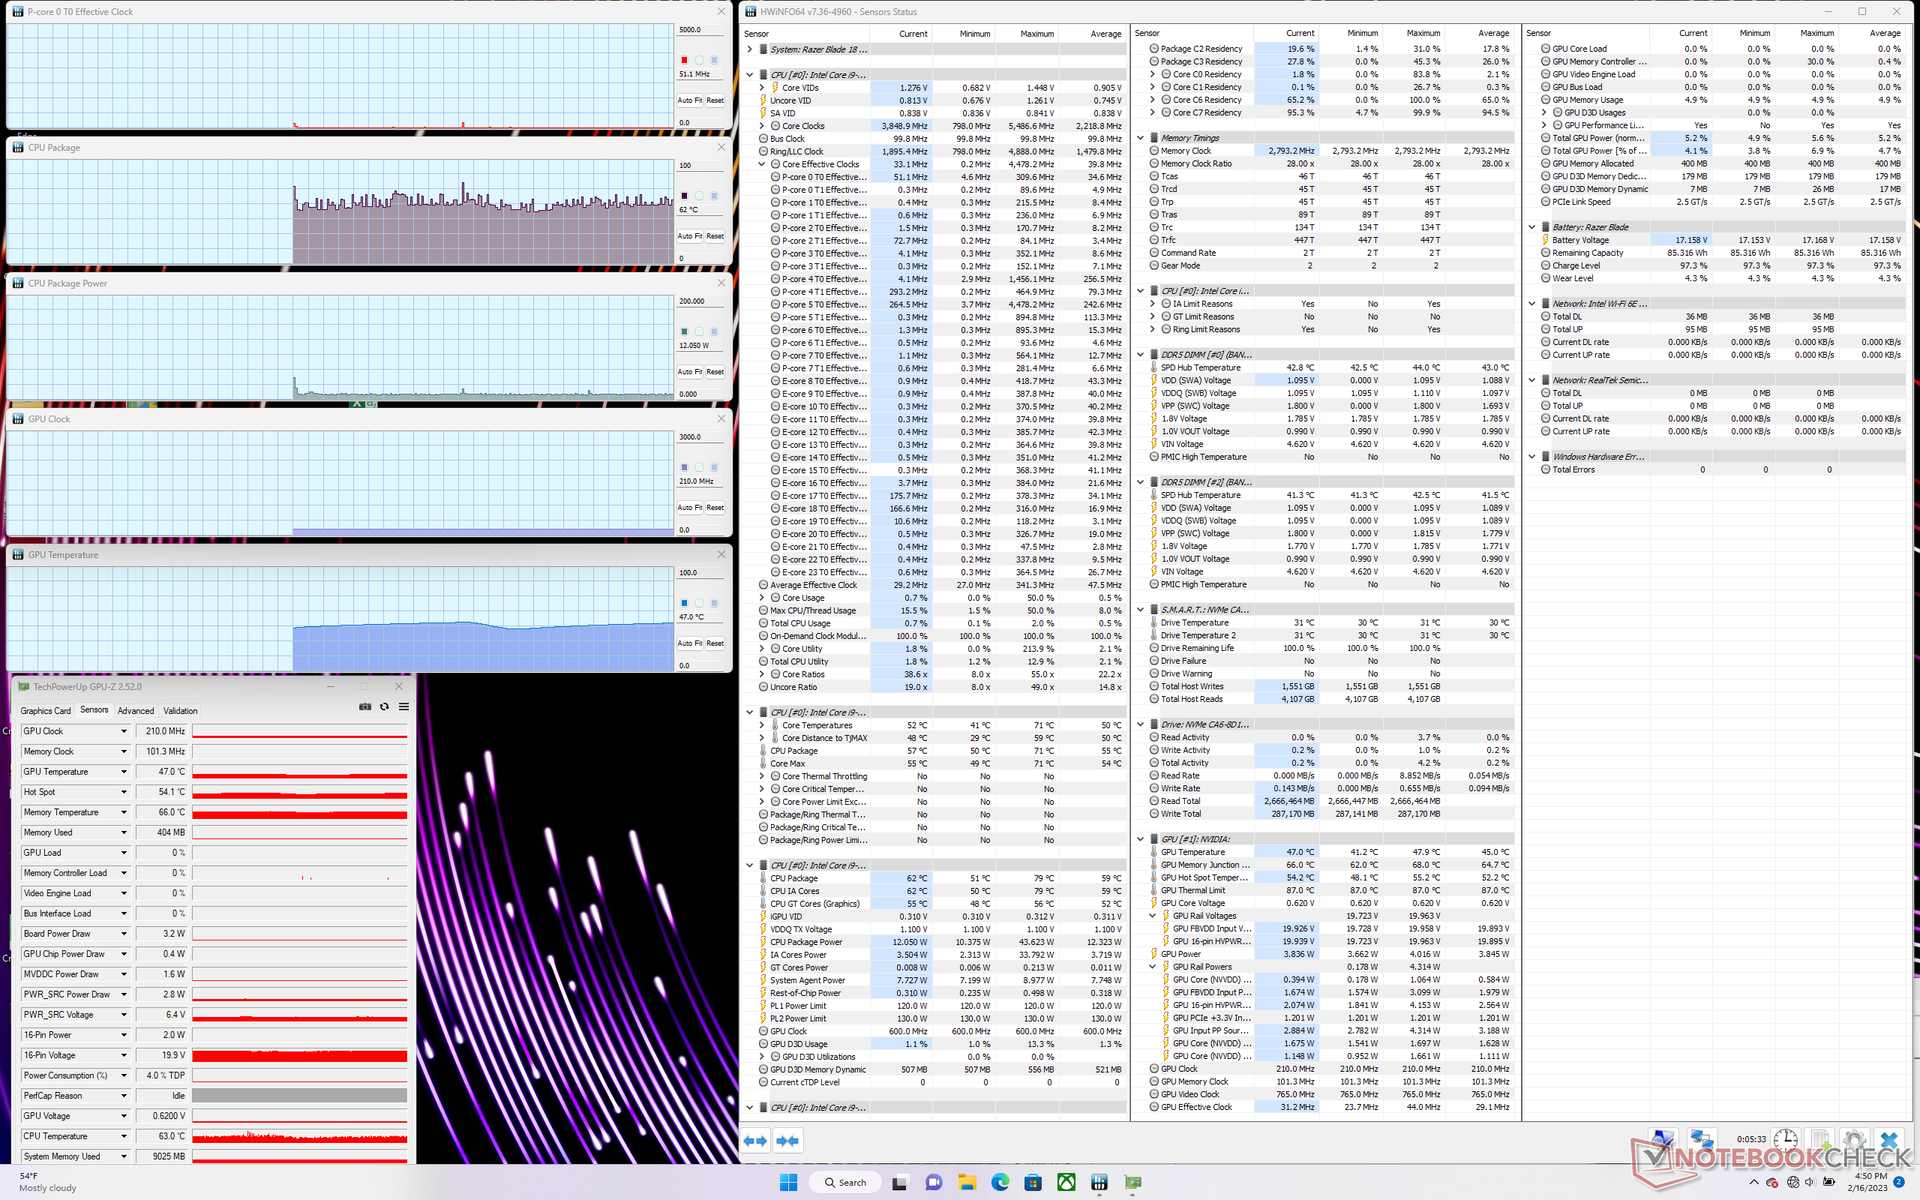
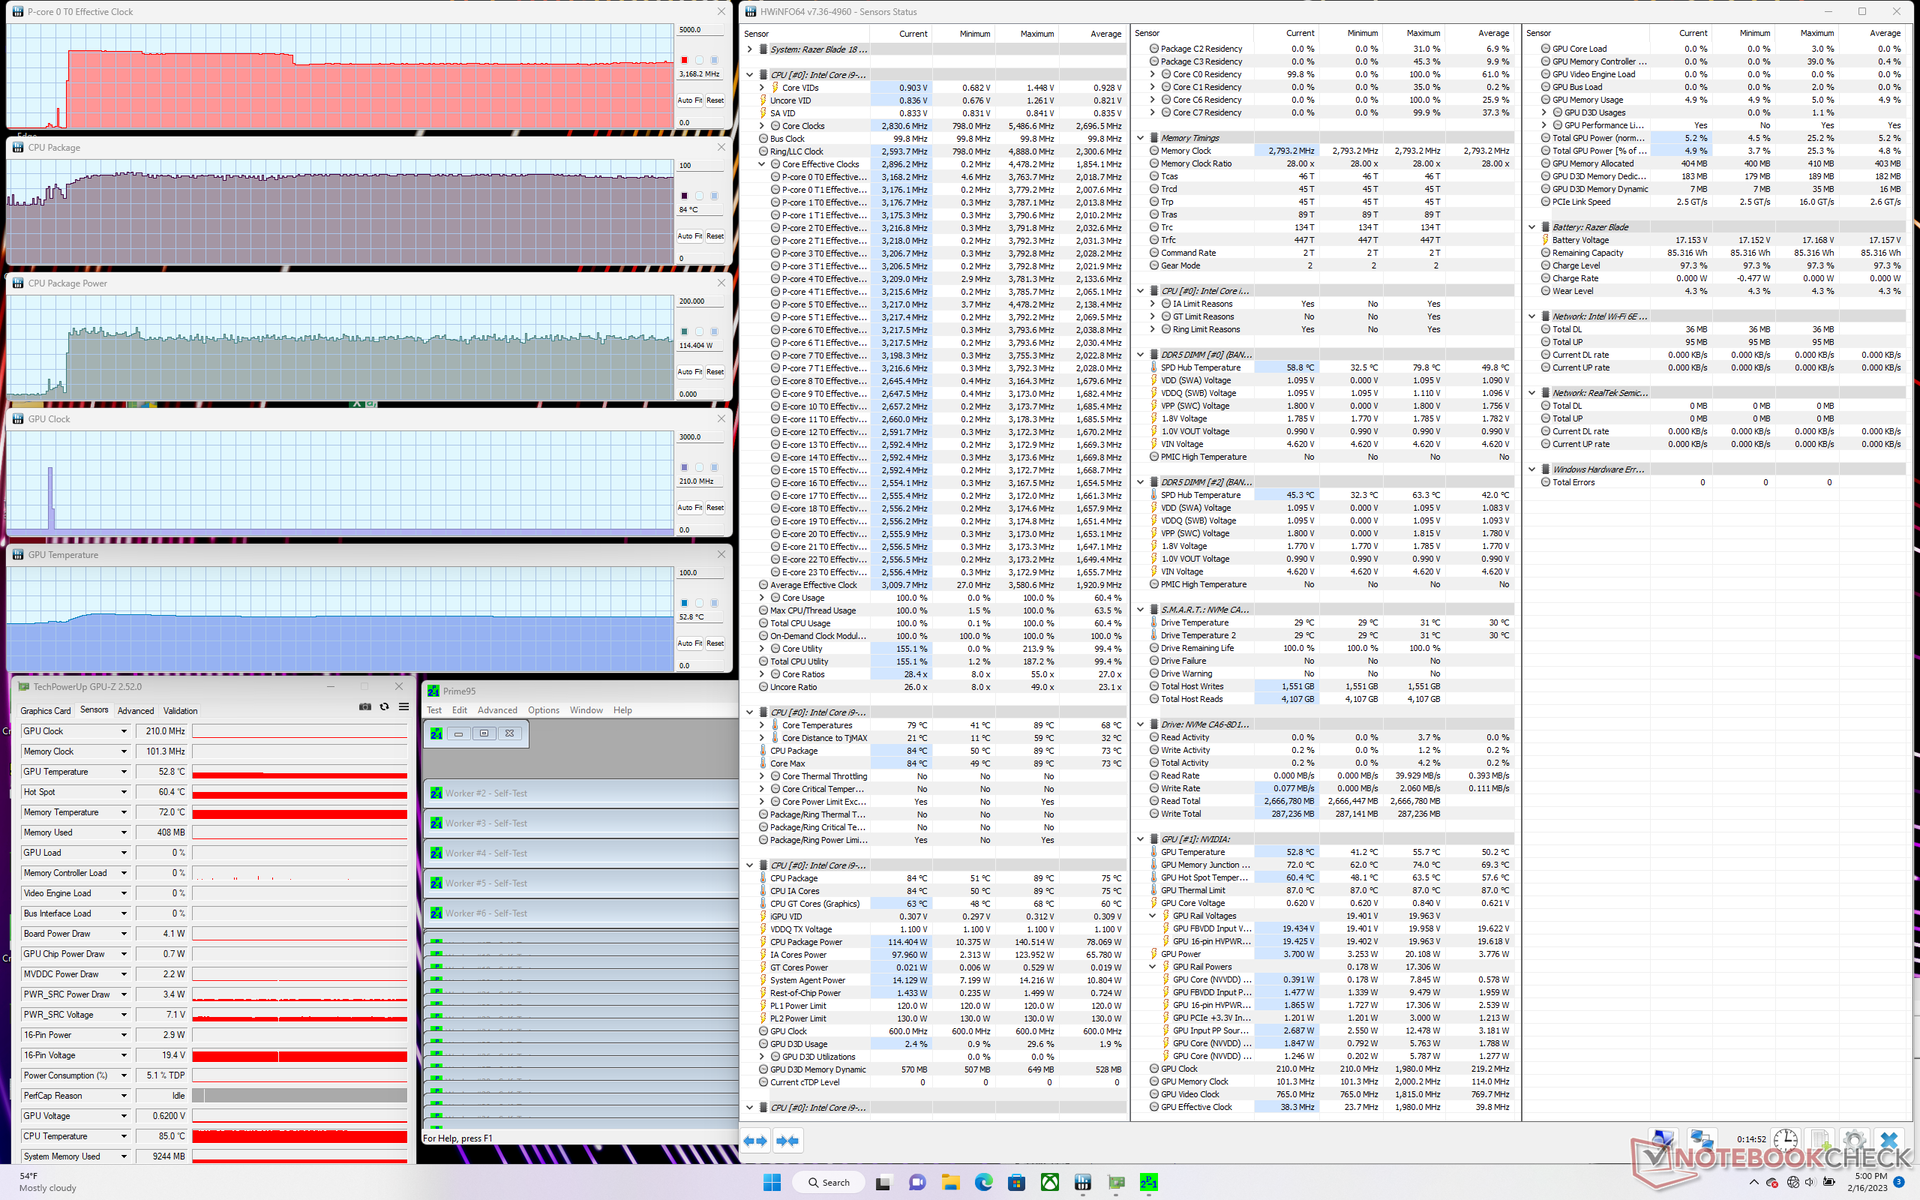
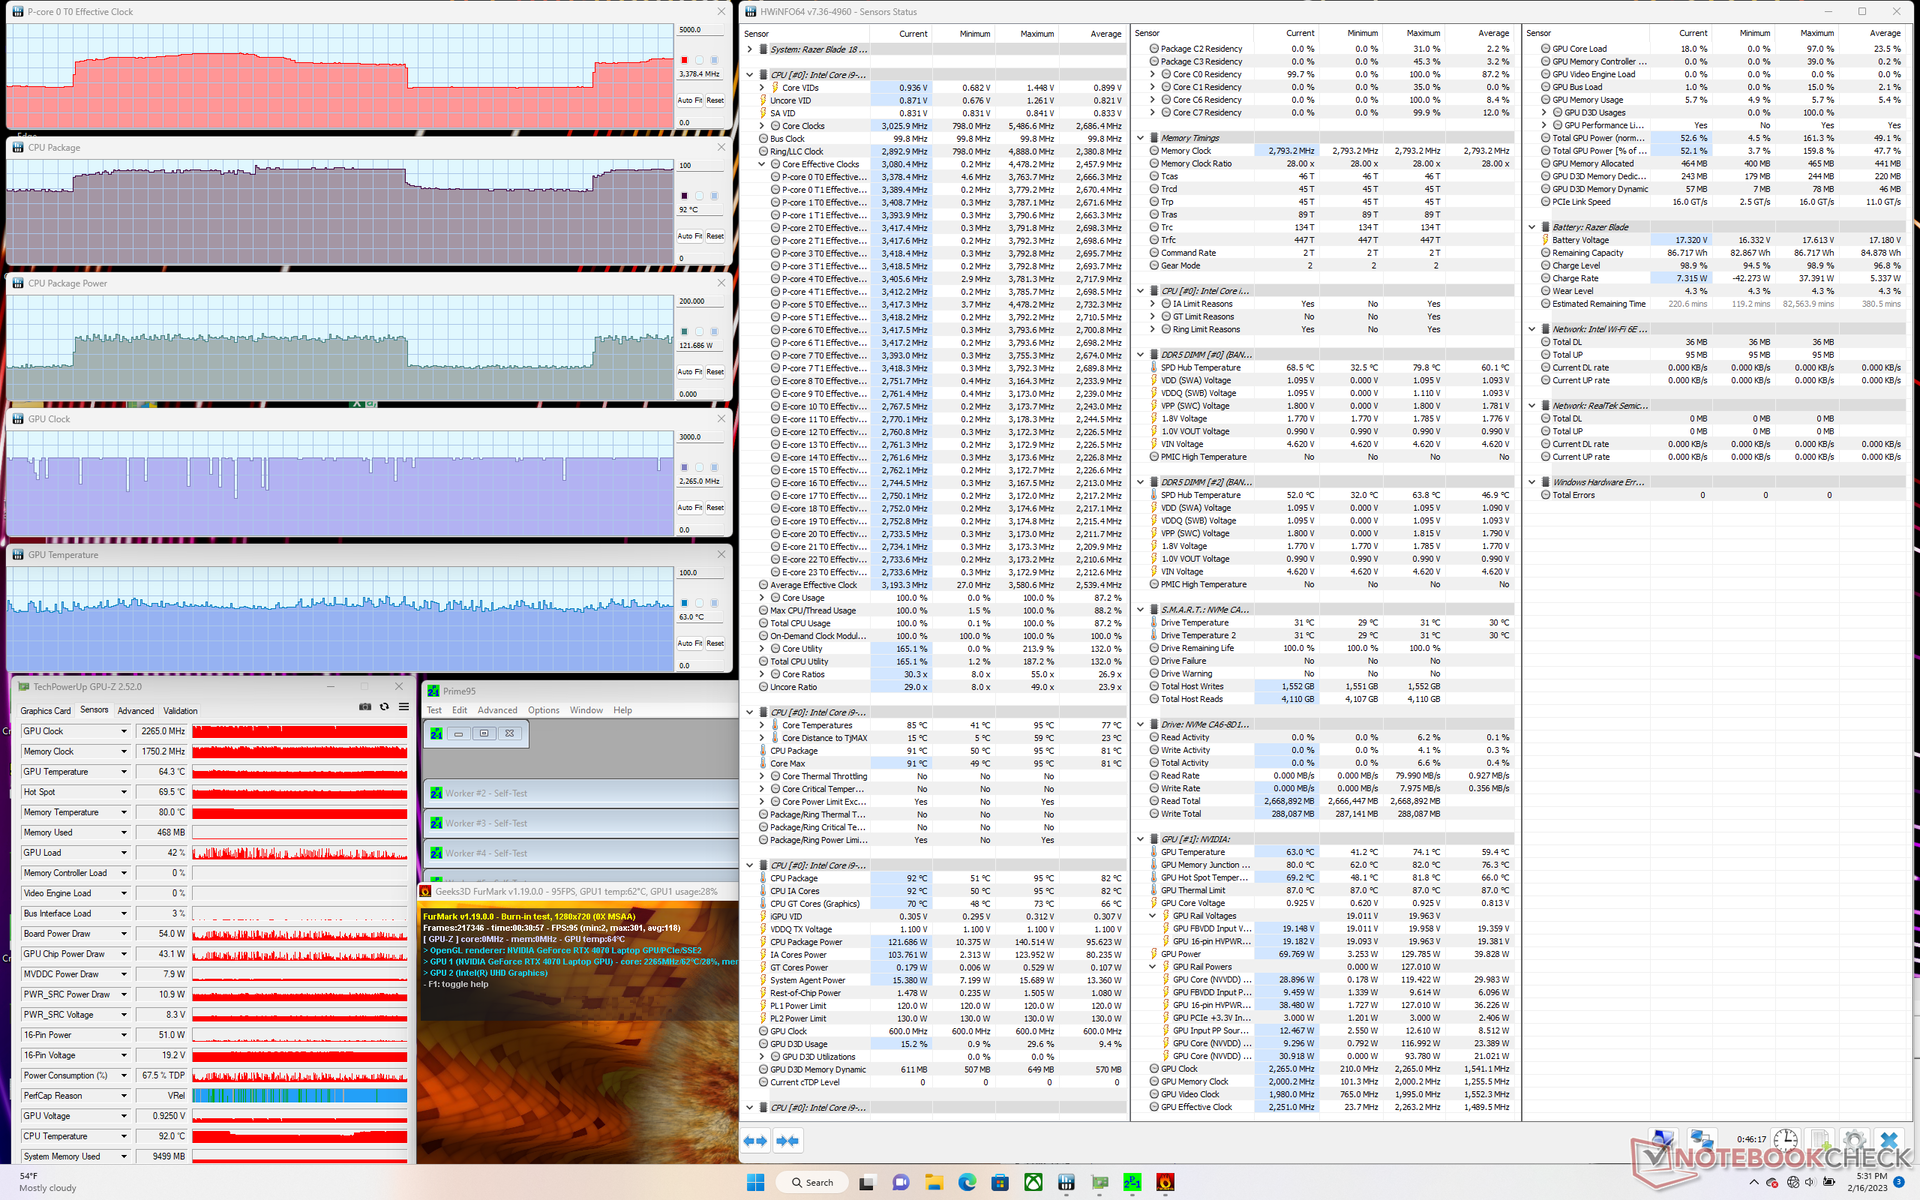
| Fréquence CPU (GHz) | Fréquence GPU (MHz) | Température CPU moyenne (°C) | Température GPU moyenne (°C) | |
| Système au repos | -- | -- | 62 | 47 |
| Prime95 Stress | 3.2 | -- | 84 | 53 |
| Prime95 + FurMark Stress | 2.0 - 3.7 | 2265 | 70 - 91 | 63 |
| Witcher 3 Stress | ~1.2 | 2265 | 85 | 64 |
Haut-parleurs
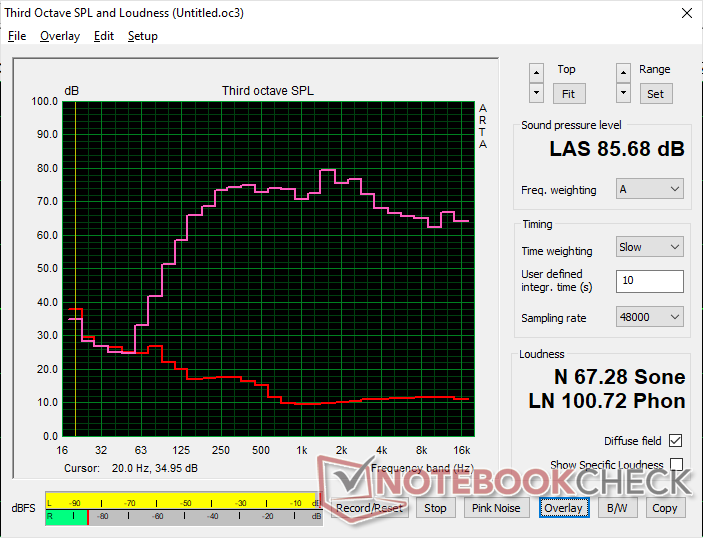
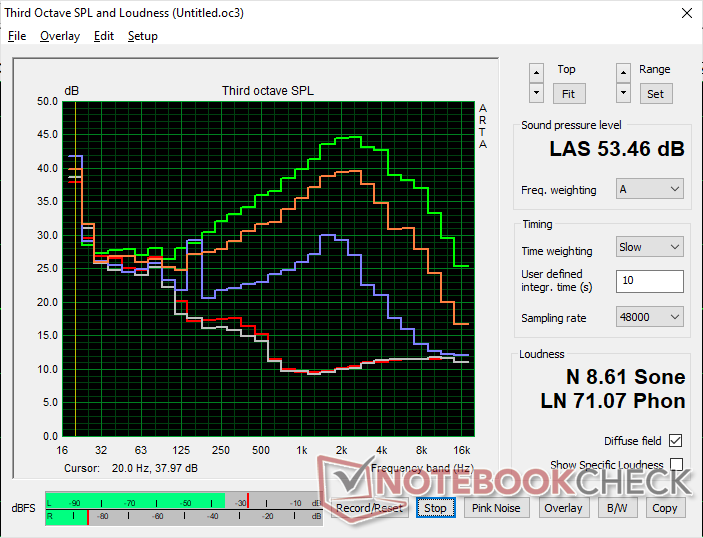
Razer Blade 18 RTX 4070 analyse audio
(+) | les haut-parleurs peuvent jouer relativement fort (85.7# dB)
Basses 100 - 315 Hz
(±) | basse réduite - en moyenne 7.5% inférieure à la médiane
(±) | la linéarité des basses est moyenne (9.2% delta à la fréquence précédente)
Médiums 400 - 2000 Hz
(+) | médiane équilibrée - seulement 3.5% de la médiane
(+) | les médiums sont linéaires (4.1% delta à la fréquence précédente)
Aiguës 2 - 16 kHz
(+) | des sommets équilibrés - à seulement 4.8% de la médiane
(+) | les aigus sont linéaires (3.8% delta à la fréquence précédente)
Globalement 100 - 16 000 Hz
(+) | le son global est linéaire (9.2% différence à la médiane)
Par rapport à la même classe
» 3% de tous les appareils testés de cette catégorie étaient meilleurs, 1% similaires, 96% pires
» Le meilleur avait un delta de 6%, la moyenne était de 18%, le pire était de 132%.
Par rapport à tous les appareils testés
» 3% de tous les appareils testés étaient meilleurs, 1% similaires, 96% pires
» Le meilleur avait un delta de 4%, la moyenne était de 23%, le pire était de 134%.
Apple MacBook Pro 16 2021 M1 Pro analyse audio
(+) | les haut-parleurs peuvent jouer relativement fort (84.7# dB)
Basses 100 - 315 Hz
(+) | bonne basse - seulement 3.8% loin de la médiane
(+) | les basses sont linéaires (5.2% delta à la fréquence précédente)
Médiums 400 - 2000 Hz
(+) | médiane équilibrée - seulement 1.3% de la médiane
(+) | les médiums sont linéaires (2.1% delta à la fréquence précédente)
Aiguës 2 - 16 kHz
(+) | des sommets équilibrés - à seulement 1.9% de la médiane
(+) | les aigus sont linéaires (2.7% delta à la fréquence précédente)
Globalement 100 - 16 000 Hz
(+) | le son global est linéaire (4.6% différence à la médiane)
Par rapport à la même classe
» 0% de tous les appareils testés de cette catégorie étaient meilleurs, 0% similaires, 100% pires
» Le meilleur avait un delta de 5%, la moyenne était de 17%, le pire était de 45%.
Par rapport à tous les appareils testés
» 0% de tous les appareils testés étaient meilleurs, 0% similaires, 100% pires
» Le meilleur avait un delta de 4%, la moyenne était de 23%, le pire était de 134%.
Gestion de l'énergie - Grand écran, grande demande d'énergie
Consommation d'énergie
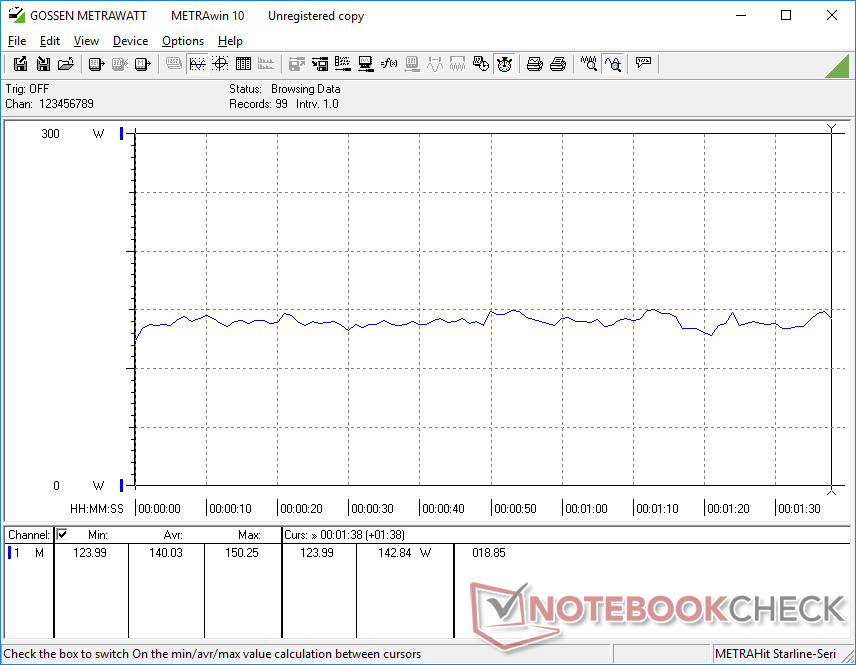
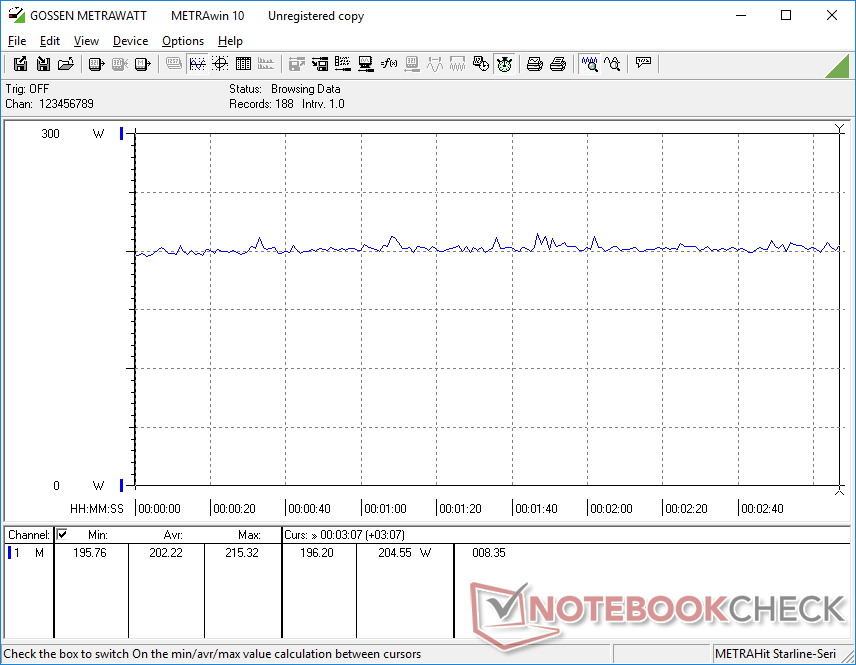
La consommation d'énergie en mode veille sur le bureau varie entre 24 W et 48 W selon le réglage de la luminosité et le profil d'alimentation. En fait, la différence entre les réglages de luminosité minimum et maximum peut atteindre 10 W. Cette fourchette est sensiblement plus élevée que sur la plupart des autres ordinateurs portables plus petits, ce qui peut expliquer les résultats non exceptionnels de l'autonomie de la batterie dans la section suivante.
Lors de l'exécution Witcher 3 pour représenter des charges de jeu typiques, le système aurait besoin d'une moyenne de 202 W par rapport à 229 W ou 225 W sur le Blade 17 équipé de RTX 3080 Ti ou sur l'Asus ROG Strix Scar 17.Asus ROG Strix Scar 17 SErespectivement. Ainsi, notre système de 18 pouces équipé de la RTX 4070 consomme environ 10 % moins d'énergie tout en offrant presque les mêmes performances graphiques que la dernière génération de RTX 3080 Ti mobile. Si vous passez à la configuration RTX 4080 ou RTX 4090, vous consommerez probablement 40 à 50 W de plus, comme nous l'avons observé sur la Blade 16.
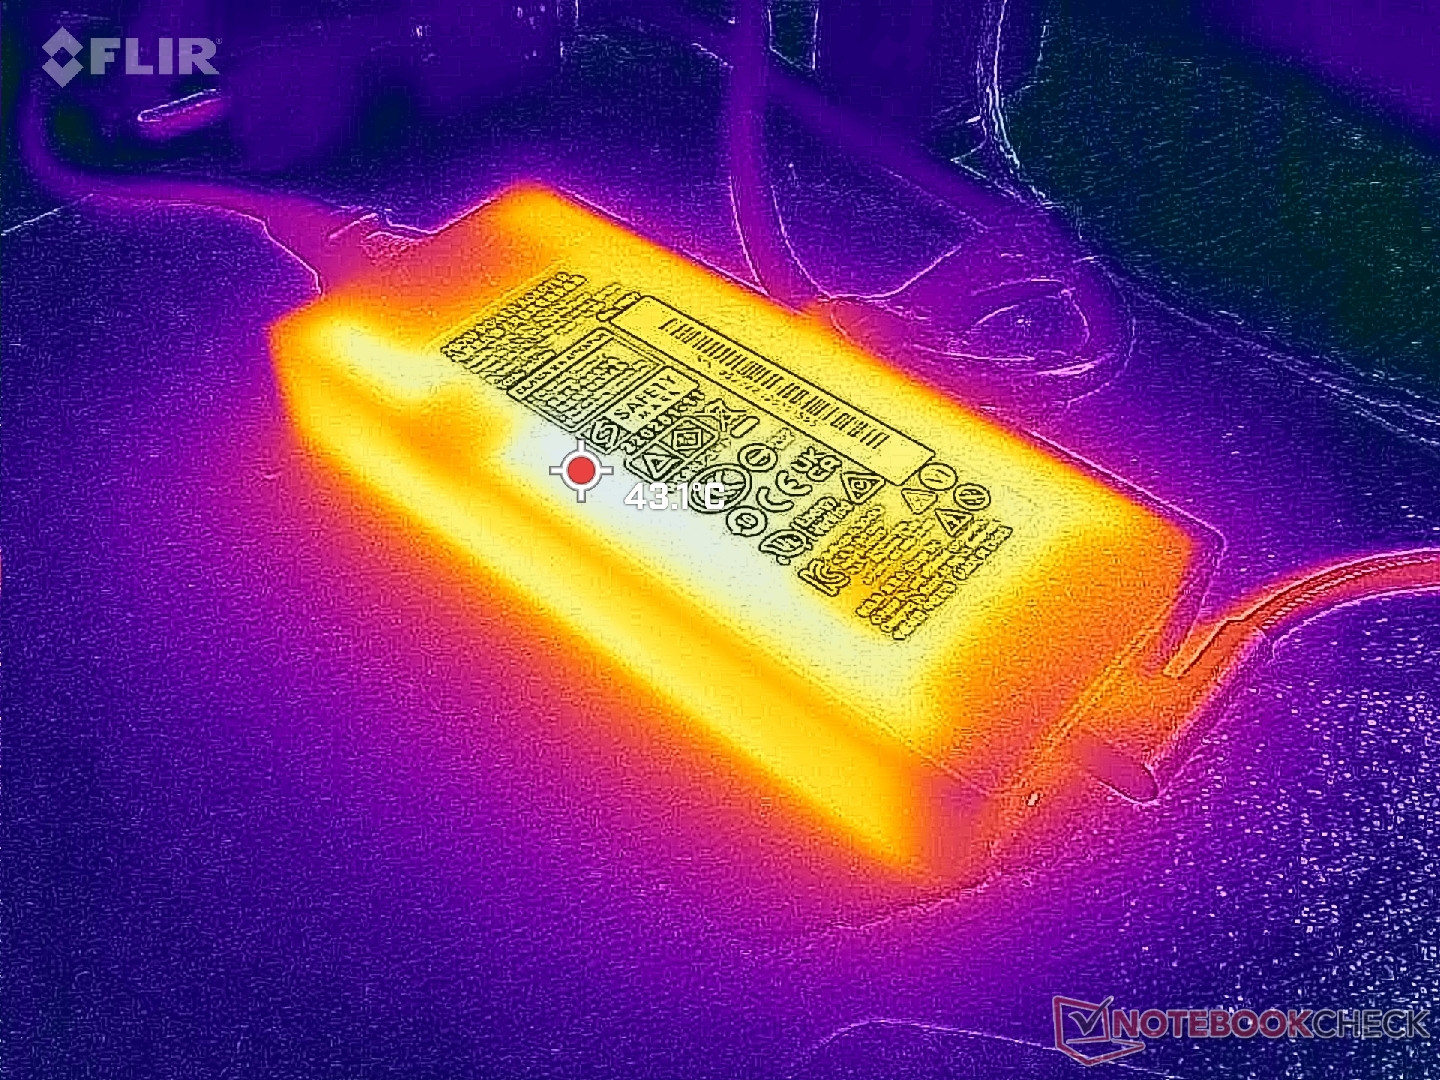
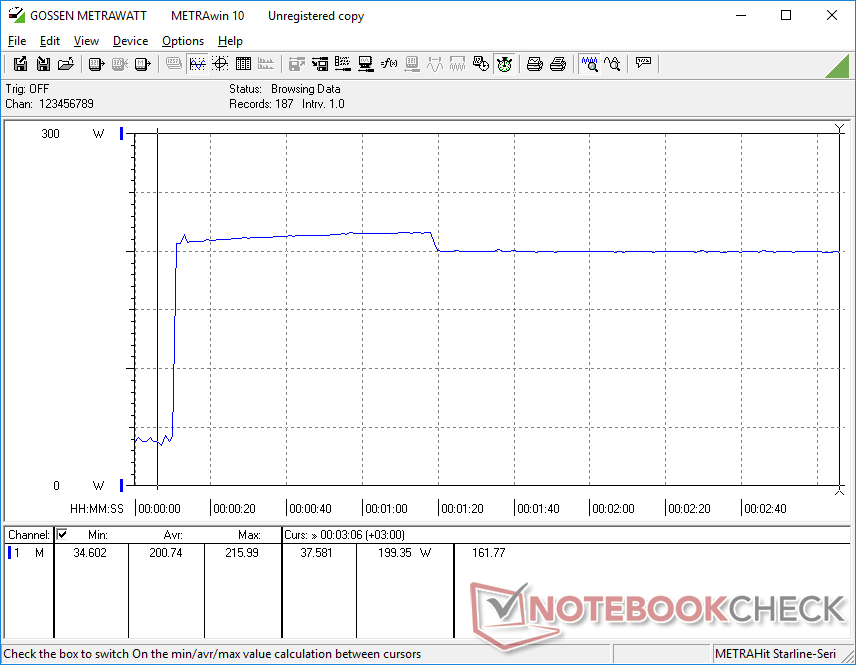
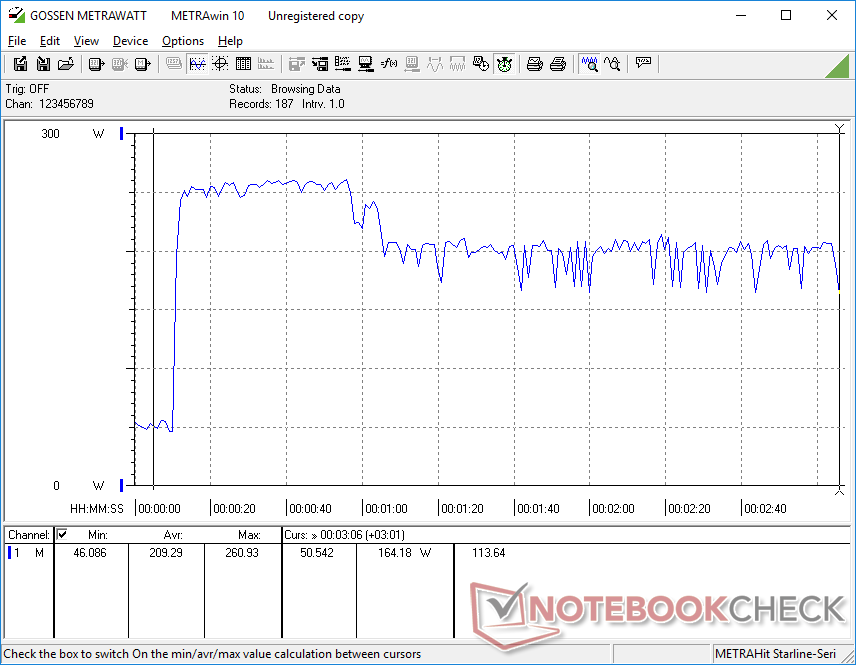
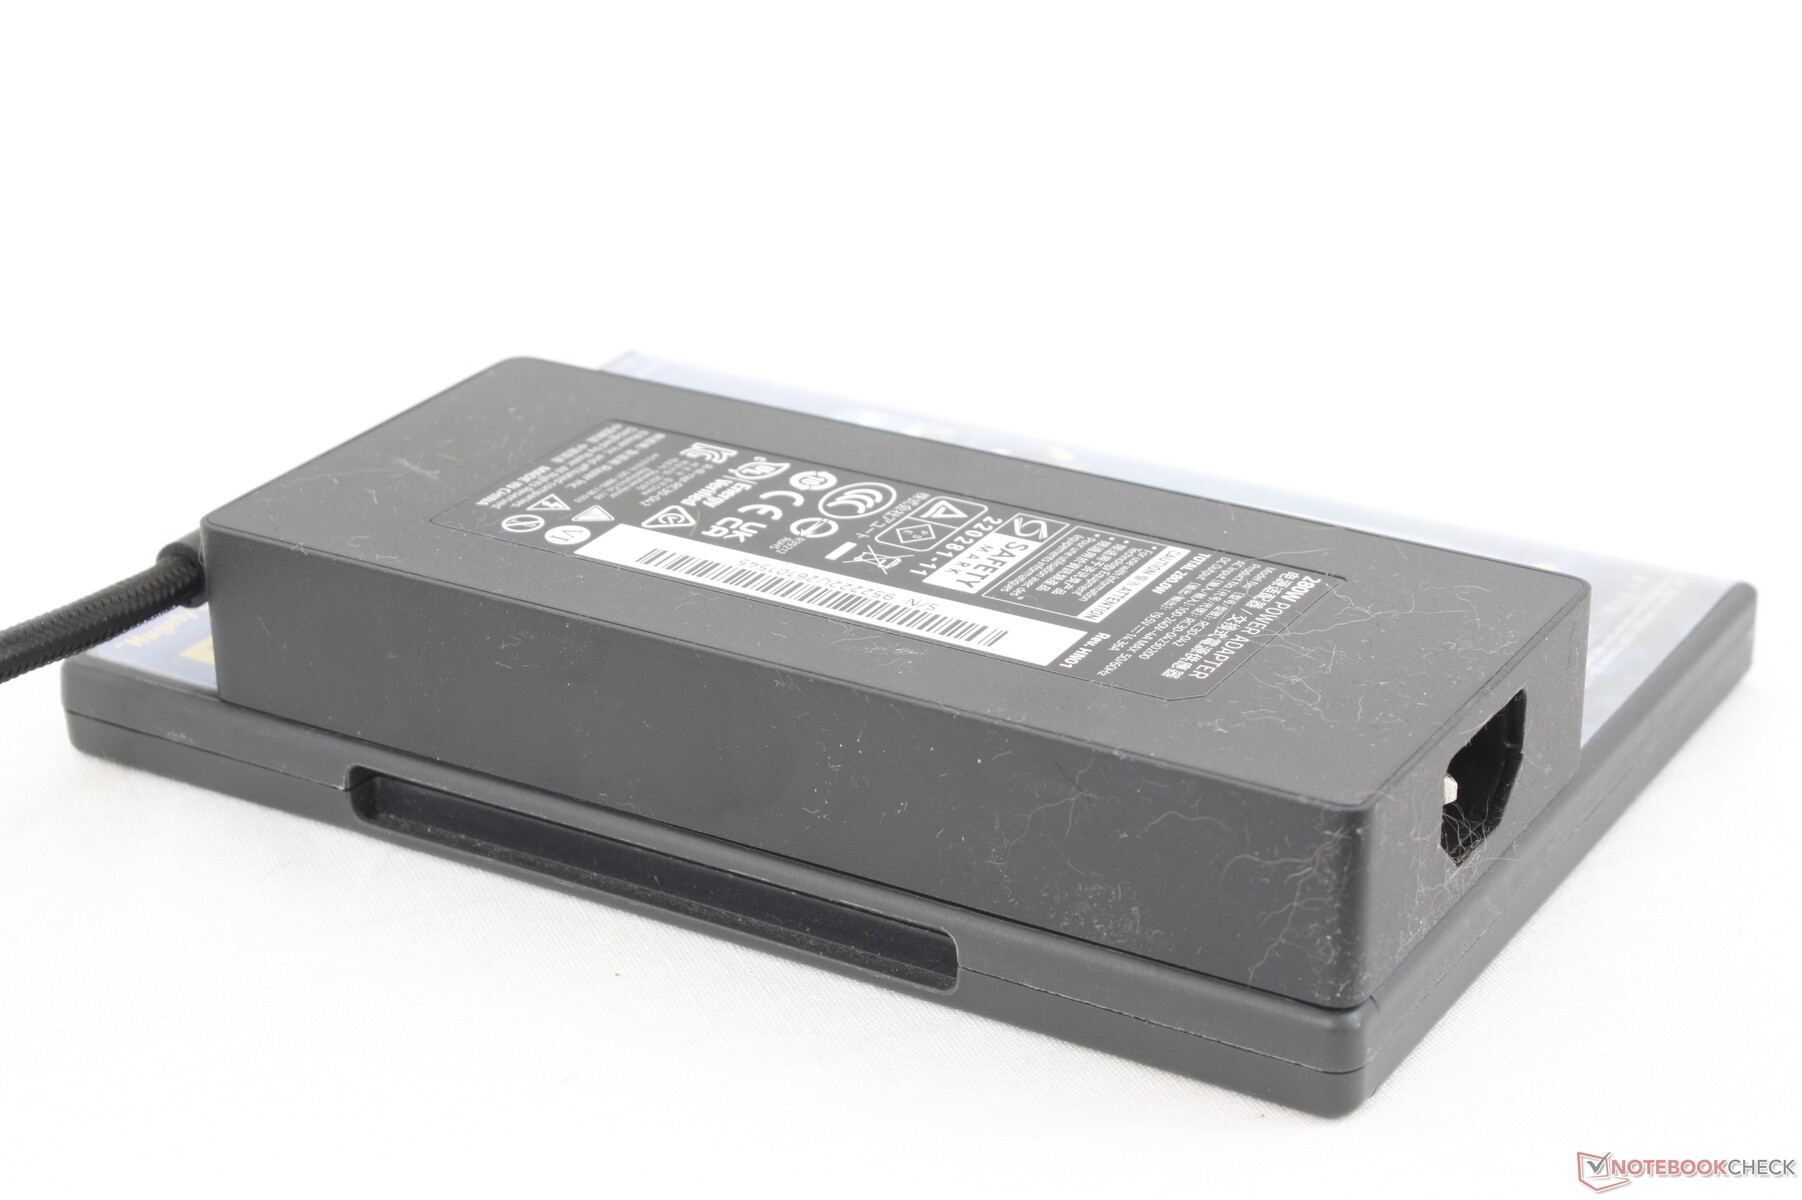
Nous avons pu enregistrer une consommation maximale temporaire de 261 W de l'adaptateur secteur GaN 280 W de petite taille (~16,3 x 7 x 2,5 cm) lors de l'exécution simultanée de Prime95 et FurMark. Gardez à l'esprit qu'il y a deux adaptateurs AC différents selon la configuration : un petit adaptateur de 280 W pour les RTX 4060 et 4070 SKUs et un plus grand adaptateur de 330 W pour les RTX 4080 et 4090 SKUs.
| Éteint/en veille | |
| Au repos | |
| Fortement sollicité |
|
Légende:
min: | |
| Razer Blade 18 RTX 4070 i9-13950HX, GeForce RTX 4070 Laptop GPU, SSSTC CA6-8D1024, IPS, 2560x1600, 18" | Razer Blade 17 Early 2022 i9-12900H, GeForce RTX 3080 Ti Laptop GPU, Samsung PM9A1 MZVL21T0HCLR, IPS, 3840x2160, 17.3" | MSI Titan GT77 HX 13VI i9-13950HX, GeForce RTX 4090 Laptop GPU, Samsung PM9A1 MZVL22T0HBLB, Mini-LED, 3840x2160, 17.3" | Gigabyte G7 KE i5-12500H, GeForce RTX 3060 Laptop GPU, Gigabyte AG470S1TB-SI B10, IPS, 1920x1080, 17.3" | Alienware m17 R5 (R9 6900HX, RX 6850M XT) R9 6900HX, Radeon RX 6850M XT, SSSTC CA6-8D1024, IPS, 3840x2160, 17" | Asus ROG Strix Scar 17 SE G733CX-LL014W i9-12950HX, GeForce RTX 3080 Ti Laptop GPU, Samsung PM9A1 MZVL22T0HBLB, IPS, 2560x1440, 17.3" | |
|---|---|---|---|---|---|---|
| Power Consumption | 17% | 8% | 32% | 31% | 9% | |
| Idle Minimum * (Watt) | 24.5 | 17 31% | 14 43% | 15 39% | 13 47% | 19.3 21% |
| Idle Average * (Watt) | 34.1 | 23 33% | 21.6 37% | 17 50% | 16.5 52% | 26.5 22% |
| Idle Maximum * (Watt) | 47.7 | 34 29% | 24.8 48% | 24 50% | 17 64% | 27.1 43% |
| Load Average * (Watt) | 140 | 120 14% | 122.5 12% | 111 21% | 93 34% | 141 -1% |
| Witcher 3 ultra * (Watt) | 202 | 229 -13% | 265 -31% | 174.1 14% | 239 -18% | 225 -11% |
| Load Maximum * (Watt) | 261 | 243 7% | 418 -60% | 208 20% | 251 4% | 307.9 -18% |
* ... Moindre est la valeur, meilleures sont les performances
Power Consumption Witcher 3 / Stresstest
Power Consumption external Monitor
Autonomie de la batterie
Ce n'est pas une coïncidence si le plus grand modèle Blade dispose également de la plus grande capacité de batterie de la famille, avec 91,7 Wh. Cependant, l'autonomie de la batterie n'est pas nécessairement plus longue, et elle peut même être plus courte dans de nombreux scénarios. Nous sommes en mesure de naviguer sur le Web avec le profil d'alimentation équilibré pendant 4 heures avant de devoir recharger, ce qui représente presque une heure de moins que sur le Blade 15 de l'année dernière. L'abaissement de la fréquence de rafraîchissement de l'écran à 60 Hz au lieu de 240 Hz peut prolonger l'autonomie de la batterie de façon marginale.
Le chargement d'une batterie vide à une batterie pleine prend environ 90 minutes. Les utilisateurs peuvent également charger le système via USB-C, mais à un rythme plus lent.
| Razer Blade 18 RTX 4070 i9-13950HX, GeForce RTX 4070 Laptop GPU, 91.7 Wh | Razer Blade 17 Early 2022 i9-12900H, GeForce RTX 3080 Ti Laptop GPU, 82 Wh | MSI Titan GT77 HX 13VI i9-13950HX, GeForce RTX 4090 Laptop GPU, 99.9 Wh | Gigabyte G7 KE i5-12500H, GeForce RTX 3060 Laptop GPU, 54 Wh | Alienware m17 R5 (R9 6900HX, RX 6850M XT) R9 6900HX, Radeon RX 6850M XT, 97 Wh | Asus ROG Strix Scar 17 SE G733CX-LL014W i9-12950HX, GeForce RTX 3080 Ti Laptop GPU, 90 Wh | |
|---|---|---|---|---|---|---|
| Autonomie de la batterie | 9% | 21% | 11% | 29% | 5% | |
| Reader / Idle (h) | 7 | 7.1 1% | 7.1 1% | |||
| WiFi v1.3 (h) | 4 | 3.8 -5% | 5.3 33% | 5.3 33% | 4.8 20% | 4.2 5% |
| Load (h) | 1.3 | 1.7 31% | 1.4 8% | 1.3 0% | 1.8 38% | |
| H.264 (h) | 4.8 | 6 | 2.2 | 4.9 |
Points positifs
Points négatifs
Verdict : j'adore le matériel, je déteste les insectes
Nous sommes partis impressionnés par la Blade 16mais on ne peut pas en dire autant du Blade 18. Notre unité présentait des problèmes majeurs, notamment des performances DLSS 3 buggées sur un moniteur externe, l'absence de support G-Sync alors que G-Sync est censé être inclus, et un affichage scintillant potentiellement défectueux. Nous avons envisagé de ne pas publier cet article jusqu'à ce que ces problèmes soient résolus, mais le Blade 18 a déjà été expédié aux clients et nous avons pensé qu'il était bon d'informer nos lecteurs qui pourraient être sur le marché. Cette page sera mise à jour avec une note finale dès que nous aurons obtenu une solution adéquate de la part du fabricant.
Le Blade 18 a le potentiel d'être un autre excellent ajout à la famille Blade si l'on regarde au-delà des problèmes ci-dessus. L'écran de 18 pouces est magnifique et massif par rapport à l'encombrement et au poids. Le fait que le système ne soit pas beaucoup plus grand ou plus lourd que le Blade 17 devrait le rendre très attrayant pour les utilisateurs qui envisagent déjà un Blade 17 ou un autre ordinateur portable de jeu de 17 pouces. Son adaptateur secteur GaN relativement petit ajoute encore à la nature hybride portable-DTR du Blade 18.
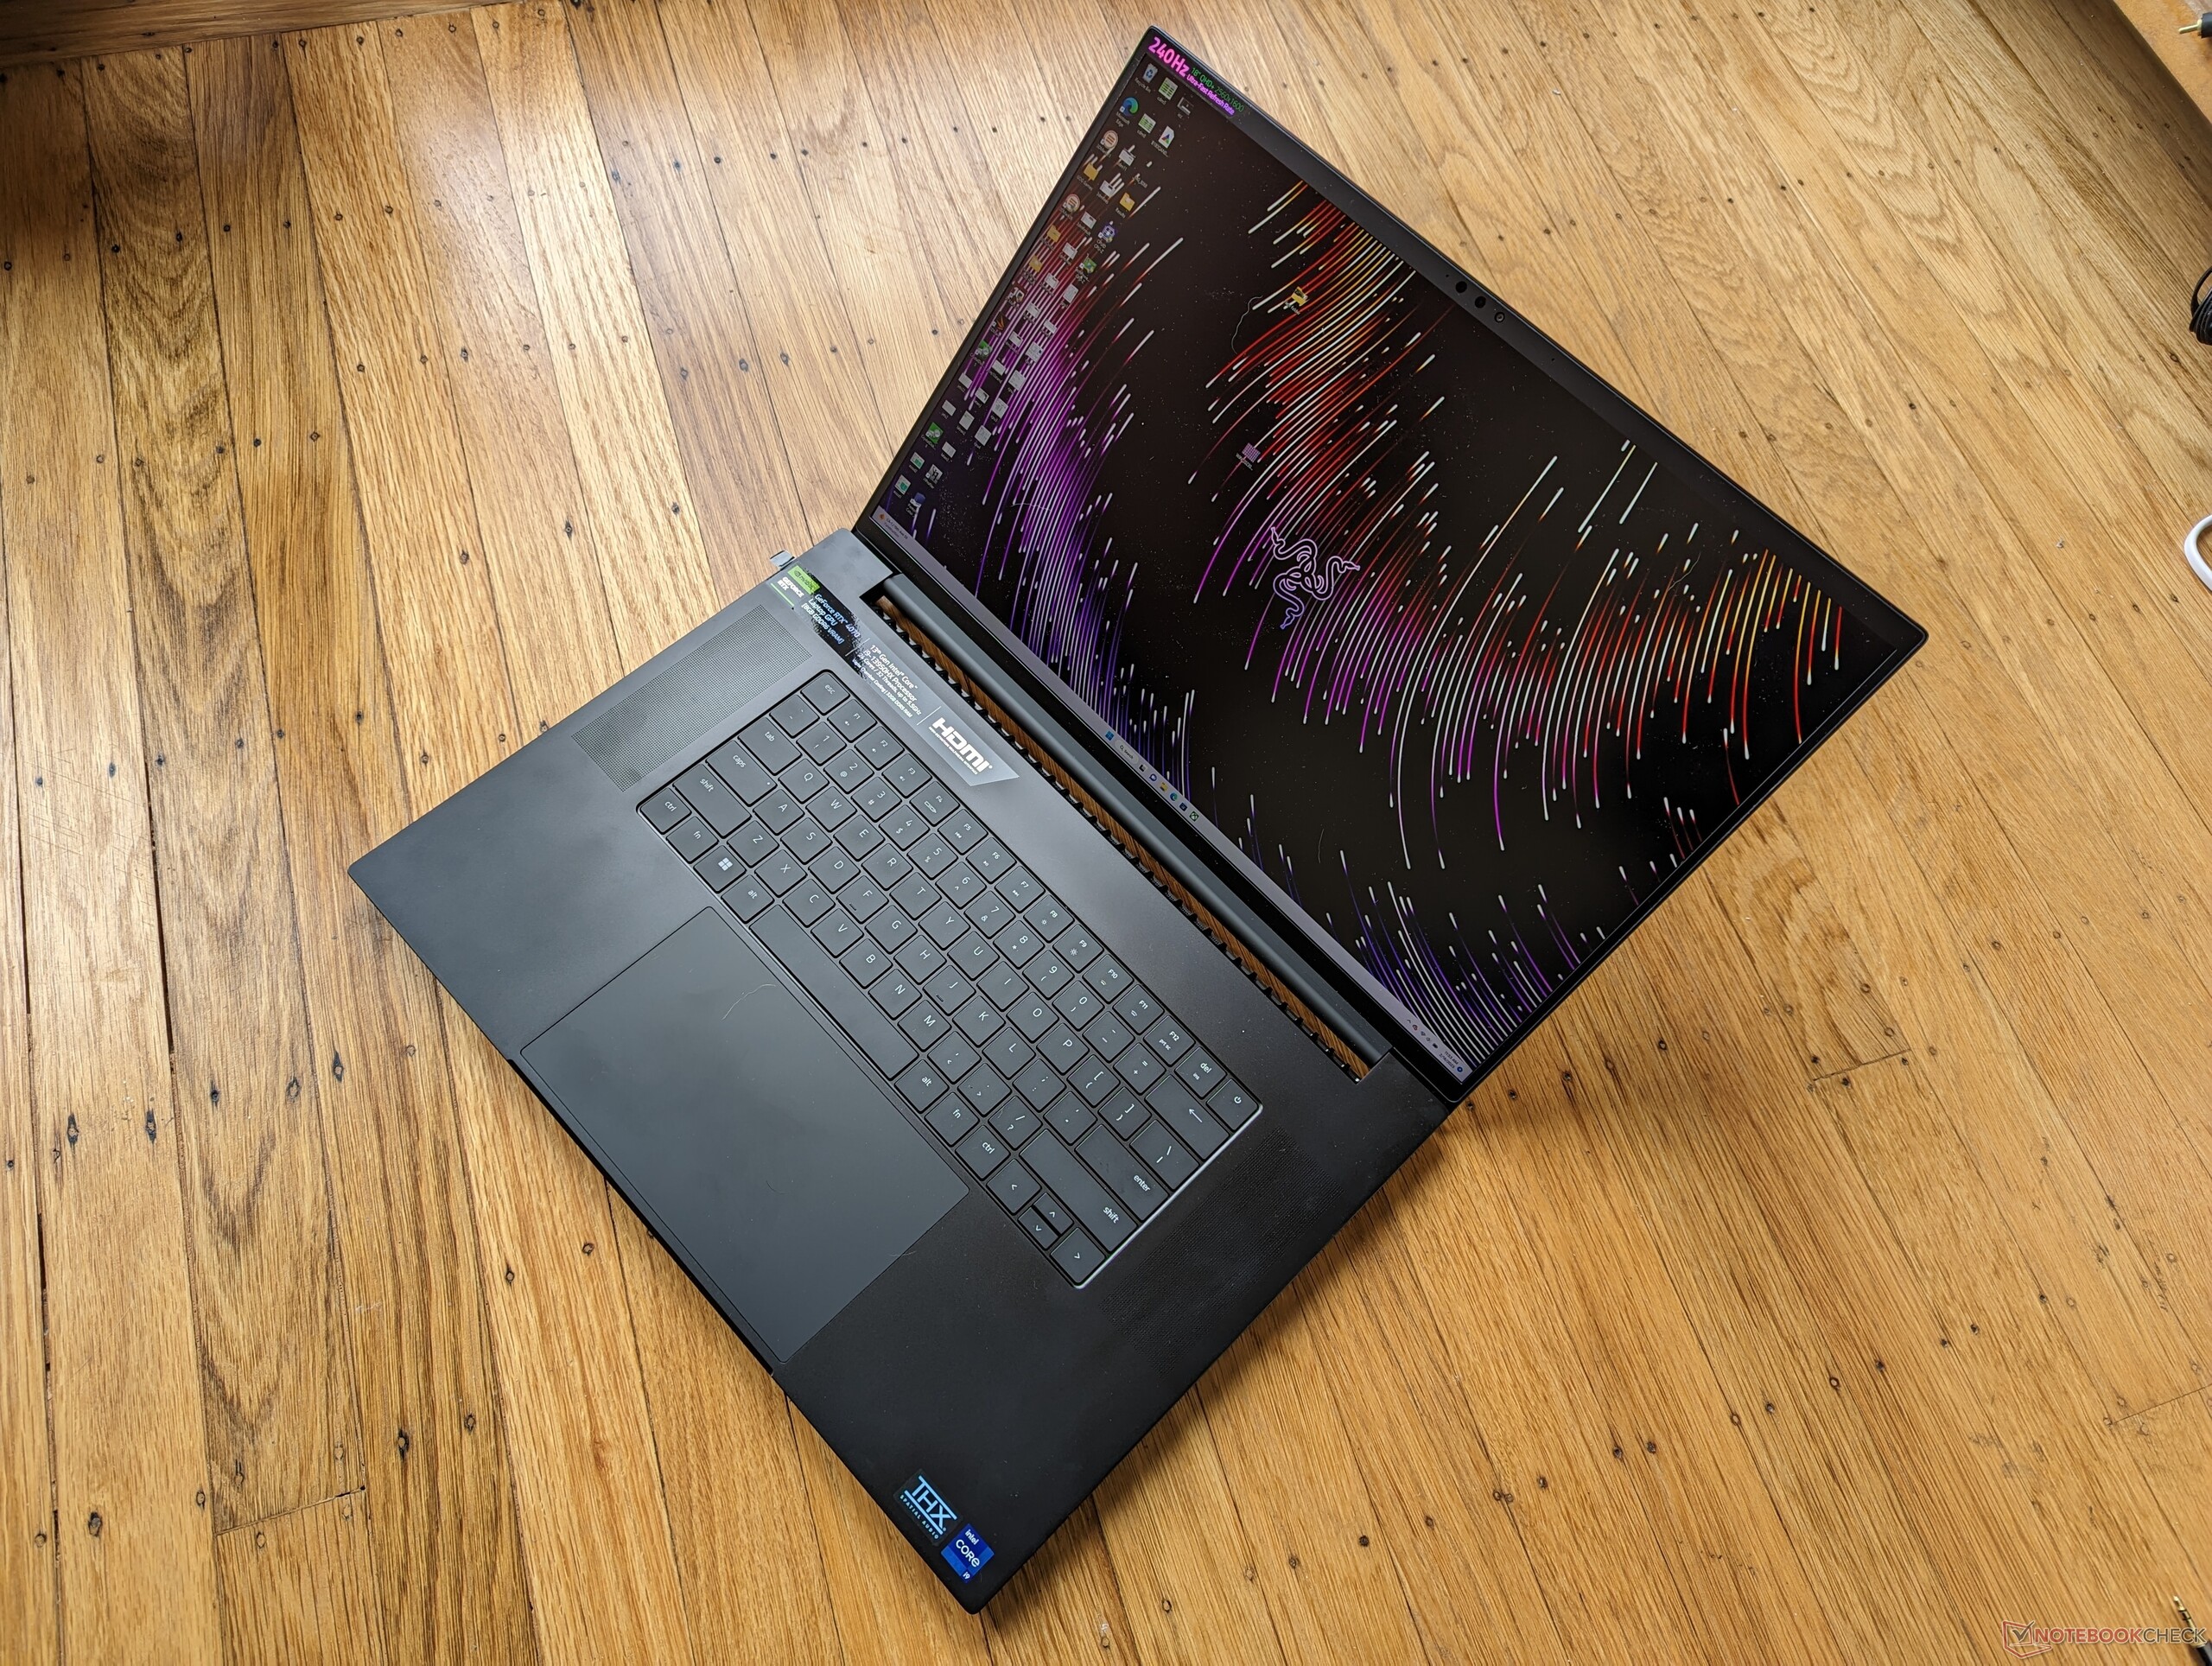
Le Blade 18 peut sembler gigantesque au premier abord, mais il n'est pas beaucoup plus grand que le Blade 17 existant. Son grand écran et son rapport écran/corps élevé sont impressionnants.
Quant à la RTX 4070 mobile, ses performances peuvent être décevantes en fonction du jeu. Les titres qui prennent en charge DLSS 3 fonctionnent comme du beurre sur la RTX 4070 mobile. Sinon, attendez-vous à ce que les performances soient similaires à celles de la RTX 3080 mobile de l'année dernière ou de la RTX 3070 de bureau. Heureusement, la liste des titres prenant en charge DLSS 3 ne cesse de s'allonger.
C'est un bon début pour la série des Blade 18 pouces, mais il y a quelques problèmes de lancement notables. Les prochains Asus ROG Strix Scar 18 et Dell Alienware m18 pourraient poser des problèmes au Blade 18 si certains problèmes clés ne sont pas résolus.
Prix et disponibilité
Transparency
La sélection des appareils à examiner est effectuée par notre équipe éditoriale. L'échantillon de test a été prêté à l'auteur par le fabricant ou le détaillant pour les besoins de cet examen. Le prêteur n'a pas eu d'influence sur cette évaluation et le fabricant n'a pas reçu de copie de cette évaluation avant sa publication. Il n'y avait aucune obligation de publier cet article. En tant que média indépendant, Notebookcheck n'est pas soumis à l'autorité des fabricants, des détaillants ou des éditeurs.
Voici comment Notebookcheck teste
Chaque année, Notebookcheck examine de manière indépendante des centaines d'ordinateurs portables et de smartphones en utilisant des procédures standardisées afin de garantir que tous les résultats sont comparables. Nous avons continuellement développé nos méthodes de test depuis environ 20 ans et avons établi des normes industrielles dans le processus. Dans nos laboratoires de test, des équipements de mesure de haute qualité sont utilisés par des techniciens et des rédacteurs expérimentés. Ces tests impliquent un processus de validation en plusieurs étapes. Notre système d'évaluation complexe repose sur des centaines de mesures et de points de référence bien fondés, ce qui garantit l'objectivité.Price comparison

