Notebookcheck Logo

Test de la NVIDIA GeForce RTX 3060 Ti Founders Edition : vaisseau-amiral 1440p Ultra et jeu 4K austère pour 400 $US

Pour le commun des mortels. Le NVIDIA RTX 3060 Ti perpétue la tradition d'Ampere qui consiste à distiller les performances haut de gamme de la génération précédente à des prix plus bas. La RTX 3060 Ti succède en fait à la RTX 2060 Super mais se veut la carte de référence pour le jeu en 1440p Ultra en offrant essentiellement les performances de la RTX 2080 Super pour 400 $US. Nous prenons la NVIDIA RTX 3060 Ti Founders Edition pour faire un tour pour voir si c'est vraiment le cas.

En décembre 2020, NVIDIA a officiellement annoncé le GeForce RTX 3060 Ti ciblant la grande majorité des joueurs en 1080p et 1440p. Le RTX 3060 Ti est basé sur le même GPU GA104 8 nm que le RTX 3070 mais ne permet que 4 864 cœurs CUDA.

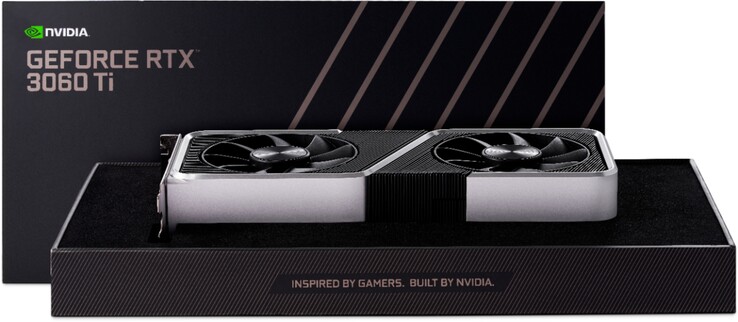
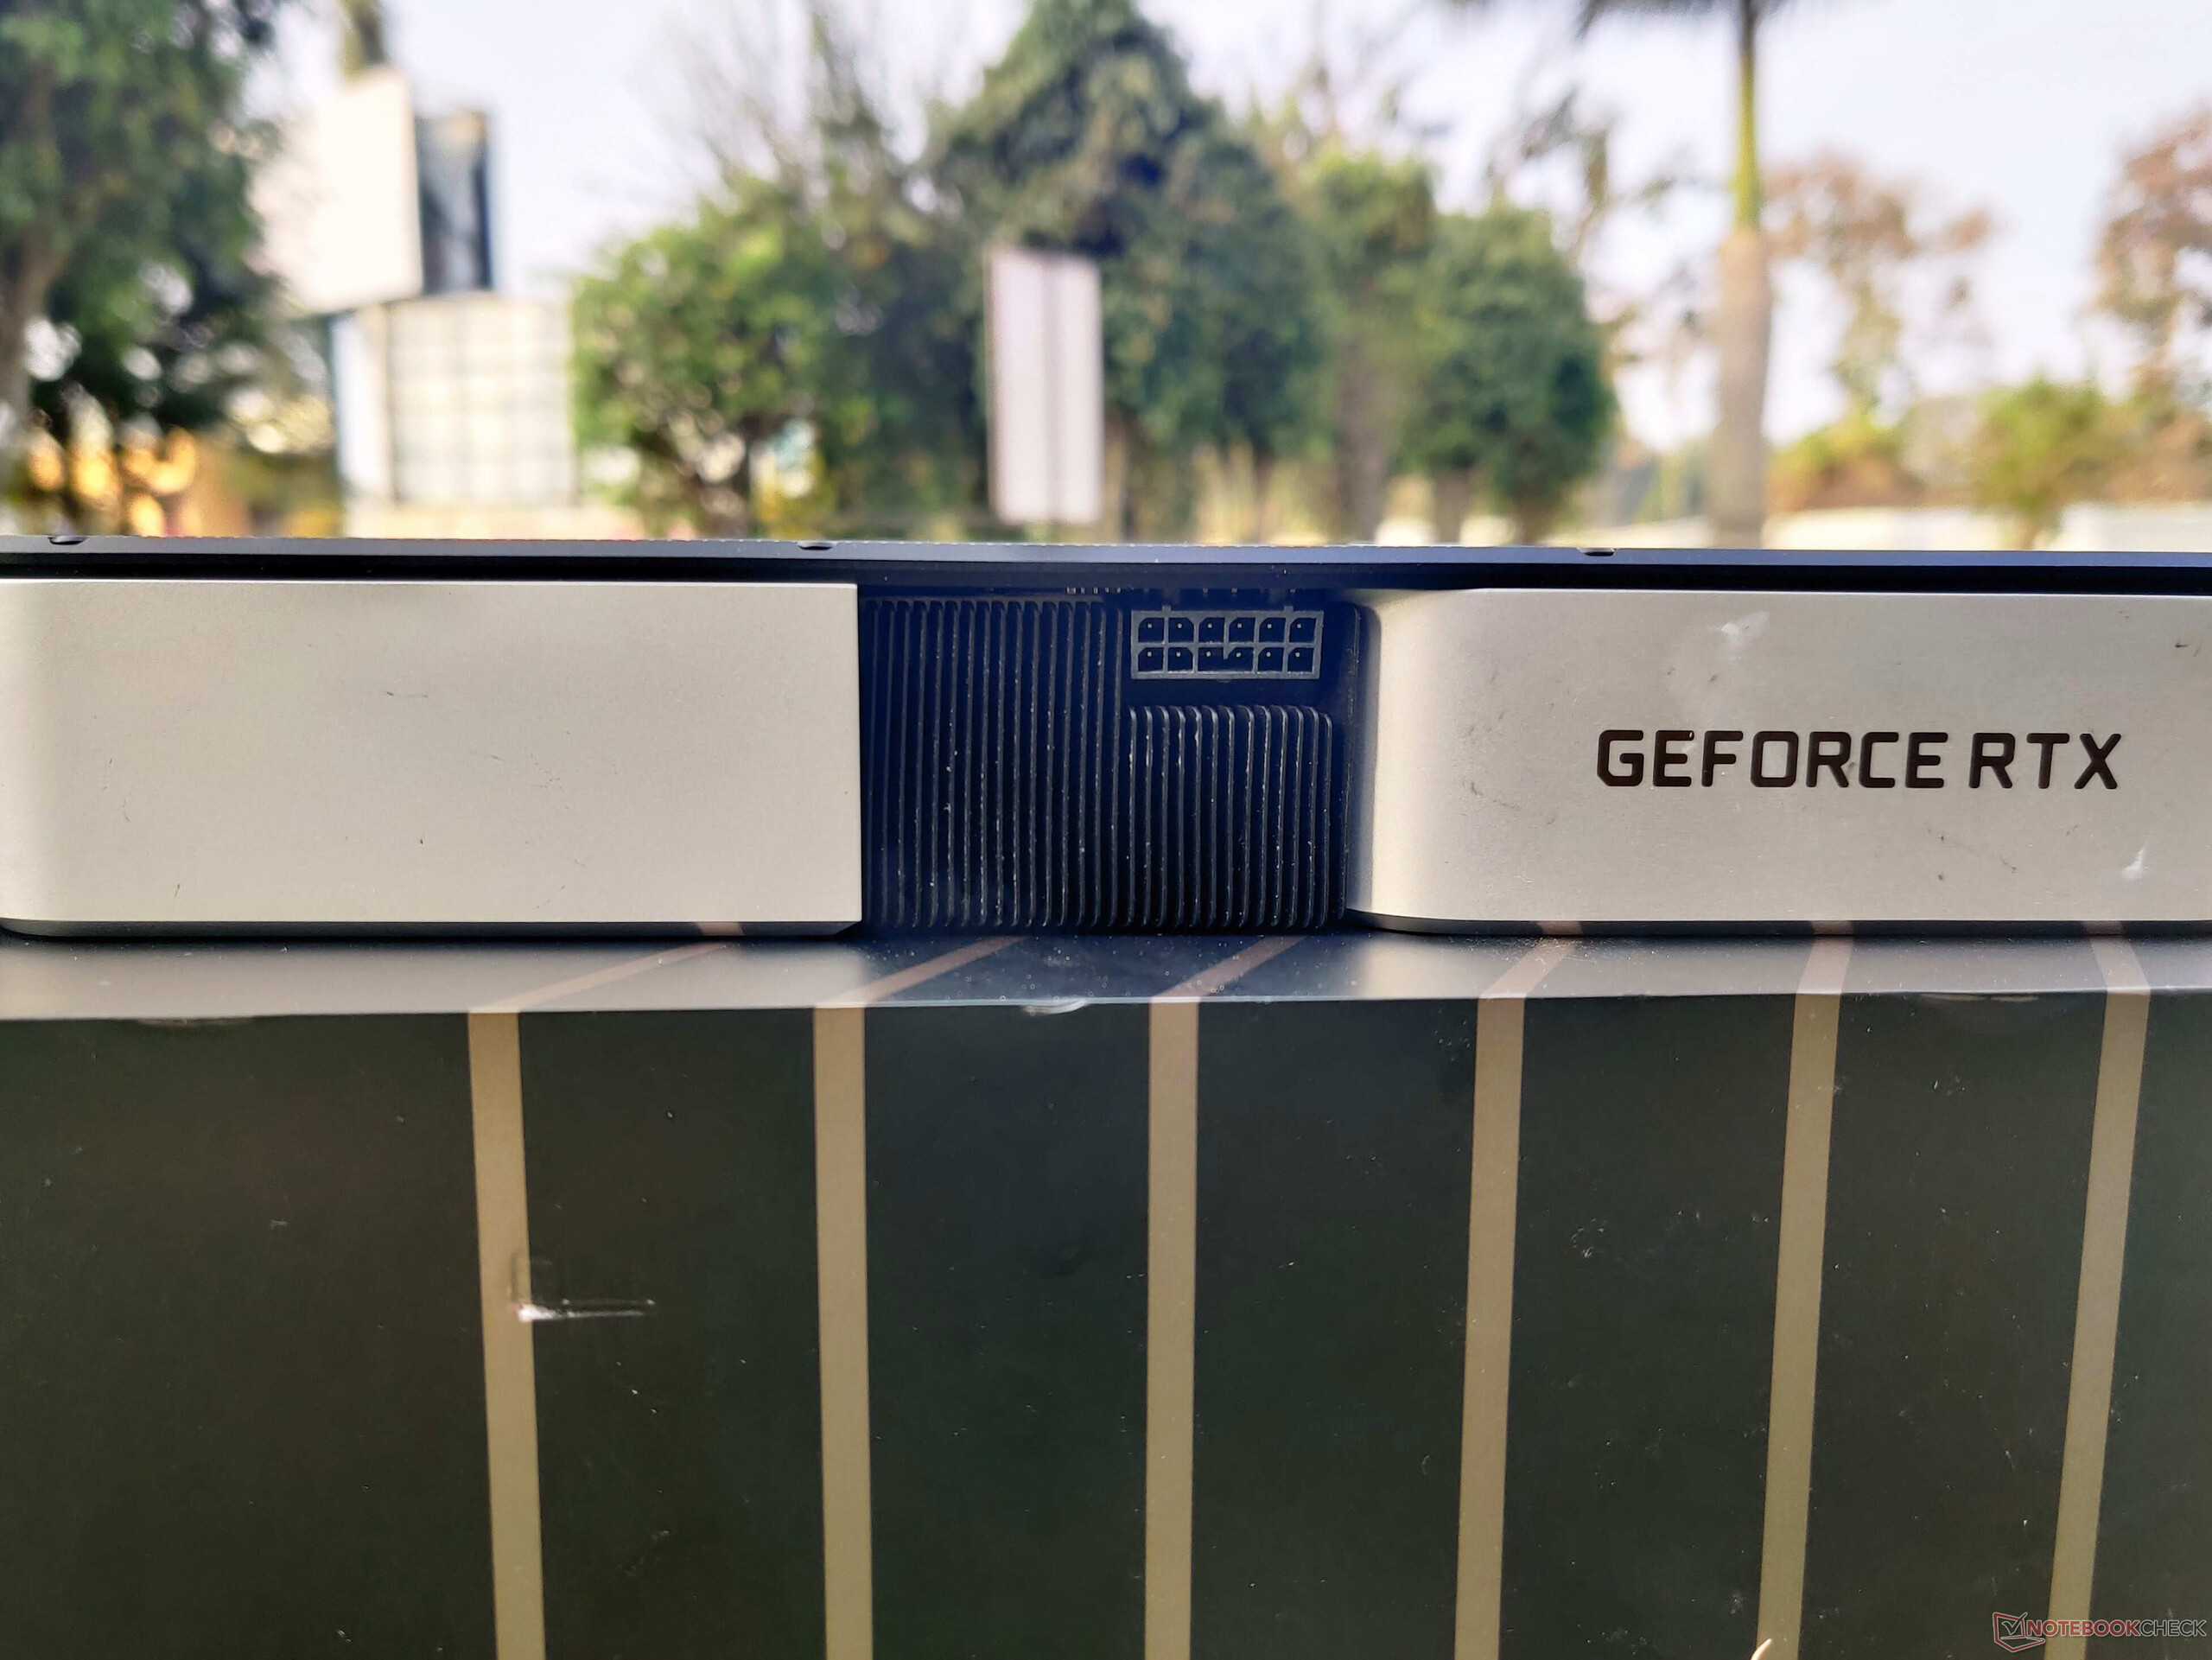
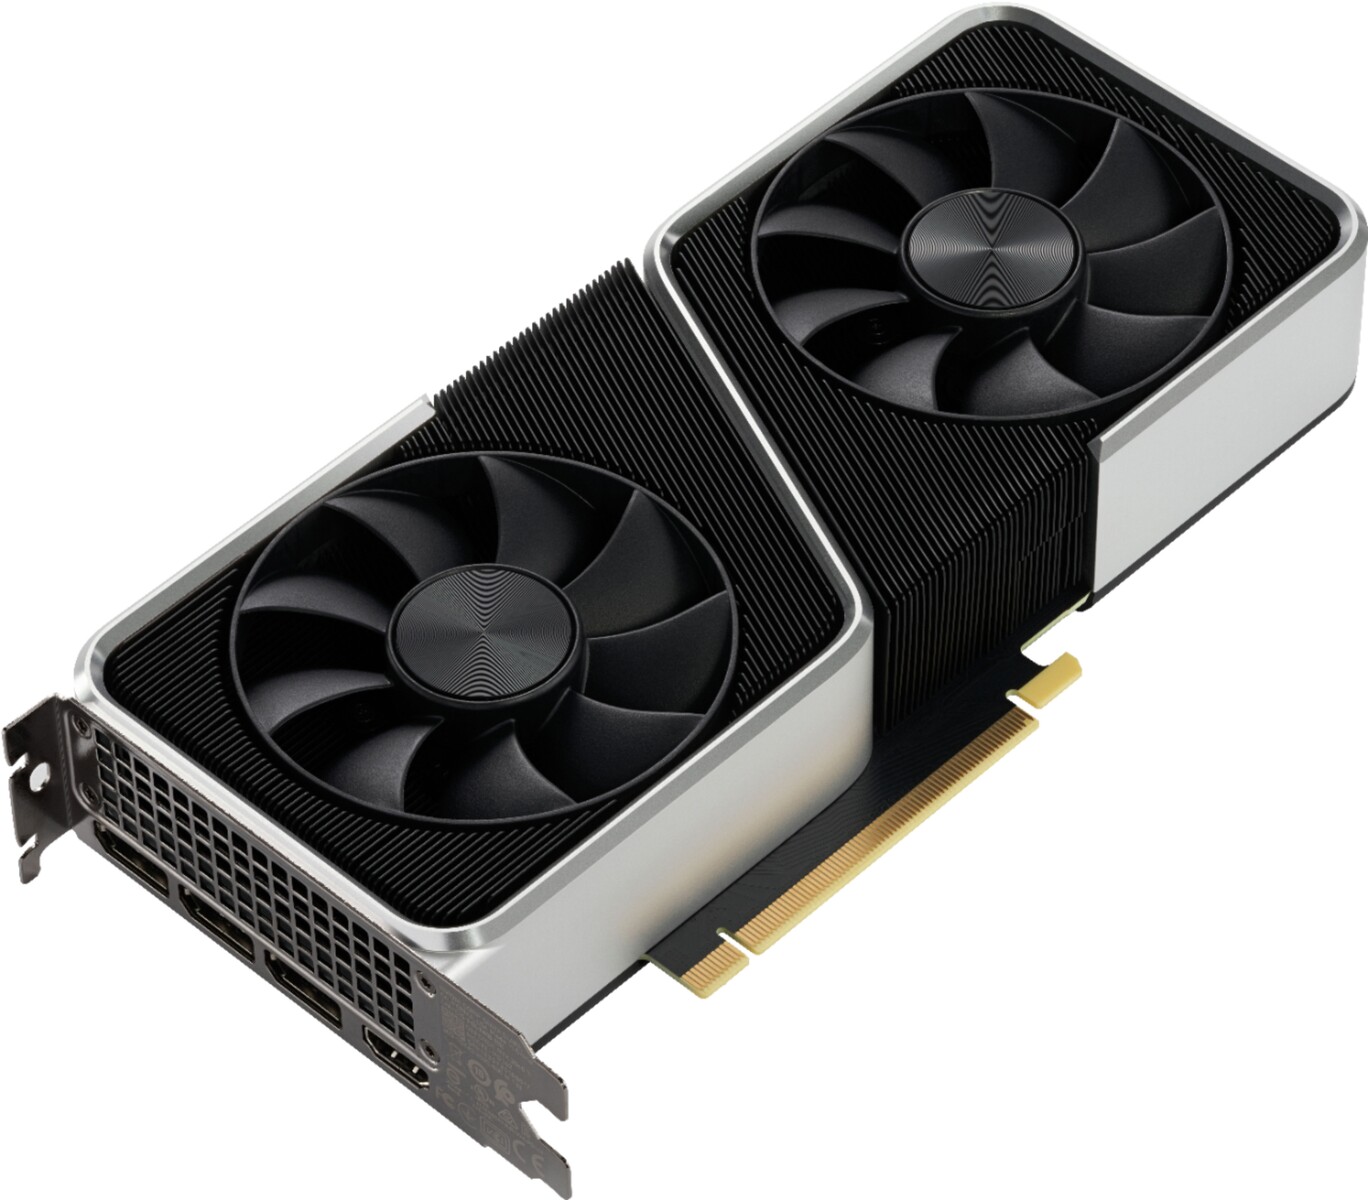
Nous avons avec nous la carte RTX 3060 Ti Founders Edition (FE) de NVIDIA pour examen. La RTX 3060 Ti FE a une conception similaire à celle des autres cartes FE d'Ampere, y compris l'utilisation d'un connecteur d'alimentation Molex MicroFit 3.0 à 12 broches. Cependant, contrairement aux autres cartes FE Ampere jusqu'à présent, nous pouvons voir une finition métallique argentée brillante qui donne un aspect haut de gamme.

À un prix de vente conseillé de 400 dollars, la RTX 3060 Ti peut être considérée comme le successeur spirituel de la RTX 2060 Super. Cependant, la carte devrait offrir des performances supérieures à celles du RTX 2080 Super pour 300 dollars de moins, ce qui en fait une aubaine potentielle à plus d'un titre pour les joueurs de 1440p Ultra et de 1080p à taux de rafraîchissement élevé.

Dans cet article, nous avons mis la RTX 3060 Ti FE à l'épreuve et évalué si elle offre vraiment le rapport qualité/prix que NVIDIA prétend offrir

Comparaison du RTX 3060 Ti avec d'autres GPU NVIDIA

Spécification RTX3090 RTX3080 FE RTX3070 FE RTX3060 Ti FE Titan RTX RTX2080 Ti RTX 2080Super RTX2070 Super TITANX Pascal
Chip GA102 GA102 GA104 GA104 TU102 TU102 TU104 TU104 GP102
Processus FinFET 8 nm 8 nm 8 nm 8 nm 8nm 12 nm 12 nm 12 nm 12 nm
CUDA cores 10,496 8,704 5,888 4,864 4,608 4,352 3,072 2,560 3,584
Textureunits 328 272 184 152 288 272 192 160 224
Noyaux tenseurs 328 3ème génération 272 3ème génération 184 3ème génération 1523ème génération 576 2ème génération 544 2ème génération 384 2ème génération 320 2ème génération
RTcores 82 68 46 38 72 68 48 40 -
Horloge de base GPU 1,395 MHz 1,440 MHz 1,500 MHz 1,410 MHz 1,350 MHz 1,650 MHz 1,605 MHz 1,417 MHz
Horloge de boost GPU 1,695 MHz 1,710 MHz 1,750 MHz 1,665 MHz 1,770 MHz 1,545 MHz 1,815 MHz 1,770 MHz 1,531 MHz
Memorybus 384-bit 320-bit 256-bit 256-bit 384-bit 352-bit 256-bit 256-bit 384-bit
Bande passante mémoire 936 GB/s 760 GB/s 448GB/s 672 GB/s 616 GB/s 495.9 GB/s 448 GB/s 480.4 GB/s
Mémoire vidéo 24 GB GDDR6X 10 GB GDDR6X 8 GB GDDR6 8 GBGDDR6 24 GB GDDR6 11 GB GDDR6 8 GB GDDR6 8 GB GDDR6 12 GB GDDR5X
Consommation d'énergie 350 W 320 W 220 W 200W 280 W 250 W 250 W 215 W 250 W

Une visite de l'édition fondatrice de NVIDIA GeForce RTX 3060 Ti

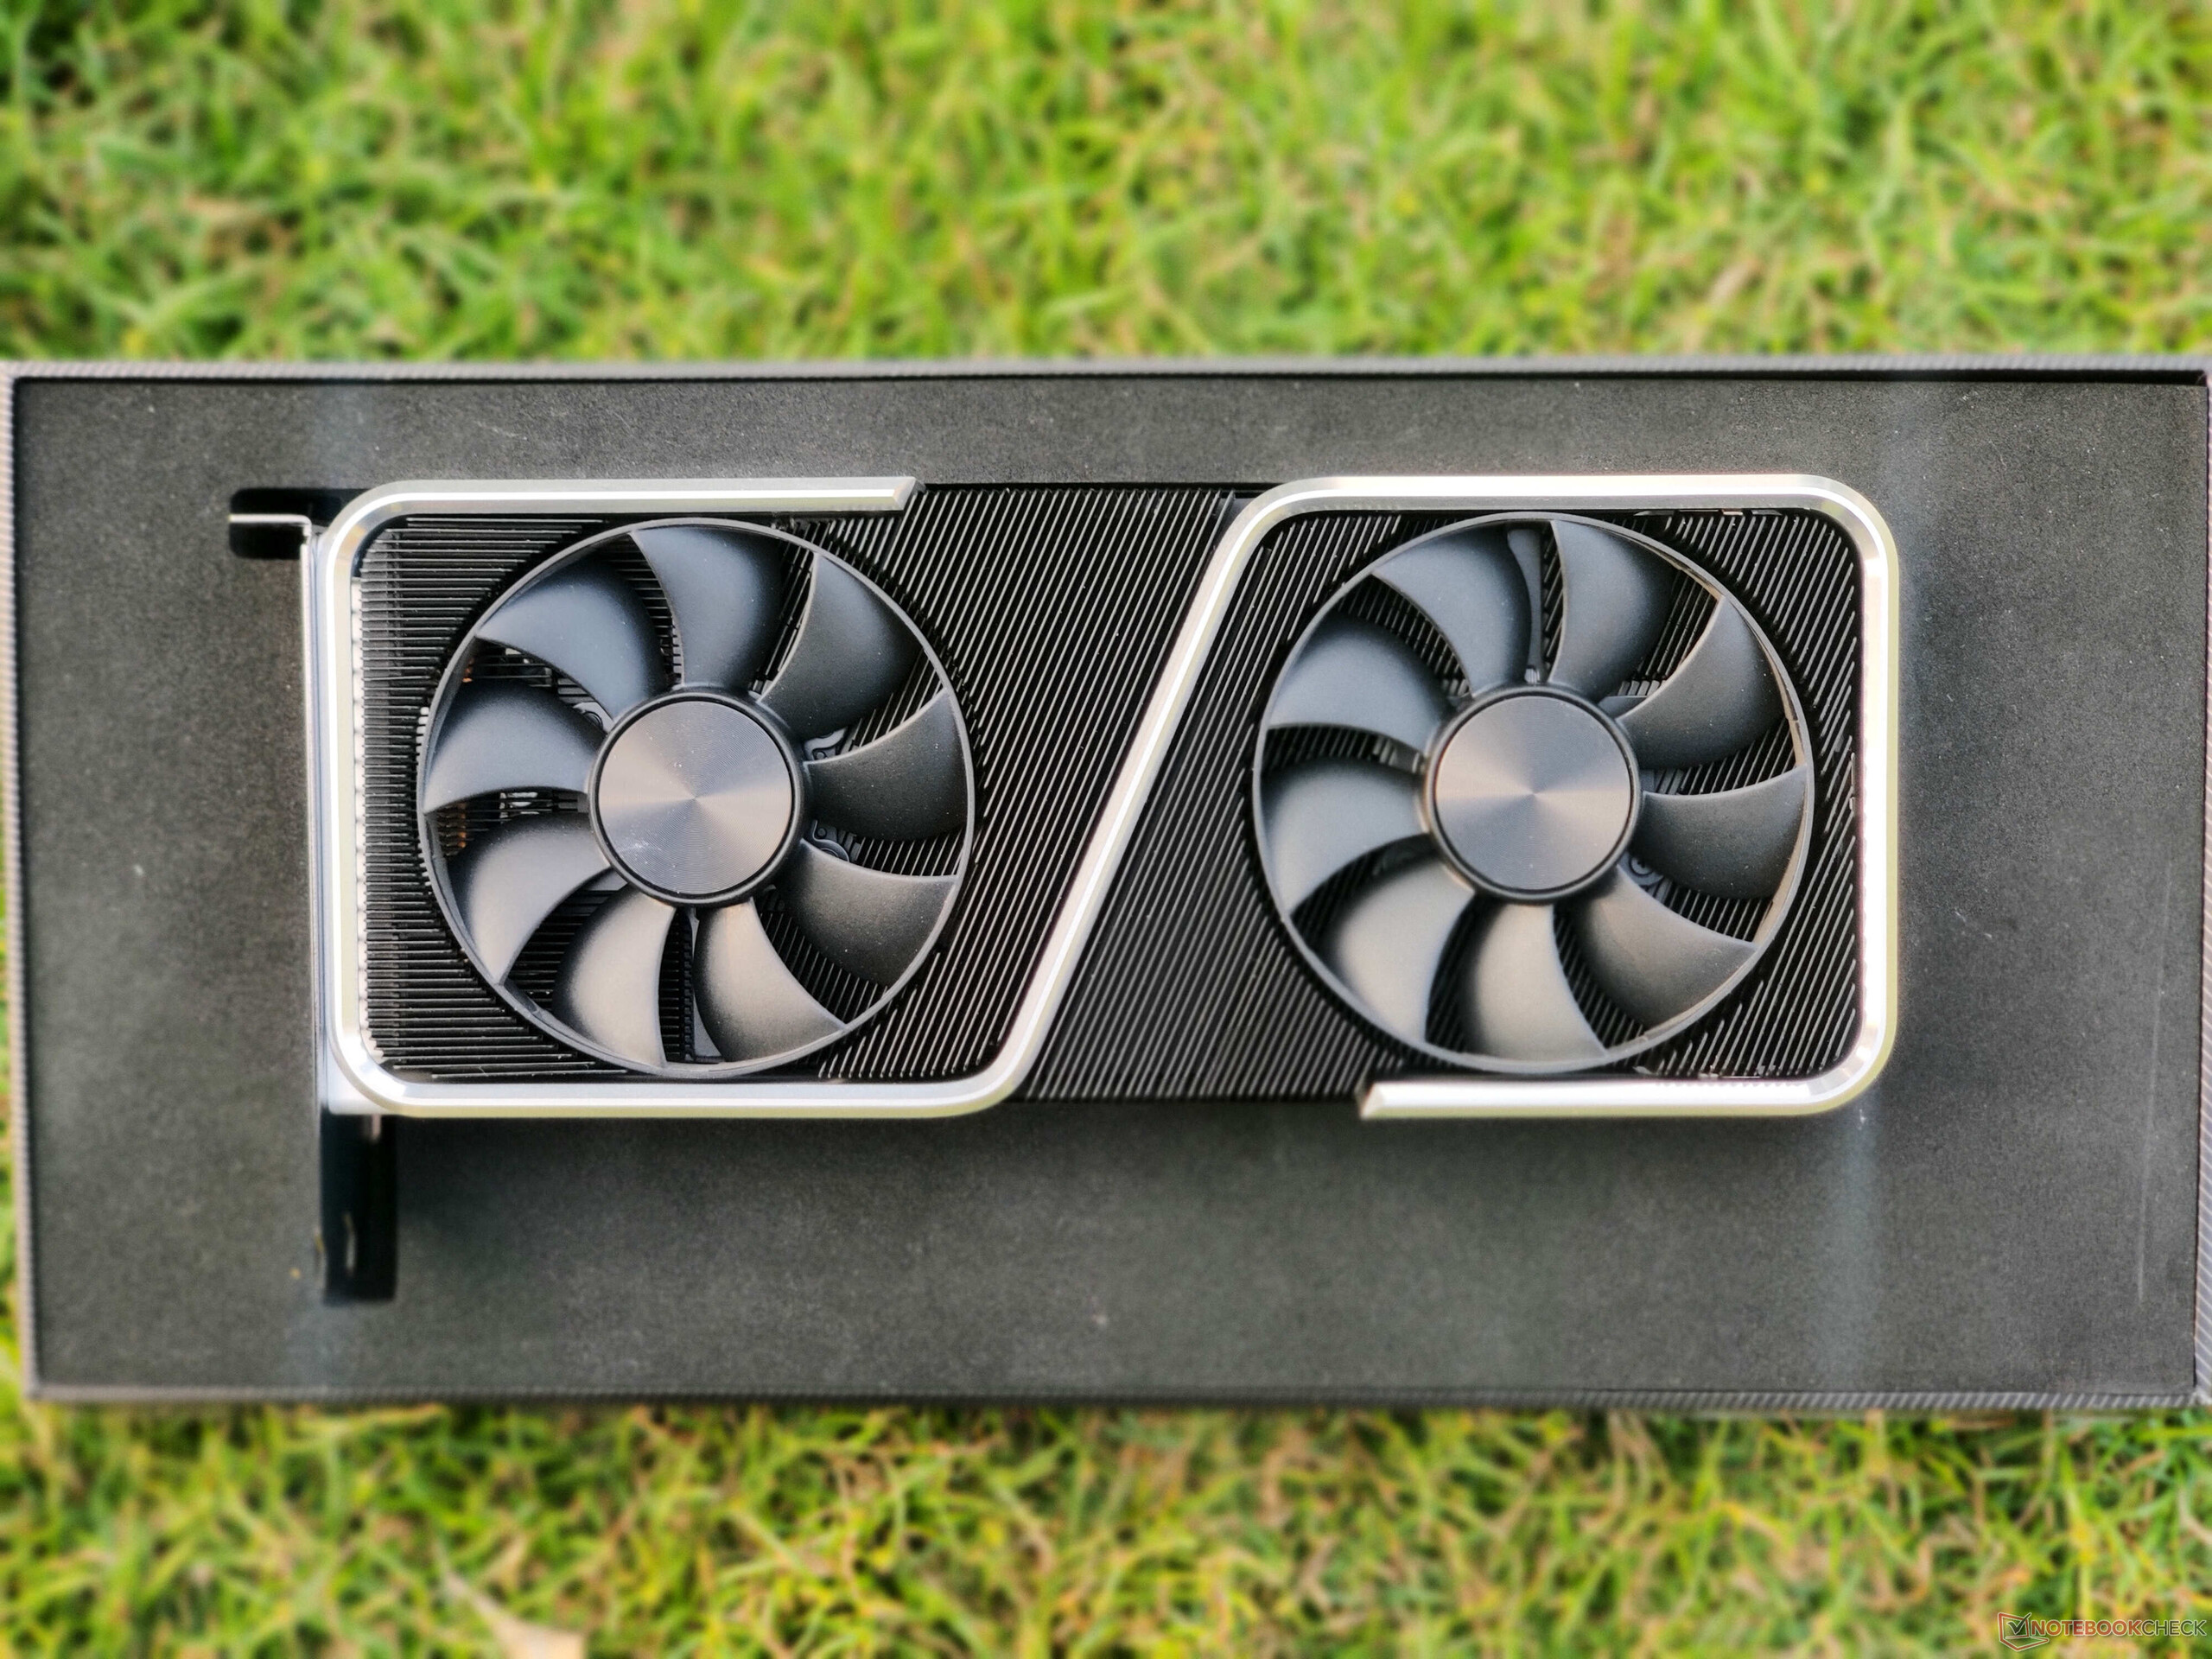
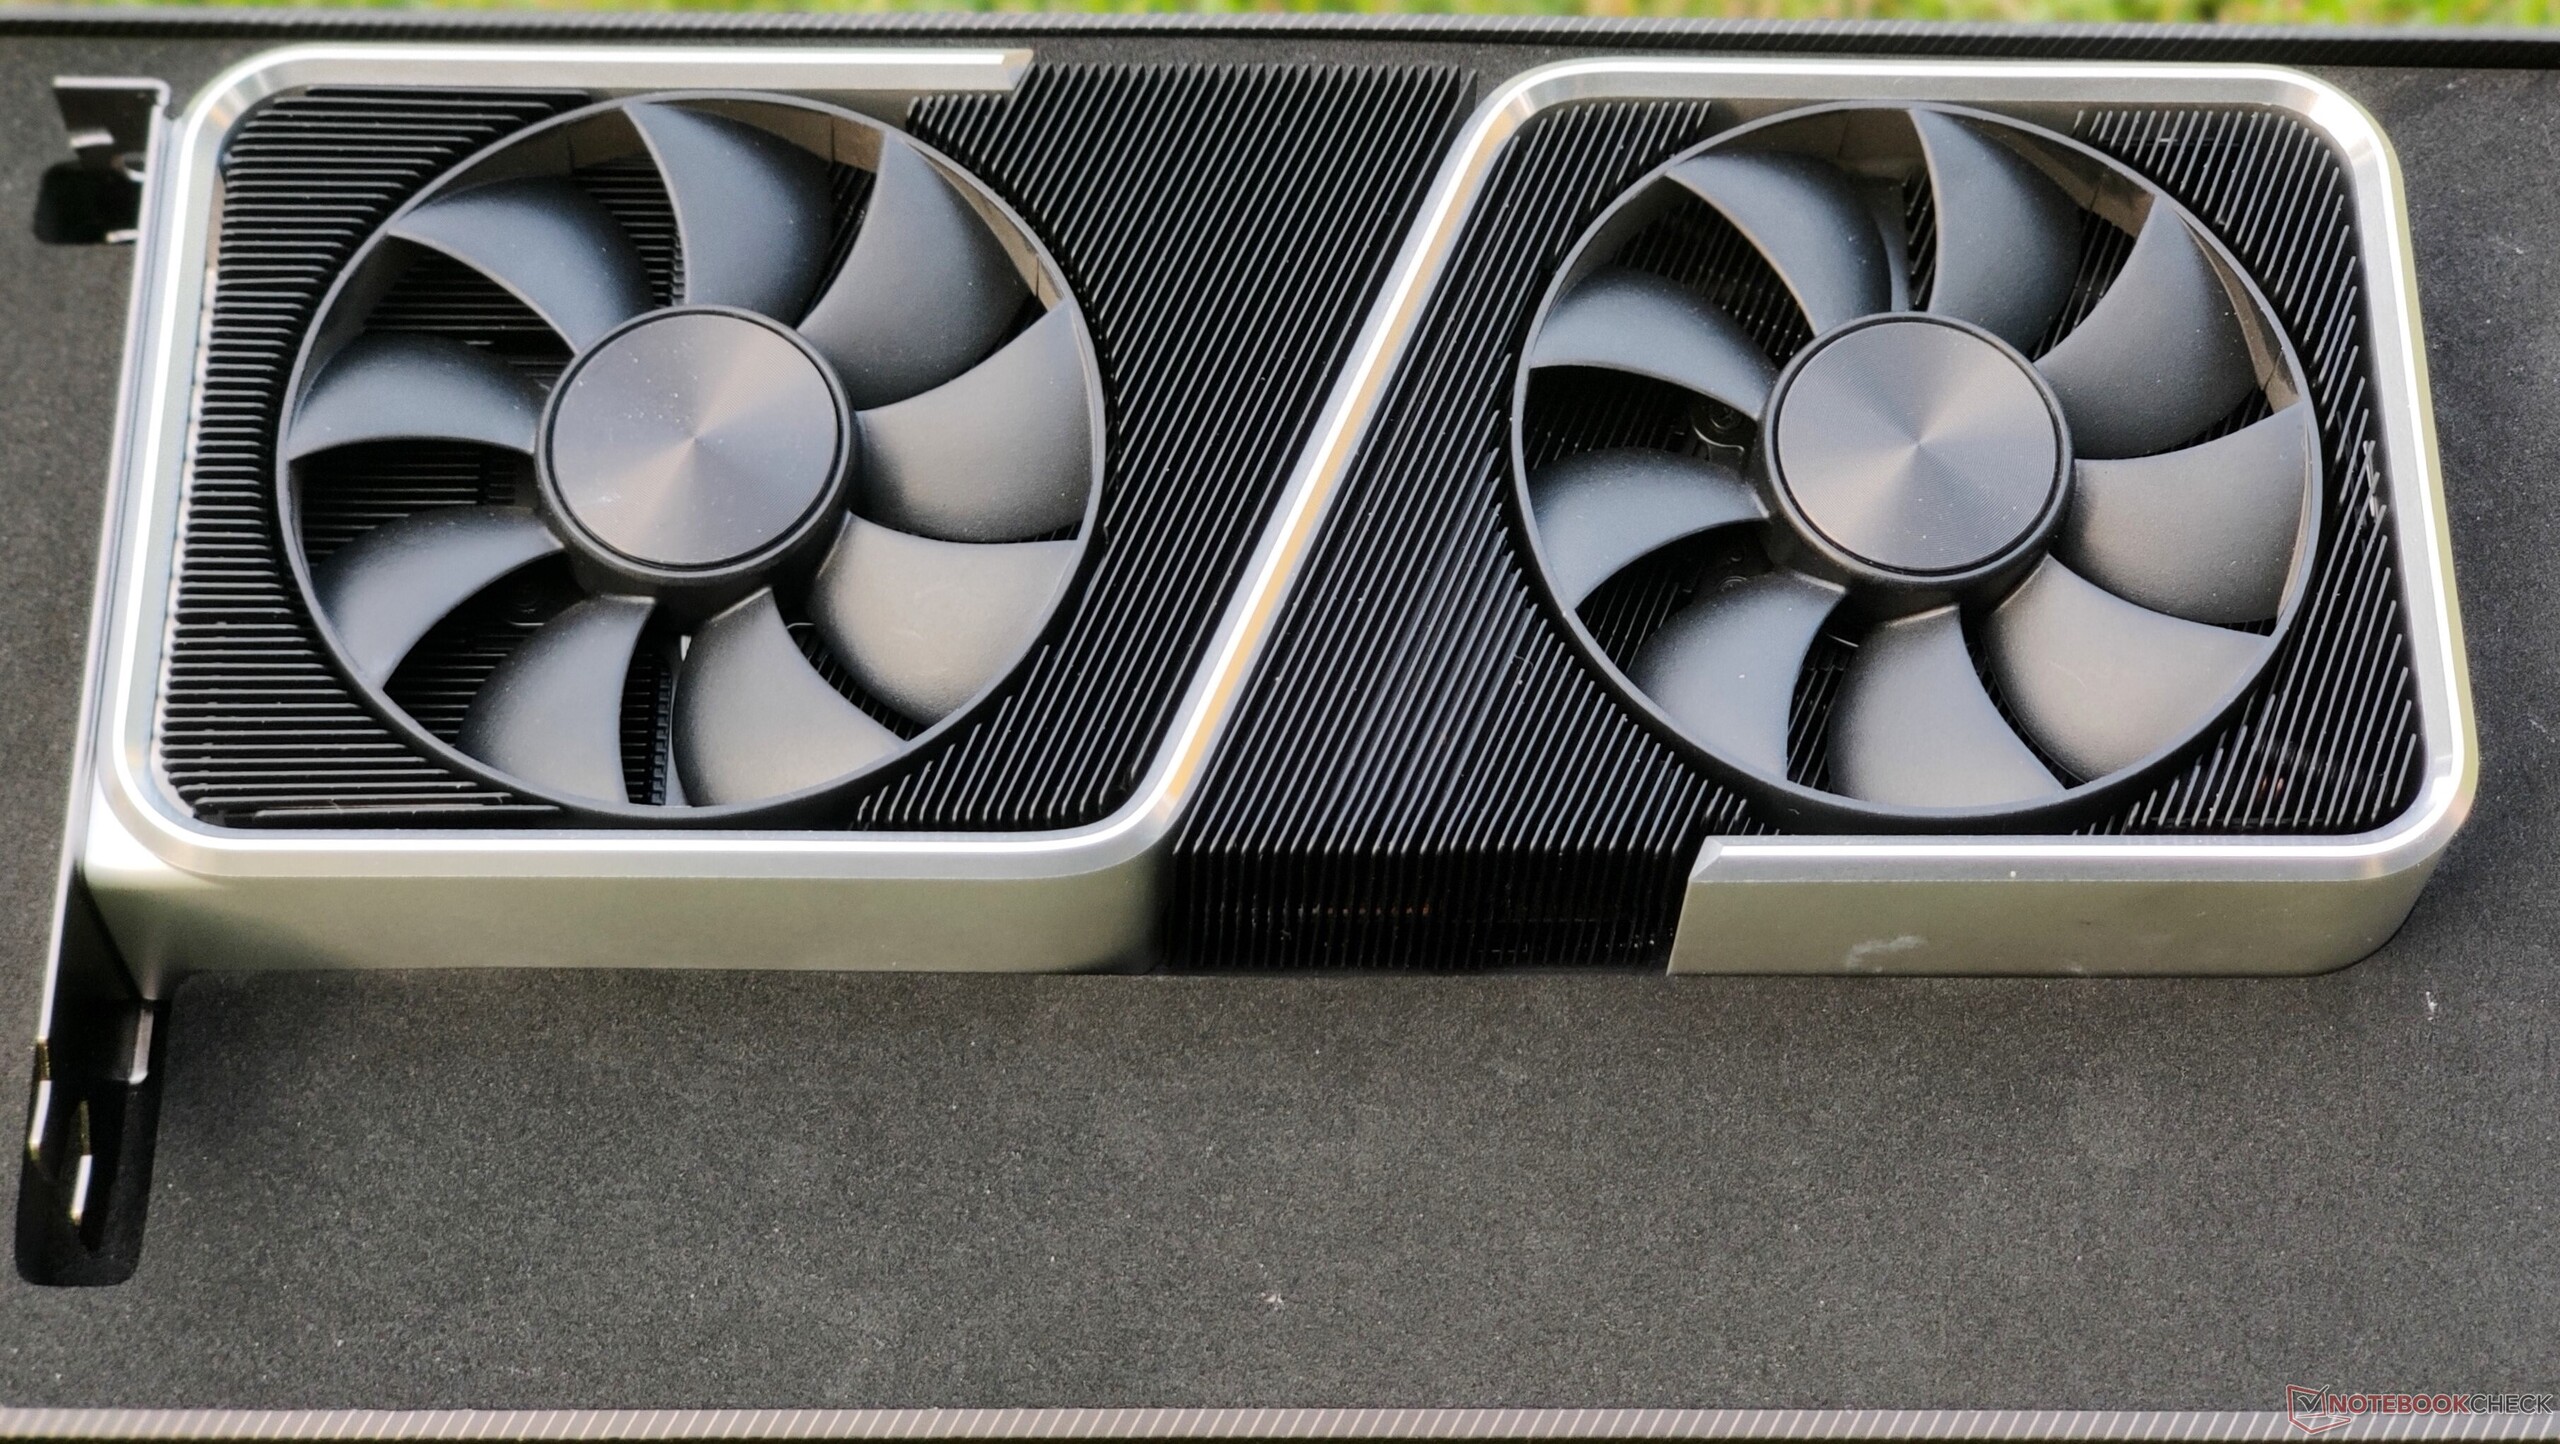
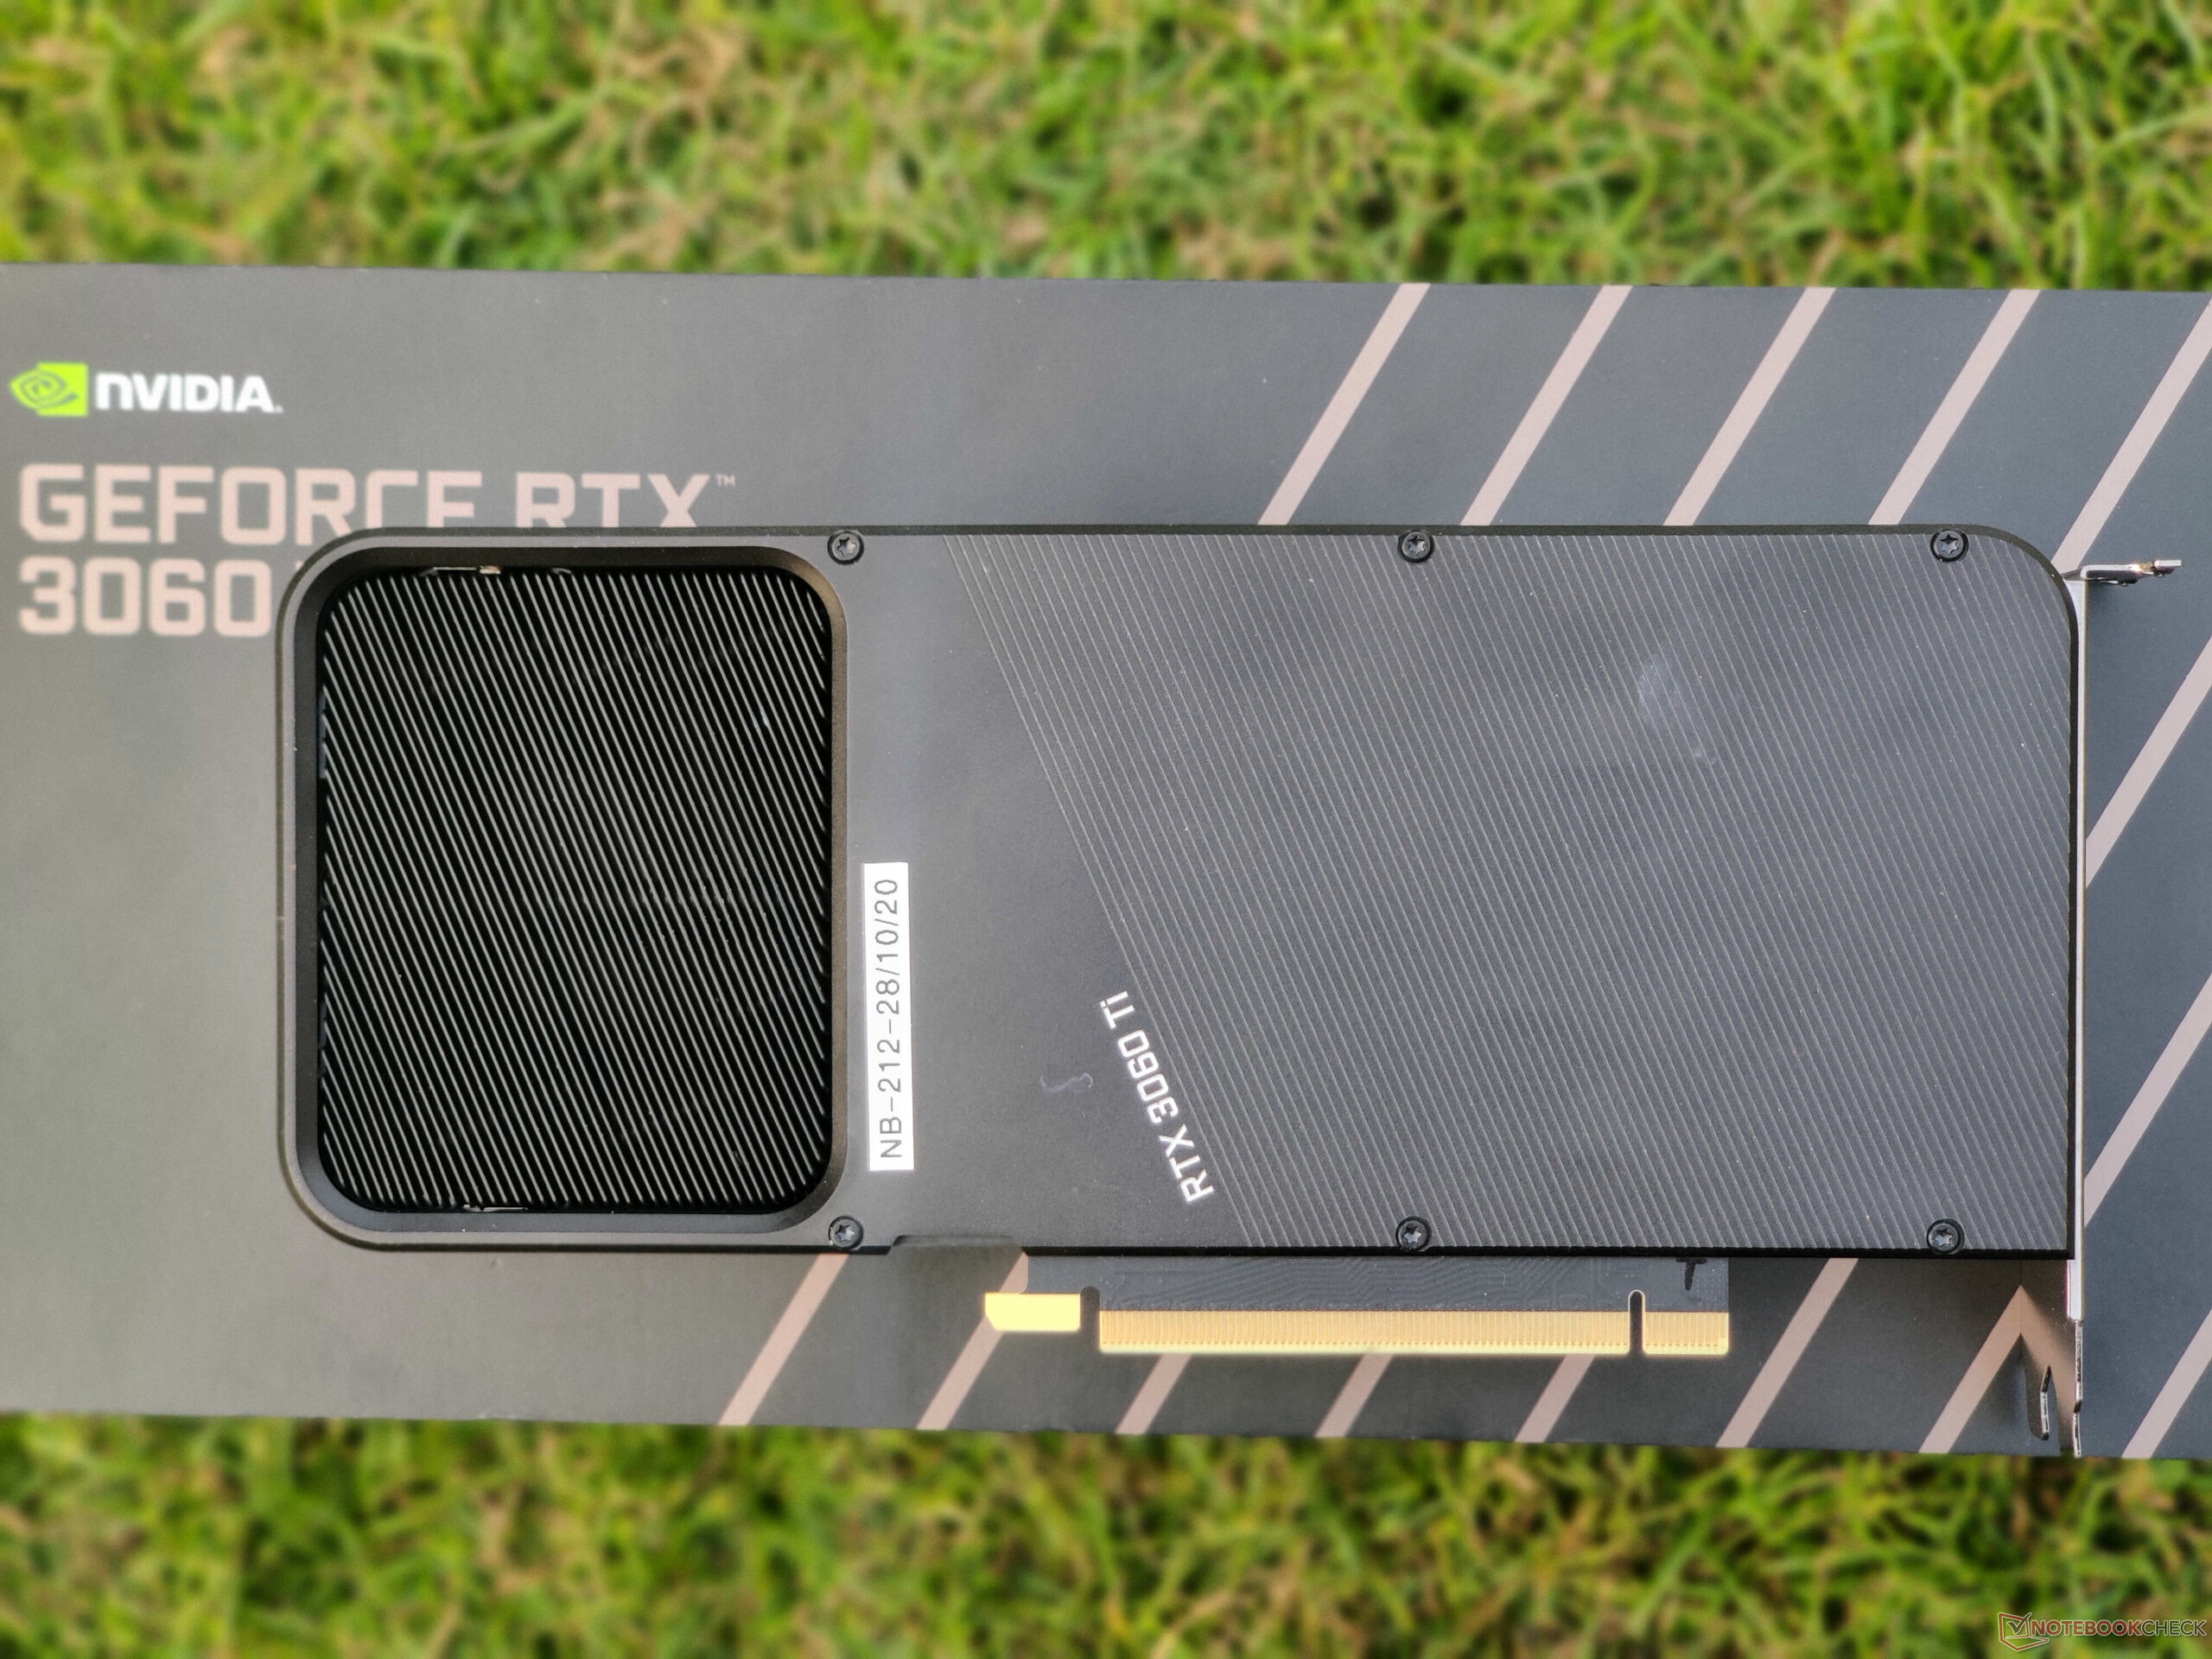
Le RTX 3060 Ti Founders Edition incarne le nouveau langage de conception de NVIDIA qui permet une meilleure dissipation de la chaleur et un faible niveau de bruit, du moins par rapport aux cartes FE de la génération précédente. La carte a l'air plutôt modeste, mais le cadre métallique argenté brillant lui donne un aspect haut de gamme. Elle est bien construite, sans torsion, ni grincement, ni enveloppe plastique fragile

Comme le reste des cartes NVIDIA Ampere Founders Edition, la RTX 3060 Ti FE est également équipée d'un connecteur d'alimentation Molex MicroFit 3.0 à 12 broches, situé vers le milieu. NVIDIA inclut un connecteur de 8 à 12 broches dans la boîte

Le connecteur à 12 broches semble ici quelque peu redondant et constitue un net inconvénient sur le plan esthétique (sans parler des problèmes de gestion des câbles), car le RTX 3060 Ti consomme moins de 300 W et peut facilement se contenter du connecteur d'alimentation standard à 8 broches.

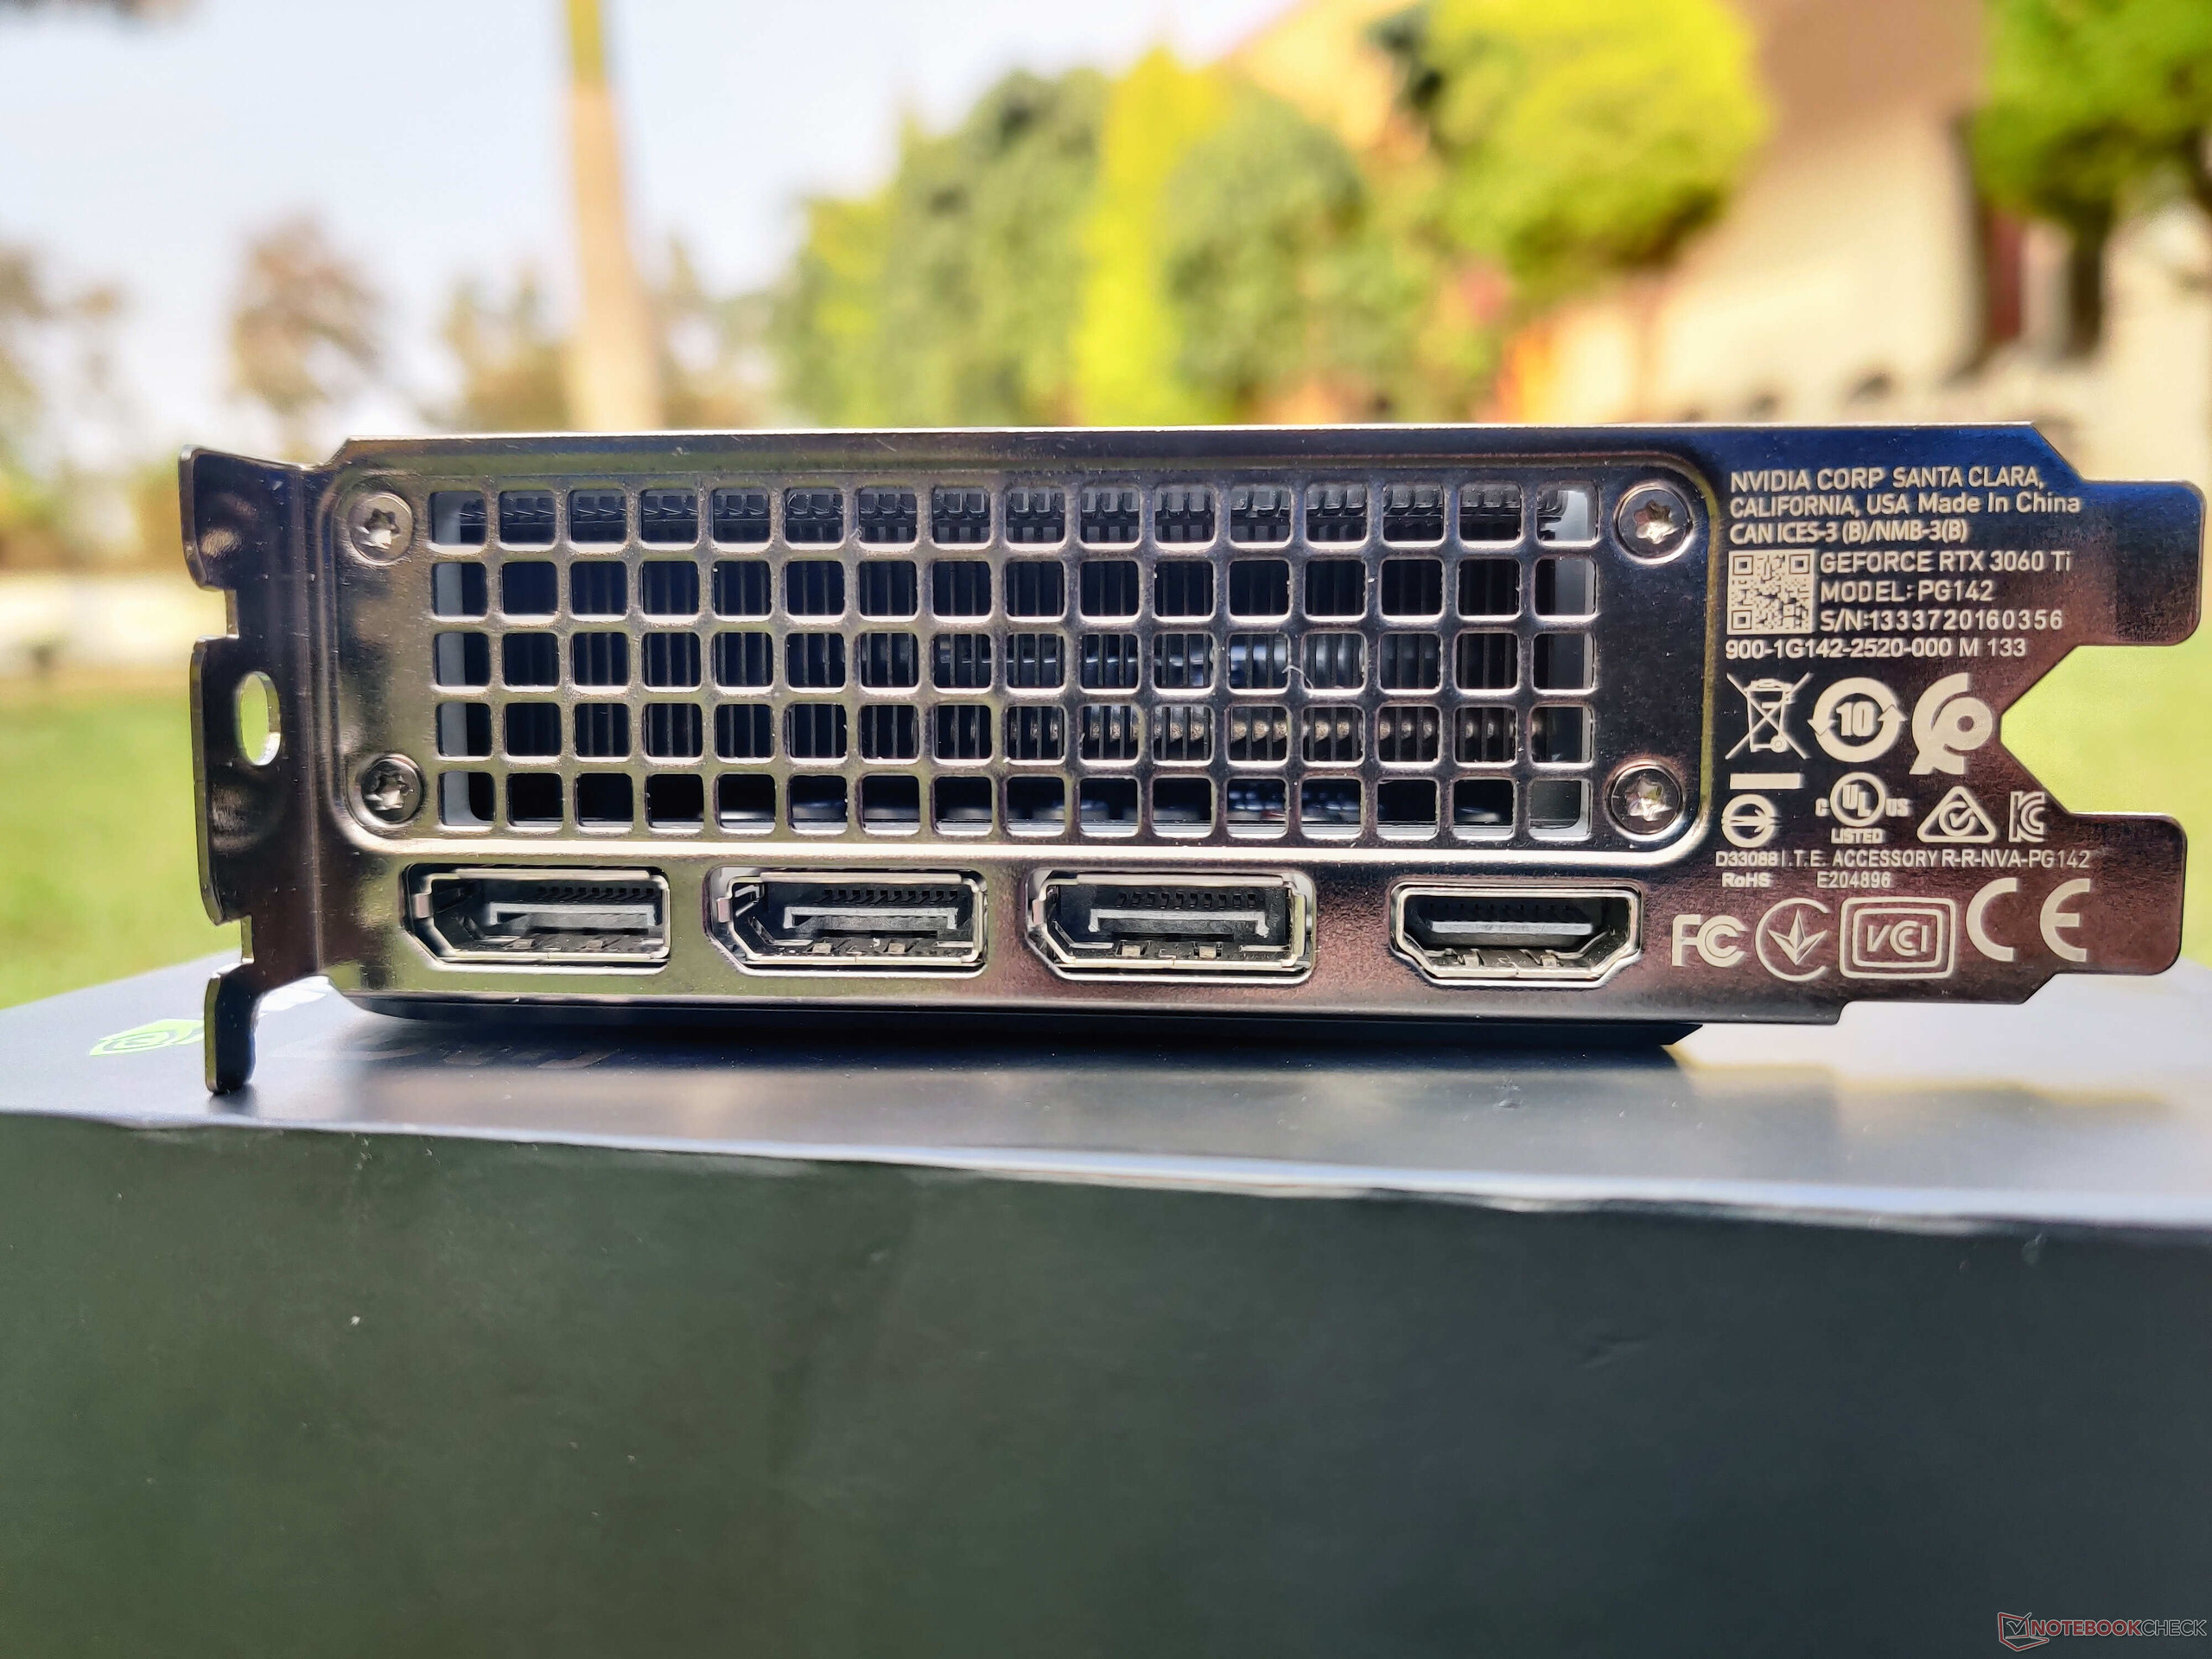
Les options de connectivité sont standard et comprennent trois ports DisplayPort 1.4a et un HDMI 2.1. Les doubles ventilateurs à 9 pales offrent un refroidissement efficace et ont un très bon profil sonore en charge comme nous le verrons plus loin dans l'article. Une plaque arrière métallique est fournie qui non seulement aide à la protection mais comporte également deux tampons thermiques en dessous pour dissiper la chaleur des VRM de la mémoire placés à l'arrière du PCB.

Le NVIDIA GeForce RTX 3060 Ti Founders Edition se vend au détail au prix de 399,99 dollars US (₹35,900) et est assorti d'une garantie de trois ans.

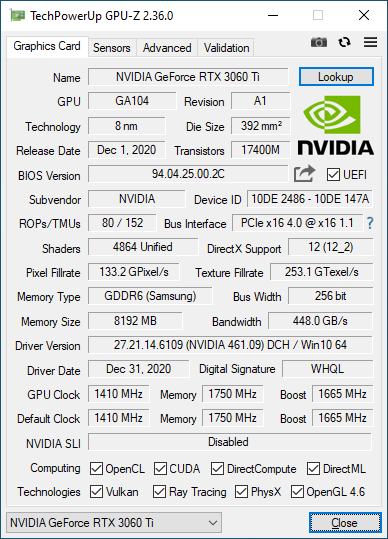
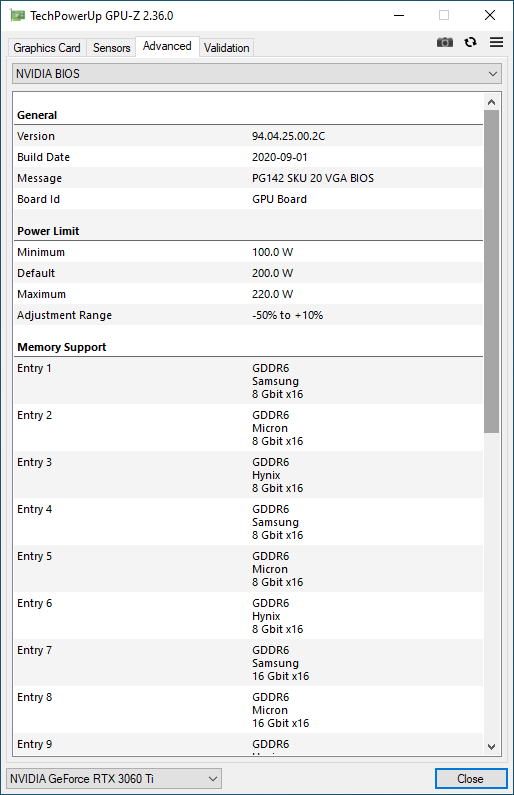
Le RTX 3060 Ti FE offre une horloge de base de 1 410 MHz et peut augmenter jusqu'à 1 665 MHz. Il est possible d'augmenter la puissance cible de 200 W de 20 W supplémentaires. Comme la carte ne comporte aucune forme de RGB bling, la puissance supplémentaire est principalement utilisée par le GPU lui-même. Cela étant dit, la marge de manœuvre réelle pour l'overclocking n'est pas très grande.

Le RTX 3060 Ti offre 8 Go de VRAM GDDR6 sur un bus mémoire de 256 bits avec une largeur de bande maximale de 448 Go/s. Bien que cela puisse sembler peu par rapport aux offres haut de gamme de NVIDIA et de toutes les cartes Radeon RX 6000 d'AMD jusqu'à présent, étant donné les capacités du RTX 3060 Ti, les 8 Go de VRAM devraient suffire, à moins que vous ne soyez un adepte des applications professionnelles ou des charges de travail importantes qui peuvent nécessiter une mémoire vidéo de travail plus importante. Nous n'avons rencontré aucun problème de limitation de mémoire pendant toute la durée de nos tests

Le banc d'essai

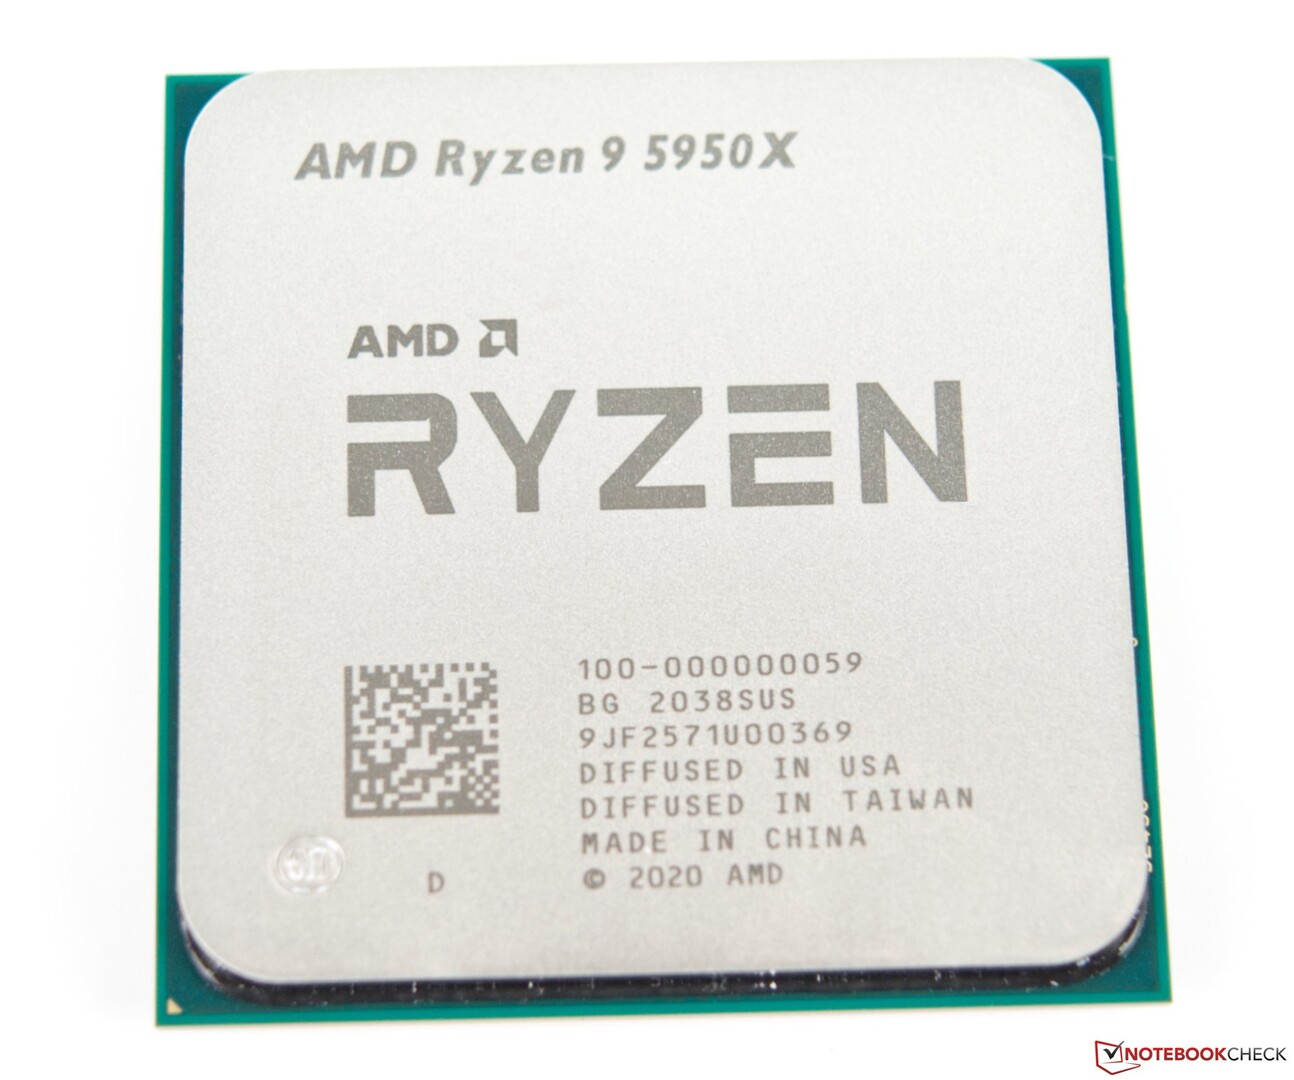
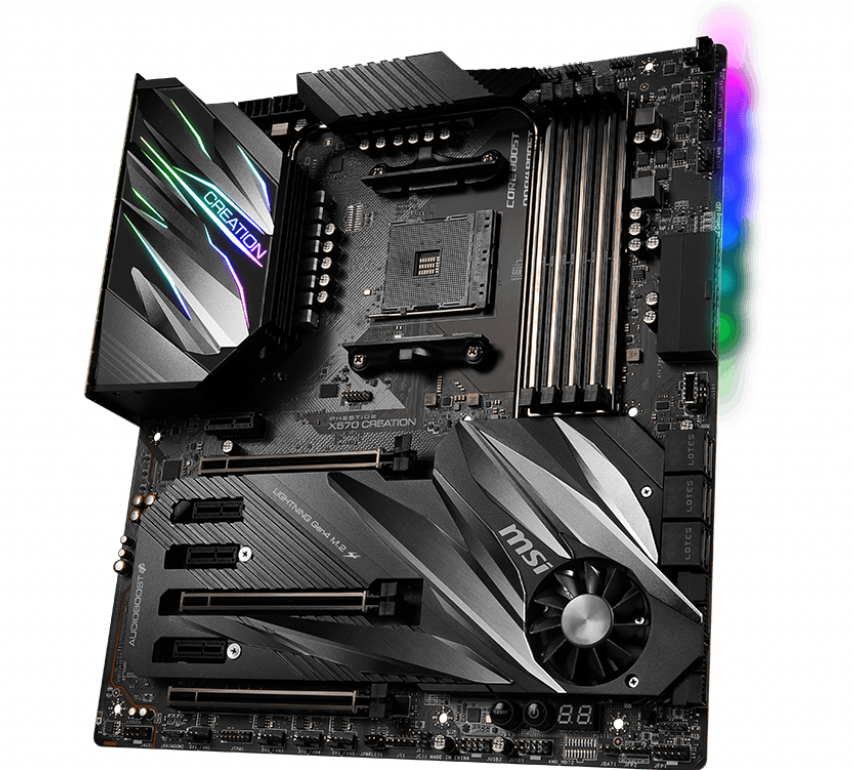
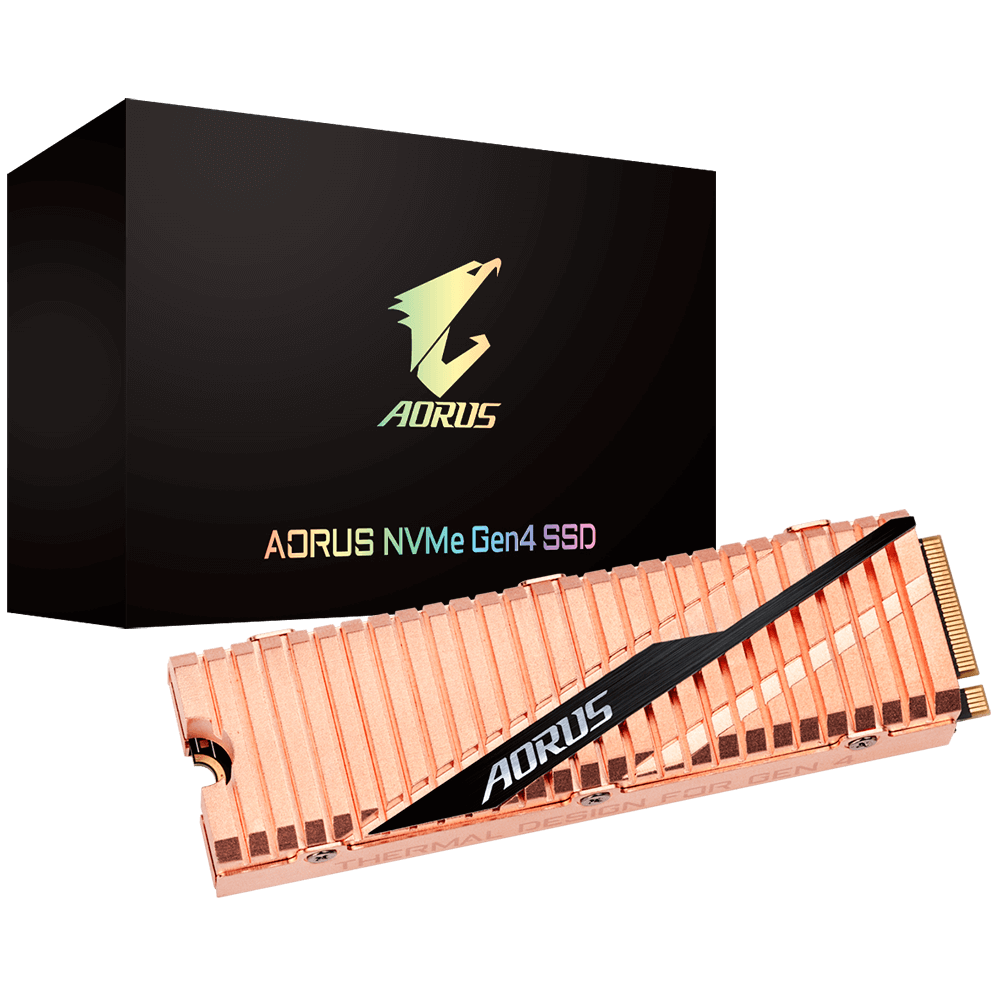
Notre banc d'essai est composé d'un processeur AMD Ryzen 9 5950X 16-core 32-thread, d'une carte mère MSI Prestige X570 Creation, de 32 Go (16 Go x2) de RAM G.SKILL Trident Z Neo DDR4-3200 (temporisations 16-19-19-39), et d'un SSD Gigabyte Aorus NVMe Gen4 1 TB

Windows 10 20H2 avec les dernières mises à jour cumulées (Build 19041.746) a été installé sur le SSD Aorus NVMe Gen4 PCIe tandis que deux SSD Crucial MX500 SATA de 1 To ont été utilisés pour l'exécution des benchmarks et des jeux.

Un refroidisseur Corsair iCUE H115i Elite Capellix AIO a permis de garder le mammouth Ryzen 9 5950X au frais. L'ensemble était logé dans un boîtier RVB Corsair iCUE 4000X avec une alimentation de choix, le Thermaltake Toughpower 850 W 80 Plus Gold. Nous avons effectué tous les tests avec le boîtier fermé pour représenter une utilisation typique.

Le RTX 3060 Ti FE a été couplé à un téléviseur intelligent OnePlus U Series 55U1 fonctionnant à 4K 60 Hz. La sortie couleur a été réglée sur le plein RGB 32 bits dans le panneau de configuration NVIDIA tandis que l'échelle du bureau Windows a été réglée à 100%.

Nous tenons à remercier AMD pour avoir fourni le processeur Ryzen 9 5950X, Corsair pour le refroidisseur iCUE Elite Capellix AIO et le boîtier iCUE 4000X, et OnePlus pour le téléviseur 4K de la série U 55U1

AMD Ryzen 9 5950X CPU
Carte mère MSI Prestige X570 Creation. (Source de l'image : MSI)
Gigaoctet Aorus NVMe Gen4 SSD. (Source de l'image : Gigaoctet)
G.SKILL Trident Z Neo DDR4-3600 RAM. (Source de l'image : G.SKILL)

Repères synthétiques

Les performances du RTX 3060 Ti sont comparables à celles du RTX 2080 Super et peuvent être jusqu'à 32 % plus rapides qu'un RTX 2060 Super, tout en étant environ 10 % plus faibles que le RTX 3070 dans les tests de 3DMark.

Une tendance similaire est également observée avec les benchmarks d'Unigine Heaven and Valley. Nous constatons que le delta de performance entre les cartes est plus élevé dans les tests DirectX que dans les tests OpenGL. Alors que le RTX 3060 Ti n'est que 8% plus rapide que le RTX 2080 Super in Heaven 4.0 DirectX, Valley 1.0 DirectX porte cette différence à un pourcentage significatif de 27%. Unigine Superposition montre que le RTX 3060 Ti est de 12 à 14 % plus lent que le RTX 3070, mais qu'il est pratiquement identique au RTX 2080 Super moyen dans tous les tests, à l'exception du 720p bas

3DMark
2560x1440 Time Spy Graphics
MSI GeForce RTX 3090 Suprim X
NVIDIA GeForce RTX 3090, R9 5900X
19571 Points +69%
Moyenne NVIDIA GeForce RTX 3090
  (18685 - 20433, n=17)
19266 Points +66%
MSI GeForce RTX 3080 Gaming X Trio
NVIDIA GeForce RTX 3080, R9 5900X
17604 Points +52%
AMD Radeon RX 6800 XT
AMD Radeon RX 6800 XT, R9 5950X
17603 Points +52%
Moyenne NVIDIA GeForce RTX 3080
  (17467 - 17604, n=2)
17536 Points +51%
AMD Ryzen 9 5900X
NVIDIA Titan RTX, R9 5900X
15283 Points +32%
KFA2 GeForce RTX 2080 Ti EX
NVIDIA GeForce RTX 2080 Ti (Desktop), R9 3900X
13744 Points +19%
Zotac Gaming GeForce RTX 3070 Twin Edge
NVIDIA GeForce RTX 3070, R9 5950X
13024 Points +12%
Moyenne NVIDIA GeForce RTX 3070
  (11043 - 13579, n=7)
12616 Points +9%
NVIDIA GeForce RTX 3060 Ti FE
NVIDIA GeForce RTX 3060 Ti, R9 5950X
11590 Points
Nvidia GeForce RTX 2080 Super
NVIDIA GeForce RTX 2080 Super (Desktop), R7 2700X
11477 Points -1%
Moyenne NVIDIA GeForce RTX 2080 Super (Desktop)
  (11313 - 11542, n=4)
11439 Points -1%
Nvidia GeForce RTX 2070 Super
NVIDIA GeForce RTX 2070 Super (Desktop), R7 2700X
10094 Points -13%
Moyenne NVIDIA GeForce RTX 2070 Super (Desktop)
  (9564 - 10094, n=8)
9846 Points -15%
Nvidia GeForce RTX 2060 Super
NVIDIA GeForce RTX 2060 Super (Desktop), R7 2700X
8795 Points -24%
AMD Radeon RX 5700 XT
AMD Radeon RX 5700 XT (Desktop), R7 2700X
8673 Points -25%
Moyenne NVIDIA GeForce RTX 2060 Super (Desktop)
  (8396 - 8795, n=7)
8631 Points -26%
KFA 2 GeForce GTX 1660 Super
NVIDIA GeForce GTX 1660 Super (Desktop), R9 3900X
6021 Points -48%
KFA2 GeForce GTX 1650 Super EX One Click OC
NVIDIA GeForce GTX 1650 Super (Desktop), R9 5900X
4632 Points -60%
3840x2160 Fire Strike Ultra Graphics
AMD Radeon RX 6800 XT
AMD Radeon RX 6800 XT, R9 5950X
12626 Points +77%
MSI GeForce RTX 3090 Suprim X
NVIDIA GeForce RTX 3090, R9 5900X
12371 Points +74%
Moyenne NVIDIA GeForce RTX 3090
  (11613 - 12587, n=14)
12289 Points +72%
Moyenne NVIDIA GeForce RTX 3080
  (10645 - 10793, n=2)
10719 Points +50%
MSI GeForce RTX 3080 Gaming X Trio
NVIDIA GeForce RTX 3080, R9 5900X
10645 Points +49%
AMD Ryzen 9 5900X
NVIDIA Titan RTX, R9 5900X
8649 Points +21%
Moyenne NVIDIA GeForce RTX 3070
  (8043 - 8483, n=5)
8250 Points +16%
Zotac Gaming GeForce RTX 3070 Twin Edge
NVIDIA GeForce RTX 3070, R9 5950X
8043 Points +13%
KFA2 GeForce RTX 2080 Ti EX
NVIDIA GeForce RTX 2080 Ti (Desktop), R9 3900X
7925 Points +11%
NVIDIA GeForce RTX 3060 Ti FE
NVIDIA GeForce RTX 3060 Ti, R9 5950X
7126 Points
Moyenne NVIDIA GeForce RTX 2080 Super (Desktop)
  (6500 - 6700, n=3)
6585 Points -8%
Nvidia GeForce RTX 2080 Super
NVIDIA GeForce RTX 2080 Super (Desktop), R7 2700X
6500 Points -9%
AMD Radeon RX 5700 XT
AMD Radeon RX 5700 XT (Desktop), R7 2700X
5955 Points -16%
Nvidia GeForce RTX 2070 Super
NVIDIA GeForce RTX 2070 Super (Desktop), R7 2700X
5786 Points -19%
Moyenne NVIDIA GeForce RTX 2070 Super (Desktop)
  (2290 - 5882, n=7)
5313 Points -25%
Nvidia GeForce RTX 2060 Super
NVIDIA GeForce RTX 2060 Super (Desktop), R7 2700X
5175 Points -27%
Moyenne NVIDIA GeForce RTX 2060 Super (Desktop)
  (5067 - 5224, n=6)
5164 Points -28%
KFA 2 GeForce GTX 1660 Super
NVIDIA GeForce GTX 1660 Super (Desktop), R9 3900X
3088 Points -57%
KFA2 GeForce GTX 1650 Super EX One Click OC
NVIDIA GeForce GTX 1650 Super (Desktop), R9 5900X
2186 Points -69%
Fire Strike Extreme Graphics
AMD Radeon RX 6800 XT
AMD Radeon RX 6800 XT, R9 5950X
25015 Points +80%
Moyenne NVIDIA GeForce RTX 3090
  (22075 - 24730, n=14)
23806 Points +71%
MSI GeForce RTX 3090 Suprim X
NVIDIA GeForce RTX 3090, R9 5900X
23114 Points +66%
Moyenne NVIDIA GeForce RTX 3080
  (20007 - 20861, n=2)
20434 Points +47%
MSI GeForce RTX 3080 Gaming X Trio
NVIDIA GeForce RTX 3080, R9 5900X
20007 Points +44%
AMD Ryzen 9 5900X
NVIDIA Titan RTX, R9 5900X
17176 Points +24%
Moyenne NVIDIA GeForce RTX 3070
  (15503 - 16276, n=5)
15859 Points +14%
KFA2 GeForce RTX 2080 Ti EX
NVIDIA GeForce RTX 2080 Ti (Desktop), R9 3900X
15603 Points +12%
Zotac Gaming GeForce RTX 3070 Twin Edge
NVIDIA GeForce RTX 3070, R9 5950X
15503 Points +12%
NVIDIA GeForce RTX 3060 Ti FE
NVIDIA GeForce RTX 3060 Ti, R9 5950X
13898 Points
Moyenne NVIDIA GeForce RTX 2080 Super (Desktop)
  (12968 - 13551, n=3)
13172 Points -5%
Nvidia GeForce RTX 2080 Super
NVIDIA GeForce RTX 2080 Super (Desktop), R7 2700X
12968 Points -7%
AMD Radeon RX 5700 XT
AMD Radeon RX 5700 XT (Desktop), R7 2700X
12209 Points -12%
Moyenne NVIDIA GeForce RTX 2070 Super (Desktop)
  (11382 - 12044, n=7)
11850 Points -15%
Nvidia GeForce RTX 2070 Super
NVIDIA GeForce RTX 2070 Super (Desktop), R7 2700X
11634 Points -16%
Moyenne NVIDIA GeForce RTX 2060 Super (Desktop)
  (10182 - 10726, n=6)
10498 Points -24%
Nvidia GeForce RTX 2060 Super
NVIDIA GeForce RTX 2060 Super (Desktop), R7 2700X
10481 Points -25%
KFA 2 GeForce GTX 1660 Super
NVIDIA GeForce GTX 1660 Super (Desktop), R9 3900X
6935 Points -50%
KFA2 GeForce GTX 1650 Super EX One Click OC
NVIDIA GeForce GTX 1650 Super (Desktop), R9 5900X
5135 Points -63%
1920x1080 Fire Strike Graphics
AMD Radeon RX 6800 XT
AMD Radeon RX 6800 XT, R9 5950X
49735 Points +77%
Moyenne NVIDIA GeForce RTX 3090
  (41298 - 49282, n=17)
46856 Points +66%
MSI GeForce RTX 3090 Suprim X
NVIDIA GeForce RTX 3090, R9 5900X
42688 Points +52%
Moyenne NVIDIA GeForce RTX 3080
  (37604 - 40910, n=2)
39257 Points +39%
MSI GeForce RTX 3080 Gaming X Trio
NVIDIA GeForce RTX 3080, R9 5900X
37604 Points +34%
AMD Ryzen 9 5900X
NVIDIA Titan RTX, R9 5900X
34722 Points +23%
KFA2 GeForce RTX 2080 Ti EX
NVIDIA GeForce RTX 2080 Ti (Desktop), R9 3900X
32081 Points +14%
Zotac Gaming GeForce RTX 3070 Twin Edge
NVIDIA GeForce RTX 3070, R9 5950X
31252 Points +11%
Moyenne NVIDIA GeForce RTX 3070
  (20357 - 33270, n=7)
28949 Points +3%
NVIDIA GeForce RTX 3060 Ti FE
NVIDIA GeForce RTX 3060 Ti, R9 5950X
28145 Points
Moyenne NVIDIA GeForce RTX 2080 Super (Desktop)
  (26824 - 28968, n=4)
27647 Points -2%
Nvidia GeForce RTX 2080 Super
NVIDIA GeForce RTX 2080 Super (Desktop), R7 2700X
27075 Points -4%
AMD Radeon RX 5700 XT
AMD Radeon RX 5700 XT (Desktop), R7 2700X
25383 Points -10%
Moyenne NVIDIA GeForce RTX 2070 Super (Desktop)
  (22819 - 25799, n=8)
24645 Points -12%
Nvidia GeForce RTX 2070 Super
NVIDIA GeForce RTX 2070 Super (Desktop), R7 2700X
24151 Points -14%
Nvidia GeForce RTX 2060 Super
NVIDIA GeForce RTX 2060 Super (Desktop), R7 2700X
21970 Points -22%
Moyenne NVIDIA GeForce RTX 2060 Super (Desktop)
  (20522 - 22764, n=7)
21970 Points -22%
KFA 2 GeForce GTX 1660 Super
NVIDIA GeForce GTX 1660 Super (Desktop), R9 3900X
15498 Points -45%
KFA2 GeForce GTX 1650 Super EX One Click OC
NVIDIA GeForce GTX 1650 Super (Desktop), R9 5900X
11688 Points -58%
Unigine Heaven 4.0
Extreme Preset DX11
Moyenne NVIDIA GeForce RTX 3090
  (272 - 315, n=11)
300 fps +59%
MSI GeForce RTX 3090 Suprim X
NVIDIA GeForce RTX 3090, R9 5900X
283.5 fps +50%
MSI GeForce RTX 3080 Gaming X Trio
NVIDIA GeForce RTX 3080, R9 5900X
252.5 fps +34%
AMD Radeon RX 6800 XT
AMD Radeon RX 6800 XT, R9 5950X
247.9 fps +31%
Moyenne NVIDIA GeForce RTX 3080
  (233 - 253, n=2)
243 fps +29%
AMD Ryzen 9 5900X
NVIDIA Titan RTX, R9 5900X
237.1 fps +26%
KFA2 GeForce RTX 2080 Ti EX
NVIDIA GeForce RTX 2080 Ti (Desktop), R9 3900X
215.2 fps +14%
Zotac Gaming GeForce RTX 3070 Twin Edge
NVIDIA GeForce RTX 3070, R9 5950X
213.7 fps +13%
Moyenne NVIDIA GeForce RTX 3070
  (196.4 - 214, n=5)
206 fps +9%
NVIDIA GeForce RTX 3060 Ti FE
NVIDIA GeForce RTX 3060 Ti, R9 5950X
188.6 (43.6min - 434.5max) fps
Nvidia GeForce RTX 2080 Super
NVIDIA GeForce RTX 2080 Super (Desktop), R7 2700X
175.2 fps -7%
Moyenne NVIDIA GeForce RTX 2080 Super (Desktop)
  ()
175.2 fps -7%
Moyenne NVIDIA GeForce RTX 2070 Super (Desktop)
  (160.1 - 172.3, n=4)
167.1 fps -11%
Nvidia GeForce RTX 2070 Super
NVIDIA GeForce RTX 2070 Super (Desktop), R7 2700X
160.1 fps -15%
Moyenne NVIDIA GeForce RTX 2060 Super (Desktop)
  (140.4 - 146.1, n=4)
143.3 fps -24%
Nvidia GeForce RTX 2060 Super
NVIDIA GeForce RTX 2060 Super (Desktop), R7 2700X
141.7 fps -25%
AMD Radeon RX 5700 XT
AMD Radeon RX 5700 XT (Desktop), R7 2700X
132.5 fps -30%
KFA 2 GeForce GTX 1660 Super
NVIDIA GeForce GTX 1660 Super (Desktop), R9 3900X
98.3 fps -48%
KFA2 GeForce GTX 1650 Super EX One Click OC
NVIDIA GeForce GTX 1650 Super (Desktop), R9 5900X
71.9 fps -62%
Extreme Preset OpenGL
MSI GeForce RTX 3090 Suprim X
NVIDIA GeForce RTX 3090, R9 5900X
273.7 fps +59%
Moyenne NVIDIA GeForce RTX 3090
  (188.2 - 284, n=10)
270 fps +57%
MSI GeForce RTX 3080 Gaming X Trio
NVIDIA GeForce RTX 3080, R9 5900X
243.2 fps +41%
Moyenne NVIDIA GeForce RTX 3080
  (232 - 243, n=2)
238 fps +38%
AMD Ryzen 9 5900X
NVIDIA Titan RTX, R9 5900X
215.1 fps +25%
KFA2 GeForce RTX 2080 Ti EX
NVIDIA GeForce RTX 2080 Ti (Desktop), R9 3900X
204.4 fps +19%
AMD Radeon RX 6800 XT
AMD Radeon RX 6800 XT, R9 5950X
204 fps +18%
Moyenne NVIDIA GeForce RTX 3070
  (187.5 - 196.1, n=4)
192.5 fps +12%
NVIDIA GeForce RTX 3060 Ti FE
NVIDIA GeForce RTX 3060 Ti, R9 5950X
172.3 (11.4min - 371.5max) fps
Nvidia GeForce RTX 2080 Super
NVIDIA GeForce RTX 2080 Super (Desktop), R7 2700X
167.5 fps -3%
Moyenne NVIDIA GeForce RTX 2080 Super (Desktop)
  ()
167.5 fps -3%
Moyenne NVIDIA GeForce RTX 2070 Super (Desktop)
  (153.5 - 157.1, n=4)
155.4 fps -10%
Nvidia GeForce RTX 2070 Super
NVIDIA GeForce RTX 2070 Super (Desktop), R7 2700X
153.5 fps -11%
Moyenne NVIDIA GeForce RTX 2060 Super (Desktop)
  (132.3 - 133.9, n=4)
133.1 fps -23%
Nvidia GeForce RTX 2060 Super
NVIDIA GeForce RTX 2060 Super (Desktop), R7 2700X
132.3 fps -23%
AMD Radeon RX 5700 XT
AMD Radeon RX 5700 XT (Desktop), R7 2700X
110.2 fps -36%
KFA 2 GeForce GTX 1660 Super
NVIDIA GeForce GTX 1660 Super (Desktop), R9 3900X
92.2 fps -46%
KFA2 GeForce GTX 1650 Super EX One Click OC
NVIDIA GeForce GTX 1650 Super (Desktop), R9 5900X
68.9 fps -60%
Unigine Valley 1.0
1920x1080 Extreme HD DirectX AA:x8
Moyenne NVIDIA GeForce RTX 3090
  (184.2 - 247, n=11)
225 fps +47%
MSI GeForce RTX 3090 Suprim X
NVIDIA GeForce RTX 3090, R9 5900X
196 fps +28%
AMD Radeon RX 6800 XT
AMD Radeon RX 6800 XT, R9 5950X
190.6 fps +24%
MSI GeForce RTX 3080 Gaming X Trio
NVIDIA GeForce RTX 3080, R9 5900X
181.8 fps +19%
AMD Ryzen 9 5900X
NVIDIA Titan RTX, R9 5900X
180.1 fps +18%
Moyenne NVIDIA GeForce RTX 3080
  (176.2 - 181.8, n=2)
179 fps +17%
Zotac Gaming GeForce RTX 3070 Twin Edge
NVIDIA GeForce RTX 3070, R9 5950X
168.1 fps +10%
Moyenne NVIDIA GeForce RTX 3070
  (155.1 - 168.5, n=5)
161.2 fps +5%
KFA2 GeForce RTX 2080 Ti EX
NVIDIA GeForce RTX 2080 Ti (Desktop), R9 3900X
159.4 fps +4%
NVIDIA GeForce RTX 3060 Ti FE
NVIDIA GeForce RTX 3060 Ti, R9 5950X
153.2 (48.2min - 297.9max) fps
Moyenne NVIDIA GeForce RTX 2070 Super (Desktop)
  (113.7 - 127.4, n=4)
122.5 fps -20%
Nvidia GeForce RTX 2080 Super
NVIDIA GeForce RTX 2080 Super (Desktop), R7 2700X
120.2 fps -22%
Moyenne NVIDIA GeForce RTX 2080 Super (Desktop)
  ()
120.2 fps -22%
Nvidia GeForce RTX 2070 Super
NVIDIA GeForce RTX 2070 Super (Desktop), R7 2700X
113.7 fps -26%
Moyenne NVIDIA GeForce RTX 2060 Super (Desktop)
  (106.9 - 114.1, n=4)
111.3 fps -27%
Nvidia GeForce RTX 2060 Super
NVIDIA GeForce RTX 2060 Super (Desktop), R7 2700X
106.9 fps -30%
AMD Radeon RX 5700 XT
AMD Radeon RX 5700 XT (Desktop), R7 2700X
106.3 fps -31%
KFA 2 GeForce GTX 1660 Super
NVIDIA GeForce GTX 1660 Super (Desktop), R9 3900X
77.6 fps -49%
KFA2 GeForce GTX 1650 Super EX One Click OC
NVIDIA GeForce GTX 1650 Super (Desktop), R9 5900X
54.1 fps -65%
1920x1080 Extreme HD Preset OpenGL AA:x8
Moyenne NVIDIA GeForce RTX 3090
  (158.8 - 226, n=10)
203 fps +53%
MSI GeForce RTX 3090 Suprim X
NVIDIA GeForce RTX 3090, R9 5900X
187.8 fps +41%
MSI GeForce RTX 3080 Gaming X Trio
NVIDIA GeForce RTX 3080, R9 5900X
172 fps +29%
Moyenne NVIDIA GeForce RTX 3080
  (163.8 - 172, n=2)
167.9 fps +26%
AMD Ryzen 9 5900X
NVIDIA Titan RTX, R9 5900X
158.5 fps +19%
AMD Radeon RX 6800 XT
AMD Radeon RX 6800 XT, R9 5950X
158.2 fps +19%
KFA2 GeForce RTX 2080 Ti EX
NVIDIA GeForce RTX 2080 Ti (Desktop), R9 3900X
145.1 fps +9%
Moyenne NVIDIA GeForce RTX 3070
  (140.2 - 144.9, n=4)
142.7 fps +7%
NVIDIA GeForce RTX 3060 Ti FE
NVIDIA GeForce RTX 3060 Ti, R9 5950X
132.9 (48.3min - 236.1max) fps
Nvidia GeForce RTX 2080 Super
NVIDIA GeForce RTX 2080 Super (Desktop), R7 2700X
114.5 fps -14%
Moyenne NVIDIA GeForce RTX 2080 Super (Desktop)
  ()
114.5 fps -14%
Moyenne NVIDIA GeForce RTX 2070 Super (Desktop)
  (105.6 - 112, n=4)
109.5 fps -18%
Nvidia GeForce RTX 2070 Super
NVIDIA GeForce RTX 2070 Super (Desktop), R7 2700X
105.6 fps -21%
Moyenne NVIDIA GeForce RTX 2060 Super (Desktop)
  (97.6 - 101.5, n=4)
99.5 fps -25%
Nvidia GeForce RTX 2060 Super
NVIDIA GeForce RTX 2060 Super (Desktop), R7 2700X
98.3 fps -26%
AMD Radeon RX 5700 XT
AMD Radeon RX 5700 XT (Desktop), R7 2700X
89.1 fps -33%
KFA 2 GeForce GTX 1660 Super
NVIDIA GeForce GTX 1660 Super (Desktop), R9 3900X
70.4 fps -47%
KFA2 GeForce GTX 1650 Super EX One Click OC
NVIDIA GeForce GTX 1650 Super (Desktop), R9 5900X
51.1 fps -62%
Unigine Superposition
7680x4320 8k Optimized
MSI GeForce RTX 3090 Suprim X
NVIDIA GeForce RTX 3090, R9 5900X
7521 Points +85%
Moyenne NVIDIA GeForce RTX 3090
  (6969 - 7521, n=11)
7144 Points +76%
MSI GeForce RTX 3080 Gaming X Trio
NVIDIA GeForce RTX 3080, R9 5900X
6346 Points +56%
Moyenne NVIDIA GeForce RTX 3080
  (6243 - 6346, n=2)
6295 Points +55%
AMD Ryzen 9 5900X
NVIDIA Titan RTX, R9 5900X
5402 Points +33%
AMD Radeon RX 6800 XT
AMD Radeon RX 6800 XT, R9 5950X
5256 Points +30%
Moyenne NVIDIA GeForce RTX 3070
  (4587 - 4695, n=5)
4624 Points +14%
Zotac Gaming GeForce RTX 3070 Twin Edge
NVIDIA GeForce RTX 3070, R9 5950X
4602 Points +13%
NVIDIA GeForce RTX 3060 Ti FE
NVIDIA GeForce RTX 3060 Ti, R9 5950X
4056 Points
Moyenne NVIDIA GeForce RTX 2080 Super (Desktop)
  ()
3989 Points -2%
Moyenne NVIDIA GeForce RTX 2070 Super (Desktop)
  (3419 - 3435, n=3)
3429 Points -15%
Moyenne NVIDIA GeForce RTX 2060 Super (Desktop)
  (2873 - 2914, n=3)
2900 Points -29%
KFA 2 GeForce GTX 1660 Super
NVIDIA GeForce GTX 1660 Super (Desktop), R9 3900X
1964 Points -52%
KFA2 GeForce GTX 1650 Super EX One Click OC
NVIDIA GeForce GTX 1650 Super (Desktop), R9 5900X
1087 Points -73%
3840x2160 4k Optimized
MSI GeForce RTX 3090 Suprim X
NVIDIA GeForce RTX 3090, R9 5900X
16868 Points +83%
Moyenne NVIDIA GeForce RTX 3090
  (15794 - 16868, n=11)
16326 Points +77%
MSI GeForce RTX 3080 Gaming X Trio
NVIDIA GeForce RTX 3080, R9 5900X
14243 Points +54%
Moyenne NVIDIA GeForce RTX 3080
  (13984 - 14243, n=2)
14114 Points +53%
AMD Radeon RX 6800 XT
AMD Radeon RX 6800 XT, R9 5950X
13471 Points +46%
AMD Ryzen 9 5900X
NVIDIA Titan RTX, R9 5900X
12186 Points +32%
Zotac Gaming GeForce RTX 3070 Twin Edge
NVIDIA GeForce RTX 3070, R9 5950X
10704 Points +16%
Moyenne NVIDIA GeForce RTX 3070
  (10544 - 10755, n=5)
10667 Points +16%
Moyenne NVIDIA GeForce RTX 2080 Super (Desktop)
  ()
9338 Points +1%
NVIDIA GeForce RTX 3060 Ti FE
NVIDIA GeForce RTX 3060 Ti, R9 5950X
9224 Points
Moyenne NVIDIA GeForce RTX 2070 Super (Desktop)
  (8096 - 8111, n=3)
8101 Points -12%
Moyenne NVIDIA GeForce RTX 2060 Super (Desktop)
  (6747 - 6863, n=3)
6811 Points -26%
KFA 2 GeForce GTX 1660 Super
NVIDIA GeForce GTX 1660 Super (Desktop), R9 3900X
4755 Points -48%
KFA2 GeForce GTX 1650 Super EX One Click OC
NVIDIA GeForce GTX 1650 Super (Desktop), R9 5900X
3724 Points -60%
1920x1080 1080p Extreme
MSI GeForce RTX 3090 Suprim X
NVIDIA GeForce RTX 3090, R9 5900X
12694 Points +78%
Moyenne NVIDIA GeForce RTX 3090
  (11806 - 12694, n=11)
12209 Points +71%
MSI GeForce RTX 3080 Gaming X Trio
NVIDIA GeForce RTX 3080, R9 5900X
10822 Points +52%
Moyenne NVIDIA GeForce RTX 3080
  (10572 - 10822, n=2)
10697 Points +50%
AMD Radeon RX 6800 XT
AMD Radeon RX 6800 XT, R9 5950X
10046 Points +41%
AMD Ryzen 9 5900X
NVIDIA Titan RTX, R9 5900X
9056 Points +27%
Moyenne NVIDIA GeForce RTX 3070
  (8276 - 8507, n=5)
8354 Points +17%
Zotac Gaming GeForce RTX 3070 Twin Edge
NVIDIA GeForce RTX 3070, R9 5950X
8336 Points +17%
NVIDIA GeForce RTX 3060 Ti FE
NVIDIA GeForce RTX 3060 Ti, R9 5950X
7142 Points
Moyenne NVIDIA GeForce RTX 2080 Super (Desktop)
  ()
7080 Points -1%
Moyenne NVIDIA GeForce RTX 2070 Super (Desktop)
  (6161 - 6178, n=3)
6169 Points -14%
Moyenne NVIDIA GeForce RTX 2060 Super (Desktop)
  (5049 - 5143, n=3)
5105 Points -29%
KFA 2 GeForce GTX 1660 Super
NVIDIA GeForce GTX 1660 Super (Desktop), R9 3900X
3171 Points -56%
KFA2 GeForce GTX 1650 Super EX One Click OC
NVIDIA GeForce GTX 1650 Super (Desktop), R9 5900X
2305 Points -68%
1920x1080 1080p High
Moyenne NVIDIA GeForce RTX 3090
  (23626 - 27207, n=11)
26018 Points +68%
MSI GeForce RTX 3090 Suprim X
NVIDIA GeForce RTX 3090, R9 5900X
25953 Points +68%
AMD Radeon RX 6800 XT
AMD Radeon RX 6800 XT, R9 5950X
22265 Points +44%
MSI GeForce RTX 3080 Gaming X Trio
NVIDIA GeForce RTX 3080, R9 5900X
21912 Points +42%
Moyenne NVIDIA GeForce RTX 3080
  (21333 - 21912, n=2)
21623 Points +40%
AMD Ryzen 9 5900X
NVIDIA Titan RTX, R9 5900X
20315 Points +31%
Zotac Gaming GeForce RTX 3070 Twin Edge
NVIDIA GeForce RTX 3070, R9 5950X
17491 Points +13%
Moyenne NVIDIA GeForce RTX 3070
  (17054 - 17491, n=5)
17312 Points +12%
Moyenne NVIDIA GeForce RTX 2080 Super (Desktop)
  ()
15558 Points +1%
NVIDIA GeForce RTX 3060 Ti FE
NVIDIA GeForce RTX 3060 Ti, R9 5950X
15479 Points
Moyenne NVIDIA GeForce RTX 2070 Super (Desktop)
  (13655 - 13832, n=3)
13765 Points -11%
Moyenne NVIDIA GeForce RTX 2060 Super (Desktop)
  (11421 - 11785, n=3)
11649 Points -25%
KFA 2 GeForce GTX 1660 Super
NVIDIA GeForce GTX 1660 Super (Desktop), R9 3900X
8212 Points -47%
KFA2 GeForce GTX 1650 Super EX One Click OC
NVIDIA GeForce GTX 1650 Super (Desktop), R9 5900X
6468 Points -58%
1280x720 720p Low
Moyenne NVIDIA GeForce RTX 3090
  (33329 - 54879, n=10)
46049 Points +20%
AMD Ryzen 9 5900X
NVIDIA Titan RTX, R9 5900X
40994 Points +7%
Zotac Gaming GeForce RTX 3070 Twin Edge
NVIDIA GeForce RTX 3070, R9 5950X
39277 Points +2%
Moyenne NVIDIA GeForce RTX 2070 Super (Desktop)
  (26742 - 45424, n=3)
38495 Points 0%
NVIDIA GeForce RTX 3060 Ti FE
NVIDIA GeForce RTX 3060 Ti, R9 5950X
38414 Points
AMD Radeon RX 6800 XT
AMD Radeon RX 6800 XT, R9 5950X
36452 Points -5%
Moyenne NVIDIA GeForce RTX 2060 Super (Desktop)
  (26634 - 40961, n=3)
35859 Points -7%
Moyenne NVIDIA GeForce RTX 3070
  (27330 - 40007, n=5)
34576 Points -10%
MSI GeForce RTX 3090 Suprim X
NVIDIA GeForce RTX 3090, R9 5900X
33329 Points -13%
MSI GeForce RTX 3080 Gaming X Trio
NVIDIA GeForce RTX 3080, R9 5900X
32183 Points -16%
Moyenne NVIDIA GeForce RTX 3080
  (30851 - 32183, n=2)
31517 Points -18%
Moyenne NVIDIA GeForce RTX 2080 Super (Desktop)
  ()
26907 Points -30%
KFA 2 GeForce GTX 1660 Super
NVIDIA GeForce GTX 1660 Super (Desktop), R9 3900X
25313 Points -34%
KFA2 GeForce GTX 1650 Super EX One Click OC
NVIDIA GeForce GTX 1650 Super (Desktop), R9 5900X
22323 Points -42%
3DMark 11 Performance
33117 points
3DMark Cloud Gate Standard Score
66922 points
3DMark Fire Strike Score
27043 points
3DMark Fire Strike Extreme Score
13790 points
3DMark Time Spy Score
11520 points
Aide

Calculer les critères de référence

Le RTX 3060 Ti FE offre des performances de calcul décentes avec des scores d'environ 25 % supérieurs dans ComputeMark par rapport au RTX 2080 Super moyen. LuxMark présente également des avantages décents, le RTX 3060 Ti FE n'étant que 6 % plus lent que le RTX 3070 moyen.

ComputeMark v2.1
1024x600 Normal, QJuliaRayTrace
Moyenne NVIDIA GeForce RTX 3090
  (16403 - 18223, n=10)
17454 Points +73%
MSI GeForce RTX 3090 Suprim X
NVIDIA GeForce RTX 3090, R9 5900X
17058 Points +69%
MSI GeForce RTX 3080 Gaming X Trio
NVIDIA GeForce RTX 3080, R9 5900X
15508 Points +54%
Moyenne NVIDIA GeForce RTX 3080
  (14718 - 15508, n=2)
15113 Points +50%
Moyenne NVIDIA GeForce RTX 3070
  (11510 - 11816, n=3)
11665 Points +16%
AMD Radeon RX 6800 XT
AMD Radeon RX 6800 XT, R9 5950X
11304 Points +12%
NVIDIA GeForce RTX 3060 Ti FE
NVIDIA GeForce RTX 3060 Ti, R9 5950X
10072 Points
KFA2 GeForce RTX 2080 Ti EX
NVIDIA GeForce RTX 2080 Ti (Desktop), R9 3900X
9104 Points -10%
Nvidia GeForce RTX 2080 Super
NVIDIA GeForce RTX 2080 Super (Desktop), R7 2700X
7258 Points -28%
Moyenne NVIDIA GeForce RTX 2080 Super (Desktop)
  ()
7258 Points -28%
Moyenne NVIDIA GeForce RTX 2070 Super (Desktop)
  (6155 - 6158, n=2)
6157 Points -39%
Nvidia GeForce RTX 2070 Super
NVIDIA GeForce RTX 2070 Super (Desktop), R7 2700X
6155 Points -39%
AMD Radeon RX 5700 XT
AMD Radeon RX 5700 XT (Desktop), R7 2700X
5761 Points -43%
Nvidia GeForce RTX 2060 Super
NVIDIA GeForce RTX 2060 Super (Desktop), R7 2700X
5271 Points -48%
Moyenne NVIDIA GeForce RTX 2060 Super (Desktop)
  (5270 - 5271, n=2)
5271 Points -48%
KFA 2 GeForce GTX 1660 Super
NVIDIA GeForce GTX 1660 Super (Desktop), R9 3900X
3656 Points -64%
KFA2 GeForce GTX 1650 Super EX One Click OC
NVIDIA GeForce GTX 1650 Super (Desktop), R9 5900X
3419 Points -66%
1024x600 Normal, Mandel Scalar
MSI GeForce RTX 3090 Suprim X
NVIDIA GeForce RTX 3090, R9 5900X
11197 Points +84%
Moyenne NVIDIA GeForce RTX 3090
  (10650 - 11564, n=10)
11162 Points +83%
AMD Radeon RX 6800 XT
AMD Radeon RX 6800 XT, R9 5950X
10018 Points +65%
MSI GeForce RTX 3080 Gaming X Trio
NVIDIA GeForce RTX 3080, R9 5900X
9938 Points +63%
Moyenne NVIDIA GeForce RTX 3080
  (9554 - 9938, n=2)
9746 Points +60%
Moyenne NVIDIA GeForce RTX 3070
  (7042 - 7314, n=3)
7169 Points +18%
NVIDIA GeForce RTX 3060 Ti FE
NVIDIA GeForce RTX 3060 Ti, R9 5950X
6087 Points
KFA2 GeForce RTX 2080 Ti EX
NVIDIA GeForce RTX 2080 Ti (Desktop), R9 3900X
5679 Points -7%
AMD Radeon RX 5700 XT
AMD Radeon RX 5700 XT (Desktop), R7 2700X
4869 Points -20%
Nvidia GeForce RTX 2080 Super
NVIDIA GeForce RTX 2080 Super (Desktop), R7 2700X
4525 Points -26%
Moyenne NVIDIA GeForce RTX 2080 Super (Desktop)
  ()
4525 Points -26%
Nvidia GeForce RTX 2070 Super
NVIDIA GeForce RTX 2070 Super (Desktop), R7 2700X
3782 Points -38%
Moyenne NVIDIA GeForce RTX 2070 Super (Desktop)
  (3748 - 3782, n=2)
3765 Points -38%
Nvidia GeForce RTX 2060 Super
NVIDIA GeForce RTX 2060 Super (Desktop), R7 2700X
3185 Points -48%
Moyenne NVIDIA GeForce RTX 2060 Super (Desktop)
  (3169 - 3185, n=2)
3177 Points -48%
KFA 2 GeForce GTX 1660 Super
NVIDIA GeForce GTX 1660 Super (Desktop), R9 3900X
2149 Points -65%
KFA2 GeForce GTX 1650 Super EX One Click OC
NVIDIA GeForce GTX 1650 Super (Desktop), R9 5900X
1984 Points -67%
1024x600 Normal, Mandel Vector
Moyenne NVIDIA GeForce RTX 3090
  (8038 - 10097, n=10)
9467 Points +98%
AMD Radeon RX 6800 XT
AMD Radeon RX 6800 XT, R9 5950X
8399 Points +76%
MSI GeForce RTX 3090 Suprim X
NVIDIA GeForce RTX 3090, R9 5900X
8341 Points +74%
MSI GeForce RTX 3080 Gaming X Trio
NVIDIA GeForce RTX 3080, R9 5900X
7540 Points +58%
Moyenne NVIDIA GeForce RTX 3080
  (7148 - 7540, n=2)
7344 Points +54%
Moyenne NVIDIA GeForce RTX 3070
  (5364 - 6266, n=3)
5707 Points +19%
NVIDIA GeForce RTX 3060 Ti FE
NVIDIA GeForce RTX 3060 Ti, R9 5950X
4782 Points
KFA2 GeForce RTX 2080 Ti EX
NVIDIA GeForce RTX 2080 Ti (Desktop), R9 3900X
4695 Points -2%
AMD Radeon RX 5700 XT
AMD Radeon RX 5700 XT (Desktop), R7 2700X
4246 Points -11%
Nvidia GeForce RTX 2080 Super
NVIDIA GeForce RTX 2080 Super (Desktop), R7 2700X
3835 Points -20%
Moyenne NVIDIA GeForce RTX 2080 Super (Desktop)
  ()
3835 Points -20%
Nvidia GeForce RTX 2070 Super
NVIDIA GeForce RTX 2070 Super (Desktop), R7 2700X
3358 Points -30%
Moyenne NVIDIA GeForce RTX 2070 Super (Desktop)
  (3348 - 3358, n=2)
3353 Points -30%
Moyenne NVIDIA GeForce RTX 2060 Super (Desktop)
  (2939 - 2948, n=2)
2944 Points -38%
Nvidia GeForce RTX 2060 Super
NVIDIA GeForce RTX 2060 Super (Desktop), R7 2700X
2939 Points -39%
KFA 2 GeForce GTX 1660 Super
NVIDIA GeForce GTX 1660 Super (Desktop), R9 3900X
2169 Points -55%
KFA2 GeForce GTX 1650 Super EX One Click OC
NVIDIA GeForce GTX 1650 Super (Desktop), R9 5900X
2060 Points -57%
1024x600 Normal, Fluid 2DTexArr
MSI GeForce RTX 3090 Suprim X
NVIDIA GeForce RTX 3090, R9 5900X
4560 Points +74%
Moyenne NVIDIA GeForce RTX 3090
  (4344 - 4608, n=10)
4492 Points +72%
MSI GeForce RTX 3080 Gaming X Trio
NVIDIA GeForce RTX 3080, R9 5900X
4159 Points +59%
Moyenne NVIDIA GeForce RTX 3080
  (4087 - 4159, n=2)
4123 Points +57%
AMD Radeon RX 6800 XT
AMD Radeon RX 6800 XT, R9 5950X
3947 Points +51%
KFA2 GeForce RTX 2080 Ti EX
NVIDIA GeForce RTX 2080 Ti (Desktop), R9 3900X
3444 Points +32%
Moyenne NVIDIA GeForce RTX 3070
  (2666 - 2706, n=3)
2692 Points +3%
Nvidia GeForce RTX 2080 Super
NVIDIA GeForce RTX 2080 Super (Desktop), R7 2700X
2655 Points +1%
Moyenne NVIDIA GeForce RTX 2080 Super (Desktop)
  ()
2655 Points +1%
NVIDIA GeForce RTX 3060 Ti FE
NVIDIA GeForce RTX 3060 Ti, R9 5950X
2619 Points
Moyenne NVIDIA GeForce RTX 2070 Super (Desktop)
  (2331 - 2354, n=2)
2343 Points -11%
Nvidia GeForce RTX 2070 Super
NVIDIA GeForce RTX 2070 Super (Desktop), R7 2700X
2331 Points -11%
Moyenne NVIDIA GeForce RTX 2060 Super (Desktop)
  (2064 - 2101, n=2)
2083 Points -20%
Nvidia GeForce RTX 2060 Super
NVIDIA GeForce RTX 2060 Super (Desktop), R7 2700X
2064 Points -21%
AMD Radeon RX 5700 XT
AMD Radeon RX 5700 XT (Desktop), R7 2700X
1960 Points -25%
KFA 2 GeForce GTX 1660 Super
NVIDIA GeForce GTX 1660 Super (Desktop), R9 3900X
1488 Points -43%
KFA2 GeForce GTX 1650 Super EX One Click OC
NVIDIA GeForce GTX 1650 Super (Desktop), R9 5900X
1015 Points -61%
1024x600 Normal, Fluid 3DTex
Moyenne NVIDIA GeForce RTX 3090
  (5246 - 5520, n=10)
5448 Points +103%
MSI GeForce RTX 3090 Suprim X
NVIDIA GeForce RTX 3090, R9 5900X
5391 Points +101%
AMD Radeon RX 6800 XT
AMD Radeon RX 6800 XT, R9 5950X
5154 Points +92%
MSI GeForce RTX 3080 Gaming X Trio
NVIDIA GeForce RTX 3080, R9 5900X
4450 Points +66%
Moyenne NVIDIA GeForce RTX 3080
  (4417 - 4450, n=2)
4434 Points +65%
KFA2 GeForce RTX 2080 Ti EX
NVIDIA GeForce RTX 2080 Ti (Desktop), R9 3900X
3589 Points +34%
Moyenne NVIDIA GeForce RTX 3070
  (2749 - 2791, n=3)
2772 Points +3%
Nvidia GeForce RTX 2080 Super
NVIDIA GeForce RTX 2080 Super (Desktop), R7 2700X
2736 Points +2%
Moyenne NVIDIA GeForce RTX 2080 Super (Desktop)
  ()
2736 Points +2%
NVIDIA GeForce RTX 3060 Ti FE
NVIDIA GeForce RTX 3060 Ti, R9 5950X
2685 Points
Moyenne NVIDIA GeForce RTX 2070 Super (Desktop)
  (2456 - 2486, n=2)
2471 Points -8%
Nvidia GeForce RTX 2070 Super
NVIDIA GeForce RTX 2070 Super (Desktop), R7 2700X
2456 Points -9%
AMD Radeon RX 5700 XT
AMD Radeon RX 5700 XT (Desktop), R7 2700X
2349 Points -13%
Moyenne NVIDIA GeForce RTX 2060 Super (Desktop)
  (2289 - 2290, n=2)
2290 Points -15%
Nvidia GeForce RTX 2060 Super
NVIDIA GeForce RTX 2060 Super (Desktop), R7 2700X
2289 Points -15%
KFA 2 GeForce GTX 1660 Super
NVIDIA GeForce GTX 1660 Super (Desktop), R9 3900X
1636 Points -39%
KFA2 GeForce GTX 1650 Super EX One Click OC
NVIDIA GeForce GTX 1650 Super (Desktop), R9 5900X
1032 Points -62%
1024x600 Normal, Score
Moyenne NVIDIA GeForce RTX 3090
  (44948 - 49118, n=9)
47804 Points +82%
MSI GeForce RTX 3090 Suprim X
NVIDIA GeForce RTX 3090, R9 5900X
46547 Points +77%
MSI GeForce RTX 3080 Gaming X Trio
NVIDIA GeForce RTX 3080, R9 5900X
41594 Points +58%
Moyenne NVIDIA GeForce RTX 3080
  (39924 - 41594, n=2)
40759 Points +55%
AMD Radeon RX 6800 XT
AMD Radeon RX 6800 XT, R9 5950X
38823 Points +48%
Moyenne NVIDIA GeForce RTX 3070
  (29330 - 30581, n=3)
30004 Points +14%
KFA2 GeForce RTX 2080 Ti EX
NVIDIA GeForce RTX 2080 Ti (Desktop), R9 3900X
26510 Points +1%
NVIDIA GeForce RTX 3060 Ti FE
NVIDIA GeForce RTX 3060 Ti, R9 5950X
26245 Points
Nvidia GeForce RTX 2080 Super
NVIDIA GeForce RTX 2080 Super (Desktop), R7 2700X
21009 Points -20%
Moyenne NVIDIA GeForce RTX 2080 Super (Desktop)
  ()
21009 Points -20%
AMD Radeon RX 5700 XT
AMD Radeon RX 5700 XT (Desktop), R7 2700X
19184 Points -27%
Moyenne NVIDIA GeForce RTX 2070 Super (Desktop)
  (18083 - 18095, n=2)
18089 Points -31%
Nvidia GeForce RTX 2070 Super
NVIDIA GeForce RTX 2070 Super (Desktop), R7 2700X
18083 Points -31%
Moyenne NVIDIA GeForce RTX 2060 Super (Desktop)
  (15749 - 15776, n=2)
15763 Points -40%
Nvidia GeForce RTX 2060 Super
NVIDIA GeForce RTX 2060 Super (Desktop), R7 2700X
15749 Points -40%
KFA 2 GeForce GTX 1660 Super
NVIDIA GeForce GTX 1660 Super (Desktop), R9 3900X
11098 Points -58%
KFA2 GeForce GTX 1650 Super EX One Click OC
NVIDIA GeForce GTX 1650 Super (Desktop), R9 5900X
9510 Points -64%
LuxMark v2.0 64Bit
Room GPUs-only
Moyenne NVIDIA GeForce RTX 3090
  (5727 - 5985, n=9)
5893 Samples/s +46%
MSI GeForce RTX 3090 Suprim X
NVIDIA GeForce RTX 3090, R9 5900X
5727 Samples/s +42%
MSI GeForce RTX 3080 Gaming X Trio
NVIDIA GeForce RTX 3080, R9 5900X
5198 Samples/s +28%
Moyenne NVIDIA GeForce RTX 3080
  (5112 - 5198, n=2)
5155 Samples/s +27%
AMD Radeon RX 6800 XT
AMD Radeon RX 6800 XT, R9 5950X
5057 Samples/s +25%
KFA2 GeForce RTX 2080 Ti EX
NVIDIA GeForce RTX 2080 Ti (Desktop), R9 3900X
4429 Samples/s +9%
NVIDIA GeForce RTX 3060 Ti FE
NVIDIA GeForce RTX 3060 Ti, R9 5950X
4046 Samples/s
Moyenne NVIDIA GeForce RTX 3070
  (2187 - 4293, n=3)
3588 Samples/s -11%
Nvidia GeForce RTX 2080 Super
NVIDIA GeForce RTX 2080 Super (Desktop), R7 2700X
3430 Samples/s -15%
Moyenne NVIDIA GeForce RTX 2080 Super (Desktop)
  ()
3430 Samples/s -15%
Nvidia GeForce RTX 2070 Super
NVIDIA GeForce RTX 2070 Super (Desktop), R7 2700X
3404 Samples/s -16%
Moyenne NVIDIA GeForce RTX 2070 Super (Desktop)
  ()
3404 Samples/s -16%
Moyenne NVIDIA GeForce RTX 2060 Super (Desktop)
  (3274 - 3278, n=2)
3276 Samples/s -19%
Nvidia GeForce RTX 2060 Super
NVIDIA GeForce RTX 2060 Super (Desktop), R7 2700X
3274 Samples/s -19%
KFA 2 GeForce GTX 1660 Super
NVIDIA GeForce GTX 1660 Super (Desktop), R9 3900X
2286 Samples/s -43%
AMD Radeon RX 5700 XT
AMD Radeon RX 5700 XT (Desktop), R7 2700X
2104 Samples/s -48%
KFA2 GeForce GTX 1650 Super EX One Click OC
NVIDIA GeForce GTX 1650 Super (Desktop), R9 5900X
1405 Samples/s -65%
Sala GPUs-only
AMD Radeon RX 6800 XT
AMD Radeon RX 6800 XT, R9 5950X
28023 Samples/s +211%
Moyenne NVIDIA GeForce RTX 3090
  (14590 - 15242, n=9)
14945 Samples/s +66%
MSI GeForce RTX 3090 Suprim X
NVIDIA GeForce RTX 3090, R9 5900X
14590 Samples/s +62%
MSI GeForce RTX 3080 Gaming X Trio
NVIDIA GeForce RTX 3080, R9 5900X
12980 Samples/s +44%
Moyenne NVIDIA GeForce RTX 3080
  (12797 - 12980, n=2)
12889 Samples/s +43%
Moyenne NVIDIA GeForce RTX 3070
  (10096 - 10115, n=3)
10107 Samples/s +12%
KFA2 GeForce RTX 2080 Ti EX
NVIDIA GeForce RTX 2080 Ti (Desktop), R9 3900X
9999 Samples/s +11%
NVIDIA GeForce RTX 3060 Ti FE
NVIDIA GeForce RTX 3060 Ti, R9 5950X
9010 Samples/s
Nvidia GeForce RTX 2080 Super
NVIDIA GeForce RTX 2080 Super (Desktop), R7 2700X
7878 Samples/s -13%
Moyenne NVIDIA GeForce RTX 2080 Super (Desktop)
  ()
7878 Samples/s -13%
Nvidia GeForce RTX 2070 Super
NVIDIA GeForce RTX 2070 Super (Desktop), R7 2700X
7594 Samples/s -16%
Moyenne NVIDIA GeForce RTX 2070 Super (Desktop)
  ()
7594 Samples/s -16%
Moyenne NVIDIA GeForce RTX 2060 Super (Desktop)
  (6980 - 7010, n=2)
6995 Samples/s -22%
Nvidia GeForce RTX 2060 Super
NVIDIA GeForce RTX 2060 Super (Desktop), R7 2700X
6980 Samples/s -23%
AMD Radeon RX 5700 XT
AMD Radeon RX 5700 XT (Desktop), R7 2700X
6188 Samples/s -31%
KFA 2 GeForce GTX 1660 Super
NVIDIA GeForce GTX 1660 Super (Desktop), R9 3900X
4490 Samples/s -50%
KFA2 GeForce GTX 1650 Super EX One Click OC
NVIDIA GeForce GTX 1650 Super (Desktop), R9 5900X
2972 Samples/s -67%
Geekbench 5.5
OpenCL Score
Moyenne NVIDIA GeForce RTX 3090
  (199930 - 224611, n=19)
214008 Points +74%
MSI GeForce RTX 3090 Suprim X
NVIDIA GeForce RTX 3090, R9 5900X
212914 Points +73%
Moyenne NVIDIA GeForce RTX 3080
  (164477 - 192091, n=2)
178284 Points +45%
MSI GeForce RTX 3080 Gaming X Trio
NVIDIA GeForce RTX 3080, R9 5900X
164477 Points +34%
AMD Radeon RX 6800 XT
AMD Radeon RX 6800 XT, R9 5950X
159072 Points +29%
AMD Ryzen 9 5900X
NVIDIA Titan RTX, R9 5900X
149070 Points +21%
Moyenne NVIDIA GeForce RTX 3070
  (134961 - 138625, n=4)
136574 Points +11%
NVIDIA GeForce RTX 3060 Ti FE
NVIDIA GeForce RTX 3060 Ti, R9 5950X
123036 Points
Moyenne NVIDIA GeForce RTX 2080 Super (Desktop)
  (118695 - 127035, n=3)
122884 Points 0%
Moyenne NVIDIA GeForce RTX 2070 Super (Desktop)
  (102914 - 132850, n=2)
117882 Points -4%
Moyenne NVIDIA GeForce RTX 2060 Super (Desktop)
  ()
88698 Points -28%
KFA2 GeForce GTX 1650 Super EX One Click OC
NVIDIA GeForce GTX 1650 Super (Desktop), R9 5900X
54745 Points -56%
Vulkan Score
Moyenne NVIDIA GeForce RTX 3090
  (62516 - 168974, n=19)
128422 Points +45%
NVIDIA GeForce RTX 3060 Ti FE
NVIDIA GeForce RTX 3060 Ti, R9 5950X
88442 Points
MSI GeForce RTX 3080 Gaming X Trio
NVIDIA GeForce RTX 3080, R9 5900X
83486 Points -6%
AMD Radeon RX 6800 XT
AMD Radeon RX 6800 XT, R9 5950X
81098 Points -8%
Moyenne NVIDIA GeForce RTX 3080
  (76596 - 83486, n=2)
80041 Points -9%
Moyenne NVIDIA GeForce RTX 2080 Super (Desktop)
  (62324 - 91321, n=3)
78667 Points -11%
Moyenne NVIDIA GeForce RTX 2070 Super (Desktop)
  (76596 - 80530, n=2)
78563 Points -11%
AMD Ryzen 9 5900X
NVIDIA Titan RTX, R9 5900X
76596 Points -13%
Moyenne NVIDIA GeForce RTX 3070
  (27460 - 107958, n=4)
71908 Points -19%
Moyenne NVIDIA GeForce RTX 2060 Super (Desktop)
  ()
65260 Points -26%
MSI GeForce RTX 3090 Suprim X
NVIDIA GeForce RTX 3090, R9 5900X
62516 Points -29%
KFA2 GeForce GTX 1650 Super EX One Click OC
NVIDIA GeForce GTX 1650 Super (Desktop), R9 5900X
0 Points -100%

Applications professionnelles

Les cartes GeForce ne sont pas vraiment destinées aux charges de travail professionnelles telles que la CAO/FAO, l'énergie, l'automobile ou les applications médicales. Cette limitation vient principalement du pilote car NVIDIA souhaiterait que les professionnels de ces domaines utilisent la gamme Quadro. Le Titan RTX, cependant, parvient à tenir son propre terrain dans les tests SPECviewperf, malgré le fait qu'il fonctionne avec les pilotes réguliers de GeForce

En examinant les tests SPECviewperf 12 et 13, nous constatons que le RTX 3060 Ti accuse un retard important par rapport à un Quadro RTX 5000 (ordinateur portable) dans les charges de travail professionnelles spécialisées, bien que ce dernier soit essentiellement une puce RTX 2080 TU104. Cependant, ceux qui travaillent sur des projets 3D Studio Max et Maya trouveront que le RTX 3060 Ti est un bon outil de travail.

SPECviewperf 2020 a semblé quelque peu difficile pour le RTX 3060 Ti FE car il s'agit d'une référence 4K. Les RTX 3080 et RTX 3090 présentent des avantages évidents, mais l'AMD Radeon RX 6800 XT est clairement le GPU grand public le plus performant en matière d'applications professionnelles

NVIDIA GeForce RTX 3060 Ti Founders Edition
NVIDIA GeForce RTX 3060 Ti, R9 5950X
MSI GeForce RTX 3080 Gaming X Trio
NVIDIA GeForce RTX 3080, R9 5900X
MSI GeForce RTX 3090 Suprim X
NVIDIA GeForce RTX 3090, R9 5900X
Nvidia GeForce RTX 2080 Super
GeForce RTX 2080 Super (Desktop), R7 2700X
AMD Ryzen 9 5900X
NVIDIA Titan RTX, R9 5900X
AMD Radeon RX 6800 XT
Radeon RX 6800 XT, R9 5950X
Acer ConceptD 9 Pro
Quadro RTX 5000 (Laptop), i9-9980HK
SPECviewperf 12
1%
20%
-9%
312%
80%
296%
1900x1060 Solidworks (sw-03)
71.1
66
-7%
72.3
2%
70.8
0%
174.9
146%
150
111%
230.1
224%
1900x1060 Siemens NX (snx-02)
12.3
12.85
4%
14.91
21%
12.26
0%
273.2
2121%
45.07
266%
258.1
1998%
1900x1060 Showcase (showcase-01)
144
180
25%
236
64%
143.6
0%
191.1
33%
223
55%
126.4
-12%
1900x1060 Medical (medical-01)
59.4
36.93
-38%
42.91
-28%
45
-24%
90.7
53%
77.3
30%
109.3
84%
1900x1060 Maya (maya-04)
197
146
-26%
184
-7%
134.8
-32%
188.3
-4%
118
-40%
179
-9%
1900x1060 Energy (energy-01)
13.9
16.35
18%
20.41
47%
13.09
-6%
28.31
104%
28.39
104%
26
87%
1900x1060 Creo (creo-01)
57.8
65.6
13%
75.4
30%
52.7
-9%
173
199%
119
106%
172.1
198%
1900x1060 Catia (catia-04)
109
116
6%
134
23%
104.2
-4%
262.7
141%
238
118%
220
102%
1900x1060 3ds Max (3dsmax-05)
252
276
10%
322
28%
225.8
-10%
292.6
16%
167
-34%
235.8
-6%
SPECviewperf 13
25%
36%
-3%
290%
91%
270%
Solidworks (sw-04)
99.6
96.5
-3%
95.3
-4%
99.6
0%
196.4
97%
193
94%
203.8
105%
Siemens NX (snx-03)
22.3
24.26
9%
27.03
21%
21.94
-2%
493.4
2113%
81.4
265%
465.3
1987%
Showcase (showcase-02)
145
204
41%
241
66%
144.5
0%
190.5
31%
232
60%
127.1
-12%
Medical (medical-02)
72.2
99
37%
105
45%
71.6
-1%
90.8
26%
130
80%
133.4
85%
Maya (maya-05)
344
440
28%
469
36%
328.7
-4%
458
33%
348
1%
340.8
-1%
Energy (energy-02)
25.6
37.87
48%
45.21
77%
23.78
-7%
52
103%
58.4
128%
57.3
124%
Creo (creo-02)
225
295
31%
316
40%
220.1
-2%
346.5
54%
276
23%
319.8
42%
Catia (catia-05)
161
190
18%
206
28%
157.7
-2%
374.8
133%
412
156%
338.9
110%
3ds Max (3dsmax-06)
252
294
17%
298
18%
227.8
-10%
291.3
16%
284
13%
232.2
-8%
SPECviewperf 2020
58%
85%
300%
107%
3840x2160 Solidworks (solidworks-05)
109
158
45%
180
65%
153
40%
108
-1%
3840x2160 Siemens NX (snx-04)
18.2
19.8
9%
22.6
24%
347
1807%
81.7
349%
3840x2160 Medical (medical-03)
11.4
18.47
62%
21.19
86%
16.42
44%
27.84
144%
3840x2160 Maya (maya-06)
215
293
36%
330
53%
257
20%
224
4%
3840x2160 Energy (energy-03)
14.5
51.7
257%
61.1
321%
58.2
301%
60.8
319%
3840x2160 Creo (creo-03)
76.6
77.6
1%
85.1
11%
113
48%
65
-15%
3840x2160 CATIA (catia-06)
37.9
50
32%
56.6
49%
78.2
106%
42.4
12%
3840x2160 3ds Max (3dsmax-07)
80.1
100
25%
135
69%
108
35%
114
42%
Moyenne finale (programmes/paramètres)
28% / 27%
47% / 46%
-6% / -6%
301% / 301%
93% / 92%
283% / 283%

Repères de jeu

D'emblée, la RTX 3060 Ti FE est très performante jusqu'à la résolution QHD Ultra dans la plupart des jeux. Les joueurs d'eSports qui préfèrent des fréquences d'images plus élevées que la résolution pourront également faire bon usage de cette carte à 1080p pour piloter des moniteurs à taux de rafraîchissement élevé. Il est également possible de jouer à 60 fps+ en 4K Ultra dans plusieurs titres tels que Champ de bataille V, Une aube nouvelle et profonde, Doom Eternalet F1 2020. Une bonne majorité des titres peuvent également être portés à 60 images par seconde et plus en 4K en modifiant les paramètres du jeu sans trop compromettre la fidélité visuelle.

Les performances du ray tracing (RT) sont inférieures de 7 % à celles d'un RTX 3070 moyen, tant que le jeu n'utilise pas le RT pour l'éclairage global, comme le montrent les résultats de L'appel du devoir : les opérations secrètes de la guerre froide et Watch Dogs Legion Repères de traçage des rayons ultraviolets 1080p. Ce delta de performance double dans les jeux qui utilisent largement l'éclairage global par traçage de rayons, tels que Métro : Exodus et Cyberpunk 2077

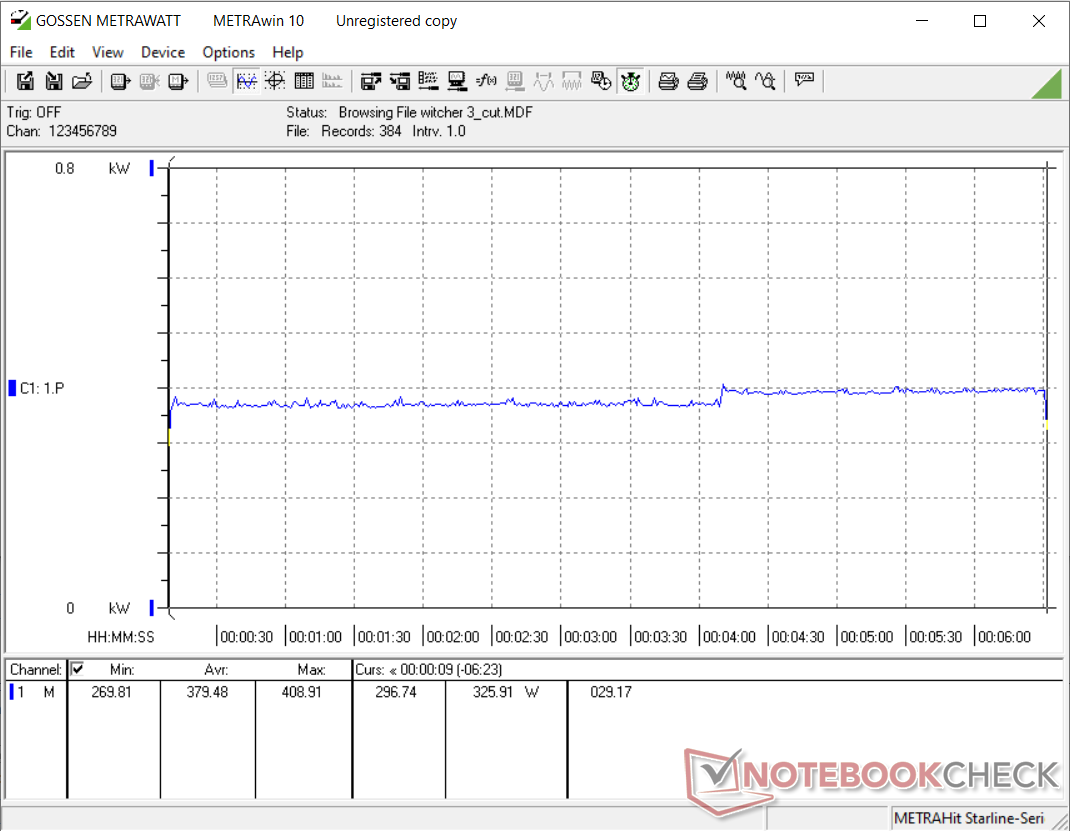
Dans Le Witcher 3 Le RTX 3060 Ti FE est considéré comme assez stable dans l'ensemble. Nous constatons que les images baissent d'environ 5 images par seconde après la moitié du test dans le graphique ci-dessous, mais l'expérience globale n'est pas très affectée. Cela indique que le refroidissement de la carte est à la hauteur de la tâche et qu'il est capable d'empêcher l'étranglement thermique

0102030405060708090100110Tooltip
NVIDIA GeForce RTX 3060 Ti Founders Edition NVIDIA GeForce RTX 3060 Ti, R9 5950X: Ø108.8 (103-113)
The Witcher 3
1920x1080 Ultra Graphics & Postprocessing (HBAO+)
Moyenne NVIDIA GeForce RTX 3090
  (160 - 192.6, n=16)
179.9 fps +65%
MSI GeForce RTX 3090 Suprim X
NVIDIA GeForce RTX 3090, R9 5900X
160 (140min - 184max) fps +47%
AMD Radeon RX 6800 XT
AMD Radeon RX 6800 XT, R9 5950X
160 (138min - 179max) fps +47%
Moyenne NVIDIA GeForce RTX 3080
  (145 - 152, n=2)
148.5 fps +36%
MSI GeForce RTX 3080 Gaming X Trio
NVIDIA GeForce RTX 3080, R9 5900X
145 (123min - 154max) fps +33%
AMD Ryzen 9 5900X
NVIDIA Titan RTX, R9 5900X
141 (127min - 154max) fps +29%
KFA2 GeForce RTX 2080 Ti EX
NVIDIA GeForce RTX 2080 Ti (Desktop), R9 3900X
135 (118min - 158max) fps +24%
Zotac Gaming GeForce RTX 3070 Twin Edge
NVIDIA GeForce RTX 3070, R9 5950X
123 (120min, 121P1 - 126max) fps +13%
Nvidia GeForce RTX 2080 Super
NVIDIA GeForce RTX 2080 Super (Desktop), R7 2700X
109 (81min - 123max) fps 0%
NVIDIA GeForce RTX 3060 Ti FE
NVIDIA GeForce RTX 3060 Ti, R9 5950X
109 (103min, 105P1 - 113max) fps
Moyenne NVIDIA GeForce RTX 2080 Super (Desktop)
  ()
109 fps 0%
Moyenne NVIDIA GeForce RTX 3070
  (52.8 - 132.2, n=7)
106.1 fps -3%
Moyenne NVIDIA GeForce RTX 2070 Super (Desktop)
  (95.6 - 109.6, n=6)
100.9 fps -7%
Nvidia GeForce RTX 2070 Super
NVIDIA GeForce RTX 2070 Super (Desktop), R7 2700X
97 (83min - 109max) fps -11%
AMD Radeon RX 5700 XT
AMD Radeon RX 5700 XT (Desktop), R7 2700X
92 (79min - 99max) fps -16%
Moyenne NVIDIA GeForce RTX 2060 Super (Desktop)
  (79 - 91.1, n=5)
84.8 fps -22%
Nvidia GeForce RTX 2060 Super
NVIDIA GeForce RTX 2060 Super (Desktop), R7 2700X
79 (67min - 89max) fps -28%
KFA 2 GeForce GTX 1660 Super
NVIDIA GeForce GTX 1660 Super (Desktop), R9 3900X
59.5 (53min - 68max) fps -45%
KFA2 GeForce GTX 1650 Super EX One Click OC
NVIDIA GeForce GTX 1650 Super (Desktop), R9 5900X
43.6 fps -60%
3840x2160 High Graphics & Postprocessing (Nvidia HairWorks Off)
Moyenne NVIDIA GeForce RTX 3090
  (128 - 160.2, n=12)
151.5 fps +86%
MSI GeForce RTX 3090 Suprim X
NVIDIA GeForce RTX 3090, R9 5900X
128 (117min - 138max) fps +57%
Moyenne NVIDIA GeForce RTX 3080
  (114 - 115, n=2)
114.5 fps +41%
MSI GeForce RTX 3080 Gaming X Trio
NVIDIA GeForce RTX 3080, R9 5900X
114 (106min - 122max) fps +40%
AMD Radeon RX 6800 XT
AMD Radeon RX 6800 XT, R9 5950X
110 (97min - 117max) fps +35%
AMD Ryzen 9 5900X
NVIDIA Titan RTX, R9 5900X
104 (97min - 112max) fps +28%
KFA2 GeForce RTX 2080 Ti EX
NVIDIA GeForce RTX 2080 Ti (Desktop), R9 3900X
96 (87min - 109max) fps +18%
Zotac Gaming GeForce RTX 3070 Twin Edge
NVIDIA GeForce RTX 3070, R9 5950X
89.6 (81min, 81P1 - 96max) fps +10%
Moyenne NVIDIA GeForce RTX 3070
  (84 - 93.9, n=5)
89.3 fps +10%
NVIDIA GeForce RTX 3060 Ti FE
NVIDIA GeForce RTX 3060 Ti, R9 5950X
81.3 (74min, 74.57P1 - 88max) fps
Nvidia GeForce RTX 2080 Super
NVIDIA GeForce RTX 2080 Super (Desktop), R7 2700X
79 (71min - 87max) fps -3%
Moyenne NVIDIA GeForce RTX 2080 Super (Desktop)
  ()
79 fps -3%
Nvidia GeForce RTX 2070 Super
NVIDIA GeForce RTX 2070 Super (Desktop), R7 2700X
68 (61min - 74max) fps -16%
Moyenne NVIDIA GeForce RTX 2070 Super (Desktop)
  (65.5 - 71, n=5)
68 fps -16%
Moyenne NVIDIA GeForce RTX 2060 Super (Desktop)
  (57 - 61, n=4)
58.8 fps -28%
Nvidia GeForce RTX 2060 Super
NVIDIA GeForce RTX 2060 Super (Desktop), R7 2700X
57 (51min - 62max) fps -30%
AMD Radeon RX 5700 XT
AMD Radeon RX 5700 XT (Desktop), R7 2700X
52.1 (47min - 57max) fps -36%
KFA 2 GeForce GTX 1660 Super
NVIDIA GeForce GTX 1660 Super (Desktop), R9 3900X
40 (36min - 44max) fps -51%
KFA2 GeForce GTX 1650 Super EX One Click OC
NVIDIA GeForce GTX 1650 Super (Desktop), R9 5900X
29.5 fps -64%
3840x2160 Ultra Graphics & Postprocessing (HBAO+)
Moyenne NVIDIA GeForce RTX 3090
  (85.4 - 98.5, n=8)
93.4 fps +75%
MSI GeForce RTX 3080 Gaming X Trio
NVIDIA GeForce RTX 3080, R9 5900X
85.7 (80min - 93max) fps +60%
MSI GeForce RTX 3090 Suprim X
NVIDIA GeForce RTX 3090, R9 5900X
85.4 (79min - 92max) fps +60%
Moyenne NVIDIA GeForce RTX 3080
  (78 - 85.7, n=2)
81.9 fps +53%
KFA2 GeForce RTX 2080 Ti EX
NVIDIA GeForce RTX 2080 Ti (Desktop), R9 3900X
65 (59min - 71max) fps +21%
Moyenne NVIDIA GeForce RTX 3070
  (59 - 60.3, n=2)
59.7 fps +12%
Zotac Gaming GeForce RTX 3070 Twin Edge
NVIDIA GeForce RTX 3070, R9 5950X
59 (53min, 53.59P1 - 64max) fps +10%
Nvidia GeForce RTX 2080 Super
NVIDIA GeForce RTX 2080 Super (Desktop), R7 2700X
55.2 (49min - 61max) fps +3%
Moyenne NVIDIA GeForce RTX 2080 Super (Desktop)
  (55.2 - 55.2, n=2)
55.2 fps +3%
NVIDIA GeForce RTX 3060 Ti FE
NVIDIA GeForce RTX 3060 Ti, R9 5950X
53.5 (49min, 49P1 - 57max) fps
Moyenne NVIDIA GeForce RTX 2070 Super (Desktop)
  (46.3 - 49.3, n=4)
47.4 fps -11%
Nvidia GeForce RTX 2070 Super
NVIDIA GeForce RTX 2070 Super (Desktop), R7 2700X
46.3 (41min - 50max) fps -13%
AMD Radeon RX 5700 XT
AMD Radeon RX 5700 XT (Desktop), R7 2700X
39.7 (35min - 43max) fps -26%
Moyenne NVIDIA GeForce RTX 2060 Super (Desktop)
  (38.4 - 42.3, n=4)
39.6 fps -26%
Nvidia GeForce RTX 2060 Super
NVIDIA GeForce RTX 2060 Super (Desktop), R7 2700X
38.4 (32min - 42max) fps -28%
KFA 2 GeForce GTX 1660 Super
NVIDIA GeForce GTX 1660 Super (Desktop), R9 3900X
27 (24min - 31max) fps -50%
Shadow of the Tomb Raider
3840x2160 Highest Preset AA:T
Moyenne NVIDIA GeForce RTX 3090
  (89.3 - 99.7, n=12)
96.4 fps +72%
MSI GeForce RTX 3090 Suprim X
NVIDIA GeForce RTX 3090, R9 5900X
95.6 fps +71%
MSI GeForce RTX 3080 Gaming X Trio
NVIDIA GeForce RTX 3080, R9 5900X
87.9 fps +57%
Moyenne NVIDIA GeForce RTX 3080
  (83.9 - 87.9, n=2)
85.9 fps +53%
AMD Radeon RX 6800 XT
AMD Radeon RX 6800 XT, R9 5950X
79.6 fps +42%
AMD Ryzen 9 5900X
NVIDIA Titan RTX, R9 5900X
66.3 fps +18%
Moyenne NVIDIA GeForce RTX 3070
  (61 - 63.5, n=4)
62.3 fps +11%
Zotac Gaming GeForce RTX 3070 Twin Edge
NVIDIA GeForce RTX 3070, R9 5950X
62 fps +11%
KFA2 GeForce RTX 2080 Ti EX
NVIDIA GeForce RTX 2080 Ti (Desktop), R9 3900X
60 fps +7%
NVIDIA GeForce RTX 3060 Ti FE
NVIDIA GeForce RTX 3060 Ti, R9 5950X
56 fps
Nvidia GeForce RTX 2080 Super
NVIDIA GeForce RTX 2080 Super (Desktop), R7 2700X
49 fps -12%
Moyenne NVIDIA GeForce RTX 2080 Super (Desktop)
  (49 - 49, n=2)
49 fps -12%
Moyenne NVIDIA GeForce RTX 2070 Super (Desktop)
  (43 - 47.9, n=5)
45.5 fps -19%
Nvidia GeForce RTX 2070 Super
NVIDIA GeForce RTX 2070 Super (Desktop), R7 2700X
43 fps -23%
Moyenne NVIDIA GeForce RTX 2060 Super (Desktop)
  (36 - 40.2, n=4)
38.2 fps -32%
AMD Radeon RX 5700 XT
AMD Radeon RX 5700 XT (Desktop), R7 2700X
38 fps -32%
Nvidia GeForce RTX 2060 Super
NVIDIA GeForce RTX 2060 Super (Desktop), R7 2700X
36 fps -36%
KFA 2 GeForce GTX 1660 Super
NVIDIA GeForce GTX 1660 Super (Desktop), R9 3900X
26 fps -54%
KFA2 GeForce GTX 1650 Super EX One Click OC
NVIDIA GeForce GTX 1650 Super (Desktop), R9 5900X
19 fps -66%
2560x1440 Highest Preset AA:T
Moyenne NVIDIA GeForce RTX 3090
  (137 - 172.3, n=12)
165.6 fps +61%
MSI GeForce RTX 3090 Suprim X
NVIDIA GeForce RTX 3090, R9 5900X
162 fps +57%
MSI GeForce RTX 3080 Gaming X Trio
NVIDIA GeForce RTX 3080, R9 5900X
152 fps +48%
Moyenne NVIDIA GeForce RTX 3080
  (147 - 152, n=2)
149.5 fps +45%
AMD Radeon RX 6800 XT
AMD Radeon RX 6800 XT, R9 5950X
148 fps +44%
AMD Ryzen 9 5900X
NVIDIA Titan RTX, R9 5900X
120 fps +17%
Zotac Gaming GeForce RTX 3070 Twin Edge
NVIDIA GeForce RTX 3070, R9 5950X
114 fps +11%
Moyenne NVIDIA GeForce RTX 3070
  (108 - 116, n=4)
113.2 fps +10%
KFA2 GeForce RTX 2080 Ti EX
NVIDIA GeForce RTX 2080 Ti (Desktop), R9 3900X
108 fps +5%
NVIDIA GeForce RTX 3060 Ti FE
NVIDIA GeForce RTX 3060 Ti, R9 5950X
103 fps
Moyenne NVIDIA GeForce RTX 2080 Super (Desktop)
  (91 - 92, n=2)
91.5 fps -11%
Nvidia GeForce RTX 2080 Super
NVIDIA GeForce RTX 2080 Super (Desktop), R7 2700X
91 fps -12%
Moyenne NVIDIA GeForce RTX 2070 Super (Desktop)
  (81 - 89.6, n=5)
85.4 fps -17%
Nvidia GeForce RTX 2070 Super
NVIDIA GeForce RTX 2070 Super (Desktop), R7 2700X
81 fps -21%
AMD Radeon RX 5700 XT
AMD Radeon RX 5700 XT (Desktop), R7 2700X
76 fps -26%
Moyenne NVIDIA GeForce RTX 2060 Super (Desktop)
  (69 - 75.7, n=4)
72.3 fps -30%
Nvidia GeForce RTX 2060 Super
NVIDIA GeForce RTX 2060 Super (Desktop), R7 2700X
69 fps -33%
KFA 2 GeForce GTX 1660 Super
NVIDIA GeForce GTX 1660 Super (Desktop), R9 3900X
53 fps -49%
KFA2 GeForce GTX 1650 Super EX One Click OC
NVIDIA GeForce GTX 1650 Super (Desktop), R9 5900X
40 fps -61%
1920x1080 Highest Preset AA:T
Moyenne NVIDIA GeForce RTX 3090
  (145 - 240, n=14)
204 fps +41%
AMD Radeon RX 6800 XT
AMD Radeon RX 6800 XT, R9 5950X
194 fps +34%
MSI GeForce RTX 3090 Suprim X
NVIDIA GeForce RTX 3090, R9 5900X
188 fps +30%
Moyenne NVIDIA GeForce RTX 3080
  (177 - 185, n=2)
181 fps +25%
MSI GeForce RTX 3080 Gaming X Trio
NVIDIA GeForce RTX 3080, R9 5900X
177 fps +22%
AMD Ryzen 9 5900X
NVIDIA Titan RTX, R9 5900X
166 fps +14%
Moyenne NVIDIA GeForce RTX 3070
  (138 - 160, n=4)
151.3 fps +4%
Zotac Gaming GeForce RTX 3070 Twin Edge
NVIDIA GeForce RTX 3070, R9 5950X
150 fps +3%
NVIDIA GeForce RTX 3060 Ti FE
NVIDIA GeForce RTX 3060 Ti, R9 5950X
145 fps
KFA2 GeForce RTX 2080 Ti EX
NVIDIA GeForce RTX 2080 Ti (Desktop), R9 3900X
130 fps -10%
Moyenne NVIDIA GeForce RTX 2070 Super (Desktop)
  (104 - 131.1, n=5)
119.7 fps -17%
Moyenne NVIDIA GeForce RTX 2080 Super (Desktop)
  (110 - 118, n=2)
114 fps -21%
Nvidia GeForce RTX 2080 Super
NVIDIA GeForce RTX 2080 Super (Desktop), R7 2700X
110 fps -24%
AMD Radeon RX 5700 XT
AMD Radeon RX 5700 XT (Desktop), R7 2700X
110 fps -24%
Moyenne NVIDIA GeForce RTX 2060 Super (Desktop)
  (96 - 111.4, n=4)
105.2 fps -27%
Nvidia GeForce RTX 2070 Super
NVIDIA GeForce RTX 2070 Super (Desktop), R7 2700X
104 fps -28%
Nvidia GeForce RTX 2060 Super
NVIDIA GeForce RTX 2060 Super (Desktop), R7 2700X
96 fps -34%
KFA 2 GeForce GTX 1660 Super
NVIDIA GeForce GTX 1660 Super (Desktop), R9 3900X
80 fps -45%
KFA2 GeForce GTX 1650 Super EX One Click OC
NVIDIA GeForce GTX 1650 Super (Desktop), R9 5900X
63 fps -57%
Borderlands 3
3840x2160 Badass Overall Quality (DX11)
MSI GeForce RTX 3090 Suprim X
NVIDIA GeForce RTX 3090, R9 5900X
73.4 fps +91%
Moyenne NVIDIA GeForce RTX 3090
  (68 - 75.3, n=13)
72.8 fps +90%
MSI GeForce RTX 3080 Gaming X Trio
NVIDIA GeForce RTX 3080, R9 5900X
61.9 fps +61%
Moyenne NVIDIA GeForce RTX 3080
  (61.5 - 61.9, n=2)
61.7 fps +61%
AMD Radeon RX 6800 XT
AMD Radeon RX 6800 XT, R9 5950X
53.6 fps +40%
AMD Ryzen 9 5900X
NVIDIA Titan RTX, R9 5900X
46.7 fps +22%
Zotac Gaming GeForce RTX 3070 Twin Edge
NVIDIA GeForce RTX 3070, R9 5950X
44.5 fps +16%
Moyenne NVIDIA GeForce RTX 3070
  (42.7 - 46.3, n=5)
44.3 fps +15%
KFA2 GeForce RTX 2080 Ti EX
NVIDIA GeForce RTX 2080 Ti (Desktop), R9 3900X
43.6 fps +14%
NVIDIA GeForce RTX 3060 Ti FE
NVIDIA GeForce RTX 3060 Ti, R9 5950X
38.4 fps
Moyenne NVIDIA GeForce RTX 2080 Super (Desktop)
  ()
35.9 fps -7%
Moyenne NVIDIA GeForce RTX 2070 Super (Desktop)
  (29.5 - 32.7, n=5)
31.3 fps -18%
Moyenne NVIDIA GeForce RTX 2060 Super (Desktop)
  (26.3 - 27.8, n=4)
27.3 fps -29%
KFA 2 GeForce GTX 1660 Super
NVIDIA GeForce GTX 1660 Super (Desktop), R9 3900X
12 fps -69%
KFA2 GeForce GTX 1650 Super EX One Click OC
NVIDIA GeForce GTX 1650 Super (Desktop), R9 5900X
7.87 fps -80%
2560x1440 Badass Overall Quality (DX11)
Moyenne NVIDIA GeForce RTX 3090
  (105 - 131.6, n=13)
123.8 fps +76%
MSI GeForce RTX 3090 Suprim X
NVIDIA GeForce RTX 3090, R9 5900X
117 fps +67%
Moyenne NVIDIA GeForce RTX 3080
  (95.7 - 103, n=2)
99.4 fps +42%
MSI GeForce RTX 3080 Gaming X Trio
NVIDIA GeForce RTX 3080, R9 5900X
95.7 fps +36%
AMD Radeon RX 6800 XT
AMD Radeon RX 6800 XT, R9 5950X
93.6 fps +33%
AMD Ryzen 9 5900X
NVIDIA Titan RTX, R9 5900X
84.7 fps +21%
Zotac Gaming GeForce RTX 3070 Twin Edge
NVIDIA GeForce RTX 3070, R9 5950X
79 fps +13%
KFA2 GeForce RTX 2080 Ti EX
NVIDIA GeForce RTX 2080 Ti (Desktop), R9 3900X
78 fps +11%
Moyenne NVIDIA GeForce RTX 3070
  (75.1 - 82.9, n=5)
77.7 fps +11%
NVIDIA GeForce RTX 3060 Ti FE
NVIDIA GeForce RTX 3060 Ti, R9 5950X
70.2 fps
Moyenne NVIDIA GeForce RTX 2080 Super (Desktop)
  ()
65.5 fps -7%
Moyenne NVIDIA GeForce RTX 2070 Super (Desktop)
  (53.7 - 60.3, n=5)
57.3 fps -18%
Moyenne NVIDIA GeForce RTX 2060 Super (Desktop)
  (48.8 - 51.7, n=4)
50.2 fps -28%
KFA 2 GeForce GTX 1660 Super
NVIDIA GeForce GTX 1660 Super (Desktop), R9 3900X
33 fps -53%
KFA2 GeForce GTX 1650 Super EX One Click OC
NVIDIA GeForce GTX 1650 Super (Desktop), R9 5900X
23.3 fps -67%
1920x1080 Badass Overall Quality (DX11)
Moyenne NVIDIA GeForce RTX 3090
  (117 - 170.1, n=13)
150.7 fps +57%
MSI GeForce RTX 3090 Suprim X
NVIDIA GeForce RTX 3090, R9 5900X
135 fps +41%
Moyenne NVIDIA GeForce RTX 3080
  (117 - 128, n=2)
122.5 fps +28%
AMD Radeon RX 6800 XT
AMD Radeon RX 6800 XT, R9 5950X
120 fps +25%
AMD Ryzen 9 5900X
NVIDIA Titan RTX, R9 5900X
118 fps +23%
MSI GeForce RTX 3080 Gaming X Trio
NVIDIA GeForce RTX 3080, R9 5900X
117 fps +22%
Zotac Gaming GeForce RTX 3070 Twin Edge
NVIDIA GeForce RTX 3070, R9 5950X
104 fps +8%
KFA2 GeForce RTX 2080 Ti EX
NVIDIA GeForce RTX 2080 Ti (Desktop), R9 3900X
101.3 fps +6%
Moyenne NVIDIA GeForce RTX 3070
  (95.3 - 108.9, n=5)
100.6 fps +5%
NVIDIA GeForce RTX 3060 Ti FE
NVIDIA GeForce RTX 3060 Ti, R9 5950X
96 fps
Moyenne NVIDIA GeForce RTX 2080 Super (Desktop)
  ()
91 fps -5%
Moyenne NVIDIA GeForce RTX 2070 Super (Desktop)
  (74.3 - 86, n=5)
80.9 fps -16%
Moyenne NVIDIA GeForce RTX 2060 Super (Desktop)
  (68.6 - 74.1, n=4)
71.2 fps -26%
KFA 2 GeForce GTX 1660 Super
NVIDIA GeForce GTX 1660 Super (Desktop), R9 3900X
50 fps -48%
KFA2 GeForce GTX 1650 Super EX One Click OC
NVIDIA GeForce GTX 1650 Super (Desktop), R9 5900X
39.8 fps -59%
Call of Duty Black Ops Cold War
1920x1080 Highest Settings + Ultra Ray Tracing
AMD Ryzen 9 5900X
NVIDIA Titan RTX, R9 5900X
119 fps +79%
Moyenne NVIDIA GeForce RTX 3090
  (88.3 - 89, n=2)
88.7 fps +33%
MSI GeForce RTX 3090 Suprim X
NVIDIA GeForce RTX 3090, R9 5900X
88.3 (22.4min, 29.5P0.1, 44.8P1 - 267max) fps +33%
MSI GeForce RTX 3080 Gaming X Trio
NVIDIA GeForce RTX 3080, R9 5900X
81.9 (17.3min, 30.1P0.1, 42.6P1 - 248max) fps +23%
Moyenne NVIDIA GeForce RTX 3080
  ()
81.9 fps +23%
Zotac Gaming GeForce RTX 3070 Twin Edge
NVIDIA GeForce RTX 3070, R9 5950X
70.1 (23.8min, 27.5P0.1, 42.6P1 - 217max) fps +5%
NVIDIA GeForce RTX 3060 Ti FE
NVIDIA GeForce RTX 3060 Ti, R9 5950X
66.5 (32.4min, 39.6P0.1, 45.3P1 - 224max) fps
Moyenne NVIDIA GeForce RTX 3070
  (49.8 - 70.1, n=3)
62.8 fps -6%
Moyenne NVIDIA GeForce RTX 2080 Super (Desktop)
  ()
59 fps -11%
Moyenne NVIDIA GeForce RTX 2070 Super (Desktop)
  ()
55.6 fps -16%
Moyenne NVIDIA GeForce RTX 2060 Super (Desktop)
  ()
44.7 fps -33%
AMD Radeon RX 6800 XT
AMD Radeon RX 6800 XT, R9 5950X
21.8 (8.8min, 9.61P0.1, 16.2P1 - 49.5max) fps -67%
3840x2160 Highest Settings
MSI GeForce RTX 3090 Suprim X
NVIDIA GeForce RTX 3090, R9 5900X
76.1 (42.1min, 58.7P0.1, 61.9P1 - 221max) fps +69%
Moyenne NVIDIA GeForce RTX 3090
  (74.6 - 76.1, n=2)
75.4 fps +68%
MSI GeForce RTX 3080 Gaming X Trio
NVIDIA GeForce RTX 3080, R9 5900X
65.6 (13.8min, 17.5P0.1, 51.4P1 - 229max) fps +46%
Moyenne NVIDIA GeForce RTX 3080
  ()
65.6 fps +46%
AMD Radeon RX 6800 XT
AMD Radeon RX 6800 XT, R9 5950X
64 (10.8min, 11.6P0.1, 50.8P1 - 159max) fps +43%
Moyenne NVIDIA GeForce RTX 3070
  (43.8 - 74, n=3)
56 fps +25%
AMD Ryzen 9 5900X
NVIDIA Titan RTX, R9 5900X
52.9 fps +18%
NVIDIA GeForce RTX 3060 Ti FE
NVIDIA GeForce RTX 3060 Ti, R9 5950X
44.9 (17.1min, 19.2P0.1, 34.5P1 - 84.4max) fps
Zotac Gaming GeForce RTX 3070 Twin Edge
NVIDIA GeForce RTX 3070, R9 5950X
43.8 (16.7min, 17.4P0.1, 33.8P1 - 80.3max) fps -2%
Moyenne NVIDIA GeForce RTX 2080 Super (Desktop)
  (38 - 44.5, n=2)
41.3 fps -8%
Moyenne NVIDIA GeForce RTX 2070 Super (Desktop)
  ()
37.6 fps -16%
Moyenne NVIDIA GeForce RTX 2060 Super (Desktop)
  ()
17.3 fps -61%
KFA2 GeForce GTX 1650 Super EX One Click OC
NVIDIA GeForce GTX 1650 Super (Desktop), R9 5900X
2 fps -96%
2560x1440 Highest Settings
Moyenne NVIDIA GeForce RTX 3090
  (122 - 124.7, n=2)
123.4 fps +50%
MSI GeForce RTX 3090 Suprim X
NVIDIA GeForce RTX 3090, R9 5900X
122 (54.5min, 84.4P0.1, 93.9P1 - 258max) fps +49%
MSI GeForce RTX 3080 Gaming X Trio
NVIDIA GeForce RTX 3080, R9 5900X
104 (19.1min, 20.4P0.1, 77.7P1 - 258max) fps +27%
Moyenne NVIDIA GeForce RTX 3080
  ()
104 fps +27%
Moyenne NVIDIA GeForce RTX 3070
  (83 - 107, n=3)
93.2 fps +14%
Zotac Gaming GeForce RTX 3070 Twin Edge
NVIDIA GeForce RTX 3070, R9 5950X
89.5 (40.5min, 65.1P0.1, 70.3P1 - 219max) fps +9%
AMD Ryzen 9 5900X
NVIDIA Titan RTX, R9 5900X
87.6 fps +7%
NVIDIA GeForce RTX 3060 Ti FE
NVIDIA GeForce RTX 3060 Ti, R9 5950X
82.1 (38.4min, 57P0.1, 63.5P1 - 233max) fps
AMD Radeon RX 6800 XT
AMD Radeon RX 6800 XT, R9 5950X
80.4 (16.5min, 31.8P0.1, 64.3P1 - 285max) fps -2%
Moyenne NVIDIA GeForce RTX 2070 Super (Desktop)
  ()
67.7 fps -18%
Moyenne NVIDIA GeForce RTX 2080 Super (Desktop)
  (51 - 77.6, n=2)
64.3 fps -22%
Moyenne NVIDIA GeForce RTX 2060 Super (Desktop)
  ()
53.2 fps -35%
KFA2 GeForce GTX 1650 Super EX One Click OC
NVIDIA GeForce GTX 1650 Super (Desktop), R9 5900X
26 fps -68%
1920x1080 Highest Settings
Moyenne NVIDIA GeForce RTX 3090
  (161 - 161.1, n=2)
161.1 fps +46%
MSI GeForce RTX 3090 Suprim X
NVIDIA GeForce RTX 3090, R9 5900X
161 (59.8min, 96.1P0.1, 111P1 - 312max) fps +46%
AMD Ryzen 9 5900X
NVIDIA Titan RTX, R9 5900X
144 fps +31%
AMD Radeon RX 6800 XT
AMD Radeon RX 6800 XT, R9 5950X
144 (58.7min, 90.7P0.1, 105P1 - 365max) fps +31%
MSI GeForce RTX 3080 Gaming X Trio
NVIDIA GeForce RTX 3080, R9 5900X
127 (21.9min, 24.4P0.1, 83.5P1 - 285max) fps +15%
Moyenne NVIDIA GeForce RTX 3080
  ()
127 fps +15%
Zotac Gaming GeForce RTX 3070 Twin Edge
NVIDIA GeForce RTX 3070, R9 5950X
120 (49.7min, 76.4P0.1, 85.7P1 - 245max) fps +9%
Moyenne NVIDIA GeForce RTX 3070
  (95.7 - 122, n=3)
112.6 fps +2%
NVIDIA GeForce RTX 3060 Ti FE
NVIDIA GeForce RTX 3060 Ti, R9 5950X
110 (46.1min, 67.8P0.1, 79.3P1 - 288max) fps
Moyenne NVIDIA GeForce RTX 2070 Super (Desktop)
  ()
92.7 fps -16%
Moyenne NVIDIA GeForce RTX 2080 Super (Desktop)
  (59 - 106, n=2)
82.5 fps -25%
Moyenne NVIDIA GeForce RTX 2060 Super (Desktop)
  ()
73 fps -34%
KFA2 GeForce GTX 1650 Super EX One Click OC
NVIDIA GeForce GTX 1650 Super (Desktop), R9 5900X
37 fps -66%
Watch Dogs Legion
1920x1080 Ultra Preset + Ultra Ray Tracing (DX12)
Moyenne NVIDIA GeForce RTX 3090
  (75.7 - 110, n=3)
88 fps +82%
MSI GeForce RTX 3090 Suprim X
NVIDIA GeForce RTX 3090, R9 5900X
78.2 (53.58min, 63.39P1 - 115.63max) fps +62%
AMD Radeon RX 6800 XT
AMD Radeon RX 6800 XT, R9 5950X
71.4 (47.71min, 55.63P1 - 113.42max) fps +48%
MSI GeForce RTX 3080 Gaming X Trio
NVIDIA GeForce RTX 3080, R9 5900X
71.3 (24.22min, 56.02P1 - 112.08max) fps +48%
Moyenne NVIDIA GeForce RTX 3080
  (70.9 - 71.3, n=2)
71.1 fps +47%
Moyenne NVIDIA GeForce RTX 3070
  (51.7 - 61, n=4)
55.1 fps +14%
Zotac Gaming GeForce RTX 3070 Twin Edge
NVIDIA GeForce RTX 3070, R9 5950X
51.7 (15.03min, 25.28P1 - 71.97max) fps +7%
NVIDIA GeForce RTX 3060 Ti FE
NVIDIA GeForce RTX 3060 Ti, R9 5950X
48.3 (26.43min, 38.03P1 - 84.29max) fps
Moyenne NVIDIA GeForce RTX 2080 Super (Desktop)
  ()
45.4 fps -6%
Moyenne NVIDIA GeForce RTX 2070 Super (Desktop)
  ()
39.2 fps -19%
Moyenne NVIDIA GeForce RTX 2060 Super (Desktop)
  ()
33.7 fps -30%
KFA 2 GeForce GTX 1660 Super
NVIDIA GeForce GTX 1660 Super (Desktop), R9 3900X
11.7 (7.26min, 8.31P1 - 16.29max) fps -76%
3840x2160 Ultra Preset (DX12)
Moyenne NVIDIA GeForce RTX 3090
  (57.6 - 64, n=3)
60.6 fps +84%
MSI GeForce RTX 3090 Suprim X
NVIDIA GeForce RTX 3090, R9 5900X
60.3 (34.68min, 51.05P1 - 78.14max) fps +83%
Moyenne NVIDIA GeForce RTX 3080
  (53.5 - 54.1, n=2)
53.8 fps +63%
MSI GeForce RTX 3080 Gaming X Trio
NVIDIA GeForce RTX 3080, R9 5900X
53.5 (33.98min, 42.85P1 - 79.6max) fps +62%
AMD Radeon RX 6800 XT
AMD Radeon RX 6800 XT, R9 5950X
49.3 (32.85min, 41.54P1 - 76.12max) fps +49%
Zotac Gaming GeForce RTX 3070 Twin Edge
NVIDIA GeForce RTX 3070, R9 5950X
38.9 (22.74min, 31.31P1 - 54.01max) fps +18%
Moyenne NVIDIA GeForce RTX 3070
  (37 - 39.2, n=4)
38 fps +15%
Moyenne NVIDIA GeForce RTX 2080 Super (Desktop)
  ()
34.4 fps +4%
NVIDIA GeForce RTX 3060 Ti FE
NVIDIA GeForce RTX 3060 Ti, R9 5950X
33 (17.58min, 22.09P1 - 51.23max) fps
Moyenne NVIDIA GeForce RTX 2070 Super (Desktop)
  ()
29.2 fps -12%
Moyenne NVIDIA GeForce RTX 2060 Super (Desktop)
  ()
24.7 fps -25%
KFA 2 GeForce GTX 1660 Super
NVIDIA GeForce GTX 1660 Super (Desktop), R9 3900X
12.3 (6.74min, 8.44P1 - 72.77max) fps -63%
KFA2 GeForce GTX 1650 Super EX One Click OC
NVIDIA GeForce GTX 1650 Super (Desktop), R9 5900X
8.09 (4.22min, 5.13P1 - 78.77max) fps -75%
2560x1440 Ultra Preset (DX12)
Moyenne NVIDIA GeForce RTX 3090
  (88.3 - 103, n=3)
93.7 fps +59%
MSI GeForce RTX 3090 Suprim X
NVIDIA GeForce RTX 3090, R9 5900X
89.7 (59.87min, 73.02P1 - 132.92max) fps +52%
AMD Radeon RX 6800 XT
AMD Radeon RX 6800 XT, R9 5950X
84.5 (58.88min, 69.45P1 - 137.16max) fps +43%
Moyenne NVIDIA GeForce RTX 3080
  (81.1 - 81.6, n=2)
81.4 fps +38%
MSI GeForce RTX 3080 Gaming X Trio
NVIDIA GeForce RTX 3080, R9 5900X
81.1 (46.24min, 61.45P1 - 140.66max) fps +37%
Moyenne NVIDIA GeForce RTX 3070
  (65.3 - 67, n=4)
66.1 fps +12%
Zotac Gaming GeForce RTX 3070 Twin Edge
NVIDIA GeForce RTX 3070, R9 5950X
65.3 (41.29min, 53.17P1 - 88.97max) fps +10%
NVIDIA GeForce RTX 3060 Ti FE
NVIDIA GeForce RTX 3060 Ti, R9 5950X
59.1 (34.72min, 48.11P1 - 97.67max) fps
Moyenne NVIDIA GeForce RTX 2080 Super (Desktop)
  ()
57.3 fps -3%
Moyenne NVIDIA GeForce RTX 2070 Super (Desktop)
  ()
51.4 fps -13%
Moyenne NVIDIA GeForce RTX 2060 Super (Desktop)
  ()
43.7 fps -26%
KFA 2 GeForce GTX 1660 Super
NVIDIA GeForce GTX 1660 Super (Desktop), R9 3900X
23.5 (14.14min, 15.64P1 - 42max) fps -60%
KFA2 GeForce GTX 1650 Super EX One Click OC
NVIDIA GeForce GTX 1650 Super (Desktop), R9 5900X
14.3 (6.88min, 8.73P1 - 63.4max) fps -76%
1920x1080 Ultra Preset (DX12)
Moyenne NVIDIA GeForce RTX 3090
  (103 - 134, n=3)
114.7 fps +50%
AMD Radeon RX 6800 XT
AMD Radeon RX 6800 XT, R9 5950X
112 (75.12min, 87.97P1 - 181.69max) fps +46%
MSI GeForce RTX 3090 Suprim X
NVIDIA GeForce RTX 3090, R9 5900X
103 (30.26min, 75.96P1 - 155.81max) fps +34%
Moyenne NVIDIA GeForce RTX 3080
  (99.3 - 103, n=2)
101.2 fps +32%
MSI GeForce RTX 3080 Gaming X Trio
NVIDIA GeForce RTX 3080, R9 5900X
99.3 (13.98min, 73.29P1 - 167.32max) fps +30%
Zotac Gaming GeForce RTX 3070 Twin Edge
NVIDIA GeForce RTX 3070, R9 5950X
84.9 (55.86min, 67.74P1 - 127.49max) fps +11%
Moyenne NVIDIA GeForce RTX 3070
  (79 - 89, n=4)
84.7 fps +11%
NVIDIA GeForce RTX 3060 Ti FE
NVIDIA GeForce RTX 3060 Ti, R9 5950X
76.6 (48.47min, 62.15P1 - 115.84max) fps
Moyenne NVIDIA GeForce RTX 2080 Super (Desktop)
  ()
75.4 fps -2%
Moyenne NVIDIA GeForce RTX 2070 Super (Desktop)
  ()
68.3 fps -11%
Moyenne NVIDIA GeForce RTX 2060 Super (Desktop)
  ()
59.1 fps -23%
KFA 2 GeForce GTX 1660 Super
NVIDIA GeForce GTX 1660 Super (Desktop), R9 3900X
31.4 (16.64min, 21.23P1 - 82max) fps -59%
KFA2 GeForce GTX 1650 Super EX One Click OC
NVIDIA GeForce GTX 1650 Super (Desktop), R9 5900X
20.9 (10.71min, 12.73P1 - 75.52max) fps -73%
Metro Exodus
1920x1080 Ultra Quality DXR AF:16x
MSI GeForce RTX 3090 Suprim X
NVIDIA GeForce RTX 3090, R9 5900X
116 (59.68min - 166.06max) fps +64%
Moyenne NVIDIA GeForce RTX 3090
  (68.6 - 122.2, n=12)
111.4 fps +57%
MSI GeForce RTX 3080 Gaming X Trio
NVIDIA GeForce RTX 3080, R9 5900X
102 (54.36min - 150.53max) fps +44%
Moyenne NVIDIA GeForce RTX 3080
  (91.5 - 102, n=2)
96.8 fps +37%
AMD Ryzen 9 5900X
NVIDIA Titan RTX, R9 5900X
87.9 (49.32min - 136.76max) fps +24%
AMD Radeon RX 6800 XT
AMD Radeon RX 6800 XT, R9 5950X
85.5 (52.71min - 120.38max) fps +21%
Zotac Gaming GeForce RTX 3070 Twin Edge
NVIDIA GeForce RTX 3070, R9 5950X
82.1 (47.4min - 134.03max) fps +16%
Moyenne NVIDIA GeForce RTX 3070
  (80.4 - 83, n=5)
81.6 fps +15%
KFA2 GeForce RTX 2080 Ti EX
NVIDIA GeForce RTX 2080 Ti (Desktop), R9 3900X
78.6 (43min - 115max) fps +11%
NVIDIA GeForce RTX 3060 Ti FE
NVIDIA GeForce RTX 3060 Ti, R9 5950X
70.8 (38.7min - 118.79max) fps
Nvidia GeForce RTX 2080 Super
NVIDIA GeForce RTX 2080 Super (Desktop), R7 2700X
65 (37.62min - 97.62max) fps -8%
Moyenne NVIDIA GeForce RTX 2080 Super (Desktop)
  ()
65 fps -8%
Moyenne NVIDIA GeForce RTX 2070 Super (Desktop)
  (56.3 - 62.1, n=4)
58.5 fps -17%
Nvidia GeForce RTX 2070 Super
NVIDIA GeForce RTX 2070 Super (Desktop), R7 2700X
57.5 (34min - 85max) fps -19%
Moyenne NVIDIA GeForce RTX 2060 Super (Desktop)
  (50 - 53.3, n=3)
51.1 fps -28%
Nvidia GeForce RTX 2060 Super
NVIDIA GeForce RTX 2060 Super (Desktop), R7 2700X
50.1 (30min - 72max) fps -29%
3840x2160 Ultra Quality AF:16x
MSI GeForce RTX 3090 Suprim X
NVIDIA GeForce RTX 3090, R9 5900X
76.3 (45.25min - 131.44max) fps +79%
Moyenne NVIDIA GeForce RTX 3090
  (70.6 - 77.3, n=12)
75 fps +76%
MSI GeForce RTX 3080 Gaming X Trio
NVIDIA GeForce RTX 3080, R9 5900X
65.9 (38.48min - 122.03max) fps +54%
Moyenne NVIDIA GeForce RTX 3080
  (64.1 - 65.9, n=2)
65 fps +52%
AMD Radeon RX 6800 XT
AMD Radeon RX 6800 XT, R9 5950X
56.3 (40.14min - 64.28max) fps +32%
AMD Ryzen 9 5900X
NVIDIA Titan RTX, R9 5900X
54.9 (34.88min - 89.73max) fps +29%
Moyenne NVIDIA GeForce RTX 3070
  (48.3 - 49.7, n=5)
48.9 fps +15%
Zotac Gaming GeForce RTX 3070 Twin Edge
NVIDIA GeForce RTX 3070, R9 5950X
48.3 (29.65min - 105.2max) fps +13%
KFA2 GeForce RTX 2080 Ti EX
NVIDIA GeForce RTX 2080 Ti (Desktop), R9 3900X
47.5 (31min - 69max) fps +11%
NVIDIA GeForce RTX 3060 Ti FE
NVIDIA GeForce RTX 3060 Ti, R9 5950X
42.7 (25.98min - 91.32max) fps
Moyenne NVIDIA GeForce RTX 2080 Super (Desktop)
  (40 - 40.4, n=2)
40.2 fps -6%
Nvidia GeForce RTX 2080 Super
NVIDIA GeForce RTX 2080 Super (Desktop), R7 2700X
40 (25.84min - 59.35max) fps -6%
Moyenne NVIDIA GeForce RTX 2070 Super (Desktop)
  (35 - 38.1, n=5)
36.8 fps -14%
Nvidia GeForce RTX 2070 Super
NVIDIA GeForce RTX 2070 Super (Desktop), R7 2700X
35 (23min - 51max) fps -18%
Moyenne NVIDIA GeForce RTX 2060 Super (Desktop)
  (29.7 - 32.2, n=4)
30.9 fps -28%
Nvidia GeForce RTX 2060 Super
NVIDIA GeForce RTX 2060 Super (Desktop), R7 2700X
29.7 (20min - 42max) fps -30%
AMD Radeon RX 5700 XT
AMD Radeon RX 5700 XT (Desktop), R7 2700X
29.6 (20.7min - 36.64max) fps -31%
KFA 2 GeForce GTX 1660 Super
NVIDIA GeForce GTX 1660 Super (Desktop), R9 3900X
21 (13min - 29max) fps -51%
KFA2 GeForce GTX 1650 Super EX One Click OC
NVIDIA GeForce GTX 1650 Super (Desktop), R9 5900X
16.1 (9.6min - 26.07max) fps -62%
2560x1440 Ultra Quality AF:16x
Moyenne NVIDIA GeForce RTX 3090
  (102 - 118.2, n=12)
113.2 fps +71%
MSI GeForce RTX 3090 Suprim X
NVIDIA GeForce RTX 3090, R9 5900X
112 (58.69min - 182.42max) fps +69%
MSI GeForce RTX 3080 Gaming X Trio
NVIDIA GeForce RTX 3080, R9 5900X
97.4 (51.56min - 162.47max) fps +47%
Moyenne NVIDIA GeForce RTX 3080
  (92.2 - 97.4, n=2)
94.8 fps +43%
AMD Radeon RX 6800 XT
AMD Radeon RX 6800 XT, R9 5950X
94.6 (55.44min - 143.68max) fps +43%
AMD Ryzen 9 5900X
NVIDIA Titan RTX, R9 5900X
84.9 (46.03min - 152.65max) fps +28%
Moyenne NVIDIA GeForce RTX 3070
  (74.4 - 78.3, n=5)
75.8 fps +15%
Zotac Gaming GeForce RTX 3070 Twin Edge
NVIDIA GeForce RTX 3070, R9 5950X
75.4 (39.91min - 127.26max) fps +14%
KFA2 GeForce RTX 2080 Ti EX
NVIDIA GeForce RTX 2080 Ti (Desktop), R9 3900X
71.9 (40min - 108max) fps +9%
NVIDIA GeForce RTX 3060 Ti FE
NVIDIA GeForce RTX 3060 Ti, R9 5950X
66.2 (36.92min - 129.84max) fps
Moyenne NVIDIA GeForce RTX 2080 Super (Desktop)
  (61 - 65, n=2)
63 fps -5%
Nvidia GeForce RTX 2080 Super
NVIDIA GeForce RTX 2080 Super (Desktop), R7 2700X
61 (35.51min - 95.82max) fps -8%
Moyenne NVIDIA GeForce RTX 2070 Super (Desktop)
  (54.3 - 61.9, n=5)
57.6 fps -13%
AMD Radeon RX 5700 XT
AMD Radeon RX 5700 XT (Desktop), R7 2700X
54.5 (31.85min - 78.06max) fps -18%
Nvidia GeForce RTX 2070 Super
NVIDIA GeForce RTX 2070 Super (Desktop), R7 2700X
54.3 (32min - 83max) fps -18%
Moyenne NVIDIA GeForce RTX 2060 Super (Desktop)
  (46 - 52.2, n=4)
49 fps -26%
Nvidia GeForce RTX 2060 Super
NVIDIA GeForce RTX 2060 Super (Desktop), R7 2700X
46.5 (28min - 69max) fps -30%
KFA 2 GeForce GTX 1660 Super
NVIDIA GeForce GTX 1660 Super (Desktop), R9 3900X
32 (19min - 47max) fps -52%
KFA2 GeForce GTX 1650 Super EX One Click OC
NVIDIA GeForce GTX 1650 Super (Desktop), R9 5900X
28.5 (16.88min - 51.46max) fps -57%
1920x1080 Ultra Quality AF:16x
Moyenne NVIDIA GeForce RTX 3090
  (108 - 145, n=12)
135.3 fps +59%
MSI GeForce RTX 3090 Suprim X
NVIDIA GeForce RTX 3090, R9 5900X
132 (72.24min - 199.88max) fps +55%
MSI GeForce RTX 3080 Gaming X Trio
NVIDIA GeForce RTX 3080, R9 5900X
116 (56.76min - 185.19max) fps +37%
AMD Radeon RX 6800 XT
AMD Radeon RX 6800 XT, R9 5950X
115 (64.52min - 181.92max) fps +35%
Moyenne NVIDIA GeForce RTX 3080
  (111 - 116, n=2)
113.5 fps +34%
AMD Ryzen 9 5900X
NVIDIA Titan RTX, R9 5900X
106 (52.66min - 176.55max) fps +25%
Moyenne NVIDIA GeForce RTX 3070
  (91.3 - 97.7, n=5)
93.9 fps +11%
Zotac Gaming GeForce RTX 3070 Twin Edge
NVIDIA GeForce RTX 3070, R9 5950X
93.6 (45.01min - 161.08max) fps +10%
KFA2 GeForce RTX 2080 Ti EX
NVIDIA GeForce RTX 2080 Ti (Desktop), R9 3900X
89.7 (46min - 140max) fps +6%
NVIDIA GeForce RTX 3060 Ti FE
NVIDIA GeForce RTX 3060 Ti, R9 5950X
84.9 (43.89min - 144.89max) fps
Moyenne NVIDIA GeForce RTX 2080 Super (Desktop)
  (76 - 82, n=2)
79 fps -7%
Nvidia GeForce RTX 2080 Super
NVIDIA GeForce RTX 2080 Super (Desktop), R7 2700X
76 (38.54min - 122.4max) fps -10%
Moyenne NVIDIA GeForce RTX 2070 Super (Desktop)
  (67.8 - 79.1, n=5)
72.3 fps -15%
Nvidia GeForce RTX 2070 Super
NVIDIA GeForce RTX 2070 Super (Desktop), R7 2700X
67.8 (36min - 110max) fps -20%
Moyenne NVIDIA GeForce RTX 2060 Super (Desktop)
  (58 - 67.4, n=4)
62.3 fps -27%
AMD Radeon RX 5700 XT
AMD Radeon RX 5700 XT (Desktop), R7 2700X
61 (36.09min - 86.1max) fps -28%
Nvidia GeForce RTX 2060 Super
NVIDIA GeForce RTX 2060 Super (Desktop), R7 2700X
58.9 (32min - 92max) fps -31%
KFA 2 GeForce GTX 1660 Super
NVIDIA GeForce GTX 1660 Super (Desktop), R9 3900X
41 (23min - 61max) fps -52%
KFA2 GeForce GTX 1650 Super EX One Click OC
NVIDIA GeForce GTX 1650 Super (Desktop), R9 5900X
36.6 (20.42min - 76.72max) fps -57%
Cyberpunk 2077 1.0
1920x1080 Ray Tracing Ultra Preset (DLSS off)
Moyenne NVIDIA GeForce RTX 3090
  (59.6 - 65.4, n=2)
62.5 fps +73%
MSI GeForce RTX 3080 Gaming X Trio
NVIDIA GeForce RTX 3080, R9 5900X
56.6 (20.9min, 44.1P0.1, 48.3P1 - 98.2max) fps +56%
Moyenne NVIDIA GeForce RTX 3080
  ()
56.6 fps +56%
Moyenne NVIDIA GeForce RTX 3070
  (41.9 - 42.3, n=2)
42.1 fps +16%
Zotac Gaming GeForce RTX 3070 Twin Edge
NVIDIA GeForce RTX 3070, R9 5950X
41.9 (20.3min, 32.1P0.1, 35.3P1 - 74max) fps +16%
AMD Ryzen 9 5900X
NVIDIA Titan RTX, R9 5900X
40.4 fps +12%
NVIDIA GeForce RTX 3060 Ti FE
NVIDIA GeForce RTX 3060 Ti, R9 5950X
36.2 (20.3min, 29.8P0.1, 31.6P1 - 68.1max) fps
Moyenne NVIDIA GeForce RTX 2080 Super (Desktop)
  ()
33 fps -9%
Moyenne NVIDIA GeForce RTX 2070 Super (Desktop)
  ()
28.9 fps -20%
Moyenne NVIDIA GeForce RTX 2060 Super (Desktop)
  ()
21.3 fps -41%
3840x2160 Ultra Preset
Moyenne NVIDIA GeForce RTX 3090
  (41.5 - 45.3, n=2)
43.4 fps +80%
MSI GeForce RTX 3080 Gaming X Trio
NVIDIA GeForce RTX 3080, R9 5900X
38.9 (20.9min, 31.3P0.1, 34.3P1 - 86.6max) fps +61%
Moyenne NVIDIA GeForce RTX 3080
  ()
38.9 fps +61%
AMD Ryzen 9 5900X
NVIDIA Titan RTX, R9 5900X
30.9 fps +28%
Moyenne NVIDIA GeForce RTX 3070
  (26.6 - 27.9, n=2)
27.3 fps +13%
Zotac Gaming GeForce RTX 3070 Twin Edge
NVIDIA GeForce RTX 3070, R9 5950X
26.6 (19min, 20.8P0.1, 23.4P1 - 46.6max) fps +10%
NVIDIA GeForce RTX 3060 Ti FE
NVIDIA GeForce RTX 3060 Ti, R9 5950X
24.1 (16.8min, 19.8P0.1, 21.8P1 - 27.1max) fps
Moyenne NVIDIA GeForce RTX 2080 Super (Desktop)
  ()
24.1 fps 0%
Moyenne NVIDIA GeForce RTX 2070 Super (Desktop)
  ()
21.5 fps -11%
Moyenne NVIDIA GeForce RTX 2060 Super (Desktop)
  (17.3 - 17.5, n=2)
17.4 fps -28%
KFA2 GeForce GTX 1650 Super EX One Click OC
NVIDIA GeForce GTX 1650 Super (Desktop), R9 5900X
7 fps -71%
2560x1440 Ultra Preset
Moyenne NVIDIA GeForce RTX 3090
  (78.1 - 85.3, n=2)
81.7 fps +70%
MSI GeForce RTX 3080 Gaming X Trio
NVIDIA GeForce RTX 3080, R9 5900X
72.5 (22.2min, 46.6P0.1, 57.1P1 - 159max) fps +51%
Moyenne NVIDIA GeForce RTX 3080
  ()
72.5 fps +51%
AMD Ryzen 9 5900X
NVIDIA Titan RTX, R9 5900X
58.4 fps +22%
Moyenne NVIDIA GeForce RTX 3070
  (53.7 - 54.8, n=2)
54.3 fps +13%
Zotac Gaming GeForce RTX 3070 Twin Edge
NVIDIA GeForce RTX 3070, R9 5950X
53.7 (20min, 39.9P0.1, 45.2P1 - 102max) fps +12%
Moyenne NVIDIA GeForce RTX 2080 Super (Desktop)
  ()
49.1 fps +2%
NVIDIA GeForce RTX 3060 Ti FE
NVIDIA GeForce RTX 3060 Ti, R9 5950X
48 (21.3min, 34.3P0.1, 41.9P1 - 94.6max) fps
Moyenne NVIDIA GeForce RTX 2070 Super (Desktop)
  ()
43.7 fps -9%
Moyenne NVIDIA GeForce RTX 2060 Super (Desktop)
  (35.3 - 35.7, n=2)
35.5 fps -26%
KFA2 GeForce GTX 1650 Super EX One Click OC
NVIDIA GeForce GTX 1650 Super (Desktop), R9 5900X
18 fps -62%
1920x1080 Ultra Preset
Moyenne NVIDIA GeForce RTX 3090
  (108 - 109.7, n=2)
108.9 fps +48%
MSI GeForce RTX 3080 Gaming X Trio
NVIDIA GeForce RTX 3080, R9 5900X
103 (23.3min, 60.3P0.1, 75.7P1 - 176max) fps +40%
Moyenne NVIDIA GeForce RTX 3080
  ()
103 fps +40%
AMD Ryzen 9 5900X
NVIDIA Titan RTX, R9 5900X
82.3 fps +12%
Moyenne NVIDIA GeForce RTX 3070
  (80.6 - 81, n=2)
80.8 fps +10%
Zotac Gaming GeForce RTX 3070 Twin Edge
NVIDIA GeForce RTX 3070, R9 5950X
80.6 (19.6min, 58.2P0.1, 65.3P1 - 111max) fps +10%
NVIDIA GeForce RTX 3060 Ti FE
NVIDIA GeForce RTX 3060 Ti, R9 5950X
73.6 (21.2min, 53.8P0.1, 61.6P1 - 102max) fps
Moyenne NVIDIA GeForce RTX 2080 Super (Desktop)
  ()
72.1 fps -2%
Moyenne NVIDIA GeForce RTX 2070 Super (Desktop)
  ()
65.4 fps -11%
Moyenne NVIDIA GeForce RTX 2060 Super (Desktop)
  (52.1 - 54.2, n=2)
53.2 fps -28%
KFA2 GeForce GTX 1650 Super EX One Click OC
NVIDIA GeForce GTX 1650 Super (Desktop), R9 5900X
30 fps -59%
Bas Moyen Élevé UltraQHD4K
The Witcher 3 (2015) 479 342 218 109 81.3
Shadow of the Tomb Raider (2018) 185 157 153 145 103 56
Forza Horizon 4 (2018) 246 200 196 173 150 103
Assassin´s Creed Odyssey (2018) 142 121 104 75 65 45
Battlefield V (2018) 181 145 124 114 97.9 64.9
Far Cry New Dawn (2019) 123 111 108 99 94 65
Metro Exodus (2019) 193 139 105 84.9 66.2 42.7
The Division 2 (2019) 225 172 142 109 77.3 43.7
Anno 1800 (2019) 134 135 94.1 54.2 40.6 34.4
Total War: Three Kingdoms (2019) 367.4 195.6 127.3 92.8 59 28.8
Control (2019) 240 147 110 71.9 36.1
Borderlands 3 (2019) 172 149 118 96 70.2 38.4
Red Dead Redemption 2 (2019) 170 154 108 69.9 57.3 37.5
Doom Eternal (2020) 508 320 283 274 219 122
Gears Tactics (2020) 332.3 208.8 162.4 128.9 91.9 49.4
F1 2020 (2020) 369 252 174 135 80
Horizon Zero Dawn (2020) 181 139 122 109 92 53
Mafia Definitive Edition (2020) 159 130 124 90.1 49.7
FIFA 21 (2020) 242 247 230
Watch Dogs Legion (2020) 124 122 109 76.6 59.1 33
Assassin´s Creed Valhalla (2020) 126 95 81 74 60 40
Call of Duty Black Ops Cold War (2020) 243 133 123 110 82.1 44.9
Immortals Fenyx Rising (2020) 166 119 110 101 84 57
Cyberpunk 2077 1.0 (2020) 122 101 85.2 73.6 48 24.1

Émissions

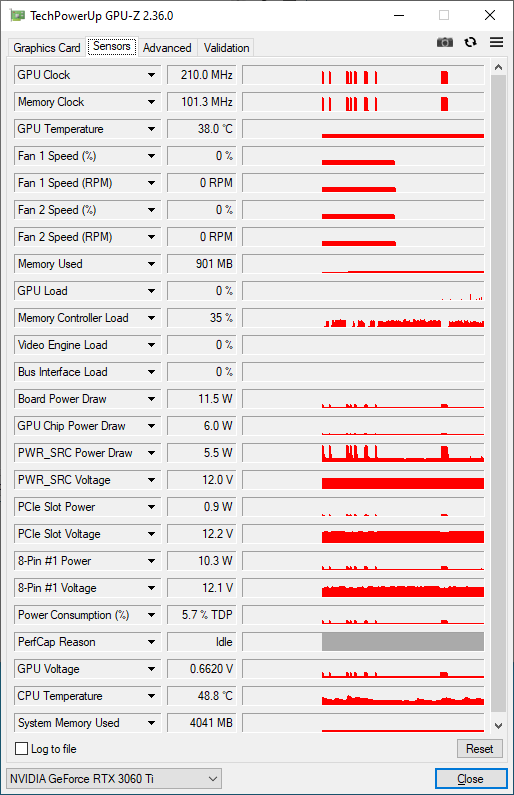
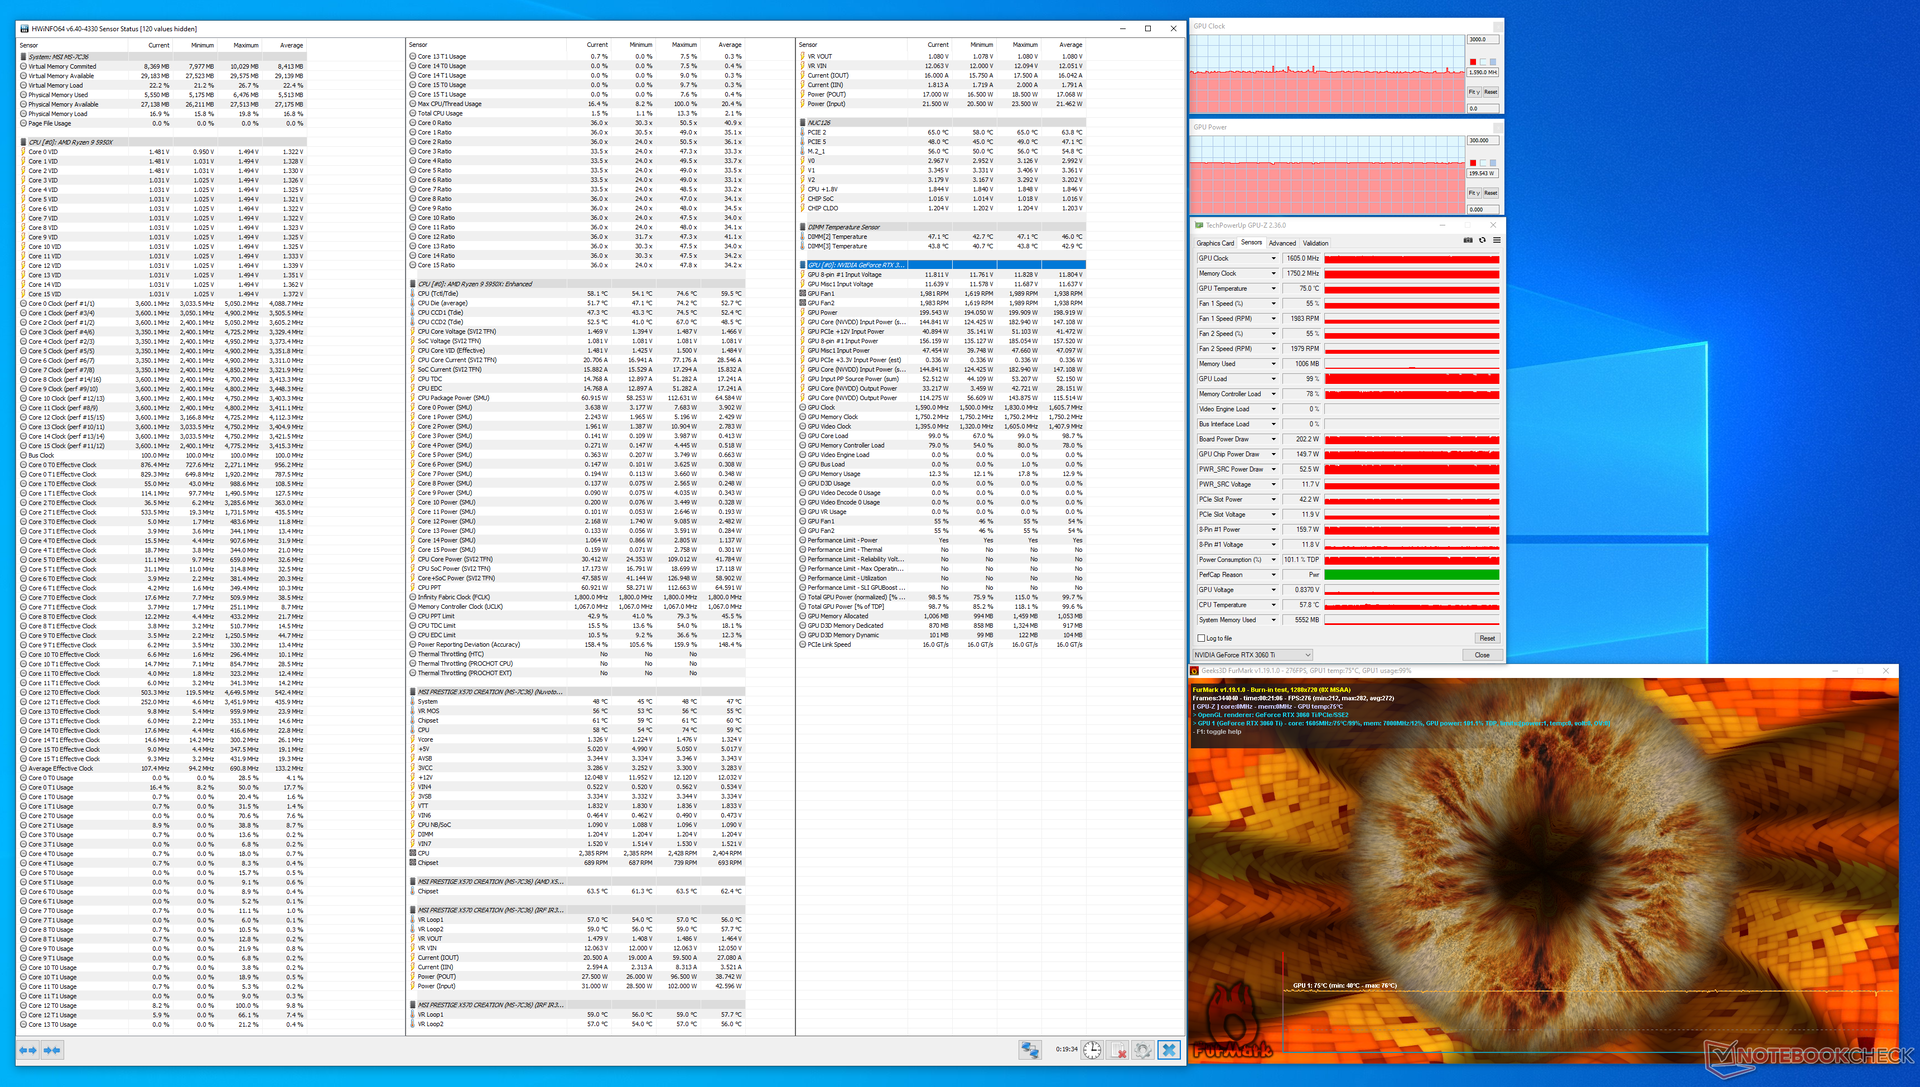
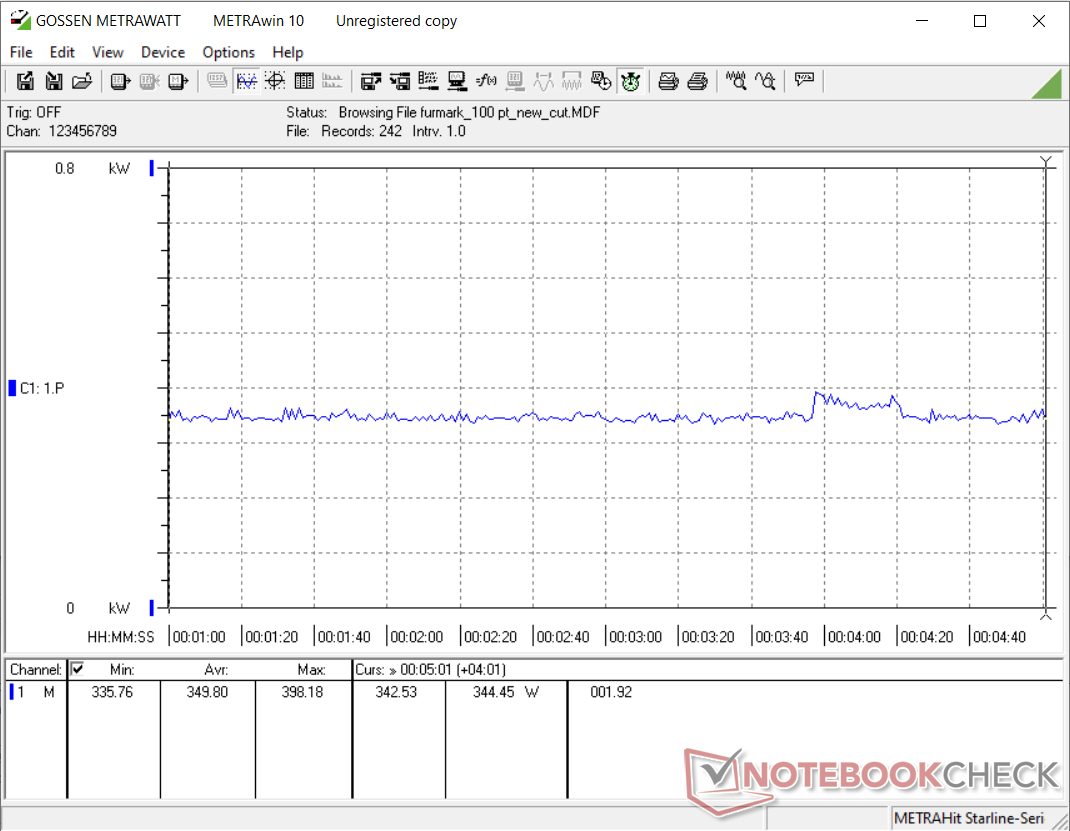
Grâce à la conception améliorée du refroidisseur de NVIDIA, le RTX 3060 Ti FE est très performant en cas de stress. Lors du test de stress FurMark, nous avons observé que le cœur du GPU maintenait une température constante de 75 °C et que la consommation de la carte était au TGP nominal de 200 W.

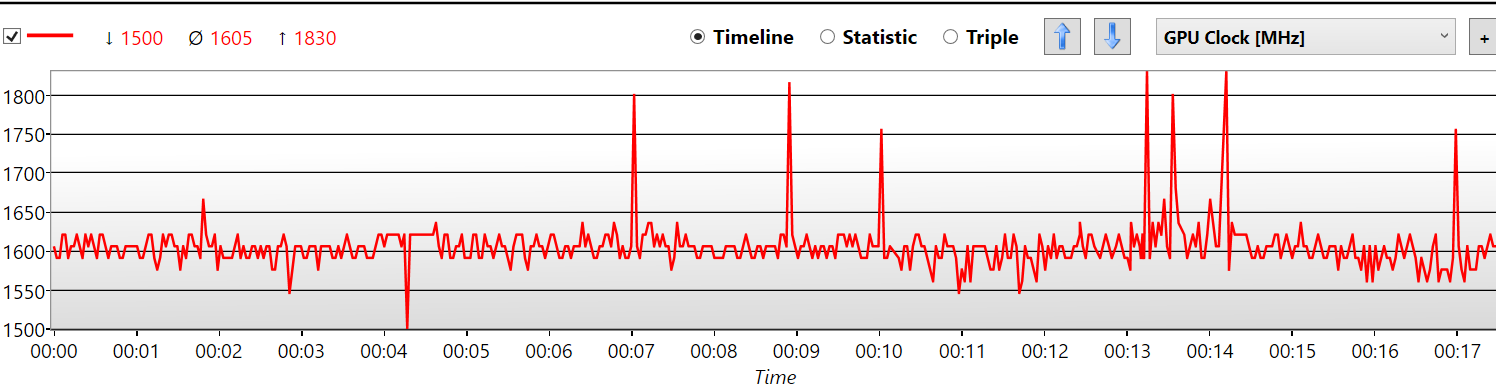
Pendant la plus grande partie du test de stress, le RTX 3060 Ti FE fonctionne près de son horloge de boost nominale de 1 665 MHz, bien que nous observions des pics occasionnels jusqu'à 1 830 MHz

Nous avons utilisé le stress FurMark pour déterminer la température et les niveaux de bruit. La consommation électrique totale du système a été déterminée pendant le stress avec FurMark et The Witcher 3 à 1080p Ultra préréglé

FurMark stress
FurMark stress
Les horloges à GPU boostés pendant le stress de FurMark

Température

Carte thermique NVIDIA RTX 3060 Ti FE

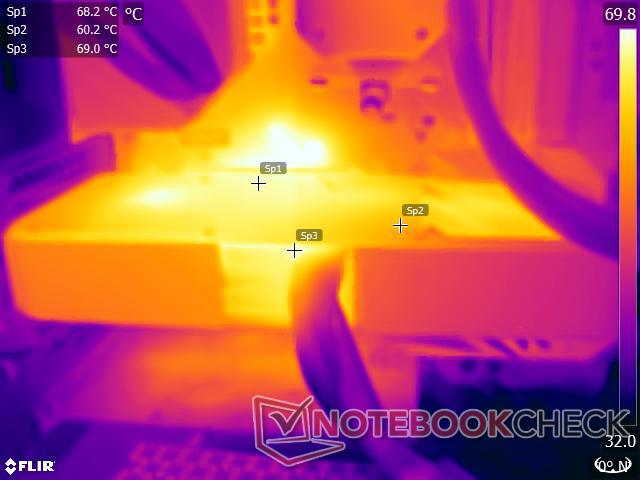
Bien que le nouveau système de refroidissement de NVIDIA offre des performances adéquates pour empêcher la carte de s'étrangler, la carte elle-même a tendance à se réchauffer de manière significative sous charge. Lors du test de stress FurMark, nous avons observé que les températures de surface près du GPU et des zones d'alimentation étaient proches de la marque des 70 °C

C'est normal, car le cœur du GPU lui-même peut atteindre 75 °C sous charge et la construction métallique ne sert qu'à transmettre une grande partie de cette chaleur à la surface

La zone proche de l'échappement du ventilateur arrière est également assez chaude à 60 °C comme vous pouvez le voir sur la carte de chaleur. Cela étant dit, le GPU tourne au ralenti entre 38 °C et 42 °C, période pendant laquelle les ventilateurs s'arrêtent complètement

Consommation d'énergie

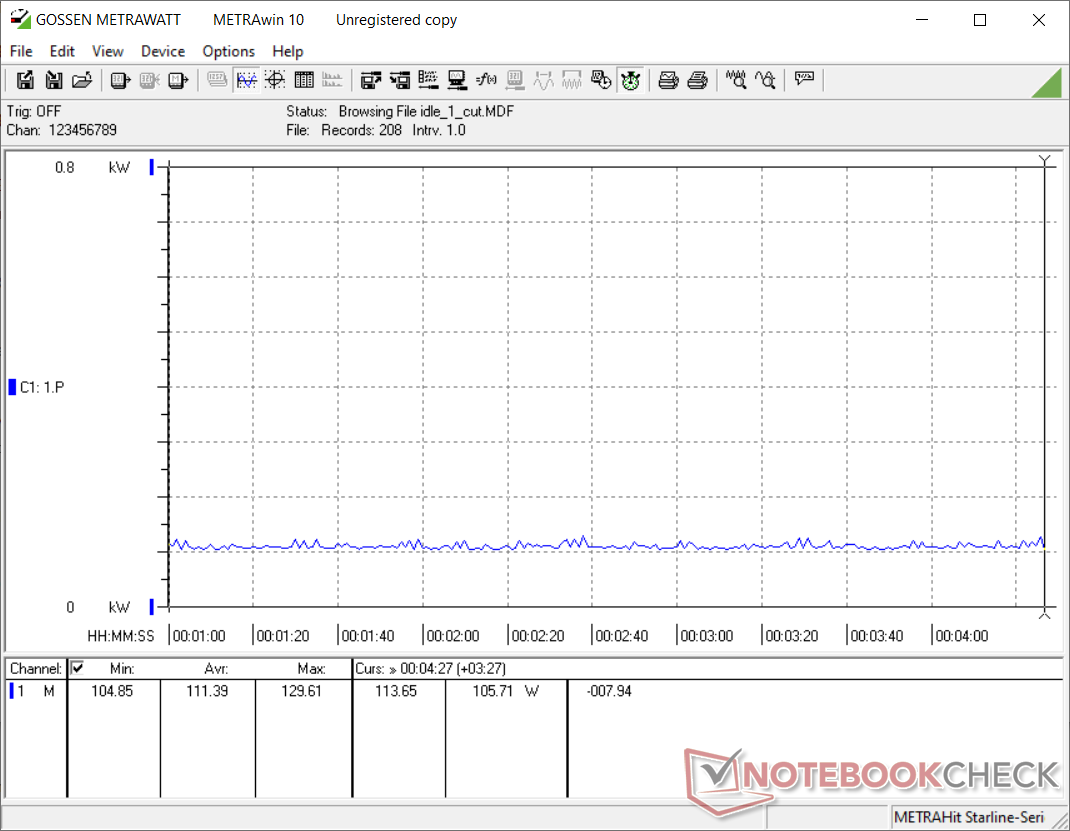
Notre banc d'essai consomme environ 111 W au ralenti avec tous les éclairages RGB éteints et un total de cinq ventilateurs (trois ventilateurs de boîtier Corsair SP 120 mm et deux ventilateurs de radiateur Corsair ML 120 mm) et la pompe Elite Capellix AIO fonctionnant en profil équilibré.

Nous avons observé une consommation électrique totale moyenne du système de 350 W et 379 W pendant les campagnes FurMark et The Witcher 3 Ultra stress, respectivement

Comme le montrent les graphiques de consommation d'énergie ci-dessous, une légère augmentation de la consommation d'énergie est observée près de la marque des 4 minutes. Cela pourrait être dû à l'augmentation momentanée de l'horloge de boost que nous avons décrite précédemment

Dans l'ensemble, le RTX 3060 Ti FE est plus ou moins économique par rapport au RTX 2080 Super moyen en termes de consommation d'énergie

Consommation électrique du système - inactif
Consommation électrique du système - FurMark stress
Consommation électrique du système - Le Witcher 3 1080p Ultra préréglé
Power Consumption
1280x720 FurMark 1.19 GPU Stress Test (external Monitor)
MSI GeForce RTX 3090 Suprim X
NVIDIA GeForce RTX 3090, R9 5900X (Idle: 105.9 W)
551 (521min - 582max) Watt * -57%
Moyenne NVIDIA GeForce RTX 3080
  (Idle: 492 - 505, n=2 W)
499 Watt * -43%
MSI GeForce RTX 3080 Gaming X Trio
NVIDIA GeForce RTX 3080, R9 5900X (Idle: 103 W)
492 (485min - 514max) Watt * -41%
Moyenne NVIDIA GeForce RTX 3090
  (Idle: 281 - 551, n=8 W)
469 Watt * -34%
AMD Radeon RX 6800 XT
AMD Radeon RX 6800 XT, R9 5950X (Idle: 99.5 W)
447.9 (413min - 484max) Watt * -28%
KFA2 GeForce RTX 2080 Ti EX
NVIDIA GeForce RTX 2080 Ti (Desktop), R9 3900X (Idle: 100.5 W)
400.8 (354min - 432max) Watt * -15%
Zotac Gaming GeForce RTX 3070 Twin Edge
NVIDIA GeForce RTX 3070, R9 5950X (Idle: 114.96 W)
393 (384min, 385P1 - 406max) Watt * -12%
Zotac Gaming GeForce RTX 3070 Twin Edge
NVIDIA GeForce RTX 3070, R9 5950X (Idle: 114.96 W)
375 (365min, 366P1 - 421max) Watt * -7%
Nvidia GeForce RTX 2080 Super
NVIDIA GeForce RTX 2080 Super (Desktop), R7 2700X (Idle: 78.87 W)
376.8 (331min - 409max) Watt * -8%
Moyenne NVIDIA GeForce RTX 2080 Super (Desktop)
  (Idle: 328 - 414, n=4 W)
362 Watt * -3%
NVIDIA GeForce RTX 3060 Ti FE
NVIDIA GeForce RTX 3060 Ti, R9 5950X (Idle: 111.39 W)
350 (336min, 336P1 - 398max) Watt *
Moyenne NVIDIA GeForce RTX 3070
  (Idle: 281 - 393, n=6 W)
348 Watt * +1%
Moyenne NVIDIA GeForce RTX 2070 Super (Desktop)
  (Idle: 280 - 358, n=6 W)
329 Watt * +6%
AMD Radeon RX 5700 XT
AMD Radeon RX 5700 XT (Desktop), R7 2700X (239 ips, Idle: 69.8 W)
326.6 (313min - 351max) Watt * +7%
Nvidia GeForce RTX 2070 Super
NVIDIA GeForce RTX 2070 Super (Desktop), R7 2700X (283 ips, Idle: 80.5 W)
326 (315min - 348max) Watt * +7%
Moyenne NVIDIA GeForce RTX 2060 Super (Desktop)
  (Idle: 235 - 315, n=5 W)
290 Watt * +17%
Nvidia GeForce RTX 2060 Super
NVIDIA GeForce RTX 2060 Super (Desktop), R7 2700X (237 ips, Idle: 77.12 W)
281.4 (275min - 321max) Watt * +20%
KFA 2 GeForce GTX 1660 Super
NVIDIA GeForce GTX 1660 Super (Desktop), R9 3900X (Idle: 84.76 W)
247.6 (241min - 322max) Watt * +29%
KFA2 GeForce GTX 1650 Super EX One Click OC
NVIDIA GeForce GTX 1650 Super (Desktop), R9 5900X (Idle: 86.5 W)
228.7 (223min - 271max) Watt * +35%
1920x1080 The Witcher 3 ultra (external Monitor)
MSI GeForce RTX 3090 Suprim X
NVIDIA GeForce RTX 3090, R9 5900X (Idle: 105.9 W)
597 (577min - 618max) Watt * -58%
Moyenne NVIDIA GeForce RTX 3090
  (Idle: 464 - 597, n=17 W)
524 Watt * -38%
AMD Radeon RX 6800 XT
AMD Radeon RX 6800 XT, R9 5950X (Idle: 99.5 W)
505 (389min - 543max) Watt * -33%
Moyenne NVIDIA GeForce RTX 3080
  (Idle: 498 - 505, n=2 W)
502 Watt * -32%
MSI GeForce RTX 3080 Gaming X Trio
NVIDIA GeForce RTX 3080, R9 5900X (Idle: 103 W)
498.3 (487min - 523max) Watt * -31%
AMD Ryzen 9 5900X
NVIDIA Titan RTX, R9 5900X (Idle: 78.1 W)
439.6 (419min - 497max) Watt * -16%
KFA2 GeForce RTX 2080 Ti EX
NVIDIA GeForce RTX 2080 Ti (Desktop), R9 3900X (Idle: 100.5 W)
438.8 (431min - 463max) Watt * -16%
Zotac Gaming GeForce RTX 3070 Twin Edge
NVIDIA GeForce RTX 3070, R9 5950X (Idle: 114.96 W)
406 (397min, 399P1 - 421max) Watt * -7%
Moyenne NVIDIA GeForce RTX 3070
  (Idle: 317 - 550, n=5 W)
401 Watt * -6%
Nvidia GeForce RTX 2080 Super
NVIDIA GeForce RTX 2080 Super (Desktop), R7 2700X (Idle: 78.87 W)
382.8 (360min - 410max) Watt * -1%
NVIDIA GeForce RTX 3060 Ti FE
NVIDIA GeForce RTX 3060 Ti, R9 5950X (Idle: 111.39 W)
379 (270min, 364P1 - 409max) Watt *
Moyenne NVIDIA GeForce RTX 2080 Super (Desktop)
  (Idle: 336 - 416, n=5 W)
363 Watt * +4%
AMD Radeon RX 5700 XT
AMD Radeon RX 5700 XT (Desktop), R7 2700X (Idle: 69.8 W)
348.7 (341min - 359max) Watt * +8%
Nvidia GeForce RTX 2070 Super
NVIDIA GeForce RTX 2070 Super (Desktop), R7 2700X (96.8 ips, Idle: 80.5 W)
344.7 (335min - 370max) Watt * +9%
Moyenne NVIDIA GeForce RTX 2070 Super (Desktop)
  (Idle: 296 - 377, n=6 W)
342 Watt * +10%
Moyenne NVIDIA GeForce RTX 2060 Super (Desktop)
  (Idle: 246 - 331, n=5 W)
304 Watt * +20%
Nvidia GeForce RTX 2060 Super
NVIDIA GeForce RTX 2060 Super (Desktop), R7 2700X (82.7 ips, Idle: 77.12 W)
298.2 (293min - 322max) Watt * +21%
KFA 2 GeForce GTX 1660 Super
NVIDIA GeForce GTX 1660 Super (Desktop), R9 3900X (Idle: 84.76 W)
260.4 (255min - 277max) Watt * +31%
KFA2 GeForce GTX 1650 Super EX One Click OC
NVIDIA GeForce GTX 1650 Super (Desktop), R9 5900X (Idle: 86.5 W)
240.7 (237min - 247max) Watt * +36%

* ... Moindre est la valeur, meilleures sont les performances
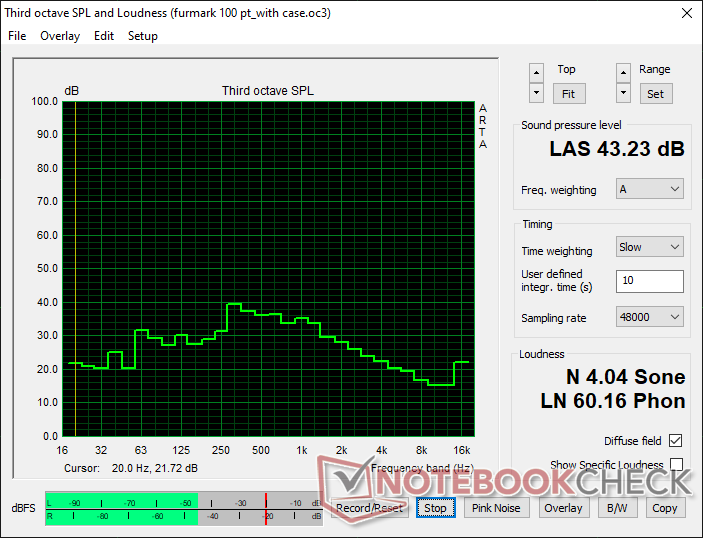
Niveaux de bruit

L'un des avantages du nouveau mécanisme de refroidissement de NVIDIA est que le niveau sonore du ventilateur est bien maîtrisé

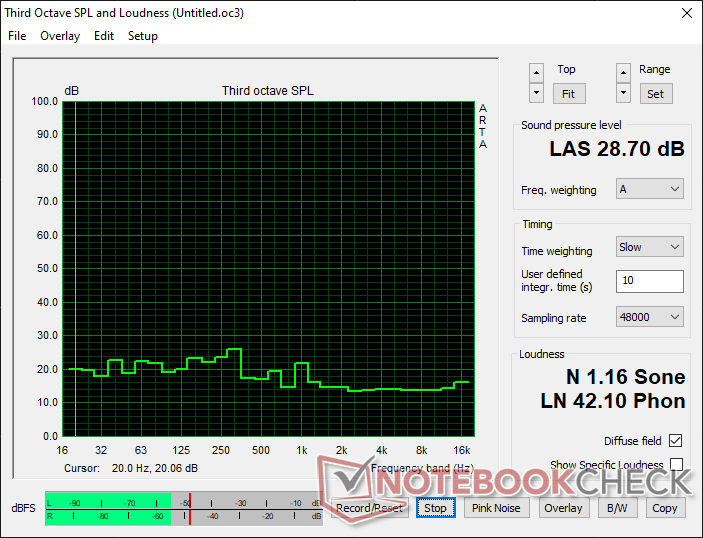
Depuis que NVIDIA a mis en place un mode d'arrêt complet des ventilateurs avec les cartes FE Ampere, le niveau de pression acoustique (SPL) au ralenti est plus ou moins le même que la valeur ambiante de 28,70 db(A) à une distance de 20 cm du boîtier fermé.

Le SPL est passé à 43,23 db(A) lors des tests de stress FurMark, ce qui est très tolérable, surtout lorsque le boîtier est fermé. Il est possible d'ajuster davantage la courbe du ventilateur en utilisant des utilitaires tiers tels que la post-combustion MSI

Niveaux de bruit - Les ventilateurs de la caisse sont éteints
Niveaux de bruit - FurMark stress avec les fans de l'affaire

Points positifs

+ Construction métallique robuste
+ L'aspect premium
+ Plaque de fond en métal
+ Performance égale ou légèrement supérieure à celle du RTX 2080 Super
+ Ray tracing et support DLSS 2.0 dans les jeux compatibles
+ Des performances décentes dans les programmes 3D professionnels
+ Des chutes de cadre minimales dans le stress à long terme
+ Arrêt complet du ventilateur au ralenti
+ Des niveaux de bruit décents en situation de stress

Points négatifs

- Le connecteur à 12 broches semble redondant
- Une marge de manœuvre limitée pour l'overclocking
- Seulement 8 GB VRAM
- Des températures de surface plus élevées sous charge
- La consommation électrique n'est que légèrement supérieure à celle du RTX 2080 Super
- Des stocks très limités

Verdict

NVIDIA GeForce RTX 3060 Ti Founders Edition. Unité de révision avec l'aimable autorisation de NVIDIA India.

L'édition fondatrice de NVIDIA GeForce RTX 3060 Ti permet de faire beaucoup de choses bien. La carte a un aspect et un toucher haut de gamme, elle est bien construite et occupe un espace relativement compact à deux emplacements. Le seul point négatif est le connecteur d'alimentation à 12 broches situé au centre, qui n'ajoute aucune fonctionnalité mais rend la gestion des câbles difficile

Le nouveau mécanisme de refroidissement de NVIDIA offre un net avantage et, avec un arrêt complet du ventilateur, l'édition Founders peut potentiellement être une meilleure affaire par rapport aux variantes de cartes d'extension (AiB). Nous avons observé une réduction de la consommation d'énergie (bien que marginale) par rapport au RTX 2080 Super, ainsi que des niveaux de bruit gérables sous charge, ce qui constitue une évolution bienvenue

La NVIDIA GeForce RTX 3060 Ti Founders Edition offre les performances de la RTX 2080 Super pour 399,99 $ US (₹35,900) et une enveloppe de puissance inférieure de 50 W. Il a le potentiel d'être l'un des GPU les plus populaires de cette génération, mais les contraintes d'approvisionnement actuelles continuent de freiner les perspectives d'achat d'un GPU au prix de vente conseillé.

Le RTX 3060 Ti FE devrait être votre carte de visite si vous jouez principalement aux résolutions 1080p Ultra et QHD Ultra. Il est tout à fait possible de jouer en 4K avec quelques ajustements visuels. L'amélioration des performances du ray tracing (RT) par rapport au RTX 2080 Super n'est pas très significative. Cela étant dit, le DLSS 2.0 devrait pouvoir offrir un coup de pouce dans les titres pris en charge pour obtenir des images jouables avec le RT activé

La carte est également capable de performances décentes en matière de calcul et de modélisation 3D, mais elle n'est pas vraiment adaptée aux flux de travail professionnels de CAO/FAO, de médecine, d'automobile ou d'énergie

NVIDIA a réussi à offrir des performances RTX 2080 Super et un peu plus pour 300 dollars US de moins et à un TGP inférieur de 50 W. Ceux qui viennent d'une GTX 1070 trouveront que la RTX 3060 Ti FE est la meilleure affaire au prix du PDSF. Cependant, les acheteurs qui peuvent étendre un peu leur budget peuvent aussi jeter un coup d'œil au RTX 3070 FE s'il est possible de l'avoir pour 499 $ US au prix de vente conseillé.

Prix et disponibilité

La disponibilité de l'édition NVIDIA GeForce RTX 3060 Ti Founders, y compris celle des cartes partenaires, est incertaine au moment de la rédaction de cette revue. Actuellement, seul Best Buy propose cette carte au prix de 399,99 $US. Il n'est pas surprenant qu'elle soit complètement épuisée au moment de la publication. Nous vous recommandons de garder un œil sur le lien indiqué car les stocks devraient être reconstitués périodiquement

Pricecompare

Please share our article, every link counts!
> Revues et rapports de ordinateurs portatifs et smartphones, ordiphones > Critiques > Test de la NVIDIA GeForce RTX 3060 Ti Founders Edition : vaisseau-amiral 1440p Ultra et jeu 4K austère pour 400 $US
Vaidyanathan Subramaniam, 2021-02- 6 (Update: 2021-02- 6)