Test du Beelink SEi12 : mini PC aux performances supérieures à celles de l'Intel NUC 11

Beelink propose une vaste gamme de mini PC conçus pour le marché des petits et moyens budgets. Bien qu'il n'y ait pas encore de modèles avec des GPU dédiés, beaucoup d'entre eux sont livrés avec Windows 11, de la RAM et de l'espace de stockage déjà préinstallés, ce qui est suffisant pour les centres multimédia, les boîtes de streaming ou les tâches quotidiennes de navigation ou de bureau
Le dernier mini-PC de Beelink est le SEi12, qui est livré avec le Core i5-1235U de 12e génération, alors que la plupart des autres alternatives bon marché sont généralement livrées avec des CPU plus anciens ou plus lents afin de maintenir des coûts bas. Notre unité d'examen peut être trouvée en ligne pour seulement $460 USD
Les concurrents du SEi12 incluent la plupart des autres mini PCs équipés de CPUs de la série U, comme de nombreux Modèles Intel NUCle BMAX B5 Proou le Ace Magician AMR5
Plus de commentaires sur Beelink :
Comparaison avec les concurrents potentiels
Note | Date | Modèle | Poids | Épaisseur | Taille | Résolution | Prix |
|---|---|---|---|---|---|---|---|
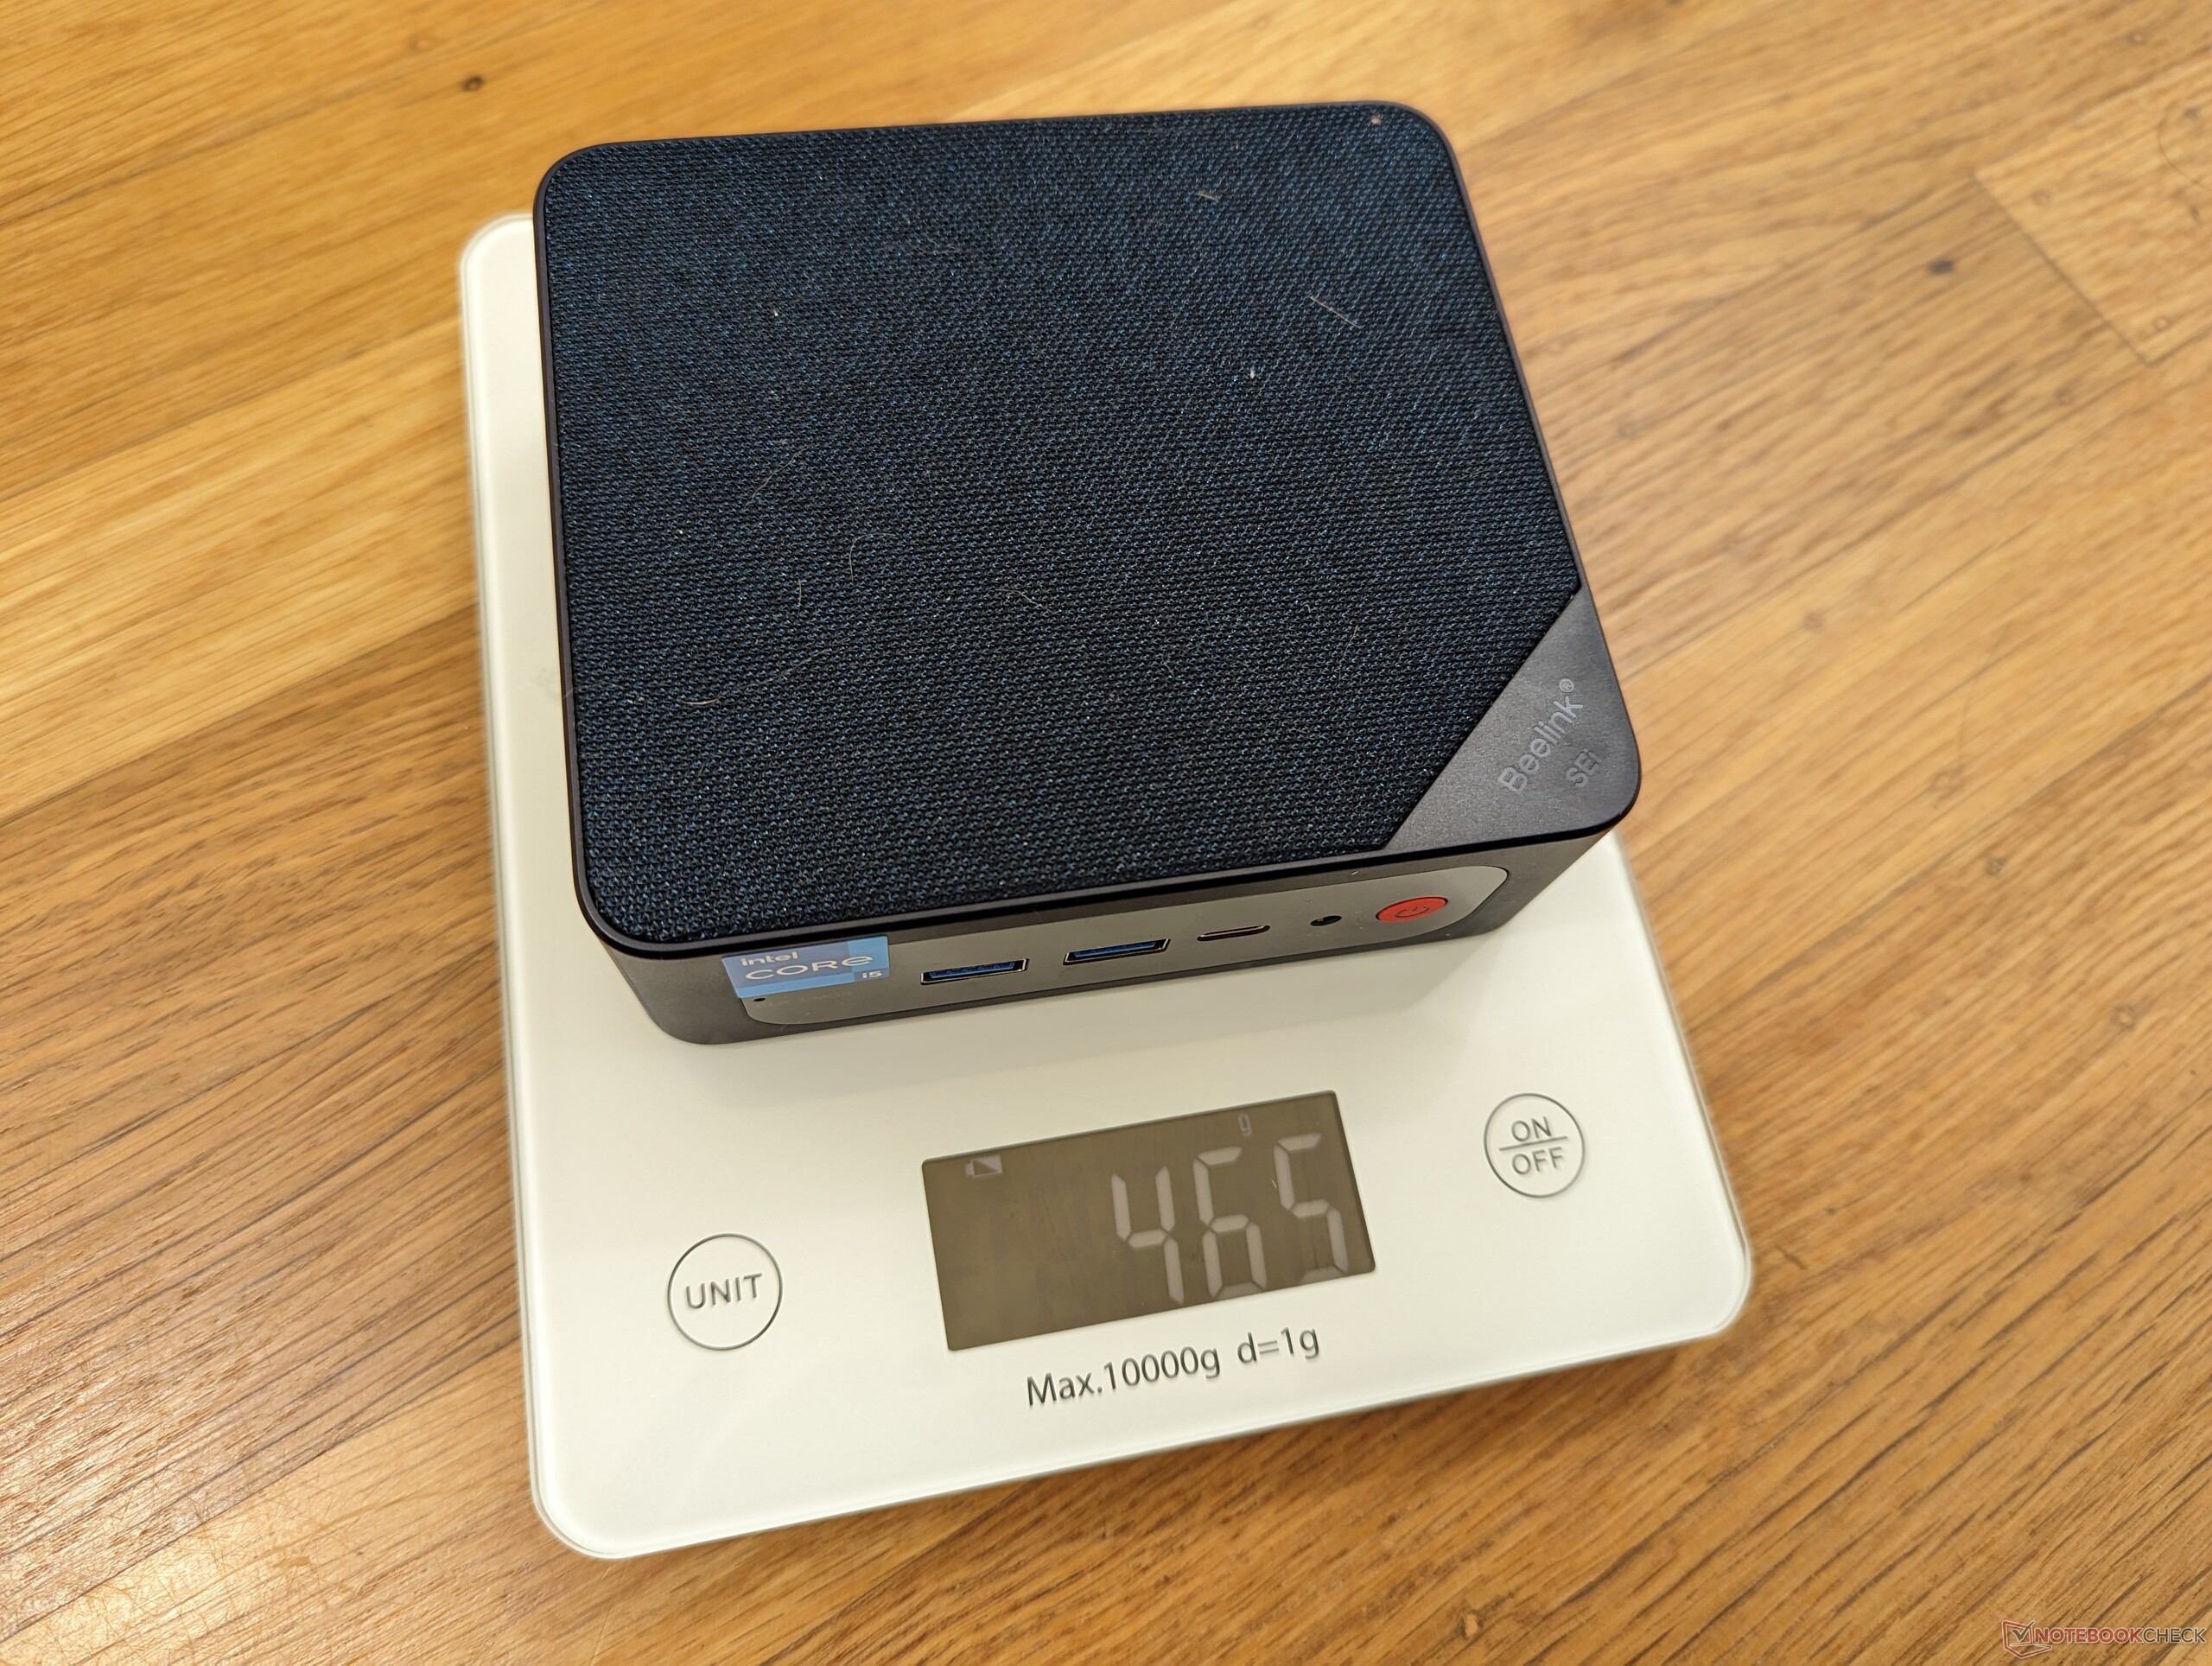
v (old) | 12/22 | Beelink SEi12 Core i5-1235U i5-1235U, Iris Xe G7 80EUs | 465 g | 42 mm | x | ||
v (old) | 04/22 | Beelink SEi8 i3-8109U, Iris Plus Graphics 655 | 346 g | 41 mm | x | ||
v (old) | 04/22 | Beelink SER4 R7 4800U, Vega 8 | 494 g | 40 mm | x | ||
v (old) | 02/21 | Intel NUC11PAQi7 i7-1165G7, Iris Xe G7 96EUs | 647 g | 56 mm | x | ||
v (old) | 11/22 | BMAX B5 Pro G7H8 i5-8260U, UHD Graphics 620 | 369 g | 43.2 mm | x | ||
v (old) | 04/18 | Intel Hades Canyon NUC8i7HVK i7-8809G, Vega M GH | 1.3 kg | 39 mm | x |
Cas
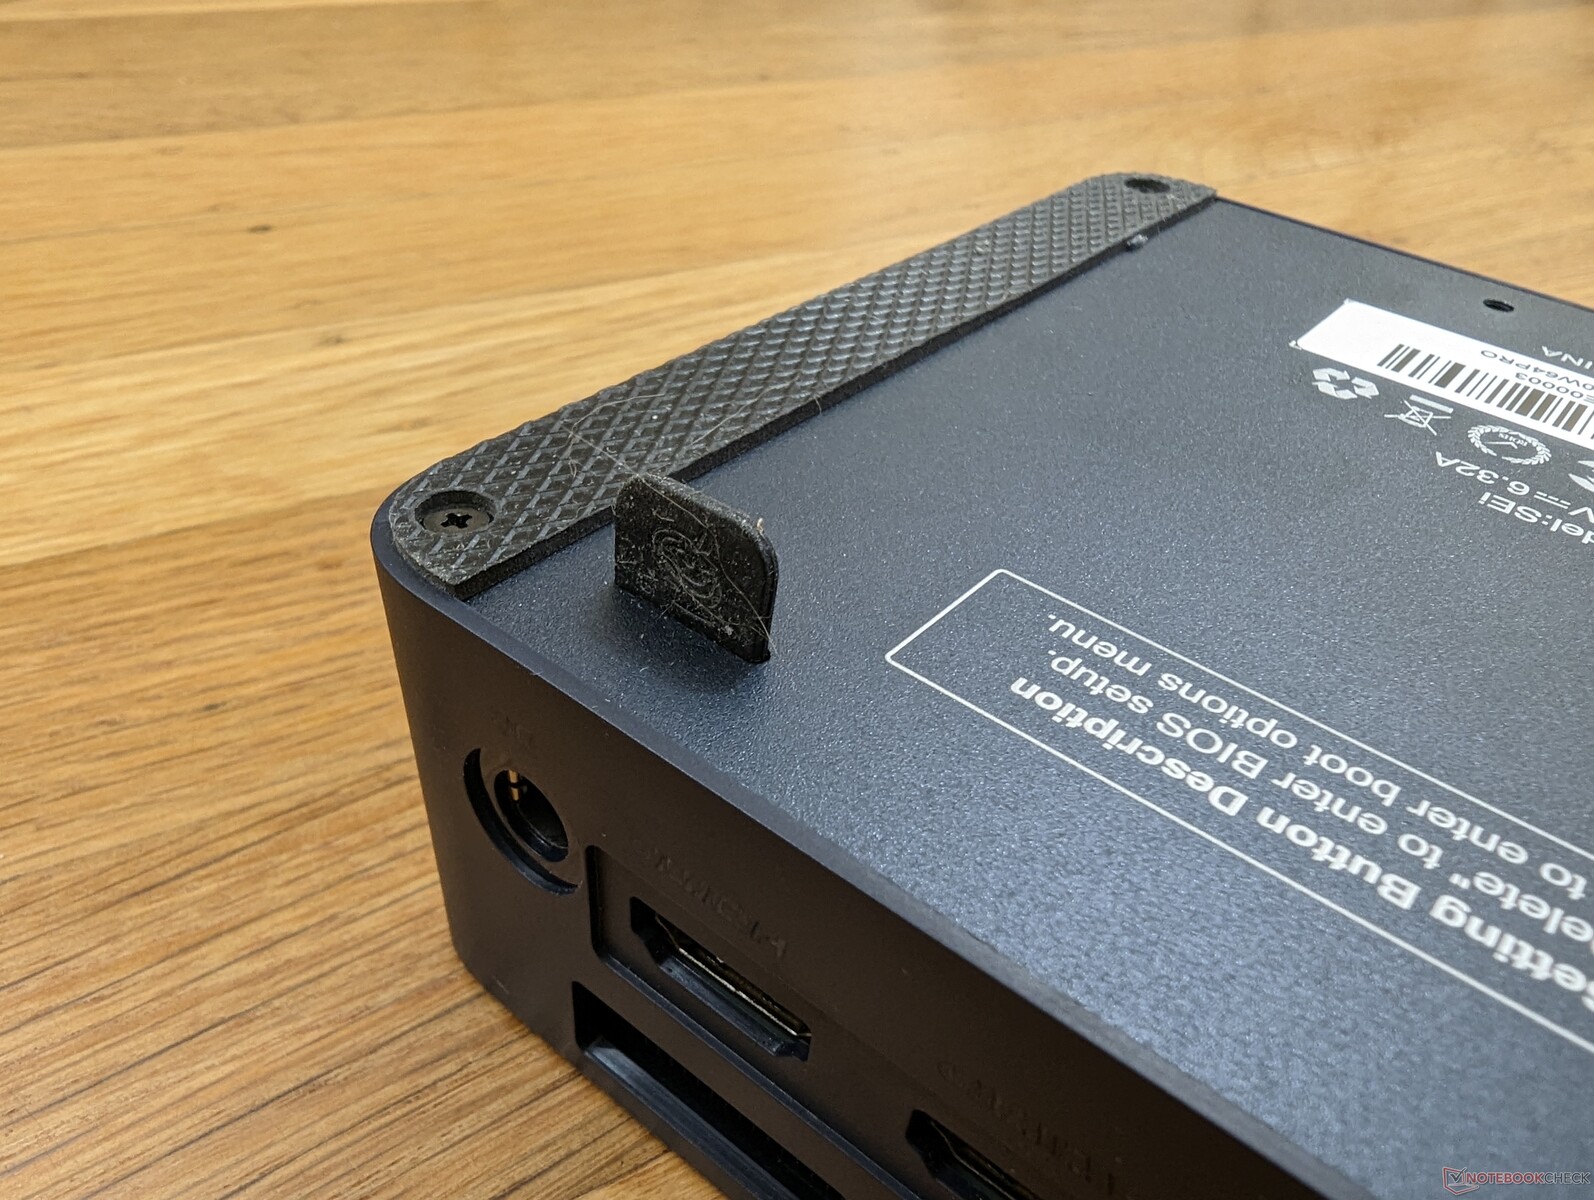
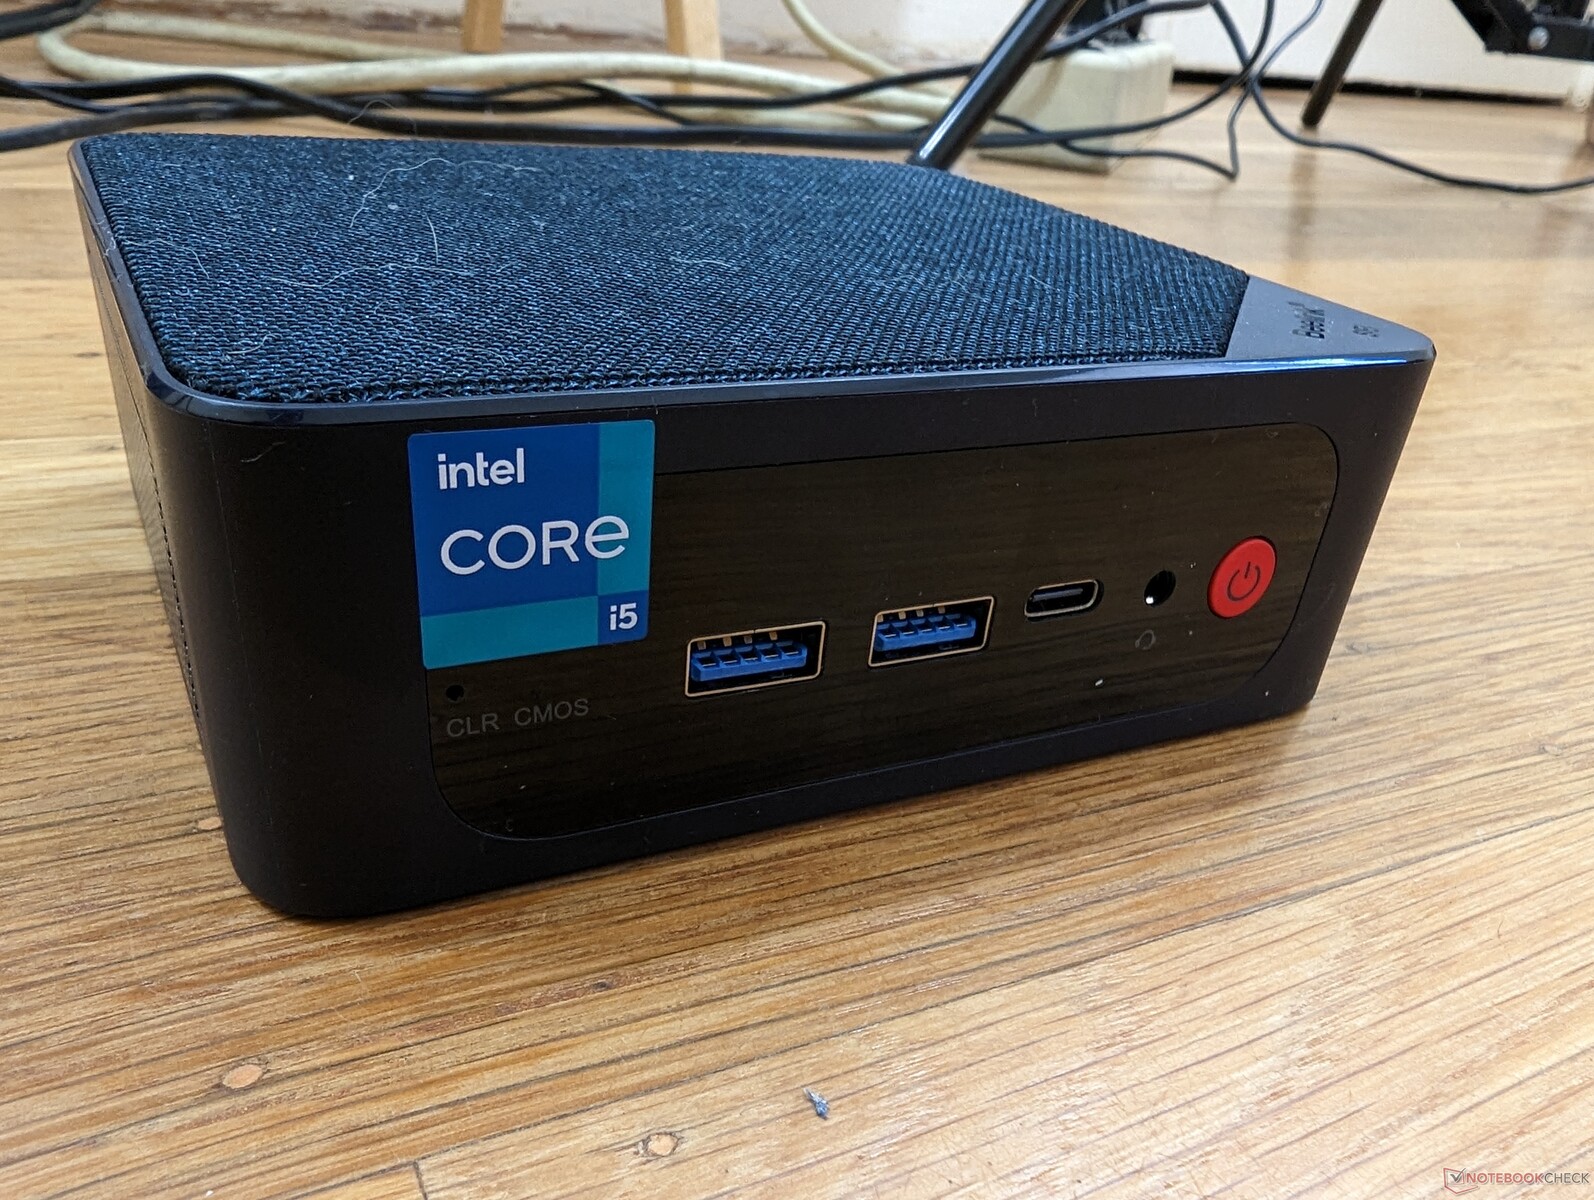
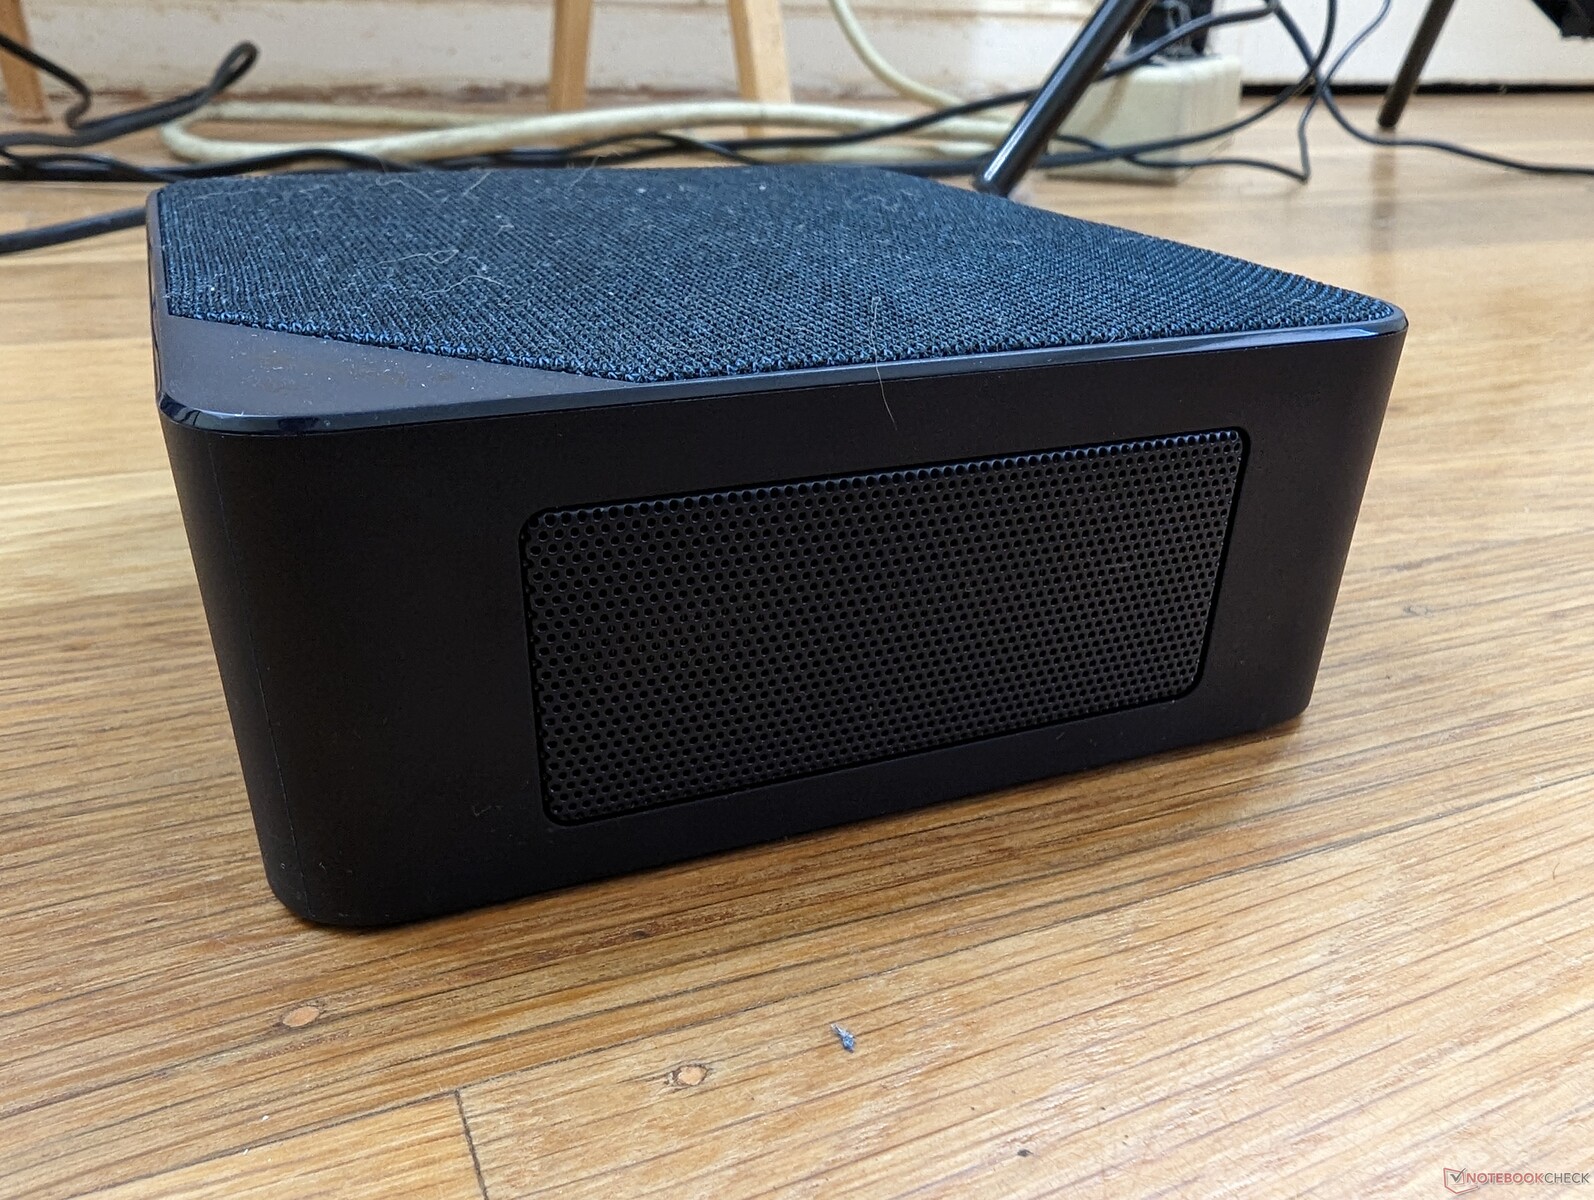
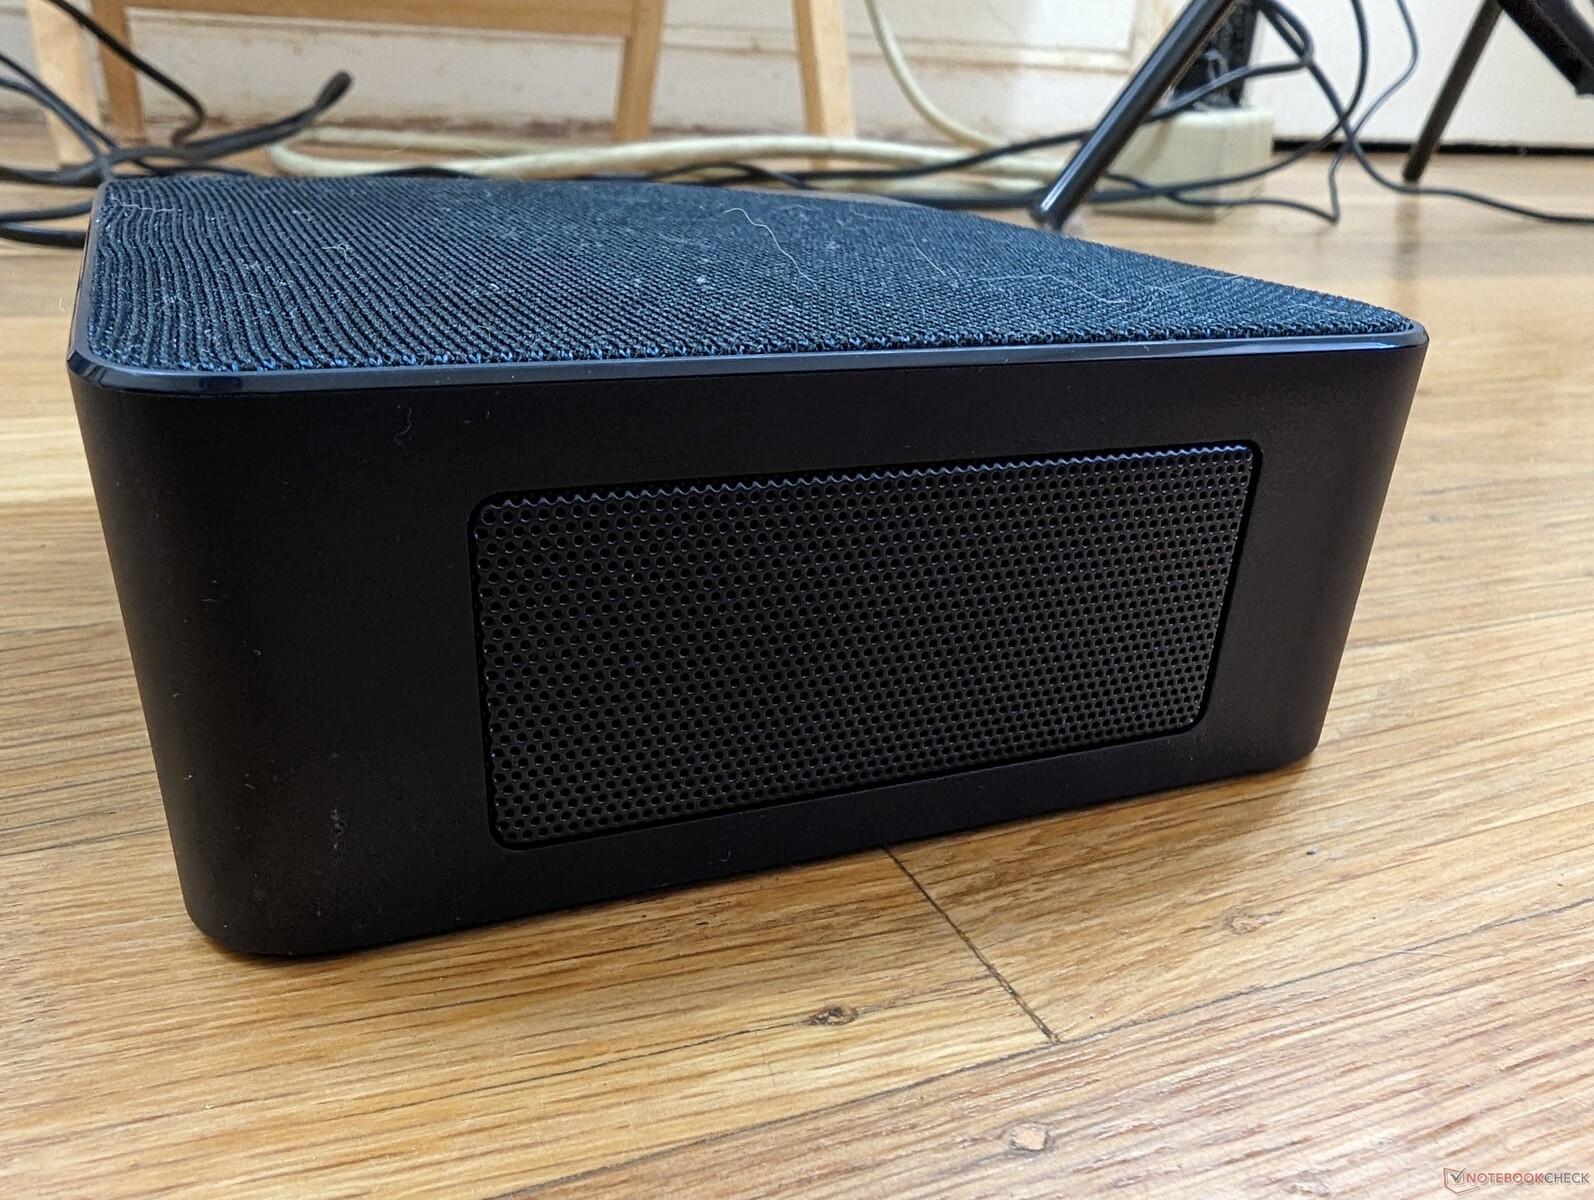
Le châssis est juste légèrement plus épais et plus lourd que l'ancien SEi 11mais avec des matériaux métalliques et des caractéristiques physiques similaires. L'aspect visuel le plus remarquable du SEi12 est son nouveau matériau en polaire ou en tissu sur la surface supérieure, alors que les anciens modèles Beelink étaient simplement en plastique lisse ou en plastique perforé. Le tissu est lisse au toucher et procure une sensation de luxe, mais son nettoyage peut être difficile car les cheveux et la poussière s'y accrochent plus facilement.
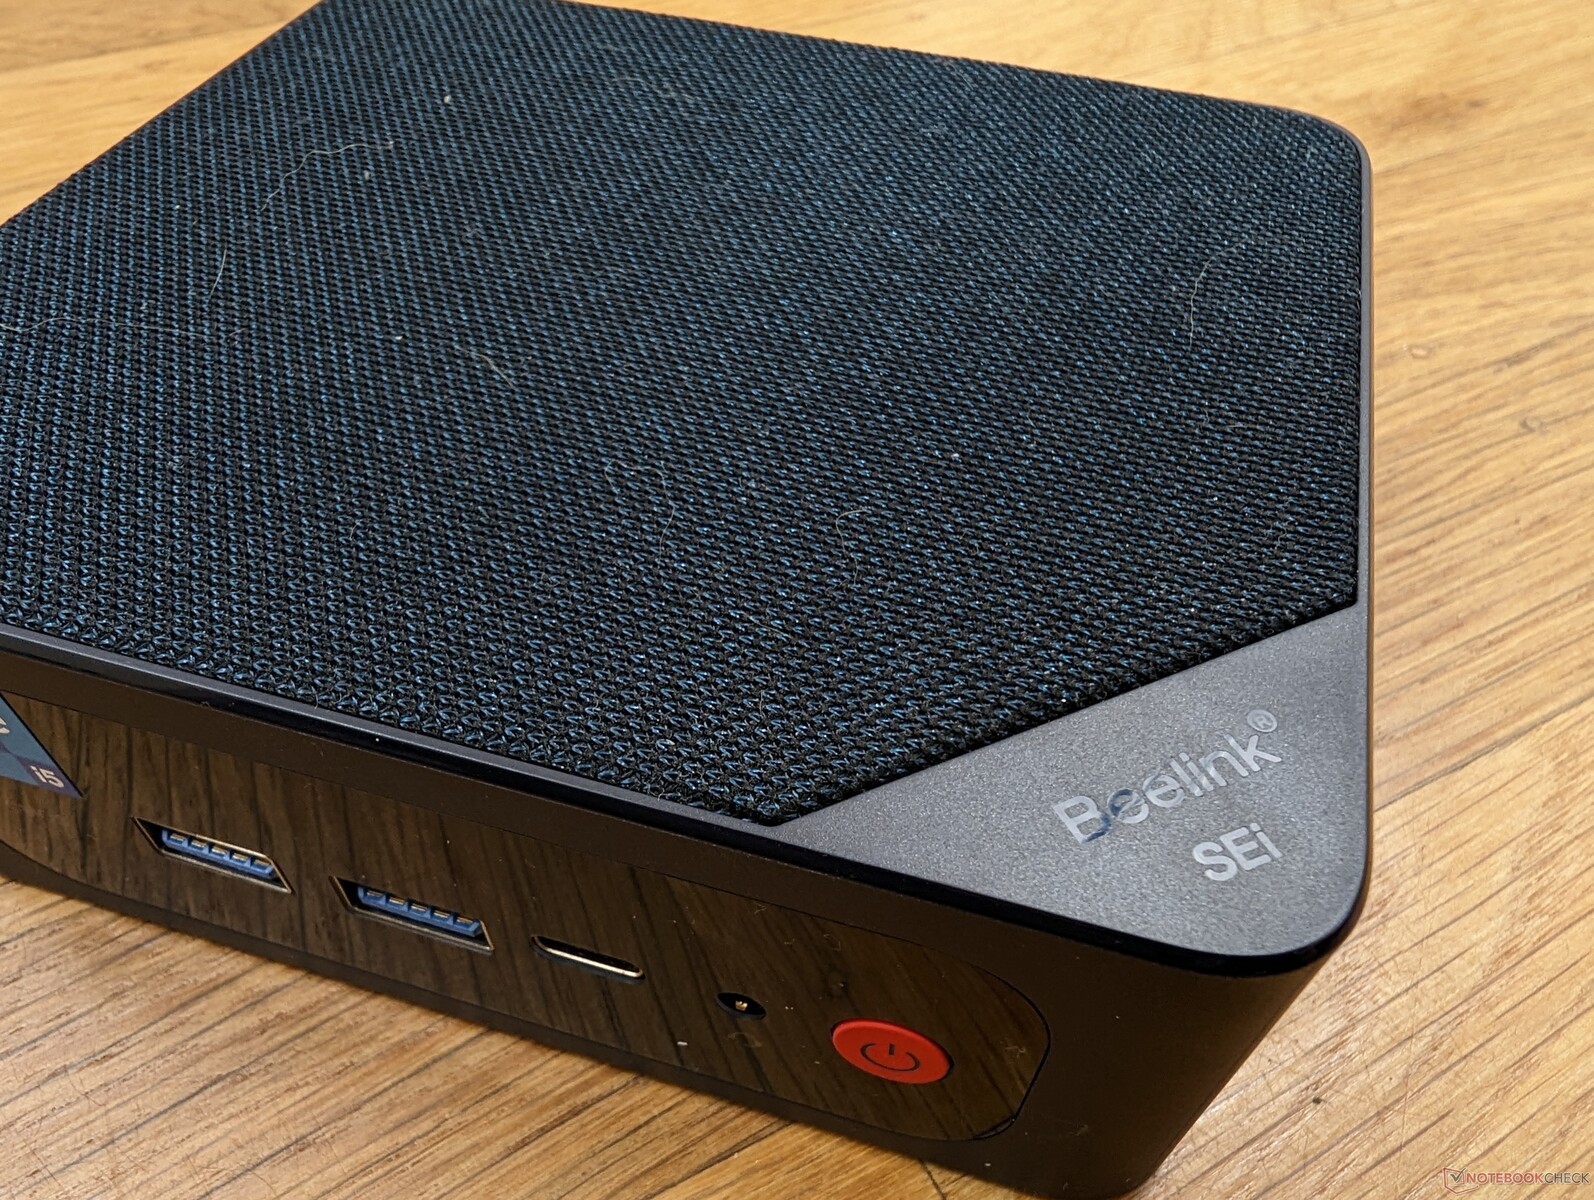
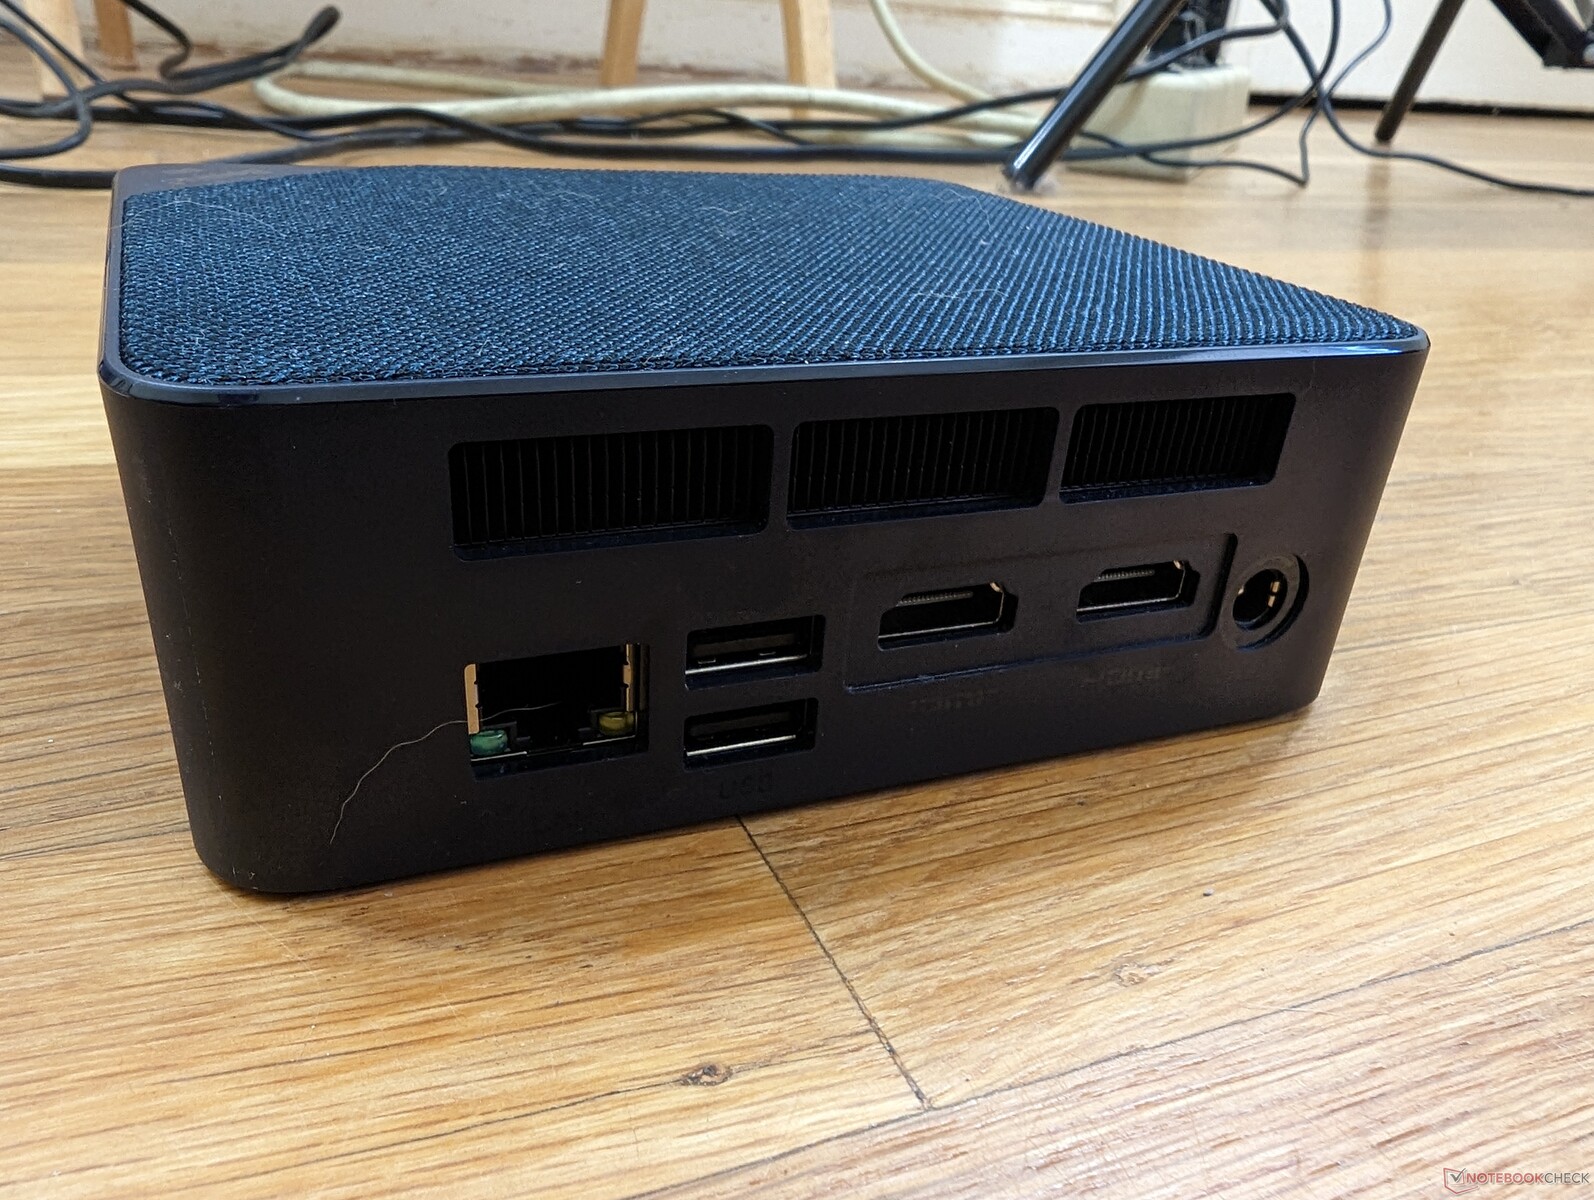
Connectivité - Pas de Thunderbolt
Les options de port sont excellentes avec cinq ports USB et deux ports HDMI. Cependant, nous sommes incapables d'émettre une vidéo à partir du port USB-C, ce qui signifie que la fonction DisplayPort-over-USB n'est peut-être pas prise en charge. Le système ne peut pas non plus être alimenté par le port USB-C.
Communication
Un Intel AX201 est fourni en standard pour la connectivité Wi-Fi 6 et Bluetooth 5.2. Il n'y a pas d'options Wi-Fi 6E susceptibles de limiter les coûts, mais les utilisateurs peuvent installer leur propre module Wi-Fi 6E s'ils le souhaitent. Les taux de transfert sont néanmoins à la fois rapides et réguliers.
| Networking | |
| iperf3 transmit AX12 | |
| Beelink SER4 | |
| Intel NUC11PAQi7 | |
| Intel Hades Canyon NUC8i7HVK | |
| Beelink SEi8 | |
| iperf3 receive AX12 | |
| Beelink SER4 | |
| Intel NUC11PAQi7 | |
| Intel Hades Canyon NUC8i7HVK | |
| Beelink SEi8 | |
| iperf3 receive AXE11000 | |
| Beelink SEi12 Core i5-1235U | |
| BMAX B5 Pro G7H8 | |
| iperf3 transmit AXE11000 | |
| Beelink SEi12 Core i5-1235U | |
| BMAX B5 Pro G7H8 | |
Maintenance
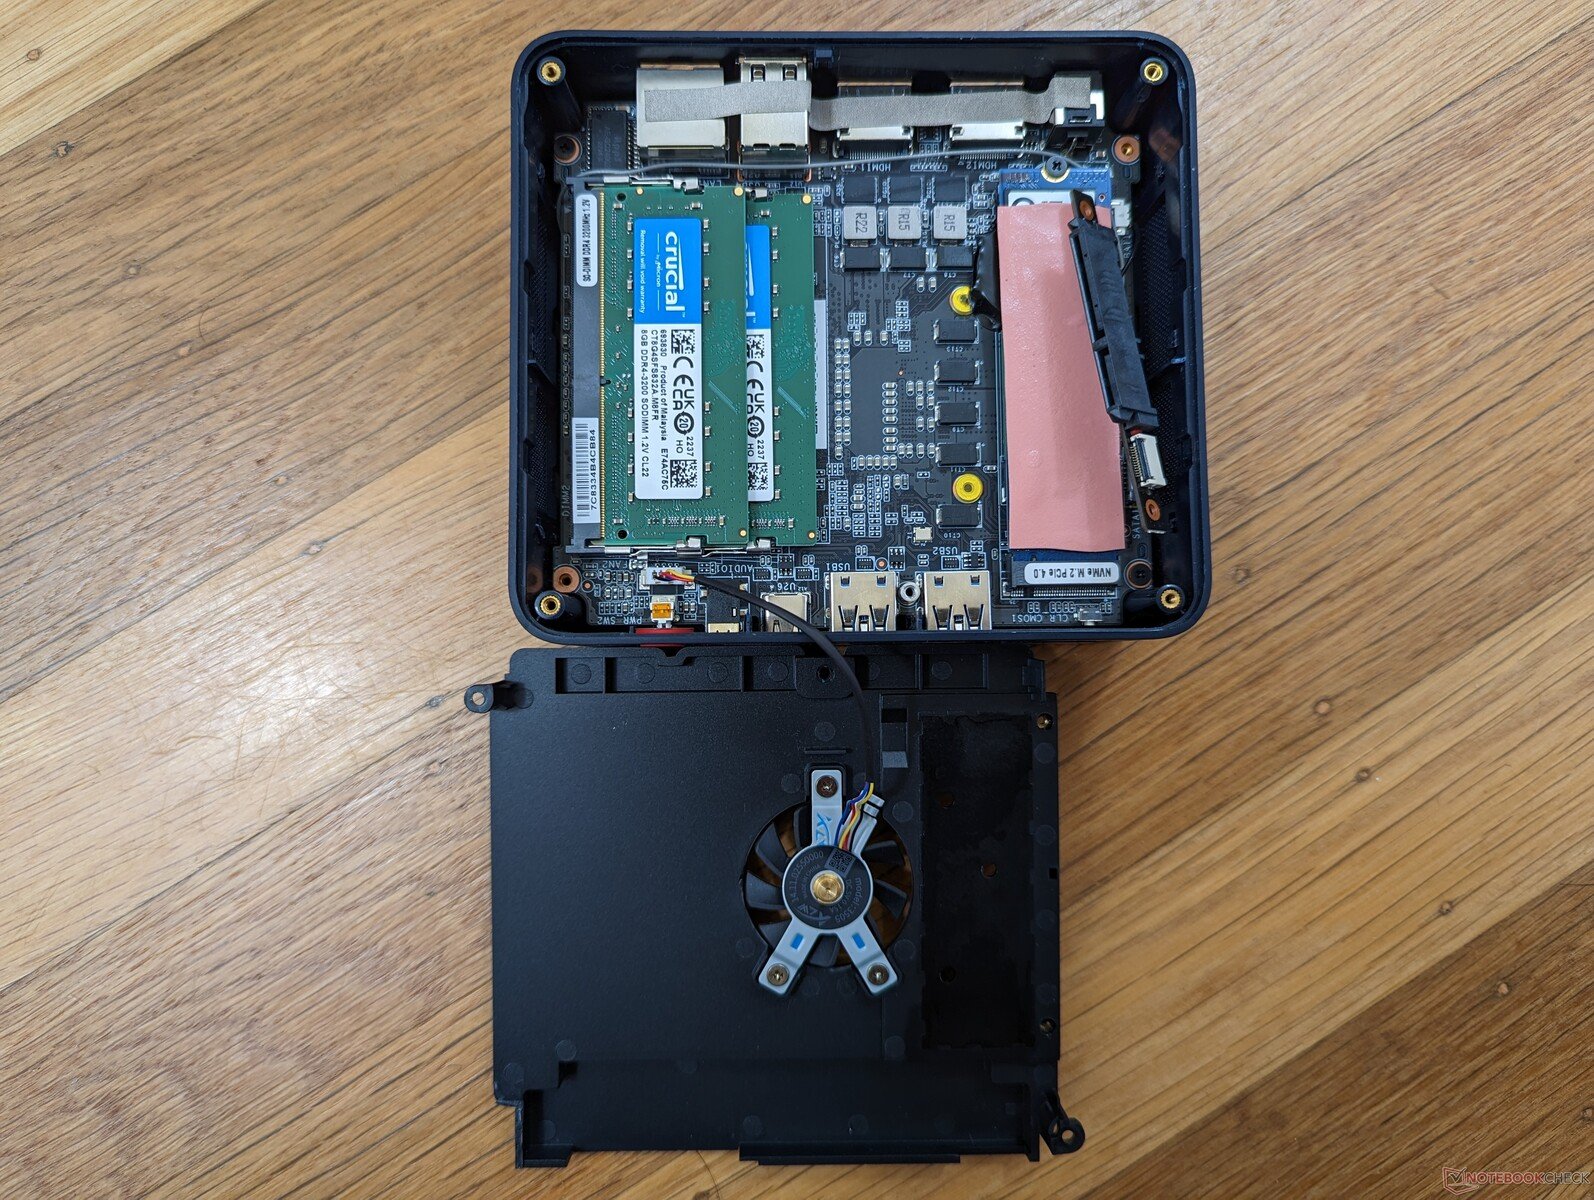
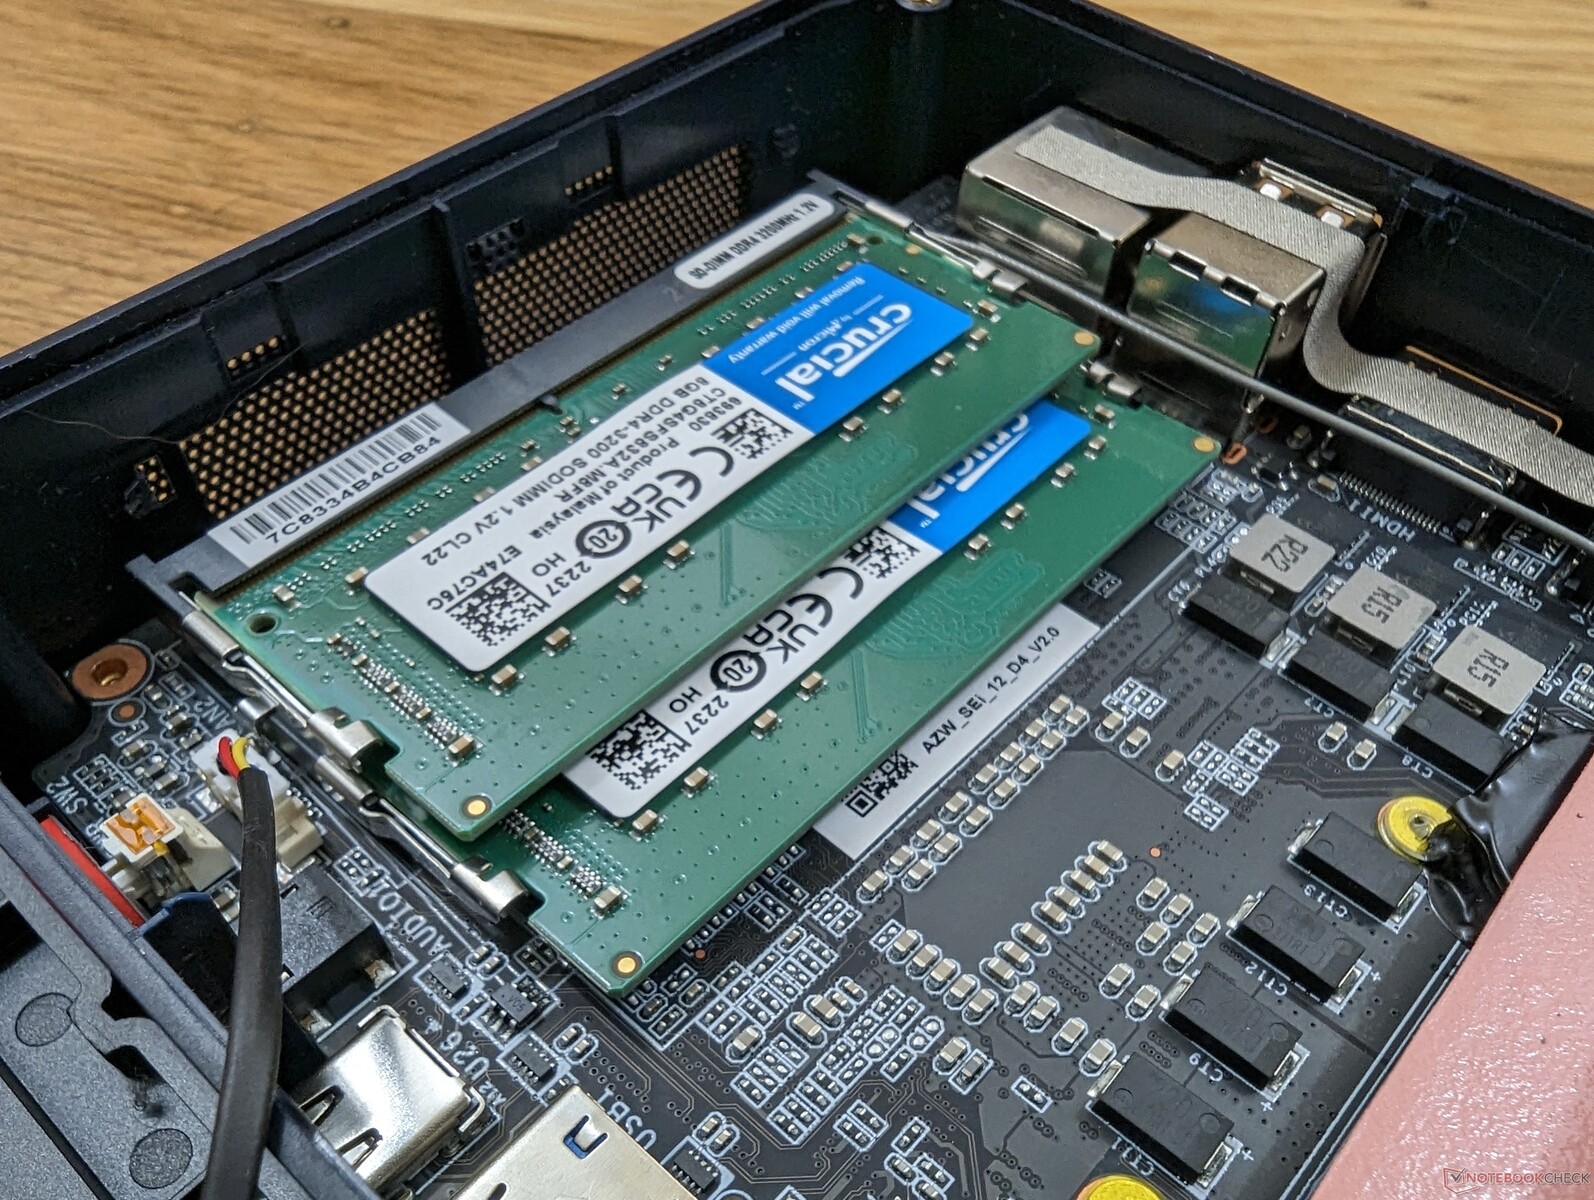
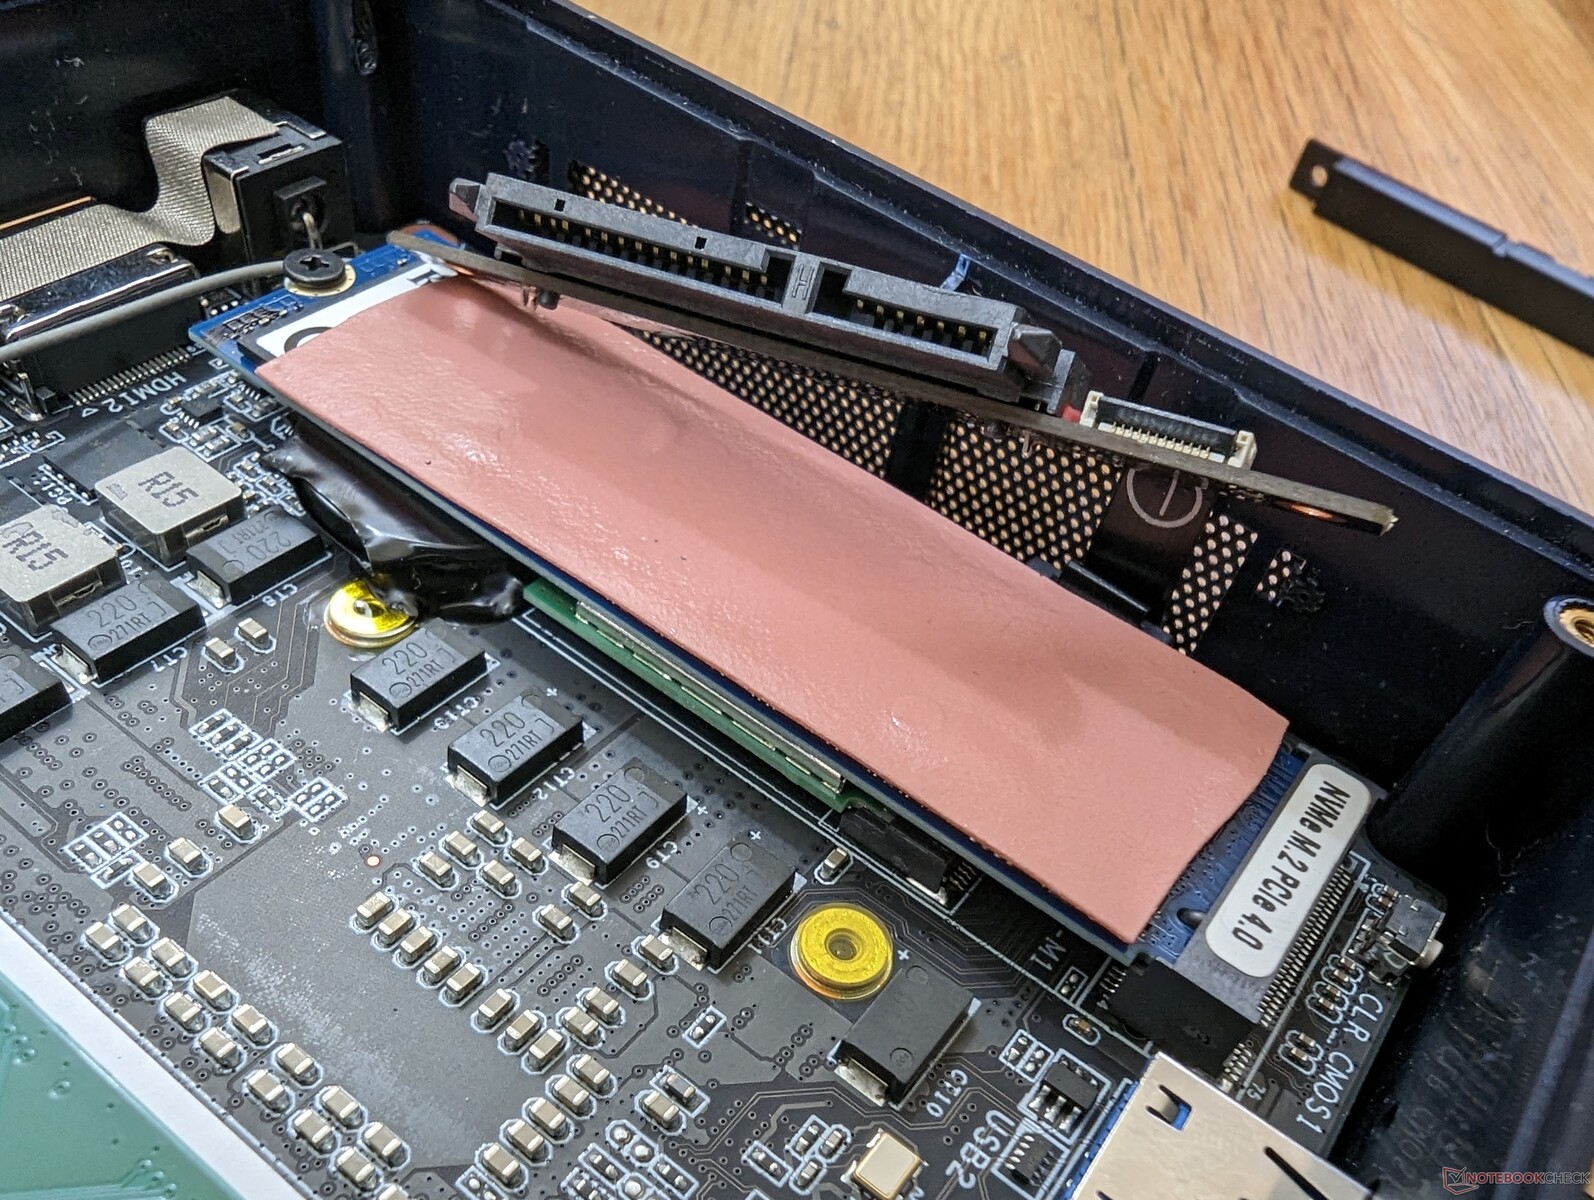
L'entretien nécessite un peu plus de travail que la plupart des autres mini-PC. Le retrait de la plaque inférieure expose l'un des ventilateurs qui doit ensuite être retiré pour révéler la RAM, le SSD M.2 et les modules WLAN M.2 comme le montrent les images ci-dessous. Heureusement, il suffit d'un tournevis Philips ordinaire pour toute mise à niveau.

Accessoires et garantie
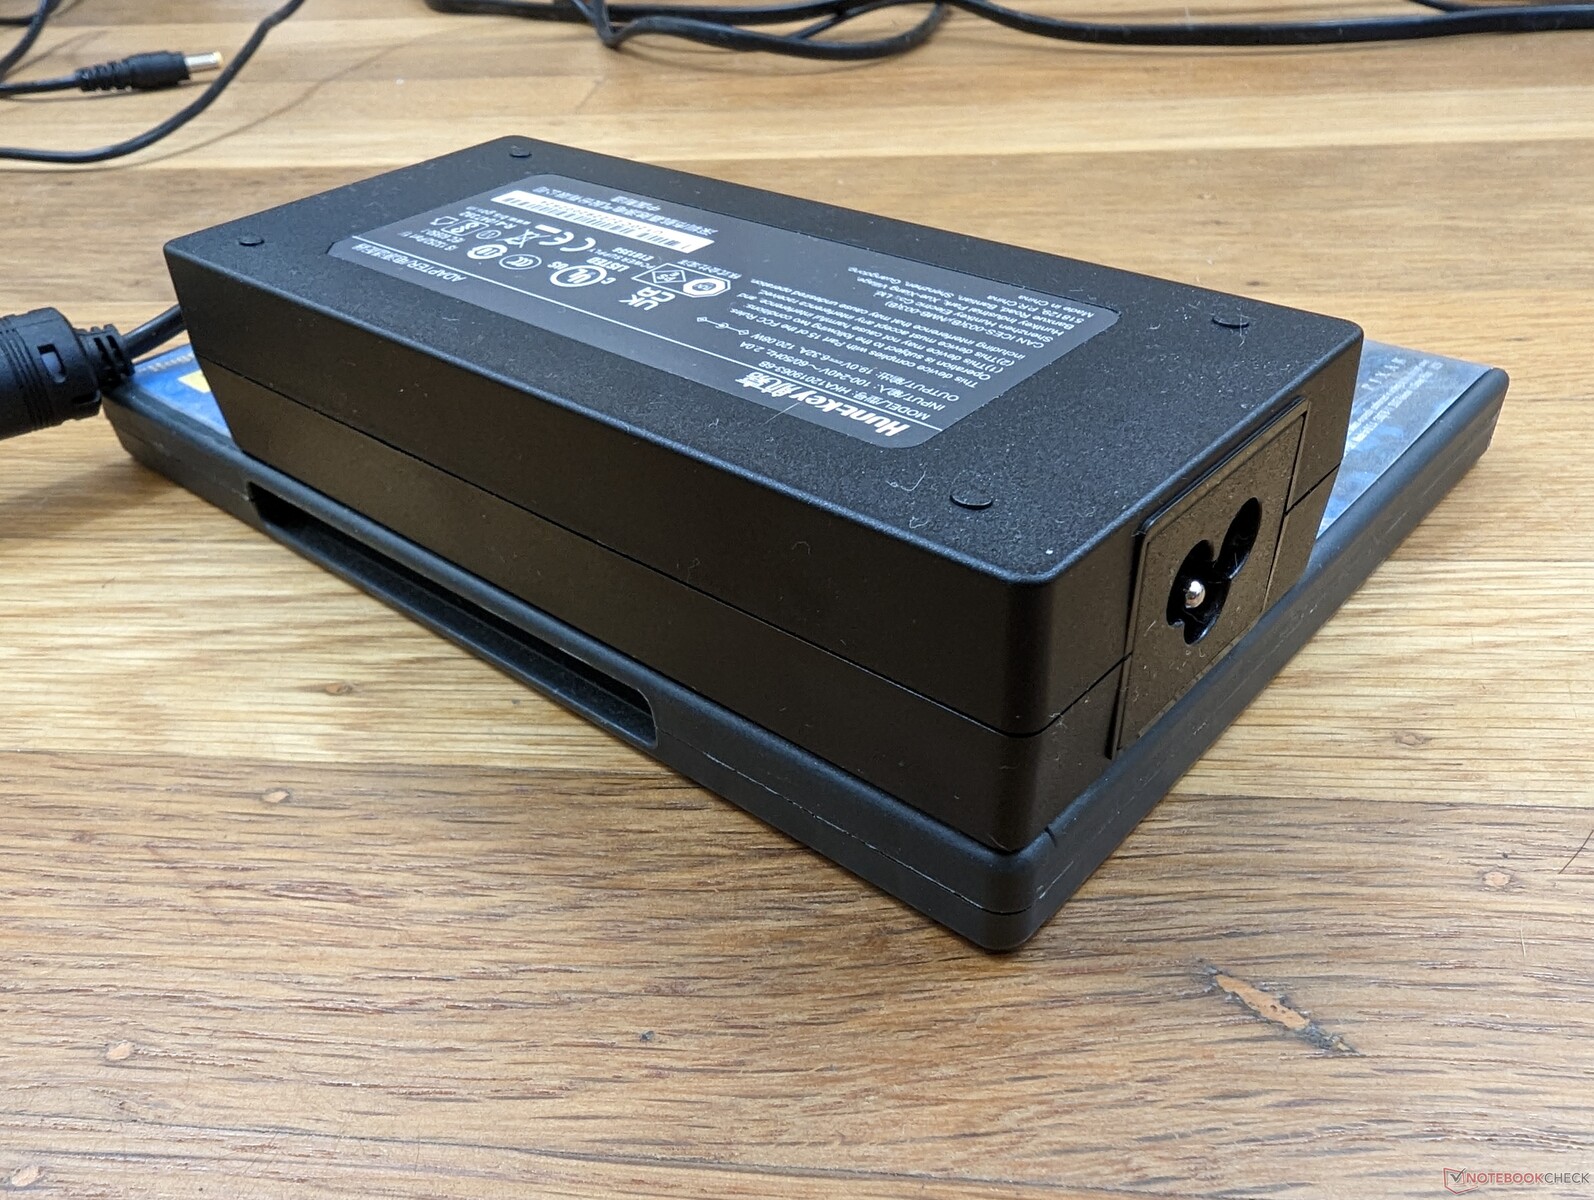
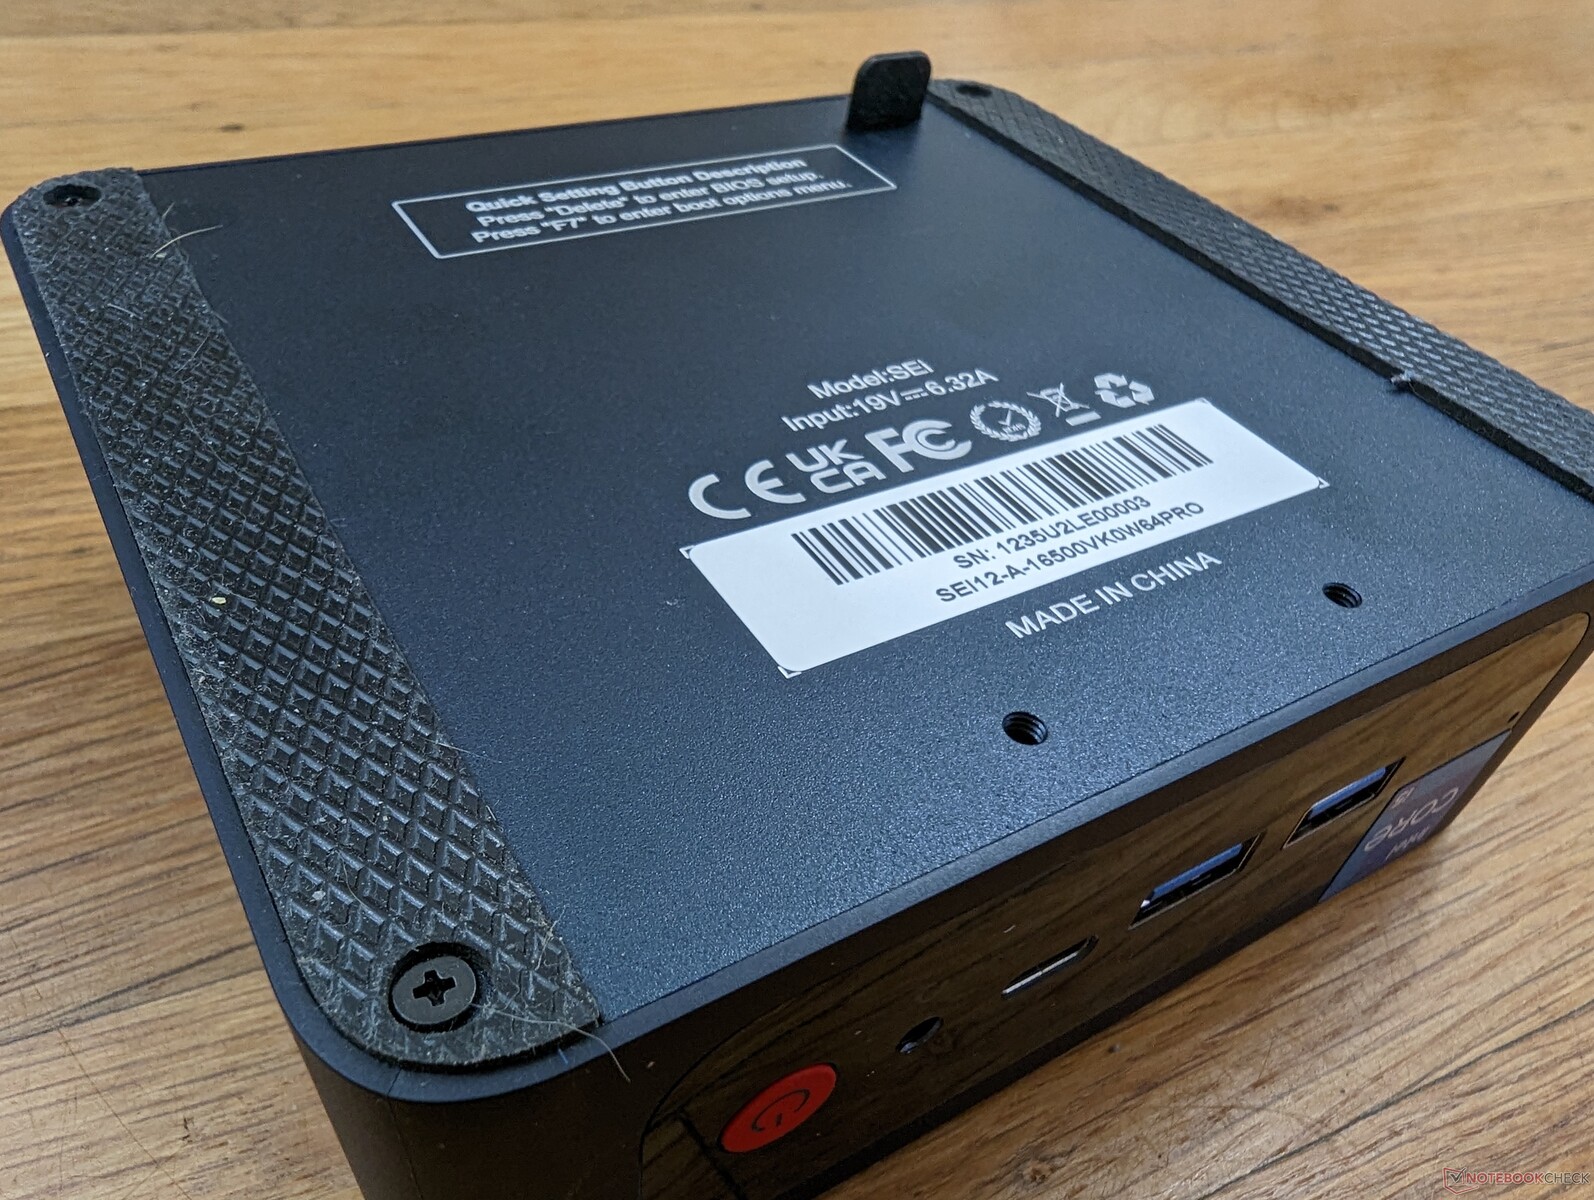
La boîte de détail comprend deux câbles HDMI, un support VESA avec vis, un manuel d'utilisation et l'adaptateur secteur. Une garantie limitée du fabricant d'un an s'applique, contre trois ans si vous achetez un NUC d'Intel.
Performance
Conditions d'essai
Nous avons réglé notre appareil en mode Performance avant d'effectuer les tests de performance ci-dessous. Le fabricant ne fournit aucune application préinstallée ni aucun logiciel de type "centre de contrôle" avec ses mini-PC.
Processeur
Les performances de l'unité centrale sont excellentes, avec des résultats nettement plus rapides que ceux de l'ordinateur.Ultra Slim 14.1 de Gateway ou VAIO FE 14.1, chacun avec le même Core i5-1235U de 12e génération Core i5-1235U DE 12E GÉNÉRATION. La durabilité de Turbo Boost pourrait certainement être meilleure, cependant, car les scores de CineBench R15 xT chuteraient d'environ 14 pour cent au fil du temps comme le montre le graphique ci-dessous. On ne s'attend pas à un potentiel Turbo Boost élevé, étant donné qu'il s'agit d'un processeur Core U-series
Les performances multithread globales sont environ 15 % plus rapides que celles du 11e génération de Core i7-1165G7 qui équipe le NUC11, plus onéreux.
Cinebench R15 Multi Loop
Cinebench R23: Multi Core | Single Core
Cinebench R15: CPU Multi 64Bit | CPU Single 64Bit
Blender: v2.79 BMW27 CPU
7-Zip 18.03: 7z b 4 | 7z b 4 -mmt1
Geekbench 5.5: Multi-Core | Single-Core
HWBOT x265 Benchmark v2.2: 4k Preset
LibreOffice : 20 Documents To PDF
R Benchmark 2.5: Overall mean
| Cinebench R20 / CPU (Multi Core) | |
| Beelink SER4 | |
| Intel NUC Pro Chassis_i7_1265U | |
| HP Spectre x360 13.5 14t-ef000 | |
| Beelink SEi12 Core i5-1235U | |
| Moyenne Intel Core i5-1235U (1783 - 3537, n=8) | |
| Intel NUC11PAQi7 | |
| Intel NUC Pro Chassis_i7_1185G7 | |
| Intel Hades Canyon NUC8i7HVK | |
| BMAX B5 Pro G7H8 | |
| Beelink SEi8 | |
| Cinebench R20 / CPU (Single Core) | |
| HP Spectre x360 13.5 14t-ef000 | |
| Intel NUC Pro Chassis_i7_1265U | |
| Beelink SEi12 Core i5-1235U | |
| Moyenne Intel Core i5-1235U (566 - 651, n=8) | |
| Intel NUC11PAQi7 | |
| Intel NUC Pro Chassis_i7_1185G7 | |
| Beelink SER4 | |
| Intel Hades Canyon NUC8i7HVK | |
| BMAX B5 Pro G7H8 | |
| Beelink SEi8 | |
| Cinebench R23 / Multi Core | |
| Beelink SER4 | |
| Intel NUC Pro Chassis_i7_1265U | |
| HP Spectre x360 13.5 14t-ef000 | |
| Beelink SEi12 Core i5-1235U | |
| Intel NUC11PAQi7 | |
| Moyenne Intel Core i5-1235U (2485 - 9208, n=8) | |
| Intel NUC Pro Chassis_i7_1185G7 | |
| BMAX B5 Pro G7H8 | |
| Beelink SEi8 | |
| Cinebench R23 / Single Core | |
| HP Spectre x360 13.5 14t-ef000 | |
| Intel NUC Pro Chassis_i7_1265U | |
| Beelink SEi12 Core i5-1235U | |
| Moyenne Intel Core i5-1235U (1444 - 1698, n=8) | |
| Intel NUC Pro Chassis_i7_1185G7 | |
| Beelink SER4 | |
| Beelink SEi8 | |
| BMAX B5 Pro G7H8 | |
| Cinebench R15 / CPU Multi 64Bit | |
| Beelink SER4 | |
| Beelink SEi12 Core i5-1235U | |
| HP Spectre x360 13.5 14t-ef000 | |
| Intel NUC Pro Chassis_i7_1265U | |
| Moyenne Intel Core i5-1235U (785 - 1587, n=8) | |
| Intel NUC11PAQi7 | |
| Intel Hades Canyon NUC8i7HVK | |
| Intel NUC Pro Chassis_i7_1185G7 | |
| BMAX B5 Pro G7H8 | |
| Beelink SEi8 | |
| Cinebench R15 / CPU Single 64Bit | |
| HP Spectre x360 13.5 14t-ef000 | |
| Intel NUC Pro Chassis_i7_1265U | |
| Beelink SEi12 Core i5-1235U | |
| Intel NUC11PAQi7 | |
| Intel NUC Pro Chassis_i7_1185G7 | |
| Moyenne Intel Core i5-1235U (151.5 - 242, n=8) | |
| Beelink SER4 | |
| Intel Hades Canyon NUC8i7HVK | |
| BMAX B5 Pro G7H8 | |
| Beelink SEi8 | |
| Blender / v2.79 BMW27 CPU | |
| Beelink SEi8 | |
| BMAX B5 Pro G7H8 | |
| Intel NUC Pro Chassis_i7_1185G7 | |
| Intel Hades Canyon NUC8i7HVK | |
| Moyenne Intel Core i5-1235U (366 - 662, n=8) | |
| Intel NUC11PAQi7 | |
| Beelink SEi12 Core i5-1235U | |
| HP Spectre x360 13.5 14t-ef000 | |
| Intel NUC Pro Chassis_i7_1265U | |
| Beelink SER4 | |
| 7-Zip 18.03 / 7z b 4 -mmt1 | |
| HP Spectre x360 13.5 14t-ef000 | |
| Intel NUC11PAQi7 | |
| Intel NUC Pro Chassis_i7_1265U | |
| Intel NUC Pro Chassis_i7_1185G7 | |
| Beelink SEi12 Core i5-1235U | |
| Moyenne Intel Core i5-1235U (4371 - 5233, n=8) | |
| Beelink SER4 | |
| Intel Hades Canyon NUC8i7HVK | |
| BMAX B5 Pro G7H8 | |
| Beelink SEi8 | |
| Geekbench 5.5 / Multi-Core | |
| Intel NUC Pro Chassis_i7_1265U | |
| HP Spectre x360 13.5 14t-ef000 | |
| Beelink SEi12 Core i5-1235U | |
| Moyenne Intel Core i5-1235U (5528 - 8571, n=10) | |
| Beelink SER4 | |
| Intel NUC Pro Chassis_i7_1185G7 | |
| Intel NUC11PAQi7 | |
| Beelink SEi8 | |
| BMAX B5 Pro G7H8 | |
| Geekbench 5.5 / Single-Core | |
| Intel NUC Pro Chassis_i7_1265U | |
| HP Spectre x360 13.5 14t-ef000 | |
| Beelink SEi12 Core i5-1235U | |
| Intel NUC11PAQi7 | |
| Moyenne Intel Core i5-1235U (1426 - 1643, n=10) | |
| Intel NUC Pro Chassis_i7_1185G7 | |
| Beelink SER4 | |
| Beelink SEi8 | |
| BMAX B5 Pro G7H8 | |
| HWBOT x265 Benchmark v2.2 / 4k Preset | |
| Beelink SER4 | |
| HP Spectre x360 13.5 14t-ef000 | |
| Intel NUC Pro Chassis_i7_1265U | |
| Beelink SEi12 Core i5-1235U | |
| Intel NUC11PAQi7 | |
| Moyenne Intel Core i5-1235U (4.99 - 9.43, n=8) | |
| Intel Hades Canyon NUC8i7HVK | |
| Intel NUC Pro Chassis_i7_1185G7 | |
| Beelink SEi8 | |
| BMAX B5 Pro G7H8 | |
| LibreOffice / 20 Documents To PDF | |
| BMAX B5 Pro G7H8 | |
| Beelink SEi8 | |
| Beelink SER4 | |
| Moyenne Intel Core i5-1235U (42.4 - 65.5, n=8) | |
| Intel NUC Pro Chassis_i7_1265U | |
| Beelink SEi12 Core i5-1235U | |
| Intel NUC Pro Chassis_i7_1185G7 | |
| HP Spectre x360 13.5 14t-ef000 | |
| Intel NUC11PAQi7 | |
| R Benchmark 2.5 / Overall mean | |
| BMAX B5 Pro G7H8 | |
| Beelink SEi8 | |
| Intel NUC Pro Chassis_i7_1185G7 | |
| Beelink SER4 | |
| Intel NUC11PAQi7 | |
| Moyenne Intel Core i5-1235U (0.4986 - 0.603, n=8) | |
| Beelink SEi12 Core i5-1235U | |
| Intel NUC Pro Chassis_i7_1265U | |
| HP Spectre x360 13.5 14t-ef000 | |
* ... Moindre est la valeur, meilleures sont les performances
AIDA64: FP32 Ray-Trace | FPU Julia | CPU SHA3 | CPU Queen | FPU SinJulia | FPU Mandel | CPU AES | CPU ZLib | FP64 Ray-Trace | CPU PhotoWorxx
| Performance rating | |
| Beelink SER4 | |
| HP Spectre x360 13.5 14t-ef000 | |
| Intel NUC Pro Chassis_i7_1265U | |
| Beelink SEi12 Core i5-1235U | |
| Intel NUC Pro Chassis_i7_1185G7 | |
| Moyenne Intel Core i5-1235U | |
| BMAX B5 Pro G7H8 | |
| Beelink SEi8 | |
| AIDA64 / FP32 Ray-Trace | |
| Beelink SER4 | |
| HP Spectre x360 13.5 14t-ef000 | |
| Intel NUC Pro Chassis_i7_1185G7 | |
| Intel NUC Pro Chassis_i7_1265U | |
| Beelink SEi12 Core i5-1235U | |
| Moyenne Intel Core i5-1235U (3078 - 7457, n=8) | |
| BMAX B5 Pro G7H8 | |
| Beelink SEi8 | |
| AIDA64 / FPU Julia | |
| Beelink SER4 | |
| HP Spectre x360 13.5 14t-ef000 | |
| Intel NUC Pro Chassis_i7_1265U | |
| Beelink SEi12 Core i5-1235U | |
| Intel NUC Pro Chassis_i7_1185G7 | |
| Moyenne Intel Core i5-1235U (15838 - 37760, n=8) | |
| BMAX B5 Pro G7H8 | |
| Beelink SEi8 | |
| AIDA64 / CPU SHA3 | |
| HP Spectre x360 13.5 14t-ef000 | |
| Intel NUC Pro Chassis_i7_1185G7 | |
| Intel NUC Pro Chassis_i7_1265U | |
| Beelink SEi12 Core i5-1235U | |
| Beelink SER4 | |
| Moyenne Intel Core i5-1235U (978 - 2072, n=8) | |
| BMAX B5 Pro G7H8 | |
| Beelink SEi8 | |
| AIDA64 / CPU Queen | |
| Beelink SER4 | |
| Intel NUC Pro Chassis_i7_1265U | |
| HP Spectre x360 13.5 14t-ef000 | |
| Beelink SEi12 Core i5-1235U | |
| Moyenne Intel Core i5-1235U (45680 - 62404, n=8) | |
| Intel NUC Pro Chassis_i7_1185G7 | |
| BMAX B5 Pro G7H8 | |
| Beelink SEi8 | |
| AIDA64 / FPU SinJulia | |
| Beelink SER4 | |
| Intel NUC Pro Chassis_i7_1265U | |
| Beelink SEi12 Core i5-1235U | |
| Intel NUC Pro Chassis_i7_1185G7 | |
| HP Spectre x360 13.5 14t-ef000 | |
| BMAX B5 Pro G7H8 | |
| Moyenne Intel Core i5-1235U (3099 - 4644, n=8) | |
| Beelink SEi8 | |
| AIDA64 / FPU Mandel | |
| Beelink SER4 | |
| HP Spectre x360 13.5 14t-ef000 | |
| Intel NUC Pro Chassis_i7_1265U | |
| Intel NUC Pro Chassis_i7_1185G7 | |
| Beelink SEi12 Core i5-1235U | |
| Moyenne Intel Core i5-1235U (8046 - 18819, n=8) | |
| BMAX B5 Pro G7H8 | |
| Beelink SEi8 | |
| AIDA64 / CPU AES | |
| Intel NUC Pro Chassis_i7_1185G7 | |
| HP Spectre x360 13.5 14t-ef000 | |
| Beelink SEi12 Core i5-1235U | |
| Beelink SER4 | |
| Intel NUC Pro Chassis_i7_1265U | |
| Moyenne Intel Core i5-1235U (23386 - 67140, n=8) | |
| BMAX B5 Pro G7H8 | |
| Beelink SEi8 | |
| AIDA64 / CPU ZLib | |
| Beelink SEi12 Core i5-1235U | |
| Beelink SER4 | |
| Intel NUC Pro Chassis_i7_1265U | |
| HP Spectre x360 13.5 14t-ef000 | |
| Moyenne Intel Core i5-1235U (329 - 633, n=8) | |
| Intel NUC Pro Chassis_i7_1185G7 | |
| BMAX B5 Pro G7H8 | |
| Beelink SEi8 | |
| AIDA64 / FP64 Ray-Trace | |
| Beelink SER4 | |
| HP Spectre x360 13.5 14t-ef000 | |
| Intel NUC Pro Chassis_i7_1265U | |
| Intel NUC Pro Chassis_i7_1185G7 | |
| Beelink SEi12 Core i5-1235U | |
| Moyenne Intel Core i5-1235U (1670 - 3928, n=8) | |
| BMAX B5 Pro G7H8 | |
| Beelink SEi8 | |
| AIDA64 / CPU PhotoWorxx | |
| Intel NUC Pro Chassis_i7_1265U | |
| HP Spectre x360 13.5 14t-ef000 | |
| Intel NUC Pro Chassis_i7_1185G7 | |
| Moyenne Intel Core i5-1235U (15933 - 41909, n=8) | |
| Beelink SEi12 Core i5-1235U | |
| Beelink SER4 | |
| BMAX B5 Pro G7H8 | |
| Beelink SEi8 | |
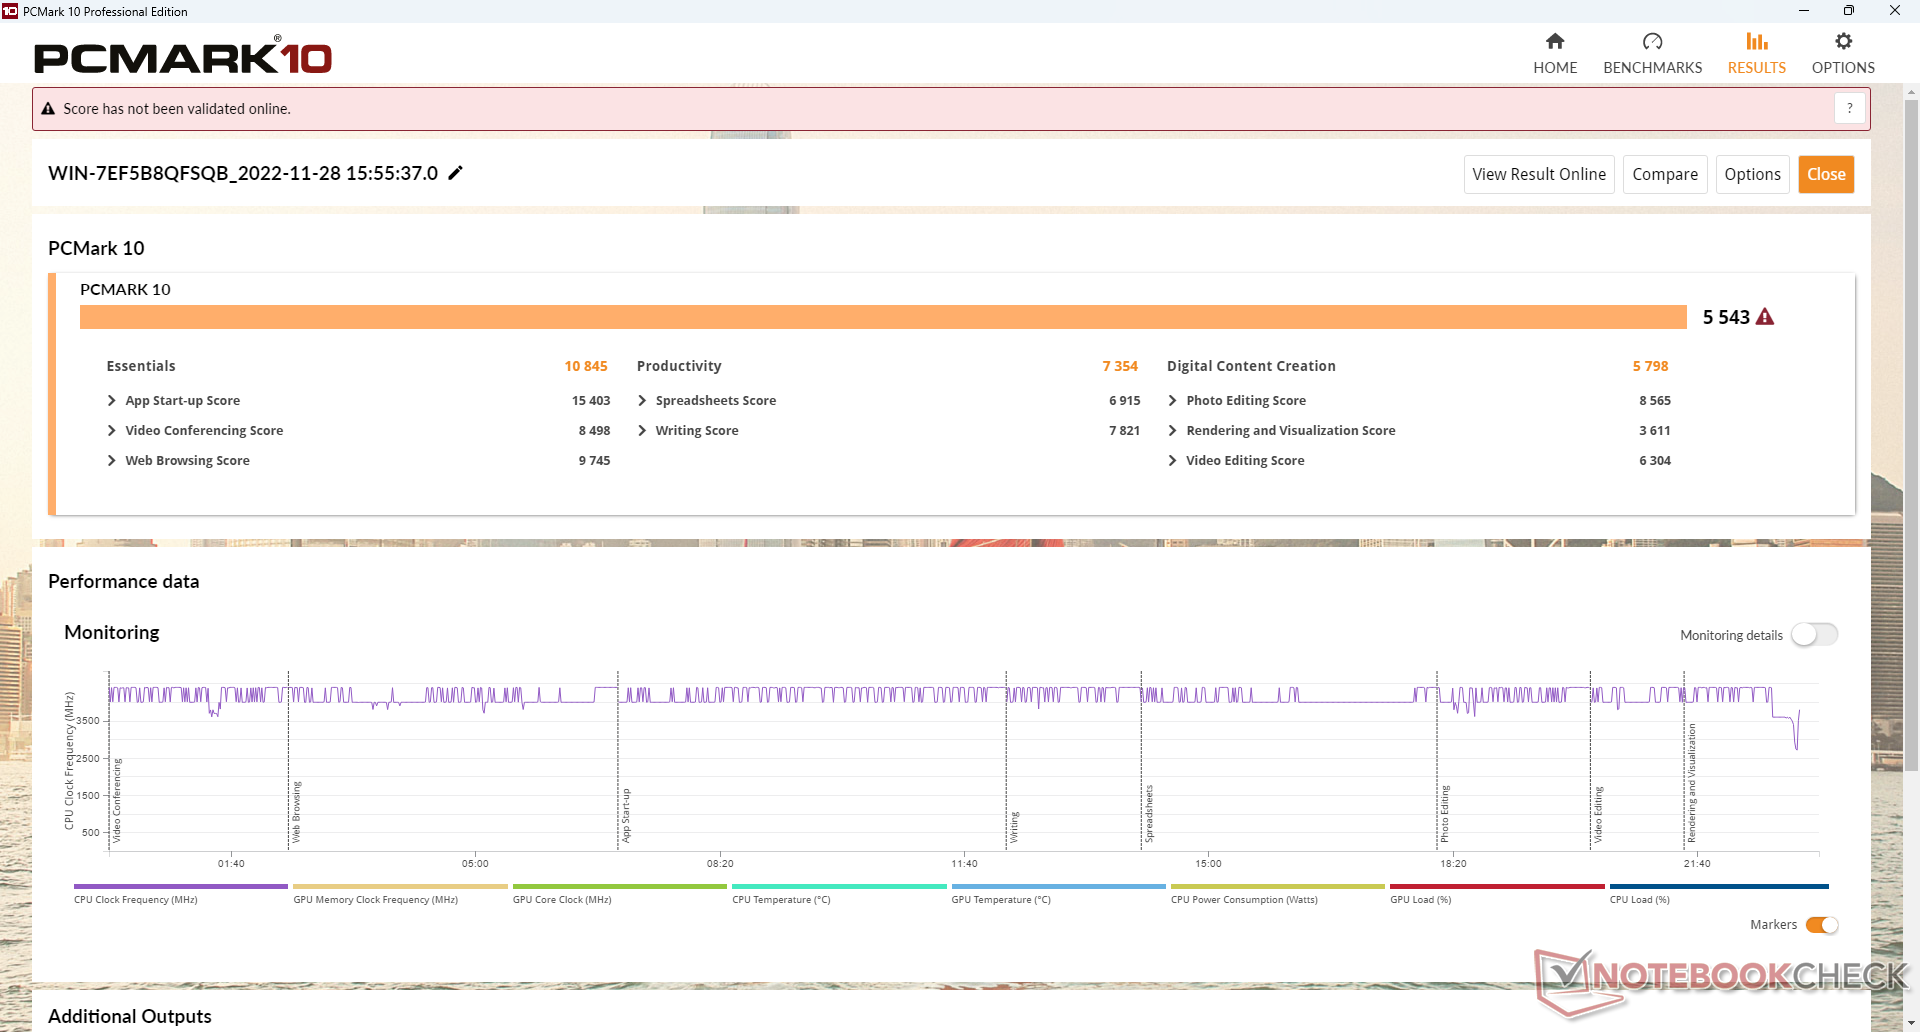
Performance du système
Les résultats PCMark sont nettement supérieurs à ceux de l'ancien modèleBeelink SEi8 qui utilise un i3-8109U de 8e génération et un SSD Intel 660p plus lent.
CrossMark: Overall | Productivity | Creativity | Responsiveness
| PCMark 10 / Score | |
| Beelink SEi12 Core i5-1235U | |
| Intel Hades Canyon NUC8i7HVK | |
| Beelink SER4 | |
| Intel NUC11PAQi7 | |
| Moyenne Intel Core i5-1235U, Intel Iris Xe Graphics G7 80EUs (4528 - 5543, n=8) | |
| BMAX B5 Pro G7H8 | |
| Beelink SEi8 | |
| PCMark 10 / Essentials | |
| Beelink SEi12 Core i5-1235U | |
| Intel NUC11PAQi7 | |
| Moyenne Intel Core i5-1235U, Intel Iris Xe Graphics G7 80EUs (9143 - 11273, n=8) | |
| Beelink SER4 | |
| Intel Hades Canyon NUC8i7HVK | |
| BMAX B5 Pro G7H8 | |
| Beelink SEi8 | |
| PCMark 10 / Productivity | |
| Beelink SER4 | |
| Intel Hades Canyon NUC8i7HVK | |
| Beelink SEi12 Core i5-1235U | |
| Intel NUC11PAQi7 | |
| Moyenne Intel Core i5-1235U, Intel Iris Xe Graphics G7 80EUs (6440 - 7354, n=8) | |
| BMAX B5 Pro G7H8 | |
| Beelink SEi8 | |
| PCMark 10 / Digital Content Creation | |
| Beelink SEi12 Core i5-1235U | |
| Intel Hades Canyon NUC8i7HVK | |
| Beelink SER4 | |
| Moyenne Intel Core i5-1235U, Intel Iris Xe Graphics G7 80EUs (4220 - 5839, n=8) | |
| Intel NUC11PAQi7 | |
| BMAX B5 Pro G7H8 | |
| Beelink SEi8 | |
| CrossMark / Overall | |
| Beelink SEi12 Core i5-1235U | |
| Moyenne Intel Core i5-1235U, Intel Iris Xe Graphics G7 80EUs (983 - 1644, n=8) | |
| BMAX B5 Pro G7H8 | |
| CrossMark / Productivity | |
| Beelink SEi12 Core i5-1235U | |
| Moyenne Intel Core i5-1235U, Intel Iris Xe Graphics G7 80EUs (1026 - 1676, n=8) | |
| BMAX B5 Pro G7H8 | |
| CrossMark / Creativity | |
| Beelink SEi12 Core i5-1235U | |
| Moyenne Intel Core i5-1235U, Intel Iris Xe Graphics G7 80EUs (1032 - 1618, n=8) | |
| BMAX B5 Pro G7H8 | |
| CrossMark / Responsiveness | |
| Beelink SEi12 Core i5-1235U | |
| Moyenne Intel Core i5-1235U, Intel Iris Xe Graphics G7 80EUs (746 - 1867, n=8) | |
| BMAX B5 Pro G7H8 | |
| PCMark 10 Score | 5543 points | |
Aide | ||
| AIDA64 / Memory Copy | |
| Moyenne Intel Core i5-1235U (24653 - 61921, n=8) | |
| Beelink SEi12 Core i5-1235U | |
| Beelink SER4 | |
| Beelink SEi8 | |
| BMAX B5 Pro G7H8 | |
| AIDA64 / Memory Read | |
| Moyenne Intel Core i5-1235U (24441 - 66108, n=8) | |
| Beelink SEi12 Core i5-1235U | |
| Beelink SER4 | |
| BMAX B5 Pro G7H8 | |
| Beelink SEi8 | |
| AIDA64 / Memory Write | |
| Moyenne Intel Core i5-1235U (25156 - 75808, n=8) | |
| Beelink SEi12 Core i5-1235U | |
| Beelink SER4 | |
| BMAX B5 Pro G7H8 | |
| Beelink SEi8 | |
| AIDA64 / Memory Latency | |
| Beelink SER4 | |
| BMAX B5 Pro G7H8 | |
| Beelink SEi12 Core i5-1235U | |
| Moyenne Intel Core i5-1235U (76.3 - 119, n=8) | |
| Beelink SEi8 | |
* ... Moindre est la valeur, meilleures sont les performances
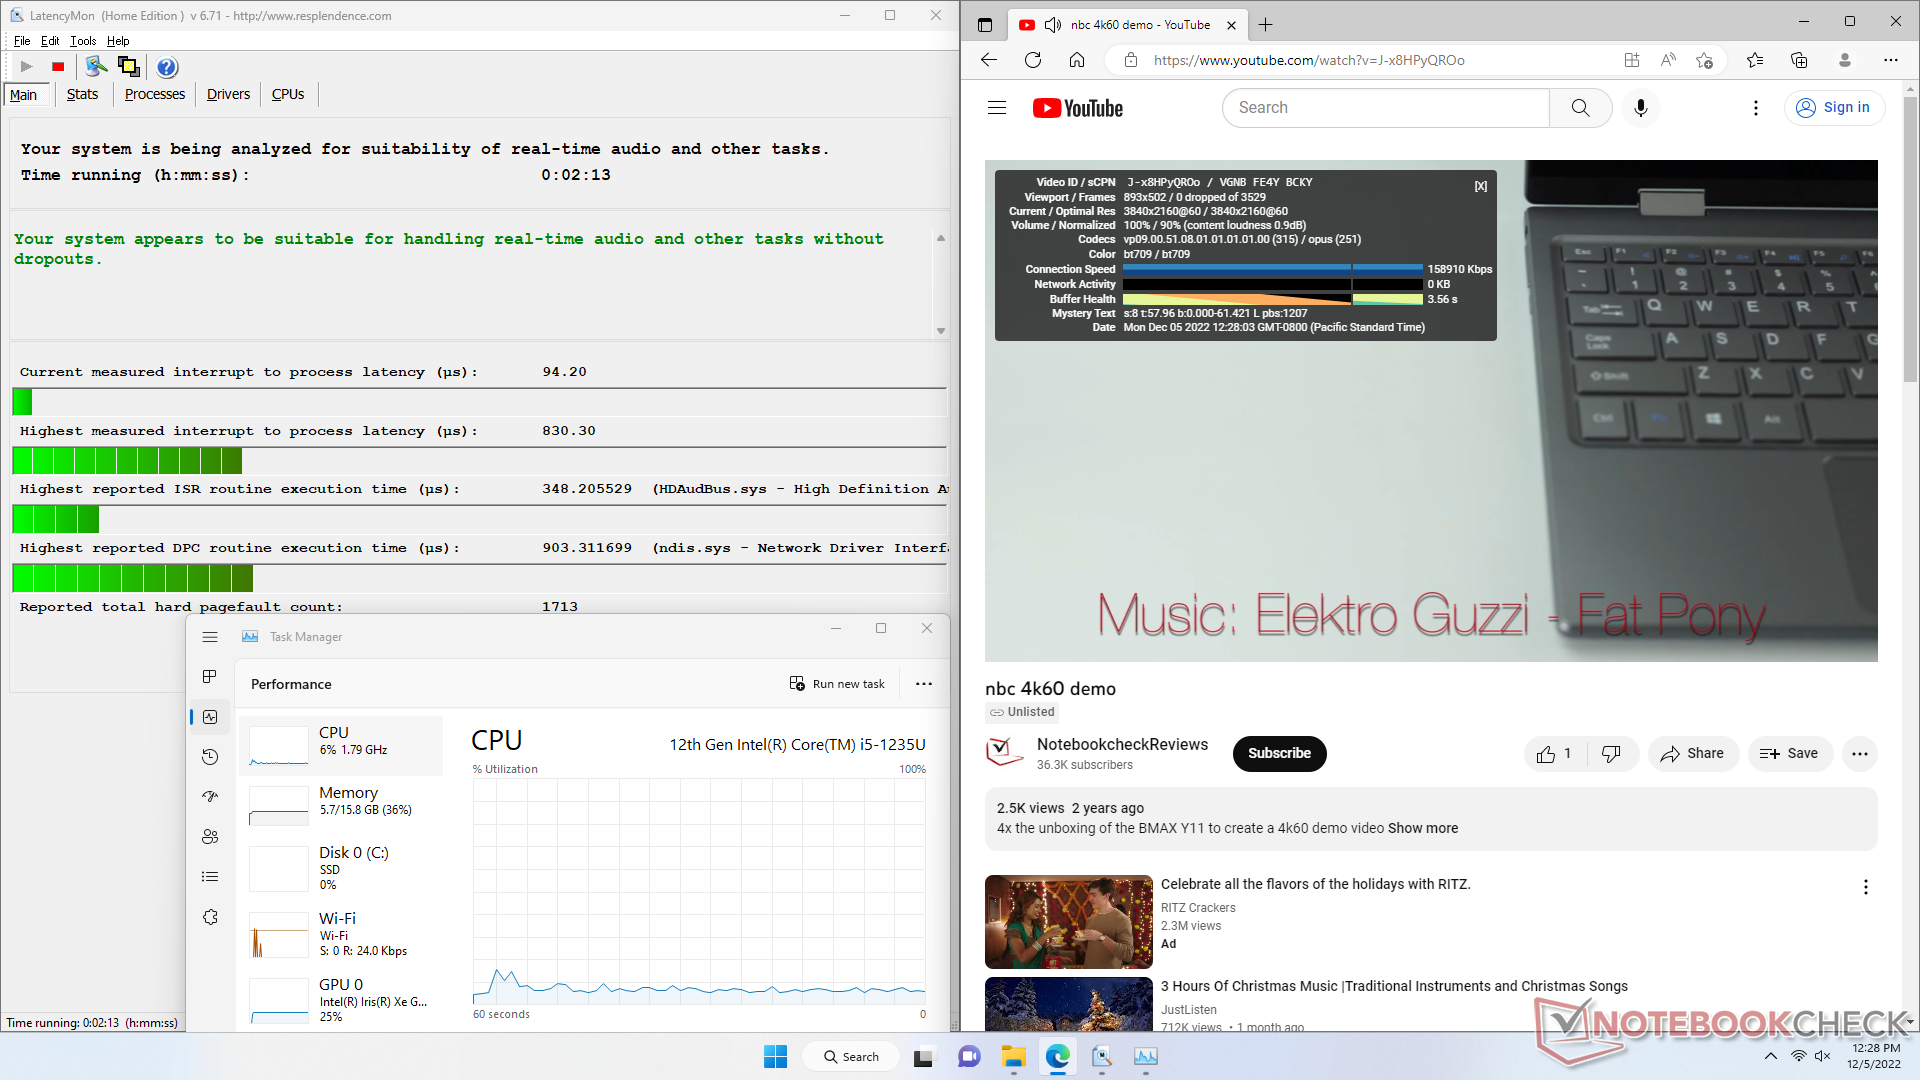
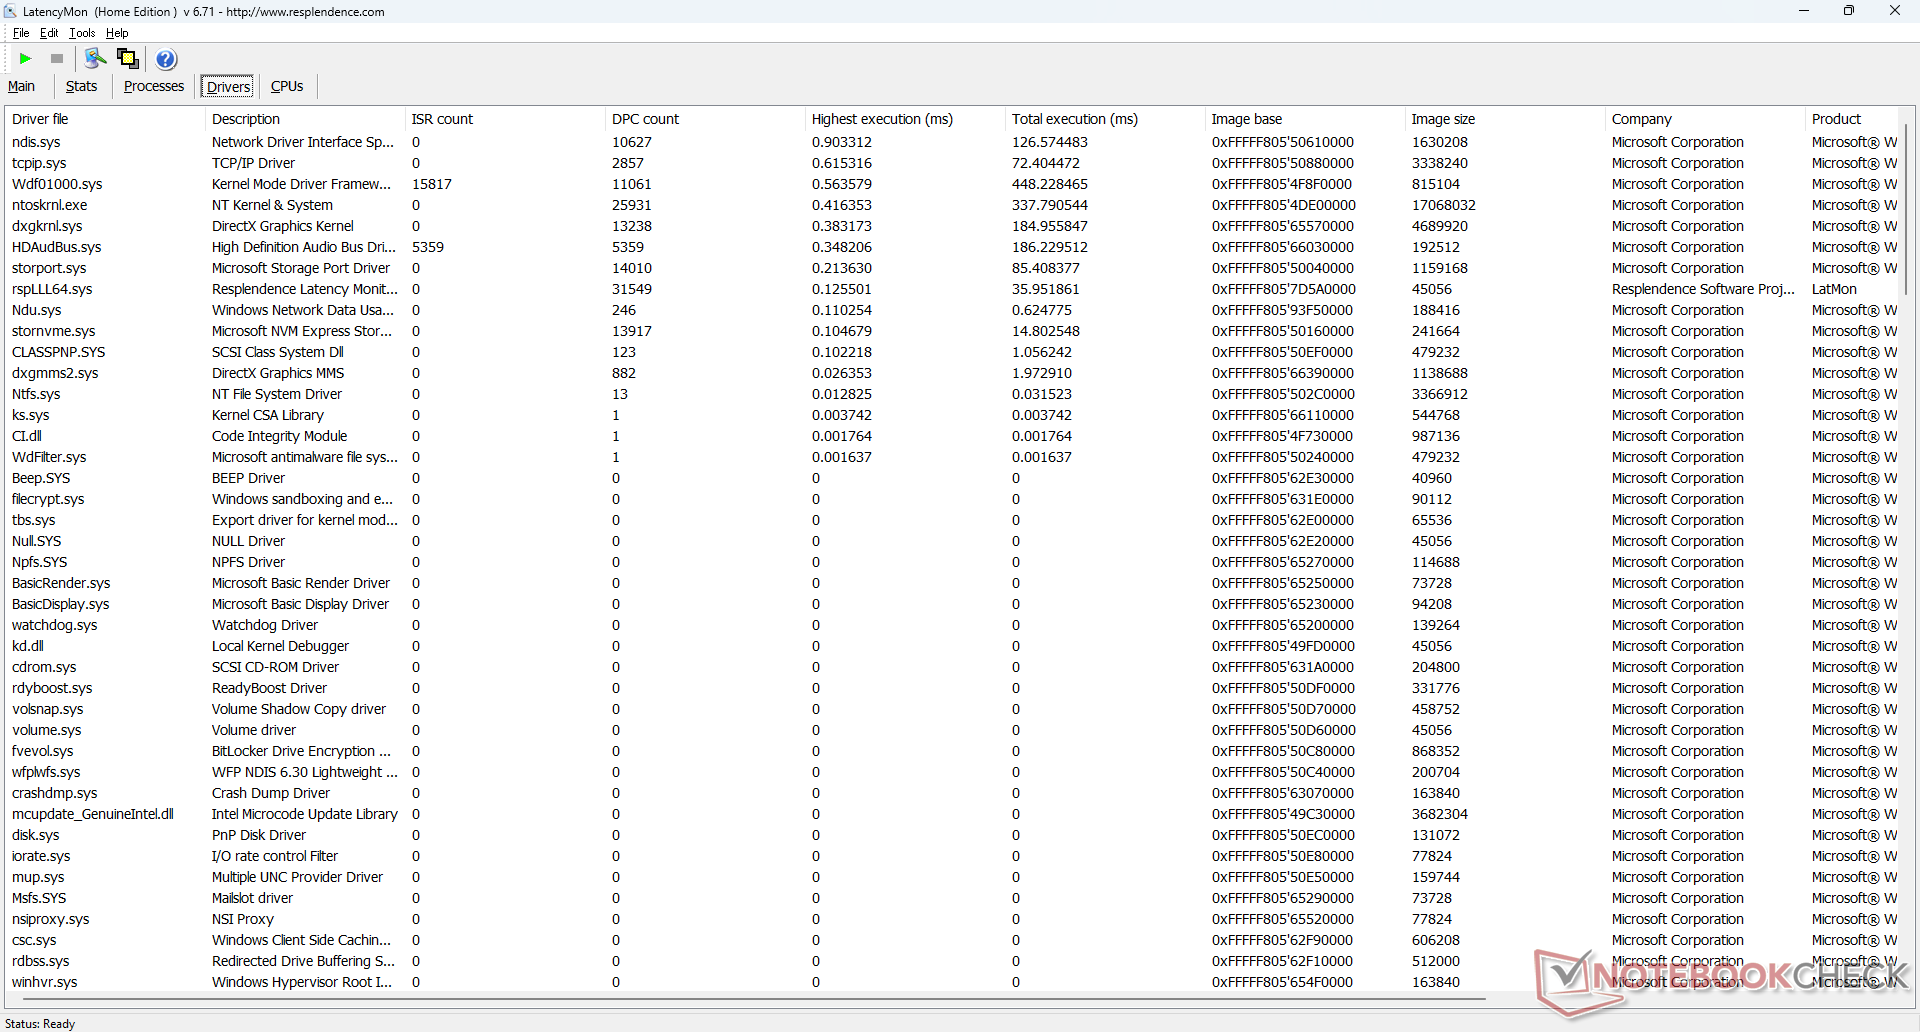
Latence DPC
LatencyMon ne révèle aucun problème de CPD lors de l'ouverture de plusieurs onglets de navigateur sur notre page d'accueil. la lecture de vidéos 4K à 60 FPS est également fluide, sans perte d'images.
| DPC Latencies / LatencyMon - interrupt to process latency (max), Web, Youtube, Prime95 | |
| Beelink SEi12 Core i5-1235U | |
| Intel NUC11PAQi7 | |
| BMAX B5 Pro G7H8 | |
| Beelink SER4 | |
| Beelink SEi11 Pro | |
* ... Moindre est la valeur, meilleures sont les performances
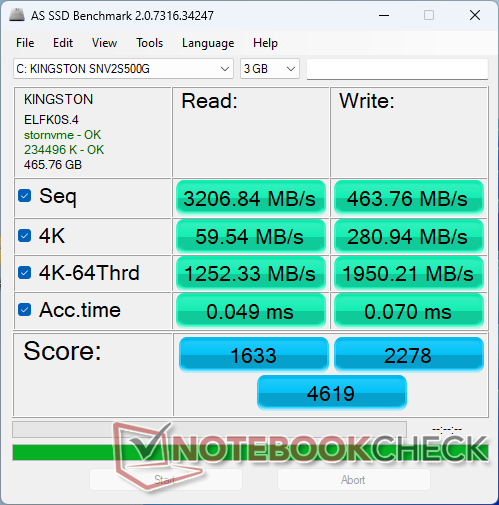
Périphériques de stockage
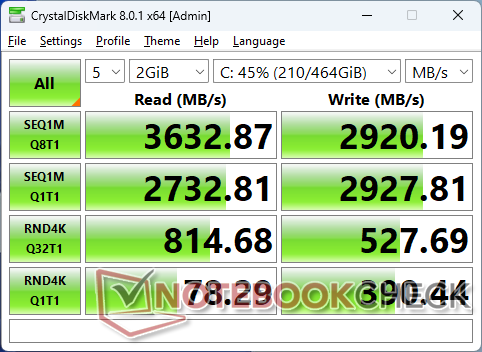
Le système prend en charge les SSD NVMe PCIe4 x4 et comprend même un dissipateur thermique pour maintenir les températures sous contrôle. Néanmoins, l'unité est livrée avec un SSD NVMe de Kingston NV1 PCIe3 x4 NVMe SSD plus lent, par mesure d'économie. En exécutant DiskSpd en boucle, nous pouvons observer que les taux de transfert chutent d'un maximum de 3600 Mo/s à un minimum de 1700 Mo/s, ce qui pourrait suggérer un dissipateur thermique sous-performant.

| Drive Performance rating - Percent | |
| Intel NUC11PAQi7 | |
| Beelink SEi12 Core i5-1235U | |
| Intel Hades Canyon NUC8i7HVK -8! | |
| BMAX B5 Pro G7H8 | |
| Beelink SEi11 Pro | |
| Beelink SER4 | |
* ... Moindre est la valeur, meilleures sont les performances
Disk Throttling: DiskSpd Read Loop, Queue Depth 8
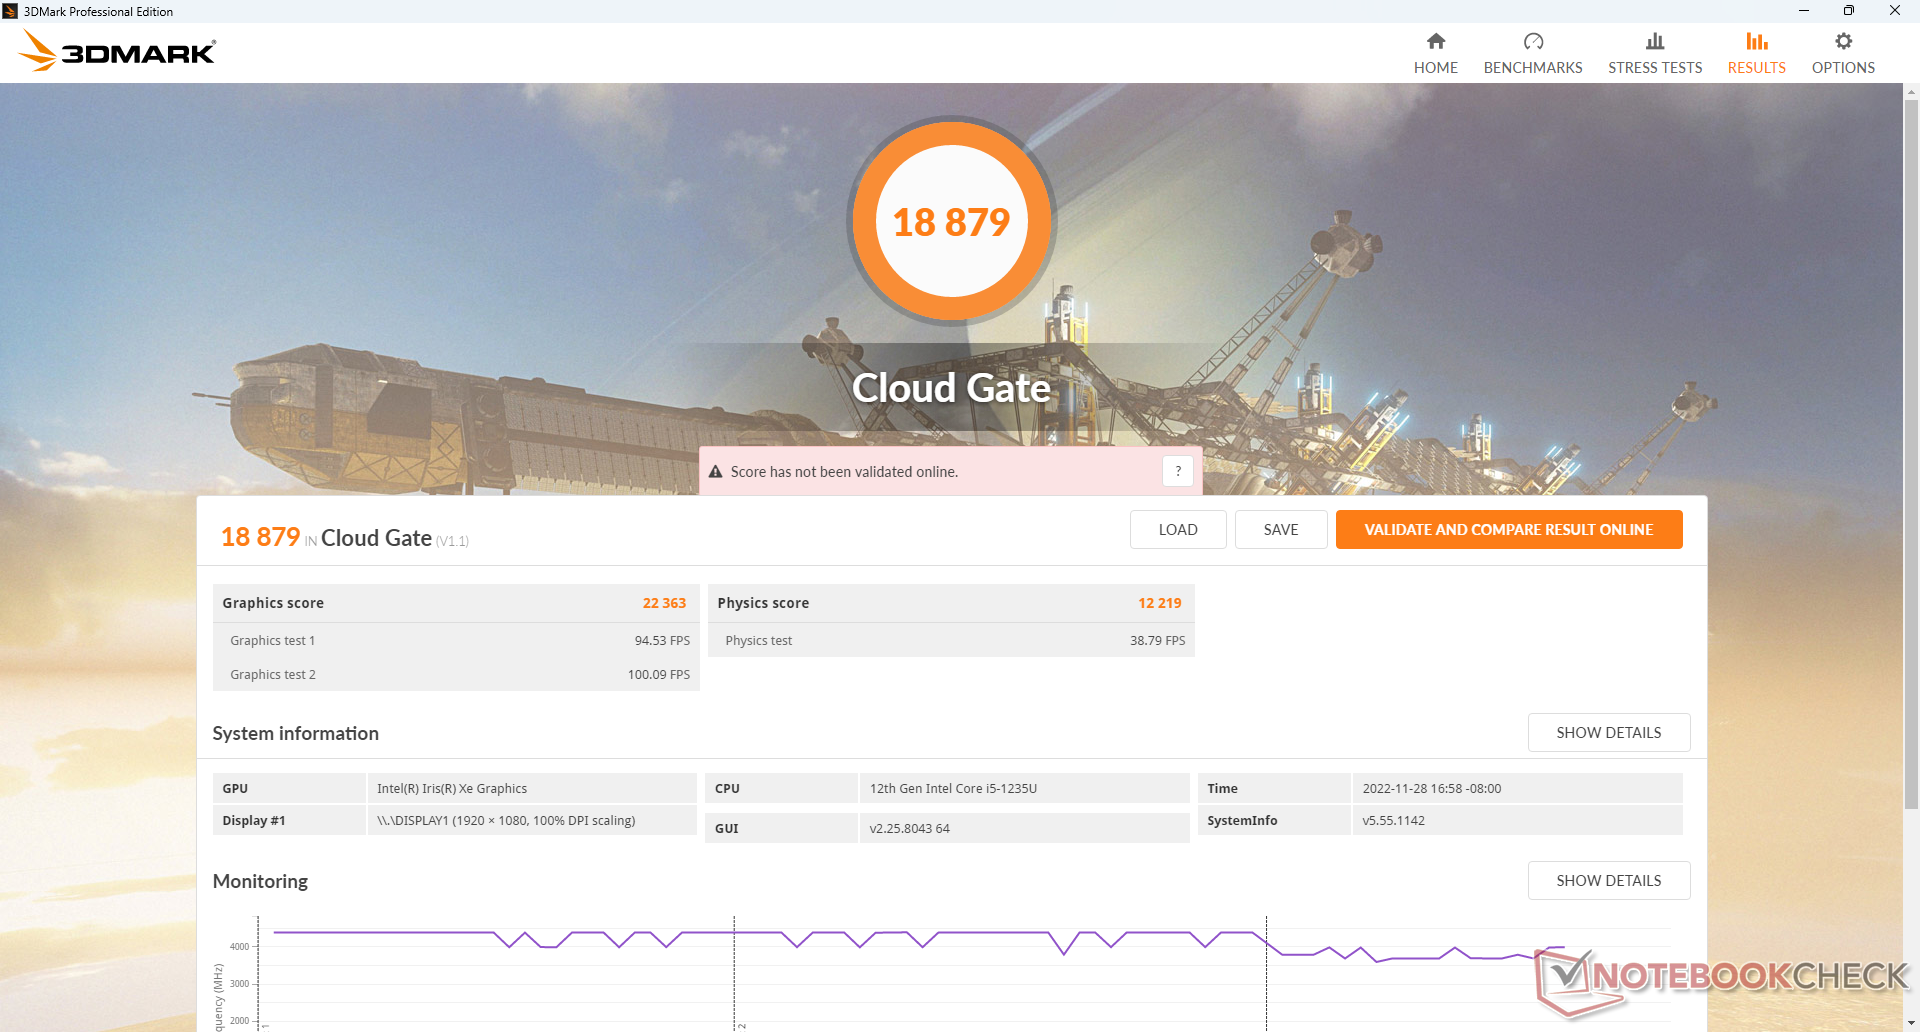
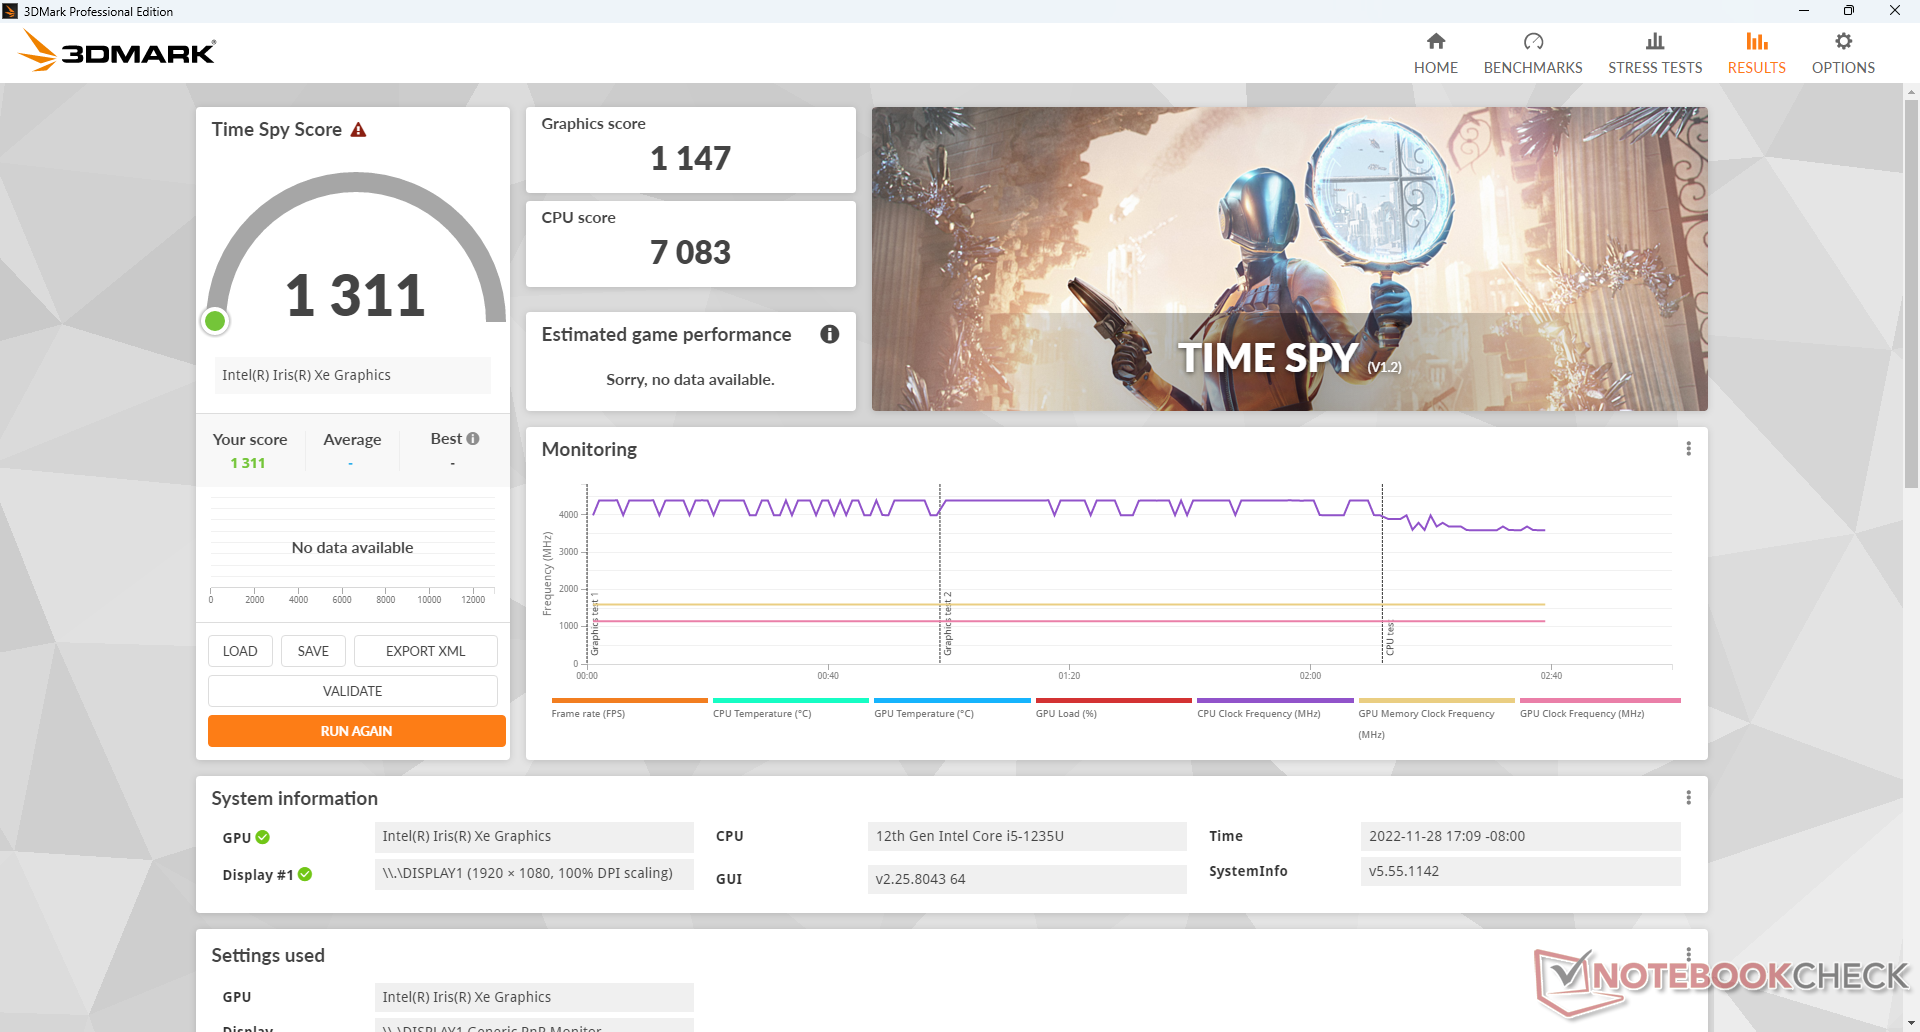
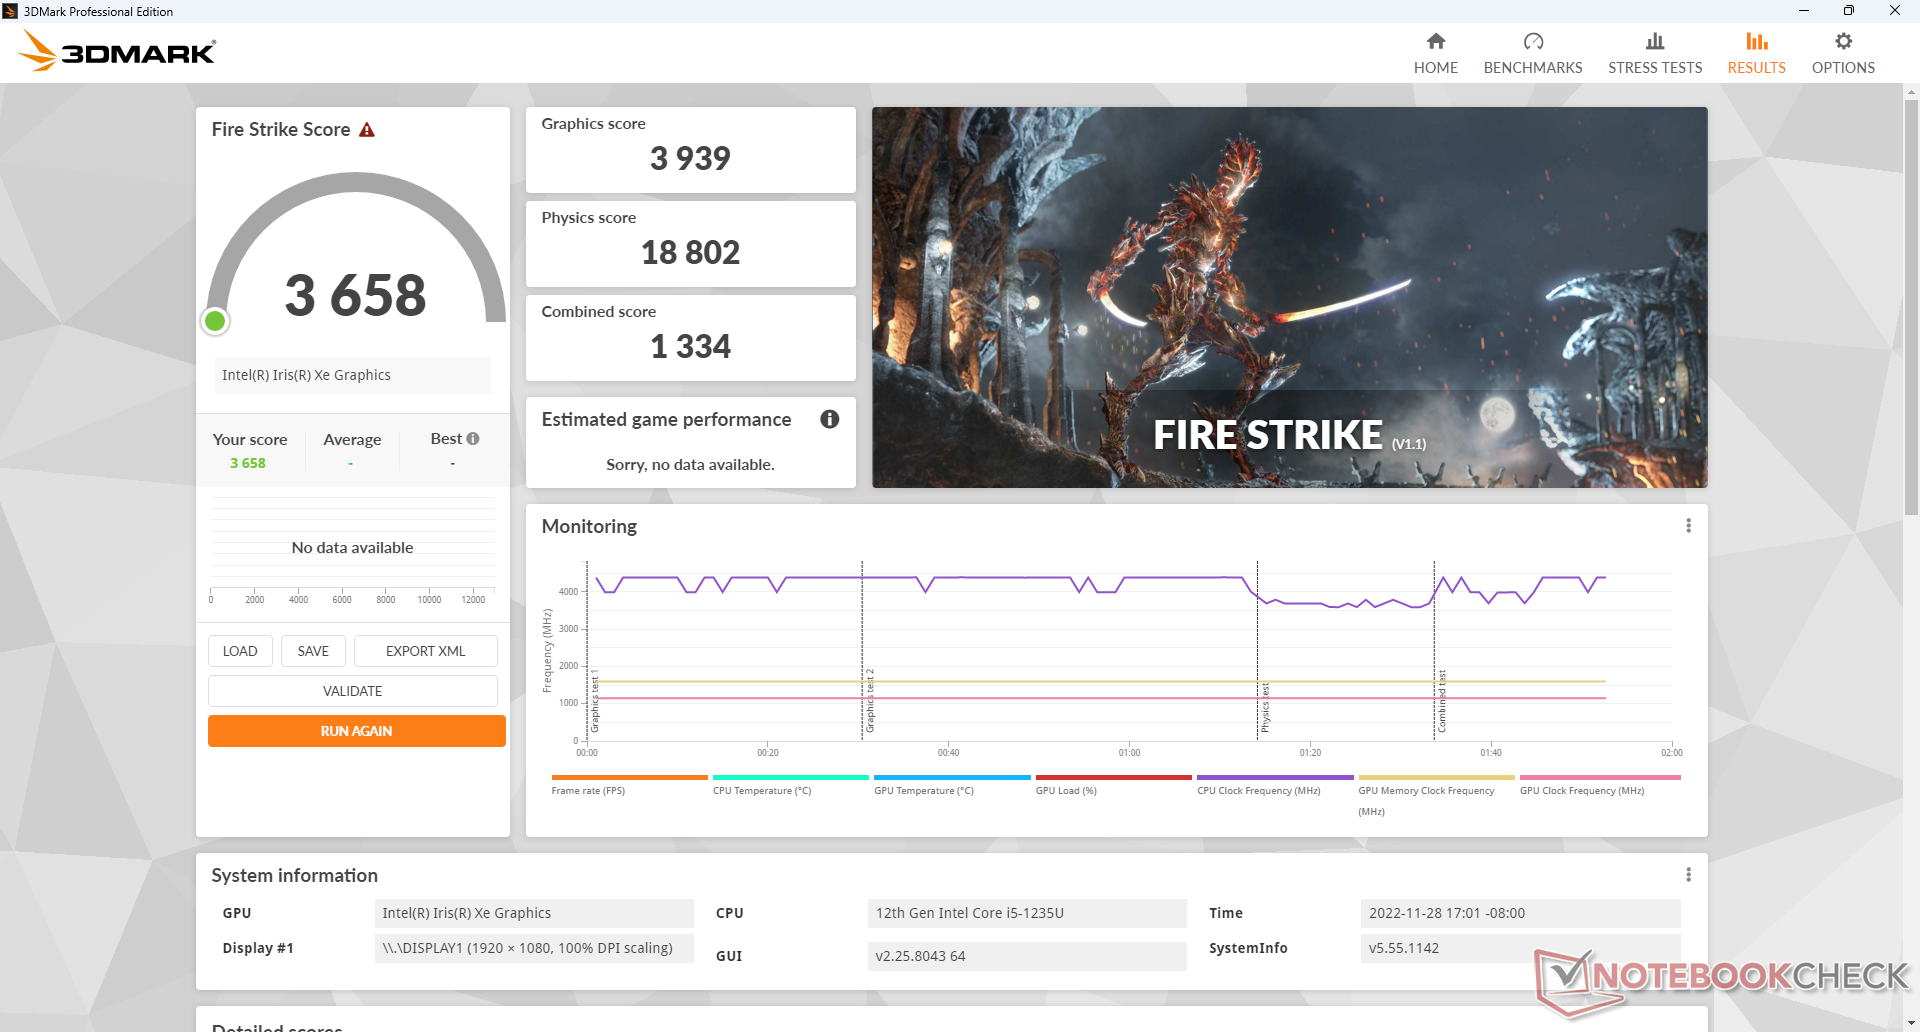
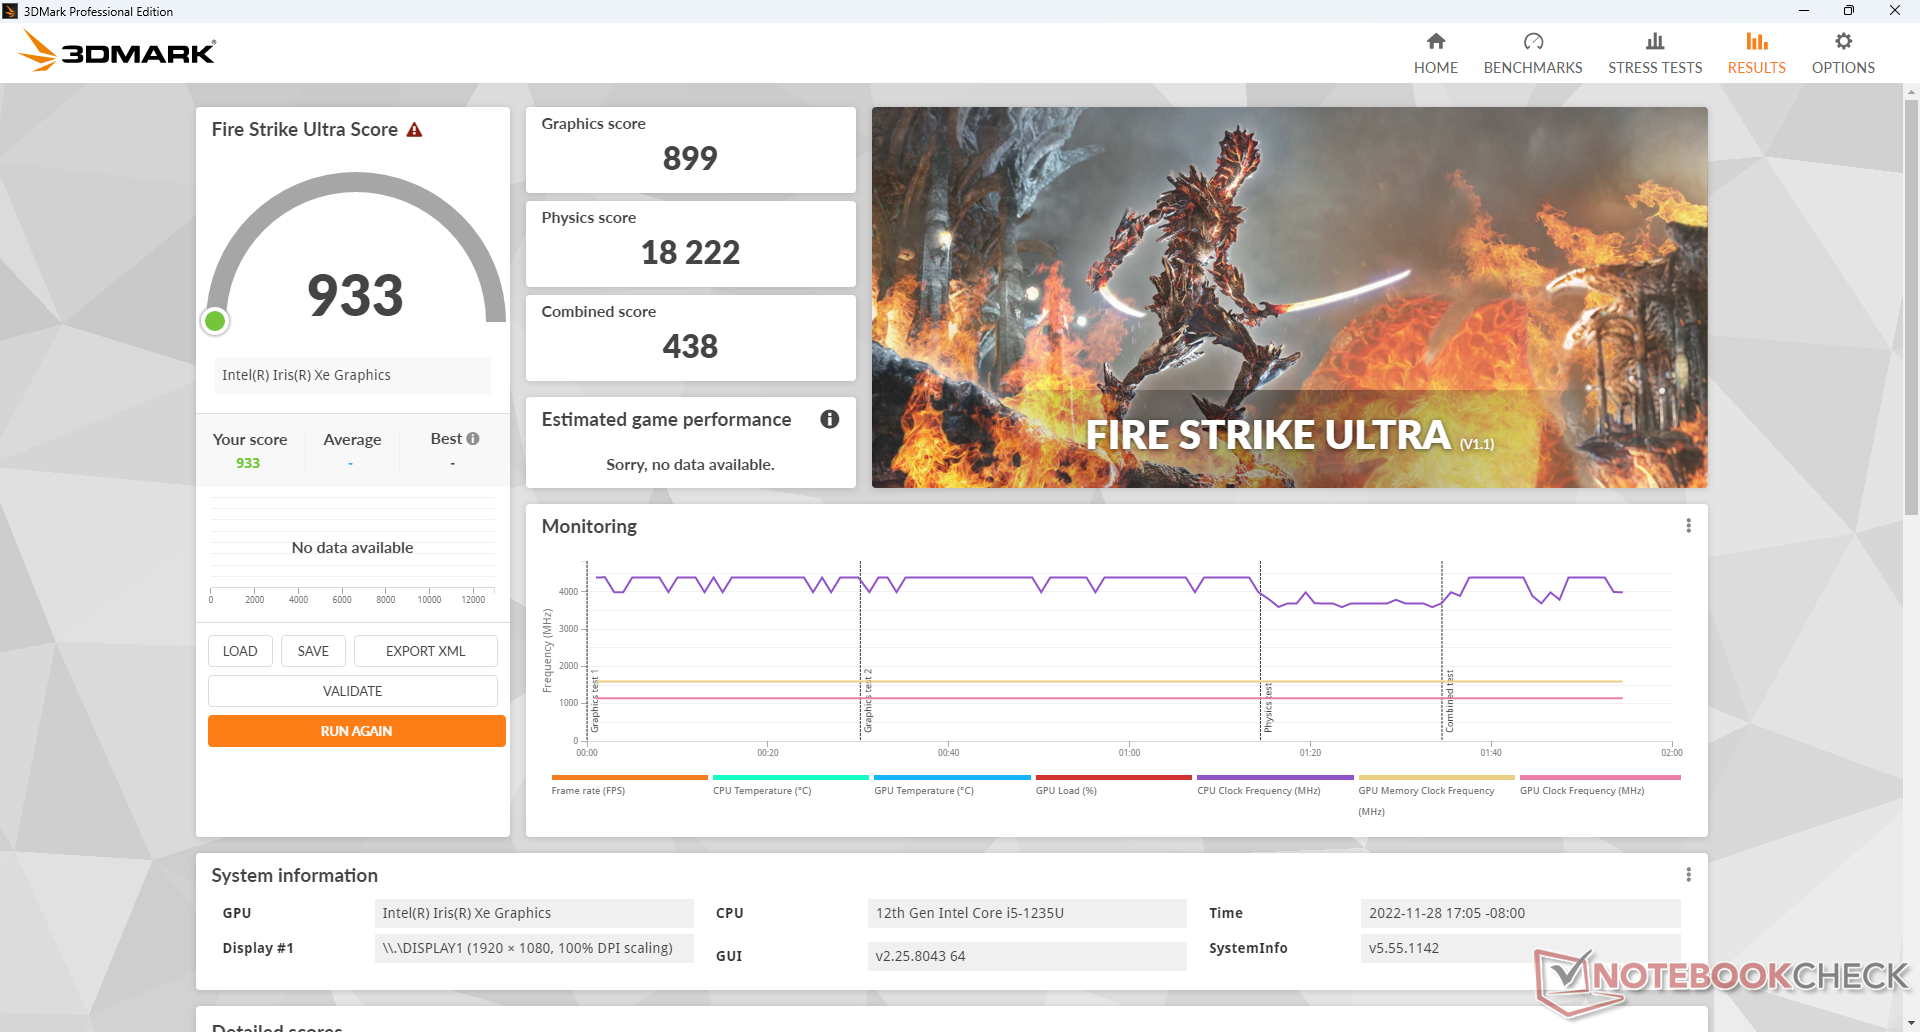
Performances du GPU
Les performances graphiques sont conformes à nos attentes par rapport à d'autres PC dotés du même système intégré Iris Xe G7 80 EUs intégré GPU INTÉGRÉ. Notez que les autres PC équipés de l'Iris Xe G7 96 EUs peuvent être plus rapides de 25 à 40 % s'ils sont configurés avec une RAM à double canal au lieu d'une RAM à canal unique.
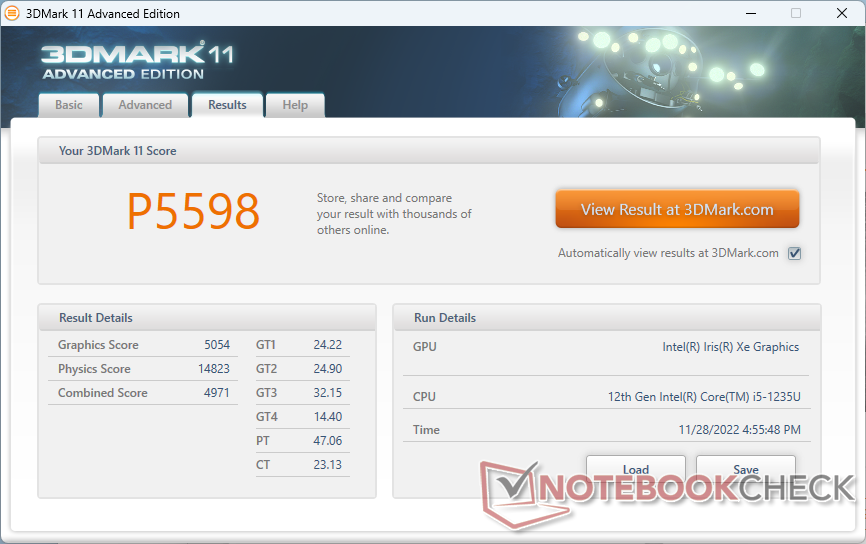
| 3DMark 11 Performance | 5598 points | |
| 3DMark Cloud Gate Standard Score | 18879 points | |
| 3DMark Fire Strike Score | 3658 points | |
| 3DMark Time Spy Score | 1311 points | |
Aide | ||
* ... Moindre est la valeur, meilleures sont les performances
| Performance rating - Percent | |
| Intel Hades Canyon NUC8i7HVK | |
| Beelink SEi11 Pro -1! | |
| Beelink SER4 | |
| Beelink SEi12 Core i5-1235U | |
| Intel NUC11PAQi7 | |
| BMAX B5 Pro G7H8 -5! | |
| The Witcher 3 - 1920x1080 Ultra Graphics & Postprocessing (HBAO+) | |
| Intel Hades Canyon NUC8i7HVK | |
| Beelink SER4 | |
| Beelink SEi11 Pro | |
| Beelink SEi12 Core i5-1235U | |
| Intel NUC11PAQi7 | |
| GTA V - 1920x1080 Highest AA:4xMSAA + FX AF:16x | |
| Intel Hades Canyon NUC8i7HVK | |
| Beelink SER4 | |
| Beelink SEi12 Core i5-1235U | |
| Intel NUC11PAQi7 | |
| Final Fantasy XV Benchmark - 1920x1080 High Quality | |
| Intel Hades Canyon NUC8i7HVK | |
| Beelink SEi11 Pro | |
| Beelink SER4 | |
| Beelink SEi12 Core i5-1235U | |
| Intel NUC11PAQi7 | |
| Strange Brigade - 1920x1080 ultra AA:ultra AF:16 | |
| Intel Hades Canyon NUC8i7HVK | |
| Beelink SER4 | |
| Beelink SEi11 Pro | |
| Beelink SEi12 Core i5-1235U | |
| Intel NUC11PAQi7 | |
| Dota 2 Reborn - 1920x1080 ultra (3/3) best looking | |
| Intel Hades Canyon NUC8i7HVK | |
| Beelink SER4 | |
| Beelink SEi11 Pro | |
| Beelink SEi12 Core i5-1235U | |
| Intel NUC11PAQi7 | |
| BMAX B5 Pro G7H8 | |
| X-Plane 11.11 - 1920x1080 high (fps_test=3) | |
| Intel Hades Canyon NUC8i7HVK | |
| Beelink SEi11 Pro | |
| Beelink SER4 | |
| Beelink SEi12 Core i5-1235U | |
| Intel NUC11PAQi7 | |
Witcher 3 FPS Chart
| Bas | Moyen | Élevé | Ultra | |
|---|---|---|---|---|
| GTA V (2015) | 117.5 | 98.7 | 17.2 | 7.41 |
| The Witcher 3 (2015) | 77.7 | 48.7 | 26 | 12.2 |
| Dota 2 Reborn (2015) | 93.8 | 88.7 | 45.5 | 42.2 |
| Final Fantasy XV Benchmark (2018) | 35.7 | 19.3 | 13.5 | |
| X-Plane 11.11 (2018) | 48.4 | 32.8 | 29.5 | |
| Strange Brigade (2018) | 65.9 | 26.5 | 21.4 | 17.5 |
| Cyberpunk 2077 1.6 (2022) | 13.4 | 11.4 | 9 | 7.4 |
Émissions
Bruit du système
Comme pour les autres mini-PC de Beelink, le bruit du ventilateur est toujours présent sur le SEi12 avec près de 28 dB(A) contre un fond silencieux de 23 dB(A). Heureusement, le système ne devient jamais trop bruyant, même lorsque des charges plus élevées sont introduites. En exécutant Witcher 3 ou 3DMark 06, on obtiendrait des niveaux de bruit de ventilateur comparables à ceux du Intel NUC 11PAQ lorsqu'il est soumis à des conditions similaires. Le bruit du ventilateur peut occasionnellement atteindre 39 dB(A), mais seulement pendant de courtes périodes avant de retomber dans la gamme des 30 dB(A). Les mini-PC plus puissants comme la série Beelink SER sont encore plus bruyants.
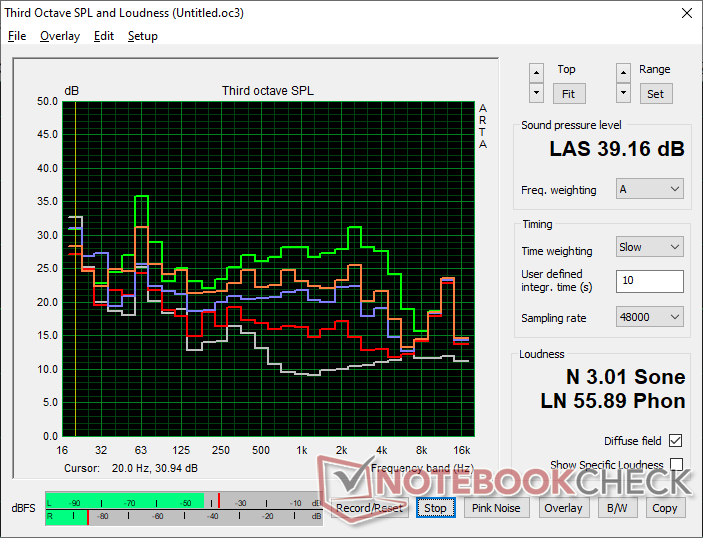
Degré de la nuisance sonore
| Au repos |
| 27.8 / 27.8 / 27.8 dB(A) |
| Fortement sollicité |
| 32 / 39.2 dB(A) |
 | ||
30 dB silencieux 40 dB(A) audible 50 dB(A) bruyant |
||
min: | ||
| Beelink SEi12 Core i5-1235U Iris Xe G7 80EUs, i5-1235U, Kingston NV1 SNVS/500GCN | Beelink SEi8 Iris Plus Graphics 655, i3-8109U, Intel SSD 660p SSDPEKNW512G8 | Beelink SER4 Vega 8, R7 4800U, Intel SSD 660p SSDPEKNW512G8 | Intel NUC11PAQi7 Iris Xe G7 96EUs, i7-1165G7, Samsung SSD 980 Pro 500GB MZ-V8P500BW | BMAX B5 Pro G7H8 UHD Graphics 620, i5-8260U | Intel Hades Canyon NUC8i7HVK Vega M GH, i7-8809G, Intel Optane 120 GB SSDPEK1W120GA | |
|---|---|---|---|---|---|---|
| Noise | -4% | -14% | -4% | 10% | -14% | |
| arrêt / environnement * (dB) | 23.3 | 24.5 -5% | 23.4 -0% | 25.6 -10% | 23 1% | 28.7 -23% |
| Idle Minimum * (dB) | 27.8 | 26.5 5% | 33.2 -19% | 25.6 8% | 25.1 10% | 29 -4% |
| Idle Average * (dB) | 27.8 | 26.5 5% | 33.2 -19% | 25.6 8% | 25.1 10% | 29 -4% |
| Idle Maximum * (dB) | 27.8 | 31.1 -12% | 33.2 -19% | 25.6 8% | 25.1 10% | 29 -4% |
| Load Average * (dB) | 32 | 37.7 -18% | 38.6 -21% | 33.6 -5% | 28.6 11% | 36 -13% |
| Witcher 3 ultra * (dB) | 34.1 | 39.2 -15% | 33.6 1% | 30.1 12% | 42 -23% | |
| Load Maximum * (dB) | 39.2 | 37.5 4% | 40.8 -4% | 54.5 -39% | 34 13% | 49.4 -26% |
* ... Moindre est la valeur, meilleures sont les performances
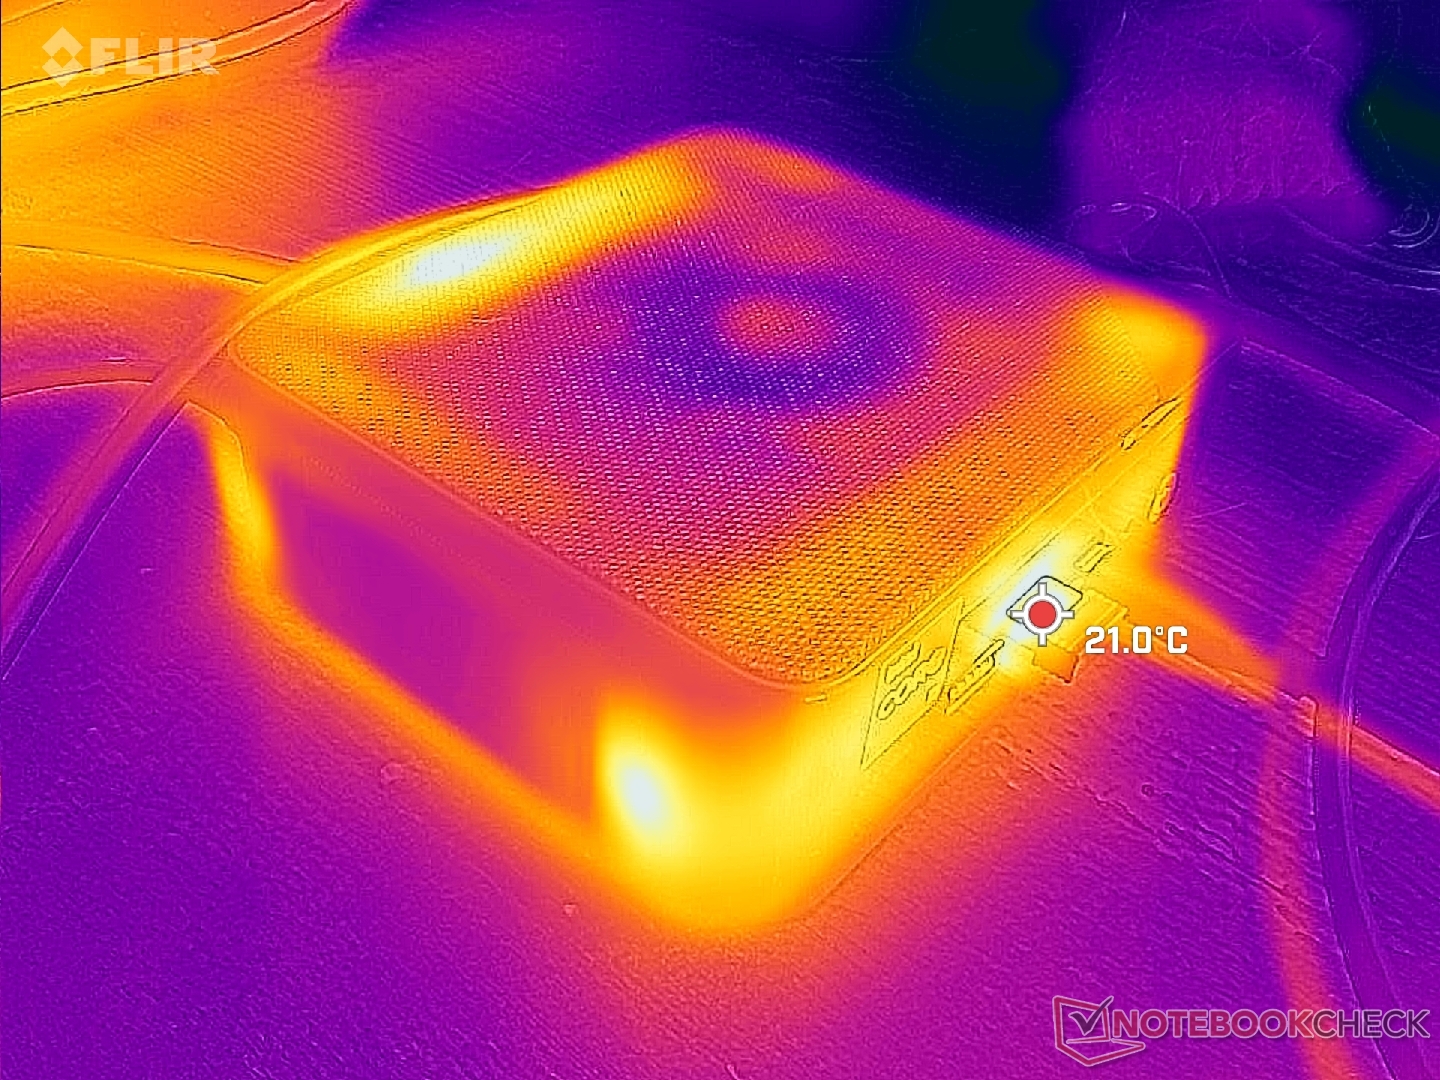
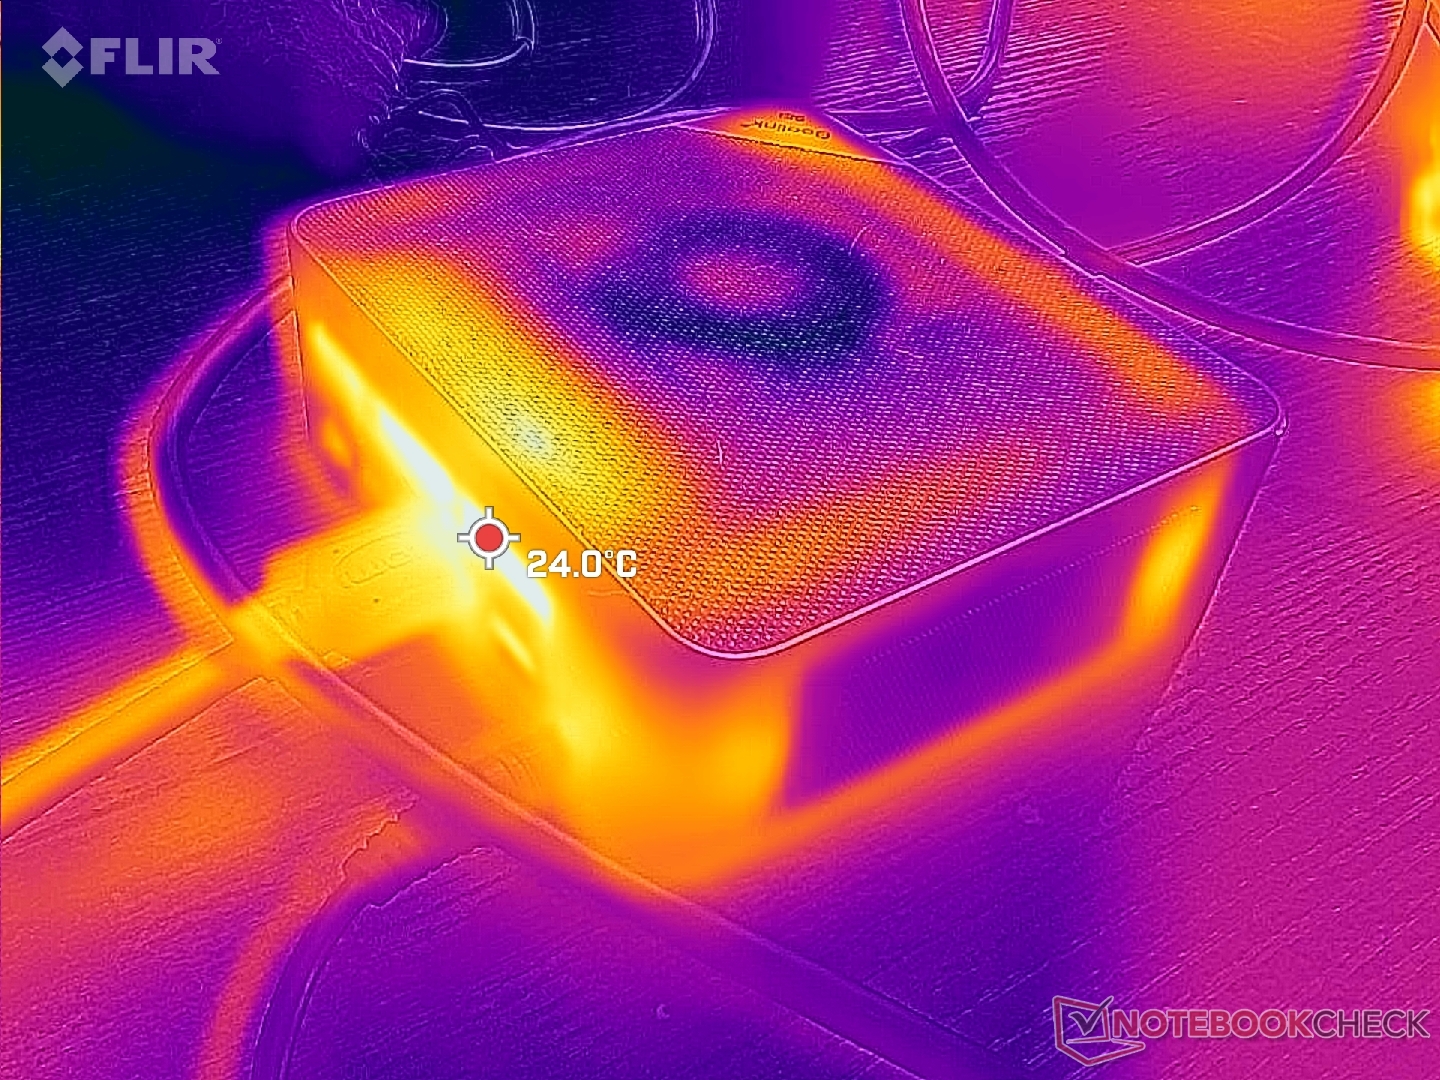
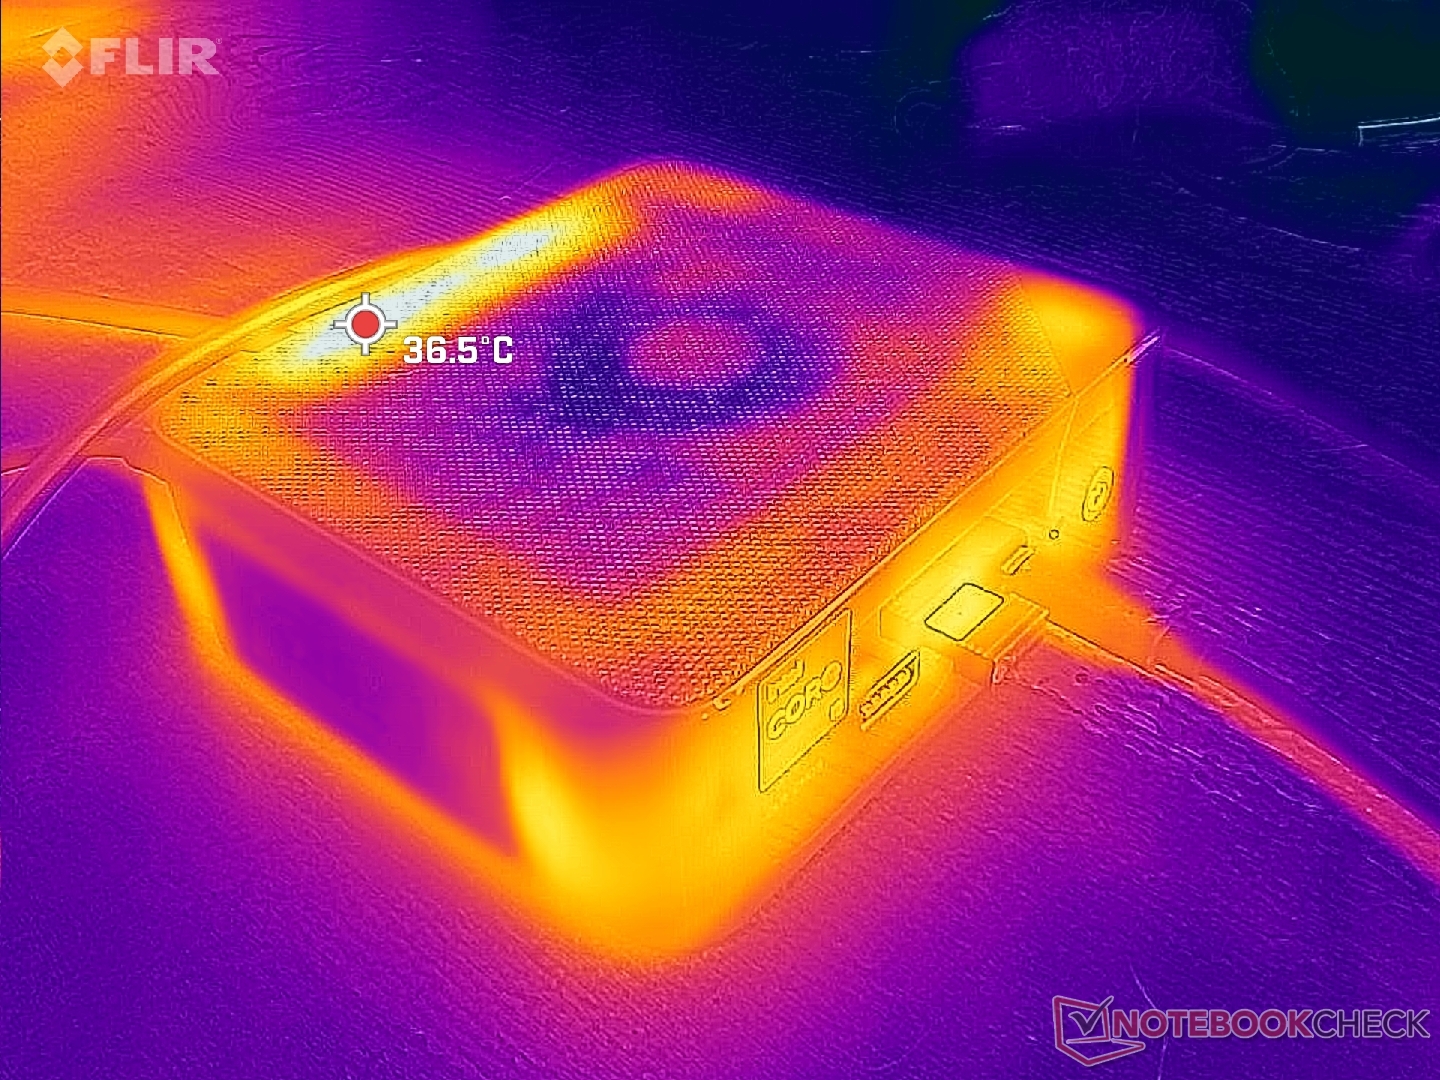
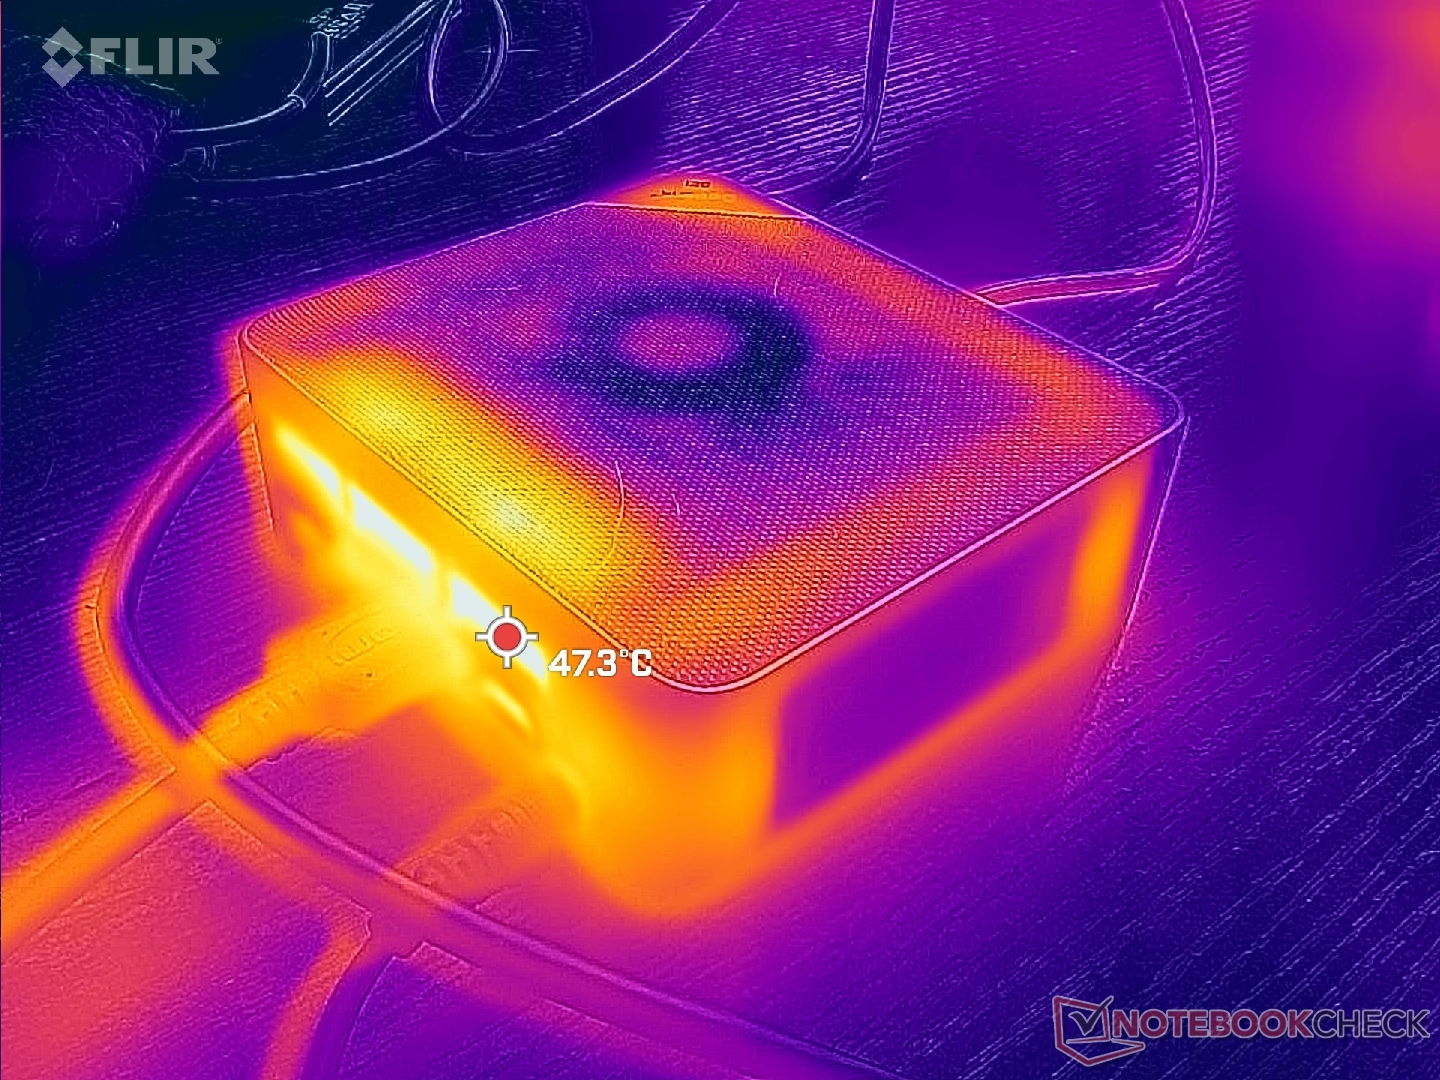
Température
L'air frais entre par les côtés et la grille supérieure, tandis que l'air chaud sort par l'arrière, comme le montrent les cartes de température ci-dessous. Le point chaud à l'arrière peut atteindre 47°C lors d'applications exigeantes. Il n'est pas recommandé de placer des objets sur le dessus de l'unité, sinon le flux d'air sera réduit.
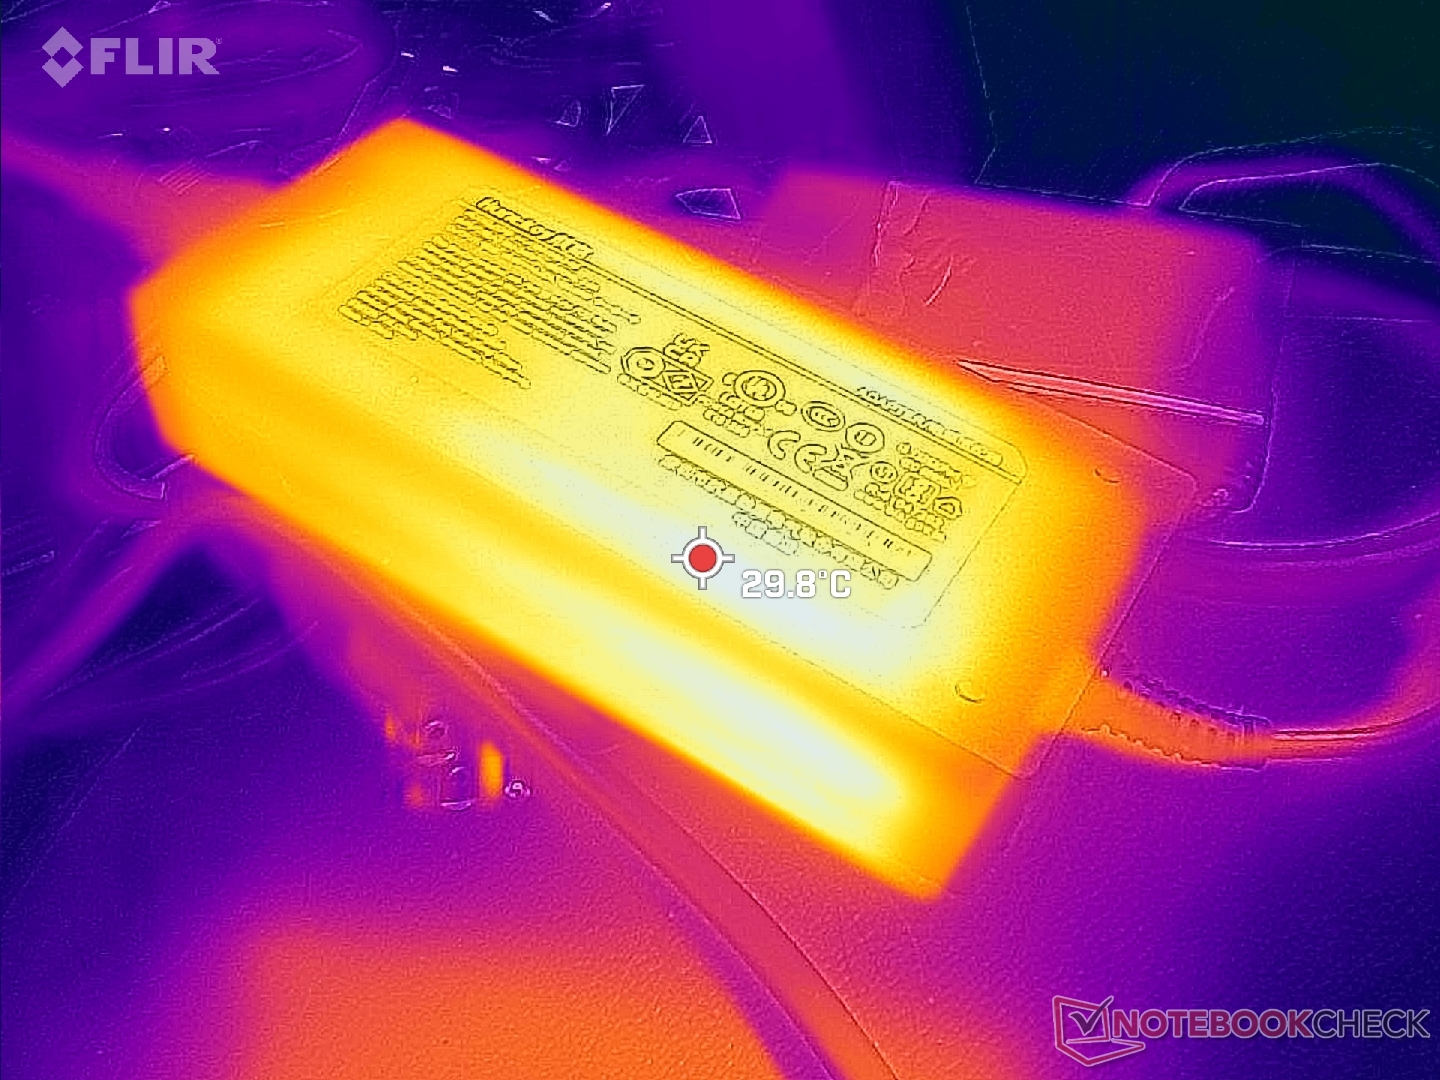
L'adaptateur secteur peut atteindre 30°C lors de l'utilisation de charges exigeantes pendant de longues périodes.
Test de stress
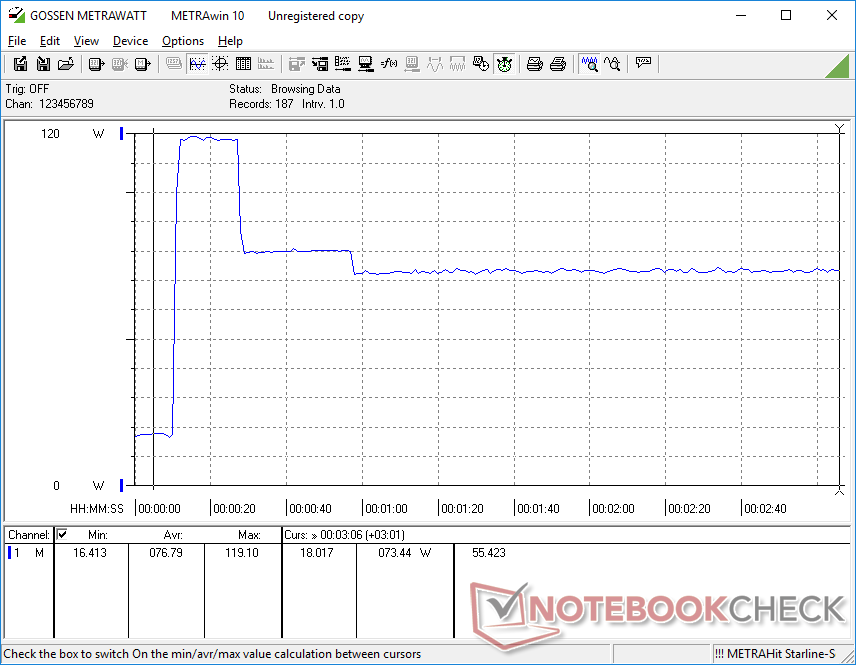
Lorsqu'il est sollicité par Prime95, le processeur passe à 3,6 GHz avec une consommation de 47 W. Cependant, lorsque la température centrale atteint 76 C quelques secondes plus tard, les fréquences d'horloge et la consommation tombent à 2,1 GHz et 27 W, respectivement, afin de maintenir une température centrale plus froide de 67 C.
La fréquence d'horloge et la température du GPU en fonctionnement Witcher 3 se stabilisent à 1150 MHz et 68 C, respectivement, contre 1300 MHz et 57 C sur le NUC11PAQi7 d'Intel, plus cher.
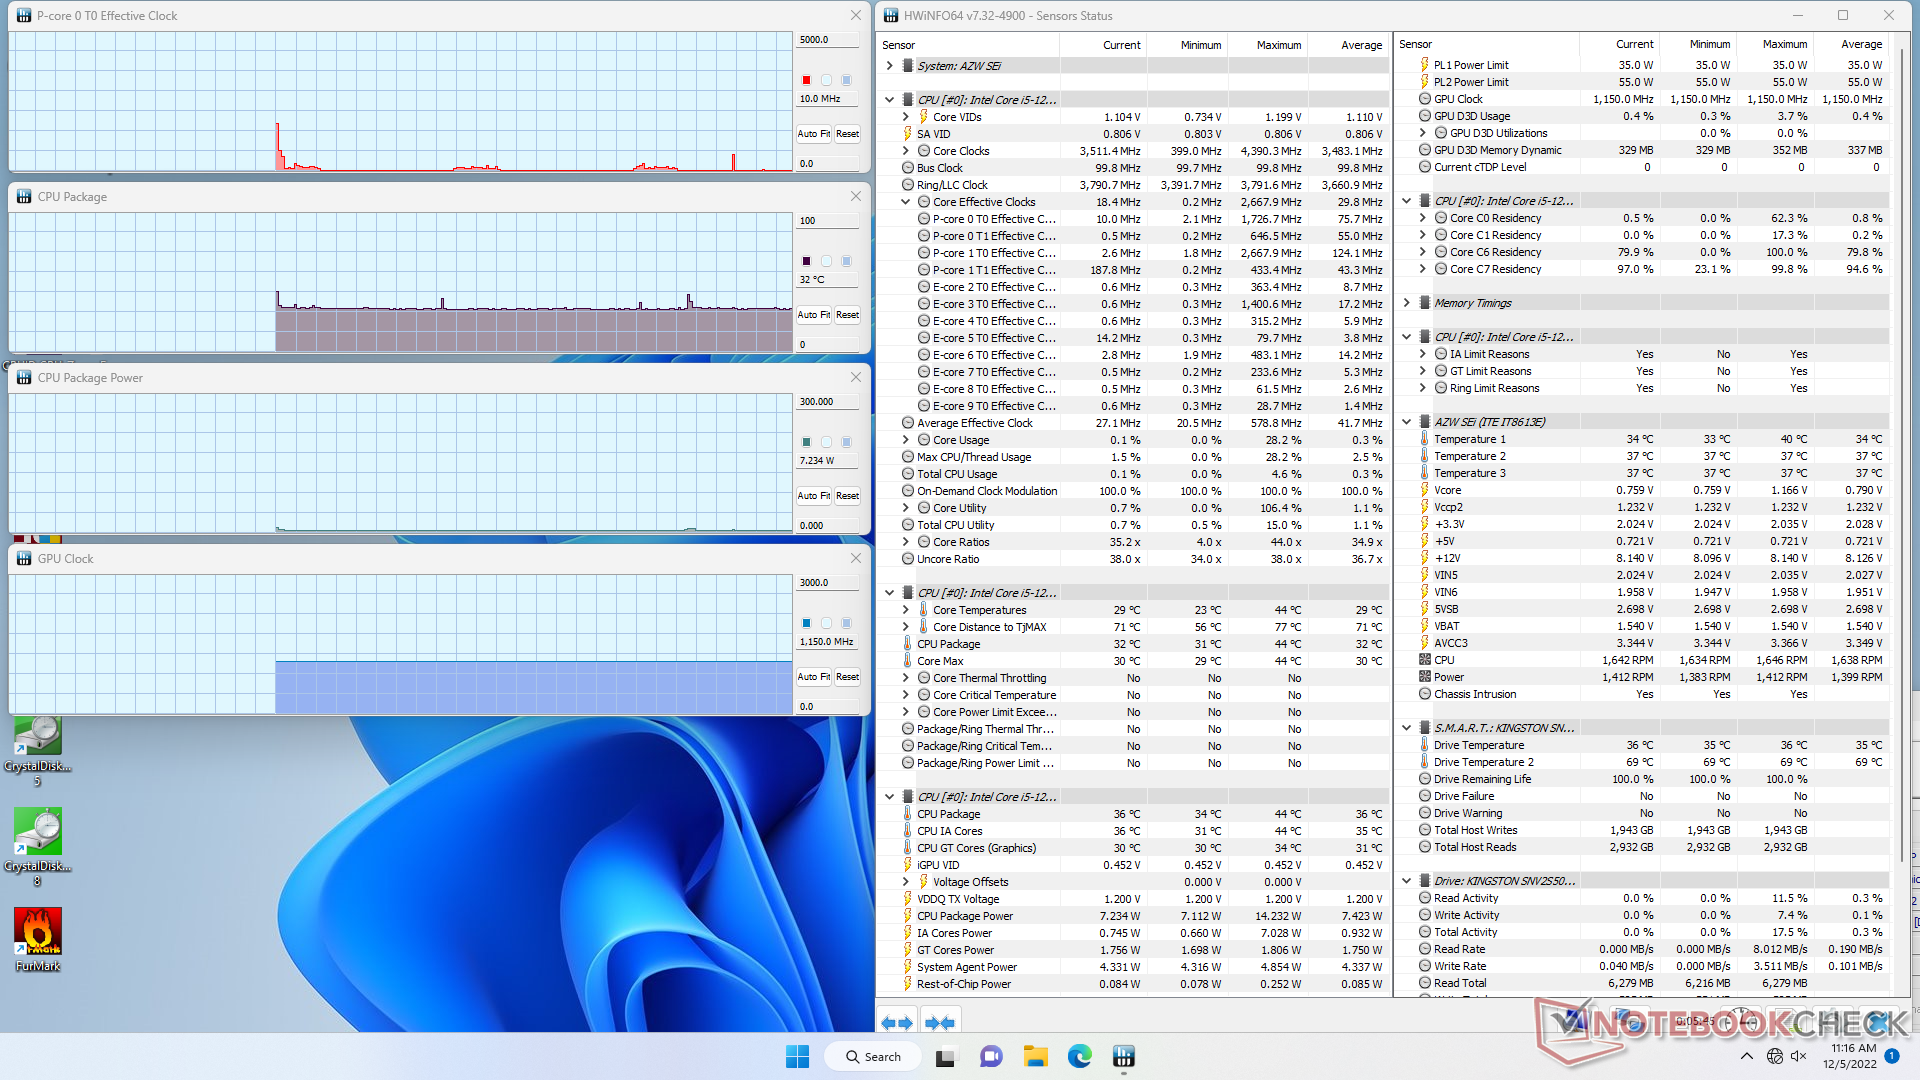
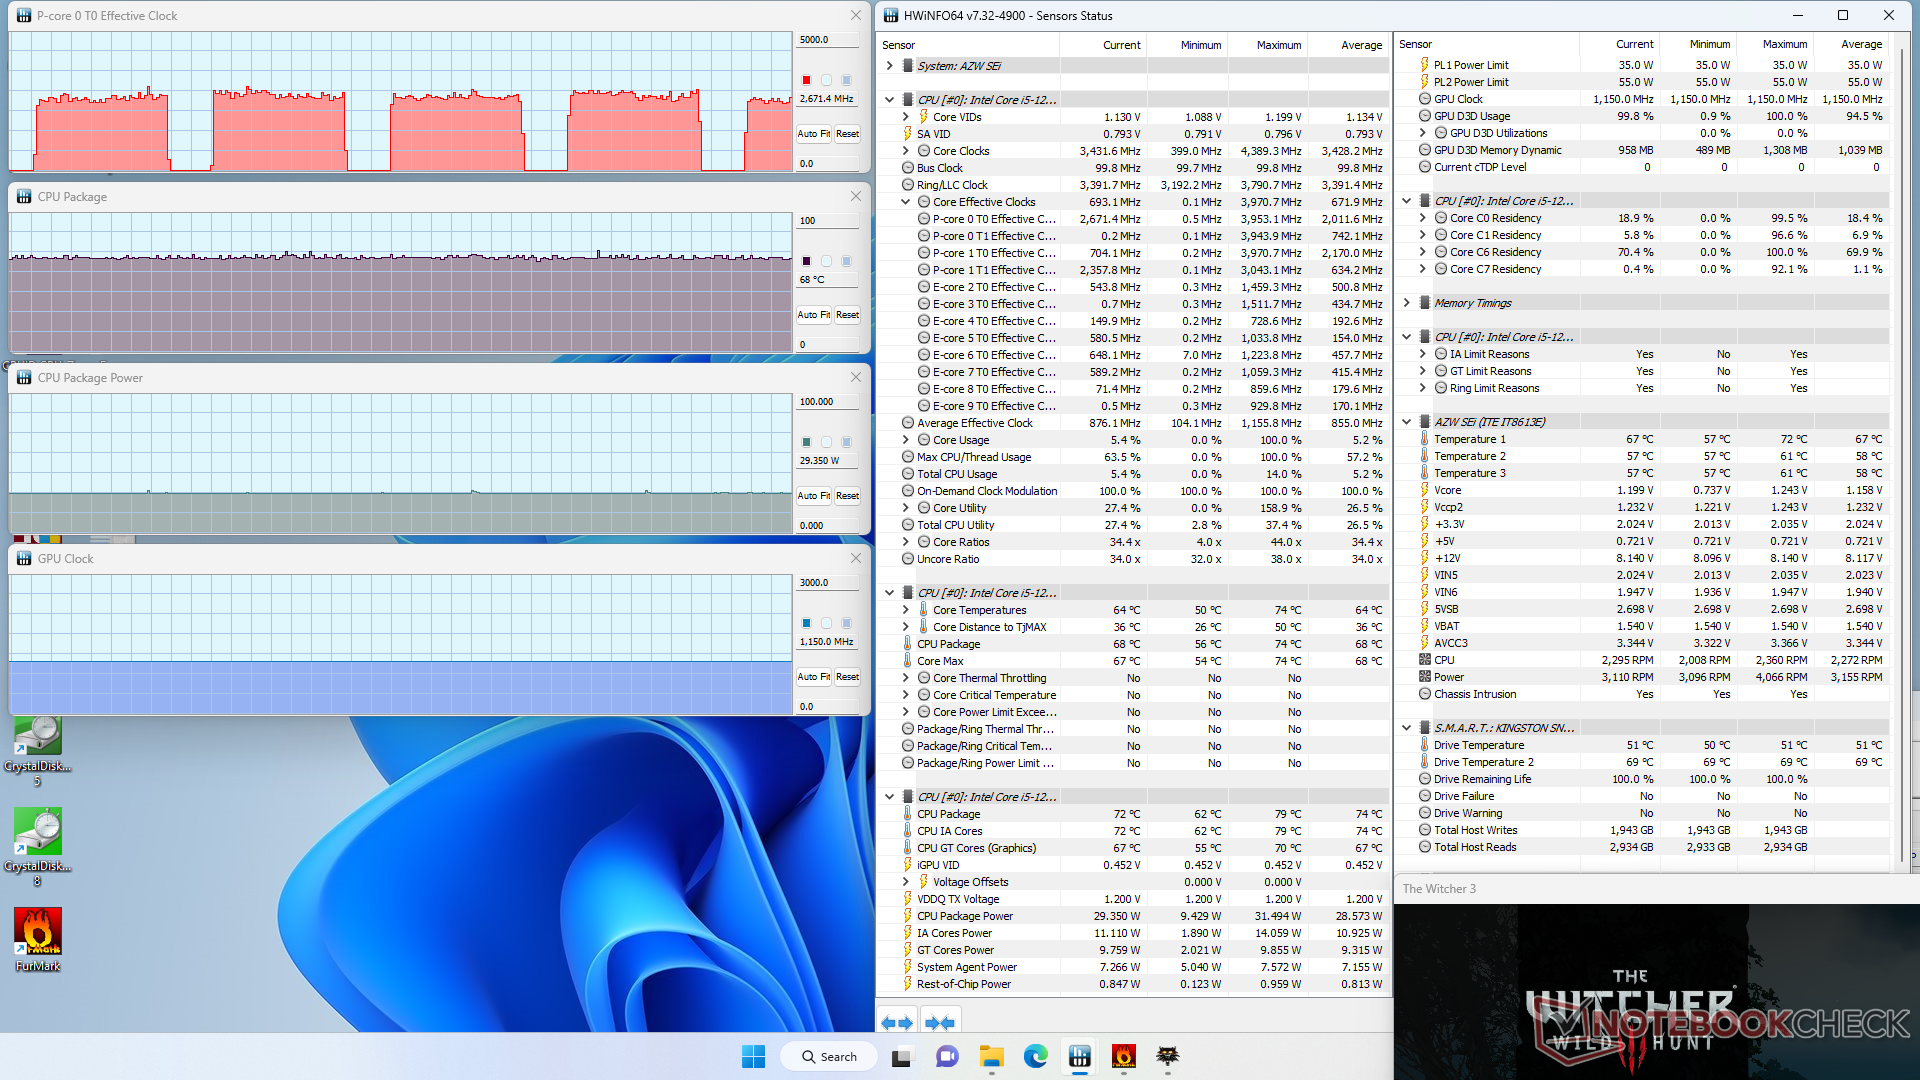

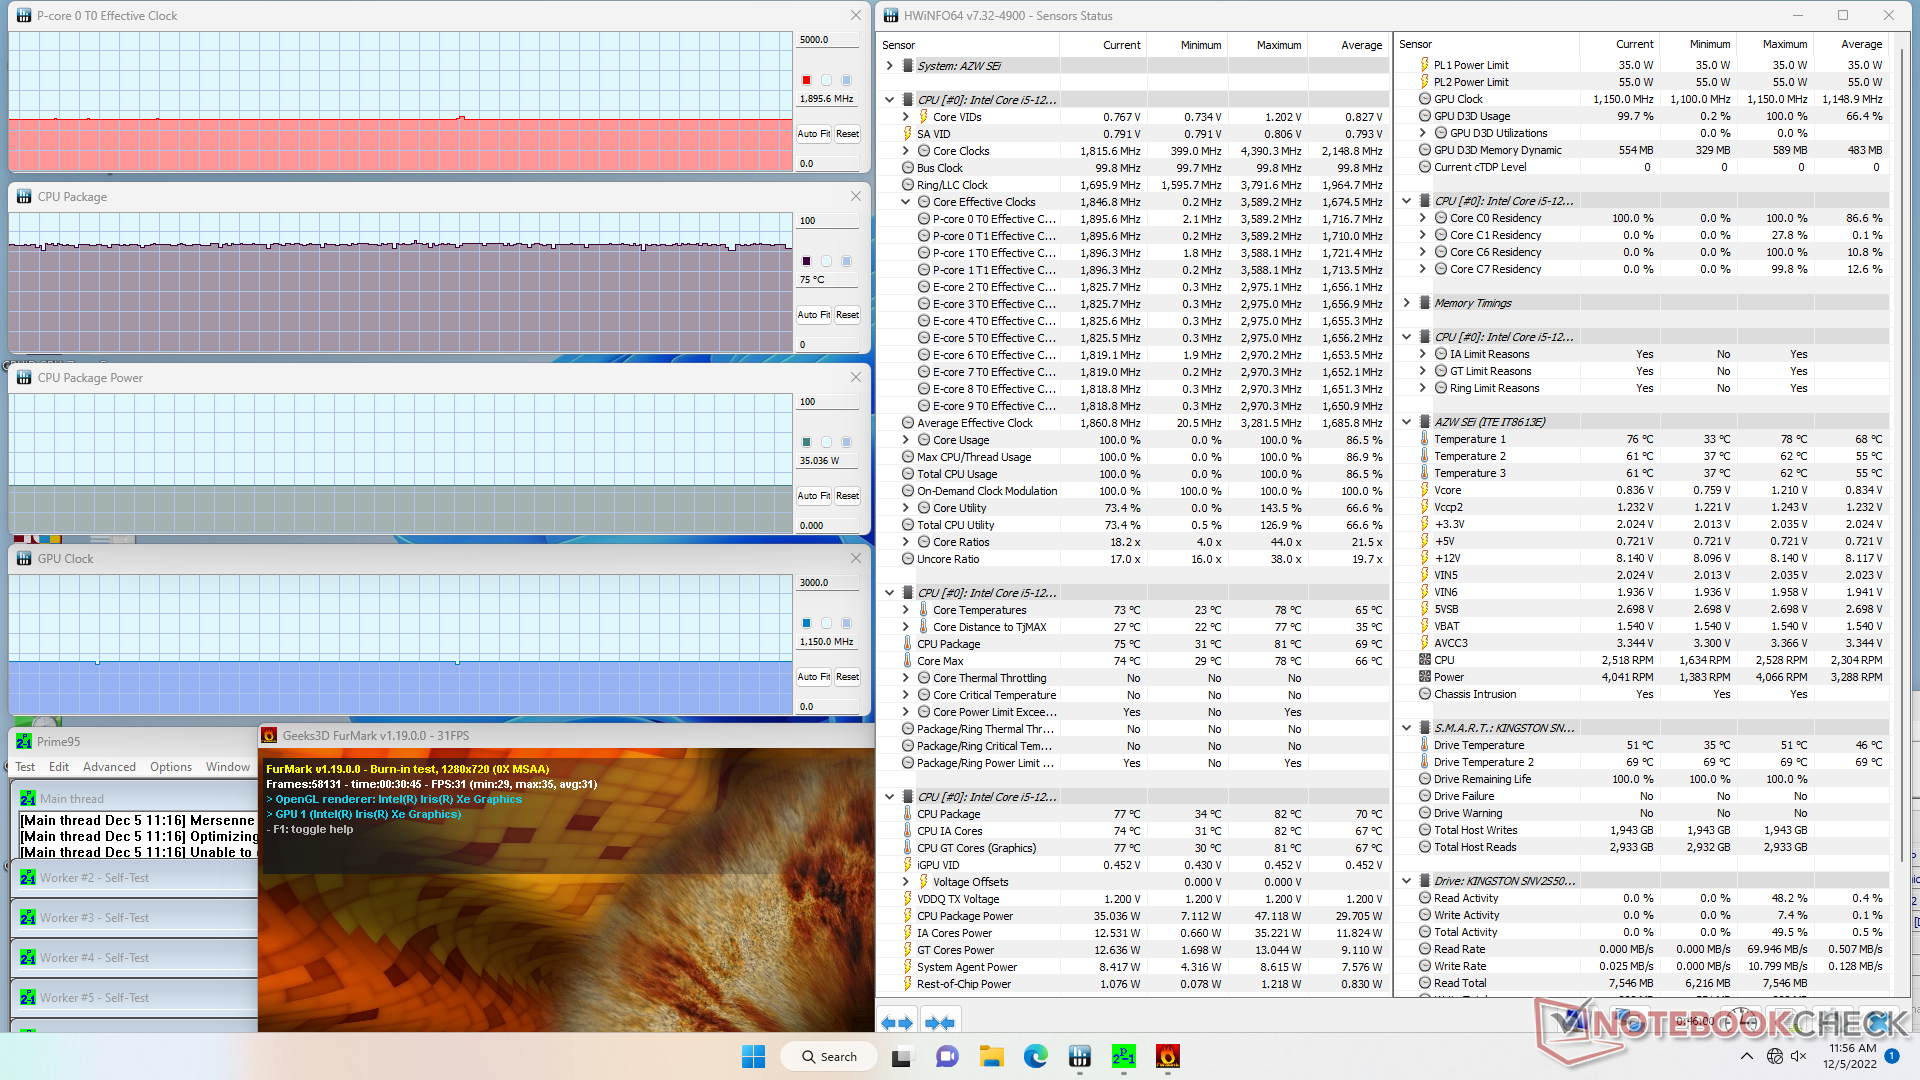
| Fréquence du CPU (GHz) | Fréquence du GPU (MHz) | Température moyenne du CPU (°C) | |
| Système au repos | -- | -- | 32 |
| Prime95 Stress | 2.1 | 1150 | 67 |
| Prime95 + FurMark Stress | 1.9 | 1150 | 75 |
| Witcher 3 Stress | ~2.6 | 1150 | 68 |
Gestion de l'énergie
Consommation d'énergie
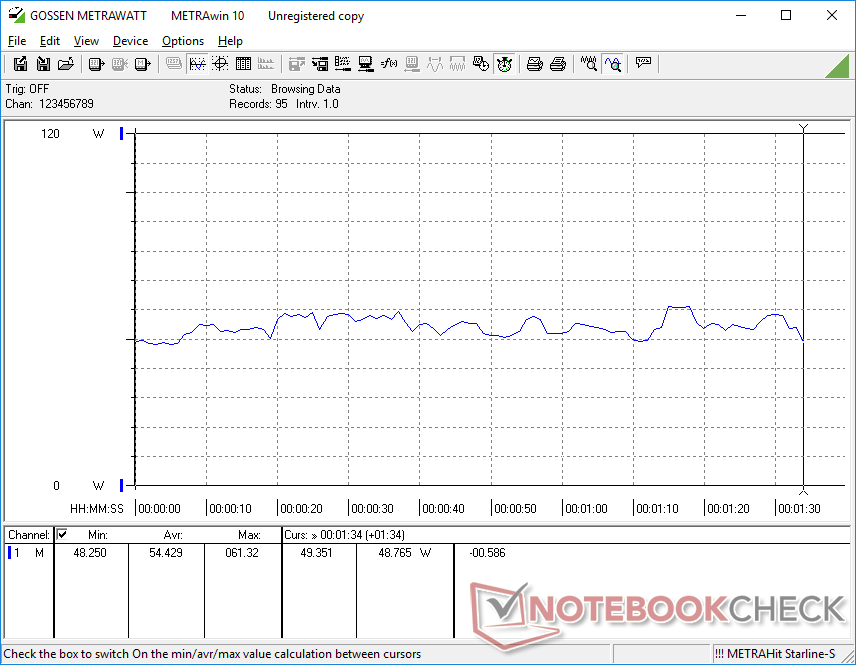
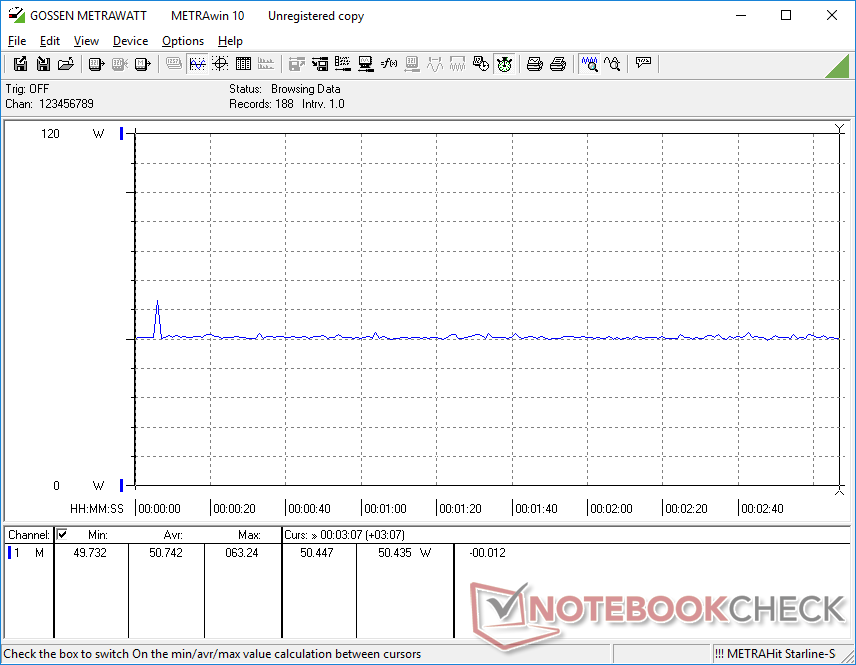
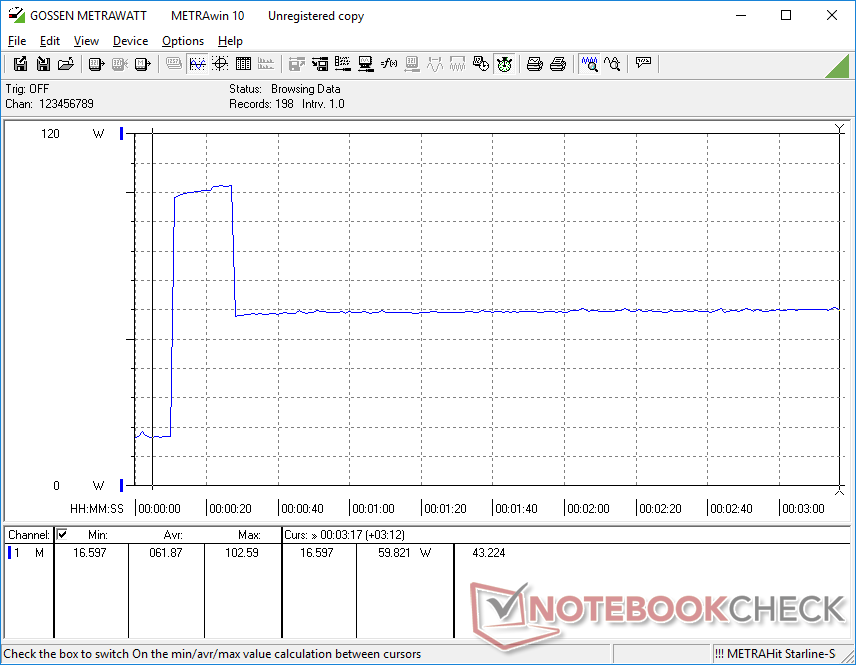
La consommation d'énergie est relativement élevée, ce qui peut expliquer l'adaptateur secteur plus grand que prévu. La marche au ralenti sur le bureau consomme environ 17 W, contre moins de la moitié pour d'autres mini-PC alimentés par la série U, comme le modèle SER4 ou Intel NUC11. Lors de l'exécution de charges exigeantes comme les jeux, la consommation moyenne est d'environ 50 W, contre un peu moins de 40 W sur le NUC11.
| Éteint/en veille | |
| Au repos | |
| Fortement sollicité |
|
Légende:
min: | |
| Beelink SEi12 Core i5-1235U i5-1235U, Iris Xe G7 80EUs, Kingston NV1 SNVS/500GCN, , x, | Beelink SEi8 i3-8109U, Iris Plus Graphics 655, Intel SSD 660p SSDPEKNW512G8, , x, | Beelink SER4 R7 4800U, Vega 8, Intel SSD 660p SSDPEKNW512G8, , x, | Intel NUC11PAQi7 i7-1165G7, Iris Xe G7 96EUs, Samsung SSD 980 Pro 500GB MZ-V8P500BW, , x, | BMAX B5 Pro G7H8 i5-8260U, UHD Graphics 620, , , x, | Intel Hades Canyon NUC8i7HVK i7-8809G, Vega M GH, Intel Optane 120 GB SSDPEK1W120GA, , x, | |
|---|---|---|---|---|---|---|
| Power Consumption | 49% | 59% | 49% | 49% | -38% | |
| Idle Minimum * (Watt) | 15.8 | 7.5 53% | 4.1 74% | 5.6 65% | 6 62% | 15.5 2% |
| Idle Average * (Watt) | 16.8 | 7.6 55% | 4.1 76% | 5.6 67% | 6.2 63% | 16.2 4% |
| Idle Maximum * (Watt) | 17 | 9.2 46% | 4.6 73% | 6 65% | 6.3 63% | 16.5 3% |
| Load Average * (Watt) | 54.4 | 41.1 24% | 35.6 35% | 31.4 42% | 42.8 21% | 83.4 -53% |
| Witcher 3 ultra * (Watt) | 50.7 | 35.6 30% | 39 23% | 35 31% | 121.7 -140% | |
| Load Maximum * (Watt) | 119.1 | 41.4 65% | 39.9 66% | 80.5 32% | 55.8 53% | 173.5 -46% |
* ... Moindre est la valeur, meilleures sont les performances
Power Consumption Witcher 3 / Stresstest
Power Consumption external Monitor
Points positifs
Points négatifs
Verdict - Un prix bas sans rogner sur les performances
Le SEi12 offre des niveaux de performance comparables et souvent supérieurs à ceux d'un Intel NUC11 équipé d'un Core U, tout en étant beaucoup moins cher. Le NUC11PAH avec un processeur Core i5-1135G7, 16 Go de RAM et 256 Go de SSD, par exemple, est actuellement vendu 550 $, alors que notre SEi 12 avec le double de stockage est vendu 400 $. Le modèle ne s'appuie pas sur des solutions Celeron ou Atom effroyablement lentes pour atteindre des prix attractifs et cela reste un argument de vente clé pour de nombreux mini PC de Beelink.
L'absence de prise en charge de Thunderbolt est décevante, mais cela n'affectera probablement que les enthousiastes qui veulent enchaîner des moniteurs haute résolution ou connecter des eGPU. Pour ce que cela vaut, Intel commence à se défendre avec la dernière série NUC12 qui offre maintenant des CPU Core P encore plus rapides. Si vous vous contentez des performances d'un Ultrabook moderne, alors le Core i5-1235U du SEi12 sera toujours plus que suffisant et certainement beaucoup plus rapide que la plupart des mini PC dans la même gamme de prix.
Prix et disponibilité
Le Beelink SEi12 est actuellement en vente pour $400 USD sur Amazon en baisse par rapport à son prix initial de 480 $. Alternativement, les utilisateurs peuvent acheter directement auprès du fabricant pour 460 $.
Price comparison

