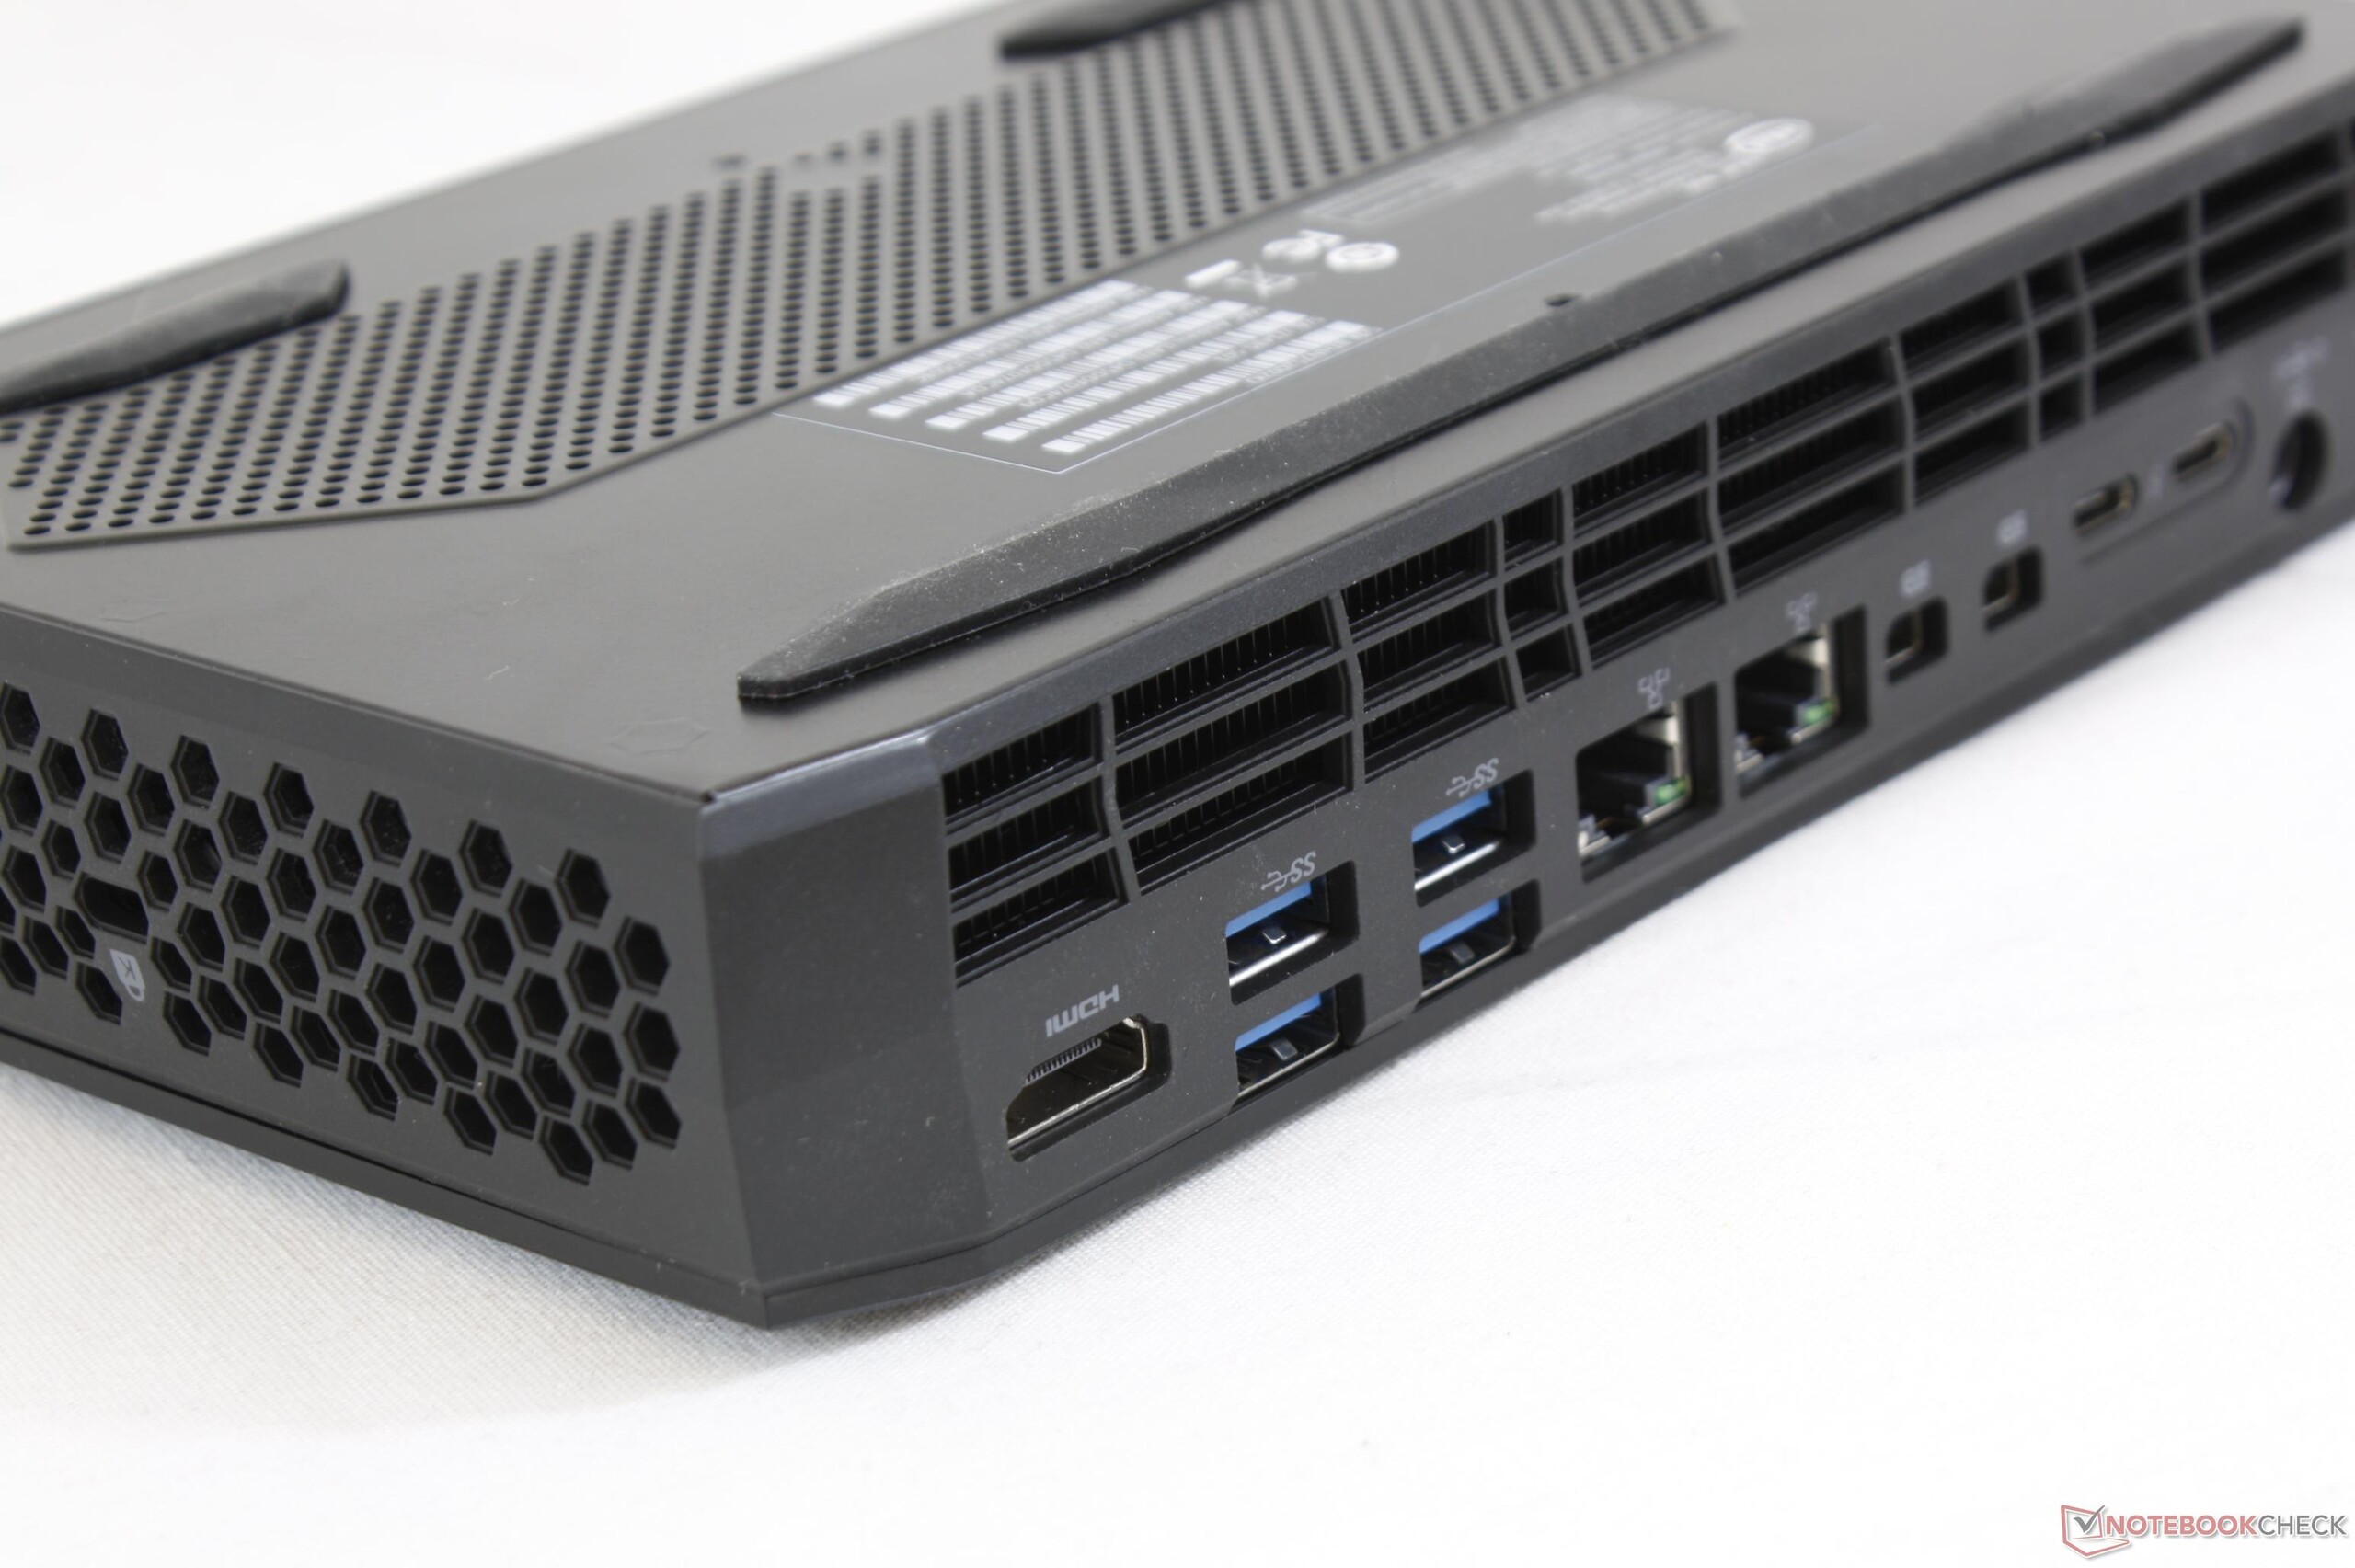
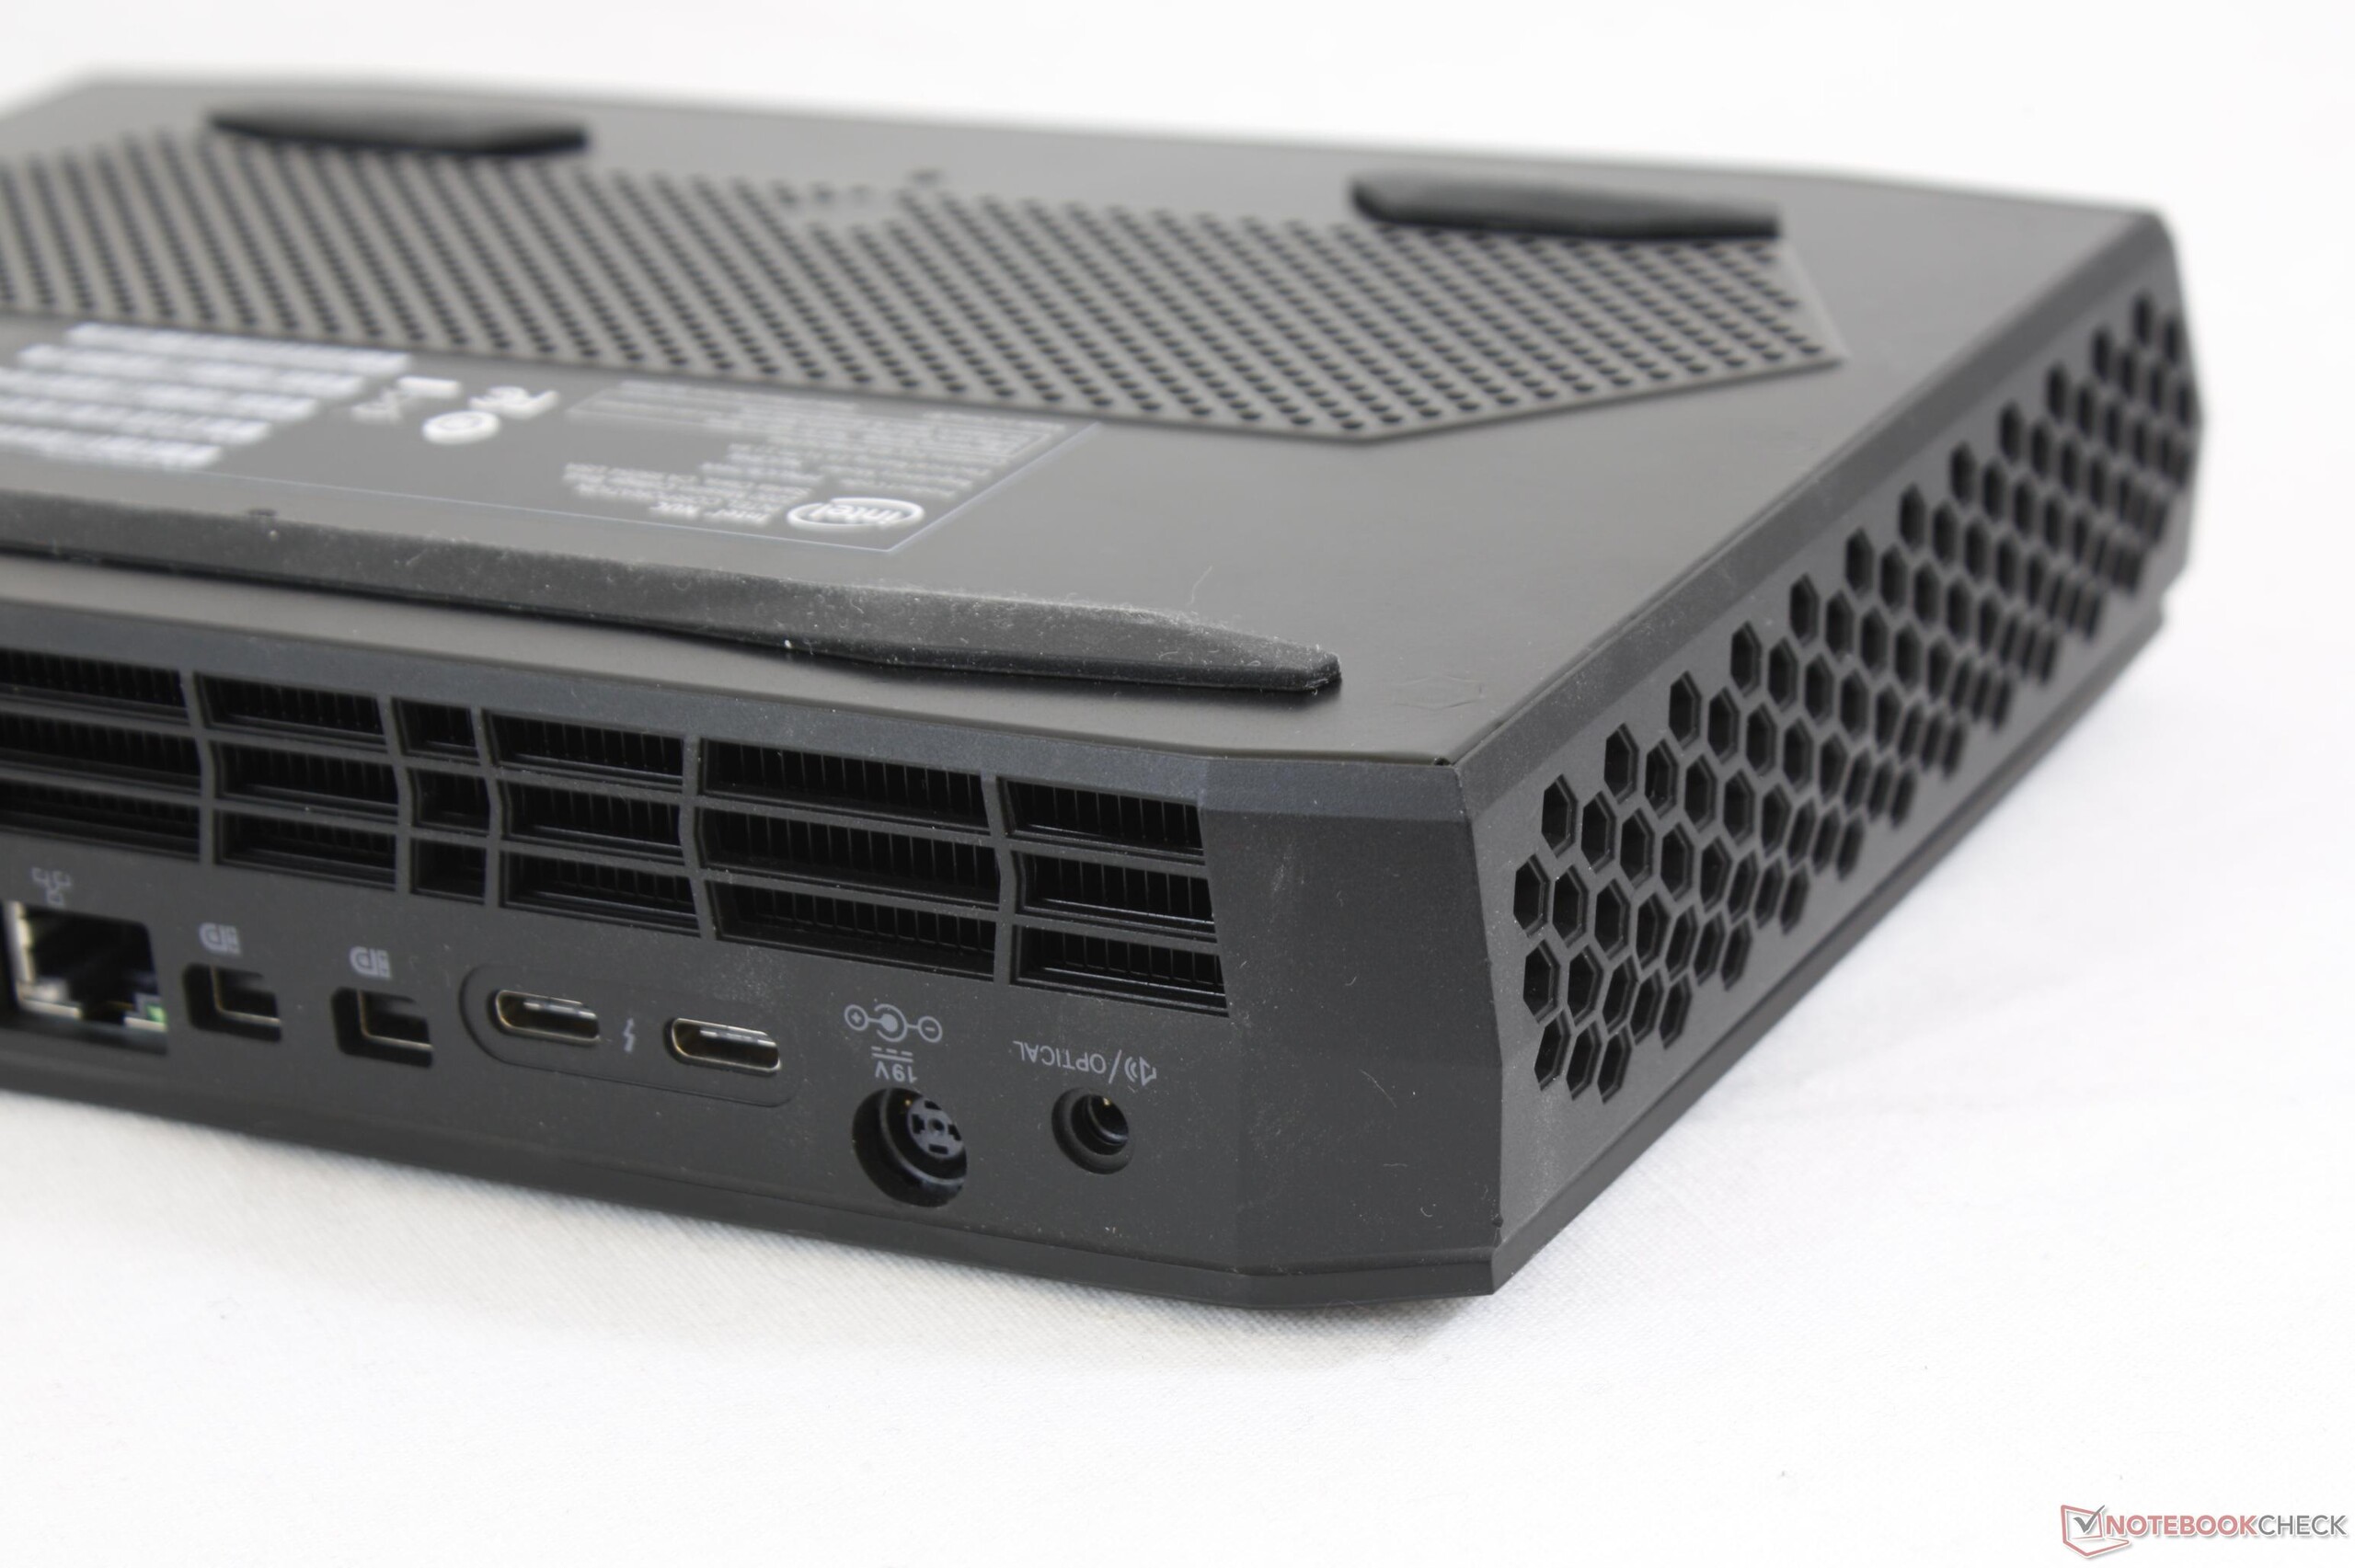
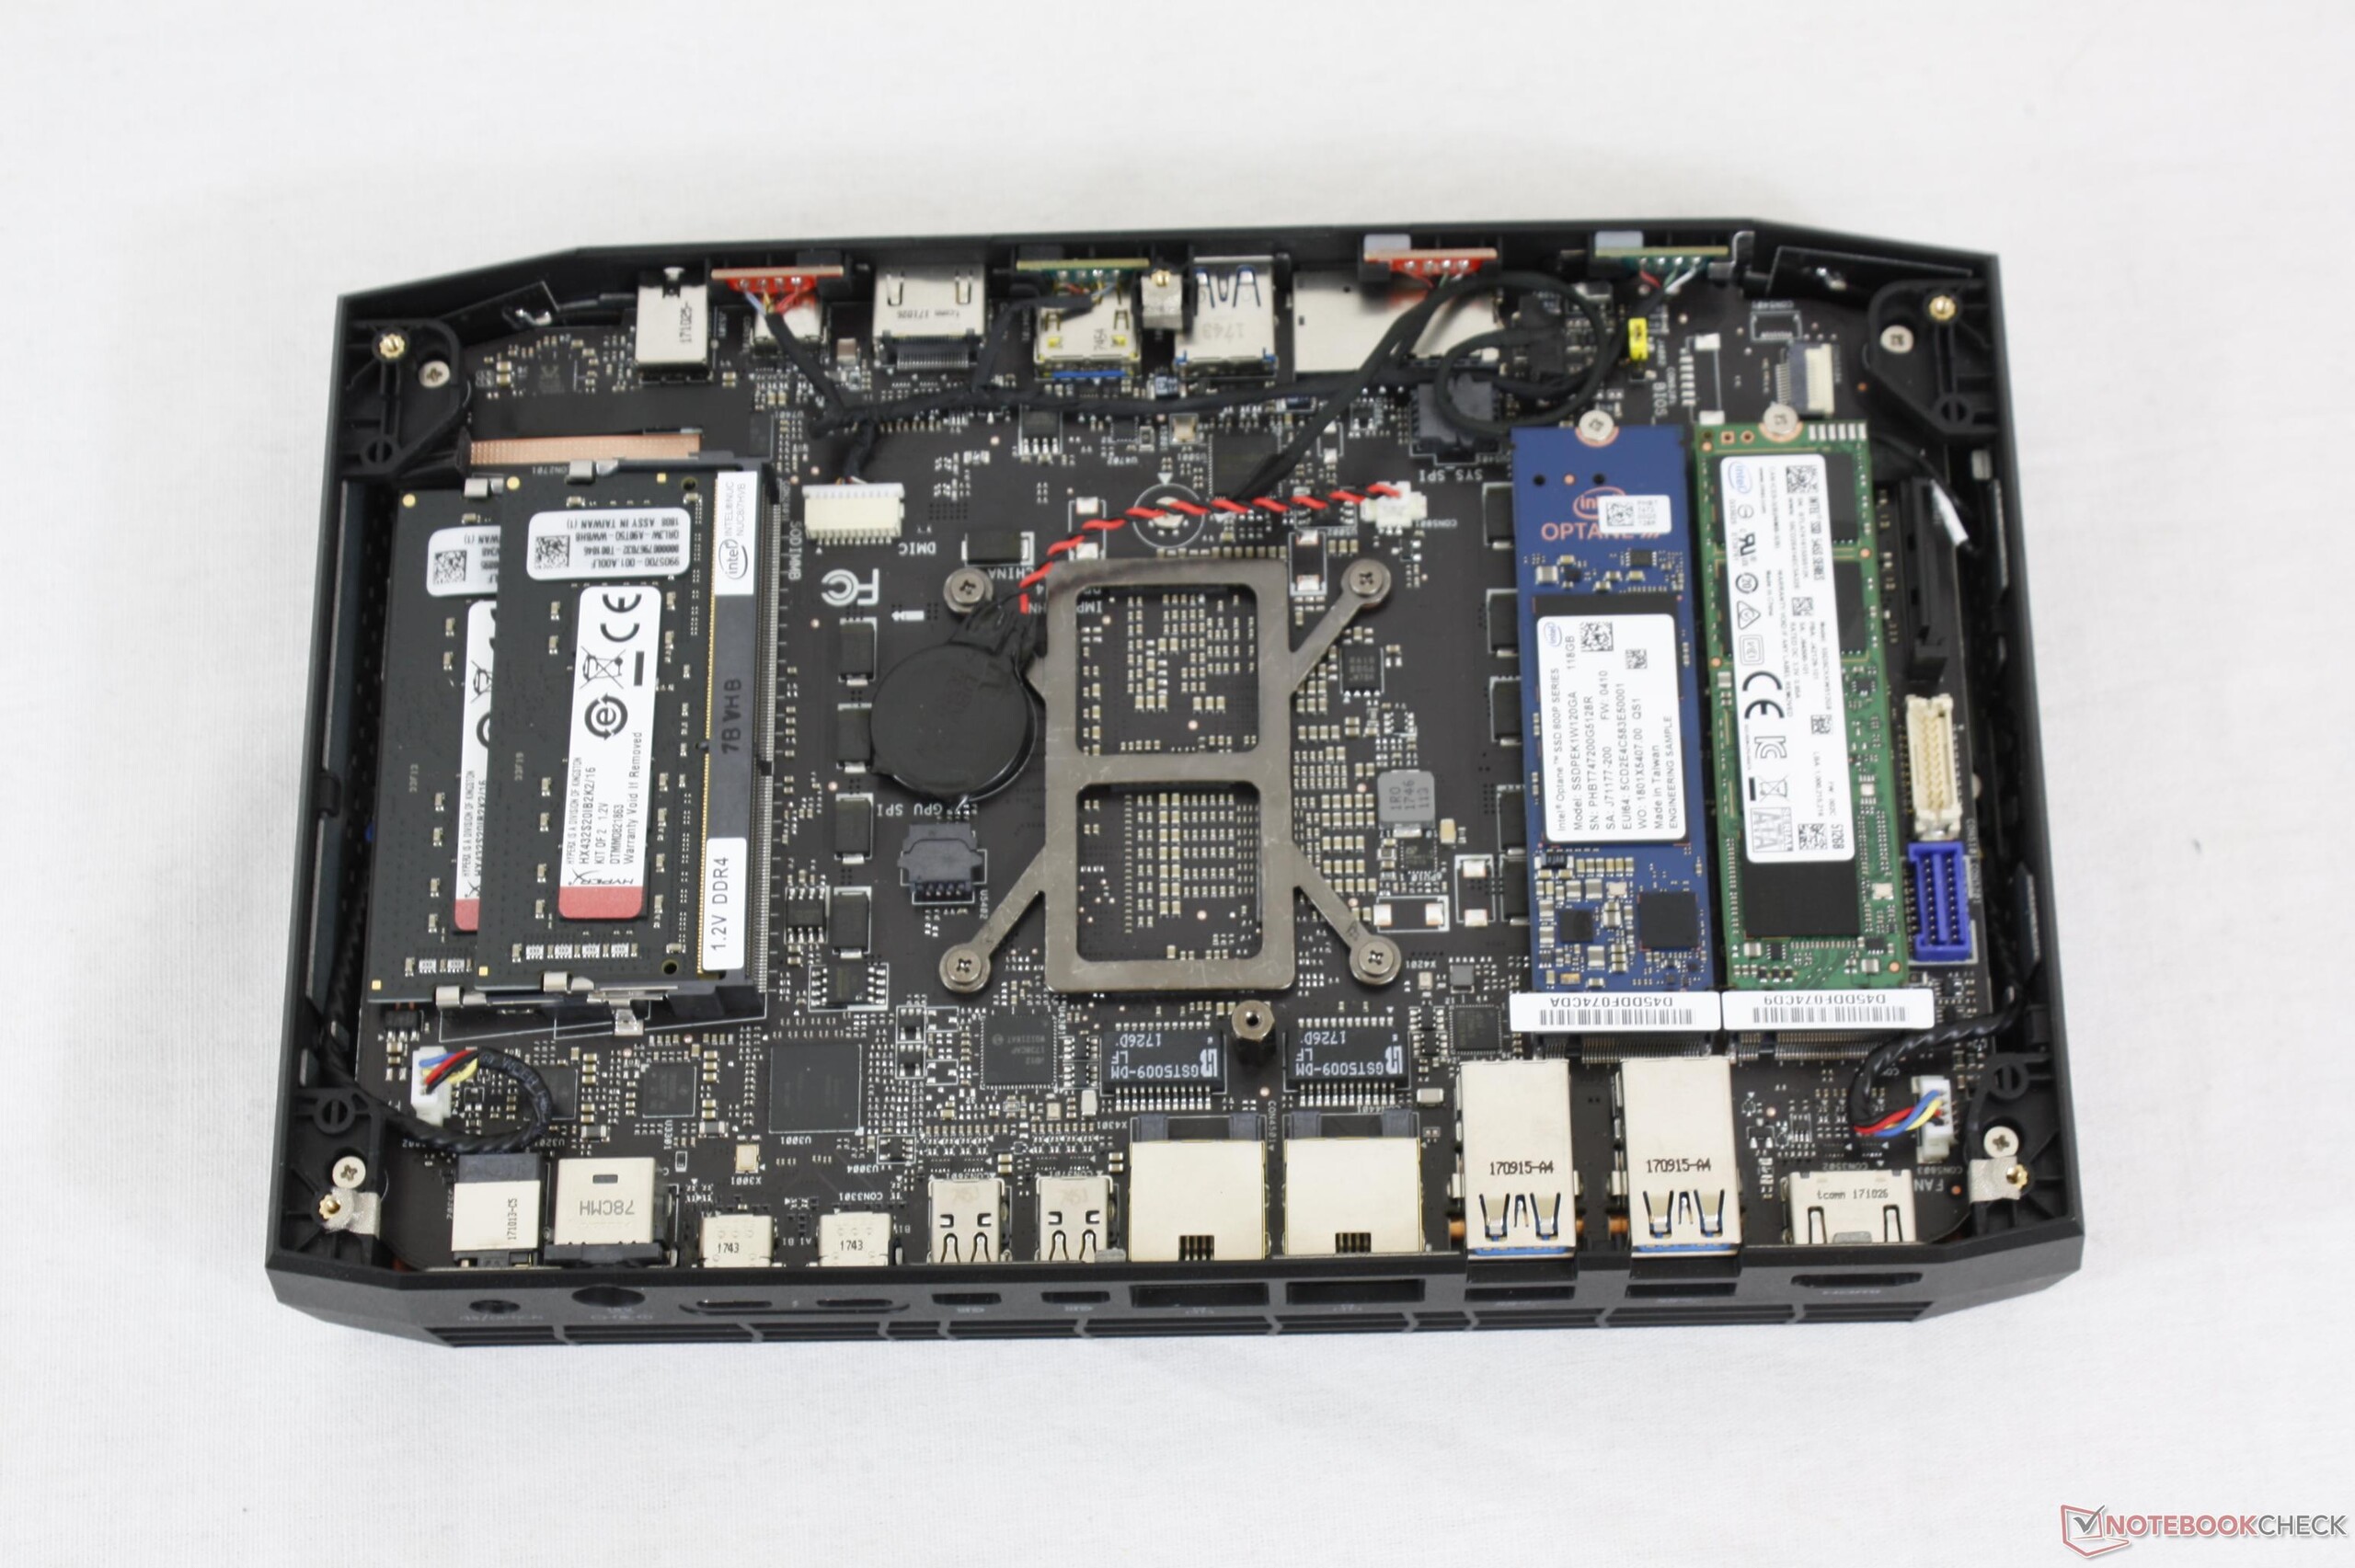
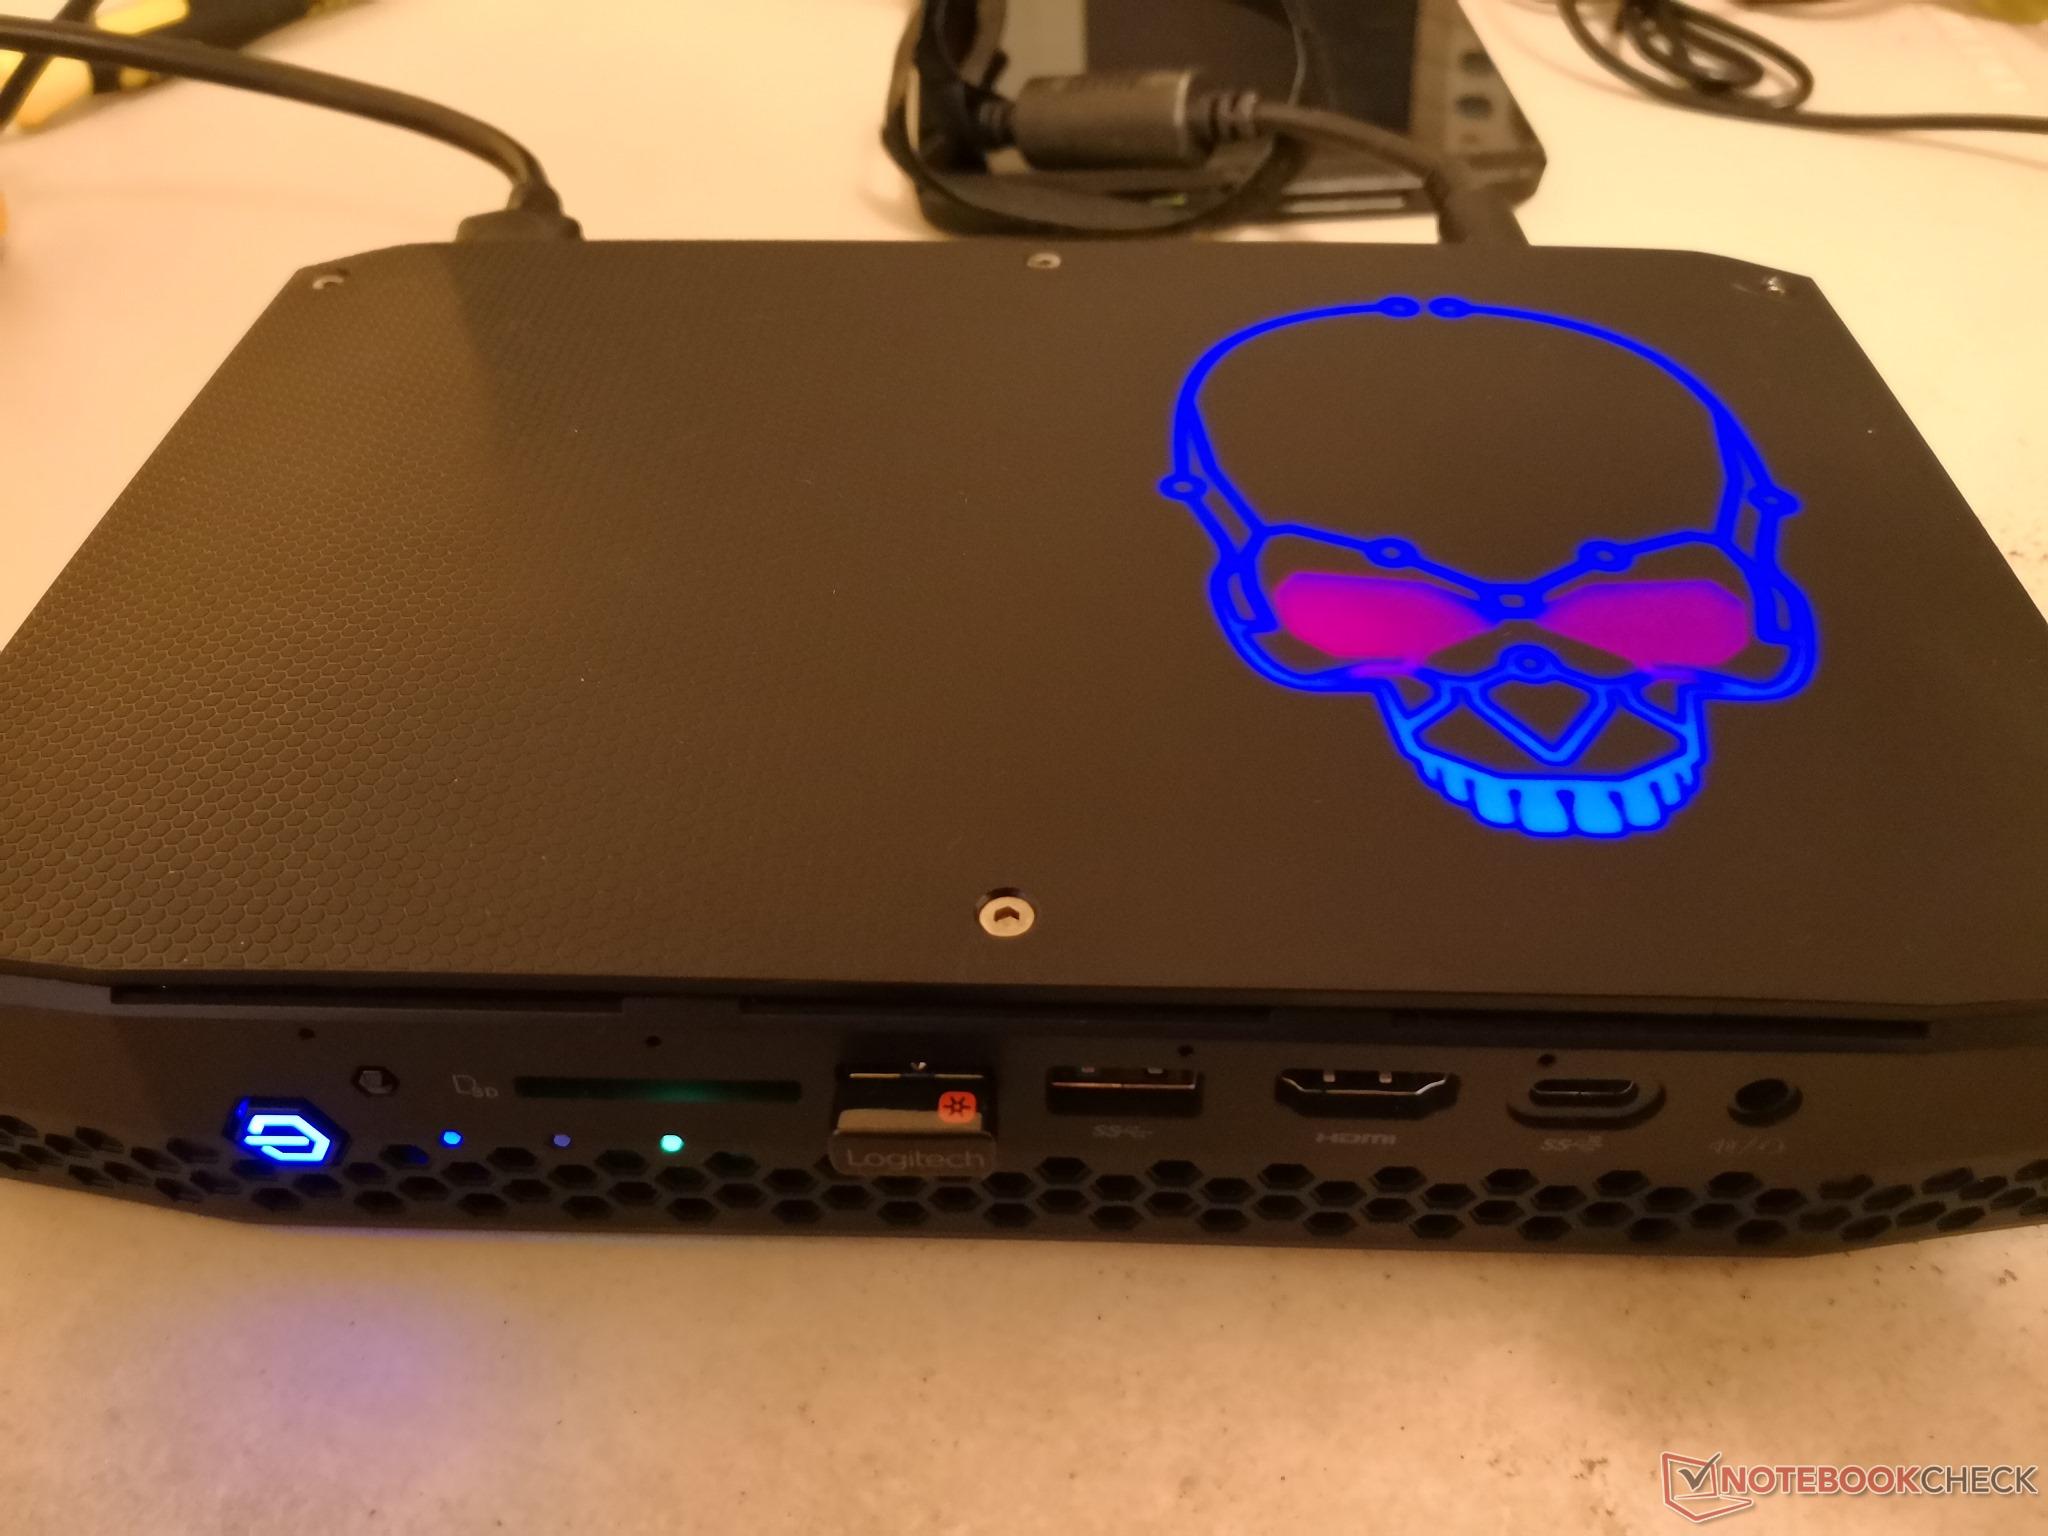
Courte critique du Mini PC Intel Hades Canyon NUC8i7HVK (i7-8809G, Radeon RX Vega M GH)
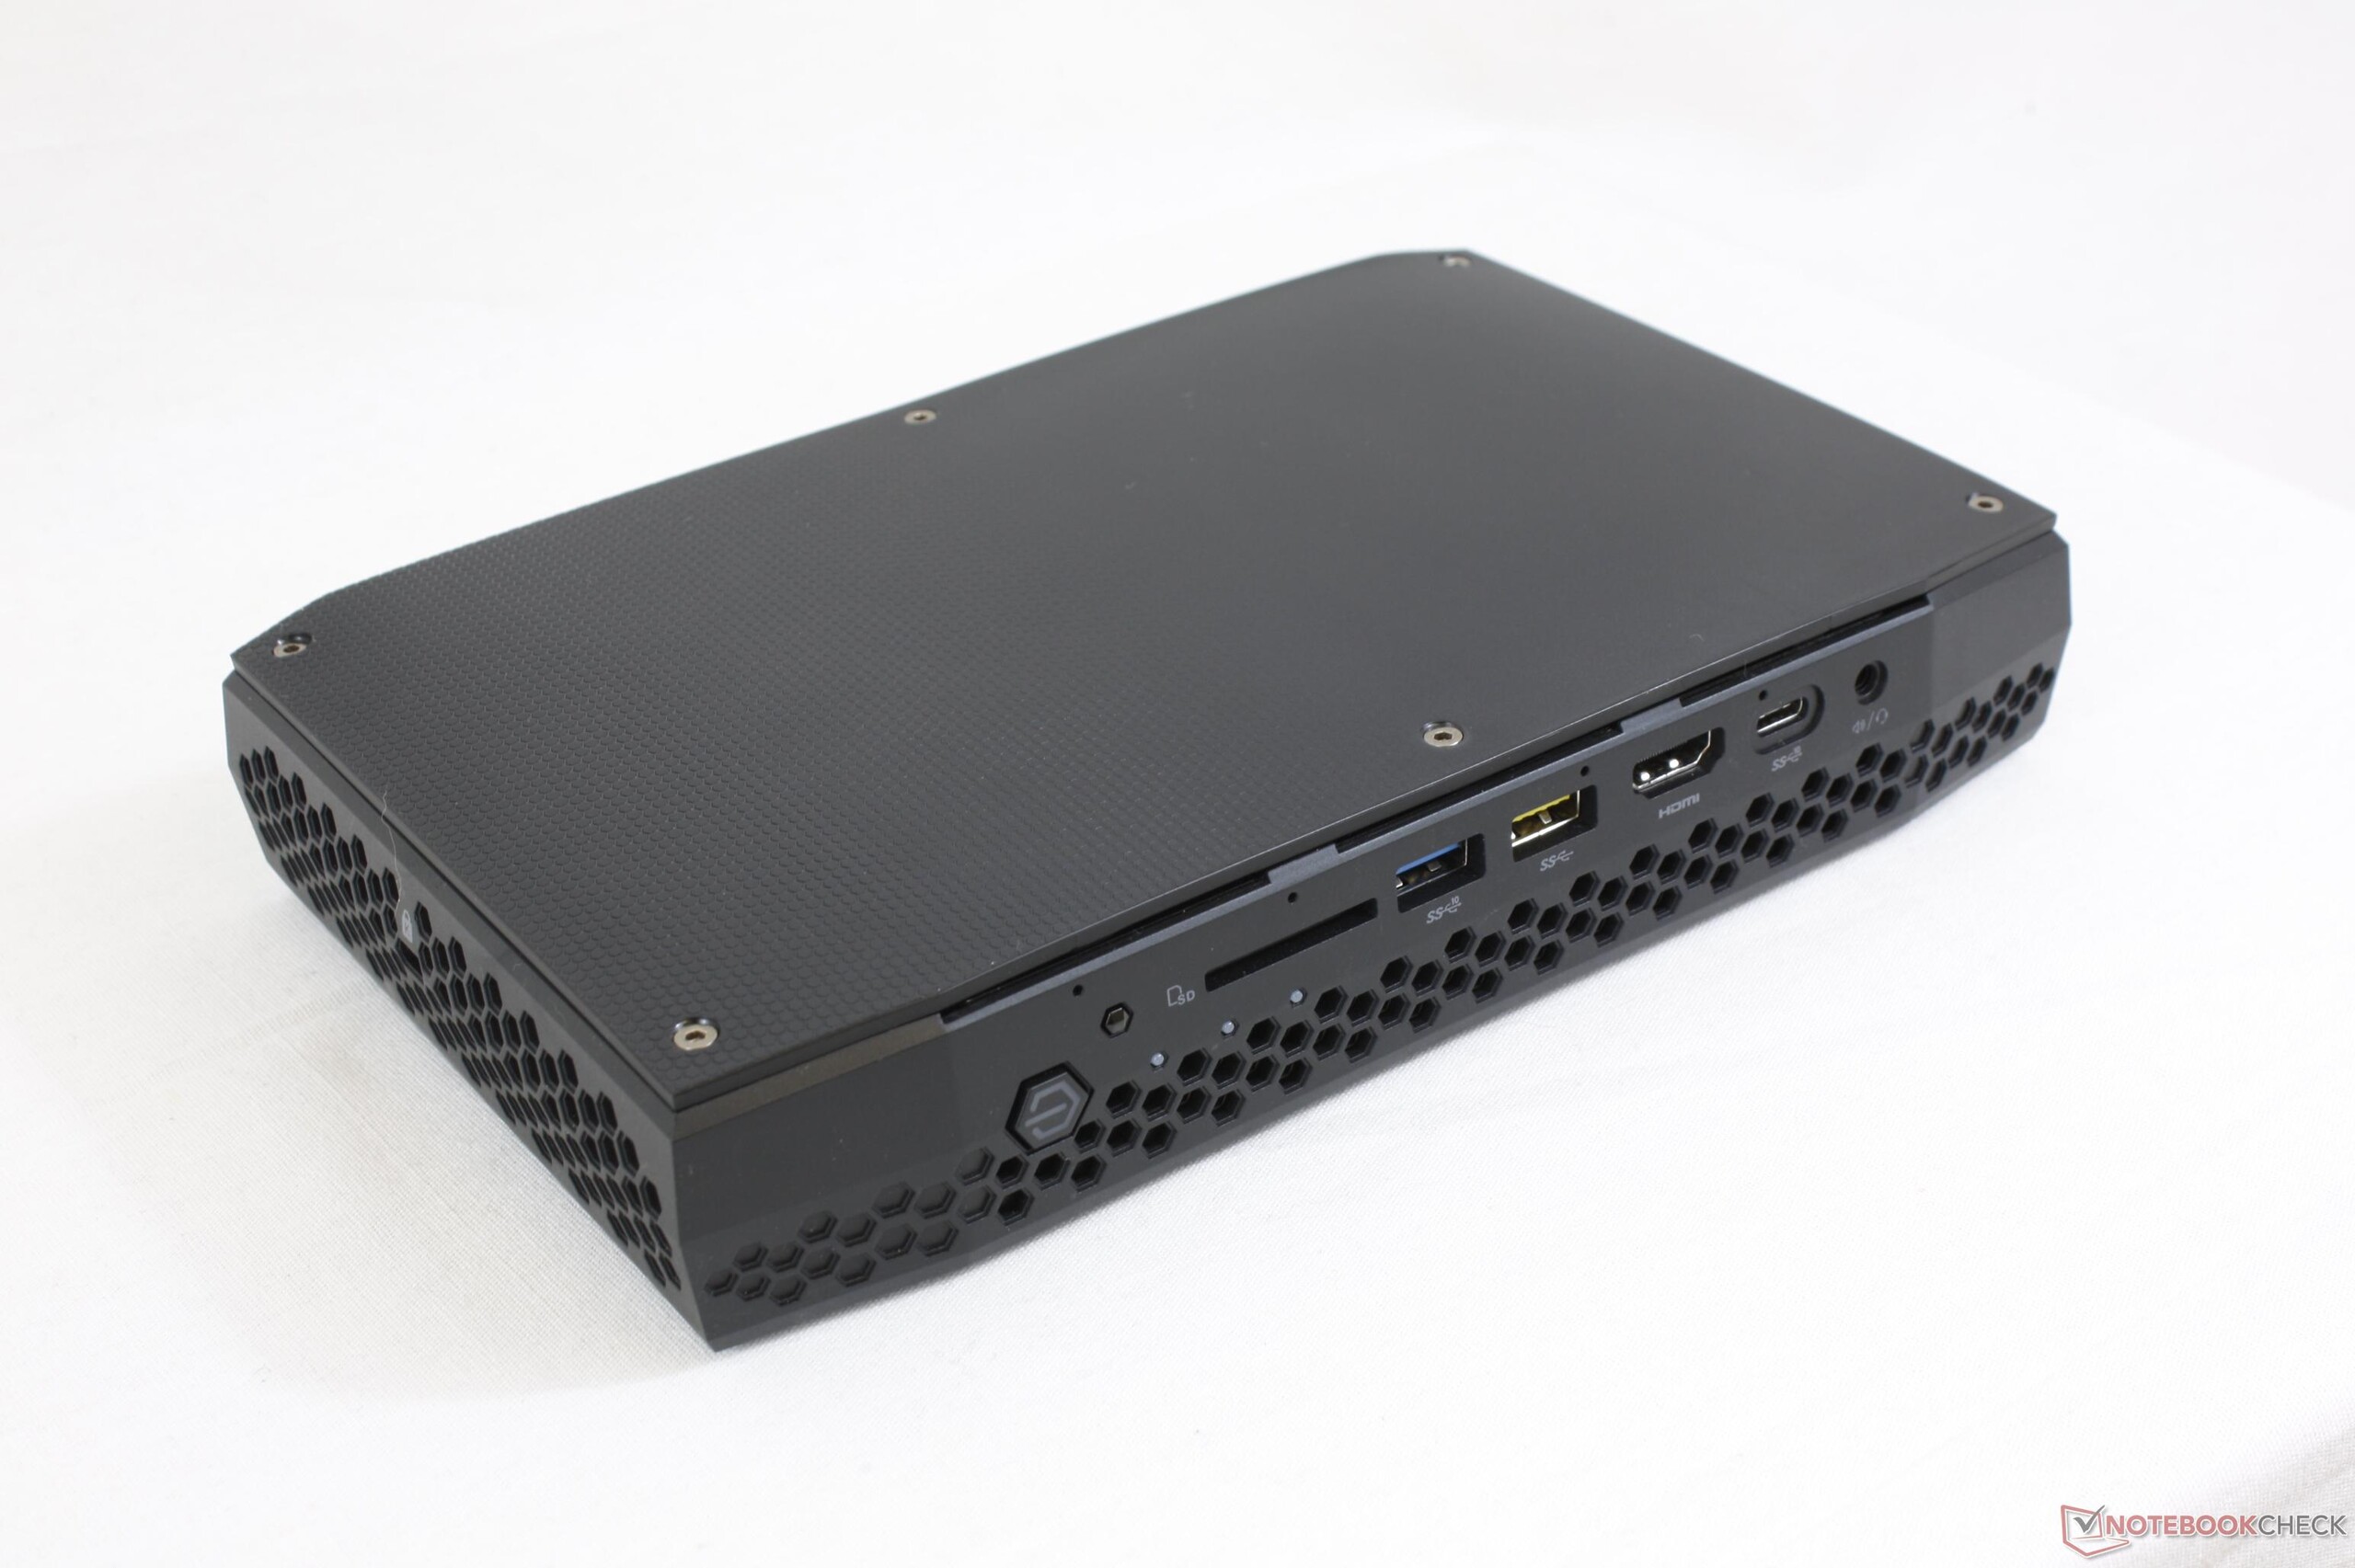
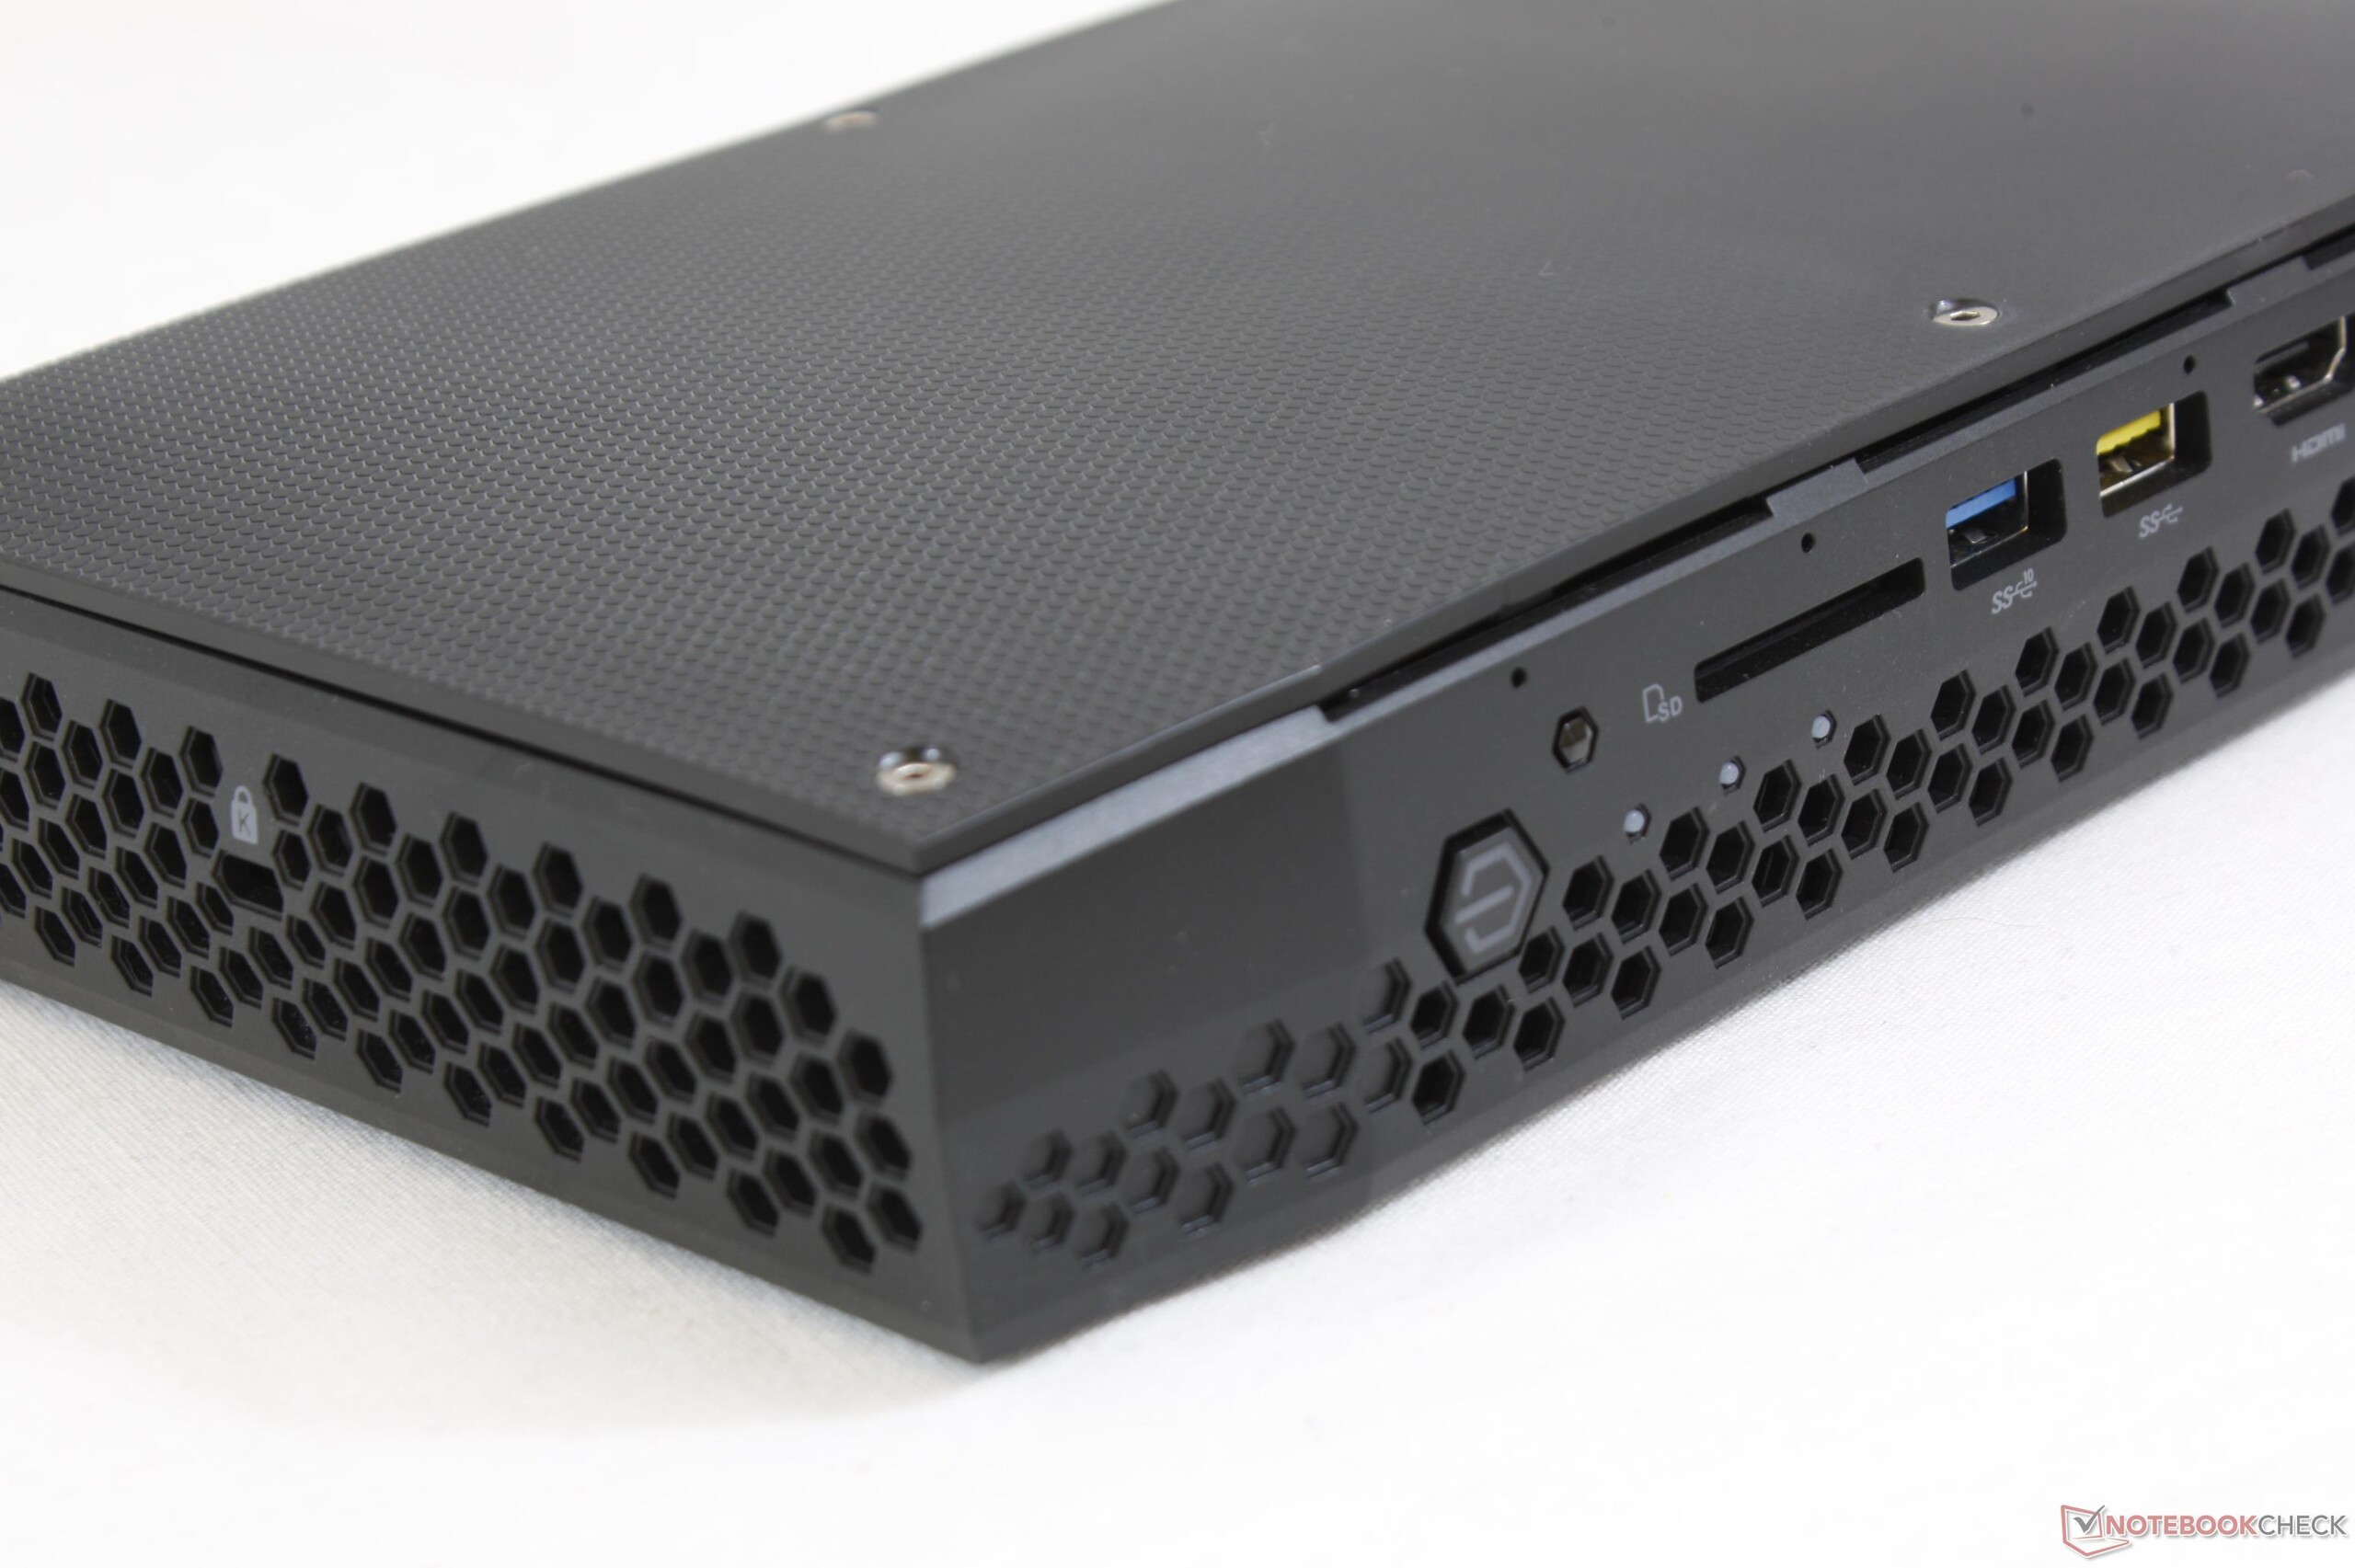
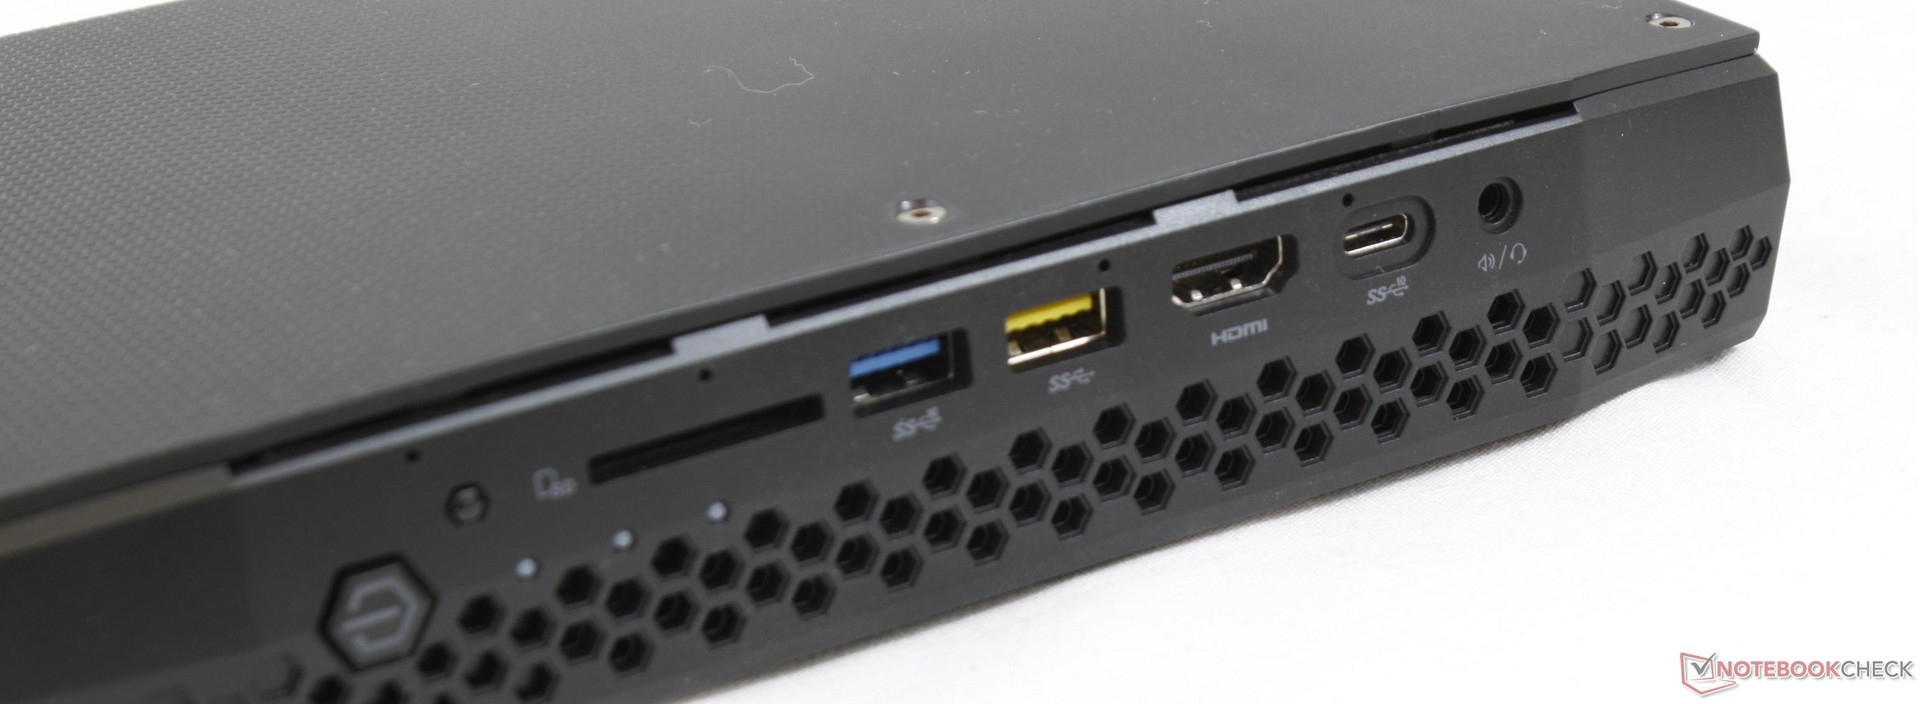
| SD Card Reader | |
| average JPG Copy Test (av. of 3 runs) | |
| MSI GS73VR 7RG (Toshiba Exceria Pro SDXC 64 GB UHS-II) | |
| Dell XPS 13 i5-8250U (Toshiba Exceria Pro SDXC 64 GB UHS-II) | |
| Intel Hades Canyon NUC8i7HVK (Toshiba Exceria Pro SDXC 64 GB UHS-II) | |
| Zotac ZBOX Magnus EN51050 (Toshiba Exceria Pro SDXC 64 GB UHS-II) | |
| maximum AS SSD Seq Read Test (1GB) | |
| MSI GS73VR 7RG (Toshiba Exceria Pro SDXC 64 GB UHS-II) | |
| Dell XPS 13 i5-8250U (Toshiba Exceria Pro SDXC 64 GB UHS-II) | |
| Intel Hades Canyon NUC8i7HVK (Toshiba Exceria Pro SDXC 64 GB UHS-II) | |
| Zotac ZBOX Magnus EN51050 (Toshiba Exceria Pro SDXC 64 GB UHS-II) | |
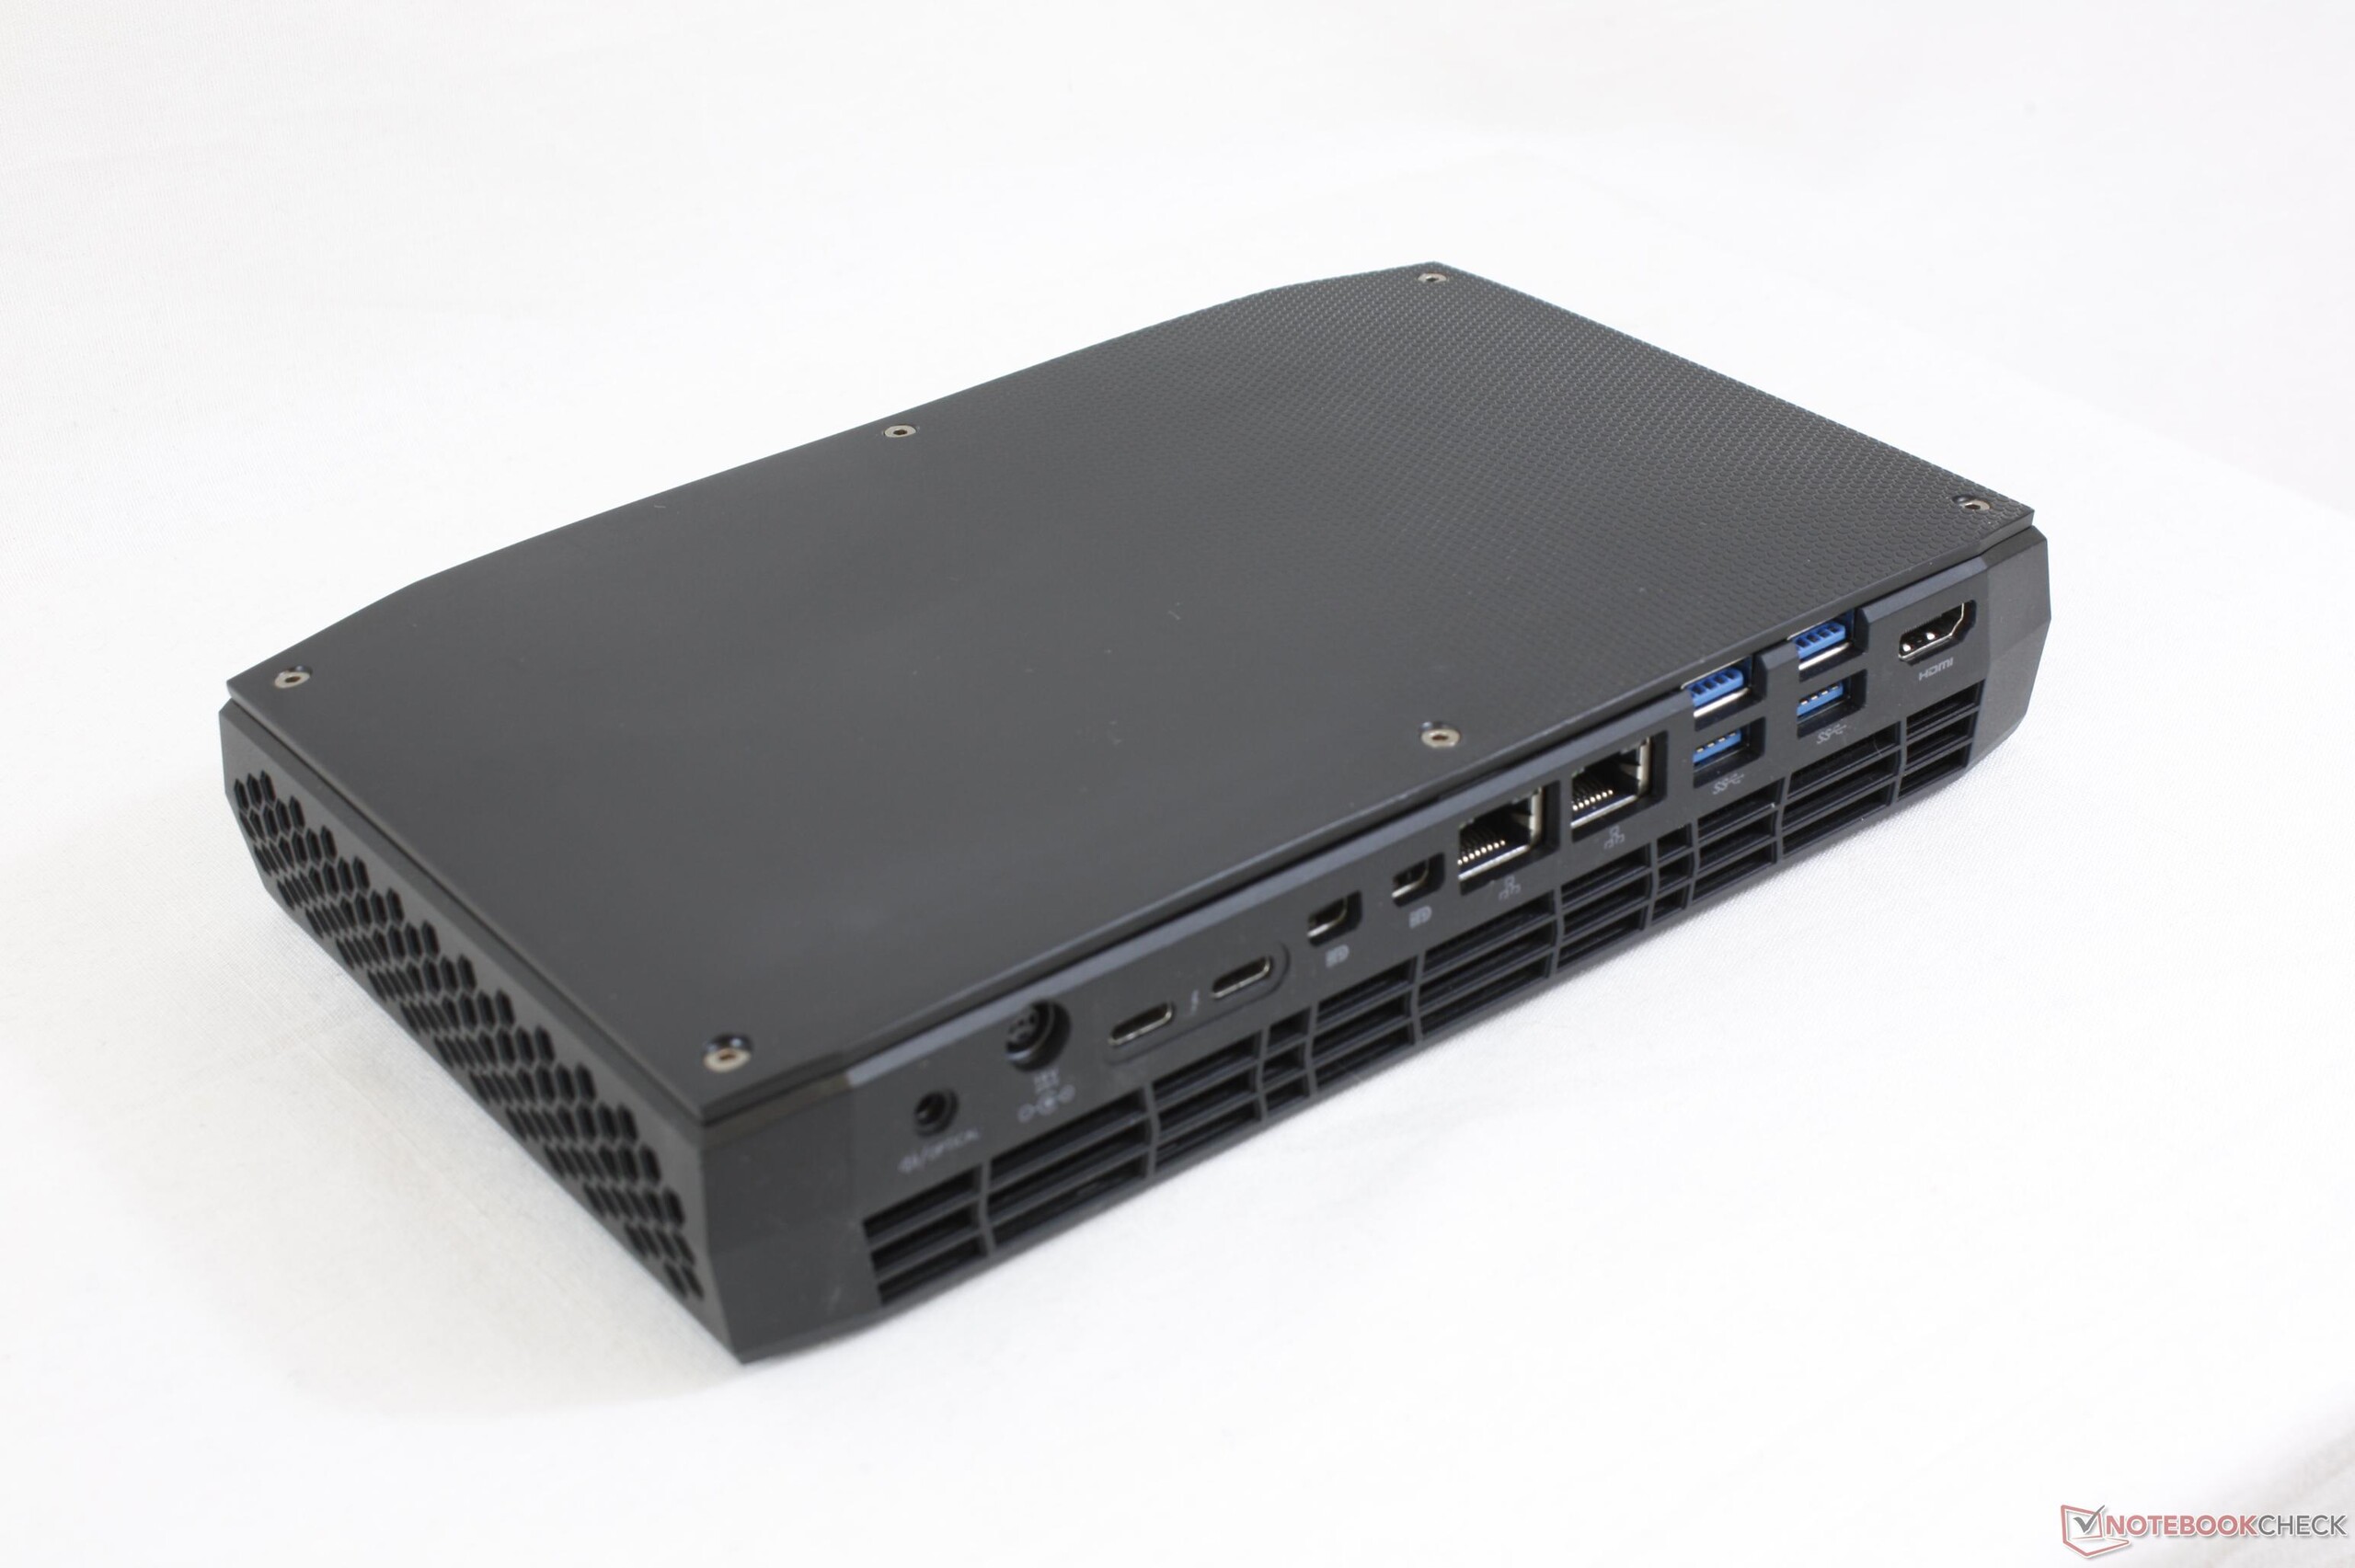
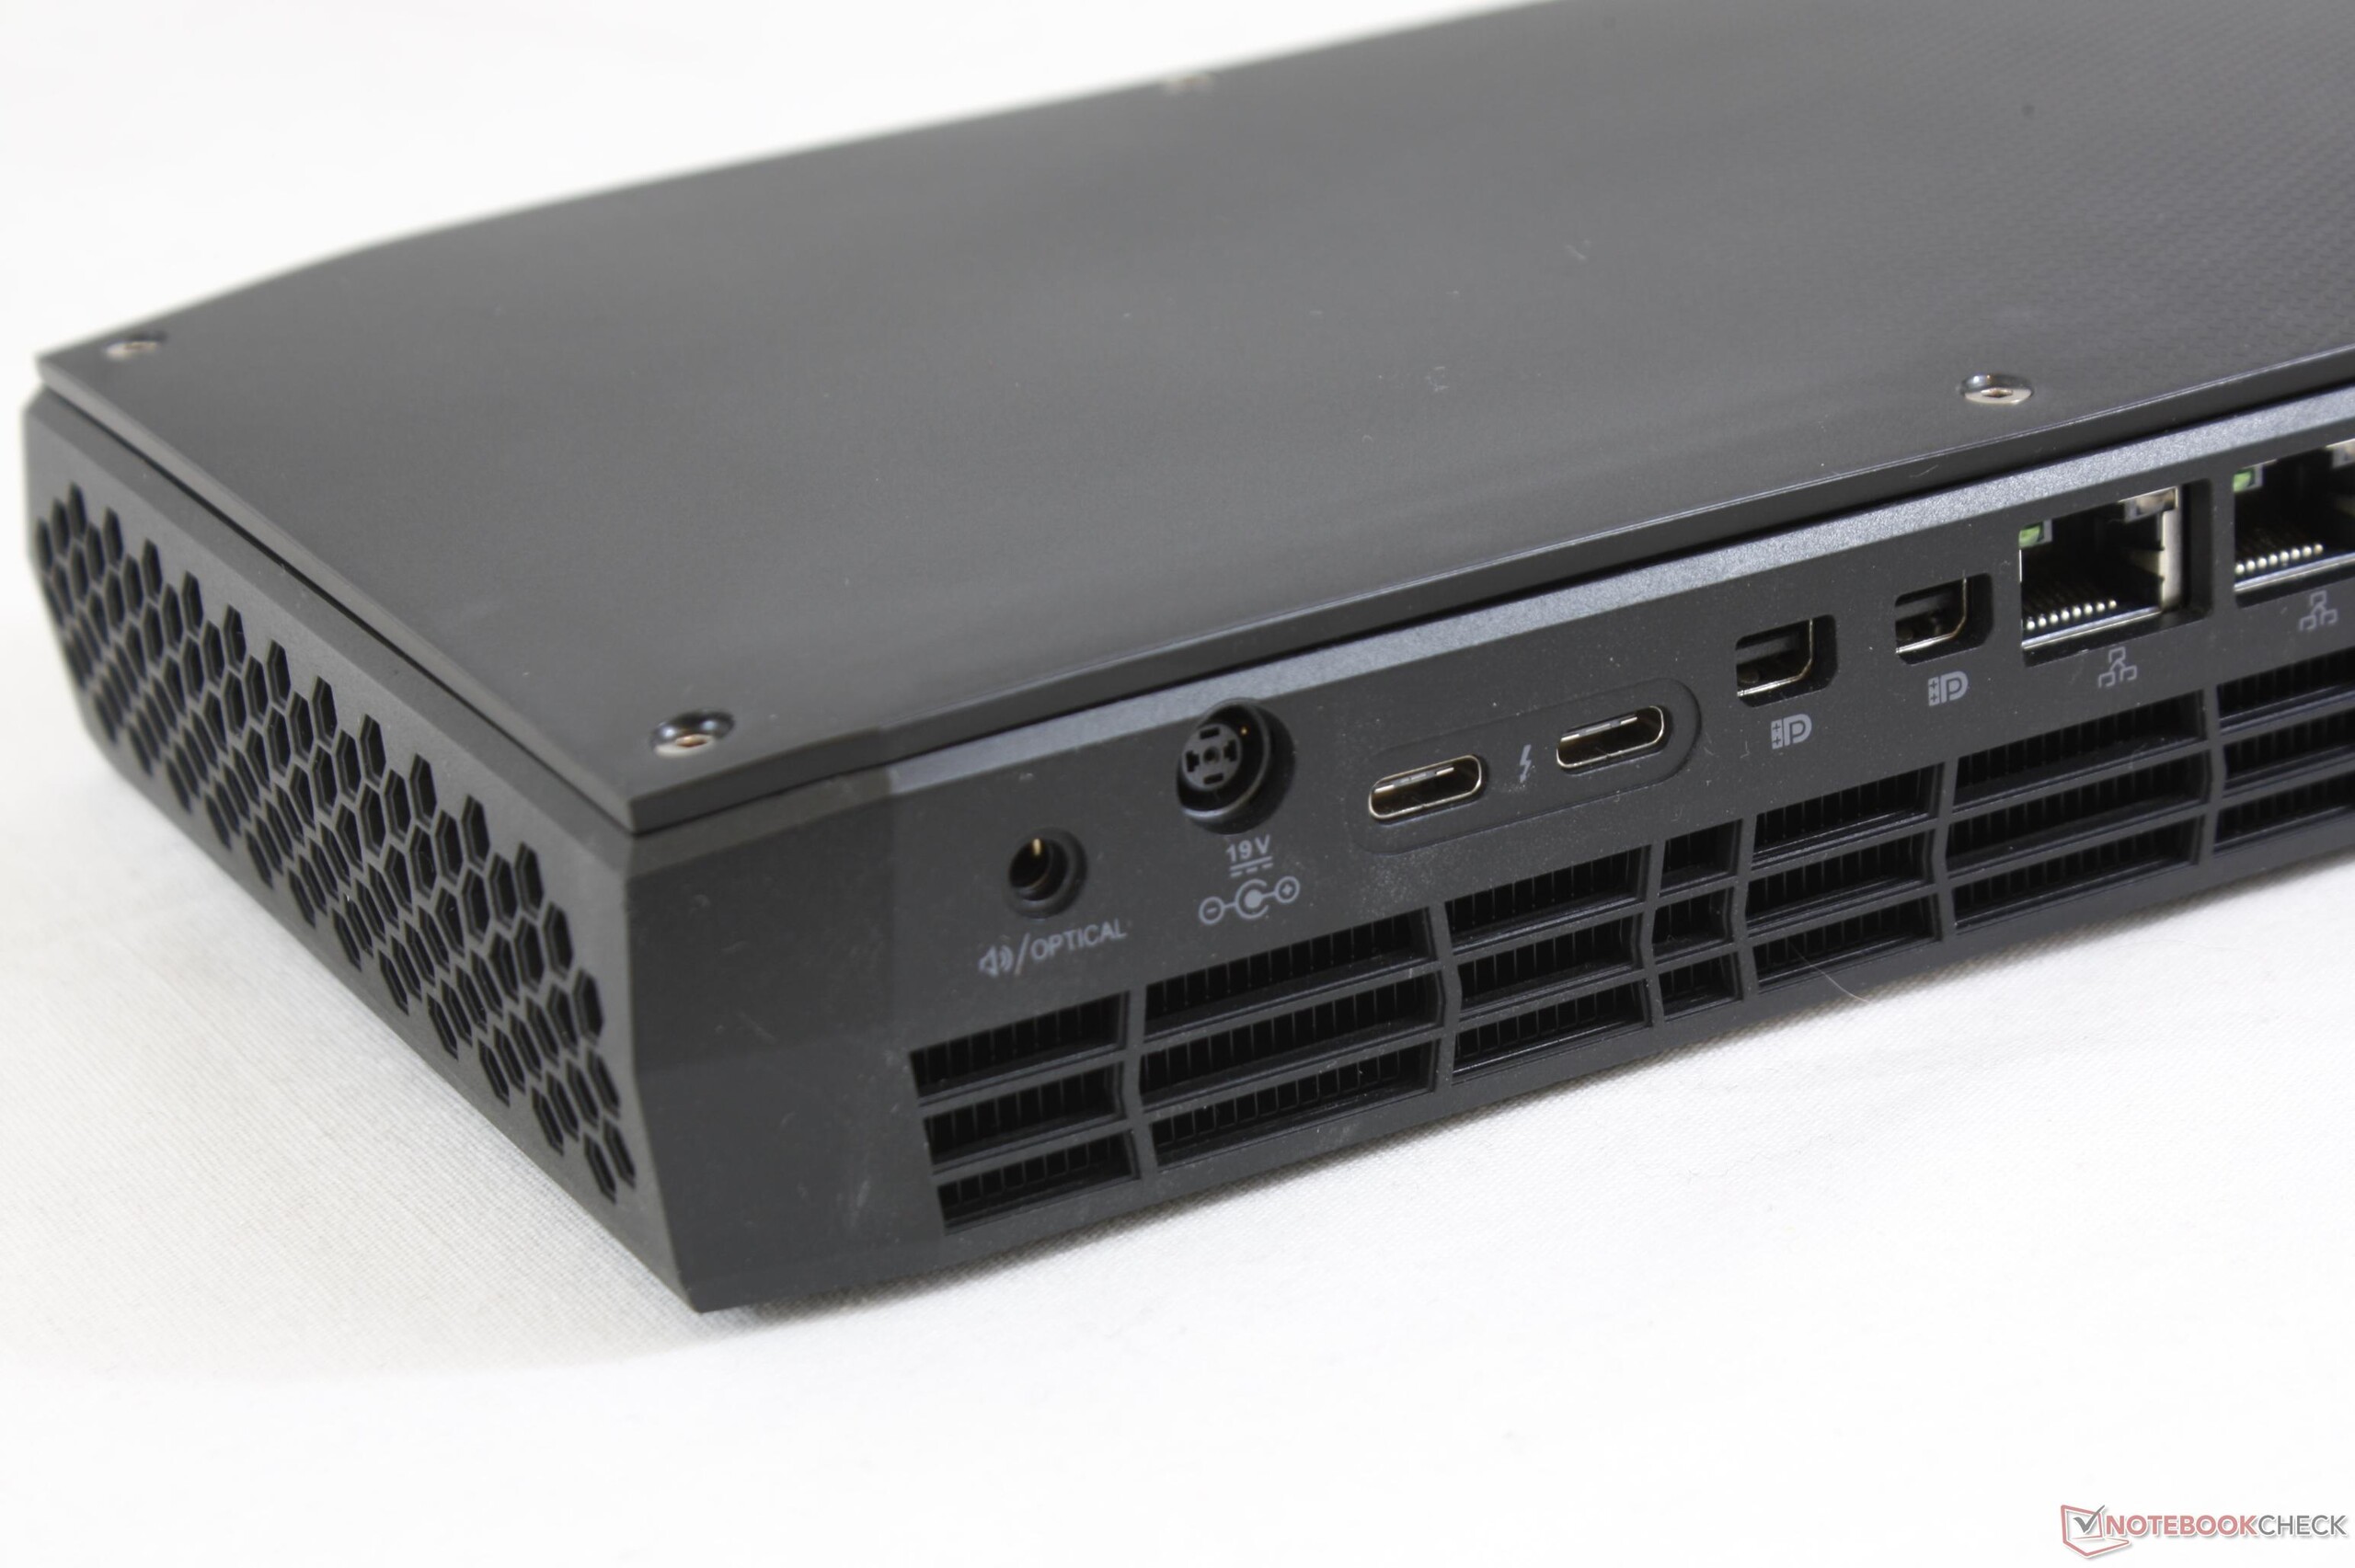
| Networking | |
| iperf3 transmit AX12 | |
| Dell XPS 13 9370 i5 UHD | |
| Intel Hades Canyon NUC8i7HVK | |
| Dell Latitude 5290 2-in-1 | |
| Zotac ZBOX Magnus EN51050 | |
| iperf3 receive AX12 | |
| Dell Latitude 5290 2-in-1 | |
| Dell XPS 13 9370 i5 UHD | |
| Intel Hades Canyon NUC8i7HVK | |
| Zotac ZBOX Magnus EN51050 | |
| Cinebench R15 | |
| CPU Single 64Bit | |
| Eurocom Tornado F5 | |
| Intel Hades Canyon NUC8i7HVK | |
| Lenovo ThinkPad T480s-20L8S02E00 | |
| HP Omen X 17-ap0xx | |
| Dell XPS 13 9360 FHD i7 Iris | |
| Razer Blade (2016) | |
| Asus Strix GL703VM-DB74 | |
| Acer Swift 3 SF315-41-R4W1 | |
| Asus ROG Strix GL702ZC-GC204T | |
| Intel Skull Canyon NUC6i7KYK | |
| Dell Inspiron 15 7000 7577 | |
| Lenovo ThinkPad A275 | |
| CPU Multi 64Bit | |
| Asus ROG Strix GL702ZC-GC204T | |
| Eurocom Tornado F5 | |
| Intel Hades Canyon NUC8i7HVK | |
| HP Omen X 17-ap0xx | |
| Lenovo ThinkPad T480s-20L8S02E00 | |
| Asus Strix GL703VM-DB74 | |
| Intel Skull Canyon NUC6i7KYK | |
| Razer Blade (2016) | |
| Acer Swift 3 SF315-41-R4W1 | |
| Dell Inspiron 15 7000 7577 | |
| Dell XPS 13 9360 FHD i7 Iris | |
| Lenovo ThinkPad A275 | |
| Cinebench R11.5 | |
| CPU Single 64Bit | |
| Eurocom Tornado F5 | |
| Intel Hades Canyon NUC8i7HVK | |
| Lenovo ThinkPad T480s-20L8S02E00 | |
| HP Omen X 17-ap0xx | |
| Intel Skull Canyon NUC6i7KYK | |
| Asus Strix GL703VM-DB74 | |
| Acer Swift 3 SF315-41-R4W1 | |
| Asus ROG Strix GL702ZC-GC204T | |
| Dell Inspiron 15 7000 7577 | |
| CPU Multi 64Bit | |
| Asus ROG Strix GL702ZC-GC204T | |
| Eurocom Tornado F5 | |
| Intel Hades Canyon NUC8i7HVK | |
| HP Omen X 17-ap0xx | |
| Lenovo ThinkPad T480s-20L8S02E00 | |
| Intel Skull Canyon NUC6i7KYK | |
| Asus Strix GL703VM-DB74 | |
| Dell Inspiron 15 7000 7577 | |
| Acer Swift 3 SF315-41-R4W1 | |
| Cinebench R10 | |
| Rendering Multiple CPUs 32Bit | |
| Eurocom Tornado F5 | |
| Intel Hades Canyon NUC8i7HVK | |
| Asus ROG Strix GL702ZC-GC204T | |
| HP Omen X 17-ap0xx | |
| Lenovo ThinkPad T480s-20L8S02E00 | |
| Intel Skull Canyon NUC6i7KYK | |
| Asus Strix GL703VM-DB74 | |
| Dell Inspiron 15 7000 7577 | |
| Acer Swift 3 SF315-41-R4W1 | |
| Rendering Single 32Bit | |
| Eurocom Tornado F5 | |
| Intel Hades Canyon NUC8i7HVK | |
| Lenovo ThinkPad T480s-20L8S02E00 | |
| HP Omen X 17-ap0xx | |
| Intel Skull Canyon NUC6i7KYK | |
| Asus Strix GL703VM-DB74 | |
| Dell Inspiron 15 7000 7577 | |
| Acer Swift 3 SF315-41-R4W1 | |
| Asus ROG Strix GL702ZC-GC204T | |
| wPrime 2.10 - 1024m | |
| Asus ROG Strix GL702ZC-GC204T | |
| Asus Strix GL703VM-DB74 | |
| Intel Skull Canyon NUC6i7KYK | |
| HP Omen X 17-ap0xx | |
| Intel Hades Canyon NUC8i7HVK | |
| Eurocom Tornado F5 | |
* ... Moindre est la valeur, meilleures sont les performances
| PCMark 10 - Score | |
| Intel Hades Canyon NUC8i7HVK | |
| Schenker XMG Pro 17 | |
| Microsoft Surface Book 2 15 | |
| Zotac ZBOX Magnus EN51050 | |
| Dell XPS 13 9370 i5 UHD | |
| Acer Swift 3 SF315-41-R4W1 | |
| PCMark 8 | |
| Home Score Accelerated v2 | |
| Intel Hades Canyon NUC8i7HVK | |
| Zotac ZBOX Magnus EN51050 | |
| Intel Skull Canyon NUC6i7KYK | |
| Schenker XMG Pro 17 | |
| Microsoft Surface Book 2 15 | |
| Dell XPS 13 9370 i5 UHD | |
| Acer Swift 3 SF315-41-R4W1 | |
| Work Score Accelerated v2 | |
| Intel Hades Canyon NUC8i7HVK | |
| Zotac ZBOX Magnus EN51050 | |
| Intel Skull Canyon NUC6i7KYK | |
| Microsoft Surface Book 2 15 | |
| Schenker XMG Pro 17 | |
| Dell XPS 13 9370 i5 UHD | |
| Acer Swift 3 SF315-41-R4W1 | |
| Creative Score Accelerated v2 | |
| Intel Hades Canyon NUC8i7HVK | |
| Zotac ZBOX Magnus EN51050 | |
| Intel Skull Canyon NUC6i7KYK | |
| Microsoft Surface Book 2 15 | |
| Dell XPS 13 9370 i5 UHD | |
| Acer Swift 3 SF315-41-R4W1 | |
| PCMark 8 Home Score Accelerated v2 | 4833 points | |
| PCMark 8 Creative Score Accelerated v2 | 6457 points | |
| PCMark 8 Work Score Accelerated v2 | 5454 points | |
| PCMark 10 Score | 5301 points | |
Aide | ||
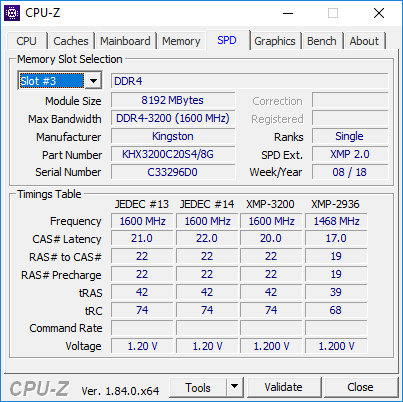
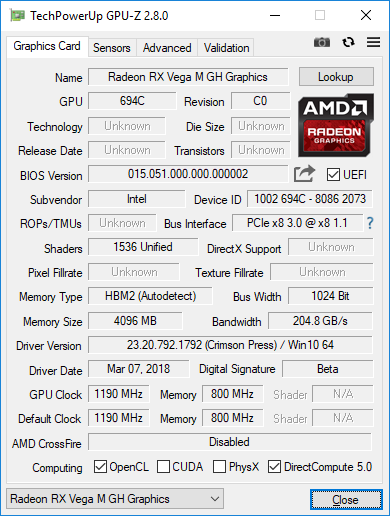
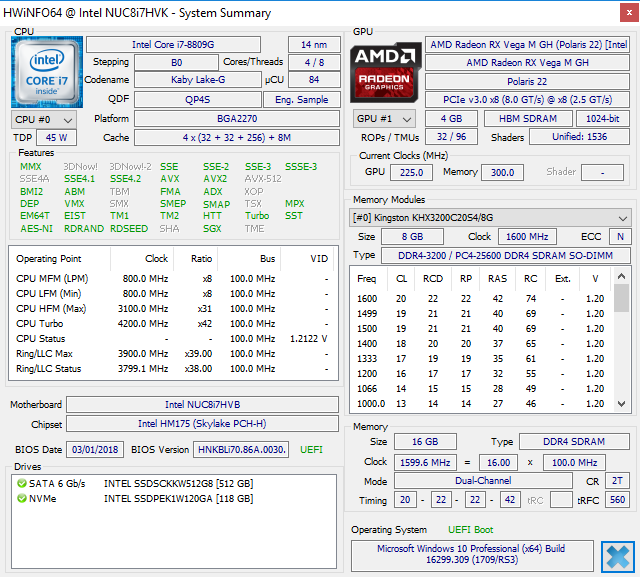
| Intel Hades Canyon NUC8i7HVK Intel Optane 120 GB SSDPEK1W120GA | Intel Skull Canyon NUC6i7KYK Samsung SSD 850 EVO m.2 120GB | Dell XPS 13 i5-8250U Toshiba XG5 KXG50ZNV256G | Razer Blade (2017) UHD Samsung PM961 NVMe MZVLW512HMJP | MSI GS63VR 7RG-005 Samsung SM961 MZVPW256HEGL | |
|---|---|---|---|---|---|
| AS SSD | -67% | -721% | -1265% | 27% | |
| Copy Game MB/s (MB/s) | 768 | 295.8 -61% | 892 16% | ||
| Copy Program MB/s (MB/s) | 342.4 | 213.1 -38% | 317.5 -7% | ||
| Copy ISO MB/s (MB/s) | 1125 | 358 -68% | 1698 51% | ||
| Score Total (Points) | 3023 | 919 -70% | 815 -73% | 1557 -48% | 3848 27% |
| Score Write (Points) | 714 | 268 -62% | 71 -90% | 80 -89% | 1185 66% |
| Score Read (Points) | 1524 | 424 -72% | 531 -65% | 1034 -32% | 1795 18% |
| Access Time Write * (ms) | 0.033 | 0.047 -42% | 2.148 -6409% | 4.467 -13436% | 0.03 9% |
| Access Time Read * (ms) | 0.025 | 0.075 -200% | 0.244 -876% | 0.036 -44% | 0.039 -56% |
| 4K-64 Write (MB/s) | 556 | 145.2 -74% | 52.3 -91% | 42.59 -92% | 932 68% |
| 4K-64 Read (MB/s) | 1258 | 337.4 -73% | 385.7 -69% | 755 -40% | 1506 20% |
| 4K Write (MB/s) | 103.5 | 76.9 -26% | 1.94 -98% | 1.03 -99% | 124.7 20% |
| 4K Read (MB/s) | 127.9 | 35.55 -72% | 11.93 -91% | 47.31 -63% | 51 -60% |
| Seq Write (MB/s) | 553 | 460.4 -17% | 166 -70% | 359.9 -35% | 1281 132% |
| Seq Read (MB/s) | 1379 | 508 -63% | 1338 -3% | 2318 68% | 2382 73% |
* ... Moindre est la valeur, meilleures sont les performances

| 3DMark 11 | |
| 1280x720 Performance GPU | |
| Eurocom Sky X4C | |
| Schenker XMG Pro 17 | |
| Asus Zephyrus GX501VS | |
| Nvidia GeForce GTX 1060 Founders Edition 6 GB | |
| Asus ROG Strix GL702ZC-GC204T | |
| Asus Strix GL703VM-DB74 | |
| Intel Hades Canyon NUC8i7HVK | |
| HP Omen 15t-ce000 | |
| Asus Strix GL502VY-DS71 | |
| Lenovo Legion Y520-15IKBN 80WK0042GE | |
| Zotac ZBOX Magnus EN51050 | |
| HP Envy 17-ae143ng | |
| HP Envy x360 15-bq102ng | |
| Intel Skull Canyon NUC6i7KYK | |
| Dell Latitude 5590 | |
| 1280x720 Performance Combined | |
| Eurocom Sky X4C | |
| Nvidia GeForce GTX 1060 Founders Edition 6 GB | |
| Intel Hades Canyon NUC8i7HVK | |
| Schenker XMG Pro 17 | |
| Asus Zephyrus GX501VS | |
| HP Omen 15t-ce000 | |
| Asus Strix GL502VY-DS71 | |
| Asus ROG Strix GL702ZC-GC204T | |
| Asus Strix GL703VM-DB74 | |
| Zotac ZBOX Magnus EN51050 | |
| Lenovo Legion Y520-15IKBN 80WK0042GE | |
| HP Envy 17-ae143ng | |
| Intel Skull Canyon NUC6i7KYK | |
| HP Envy x360 15-bq102ng | |
| Dell Latitude 5590 | |
| 3DMark 06 Standard Score | 33046 points | |
| 3DMark 11 Performance | 13212 points | |
| 3DMark Ice Storm Standard Score | 156453 points | |
| 3DMark Cloud Gate Standard Score | 25445 points | |
| 3DMark Fire Strike Score | 8506 points | |
| 3DMark Fire Strike Extreme Score | 4154 points | |
| 3DMark Time Spy Score | 3096 points | |
Aide | ||
| BioShock Infinite - 1920x1080 Ultra Preset, DX11 (DDOF) | |
| MSI GS63VR 7RG-005 | |
| MSI GF62VR 7RF-877 | |
| Dell Inspiron 15 7000 7577 4K | |
| EVGA SC17 | |
| Intel Hades Canyon NUC8i7HVK | |
| Gigabyte Aero 14-K7 | |
| Asus GL503VD-DB74 | |
| Asus Zenbook UX430UN | |
| Rise of the Tomb Raider - 1920x1080 Very High Preset AA:FX AF:16x | |
| MSI GF62VR 7RF-877 | |
| EVGA SC17 | |
| Dell Inspiron 15 7000 7577 4K | |
| Intel Hades Canyon NUC8i7HVK | |
| Asus GL503VD-DB74 | |
| Asus Zenbook UX430UN | |
| Bas | Moyen | Élevé | Ultra | QHD | 4K | |
|---|---|---|---|---|---|---|
| BioShock Infinite (2013) | 302.7 | 239.3 | 209.2 | 81.4 | ||
| Metro: Last Light (2013) | 159.2 | 156.5 | 113.1 | 55.9 | ||
| Thief (2014) | 120.7 | 109.8 | 107.1 | 62.6 | ||
| GTA V (2015) | 165 | 158 | 81.2 | 39.4 | ||
| The Witcher 3 (2015) | 165.5 | 105.1 | 59.7 | 34.3 | ||
| Batman: Arkham Knight (2015) | 146 | 135 | 74 | |||
| Metal Gear Solid V (2015) | 60 | 60 | 60 | 59 | ||
| Dota 2 Reborn (2015) | 127 | 119 | 108 | 94.6 | ||
| Fallout 4 (2015) | 179.1 | 63.4 | 50.8 | |||
| Rise of the Tomb Raider (2016) | 161.8 | 102.4 | 53.9 | 40.8 | ||
| Ashes of the Singularity (2016) | 80.2 | 50.8 | 45.1 | |||
| Overwatch (2016) | 197.3 | 148.3 | 71 | |||
| Deus Ex Mankind Divided (2016) | 48.3 | 23.4 | ||||
| Mafia 3 (2016) | 63 | 39.4 | 36 | |||
| Prey (2017) | 143 | 118.9 | 96.5 | 81.5 | ||
| Rocket League (2017) | 141 | 49.1 | ||||
| Dirt 4 (2017) | 202.1 | 137.9 | 81.2 | 46.9 | ||
| F1 2017 (2017) | 215 | 105 | 86 | 53 | ||
| Middle-earth: Shadow of War (2017) | 150 | 69 | 48 | 36 | ||
| Destiny 2 (2017) | 106.1 | 81.2 | 78.8 | 65.9 | ||
| Assassin´s Creed Origins (2017) | 64 | 45 | 42 | 34 | ||
| Final Fantasy XV Benchmark (2018) | 81.8 | 41.2 | 20.4 | |||
| X-Plane 11.11 (2018) | 61.8 | 52.8 | 45.5 | |||
| World of Tanks enCore (2018) | 386.1 | 186.1 | 63.3 | 41.8 | 21.4 | |
| Far Cry 5 (2018) | 51 | 47 | ||||
| The Crew 2 (2018) | 51 | |||||
| F1 2018 (2018) | 139 | 83 | 70 | 46.1 | ||
| Strange Brigade (2018) | 210 | 85.3 | 68 | 56.6 | ||
| Shadow of the Tomb Raider (2018) | 109 | 47 | 43 | 36 | ||
| Forza Horizon 4 (2018) | 0 Le jeu ne démarre pas (benchmark wont start) | |||||
| Assassin´s Creed Odyssey (2018) | 44 | 35 | 21 | |||
| Call of Duty Black Ops 4 (2018) | 66 | 38.7 | 17.8 | |||
| Hitman 2 (2018) | 53 | 52.8 | 46.2 | 41.3 | 14.4 | |
| Fallout 76 (2018) | 50.4 | |||||
| Battlefield V (2018) | 161 | 81 | 66 | 59.8 | 43.3 | 20.9 |
| Farming Simulator 19 (2018) | 142.9 | 101.6 | 88.6 | 57.1 | 21.3 | |
| Darksiders III (2018) | 134.7 | 59.7 | 49.7 | 42.3 | 14.3 | |
| Just Cause 4 (2018) | 76.2 | 51.6 | 41.9 | 40.3 | 14 | |
| Far Cry New Dawn (2019) | 71 | 55 | 51 | 47 | 22 | |
| Metro Exodus (2019) | 85.1 | 43.11 | 28.43 | 24.01 | 10.94 | |
| Anthem (2019) | 23.81 | 19.78 | 10 | |||
| Dirt Rally 2.0 (2019) | 164.7 | 78.2 | 64.7 | 35.95 | ||
| The Division 2 (2019) | 57 | 52 | 44 | 35 | 10 | |
| Rage 2 (2019) | 100.2 | 46.8 | 39.7 | 38.6 | ||
| Total War: Three Kingdoms (2019) | 149 | 49.4 | 29.8 | 19.8 | 12.7 | 5.4 |
| League of Legends (2019) | 174.9 | 160.4 | 158.8 | 156.8 | 156.2 | 156 |
| F1 2019 (2019) | 133 | 87 | 74 | 50.1 | 37.8 | 21.5 |
| Control (2019) | 102 | 34 | 24 | 15 | ||
| Borderlands 3 (2019) | 80.8 | 50 | 31.5 | 21.9 | 16.8 | 6.6 |
| FIFA 20 (2019) | 148.2 | 145.1 | 139.3 | 137.3 | 127.4 | 74.3 |
| Ghost Recon Breakpoint (2019) | 44 | 36 | 32 | 21 | 13 | |
| Need for Speed Heat (2019) | 70.9 | 55 | 48 | 41 | 29 | |
| Star Wars Jedi Fallen Order (2019) | 39 | 33 | 27.9 | |||
| Hunt Showdown (2020) | 133 | 53.3 | 41.3 | 24.5 | 11 | |
| Gears Tactics (2020) | 134.9 | 84.4 | 49 | 37.7 | 23.5 | 12.1 |
| F1 2020 (2020) | 204 | 105 | 81.5 | 56.1 | 40.8 | 20.8 |
| Forza Horizon 5 (2021) | 85 | 47 | 35 | 14 | 13 | |
| Cyberpunk 2077 1.6 (2022) | 39 | 30 | 23 | 23 | 4 |
Degré de la nuisance sonore
| Au repos |
| 29 / 29 / 29 dB(A) |
| Fortement sollicité |
| 36 / 49.4 dB(A) |
 | ||
30 dB silencieux 40 dB(A) audible 50 dB(A) bruyant |
||
min: | ||
| Intel Hades Canyon NUC8i7HVK Vega M GH, i7-8809G, Intel Optane 120 GB SSDPEK1W120GA | Intel Skull Canyon NUC6i7KYK Iris Pro Graphics 580, 6770HQ, Samsung SSD 850 EVO m.2 120GB | Zotac ZBOX Magnus EN51050 GeForce GTX 1050 Mobile, i5-7500T, Samsung SSD 960 Pro 512 GB m.2 | Razer Blade (2017) UHD GeForce GTX 1060 Mobile, i7-7700HQ, Samsung PM961 NVMe MZVLW512HMJP | Dell XPS 13 9370 i5 UHD UHD Graphics 620, i5-8250U, Toshiba XG5 KXG50ZNV256G | MSI GS63VR 7RG-005 GeForce GTX 1070 Max-Q, i7-7700HQ, Samsung SM961 MZVPW256HEGL | |
|---|---|---|---|---|---|---|
| Noise | -7% | -13% | -8% | 5% | -9% | |
| arrêt / environnement * (dB) | 28.7 | 29.5 -3% | 30.7 -7% | 30.3 -6% | 29 -1% | 30 -5% |
| Idle Minimum * (dB) | 29 | 31.6 -9% | 37.6 -30% | 30.3 -4% | 29 -0% | 31 -7% |
| Idle Average * (dB) | 29 | 32.2 -11% | 37.6 -30% | 30.3 -4% | 29 -0% | 34 -17% |
| Idle Maximum * (dB) | 29 | 32.3 -11% | 37.7 -30% | 30.3 -4% | 29 -0% | 35 -21% |
| Load Average * (dB) | 36 | 43 -19% | 39.3 -9% | 42.2 -17% | 32 11% | 42 -17% |
| Witcher 3 ultra * (dB) | 42 | 40.6 3% | 44 -5% | |||
| Load Maximum * (dB) | 49.4 | 43.2 13% | 44 11% | 55.7 -13% | 40.1 19% | 46 7% |
* ... Moindre est la valeur, meilleures sont les performances
| Éteint/en veille | |
| Au repos | |
| Fortement sollicité |
|
Légende:
min: | |
| Intel Hades Canyon NUC8i7HVK i7-8809G, Vega M GH, Intel Optane 120 GB SSDPEK1W120GA, , x, | Zotac ZBOX Magnus EN51050 i5-7500T, GeForce GTX 1050 Mobile, Samsung SSD 960 Pro 512 GB m.2, , x, | Razer Blade (2017) UHD i7-7700HQ, GeForce GTX 1060 Mobile, Samsung PM961 NVMe MZVLW512HMJP, IPS, 3840x2160, 14" | Intel Skull Canyon NUC6i7KYK 6770HQ, Iris Pro Graphics 580, Samsung SSD 850 EVO m.2 120GB, , x, 0" | Asus Strix GL502VY-DS71 6700HQ, GeForce GTX 980M, SanDisk SD8SN8U1T001122, IPS, 1920x1080, 15.6" | Asus FX503VM-EH73 i7-7700HQ, GeForce GTX 1060 Mobile, SanDisk SD8SN8U128G1002, IPS, 1920x1080, 15.6" | |
|---|---|---|---|---|---|---|
| Power Consumption | -12% | 15% | 22% | -33% | 10% | |
| Idle Minimum * (Watt) | 15.5 | 21.1 -36% | 8.1 48% | 14.8 5% | 20.6 -33% | 12.8 17% |
| Idle Average * (Watt) | 16.2 | 22.1 -36% | 14.3 12% | 15.7 3% | 22.1 -36% | 15.4 5% |
| Idle Maximum * (Watt) | 16.5 | 26.6 -61% | 16.3 1% | 15.8 4% | 22.5 -36% | 15.9 4% |
| Load Average * (Watt) | 83.4 | 77.5 7% | 74 11% | 62.7 25% | 130.6 -57% | 78 6% |
| Witcher 3 ultra * (Watt) | 121.7 | 92.4 24% | 107.3 12% | |||
| Load Maximum * (Watt) | 173.5 | 121.7 30% | 164 5% | 48.5 72% | 177.2 -2% | 143.4 17% |
* ... Moindre est la valeur, meilleures sont les performances
Points positifs
Points négatifs
Vu de l’extérieur, le NUC Hades Canyon ressemble à une évolution terne et mineure du Skull Canyon de 2016. En termes de performances, on ne pourrait être plus éloigné de la vérité. Intel a corrigé tout ce que nous n’aimions pas dans le Skull Canyon, permettant une bien meilleure expérience globale. Le ventilateur est plus silencieux, les températures internes mieux maîtrisées, et les performances de jeu supérieures à ce que la série Iris est capable de fournir, au point de rivaliser avec les portables de jeu équipés d’une GTX 1050 Ti ou d’une GTX 1060. Non seulement le Kaby Lake G est plus fonctionnel que n’importe quel APU AMD Fusion mobile, mais il démarre sur les chapeaux de roue, en tenant ses promesses dès les premiers essais.
Son plus gros point faible est peut-être le moins bon rapport performances / watt du Core i7-8809G par rapport à une GTX 1060 équivalente. Le NUC nécessite plus de puissance qu’un portable de jeu de 15,6 pouces équipé d’un CPU HQ de 7e génération, et de cartes graphique GTX 1060 ou GTX 1060 Max-Q, même avant de prendre en compte l’écran et le clavier que n’a pas le NUC. Cela souligne la situation des GPU Vega 56/64, qui ont des performances par watt inférieures que leurs alternatives Pascal. En d’autres termes, toute cette puissance si compact se fait au prix d’une consommation énergétique plus élevée que prévu.
Le prix de vente conseillé de 1 000 $ pourrait en rebuter plus d’un. Le NUC ne possède pas de RAM, ni de stockage, ni d’OS, si bien qu’il faut investir encore plus pour avoir un système fonctionnel. Par contraste, un portable de jeu avec une GTX 1050 TI ou une GTX 1060 peut être trouvé pour 1 000 - 1 200 $, avec RAM, stockage, OS, écran, etc. Les utilisateurs prêts à acheter le NUC Intel passeront à la caisse pour avoir un appareil de taille réduite et un processeur dernier cri.
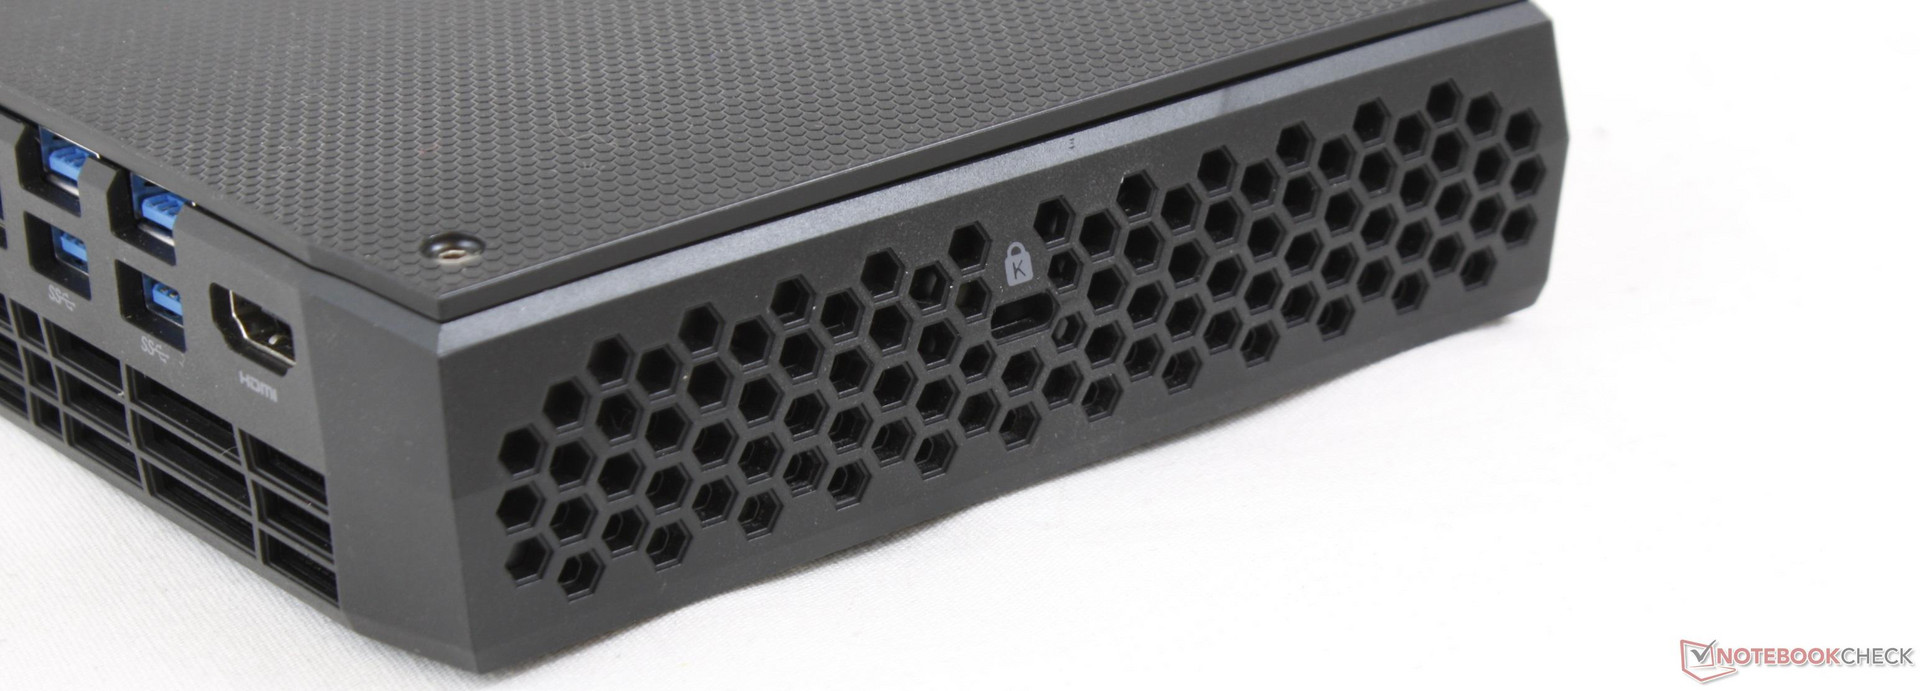
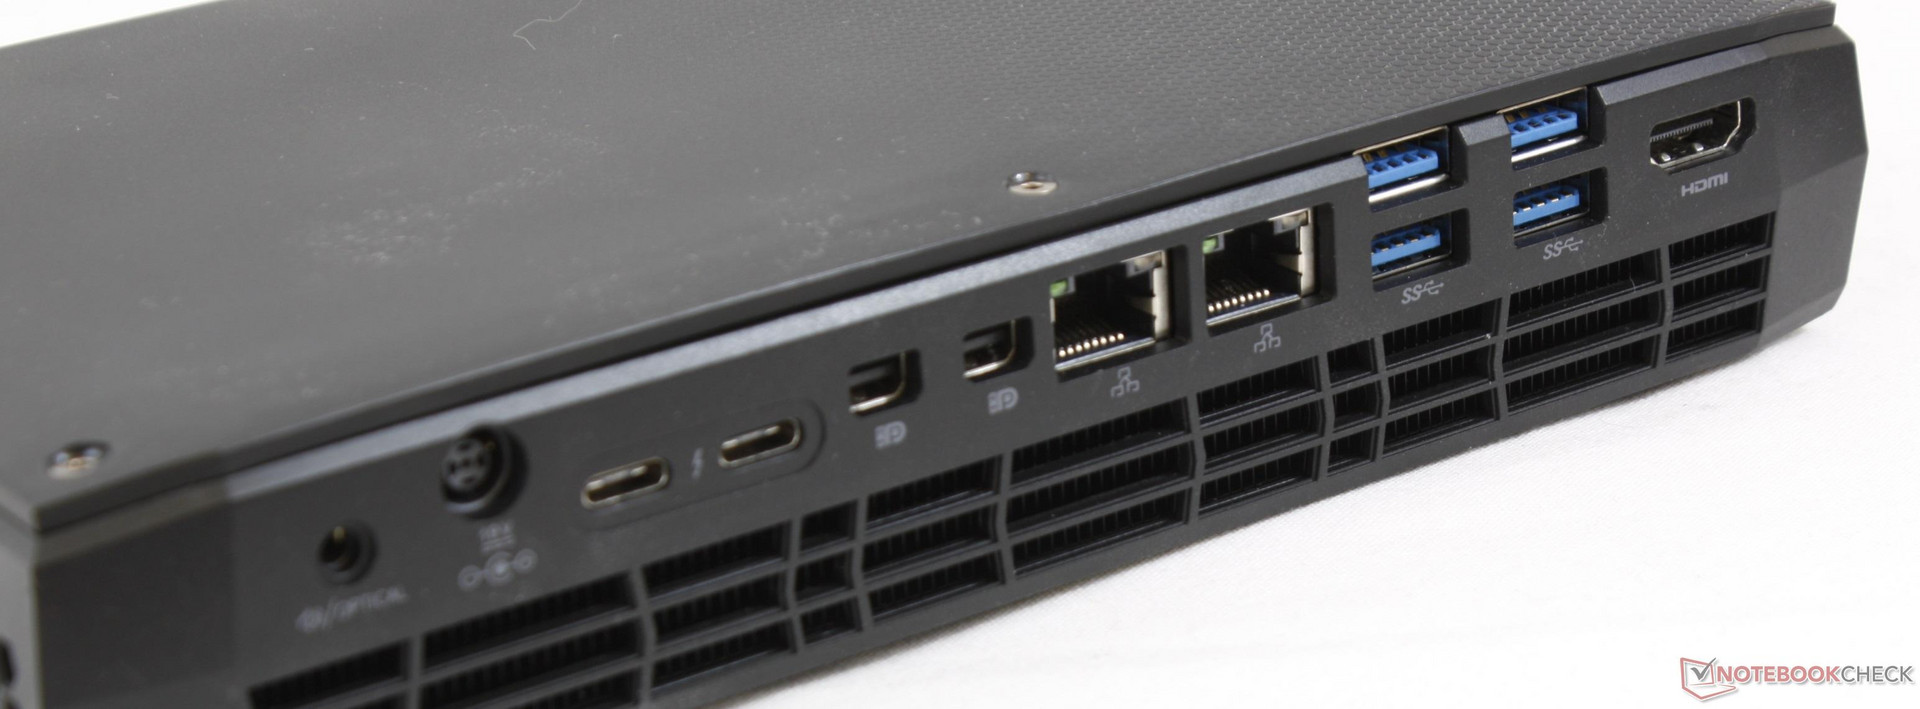
Les autres points faibles de la machine sont d’après nous moins gênants. Les températures internes pourraient être moins élevées, le GPU et / ou le CPU pouvant monter à 85 – 99 °C sans overclocking. Les performances moyennes du lecteur de carte, les ports USB à l’envers, les vibrations du ventilateur en jeu, et le gros adaptateur secteur complètent notre liste des inconvénients mineurs.
Il ne s’agit pas là du mini PC le plus puissant qui soit, n’importe quel NUC équivalent avec GTX 1060 pouvant avoir un bon rapport qualité – prix. Pour la nouvelle plateforme Kaby Lake G, il s’agit néanmoins d’un bon départ, qui, nous l’espérons, fera des émules parmi les mini PC et PC portables à venir. Nous sommes juste impatients de voir les prix baisser, pour avoir des coûts plus compétitifs par rapport aux puces Pascal de Nvidia.
L’intégralité de cette critique est disponible en anglais en suivant ce lien.
Price comparison
