Test du mini PC Beelink SER4 : le Zen 2 d'AMD donne du fil à retordre au NUC Intel
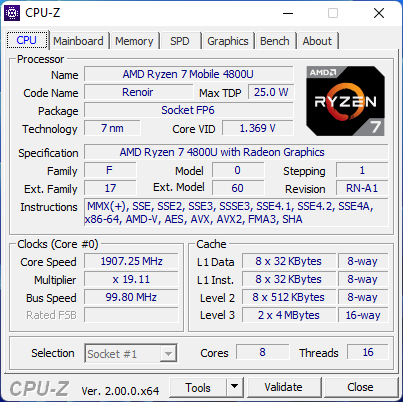
La SER4 succède directement à la SER3 de l'année dernière en remplaçant l'ancien processeur Zen+ par un processeur Zen 2 plus récent. En particulier, le SER4 utilise le très rapide et relativement peu commun Ryzen 7 4800U qui est malheureusement dans très peu d'autres produits.
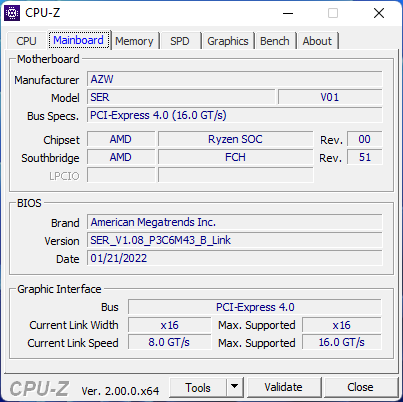
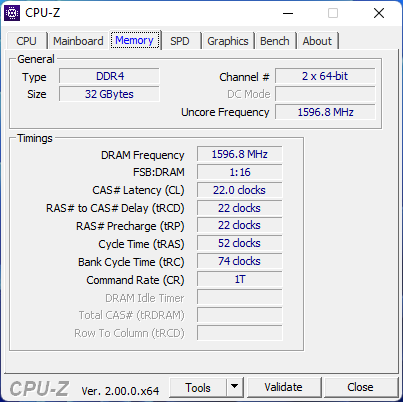
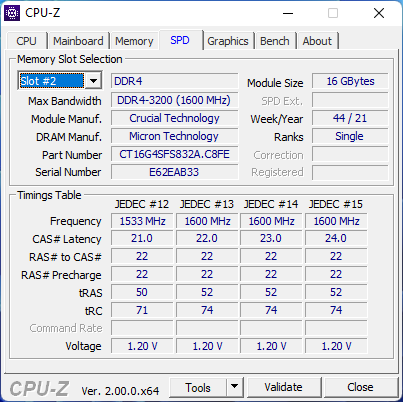
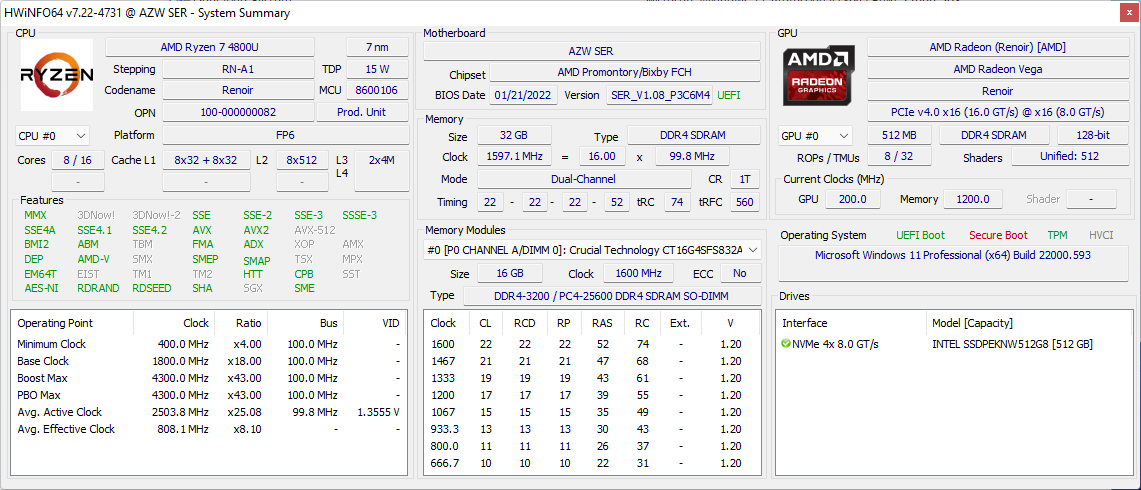
Notre configuration est livrée avec le CPU Ryzen 7 4800U, 32 Go de RAM DDR4-3200 et un SSD NVMe de 512 Go pour 650 USD. Un SKU inférieur avec la moitié de la RAM est disponible pour 50 $ de moins. Les utilisateurs intéressés par une version Intel devraient plutôt se tourner vers la série Beelink SEI. Le SER4 est en concurrence directe avec la série Intel NUC ainsi qu'avec d'autres mini-PC équipés de processeurs de la série U
Plus de commentaires sur Beelink
Comparaison avec les concurrents potentiels
Note | Date | Modèle | Poids | Épaisseur | Taille | Résolution | Prix |
|---|---|---|---|---|---|---|---|
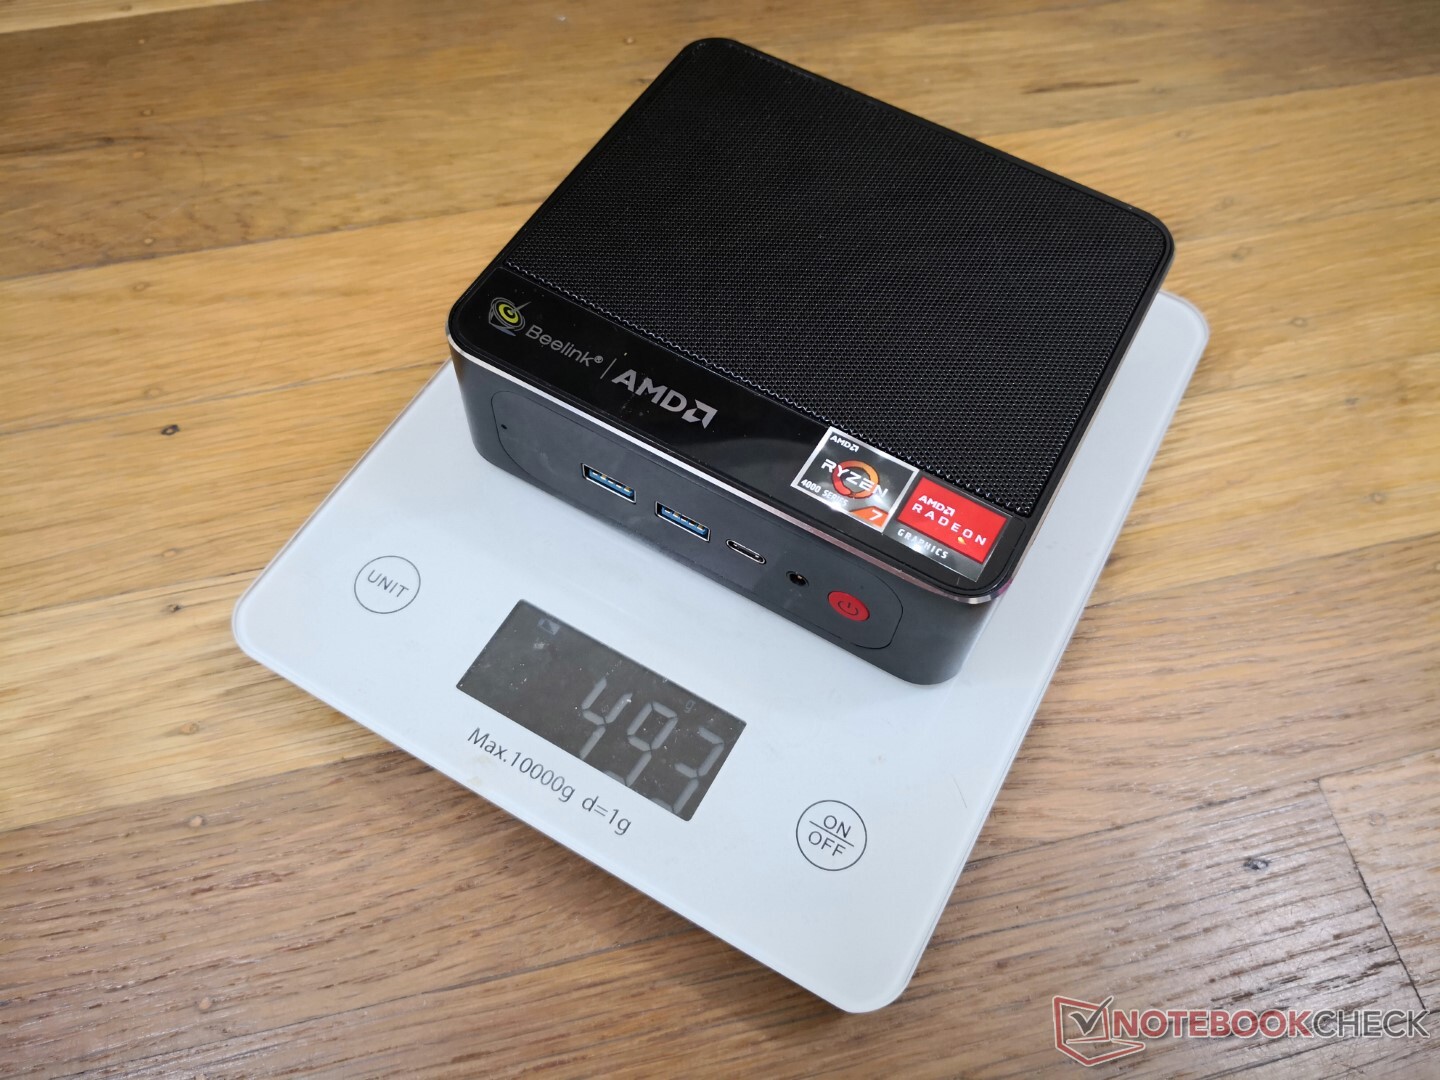
v (old) | 04/22 | Beelink SER4 R7 4800U, Vega 8 | 494 g | 40 mm | x | ||
v (old) | 02/22 | GMK NucBox 3 Celeron J4125, UHD Graphics 600 | 410 g | 32.5 mm | x | ||
v (old) | 01/22 | Beelink GTR5 R9 5900HX, Vega 8 | 686 g | 39 mm | x | ||
v (old) | 02/21 | Intel NUC11PAQi7 i7-1165G7, Iris Xe G7 96EUs | 647 g | 56 mm | x | ||
v (old) | 11/21 | Beelink SER3 R7 3750H, Vega 10 | 492 g | 40 mm | x | ||
v (old) | 02/20 | Intel NUC10i5FNK i5-10210U, UHD Graphics 620 | 493 g | 36 mm | 0.00" | 0x0 |
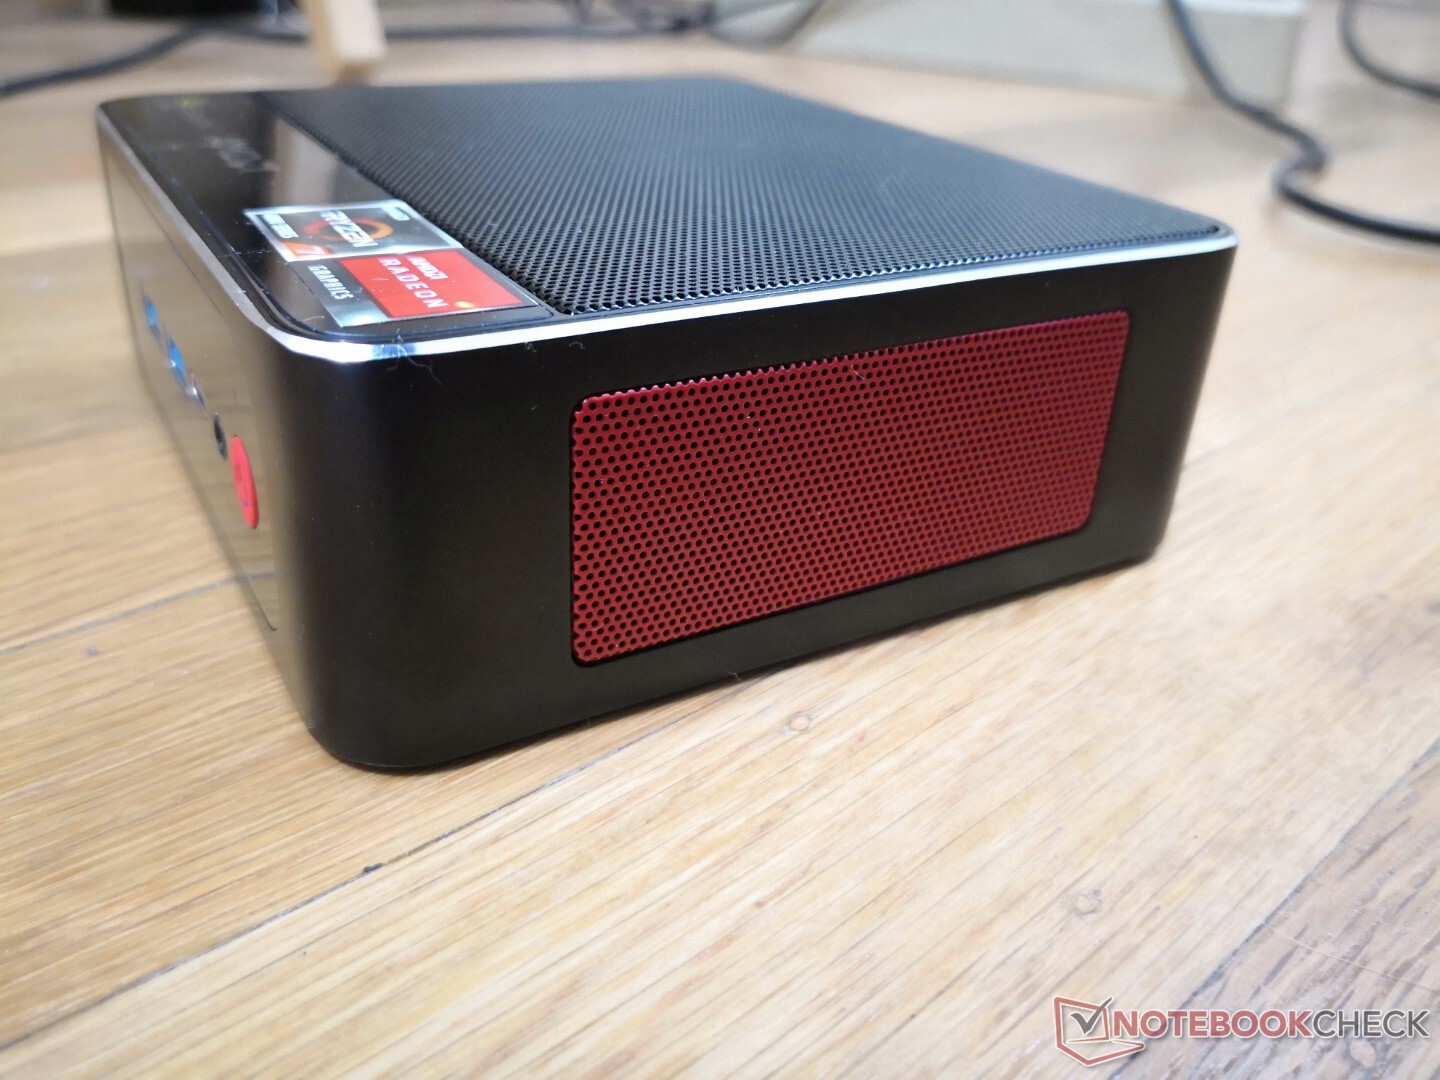
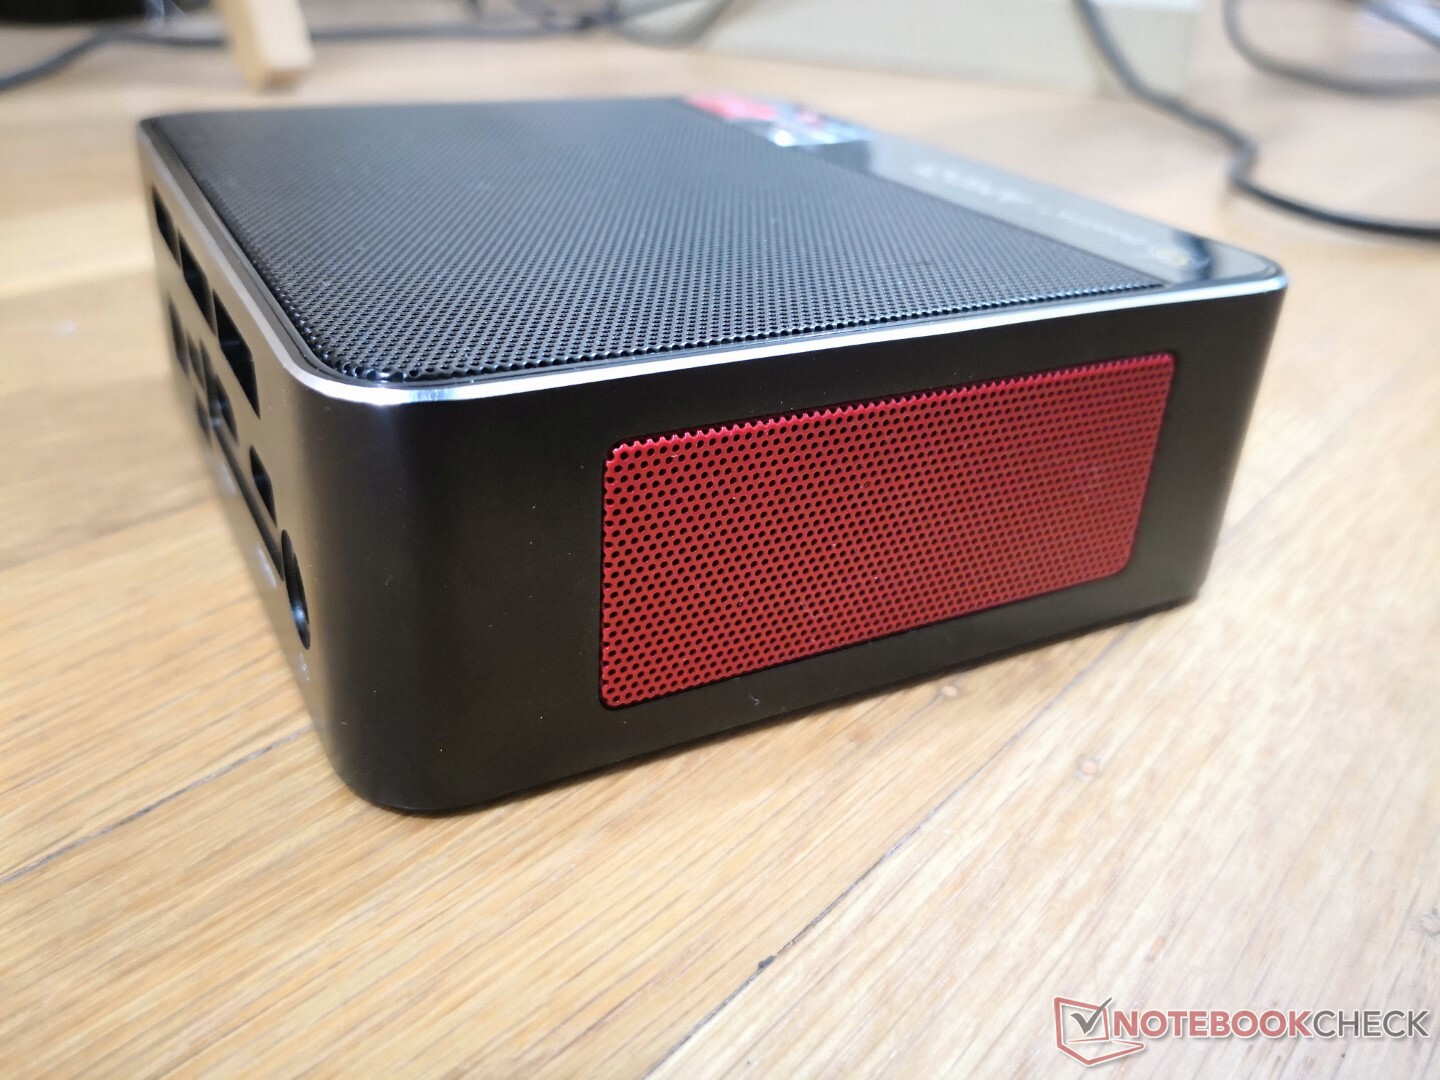
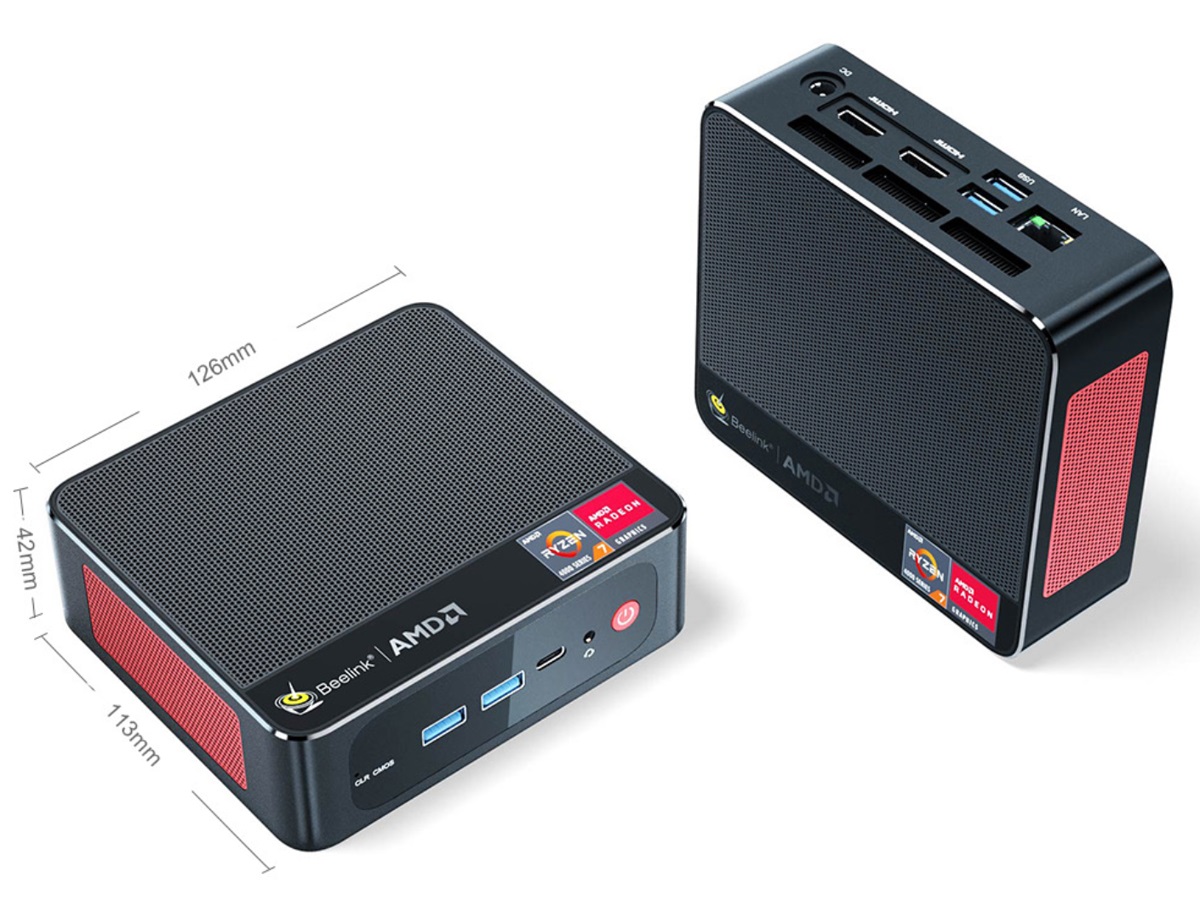
Cas - Beaucoup de grilles d'aération
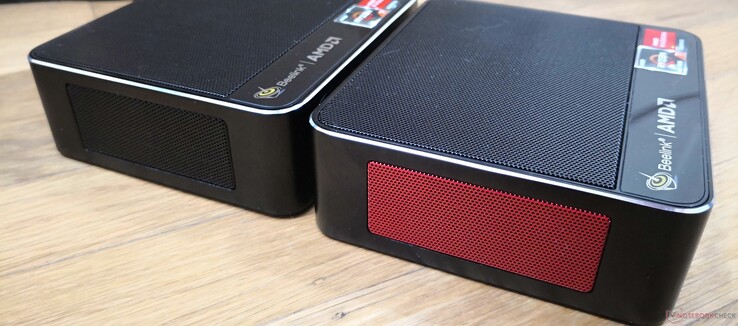
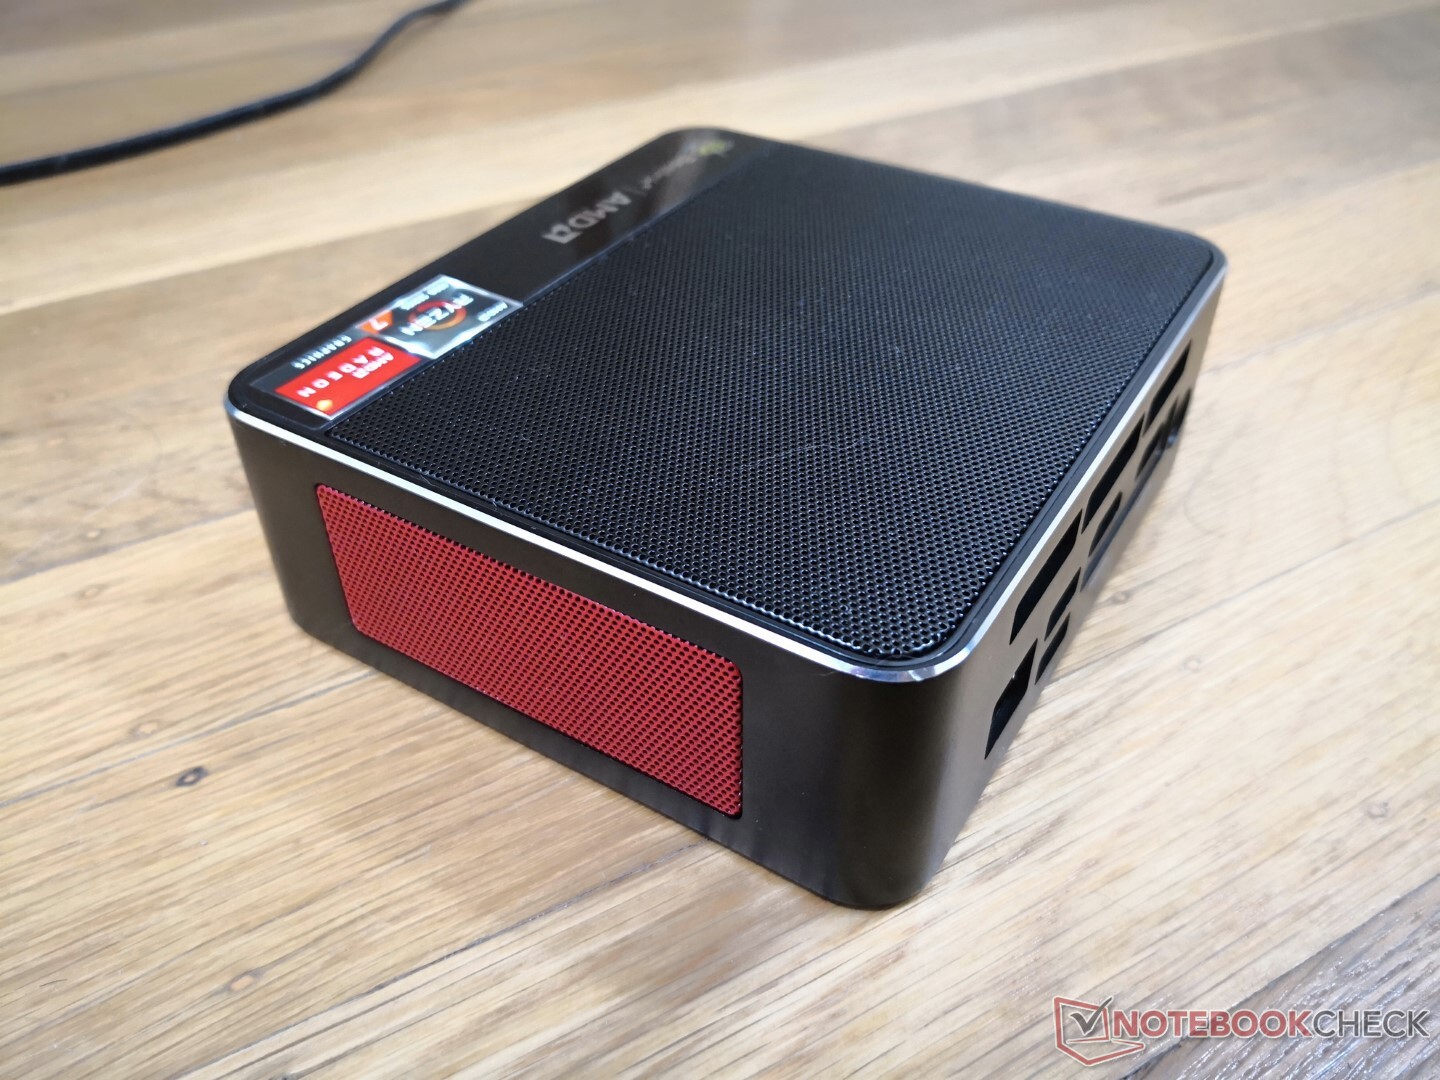
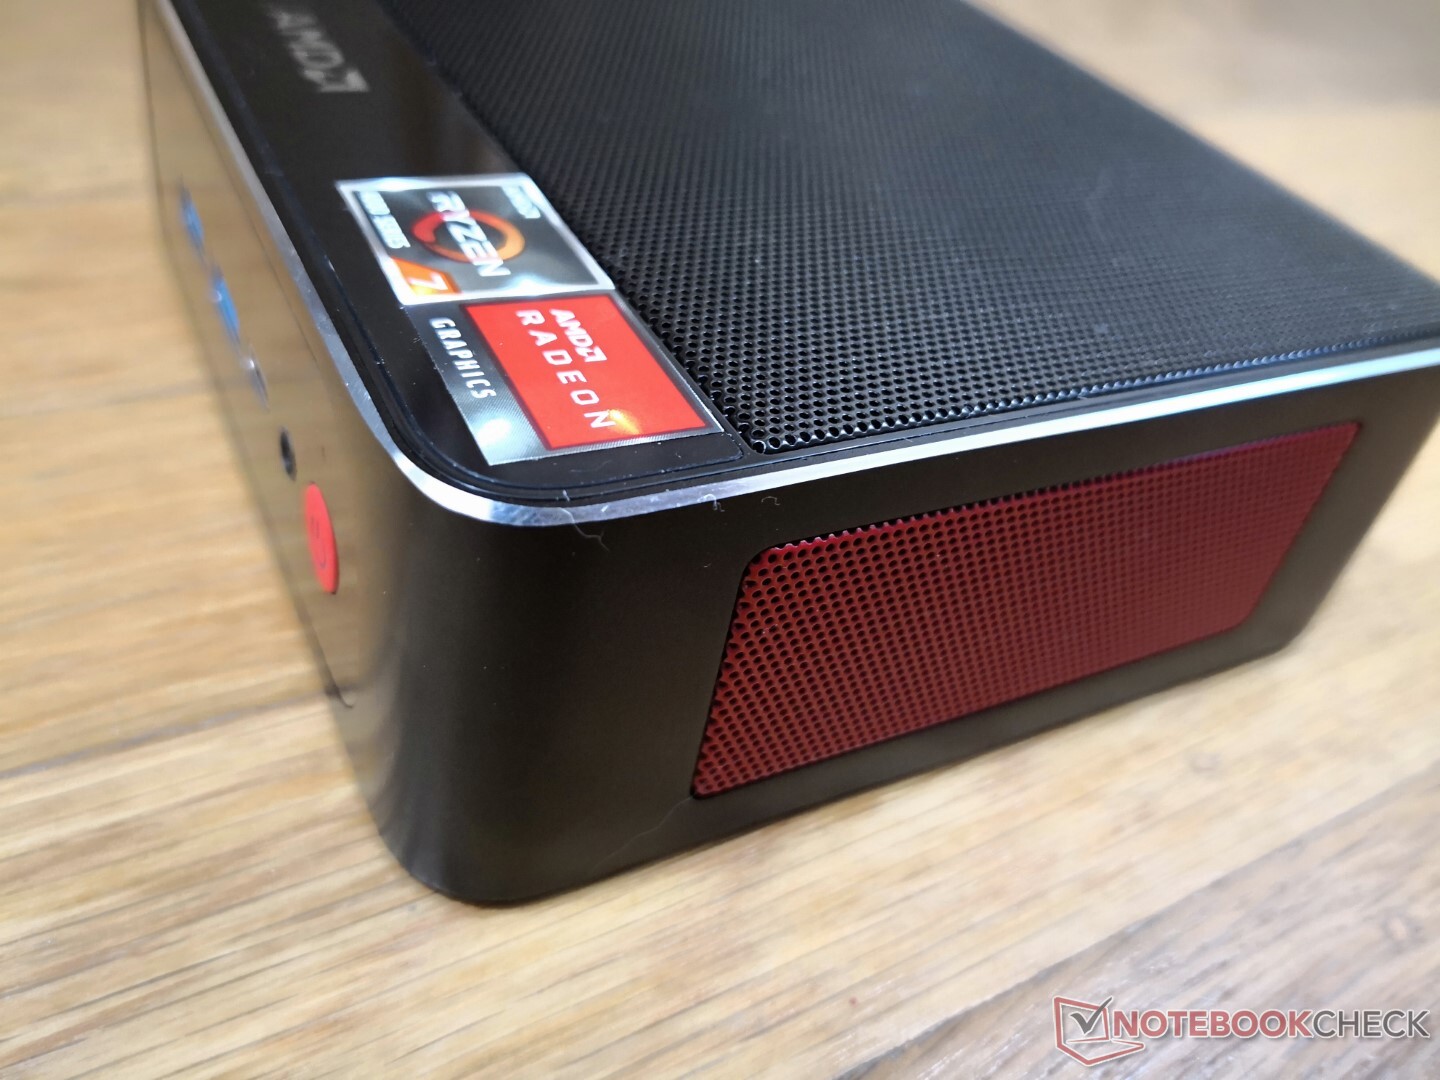
Le SER4 utilise le même châssis que le SER3 mais avec un changement superficiel. Plus précisément, les grilles situées sur les côtés de l'unité sont désormais rouges au lieu de noires, en hommage au CPU AMD qu'il contient.
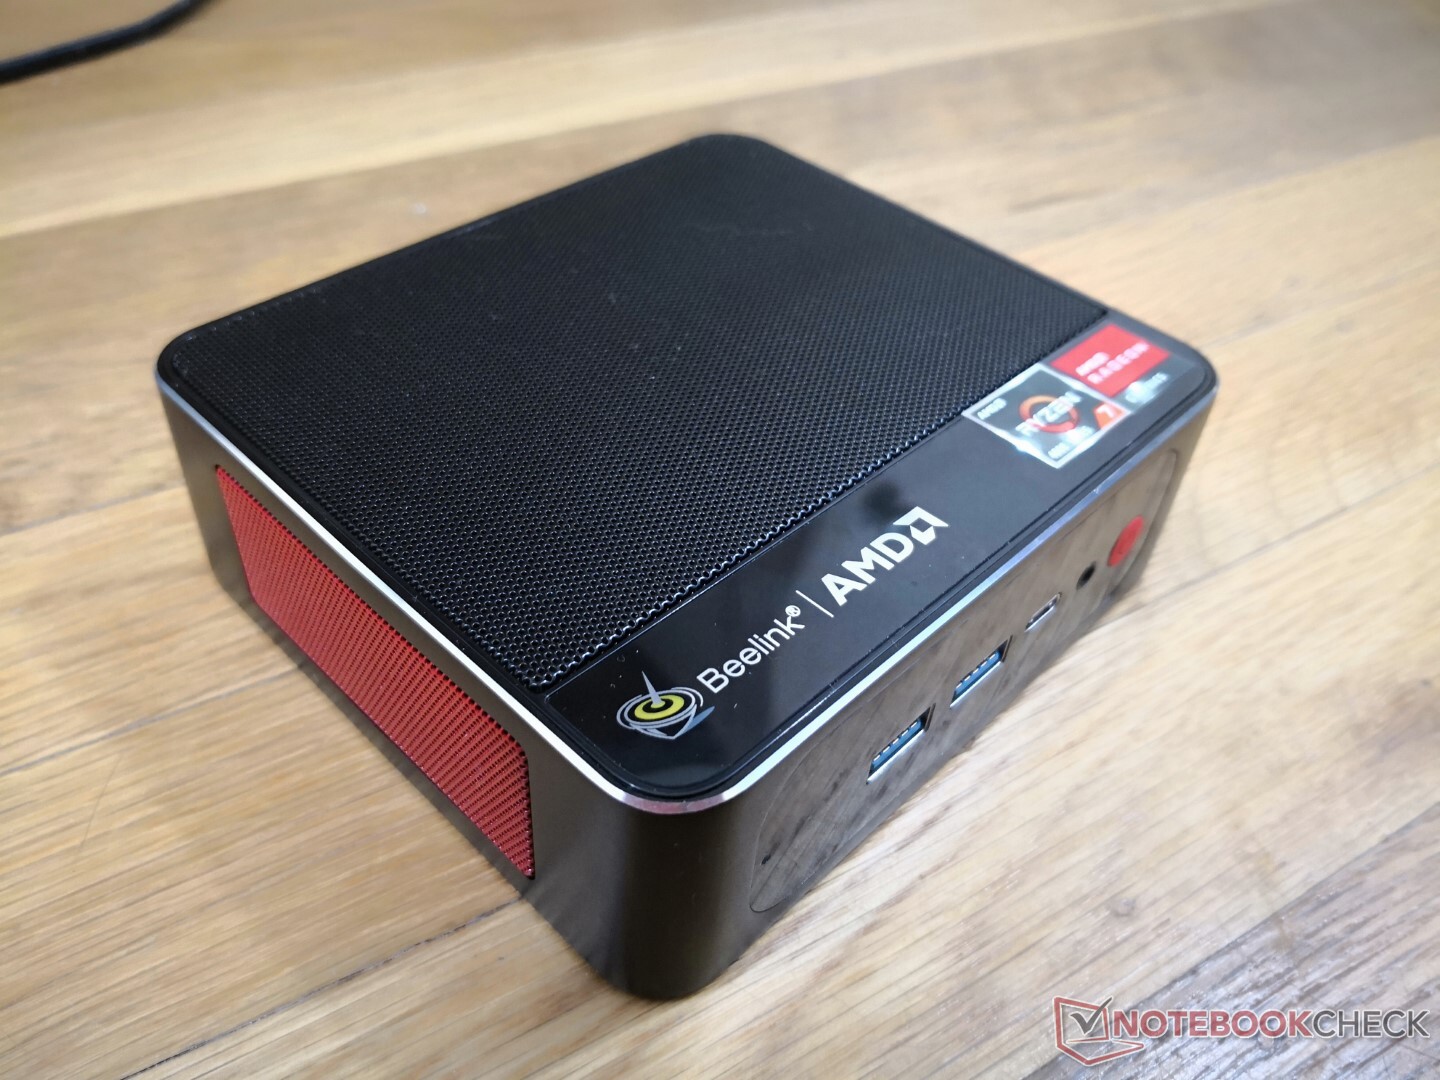
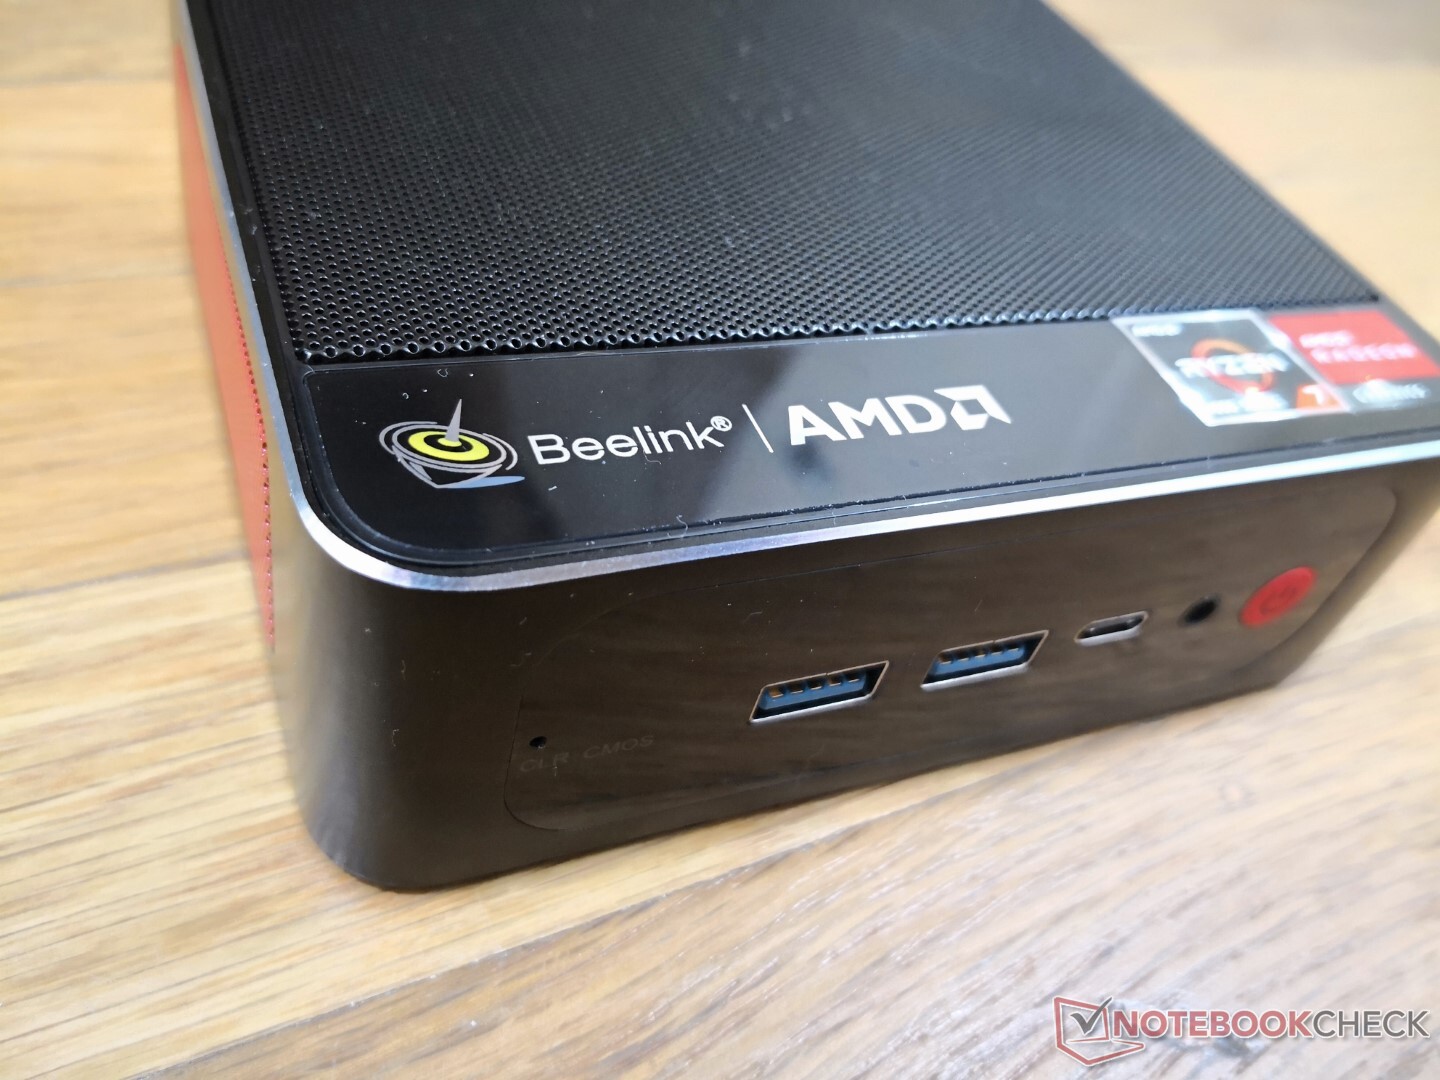
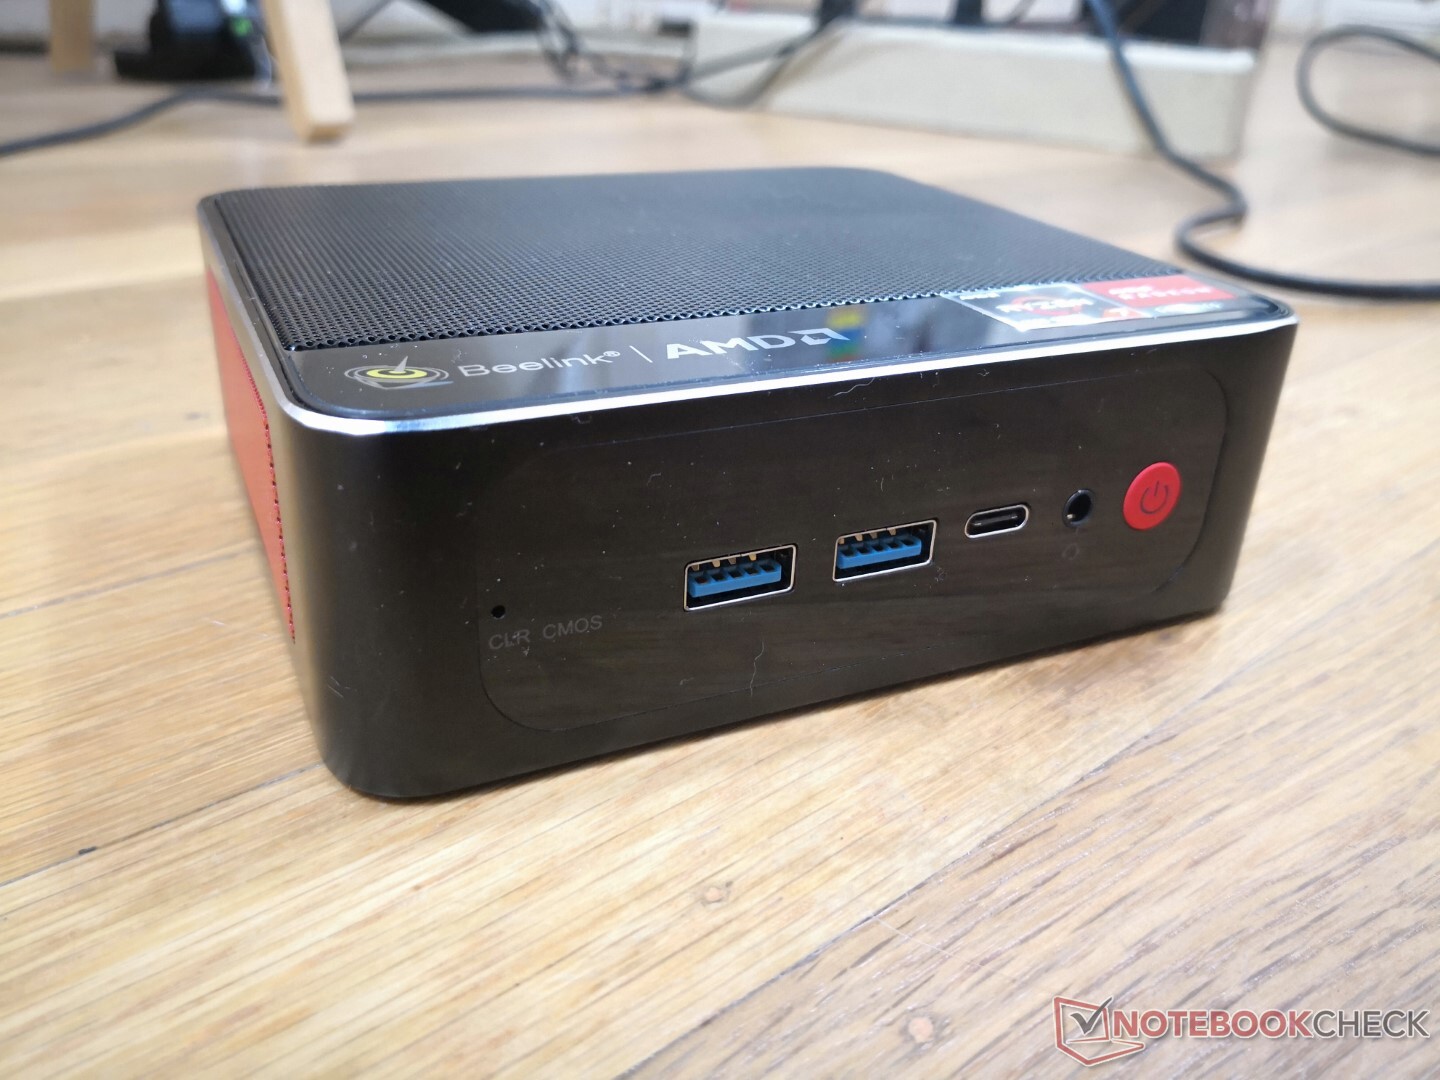
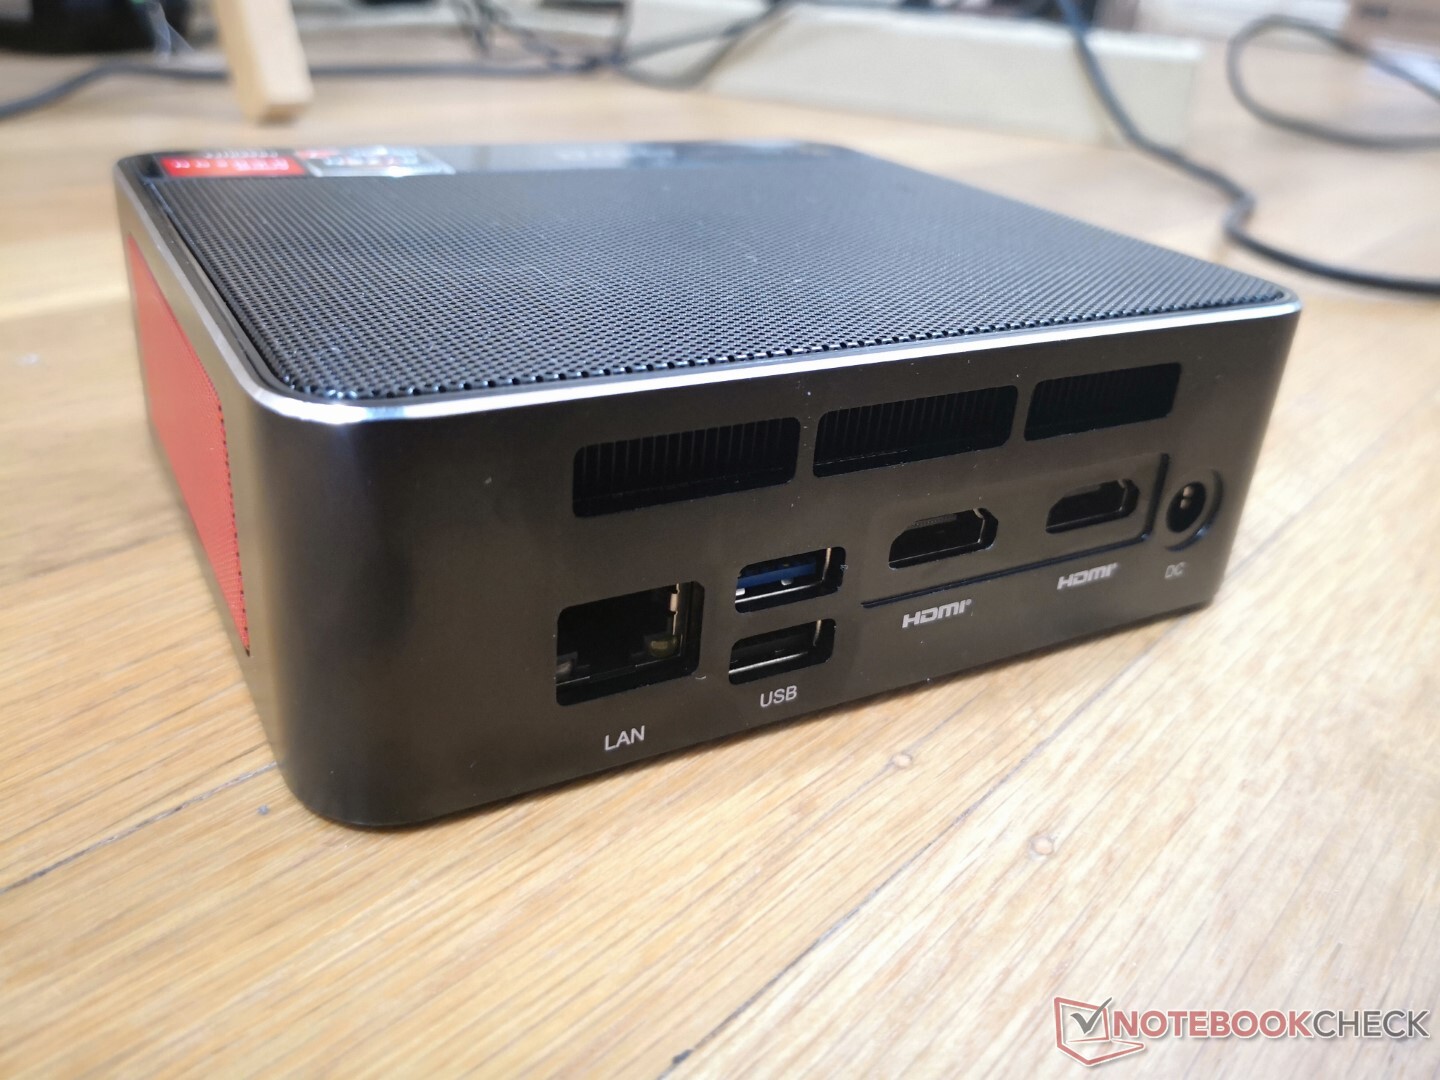
Connectivité - Pas de support Thunderbolt
Les options de port sont identiques à ce qui était proposé sur la SER3. Notez qu'il est possible d'alimenter le SER4 avec certains adaptateurs secteur USB-C si les propriétaires perdent le câble adaptateur secteur propriétaire en forme de barillet fourni dans la boîte.
Communication
| Networking | |
| iperf3 transmit AX12 | |
| Beelink SER4 | |
| Beelink GTR5 | |
| Intel NUC11PAQi7 | |
| Beelink SER3 | |
| GMK NucBox 3 | |
| iperf3 receive AX12 | |
| Beelink SER4 | |
| Intel NUC11PAQi7 | |
| Beelink GTR5 | |
| GMK NucBox 3 | |
| Beelink SER3 | |
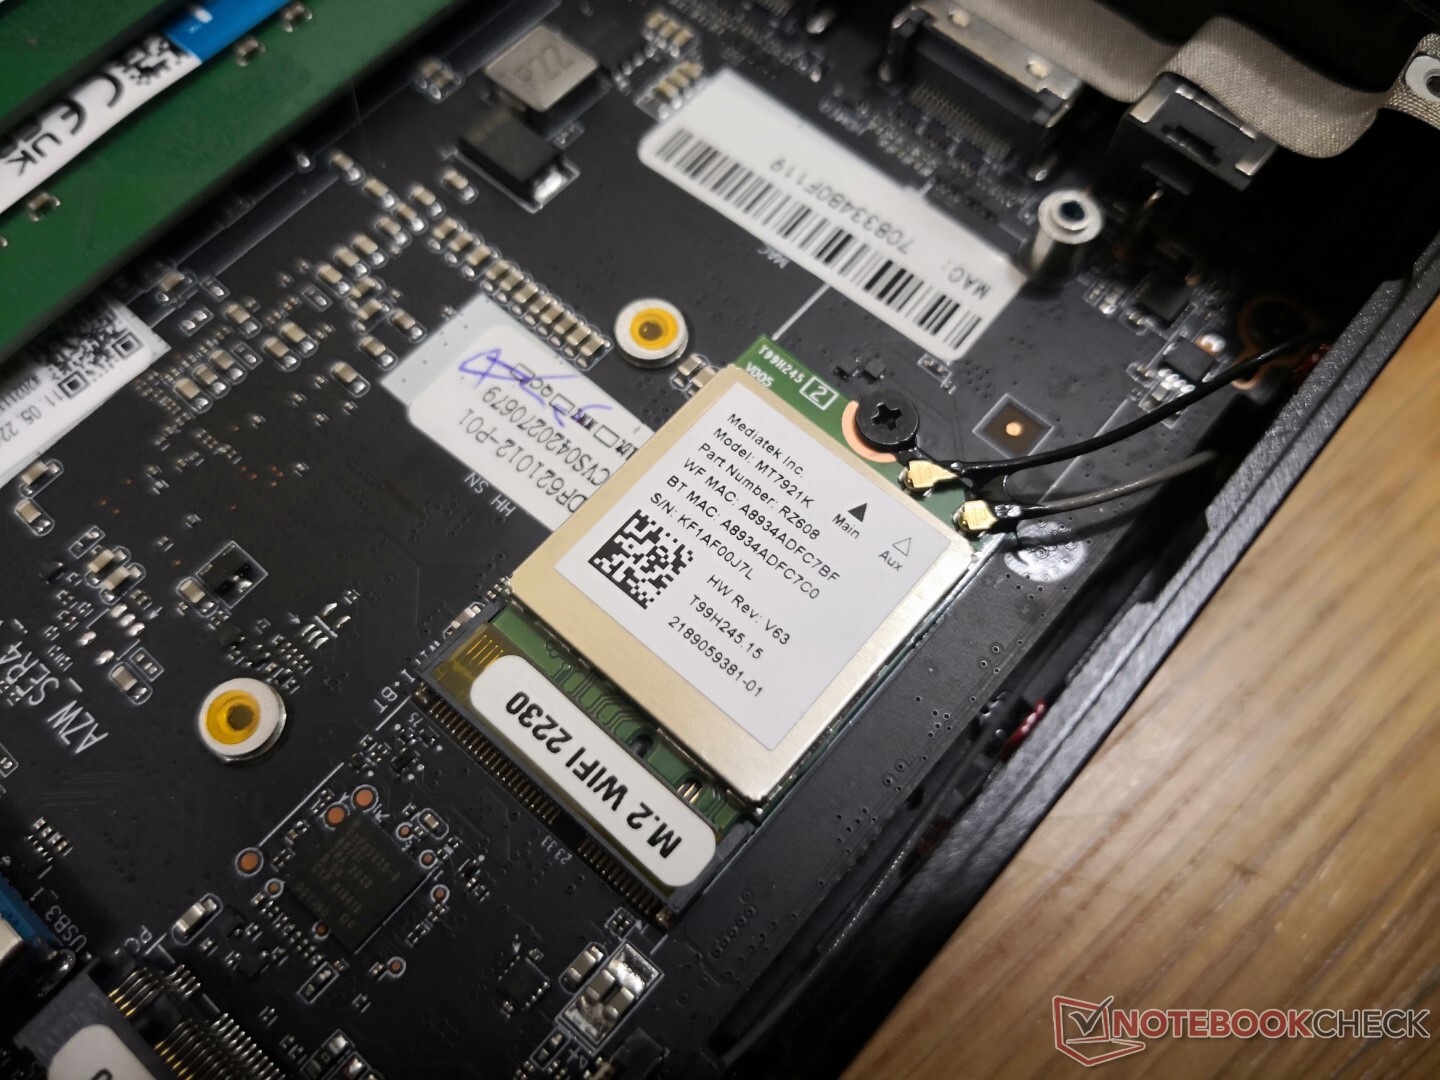
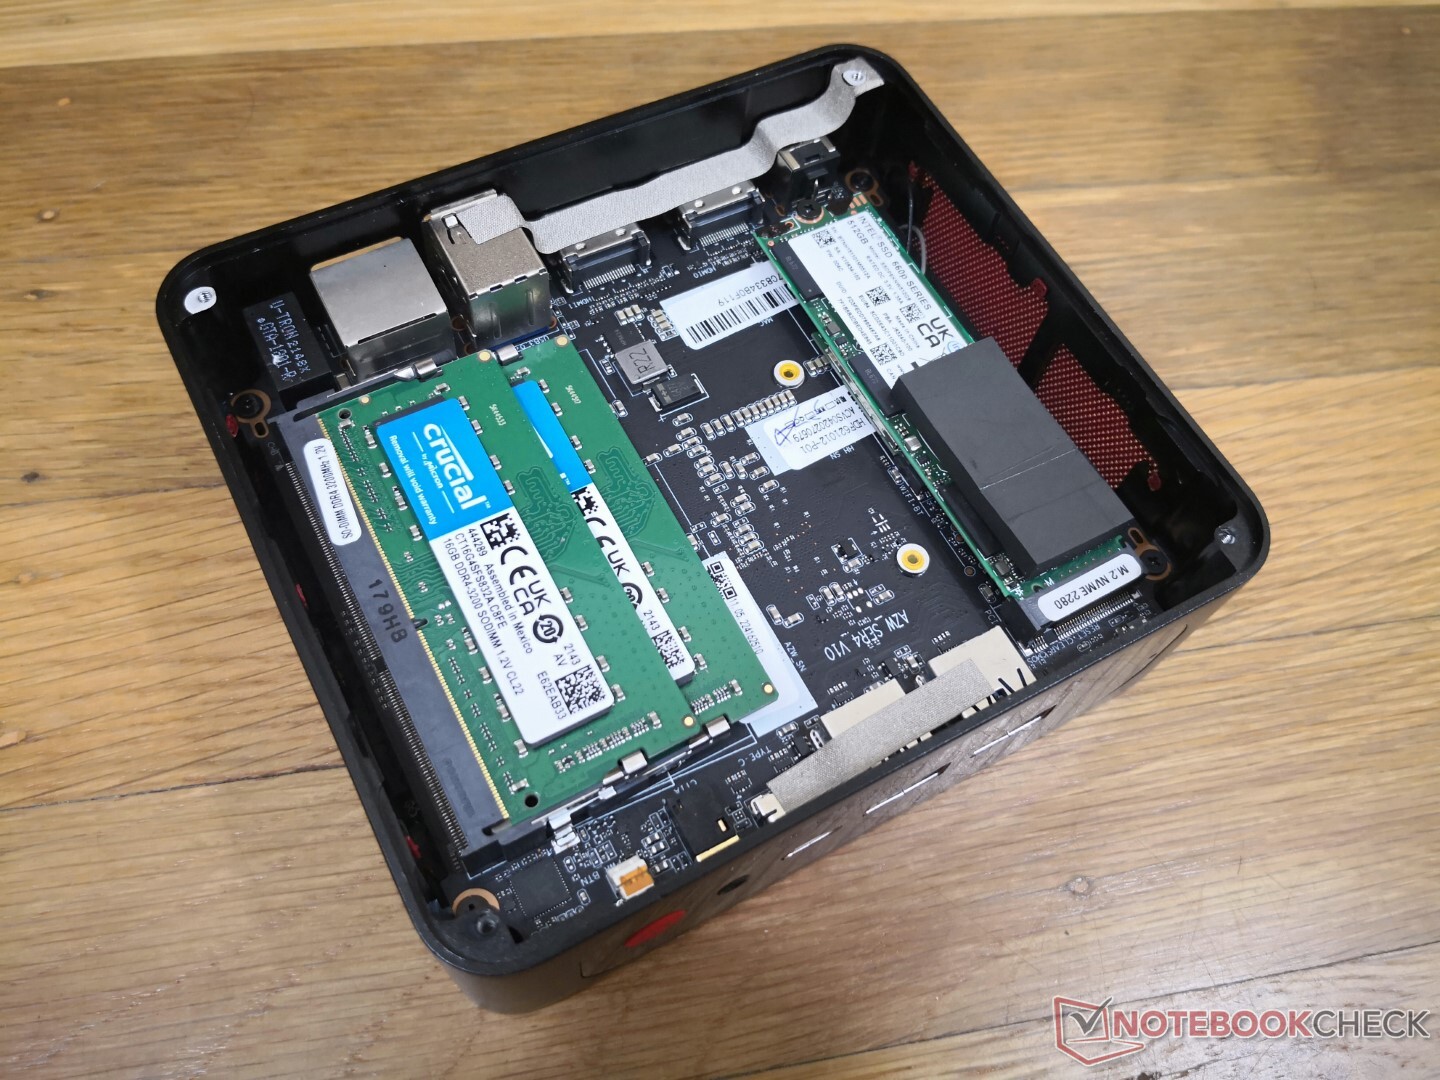
Maintenance
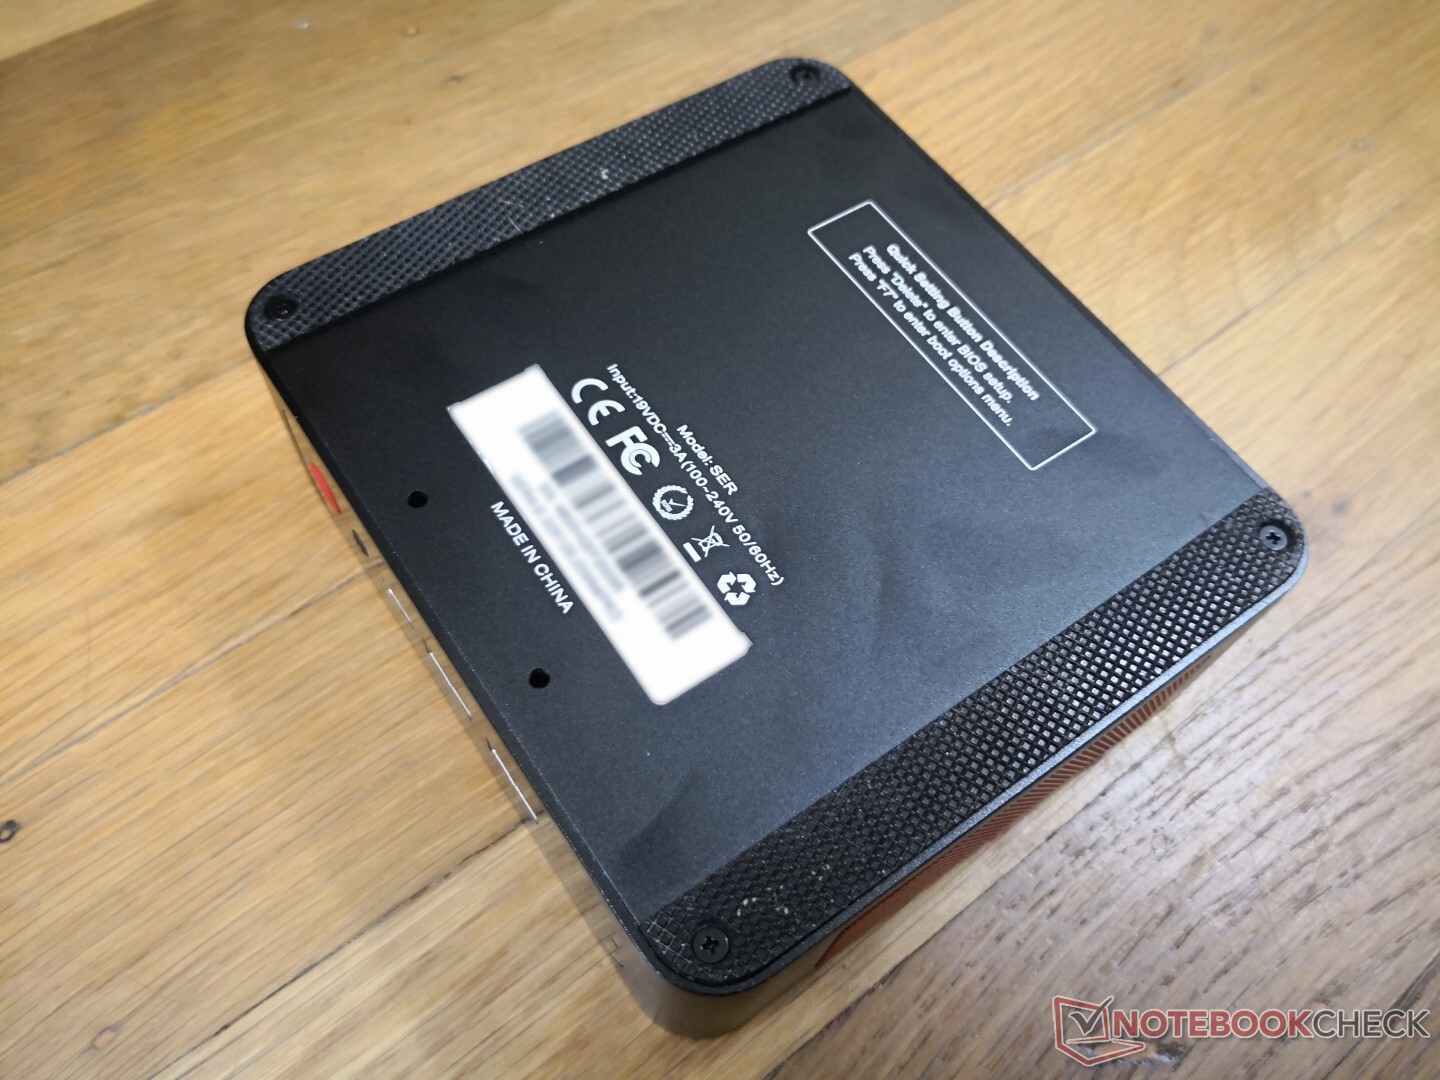
Le panneau inférieur est fixé par quatre vis Philips, comme sur la SER3. Cependant, le panneau de notre unité SER4 était coincé et difficile à retirer même après avoir dévissé toutes les vis. Nous recommandons de fixer la plaque de montage comme un ancrage pour saisir et retirer plus facilement la plaque inférieure.
Il est intéressant de noter que la batterie du BIOS est absente sur le SER4 alors qu'elle était présente sur notre SER3. Il est possible que le fabricant ait déplacé la batterie de l'autre côté de la carte mère pour cette génération.
Accessoires et garantie
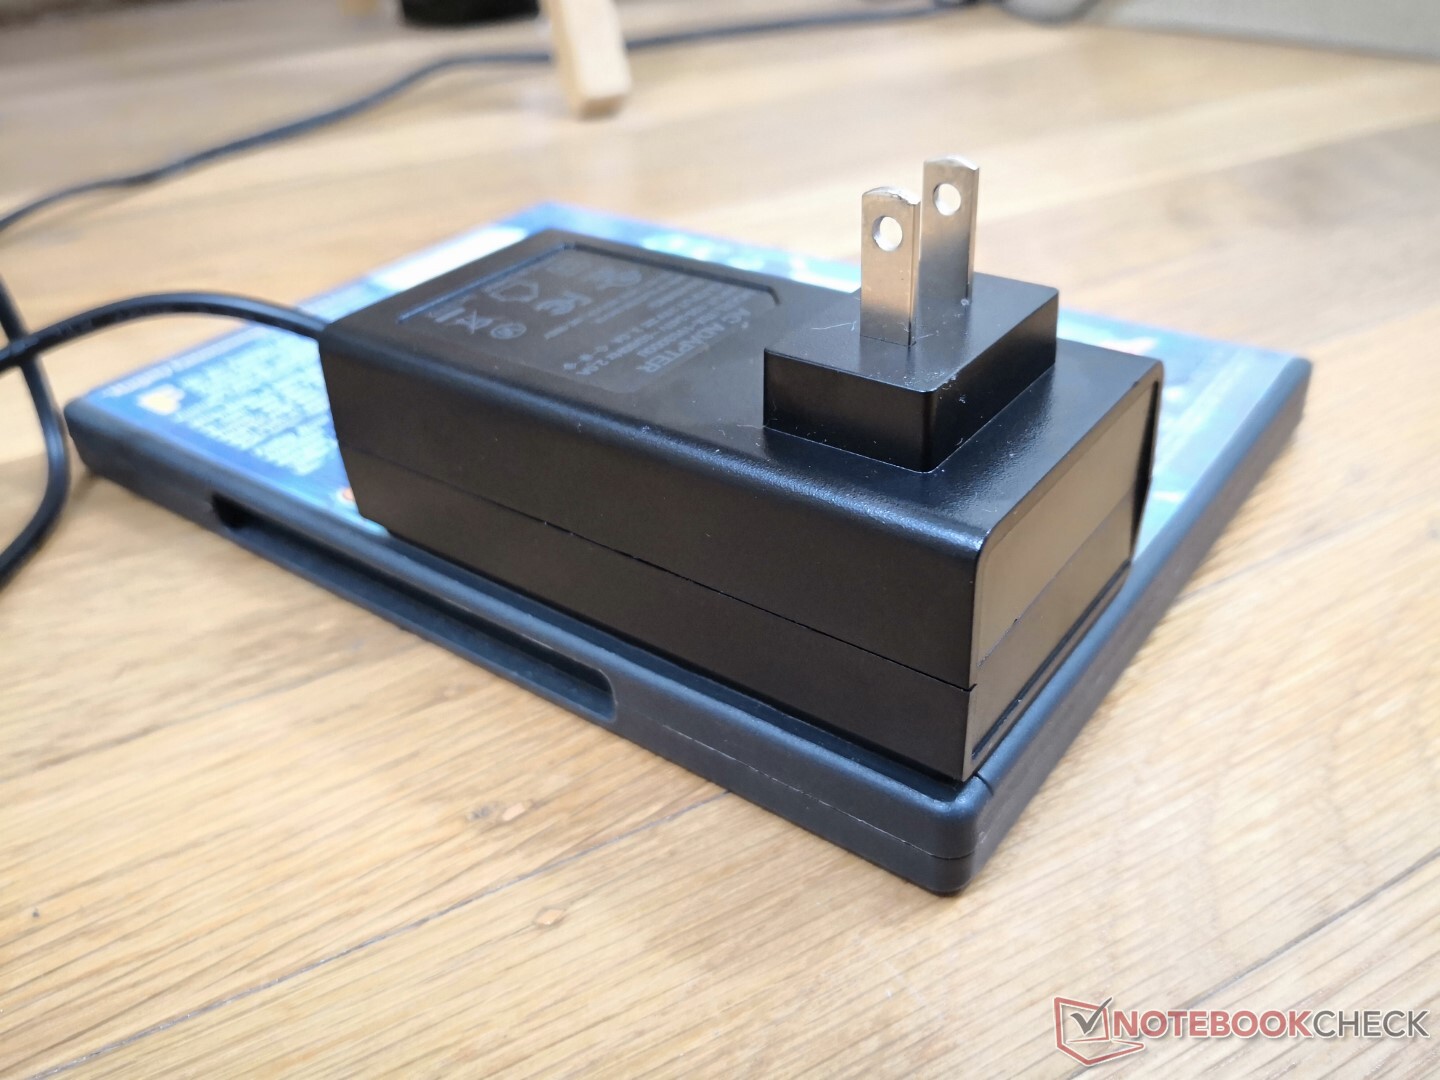
La boîte de détail comprend un support mural VESA amovible, un adaptateur secteur, deux câbles HDMI courts et un manuel. La garantie standard limitée du fabricant est d'un an, contre trois ans pour la plupart des systèmes Intel NUC.
Performances - Plus rapide que la plupart des mini-PC de la série U
Conditions d'essai
Notre appareil a été réglé en mode Performance via Windows avant d'effectuer les tests de performance ci-dessous.
Processeur - CPU U-Series 8-Core 16-Threads
La performance du processeur est l'une des plus rapides de tous les mini-PC équipés d'un processeur de la série U et constitue une amélioration majeure par rapport à l'ancien processeur Ryzen 7-3750H dans le SER3. Le système ne présente pas de comportement d'étranglement majeur, comme le montrent les résultats de notre test en boucle CineBench R15 xT ci-dessous. Cela permet en fait au Ryzen 7 4800U dans notre Beelink de surpasser le plus récent Ryzen 7 5800U dans le ThinkPad 13s.
Les performances en mode Single-Thread sont médiocres mais restent très bonnes dans l'ensemble, avec des résultats proches de ceux du Core i5-1135G7.
Cinebench R15 Multi Loop
Cinebench R23: Multi Core | Single Core
Cinebench R15: CPU Multi 64Bit | CPU Single 64Bit
Blender: v2.79 BMW27 CPU
7-Zip 18.03: 7z b 4 | 7z b 4 -mmt1
Geekbench 5.5: Multi-Core | Single-Core
HWBOT x265 Benchmark v2.2: 4k Preset
LibreOffice : 20 Documents To PDF
R Benchmark 2.5: Overall mean
| Cinebench R20 / CPU (Multi Core) | |
| Beelink GTR5 | |
| Beelink SER4 | |
| Moyenne AMD Ryzen 7 4800U (2943 - 3306, n=4) | |
| Lenovo ThinkBook 13s G3 20YA0005GE | |
| Intel NUC11PAQi7 | |
| Intel NUC11TNKi5 | |
| Intel NUC10i5FNK | |
| Beelink SER3 | |
| Infinix INBook X2 | |
| GMK NucBox 3 | |
| Cinebench R20 / CPU (Single Core) | |
| Intel NUC11PAQi7 | |
| Beelink GTR5 | |
| Lenovo ThinkBook 13s G3 20YA0005GE | |
| Intel NUC11TNKi5 | |
| Beelink SER4 | |
| Moyenne AMD Ryzen 7 4800U (474 - 488, n=4) | |
| Intel NUC10i5FNK | |
| Infinix INBook X2 | |
| Beelink SER3 | |
| GMK NucBox 3 | |
| Cinebench R23 / Multi Core | |
| Beelink GTR5 | |
| Moyenne AMD Ryzen 7 4800U (7558 - 9762, n=3) | |
| Beelink SER4 | |
| Lenovo ThinkBook 13s G3 20YA0005GE | |
| Intel NUC11PAQi7 | |
| Intel NUC11TNKi5 | |
| Beelink SER3 | |
| Infinix INBook X2 | |
| GMK NucBox 3 | |
| Cinebench R23 / Single Core | |
| Beelink GTR5 | |
| Lenovo ThinkBook 13s G3 20YA0005GE | |
| Intel NUC11TNKi5 | |
| Beelink SER4 | |
| Moyenne AMD Ryzen 7 4800U (1231 - 1240, n=3) | |
| Infinix INBook X2 | |
| Beelink SER3 | |
| GMK NucBox 3 | |
| Cinebench R15 / CPU Multi 64Bit | |
| Beelink GTR5 | |
| Lenovo ThinkBook 13s G3 20YA0005GE | |
| Lenovo ThinkBook 13s G3 20YA0005GE | |
| Moyenne AMD Ryzen 7 4800U (1281 - 1639, n=3) | |
| Beelink SER4 | |
| Intel NUC11PAQi7 | |
| Intel NUC11TNKi5 | |
| Intel NUC10i5FNK | |
| Beelink SER3 | |
| Infinix INBook X2 | |
| GMK NucBox 3 | |
| Cinebench R15 / CPU Single 64Bit | |
| Beelink GTR5 | |
| Intel NUC11PAQi7 | |
| Lenovo ThinkBook 13s G3 20YA0005GE | |
| Intel NUC11TNKi5 | |
| Beelink SER4 | |
| Moyenne AMD Ryzen 7 4800U (182 - 187, n=3) | |
| Intel NUC10i5FNK | |
| Infinix INBook X2 | |
| Beelink SER3 | |
| GMK NucBox 3 | |
| Blender / v2.79 BMW27 CPU | |
| GMK NucBox 3 | |
| Infinix INBook X2 | |
| Beelink SER3 | |
| Intel NUC11TNKi5 | |
| Intel NUC10i5FNK | |
| Intel NUC11PAQi7 | |
| Lenovo ThinkBook 13s G3 20YA0005GE | |
| Moyenne AMD Ryzen 7 4800U (322 - 374, n=3) | |
| Beelink SER4 | |
| Beelink GTR5 | |
| 7-Zip 18.03 / 7z b 4 | |
| Beelink GTR5 | |
| Moyenne AMD Ryzen 7 4800U (38654 - 44804, n=3) | |
| Beelink SER4 | |
| Lenovo ThinkBook 13s G3 20YA0005GE | |
| Intel NUC11PAQi7 | |
| Intel NUC11TNKi5 | |
| Intel NUC10i5FNK | |
| Beelink SER3 | |
| Infinix INBook X2 | |
| GMK NucBox 3 | |
| 7-Zip 18.03 / 7z b 4 -mmt1 | |
| Beelink GTR5 | |
| Intel NUC11PAQi7 | |
| Lenovo ThinkBook 13s G3 20YA0005GE | |
| Intel NUC11TNKi5 | |
| Beelink SER4 | |
| Moyenne AMD Ryzen 7 4800U (4420 - 4603, n=3) | |
| Intel NUC10i5FNK | |
| Beelink SER3 | |
| Infinix INBook X2 | |
| GMK NucBox 3 | |
| Geekbench 5.5 / Multi-Core | |
| Beelink GTR5 | |
| Lenovo ThinkBook 13s G3 20YA0005GE | |
| Beelink SER4 | |
| Moyenne AMD Ryzen 7 4800U (5798 - 6950, n=4) | |
| Intel NUC11PAQi7 | |
| Intel NUC11TNKi5 | |
| Intel NUC10i5FNK | |
| Infinix INBook X2 | |
| GMK NucBox 3 | |
| Geekbench 5.5 / Single-Core | |
| Beelink GTR5 | |
| Intel NUC11PAQi7 | |
| Lenovo ThinkBook 13s G3 20YA0005GE | |
| Intel NUC11TNKi5 | |
| Beelink SER4 | |
| Infinix INBook X2 | |
| Moyenne AMD Ryzen 7 4800U (1150 - 1192, n=4) | |
| Intel NUC10i5FNK | |
| GMK NucBox 3 | |
| HWBOT x265 Benchmark v2.2 / 4k Preset | |
| Beelink GTR5 | |
| Beelink SER4 | |
| Moyenne AMD Ryzen 7 4800U (9.48 - 10.8, n=3) | |
| Lenovo ThinkBook 13s G3 20YA0005GE | |
| Intel NUC11PAQi7 | |
| Intel NUC11TNKi5 | |
| Intel NUC10i5FNK | |
| Infinix INBook X2 | |
| Beelink SER3 | |
| GMK NucBox 3 | |
| LibreOffice / 20 Documents To PDF | |
| GMK NucBox 3 | |
| Beelink SER3 | |
| Infinix INBook X2 | |
| Beelink SER4 | |
| Moyenne AMD Ryzen 7 4800U (57.8 - 62.6, n=3) | |
| Intel NUC11TNKi5 | |
| Lenovo ThinkBook 13s G3 20YA0005GE | |
| Beelink GTR5 | |
| Intel NUC11PAQi7 | |
| R Benchmark 2.5 / Overall mean | |
| GMK NucBox 3 | |
| Infinix INBook X2 | |
| Beelink SER3 | |
| Intel NUC10i5FNK | |
| Intel NUC11TNKi5 | |
| Moyenne AMD Ryzen 7 4800U (0.576 - 0.613, n=3) | |
| Beelink SER4 | |
| Intel NUC11PAQi7 | |
| Lenovo ThinkBook 13s G3 20YA0005GE | |
| Beelink GTR5 | |
* ... Moindre est la valeur, meilleures sont les performances
AIDA64: FP32 Ray-Trace | FPU Julia | CPU SHA3 | CPU Queen | FPU SinJulia | FPU Mandel | CPU AES | CPU ZLib | FP64 Ray-Trace | CPU PhotoWorxx
| Performance rating | |
| Beelink GTR5 | |
| Beelink SER4 | |
| Moyenne AMD Ryzen 7 4800U | |
| Beelink SER3 | |
| GMK NucBox 3 | |
| AIDA64 / FP32 Ray-Trace | |
| Beelink GTR5 | |
| Beelink SER4 | |
| Moyenne AMD Ryzen 7 4800U (9268 - 10046, n=2) | |
| Beelink SER3 | |
| GMK NucBox 3 | |
| AIDA64 / FPU Julia | |
| Beelink GTR5 | |
| Beelink SER4 | |
| Moyenne AMD Ryzen 7 4800U (53257 - 56388, n=2) | |
| Beelink SER3 | |
| GMK NucBox 3 | |
| AIDA64 / CPU SHA3 | |
| Beelink GTR5 | |
| Beelink SER4 | |
| Moyenne AMD Ryzen 7 4800U (1732 - 1840, n=2) | |
| Beelink SER3 | |
| GMK NucBox 3 | |
| AIDA64 / CPU Queen | |
| Beelink GTR5 | |
| Beelink SER4 | |
| Moyenne AMD Ryzen 7 4800U (77333 - 78511, n=2) | |
| Beelink SER3 | |
| GMK NucBox 3 | |
| AIDA64 / FPU SinJulia | |
| Beelink GTR5 | |
| Beelink SER4 | |
| Moyenne AMD Ryzen 7 4800U (11293 - 11799, n=2) | |
| Beelink SER3 | |
| GMK NucBox 3 | |
| AIDA64 / FPU Mandel | |
| Beelink GTR5 | |
| Beelink SER4 | |
| Moyenne AMD Ryzen 7 4800U (27938 - 28667, n=2) | |
| Beelink SER3 | |
| GMK NucBox 3 | |
| AIDA64 / CPU AES | |
| Beelink GTR5 | |
| Beelink SER4 | |
| Moyenne AMD Ryzen 7 4800U (52147 - 54686, n=2) | |
| Beelink SER3 | |
| GMK NucBox 3 | |
| AIDA64 / CPU ZLib | |
| Beelink GTR5 | |
| Beelink SER4 | |
| Moyenne AMD Ryzen 7 4800U (580 - 593, n=2) | |
| Beelink SER3 | |
| GMK NucBox 3 | |
| AIDA64 / FP64 Ray-Trace | |
| Beelink GTR5 | |
| Beelink SER4 | |
| Moyenne AMD Ryzen 7 4800U (4877 - 5555, n=2) | |
| Beelink SER3 | |
| GMK NucBox 3 | |
| AIDA64 / CPU PhotoWorxx | |
| Beelink SER4 | |
| Moyenne AMD Ryzen 7 4800U (22818 - 24254, n=2) | |
| Beelink GTR5 | |
| Beelink SER3 | |
| GMK NucBox 3 | |
Performance du système
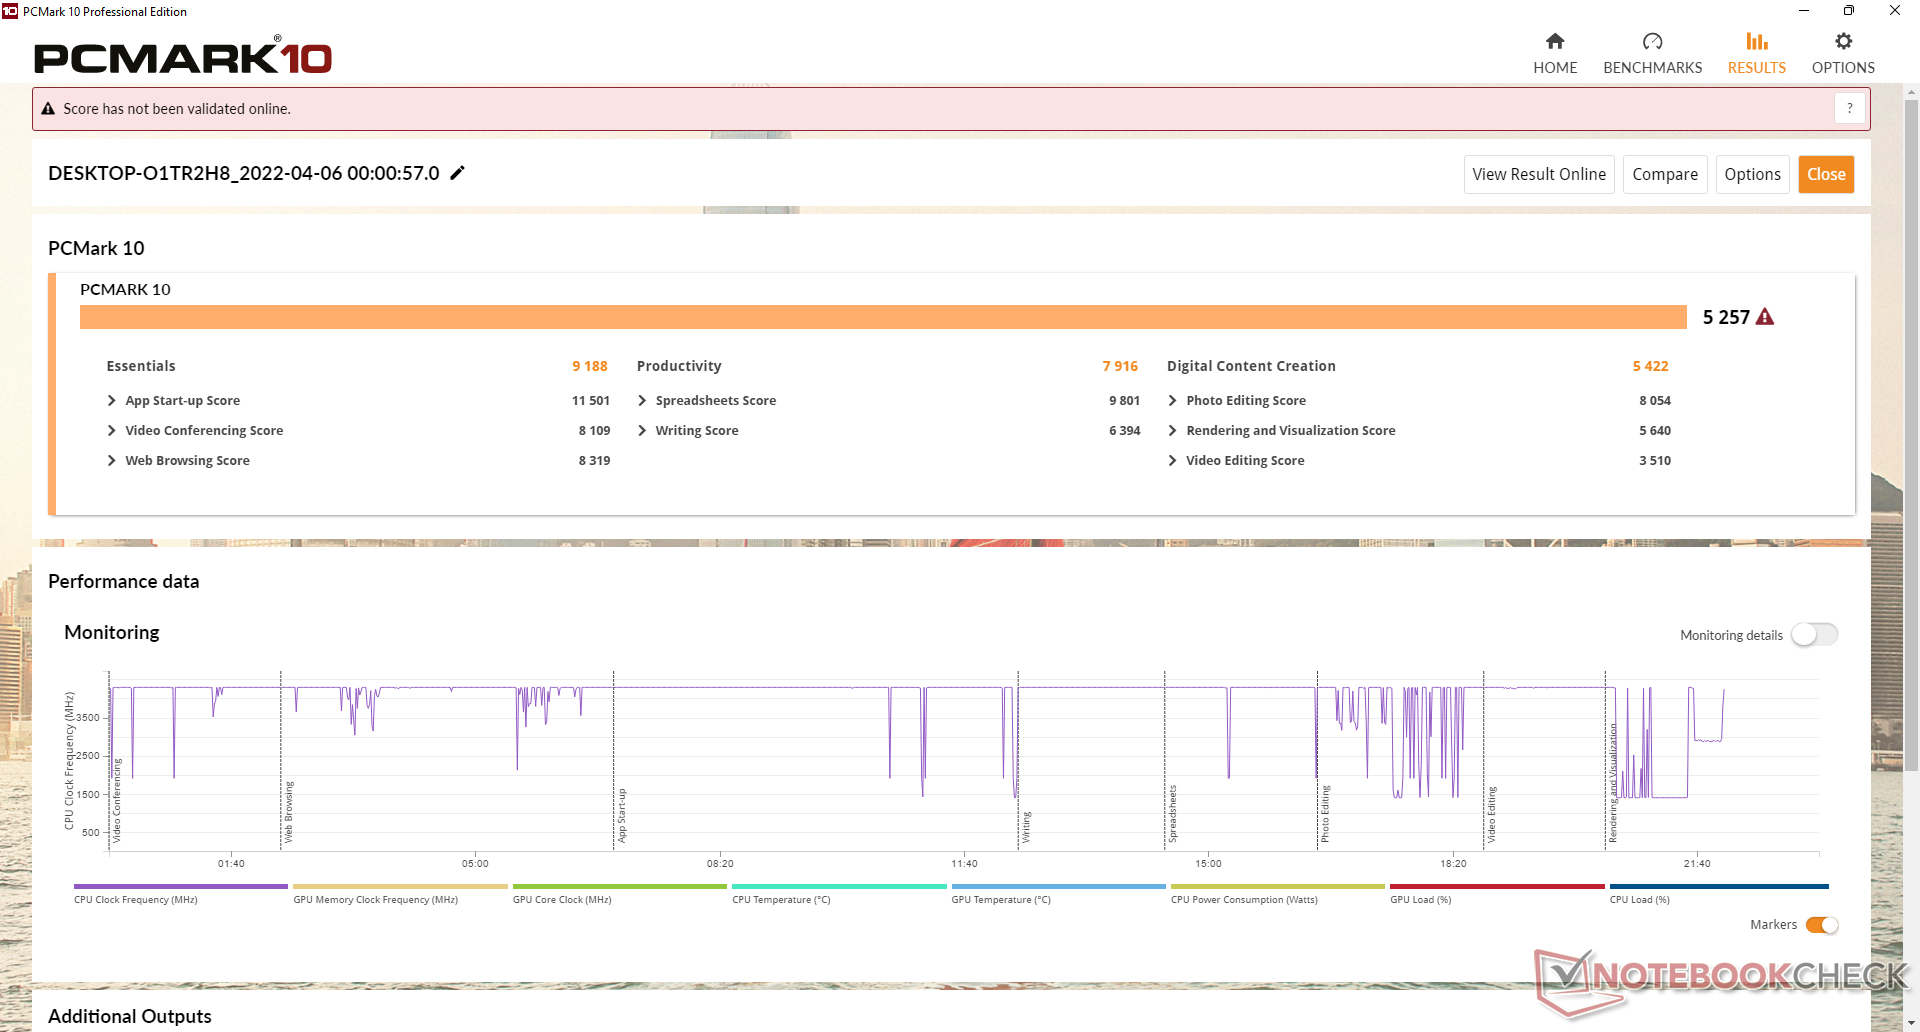
Les résultats de PCMark 10 sont équivalents, voire légèrement supérieurs, à ceux de l'Intel NUC 11 fonctionnant avec un Core i7-1165G7 de 11e génération. Nous soupçonnons que le modèle Intel aurait pu obtenir des résultats encore plus élevés, cependant, si notre unité de test Intel n'avait pas été limitée à la mémoire à canal unique.
CrossMark: Overall | Productivity | Creativity | Responsiveness
| PCMark 10 / Score | |
| Beelink GTR5 | |
| Moyenne AMD Ryzen 7 4800U, AMD Radeon RX Vega 8 (Ryzen 4000/5000) (5233 - 5383, n=3) | |
| Beelink SER4 | |
| Intel NUC11PAQi7 | |
| Intel NUC10i5FNK | |
| Beelink SER3 | |
| GMK NucBox 3 | |
| PCMark 10 / Essentials | |
| Beelink GTR5 | |
| Intel NUC11PAQi7 | |
| Moyenne AMD Ryzen 7 4800U, AMD Radeon RX Vega 8 (Ryzen 4000/5000) (9188 - 9637, n=3) | |
| Beelink SER4 | |
| Intel NUC10i5FNK | |
| Beelink SER3 | |
| GMK NucBox 3 | |
| PCMark 10 / Productivity | |
| Beelink GTR5 | |
| Beelink SER4 | |
| Moyenne AMD Ryzen 7 4800U, AMD Radeon RX Vega 8 (Ryzen 4000/5000) (7631 - 8091, n=3) | |
| Intel NUC11PAQi7 | |
| Intel NUC10i5FNK | |
| Beelink SER3 | |
| GMK NucBox 3 | |
| PCMark 10 / Digital Content Creation | |
| Beelink GTR5 | |
| Moyenne AMD Ryzen 7 4800U, AMD Radeon RX Vega 8 (Ryzen 4000/5000) (5123 - 5758, n=3) | |
| Beelink SER4 | |
| Intel NUC11PAQi7 | |
| Beelink SER3 | |
| Intel NUC10i5FNK | |
| GMK NucBox 3 | |
| CrossMark / Overall | |
| Beelink GTR5 | |
| CrossMark / Productivity | |
| Beelink GTR5 | |
| CrossMark / Creativity | |
| Beelink GTR5 | |
| CrossMark / Responsiveness | |
| Beelink GTR5 | |
| PCMark 10 Score | 5257 points | |
Aide | ||
| AIDA64 / Memory Copy | |
| Beelink GTR5 | |
| Moyenne AMD Ryzen 7 4800U (37086 - 40961, n=2) | |
| Beelink SER4 | |
| Beelink SER3 | |
| GMK NucBox 3 | |
| AIDA64 / Memory Read | |
| Beelink GTR5 | |
| Moyenne AMD Ryzen 7 4800U (44706 - 46406, n=2) | |
| Beelink SER4 | |
| Beelink SER3 | |
| GMK NucBox 3 | |
| AIDA64 / Memory Write | |
| Beelink SER4 | |
| Moyenne AMD Ryzen 7 4800U (42240 - 43768, n=2) | |
| Beelink GTR5 | |
| Beelink SER3 | |
| GMK NucBox 3 | |
| AIDA64 / Memory Latency | |
| Moyenne AMD Ryzen 7 4800U (94.7 - 115, n=2) | |
| Beelink SER3 | |
| Beelink SER4 | |
| GMK NucBox 3 | |
| Beelink GTR5 | |
* ... Moindre est la valeur, meilleures sont les performances
Latence DPC
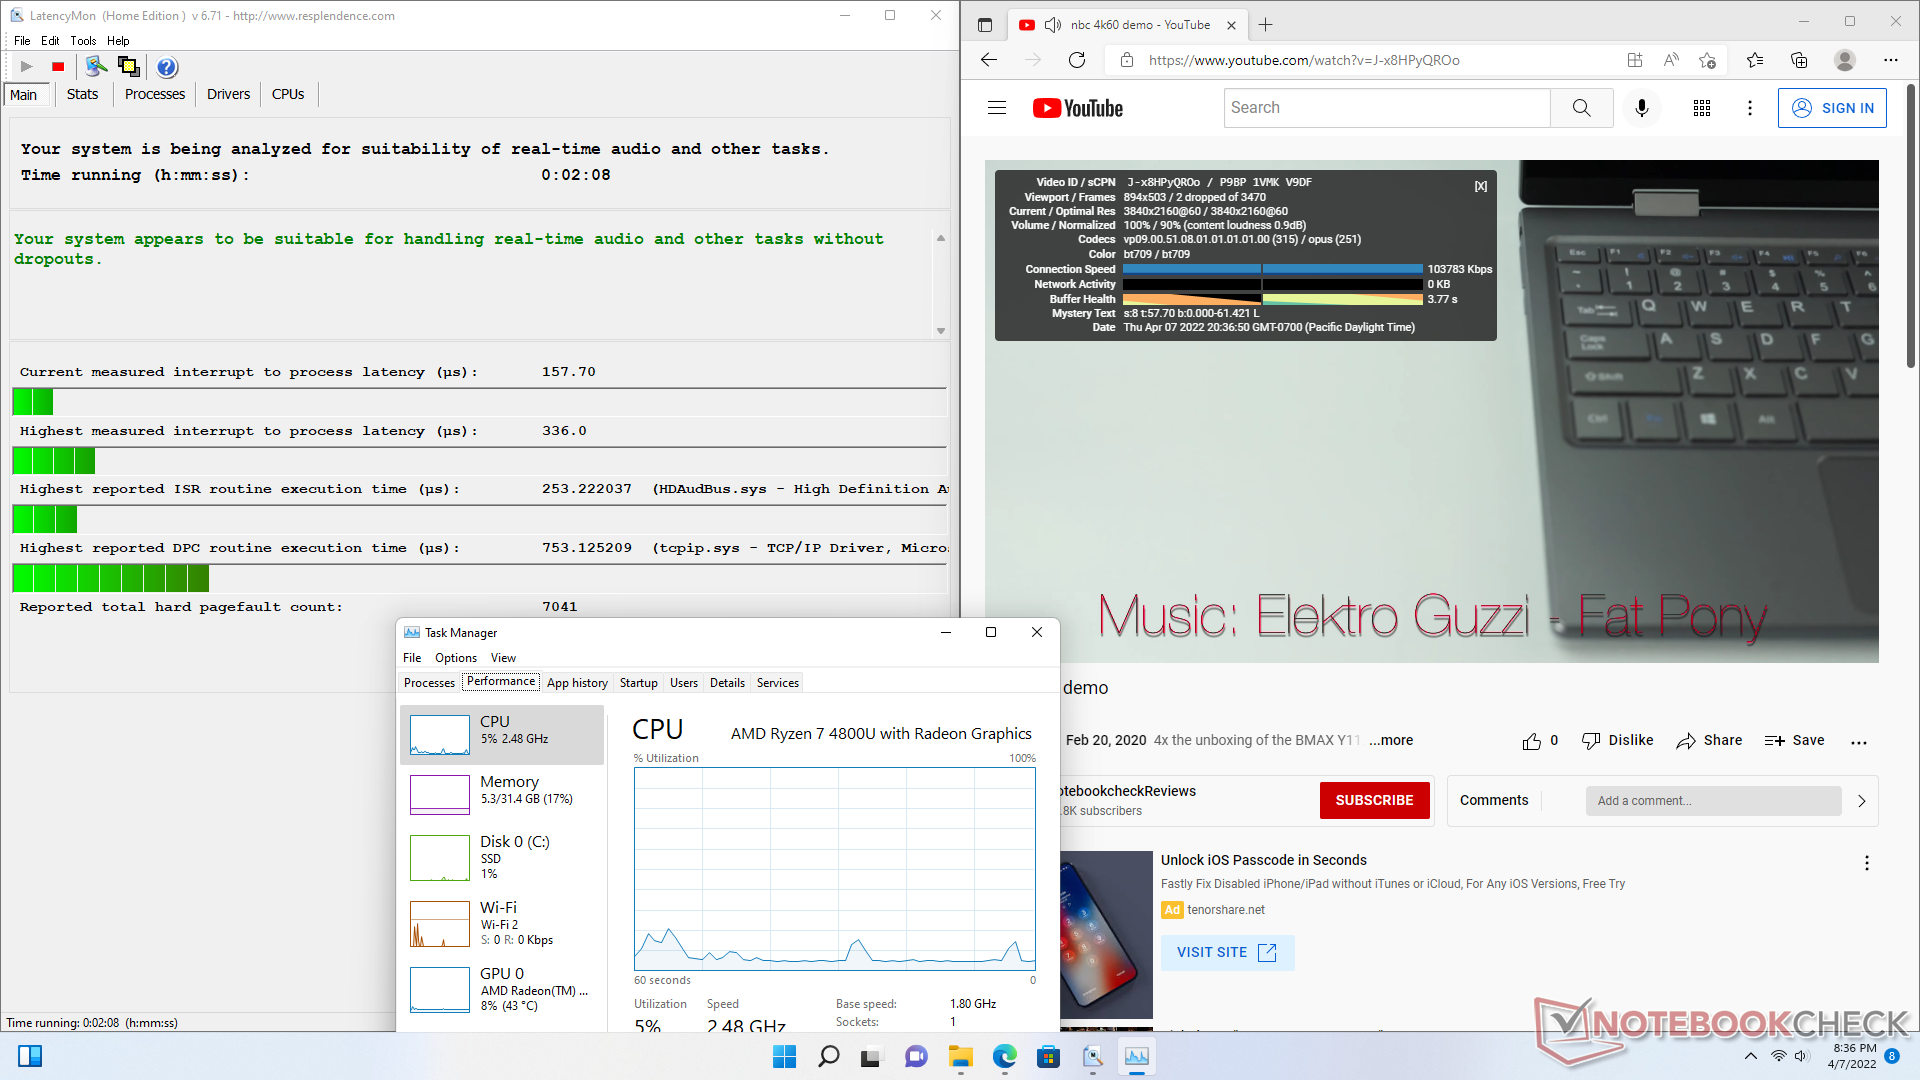
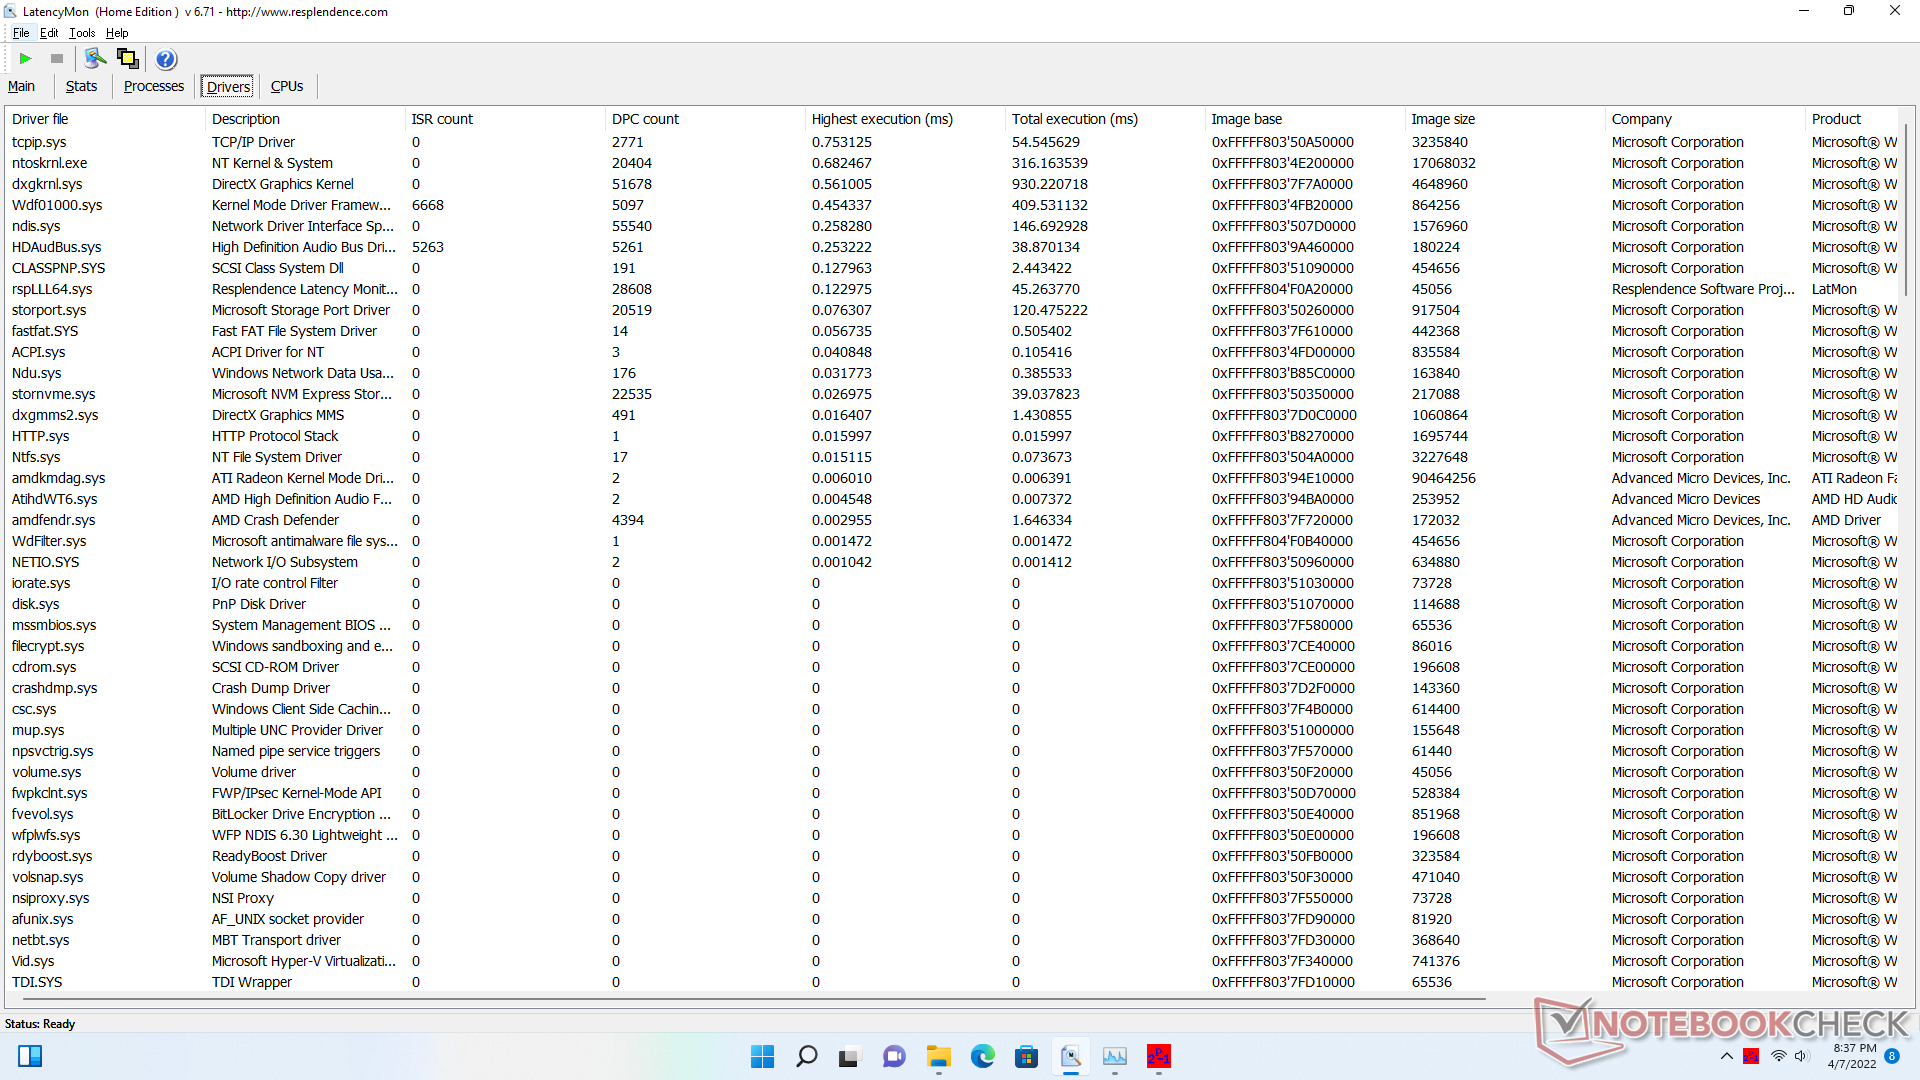
LatencyMon ne révèle aucun problème de CPD lors de l'ouverture de plusieurs onglets de navigateur sur notre page d'accueil. la lecture de vidéos 4K à 60 FPS est presque parfaite avec seulement 2 images perdues pendant notre vidéo d'une minute.
| DPC Latencies / LatencyMon - interrupt to process latency (max), Web, Youtube, Prime95 | |
| GMK NucBox 3 | |
| Beelink SER3 | |
| Intel NUC11PAQi7 | |
| Beelink SER4 | |
| Beelink GTR5 | |
* ... Moindre est la valeur, meilleures sont les performances
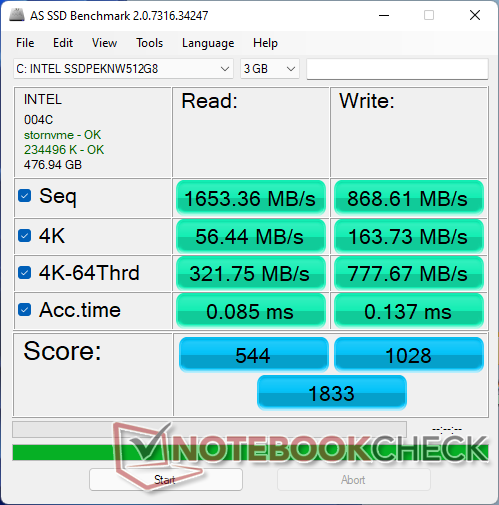
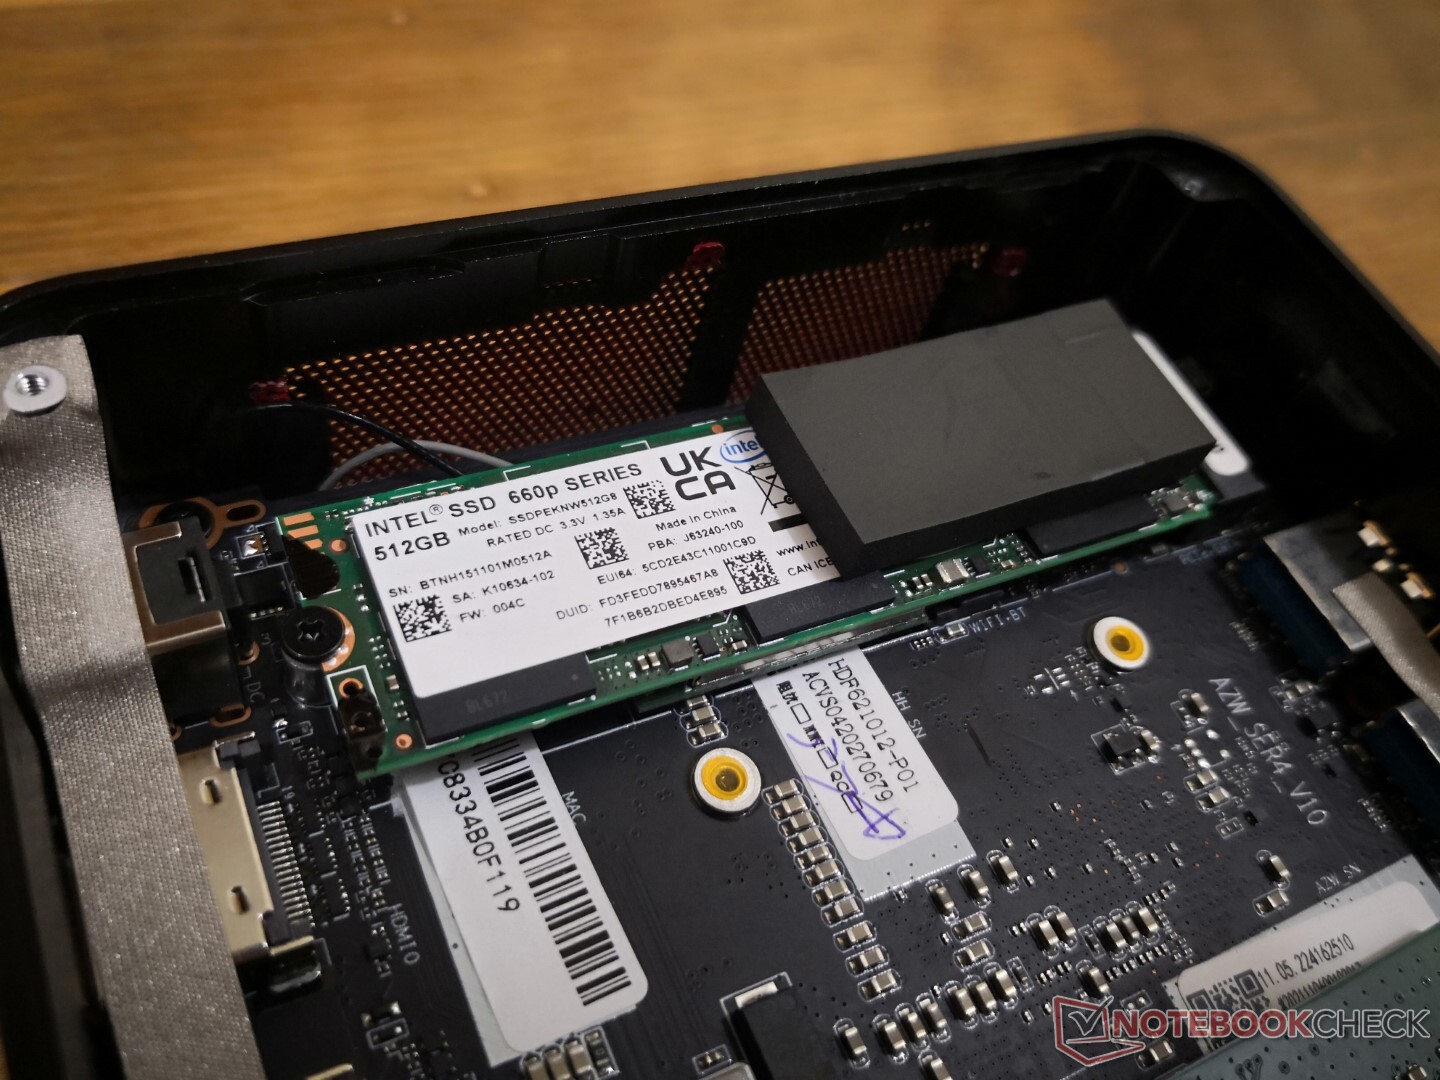
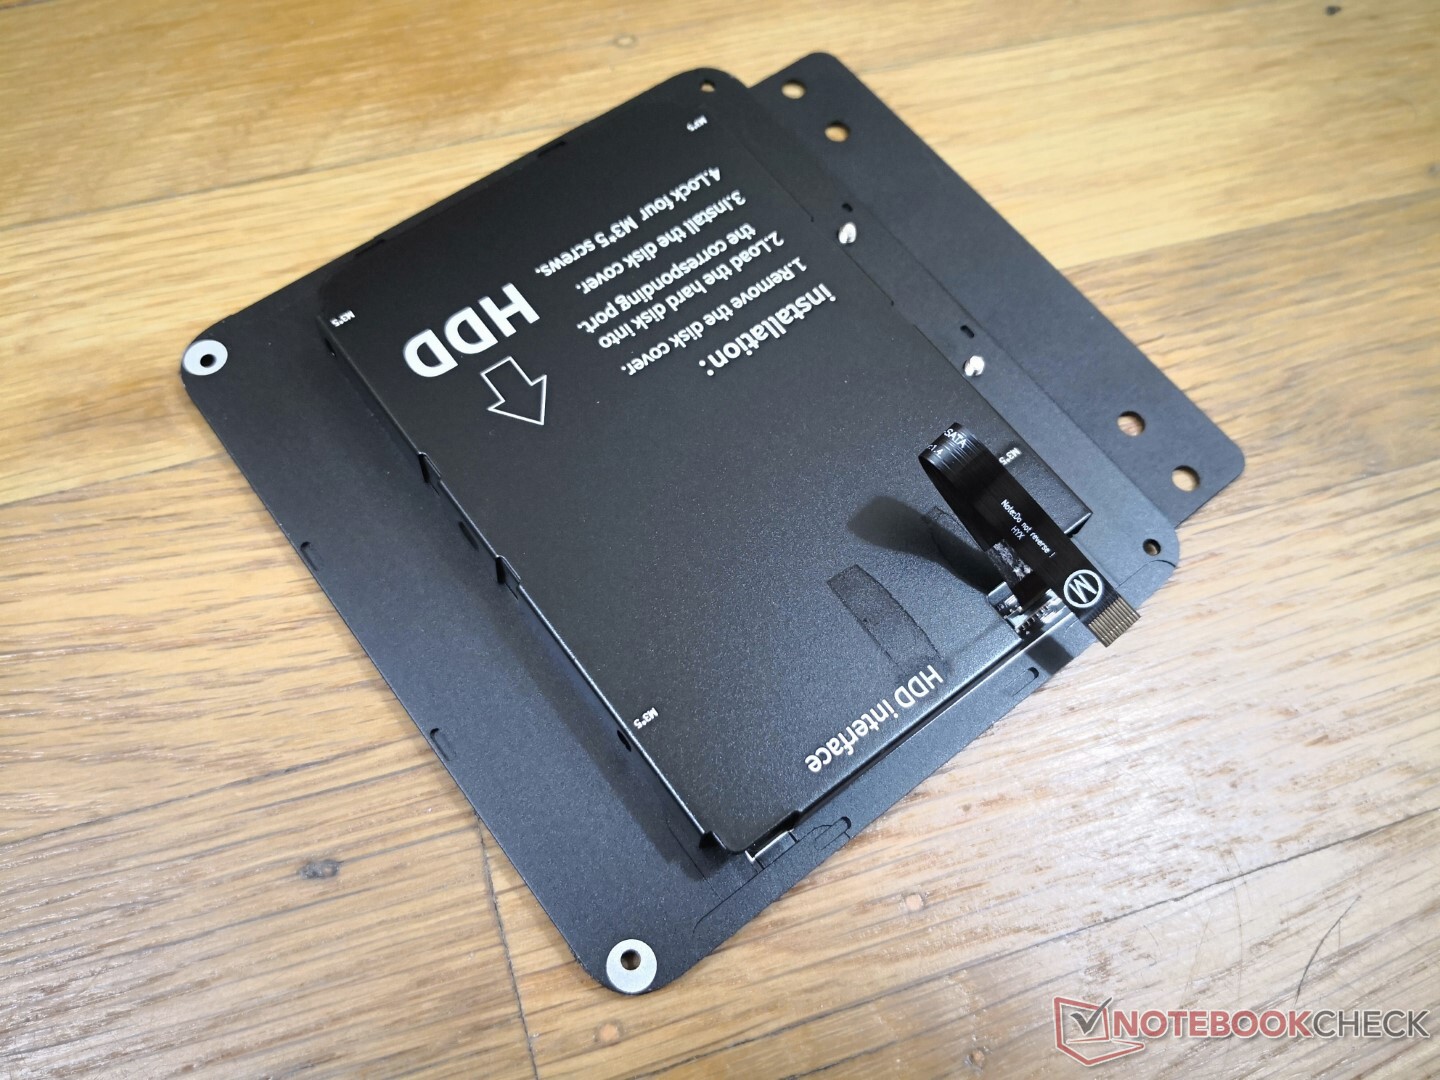
Périphériques de stockage - PCIe3 x4 + SATA III 2,5 pouces
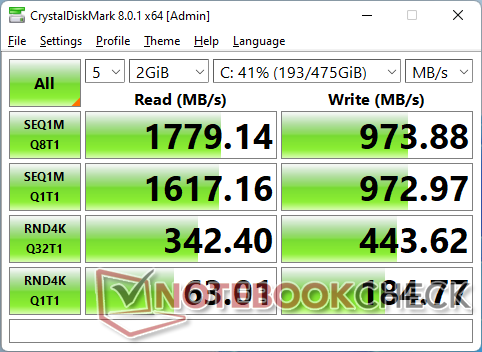
Notre unité de test comprend un 512 GB Intel SSD 660p qui est un SSD NVMe PCIe3 x4 économique. Les taux de lecture séquentielle n'atteignent qu'environ 1400 Mo/s, contre >3000 Mo/s ou >7000 Mo/s pour les disques PCIe3 ou PCIe4 haut de gamme, respectivement. Pour le public cible, cependant, l'Intel 660p sera suffisant.

| Drive Performance rating - Percent | |
| Intel NUC11PAQi7 | |
| Beelink GTR5 | |
| Beelink SER4 | |
| Beelink SER3 | |
| Intel NUC10i5FNK | |
| GMK NucBox 3 | |
* ... Moindre est la valeur, meilleures sont les performances
Disk Throttling: DiskSpd Read Loop, Queue Depth 8
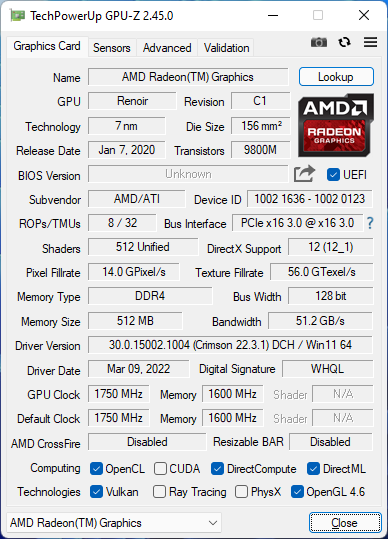
Performances du GPU - Au coude à coude avec l'Iris Xe 80 EUs
Le système intégré Radeon Vega 8 Intégré est encore très bon, bien qu'il soit vieux d'une ou deux générations. les résultats 3DMark sont environ 20 à 30 % plus lents que ceux du concurrent Iris Xe 96 EU concurrent fonctionnant sur de la RAM double canal ou environ 5 à 20 % plus rapide si ledit GPU Intel fonctionnait sur de la RAM simple canal à la place. Il n'est pas déraisonnable de s'attendre à plus de 30 FPS en configuration basse 1080p ou 720p, selon le titre.
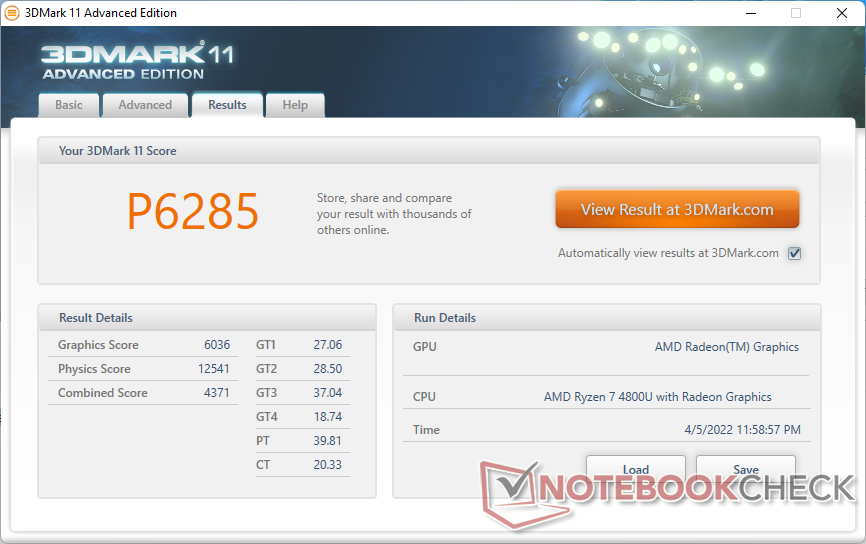
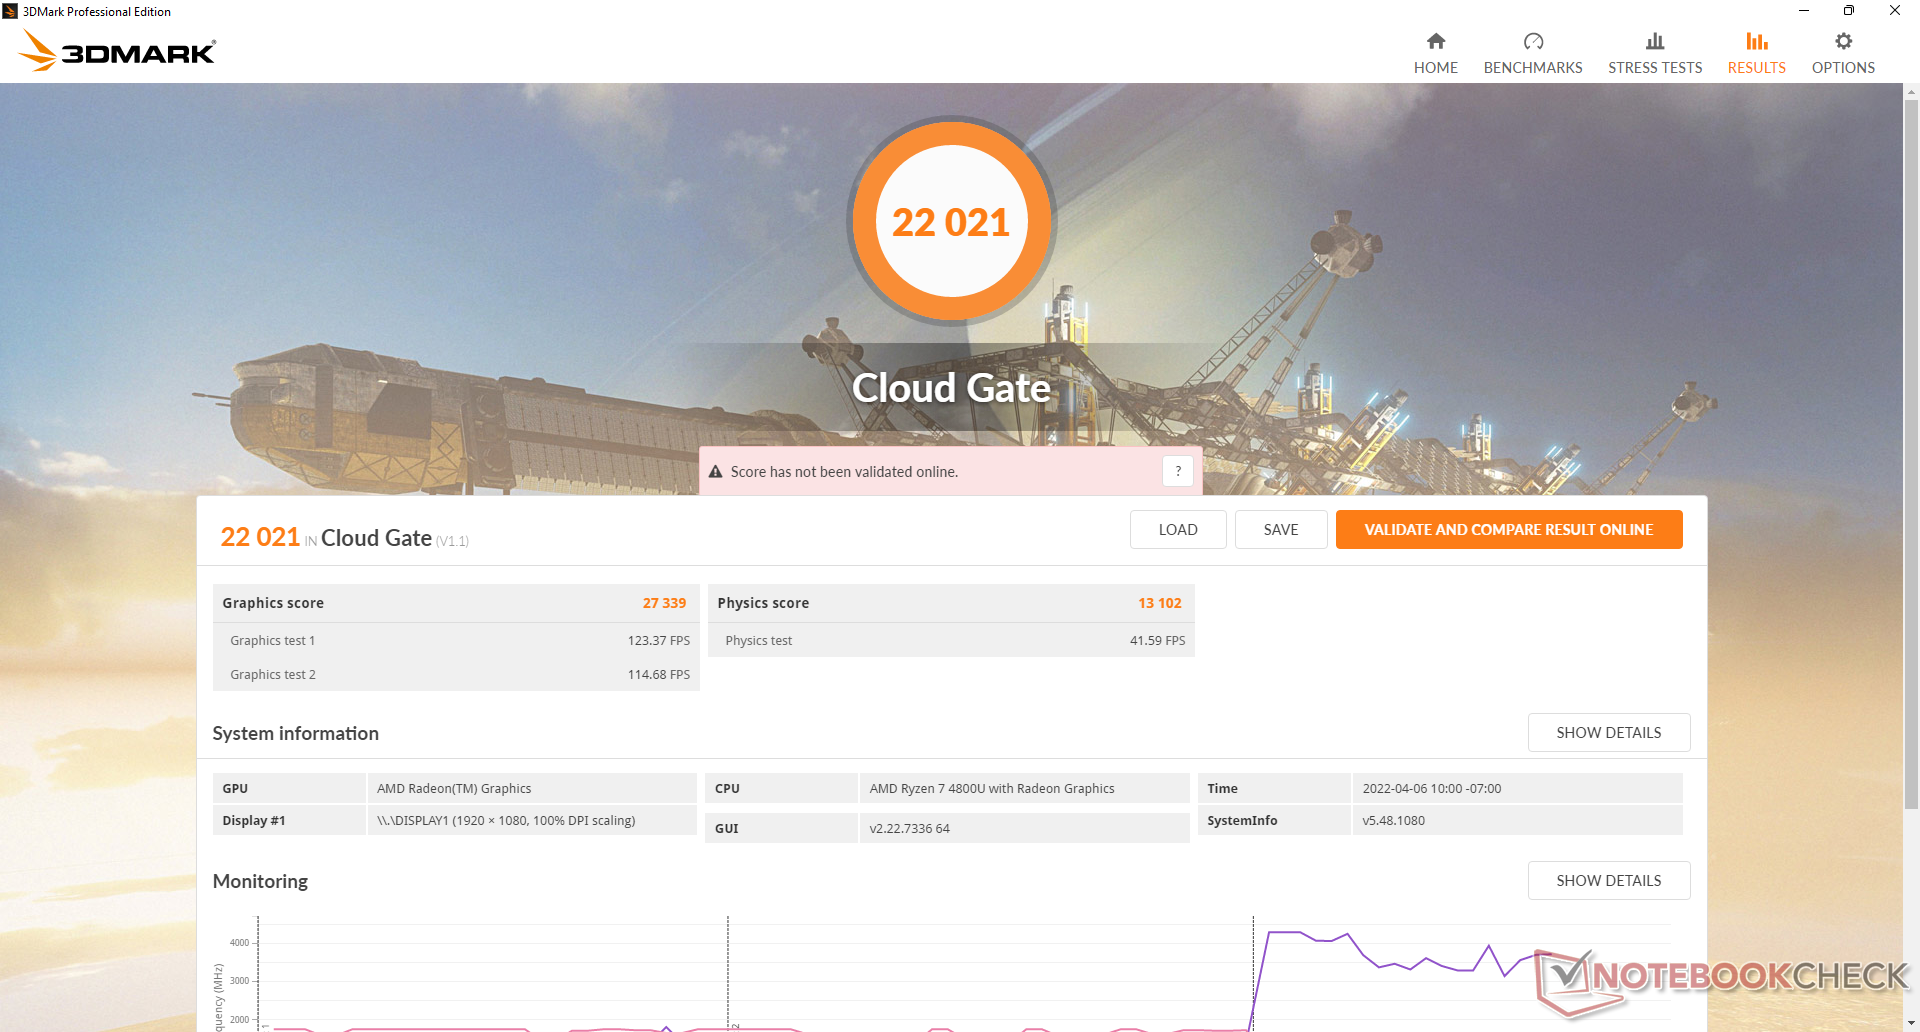
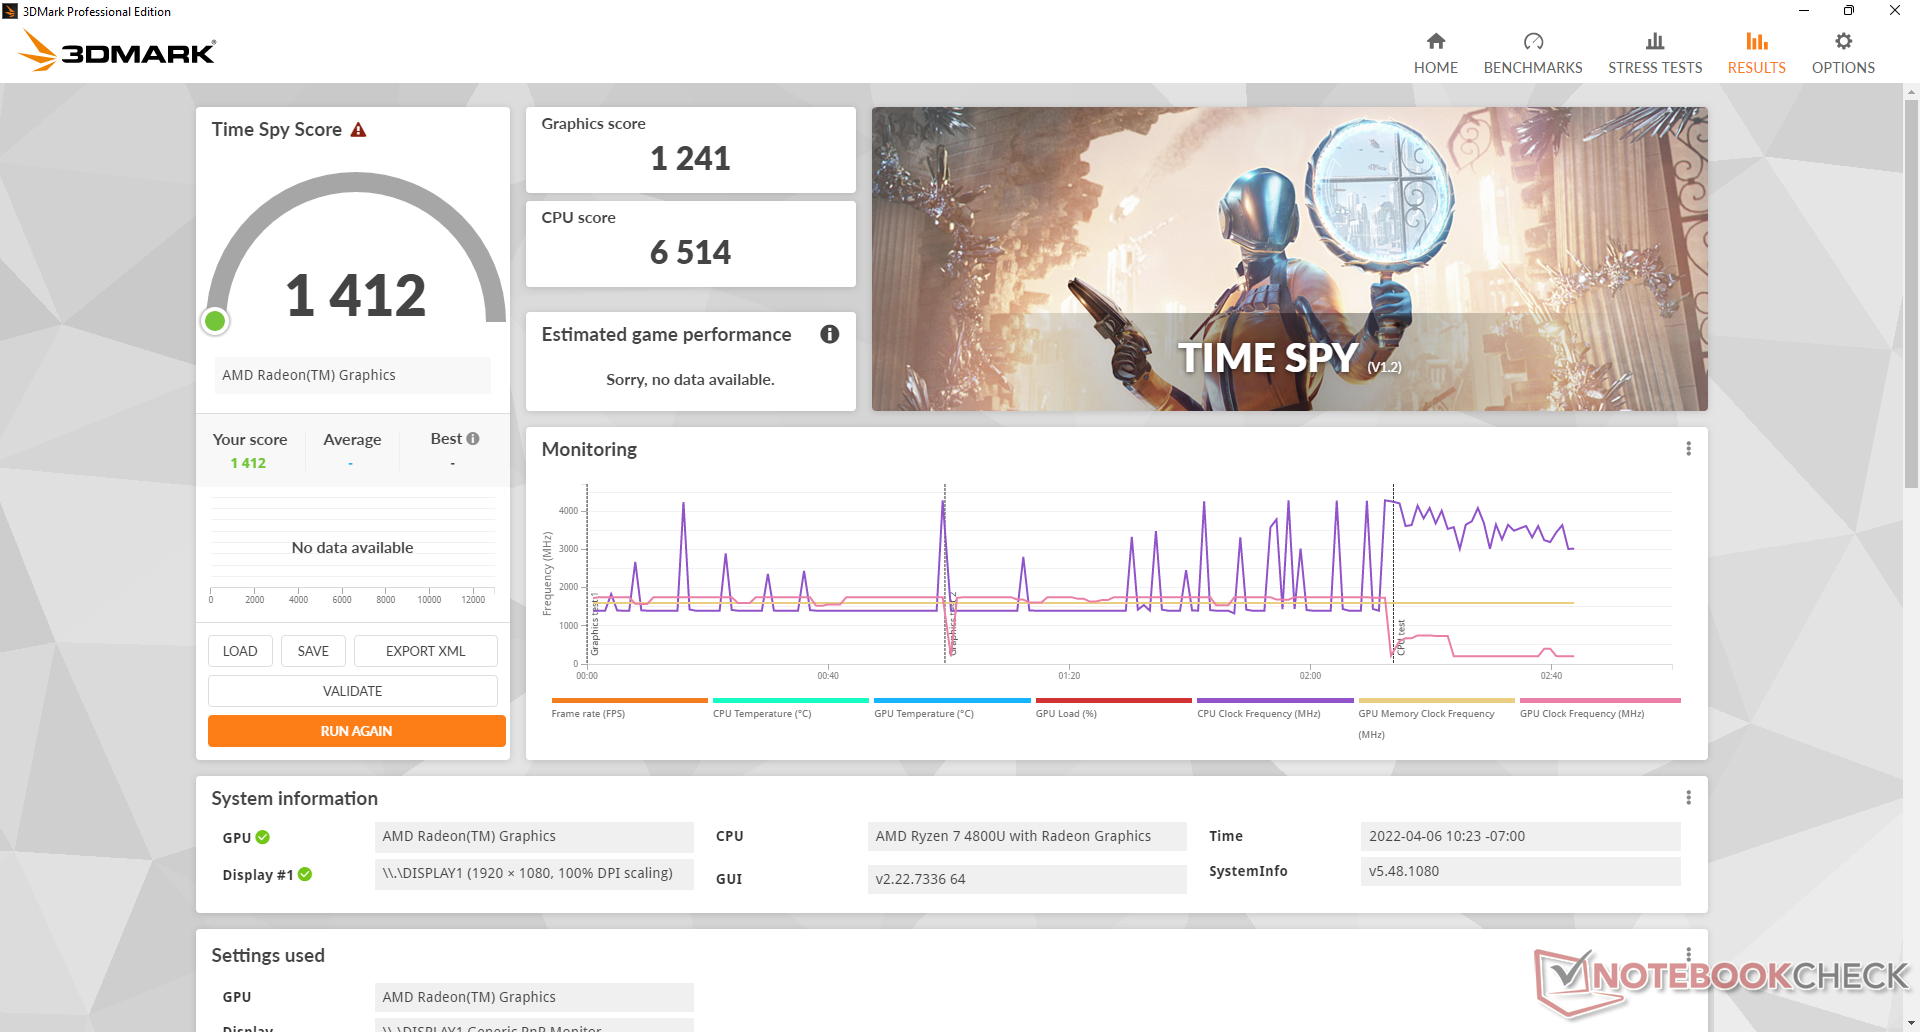
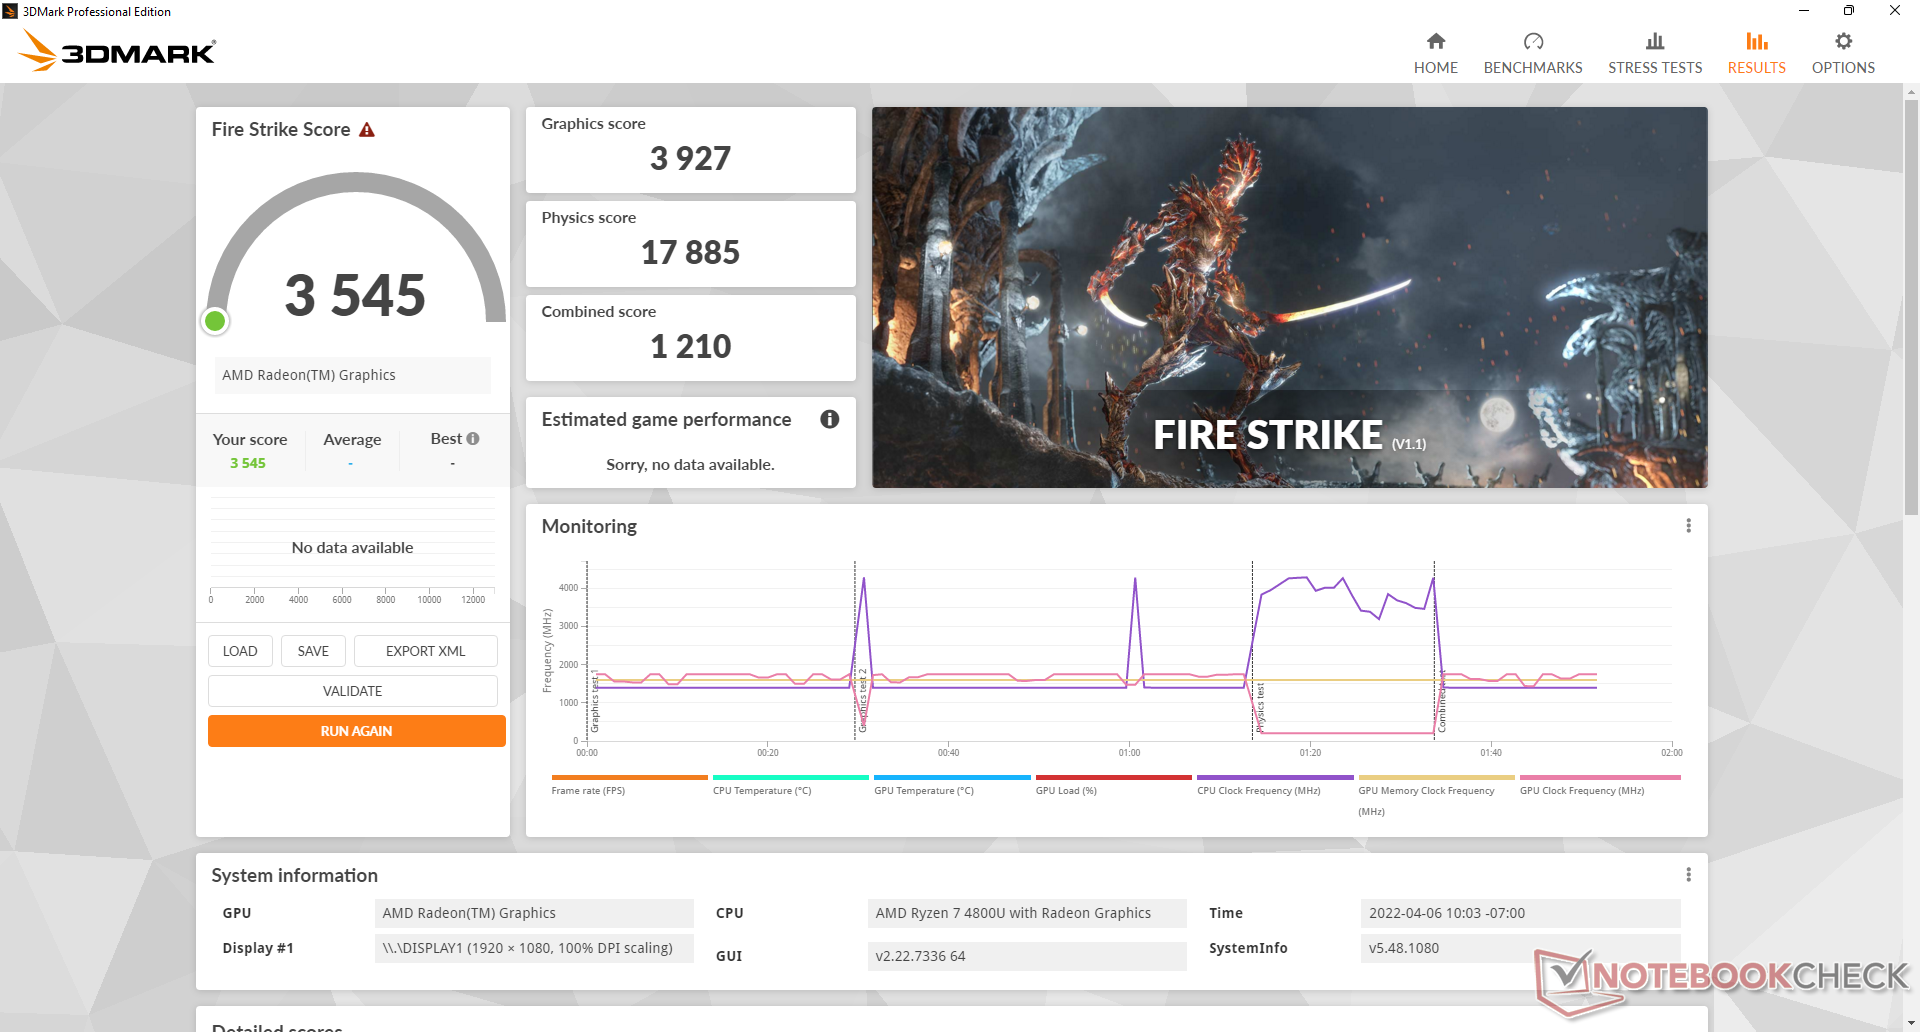
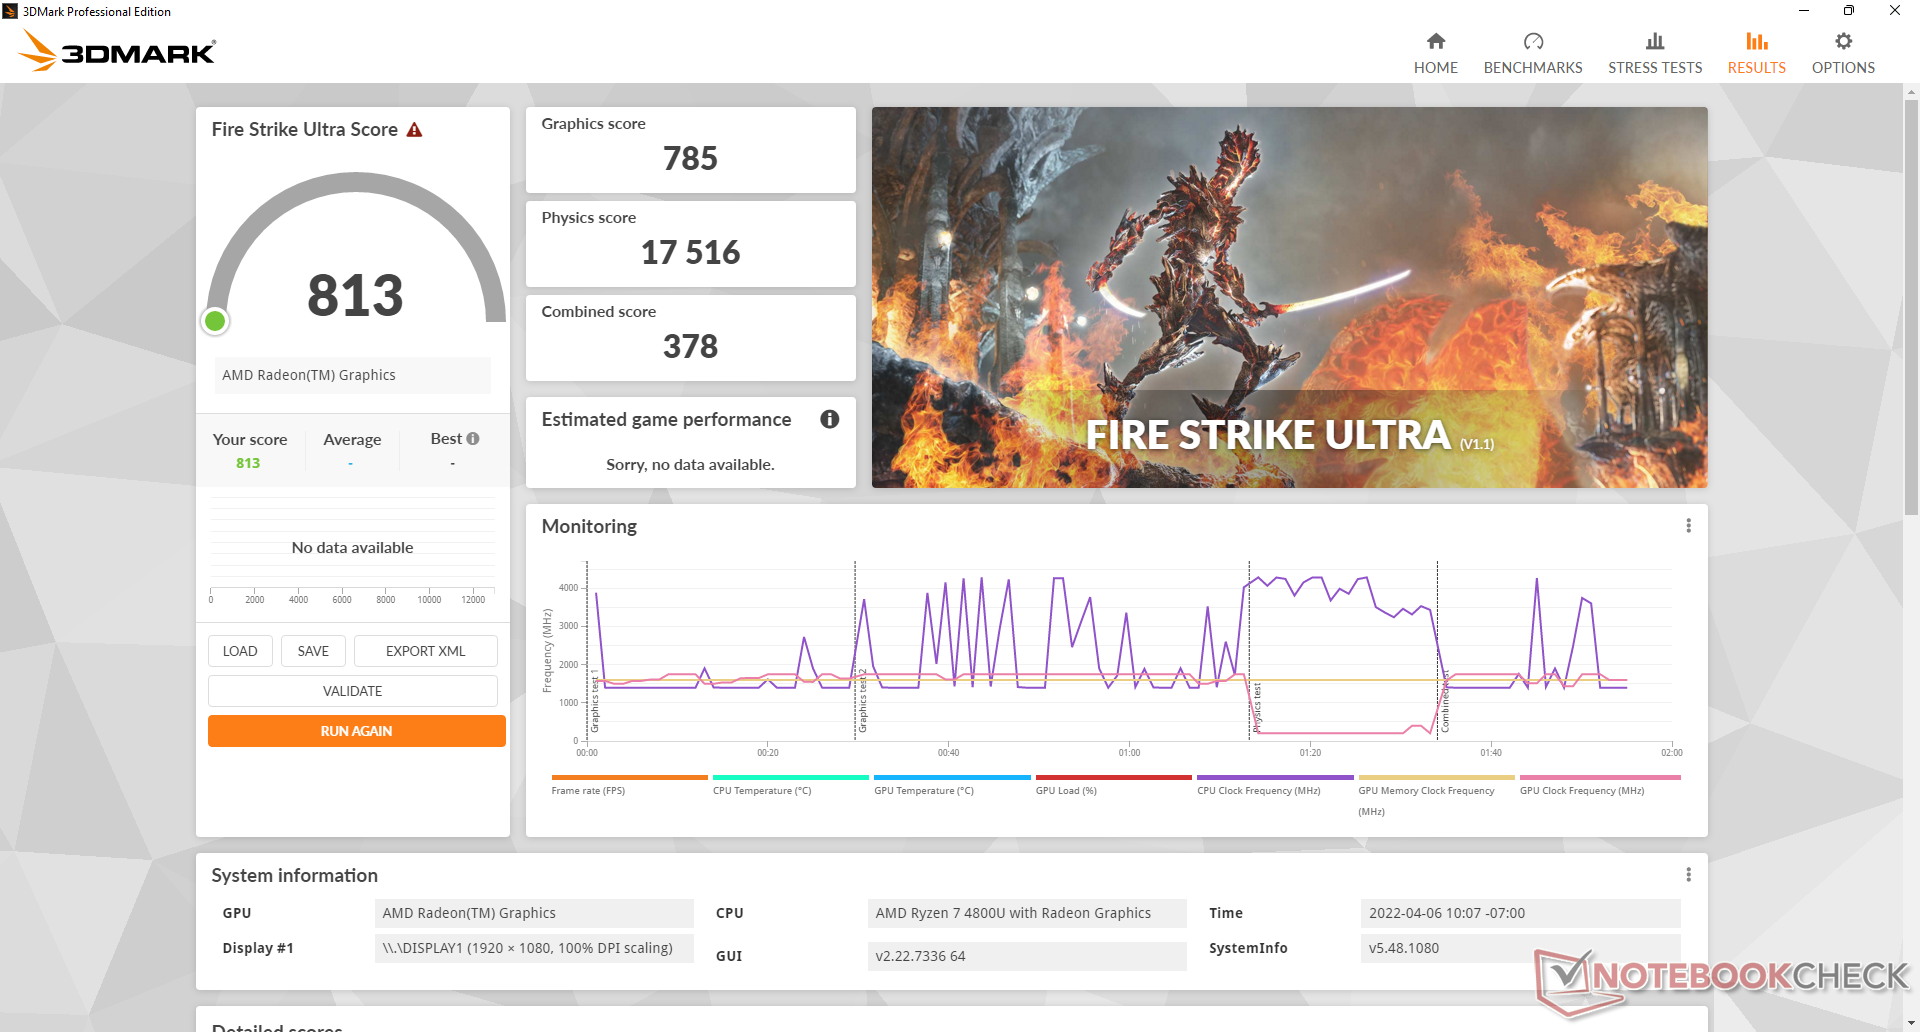
| 3DMark 11 Performance | 6285 points | |
| 3DMark Cloud Gate Standard Score | 22021 points | |
| 3DMark Fire Strike Score | 3545 points | |
| 3DMark Time Spy Score | 1412 points | |
Aide | ||
| The Witcher 3 | |
| 1024x768 Low Graphics & Postprocessing | |
| Samsung Galaxy Book Pro 15 NP950XDB-KC5US | |
| Beelink GTR5 | |
| Intel NUC11PAQi7 | |
| Moyenne AMD Radeon RX Vega 8 (Ryzen 4000/5000) (27.2 - 89, n=47) | |
| Beelink SER4 | |
| Beelink SER3 | |
| 1366x768 Medium Graphics & Postprocessing | |
| Samsung Galaxy Book Pro 15 NP950XDB-KC5US | |
| Beelink GTR5 | |
| Beelink SER4 | |
| Intel NUC11PAQi7 | |
| Moyenne AMD Radeon RX Vega 8 (Ryzen 4000/5000) (19.6 - 55.2, n=35) | |
| Beelink SER3 | |
| 1920x1080 High Graphics & Postprocessing (Nvidia HairWorks Off) | |
| Samsung Galaxy Book Pro 15 NP950XDB-KC5US | |
| Beelink GTR5 | |
| Beelink SER4 | |
| Intel NUC11PAQi7 | |
| Moyenne AMD Radeon RX Vega 8 (Ryzen 4000/5000) (8.7 - 26.8, n=46) | |
| Beelink SER3 | |
| 1920x1080 Ultra Graphics & Postprocessing (HBAO+) | |
| Beelink GTR5 | |
| Samsung Galaxy Book Pro 15 NP950XDB-KC5US | |
| Beelink SER4 | |
| Moyenne AMD Radeon RX Vega 8 (Ryzen 4000/5000) (7.07 - 17.6, n=49) | |
| Intel NUC11PAQi7 | |
| Beelink SER3 | |
Witcher 3 FPS Chart
| Bas | Moyen | Élevé | Ultra | |
|---|---|---|---|---|
| GTA V (2015) | 110 | 98.3 | 29.6 | 13.4 |
| The Witcher 3 (2015) | 64.2 | 45.2 | 22.6 | 14.3 |
| Dota 2 Reborn (2015) | 103 | 83.3 | 53.1 | 51.1 |
| Final Fantasy XV Benchmark (2018) | 37.3 | 19.2 | 13.8 | |
| X-Plane 11.11 (2018) | 41.1 | 33.2 | 29.5 | |
| Far Cry 5 (2018) | 46 | 22 | 20 | 19 |
| Strange Brigade (2018) | 82.3 | 33.3 | 28.1 | 24 |
Émissions
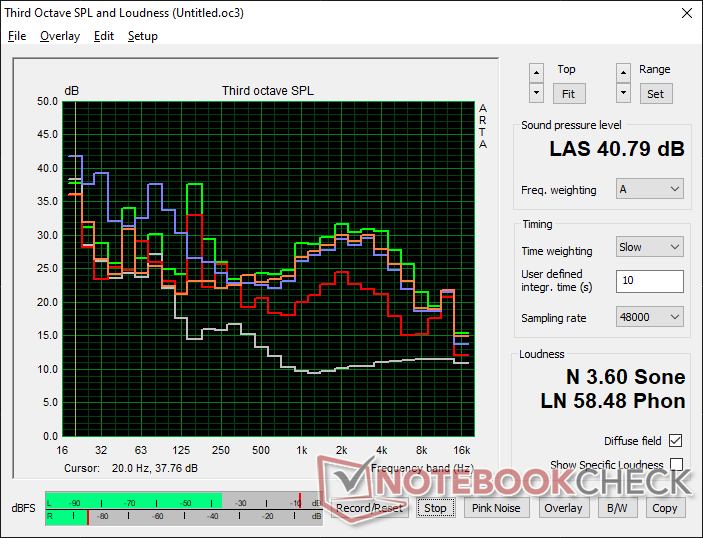
Bruit du système - Comportement pulsatoire gênant
Le bruit du ventilateur est peut-être le pire aspect de la SER4. Bien qu'il soit loin d'être aussi bruyant que celui des GTR5le SER4 est toujours très bruyant pour un mini PC de la série U. Le ralenti sur le bureau, par exemple, est suffisant pour provoquer un bruit de ventilateur de 33,2 dB(A) contre un fond silencieux de 23,4 dB(A). Des charges de traitement faibles, comme la navigation sur le Web ou le streaming vidéo, peuvent provoquer une fluctuation gênante du ventilateur entre 33 et 39 dB(A). En revanche, l'Intel NUC 11 est capable de rester plus silencieux, voire presque silencieux, pendant de longues périodes.
Le bruit du ventilateur peut atteindre 40 dB(A) lors de l'exécution de charges de jeu, contre seulement 34 dB(A) sur le NUC 11.
Degré de la nuisance sonore
| Au repos |
| 33.2 / 33.2 / 33.2 dB(A) |
| Fortement sollicité |
| 38.6 / 40.8 dB(A) |
 | ||
30 dB silencieux 40 dB(A) audible 50 dB(A) bruyant |
||
min: | ||
| Beelink SER4 Vega 8, R7 4800U, Intel SSD 660p SSDPEKNW512G8 | Beelink GTR5 Vega 8, R9 5900HX, Kingston NV1 SNVS/500GCN | Intel NUC11PAQi7 Iris Xe G7 96EUs, i7-1165G7, Samsung SSD 980 Pro 500GB MZ-V8P500BW | Beelink SER3 Vega 10, R7 3750H, GSemi AZW GSDFN512TS3F1OGCX | |
|---|---|---|---|---|
| Noise | -6% | 8% | 11% | |
| arrêt / environnement * (dB) | 23.4 | 23.1 1% | 25.6 -9% | 23.4 -0% |
| Idle Minimum * (dB) | 33.2 | 34.2 -3% | 25.6 23% | 23.4 30% |
| Idle Average * (dB) | 33.2 | 34.2 -3% | 25.6 23% | 23.4 30% |
| Idle Maximum * (dB) | 33.2 | 34.2 -3% | 25.6 23% | 29.4 11% |
| Load Average * (dB) | 38.6 | 44.6 -16% | 33.6 13% | 35.2 9% |
| Witcher 3 ultra * (dB) | 39.2 | 41.4 -6% | 33.6 14% | 37.2 5% |
| Load Maximum * (dB) | 40.8 | 45.1 -11% | 54.5 -34% | 43.3 -6% |
* ... Moindre est la valeur, meilleures sont les performances
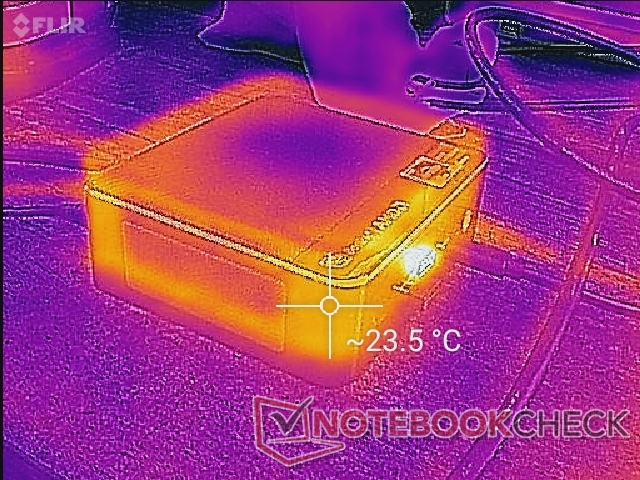
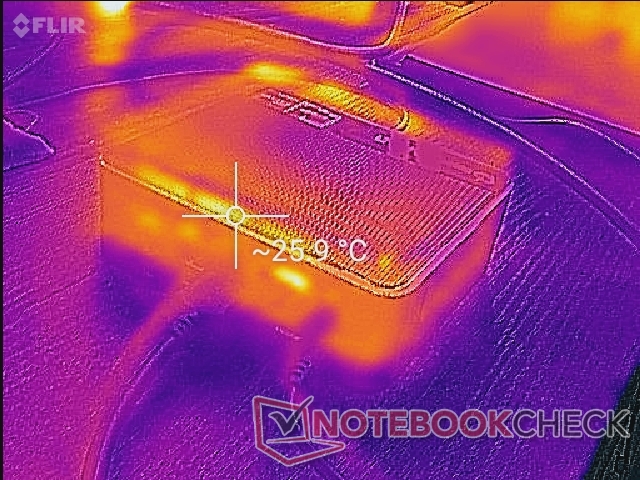
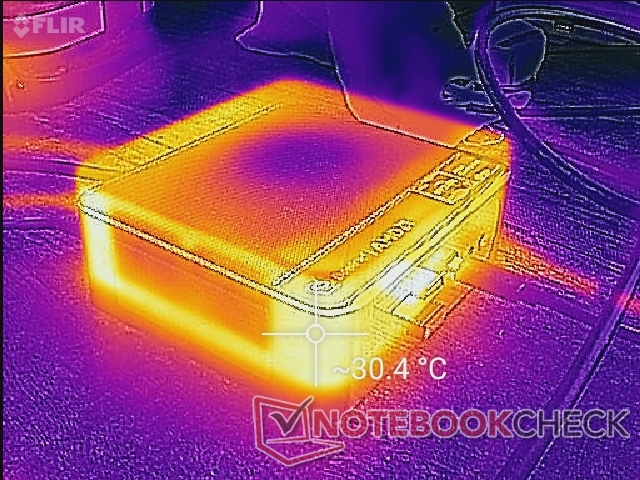
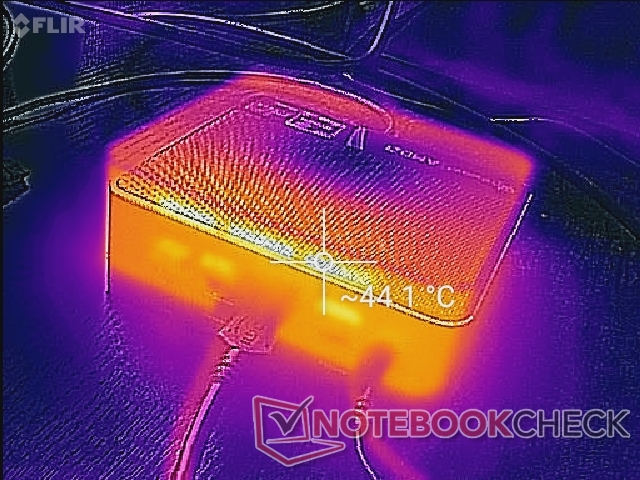
Température - Gardez le haut de l'affiche bien dégagé
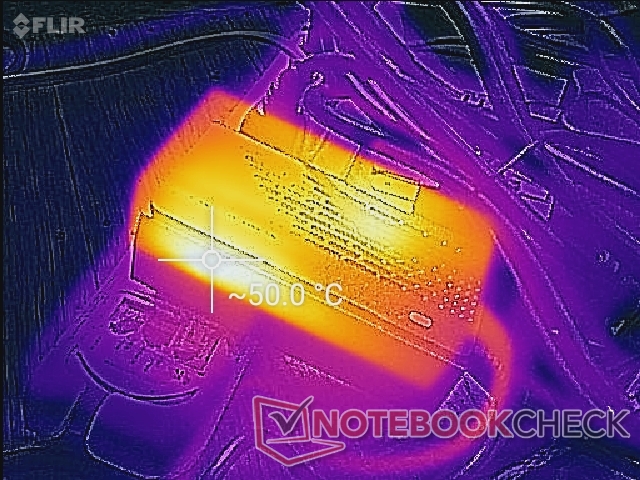
Les températures de surface ne posent pas de problème. L'appareil est doté de grilles de ventilation sur quatre de ses six côtés pour permettre la circulation de l'air. L'air frais entre par la surface supérieure et il n'est donc pas recommandé de placer des papiers ou des livres sur le dessus de l'appareil.
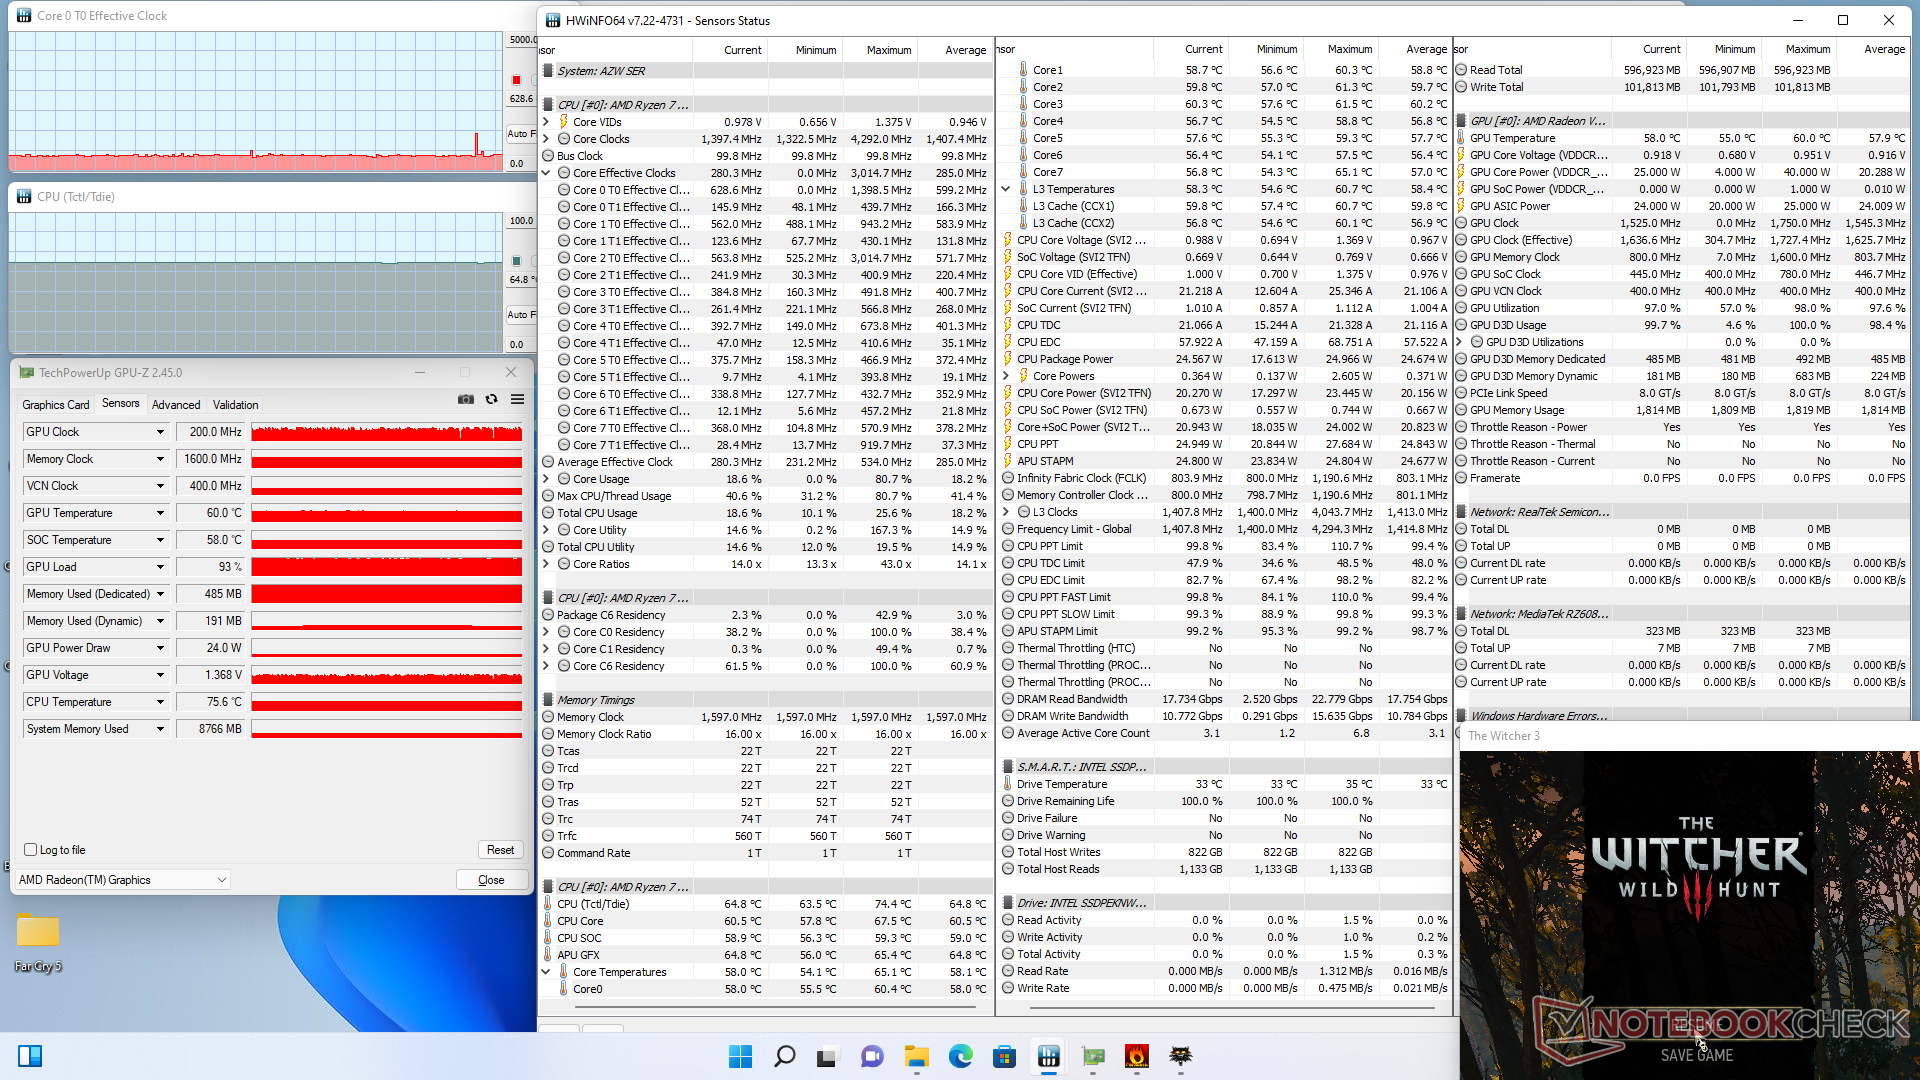
Test de stress
Lorsqu'il est soumis à Prime95, le processeur passe à 2,8 GHz indéfiniment et à une température stable de 64°C. Le même test sur le NUC11PAQi7 d'Intel donne une température plus élevée de 79°C. Les fréquences d'horloge restent stables et sans comportement cyclique dans les jeux.
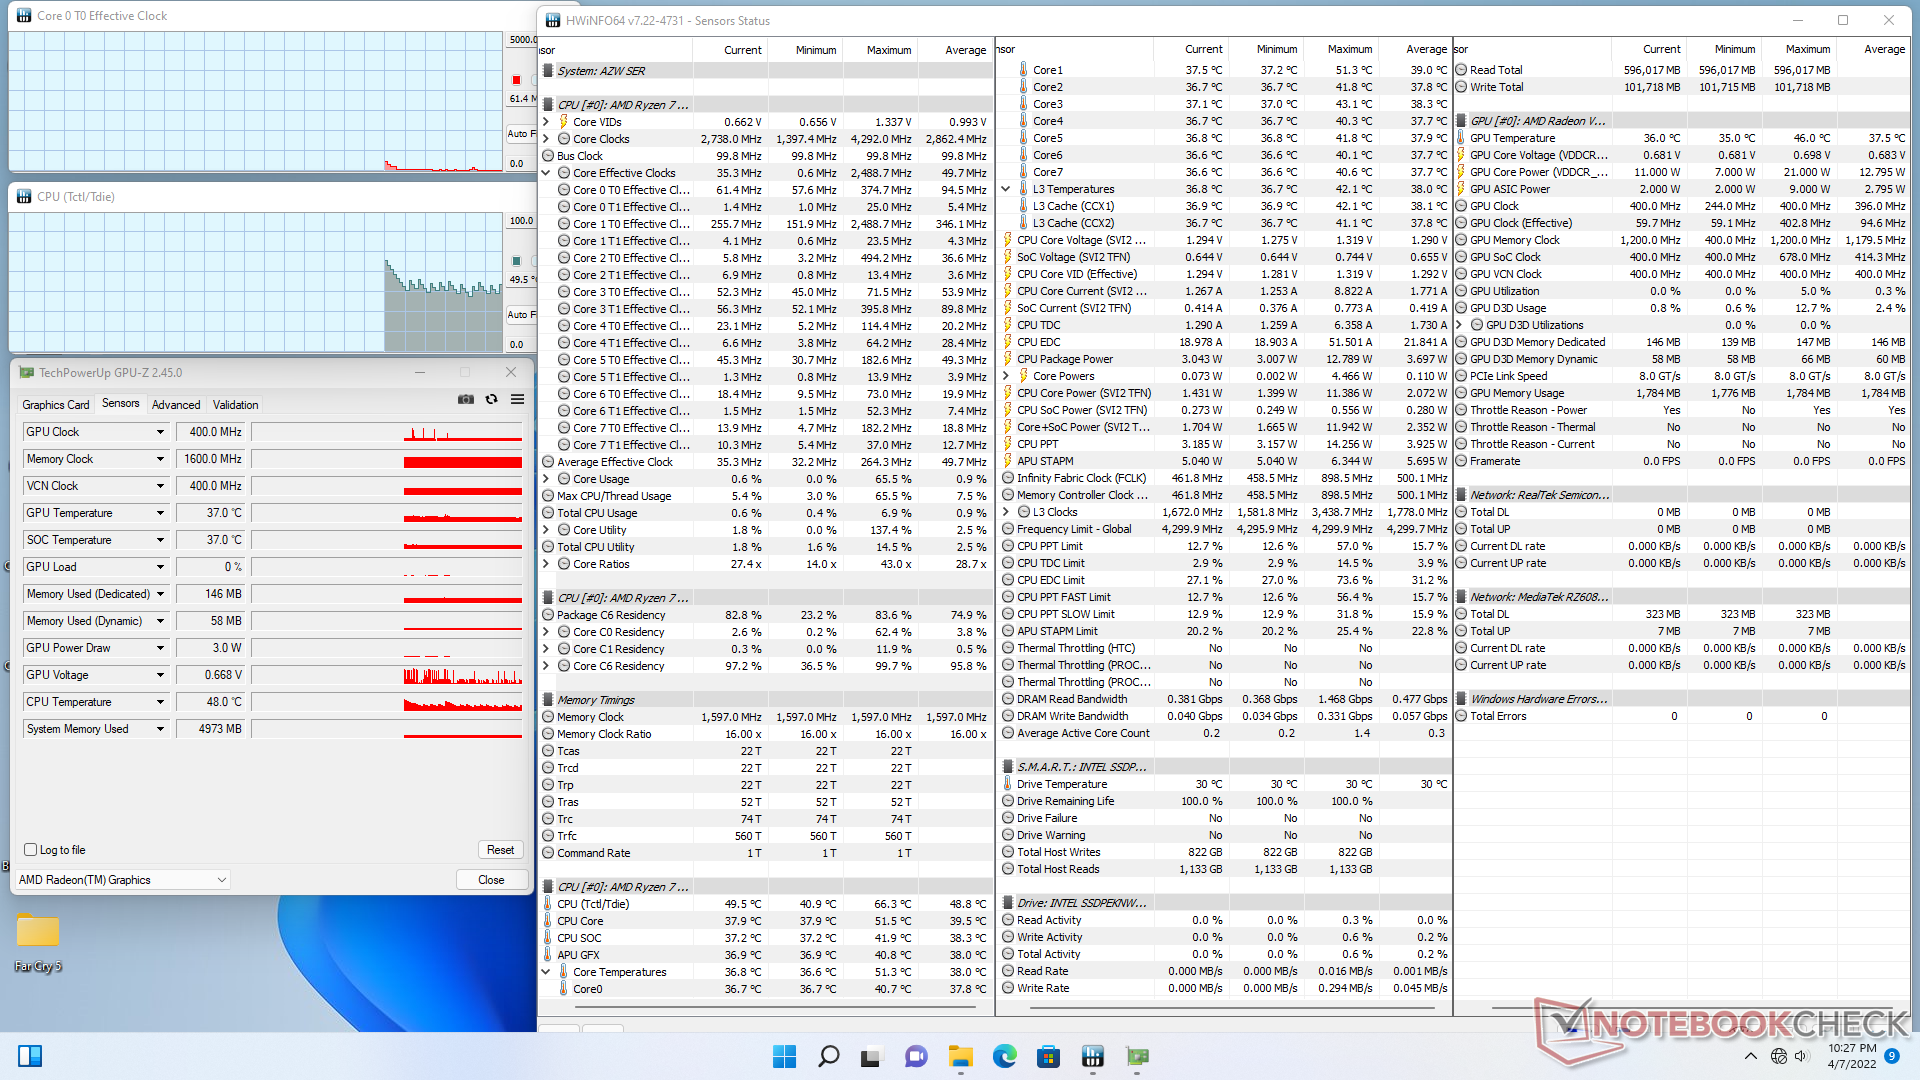
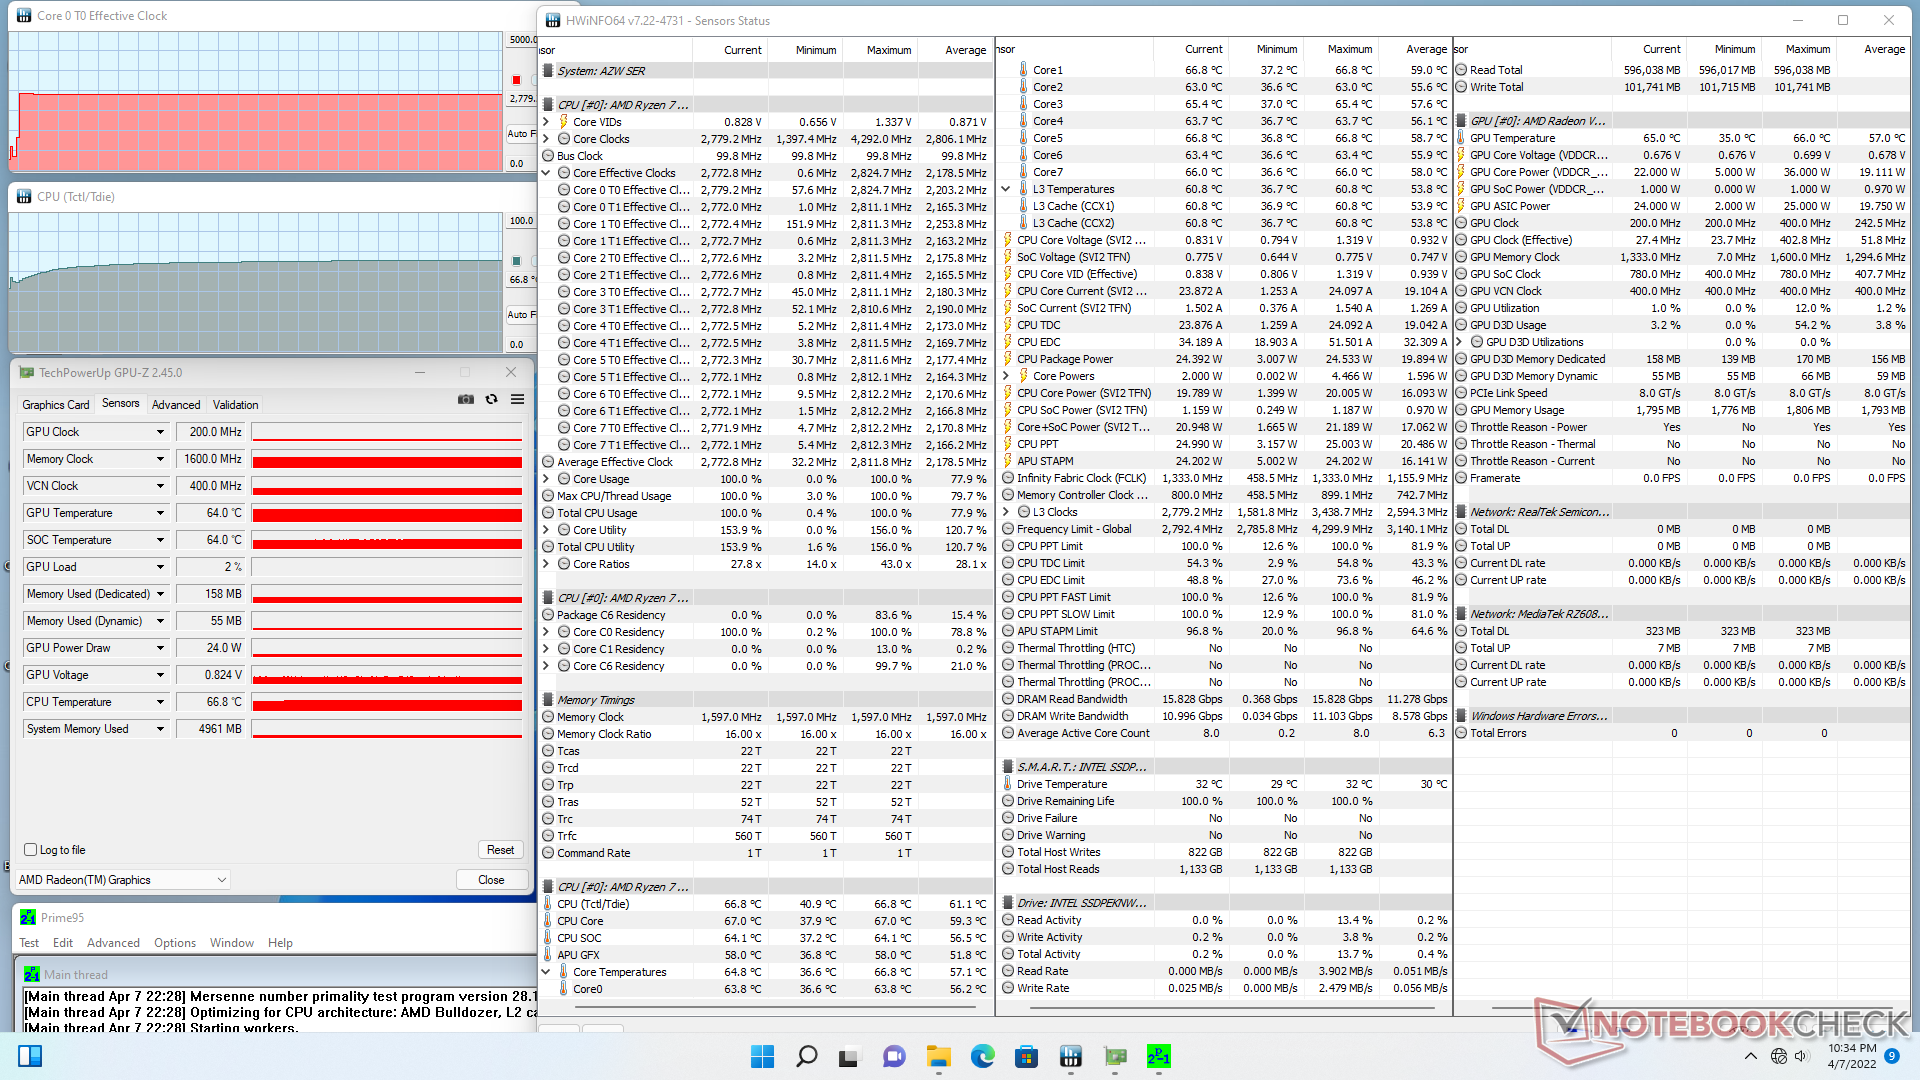
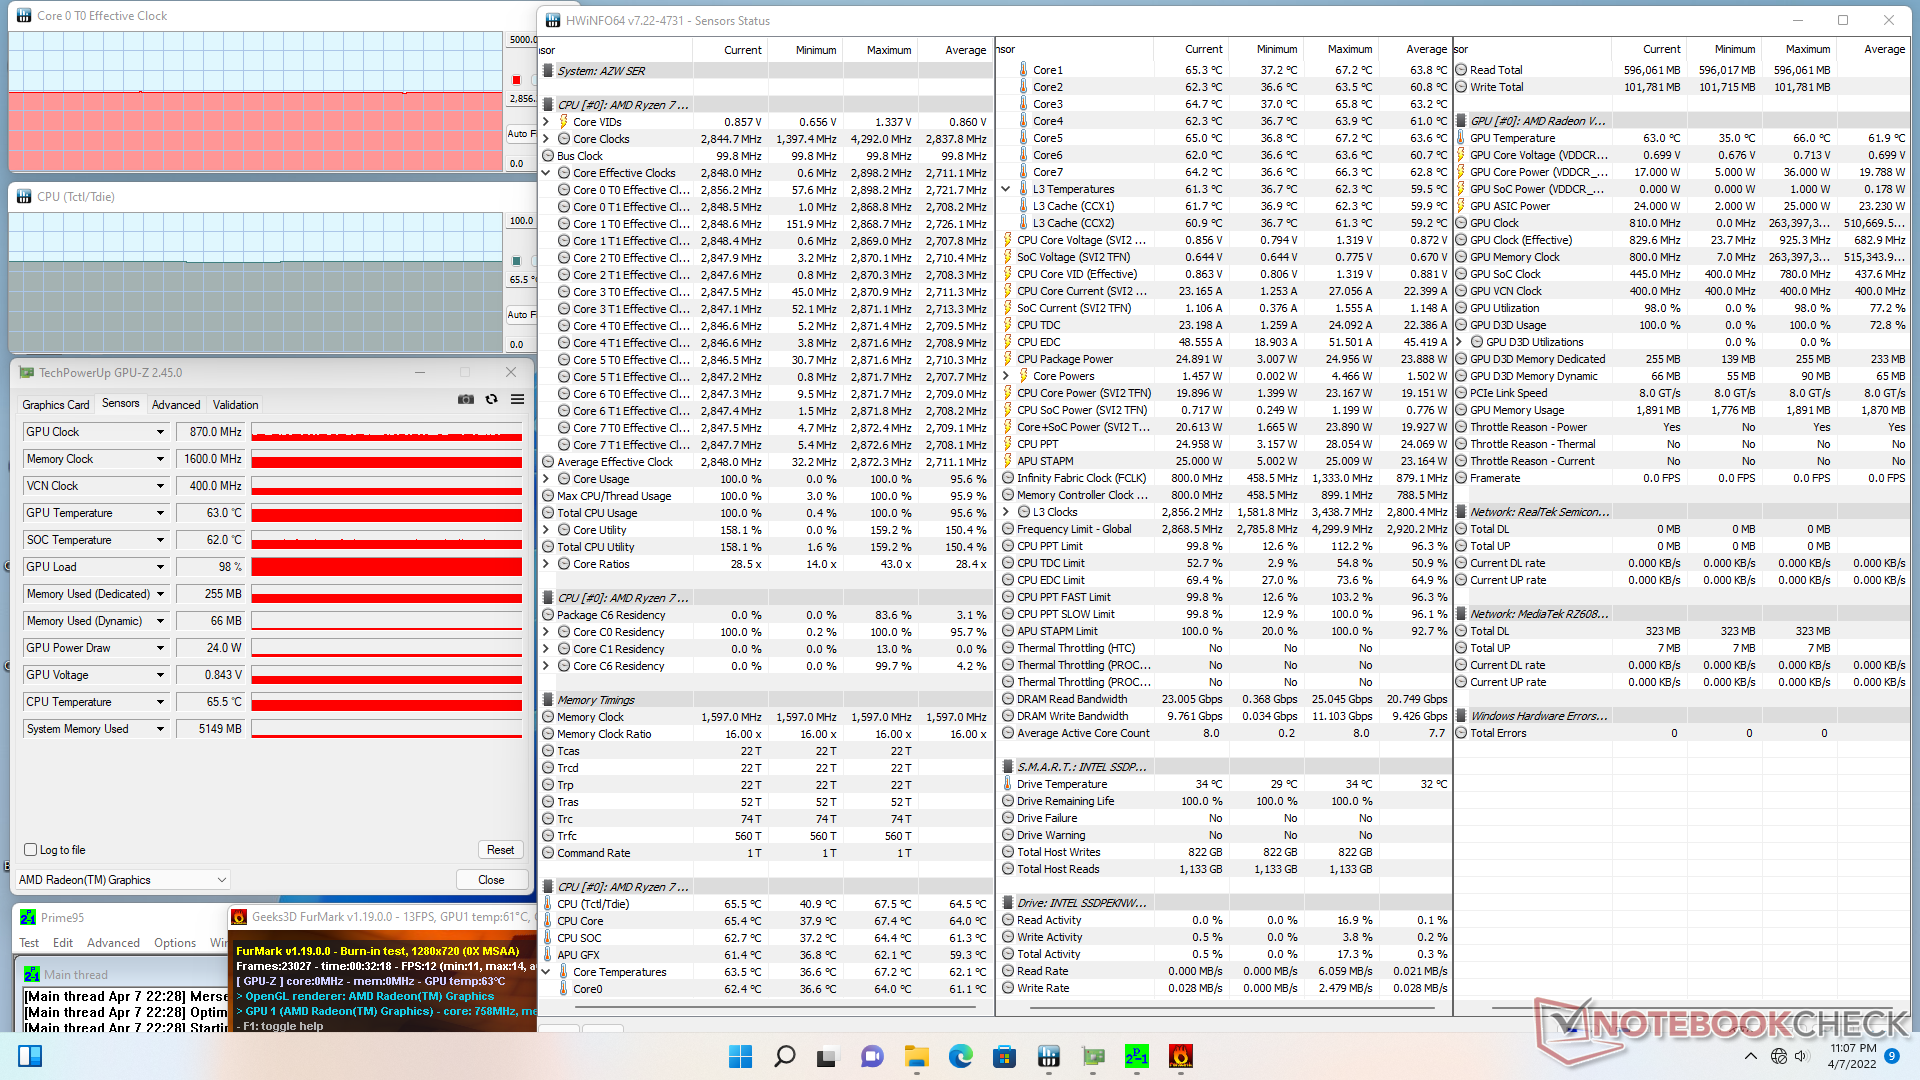
| Fréquence du CPU (GHz) | Fréquence du GPU (MHz) | Température moyenne du CPU SoC (°C) | |
| Système au repos | -- | -- | 37 |
| Prime95 Stress | 2.8 | -- | 64 |
| Prime95 + FurMark Stress | 2.9 | 870 | 62 |
| Witcher 3 Stress | 0.6 | 1525 | 58 |
Gestion de l'énergie
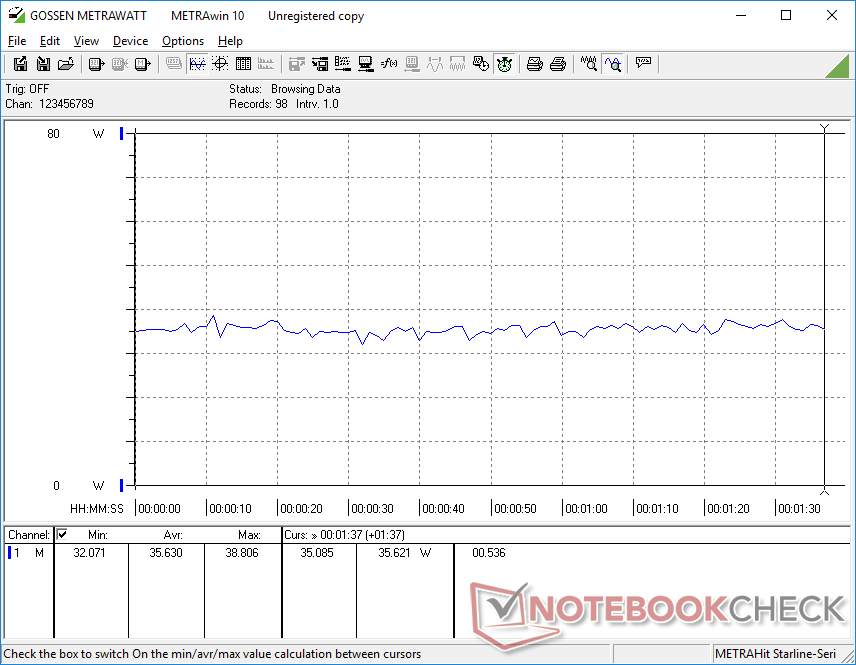
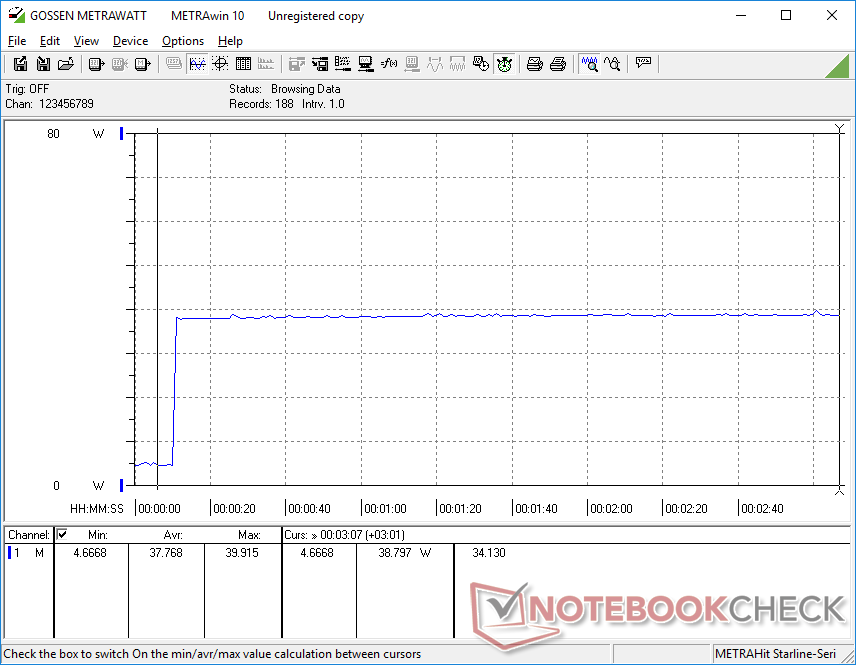
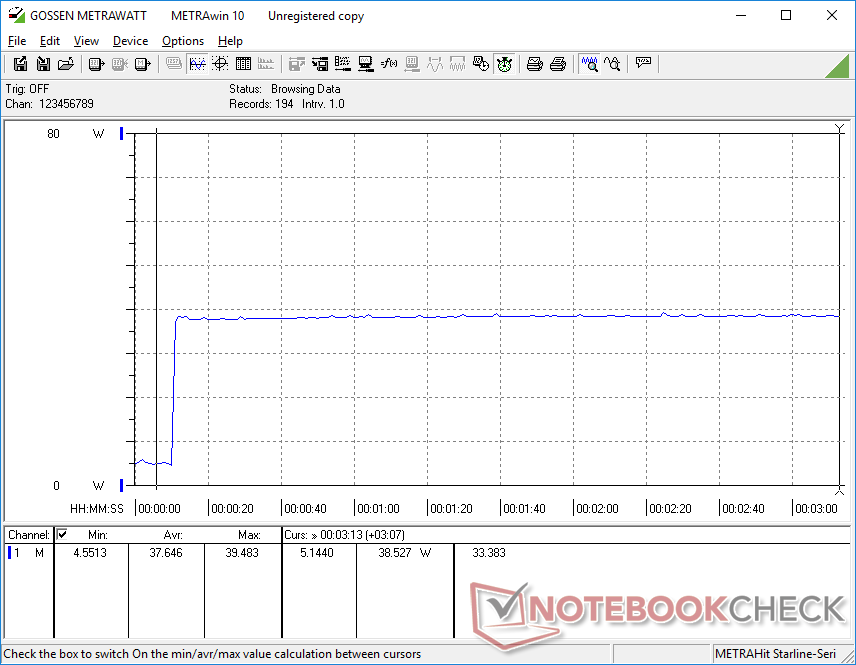
Consommation d'énergie
Le SER4 demande à peu près autant d'énergie que le NUC11PAQi7 d'Intel malgré toutes leurs différences de performances. En d'autres termes, le système Beelink offre une meilleure performance CPU par watt mais une performance GPU par watt inférieure à celle du NUC Core i7-1165G7.
Nous avons pu enregistrer une consommation maximale de 49 W sur le petit adaptateur secteur ())(() 57 W avec Prime95 et FurMark simultanément. Cette consommation peut être augmentée si vous connectez des périphériques USB supplémentaires comme des écrans ou des smartphones.

| Éteint/en veille | |
| Au repos | |
| Fortement sollicité |
|
Légende:
min: | |
| Beelink SER4 R7 4800U, Vega 8, Intel SSD 660p SSDPEKNW512G8, , x, | GMK NucBox 3 Celeron J4125, UHD Graphics 600, Netac S535N8/256GYN, , x, | Beelink GTR5 R9 5900HX, Vega 8, Kingston NV1 SNVS/500GCN, , x, | Intel NUC11PAQi7 i7-1165G7, Iris Xe G7 96EUs, Samsung SSD 980 Pro 500GB MZ-V8P500BW, , x, | Beelink SER3 R7 3750H, Vega 10, GSemi AZW GSDFN512TS3F1OGCX, , x, | Intel NUC10i5FNK i5-10210U, UHD Graphics 620, Kingston RBUSNS8154P3256GJ1, , 0x0, 0" | |
|---|---|---|---|---|---|---|
| Power Consumption | 36% | -89% | -34% | -50% | -165% | |
| Idle Minimum * (Watt) | 4.1 | 3 27% | 6.2 -51% | 5.6 -37% | 7 -71% | |
| Idle Average * (Watt) | 4.1 | 3.1 24% | 8.9 -117% | 5.6 -37% | 9.1 -122% | 15.7 -283% |
| Idle Maximum * (Watt) | 4.6 | 3.6 22% | 9 -96% | 6 -30% | 9.7 -111% | |
| Load Average * (Watt) | 35.6 | 11.1 69% | 66.8 -88% | 31.4 12% | 29.5 17% | |
| Witcher 3 ultra * (Watt) | 35.6 | 62.6 -76% | 39 -10% | 32.5 9% | ||
| Load Maximum * (Watt) | 39.9 | 25.4 36% | 81.6 -105% | 80.5 -102% | 48.7 -22% | 58.6 -47% |
* ... Moindre est la valeur, meilleures sont les performances
Power Consumption Witcher 3 / Stresstest
{
Points positifs
Points négatifs
Verdict - Haute performance par dollar
Pour 600 dollars américains sur Amazon, les utilisateurs obtiennent le CPU Ryzen 7 4800U avec 16 Go de RAM, une licence Windows 11 Pro et un SSD de 512 Go. En revanche, un Intel NUC 11 équipé du Core i7-1165G7 est vendu au détail pour un peu plus de 700 dollars américains, sans système d'exploitation, RAM ou stockage. La SER4 offre des performances de CPU multithread plus rapides à un prix nettement inférieur à celui de l'option Intel, ce qui est sa caractéristique la plus notable.
La SER4 a rendu la SER3 obsolète. Son processeur Ryzen 7 4800U n'est pas en reste, avec des vitesses rivalisant avec n'importe quelle option Intel NUC 11 équipée d'un Core U.
L'inconvénient le plus notable du SER4 est son bruit de ventilateur plus fort que l'Intel NUC. Nous avons rencontré ce problème sur de nombreux autres mini PC Beelink et le SER4 continue cette tendance. Des inconvénients plus petits incluent la performance graphique légèrement plus lente comparée aux Iris Xe 96 EUs, une garantie de base d'un an au lieu de trois, le support SSD PCIe3 au lieu de PCIe4, pas de support Thunderbolt, et une interface utilisateur BIOS moins développée qu'un Intel NUC. Si ces inconvénients ne sont pas des préoccupations majeures, alors le SER4 est une forte recommandation comme alternative au NUC d'Intel.
Prix et disponibilité
Price comparison

