Test de l'Intel NUC11PAQi7 Panther Canyon : Tiger Lake pour mini PC bien conçu
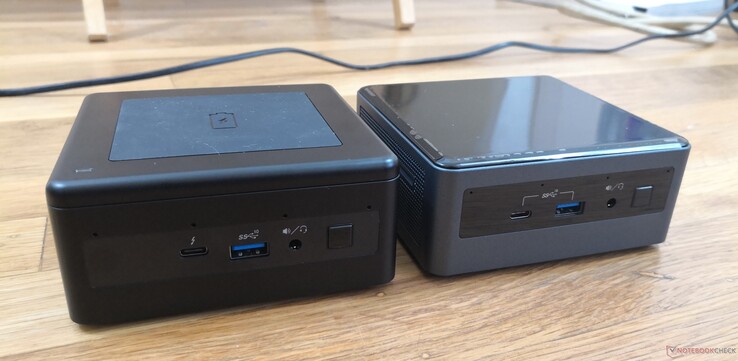
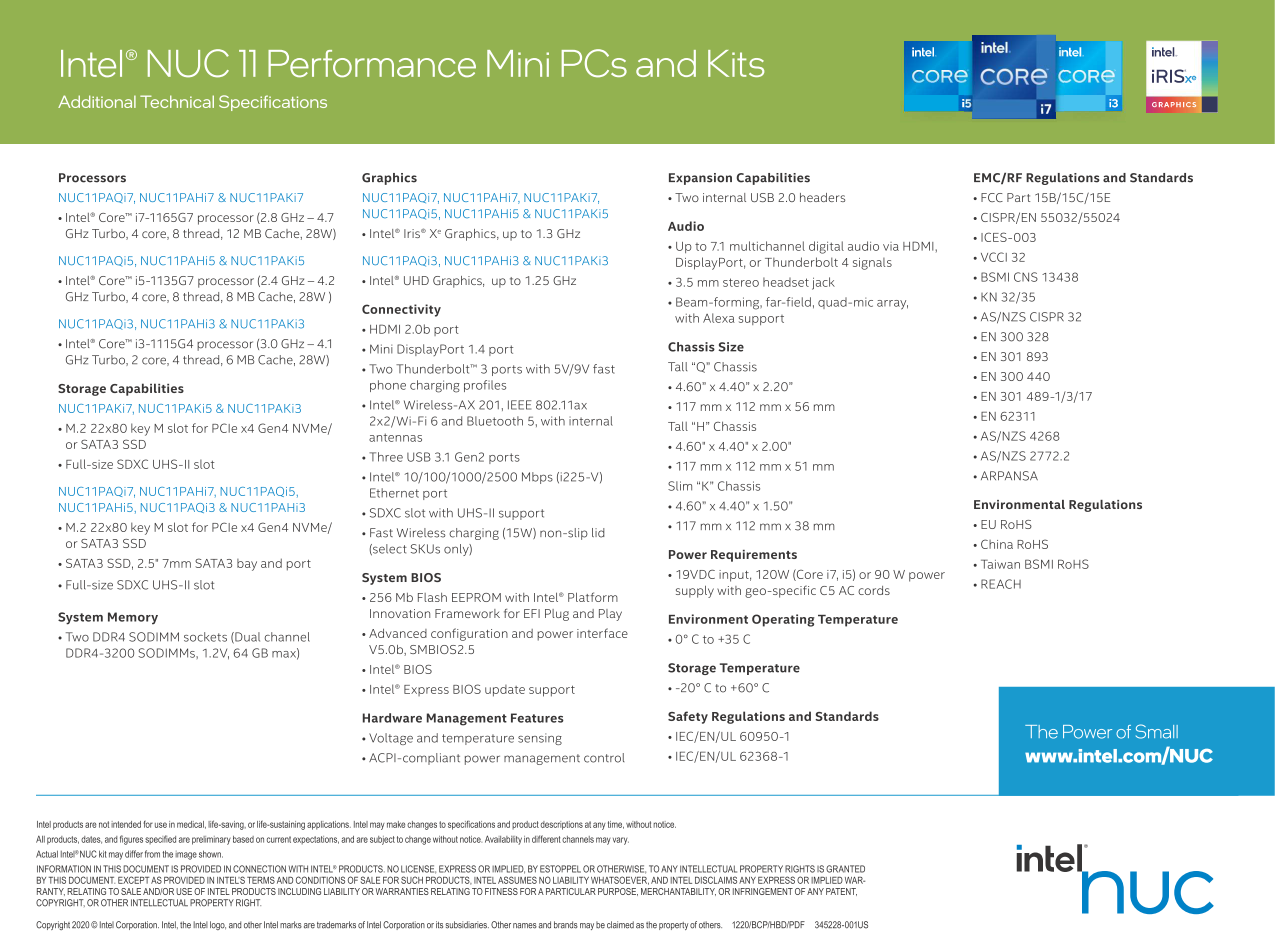
La série NUC 11 succède à la série NUC 10 de l'année dernière en introduisant de nouvelles conceptions de châssis et en actualisant les options du processeur sur Tiger Lake-U. Trois modèles sont disponibles en différentes tailles : le grand NUC11PAQ, le moyen NUC11PAH et le petit NUC11PAK. Les différences physiques et les caractéristiques sont toutes détaillées dans la fiche produit officielle d'Intel ci-dessous.
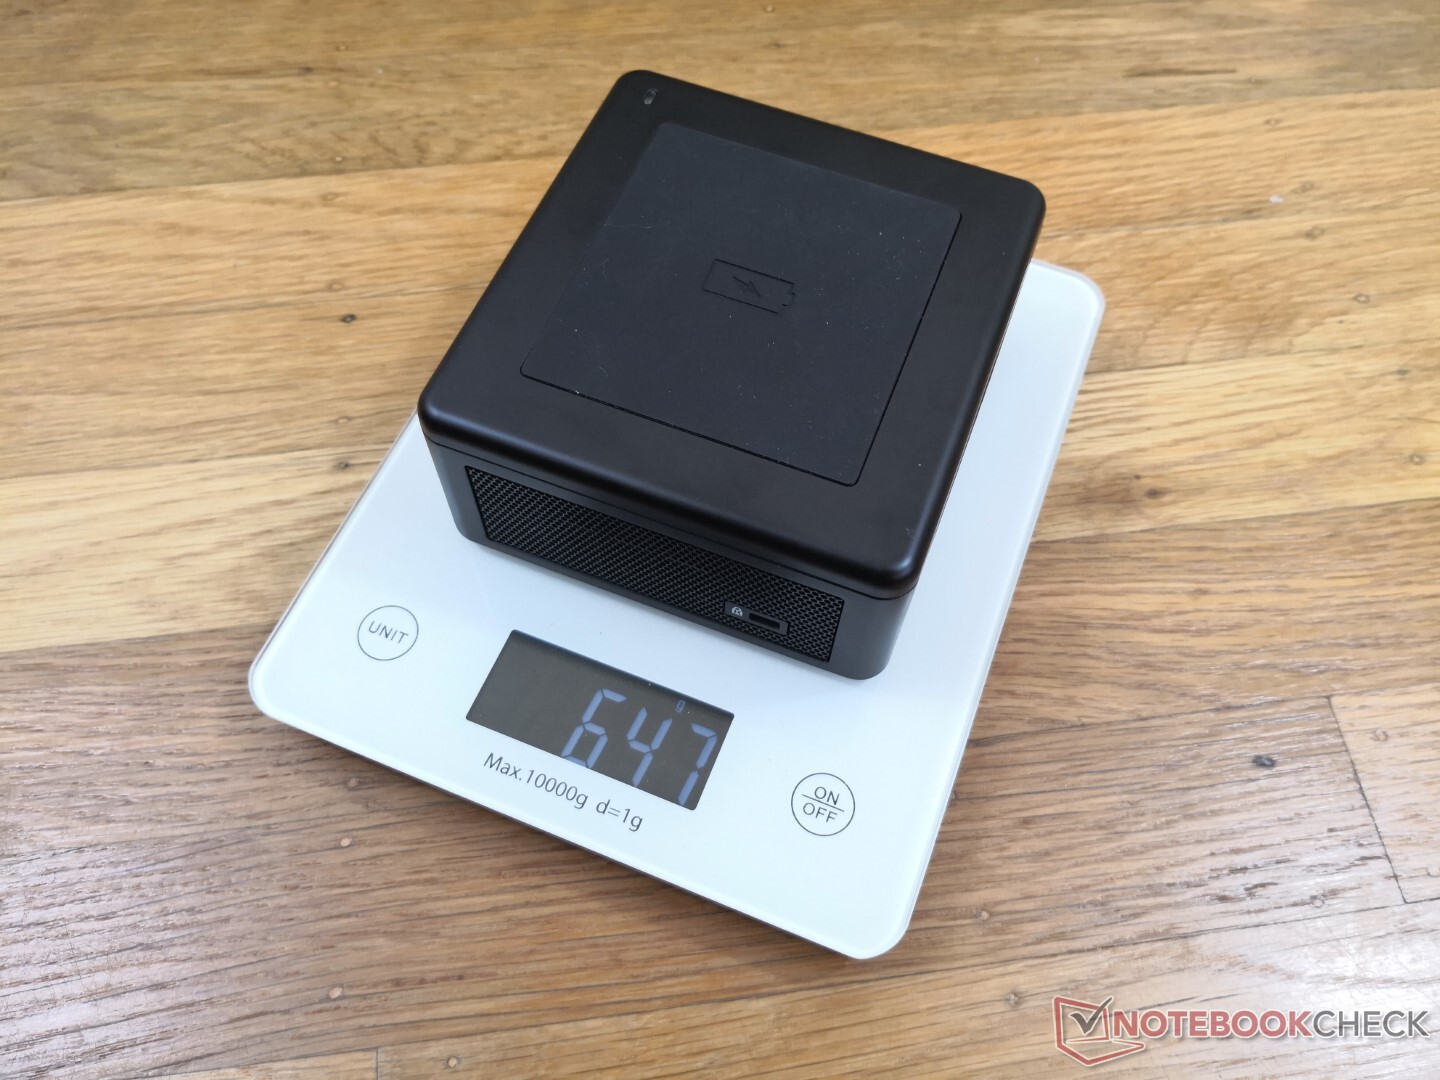
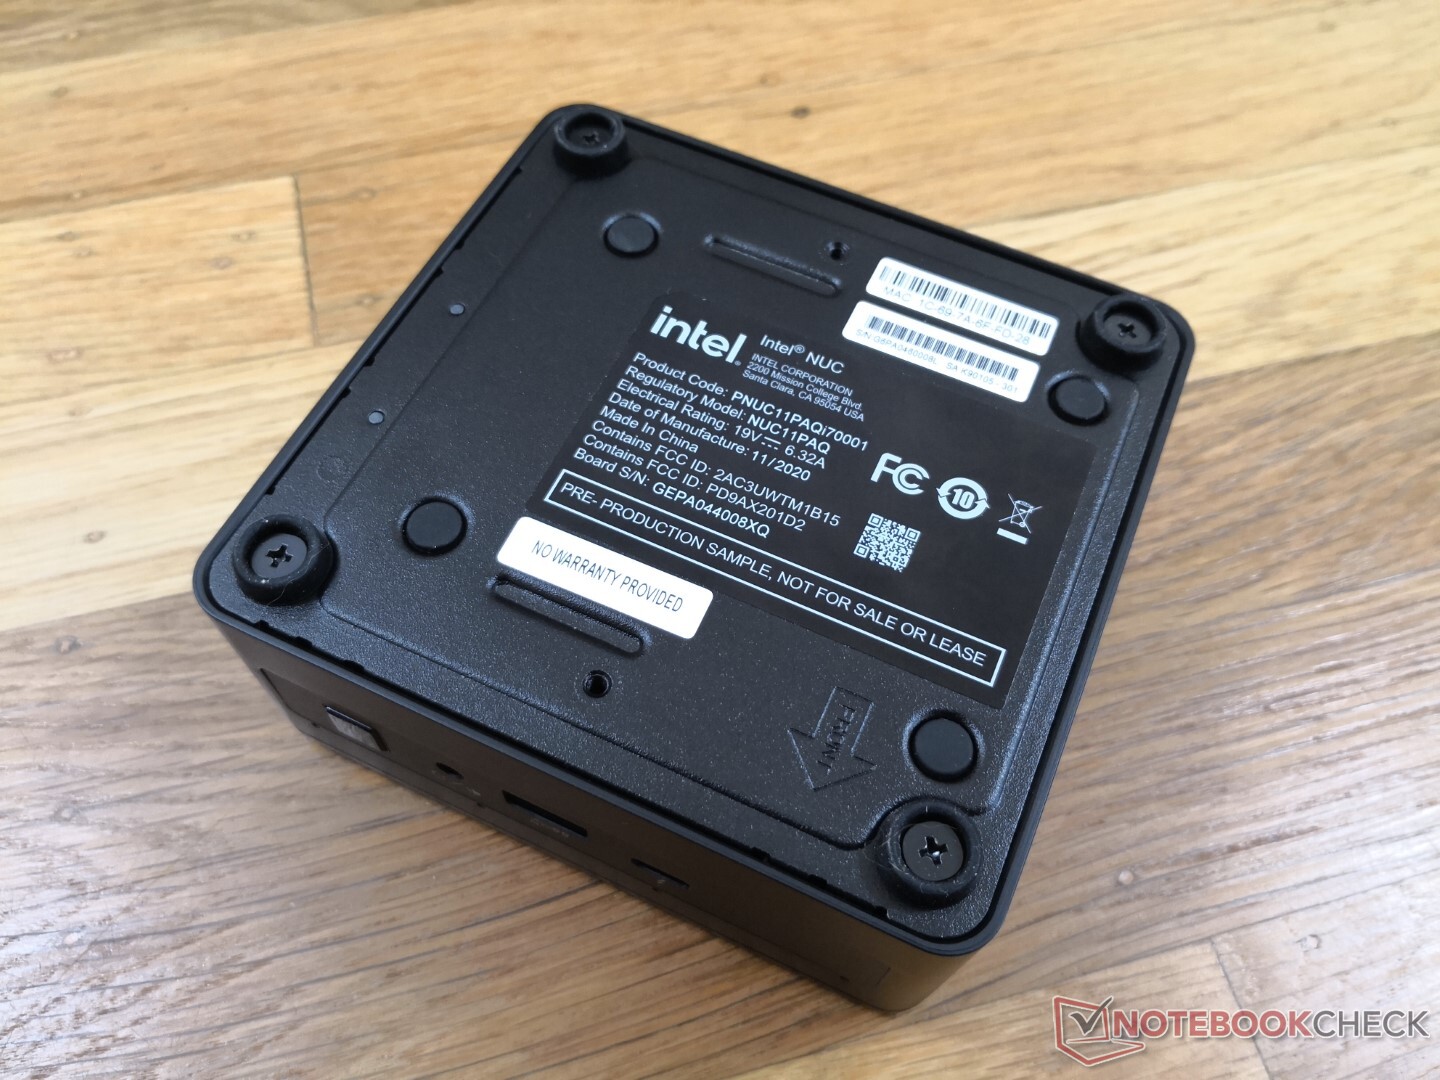
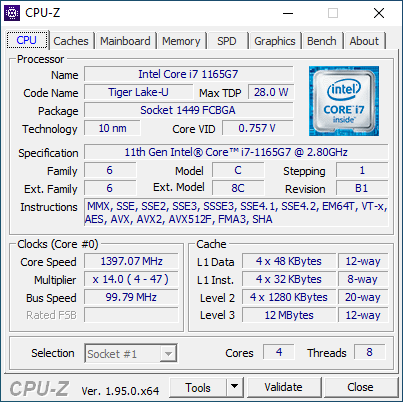
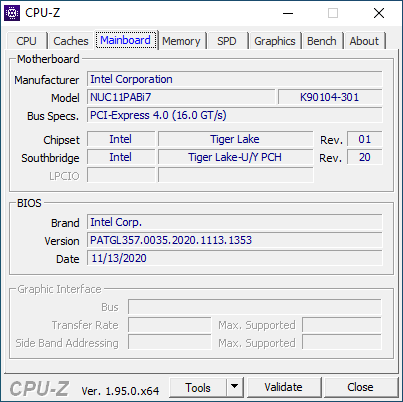
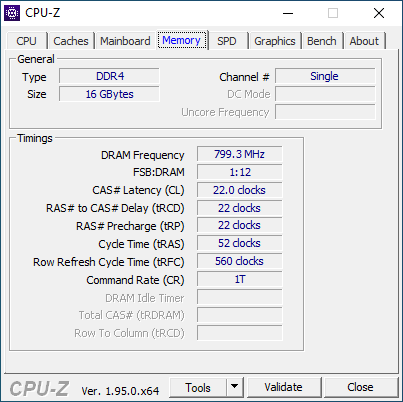
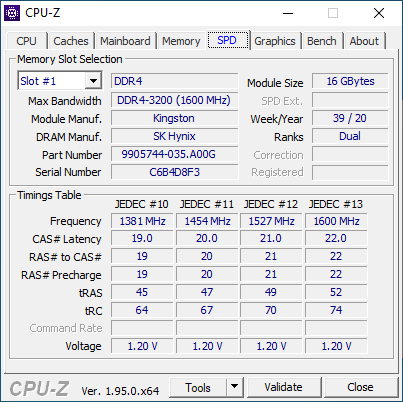
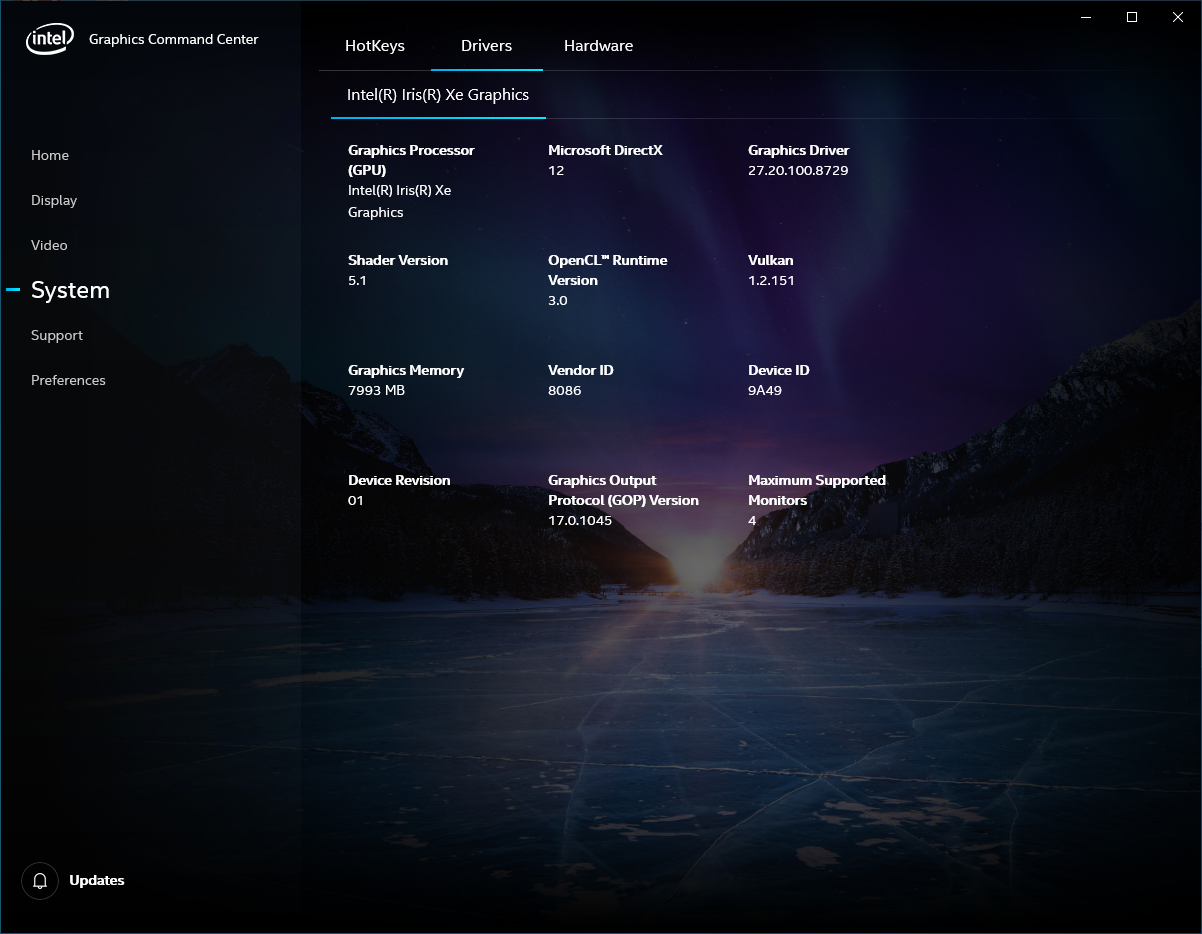
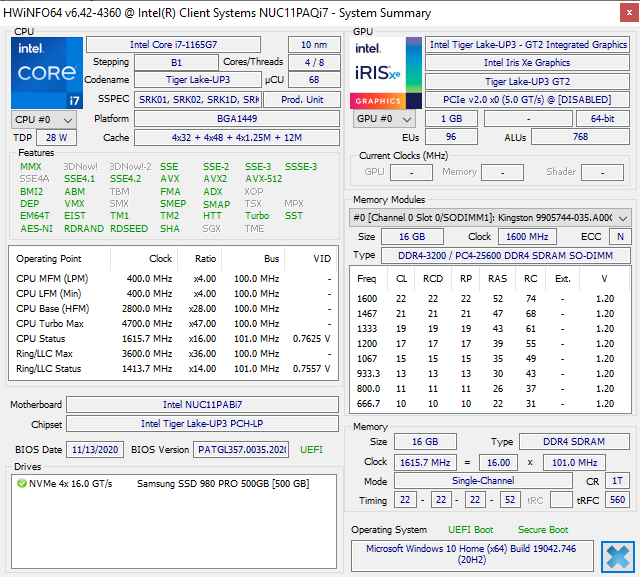
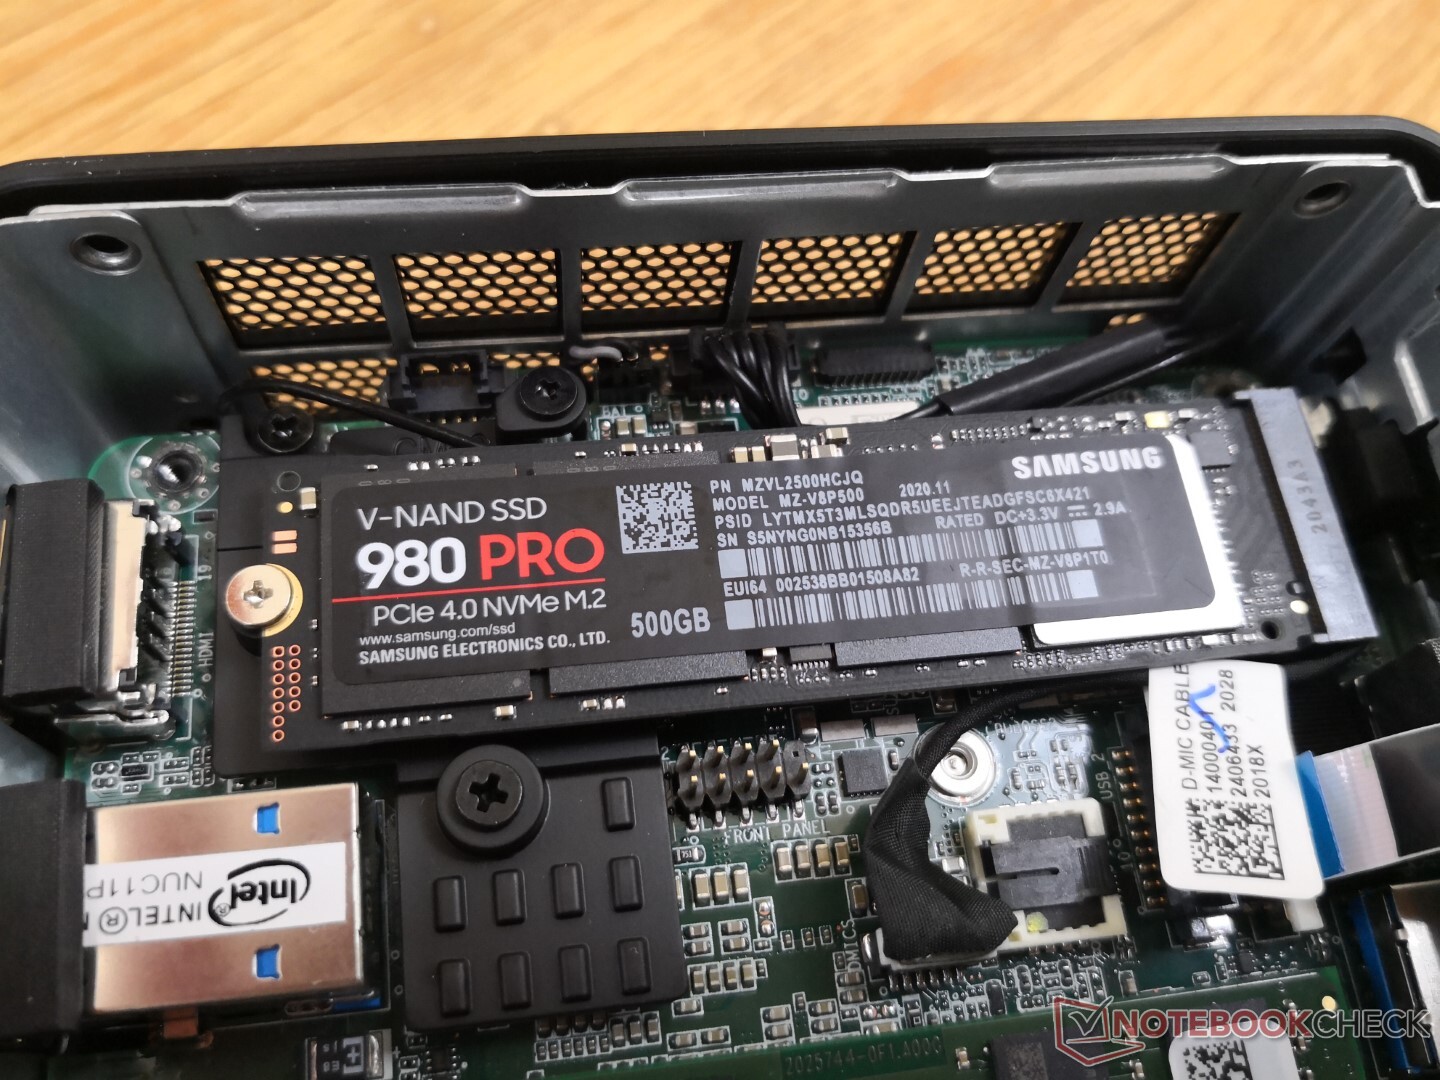
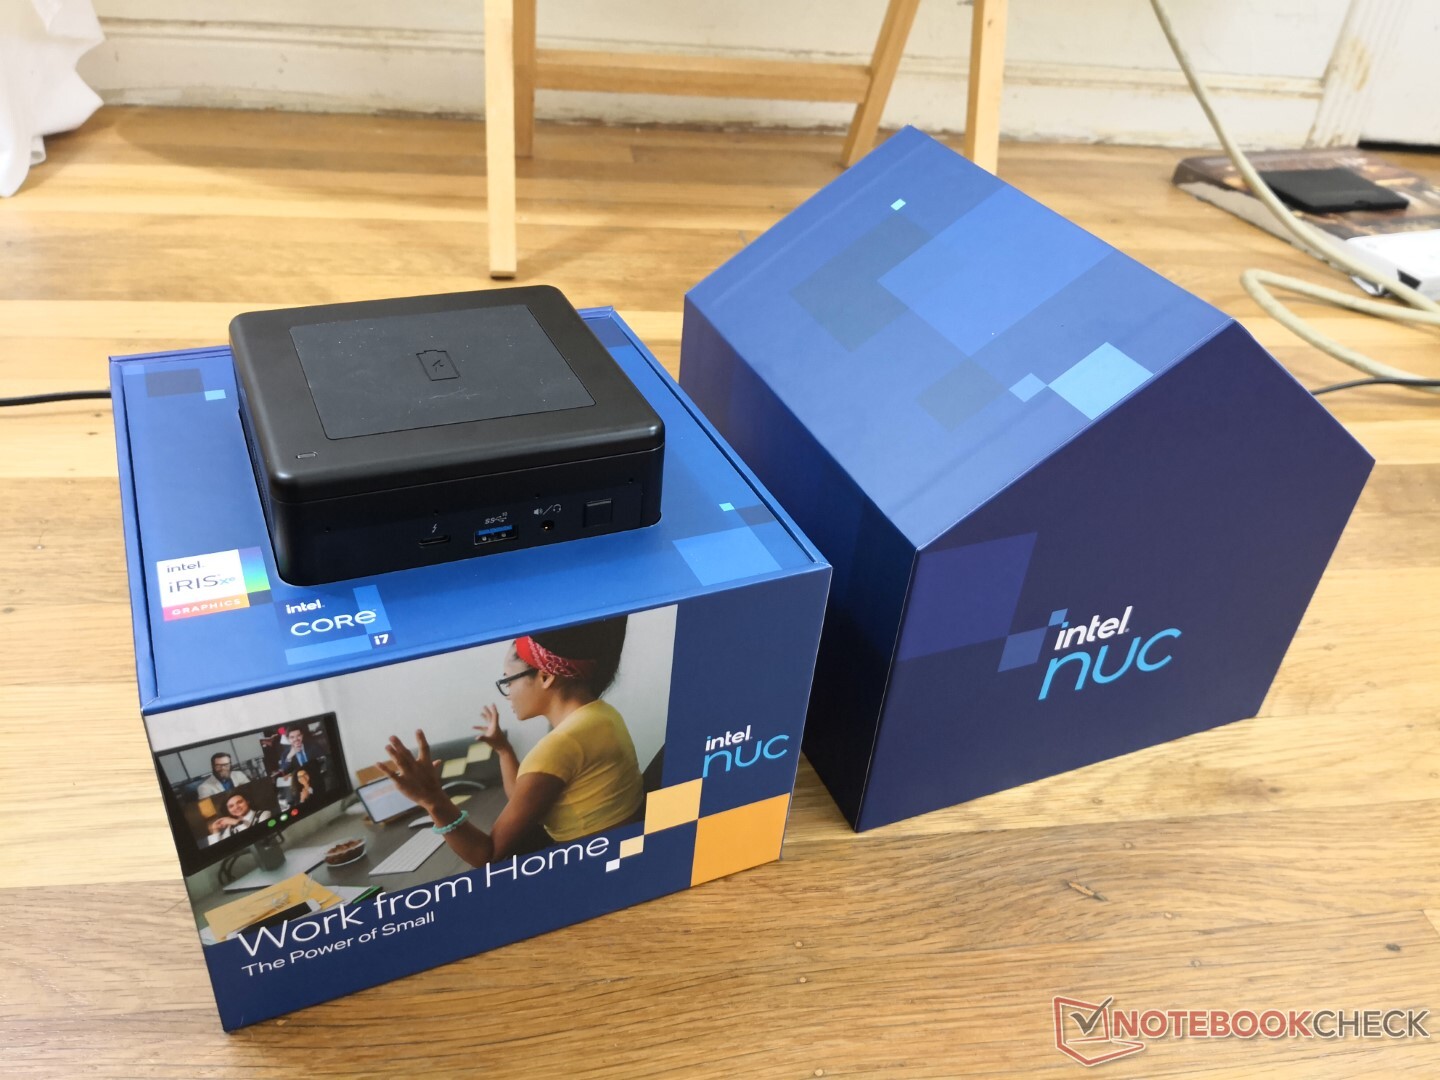
Notre unité d'évaluation ici est le NUC11PAQ équipé du processeur Core i7-1165G7, de 16 Go de RAM monocanal, et de 500 Go de SSD Samsung 980 Pro NVMe PCIe 4.0. Les unités de gestion des stocks Core i5-1135G7 et Core i3-1115G4 sont également disponibles, toutes avec des graphiques Iris Xe intégrés.
Plus de commentaires sur Intel NUC :
potential competitors in comparison
Note | Date | Modèle | Poids | Épaisseur | Taille | Résolution | Prix |
|---|---|---|---|---|---|---|---|
v (old) | 02/21 | Intel NUC11PAQi7 i7-1165G7, Iris Xe G7 96EUs | 647 g | 56 mm | x | ||
v (old) | 02/20 | Intel NUC10i7FNH i7-10710U, UHD Graphics 620 | 697 g | 51 mm | 0.00" | 0x0 | |
v (old) | 11/18 | Intel NUC8i7BE i7-8559U, Iris Plus Graphics 655 | 683 g | 51 mm | x | ||
v (old) | 04/18 | Intel Hades Canyon NUC8i7HVK i7-8809G, Vega M GH | 1.3 kg | 39 mm | x | ||
v (old) | Beelink SEi10 i3-1005G1, UHD Graphics G1 (Ice Lake 32 EU) | 350 g | 41 mm | x | |||
v (old) | Zotac ZBox MI643 i5-10210U, UHD Graphics 620 | 550 g | 28.5 mm | x |
Cas
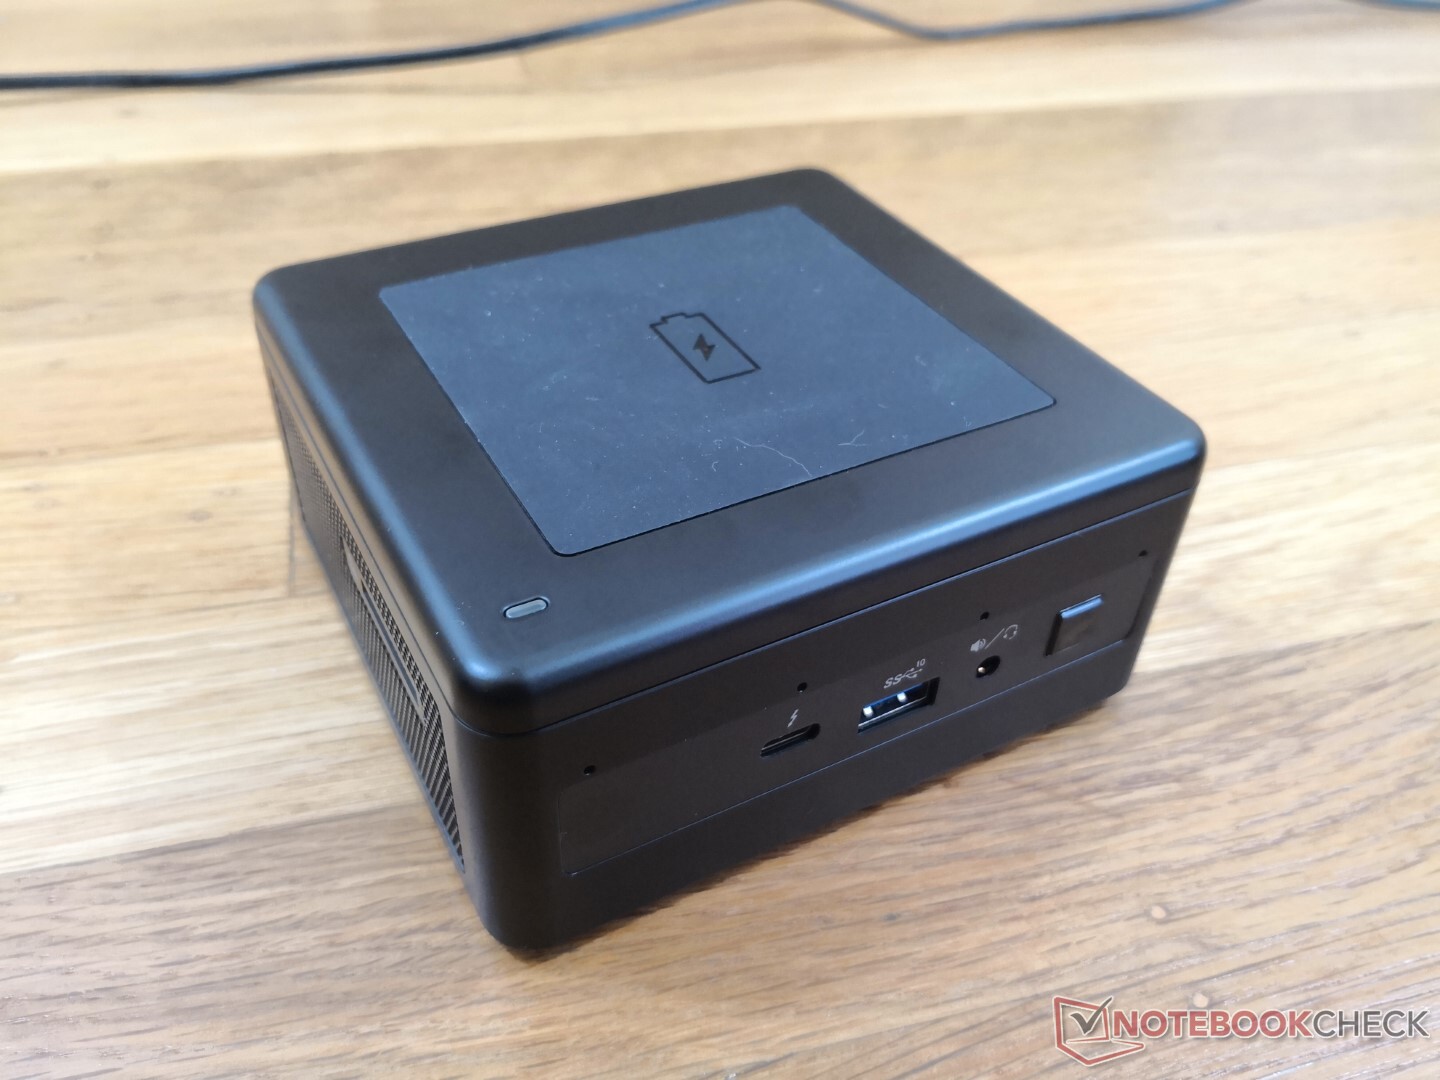
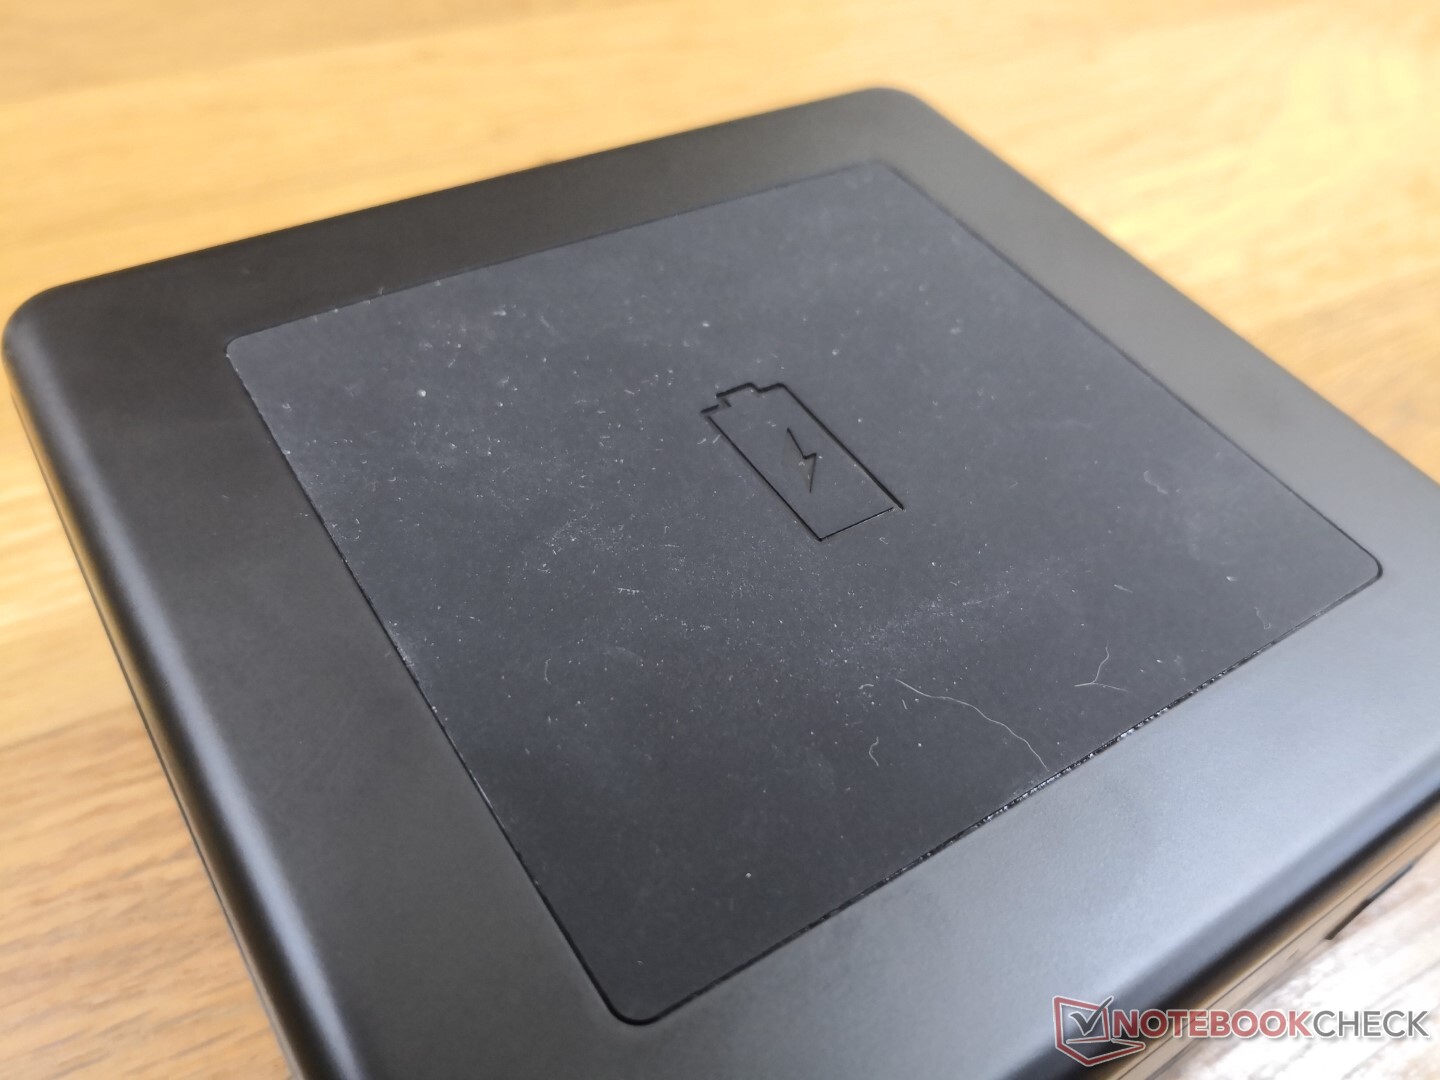
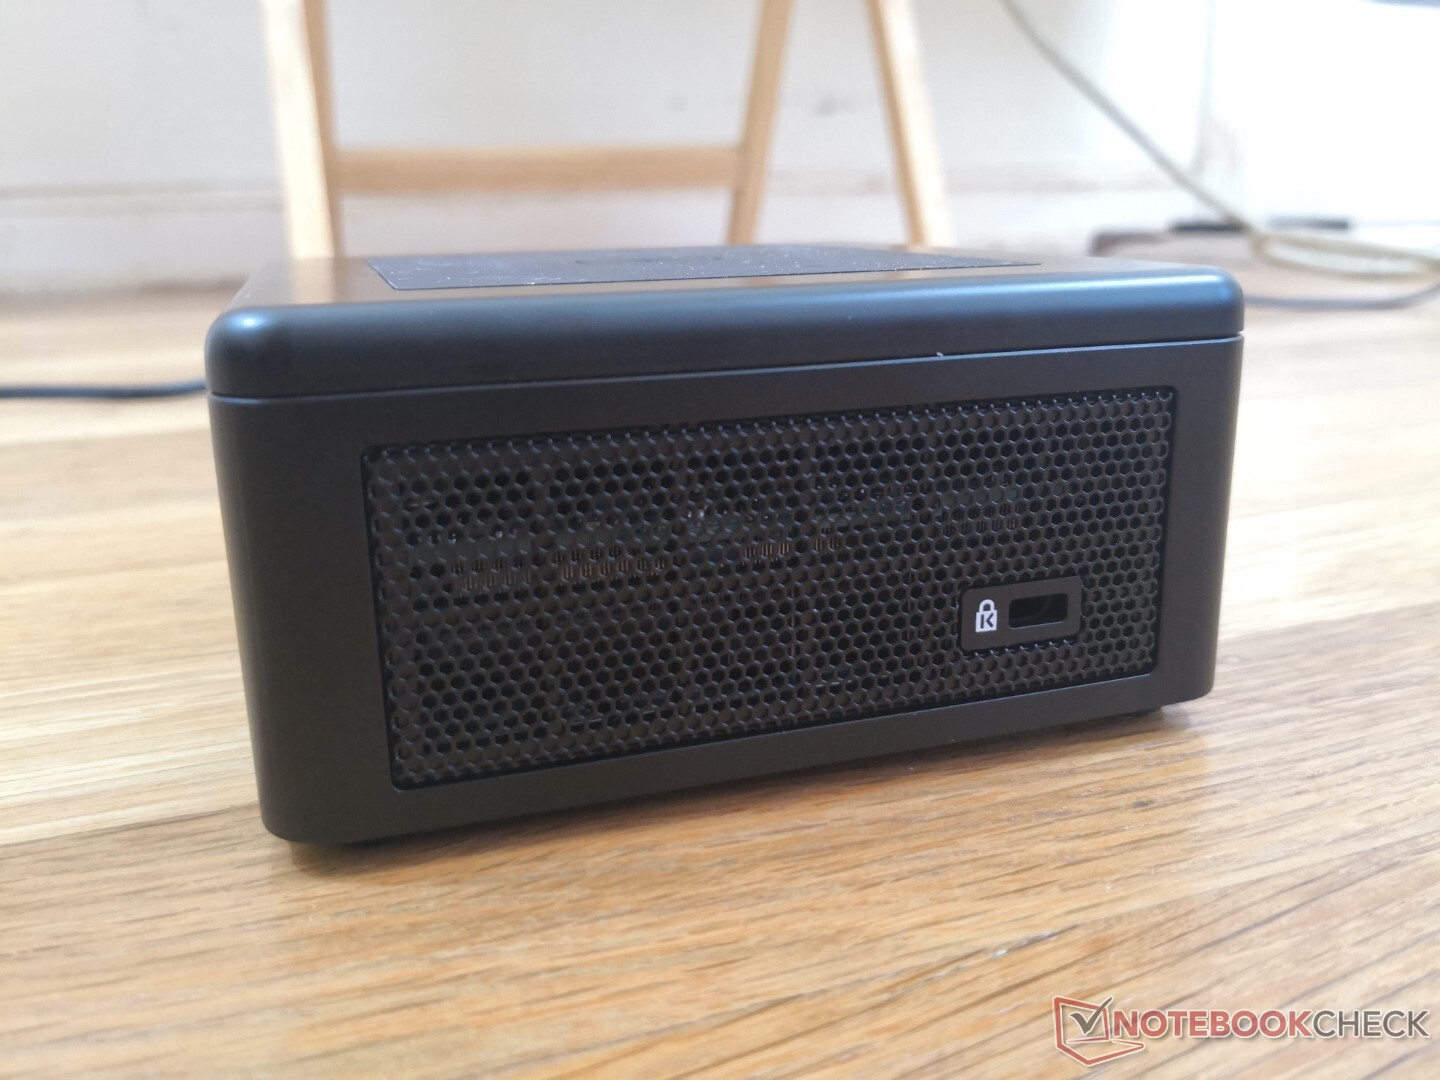
Le NUC 11PAQ reprend la forme et les matériaux familiers des précédents modèles NUC, mais avec un nouveau "tapis" de chargement du Qi en caoutchouc sur le dessus. Il a l'air plus classe que le plastique lisse et brillant du NUC 10 de l'année dernière, mais la surface en caoutchouc attirera la poussière et la fourrure comme jamais auparavant. Cette nouvelle caractéristique sera également inutile pour les propriétaires qui ont l'intention de cacher leur appareil NUC sous des tables ou de le monter verticalement derrière des écrans
Connectivité
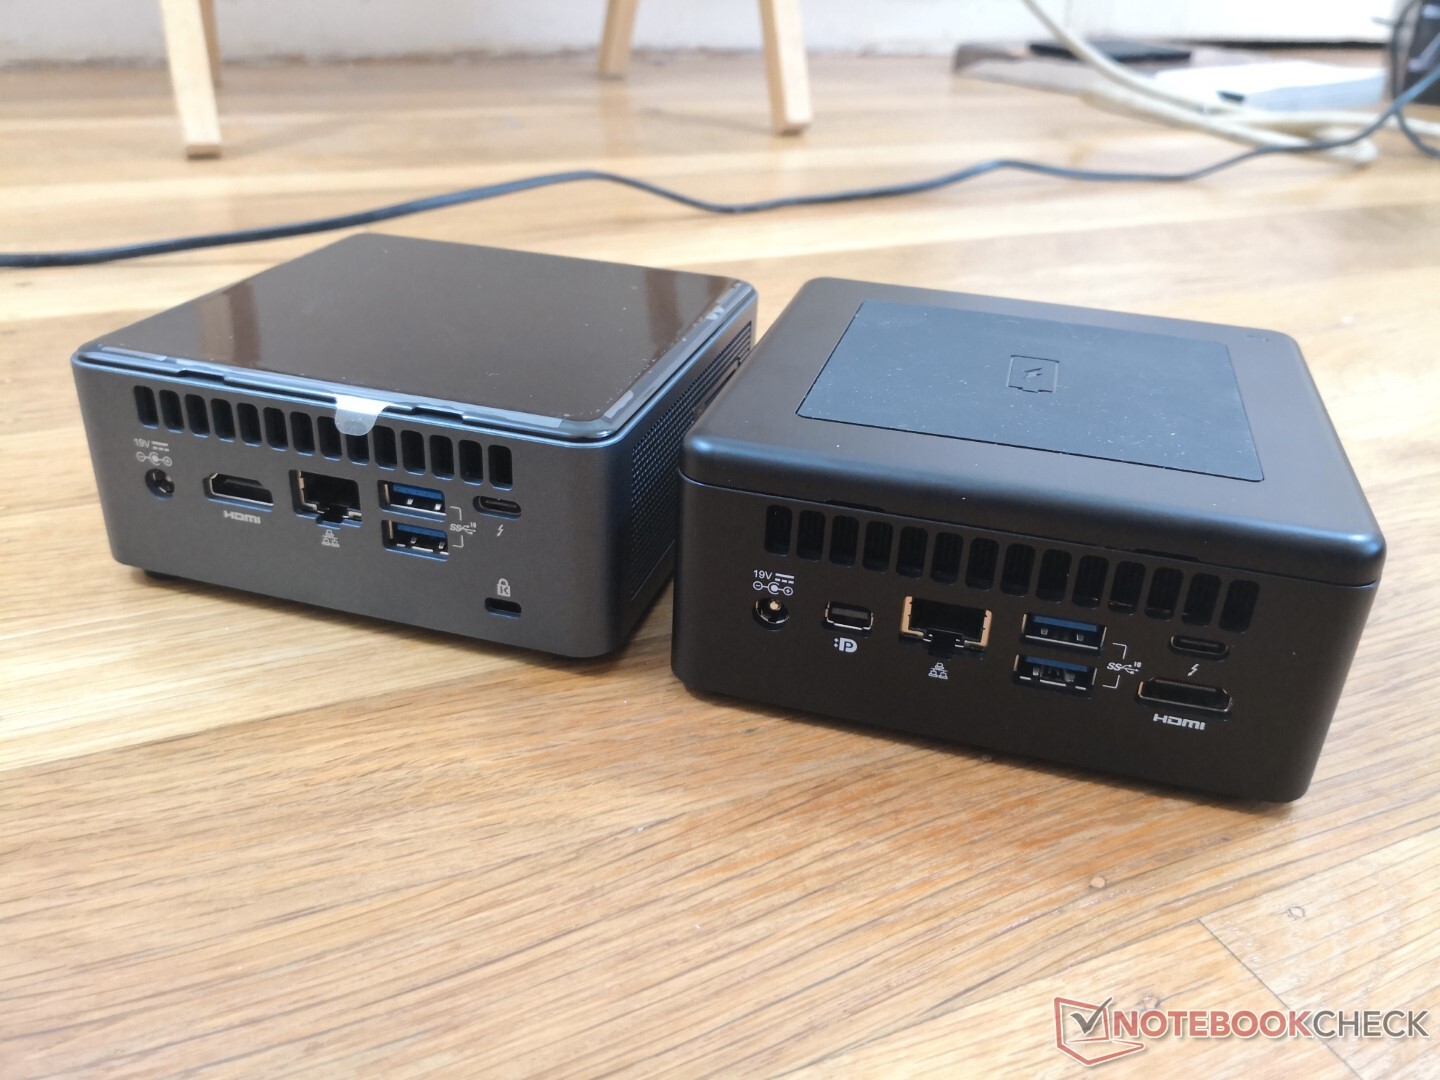
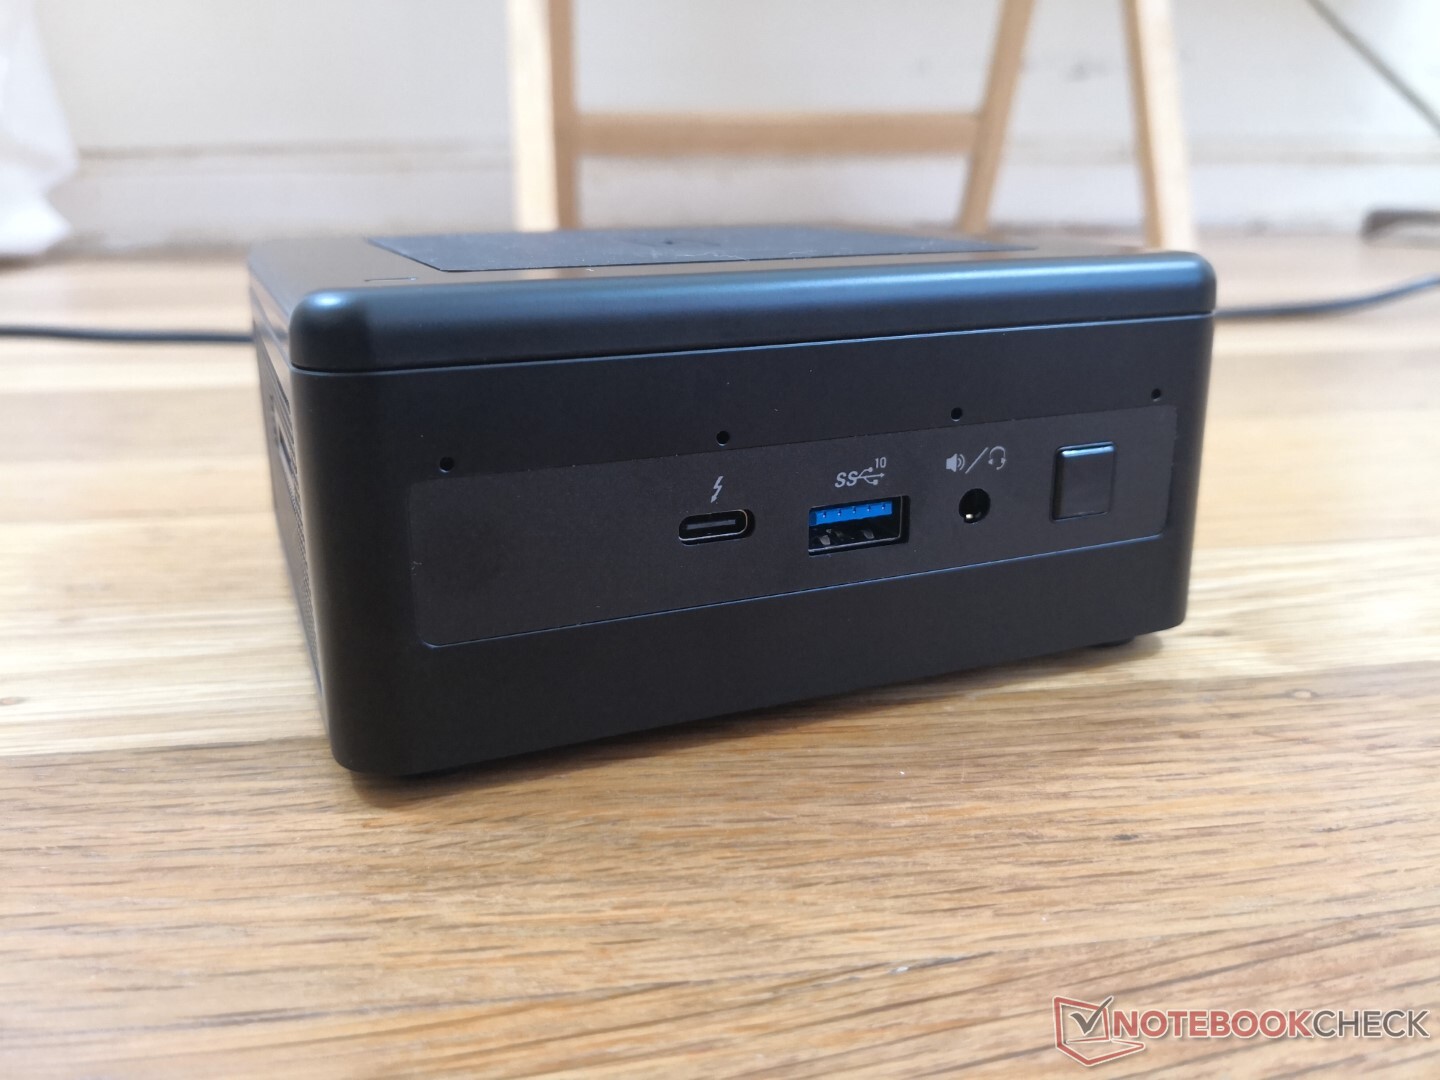
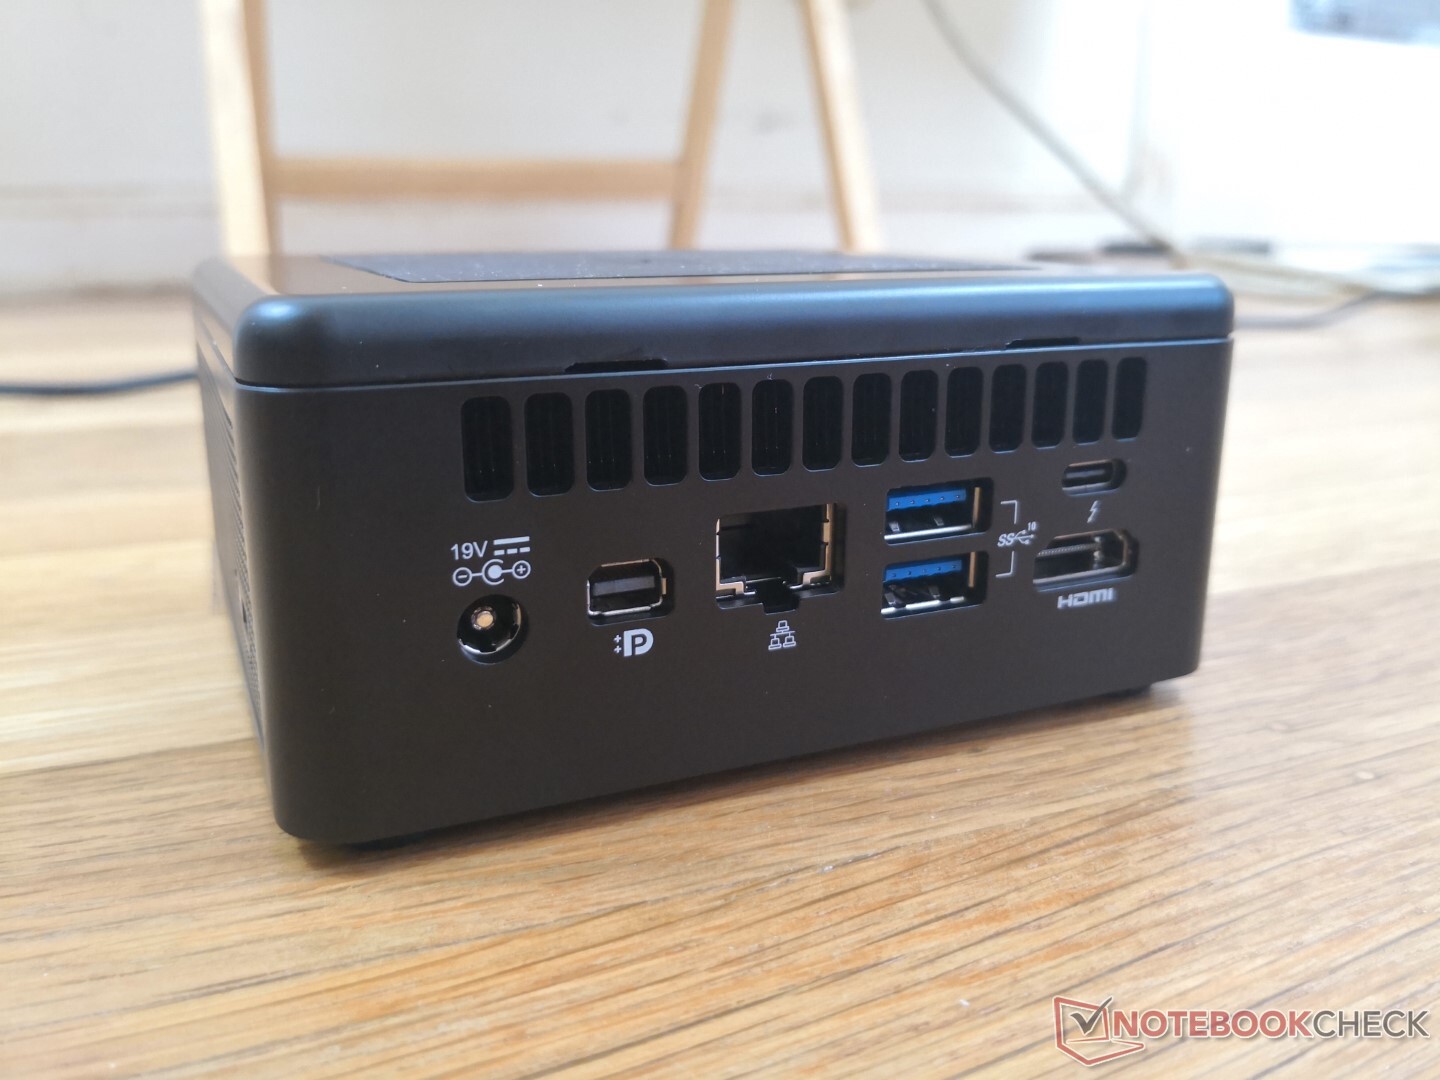
Le NUC 11 comprend tous les ports qui se trouvent sur le NUC 10, bien que légèrement réorganisés. Un nouvel ajout est le mini DisplayPort 1.4 comme quatrième option de sortie vidéo aux ports HDMI et 2x Thunderbolt 3 existants.
Malheureusement, l'adaptateur secteur propriétaire est toujours nécessaire pour alimenter le NUC car aucun des ports USB-C ne prend en charge l'alimentation.
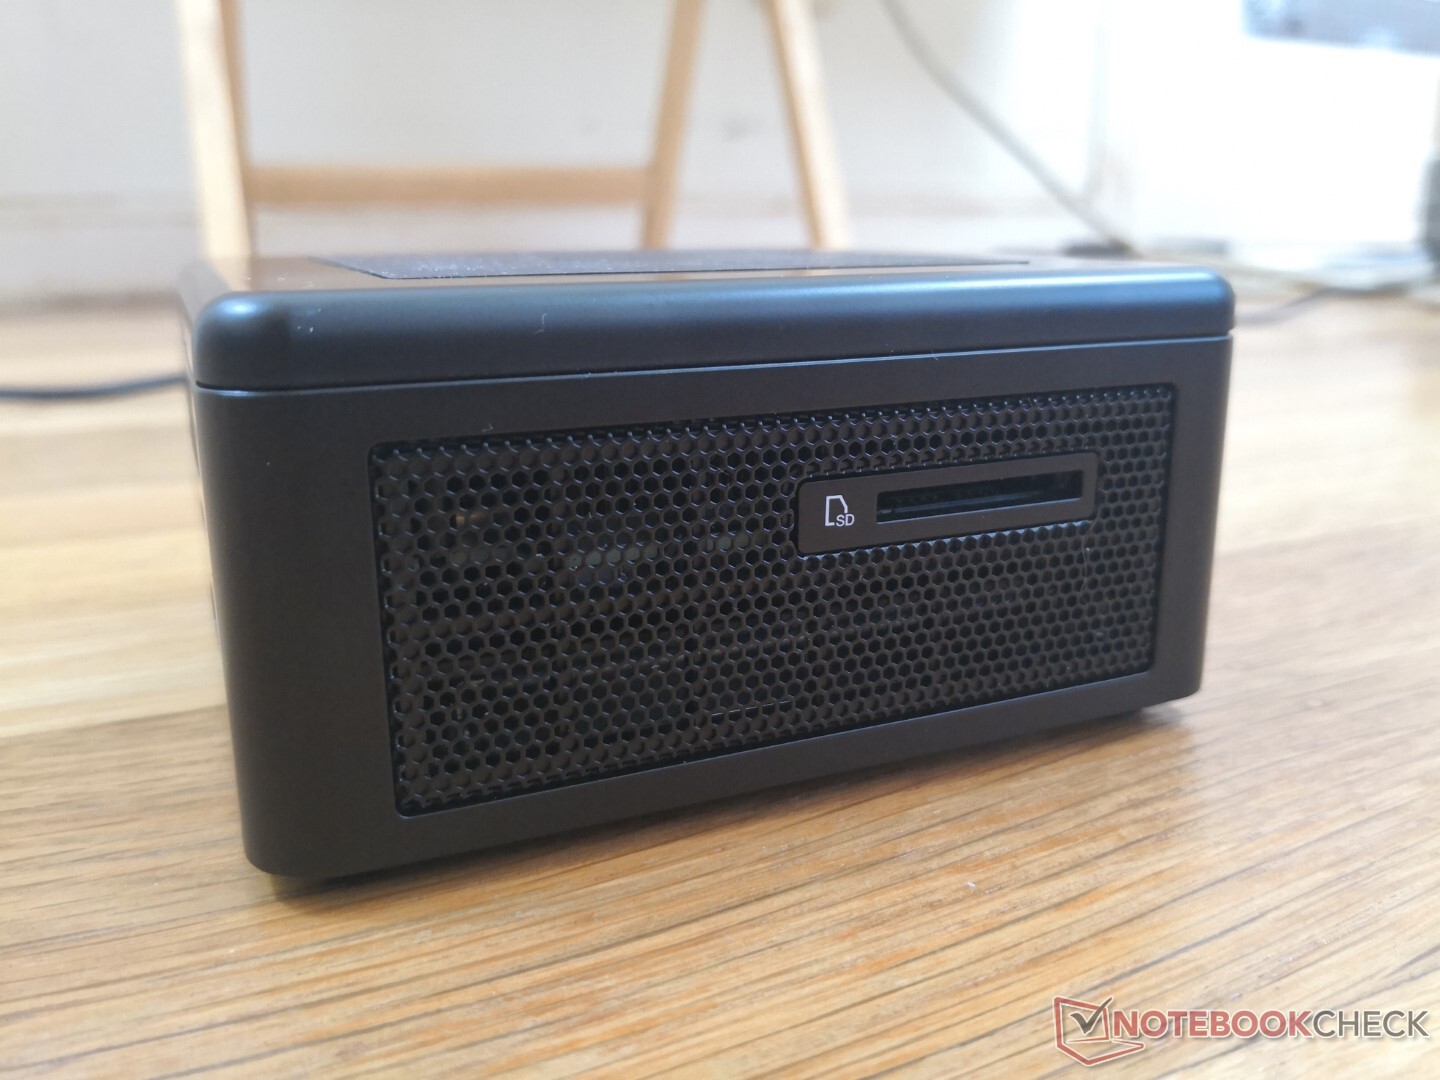
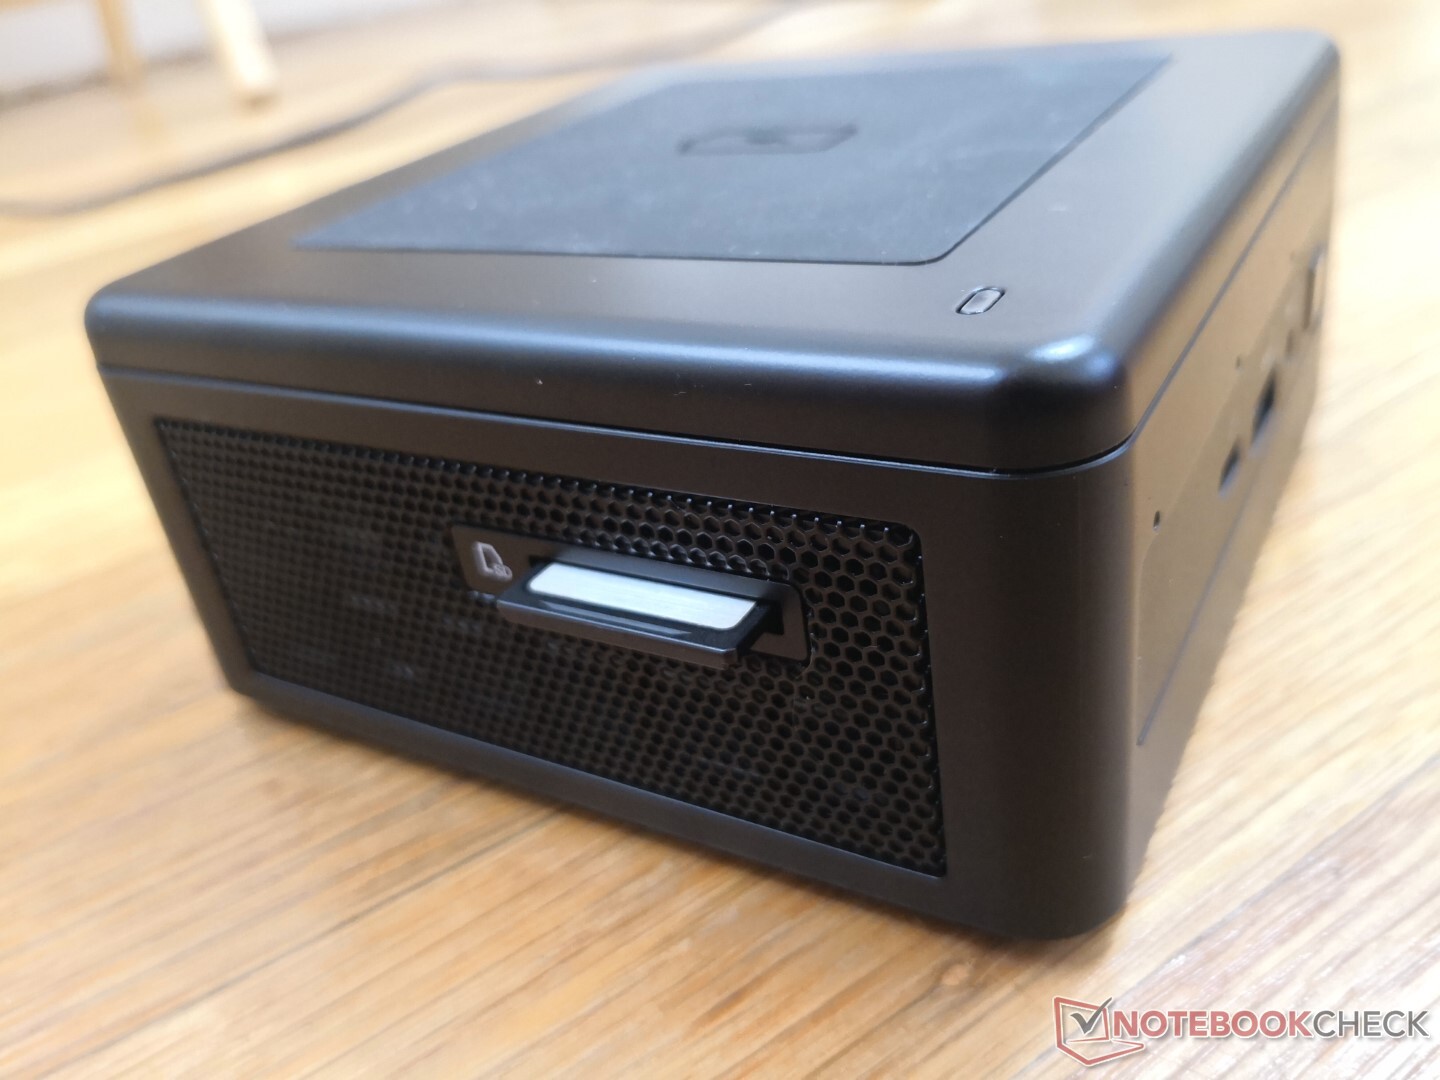
Lecteur de carte SD
Les taux de transfert du lecteur de carte intégré sont plus de deux fois plus rapides que sur l'ancien NUC de Hades Canyon. Le transfert de 1 Go de fichiers depuis notre carte test UHS-II prend environ 5 à 6 secondes, contre 12 secondes sur le Hades Canyon.
| SD Card Reader | |
| average JPG Copy Test (av. of 3 runs) | |
| Intel NUC11PAQi7 (Toshiba Exceria Pro SDXC 64 GB UHS-II) | |
| Intel Hades Canyon NUC8i7HVK (Toshiba Exceria Pro SDXC 64 GB UHS-II) | |
| Intel NUC8i7BE (Toshiba Exceria Pro M501 UHS-II) | |
| Zotac ZBox MI643 (Toshiba Exceria Pro M501 UHS-II) | |
| Beelink SEi10 (Toshiba Exceria Pro M501 UHS-II) | |
| maximum AS SSD Seq Read Test (1GB) | |
| Intel NUC11PAQi7 (Toshiba Exceria Pro SDXC 64 GB UHS-II) | |
| Intel Hades Canyon NUC8i7HVK (Toshiba Exceria Pro SDXC 64 GB UHS-II) | |
| Intel NUC8i7BE (Toshiba Exceria Pro M501 UHS-II) | |
| Zotac ZBox MI643 (Toshiba Exceria Pro M501 UHS-II) | |
| Beelink SEi10 (Toshiba Exceria Pro M501 UHS-II) | |
Communication
Wi-Fi 6 et Bluetooth 5.1 sont disponibles en standard via l'Intel AX201. Bien que nous n'ayons pas rencontré de problèmes de connectivité, les taux de transfert bruts sont plus lents que prévu par rapport aux ordinateurs portables équipés du même module AX201, d'environ la moitié. Nous pensons que cela peut être dû à une antenne plus faible dans le NUC.
| Networking | |
| iperf3 transmit AX12 | |
| Beelink SEi10 | |
| Intel NUC8i7BE | |
| Intel NUC11PAQi7 | |
| Intel Hades Canyon NUC8i7HVK | |
| Zotac ZBox MI643 | |
| iperf3 receive AX12 | |
| Beelink SEi10 | |
| Intel NUC11PAQi7 | |
| Intel NUC8i7BE | |
| Intel Hades Canyon NUC8i7HVK | |
| Zotac ZBox MI643 | |
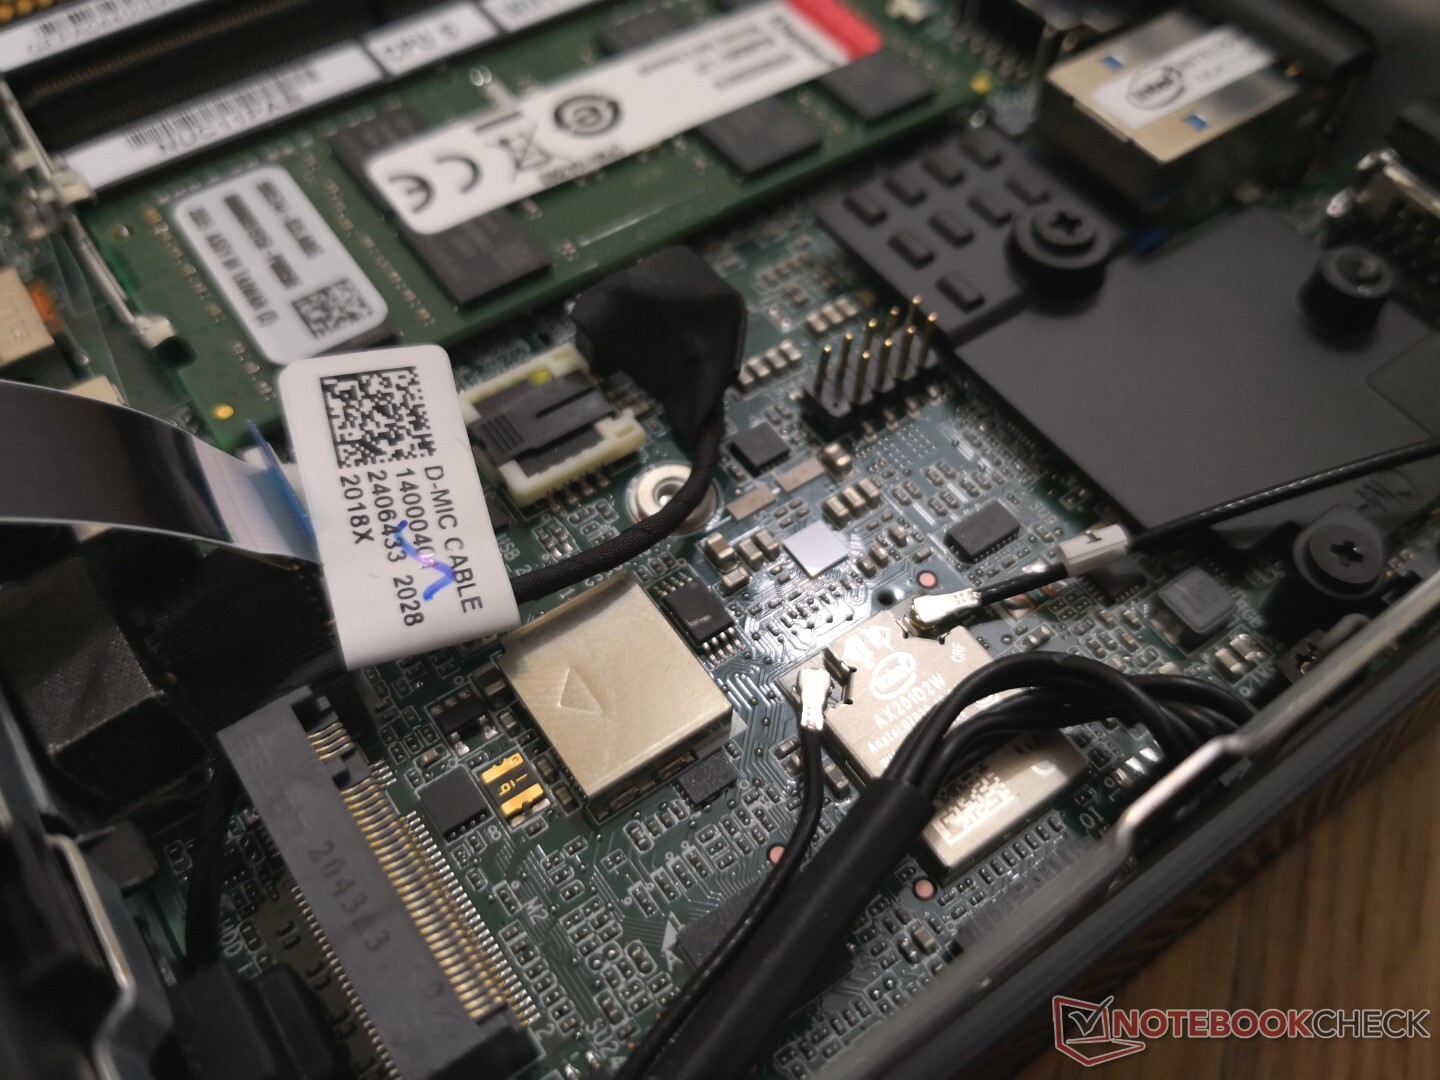
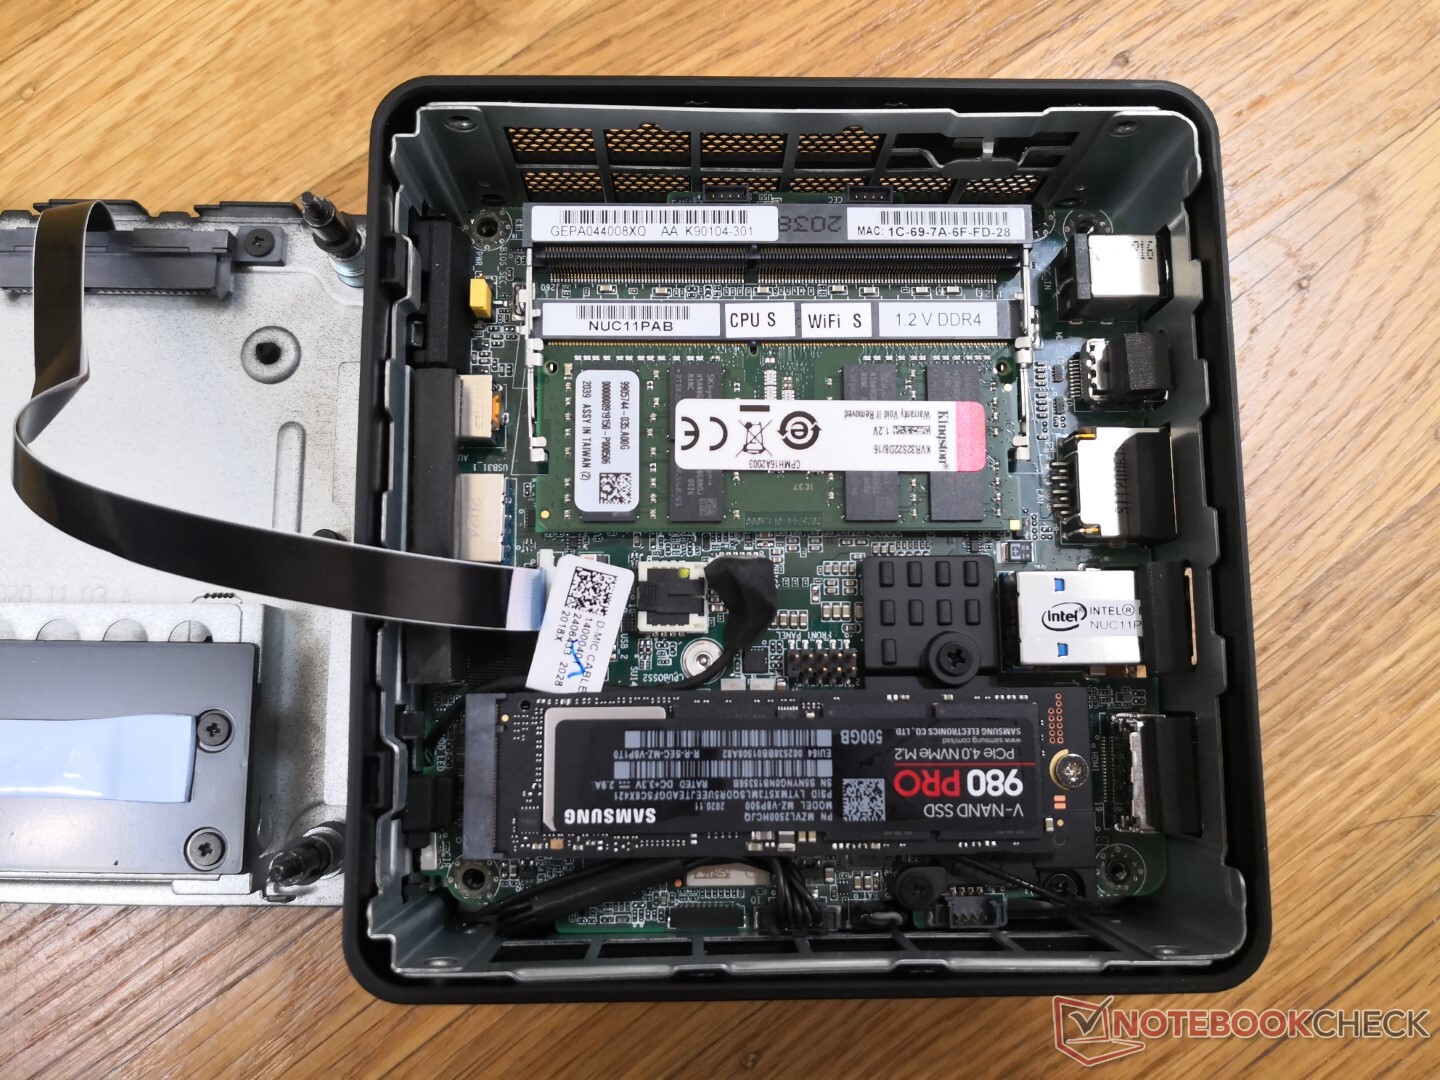
Maintenance
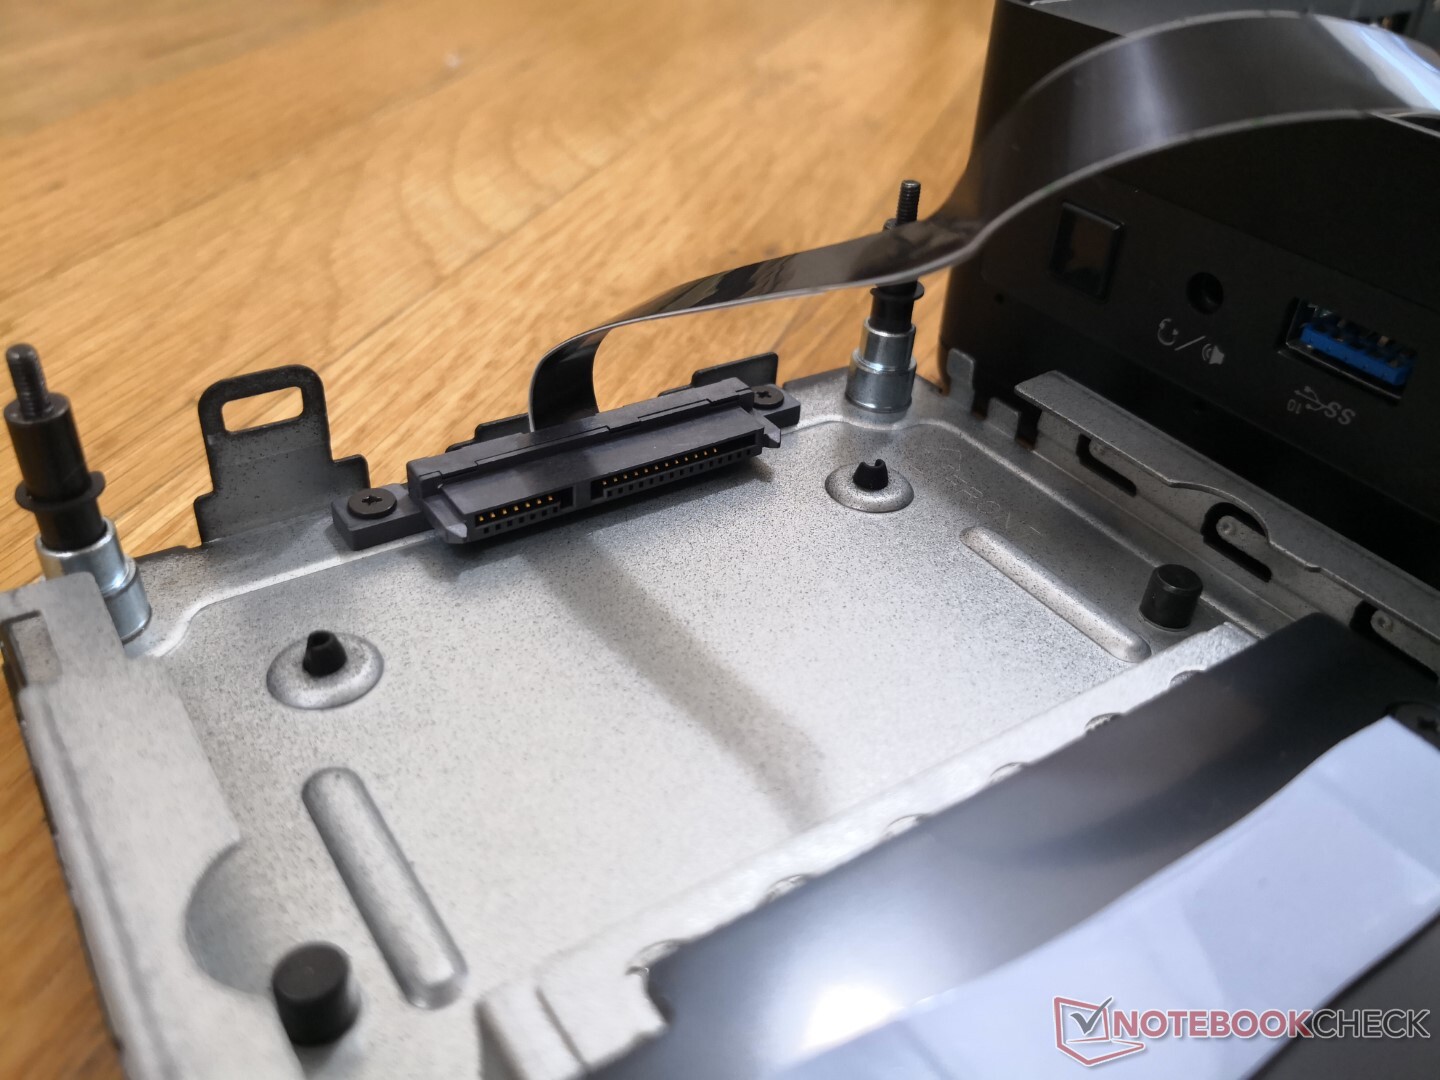
Le panneau inférieur permet d'accéder directement à la fente M.2 2280, à la fente SATA III de 2,5 pouces et aux deux fentes SODIMM. Un démontage supplémentaire est nécessaire pour accéder au ventilateur et au socle de chargement. Cette fois, Intel a allongé le ruban SATA III de 2,5 pouces pour faciliter l'entretien.
Accessoires et garantie
La boîte de vente au détail comprend quatre vis de montage et les manuels habituels. Un support de montage n'est pas inclus.
Une garantie limitée de trois ans est fournie en standard avec tout nouvel achat.
Performance
Processeur
Les performances du processeur sont excellentes, avec un score CineBench R15 xT bien supérieur à la moyenne du Core i7-1165G7 dans notre base de données d'au moins 15 pour cent. Ce delta s'élargit lorsque l'on compare les résultats du CineBench R20 xT, car le NUC d'Intel est meilleur pour maintenir des fréquences d'horloge plus élevées pendant plus longtemps que la plupart des ordinateurs portables avec le même CPU. Les processeurs AMD Zen 2 moins chers comme le Ryzen 5 4500U ou le Ryzen 7 4700U sont capables de rivaliser avec notre Intel, mais avec des performances plus lentes en monofil.
Opter pour les unités de gestion des stocks NUC Core i3-1115G4 ou Core i5-1135G7, moins coûteuses, entraînera un déficit de performance multithread de 30 % et 65 %, respectivement.
Cinebench R15: CPU Multi 64Bit | CPU Single 64Bit
Blender: v2.79 BMW27 CPU
7-Zip 18.03: 7z b 4 -mmt1 | 7z b 4
Geekbench 5.5: Single-Core | Multi-Core
HWBOT x265 Benchmark v2.2: 4k Preset
LibreOffice : 20 Documents To PDF
R Benchmark 2.5: Overall mean
| Cinebench R20 / CPU (Multi Core) | |
| Lenovo Yoga Slim 7-14ARE | |
| Lenovo Yoga Slim 7 14ARE05 82A20008GE | |
| Intel NUC11PAQi7 | |
| Honor MagicBook 15 4500U | |
| Intel NUC10i7FNH | |
| Intel Hades Canyon NUC8i7HVK | |
| Moyenne Intel Core i7-1165G7 (1060 - 2657, n=81) | |
| Dell XPS 13 9310 Core i7 4K | |
| GPD Win 3 | |
| Intel NUC8i7BE | |
| Lenovo ThinkPad P14s Gen1 20S40009GE | |
| Lenovo IdeaPad Slim 9i 14ITL5 | |
| Beelink GTR35 II-G-16512D00W64PRO-1T | |
| Acer Swift 3 SF314-42-R27B | |
| Asus ZenBook 14 UX434FL-DB77 | |
| Zotac ZBox MI643 | |
| Microsoft Surface Laptop Go Core i5 | |
| Dell Inspiron 15 5000 5502 | |
| Beelink SEi10 | |
| Cinebench R20 / CPU (Single Core) | |
| Intel NUC11PAQi7 | |
| Dell XPS 13 9310 Core i7 4K | |
| Moyenne Intel Core i7-1165G7 (442 - 589, n=81) | |
| GPD Win 3 | |
| Lenovo IdeaPad Slim 9i 14ITL5 | |
| Dell Inspiron 15 5000 5502 | |
| Intel NUC10i7FNH | |
| Lenovo Yoga Slim 7-14ARE | |
| Lenovo Yoga Slim 7 14ARE05 82A20008GE | |
| Intel NUC8i7BE | |
| Lenovo ThinkPad P14s Gen1 20S40009GE | |
| Asus ZenBook 14 UX434FL-DB77 | |
| Honor MagicBook 15 4500U | |
| Acer Swift 3 SF314-42-R27B | |
| Zotac ZBox MI643 | |
| Microsoft Surface Laptop Go Core i5 | |
| Intel Hades Canyon NUC8i7HVK | |
| Beelink SEi10 | |
| Beelink GTR35 II-G-16512D00W64PRO-1T | |
| Cinebench R15 / CPU Multi 64Bit | |
| Lenovo Yoga Slim 7-14ARE | |
| Lenovo Yoga Slim 7 14ARE05 82A20008GE | |
| Intel NUC10i7FNH | |
| Intel NUC11PAQi7 | |
| Honor MagicBook 15 4500U | |
| Dell XPS 13 9310 Core i7 4K | |
| Intel Hades Canyon NUC8i7HVK | |
| Moyenne Intel Core i7-1165G7 (553 - 1027, n=86) | |
| Intel NUC8i7BE | |
| Lenovo IdeaPad Slim 9i 14ITL5 | |
| GPD Win 3 | |
| Lenovo ThinkPad P14s Gen1 20S40009GE | |
| Asus ZenBook 14 UX434FL-DB77 | |
| Beelink GTR35 II-G-16512D00W64PRO-1T | |
| Acer Swift 3 SF314-42-R27B | |
| Microsoft Surface Laptop Go Core i5 | |
| Zotac ZBox MI643 | |
| Beelink SEi10 | |
| Dell Inspiron 15 5000 5502 | |
| Cinebench R15 / CPU Single 64Bit | |
| Intel NUC11PAQi7 | |
| Dell XPS 13 9310 Core i7 4K | |
| Moyenne Intel Core i7-1165G7 (115 - 230, n=78) | |
| Lenovo IdeaPad Slim 9i 14ITL5 | |
| GPD Win 3 | |
| Intel NUC10i7FNH | |
| Dell Inspiron 15 5000 5502 | |
| Intel NUC8i7BE | |
| Lenovo ThinkPad P14s Gen1 20S40009GE | |
| Lenovo Yoga Slim 7-14ARE | |
| Intel Hades Canyon NUC8i7HVK | |
| Asus ZenBook 14 UX434FL-DB77 | |
| Lenovo Yoga Slim 7 14ARE05 82A20008GE | |
| Zotac ZBox MI643 | |
| Honor MagicBook 15 4500U | |
| Acer Swift 3 SF314-42-R27B | |
| Microsoft Surface Laptop Go Core i5 | |
| Beelink SEi10 | |
| Beelink GTR35 II-G-16512D00W64PRO-1T | |
| Blender / v2.79 BMW27 CPU | |
| Dell Inspiron 15 5000 5502 | |
| Beelink SEi10 | |
| Microsoft Surface Laptop Go Core i5 | |
| Acer Swift 3 SF314-42-R27B | |
| Zotac ZBox MI643 | |
| Asus ZenBook 14 UX434FL-DB77 | |
| Intel NUC8i7BE | |
| Intel NUC8i7BE | |
| Beelink GTR35 II-G-16512D00W64PRO-1T | |
| Dell XPS 13 9310 Core i7 4K | |
| Lenovo ThinkPad P14s Gen1 20S40009GE | |
| GPD Win 3 | |
| Moyenne Intel Core i7-1165G7 (468 - 1138, n=80) | |
| Lenovo IdeaPad Slim 9i 14ITL5 | |
| Honor MagicBook 15 4500U | |
| Intel Hades Canyon NUC8i7HVK | |
| Lenovo Yoga Slim 7 14ARE05 82A20008GE | |
| Intel NUC10i7FNH | |
| Intel NUC11PAQi7 | |
| Lenovo Yoga Slim 7-14ARE | |
| 7-Zip 18.03 / 7z b 4 -mmt1 | |
| Intel NUC8i7BE | |
| Intel NUC8i7BE | |
| Intel NUC11PAQi7 | |
| Lenovo IdeaPad Slim 9i 14ITL5 | |
| Moyenne Intel Core i7-1165G7 (4478 - 5507, n=80) | |
| Dell XPS 13 9310 Core i7 4K | |
| Lenovo ThinkPad P14s Gen1 20S40009GE | |
| GPD Win 3 | |
| Intel NUC10i7FNH | |
| Dell Inspiron 15 5000 5502 | |
| Zotac ZBox MI643 | |
| Lenovo Yoga Slim 7-14ARE | |
| Lenovo Yoga Slim 7 14ARE05 82A20008GE | |
| Honor MagicBook 15 4500U | |
| Intel Hades Canyon NUC8i7HVK | |
| Beelink SEi10 | |
| Acer Swift 3 SF314-42-R27B | |
| Microsoft Surface Laptop Go Core i5 | |
| Asus ZenBook 14 UX434FL-DB77 | |
| Beelink GTR35 II-G-16512D00W64PRO-1T | |
| 7-Zip 18.03 / 7z b 4 | |
| Lenovo Yoga Slim 7-14ARE | |
| Lenovo Yoga Slim 7 14ARE05 82A20008GE | |
| Intel NUC8i7BE | |
| Intel NUC8i7BE | |
| Intel NUC10i7FNH | |
| Intel NUC11PAQi7 | |
| Honor MagicBook 15 4500U | |
| Lenovo IdeaPad Slim 9i 14ITL5 | |
| Moyenne Intel Core i7-1165G7 (15347 - 27405, n=80) | |
| GPD Win 3 | |
| Dell XPS 13 9310 Core i7 4K | |
| Intel Hades Canyon NUC8i7HVK | |
| Lenovo ThinkPad P14s Gen1 20S40009GE | |
| Zotac ZBox MI643 | |
| Asus ZenBook 14 UX434FL-DB77 | |
| Beelink GTR35 II-G-16512D00W64PRO-1T | |
| Acer Swift 3 SF314-42-R27B | |
| Microsoft Surface Laptop Go Core i5 | |
| Dell Inspiron 15 5000 5502 | |
| Beelink SEi10 | |
| Geekbench 5.5 / Single-Core | |
| Lenovo IdeaPad Slim 9i 14ITL5 | |
| Intel NUC11PAQi7 | |
| Dell XPS 13 9310 Core i7 4K | |
| Moyenne Intel Core i7-1165G7 (1302 - 1595, n=77) | |
| GPD Win 3 | |
| Dell Inspiron 15 5000 5502 | |
| Intel NUC10i7FNH | |
| Lenovo ThinkPad P14s Gen1 20S40009GE | |
| Honor MagicBook 15 4500U | |
| Asus ZenBook 14 UX434FL-DB77 | |
| Lenovo Yoga Slim 7-14ARE | |
| Lenovo Yoga Slim 7-14ARE | |
| Microsoft Surface Laptop Go Core i5 | |
| Zotac ZBox MI643 | |
| Lenovo Yoga Slim 7 14ARE05 82A20008GE | |
| Beelink SEi10 | |
| Acer Swift 3 SF314-42-R27B | |
| Beelink GTR35 II-G-16512D00W64PRO-1T | |
| Intel NUC8i7BE | |
| Geekbench 5.5 / Multi-Core | |
| Lenovo Yoga Slim 7-14ARE | |
| Lenovo Yoga Slim 7-14ARE | |
| Lenovo Yoga Slim 7 14ARE05 82A20008GE | |
| Honor MagicBook 15 4500U | |
| Intel NUC10i7FNH | |
| Dell XPS 13 9310 Core i7 4K | |
| Lenovo IdeaPad Slim 9i 14ITL5 | |
| Moyenne Intel Core i7-1165G7 (3078 - 5926, n=77) | |
| Intel NUC11PAQi7 | |
| GPD Win 3 | |
| Zotac ZBox MI643 | |
| Lenovo ThinkPad P14s Gen1 20S40009GE | |
| Intel NUC8i7BE | |
| Microsoft Surface Laptop Go Core i5 | |
| Acer Swift 3 SF314-42-R27B | |
| Beelink GTR35 II-G-16512D00W64PRO-1T | |
| Asus ZenBook 14 UX434FL-DB77 | |
| Dell Inspiron 15 5000 5502 | |
| Beelink SEi10 | |
| HWBOT x265 Benchmark v2.2 / 4k Preset | |
| Lenovo Yoga Slim 7-14ARE | |
| Lenovo Yoga Slim 7 14ARE05 82A20008GE | |
| Intel NUC11PAQi7 | |
| Intel NUC10i7FNH | |
| Honor MagicBook 15 4500U | |
| Intel Hades Canyon NUC8i7HVK | |
| Lenovo IdeaPad Slim 9i 14ITL5 | |
| Moyenne Intel Core i7-1165G7 (1.39 - 8.47, n=80) | |
| GPD Win 3 | |
| Intel NUC8i7BE | |
| Intel NUC8i7BE | |
| Dell XPS 13 9310 Core i7 4K | |
| Lenovo ThinkPad P14s Gen1 20S40009GE | |
| Asus ZenBook 14 UX434FL-DB77 | |
| Acer Swift 3 SF314-42-R27B | |
| Zotac ZBox MI643 | |
| Beelink GTR35 II-G-16512D00W64PRO-1T | |
| Microsoft Surface Laptop Go Core i5 | |
| Beelink SEi10 | |
| Dell Inspiron 15 5000 5502 | |
| LibreOffice / 20 Documents To PDF | |
| Beelink GTR35 II-G-16512D00W64PRO-1T | |
| Asus ZenBook 14 UX434FL-DB77 | |
| Lenovo Yoga Slim 7 14ARE05 82A20008GE | |
| Honor MagicBook 15 4500U | |
| Microsoft Surface Laptop Go Core i5 | |
| Dell Inspiron 15 5000 5502 | |
| Acer Swift 3 SF314-42-R27B | |
| Lenovo Yoga Slim 7-14ARE | |
| Zotac ZBox MI643 | |
| Lenovo ThinkPad P14s Gen1 20S40009GE | |
| Beelink SEi10 | |
| Lenovo IdeaPad Slim 9i 14ITL5 | |
| Moyenne Intel Core i7-1165G7 (21.5 - 88.1, n=78) | |
| GPD Win 3 | |
| Dell XPS 13 9310 Core i7 4K | |
| Intel NUC11PAQi7 | |
| R Benchmark 2.5 / Overall mean | |
| Asus ZenBook 14 UX434FL-DB77 | |
| Beelink SEi10 | |
| Microsoft Surface Laptop Go Core i5 | |
| Beelink GTR35 II-G-16512D00W64PRO-1T | |
| Acer Swift 3 SF314-42-R27B | |
| Lenovo ThinkPad P14s Gen1 20S40009GE | |
| Zotac ZBox MI643 | |
| Dell Inspiron 15 5000 5502 | |
| Intel NUC10i7FNH | |
| GPD Win 3 | |
| Intel NUC8i7BE | |
| Honor MagicBook 15 4500U | |
| Lenovo Yoga Slim 7 14ARE05 82A20008GE | |
| Lenovo Yoga Slim 7-14ARE | |
| Dell XPS 13 9310 Core i7 4K | |
| Moyenne Intel Core i7-1165G7 (0.552 - 1.002, n=80) | |
| Lenovo IdeaPad Slim 9i 14ITL5 | |
| Intel NUC11PAQi7 | |
Cinebench R15: CPU Multi 64Bit | CPU Single 64Bit
Blender: v2.79 BMW27 CPU
7-Zip 18.03: 7z b 4 -mmt1 | 7z b 4
Geekbench 5.5: Single-Core | Multi-Core
HWBOT x265 Benchmark v2.2: 4k Preset
LibreOffice : 20 Documents To PDF
R Benchmark 2.5: Overall mean
* ... Moindre est la valeur, meilleures sont les performances
Performance du système
| PCMark 10 | |
| Score | |
| Intel Hades Canyon NUC8i7HVK | |
| Intel NUC11PAQi7 | |
| Moyenne Intel Core i7-1165G7, Intel Iris Xe Graphics G7 96EUs (4531 - 5454, n=50) | |
| Intel NUC8i7BE | |
| Intel NUC10i7FNH | |
| Beelink GTR35 II-G-16512D00W64PRO-1T | |
| Zotac ZBox MI643 | |
| Beelink SEi10 | |
| Essentials | |
| Intel NUC11PAQi7 | |
| Moyenne Intel Core i7-1165G7, Intel Iris Xe Graphics G7 96EUs (8997 - 11505, n=50) | |
| Zotac ZBox MI643 | |
| Intel Hades Canyon NUC8i7HVK | |
| Intel NUC10i7FNH | |
| Intel NUC8i7BE | |
| Beelink GTR35 II-G-16512D00W64PRO-1T | |
| Beelink SEi10 | |
| Productivity | |
| Intel Hades Canyon NUC8i7HVK | |
| Intel NUC8i7BE | |
| Intel NUC11PAQi7 | |
| Zotac ZBox MI643 | |
| Intel NUC10i7FNH | |
| Moyenne Intel Core i7-1165G7, Intel Iris Xe Graphics G7 96EUs (5570 - 7136, n=50) | |
| Beelink GTR35 II-G-16512D00W64PRO-1T | |
| Beelink SEi10 | |
| Digital Content Creation | |
| Intel Hades Canyon NUC8i7HVK | |
| Intel NUC11PAQi7 | |
| Moyenne Intel Core i7-1165G7, Intel Iris Xe Graphics G7 96EUs (4083 - 5550, n=50) | |
| Intel NUC8i7BE | |
| Beelink GTR35 II-G-16512D00W64PRO-1T | |
| Intel NUC10i7FNH | |
| Zotac ZBox MI643 | |
| Beelink SEi10 | |
| PCMark 8 | |
| Home Score Accelerated v2 | |
| Intel Hades Canyon NUC8i7HVK | |
| Intel NUC8i7BE | |
| Moyenne Intel Core i7-1165G7, Intel Iris Xe Graphics G7 96EUs (3769 - 5686, n=17) | |
| Intel NUC11PAQi7 | |
| Intel NUC10i7FNH | |
| Beelink GTR35 II-G-16512D00W64PRO-1T | |
| Zotac ZBox MI643 | |
| Beelink SEi10 | |
| Work Score Accelerated v2 | |
| Intel Hades Canyon NUC8i7HVK | |
| Beelink GTR35 II-G-16512D00W64PRO-1T | |
| Zotac ZBox MI643 | |
| Intel NUC10i7FNH | |
| Intel NUC11PAQi7 | |
| Moyenne Intel Core i7-1165G7, Intel Iris Xe Graphics G7 96EUs (2431 - 3221, n=15) | |
| Beelink SEi10 | |
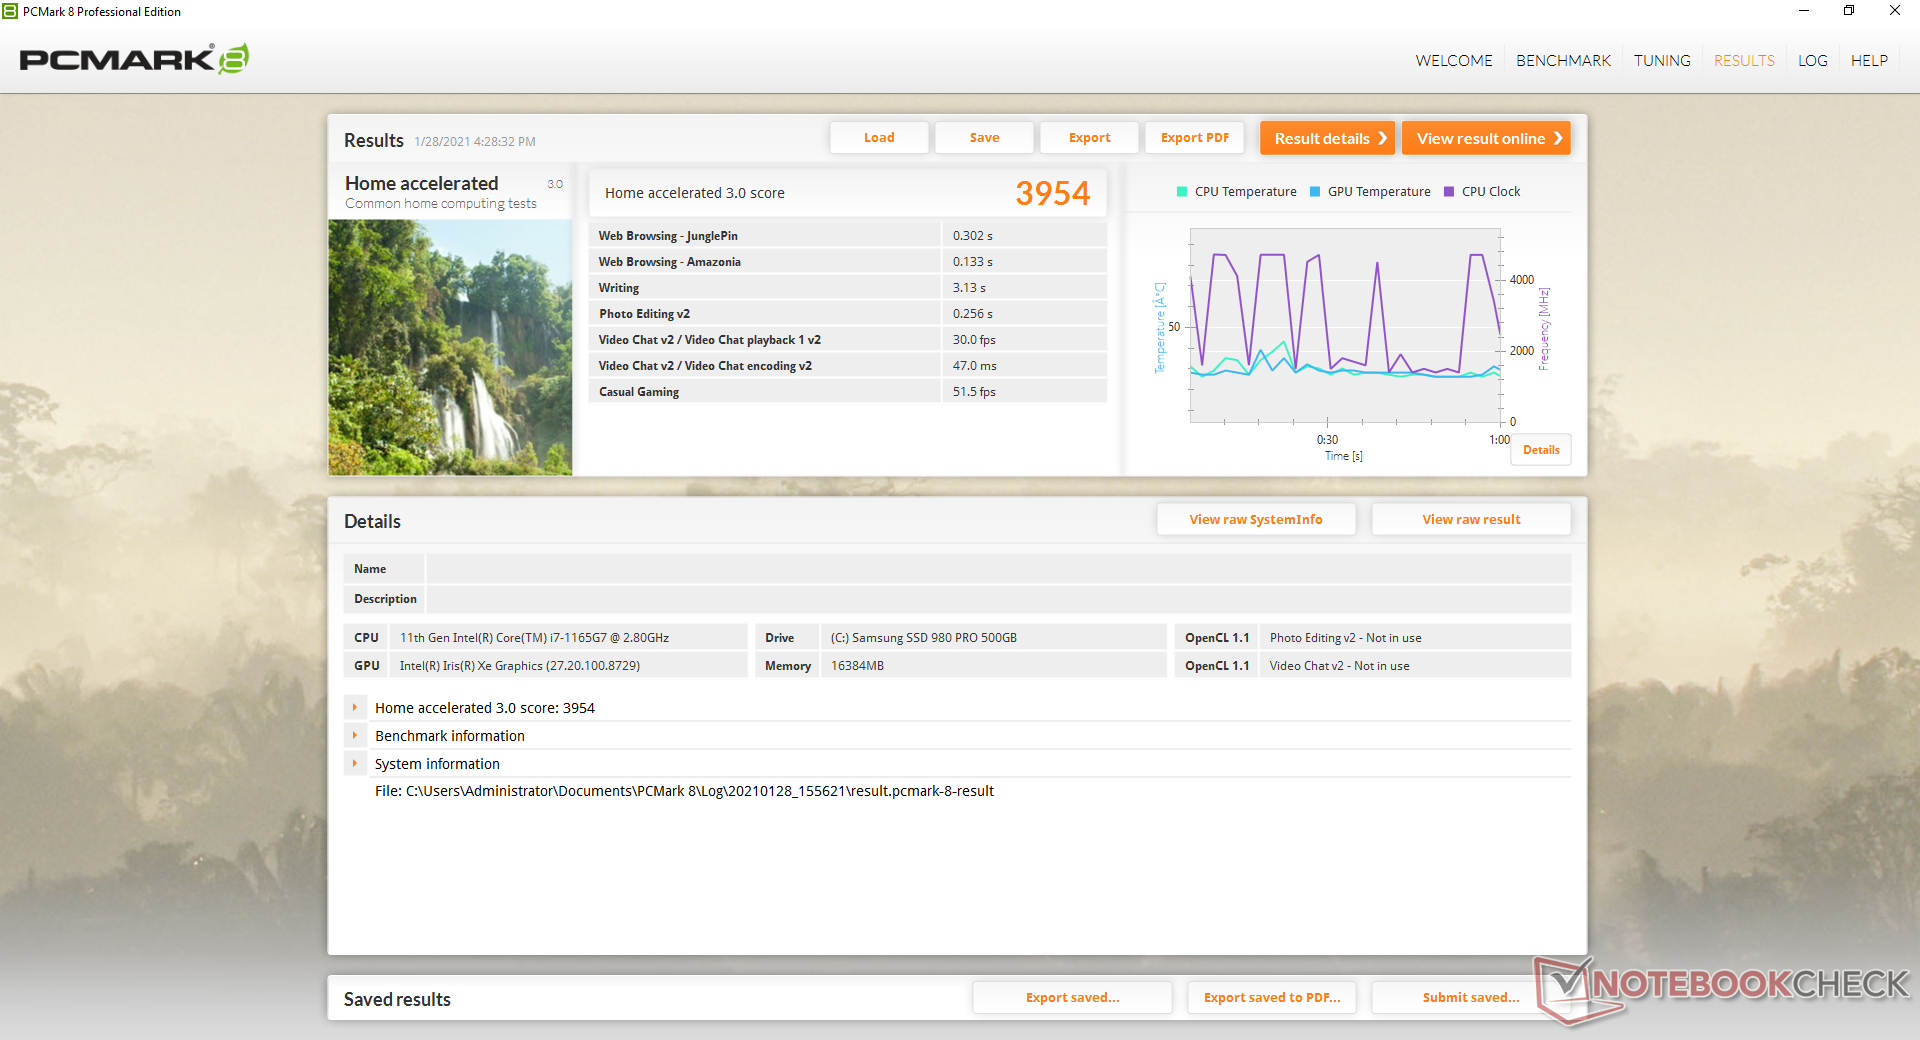
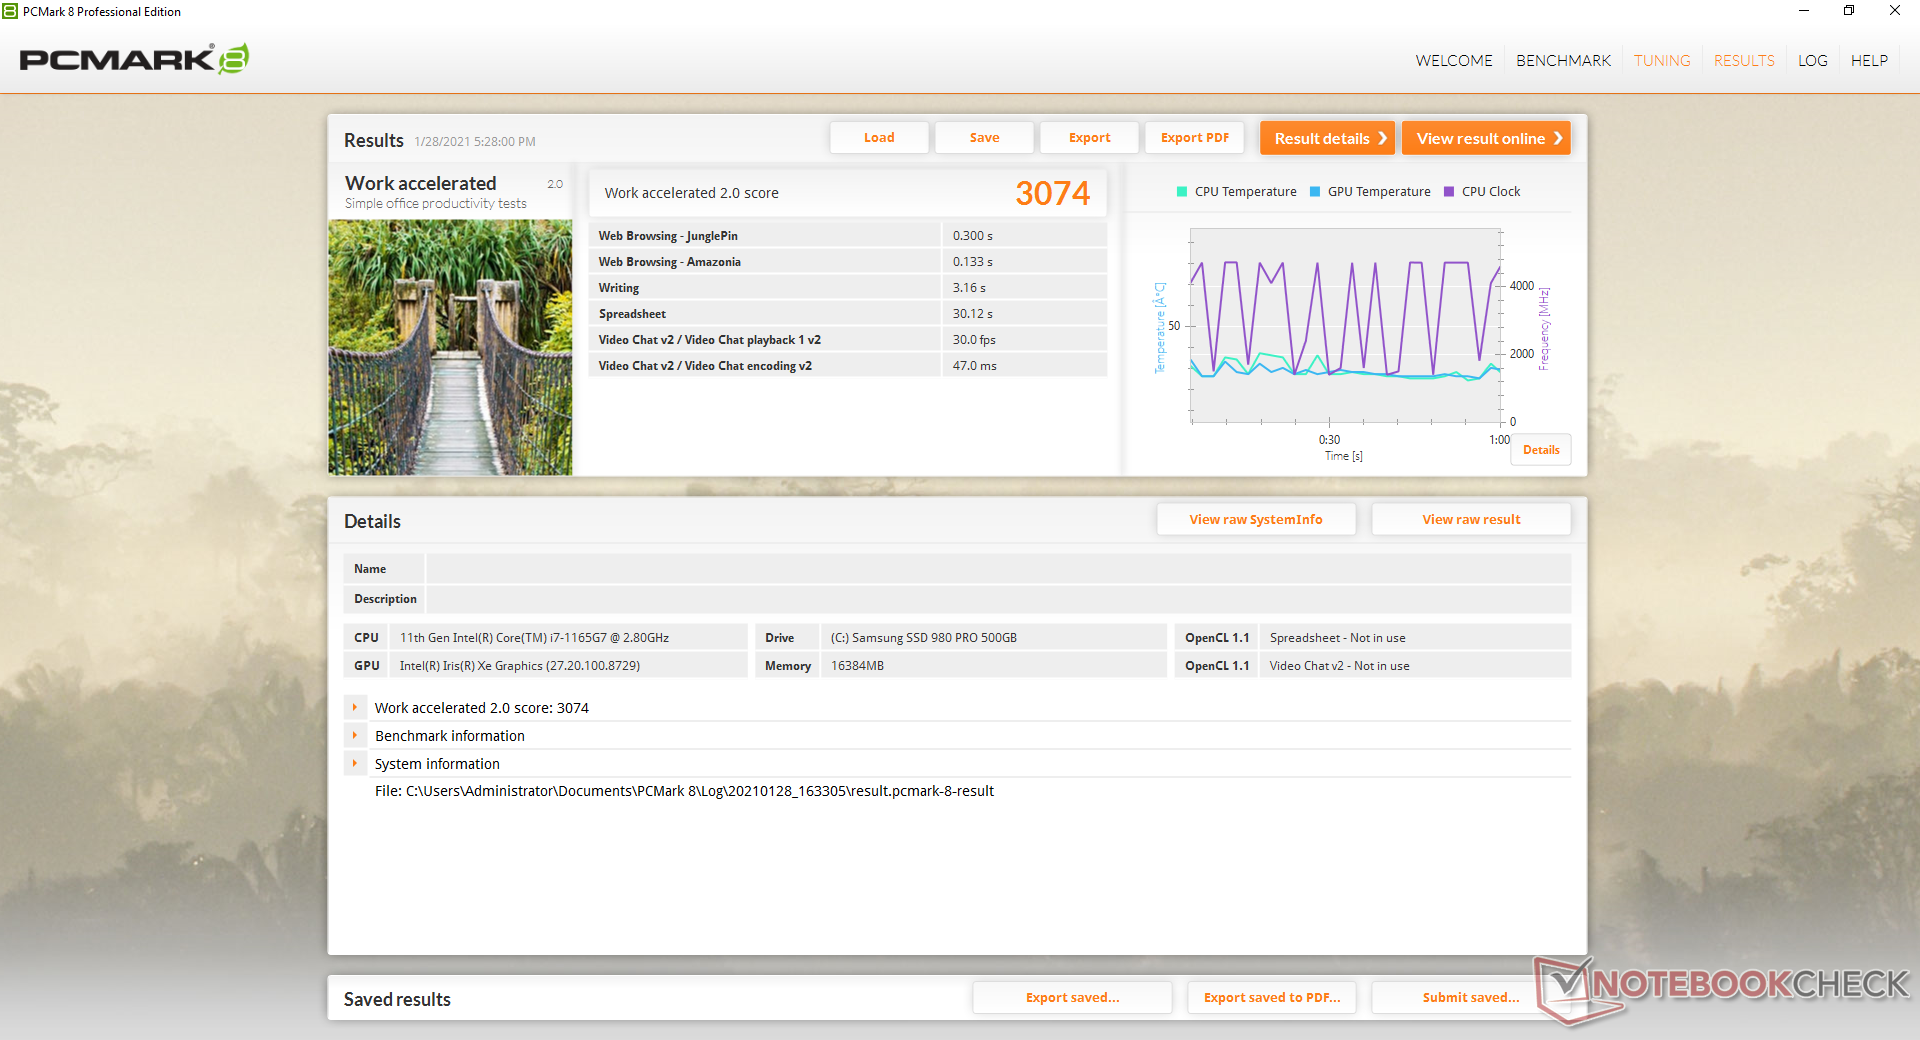
| PCMark 8 Home Score Accelerated v2 | 3954 points | |
| PCMark 8 Work Score Accelerated v2 | 3074 points | |
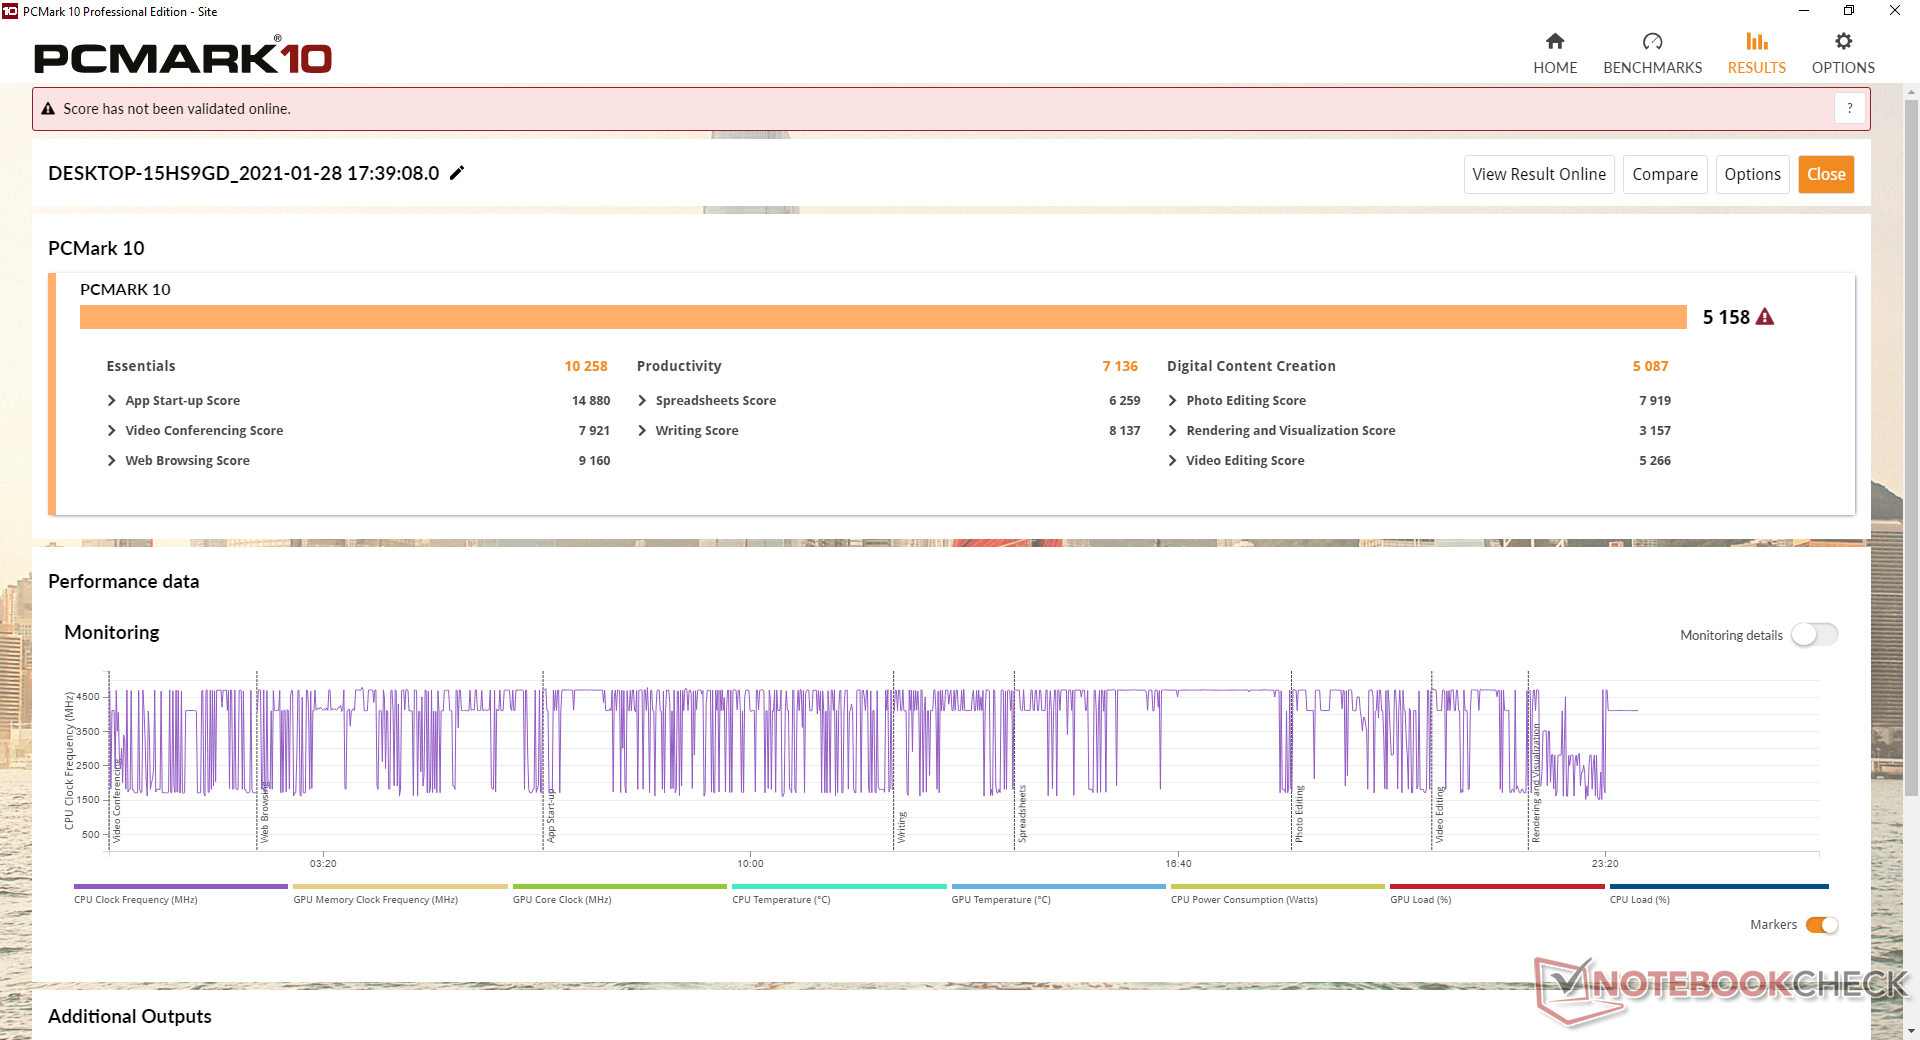
| PCMark 10 Score | 5158 points | |
Aide | ||
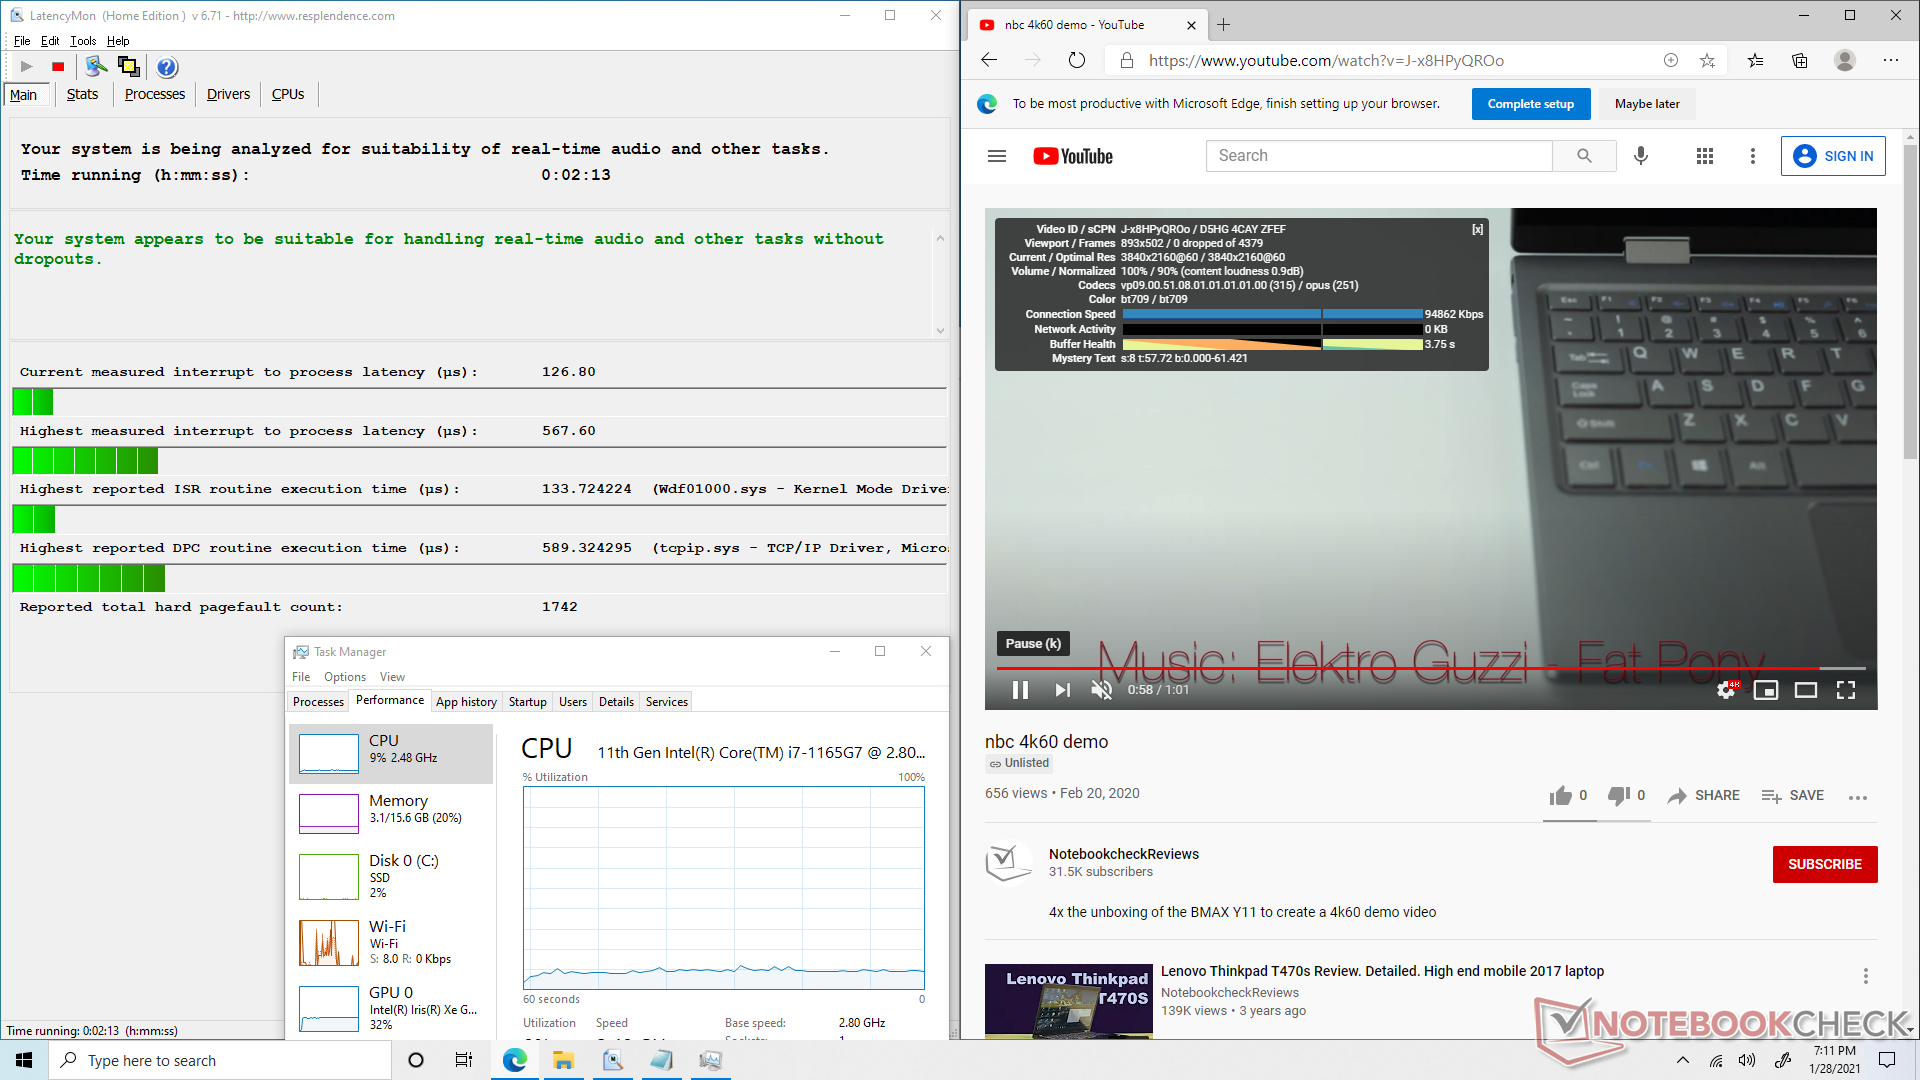
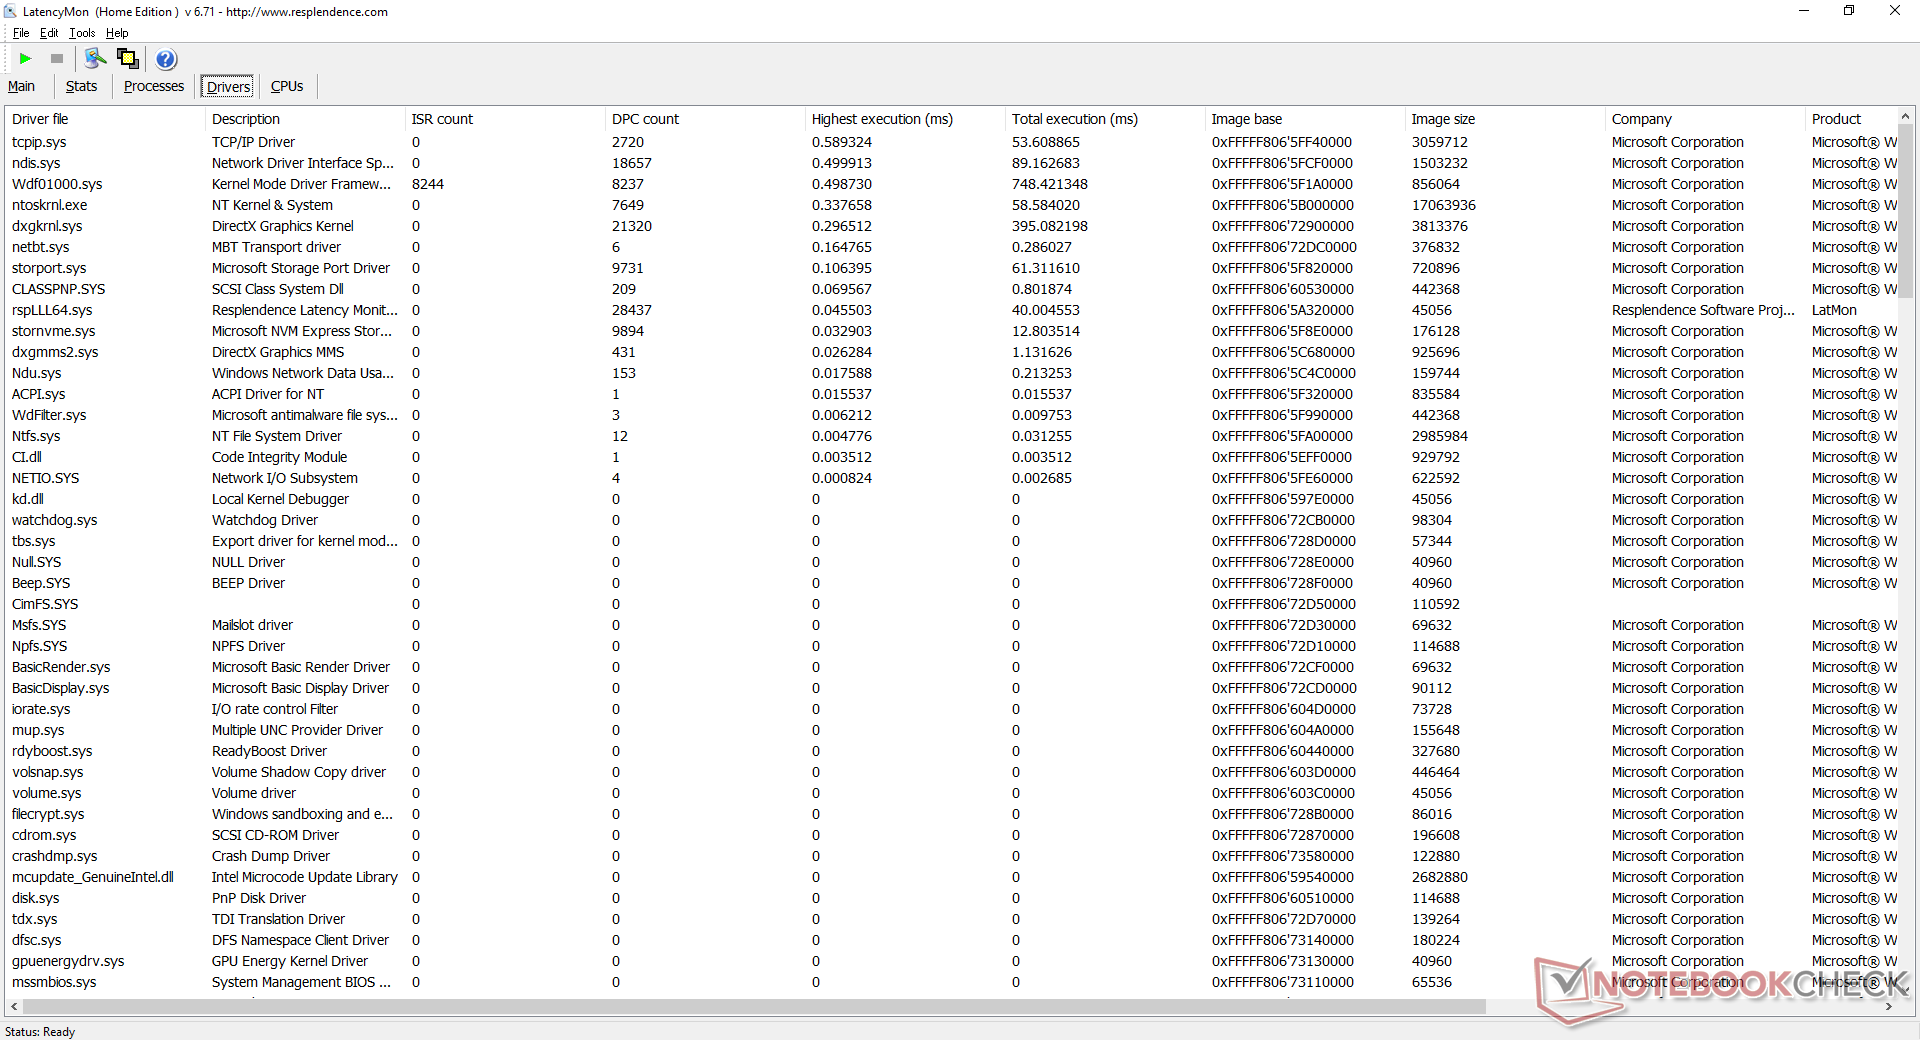
DPC Latence
LatencyMon ne montre aucun problème de latence de DPC. La lecture de vidéos 4K à 60 FPS est également fluide et sans perte d'images. Le GPU Iris Xe est stable avec un taux d'utilisation de 32 %, contre 50 % pour l'ancien Iris Plus G7.
| DPC Latencies / LatencyMon - interrupt to process latency (max), Web, Youtube, Prime95 | |
| Beelink SEi10 | |
| Zotac ZBox MI643 | |
| Intel NUC11PAQi7 | |
* ... Moindre est la valeur, meilleures sont les performances
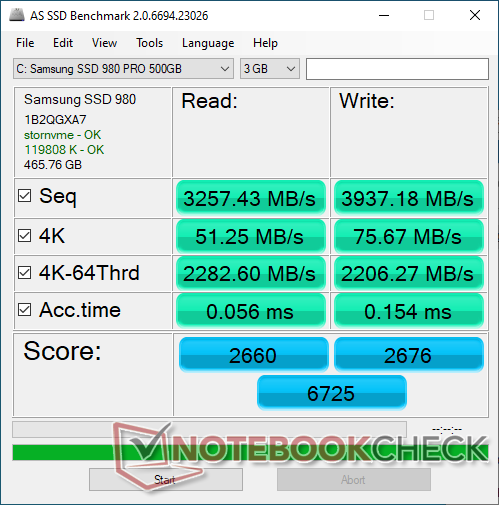
Dispositifs de stockage
Notre unité est équipée d'un Samsung SSD 980 Pro de 500 Go pour des taux de lecture et d'écriture théoriques allant jusqu'à 6900 Mo/s et 5000 Mo/s, respectivement. Nous sommes en mesure de confirmer ces chiffres annoncés lorsque nous exécutons DiskSpd en boucle, comme le montre le graphique ci-dessous. Notez qu'un rembourrage thermique et un fin dissipateur de chaleur sont inclus.
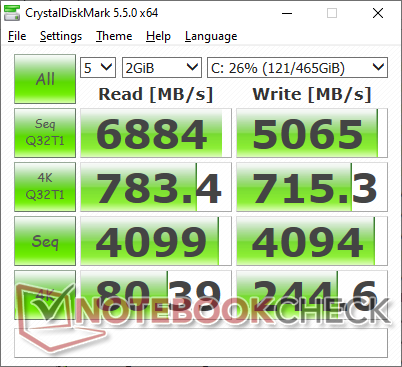
| Intel NUC11PAQi7 Samsung SSD 980 Pro 500GB MZ-V8P500BW | Intel NUC10i7FNH Kingston RBUSNS8154P3256GJ1 | Intel Hades Canyon NUC8i7HVK Intel Optane 120 GB SSDPEK1W120GA | Beelink SEi10 Silicon Motion AZW 256G M.2280 NVMe 4X 200725 D | Zotac ZBox MI643 Lexar NM610 1TB | |
|---|---|---|---|---|---|
| AS SSD | -58% | -20% | -83% | -40% | |
| Seq Read (MB/s) | 3257 | 1306 -60% | 1379 -58% | 1111 -66% | 1511 -54% |
| Seq Write (MB/s) | 3937 | 611 -84% | 553 -86% | 323.5 -92% | 1558 -60% |
| 4K Read (MB/s) | 51.3 | 21.53 -58% | 127.9 149% | 33.1 -35% | 43.77 -15% |
| 4K Write (MB/s) | 75.7 | 53.5 -29% | 103.5 37% | 66.2 -13% | 119.5 58% |
| 4K-64 Read (MB/s) | 2283 | 652 -71% | 1258 -45% | 357.3 -84% | 839 -63% |
| 4K-64 Write (MB/s) | 2206 | 648 -71% | 556 -75% | 154.8 -93% | 909 -59% |
| Access Time Read * (ms) | 0.056 | 0.114 -104% | 0.025 55% | 0.066 -18% | 0.032 43% |
| Access Time Write * (ms) | 0.154 | 0.07 55% | 0.033 79% | 0.616 -300% | 0.242 -57% |
| Score Read (Points) | 2660 | 804 -70% | 1524 -43% | 501 -81% | 1034 -61% |
| Score Write (Points) | 2676 | 762 -72% | 714 -73% | 253 -91% | 1185 -56% |
| Score Total (Points) | 6725 | 1944 -71% | 3023 -55% | 983 -85% | 2760 -59% |
| Copy ISO MB/s (MB/s) | 2030 | 976 -52% | 1125 -45% | 1160 -43% | 1373 -32% |
| Copy Program MB/s (MB/s) | 883 | 346 -61% | 342.4 -61% | 121.1 -86% | 280.4 -68% |
| Copy Game MB/s (MB/s) | 1817 | 735 -60% | 768 -58% | 364.4 -80% | 531 -71% |
| CrystalDiskMark 5.2 / 6 | 6% | -45% | -51% | -48% | |
| Write 4K (MB/s) | 244.6 | 442.4 81% | 133.7 -45% | 203 -17% | 214.1 -12% |
| Read 4K (MB/s) | 80.4 | 371.1 362% | 178.6 122% | 63.2 -21% | 62.1 -23% |
| Write Seq (MB/s) | 4094 | 900 -78% | 608 -85% | 1114 -73% | 1664 -59% |
| Read Seq (MB/s) | 4099 | 1582 -61% | 1428 -65% | 1765 -57% | 1797 -56% |
| Write 4K Q32T1 (MB/s) | 715 | 373.8 -48% | 323.6 -55% | 423.9 -41% | 421.8 -41% |
| Read 4K Q32T1 (MB/s) | 783 | 374.9 -52% | 282.3 -64% | 389.2 -50% | 512 -35% |
| Write Seq Q32T1 (MB/s) | 5065 | 893 -82% | 627 -88% | 1104 -78% | 564 -89% |
| Read Seq Q32T1 (MB/s) | 6884 | 1582 -77% | 1521 -78% | 1990 -71% | 2073 -70% |
| Write 4K Q8T8 (MB/s) | 399.1 | ||||
| Read 4K Q8T8 (MB/s) | 688 | ||||
| Moyenne finale (programmes/paramètres) | -26% /
-35% | -33% /
-29% | -67% /
-72% | -44% /
-43% |
* ... Moindre est la valeur, meilleures sont les performances

Disk Throttling: DiskSpd Read Loop, Queue Depth 8
Performances des GPU
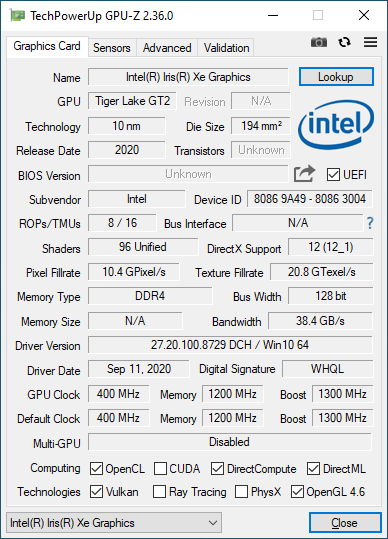
Les résultats de 3DMark sont environ 15 % plus lents que la moyenne des Iris Xe 96 EU dans notre base de données, malgré les performances du processeur plus rapides que la moyenne enregistrées ci-dessus. Cet écart est probablement dû à la mémoire vive à canal unique de notre unité d'examen. S'il s'était agi d'une RAM double canal, les résultats seraient probablement supérieurs de 30 % ou plus, comme nous l'avons observé sur le Lenovo IdeaPad Slim 9i.
Pour plus d'informations techniques et de références sur les Iris Xe 96 EU, cliquez ici. Opter pour le Core i5 Iris Xe 80 EU, moins puissant, ne signifie pas nécessairement des performances graphiques plus lentes selon la configuration de la RAM. Cependant, attendez-vous à ce que l'option Core i3 UHD Graphics 620 (ou Iris Xe 48 EU) soit nettement plus lente.
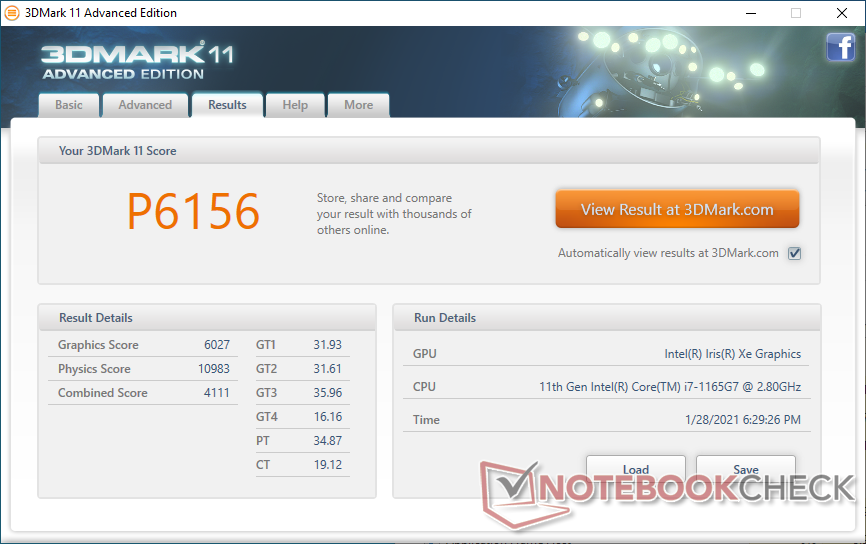

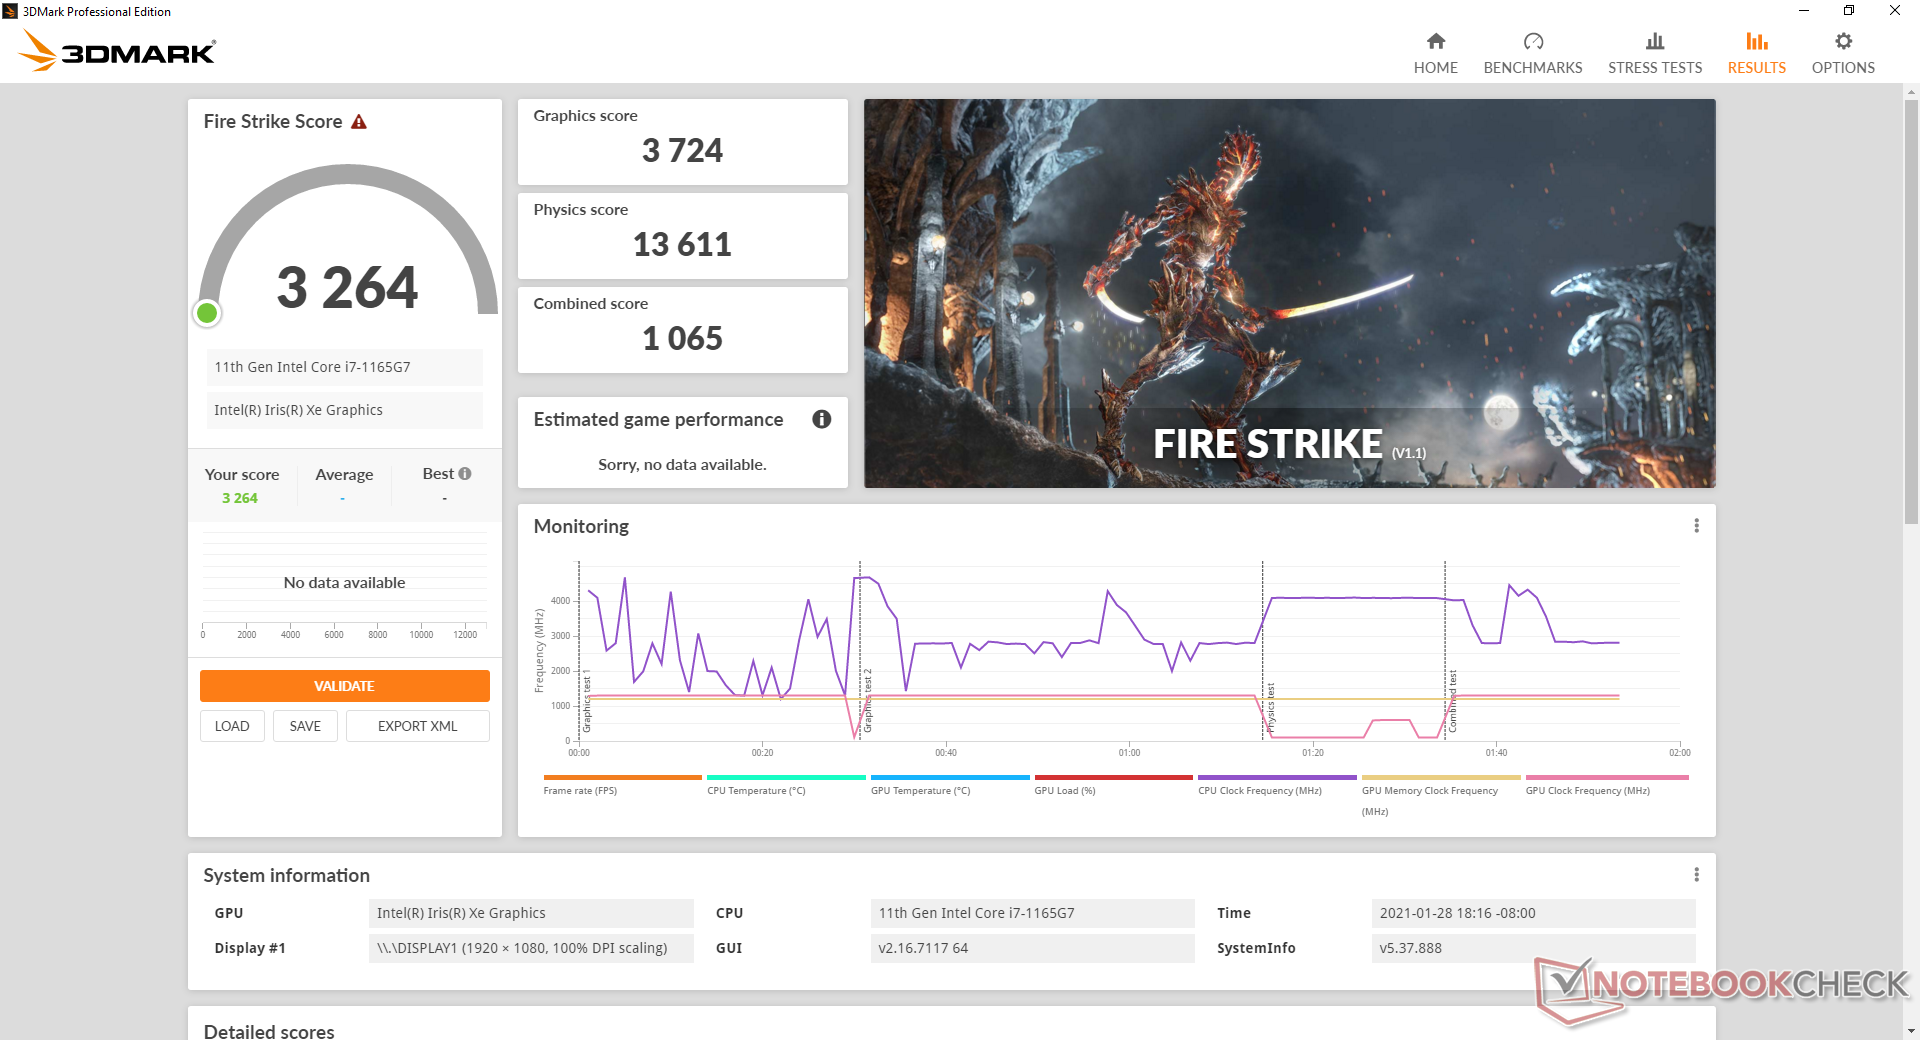
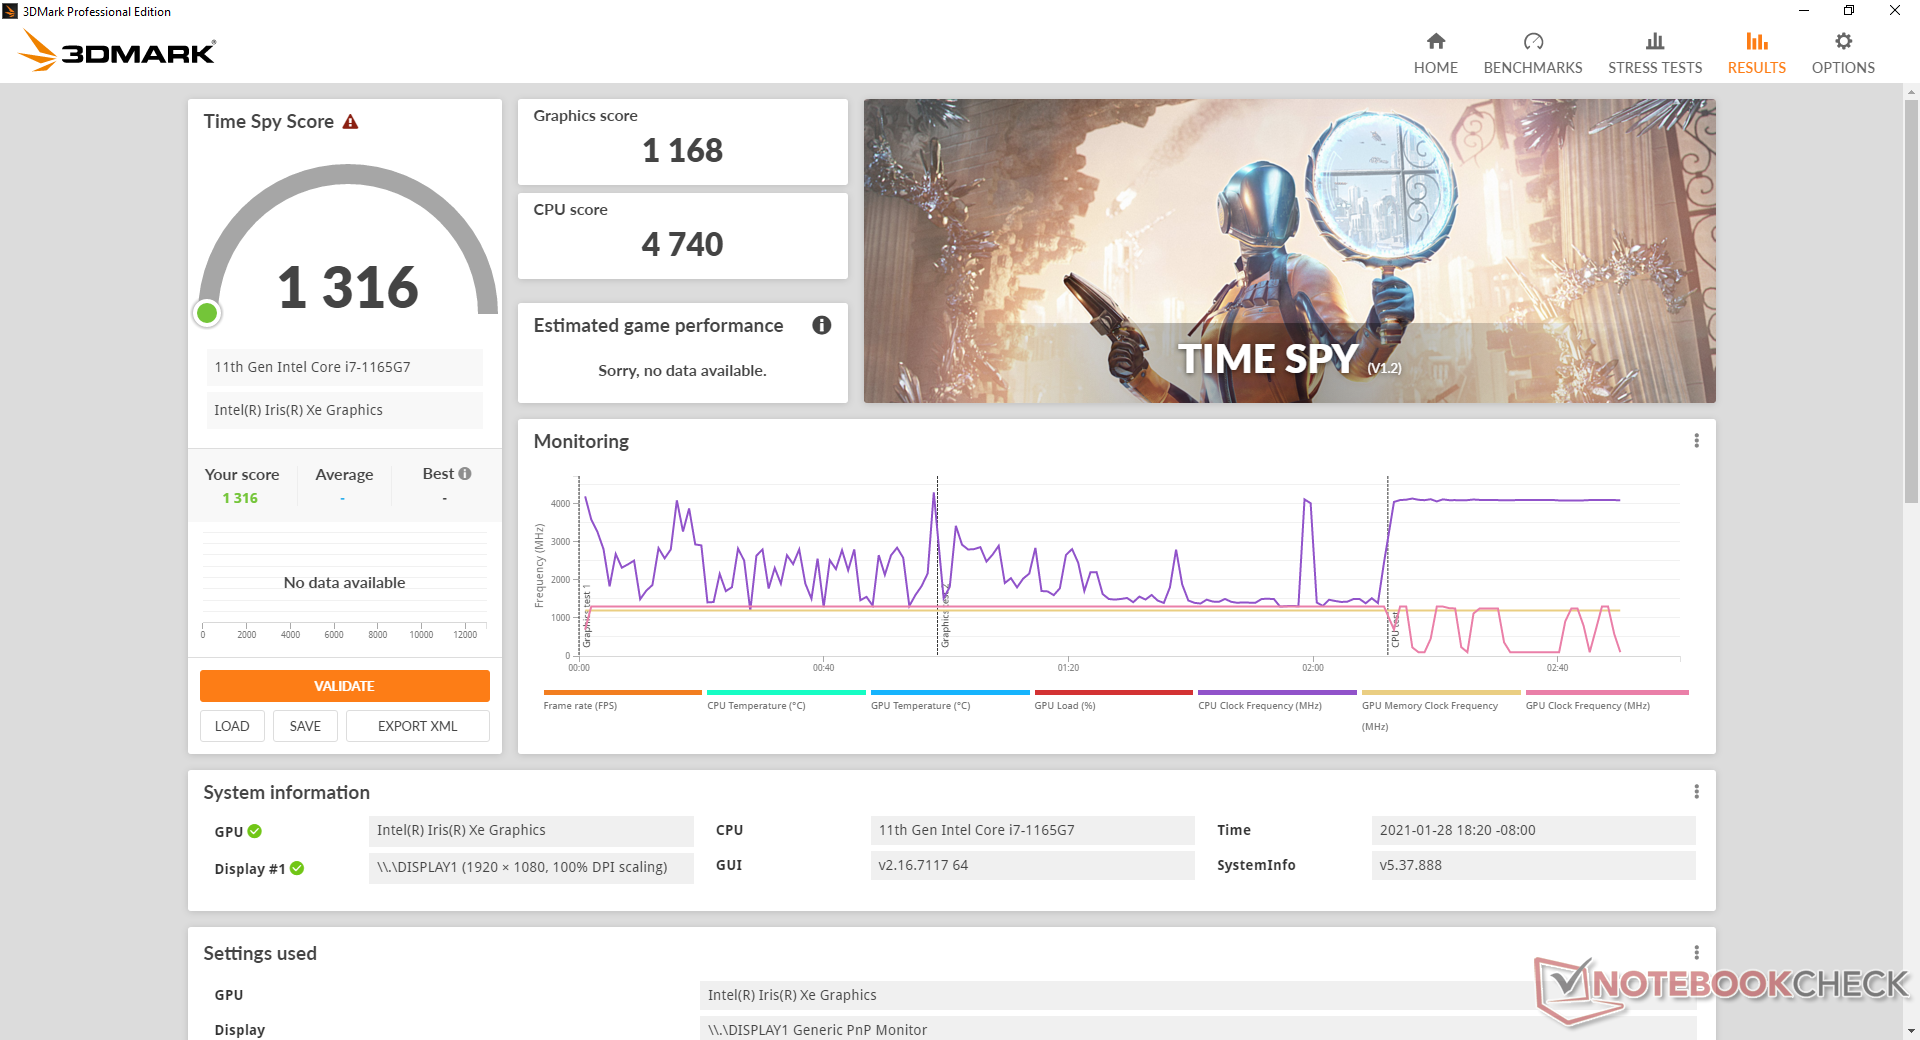
| 3DMark 11 Performance | 6156 points | |
| 3DMark Cloud Gate Standard Score | 17226 points | |
| 3DMark Fire Strike Score | 3264 points | |
| 3DMark Time Spy Score | 1316 points | |
Aide | ||
| Bas | Moyen | Élevé | Ultra | |
|---|---|---|---|---|
| GTA V (2015) | 67.6 | 52.5 | 12.6 | 5.72 |
| The Witcher 3 (2015) | 70.3 | 43.7 | 20.7 | 10.3 |
| Dota 2 Reborn (2015) | 78.8 | 61.8 | 37.7 | 35 |
| Final Fantasy XV Benchmark (2018) | 30.3 | 15.6 | 12.7 | |
| X-Plane 11.11 (2018) | 42.3 | 32.7 | 28.8 | |
| Strange Brigade (2018) | 66.2 | 23.8 | 20.1 | 16.9 |
Emissions
Bruit du système
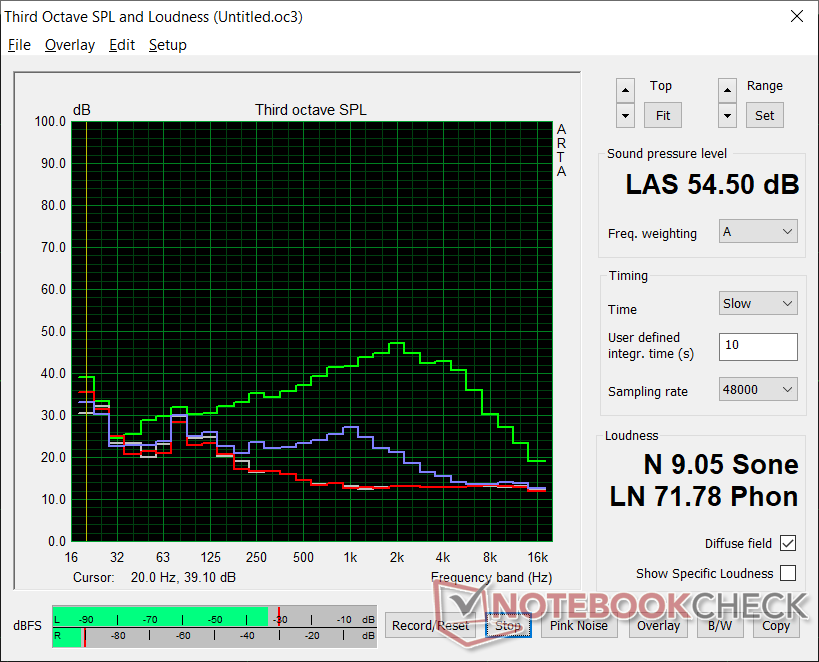
Le ventilateur interne pulsera entre le ralenti et 33,6 dB(A) même en cas de simple navigation sur le web ou de marche au ralenti sur le bureau. Bien qu'il ne soit pas assez bruyant pour être gênant ou trop perceptible, une approche plus stable aurait été préférable. Bruit du ventilateur en fonctionnement Witcher 3 est stable à 33,6 dB(A) pour être plus silencieux que prévu initialement. L'exécution d'autres jeux à des réglages inférieurs pour des fréquences d'images plus élevées fera légèrement sauter le bruit du ventilateur.
Des charges extrêmes comme le Prime95 feront monter le bruit des ventilateurs jusqu'à 49,2 dB(A) et même 54,5 dB(A) pour être beaucoup plus fort que la plupart des autres mini-PC dans des conditions similaires. Le CPU est peut-être rapide, mais le ventilateur s'efforcera de maintenir ces performances impressionnantes.
Nous pouvons remarquer un léger bruit de bobine ou un bruit électronique de notre unité de test.
| Intel NUC11PAQi7 Iris Xe G7 96EUs, i7-1165G7, Samsung SSD 980 Pro 500GB MZ-V8P500BW | Intel NUC8i7BE Iris Plus Graphics 655, i7-8559U | Intel Hades Canyon NUC8i7HVK Vega M GH, i7-8809G, Intel Optane 120 GB SSDPEK1W120GA | Beelink SEi10 UHD Graphics G1 (Ice Lake 32 EU), i3-1005G1, Silicon Motion AZW 256G M.2280 NVMe 4X 200725 D | Zotac ZBox MI643 UHD Graphics 620, i5-10210U, Lexar NM610 1TB | GMK NucBox K1 UHD Graphics 600, Celeron J4125, HIKVision C100 NGFF SSD 128GB | |
|---|---|---|---|---|---|---|
| Noise | -10% | -11% | -17% | 2% | -10% | |
| arrêt / environnement * (dB) | 25.6 | 28.7 -12% | 28.7 -12% | 27.5 -7% | 26.1 -2% | 27.8 -9% |
| Idle Minimum * (dB) | 25.6 | 28.7 -12% | 29 -13% | 30.9 -21% | 27.5 -7% | 27.8 -9% |
| Idle Average * (dB) | 25.6 | 29.3 -14% | 29 -13% | 33.5 -31% | 27.5 -7% | 27.8 -9% |
| Idle Maximum * (dB) | 25.6 | 31.8 -24% | 29 -13% | 33.5 -31% | 27.5 -7% | 27.8 -9% |
| Load Average * (dB) | 33.6 | 39 -16% | 36 -7% | 38.5 -15% | 28.9 14% | 46.8 -39% |
| Witcher 3 ultra * (dB) | 33.6 | 39 -16% | 42 -25% | |||
| Load Maximum * (dB) | 54.5 | 41.4 24% | 49.4 9% | 51.6 5% | 42 23% | 46.8 14% |
* ... Moindre est la valeur, meilleures sont les performances
Degré de la nuisance sonore
| Au repos |
| 25.6 / 25.6 / 25.6 dB(A) |
| Fortement sollicité |
| 33.6 / 54.5 dB(A) |
 | ||
30 dB silencieux 40 dB(A) audible 50 dB(A) bruyant |
||
min: | ||
Température
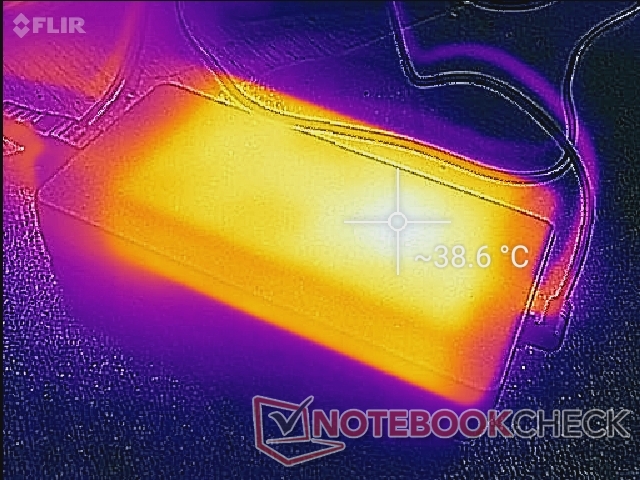
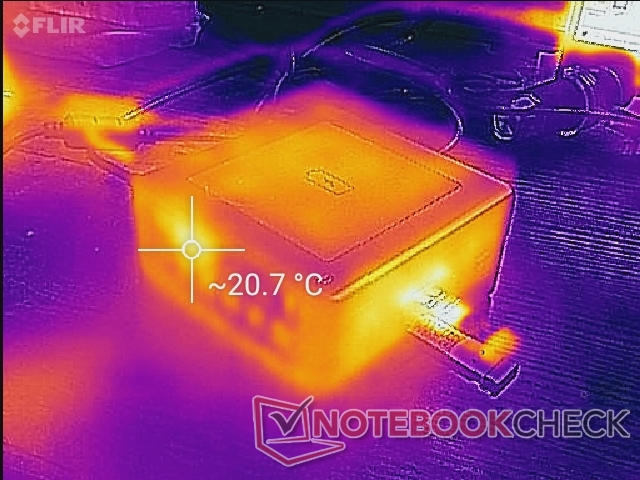
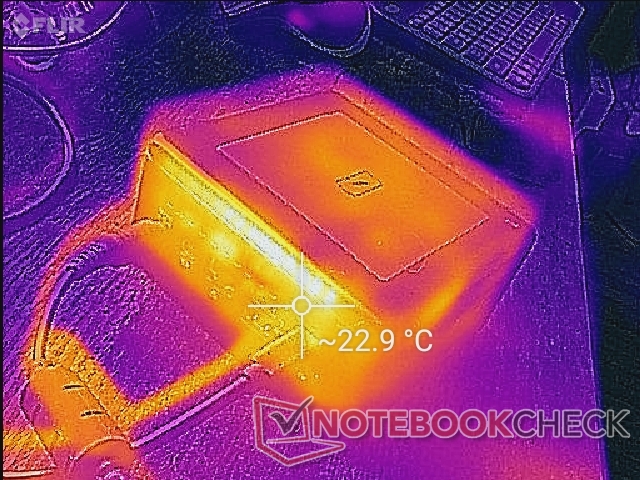
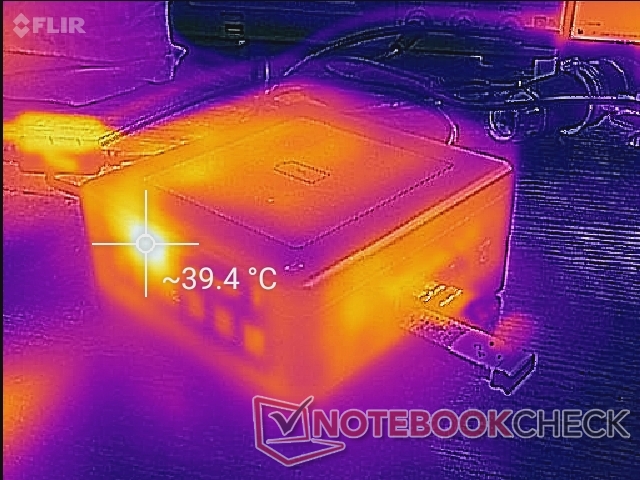
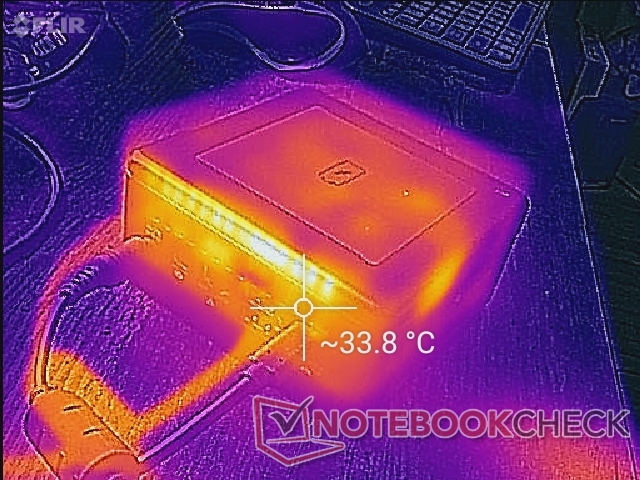
Les températures de surface ne posent pas de problème, même en cas de charge. L'appareil fonctionnera très bien s'il est placé sur le côté, mais ce n'est pas recommandé car les grilles de ventilation seront bloquées.
L'adaptateur secteur peut être sensiblement plus chaud que le mini PC lui-même à environ 40 C lors du jeu.
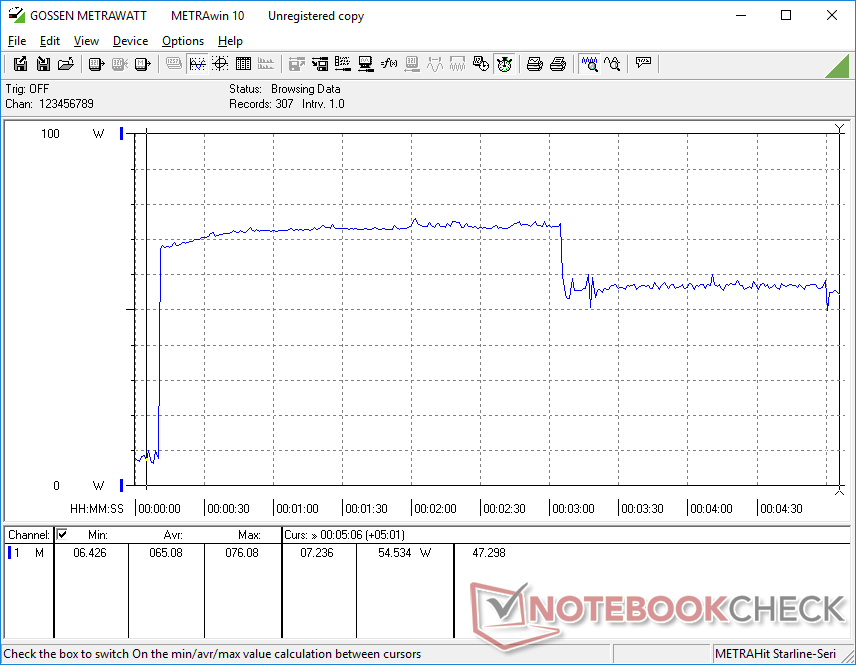
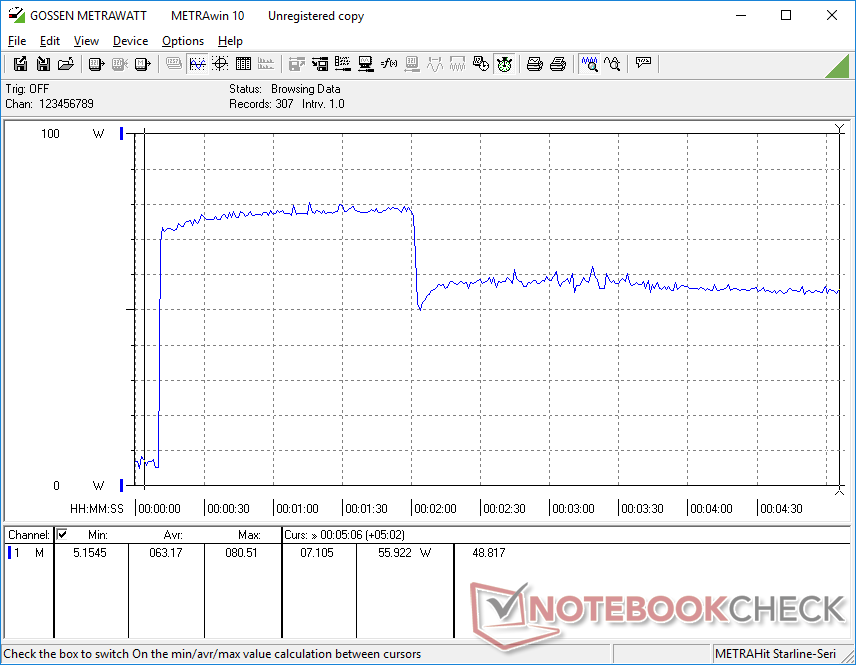
Test de stress
Nous insistons auprès du NUC pour qu'il identifie tout problème potentiel d'étranglement. Lors du fonctionnement de Prime95, la fréquence d'horloge passerait à 4,1 GHz pendant les premières minutes et à une température centrale stable de 86 C. Cependant, au bout d'un certain temps, la fréquence d'horloge et la température chutent automatiquement et fluctuent respectivement entre 2,7 et 3,4 GHz et entre 71 et 79 C. Une option permettant de fonctionner indéfiniment à 4,1 GHz et à 86 C pour une performance maximale et durable aurait été excellente pour les utilisateurs de puissance. Lors de l'exploitation Witcher 3 pour représenter les charges de jeu du monde réel, la fréquence d'horloge et la température sont beaucoup plus basses à seulement 57 C.
Notez que le régime du ventilateur fluctue entre 0 et 2000 même lorsque le système est au ralenti, comme le montre la capture d'écran ci-dessous.
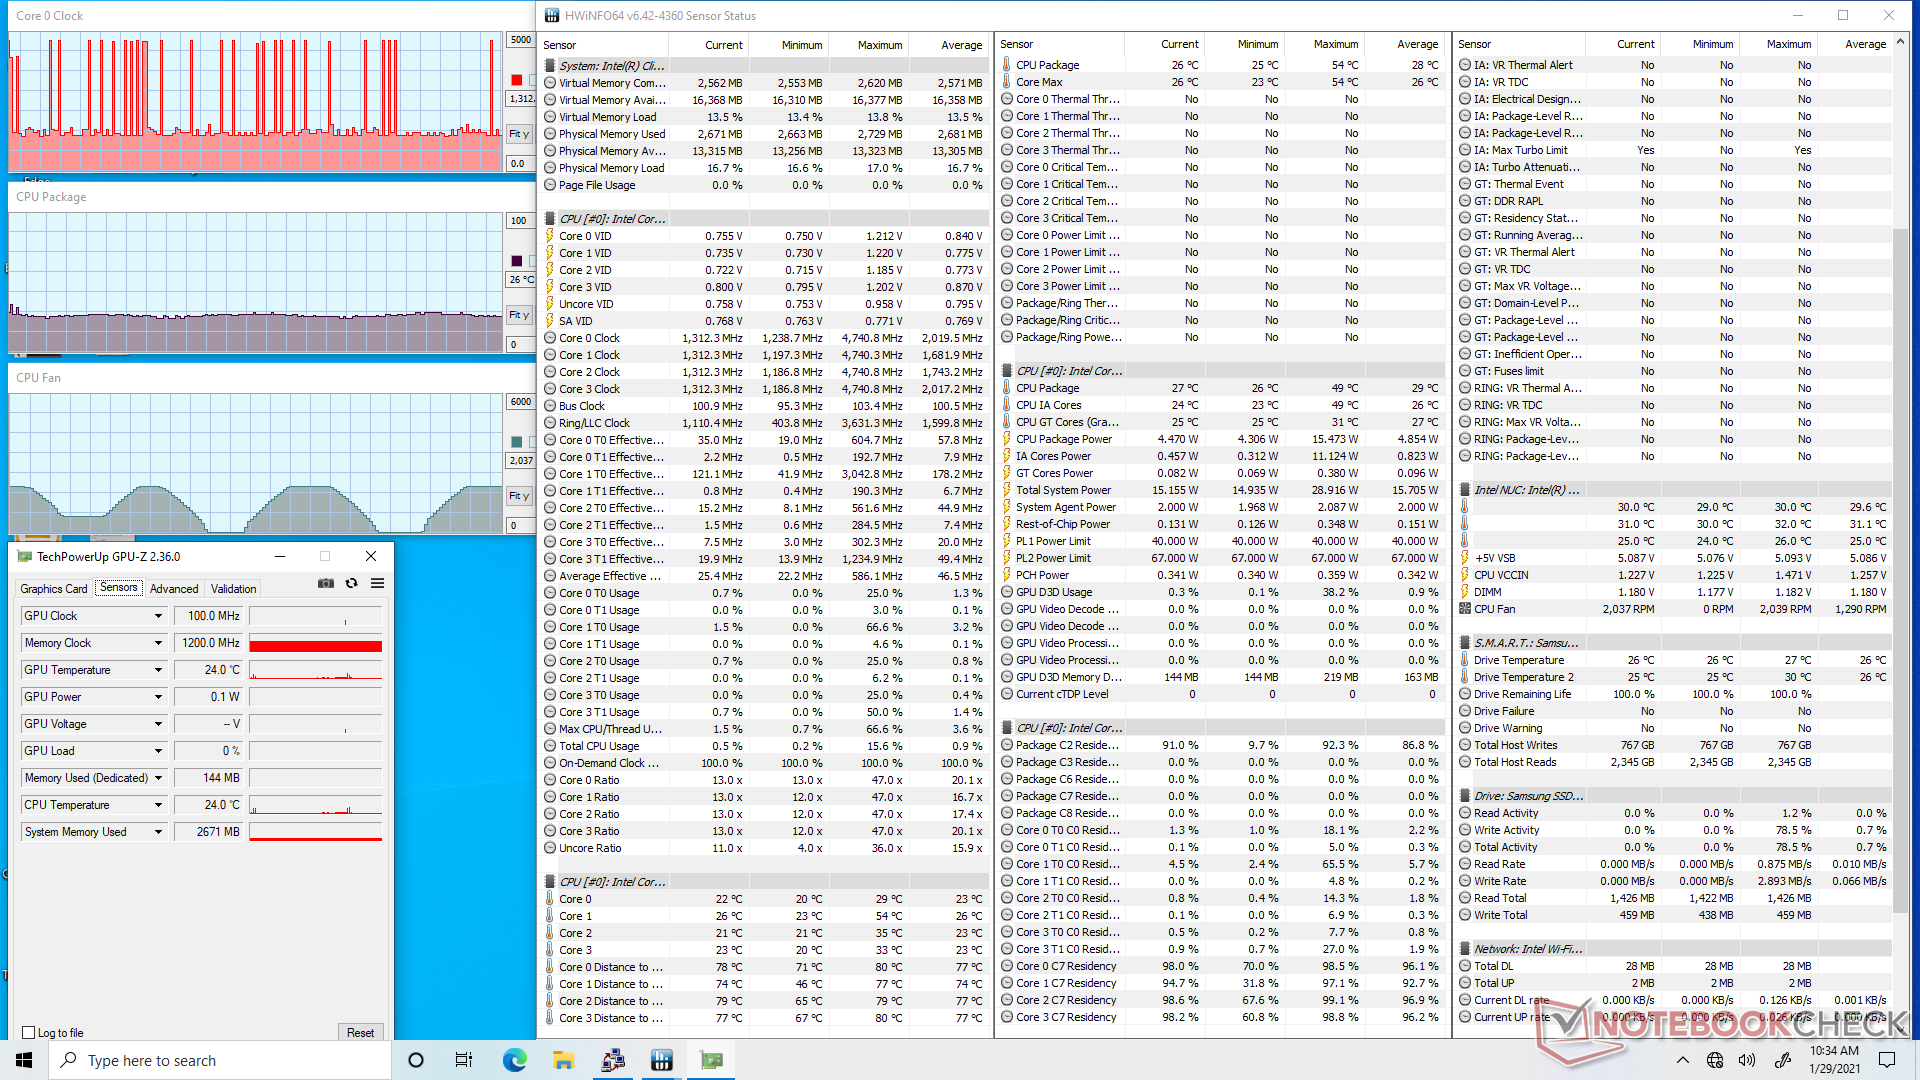
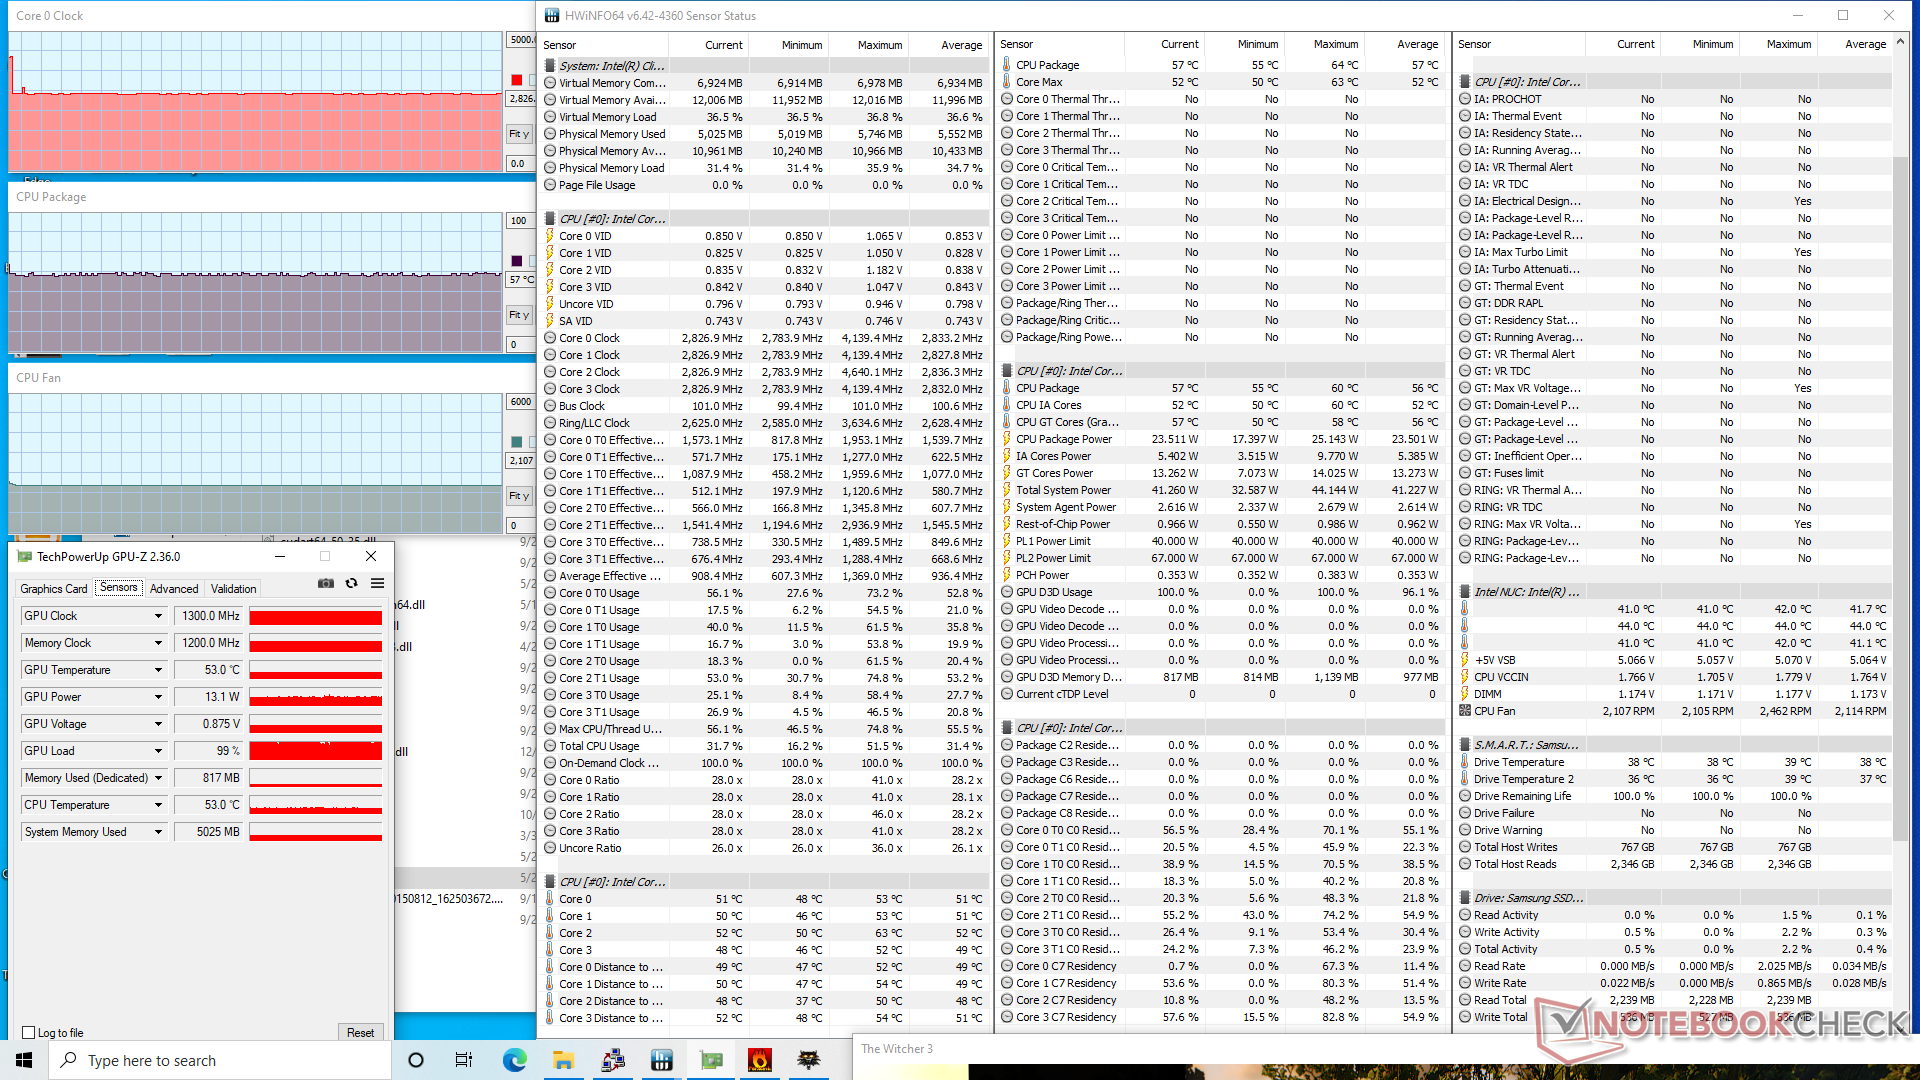
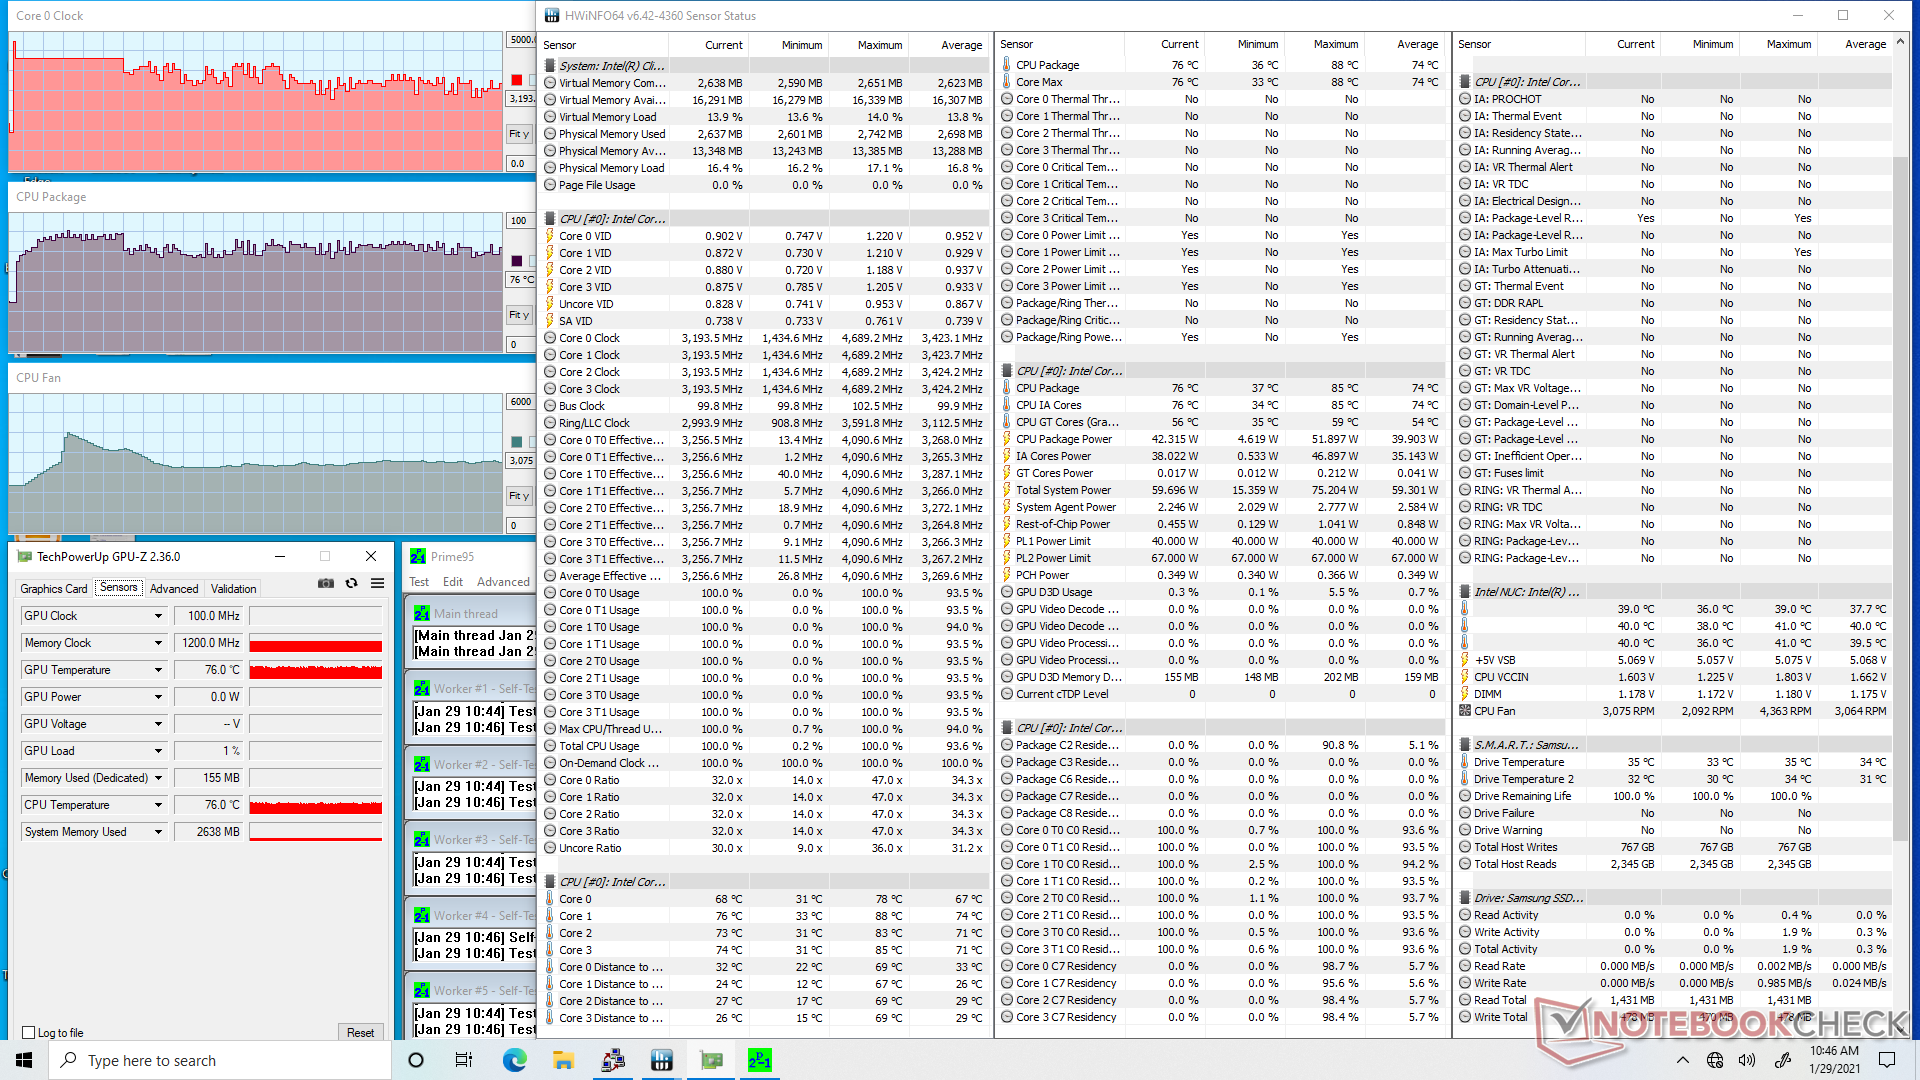
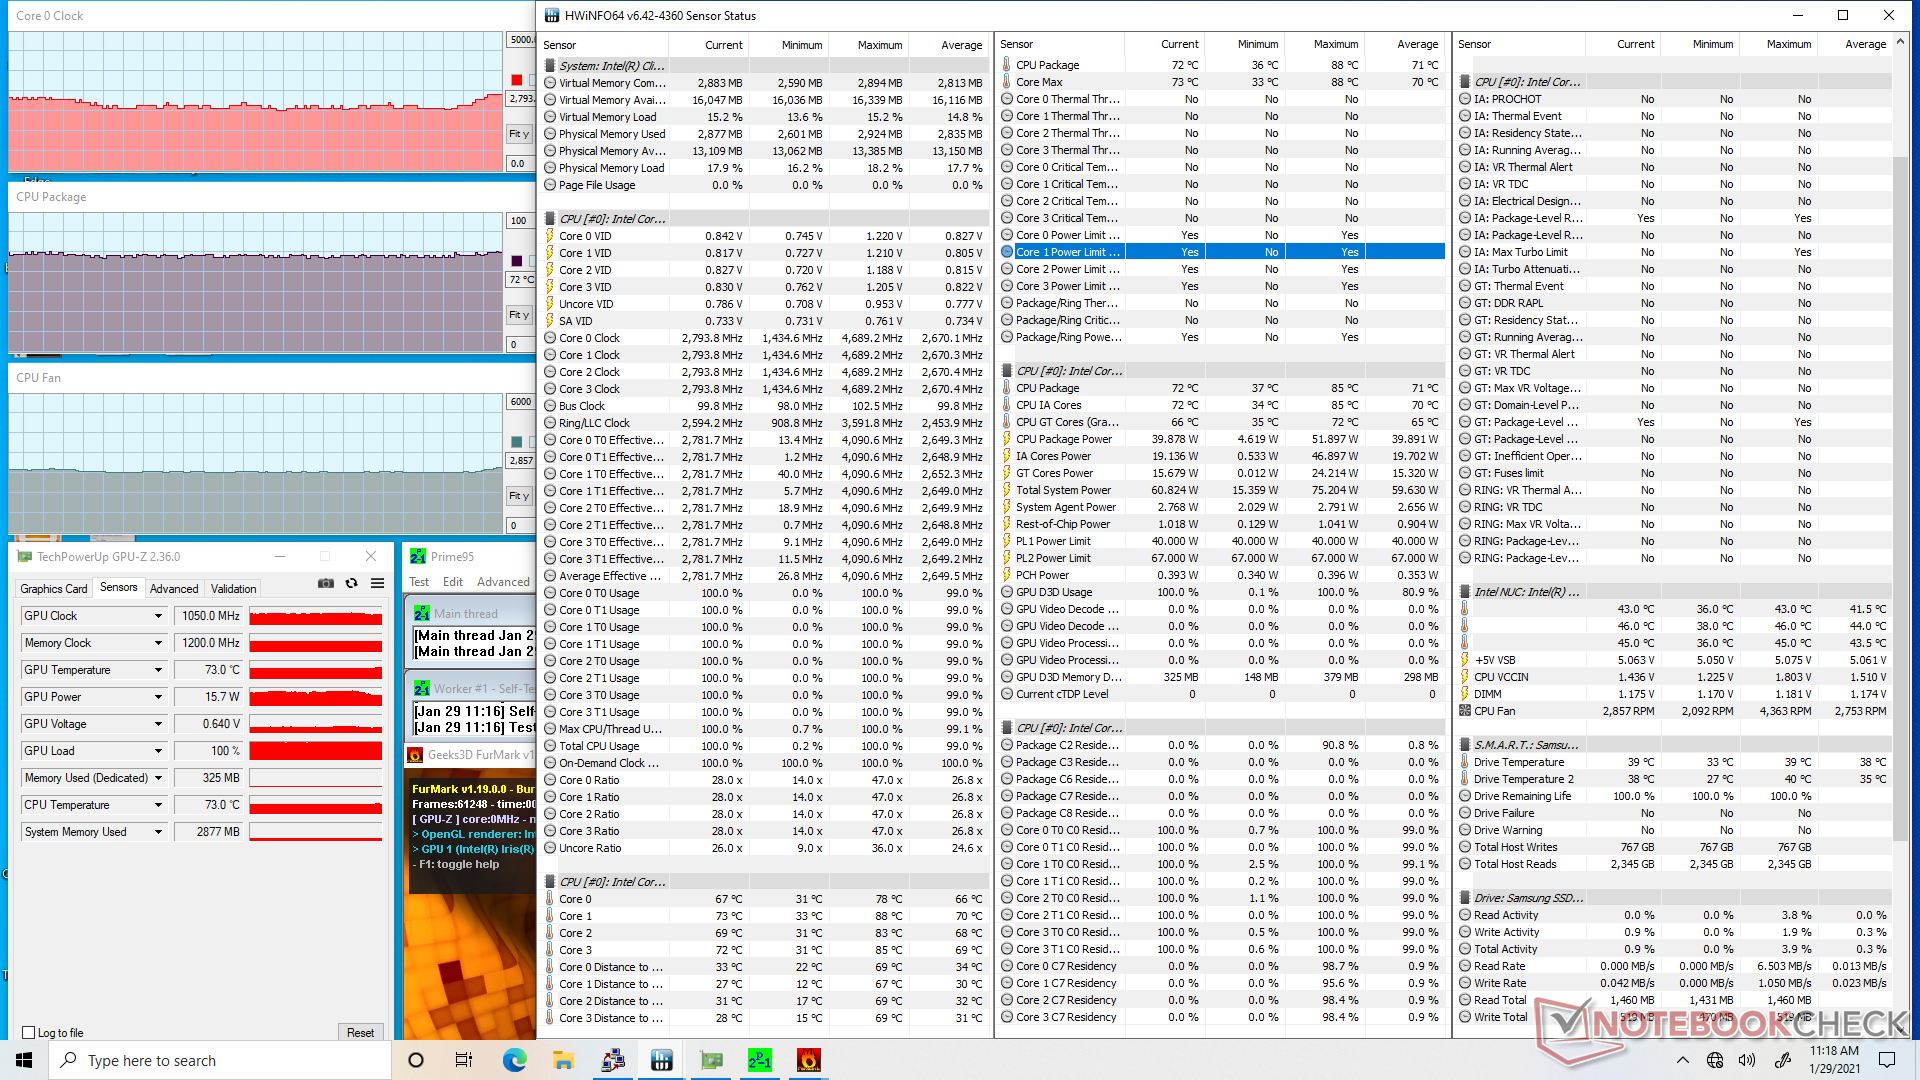
| Horloge CPU (GHz) | HorlogeGPU(MHz) | Températuremoyenne duCPU (°C) | |
| Lesystème est au repos | -- | -- | 26 |
| Prime95 Stress | 2.7 - 3.4 | -- | 71 - 79 |
| Prime95 + FurMark Stress | 2.1 - 2.8 | ~1050 | 72 |
| Witcher 3 Stress | 2.8 | 1300 | 57 |
Energy Management
Consommation d'énergie
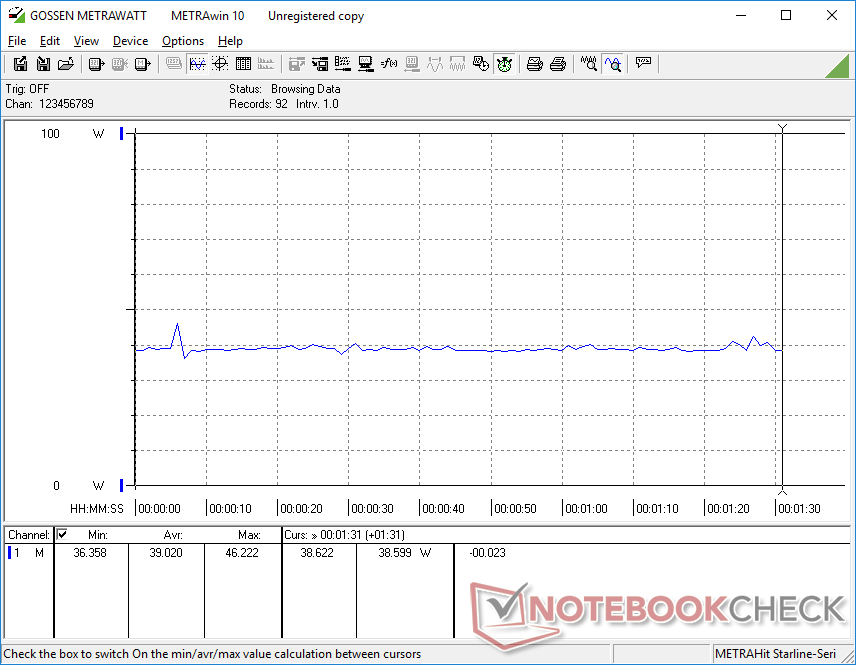
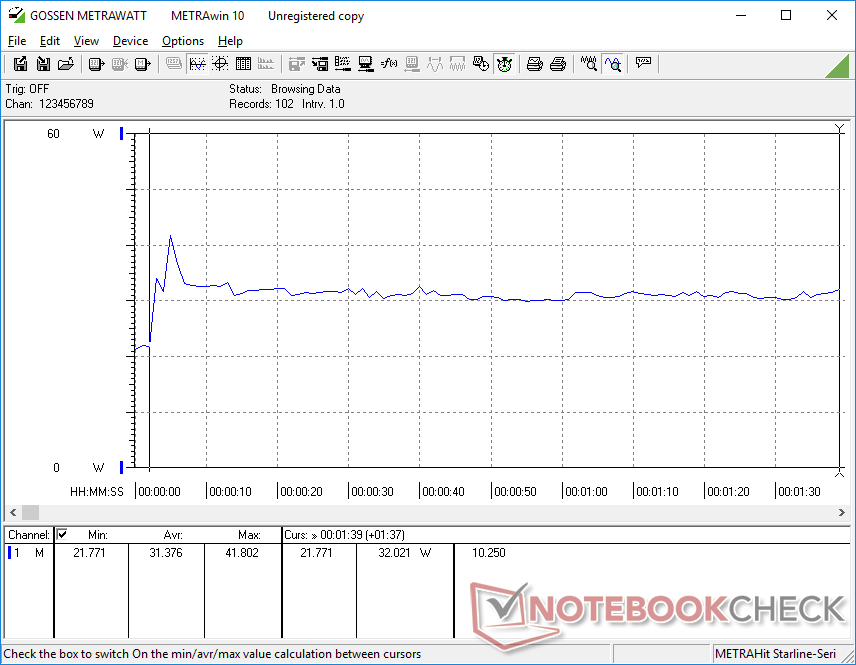
Les modèles NUC ont toujours été très économes en énergie et le NUC 11 poursuit la tendance. Le système ne consomme que 31 W à 39 W pour le jeu, contre 63 W et 50 W respectivement pour le Skull Canyon NUC et le Beelink GT-R35 concurrent, tout en offrant des performances CPU et GPU nettement plus rapides que les deux autres. Hades Canyon est toujours plus de deux fois plus puissant en termes de performances graphiques, mais il consomme également trois fois plus de puissance dans le processus.
Nous sommes en mesure de mesurer une consommation maximale de 80,5 W en cas de charges extrêmes, comme le montrent les graphiques ci-dessous. Ce résultat n'est que temporaire et correspond à nos observations sur la fréquence d'horloge lors de l'exécution de Prime95 dans la section "Stress Test" ci-dessus.
Il convient de noter que l'adaptateur secteur externe de 120 W est relativement grand (~15 x 7,5 x 2,5 cm) et pèse plus des deux tiers du poids de l'unité NUC (448 g contre 647 g).
| Éteint/en veille | |
| Au repos | |
| Fortement sollicité |
|
Légende:
min: | |
| Intel NUC11PAQi7 i7-1165G7, Iris Xe G7 96EUs, Samsung SSD 980 Pro 500GB MZ-V8P500BW, , x, | Intel NUC8i7BE i7-8559U, Iris Plus Graphics 655, , , x, | Intel Hades Canyon NUC8i7HVK i7-8809G, Vega M GH, Intel Optane 120 GB SSDPEK1W120GA, , x, | Zotac ZBox MI643 i5-10210U, UHD Graphics 620, Lexar NM610 1TB, , x, | Beelink GTR35 II-G-16512D00W64PRO-1T R5 3550H, Vega 8, Silicon Motion AZW 512G NV428, , x, | |
|---|---|---|---|---|---|
| Power Consumption | -3% | -173% | -29% | -44% | |
| Idle Minimum * (Watt) | 5.6 | 2.7 52% | 15.5 -177% | 7.5 -34% | 8.8 -57% |
| Idle Average * (Watt) | 5.6 | 3.1 45% | 16.2 -189% | 9.2 -64% | 9.1 -63% |
| Idle Maximum * (Watt) | 6 | 6.3 -5% | 16.5 -175% | 9.6 -60% | 9.6 -60% |
| Load Average * (Watt) | 31.4 | 59.7 -90% | 83.4 -166% | 34.4 -10% | 55.3 -76% |
| Witcher 3 ultra * (Watt) | 39 | 47.2 -21% | 121.7 -212% | 50.3 -29% | |
| Load Maximum * (Watt) | 80.5 | 78 3% | 173.5 -116% | 60.6 25% | 65.6 19% |
* ... Moindre est la valeur, meilleures sont les performances
Points positifs
Points négatifs
Verdict
En termes de performances, notre Tiger Lake Core i7 est à peu près à égalité avec le Comet Lake NUC 10 dans les charges multi-filières, tout en étant environ 20 % plus rapide dans les charges monofilières. Son plus grand avantage réside toutefois dans les performances graphiques, l'Iris Xe pouvant être plus de 3 fois plus rapide que le UHD Graphics 620 sans même avoir besoin de consommer autant d'énergie. Si la puissance et l'efficacité du GPU sont les plus importantes, alors le NUC 11 sera le meilleur investissement. Sinon, les utilisateurs qui ont l'intention d'utiliser principalement des charges HTPC, comme le streaming 4K ou la navigation vidéo, seront satisfaits d'un NUC 10 plus ancien, tandis que le NUC Hades Canyon restera la meilleure option pour les jeux bruts.
Le NUC met Tiger Lake sous un meilleur jour que ce que la plupart des ordinateurs portables ont réussi à faire avec la même série de processeurs. Il vous coûtera plus cher que la plupart des autres mini-PC Core de la série U, mais la qualité et la garantie de 3 ans en font un investissement plus sûr.
Il est fortement recommandé de configurer le NUC 11 avec une mémoire double canal pour augmenter les performances graphiques. Notre kit monocanal fourni par Intel a donné des scores 3DMark et des fréquences d'images plus lents que prévu, ce qui ne rend pas justice à Iris Xe.
Sur les futurs NUC, nous aimerions voir un lecteur d'empreintes digitales intégré et un support pour les adaptateurs USB-C AC. Le mini PC Beelink GT-R concurrent comprend un lecteur d'empreintes digitales, tandis qu'une source d'alimentation USB-C externe serait une solution plus universelle à l'avenir.
Prix et disponibilité
La série NUC 11 ne devrait pas être livrée avant mars 2021 et n'est donc pas encore largement disponible au moment où nous écrivons ces lignes
Price comparison

