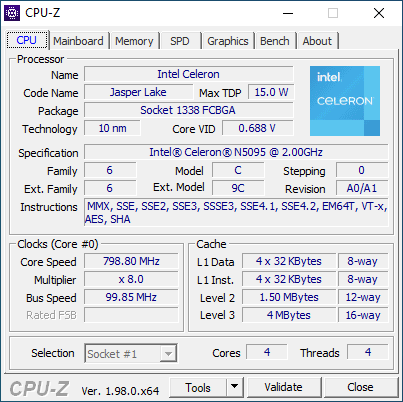
Test du Beelink U59 : l'Intel Celeron N5095 Jasper Lake évalué dans ce mini PC

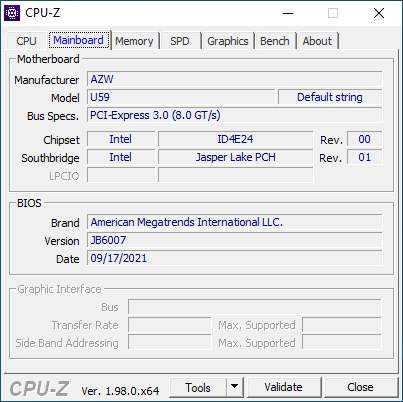
Beelink a récemment mis à disposition son mini PC U59 pour succéder à son U55 de dernière génération. Le système est équipé du nouveau Celeron N5095 à quatre cœurs d'Intel pour remplacer les anciens Celeron N4500, J4125 ou N4120 que l'on trouve couramment sur d'autres mini-PC dans cette même gamme de prix de 300 USD.
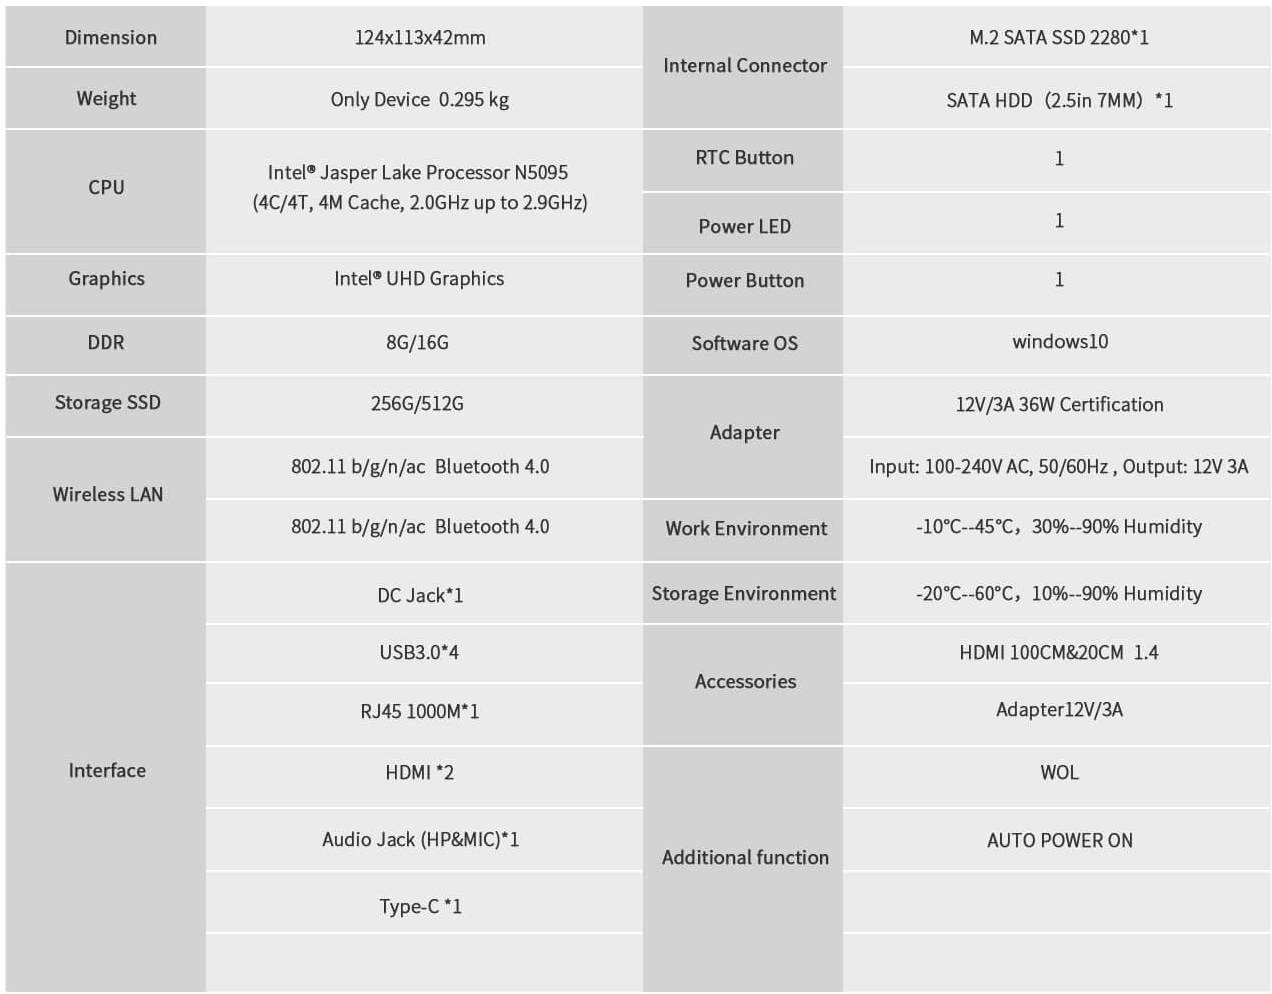
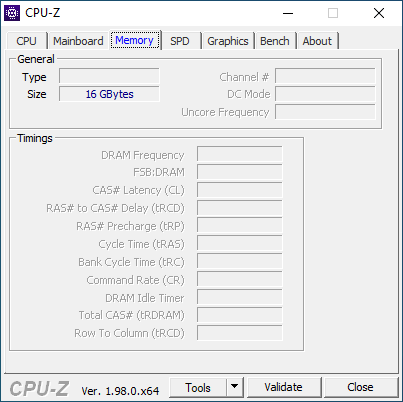
Notre configuration de test spécifique avec 16 Go de RAM double canal et 512 Go de SSD M.2 peut être trouvée en ligne pour 349 USD, tandis qu'une configuration inférieure avec la moitié de la RAM et du stockage peut être trouvée pour seulement 279 USD. Les spécifications supplémentaires de l'U59 sont disponibles sur sa page produit officielle https://www.bee-link.com/collections/computer/products/u59-n5095.
Plus de commentaires sur Beelink :
Potential Competitors in Comparison
Note | Date | Modèle | Poids | Épaisseur | Taille | Résolution | Prix |
|---|---|---|---|---|---|---|---|
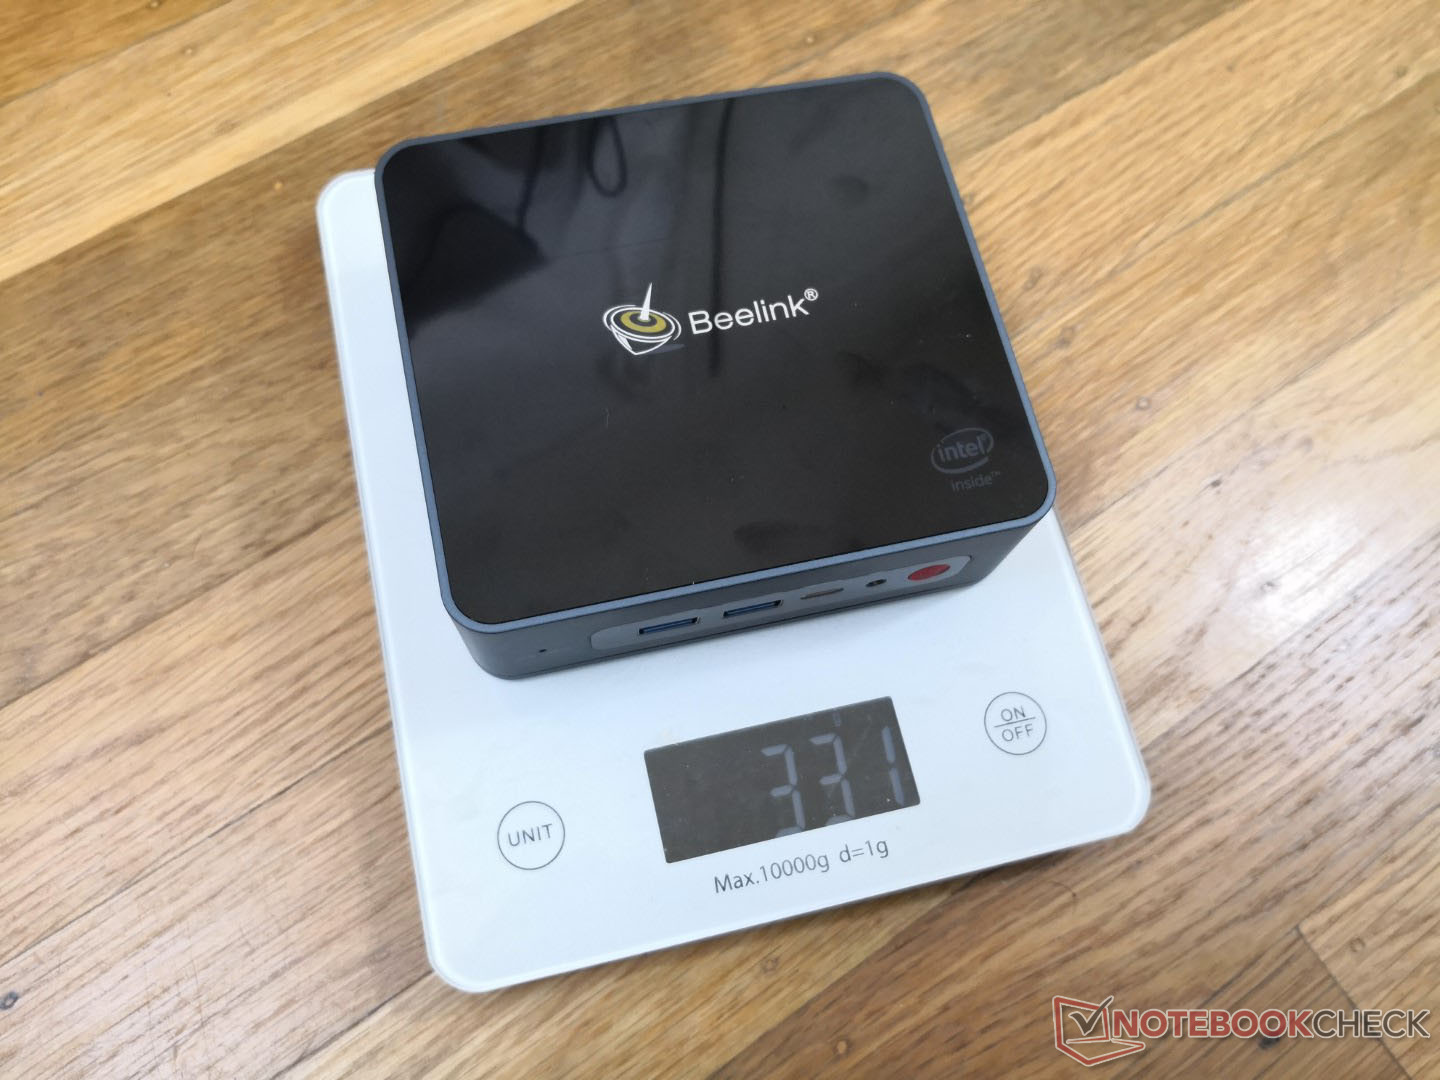
v (old) | 11/21 | Beelink U59 Celeron N5095, UHD Graphics (Jasper Lake 16 EU) | 329 g | 42 mm | x | ||
v (old) | 04/21 | Intel NUC11TNKi5 i5-1135G7, Iris Xe G7 80EUs | 504 g | 37 mm | x | ||
v (old) | 11/18 | Intel NUC8i7BE i7-8559U, Iris Plus Graphics 655 | 683 g | 51 mm | x | ||
v (old) | Beelink SEi10 i3-1005G1, UHD Graphics G1 (Ice Lake 32 EU) | 350 g | 41 mm | x | |||
v (old) | Zotac ZBOX MI642 Nano i5-10210U, UHD Graphics 620 | 472 g | 51 mm | x | |||
v (old) | 09/20 | GMK NucBox K1 Celeron J4125, UHD Graphics 600 | 130 g | 42 mm | x |
Cas
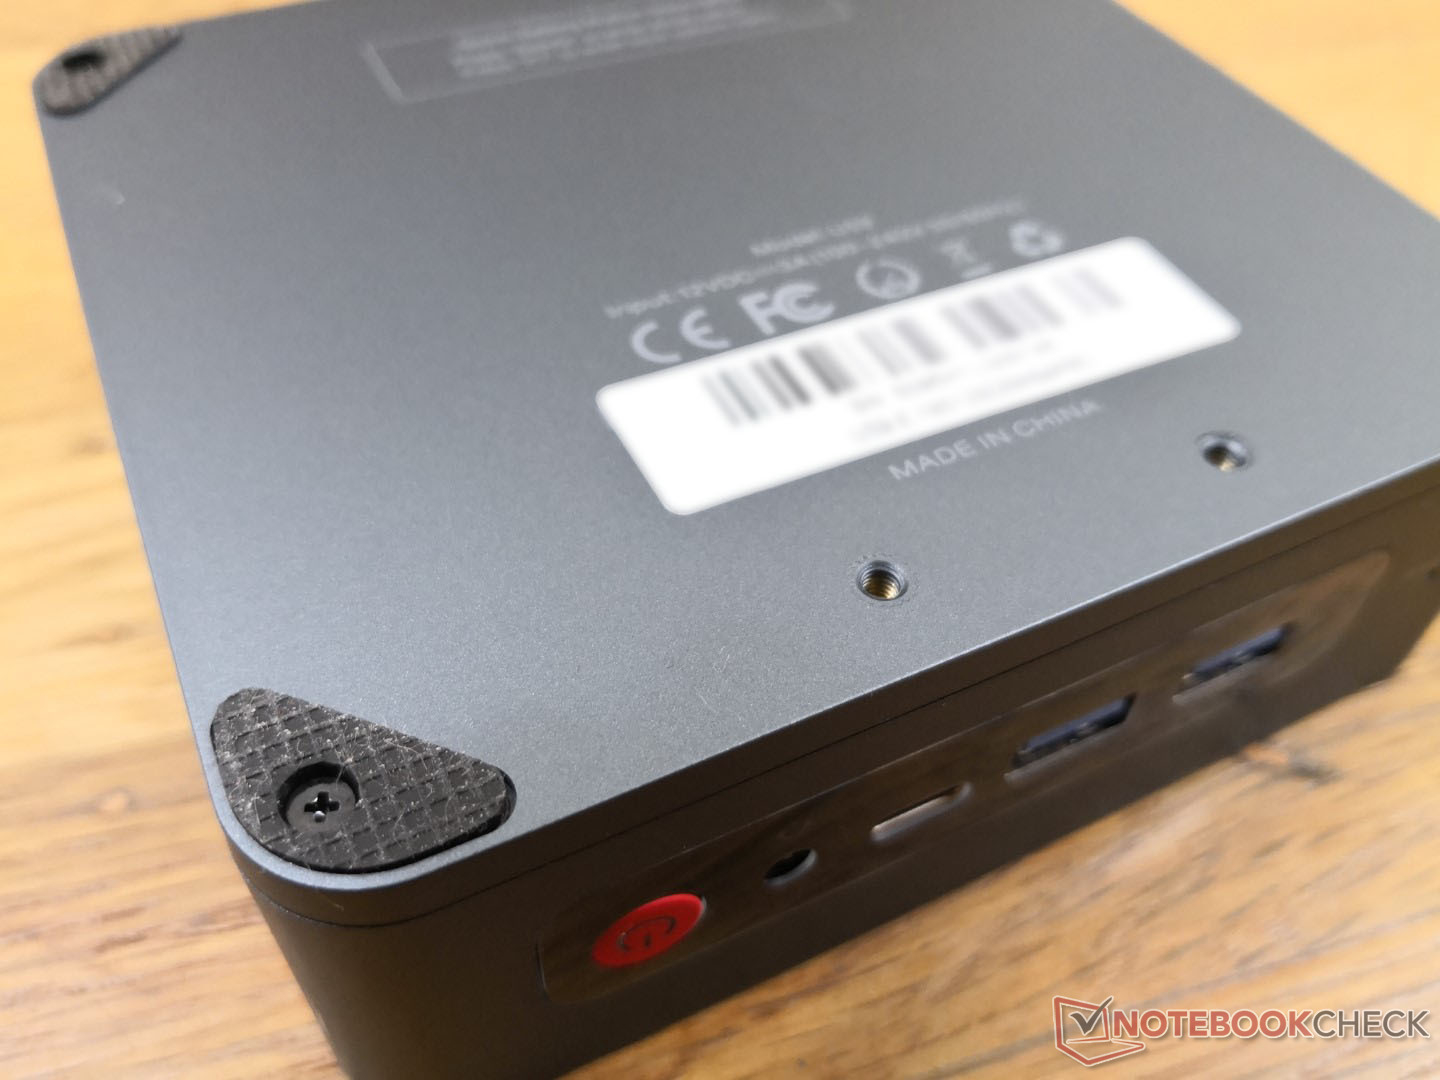
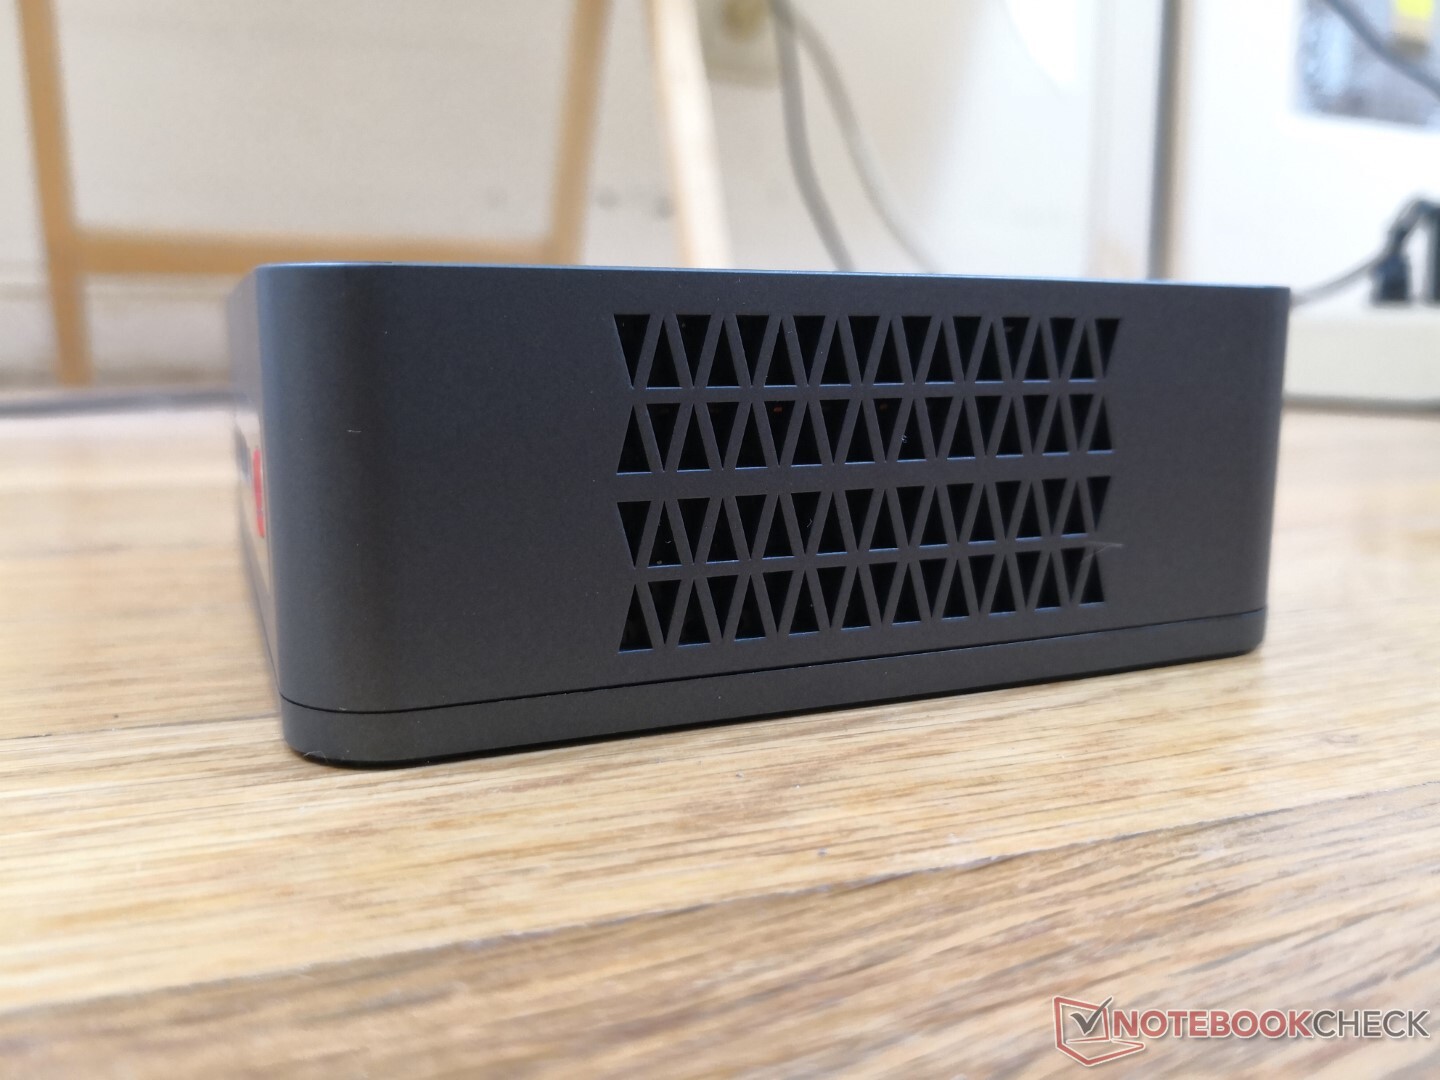
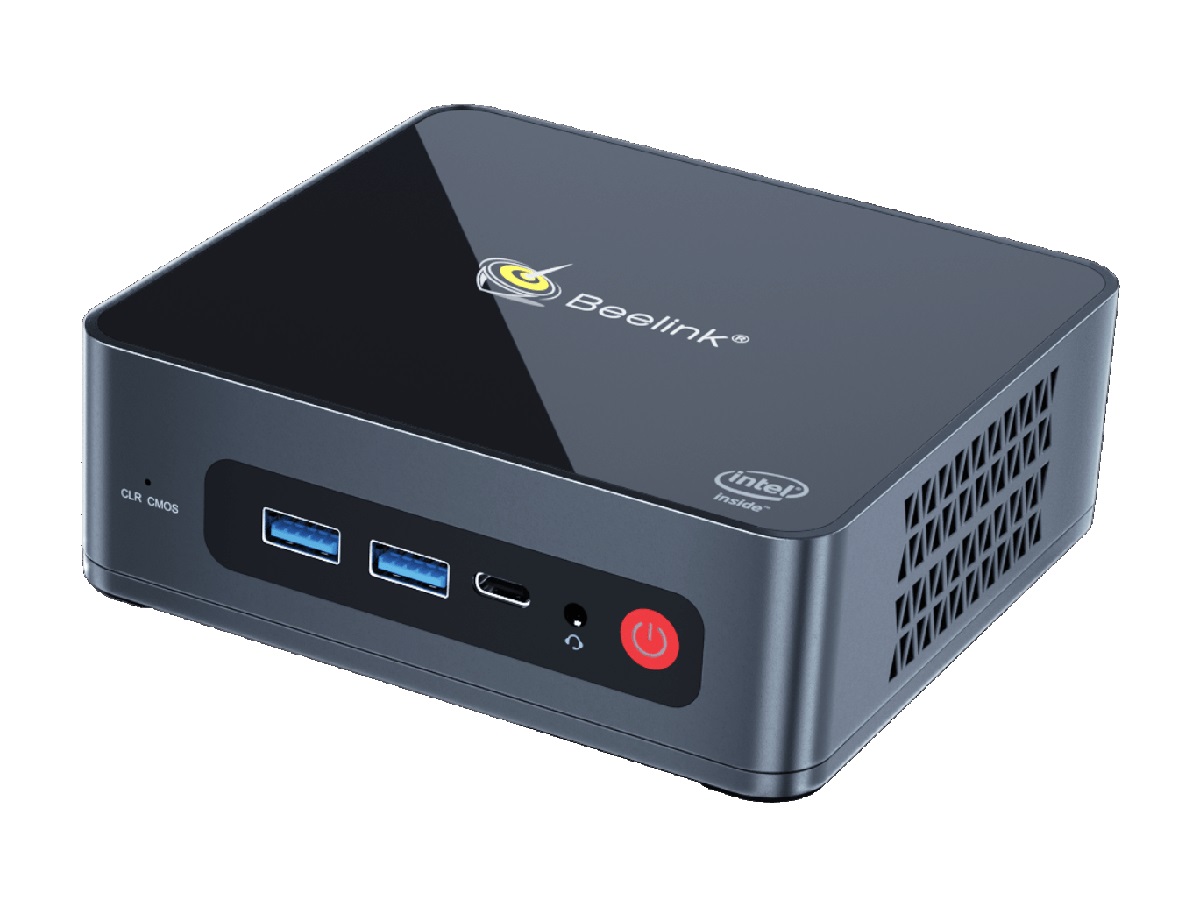
Beelink utilise un design de châssis similaire entre sa série de mini PC U59 et SER3 basée sur AMD. Sur le U59, cependant, le dessus est simplement en plastique brillant sans les grilles métalliques ou le périmètre chromé que l'on trouve sur le SER3 pour un look plus discret. Le dessus en plastique semble agréable au premier abord, mais même la plus petite des rayures ou des empreintes digitales sera difficile à cacher. Il fléchit aussi plus facilement en son centre quand on le compare à d'autres mini PC plus épais comme le GMK NucBox 2 ou Intel NUC série.
Connectivité
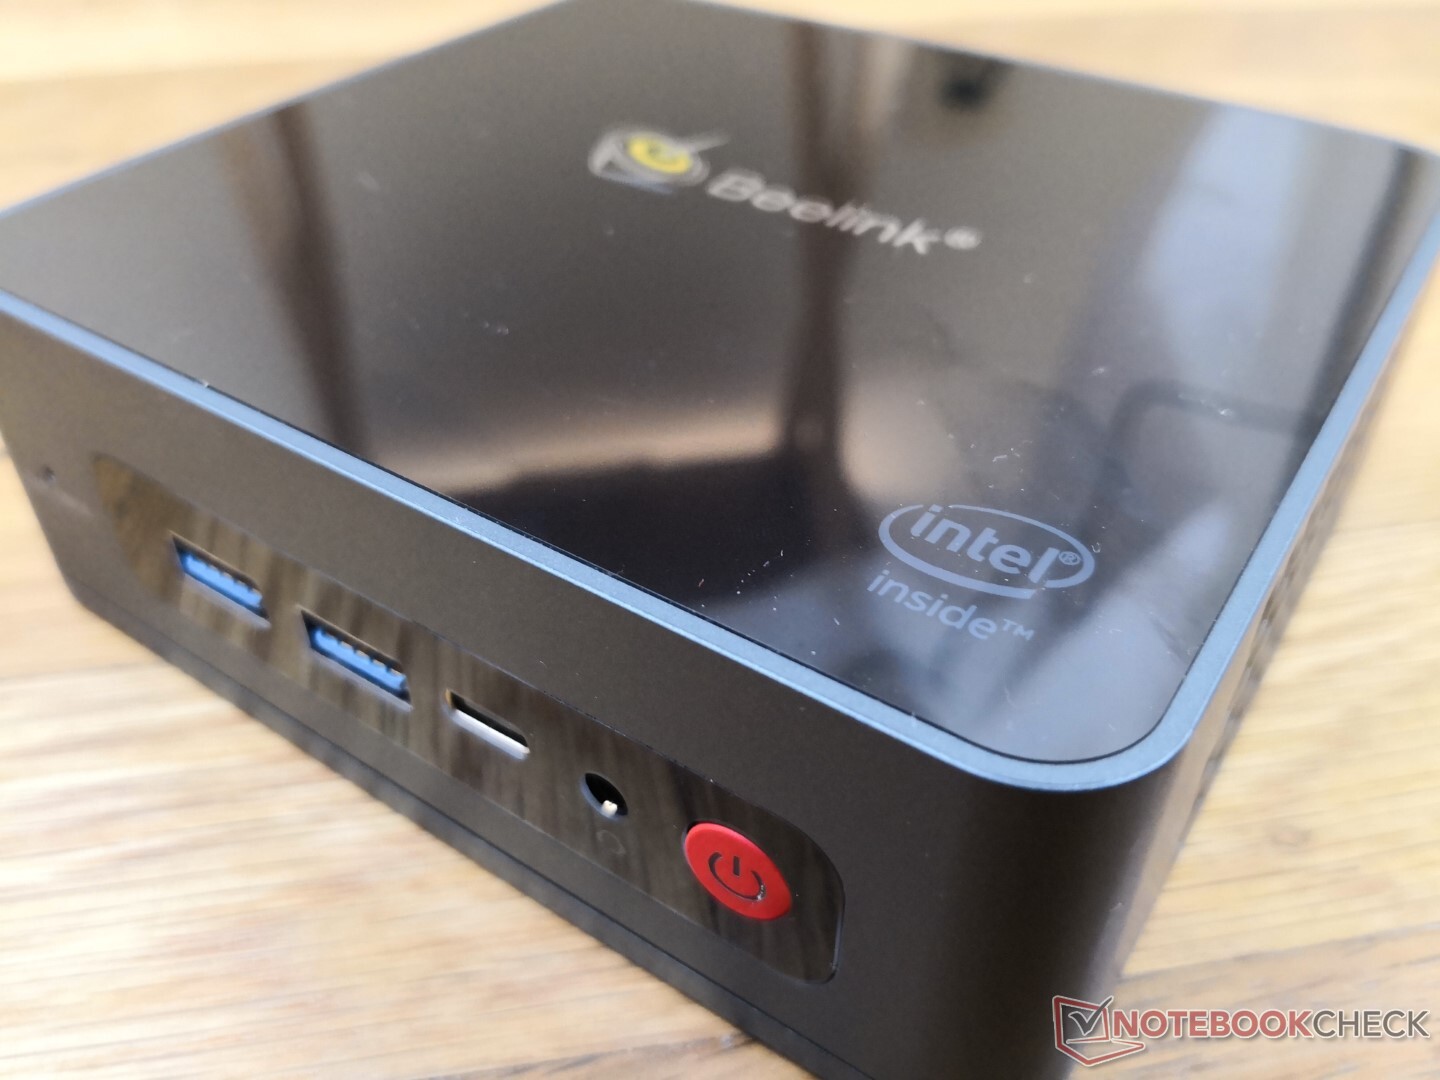
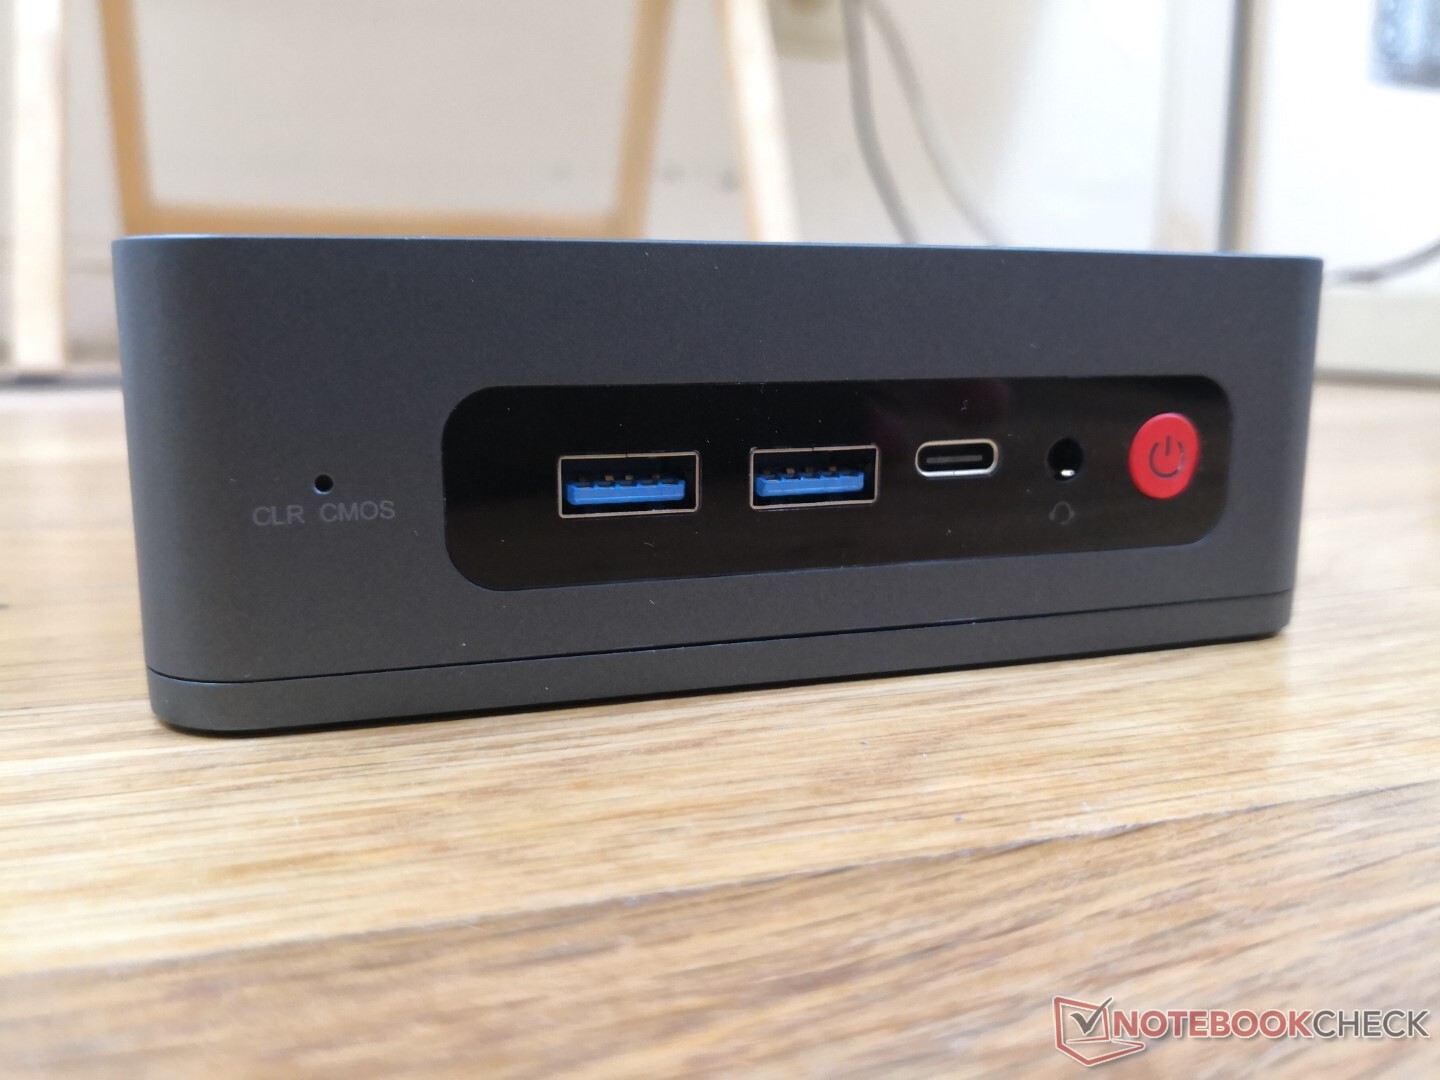
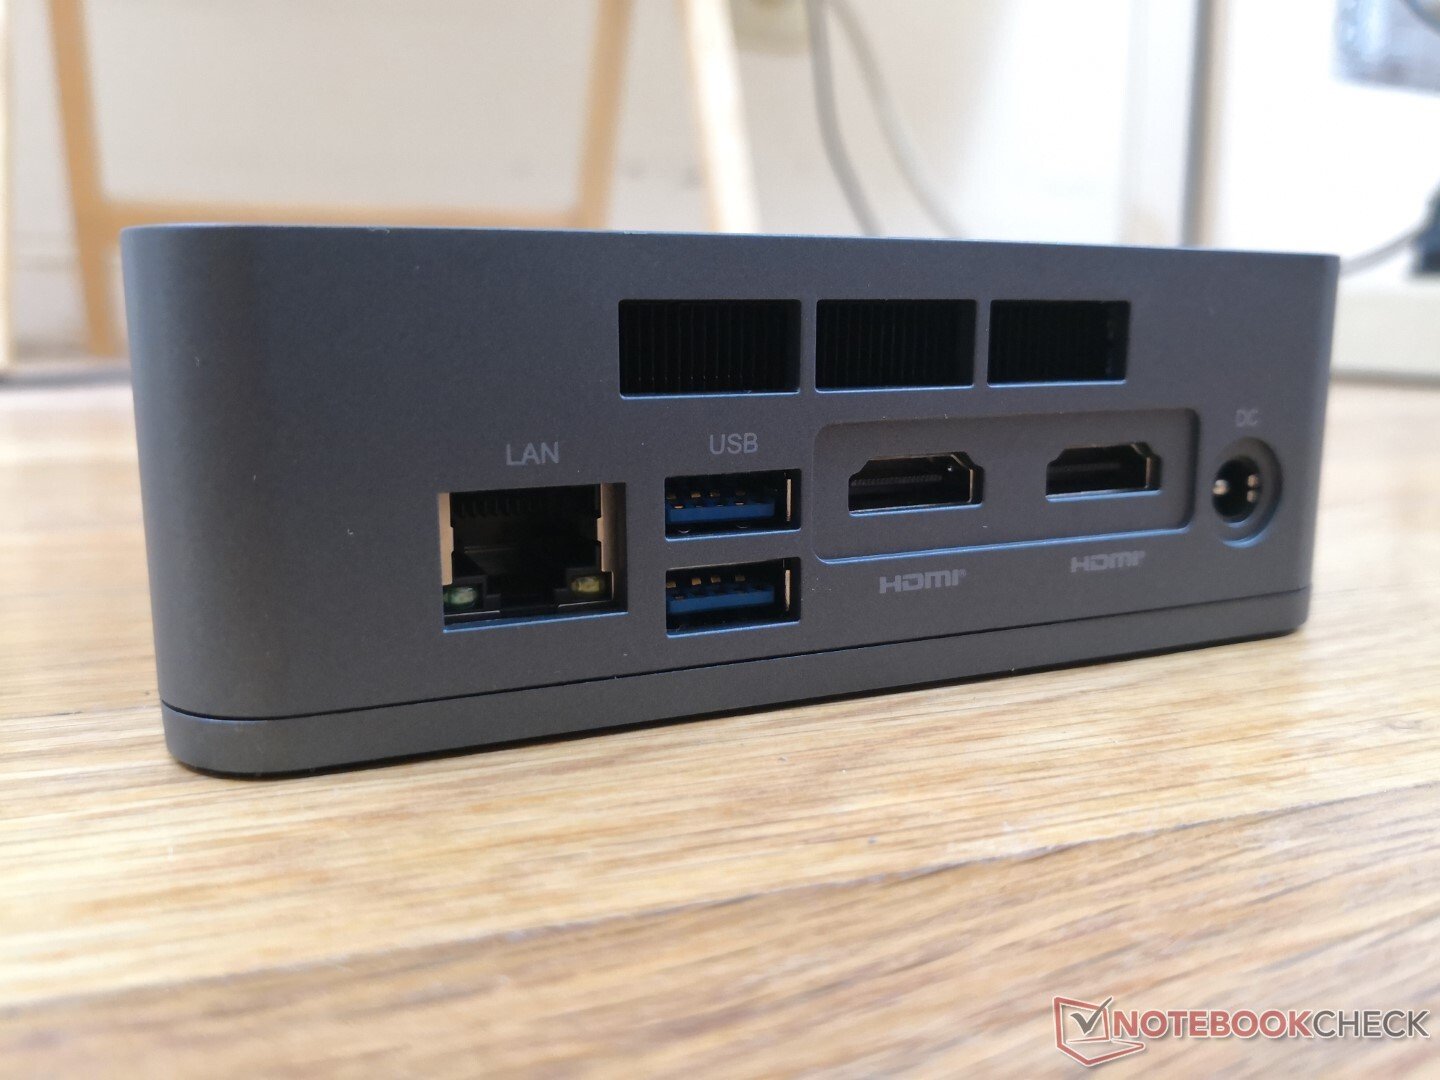
Les options de port physique sont identiques à celles du Beelink SEi10 à l'exception de la prise en charge de Thunderbolt. La sortie DisplayPort-over-USB-C et 4K60 est prise en charge.
Communication
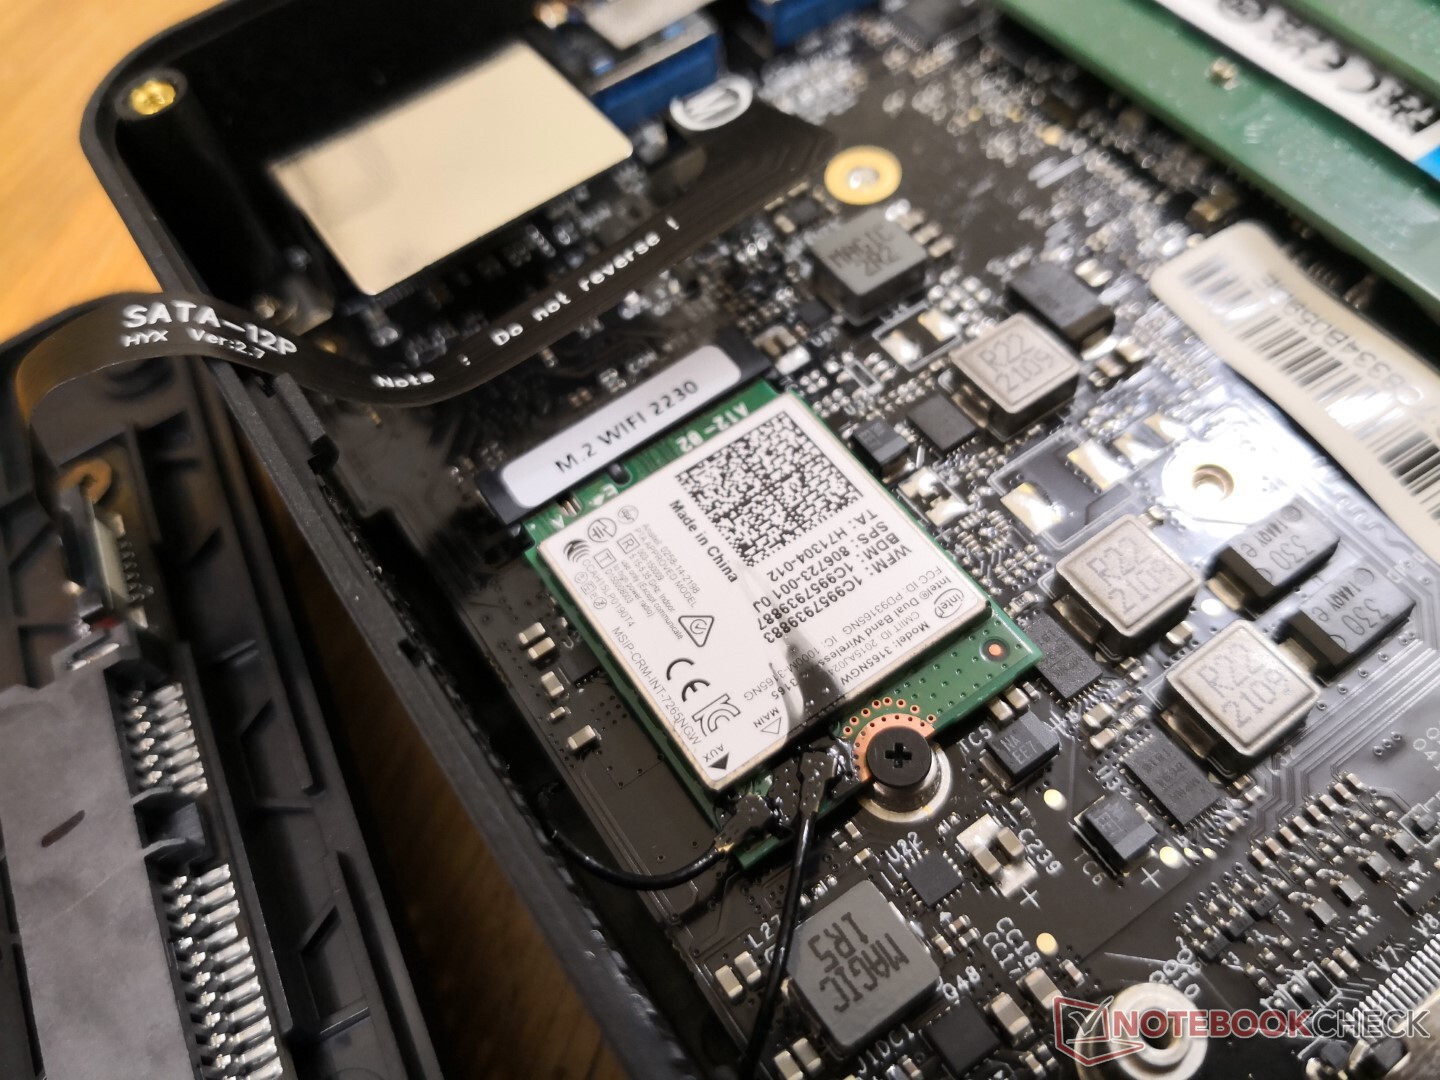
L'Intel 3165, vieux de 7 ans, est livré en standard pour la connectivité Wi-Fi 5 jusqu'à un débit théorique de 433 Mbps. Les performances sont stables bien que beaucoup plus lentes que les modules modernes Wi-Fi 6 de plus d'un gigabit.
| Networking | |
| iperf3 transmit AX12 | |
| Intel NUC11TNKi5 | |
| Beelink SEi10 | |
| Intel NUC8i7BE | |
| Beelink U59 | |
| GMK NucBox K1 | |
| iperf3 receive AX12 | |
| Intel NUC11TNKi5 | |
| Beelink SEi10 | |
| Intel NUC8i7BE | |
| GMK NucBox K1 | |
| Beelink U59 | |
Maintenance
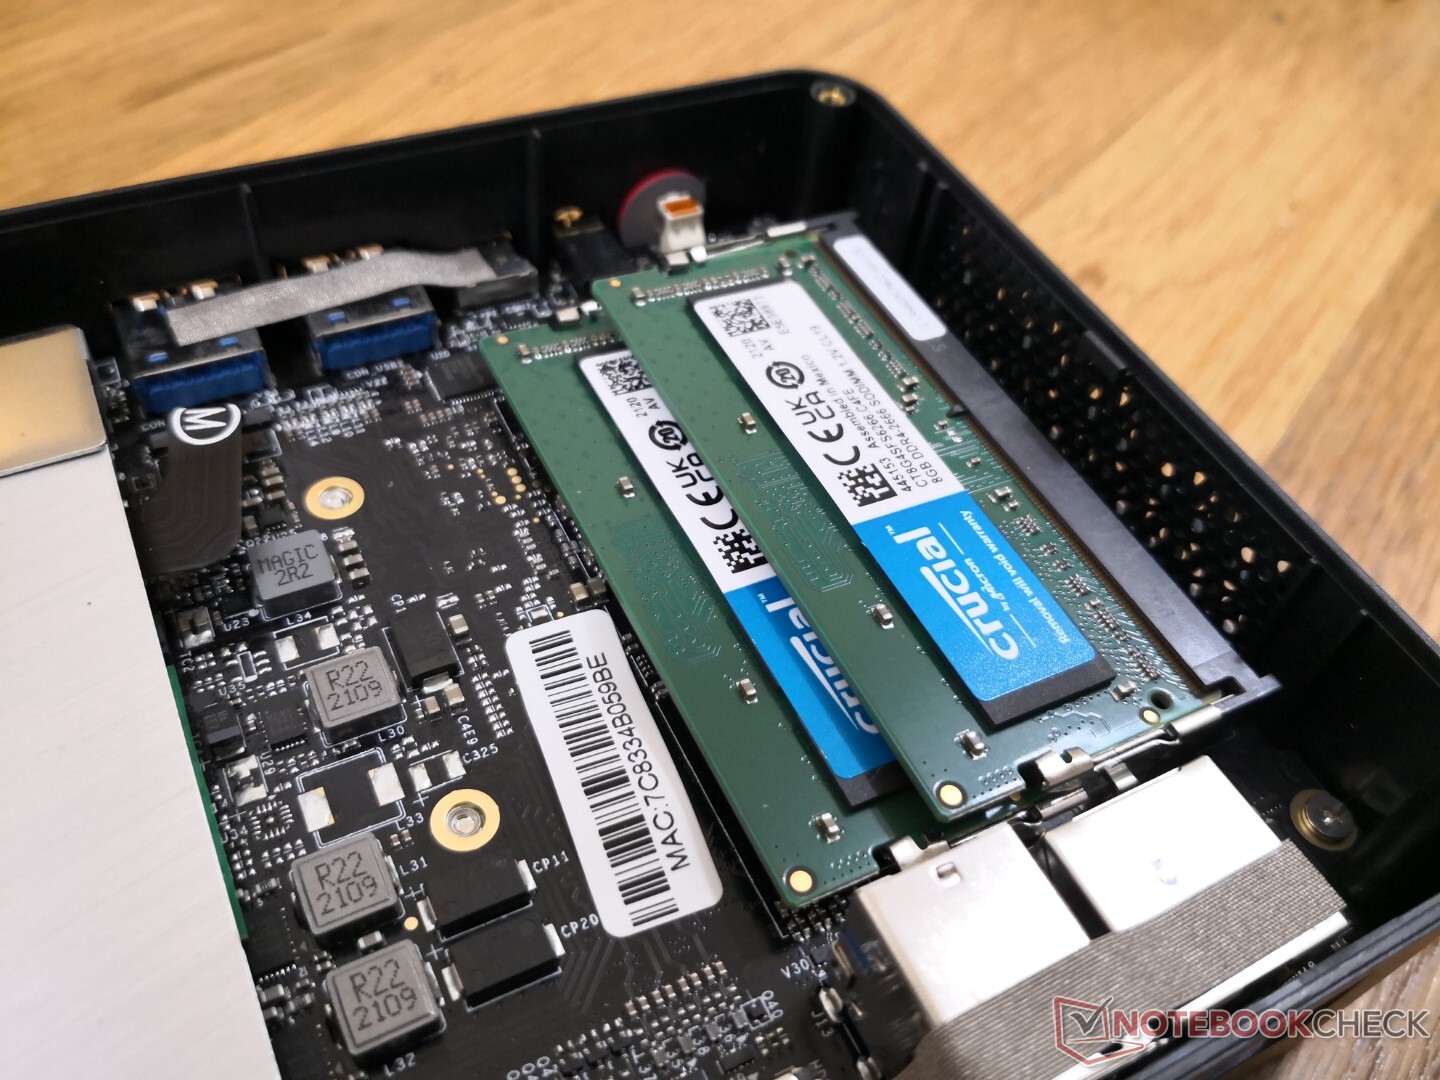
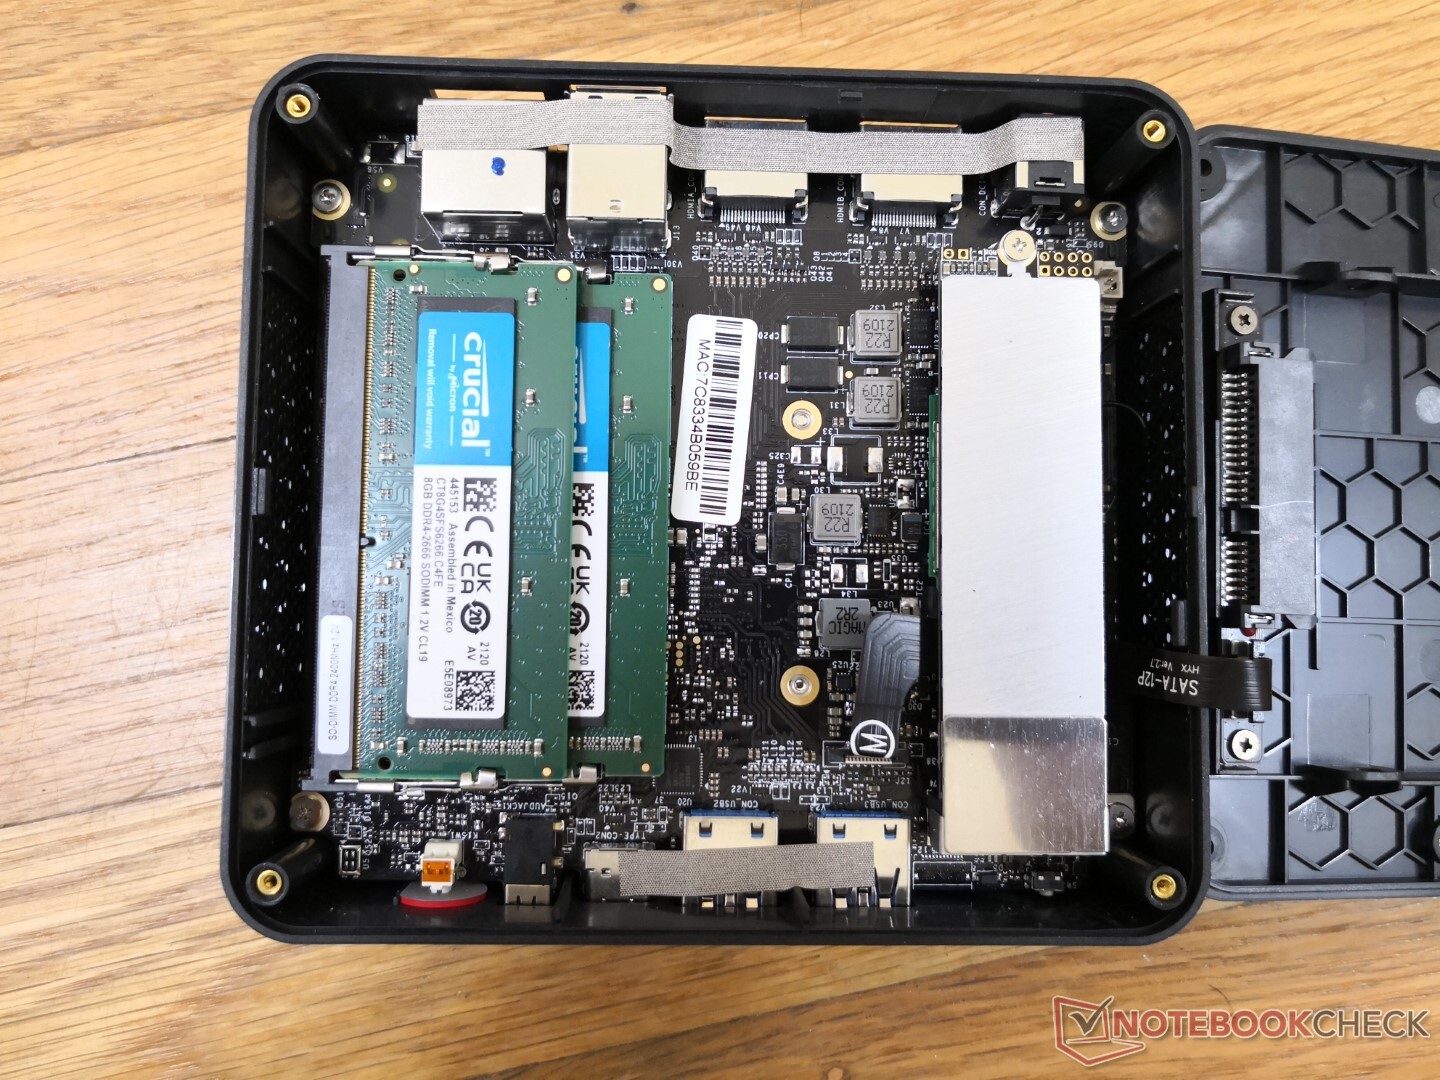
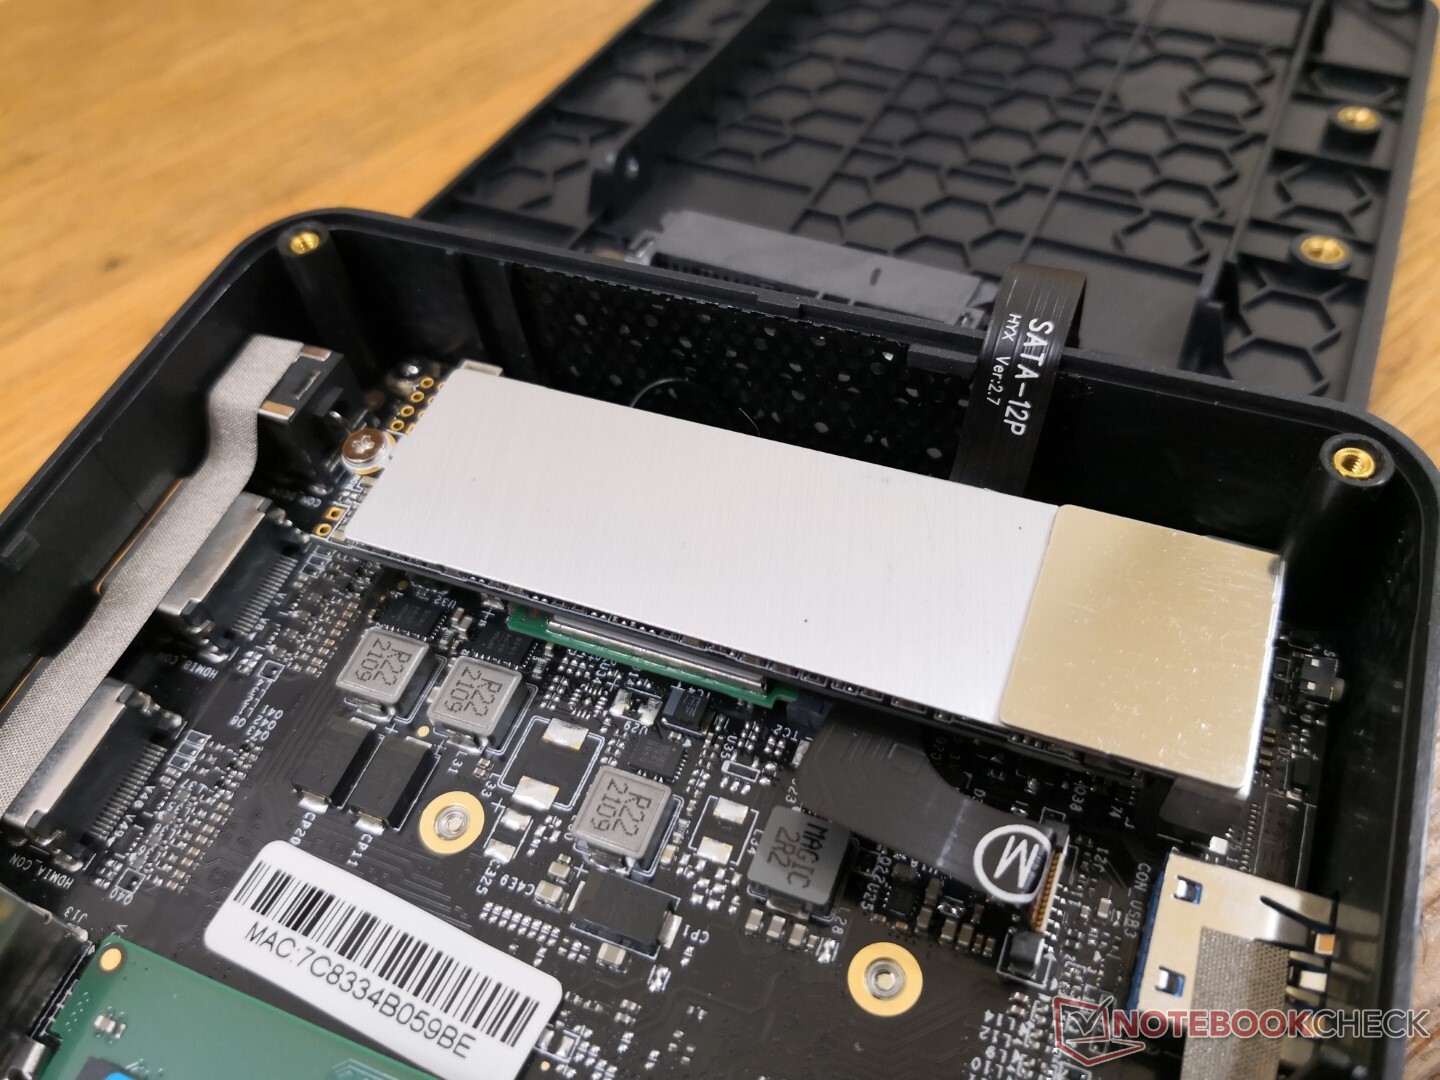
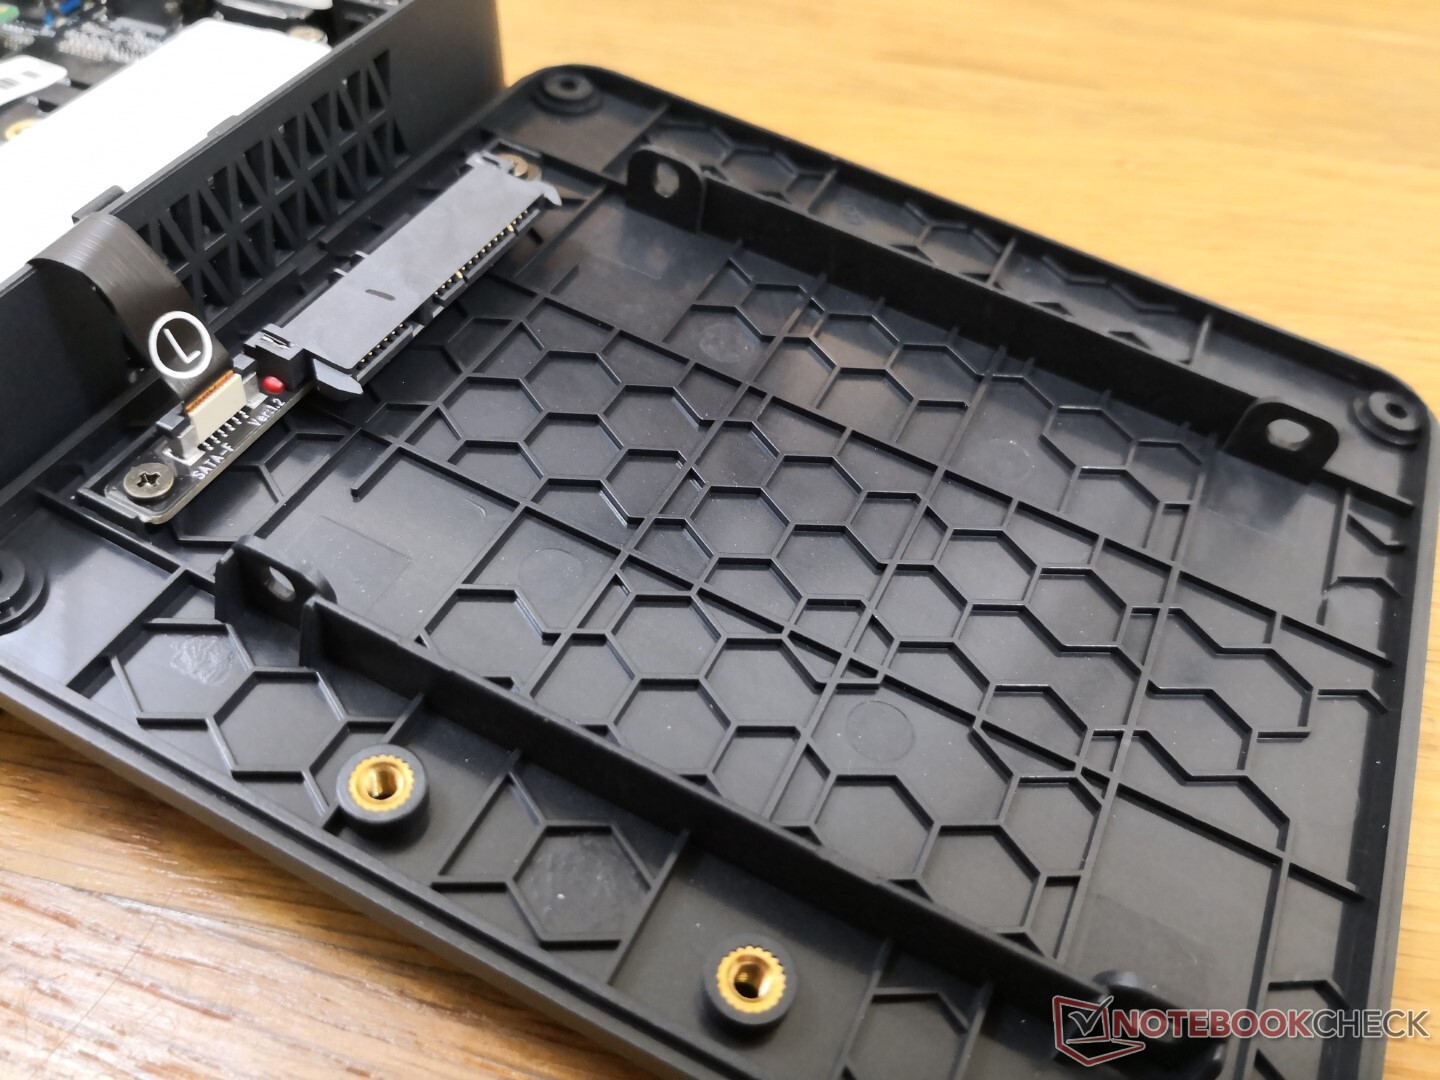
Le panneau inférieur est fixé par seulement quatre vis Philips pour un retrait facile. Les utilisateurs ont un accès direct à deux emplacements SODIMM, au module WLAN M.2 amovible et à deux baies de stockage (M.2 2280 SATA III + 2,5 pouces SATA III). Malheureusement, le processeur et le ventilateur nécessitent un démontage supplémentaire car ils se trouvent tous deux de l'autre côté de la carte mère.
Accessoires et garantie
La boîte de détail comprend deux câbles HDMI, un adaptateur secteur, des papiers et un support de montage VESA amovible. La garantie limitée standard d'un an s'applique
Performance
Processeur
Les performances du CPU multithread sont étonnamment assez proches de celles du Ice Lake.Core i3-1005G1. En revanche, les performances en mode monofil sont beaucoup plus faibles, de l'ordre de 30 à 40 %. Le Celeron N5095 a quatre cœurs physiques sans Hyper-Threading alors que le i3-1005G1 a deux cœurs physiques avec Hyper-Threading et il n'est donc pas surprenant de voir des performances plus rapides en single-thread sur le processeur avec moins de cœurs. La durabilité des performances dans le temps est par ailleurs excellente lors de l'exécution de CineBench R15 xT en boucle.
Cinebench R15 Multi Loop
Cinebench R23: Multi Core | Single Core
Cinebench R20: CPU (Multi Core) | CPU (Single Core)
Cinebench R15: CPU Multi 64Bit | CPU Single 64Bit
Blender: v2.79 BMW27 CPU
7-Zip 18.03: 7z b 4 | 7z b 4 -mmt1
Geekbench 5.5: Multi-Core | Single-Core
HWBOT x265 Benchmark v2.2: 4k Preset
LibreOffice : 20 Documents To PDF
R Benchmark 2.5: Overall mean
| CPU Performance rating | |
| Intel NUC11TNKi5 | |
| Intel NUC8i7BE -3! | |
| Zotac ZBOX MI642 Nano -2! | |
| Beelink SEi10 -2! | |
| Beelink U59 -2! | |
| Moyenne Intel Celeron N5095 | |
| GMK NucBox K1 -2! | |
| Blackview AceBook 1 -2! | |
| Jumper Tech Ez Book X3 Air -2! | |
| Asus BR1100FKA-BP0109RA | |
| Chuwi LapBook Plus -6! | |
| Cinebench R23 / Multi Core | |
| Intel NUC11TNKi5 | |
| Beelink U59 | |
| Moyenne Intel Celeron N5095 (2150 - 2219, n=5) | |
| Blackview AceBook 1 | |
| Asus BR1100FKA-BP0109RA | |
| Cinebench R23 / Single Core | |
| Intel NUC11TNKi5 | |
| Beelink U59 | |
| Moyenne Intel Celeron N5095 (587 - 621, n=5) | |
| Asus BR1100FKA-BP0109RA | |
| Blackview AceBook 1 | |
| Cinebench R20 / CPU (Multi Core) | |
| Intel NUC11TNKi5 | |
| Intel NUC8i7BE | |
| Zotac ZBOX MI642 Nano | |
| Beelink SEi10 | |
| Beelink U59 | |
| Moyenne Intel Celeron N5095 (804 - 844, n=5) | |
| Jumper Tech Ez Book X3 Air | |
| Blackview AceBook 1 | |
| Asus BR1100FKA-BP0109RA | |
| GMK NucBox K1 | |
| Chuwi LapBook Plus | |
| Cinebench R20 / CPU (Single Core) | |
| Intel NUC11TNKi5 | |
| Intel NUC8i7BE | |
| Zotac ZBOX MI642 Nano | |
| Beelink SEi10 | |
| Beelink U59 | |
| Moyenne Intel Celeron N5095 (228 - 239, n=5) | |
| Asus BR1100FKA-BP0109RA | |
| GMK NucBox K1 | |
| Blackview AceBook 1 | |
| Jumper Tech Ez Book X3 Air | |
| Chuwi LapBook Plus | |
| Cinebench R15 / CPU Multi 64Bit | |
| Intel NUC8i7BE | |
| Intel NUC11TNKi5 | |
| Zotac ZBOX MI642 Nano | |
| Beelink SEi10 | |
| Beelink U59 | |
| Moyenne Intel Celeron N5095 (221 - 379, n=6) | |
| GMK NucBox K1 | |
| Blackview AceBook 1 | |
| Jumper Tech Ez Book X3 Air | |
| Asus BR1100FKA-BP0109RA | |
| Chuwi LapBook Plus | |
| Cinebench R15 / CPU Single 64Bit | |
| Intel NUC11TNKi5 | |
| Intel NUC8i7BE | |
| Zotac ZBOX MI642 Nano | |
| Beelink SEi10 | |
| Beelink U59 | |
| Moyenne Intel Celeron N5095 (95.4 - 109, n=5) | |
| Asus BR1100FKA-BP0109RA | |
| GMK NucBox K1 | |
| Blackview AceBook 1 | |
| Jumper Tech Ez Book X3 Air | |
| Chuwi LapBook Plus | |
| Blender / v2.79 BMW27 CPU | |
| Chuwi LapBook Plus | |
| Asus BR1100FKA-BP0109RA | |
| Jumper Tech Ez Book X3 Air | |
| Blackview AceBook 1 | |
| GMK NucBox K1 | |
| Moyenne Intel Celeron N5095 (1502 - 1624, n=5) | |
| Beelink U59 | |
| Beelink SEi10 | |
| Zotac ZBOX MI642 Nano | |
| Intel NUC8i7BE | |
| Intel NUC8i7BE | |
| Intel NUC11TNKi5 | |
| 7-Zip 18.03 / 7z b 4 | |
| Intel NUC8i7BE | |
| Intel NUC8i7BE | |
| Intel NUC11TNKi5 | |
| Zotac ZBOX MI642 Nano | |
| Beelink U59 | |
| Moyenne Intel Celeron N5095 (10924 - 11168, n=5) | |
| Beelink SEi10 | |
| GMK NucBox K1 | |
| Blackview AceBook 1 | |
| Jumper Tech Ez Book X3 Air | |
| Asus BR1100FKA-BP0109RA | |
| Chuwi LapBook Plus | |
| 7-Zip 18.03 / 7z b 4 -mmt1 | |
| Intel NUC8i7BE | |
| Intel NUC8i7BE | |
| Intel NUC11TNKi5 | |
| Zotac ZBOX MI642 Nano | |
| Beelink SEi10 | |
| Beelink U59 | |
| Moyenne Intel Celeron N5095 (2935 - 3124, n=5) | |
| Asus BR1100FKA-BP0109RA | |
| Blackview AceBook 1 | |
| GMK NucBox K1 | |
| Jumper Tech Ez Book X3 Air | |
| Chuwi LapBook Plus | |
| Geekbench 5.5 / Multi-Core | |
| Intel NUC11TNKi5 | |
| Zotac ZBOX MI642 Nano | |
| Intel NUC8i7BE | |
| Beelink SEi10 | |
| Moyenne Intel Celeron N5095 (1933 - 2052, n=4) | |
| Jumper Tech Ez Book X3 Air | |
| GMK NucBox K1 | |
| Asus BR1100FKA-BP0109RA | |
| Geekbench 5.5 / Single-Core | |
| Intel NUC11TNKi5 | |
| Beelink SEi10 | |
| Zotac ZBOX MI642 Nano | |
| Intel NUC8i7BE | |
| Moyenne Intel Celeron N5095 (637 - 659, n=4) | |
| GMK NucBox K1 | |
| Jumper Tech Ez Book X3 Air | |
| Asus BR1100FKA-BP0109RA | |
| HWBOT x265 Benchmark v2.2 / 4k Preset | |
| Intel NUC11TNKi5 | |
| Intel NUC8i7BE | |
| Intel NUC8i7BE | |
| Zotac ZBOX MI642 Nano | |
| Beelink SEi10 | |
| Beelink U59 | |
| Moyenne Intel Celeron N5095 (1.9 - 2.05, n=5) | |
| GMK NucBox K1 | |
| Jumper Tech Ez Book X3 Air | |
| Blackview AceBook 1 | |
| Chuwi LapBook Plus | |
| Asus BR1100FKA-BP0109RA | |
| LibreOffice / 20 Documents To PDF | |
| Asus BR1100FKA-BP0109RA | |
| Blackview AceBook 1 | |
| Jumper Tech Ez Book X3 Air | |
| GMK NucBox K1 | |
| Moyenne Intel Celeron N5095 (97 - 107.9, n=5) | |
| Beelink U59 | |
| Zotac ZBOX MI642 Nano | |
| Beelink SEi10 | |
| Intel NUC11TNKi5 | |
| R Benchmark 2.5 / Overall mean | |
| Asus BR1100FKA-BP0109RA | |
| Jumper Tech Ez Book X3 Air | |
| Blackview AceBook 1 | |
| GMK NucBox K1 | |
| Moyenne Intel Celeron N5095 (1.16 - 1.2, n=5) | |
| Beelink U59 | |
| Beelink SEi10 | |
| Zotac ZBOX MI642 Nano | |
| Intel NUC8i7BE | |
| Intel NUC11TNKi5 | |
* ... Moindre est la valeur, meilleures sont les performances
AIDA64: FP32 Ray-Trace | FPU Julia | CPU SHA3 | CPU Queen | FPU SinJulia | FPU Mandel | CPU AES | CPU ZLib | FP64 Ray-Trace | CPU PhotoWorxx
| Performance rating | |
| Intel NUC11TNKi5 | |
| Intel NUC8i7BE -1! | |
| Zotac ZBOX MI642 Nano | |
| Beelink U59 | |
| AIDA64 / FP32 Ray-Trace | |
| Intel NUC11TNKi5 | |
| Intel NUC8i7BE | |
| Zotac ZBOX MI642 Nano | |
| Beelink U59 | |
| AIDA64 / FPU Julia | |
| Intel NUC11TNKi5 | |
| Intel NUC8i7BE | |
| Zotac ZBOX MI642 Nano | |
| Beelink U59 | |
| AIDA64 / CPU SHA3 | |
| Intel NUC11TNKi5 | |
| Zotac ZBOX MI642 Nano | |
| Beelink U59 | |
| AIDA64 / CPU Queen | |
| Intel NUC8i7BE | |
| Zotac ZBOX MI642 Nano | |
| Intel NUC11TNKi5 | |
| Beelink U59 | |
| AIDA64 / FPU SinJulia | |
| Intel NUC8i7BE | |
| Intel NUC11TNKi5 | |
| Zotac ZBOX MI642 Nano | |
| Beelink U59 | |
| AIDA64 / FPU Mandel | |
| Intel NUC11TNKi5 | |
| Intel NUC8i7BE | |
| Zotac ZBOX MI642 Nano | |
| Beelink U59 | |
| AIDA64 / CPU AES | |
| Intel NUC11TNKi5 | |
| Beelink U59 | |
| Intel NUC8i7BE | |
| Zotac ZBOX MI642 Nano | |
| AIDA64 / CPU ZLib | |
| Intel NUC11TNKi5 | |
| Intel NUC8i7BE | |
| Zotac ZBOX MI642 Nano | |
| Beelink U59 | |
| AIDA64 / FP64 Ray-Trace | |
| Intel NUC11TNKi5 | |
| Intel NUC8i7BE | |
| Zotac ZBOX MI642 Nano | |
| Beelink U59 | |
| AIDA64 / CPU PhotoWorxx | |
| Intel NUC8i7BE | |
| Intel NUC11TNKi5 | |
| Zotac ZBOX MI642 Nano | |
| Beelink U59 | |
Performance du système
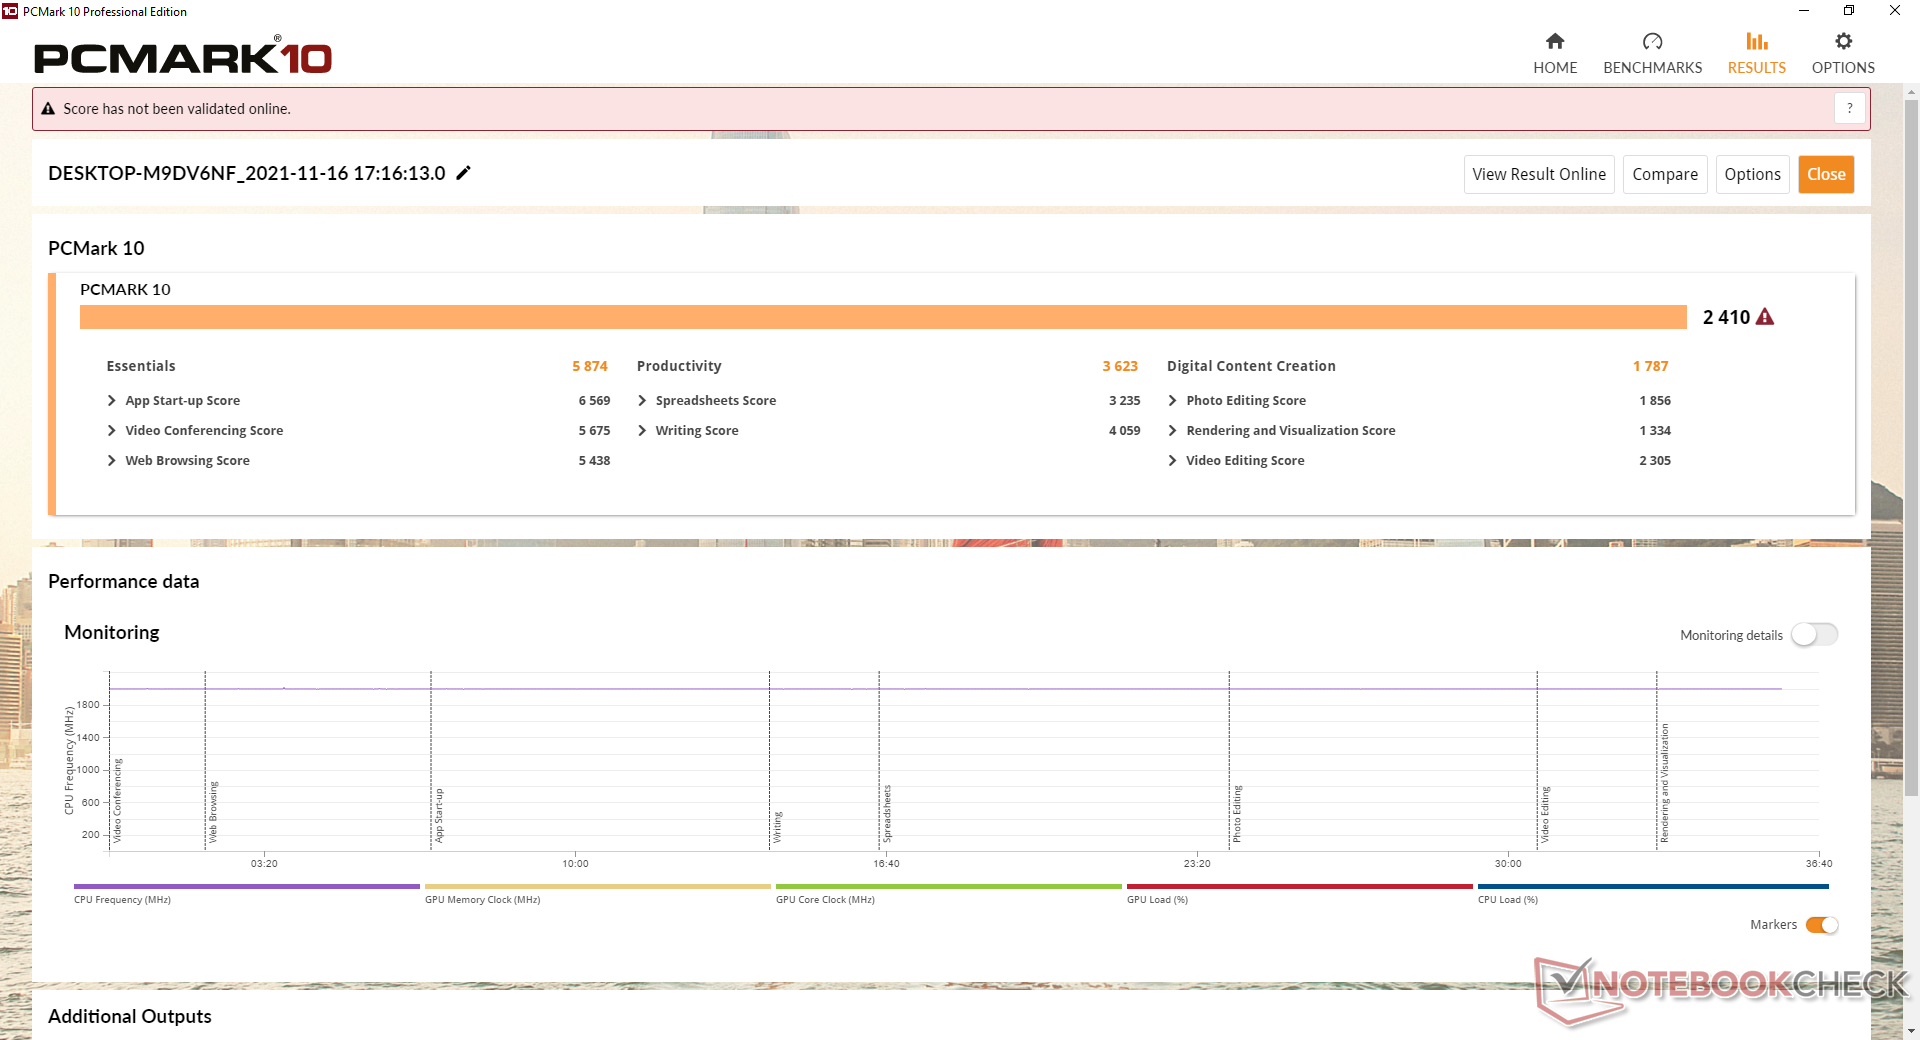
Les scores PCMark 10 sont systématiquement supérieurs à ceux de laGMK NucBox K1 tout en étant plus lent que le Core i3 de la gamme Beelink SEi10.
| PCMark 10 / Score | |
| Intel NUC8i7BE | |
| Intel NUC11TNKi5 | |
| Zotac ZBOX MI642 Nano | |
| Beelink SEi10 | |
| Beelink U59 | |
| Moyenne Intel Celeron N5095, Intel UHD Graphics (Jasper Lake 16 EU) (2317 - 2417, n=5) | |
| GMK NucBox K1 | |
| PCMark 10 / Essentials | |
| Intel NUC11TNKi5 | |
| Intel NUC8i7BE | |
| Zotac ZBOX MI642 Nano | |
| Beelink SEi10 | |
| Beelink U59 | |
| Moyenne Intel Celeron N5095, Intel UHD Graphics (Jasper Lake 16 EU) (5516 - 5874, n=5) | |
| GMK NucBox K1 | |
| PCMark 10 / Productivity | |
| Intel NUC8i7BE | |
| Zotac ZBOX MI642 Nano | |
| Intel NUC11TNKi5 | |
| Beelink SEi10 | |
| Beelink U59 | |
| Moyenne Intel Celeron N5095, Intel UHD Graphics (Jasper Lake 16 EU) (3454 - 3666, n=5) | |
| GMK NucBox K1 | |
| PCMark 10 / Digital Content Creation | |
| Intel NUC11TNKi5 | |
| Intel NUC8i7BE | |
| Zotac ZBOX MI642 Nano | |
| Beelink SEi10 | |
| Beelink U59 | |
| Moyenne Intel Celeron N5095, Intel UHD Graphics (Jasper Lake 16 EU) (1752 - 1787, n=5) | |
| GMK NucBox K1 | |
| PCMark 10 Score | 2410 points | |
Aide | ||
| AIDA64 / Memory Copy | |
| Intel NUC8i7BE | |
| Zotac ZBOX MI642 Nano | |
| Beelink U59 | |
| Intel NUC11TNKi5 | |
| AIDA64 / Memory Read | |
| Intel NUC8i7BE | |
| Zotac ZBOX MI642 Nano | |
| Intel NUC11TNKi5 | |
| Beelink U59 | |
| AIDA64 / Memory Write | |
| Intel NUC8i7BE | |
| Zotac ZBOX MI642 Nano | |
| Beelink U59 | |
| Intel NUC11TNKi5 | |
| AIDA64 / Memory Latency | |
| Zotac ZBOX MI642 Nano | |
| Intel NUC11TNKi5 | |
| Beelink U59 | |
| Intel NUC8i7BE | |
* ... Moindre est la valeur, meilleures sont les performances
Latence DPC
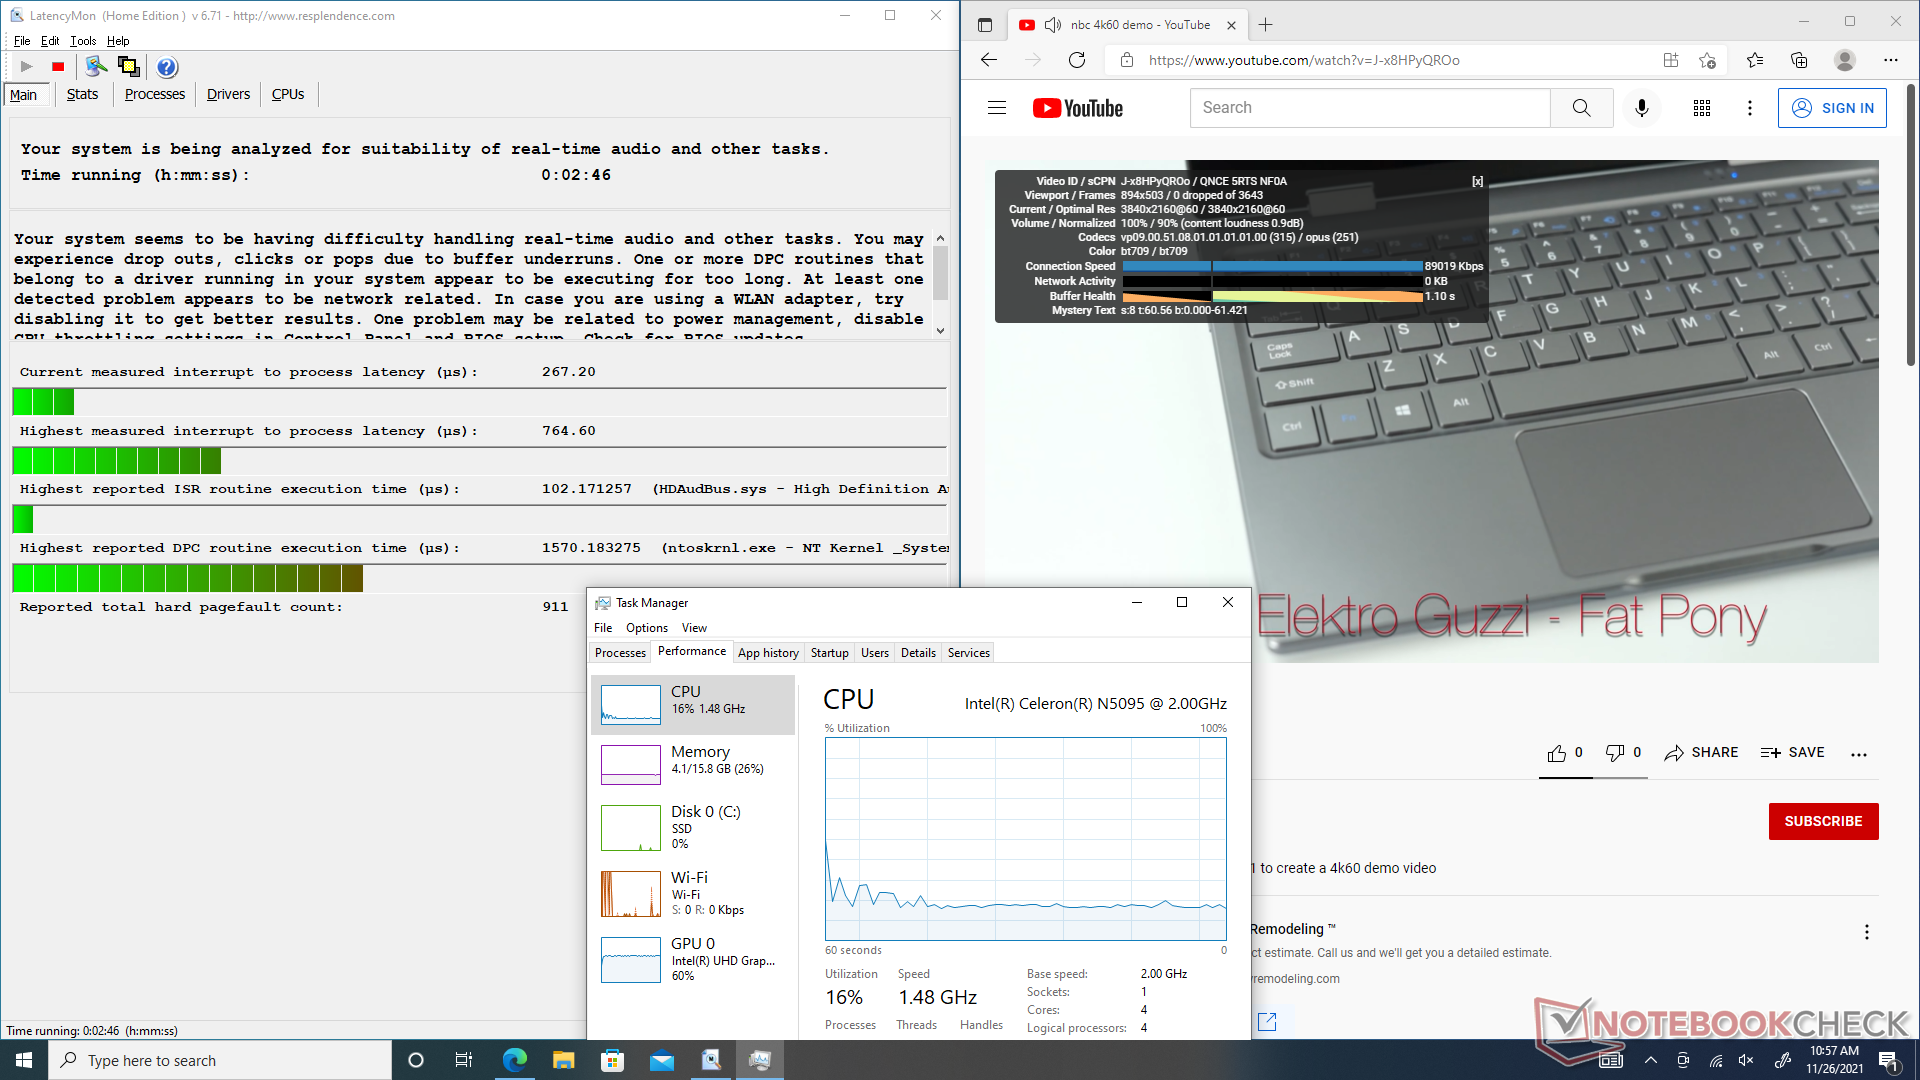
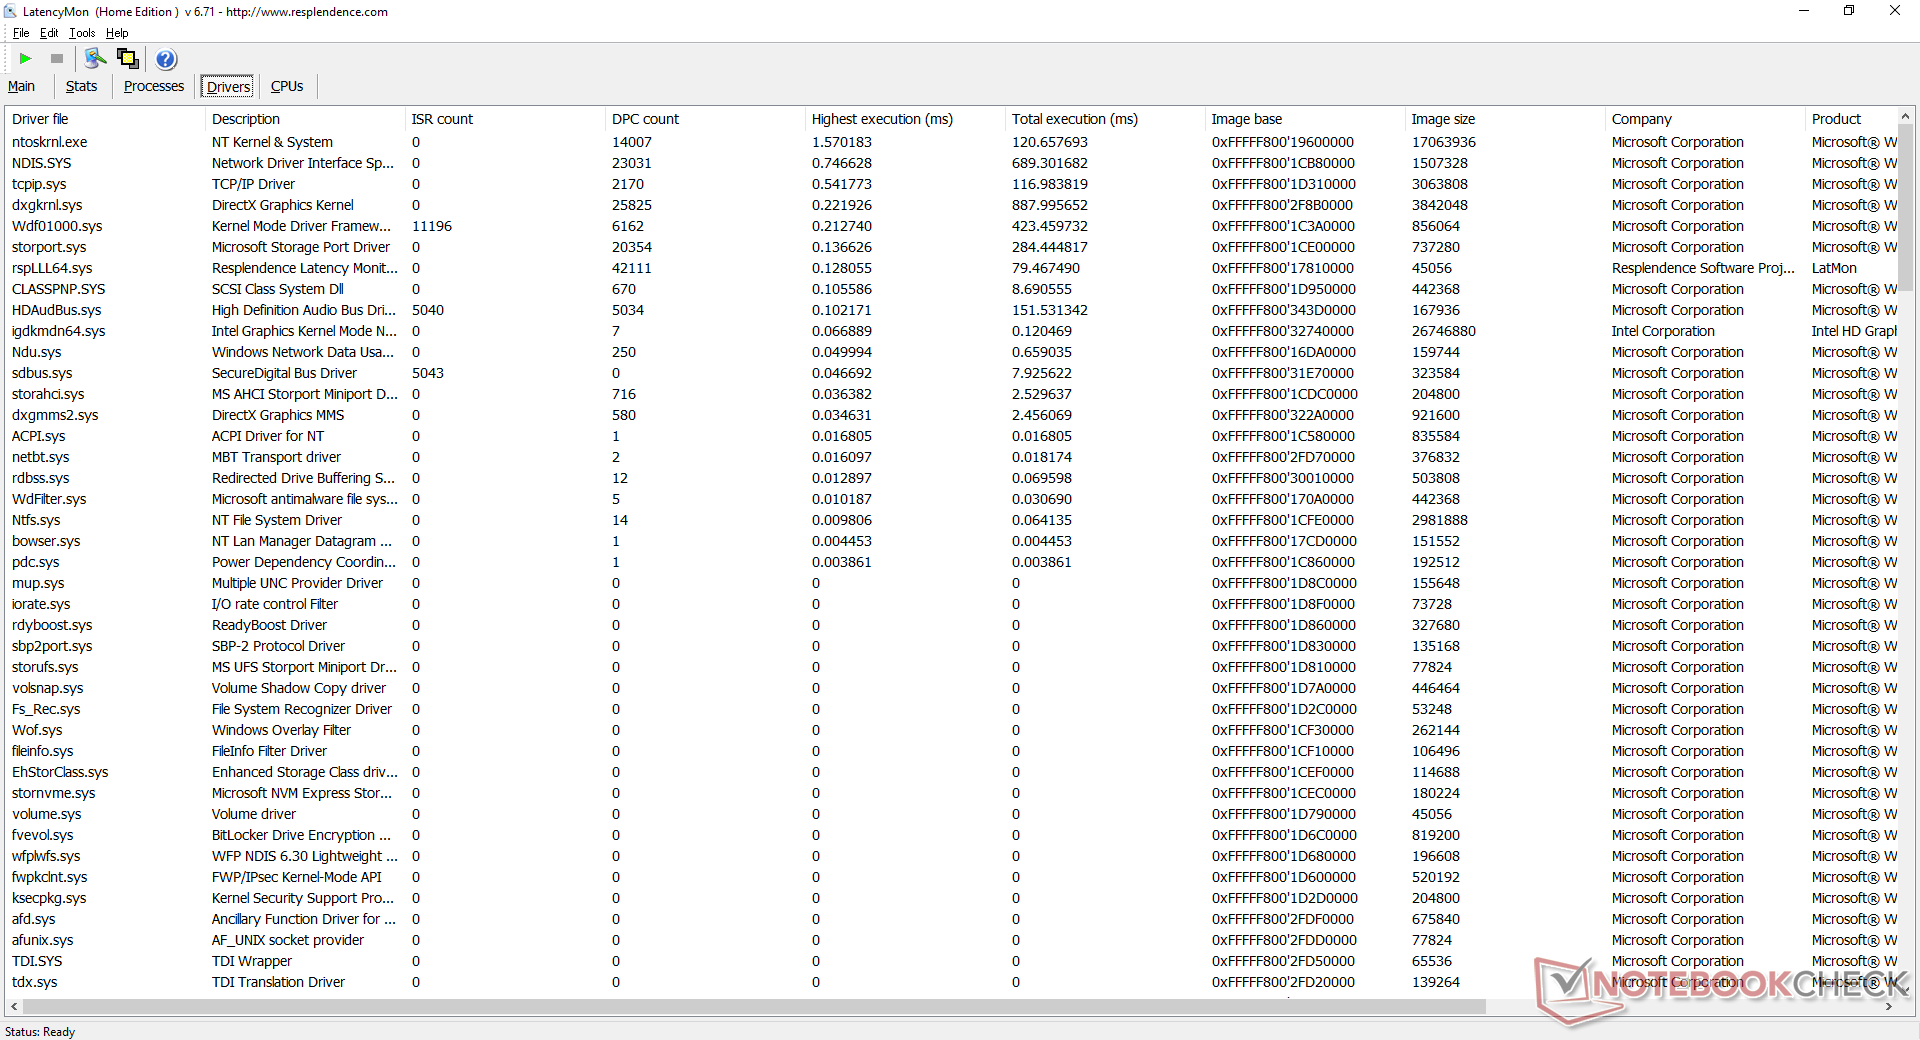
LatencyMon révèle des problèmes mineurs de latence DPC lors de l'ouverture de plusieurs onglets de navigateur sur notre page d'accueil. La lecture de vidéos 4K est par ailleurs excellente, sans aucune perte d'images pendant notre test d'une minute. L'utilisation du GPU serait relativement élevée à 60 %.
| DPC Latencies / LatencyMon - interrupt to process latency (max), Web, Youtube, Prime95 | |
| GMK NucBox K1 | |
| Beelink SEi10 | |
| Beelink U59 | |
| Intel NUC11TNKi5 | |
* ... Moindre est la valeur, meilleures sont les performances
Périphériques de stockage
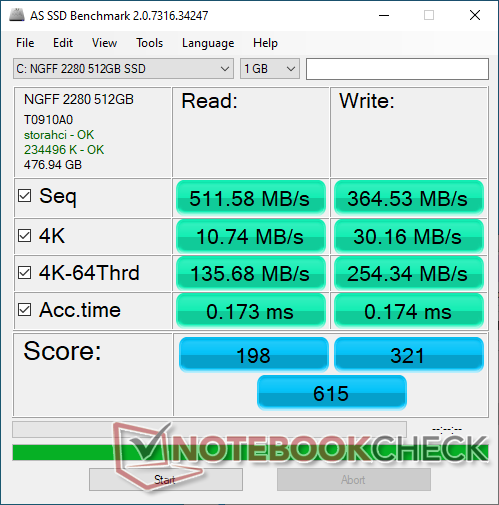
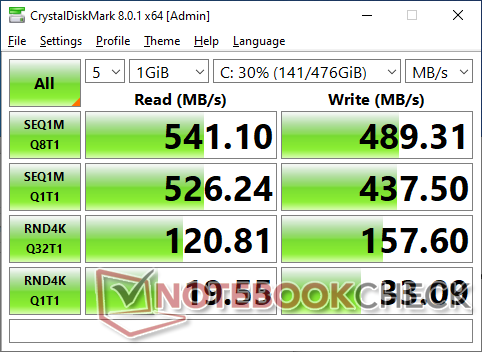
Notre unité de test est livrée avec un 512 GB AZW M.2 2280 SATA III SSD qui est une marque relativement peu connue, probablement pour économiser sur les coûts. La plupart des autres PC utilisent des marques de SSD plus connues telles que Samsung, Intel, Kingston, ou autres. Les taux de transfert sont néanmoins excellents pour un disque SATA III avec des taux de lecture et d'écriture séquentiels d'environ 500 Mo/s chacun.

| Drive Performance rating - Percent | |
| Beelink SEi10 | |
| Zotac ZBOX MI642 Nano | |
| Intel NUC11TNKi5 | |
| Beelink U59 | |
| GMK NucBox K1 | |
| DiskSpd | |
| seq read | |
| Beelink SEi10 | |
| Intel NUC11TNKi5 | |
| Zotac ZBOX MI642 Nano | |
| Beelink U59 | |
| GMK NucBox K1 | |
| seq write | |
| Beelink SEi10 | |
| Zotac ZBOX MI642 Nano | |
| Intel NUC11TNKi5 | |
| Beelink U59 | |
| GMK NucBox K1 | |
| seq q8 t1 read | |
| Beelink SEi10 | |
| Intel NUC11TNKi5 | |
| Zotac ZBOX MI642 Nano | |
| Beelink U59 | |
| GMK NucBox K1 | |
| seq q8 t1 write | |
| Beelink SEi10 | |
| Zotac ZBOX MI642 Nano | |
| Intel NUC11TNKi5 | |
| GMK NucBox K1 | |
| Beelink U59 | |
| 4k q1 t1 read | |
| Beelink SEi10 | |
| Zotac ZBOX MI642 Nano | |
| Intel NUC11TNKi5 | |
| Beelink U59 | |
| GMK NucBox K1 | |
| 4k q1 t1 write | |
| Beelink SEi10 | |
| Zotac ZBOX MI642 Nano | |
| GMK NucBox K1 | |
| Intel NUC11TNKi5 | |
| Beelink U59 | |
| 4k q32 t16 read | |
| Beelink SEi10 | |
| Zotac ZBOX MI642 Nano | |
| Intel NUC11TNKi5 | |
| Beelink U59 | |
| GMK NucBox K1 | |
| 4k q32 t16 write | |
| Beelink SEi10 | |
| Intel NUC11TNKi5 | |
| Zotac ZBOX MI642 Nano | |
| GMK NucBox K1 | |
| Beelink U59 | |
| AS SSD | |
| Score Total | |
| Zotac ZBOX MI642 Nano | |
| Beelink SEi10 | |
| Intel NUC11TNKi5 | |
| Beelink U59 | |
| GMK NucBox K1 | |
| Score Read | |
| Beelink SEi10 | |
| Zotac ZBOX MI642 Nano | |
| Intel NUC11TNKi5 | |
| Beelink U59 | |
| GMK NucBox K1 | |
| Score Write | |
| Intel NUC11TNKi5 | |
| Zotac ZBOX MI642 Nano | |
| Beelink U59 | |
| Beelink SEi10 | |
| GMK NucBox K1 | |
| Seq Read | |
| Beelink SEi10 | |
| Intel NUC11TNKi5 | |
| Beelink U59 | |
| Zotac ZBOX MI642 Nano | |
| GMK NucBox K1 | |
| Seq Write | |
| Intel NUC11TNKi5 | |
| Zotac ZBOX MI642 Nano | |
| GMK NucBox K1 | |
| Beelink U59 | |
| Beelink SEi10 | |
| 4K Read | |
| Zotac ZBOX MI642 Nano | |
| Beelink SEi10 | |
| Intel NUC11TNKi5 | |
| Beelink U59 | |
| GMK NucBox K1 | |
| 4K Write | |
| Zotac ZBOX MI642 Nano | |
| Beelink SEi10 | |
| GMK NucBox K1 | |
| Intel NUC11TNKi5 | |
| Beelink U59 | |
| 4K-64 Read | |
| Zotac ZBOX MI642 Nano | |
| Beelink SEi10 | |
| Intel NUC11TNKi5 | |
| Beelink U59 | |
| GMK NucBox K1 | |
| 4K-64 Write | |
| Intel NUC11TNKi5 | |
| Beelink U59 | |
| Zotac ZBOX MI642 Nano | |
| Beelink SEi10 | |
| GMK NucBox K1 | |
| Access Time Read | |
| GMK NucBox K1 | |
| Beelink U59 | |
| Intel NUC11TNKi5 | |
| Zotac ZBOX MI642 Nano | |
| Beelink SEi10 | |
| Access Time Write | |
| Beelink SEi10 | |
| GMK NucBox K1 | |
| Intel NUC11TNKi5 | |
| Beelink U59 | |
| Zotac ZBOX MI642 Nano | |
* ... Moindre est la valeur, meilleures sont les performances
Disk Throttling: DiskSpd Read Loop, Queue Depth 8
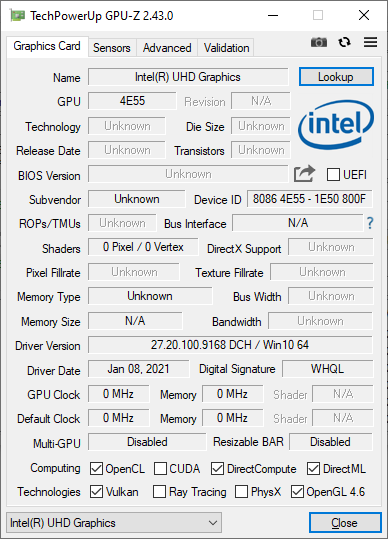
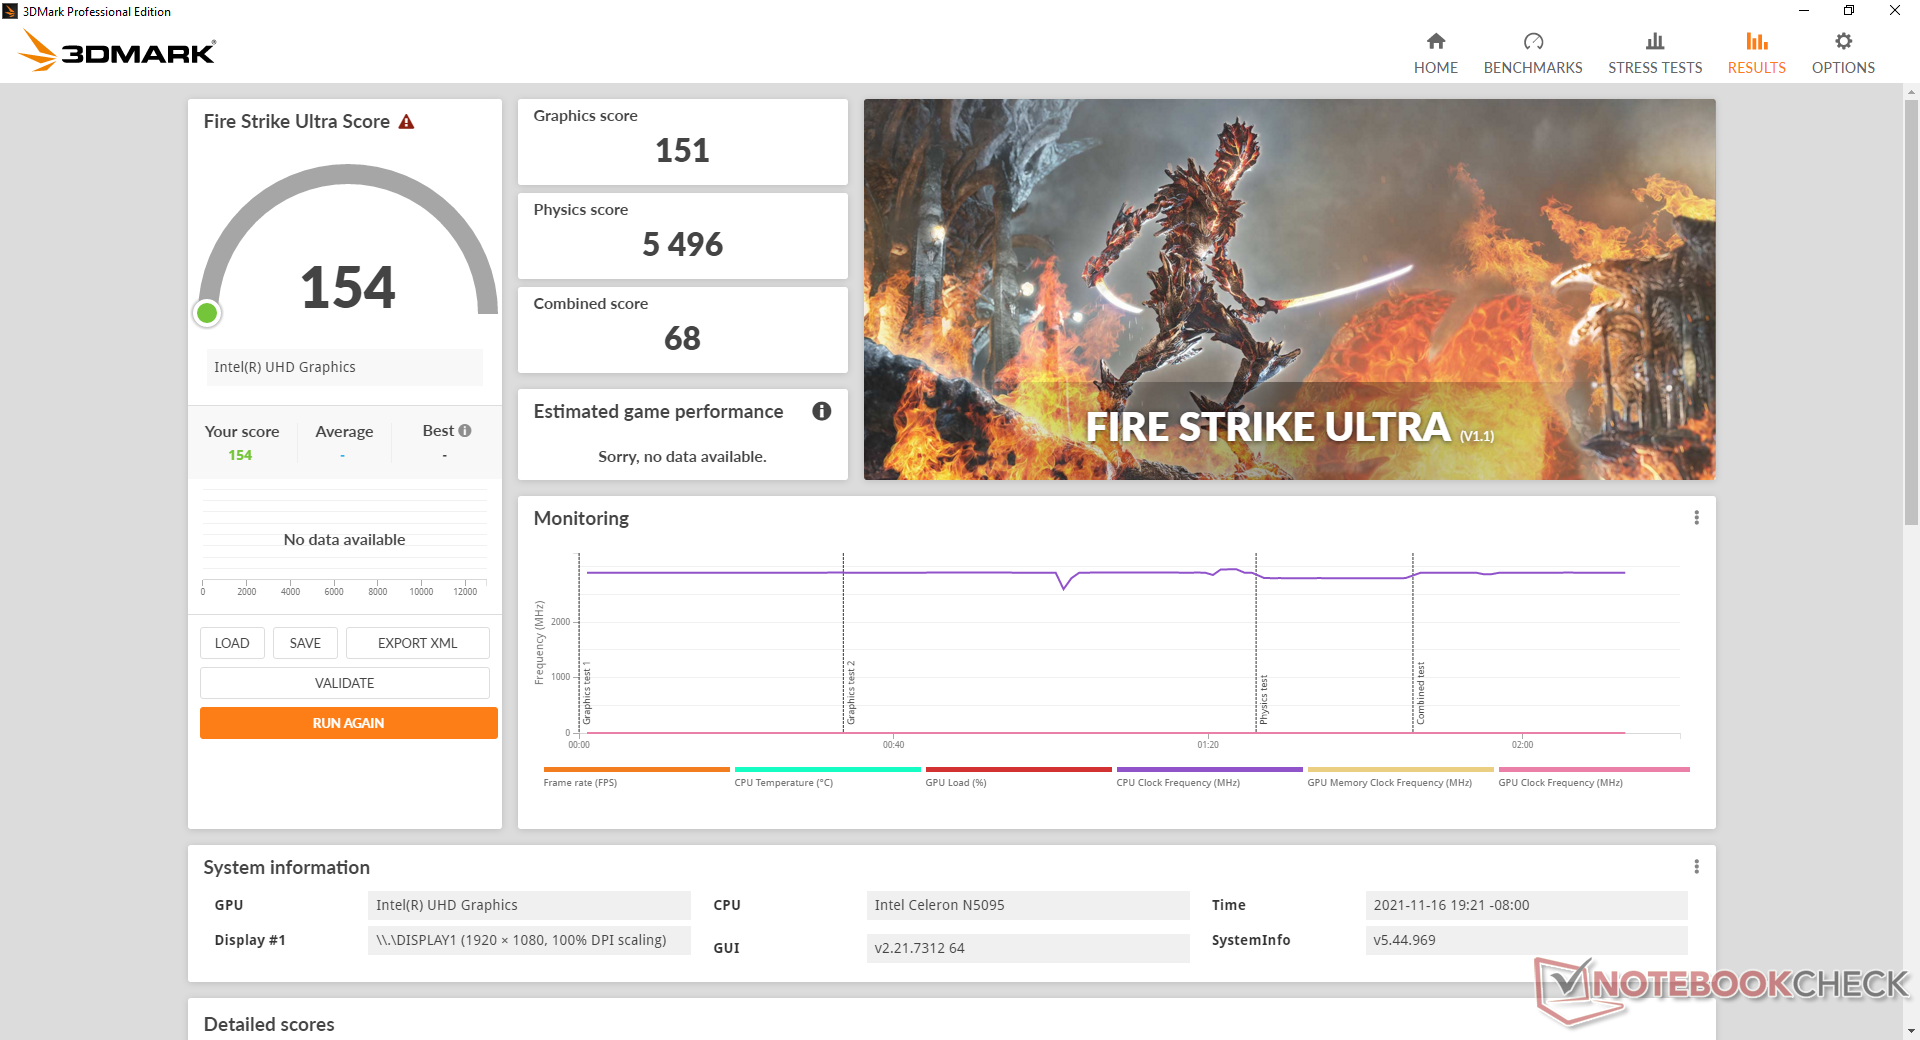
Performances du GPU
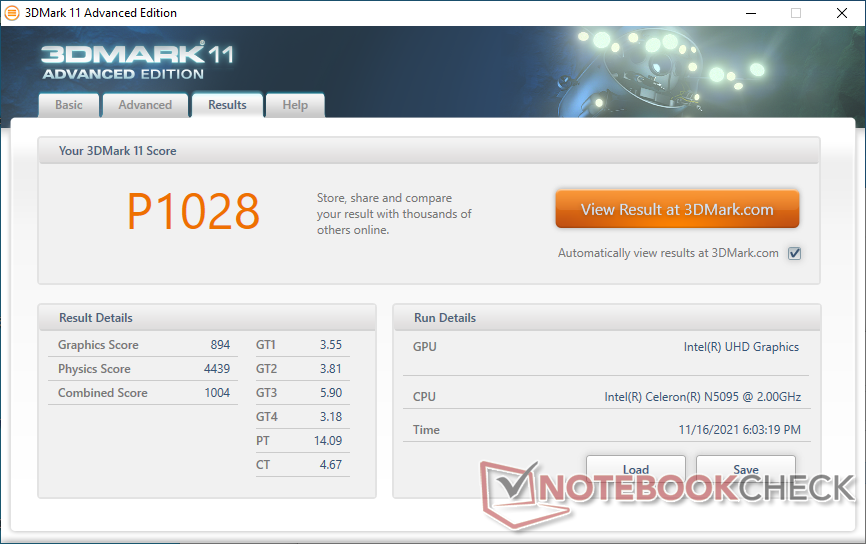
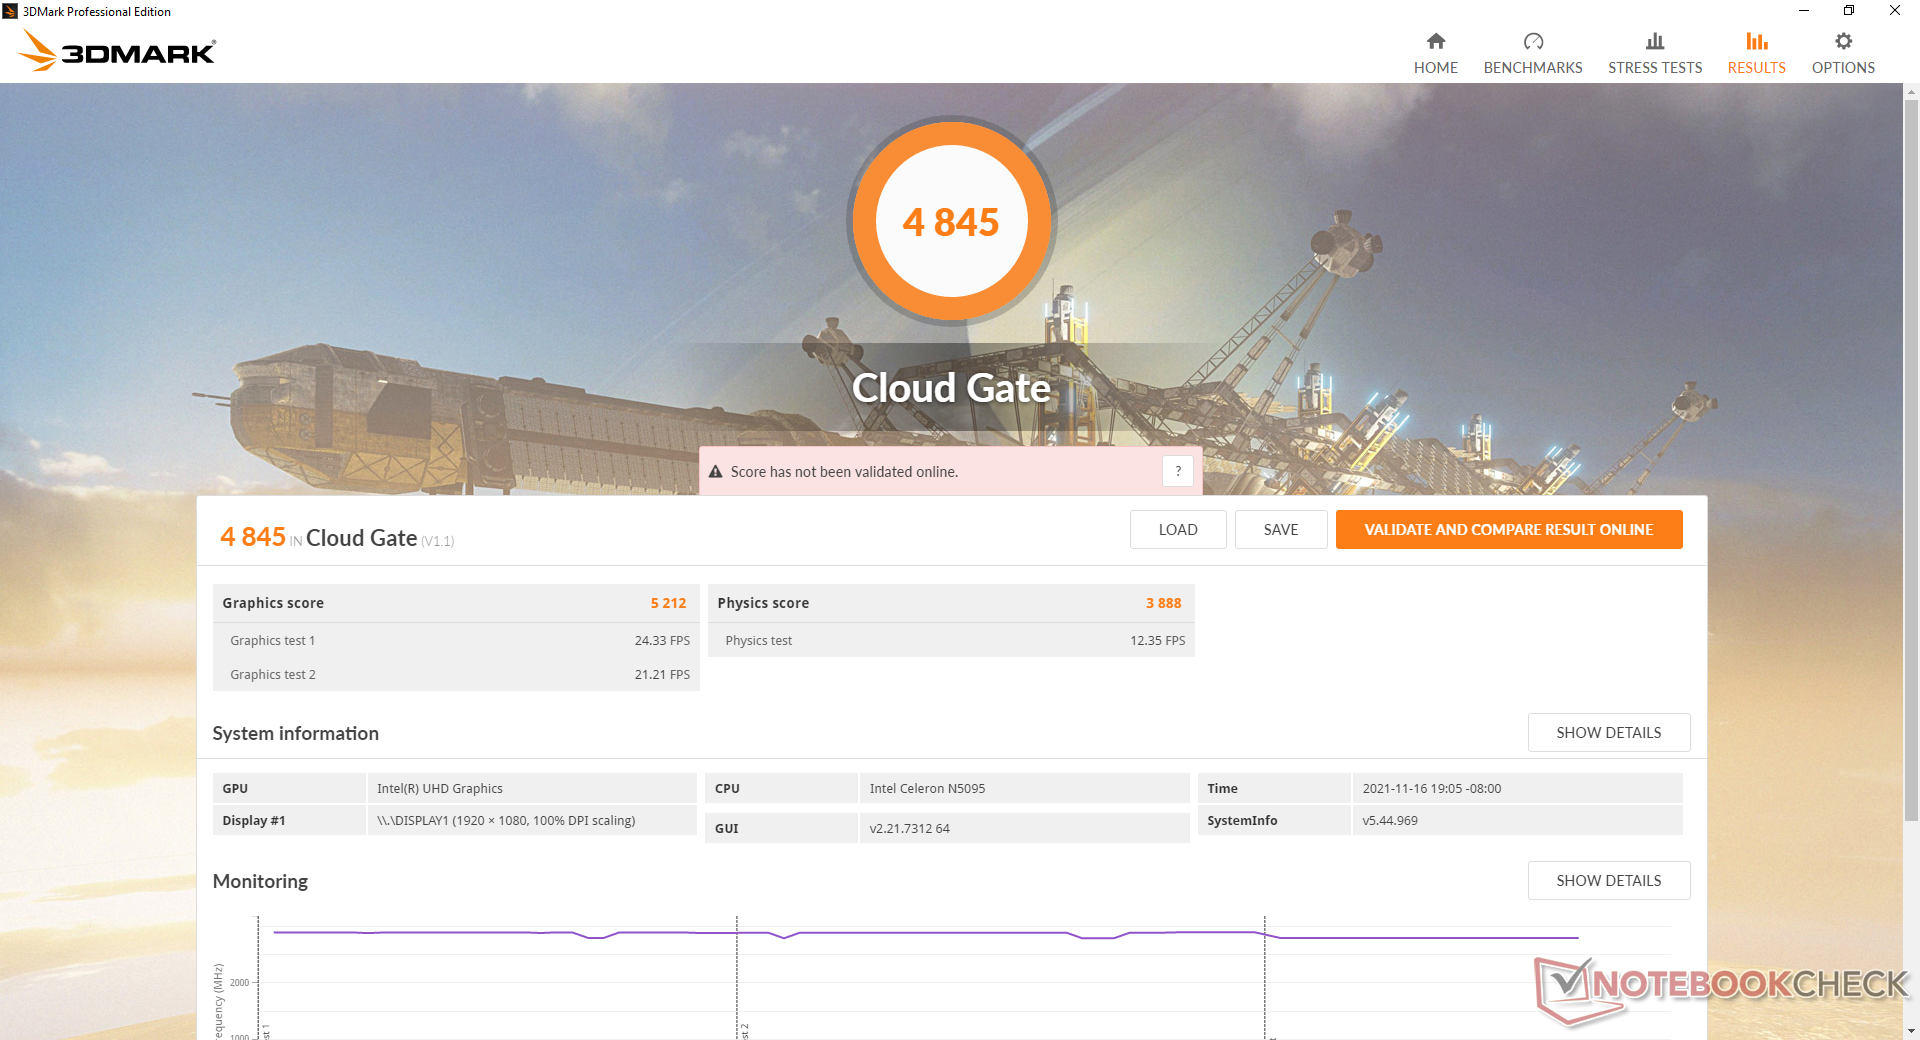
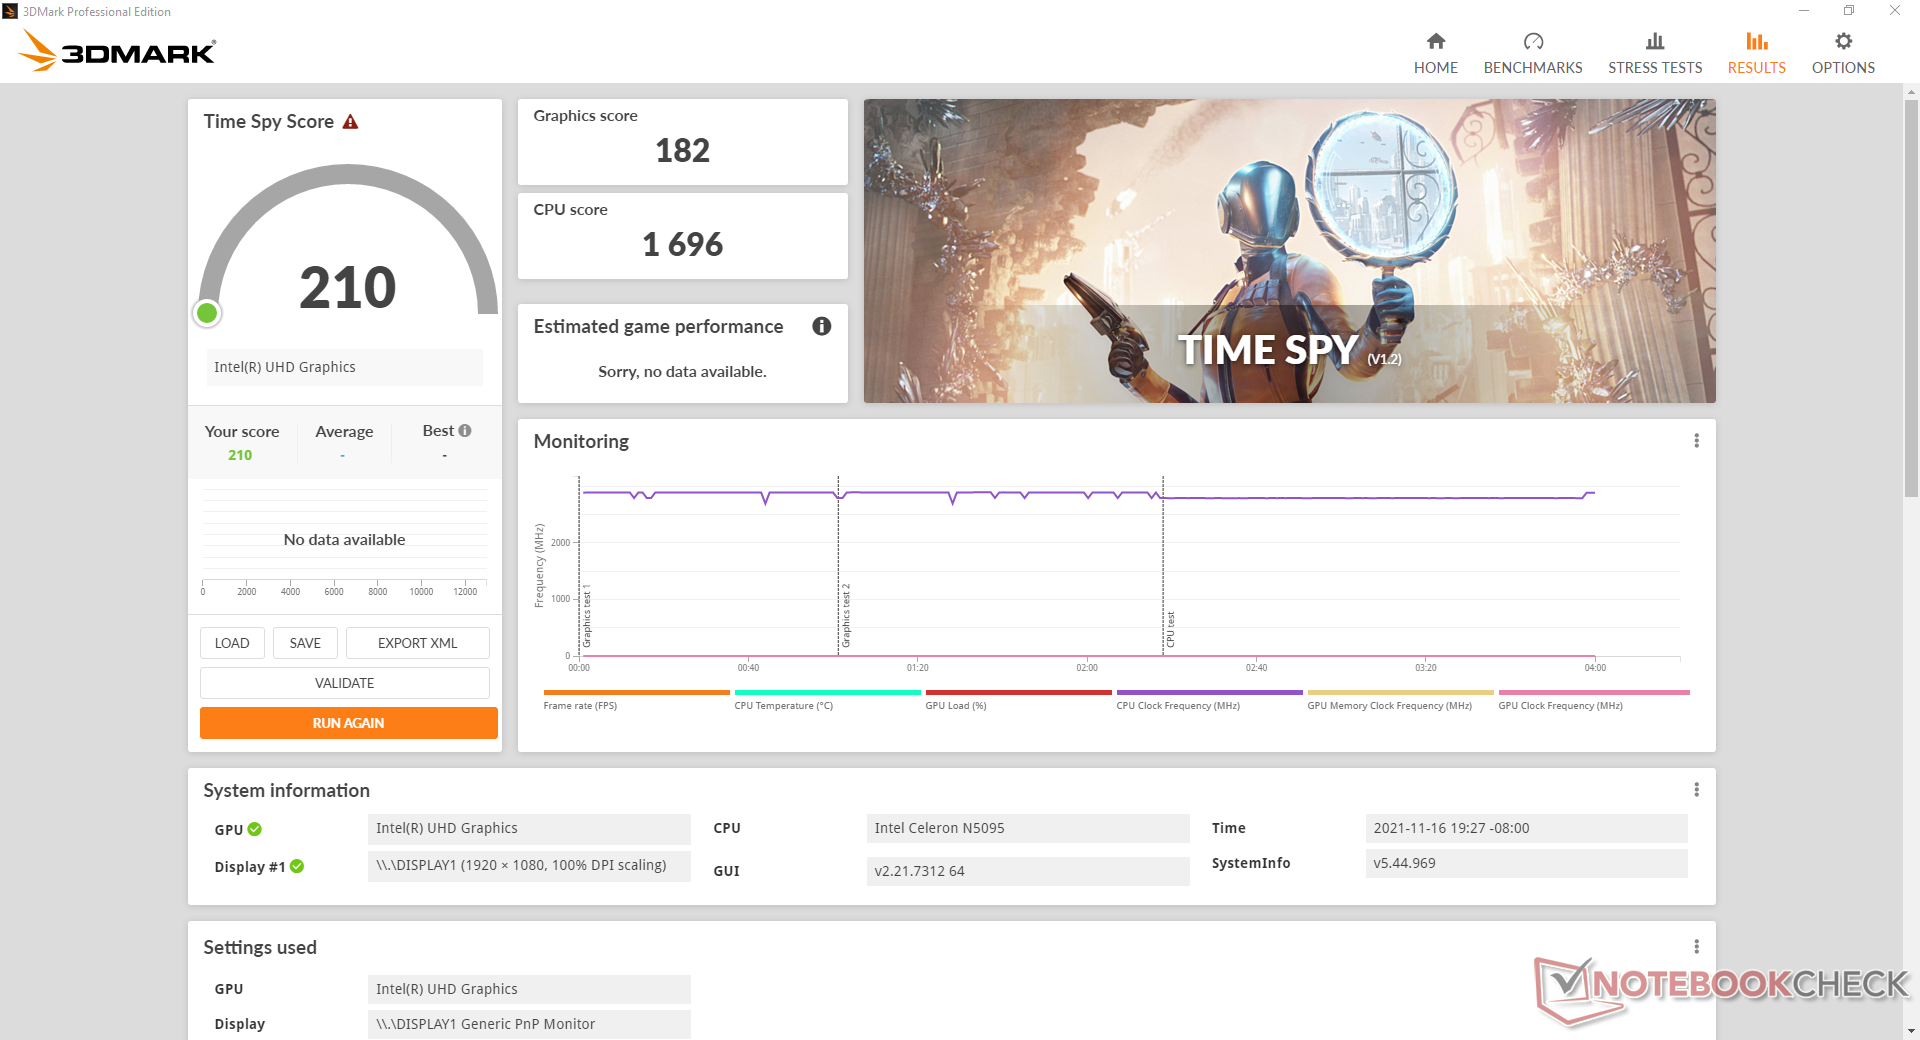
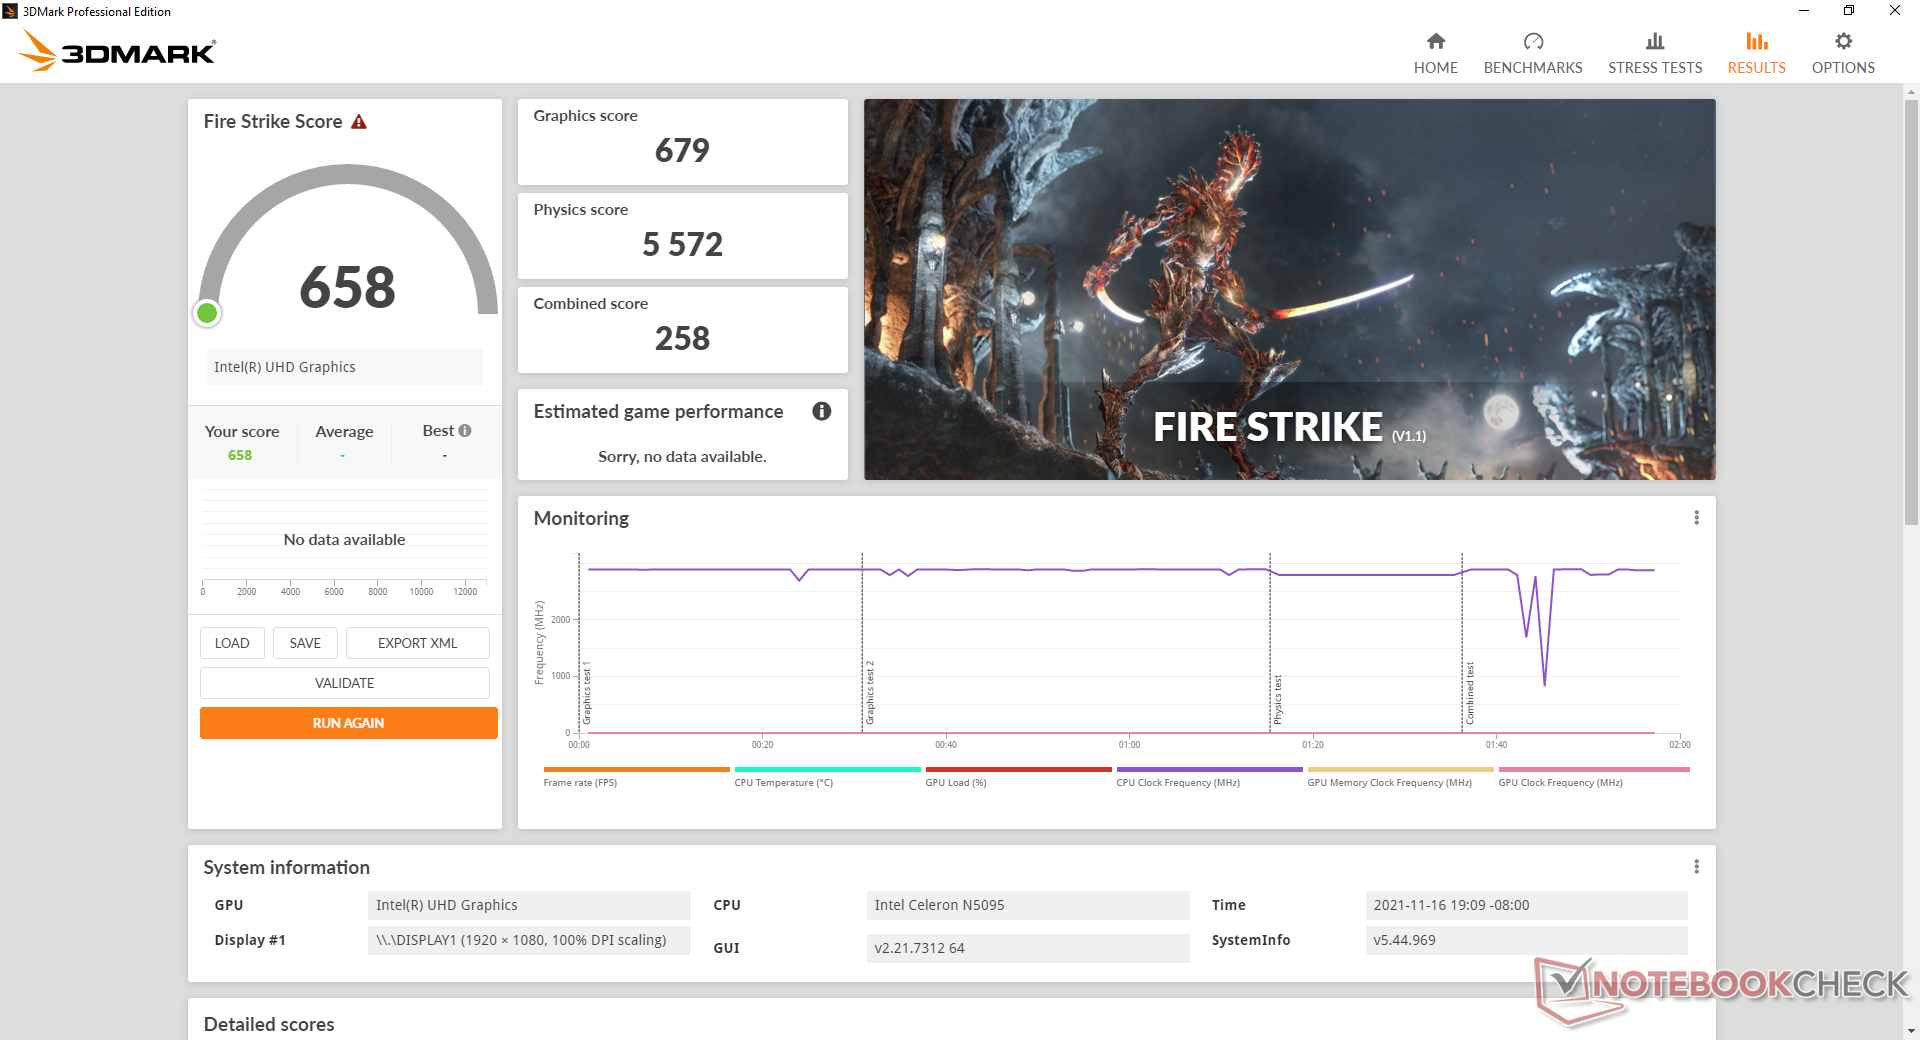
Les performances graphiques sont environ 40 à 50 % plus lentes que celles de l'ordinaire UHD Graphics 620 que l'on trouvait sur les anciens ordinateurs portables et les mini-PC avant l'arrivée de la technologie Iris Xe. Bien qu'il soit capable de diffuser des flux, ne vous attendez pas à ce que la plupart des jeux natifs fonctionnent bien.
| 3DMark Performance rating - Percent | |
| Intel NUC11TNKi5 | |
| Intel NUC8i7BE | |
| Zotac ZBOX MI642 Nano -3! | |
| Prime Computer PrimeMini 5 i7 NUC8v7PNB | |
| Beelink SEi10 | |
| Beelink U59 | |
| Moyenne Intel UHD Graphics (Jasper Lake 16 EU) | |
| Chuwi LapBook Plus -1! | |
| Blackview AceBook 1 -2! | |
| Asus BR1100FKA-BP0109RA | |
| GMK NucBox K1 | |
| Jumper Tech Ez Book X3 Air -1! | |
| 3DMark 11 Performance | 1028 points | |
| 3DMark Cloud Gate Standard Score | 4845 points | |
| 3DMark Fire Strike Score | 658 points | |
| 3DMark Time Spy Score | 210 points | |
Aide | ||
Witcher 3 FPS Chart
| Bas | Moyen | Élevé | Ultra | |
|---|---|---|---|---|
| The Witcher 3 (2015) | 14 | |||
| Dota 2 Reborn (2015) | 57.3 | 26.6 | 12 | 11.2 |
| Final Fantasy XV Benchmark (2018) | 7.17 | |||
| X-Plane 11.11 (2018) | 10.8 | 9.18 | 8.62 |
Émissions
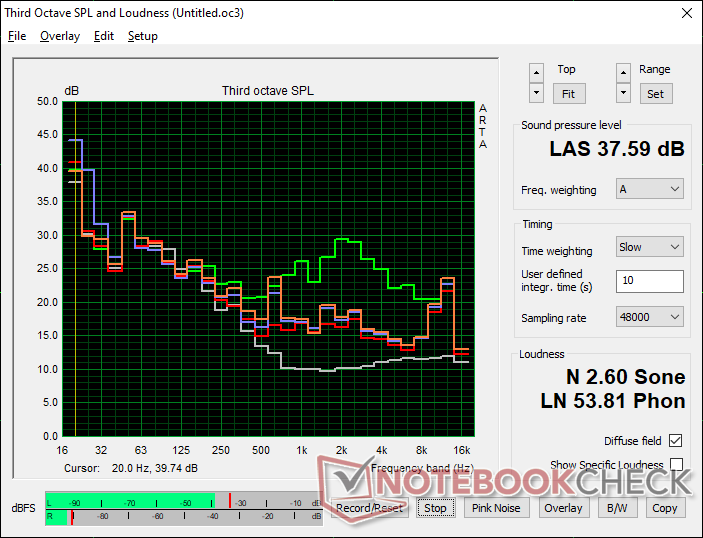
Bruit du système
Le ventilateur interne est silencieux à 24,5 dB(A) lorsque le système n'exécute aucune application. Le plus souvent, cependant, les utilisateurs seront probablement en train de regarder des vidéos en streaming ou de naviguer sur le Web, et le ventilateur passera donc occasionnellement à 28,6 dB(A) ou 30,4 dB(A). D'autres mini PC sont beaucoup plus bruyants, notamment le SEi10 de Beelink.
L'exécution de Prime95 induit un bruit de ventilateur maximal de 37,6 dB(A), ce qui est perceptible mais pas gênant dans un environnement HTPC.
Degré de la nuisance sonore
| Au repos |
| 24.5 / 24.5 / 28.6 dB(A) |
| Fortement sollicité |
| 29.7 / 37.6 dB(A) |
 | ||
30 dB silencieux 40 dB(A) audible 50 dB(A) bruyant |
||
min: | ||
| Beelink U59 UHD Graphics (Jasper Lake 16 EU), Celeron N5095, Silicon Motion AZW 512G NV428 | Intel NUC11TNKi5 Iris Xe G7 80EUs, i5-1135G7, Transcend M.2 SSD 430S TS512GMTS430S | Intel NUC8i7BE Iris Plus Graphics 655, i7-8559U | Beelink SEi10 UHD Graphics G1 (Ice Lake 32 EU), i3-1005G1, Silicon Motion AZW 256G M.2280 NVMe 4X 200725 D | Zotac ZBOX MI642 Nano UHD Graphics 620, i5-10210U, Western Digital WD Blue 3D WDBNCE5000PNC | GMK NucBox K1 UHD Graphics 600, Celeron J4125, HIKVision C100 NGFF SSD 128GB | |
|---|---|---|---|---|---|---|
| Noise | -27% | -19% | -27% | -24% | -20% | |
| arrêt / environnement * (dB) | 24.5 | 24.8 -1% | 28.7 -17% | 27.5 -12% | 27.8 -13% | 27.8 -13% |
| Idle Minimum * (dB) | 24.5 | 35.6 -45% | 28.7 -17% | 30.9 -26% | 27.8 -13% | 27.8 -13% |
| Idle Average * (dB) | 24.5 | 35.6 -45% | 29.3 -20% | 33.5 -37% | 33.9 -38% | 27.8 -13% |
| Idle Maximum * (dB) | 28.6 | 35.6 -24% | 31.8 -11% | 33.5 -17% | 33.9 -19% | 27.8 3% |
| Load Average * (dB) | 29.7 | 36.2 -22% | 39 -31% | 38.5 -30% | 43.7 -47% | 46.8 -58% |
| Witcher 3 ultra * (dB) | 30.4 | 38 -25% | 39 -28% | |||
| Load Maximum * (dB) | 37.6 | 47.6 -27% | 41.4 -10% | 51.6 -37% | 43.7 -16% | 46.8 -24% |
* ... Moindre est la valeur, meilleures sont les performances
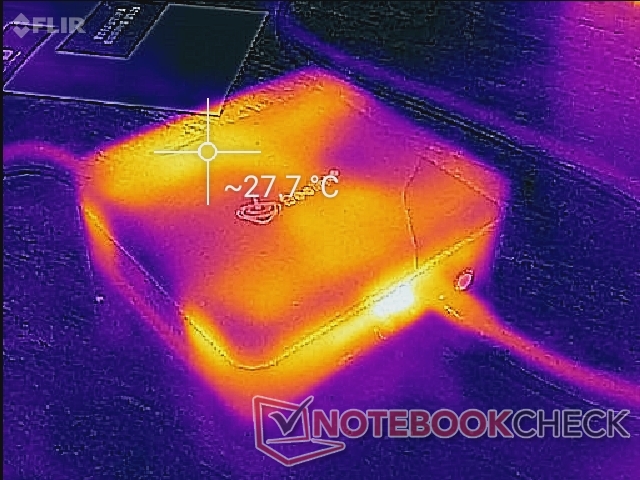
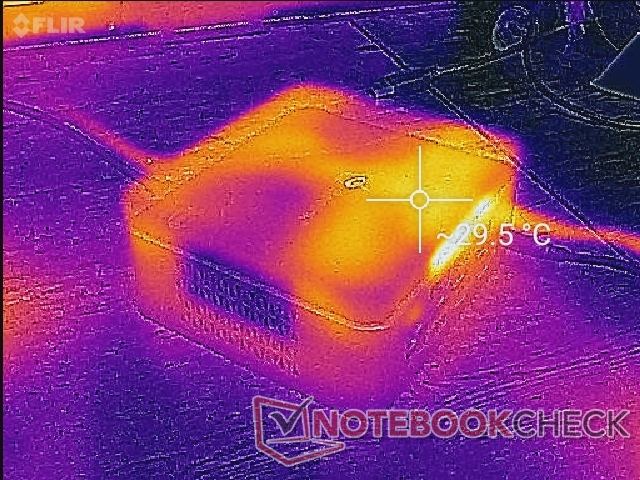
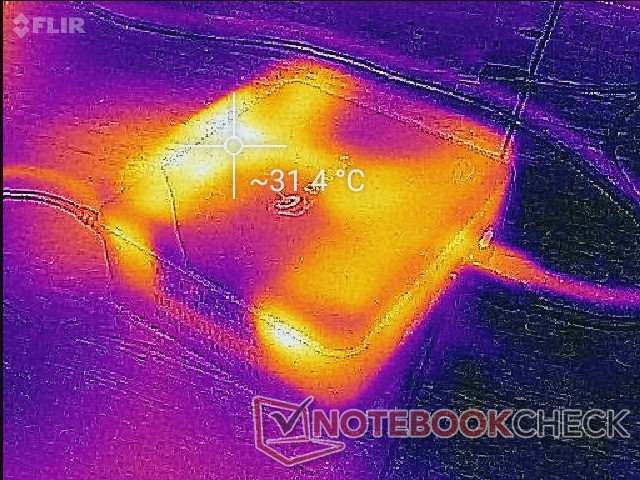
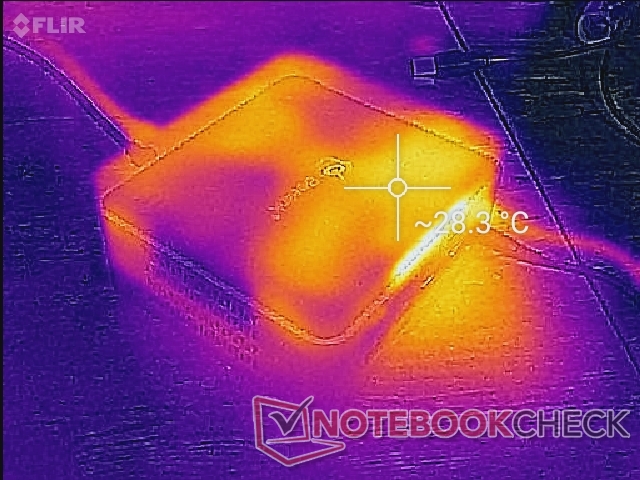
Température
Les températures ne sont pas un problème sur l'U59. Les points chauds sont à peine plus chauds, même lorsque le système est pleinement sollicité.
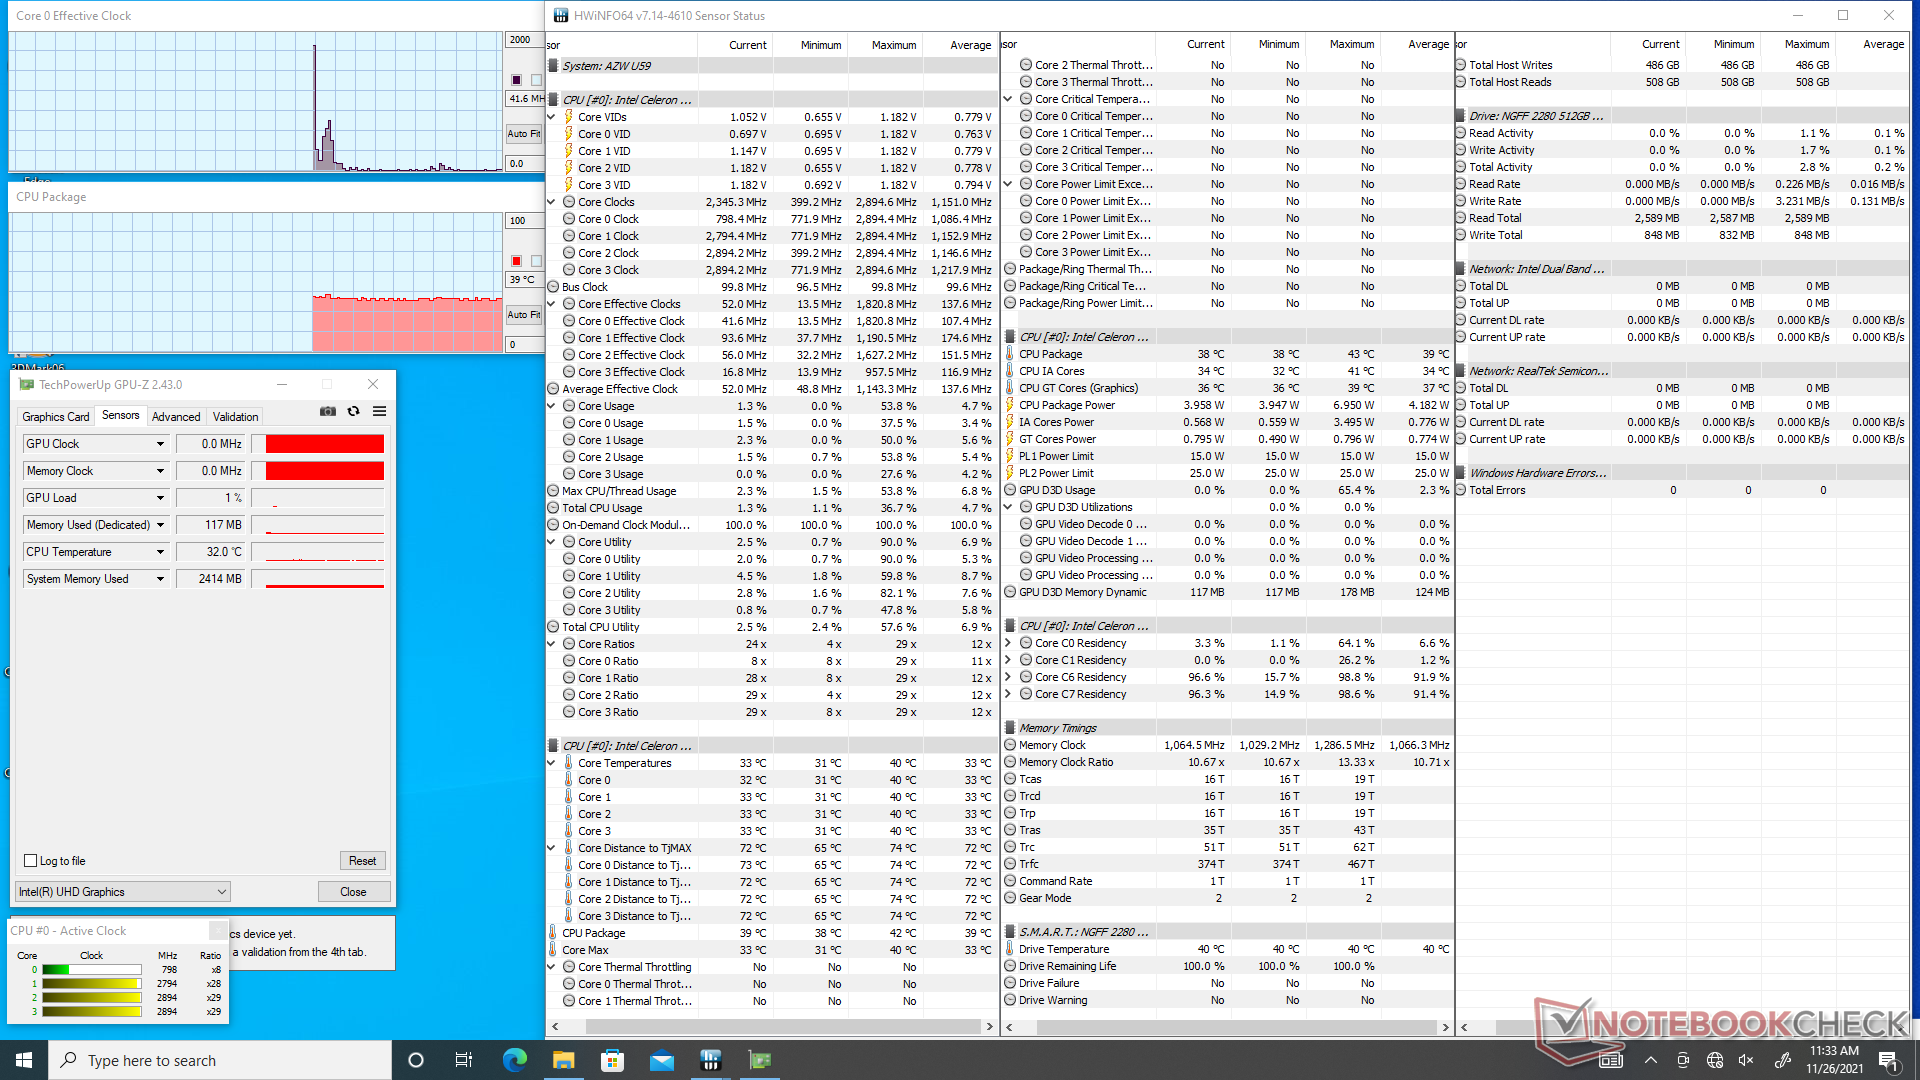
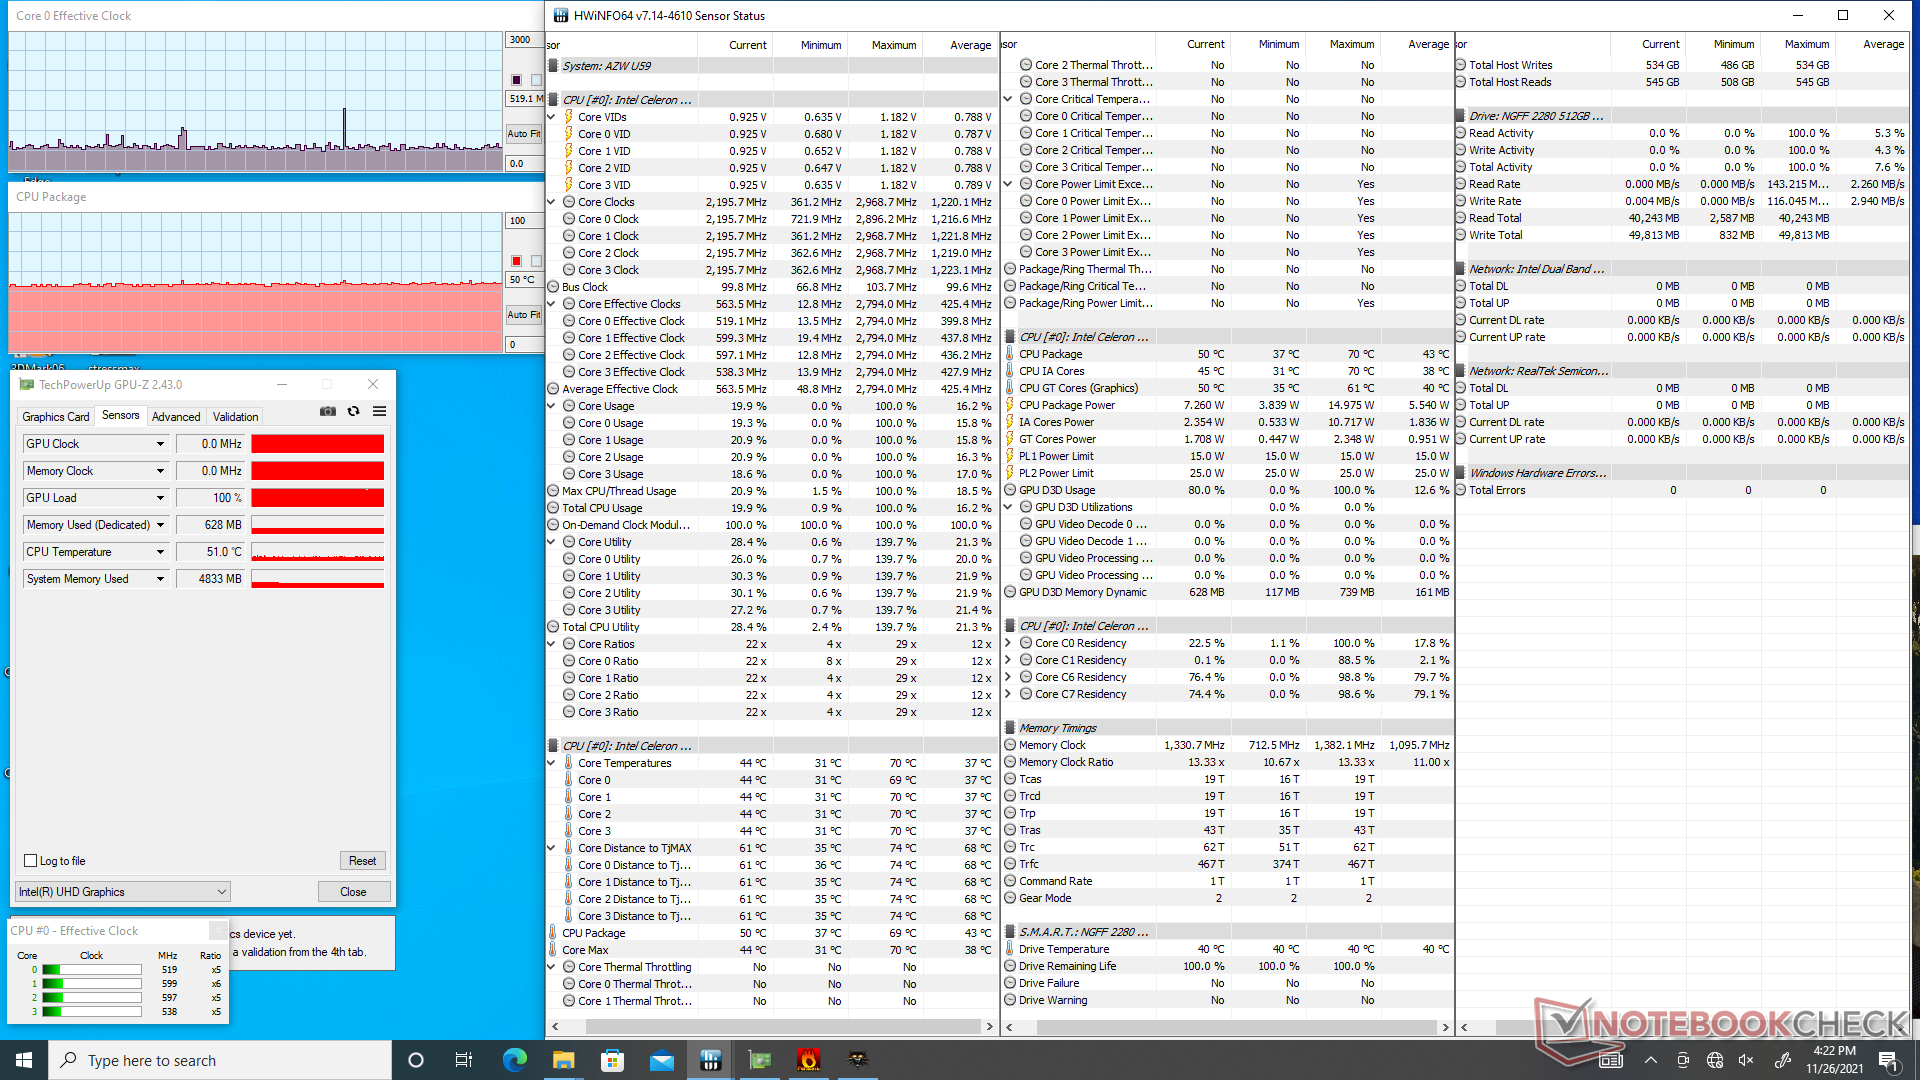
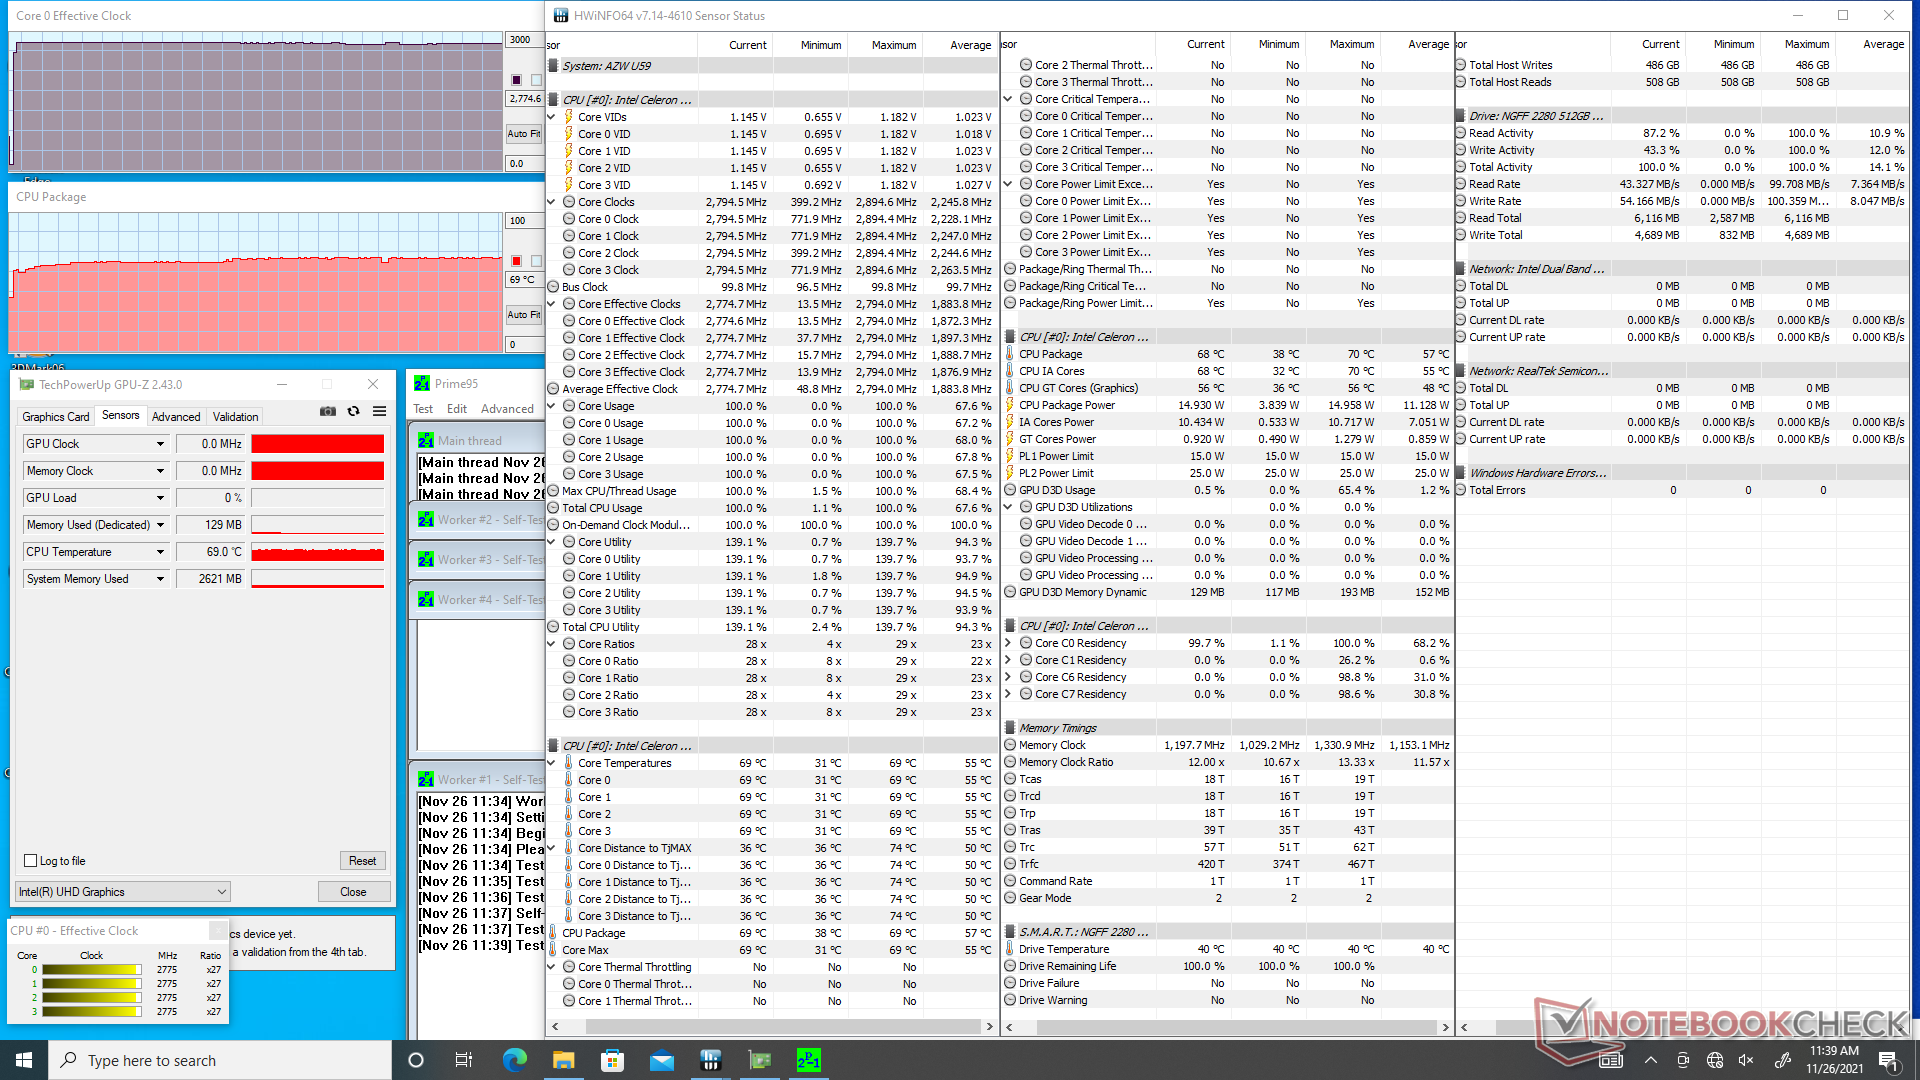
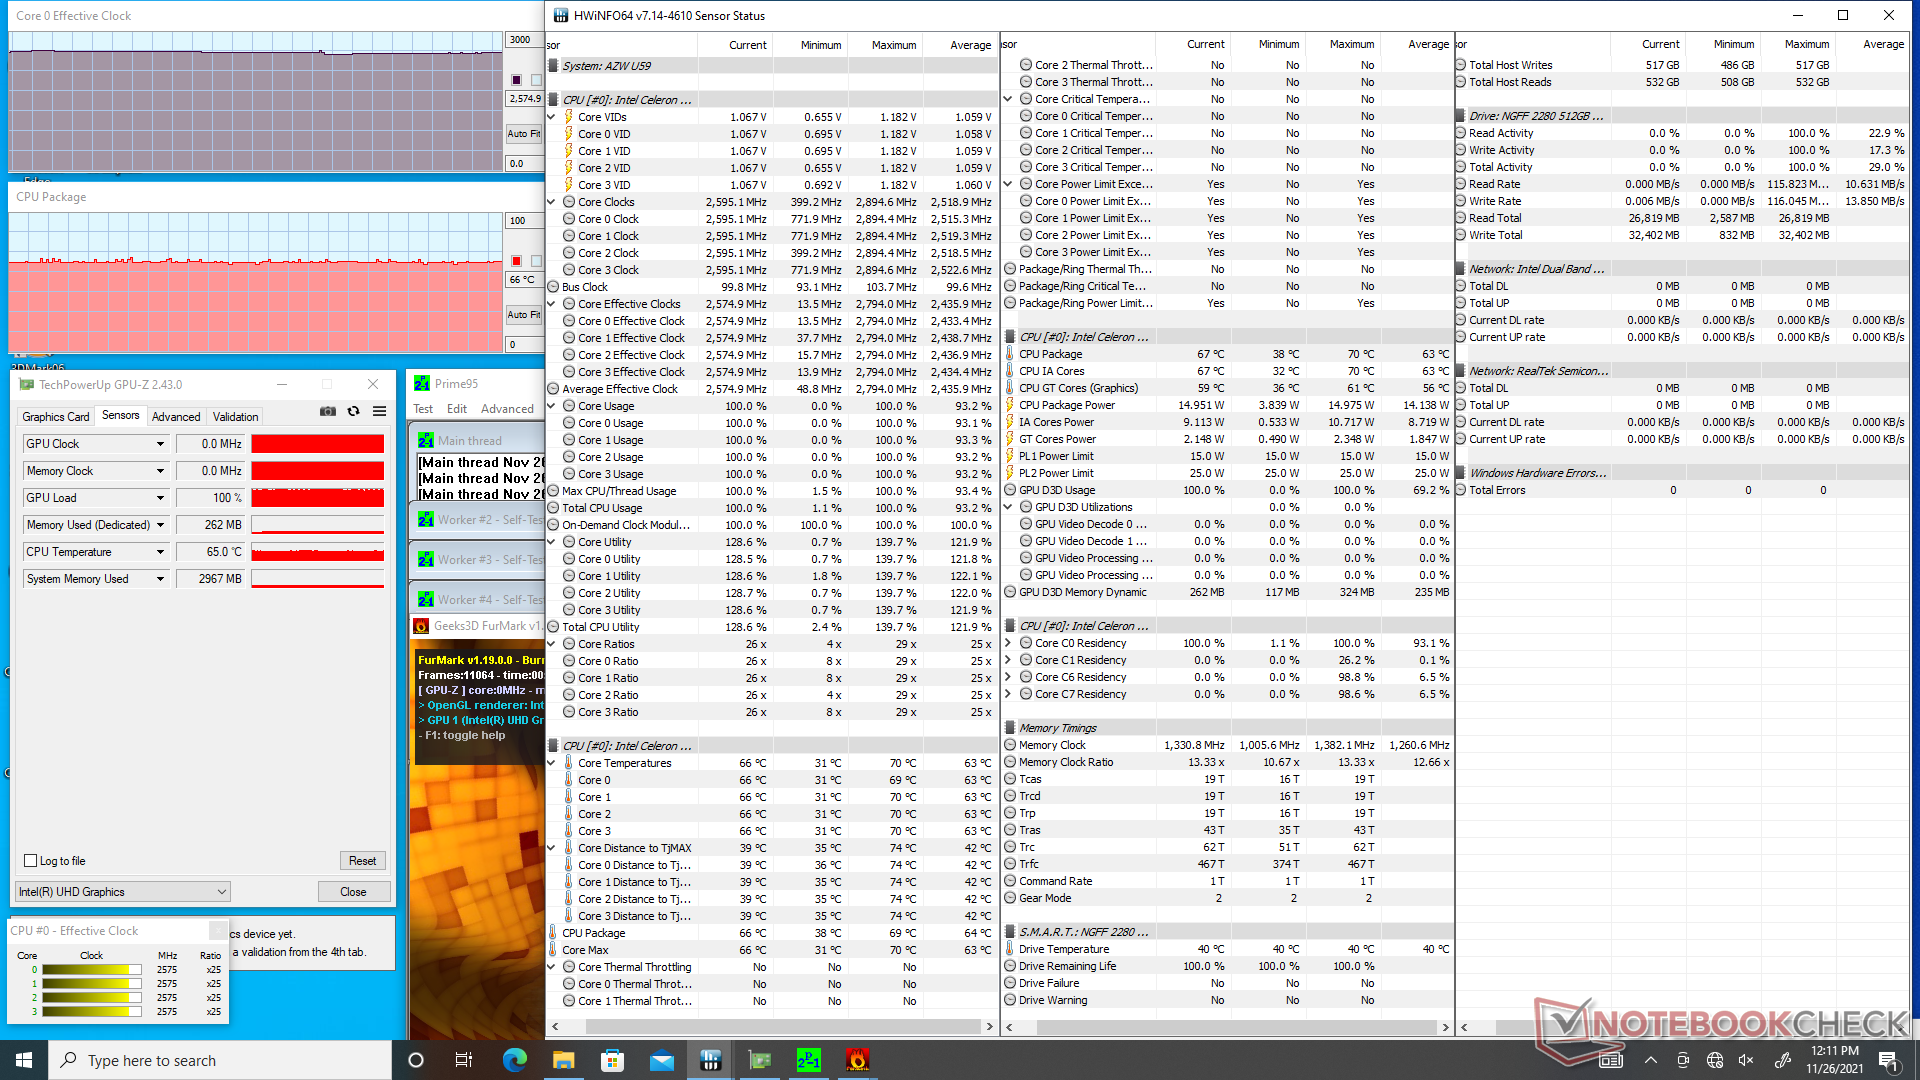
Test de stress
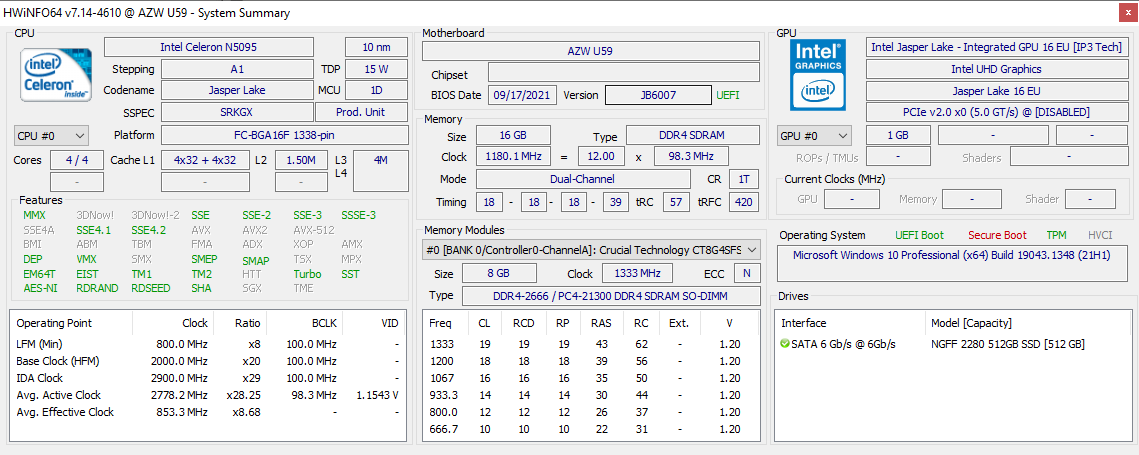
Le processeur se stabilise à 2,8 GHz et à 69°C sous le stress de Prime95. Le fait que le système utilise un ventilateur actif pour le refroidissement est probablement responsable des températures plus basses que prévu et des performances stables dans le temps. HWiNFO rapporte des niveaux PL1 et PL2 de 15 W et 25 W, respectivement, mais nous ne sommes capables d'atteindre qu'un niveau stable de 15 W lors de charges aussi extrêmes. En effectuant ce même test sur le Beelink SEi10 équipé d'un Core i3, nous avons obtenu des performances stables Beelink SEi10 équipé d'un Core i3, la température centrale serait nettement plus élevée, à 90 °C
| Fréquence CPU(GHz) | Fréquence GPU(MHz) | Température CPUmoyenne(°C) | |
| Système au repos | - | - | 39 |
| Prime95 Stress | 2.8 | ||
| Prime95+ FurMark Stress | 2.6 | -- | 66 |
| Witcher 3 Stress | 0.5 | -- | 50 |
Gestion de l'énergie
Consommation d'énergie
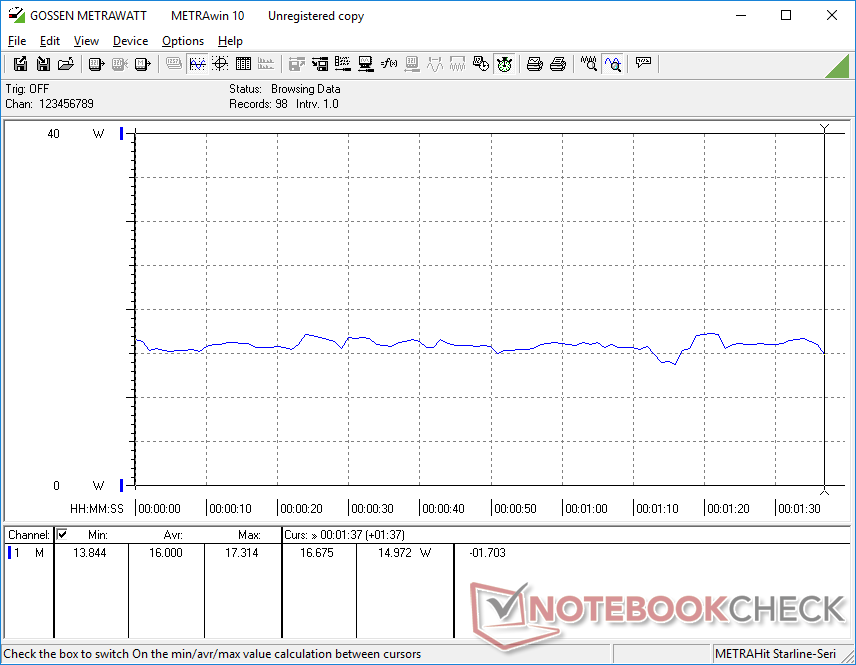
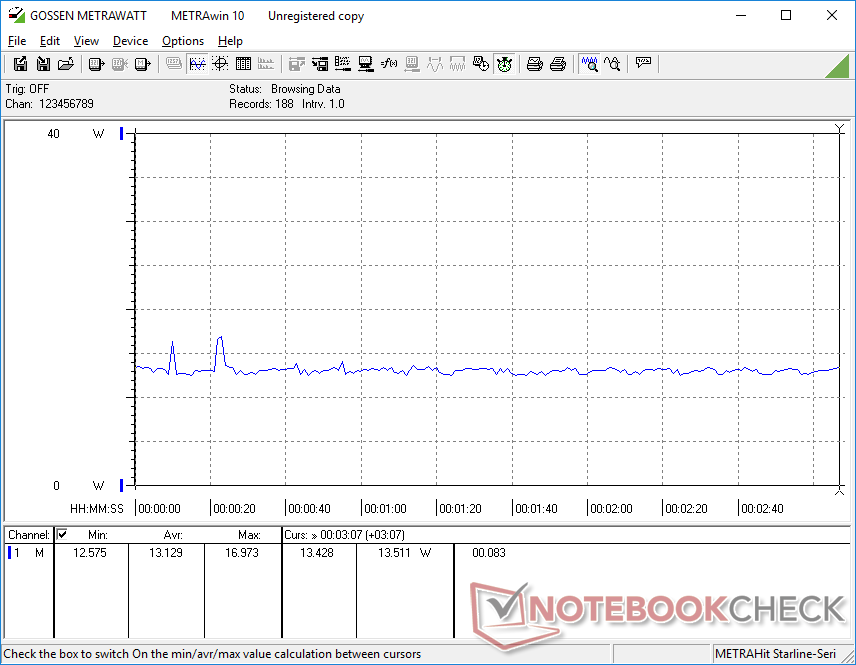
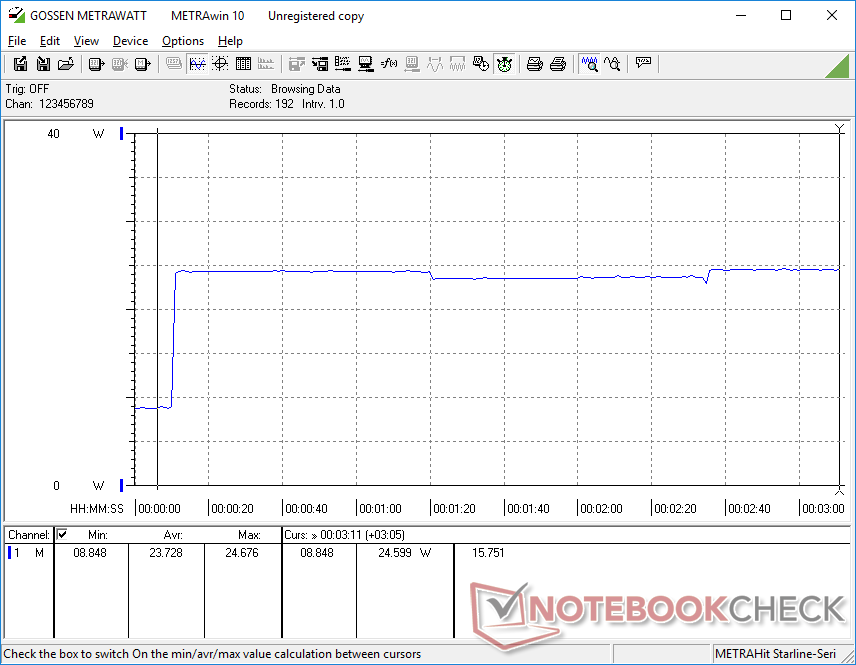
La marche au ralenti sur le bureau sans application en cours consomme plus que prévu, soit environ 7 W, alors que le NUC8 d'Intel ou la NucBox K1 de GMK ne consomment que 3 W chacun. Des charges plus élevées, comme des jeux, consomment beaucoup moins sur notre U59, avec seulement 13 à 16 W en moyenne, contre 2 fois plus sur les mini PC équipés de GPU plus rapides UHD Graphics 620 ou Iris Xe.

| Éteint/en veille | |
| Au repos | |
| Fortement sollicité |
|
Légende:
min: | |
| Beelink U59 Celeron N5095, UHD Graphics (Jasper Lake 16 EU), Silicon Motion AZW 512G NV428, , x, | Intel NUC11TNKi5 i5-1135G7, Iris Xe G7 80EUs, Transcend M.2 SSD 430S TS512GMTS430S, , x, | Intel NUC8i7BE i7-8559U, Iris Plus Graphics 655, , , x, | Beelink SEi10 i3-1005G1, UHD Graphics G1 (Ice Lake 32 EU), Silicon Motion AZW 256G M.2280 NVMe 4X 200725 D, , x, | Zotac ZBOX MI642 Nano i5-10210U, UHD Graphics 620, Western Digital WD Blue 3D WDBNCE5000PNC, , x, | GMK NucBox K1 Celeron J4125, UHD Graphics 600, HIKVision C100 NGFF SSD 128GB, , x, | |
|---|---|---|---|---|---|---|
| Power Consumption | -135% | -102% | -26% | -67% | 34% | |
| Idle Minimum * (Watt) | 6.7 | 11.5 -72% | 2.7 60% | 6.3 6% | 8.9 -33% | 3.4 49% |
| Idle Average * (Watt) | 6.7 | 12.4 -85% | 3.1 54% | 6.6 1% | 9 -34% | 3.8 43% |
| Idle Maximum * (Watt) | 7.4 | 12.9 -74% | 6.3 15% | 6.7 9% | 9.9 -34% | 3.9 47% |
| Load Average * (Watt) | 16 | 40.7 -154% | 59.7 -273% | 25.9 -62% | 33 -106% | 12.5 22% |
| Witcher 3 ultra * (Watt) | 13.1 | 43.9 -235% | 47.2 -260% | |||
| Load Maximum * (Watt) | 25.6 | 73.5 -187% | 78 -205% | 46.7 -82% | 58 -127% | 22.7 11% |
* ... Moindre est la valeur, meilleures sont les performances
Power Consumption Witcher 3 / Stresstest
Power Consumption external Monitor
Points positifs
Points négatifs
Verdict
Le faible prix de 279 à 349 dollars américains, avec la RAM, le stockage et Windows 11 Pro, est l'argument de vente le plus convaincant du Beelink U59. Les performances par rapport au prix sont nettement supérieures à celles des mini-PC Celeron de la génération précédente, de 2 à 2,5 fois plus élevées en termes de performances multithread et de 50 % en termes de performances monothread et graphiques. Nous apprécions le fait que les deux baies de stockage, les deux emplacements de mémoire vive et le module WLAN soient facilement accessibles et évolutifs, ce qui signifie que les acheteurs intéressés n'ont pas besoin de débourser pour la configuration haut de gamme s'ils n'ont pas peur de mettre à niveau ces composants eux-mêmes.
Ce n'est pas tout à fait un Core i3, mais le Celeron Jasper Lake N5095 en est au moins beaucoup plus proche que tous les autres CPU Celeron mobiles avant lui. Le Beelink U59 offre des performances nettement supérieures à celles de la plupart des autres mini-PC dans la fourchette de prix de 200 à 350 dollars.
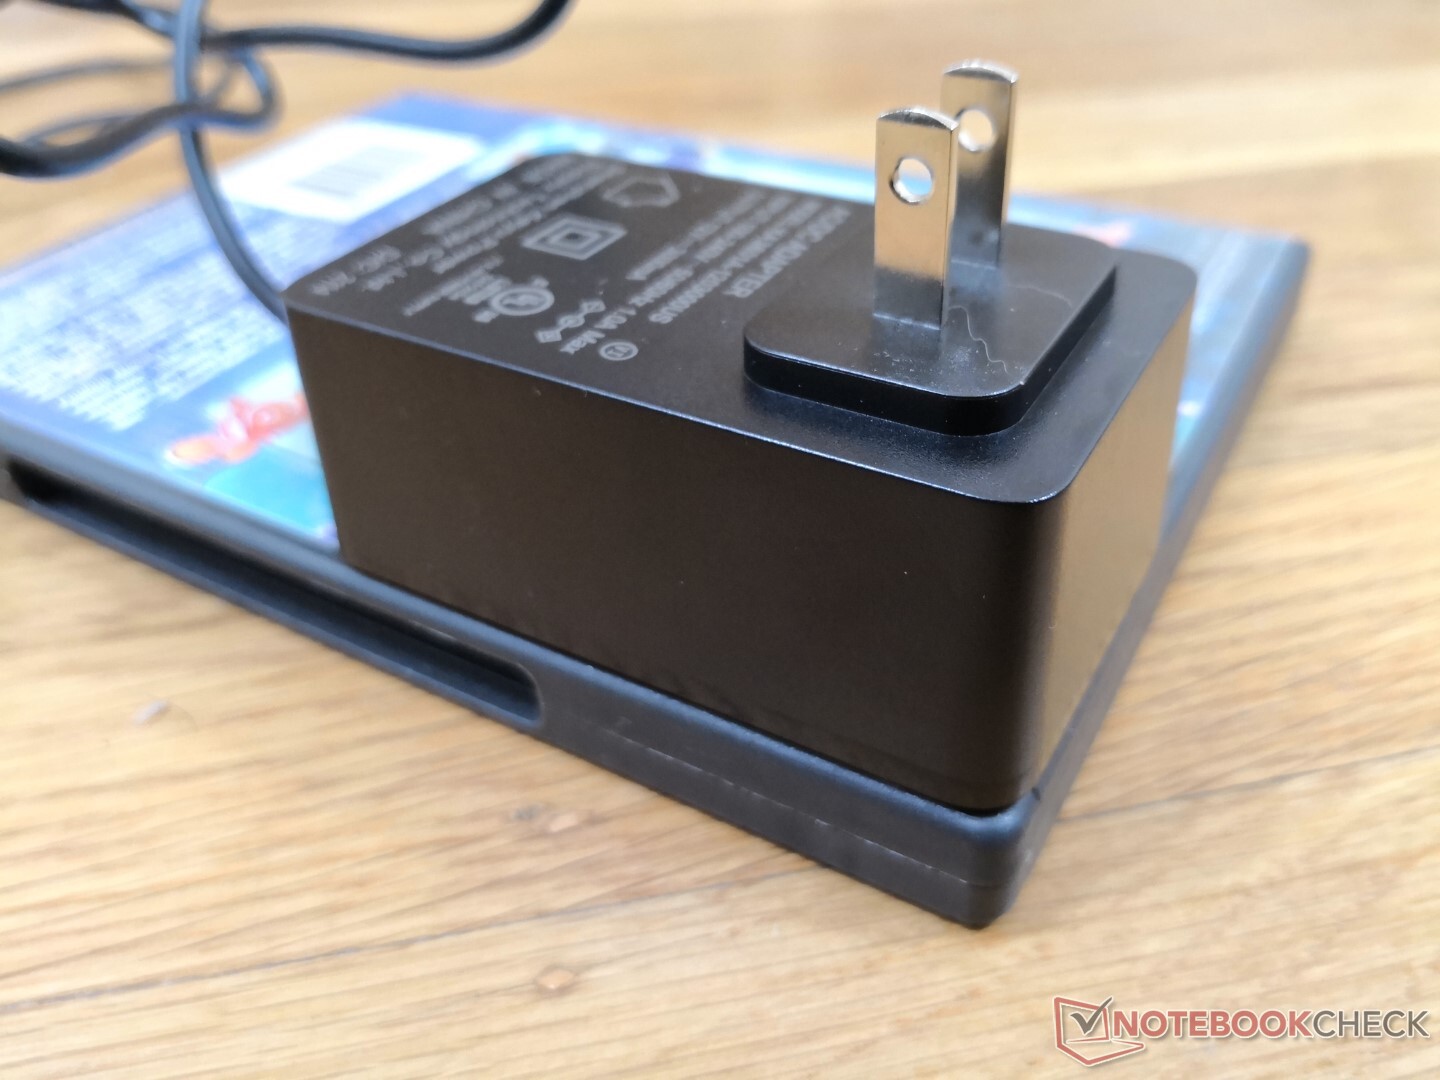
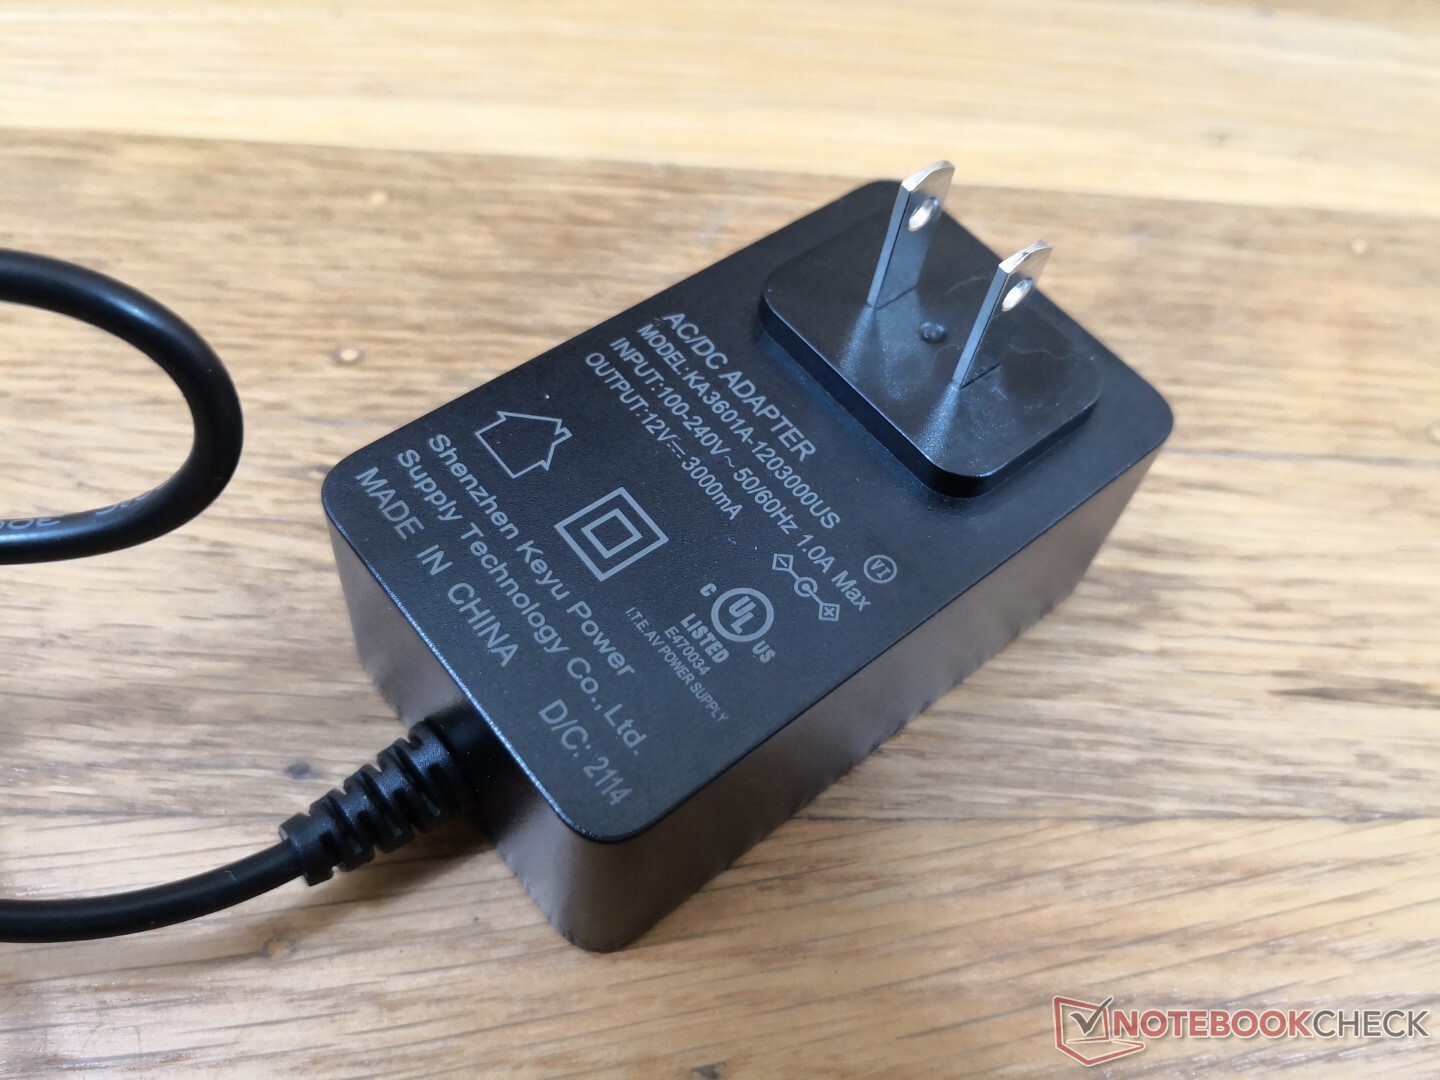
Les inconvénients sont mineurs, mais ils s'additionnent. Le fait que le système nécessite un adaptateur secteur propriétaire est une gêne alors qu'il aurait pu être alimenté par l'USB-C, plus universel, à la place. Le ventilateur, bien que généralement silencieux, a tendance à pulser fréquemment en réponse à la charge de travail. L'absence de lecteur de carte SD peut vexer les utilisateurs qui en dépendent, tandis que la plaque supérieure en plastique semble bon marché et sujette aux rayures. Si vous devez vous procurer un mini-PC Celeron, alors le Beelink U59 alimenté par Jasper Lake peut être une bonne option, simplement en raison des avantages notables en termes de performances par rapport aux anciennes puces Celeron telles que celles duGMK NucBox K1 ou Chuwi GBox.
Prix et disponibilité
Amazon expédie actuellement le Beelink U59 à partir de 279 USD et jusqu'à 349 USD selon l'option de mémoire vive et de stockage.
Price comparison

