Cours critique du Mini PC Intel NUC Kit NUC8i7BEH (i7-8559U)
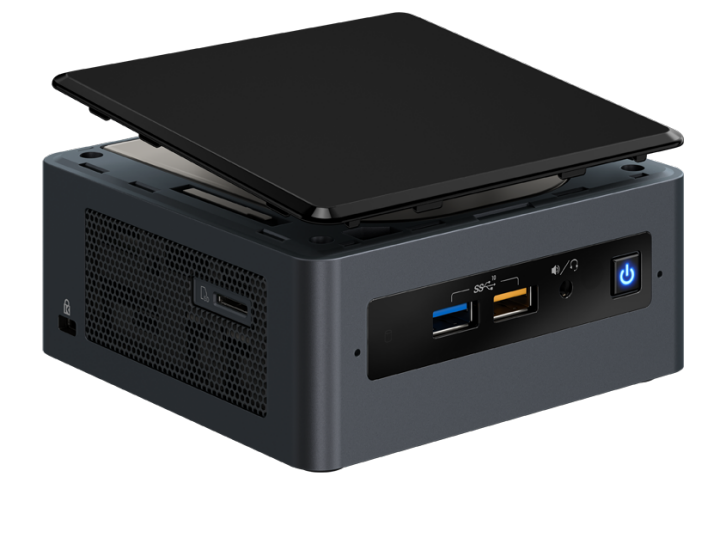
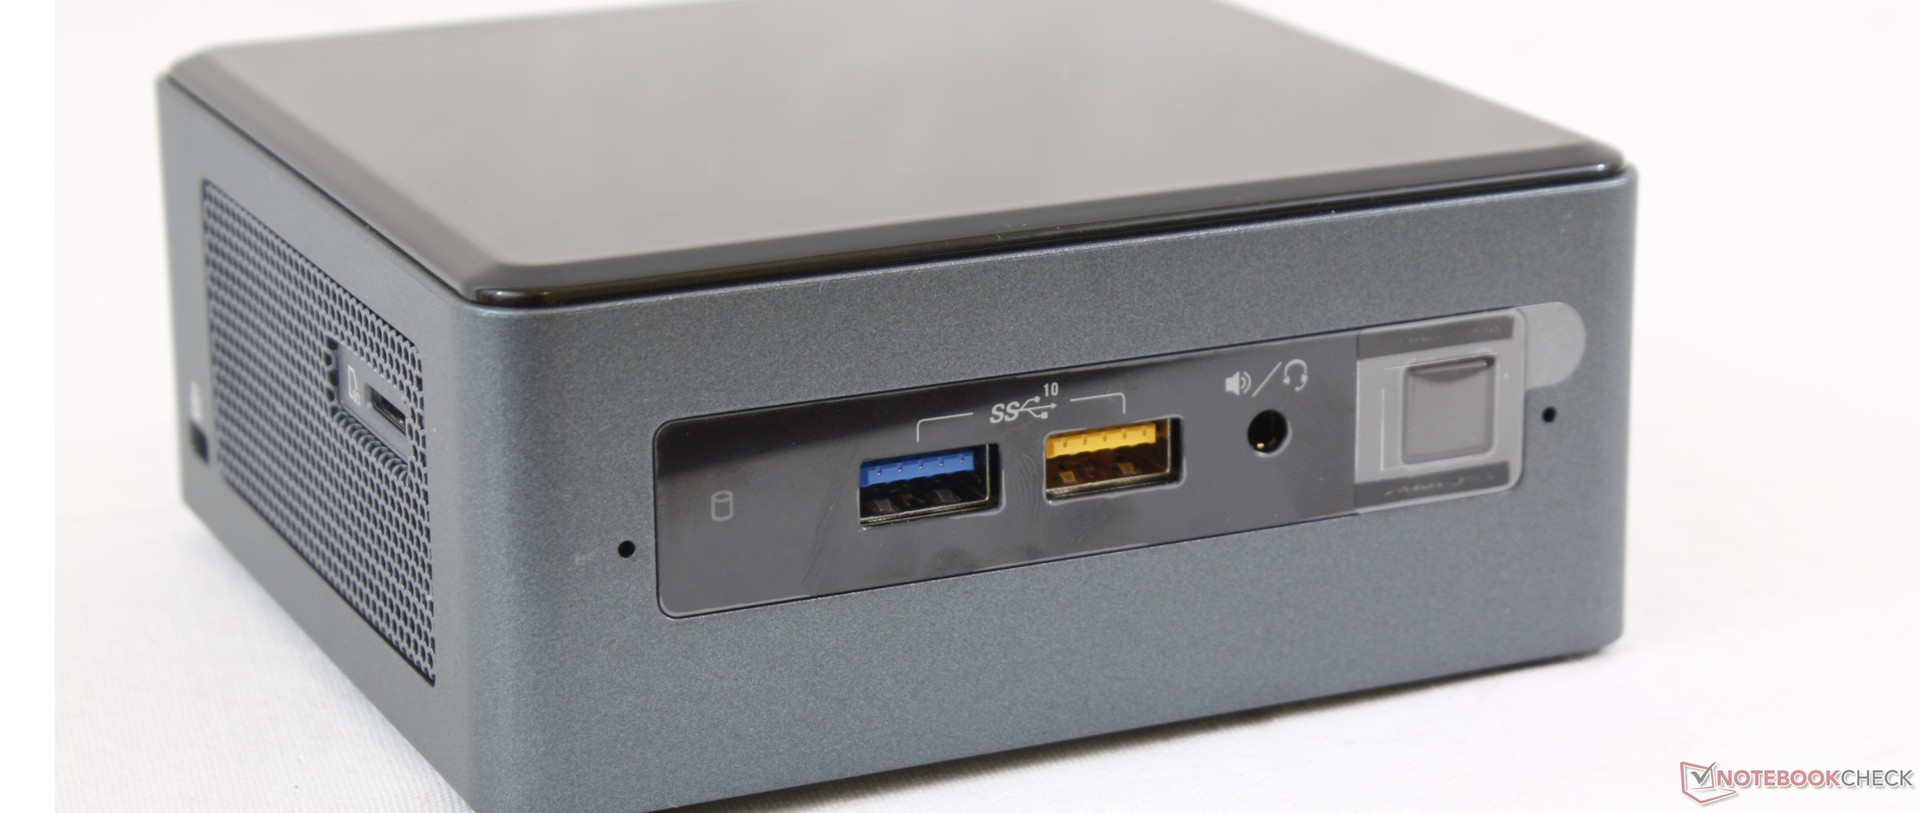
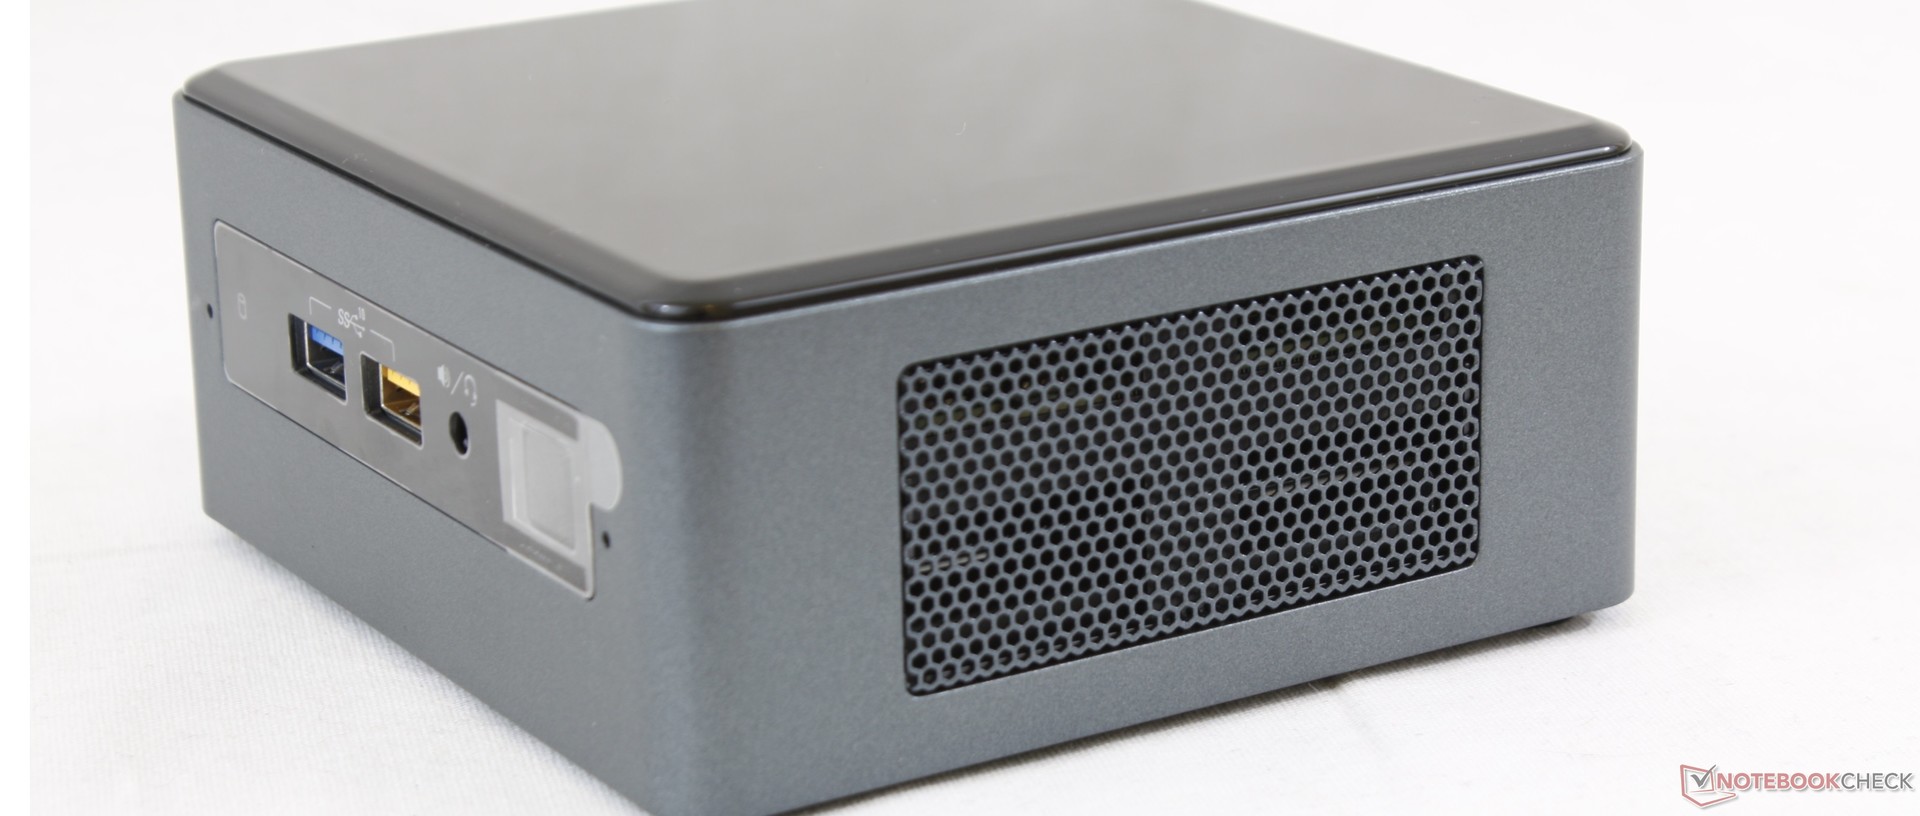
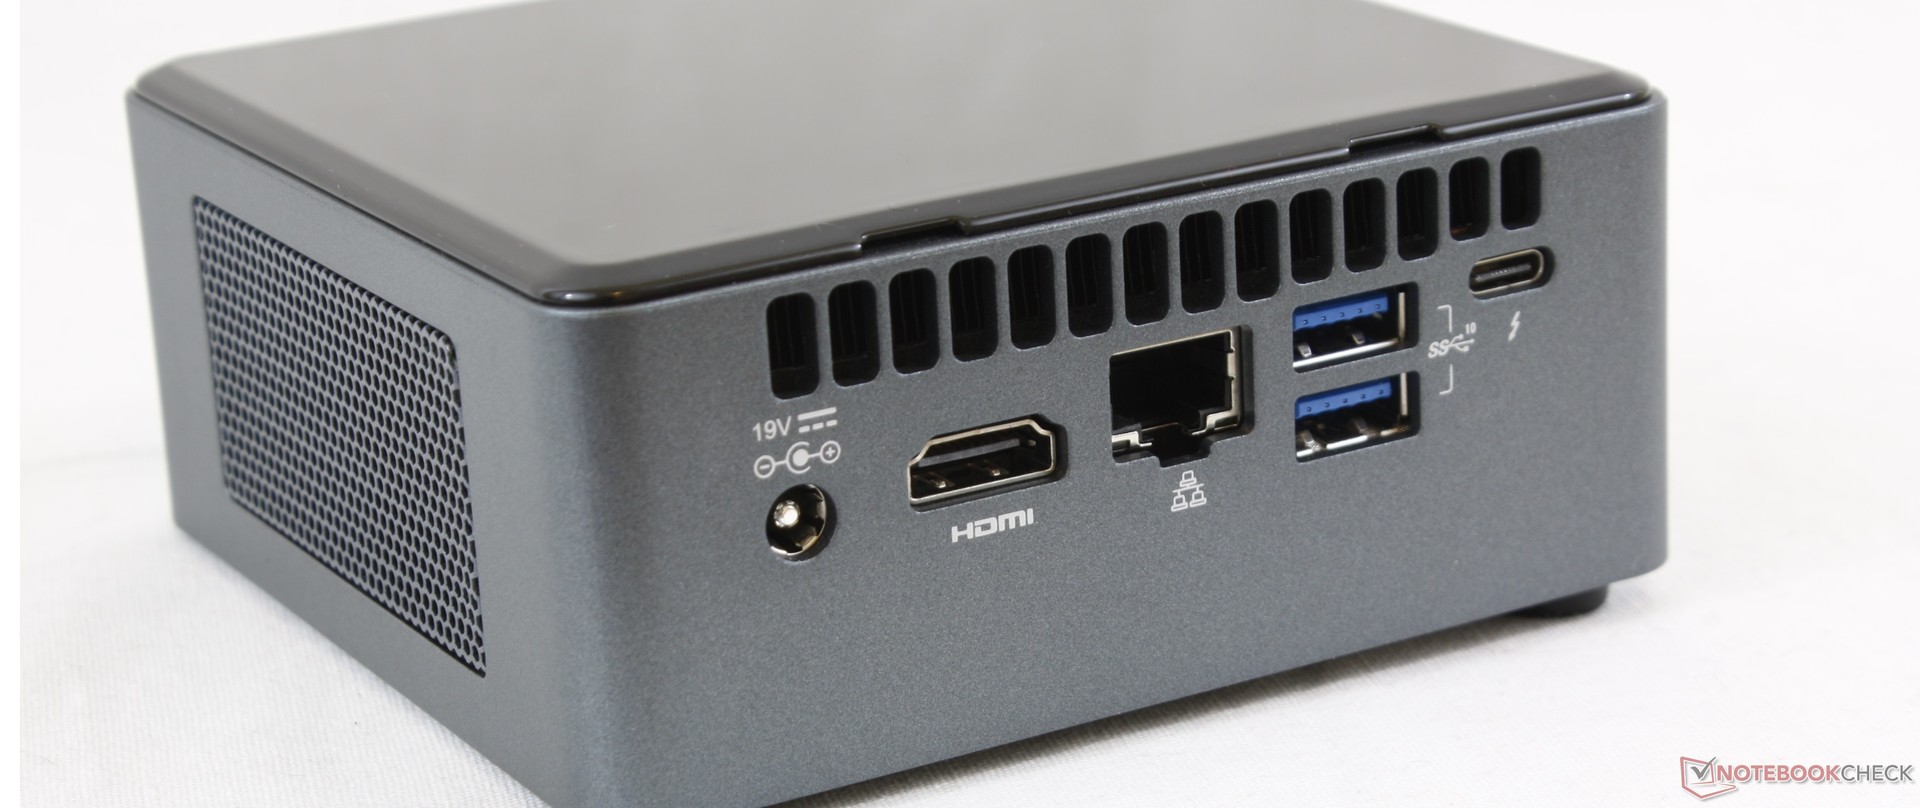
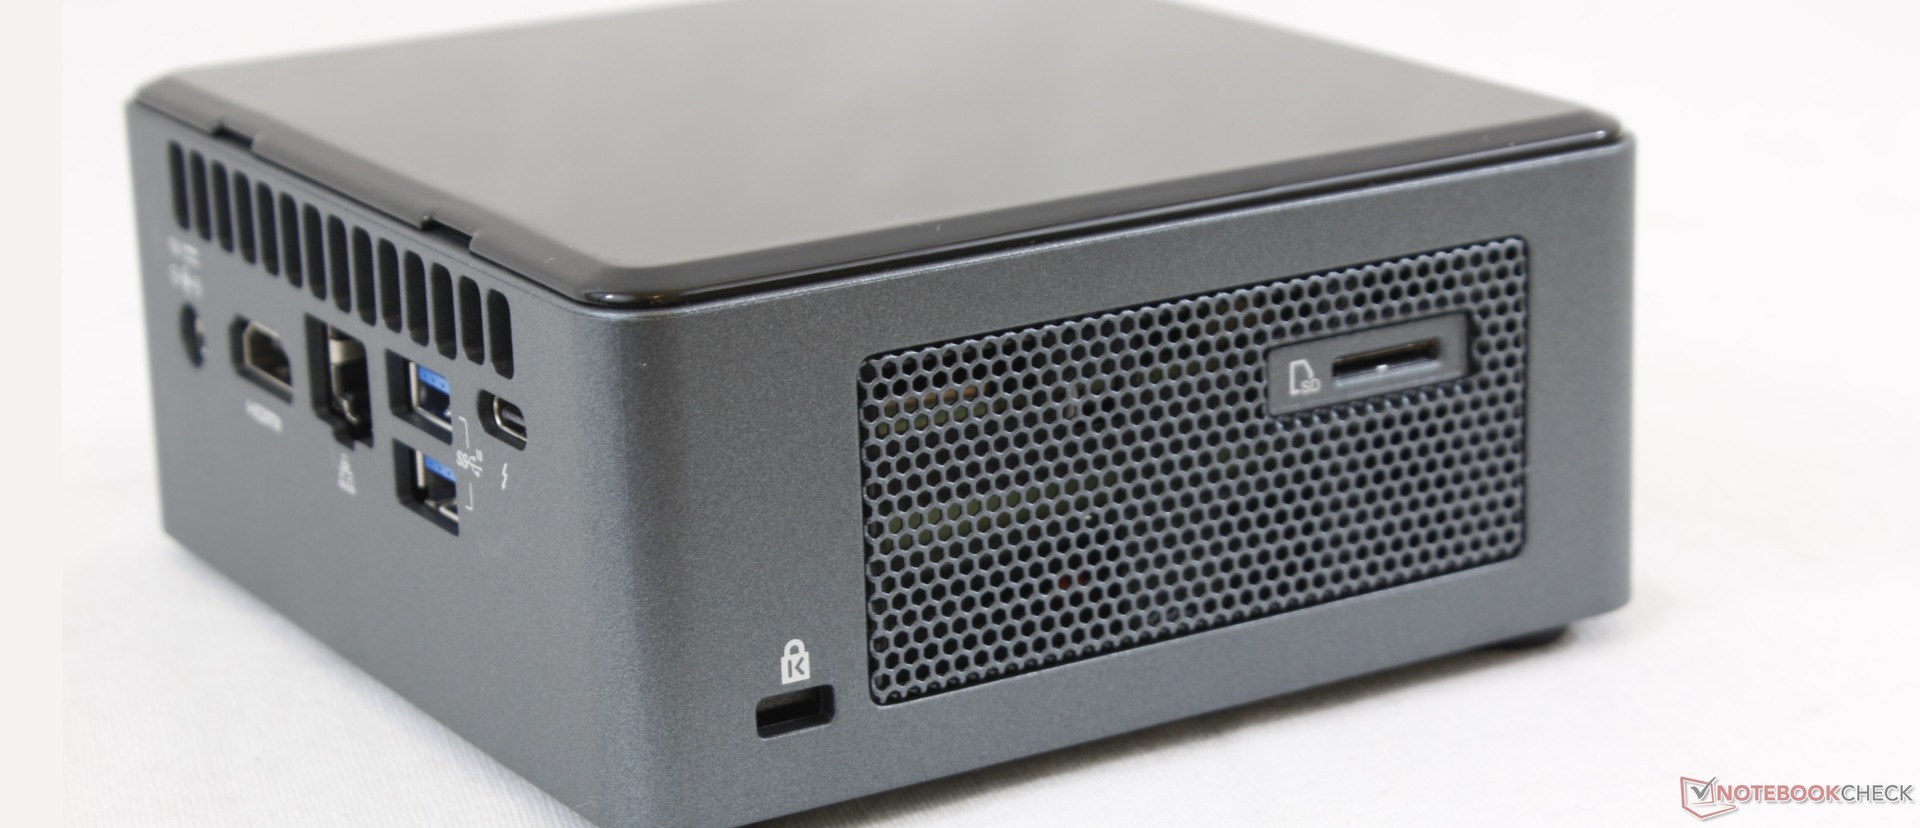
| SD Card Reader | |
| average JPG Copy Test (av. of 3 runs) | |
| Intel Hades Canyon NUC8i7HVK (Toshiba Exceria Pro SDXC 64 GB UHS-II) | |
| Intel NUC8i7BE (Toshiba Exceria Pro M501 UHS-II) | |
| Zotac ZBOX-QK7P3000 (Toshiba Exceria Pro SDXC 64 GB UHS-II) | |
| Zotac ZBOX-CI660 Nano (Toshiba Exceria Pro SDXC 64 GB UHS-II) | |
| maximum AS SSD Seq Read Test (1GB) | |
| Intel Hades Canyon NUC8i7HVK (Toshiba Exceria Pro SDXC 64 GB UHS-II) | |
| Intel NUC8i7BE (Toshiba Exceria Pro M501 UHS-II) | |
| Zotac ZBOX-QK7P3000 (Toshiba Exceria Pro SDXC 64 GB UHS-II) | |
| Zotac ZBOX-CI660 Nano (Toshiba Exceria Pro SDXC 64 GB UHS-II) | |
| Networking | |
| iperf3 transmit AX12 | |
| Intel NUC8i7BE | |
| Intel Hades Canyon NUC8i7HVK | |
| Zotac ZBOX-QK7P3000 | |
| Zotac ZBOX-CI660 Nano | |
| iperf3 receive AX12 | |
| Intel NUC8i7BE | |
| Intel Hades Canyon NUC8i7HVK | |
| Zotac ZBOX-CI660 Nano | |
| Zotac ZBOX-QK7P3000 | |
| Cinebench R15 | |
| CPU Single 64Bit | |
| Intel NUC8i7BE | |
| Intel Hades Canyon NUC8i7HVK | |
| Dell Latitude 5591 | |
| Zotac ZBOX Magnus EK71080 | |
| Zotac ZBOX-CI660 Nano | |
| Zotac ZBOX-QK7P3000 | |
| Dell XPS 13 9360 FHD i7 Iris | |
| Lenovo Yoga C930-13IKB | |
| Apple MacBook Pro 13 2017 Touchbar i5 | |
| Intel Skull Canyon NUC6i7KYK | |
| HP Pavilion 15-cw0003ng | |
| Intel NUC6i5SYH | |
| Intel NUC7CJYH | |
| CPU Multi 64Bit | |
| Dell Latitude 5591 | |
| Intel Hades Canyon NUC8i7HVK | |
| Intel NUC8i7BE | |
| Zotac ZBOX Magnus EK71080 | |
| Zotac ZBOX-QK7P3000 | |
| Intel Skull Canyon NUC6i7KYK | |
| Zotac ZBOX-CI660 Nano | |
| Lenovo Yoga C930-13IKB | |
| HP Pavilion 15-cw0003ng | |
| Apple MacBook Pro 13 2017 Touchbar i5 | |
| Dell XPS 13 9360 FHD i7 Iris | |
| Intel NUC6i5SYH | |
| Intel NUC7CJYH | |
| Cinebench R11.5 | |
| CPU Single 64Bit | |
| Intel NUC8i7BE | |
| Dell Latitude 5591 | |
| Intel Hades Canyon NUC8i7HVK | |
| Zotac ZBOX Magnus EK71080 | |
| Zotac ZBOX-QK7P3000 | |
| Intel Skull Canyon NUC6i7KYK | |
| Lenovo Yoga C930-13IKB | |
| Apple MacBook Pro 13 2017 Touchbar i5 | |
| Intel NUC6i5SYH | |
| Intel NUC7CJYH | |
| CPU Multi 64Bit | |
| Dell Latitude 5591 | |
| Intel Hades Canyon NUC8i7HVK | |
| Zotac ZBOX Magnus EK71080 | |
| Intel Skull Canyon NUC6i7KYK | |
| Zotac ZBOX-QK7P3000 | |
| Intel NUC8i7BE | |
| Lenovo Yoga C930-13IKB | |
| Apple MacBook Pro 13 2017 Touchbar i5 | |
| Intel NUC6i5SYH | |
| Intel NUC7CJYH | |
| Cinebench R10 | |
| Rendering Multiple CPUs 32Bit | |
| Dell Latitude 5591 | |
| Intel Hades Canyon NUC8i7HVK | |
| Intel NUC8i7BE | |
| Zotac ZBOX Magnus EK71080 | |
| Zotac ZBOX-QK7P3000 | |
| Intel Skull Canyon NUC6i7KYK | |
| Lenovo Yoga C930-13IKB | |
| Apple MacBook Pro 13 2017 Touchbar i5 | |
| Intel NUC6i5SYH | |
| Intel NUC7CJYH | |
| Rendering Single 32Bit | |
| Intel NUC8i7BE | |
| Zotac ZBOX-QK7P3000 | |
| Dell Latitude 5591 | |
| Intel Hades Canyon NUC8i7HVK | |
| Zotac ZBOX Magnus EK71080 | |
| Lenovo Yoga C930-13IKB | |
| Intel Skull Canyon NUC6i7KYK | |
| Apple MacBook Pro 13 2017 Touchbar i5 | |
| Intel NUC6i5SYH | |
| Intel NUC7CJYH | |
| wPrime 2.10 - 1024m | |
| Intel NUC7CJYH | |
| Intel NUC6i5SYH | |
| Apple MacBook Pro 13 2017 Touchbar i5 | |
| Intel NUC8i7BE | |
| Zotac ZBOX-QK7P3000 | |
| Intel Skull Canyon NUC6i7KYK | |
| Zotac ZBOX Magnus EK71080 | |
| Intel Hades Canyon NUC8i7HVK | |
* ... Moindre est la valeur, meilleures sont les performances
| PCMark 8 | |
| Home Score Accelerated v2 | |
| Intel Hades Canyon NUC8i7HVK | |
| Intel NUC8i7BE | |
| Intel NUC6i5SYH | |
| Zotac ZBOX-CI660 Nano | |
| Intel NUC7CJYH | |
| Work Score Accelerated v2 | |
| Intel Hades Canyon NUC8i7HVK | |
| Intel NUC6i5SYH | |
| Intel NUC7CJYH | |
| Creative Score Accelerated v2 | |
| Intel Hades Canyon NUC8i7HVK | |
| Intel NUC6i5SYH | |
| Intel NUC7CJYH | |
| PCMark 8 Home Score Accelerated v2 | 4674 points | |
| PCMark 10 Score | 4580 points | |
Aide | ||
| 3DMark 11 | |
| 1280x720 Performance GPU | |
| Zotac ZBOX-QK7P3000 | |
| Intel Hades Canyon NUC8i7HVK | |
| MSI Prestige PS42 8RB-059 | |
| Intel Skull Canyon NUC6i7KYK | |
| Intel NUC8i7BE | |
| Dell Latitude 5591 | |
| Apple MacBook Pro 13 2017 Touchbar i5 | |
| Moyenne Intel Iris Plus Graphics 655 (1365 - 3081, n=8) | |
| Asus VivoBook S410UQ-NH74 | |
| HP Pavilion 15-cw0003ng | |
| Intel NUC6i5SYH | |
| Dell XPS 13 9360 FHD i7 Iris | |
| Zotac ZBOX-CI660 Nano | |
| Intel NUC7CJYH | |
| 1280x720 Performance Combined | |
| Intel Hades Canyon NUC8i7HVK | |
| Zotac ZBOX-QK7P3000 | |
| MSI Prestige PS42 8RB-059 | |
| Dell Latitude 5591 | |
| Intel Skull Canyon NUC6i7KYK | |
| Intel NUC8i7BE | |
| Apple MacBook Pro 13 2017 Touchbar i5 | |
| Asus VivoBook S410UQ-NH74 | |
| Moyenne Intel Iris Plus Graphics 655 (1245 - 2688, n=8) | |
| Intel NUC6i5SYH | |
| HP Pavilion 15-cw0003ng | |
| Dell XPS 13 9360 FHD i7 Iris | |
| Zotac ZBOX-CI660 Nano | |
| Intel NUC7CJYH | |
| 3DMark Vantage P Result | 12093 points | |
| 3DMark 11 Performance | 3349 points | |
| 3DMark Ice Storm Standard Score | 87906 points | |
| 3DMark Cloud Gate Standard Score | 13037 points | |
| 3DMark Fire Strike Score | 2040 points | |
| 3DMark Fire Strike Extreme Score | 1011 points | |
| 3DMark Time Spy Score | 722 points | |
Aide | ||
| The Witcher 3 - 1024x768 Low Graphics & Postprocessing | |
| Moyenne de la classe Desktop (39.3 - 841, n=30, 2 dernières années) | |
| Intel NUC8i7BE | |
| Moyenne Intel Iris Plus Graphics 655 (23.2 - 27.9, n=4) | |
| Bas | Moyen | Élevé | Ultra | QHD | 4K | |
|---|---|---|---|---|---|---|
| Counter-Strike: GO (2012) | 93.7 | 49.6 | 12.4 | |||
| BioShock Infinite (2013) | 116.6 | 64.8 | 55 | 17 | ||
| GTA V (2015) | 68 | 62.1 | 15.8 | 6.22 | 4.17 | |
| The Witcher 3 (2015) | 27.4 | |||||
| Dota 2 Reborn (2015) | 95 | 68 | 34.7 | 30.4 | 12.2 | |
| Rainbow Six Siege (2015) | 75.8 | 0 | ||||
| Rise of the Tomb Raider (2016) | 39.2 | 22.3 | 10.8 | 8.9 | ||
| Ashes of the Singularity (2016) | 19.4 | 11.3 | 10.5 | |||
| Deus Ex Mankind Divided (2016) | 28.7 | 21.1 | ||||
| For Honor (2017) | 41.3 | 16.1 | ||||
| Ghost Recon Wildlands (2017) | 22.7 | |||||
| Rocket League (2017) | 133.3 | 59.1 | 38.8 | |||
| Final Fantasy XV Benchmark (2018) | 16.9 | |||||
| X-Plane 11.11 (2018) | 32.6 | 23.3 | 19.8 | |||
| World of Tanks enCore (2018) | 15.7 | 40.3 | ||||
| Far Cry 5 (2018) | 23 | 11 | ||||
| Shadow of the Tomb Raider (2018) | 22 | |||||
| FIFA 19 (2018) | 82 | 45.8 | 40.3 | 36.7 | ||
| Assassin´s Creed Odyssey (2018) | 18 | |||||
| Battlefield V (2018) | 19.9 | |||||
| Far Cry New Dawn (2019) | 22 | 11 | ||||
| Metro Exodus (2019) | 18.3 | |||||
| Anthem (2019) | 16.6 | |||||
| Dirt Rally 2.0 (2019) | 64 | 22.8 | ||||
| The Division 2 (2019) | 35 | |||||
| Anno 1800 (2019) | 30.2 | |||||
| Rage 2 (2019) | 24.5 | |||||
| Total War: Three Kingdoms (2019) | 56.7 | 18.5 | 10.5 | |||
| F1 2019 (2019) | 51.2 | 21.9 | 19.3 | |||
| Control (2019) | 25 problèmes graphiques graves | |||||
| Borderlands 3 (2019) | 23.5 | 10.2 | 6.4 | |||
| FIFA 20 (2019) | 92 | 55.9 | 46.3 | 34.9 | 26.5 | 13.6 |
| Ghost Recon Breakpoint (2019) | 0 Le jeu ne démarre pas | |||||
| GRID 2019 (2019) | 36 problèmes graphiques graves | 20 problèmes graphiques graves | ||||
| Call of Duty Modern Warfare 2019 (2019) | 0 Le jeu ne démarre pas | |||||
| Red Dead Redemption 2 (2019) | 15.8 | |||||
| Hearthstone (2020) | 59.8 | 27.2 | ||||
| Escape from Tarkov (2020) | 29.1 | 16.2 | 14.1 | 6.59 | ||
| Doom Eternal (2020) | 0 Le jeu ne démarre pas | |||||
| Gears Tactics (2020) | 54.8 | 17.3 | 11.6 |
| Intel NUC8i7BE Iris Plus Graphics 655, i7-8559U | Intel Hades Canyon NUC8i7HVK Vega M GH, i7-8809G, Intel Optane 120 GB SSDPEK1W120GA | Intel Skull Canyon NUC6i7KYK Iris Pro Graphics 580, 6770HQ, Samsung SSD 850 EVO m.2 120GB | Lenovo Yoga C930-13IKB 81C4 UHD Graphics 620, i5-8550U, SK hynix PC401 HFS256GD9TNG | Apple MacBook Pro 13 2018 Touchbar i5 Iris Plus Graphics 655, i5-8259U | |
|---|---|---|---|---|---|
| Noise | -1% | -7% | 7% | 1% | |
| arrêt / environnement * (dB) | 28.7 | 28.7 -0% | 29.5 -3% | 27.9 3% | 29.6 -3% |
| Idle Minimum * (dB) | 28.7 | 29 -1% | 31.6 -10% | 27.9 3% | 29.6 -3% |
| Idle Average * (dB) | 29.3 | 29 1% | 32.2 -10% | 27.9 5% | 29.6 -1% |
| Idle Maximum * (dB) | 31.8 | 29 9% | 32.3 -2% | 29.3 8% | 29.6 7% |
| Load Average * (dB) | 39 | 36 8% | 43 -10% | 32 18% | 36.7 6% |
| Witcher 3 ultra * (dB) | 39 | 42 -8% | 32.5 17% | ||
| Load Maximum * (dB) | 41.4 | 49.4 -19% | 43.2 -4% | 39.3 5% | 46.7 -13% |
* ... Moindre est la valeur, meilleures sont les performances
Degré de la nuisance sonore
| Au repos |
| 28.7 / 29.3 / 31.8 dB(A) |
| Fortement sollicité |
| 39 / 41.4 dB(A) |
 | ||
30 dB silencieux 40 dB(A) audible 50 dB(A) bruyant |
||
min: | ||
| Éteint/en veille | |
| Au repos | |
| Fortement sollicité |
|
Légende:
min: | |
| Intel NUC8i7BE i7-8559U, Iris Plus Graphics 655, , , x, | Intel Hades Canyon NUC8i7HVK i7-8809G, Vega M GH, Intel Optane 120 GB SSDPEK1W120GA, , x, | Intel NUC6i5SYH 6260U, Iris Graphics 540, Samsung SSD XP941 MZHPU256HCGL, , x, 0" | Zotac ZBOX-CI660 Nano i5-8550U, UHD Graphics 620, OCZ Vertex OCZSSD2-1VTX120G, , x, | Lenovo Yoga C930-13IKB i5-8250U, UHD Graphics 620, SK hynix PC401 HFS256GD9TNG, IPS, 1920x1080, 13.9" | Lenovo Ideapad 720S-13ARR R7 2700U, Vega 10, Samsung PM961 MZVLW256HEHP, IPS, 1920x1080, 13.3" | |
|---|---|---|---|---|---|---|
| Power Consumption | -230% | -64% | -106% | -27% | -59% | |
| Idle Minimum * (Watt) | 2.7 | 15.5 -474% | 8.7 -222% | 9.7 -259% | 3.3 -22% | 5.4 -100% |
| Idle Average * (Watt) | 3.1 | 16.2 -423% | 8.7 -181% | 9.8 -216% | 6.8 -119% | 9.8 -216% |
| Idle Maximum * (Watt) | 6.3 | 16.5 -162% | 8.7 -38% | 11.8 -87% | 9.5 -51% | 11.3 -79% |
| Load Average * (Watt) | 59.7 | 83.4 -40% | 18.2 70% | 51.6 14% | 40.8 32% | 29.3 51% |
| Witcher 3 ultra * (Watt) | 47.2 | 121.7 -158% | ||||
| Load Maximum * (Watt) | 78 | 173.5 -122% | 36.6 53% | 63.2 19% | 57 27% | 38.5 51% |
* ... Moindre est la valeur, meilleures sont les performances
Points positifs
Points négatifs
Les utilisateurs peuvent s’attendre à des performances similaires à celles de l’ancienne génération de NUC Skull Canyon, tout en tournant plus silencieusement, en chauffant moins, et à un prix d’appel moins élevé. L’ajout du Thunderbolt 3 signifie que les utilisateurs peuvent utiliser l’appareil avec un dock graphique pour le jeu ou pour d’autres tâches exigeantes, afin d’augmenter la polyvalence du système.
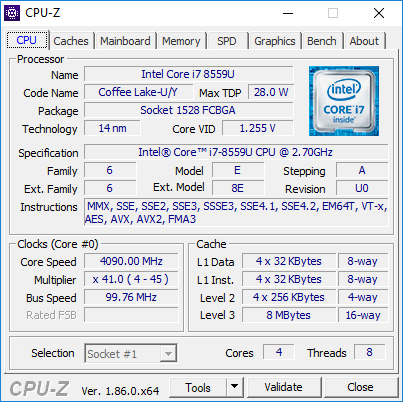
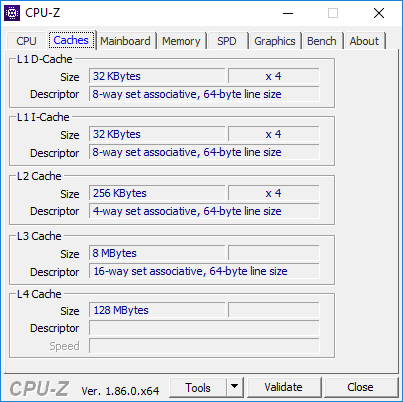
La série NUC8 se fait remarquer avec l’arrivée de Coffee Lake U, mais ses résultats sont mitigés. L’Iris Plus Graphics 655 est de 5 à 30 % plus rapide qu’une Vega 10, pourvu que le NUC soit équipé de RAM double canal, mais les performances processeur ne sont pas vraiment meilleures qu’avec le i7-8550U moins cher. Son enveloppe thermique supérieure est avant tout due au GPU Iris, si bien que le processeur bénéficie peu de ce gain d’enveloppe thermique, mis à part pour le bref Turbo Boost initial.
Pour le streaming 4K et le HTPC (PC de salon), une ZBox ou un NUC7 moins chers avec des i5-8250U ou i7-8550U suffiront. Le NUC8 profitera à ceux qui exploiteront le port Thunderbolt 3, et qui pousseront la carte Iris Plus à son maximum.
L’intégralité de cette critique est disponible en anglais en suivant ce lien.
Price comparison
