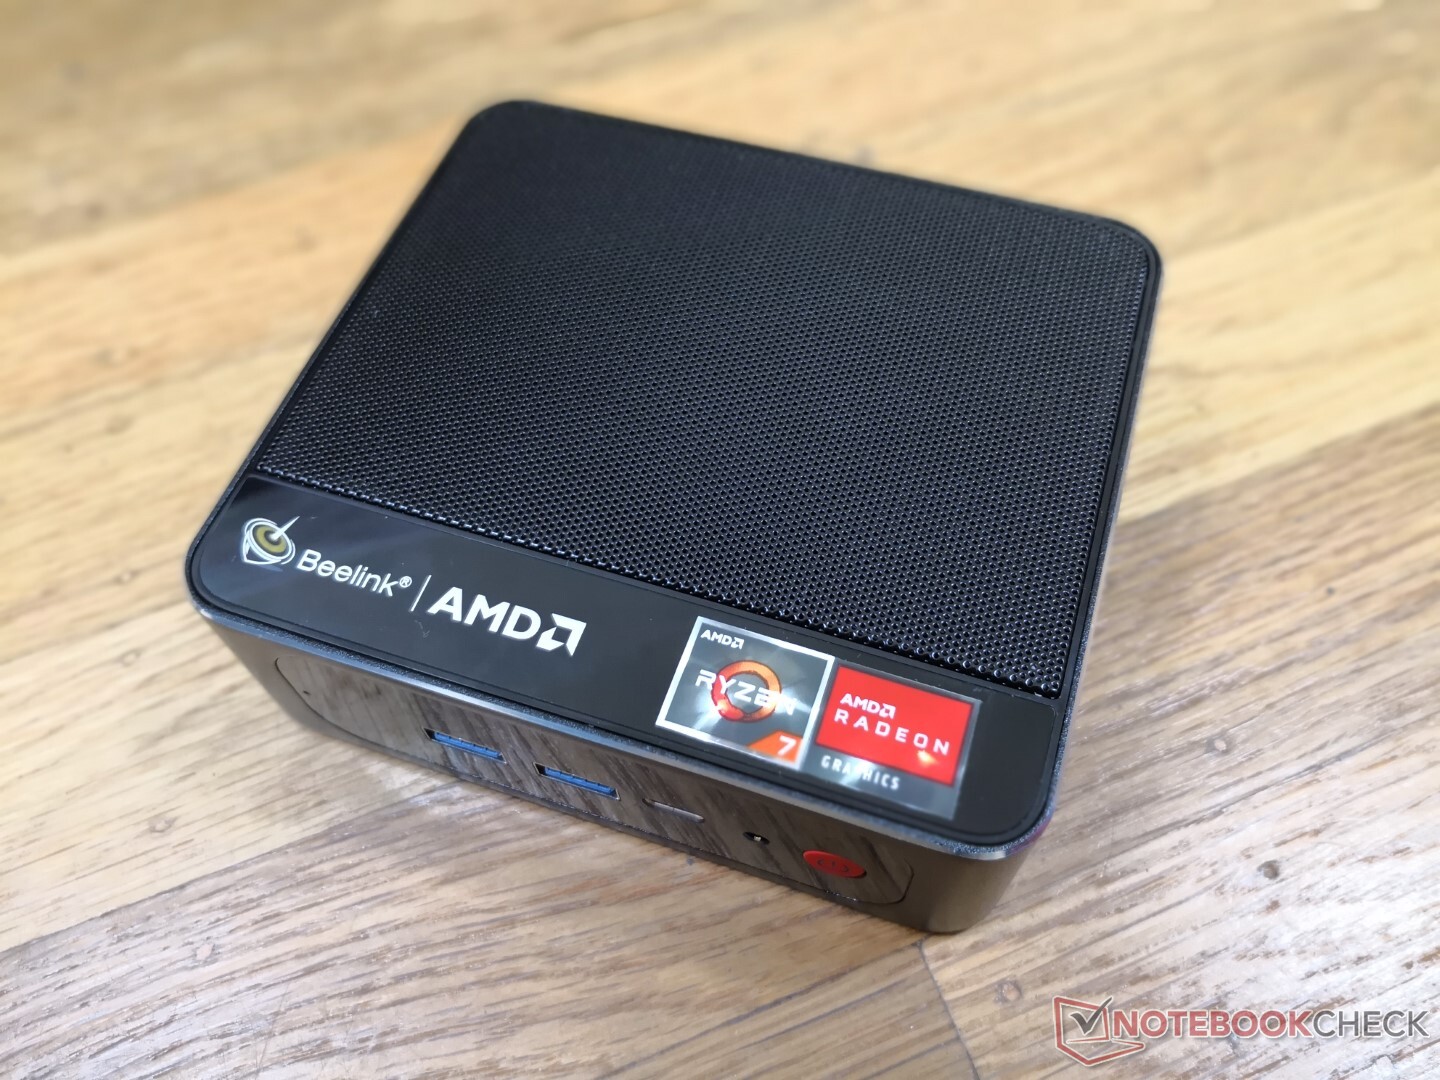
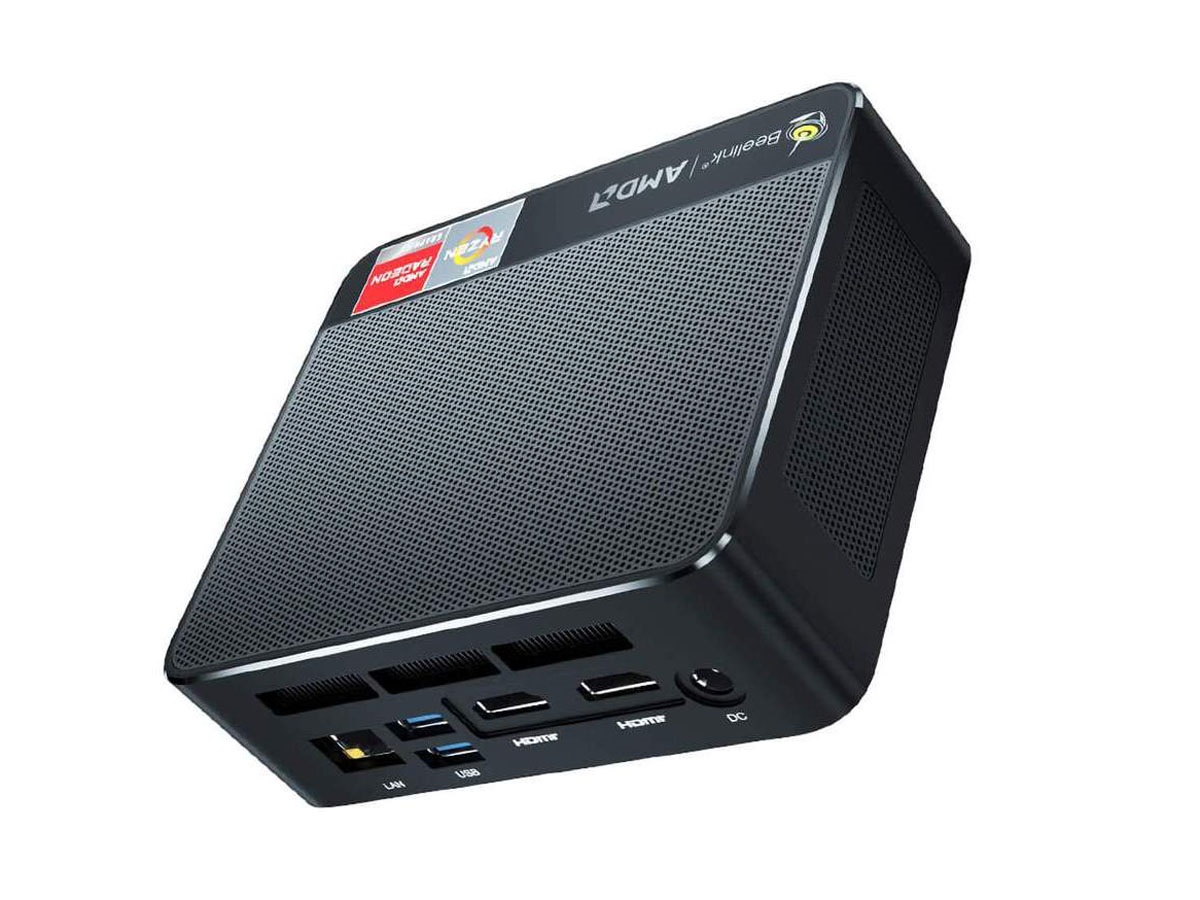
Test du mini-PC Beelink SER3 : l'ancien Ryzen 7 3750H a son utilité

Beelink propose plusieurs mini-PC alimentés par d'anciens processeurs Intel et AMD comme alternatives moins chères aux nouveaux NUC Intel alimentés par la dernière génération de processeurs. Presque toutes les applications HTPC, de la navigation web au streaming vidéo 4K, ne nécessitent pas les processeurs les plus rapides et les plus performants, ce qui signifie que la plupart des utilisateurs peuvent s'en sortir avec du matériel moins cher.
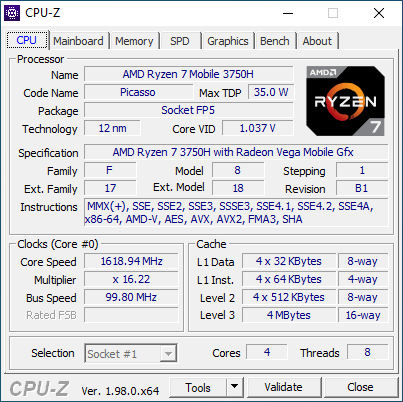
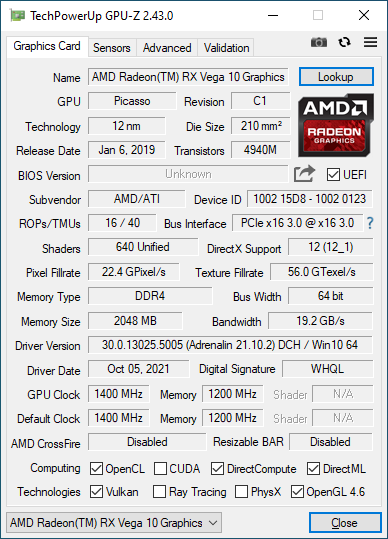
Notre unité de test Beelink SER3 est équipée du processeur AMD Zen+, vieux de deux ans Ryzen 7 3750H Qui a depuis été remplacé par les séries plus récentes Zen 2 4000H et Zen 3 5000H.
Plus de tests Beelink
No, or more than one (0) Rating for the given SpecsID 326081 found
Potential Competitors in Comparison
Note | Date | Modèle | Poids | Épaisseur | Taille | Résolution | Prix |
|---|---|---|---|---|---|---|---|
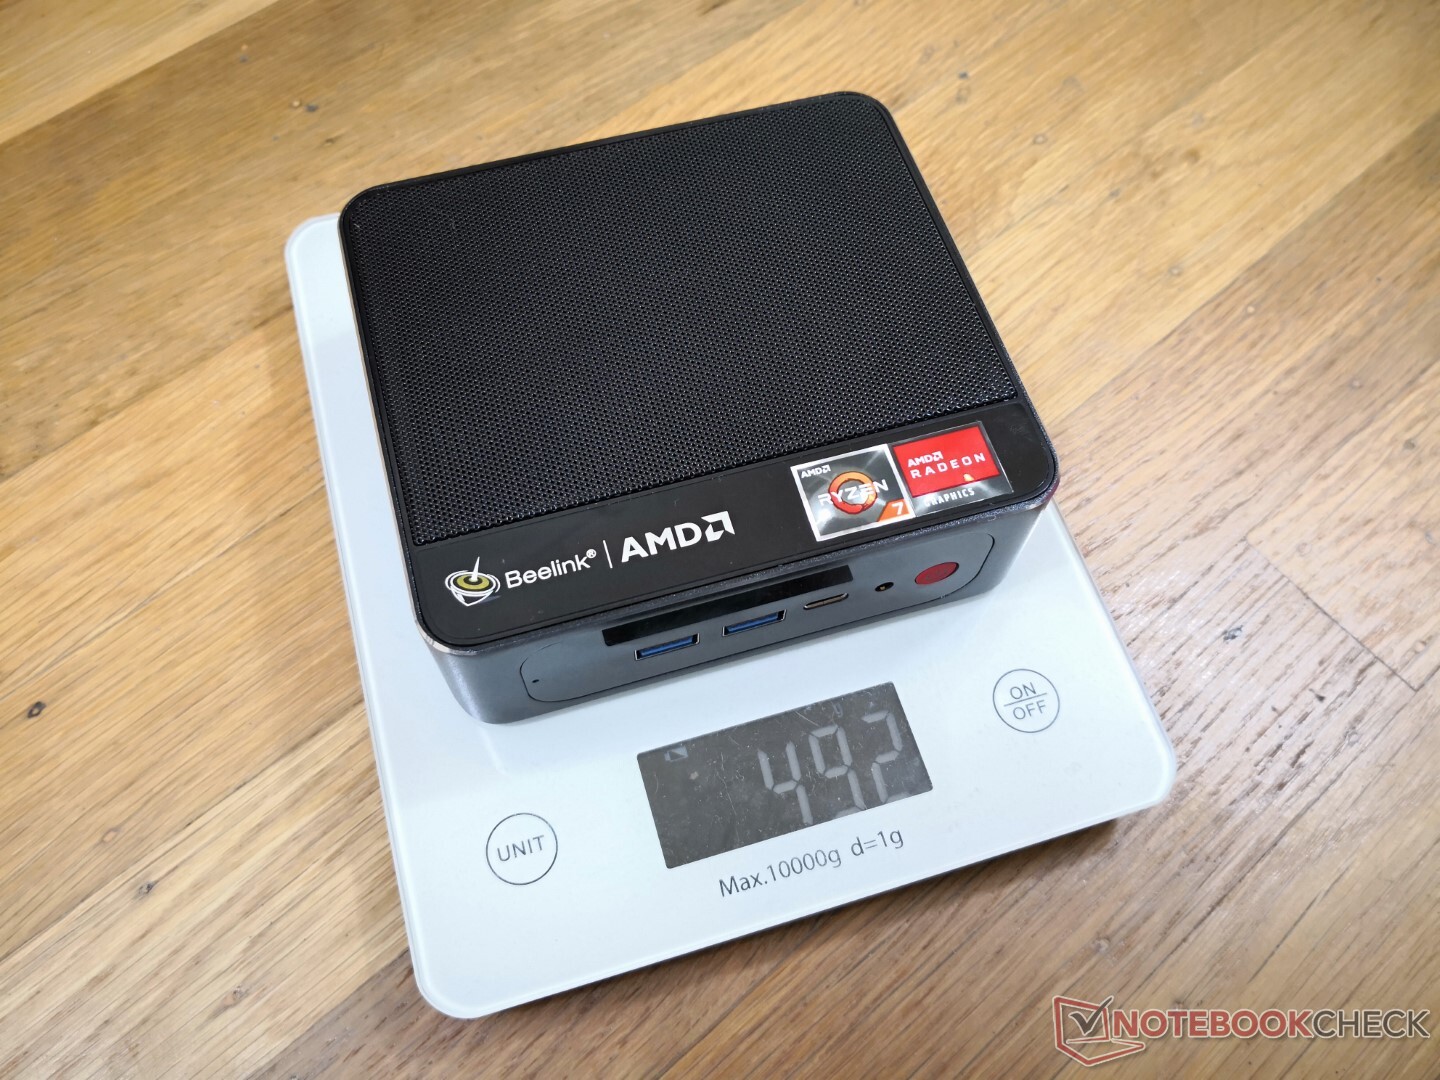
v (old) | 11/21 | Beelink SER3 R7 3750H, Vega 10 | 492 g | 40 mm | x | ||
v (old) | Beelink SEi10 i3-1005G1, UHD Graphics G1 (Ice Lake 32 EU) | 350 g | 41 mm | x | |||
v (old) | 11/18 | Intel NUC8i7BE i7-8559U, Iris Plus Graphics 655 | 683 g | 51 mm | x | ||
v (old) | 03/21 | GMK NucBox 2 i5-8259U, Iris Plus Graphics 655 | 430 g | 50 mm | x | ||
v (old) | Zotac ZBox MI643 i5-10210U, UHD Graphics 620 | 550 g | 28.5 mm | x | |||
v (old) | 04/21 | Intel NUC11TNKi5 i5-1135G7, Iris Xe G7 80EUs | 504 g | 37 mm | x |
Cas
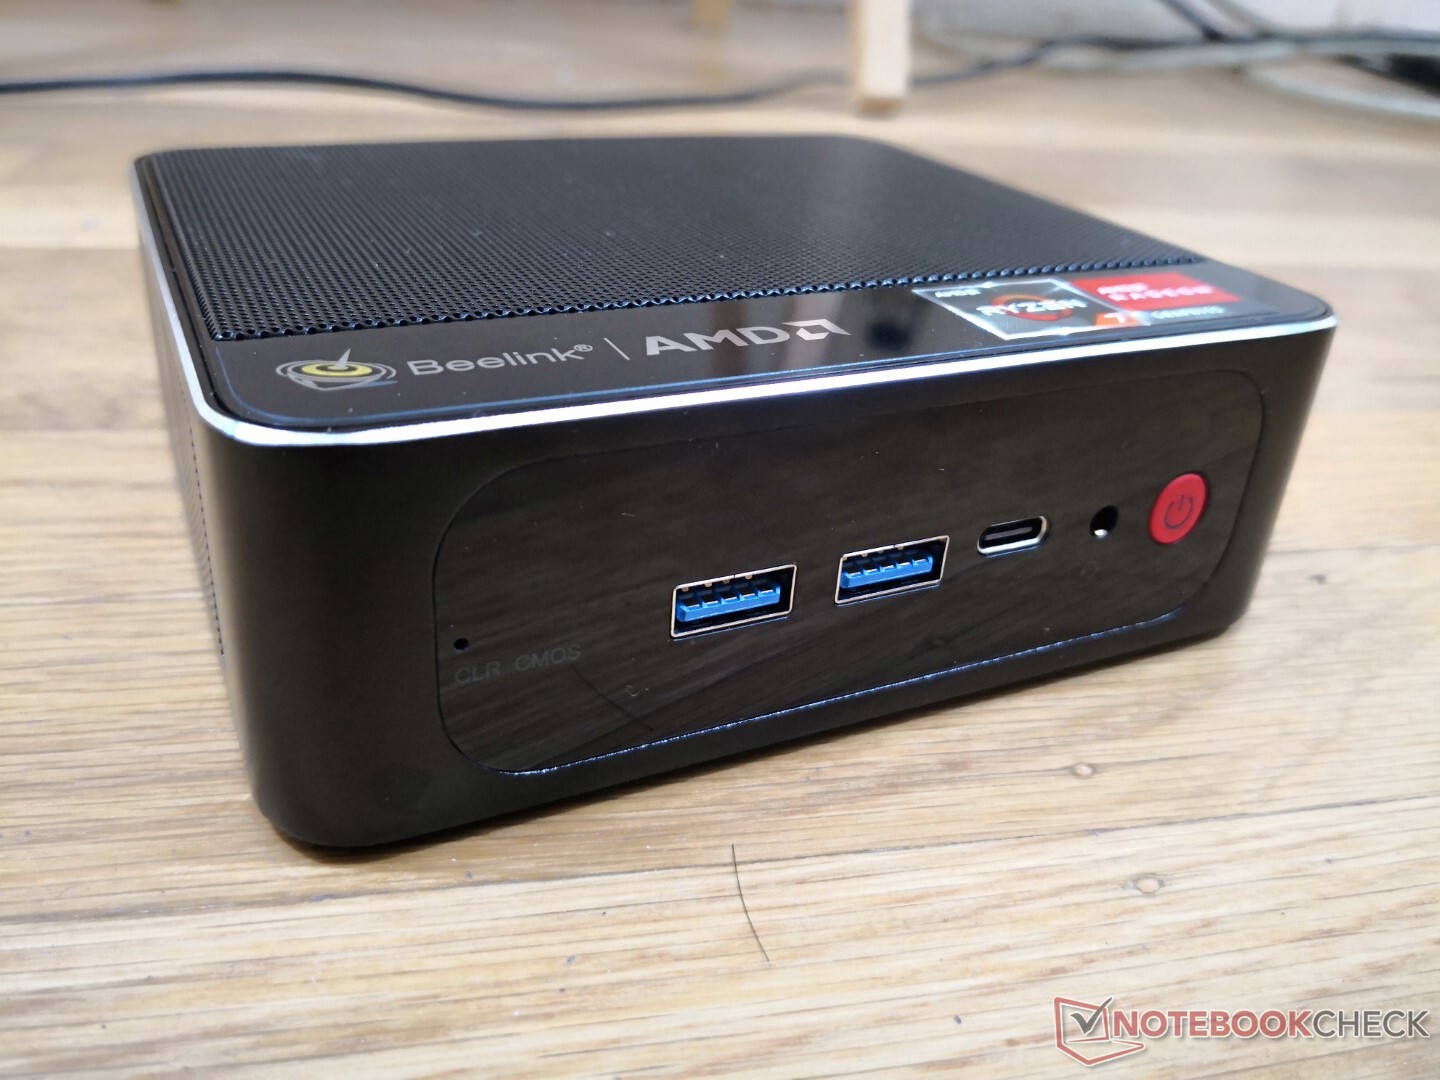
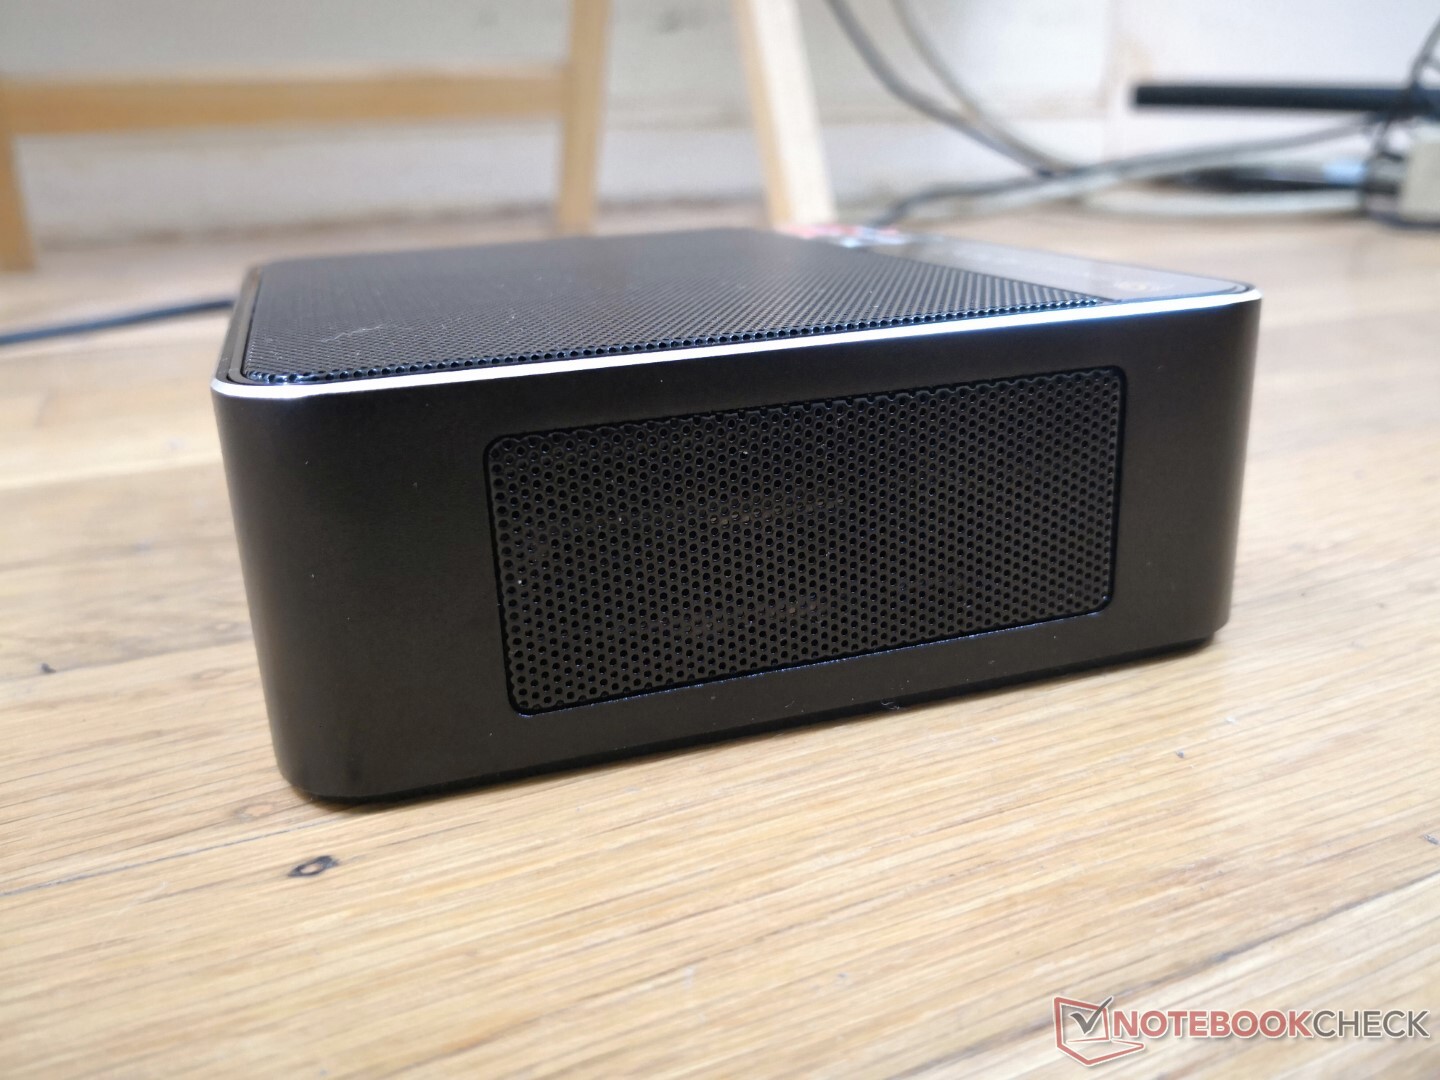
Le châssis est principalement en métal mat avec un peu de plastique brillant sur le devant et une partie du dessus. Les premières impressions sont solides bien que pas aussi rigides qu'un Intel NUC qui utilise des matériaux métalliques plus épais et plus lourds.
Connectivité
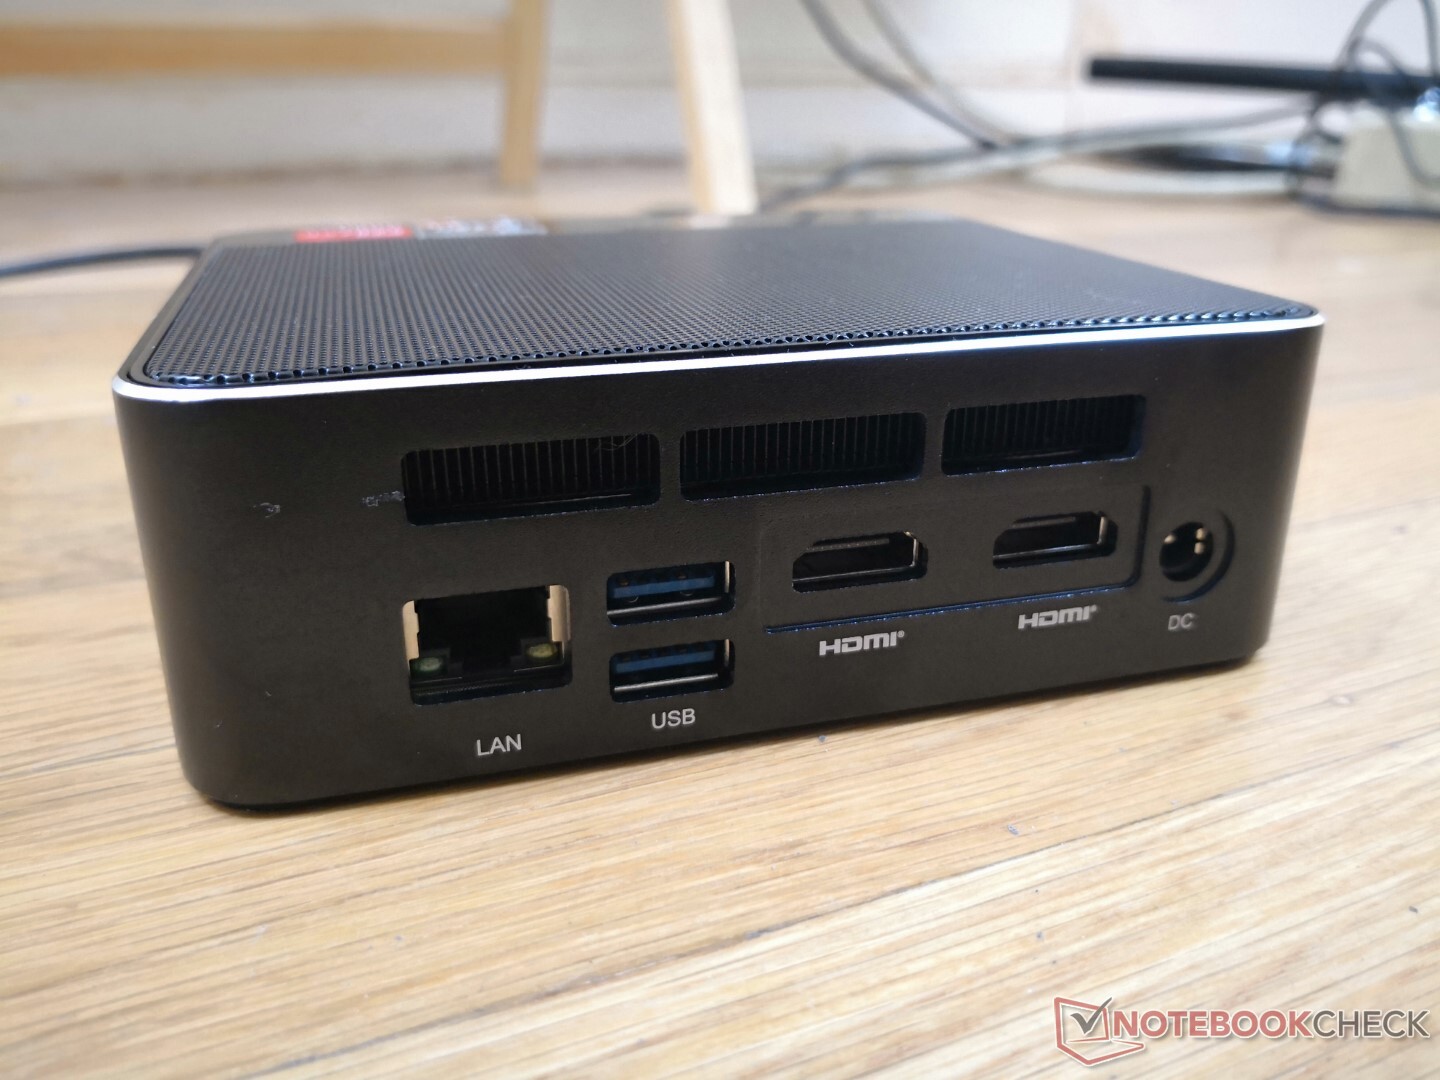
Les options de port sont exactement les mêmes que sur le Beelink SEi10. Cependant, gardez à l'esprit qu'il n'y a pas de Thunderbolt sur le SER3 puisque son processeur AMD ne prend pas en charge l'interface de manière native
Le port USB-C prend en charge la sortie DisplayPort, mais elle ne fonctionnerait étrangement qu'avec certains de nos moniteurs externes, et pas tous.
Communication
| Networking | |
| iperf3 transmit AX12 | |
| Intel NUC11TNKi5 | |
| Beelink SEi10 | |
| Intel NUC8i7BE | |
| GMK NucBox 2 | |
| Beelink SER3 | |
| Zotac ZBox MI643 | |
| iperf3 receive AX12 | |
| Intel NUC11TNKi5 | |
| Beelink SEi10 | |
| Beelink SER3 | |
| GMK NucBox 2 | |
| Intel NUC8i7BE | |
| Zotac ZBox MI643 | |
Maintenance
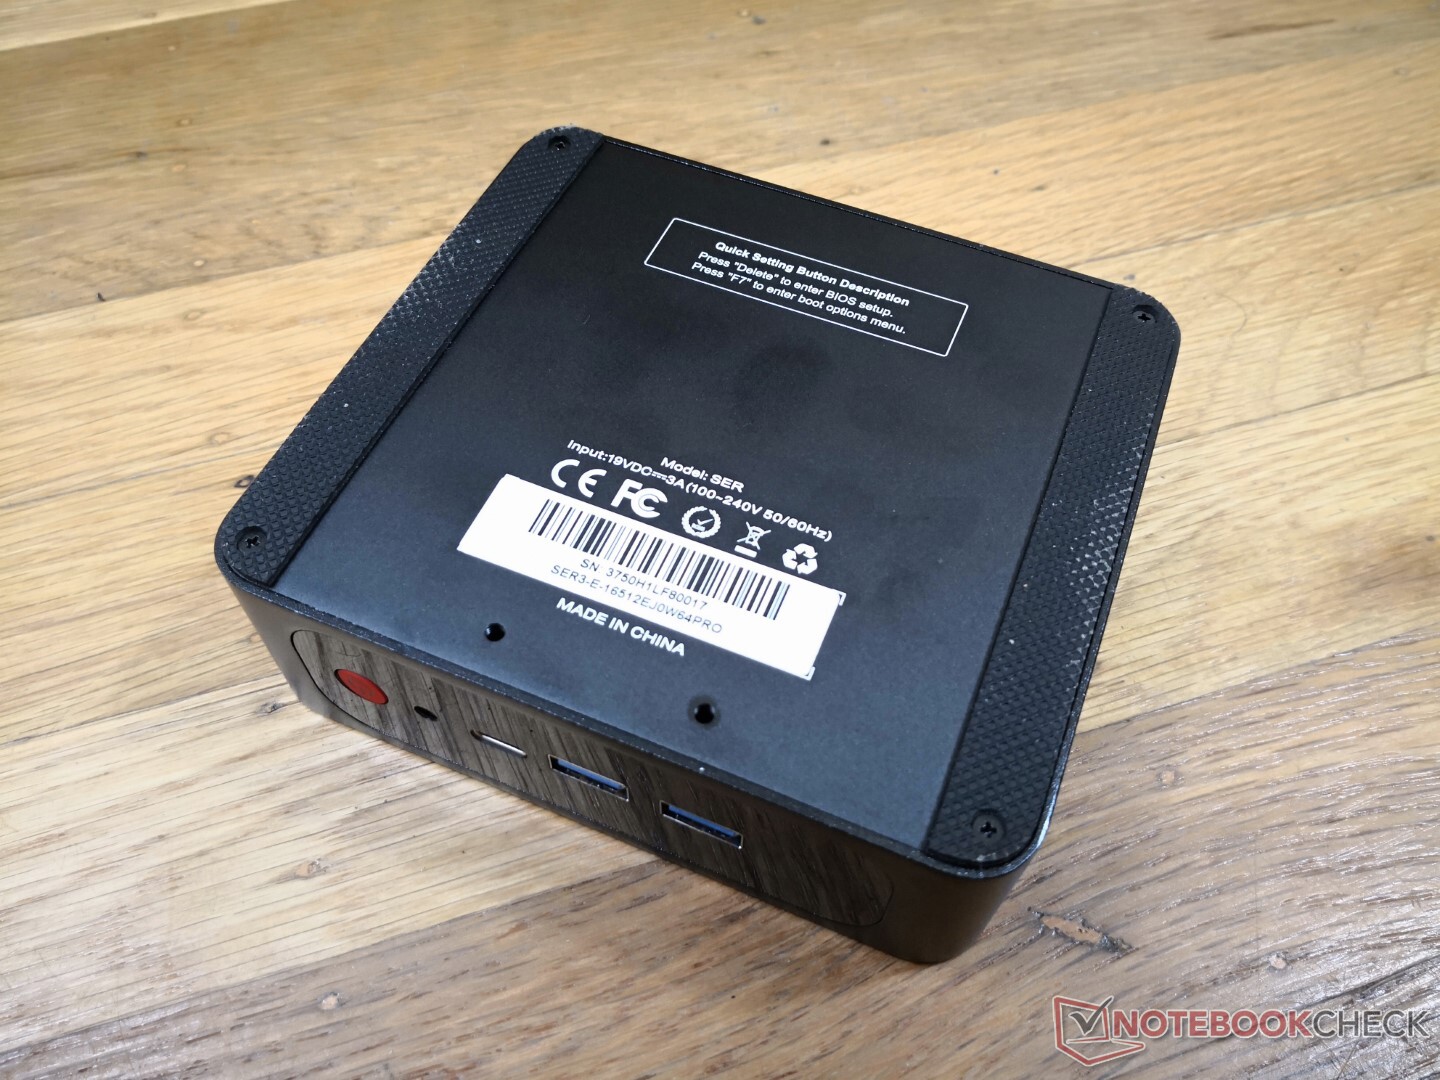
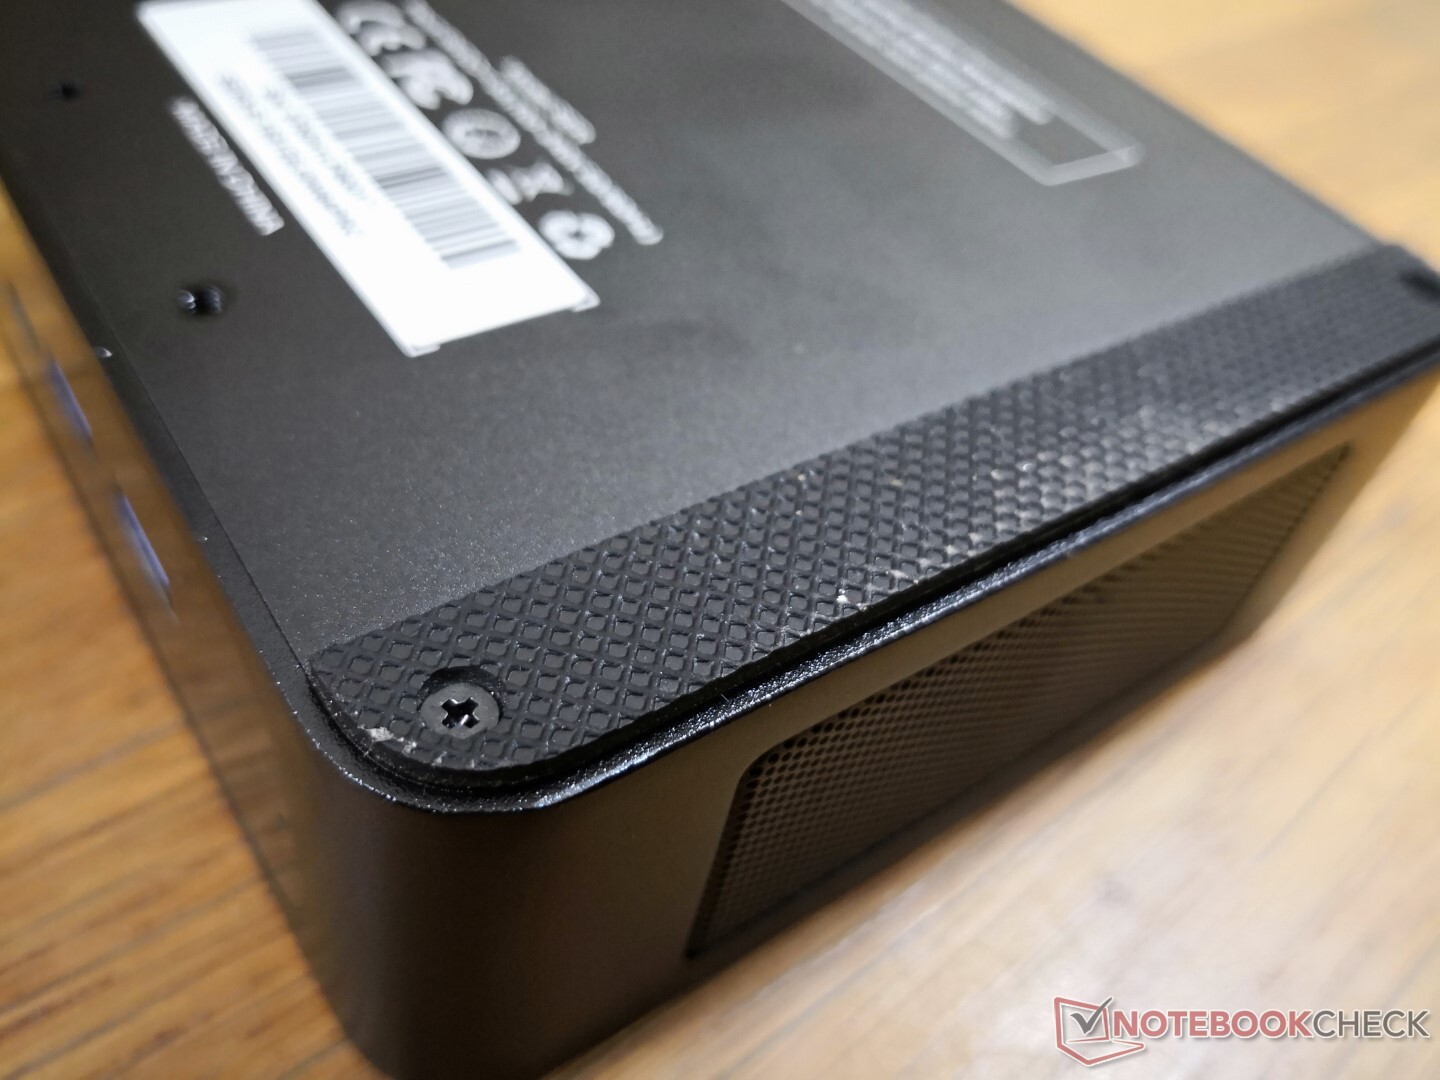
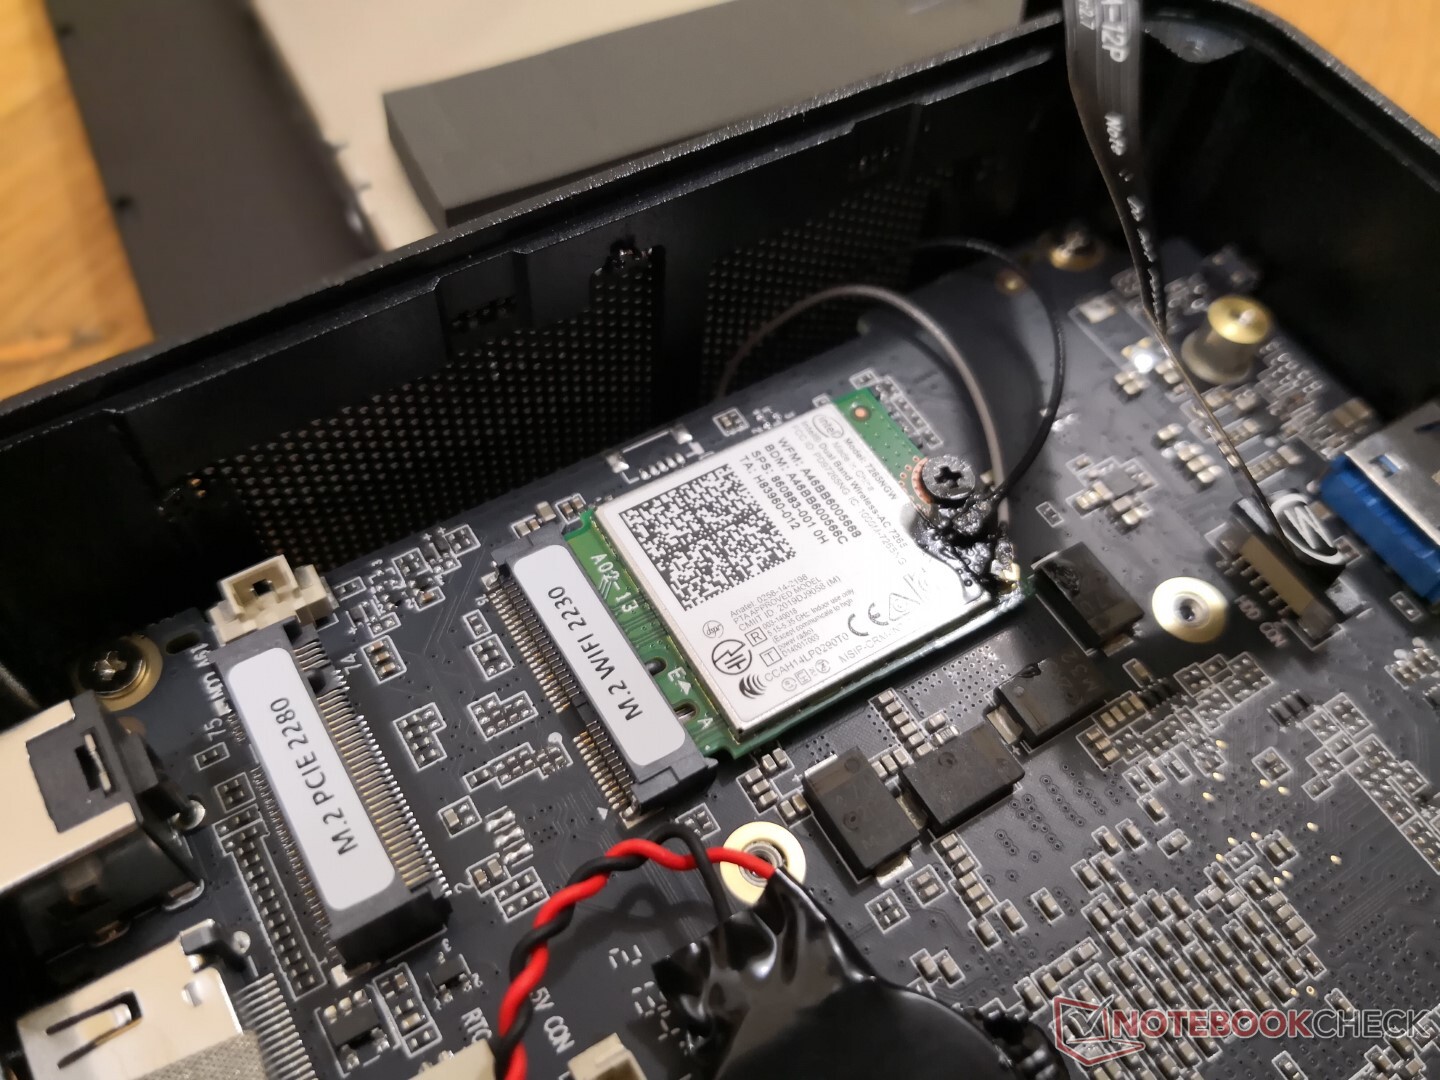
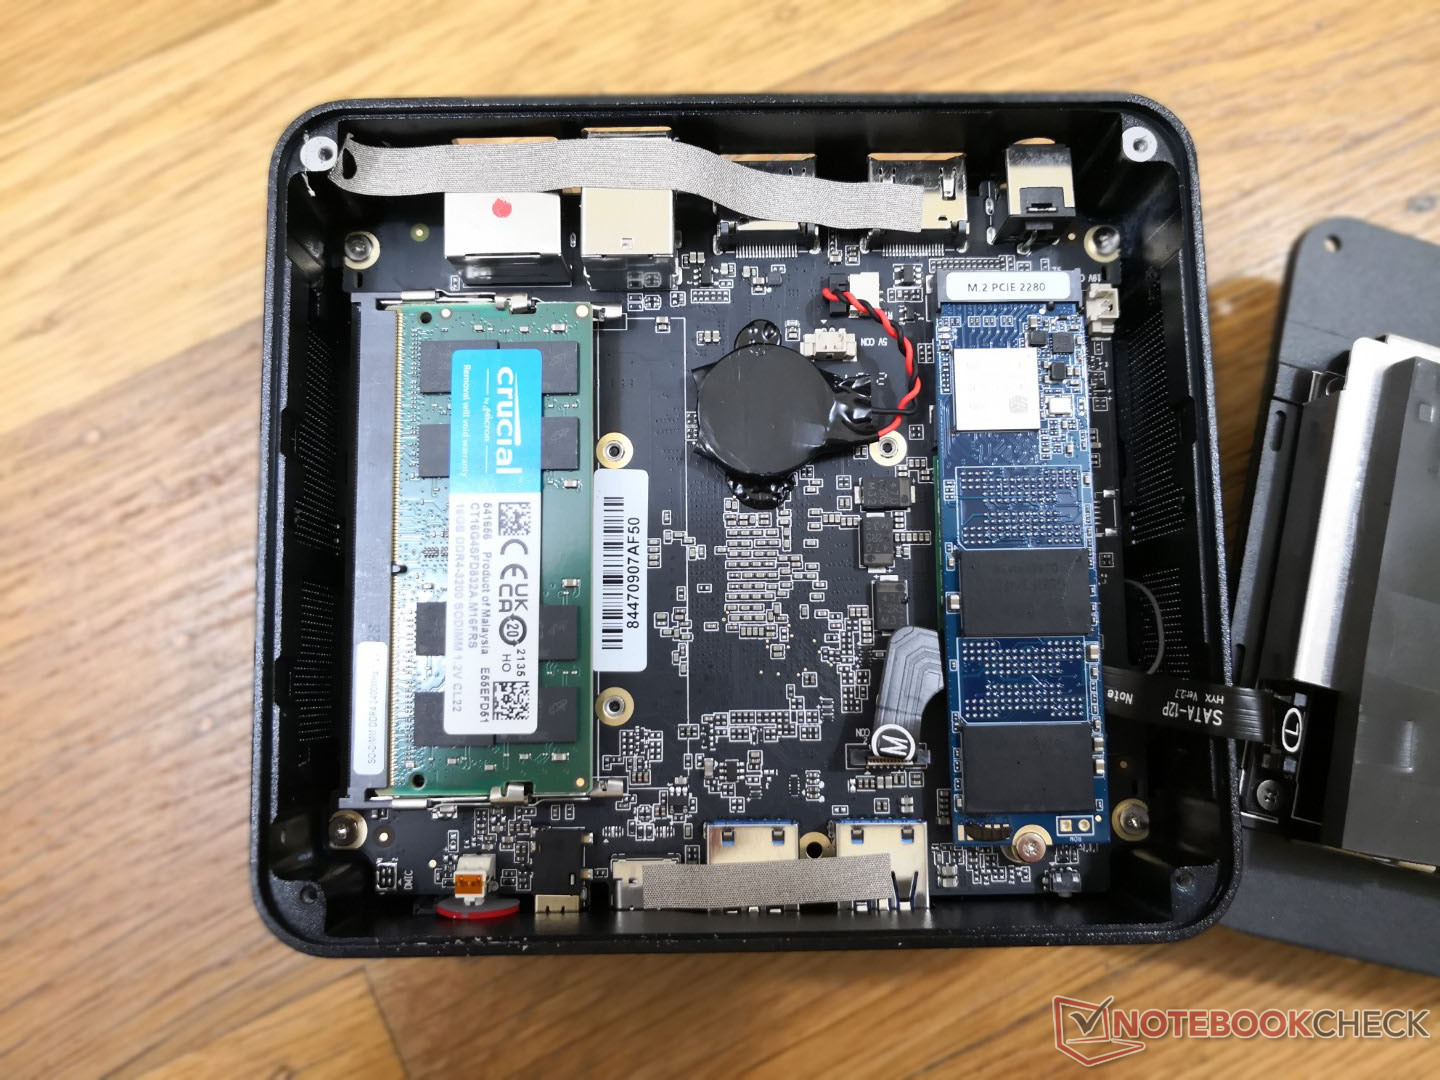
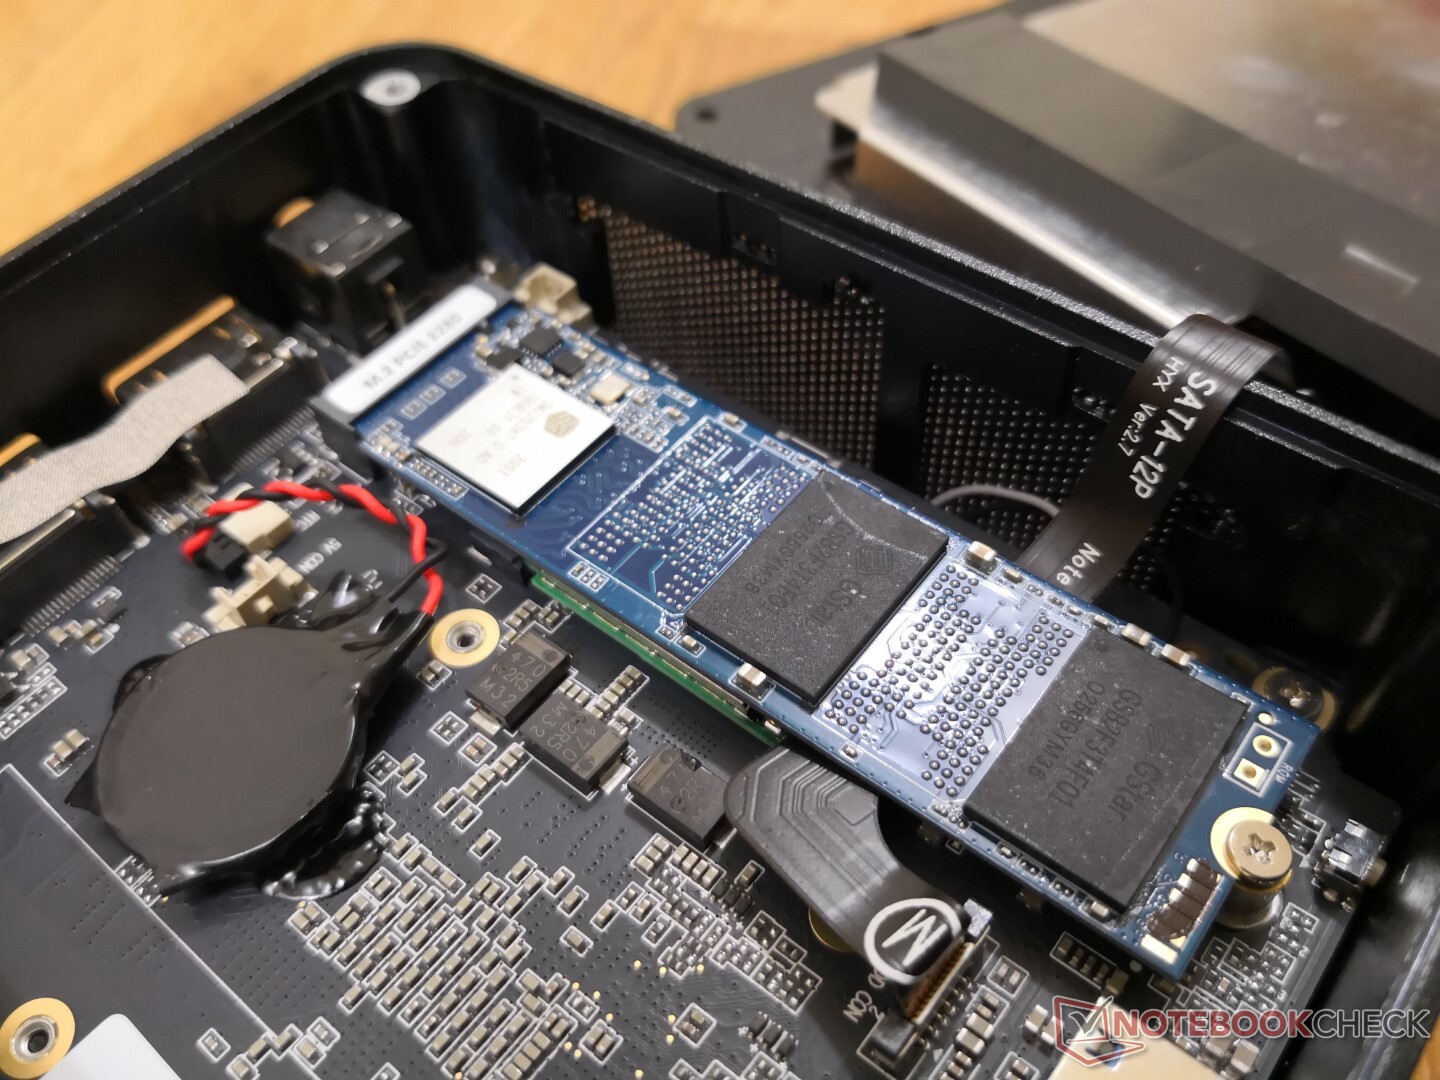
Le panneau inférieur peut être facilement retiré à l'aide d'un simple tournevis Philips pour révéler un module WLAN amovible, un SSD NVMe M.2 2280 amovible et deux emplacements SODIMM.
Accessoires et garantie
L'emballage de détail comprend deux câbles HDMI courts, un support de montage de 50 mm ou 100 mm et des vis supplémentaires, en plus du manuel et de l'adaptateur secteur habituels. La garantie du fabricant est d'un an
Performance
Conditions d'essai
Notre appareil a été réglé sur le mode Performance avant d'exécuter les benchmarks ci-dessous pour obtenir les meilleurs résultats possibles.
Processeur
Les performances brutes du CPU sont comparables à celles duCore i5-8259U dans le GMK NucBox 2 concurrent. Il n'atteint pas tout à fait les performances des nouveaux processeurs Zen 2 ou Tiger Lake U-series comme le Ryzen 7 5700U ou Core i5-1135G7 que l'on trouve couramment sur les derniers Ultrabooks. Les performances en cas de charge élevée pendant de longues périodes sont néanmoins cohérentes et ne présentent pas de problèmes majeurs d'accélération.
Cinebench R15 Multi Loop
Cinebench R23: Multi Core | Single Core
Cinebench R20: CPU (Multi Core) | CPU (Single Core)
Cinebench R15: CPU Multi 64Bit | CPU Single 64Bit
Blender: v2.79 BMW27 CPU
7-Zip 18.03: 7z b 4 | 7z b 4 -mmt1
Geekbench 5.5: Multi-Core | Single-Core
HWBOT x265 Benchmark v2.2: 4k Preset
LibreOffice : 20 Documents To PDF
R Benchmark 2.5: Overall mean
| CPU Performance rating | |
| Intel NUC11TNKi5 | |
| Intel NUC8i7BE -3! | |
| GMK NucBox 2 | |
| Moyenne AMD Ryzen 7 3750H | |
| Zotac ZBox MI643 -2! | |
| Beelink SER3 -2! | |
| Beelink SEi10 -2! | |
| Cinebench R23 / Multi Core | |
| Intel NUC11TNKi5 | |
| Beelink SER3 | |
| Moyenne AMD Ryzen 7 3750H (n=1) | |
| GMK NucBox 2 | |
| Cinebench R23 / Single Core | |
| Intel NUC11TNKi5 | |
| GMK NucBox 2 | |
| Beelink SER3 | |
| Moyenne AMD Ryzen 7 3750H (n=1) | |
| Cinebench R20 / CPU (Multi Core) | |
| Intel NUC11TNKi5 | |
| Intel NUC8i7BE | |
| Moyenne AMD Ryzen 7 3750H (1514 - 1825, n=4) | |
| Beelink SER3 | |
| GMK NucBox 2 | |
| Zotac ZBox MI643 | |
| Beelink SEi10 | |
| Cinebench R20 / CPU (Single Core) | |
| Intel NUC11TNKi5 | |
| Intel NUC8i7BE | |
| Zotac ZBox MI643 | |
| Beelink SEi10 | |
| GMK NucBox 2 | |
| Beelink SER3 | |
| Moyenne AMD Ryzen 7 3750H (340 - 386, n=4) | |
| Cinebench R15 / CPU Multi 64Bit | |
| Intel NUC8i7BE | |
| Intel NUC11TNKi5 | |
| Moyenne AMD Ryzen 7 3750H (672 - 805, n=7) | |
| Beelink SER3 | |
| GMK NucBox 2 | |
| Zotac ZBox MI643 | |
| Beelink SEi10 | |
| Cinebench R15 / CPU Single 64Bit | |
| Intel NUC11TNKi5 | |
| Intel NUC8i7BE | |
| Zotac ZBox MI643 | |
| Beelink SEi10 | |
| GMK NucBox 2 | |
| Beelink SER3 | |
| Moyenne AMD Ryzen 7 3750H (135 - 157, n=7) | |
| Blender / v2.79 BMW27 CPU | |
| Beelink SEi10 | |
| Zotac ZBox MI643 | |
| GMK NucBox 2 | |
| Intel NUC8i7BE | |
| Intel NUC8i7BE | |
| Beelink SER3 | |
| Moyenne AMD Ryzen 7 3750H (584 - 672, n=3) | |
| Intel NUC11TNKi5 | |
| 7-Zip 18.03 / 7z b 4 | |
| Intel NUC8i7BE | |
| Intel NUC8i7BE | |
| Intel NUC11TNKi5 | |
| GMK NucBox 2 | |
| Moyenne AMD Ryzen 7 3750H (17077 - 19187, n=3) | |
| Beelink SER3 | |
| Zotac ZBox MI643 | |
| Beelink SEi10 | |
| 7-Zip 18.03 / 7z b 4 -mmt1 | |
| Intel NUC8i7BE | |
| Intel NUC8i7BE | |
| Intel NUC11TNKi5 | |
| Zotac ZBox MI643 | |
| Beelink SEi10 | |
| GMK NucBox 2 | |
| Beelink SER3 | |
| Moyenne AMD Ryzen 7 3750H (3511 - 3752, n=3) | |
| Geekbench 5.5 / Multi-Core | |
| Intel NUC11TNKi5 | |
| Zotac ZBox MI643 | |
| Intel NUC8i7BE | |
| Moyenne AMD Ryzen 7 3750H (n=1) | |
| GMK NucBox 2 | |
| Beelink SEi10 | |
| Geekbench 5.5 / Single-Core | |
| Intel NUC11TNKi5 | |
| Zotac ZBox MI643 | |
| Beelink SEi10 | |
| GMK NucBox 2 | |
| Moyenne AMD Ryzen 7 3750H (n=1) | |
| Intel NUC8i7BE | |
| HWBOT x265 Benchmark v2.2 / 4k Preset | |
| Intel NUC11TNKi5 | |
| Intel NUC8i7BE | |
| Intel NUC8i7BE | |
| GMK NucBox 2 | |
| Moyenne AMD Ryzen 7 3750H (4.14 - 4.4, n=3) | |
| Zotac ZBox MI643 | |
| Beelink SER3 | |
| Beelink SEi10 | |
| LibreOffice / 20 Documents To PDF | |
| Beelink SER3 | |
| Moyenne AMD Ryzen 7 3750H (n=1) | |
| GMK NucBox 2 | |
| Zotac ZBox MI643 | |
| Beelink SEi10 | |
| Intel NUC11TNKi5 | |
| R Benchmark 2.5 / Overall mean | |
| GMK NucBox 2 | |
| Beelink SEi10 | |
| Beelink SER3 | |
| Moyenne AMD Ryzen 7 3750H (0.69 - 0.723, n=2) | |
| Zotac ZBox MI643 | |
| Intel NUC8i7BE | |
| Intel NUC11TNKi5 | |
* ... Moindre est la valeur, meilleures sont les performances
AIDA64: FP32 Ray-Trace | FPU Julia | CPU SHA3 | CPU Queen | FPU SinJulia | FPU Mandel | CPU AES | CPU ZLib | FP64 Ray-Trace | CPU PhotoWorxx
| Performance rating | |
| Intel NUC11TNKi5 | |
| Intel NUC8i7BE -1! | |
| GMK NucBox 2 | |
| Moyenne AMD Ryzen 7 3750H | |
| Zotac ZBox MI643 | |
| Beelink SER3 | |
| AIDA64 / FP32 Ray-Trace | |
| Intel NUC11TNKi5 | |
| Intel NUC8i7BE | |
| GMK NucBox 2 | |
| Zotac ZBox MI643 | |
| Moyenne AMD Ryzen 7 3750H (3338 - 3668, n=2) | |
| Beelink SER3 | |
| AIDA64 / FPU Julia | |
| Intel NUC11TNKi5 | |
| Intel NUC8i7BE | |
| GMK NucBox 2 | |
| Zotac ZBox MI643 | |
| Moyenne AMD Ryzen 7 3750H (16912 - 19132, n=2) | |
| Beelink SER3 | |
| AIDA64 / CPU SHA3 | |
| Intel NUC11TNKi5 | |
| GMK NucBox 2 | |
| Moyenne AMD Ryzen 7 3750H (897 - 1001, n=2) | |
| Zotac ZBox MI643 | |
| Beelink SER3 | |
| AIDA64 / CPU Queen | |
| Intel NUC8i7BE | |
| Zotac ZBox MI643 | |
| Moyenne AMD Ryzen 7 3750H (43632 - 50328, n=2) | |
| Intel NUC11TNKi5 | |
| Beelink SER3 | |
| GMK NucBox 2 | |
| AIDA64 / FPU SinJulia | |
| Moyenne AMD Ryzen 7 3750H (5639 - 6478, n=2) | |
| Beelink SER3 | |
| Intel NUC8i7BE | |
| Intel NUC11TNKi5 | |
| GMK NucBox 2 | |
| Zotac ZBox MI643 | |
| AIDA64 / FPU Mandel | |
| Intel NUC11TNKi5 | |
| Intel NUC8i7BE | |
| GMK NucBox 2 | |
| Zotac ZBox MI643 | |
| Moyenne AMD Ryzen 7 3750H (8846 - 9928, n=2) | |
| Beelink SER3 | |
| AIDA64 / CPU AES | |
| Intel NUC11TNKi5 | |
| Moyenne AMD Ryzen 7 3750H (28977 - 32668, n=2) | |
| Beelink SER3 | |
| Intel NUC8i7BE | |
| GMK NucBox 2 | |
| Zotac ZBox MI643 | |
| AIDA64 / CPU ZLib | |
| Intel NUC11TNKi5 | |
| Intel NUC8i7BE | |
| Moyenne AMD Ryzen 7 3750H (313 - 350, n=2) | |
| Beelink SER3 | |
| GMK NucBox 2 | |
| Zotac ZBox MI643 | |
| AIDA64 / FP64 Ray-Trace | |
| Intel NUC11TNKi5 | |
| Intel NUC8i7BE | |
| GMK NucBox 2 | |
| Zotac ZBox MI643 | |
| Moyenne AMD Ryzen 7 3750H (1758 - 1935, n=2) | |
| Beelink SER3 | |
| AIDA64 / CPU PhotoWorxx | |
| Zotac ZBox MI643 | |
| Intel NUC8i7BE | |
| Intel NUC11TNKi5 | |
| Moyenne AMD Ryzen 7 3750H (10338 - 18898, n=2) | |
| Beelink SER3 | |
| GMK NucBox 2 | |
Performance du système
| PCMark 10 / Score | |
| Intel NUC8i7BE | |
| Intel NUC11TNKi5 | |
| Zotac ZBox MI643 | |
| GMK NucBox 2 | |
| Beelink SER3 | |
| Moyenne AMD Ryzen 7 3750H, AMD Radeon RX Vega 10 (n=1) | |
| Beelink SEi10 | |
| PCMark 10 / Essentials | |
| Zotac ZBox MI643 | |
| Intel NUC11TNKi5 | |
| Intel NUC8i7BE | |
| GMK NucBox 2 | |
| Beelink SEi10 | |
| Beelink SER3 | |
| Moyenne AMD Ryzen 7 3750H, AMD Radeon RX Vega 10 (n=1) | |
| PCMark 10 / Productivity | |
| Intel NUC8i7BE | |
| Zotac ZBox MI643 | |
| GMK NucBox 2 | |
| Intel NUC11TNKi5 | |
| Beelink SER3 | |
| Moyenne AMD Ryzen 7 3750H, AMD Radeon RX Vega 10 (n=1) | |
| Beelink SEi10 | |
| PCMark 10 / Digital Content Creation | |
| Intel NUC11TNKi5 | |
| Intel NUC8i7BE | |
| GMK NucBox 2 | |
| Beelink SER3 | |
| Moyenne AMD Ryzen 7 3750H, AMD Radeon RX Vega 10 (n=1) | |
| Zotac ZBox MI643 | |
| Beelink SEi10 | |
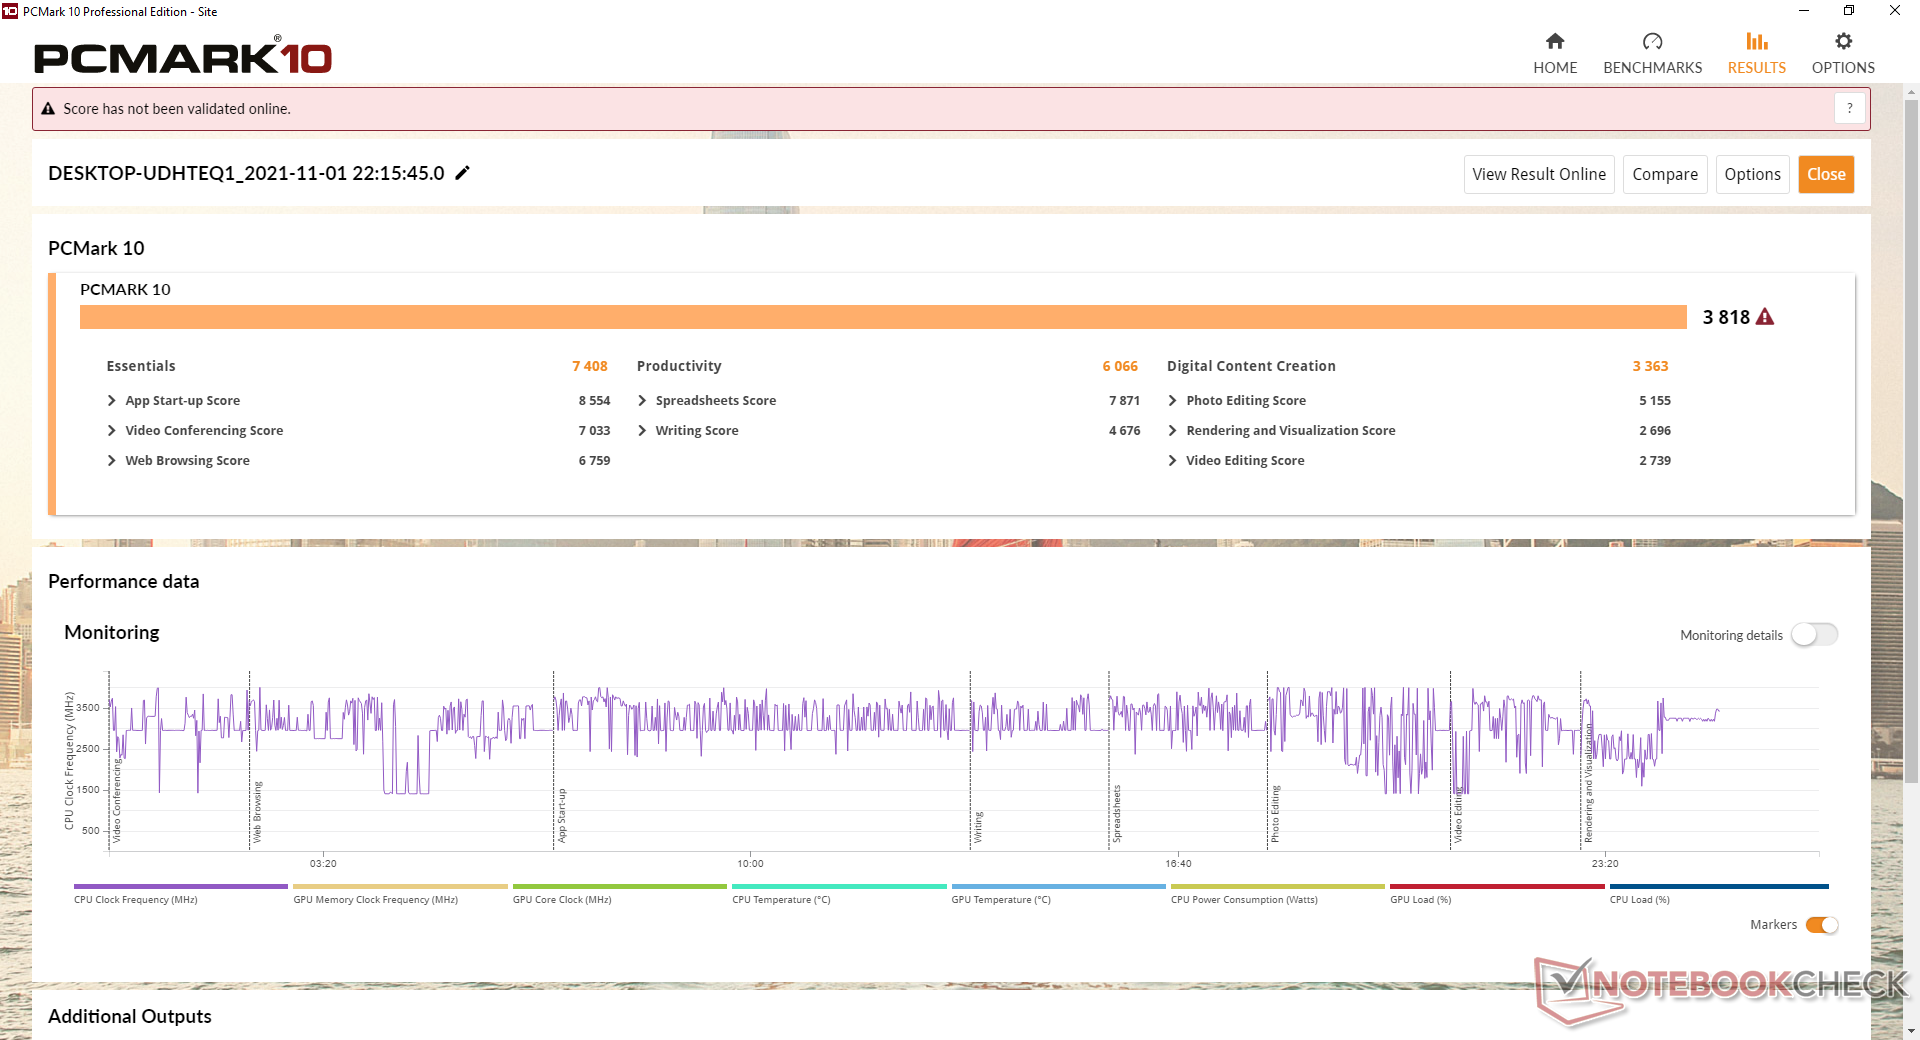
| PCMark 10 Score | 3818 points | |
Aide | ||
| AIDA64 / Memory Copy | |
| Intel NUC8i7BE | |
| GMK NucBox 2 | |
| Zotac ZBox MI643 | |
| Moyenne AMD Ryzen 7 3750H (16249 - 30963, n=2) | |
| Intel NUC11TNKi5 | |
| Beelink SER3 | |
| AIDA64 / Memory Read | |
| Intel NUC8i7BE | |
| GMK NucBox 2 | |
| Zotac ZBox MI643 | |
| Moyenne AMD Ryzen 7 3750H (18268 - 35218, n=2) | |
| Intel NUC11TNKi5 | |
| Beelink SER3 | |
| AIDA64 / Memory Write | |
| Intel NUC8i7BE | |
| GMK NucBox 2 | |
| Zotac ZBox MI643 | |
| Moyenne AMD Ryzen 7 3750H (18455 - 35988, n=2) | |
| Intel NUC11TNKi5 | |
| Beelink SER3 | |
| AIDA64 / Memory Latency | |
| Moyenne AMD Ryzen 7 3750H (95.8 - 118, n=2) | |
| Beelink SER3 | |
| Intel NUC11TNKi5 | |
| Zotac ZBox MI643 | |
| GMK NucBox 2 | |
| Intel NUC8i7BE | |
* ... Moindre est la valeur, meilleures sont les performances
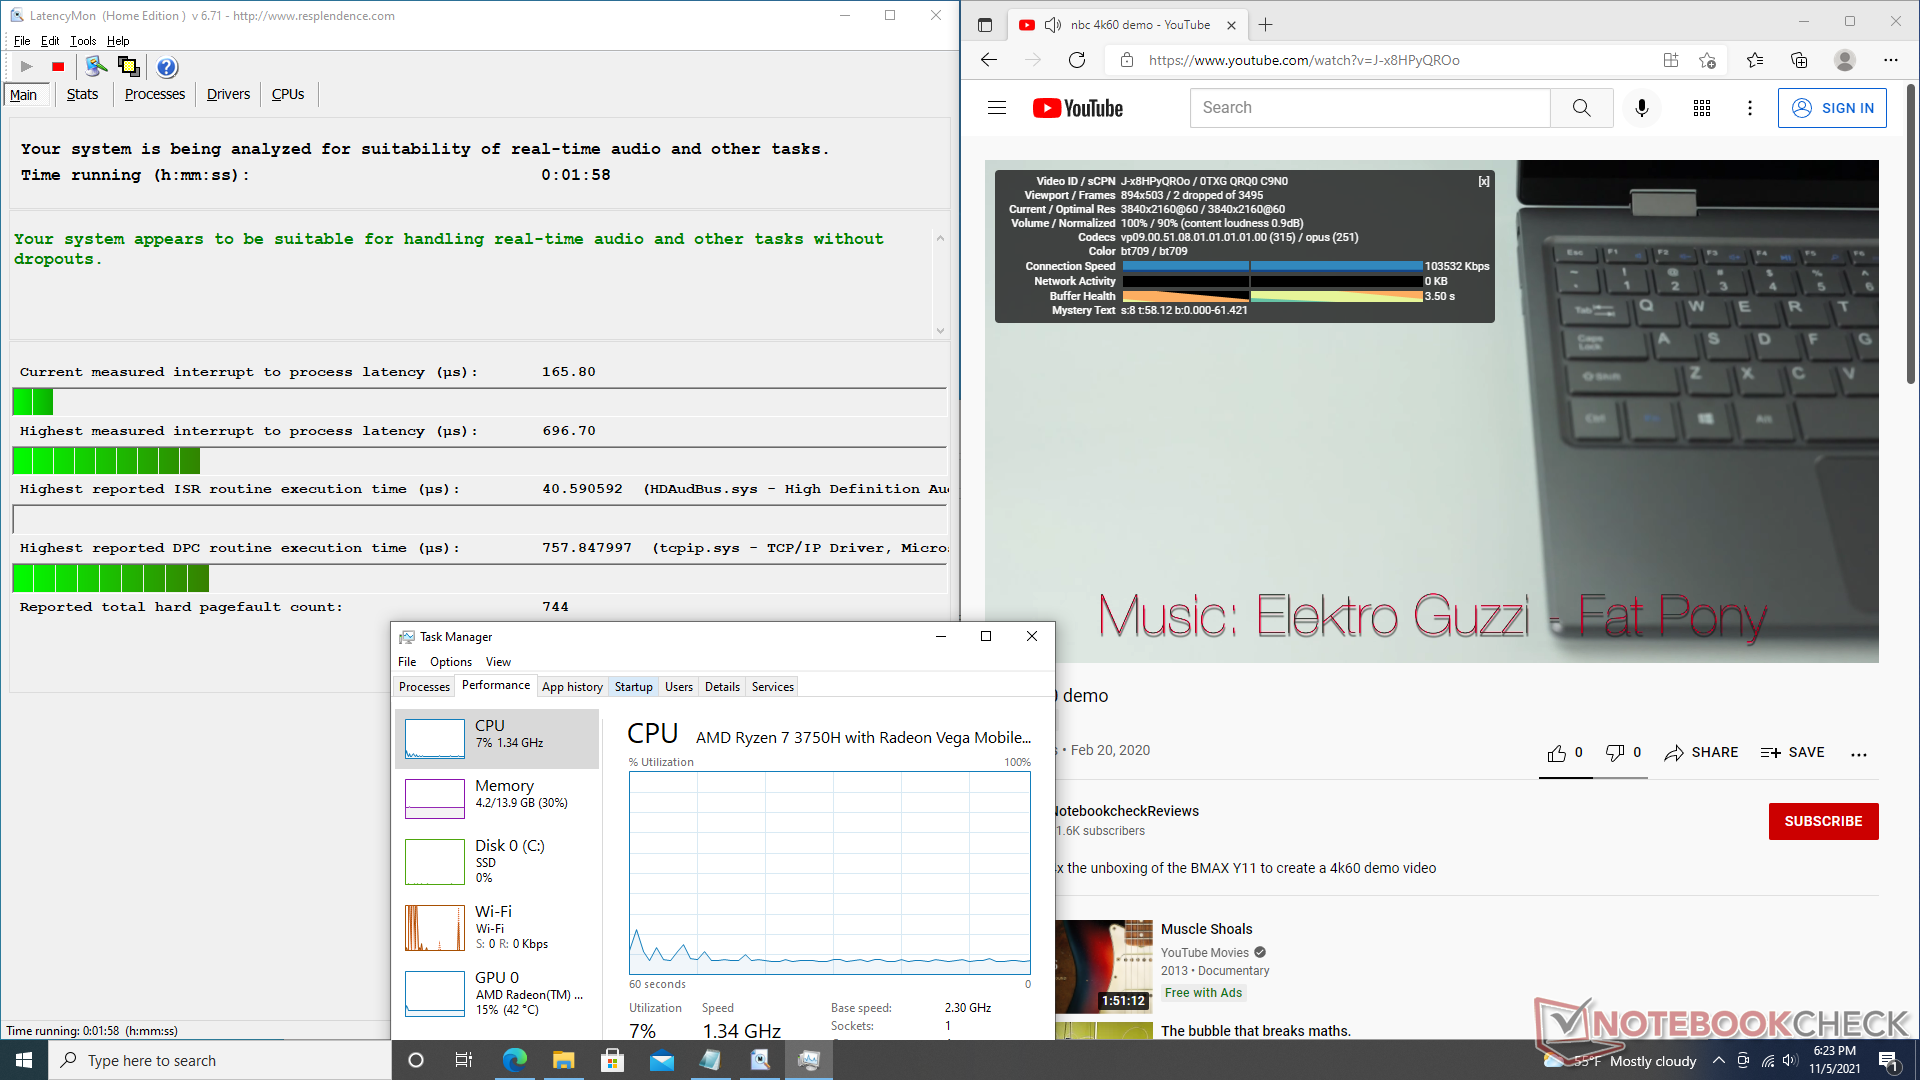
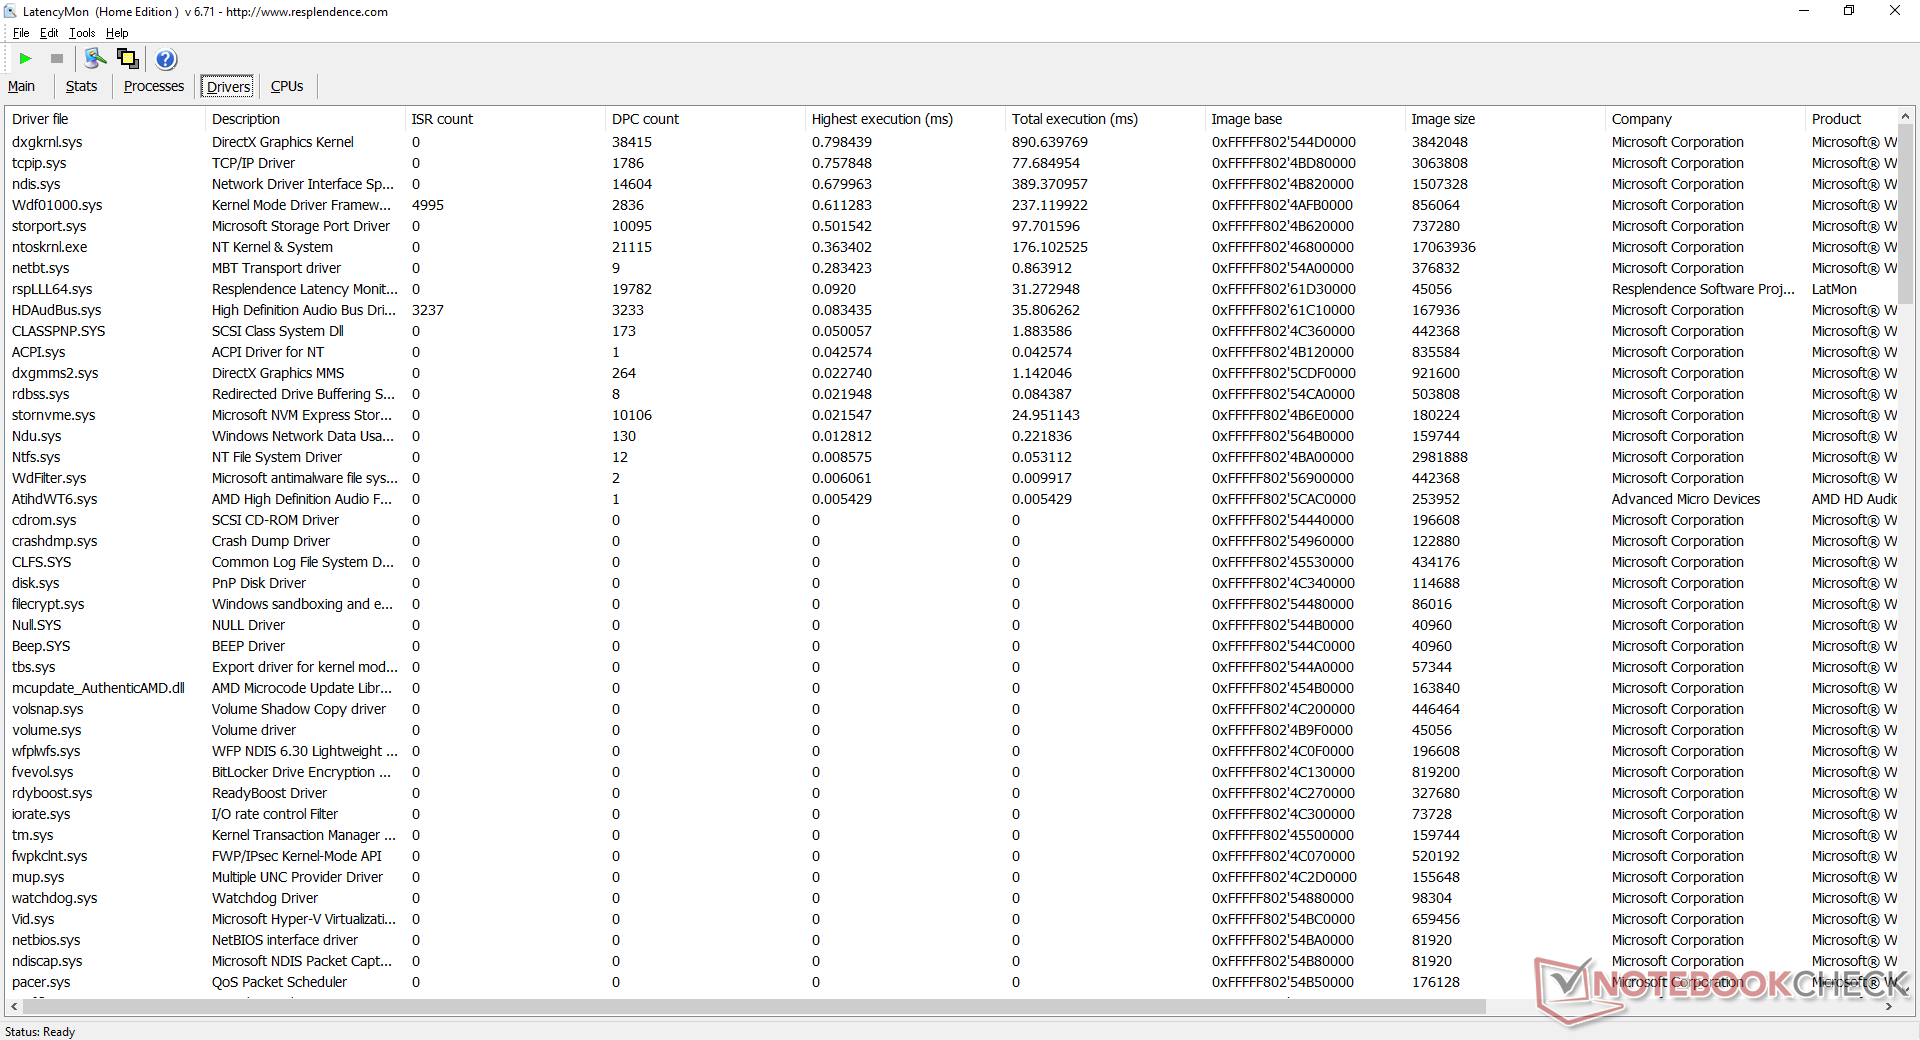
Latence DPC
LatencyMon ne montre aucun problème de CPD lors de l'ouverture de plusieurs onglets de navigateur sur notre page d'accueil ou lors de l'exécution du stress Prime95. La lecture de vidéos 4K à 60 FPS est fluide et ne présente pratiquement aucune perte d'images.
| DPC Latencies / LatencyMon - interrupt to process latency (max), Web, Youtube, Prime95 | |
| Beelink SEi10 | |
| GMK NucBox 2 | |
| Zotac ZBox MI643 | |
| Beelink SER3 | |
| Intel NUC11TNKi5 | |
* ... Moindre est la valeur, meilleures sont les performances
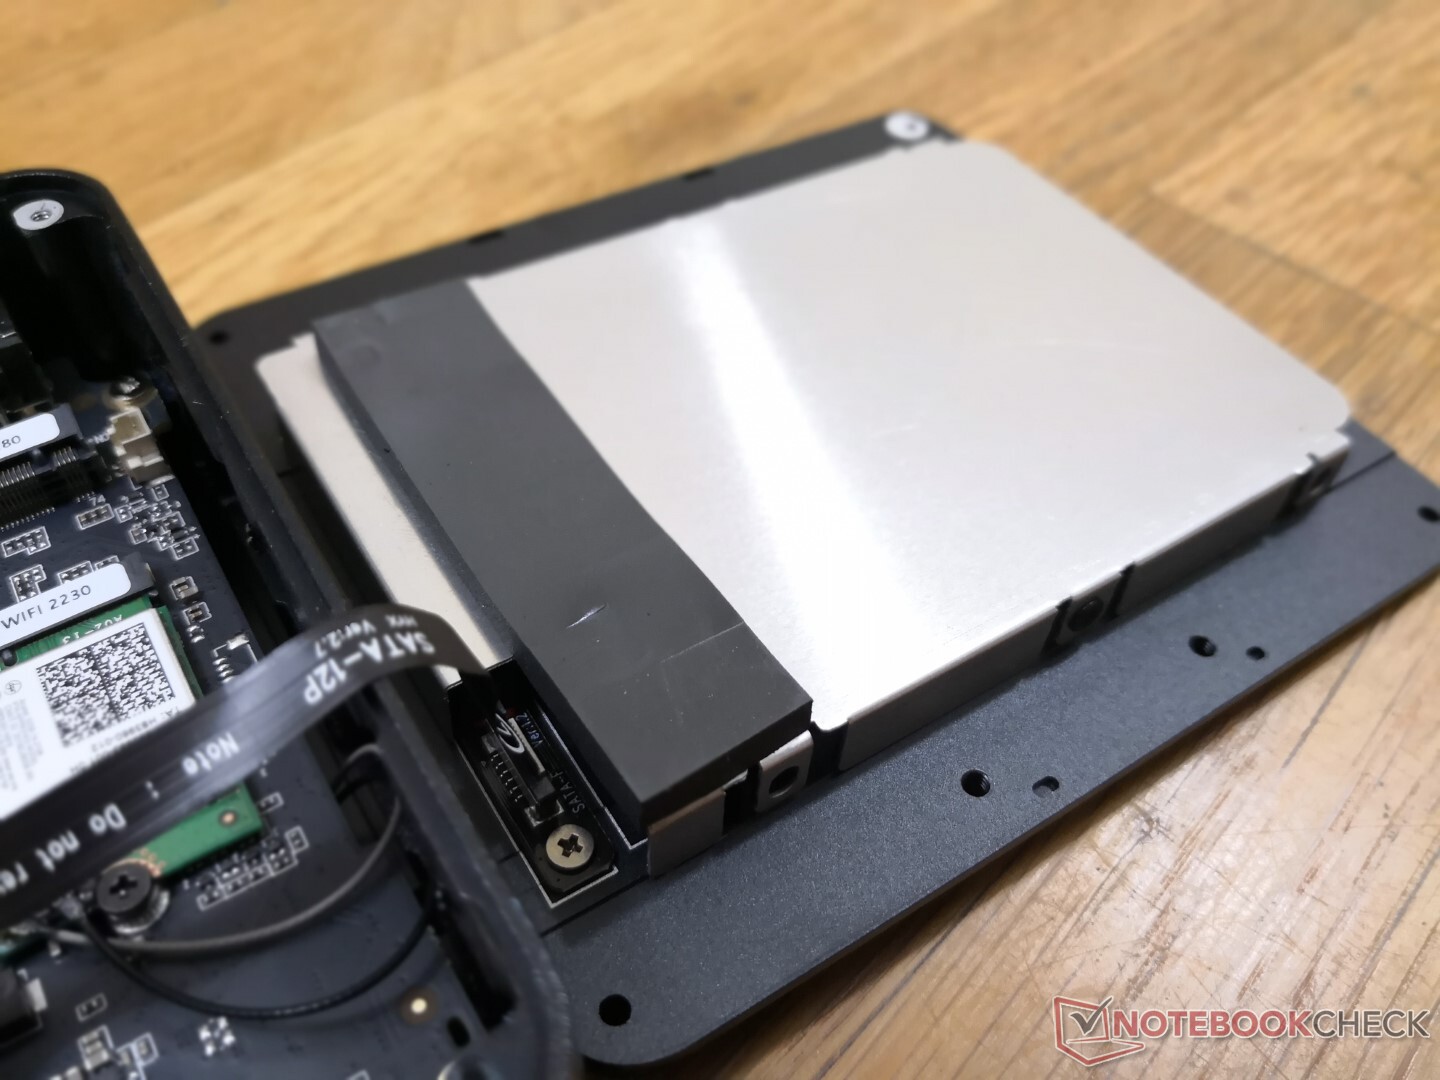
Périphériques de stockage
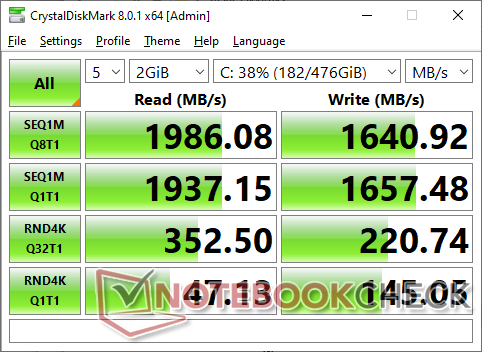
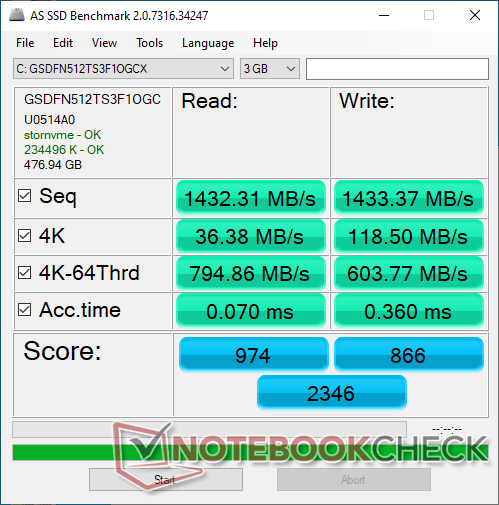
Alors que notre SEi10 est livré avec un SSD NVMe AZW de 256 Go de Silicon Motion, notre SER3 est livré avec la version de 512 Go. Les taux de lecture et d'écriture séquentiels révèlent que le disque est une offre NVMe de milieu de gamme. Les taux de transfert ralentiront au fil du temps lorsqu'ils seront sollicités, passant de 1900 Mo/s à 1400 Mo/s ou moins, en raison des limitations thermiques. De nombreux NUC d'Intel intègrent un dissipateur thermique sur le dessus du SSD NVMe pour le refroidissement afin d'éviter ou de retarder le ralentissement des performances.

| Drive Performance rating - Percent | |
| Zotac ZBox MI643 | |
| Beelink SER3 | |
| GMK NucBox 2 | |
| Beelink SEi10 | |
| Intel NUC11TNKi5 | |
| DiskSpd | |
| seq read | |
| Zotac ZBox MI643 | |
| GMK NucBox 2 | |
| Beelink SER3 | |
| Beelink SEi10 | |
| Intel NUC11TNKi5 | |
| seq write | |
| Zotac ZBox MI643 | |
| Beelink SER3 | |
| GMK NucBox 2 | |
| Beelink SEi10 | |
| Intel NUC11TNKi5 | |
| seq q8 t1 read | |
| GMK NucBox 2 | |
| Zotac ZBox MI643 | |
| Beelink SER3 | |
| Beelink SEi10 | |
| Intel NUC11TNKi5 | |
| seq q8 t1 write | |
| Zotac ZBox MI643 | |
| Beelink SER3 | |
| GMK NucBox 2 | |
| Beelink SEi10 | |
| Intel NUC11TNKi5 | |
| 4k q1 t1 read | |
| Zotac ZBox MI643 | |
| Beelink SEi10 | |
| Beelink SER3 | |
| GMK NucBox 2 | |
| Intel NUC11TNKi5 | |
| 4k q1 t1 write | |
| Zotac ZBox MI643 | |
| Beelink SEi10 | |
| GMK NucBox 2 | |
| Beelink SER3 | |
| Intel NUC11TNKi5 | |
| 4k q32 t16 read | |
| Beelink SER3 | |
| Zotac ZBox MI643 | |
| Beelink SEi10 | |
| GMK NucBox 2 | |
| Intel NUC11TNKi5 | |
| 4k q32 t16 write | |
| Zotac ZBox MI643 | |
| GMK NucBox 2 | |
| Beelink SEi10 | |
| Beelink SER3 | |
| Intel NUC11TNKi5 | |
| AS SSD | |
| Score Total | |
| Zotac ZBox MI643 | |
| Beelink SER3 | |
| GMK NucBox 2 | |
| Beelink SEi10 | |
| Intel NUC11TNKi5 | |
| Score Read | |
| Zotac ZBox MI643 | |
| Beelink SER3 | |
| GMK NucBox 2 | |
| Beelink SEi10 | |
| Intel NUC11TNKi5 | |
| Score Write | |
| Zotac ZBox MI643 | |
| Beelink SER3 | |
| GMK NucBox 2 | |
| Intel NUC11TNKi5 | |
| Beelink SEi10 | |
| Seq Read | |
| GMK NucBox 2 | |
| Zotac ZBox MI643 | |
| Beelink SER3 | |
| Beelink SEi10 | |
| Intel NUC11TNKi5 | |
| Seq Write | |
| Zotac ZBox MI643 | |
| Beelink SER3 | |
| GMK NucBox 2 | |
| Intel NUC11TNKi5 | |
| Beelink SEi10 | |
| 4K Read | |
| Zotac ZBox MI643 | |
| GMK NucBox 2 | |
| Beelink SER3 | |
| Beelink SEi10 | |
| Intel NUC11TNKi5 | |
| 4K Write | |
| GMK NucBox 2 | |
| Zotac ZBox MI643 | |
| Beelink SER3 | |
| Beelink SEi10 | |
| Intel NUC11TNKi5 | |
| 4K-64 Read | |
| Zotac ZBox MI643 | |
| Beelink SER3 | |
| GMK NucBox 2 | |
| Beelink SEi10 | |
| Intel NUC11TNKi5 | |
| 4K-64 Write | |
| Zotac ZBox MI643 | |
| Beelink SER3 | |
| GMK NucBox 2 | |
| Intel NUC11TNKi5 | |
| Beelink SEi10 | |
| Access Time Read | |
| Intel NUC11TNKi5 | |
| Beelink SER3 | |
| Beelink SEi10 | |
| GMK NucBox 2 | |
| Zotac ZBox MI643 | |
| Access Time Write | |
| Beelink SEi10 | |
| Beelink SER3 | |
| GMK NucBox 2 | |
| Intel NUC11TNKi5 | |
| Zotac ZBox MI643 | |
* ... Moindre est la valeur, meilleures sont les performances
Disk Throttling: DiskSpd Read Loop, Queue Depth 8
Performances du GPU
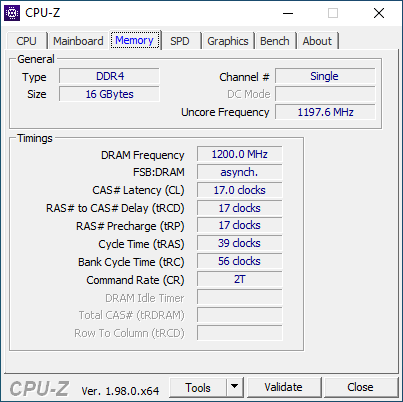
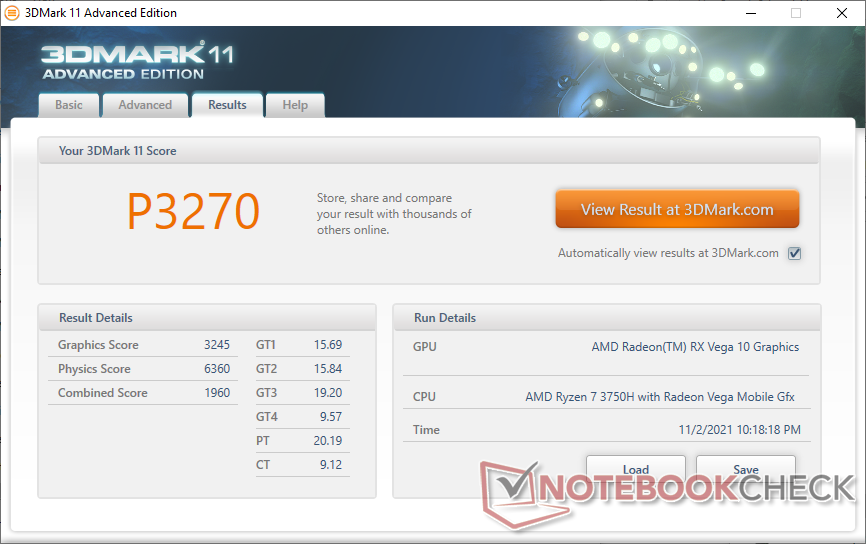
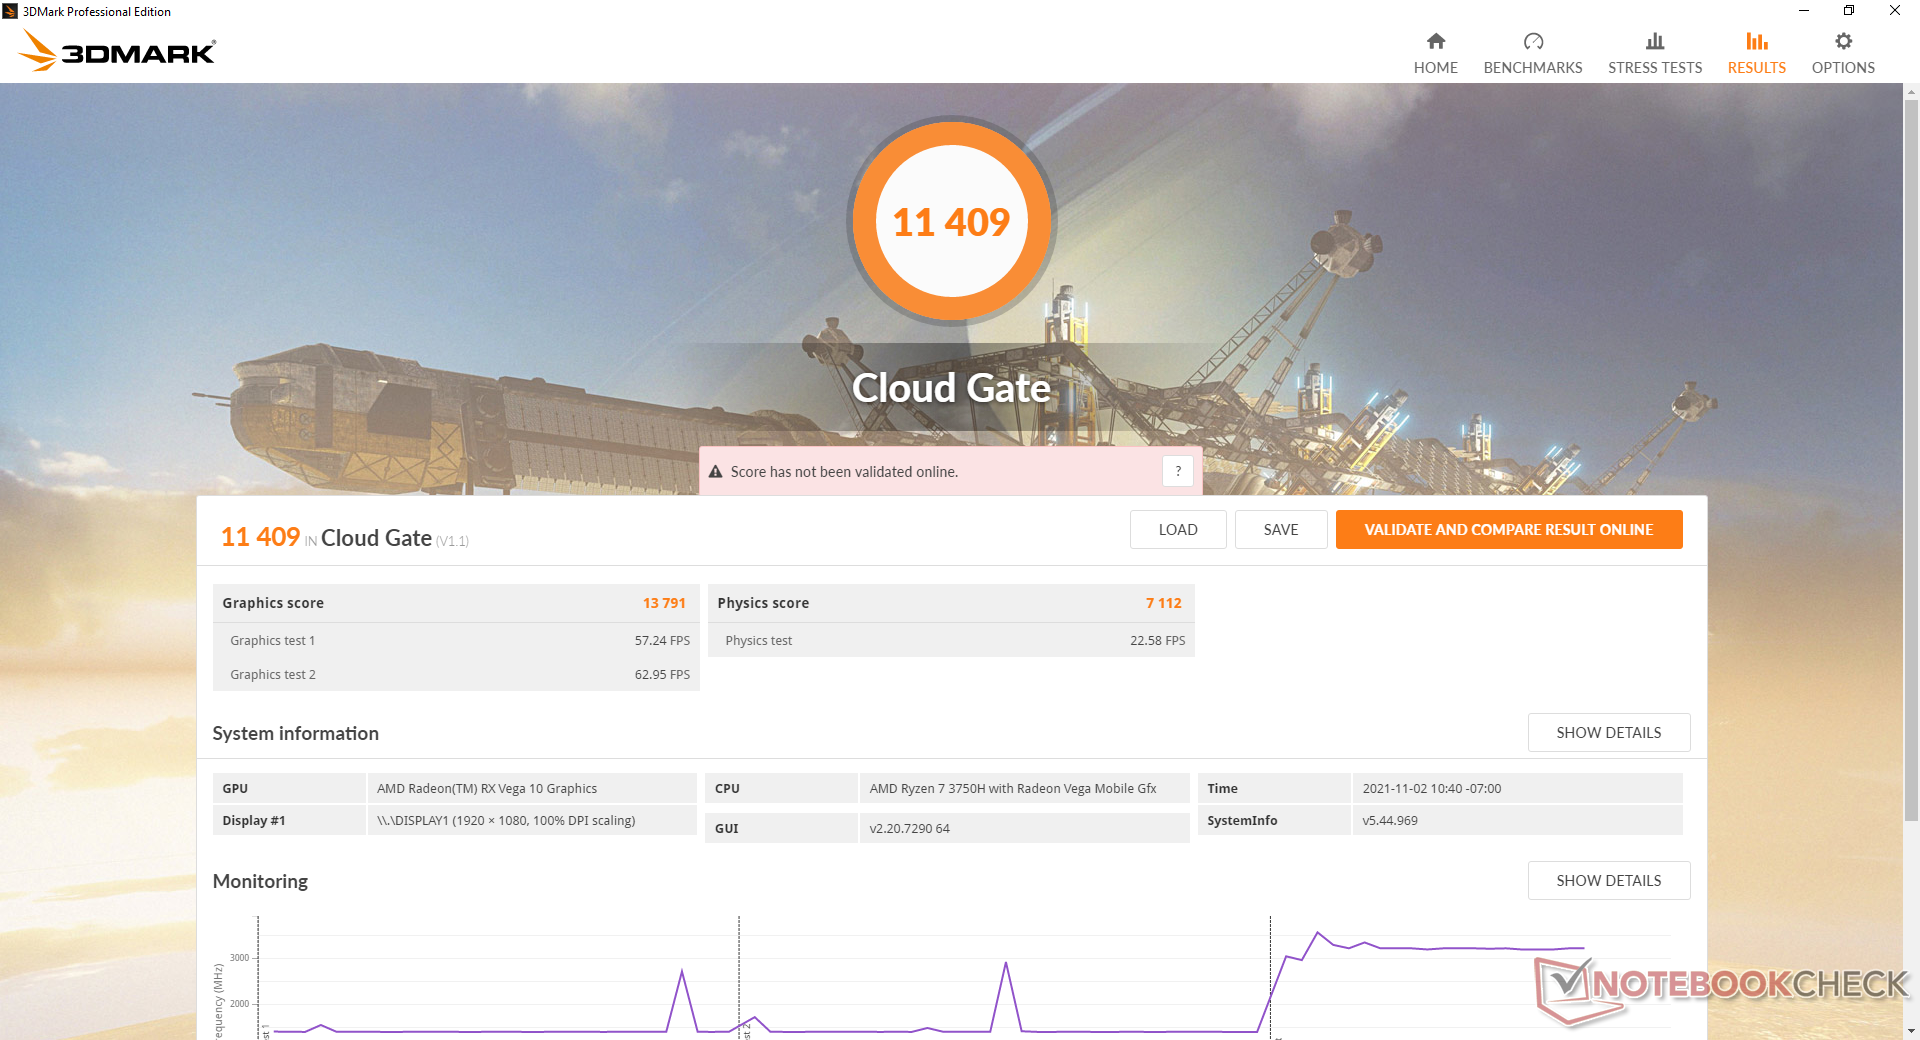
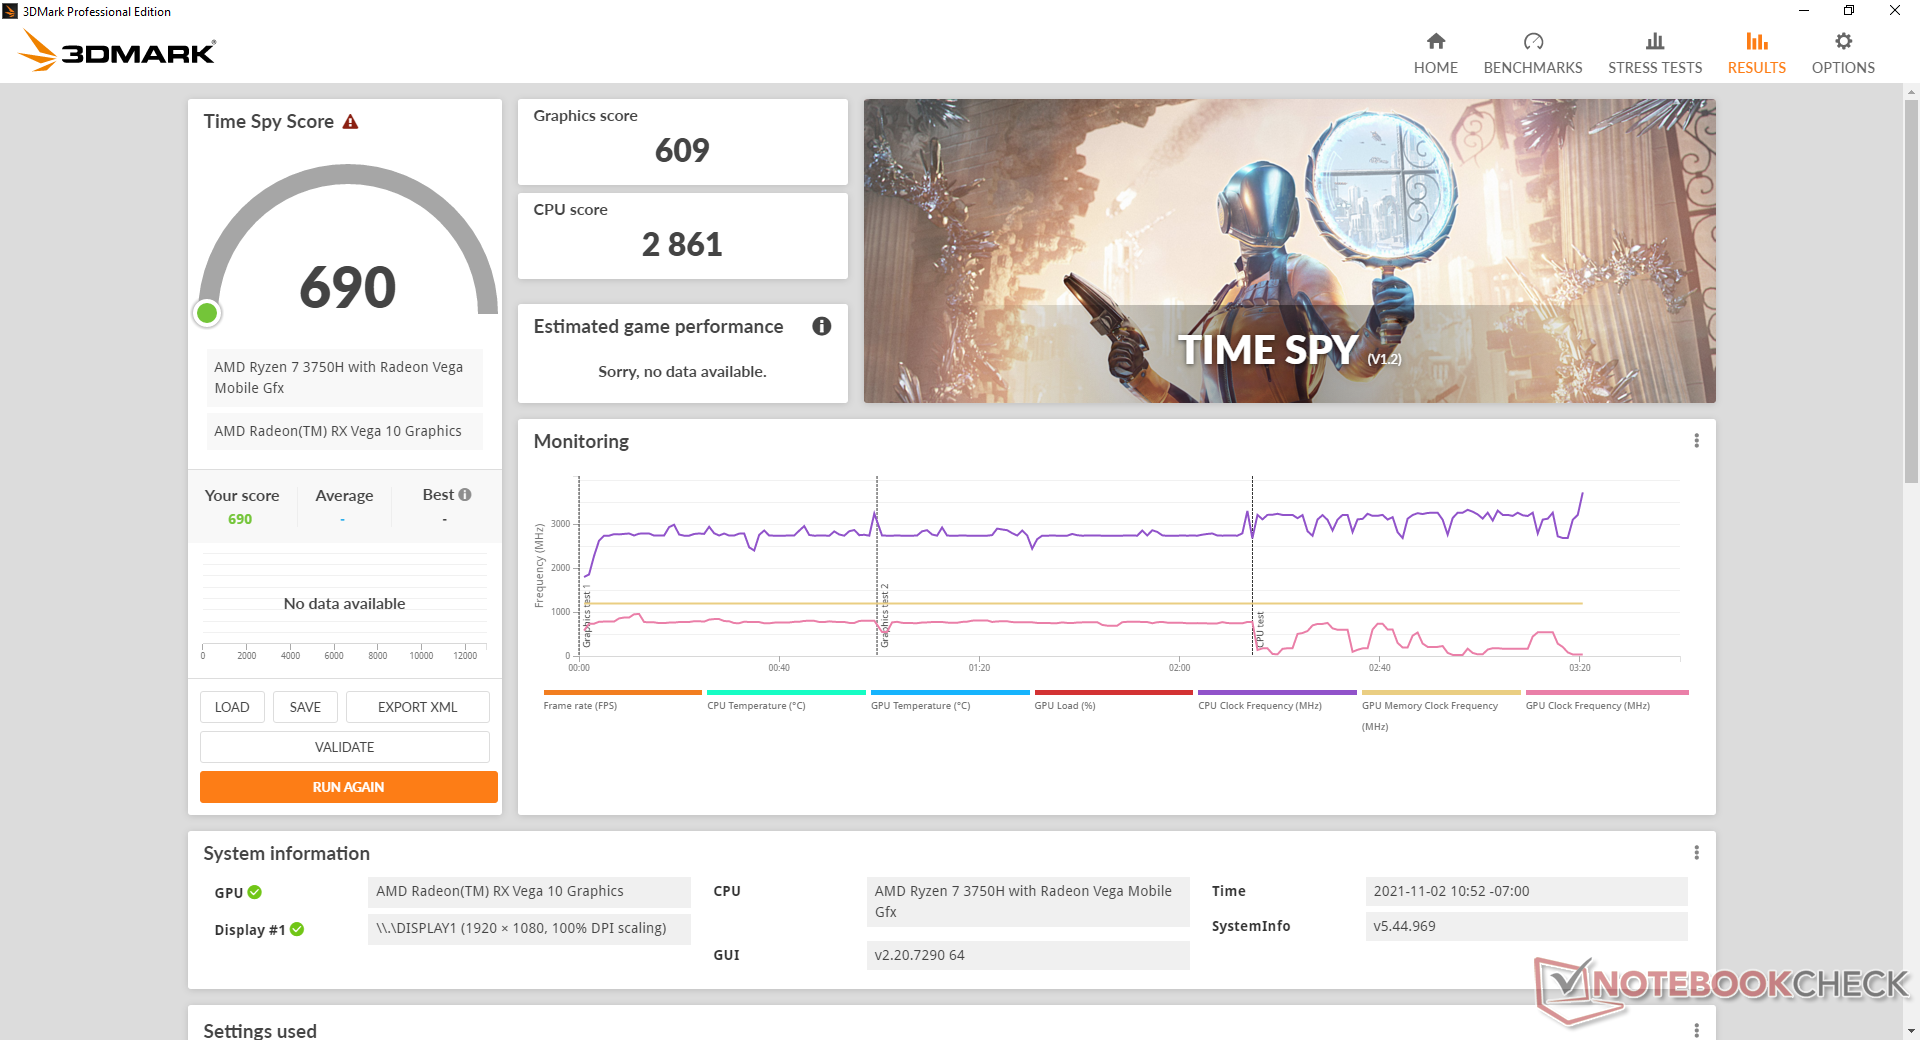
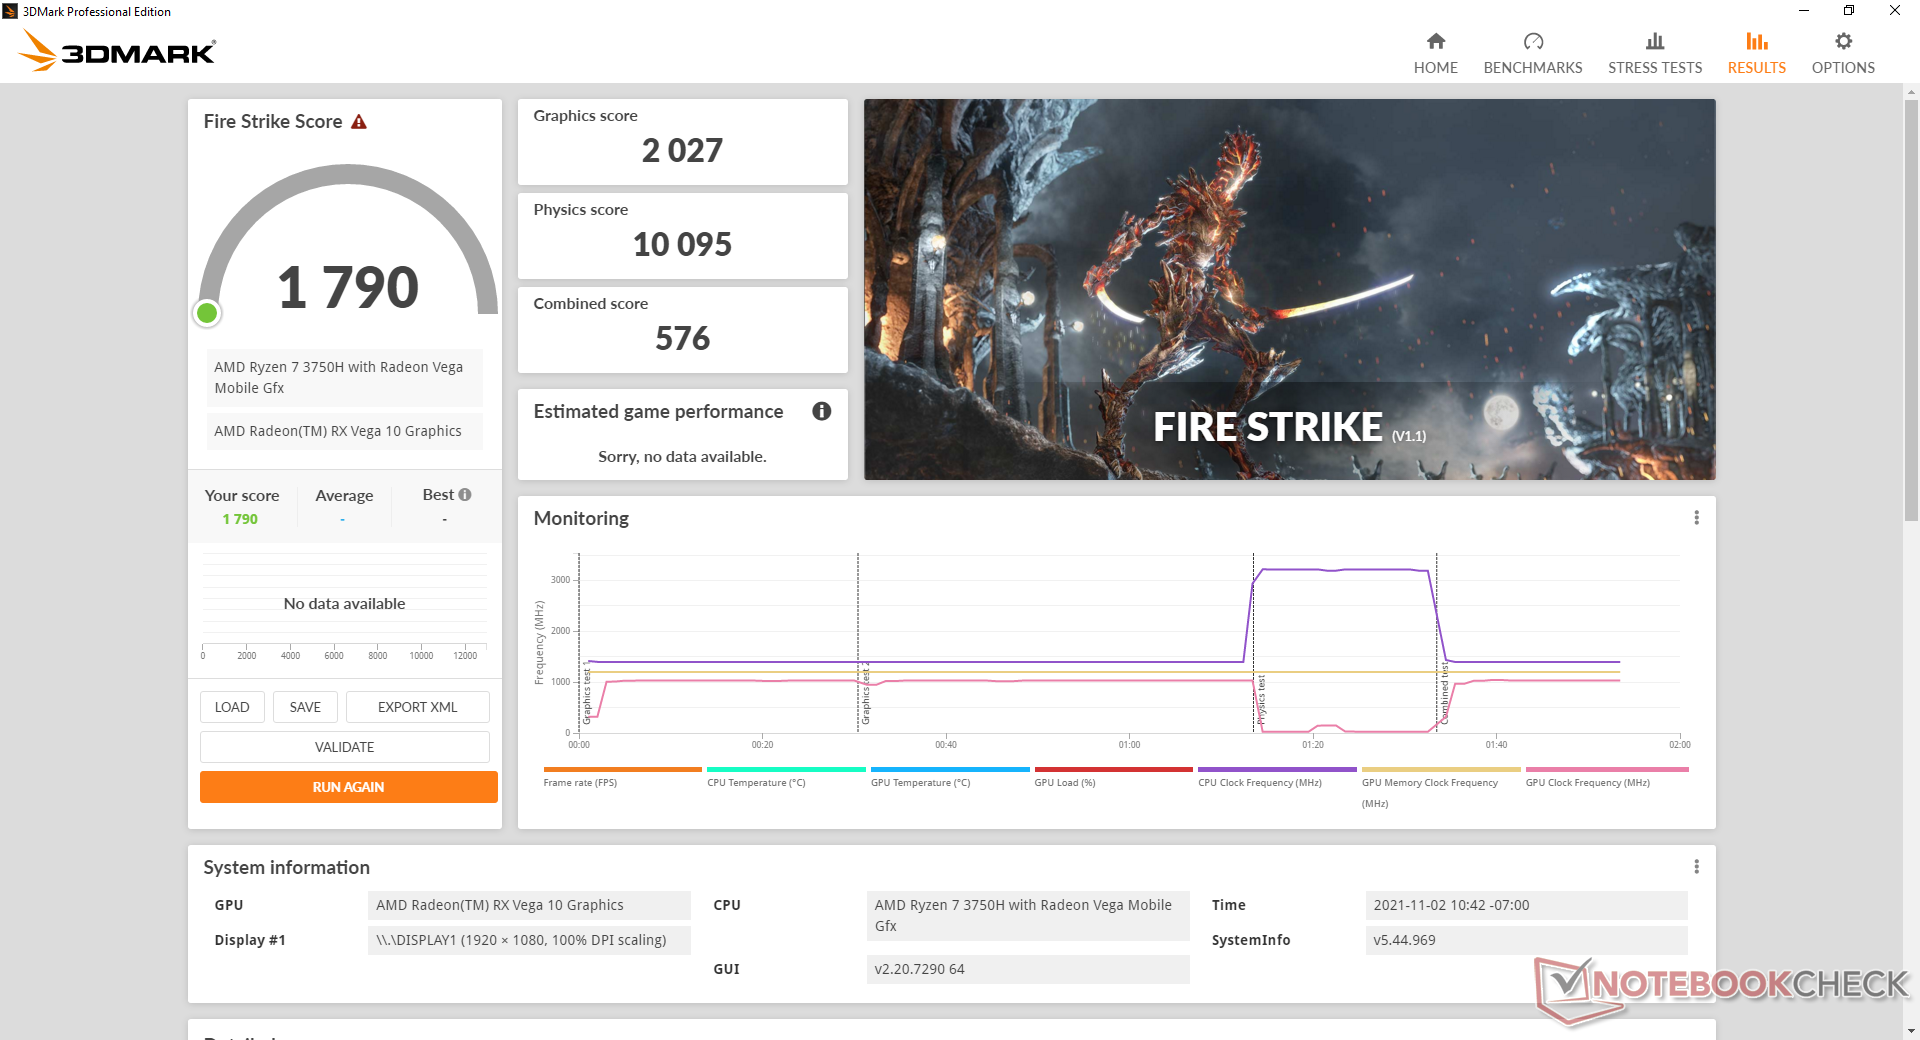
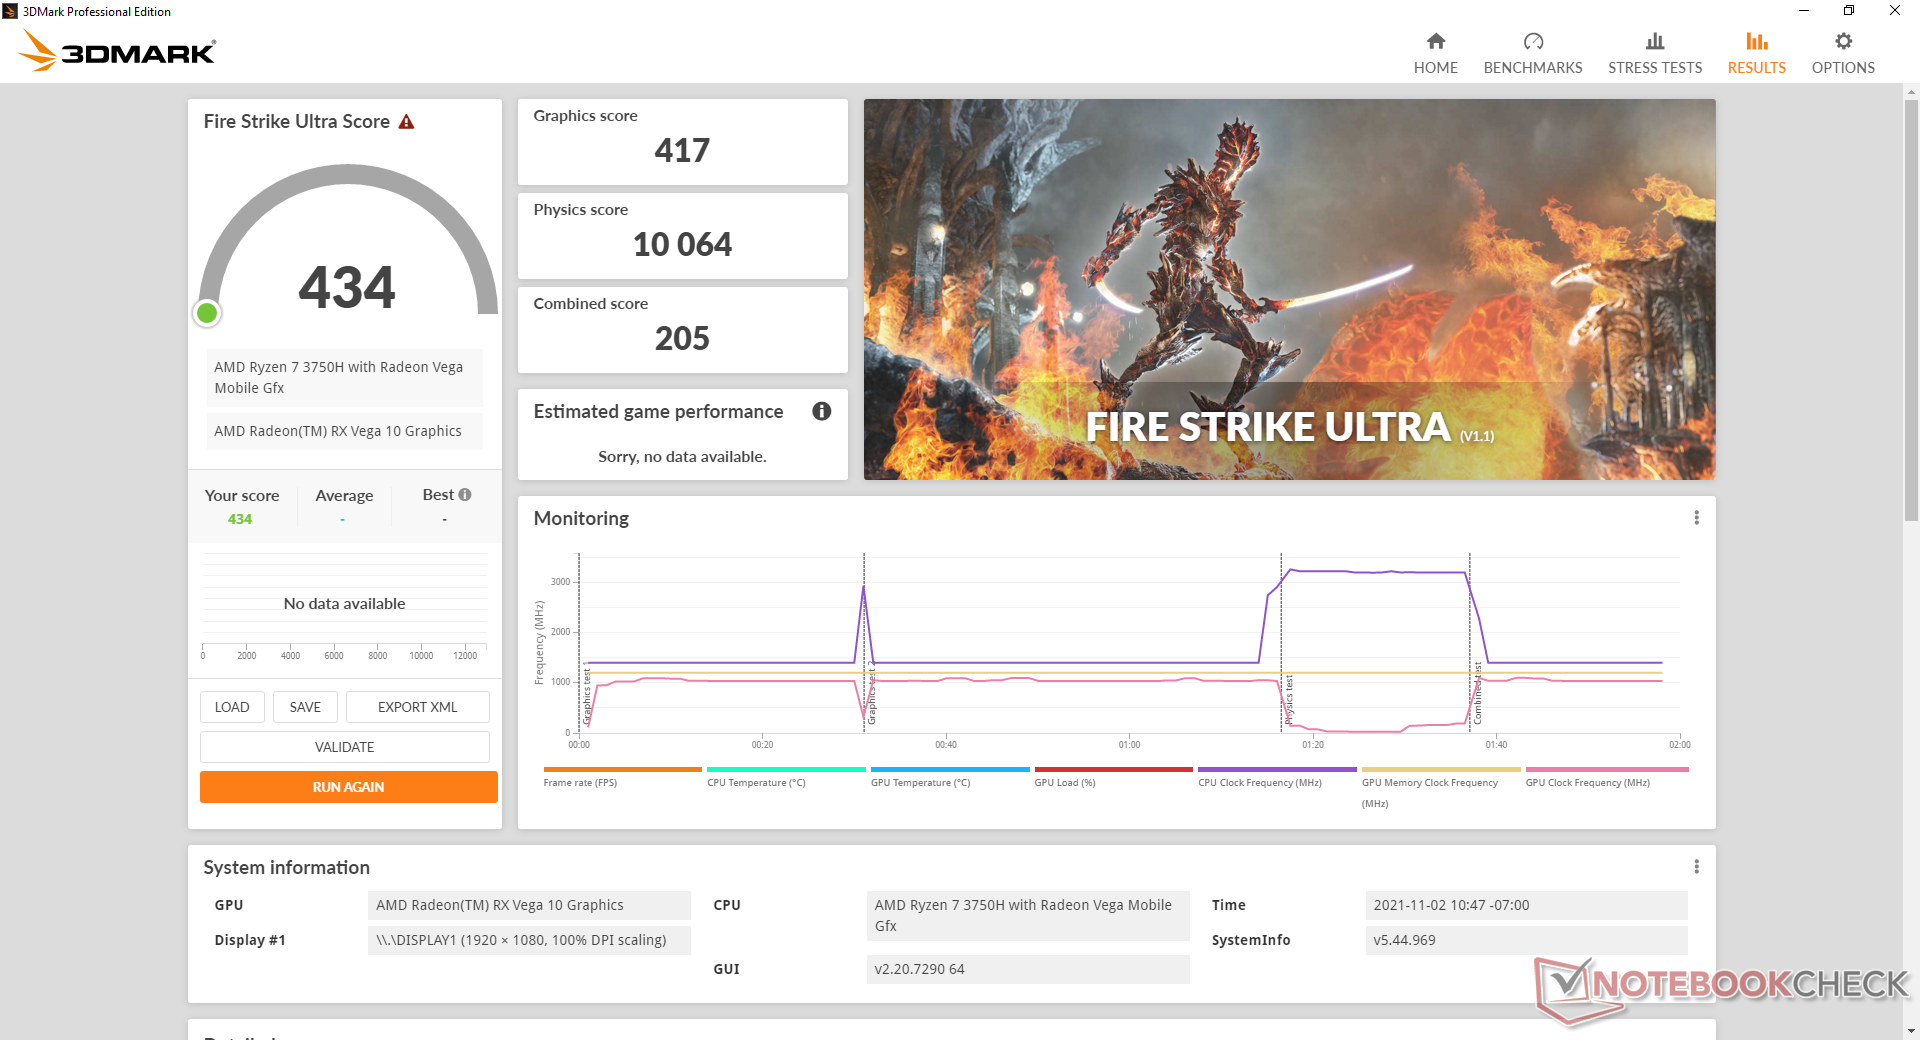
Les performances graphiques sont très similaires à celles de l Iris Plus Graphics 655. Alors que notre Radeon RX Vega 10 est une mise à niveau décente par rapport à la UHD Graphics 620elle est toujours significativement plus lente que les dernières Options Iris Xe NUC d'Intel. Les performances globales sont légèrement inférieures à celles de la moyenne des RX Vega 10 de notre base de données, car notre unité de test SER3 est équipée de RAM monocanal uniquement. Les utilisateurs peuvent tirer davantage de performances du GPU s'il est configuré avec de la RAM à double canal.
| 3DMark Performance rating - Percent | |
| VAIO SX14 VJS144X0111K | |
| Asus Zenbook 14X UX5400E -1! | |
| Huawei MateBook 16 R7 5800H | |
| Lenovo Yoga 6 13ALC6 | |
| Dell Latitude 14 5411-WJ40N | |
| Intel NUC11TNKi5 | |
| Moyenne AMD Radeon RX Vega 10 | |
| Intel NUC8i7BE | |
| Beelink SER3 | |
| GMK NucBox 2 | |
| Zotac ZBox MI643 | |
| Beelink SEi10 | |
| 3DMark | |
| 1920x1080 Fire Strike Graphics | |
| VAIO SX14 VJS144X0111K | |
| Asus Zenbook 14X UX5400E | |
| Dell Latitude 14 5411-WJ40N | |
| Huawei MateBook 16 R7 5800H | |
| Lenovo Yoga 6 13ALC6 | |
| Intel NUC11TNKi5 | |
| Intel NUC8i7BE | |
| Moyenne AMD Radeon RX Vega 10 (1567 - 2999, n=17) | |
| Beelink SER3 | |
| GMK NucBox 2 | |
| Zotac ZBox MI643 | |
| Beelink SEi10 | |
| 2560x1440 Time Spy Graphics | |
| VAIO SX14 VJS144X0111K | |
| Asus Zenbook 14X UX5400E | |
| Huawei MateBook 16 R7 5800H | |
| Dell Latitude 14 5411-WJ40N | |
| Lenovo Yoga 6 13ALC6 | |
| Intel NUC11TNKi5 | |
| Moyenne AMD Radeon RX Vega 10 (578 - 852, n=7) | |
| Intel NUC8i7BE | |
| Beelink SER3 | |
| GMK NucBox 2 | |
| Zotac ZBox MI643 | |
| Beelink SEi10 | |
| 2560x1440 Time Spy Score | |
| VAIO SX14 VJS144X0111K | |
| Asus Zenbook 14X UX5400E | |
| Huawei MateBook 16 R7 5800H | |
| Dell Latitude 14 5411-WJ40N | |
| Lenovo Yoga 6 13ALC6 | |
| Intel NUC11TNKi5 | |
| Moyenne AMD Radeon RX Vega 10 (647 - 955, n=8) | |
| Intel NUC8i7BE | |
| Beelink SER3 | |
| GMK NucBox 2 | |
| Zotac ZBox MI643 | |
| Beelink SEi10 | |
| 3DMark 11 - 1280x720 Performance GPU | |
| VAIO SX14 VJS144X0111K | |
| Huawei MateBook 16 R7 5800H | |
| Lenovo Yoga 6 13ALC6 | |
| Intel NUC11TNKi5 | |
| Dell Latitude 14 5411-WJ40N | |
| Moyenne AMD Radeon RX Vega 10 (2688 - 4165, n=17) | |
| Beelink SER3 | |
| Intel NUC8i7BE | |
| GMK NucBox 2 | |
| Zotac ZBox MI643 | |
| Beelink SEi10 | |
| 3DMark 11 Performance | 3270 points | |
| 3DMark Cloud Gate Standard Score | 11409 points | |
| 3DMark Fire Strike Score | 1790 points | |
| 3DMark Time Spy Score | 690 points | |
Aide | ||
Witcher 3 FPS Chart
| Bas | Moyen | Élevé | Ultra | |
|---|---|---|---|---|
| GTA V (2015) | 51.8 | 46.3 | 13.2 | 6.76 |
| The Witcher 3 (2015) | 35.7 | 22.9 | 12.2 | 8 |
| Dota 2 Reborn (2015) | 67.4 | 52 | 30.1 | 28.3 |
| Final Fantasy XV Benchmark (2018) | 19 | 9.98 | 6.8 | |
| X-Plane 11.11 (2018) | 23.8 | 18.5 | 16.7 | |
| Far Cry 5 (2018) | 23 | 12 | 11 | 10 |
| Strange Brigade (2018) | 37.9 | 15.1 | 12.6 | 10.9 |
Émissions
Bruit du système
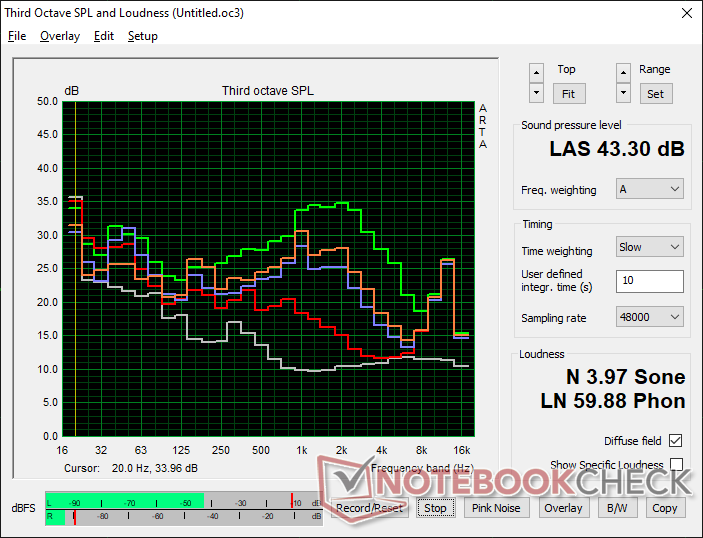
Le ventilateur émet des pulsations fréquentes lors de l'exécution de charges HTPC typiques, comme la navigation ou le streaming vidéo. Ces pulsations ne sont pas extrêmes (29,4 dB(A) contre 23,4 dB(A) pour un fond silencieux), mais elles sont perceptibles dans un environnement de bureau calme. Heureusement, il n'est pas assez fort pour être gênant lors de la lecture de musique ou de vidéos à fort volume.
L'exécution de charges plus élevées, comme les jeux, peut induire un bruit de ventilateur allant jusqu'à 37 à 43 dB(A), ce qui n'est pas sans rappeler de nombreux ultrabooks de la série U ou les anciens modèles d'Intel NUC8i7BE.Intel NUC8i7BE.
Degré de la nuisance sonore
| Au repos |
| 23.4 / 23.4 / 29.4 dB(A) |
| Fortement sollicité |
| 35.2 / 43.3 dB(A) |
 | ||
30 dB silencieux 40 dB(A) audible 50 dB(A) bruyant |
||
min: | ||
| Beelink SER3 Vega 10, R7 3750H, GSemi AZW GSDFN512TS3F1OGCX | Beelink SEi10 UHD Graphics G1 (Ice Lake 32 EU), i3-1005G1, Silicon Motion AZW 256G M.2280 NVMe 4X 200725 D | Intel NUC8i7BE Iris Plus Graphics 655, i7-8559U | GMK NucBox 2 Iris Plus Graphics 655, i5-8259U, Netac S930E8/256GPN | Zotac ZBox MI643 UHD Graphics 620, i5-10210U, Lexar NM610 1TB | Intel NUC11TNKi5 Iris Xe G7 80EUs, i5-1135G7, Transcend M.2 SSD 430S TS512GMTS430S | |
|---|---|---|---|---|---|---|
| Noise | -23% | -13% | 1% | -4% | -21% | |
| arrêt / environnement * (dB) | 23.4 | 27.5 -18% | 28.7 -23% | 25.6 -9% | 26.1 -12% | 24.8 -6% |
| Idle Minimum * (dB) | 23.4 | 30.9 -32% | 28.7 -23% | 25.7 -10% | 27.5 -18% | 35.6 -52% |
| Idle Average * (dB) | 23.4 | 33.5 -43% | 29.3 -25% | 25.7 -10% | 27.5 -18% | 35.6 -52% |
| Idle Maximum * (dB) | 29.4 | 33.5 -14% | 31.8 -8% | 25.7 13% | 27.5 6% | 35.6 -21% |
| Load Average * (dB) | 35.2 | 38.5 -9% | 39 -11% | 35.3 -0% | 28.9 18% | 36.2 -3% |
| Witcher 3 ultra * (dB) | 37.2 | 39 -5% | 38 -2% | |||
| Load Maximum * (dB) | 43.3 | 51.6 -19% | 41.4 4% | 35.1 19% | 42 3% | 47.6 -10% |
* ... Moindre est la valeur, meilleures sont les performances
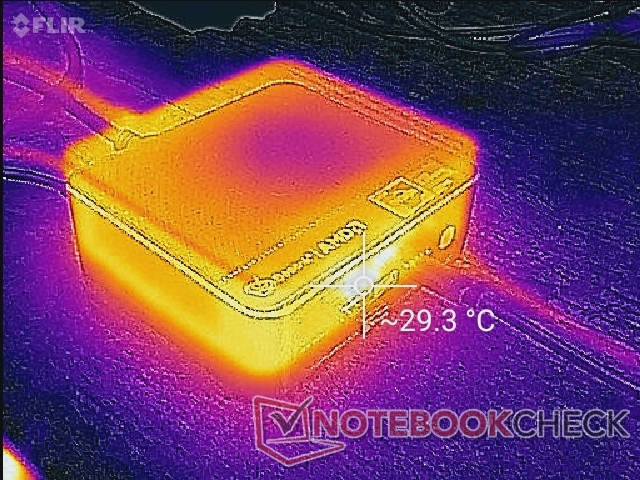
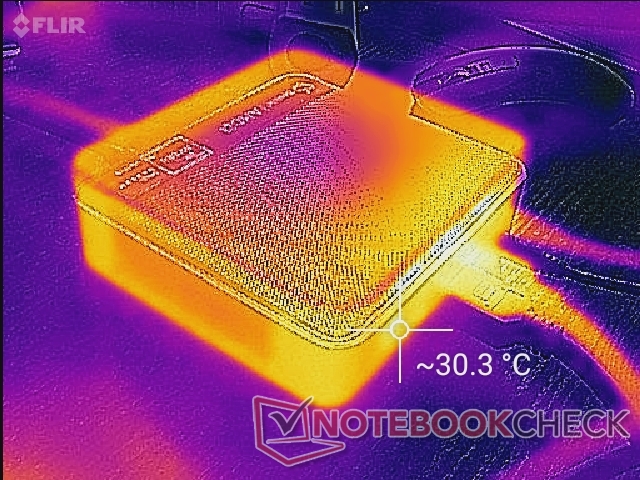
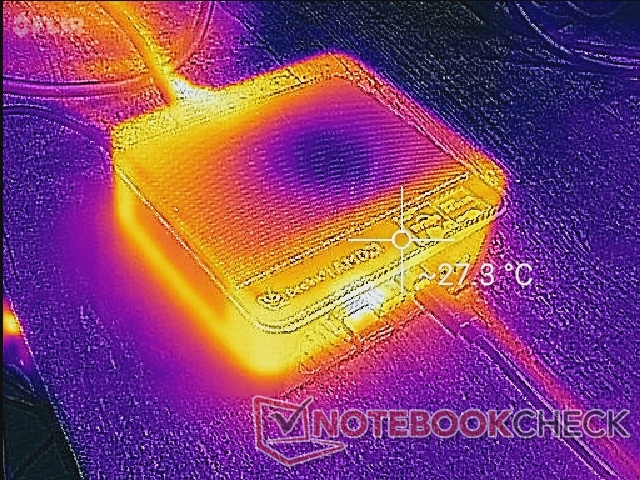
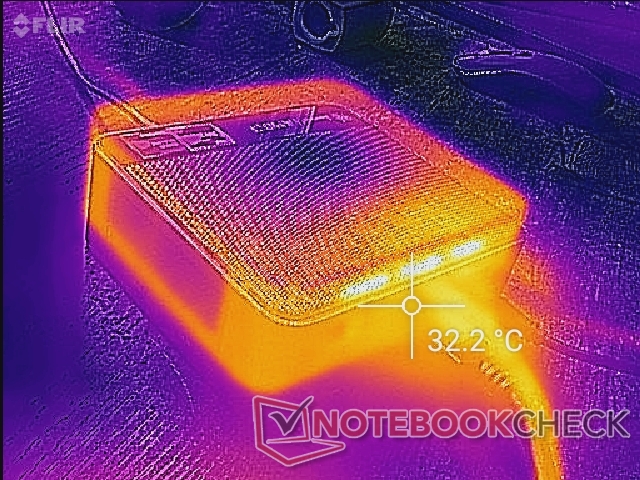
Température
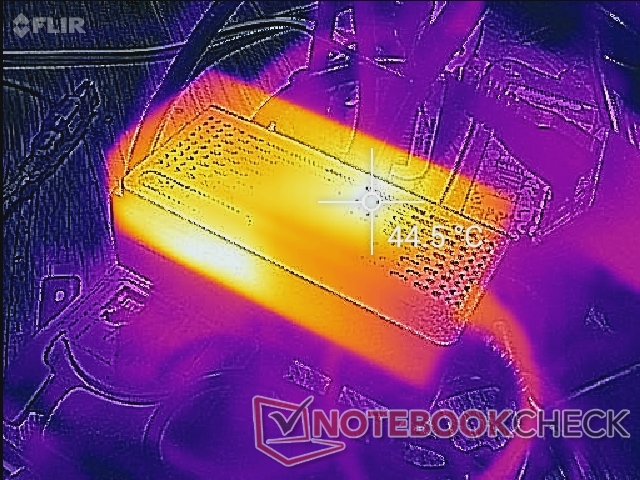
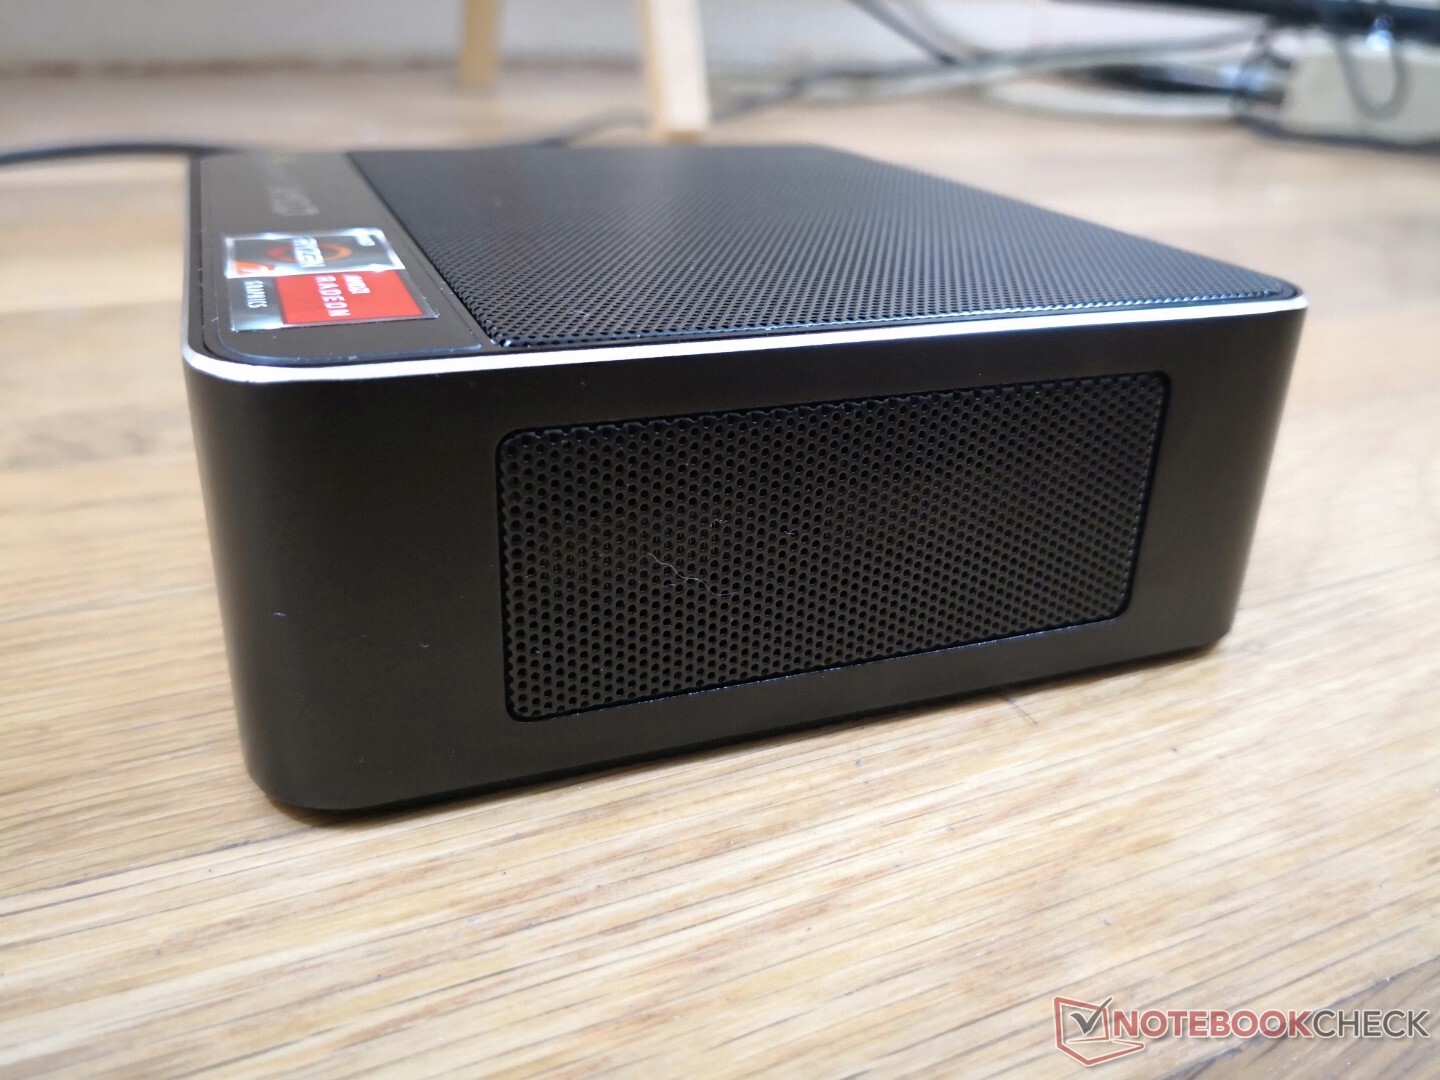
Les températures de surface ne sont pas un problème pour le SER3. L'air chaud sort par l'arrière tandis que l'air frais entre par le haut. Nous ne recommandons donc pas d'empiler des livres ou des papiers sur le mini PC
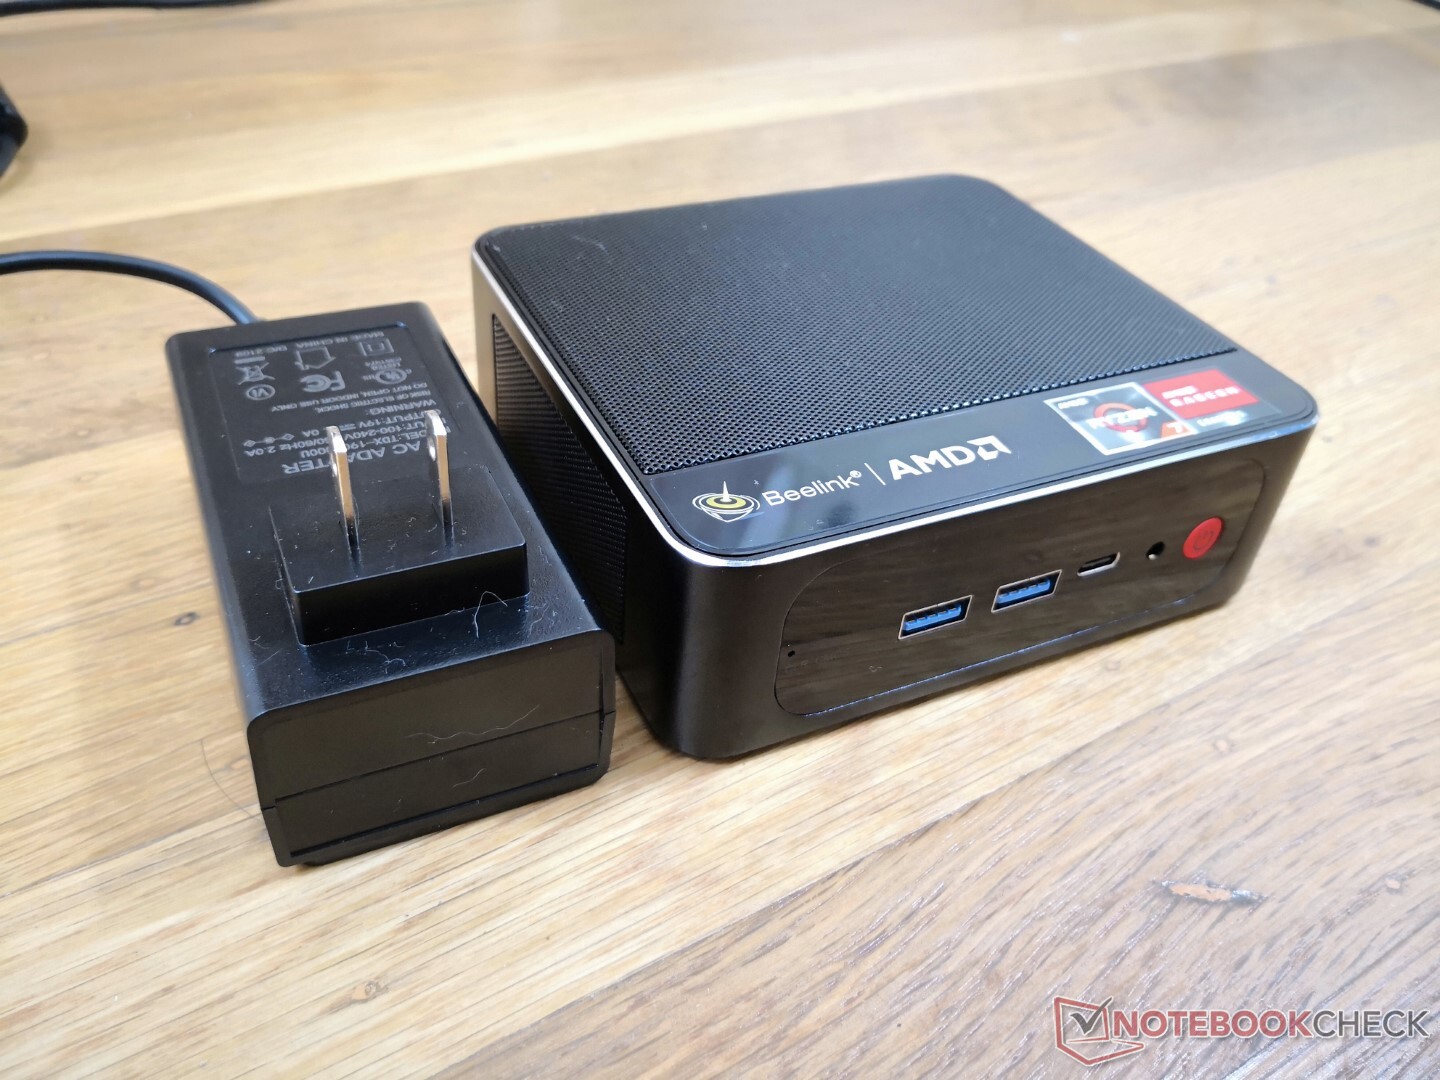
L'adaptateur secteur peut devenir plus chaud que le mini PC lui-même en cas de charge élevée, comme le montrent nos cartes de température.
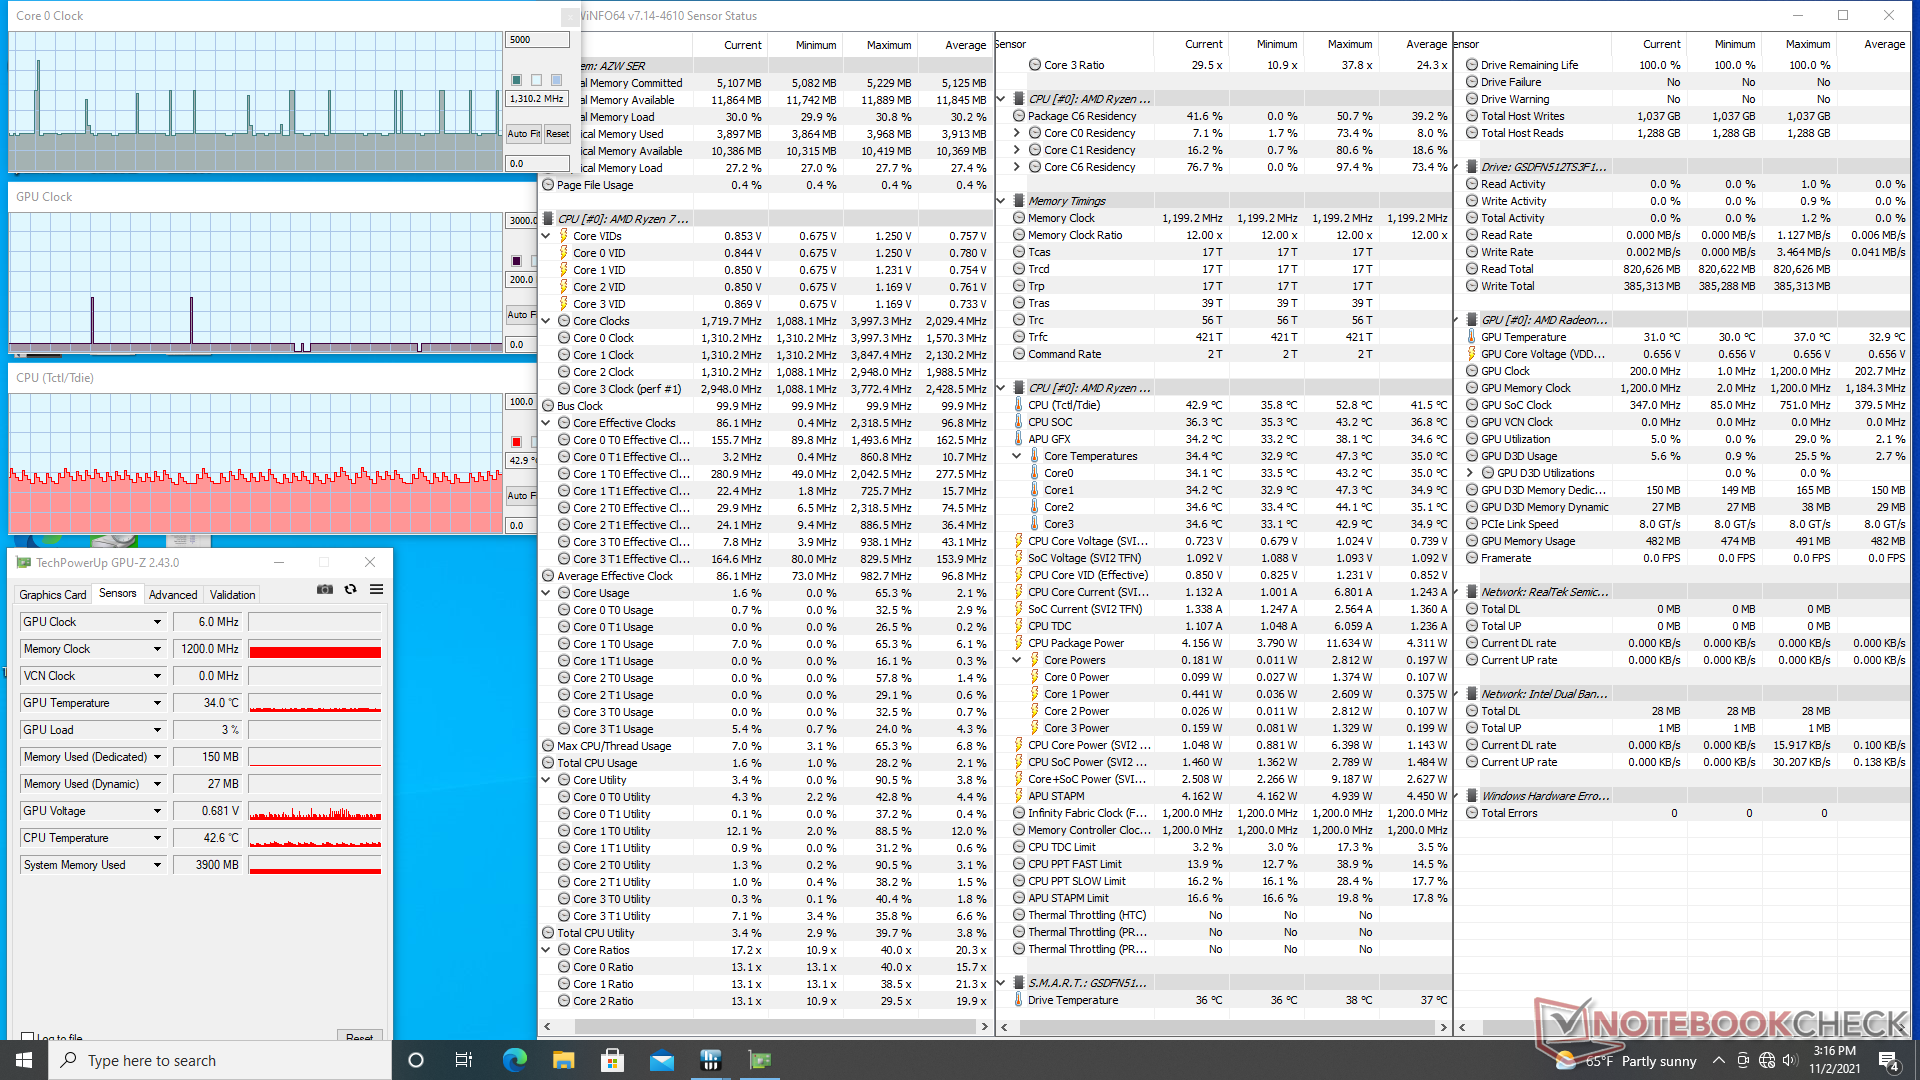
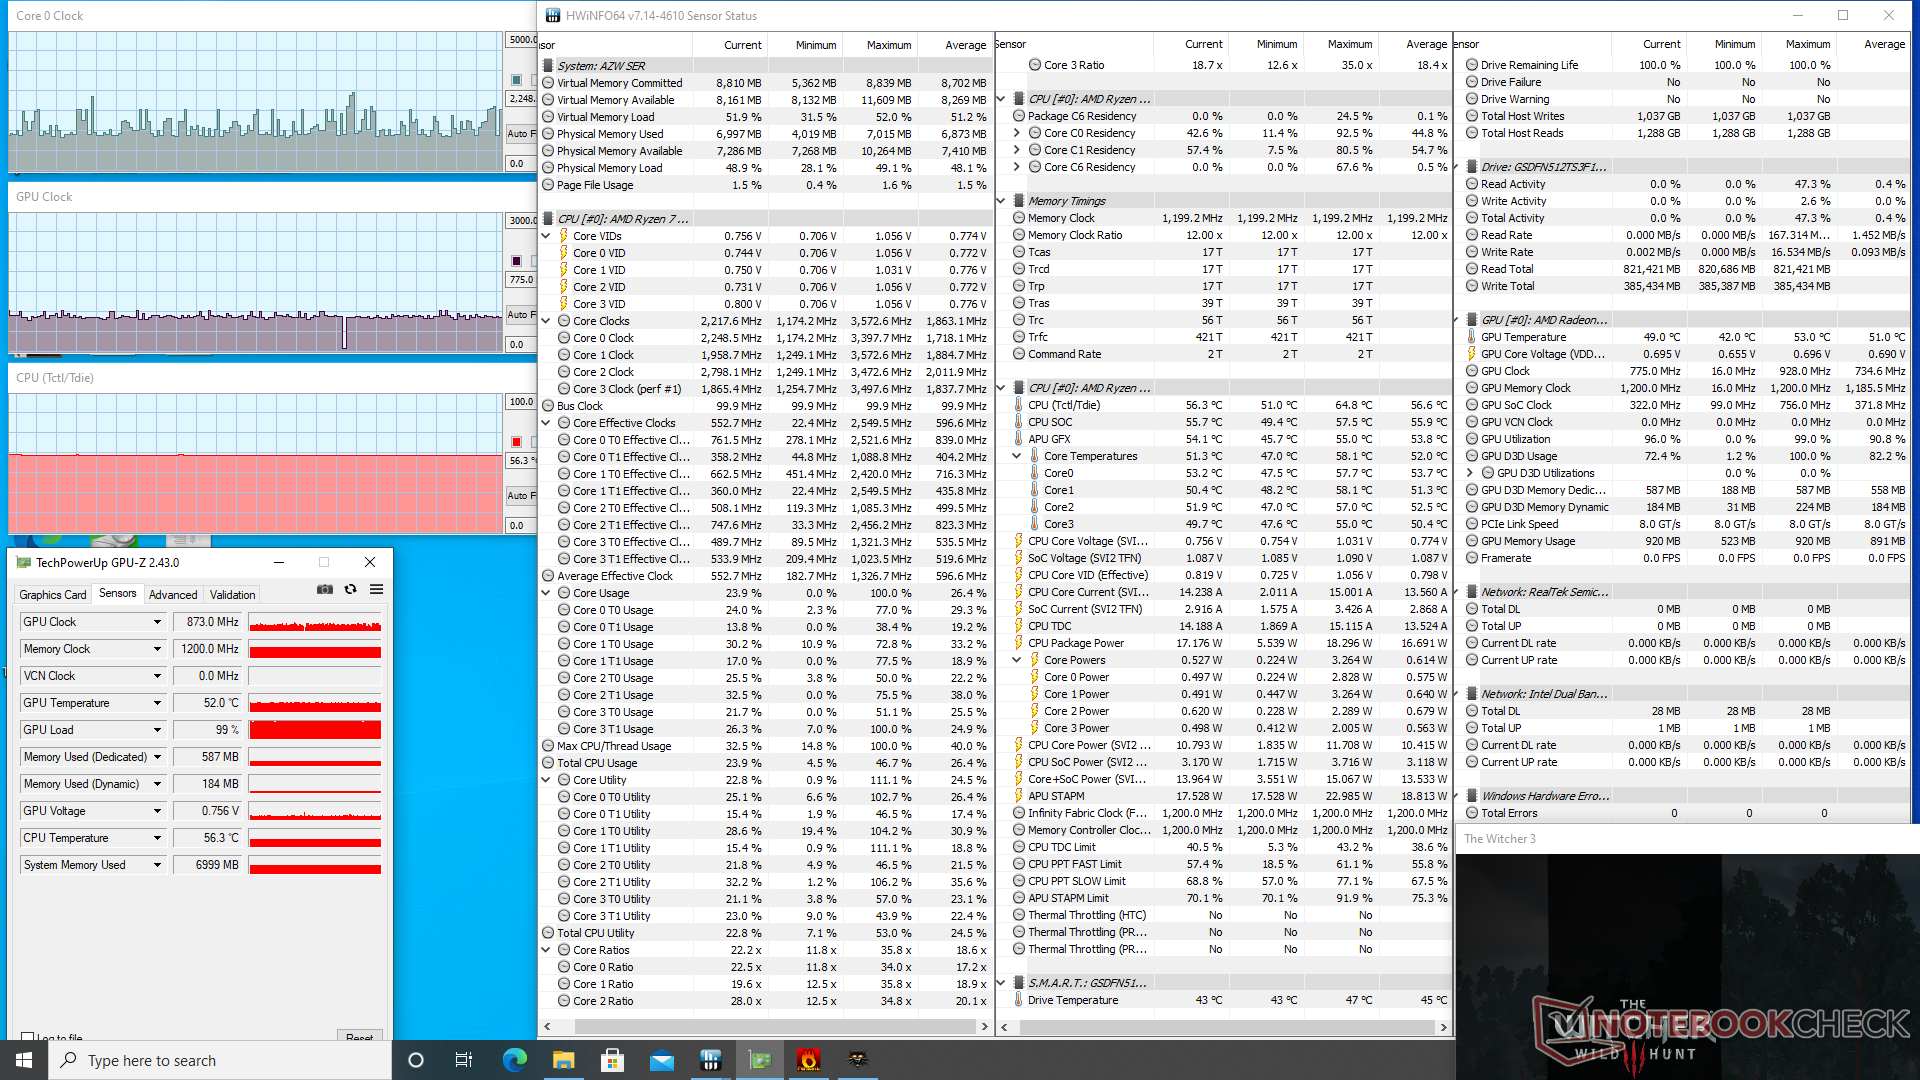
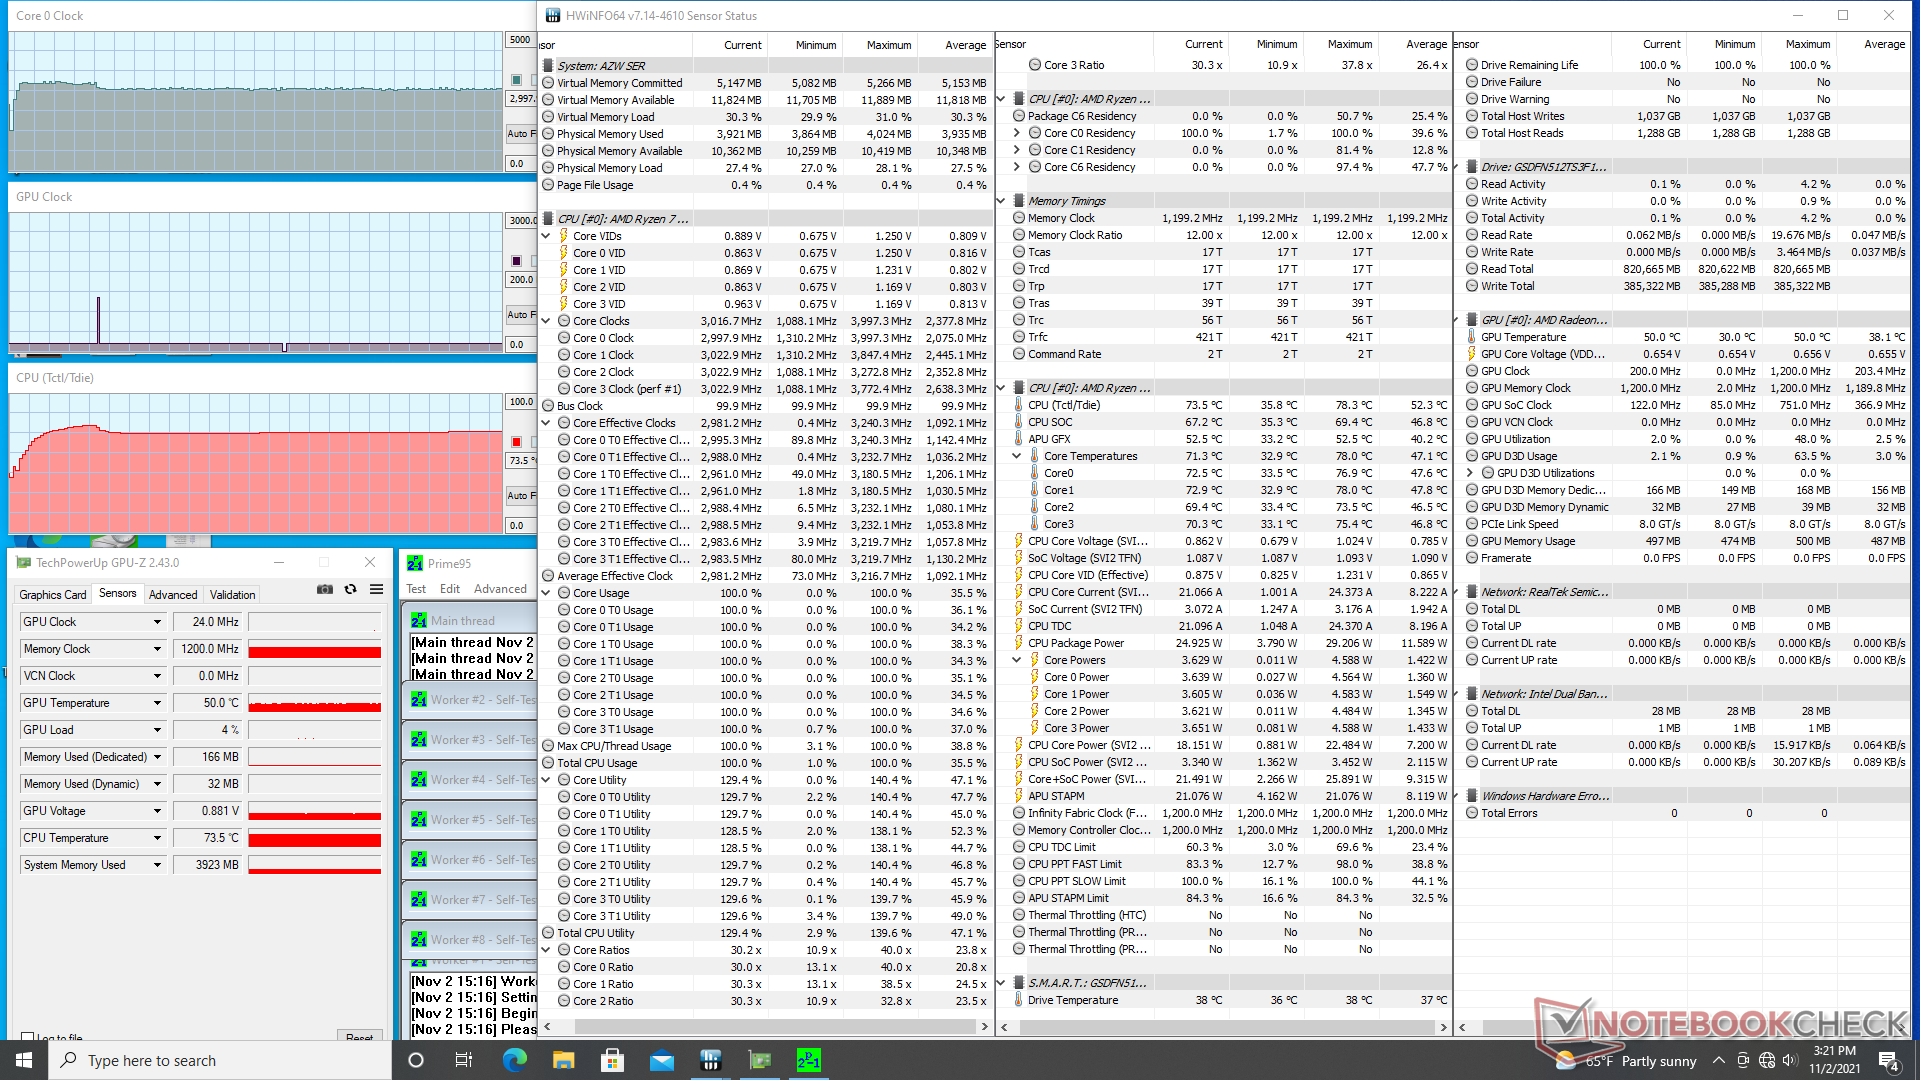
Test de stress
Lors de l'exécution de Prime95, les fréquences d'horloge du CPU augmentent à 3,3 GHz pendant la première minute jusqu'à atteindre une température de 78 C. Les fréquences d'horloge baissent ensuite à 3,0 GHz afin de maintenir une température de 72 C plus fraîche.
La température du cœur est relativement fraîche, 56°C en fonctionnement Witcher 3 par rapport à 62 C sur le Intel NUC11TNKi5 Pro.
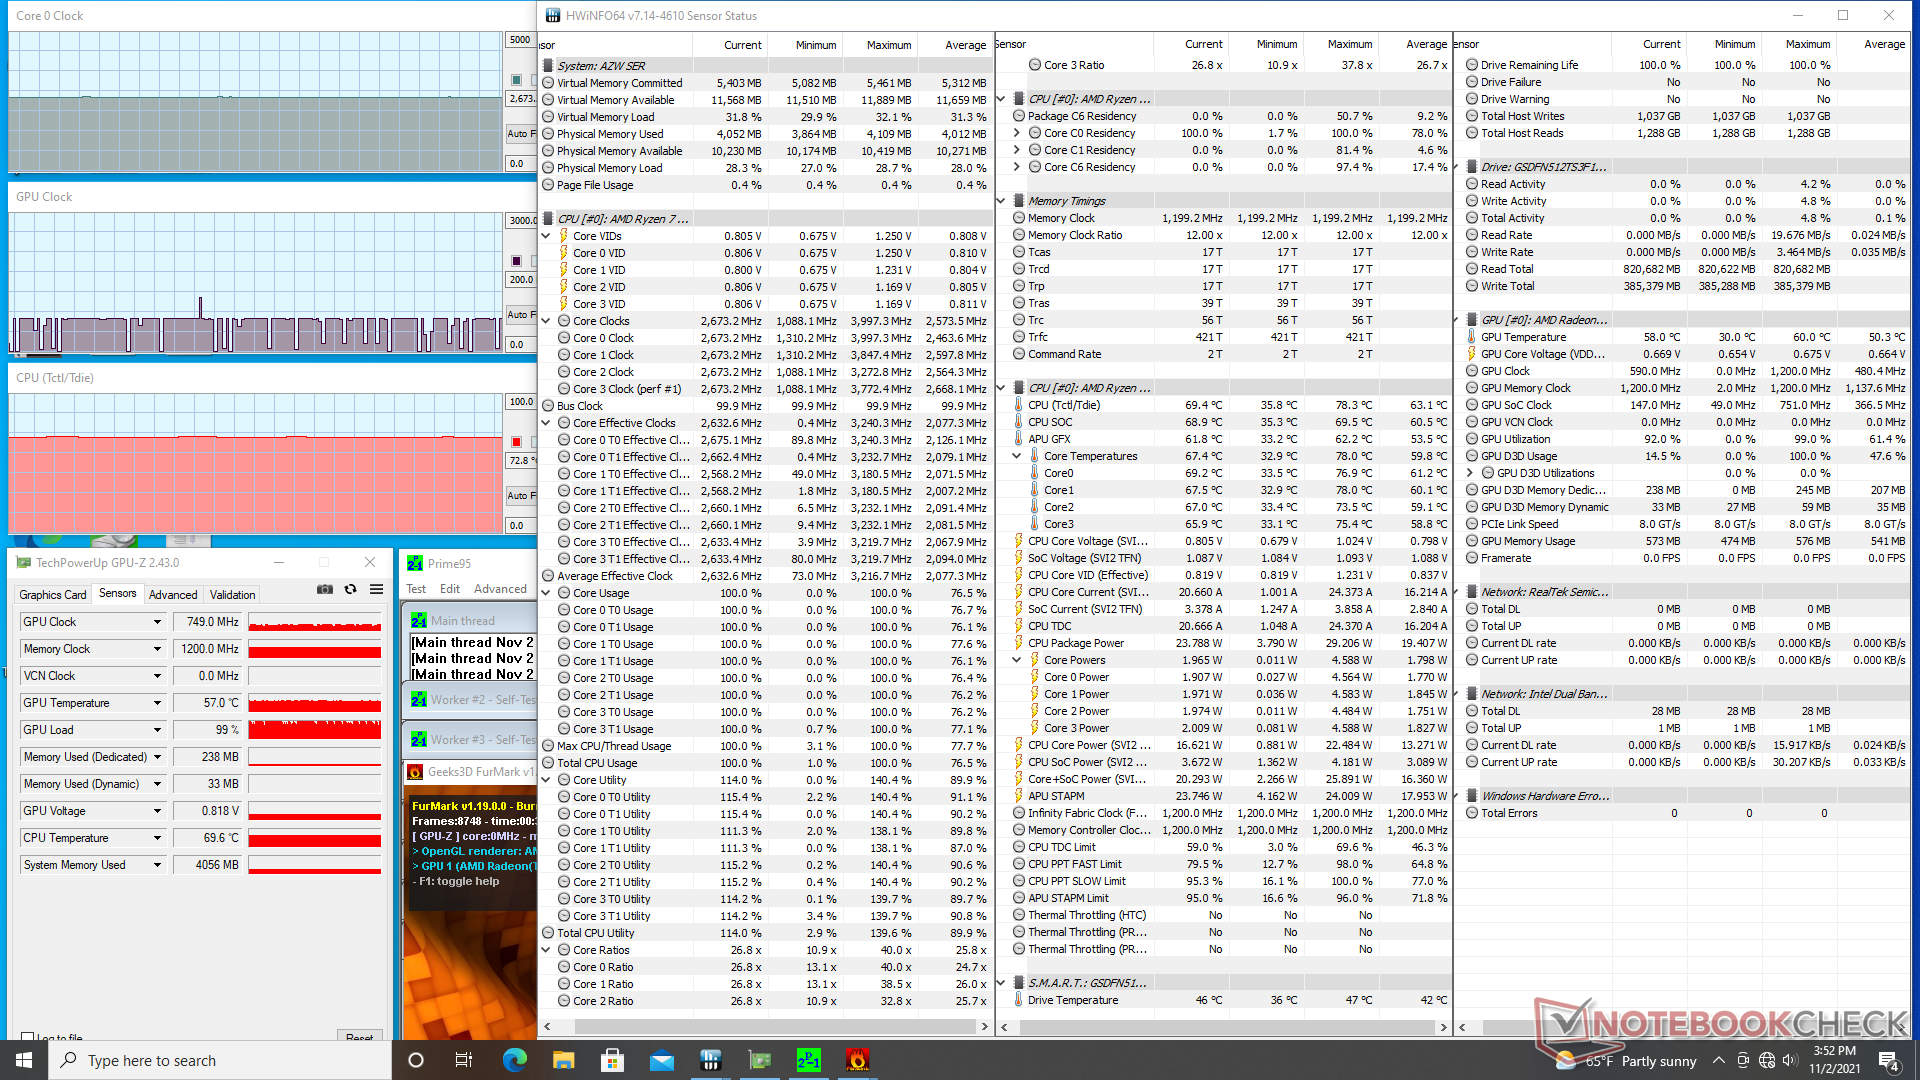
| Fréquence CPU(GHz) | Fréquence GPU(MHz) | Température CPUmoyenneTctl/Tdie (°C) |
| Système au repos | - | - |
| Prime95 Stress | 3.0 | -- |
| Prime95+ FurMark Stress | 2.7 | 749 |
| Witcher 3 Stress | 0.3 - 0.8 | ~873 |
Gestion de l'énergie
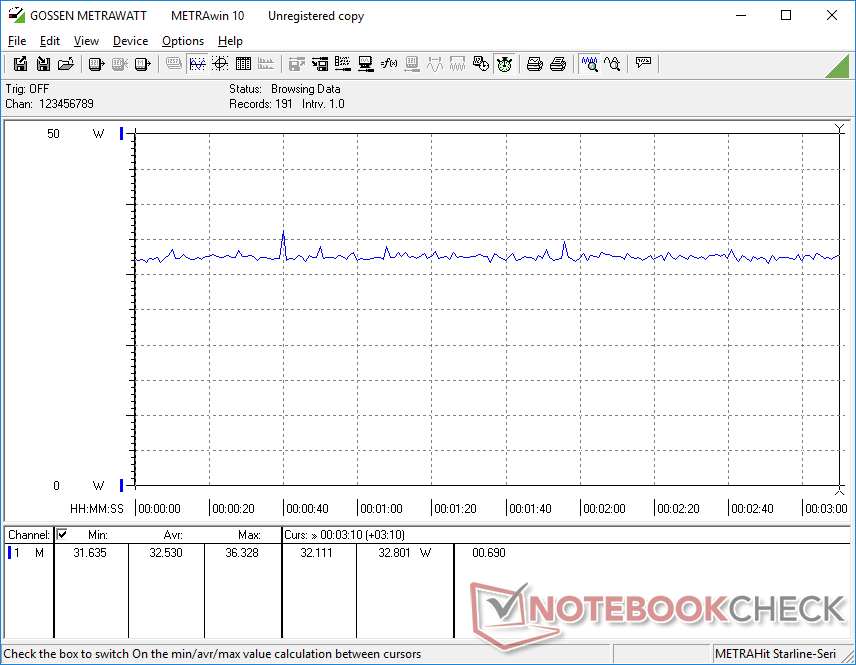
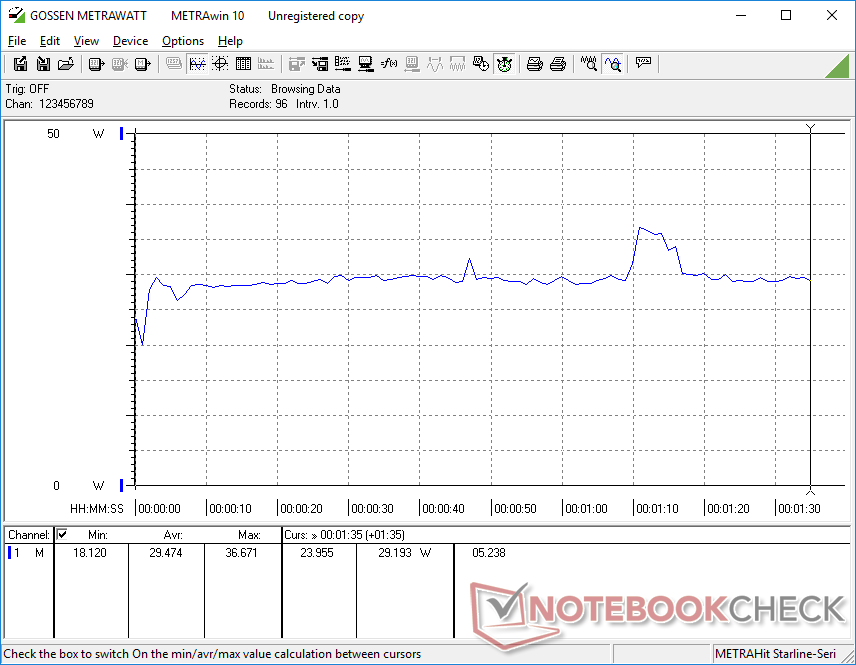
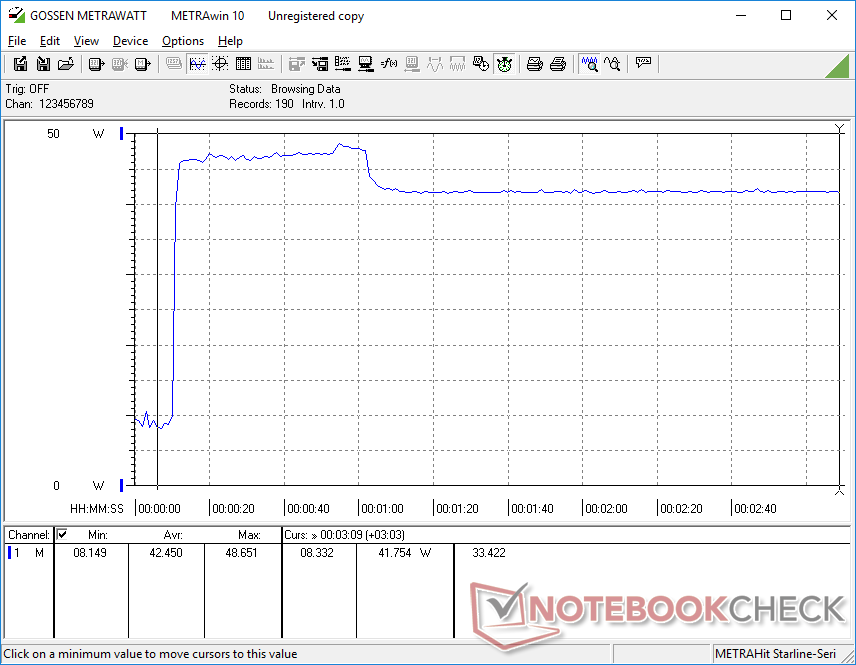
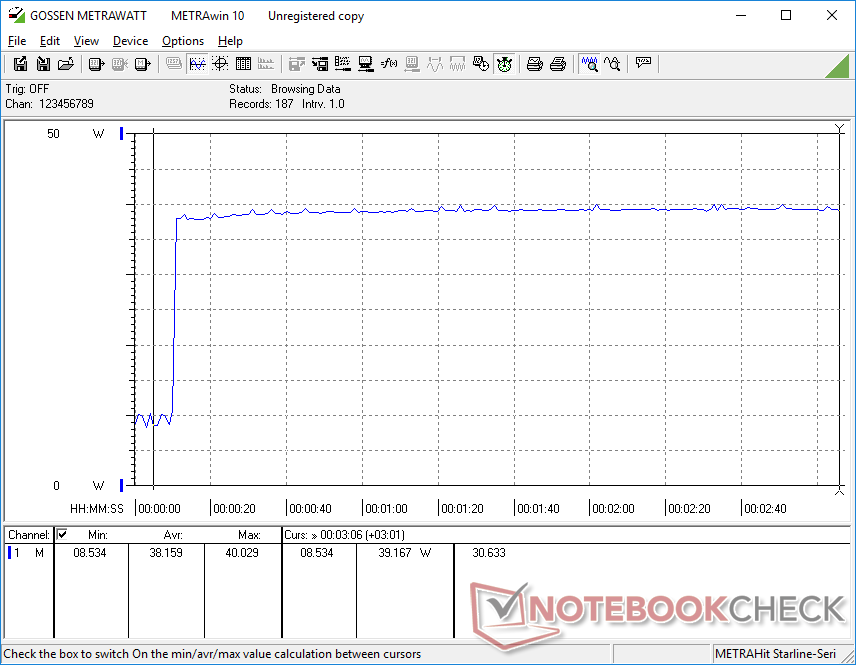
Consommation d'énergie
La consommation d'énergie en mode veille sur le bureau est légèrement supérieure à celle de la plupart des autres mini-PC équipés de processeurs Core série U, car notre SER3 utilise un processeur série H plus exigeant. Néanmoins, la consommation d'énergie lors de l'exécution de charges plus élevées est plus faible que prévu, avec seulement 30 à 40 W en moyenne
Nous sommes en mesure d'enregistrer un maximum d'un peu moins de 49 W à partir de l'adaptateur secteur 57 W de taille moyenne (~10 x 5 x 6 cm, y compris les broches) lorsque le CPU est utilisé à 100 %. Ce taux chute après environ une minute en raison des limitations thermiques.
| Éteint/en veille | |
| Au repos | |
| Fortement sollicité |
|
Légende:
min: | |
| Beelink SER3 R7 3750H, Vega 10, GSemi AZW GSDFN512TS3F1OGCX, , x, | Beelink SEi10 i3-1005G1, UHD Graphics G1 (Ice Lake 32 EU), Silicon Motion AZW 256G M.2280 NVMe 4X 200725 D, , x, | Intel NUC8i7BE i7-8559U, Iris Plus Graphics 655, , , x, | GMK NucBox 2 i5-8259U, Iris Plus Graphics 655, Netac S930E8/256GPN, , x, | Zotac ZBox MI643 i5-10210U, UHD Graphics 620, Lexar NM610 1TB, , x, | Intel NUC11TNKi5 i5-1135G7, Iris Xe G7 80EUs, Transcend M.2 SSD 430S TS512GMTS430S, , x, | |
|---|---|---|---|---|---|---|
| Power Consumption | 17% | -8% | 0% | -10% | -43% | |
| Idle Minimum * (Watt) | 7 | 6.3 10% | 2.7 61% | 6.1 13% | 7.5 -7% | 11.5 -64% |
| Idle Average * (Watt) | 9.1 | 6.6 27% | 3.1 66% | 6.8 25% | 9.2 -1% | 12.4 -36% |
| Idle Maximum * (Watt) | 9.7 | 6.7 31% | 6.3 35% | 7.3 25% | 9.6 1% | 12.9 -33% |
| Load Average * (Watt) | 29.5 | 25.9 12% | 59.7 -102% | 46.3 -57% | 34.4 -17% | 40.7 -38% |
| Witcher 3 ultra * (Watt) | 32.5 | 47.2 -45% | 43.9 -35% | |||
| Load Maximum * (Watt) | 48.7 | 46.7 4% | 78 -60% | 50.7 -4% | 60.6 -24% | 73.5 -51% |
* ... Moindre est la valeur, meilleures sont les performances
Power Consumption Witcher 3 / Stresstest
Points positifs
Points négatifs
Verdict
Pour moins de 500 dollars américains, les utilisateurs obtiennent un mini-PC prêt pour le HTPC avec un niveau de performance similaire à celui du Core i5-8259U de certains NUC d'Intel. Le système est plusieurs fois supérieur aux autres mini-PC bon marché fonctionnant avec des CPU Atom ou Celeron, comme le Chuwi LarkBox ou GBox qui sont notoirement lents même lorsqu'ils exécutent des applications peu exigeantes. Nous apprécions le fait que Beelink propose le SER3 en tant que PC prêt à l'emploi avec RAM et stockage, alors que les NUC d'Intel sont presque toujours vendus en tant qu'unités de base nues.
Le SER3 de Beelink est un HTPC discret et facile à utiliser avec des options de mise à jour accessibles. Préparez-vous à un peu de bruit de ventilateur, surtout lorsque vous exécutez des applications très exigeantes.
Les acheteurs doivent être conscients que le SER3 omet une poignée de fonctions auxiliaires susceptibles de maintenir les coûts bas. Il n'y a pas de verrou Kensington, de lecteur SD, de récepteur IR, ou de support Thunderbolt, tandis que le DP-over-USB-C peut être peu fiable. Le ventilateur émet des impulsions fréquentes et l'adaptateur secteur à prise murale est à la fois épais et court. Le SSD NVMe inclus, bien que relativement rapide, voit ses performances diminuer lorsqu'il est sollicité en raison de l'absence d'un dissipateur thermique intégré.
Prix et disponibilité
Le Beelink SER3 peut être trouvé sur sur Amazon pour 479 USD avec 8 Go de RAM et 256 Go de SSD ou 559 USD avec le double de RAM et de stockage.
No, or more than one (0) Rating for the given SpecsID 326081 found

