Test de l'Intel Phantom Canyon NUC11PHKi7C : Kaby Lake G est de l'histoire ancienne
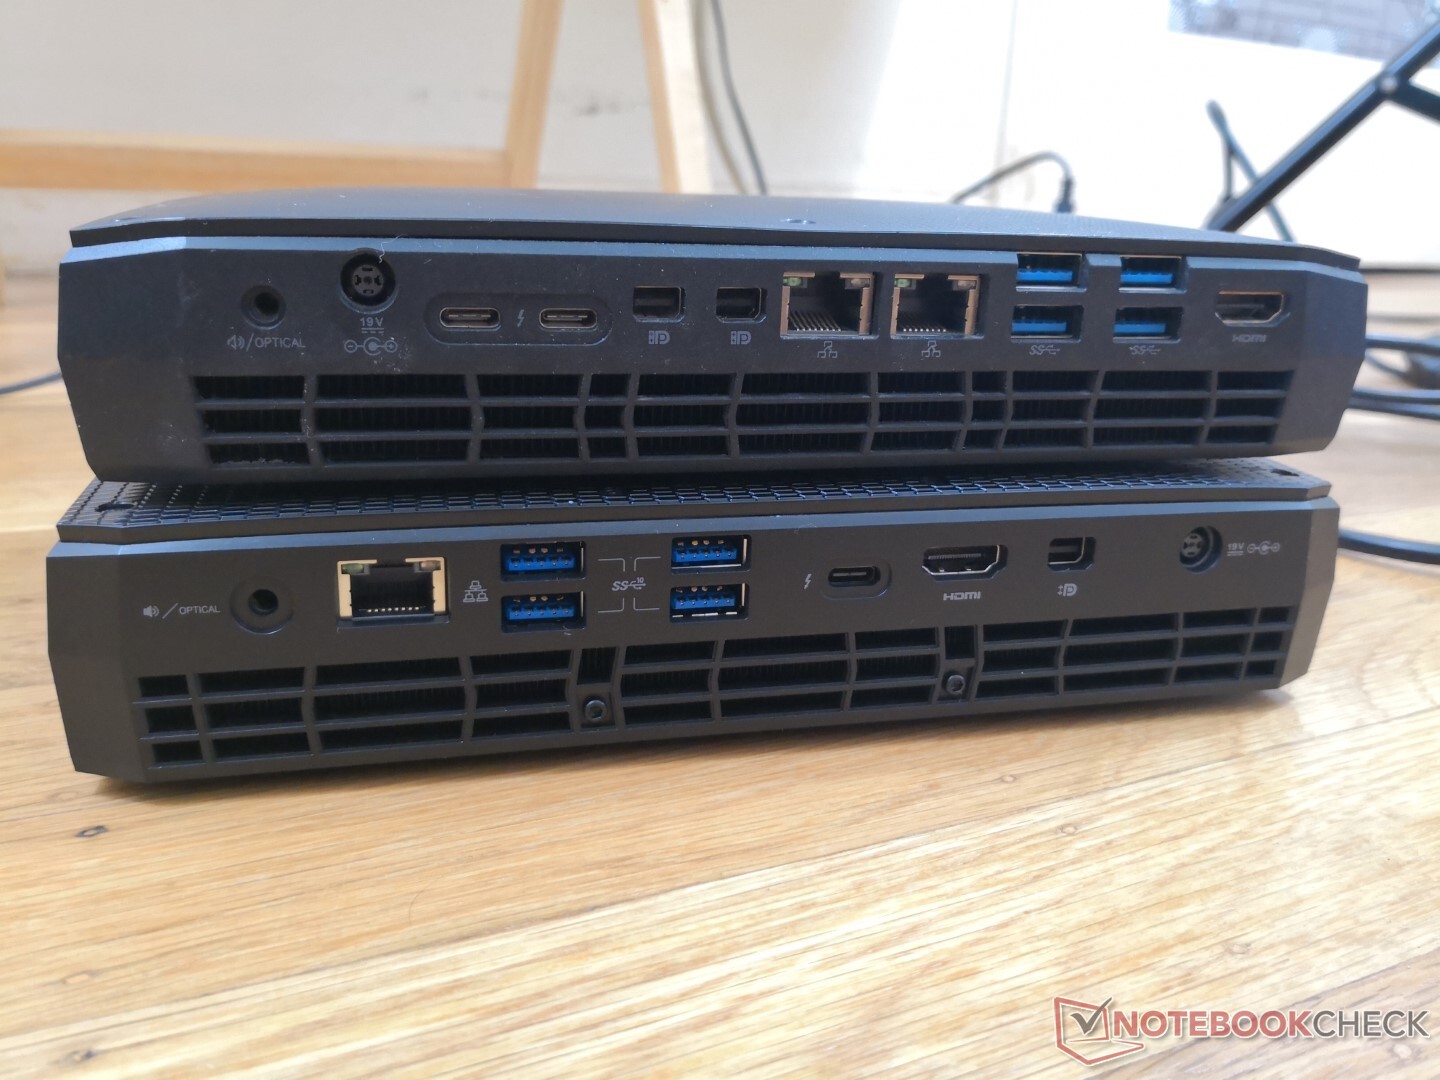
 vs. 2018 Intel Hades Canyon (droite)")
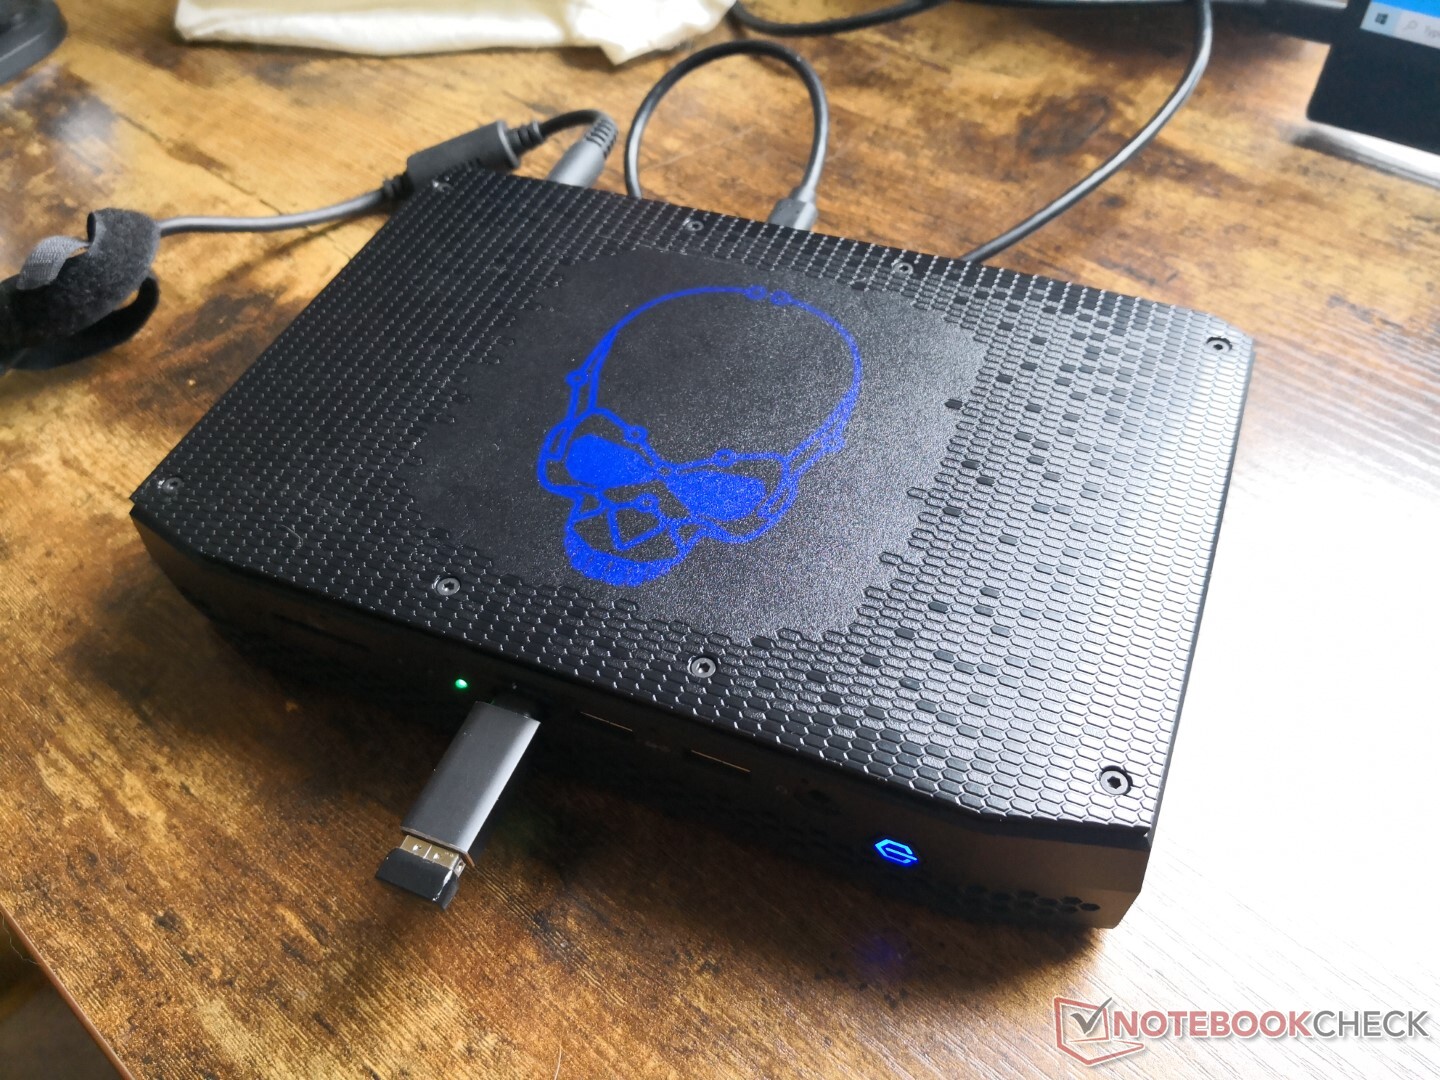
(Mise à jour du 26 avril 2021: Nous sommes en train de confirmer avec Intel si le NUC11PHK prend en charge G-Sync ou non et si le crâne éclairé par des LED bleues peut être changé en différentes couleurs. La page sera mise à jour dès que nous aurons les informations)
Contrairement à la version plus lente et moins chère du NUC11TNK ou NUC11PAQle NUC11PHK Phantom Canyon est équipé en standard d'un GPU discret GeForce RTX 2060 pour des performances graphiques et un potentiel de jeu nettement supérieurs. Il succède directement au NUC8 Hades Canyon et non au NUC9 Extreme car son châssis ressemble davantage au premier qu'au second.
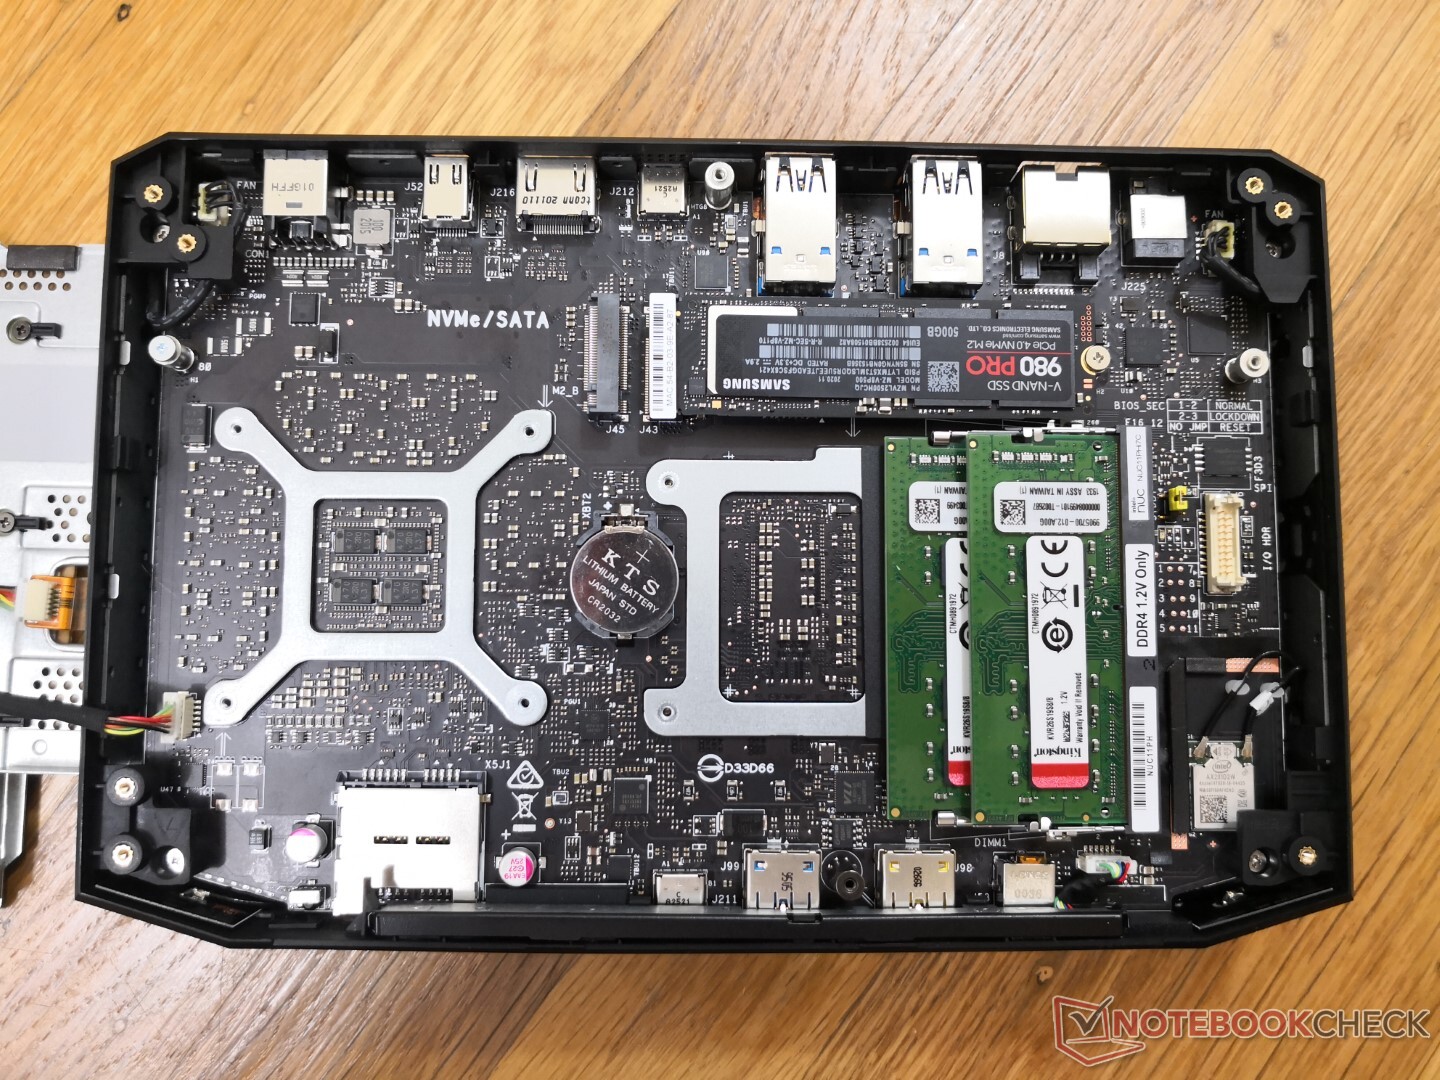
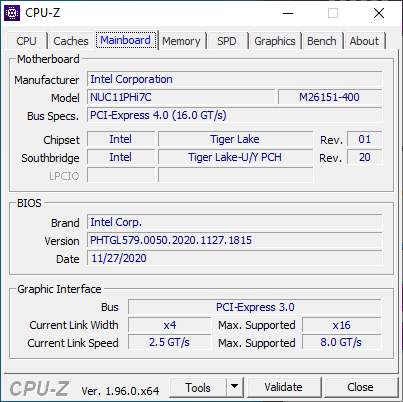
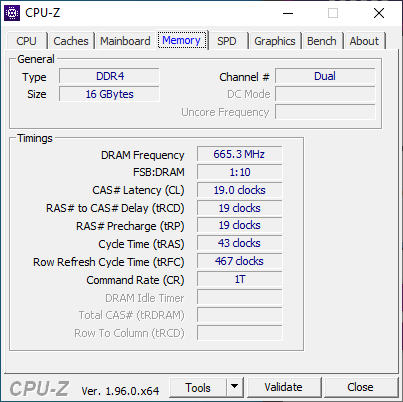
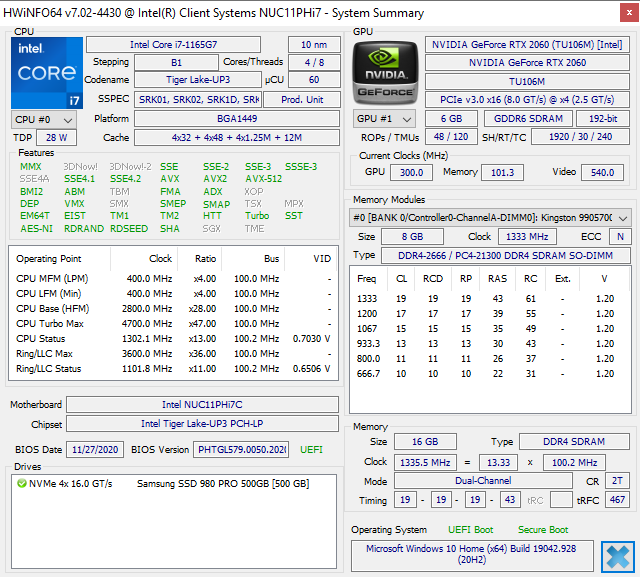
Phantom Canyon est livré en tant que kit barebones et nous avons donc choisi d'installer un SSD Samsung 980 Pro NVMe avec 16 Go de RAM DDR4-2666 à double canal pour nos besoins de révision. Le NUC lui-même peut prendre en charge une RAM plus rapide, jusqu'à 3200 MHz.
Plus d'articles sur les NUC d'Intel :
potential competitors in comparison
Note | Date | Modèle | Poids | Épaisseur | Taille | Résolution | Prix |
|---|---|---|---|---|---|---|---|
v (old) | 04/21 | Intel NUC11PHKi7C i7-1165G7, GeForce RTX 2060 Mobile | 1.4 kg | 42 mm | x | ||
v (old) | 04/18 | Intel Hades Canyon NUC8i7HVK i7-8809G, Vega M GH | 1.3 kg | 39 mm | x | ||
v (old) | 02/21 | Intel NUC11PAQi7 i7-1165G7, Iris Xe G7 96EUs | 647 g | 56 mm | x | ||
v (old) | 03/21 | GMK NucBox 2 i5-8259U, Iris Plus Graphics 655 | 430 g | 50 mm | x | ||
v (old) | 03/18 | Zotac ZBOX Magnus EK71080 i7-7700HQ, GeForce GTX 1080 (Desktop) | 3.3 kg | 128 mm | 0.00" | x | |
v (old) | 02/21 | Aorus Gaming Box GeForce RTX 2080 Ti i7-1165G7 | 3.8 kg | 140 mm | x | ||
v (old) | Beelink GTR35 II-G-16512D00W64PRO-1T R5 3550H, Vega 8 | 843 g | 39 mm | x |
Cas
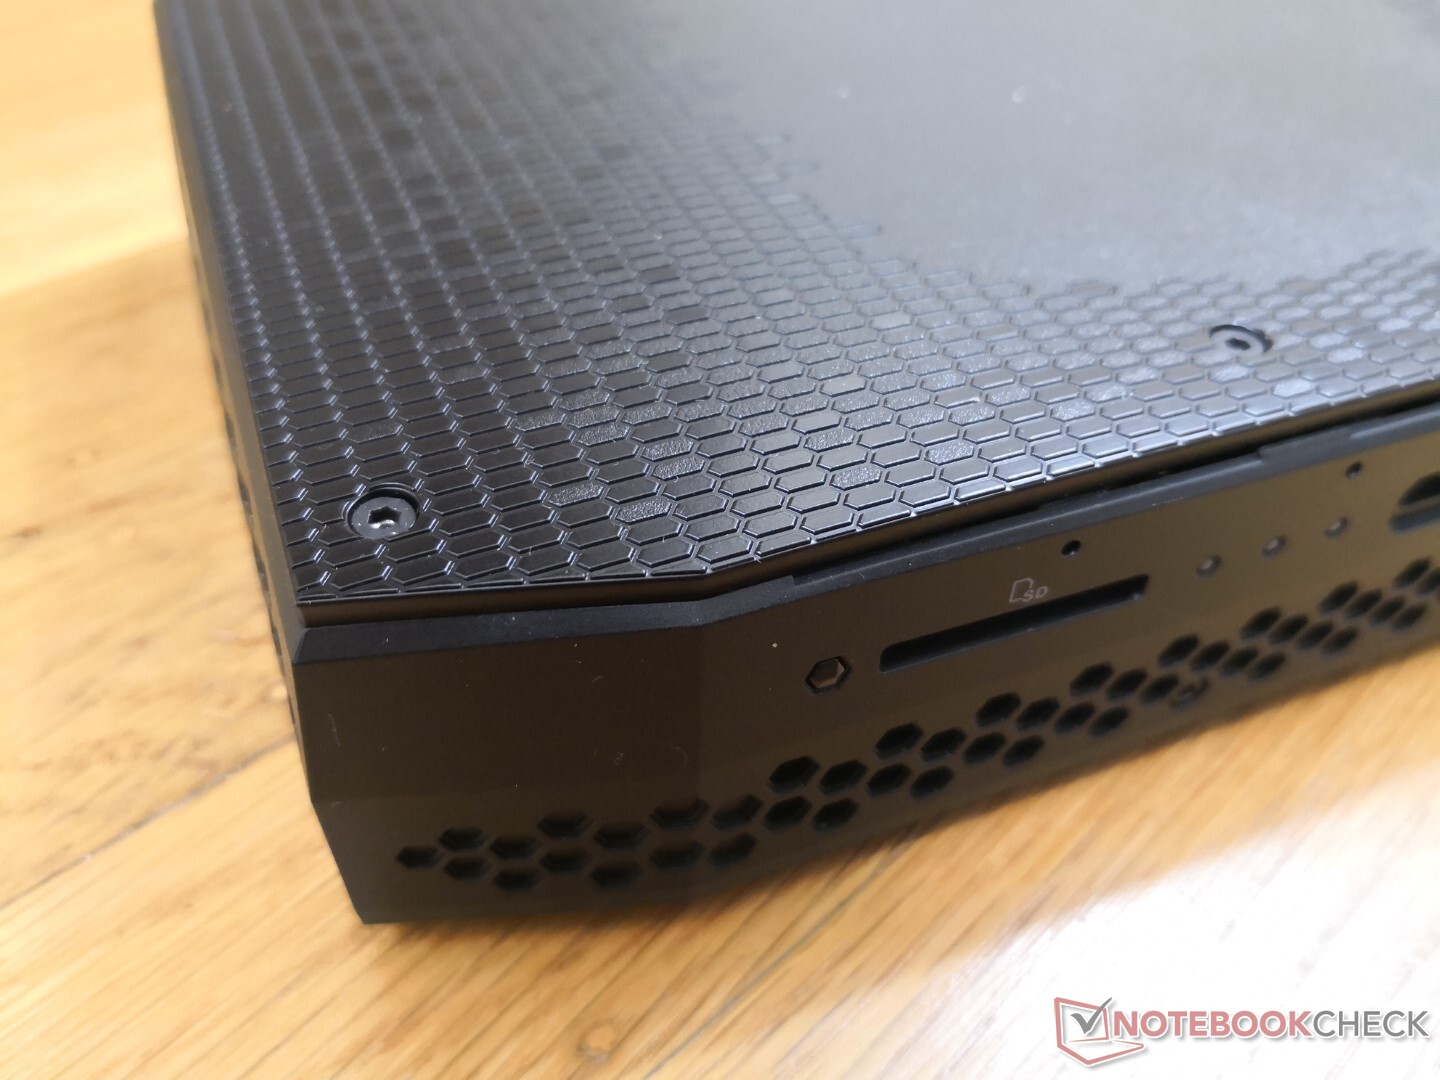
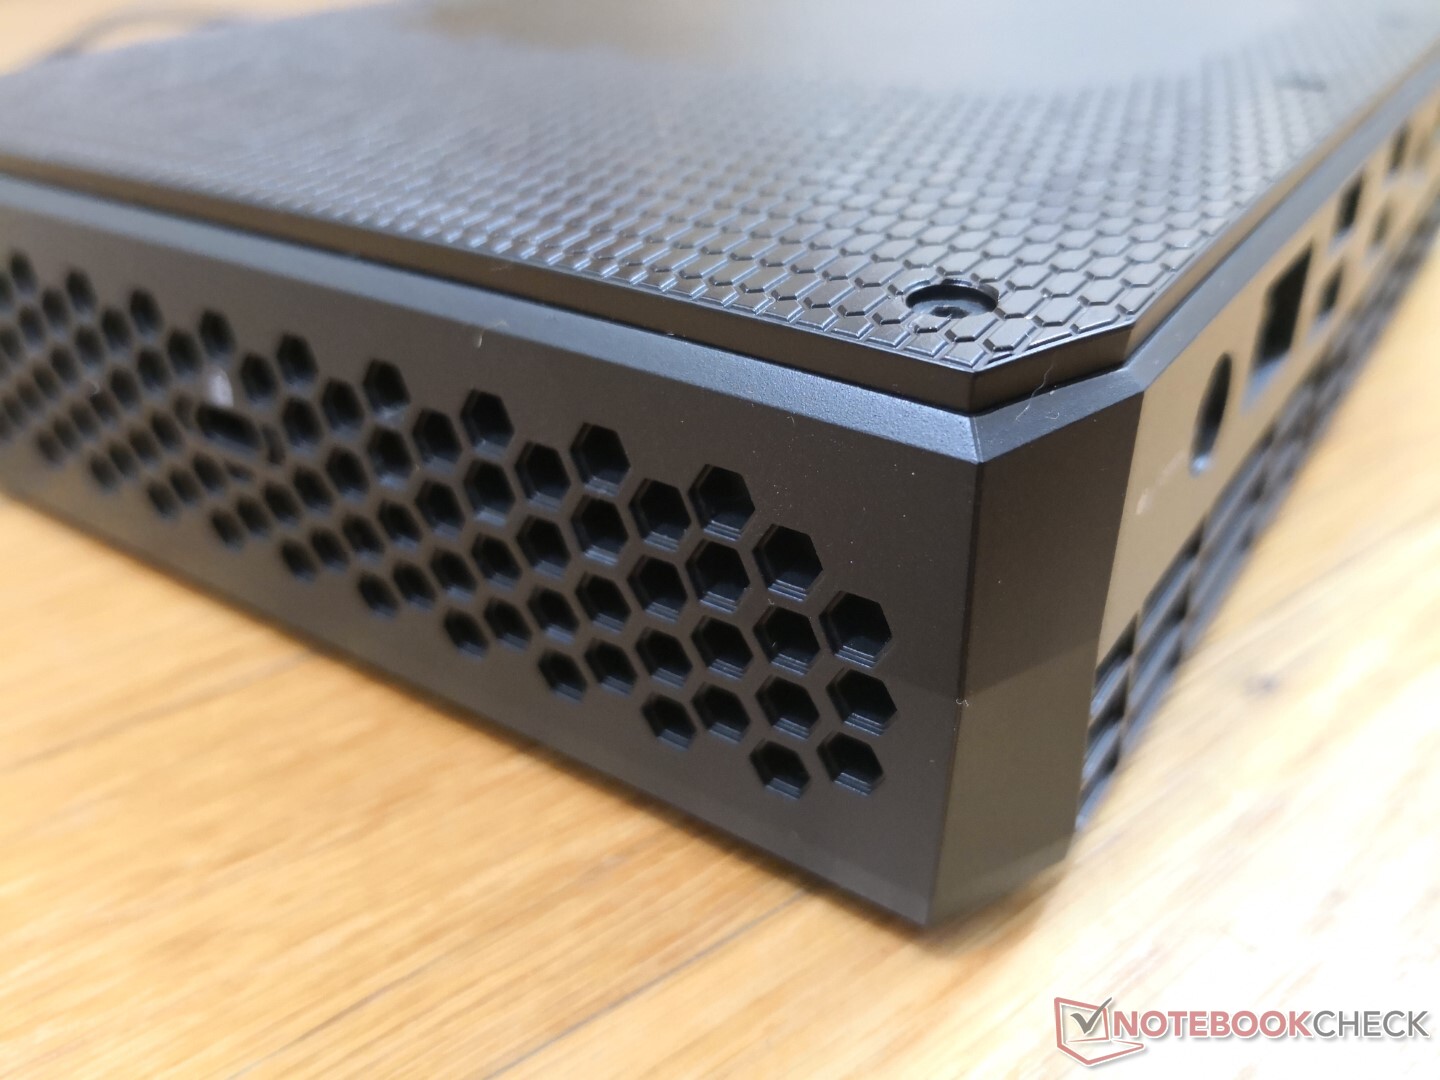
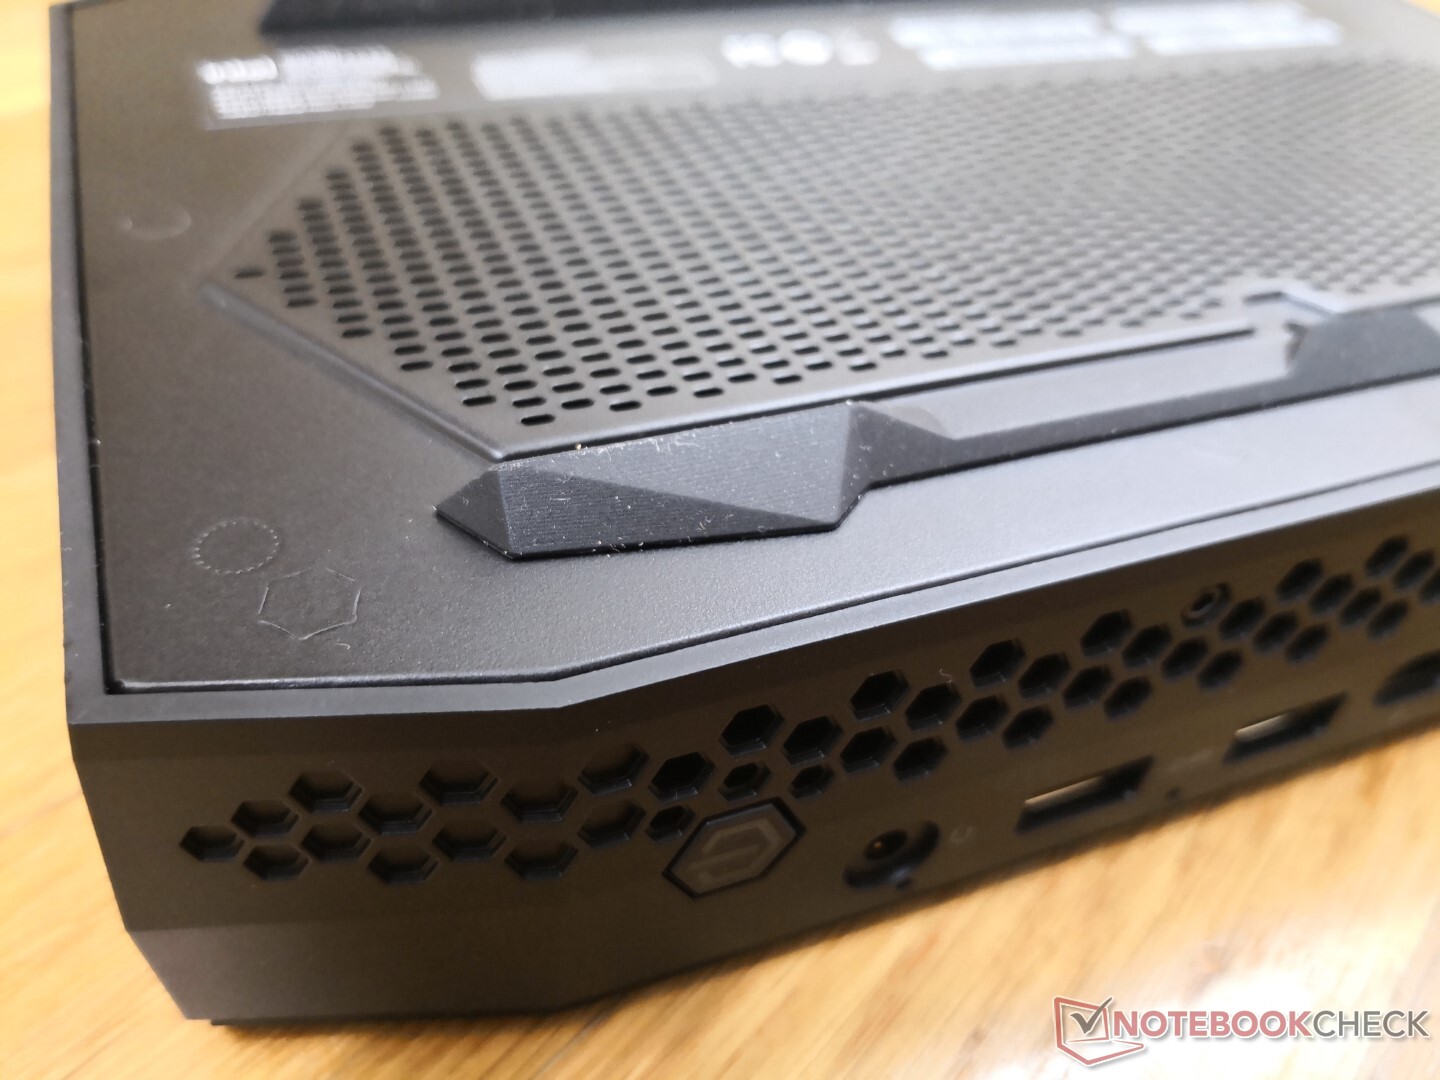
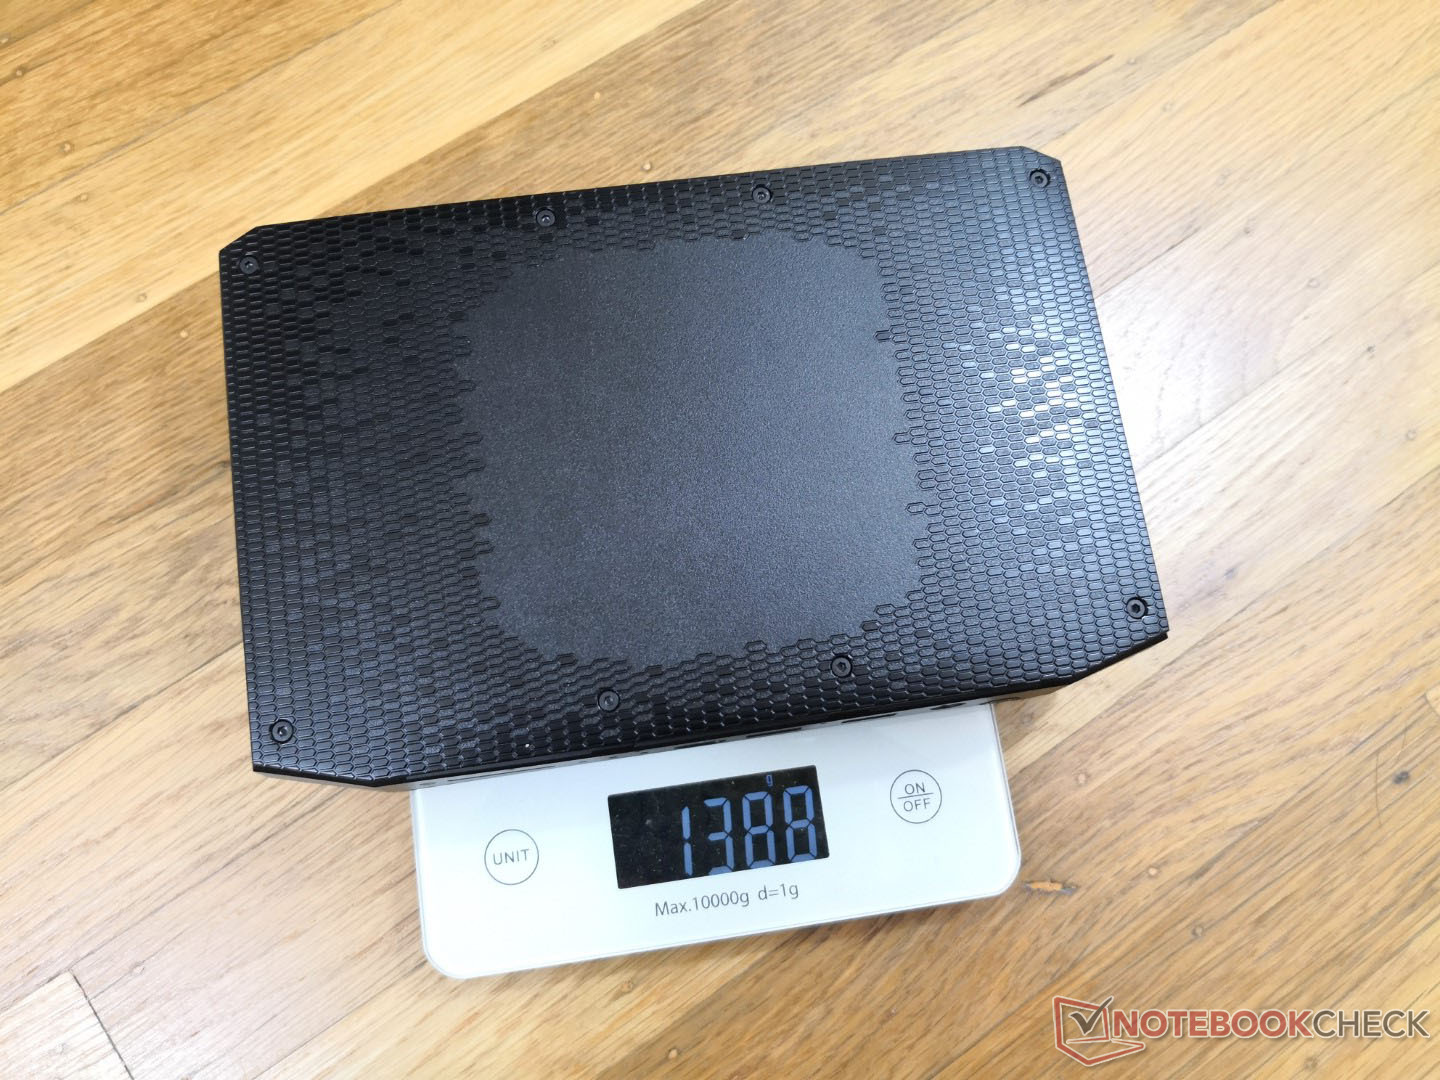
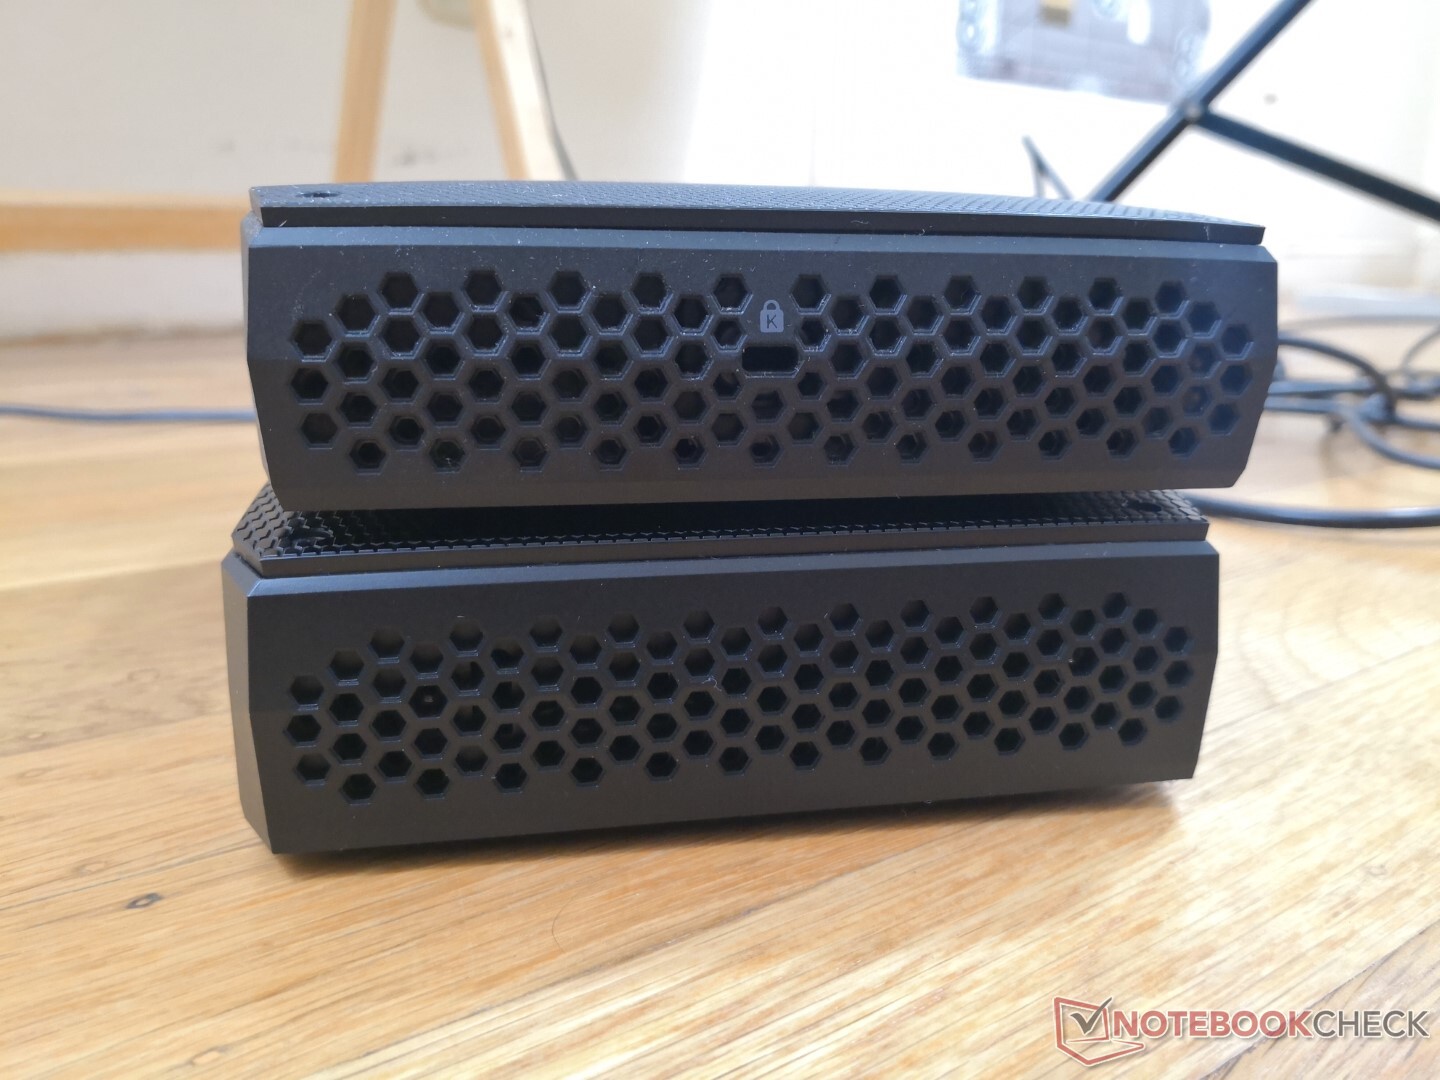
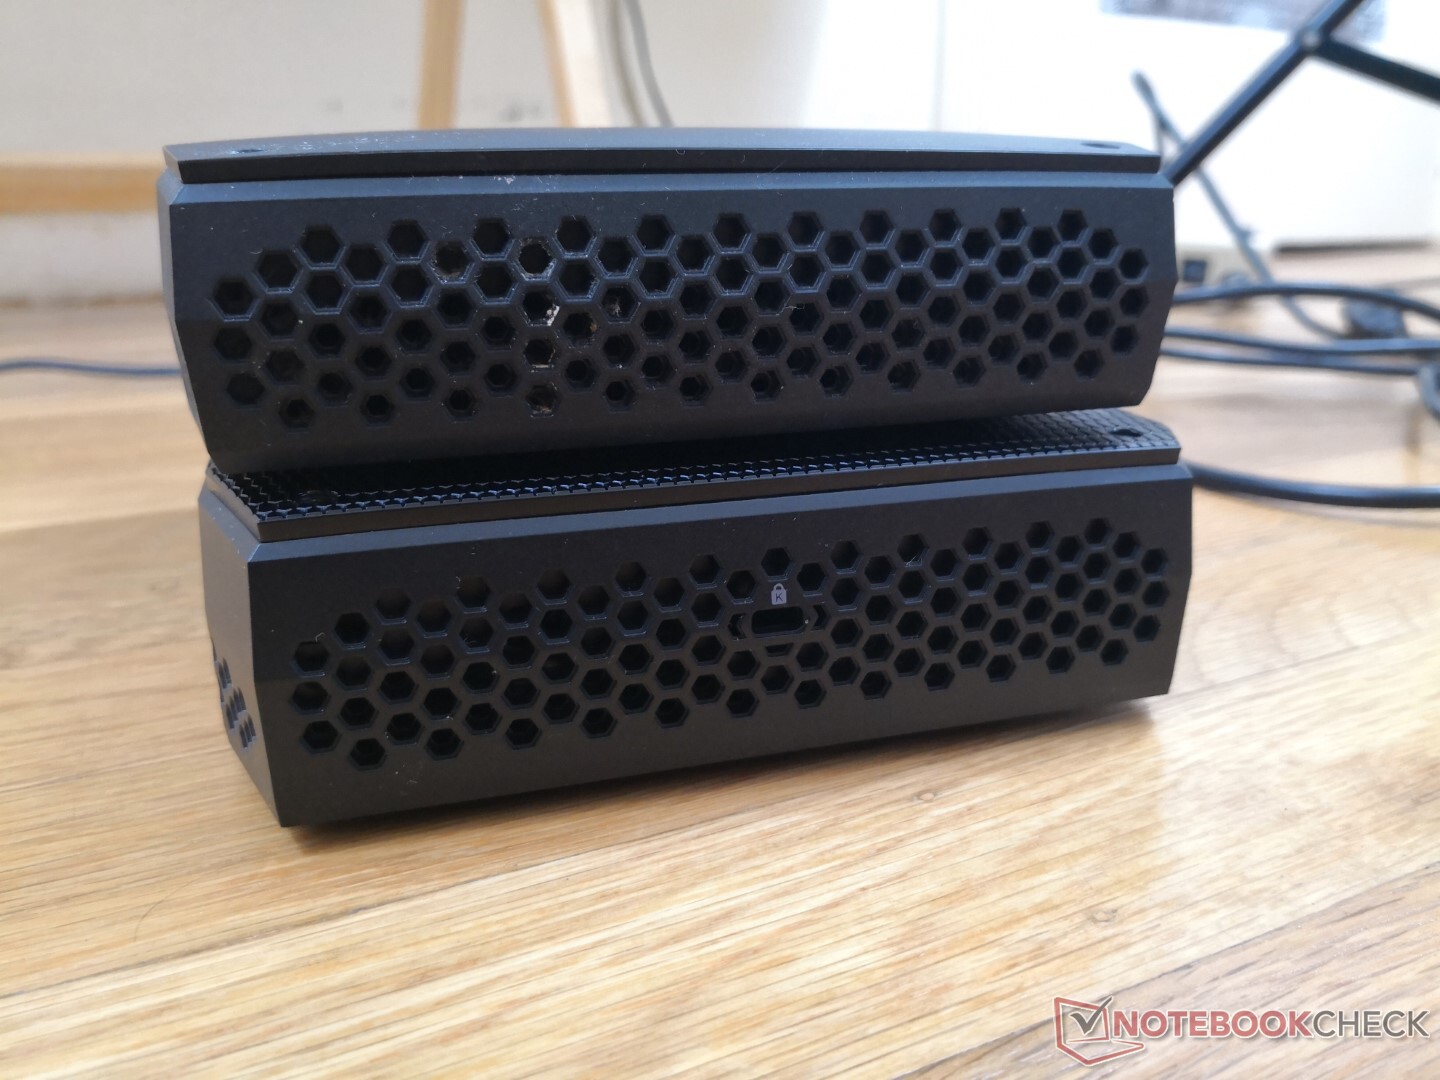
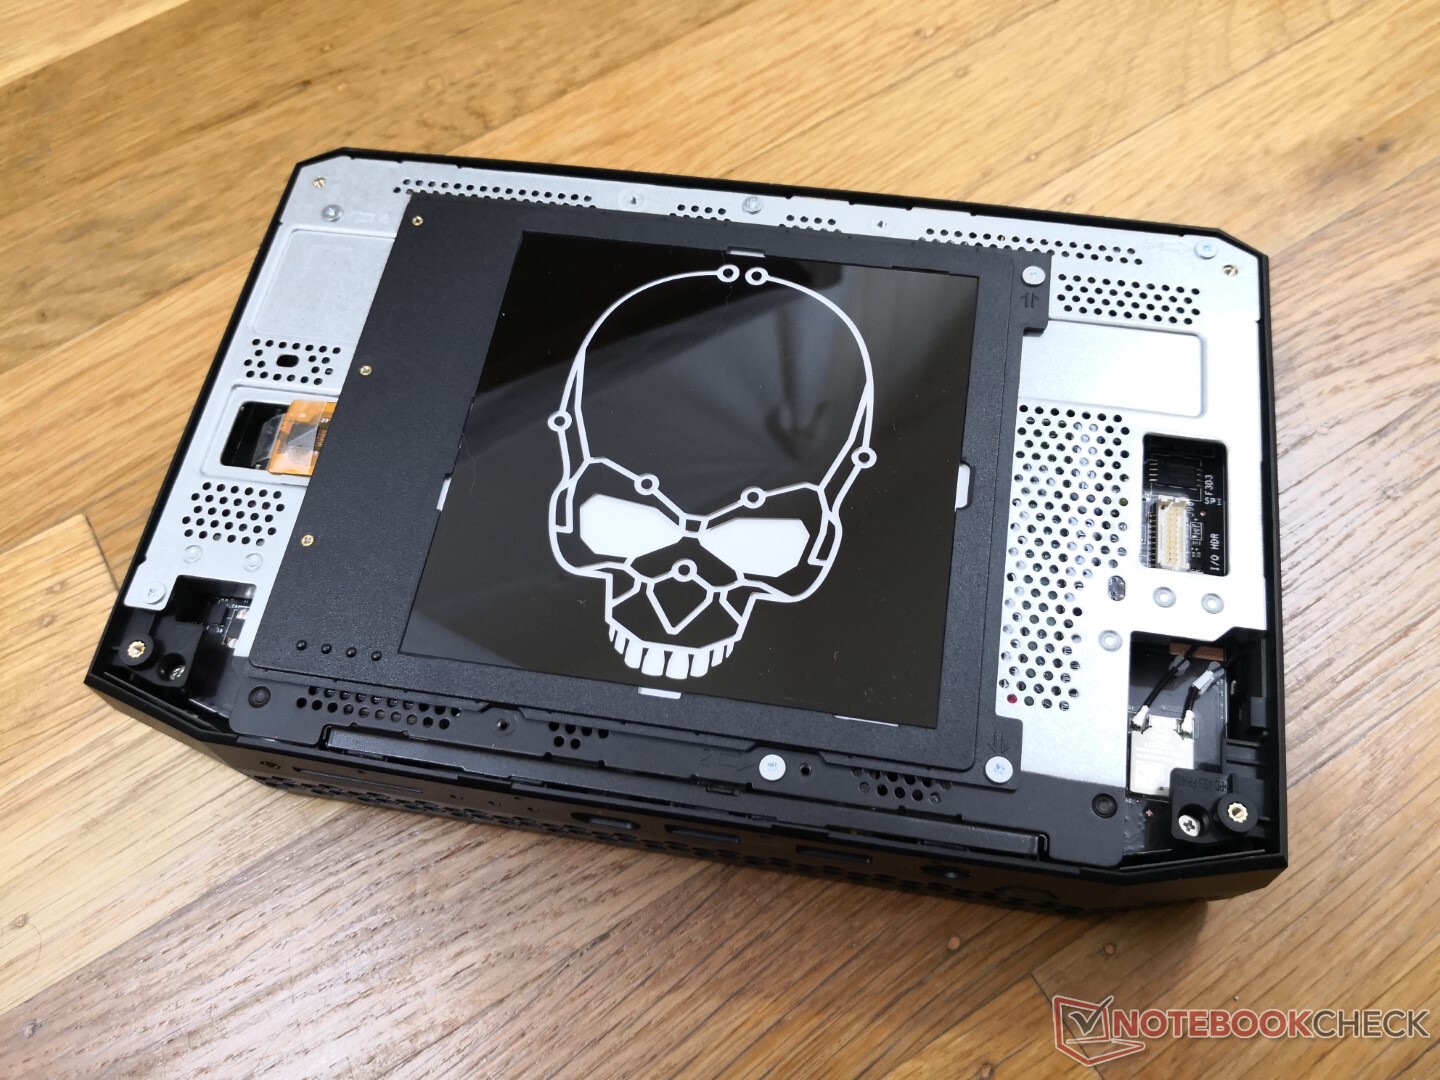
Les matériaux et la taille du châssis sont essentiellement les mêmes que sur le NUC Hades Canyon, avec juste de légers changements cosmétiques au niveau des textures et des grilles de ventilation. Cependant, le Phantom Canyon est légèrement plus épais (42 mm contre 39 mm) et plus lourd (1,4 kg contre 1,3 kg) que son prédécesseur immédiat afin de mieux accueillir les processeurs plus gourmands en énergie et pour la nouvelle plaque frontale amovible éclairée par LED.
Connectivité
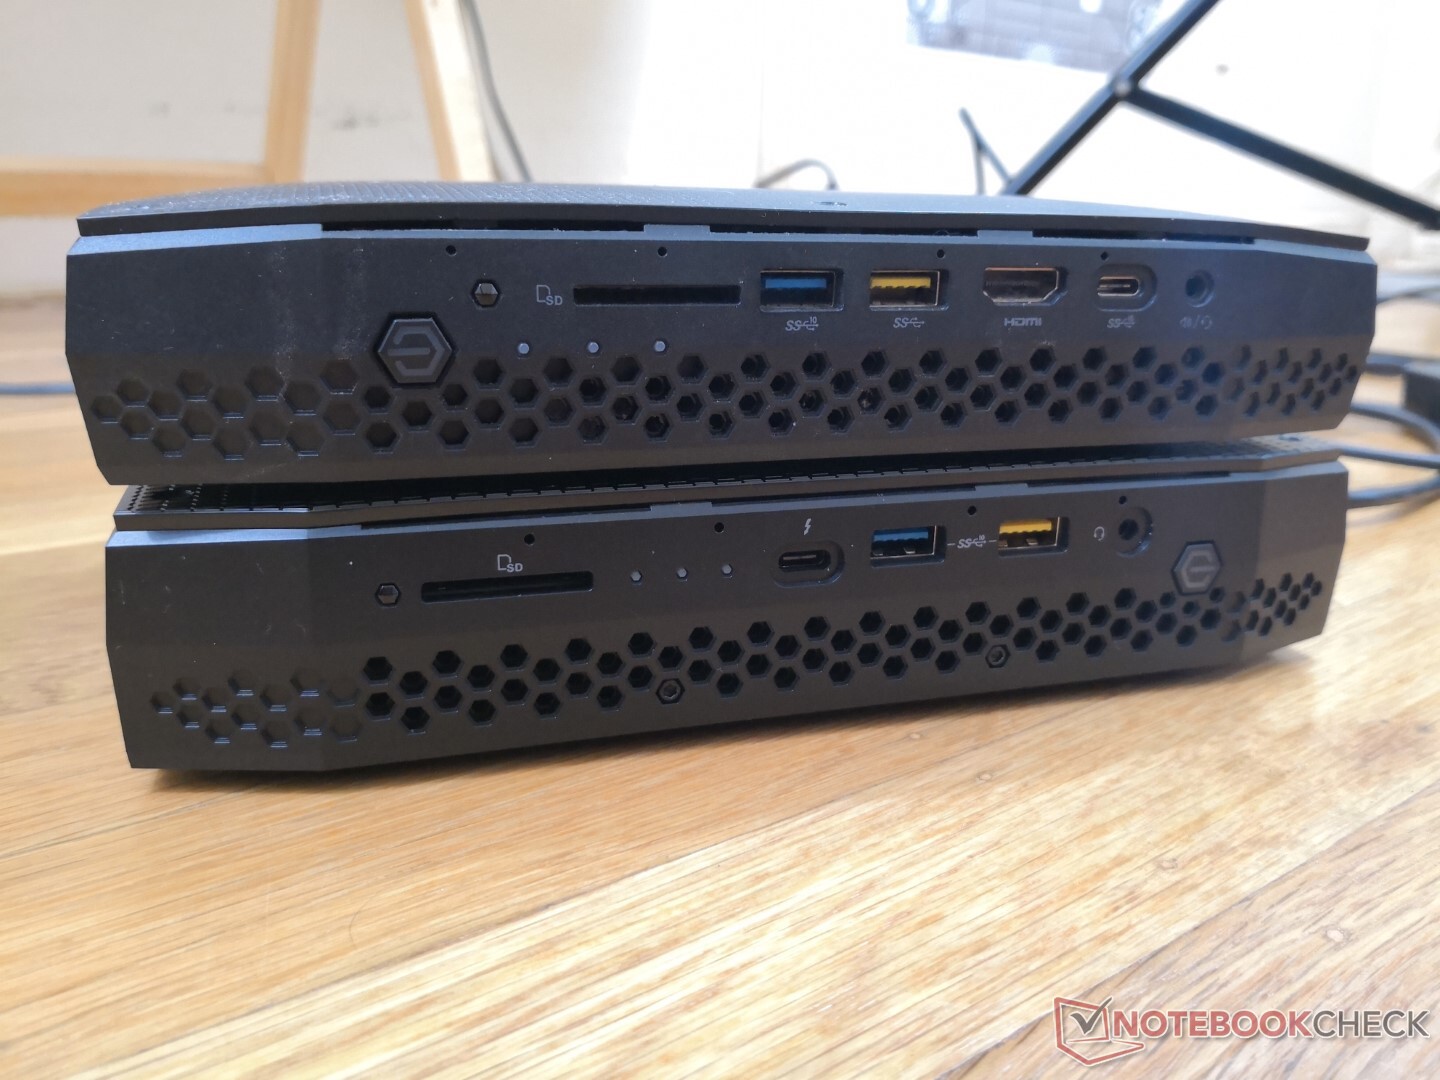
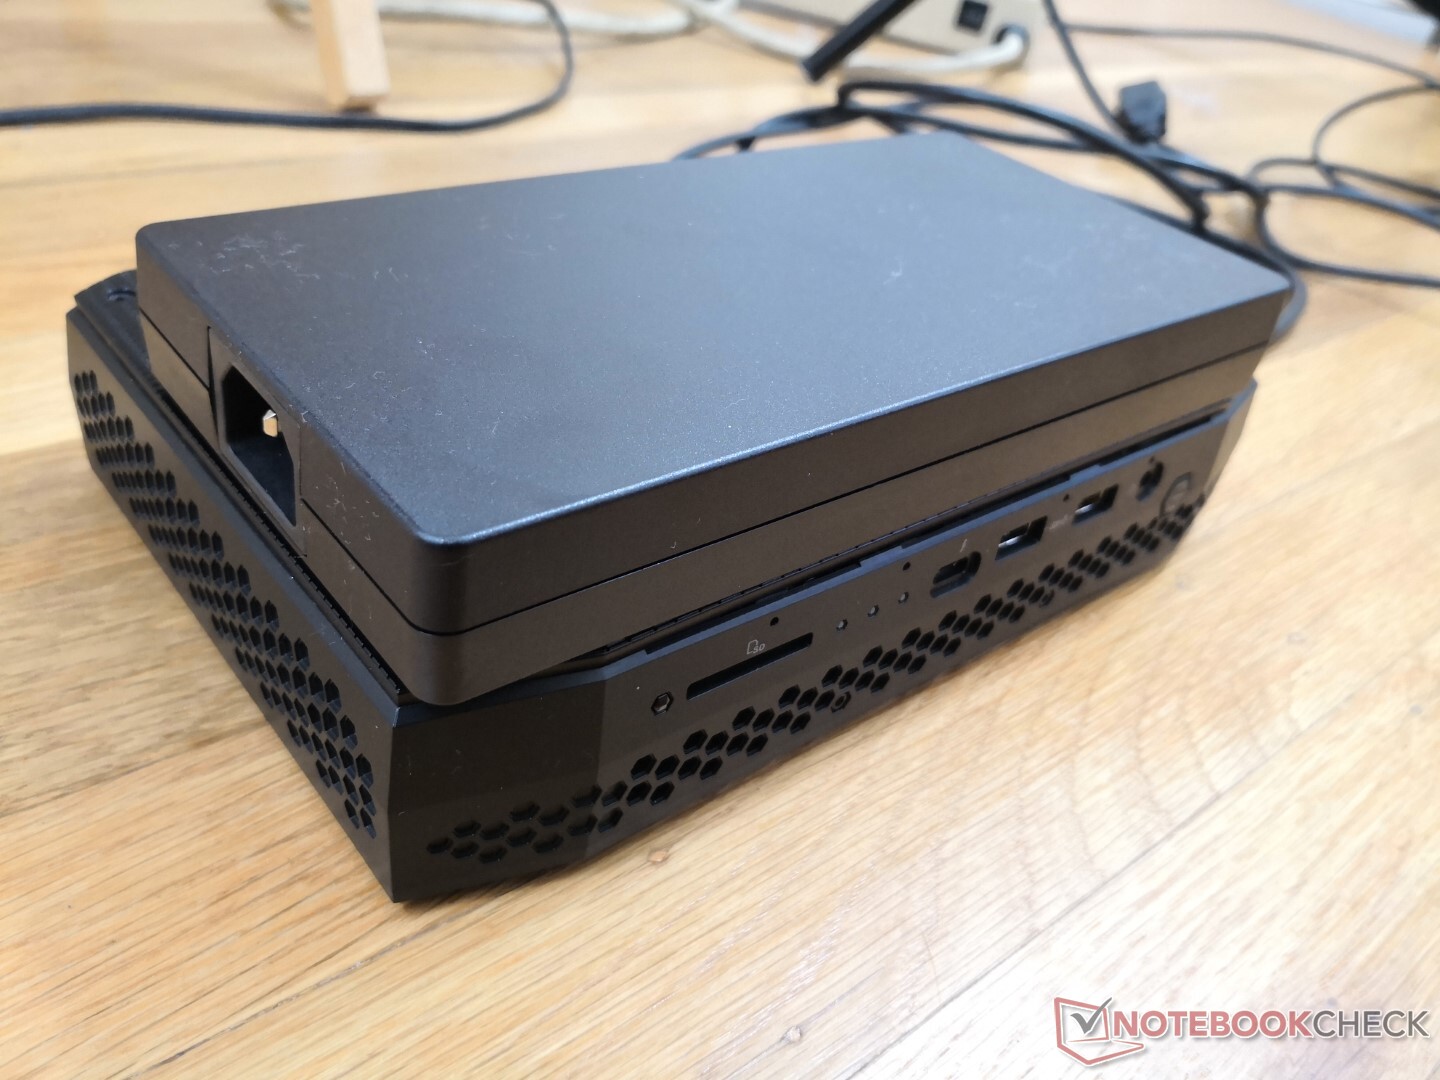
Les options de port ont changé par rapport au Hades Canyon de 2018 . Il n'y a plus qu'un port RJ-45, un port HDMI, un mini-DisplayPort et deux USB-C w/ Thunderbolt 4 au lieu de deux RJ-45, deux HDMI, deux mini-DisplayPort et trois USB-C sur le modèle précédent. Les six ports USB-A sont conservés.
Le NUC ne peut pas être alimenté par USB-C et même s'il le pouvait, il aurait besoin de plus de jus pour fonctionner que la limite USB-C de 100 W.
Les images ci-dessous comparent le NUC8 Hades Canyon (en haut) au NUC11 Phantom Canyon (en bas).
Lecteur de carte SD
Le lecteur SD intégré offre des taux de transfert plus rapides que le lecteur de cartes présent sur Hades Canyon. Il n'est pas à ressort comme sur la plupart des ordinateurs portables.
| SD Card Reader | |
| average JPG Copy Test (av. of 3 runs) | |
| Intel NUC11PAQi7 (Toshiba Exceria Pro SDXC 64 GB UHS-II) | |
| Intel NUC11PHKi7C (Toshiba Exceria Pro SDXC 64 GB UHS-II) | |
| Intel Hades Canyon NUC8i7HVK (Toshiba Exceria Pro SDXC 64 GB UHS-II) | |
| Zotac ZBOX Magnus EK71080 (Toshiba Exceria Pro SDXC 64 GB UHS-II) | |
| GMK NucBox 2 (Toshiba Exceria Pro M501 UHS-II) | |
| maximum AS SSD Seq Read Test (1GB) | |
| Intel NUC11PHKi7C (Toshiba Exceria Pro SDXC 64 GB UHS-II) | |
| Intel NUC11PAQi7 (Toshiba Exceria Pro SDXC 64 GB UHS-II) | |
| Intel Hades Canyon NUC8i7HVK (Toshiba Exceria Pro SDXC 64 GB UHS-II) | |
| Zotac ZBOX Magnus EK71080 (Toshiba Exceria Pro SDXC 64 GB UHS-II) | |
| GMK NucBox 2 (Toshiba Exceria Pro M501 UHS-II) | |
Communication
| Networking | |
| iperf3 transmit AX12 | |
| Intel NUC11PHKi7C | |
| Intel NUC11PAQi7 | |
| GMK NucBox 2 | |
| Intel Hades Canyon NUC8i7HVK | |
| Zotac ZBOX Magnus EK71080 | |
| iperf3 receive AX12 | |
| Intel NUC11PHKi7C | |
| Intel NUC11PAQi7 | |
| GMK NucBox 2 | |
| Intel Hades Canyon NUC8i7HVK | |
| Zotac ZBOX Magnus EK71080 | |
Maintenance
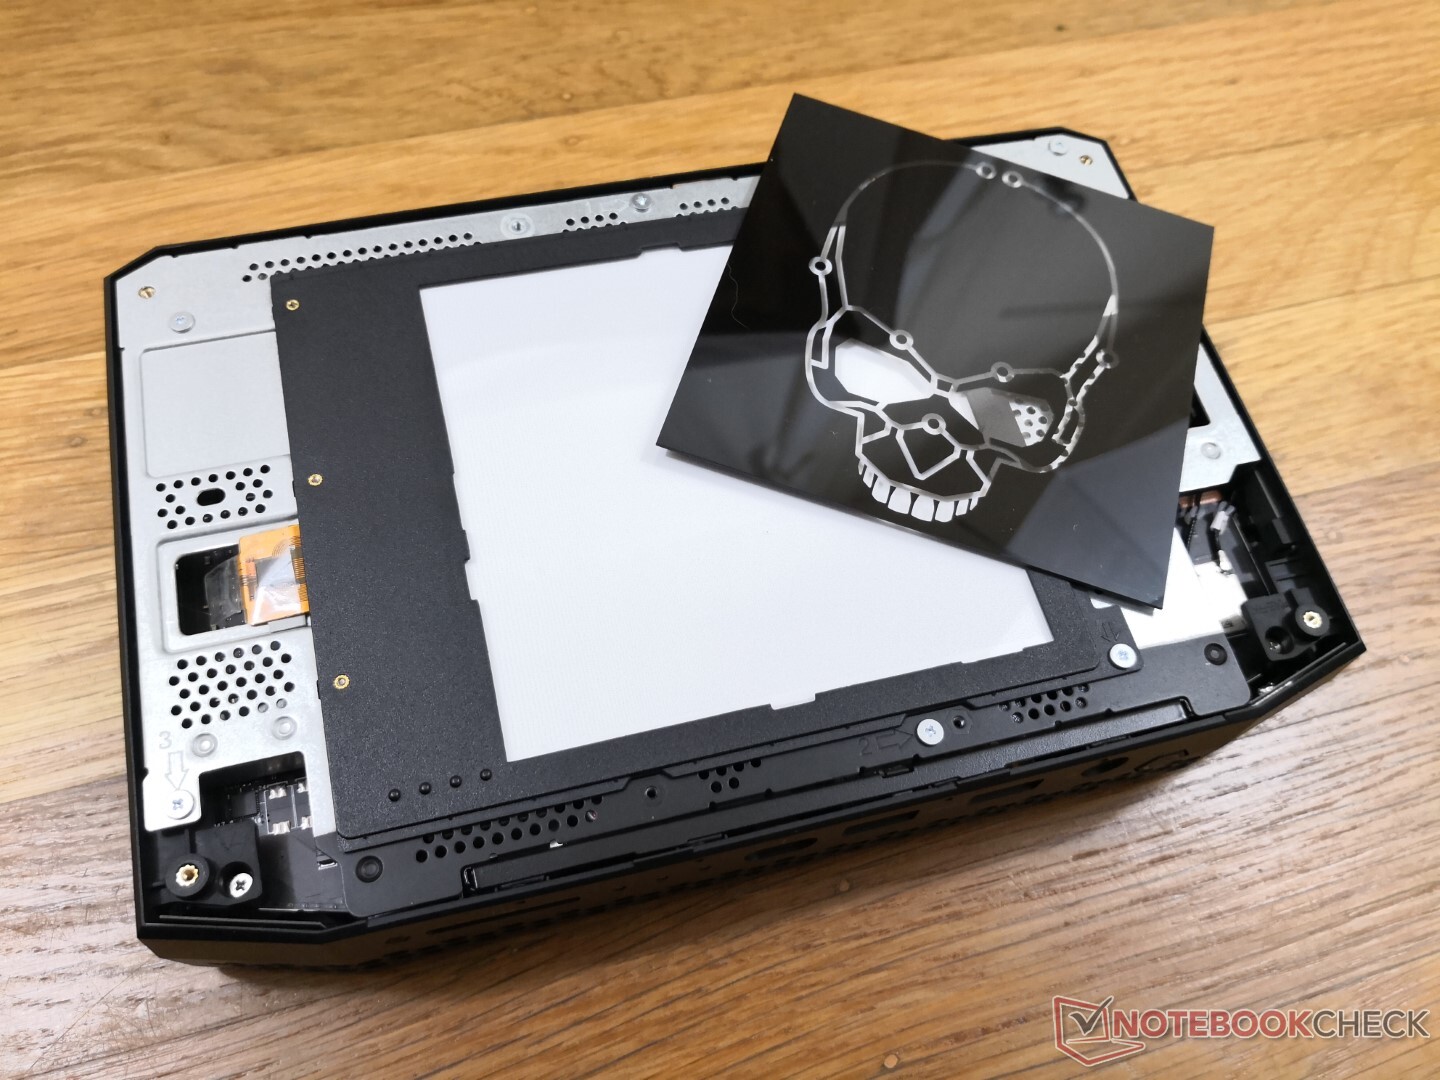
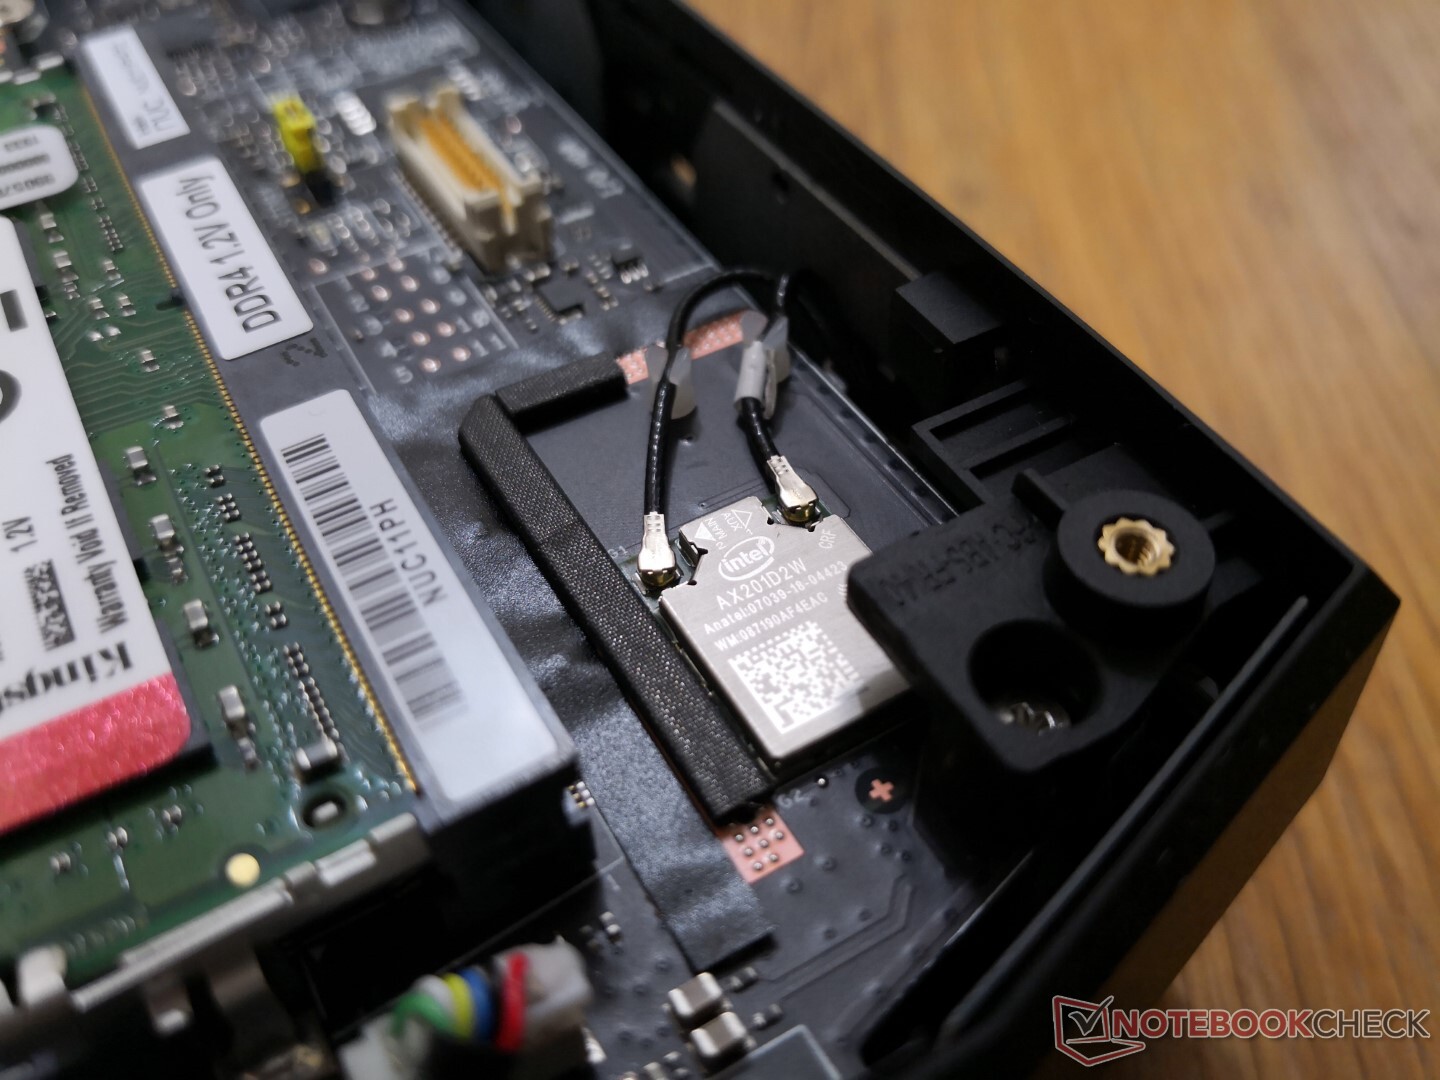
Le panneau supérieur est fixé par 8 vis hexagonales qui protègent la plaque frontale à DEL personnalisable et la cage métallique. Le retrait de la cage métallique pour accéder à la RAM et aux emplacements de stockage nécessite un tournevis Philips standard. L'accès à la solution de refroidissement située en dessous est malheureusement plus difficile et moins convivial.
Accessoires et garantie
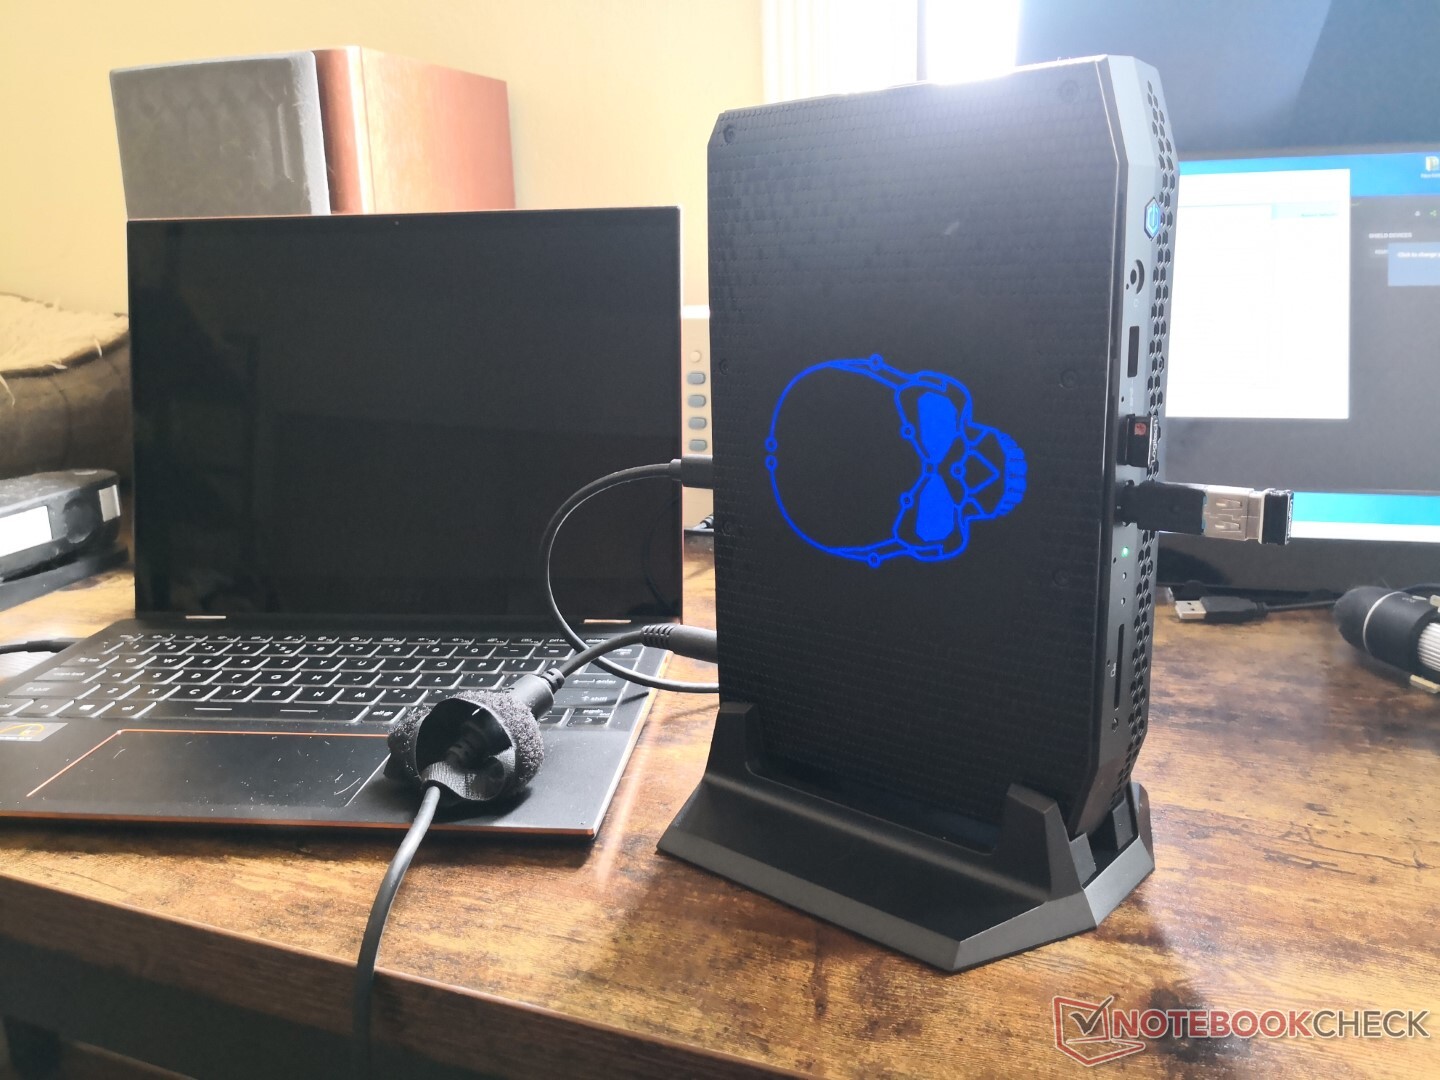
La boîte contient également un support VESA amovible, des vis supplémentaires, un support vertical en plastique et cinq plaques frontales en plastique transparent si vous souhaitez remplacer le crâne éclairé par un autre motif. Le support est heureusement ferme, sans risque réel de basculement. Des coussins maintiennent le NUC en place avec un peu d'espace le long du fond pour le flux d'air
Une garantie limitée de trois ans est fournie en standard, contrairement à la plupart des autres mini-PC.
Performance
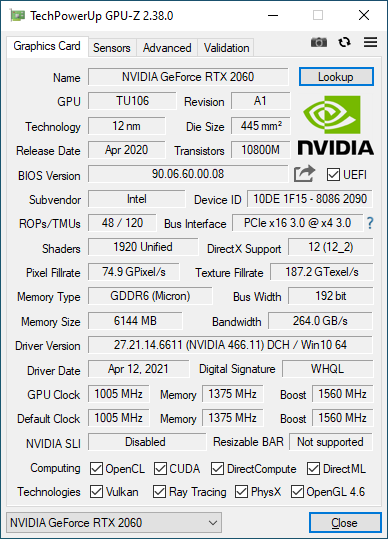
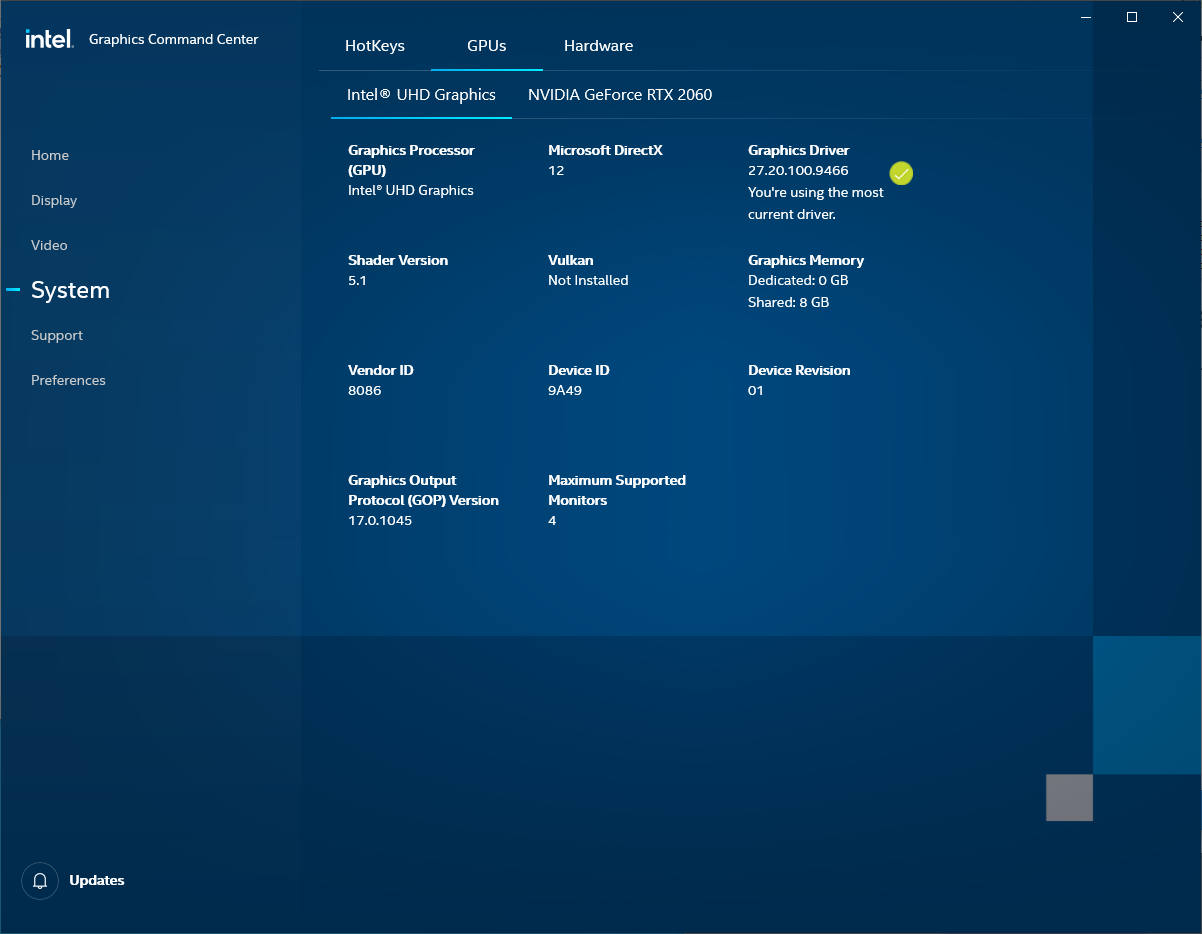
Tous les NUC11 Enthusiast SKUs sont équipés du CPU Core i7-1165G7 de 11ème génération et du GPU RTX 2060 de GeForce. Gardez à l'esprit que le GPU Nvidia ici est la version Max-P mobile et non la de bureau.
Optimus est pris en charge pour la commutation graphique automatique. Il n'y a pas de support G-Sync.
Notre unité a été réglée en mode "Performance" via le BIOS avant d'exécuter les benchmarks de performance ci-dessous pour obtenir les meilleurs scores possibles.
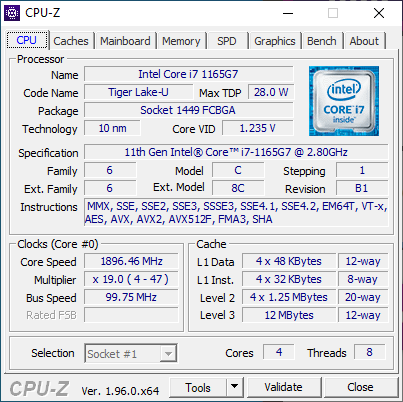
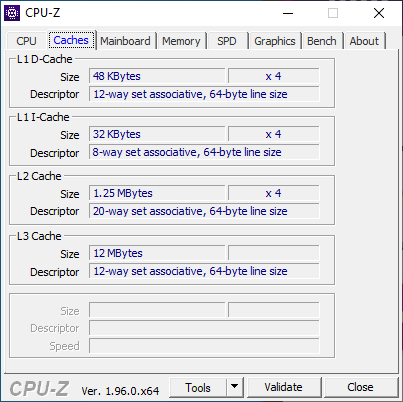
Processeur
Les performances du CPU sont excellentes, avec des résultats qui se situent à moins de 5 % de ceux du NUC11PHKi7C. Le site Huawei MateBook X Pro équipé du même CPU Core i7-1165G7 fonctionnerait environ 32% plus lentement que notre NUC Phantom Canyon.
Si l'on règle le BIOS sur le mode équilibré au lieu du mode performance, les performances multithreads chutent d'environ 10 à 15 % selon CineBench.
En comparaison avec l'ancien Core i7-8809Gnotre Core i7-1165G7 est capable de le surpasser à la fois dans les benchmarks monofil et multi-fil d'environ 30 % et 15 %, respectivement. Il est intéressant de noter que notre score CineBench R20 xT est plus bas que prévu, même après deux tentatives.
Cinebench R15: CPU Multi 64Bit | CPU Single 64Bit
Blender: v2.79 BMW27 CPU
7-Zip 18.03: 7z b 4 -mmt1 | 7z b 4
Geekbench 5.5: Single-Core | Multi-Core
HWBOT x265 Benchmark v2.2: 4k Preset
LibreOffice : 20 Documents To PDF
R Benchmark 2.5: Overall mean
| Cinebench R20 / CPU (Multi Core) | |
| Lenovo Legion C7 15IMH05 82EH0030GE | |
| Asus ZenBook 13 UM325S | |
| Zotac ZBOX Magnus EN72070V | |
| Lenovo ThinkBook 15p Gen1 4K | |
| Intel Hades Canyon NUC8i7HVK | |
| Intel NUC11TNKi5 | |
| Moyenne Intel Core i7-1165G7 (1060 - 2657, n=81) | |
| Intel NUC11PHKi7C | |
| Beelink GTR35 II-G-16512D00W64PRO-1T | |
| Asus VivoBook S13 S333JA-DS51 | |
| Asus Zenbook S UX393JA | |
| Beelink SEi10 | |
| Cinebench R20 / CPU (Single Core) | |
| Intel NUC11PHKi7C | |
| Asus ZenBook 13 UM325S | |
| Moyenne Intel Core i7-1165G7 (442 - 589, n=81) | |
| Intel NUC11TNKi5 | |
| Zotac ZBOX Magnus EN72070V | |
| Lenovo Legion C7 15IMH05 82EH0030GE | |
| Lenovo ThinkBook 15p Gen1 4K | |
| Asus Zenbook S UX393JA | |
| Intel Hades Canyon NUC8i7HVK | |
| Beelink SEi10 | |
| Asus VivoBook S13 S333JA-DS51 | |
| Beelink GTR35 II-G-16512D00W64PRO-1T | |
| Cinebench R15 / CPU Multi 64Bit | |
| Lenovo Legion C7 15IMH05 82EH0030GE | |
| Asus ZenBook 13 UM325S | |
| Lenovo ThinkBook 15p Gen1 4K | |
| Zotac ZBOX Magnus EN72070V | |
| Intel NUC11PHKi7C | |
| Intel Hades Canyon NUC8i7HVK | |
| Moyenne Intel Core i7-1165G7 (553 - 1027, n=86) | |
| Intel NUC11TNKi5 | |
| Beelink GTR35 II-G-16512D00W64PRO-1T | |
| Asus VivoBook S13 S333JA-DS51 | |
| Asus Zenbook S UX393JA | |
| Beelink SEi10 | |
| Cinebench R15 / CPU Single 64Bit | |
| Intel NUC11PHKi7C | |
| Asus ZenBook 13 UM325S | |
| Moyenne Intel Core i7-1165G7 (115 - 230, n=78) | |
| Lenovo Legion C7 15IMH05 82EH0030GE | |
| Intel NUC11TNKi5 | |
| Lenovo ThinkBook 15p Gen1 4K | |
| Zotac ZBOX Magnus EN72070V | |
| Asus Zenbook S UX393JA | |
| Intel Hades Canyon NUC8i7HVK | |
| Beelink SEi10 | |
| Beelink GTR35 II-G-16512D00W64PRO-1T | |
| Asus VivoBook S13 S333JA-DS51 | |
| Blender / v2.79 BMW27 CPU | |
| Beelink SEi10 | |
| Asus Zenbook S UX393JA | |
| Asus VivoBook S13 S333JA-DS51 | |
| Beelink GTR35 II-G-16512D00W64PRO-1T | |
| Moyenne Intel Core i7-1165G7 (468 - 1138, n=80) | |
| Intel NUC11TNKi5 | |
| Intel NUC11PHKi7C | |
| Intel Hades Canyon NUC8i7HVK | |
| Lenovo ThinkBook 15p Gen1 4K | |
| Zotac ZBOX Magnus EN72070V | |
| Asus ZenBook 13 UM325S | |
| Lenovo Legion C7 15IMH05 82EH0030GE | |
| 7-Zip 18.03 / 7z b 4 -mmt1 | |
| Lenovo Legion C7 15IMH05 82EH0030GE | |
| Asus ZenBook 13 UM325S | |
| Intel NUC11PHKi7C | |
| Moyenne Intel Core i7-1165G7 (4478 - 5507, n=80) | |
| Lenovo ThinkBook 15p Gen1 4K | |
| Zotac ZBOX Magnus EN72070V | |
| Intel NUC11TNKi5 | |
| Asus Zenbook S UX393JA | |
| Intel Hades Canyon NUC8i7HVK | |
| Beelink SEi10 | |
| Asus VivoBook S13 S333JA-DS51 | |
| Beelink GTR35 II-G-16512D00W64PRO-1T | |
| 7-Zip 18.03 / 7z b 4 | |
| Lenovo Legion C7 15IMH05 82EH0030GE | |
| Asus ZenBook 13 UM325S | |
| Zotac ZBOX Magnus EN72070V | |
| Lenovo ThinkBook 15p Gen1 4K | |
| Intel NUC11PHKi7C | |
| Intel NUC11TNKi5 | |
| Moyenne Intel Core i7-1165G7 (15347 - 27405, n=80) | |
| Intel Hades Canyon NUC8i7HVK | |
| Asus Zenbook S UX393JA | |
| Asus VivoBook S13 S333JA-DS51 | |
| Beelink GTR35 II-G-16512D00W64PRO-1T | |
| Beelink SEi10 | |
| Geekbench 5.5 / Single-Core | |
| Intel NUC11PHKi7C | |
| Moyenne Intel Core i7-1165G7 (1302 - 1595, n=77) | |
| Asus ZenBook 13 UM325S | |
| Intel NUC11TNKi5 | |
| Asus Zenbook S UX393JA | |
| Lenovo Legion C7 15IMH05 82EH0030GE | |
| Lenovo ThinkBook 15p Gen1 4K | |
| Zotac ZBOX Magnus EN72070V | |
| Asus VivoBook S13 S333JA-DS51 | |
| Beelink SEi10 | |
| Beelink GTR35 II-G-16512D00W64PRO-1T | |
| Geekbench 5.5 / Multi-Core | |
| Lenovo Legion C7 15IMH05 82EH0030GE | |
| Asus ZenBook 13 UM325S | |
| Lenovo ThinkBook 15p Gen1 4K | |
| Zotac ZBOX Magnus EN72070V | |
| Intel NUC11PHKi7C | |
| Moyenne Intel Core i7-1165G7 (3078 - 5926, n=77) | |
| Asus Zenbook S UX393JA | |
| Intel NUC11TNKi5 | |
| Asus VivoBook S13 S333JA-DS51 | |
| Beelink GTR35 II-G-16512D00W64PRO-1T | |
| Beelink SEi10 | |
| HWBOT x265 Benchmark v2.2 / 4k Preset | |
| Lenovo Legion C7 15IMH05 82EH0030GE | |
| Asus ZenBook 13 UM325S | |
| Zotac ZBOX Magnus EN72070V | |
| Lenovo ThinkBook 15p Gen1 4K | |
| Intel NUC11PHKi7C | |
| Intel Hades Canyon NUC8i7HVK | |
| Intel NUC11TNKi5 | |
| Moyenne Intel Core i7-1165G7 (1.39 - 8.47, n=80) | |
| Asus VivoBook S13 S333JA-DS51 | |
| Asus Zenbook S UX393JA | |
| Beelink GTR35 II-G-16512D00W64PRO-1T | |
| Beelink SEi10 | |
| LibreOffice / 20 Documents To PDF | |
| Beelink GTR35 II-G-16512D00W64PRO-1T | |
| Asus VivoBook S13 S333JA-DS51 | |
| Zotac ZBOX Magnus EN72070V | |
| Lenovo ThinkBook 15p Gen1 4K | |
| Lenovo Legion C7 15IMH05 82EH0030GE | |
| Beelink SEi10 | |
| Asus ZenBook 13 UM325S | |
| Intel NUC11TNKi5 | |
| Moyenne Intel Core i7-1165G7 (21.5 - 88.1, n=78) | |
| Asus Zenbook S UX393JA | |
| Intel NUC11PHKi7C | |
| R Benchmark 2.5 / Overall mean | |
| Asus VivoBook S13 S333JA-DS51 | |
| Beelink SEi10 | |
| Beelink GTR35 II-G-16512D00W64PRO-1T | |
| Asus Zenbook S UX393JA | |
| Intel NUC11TNKi5 | |
| Lenovo ThinkBook 15p Gen1 4K | |
| Zotac ZBOX Magnus EN72070V | |
| Moyenne Intel Core i7-1165G7 (0.552 - 1.002, n=80) | |
| Lenovo Legion C7 15IMH05 82EH0030GE | |
| Intel NUC11PHKi7C | |
| Asus ZenBook 13 UM325S | |
* ... Moindre est la valeur, meilleures sont les performances
Performance du système
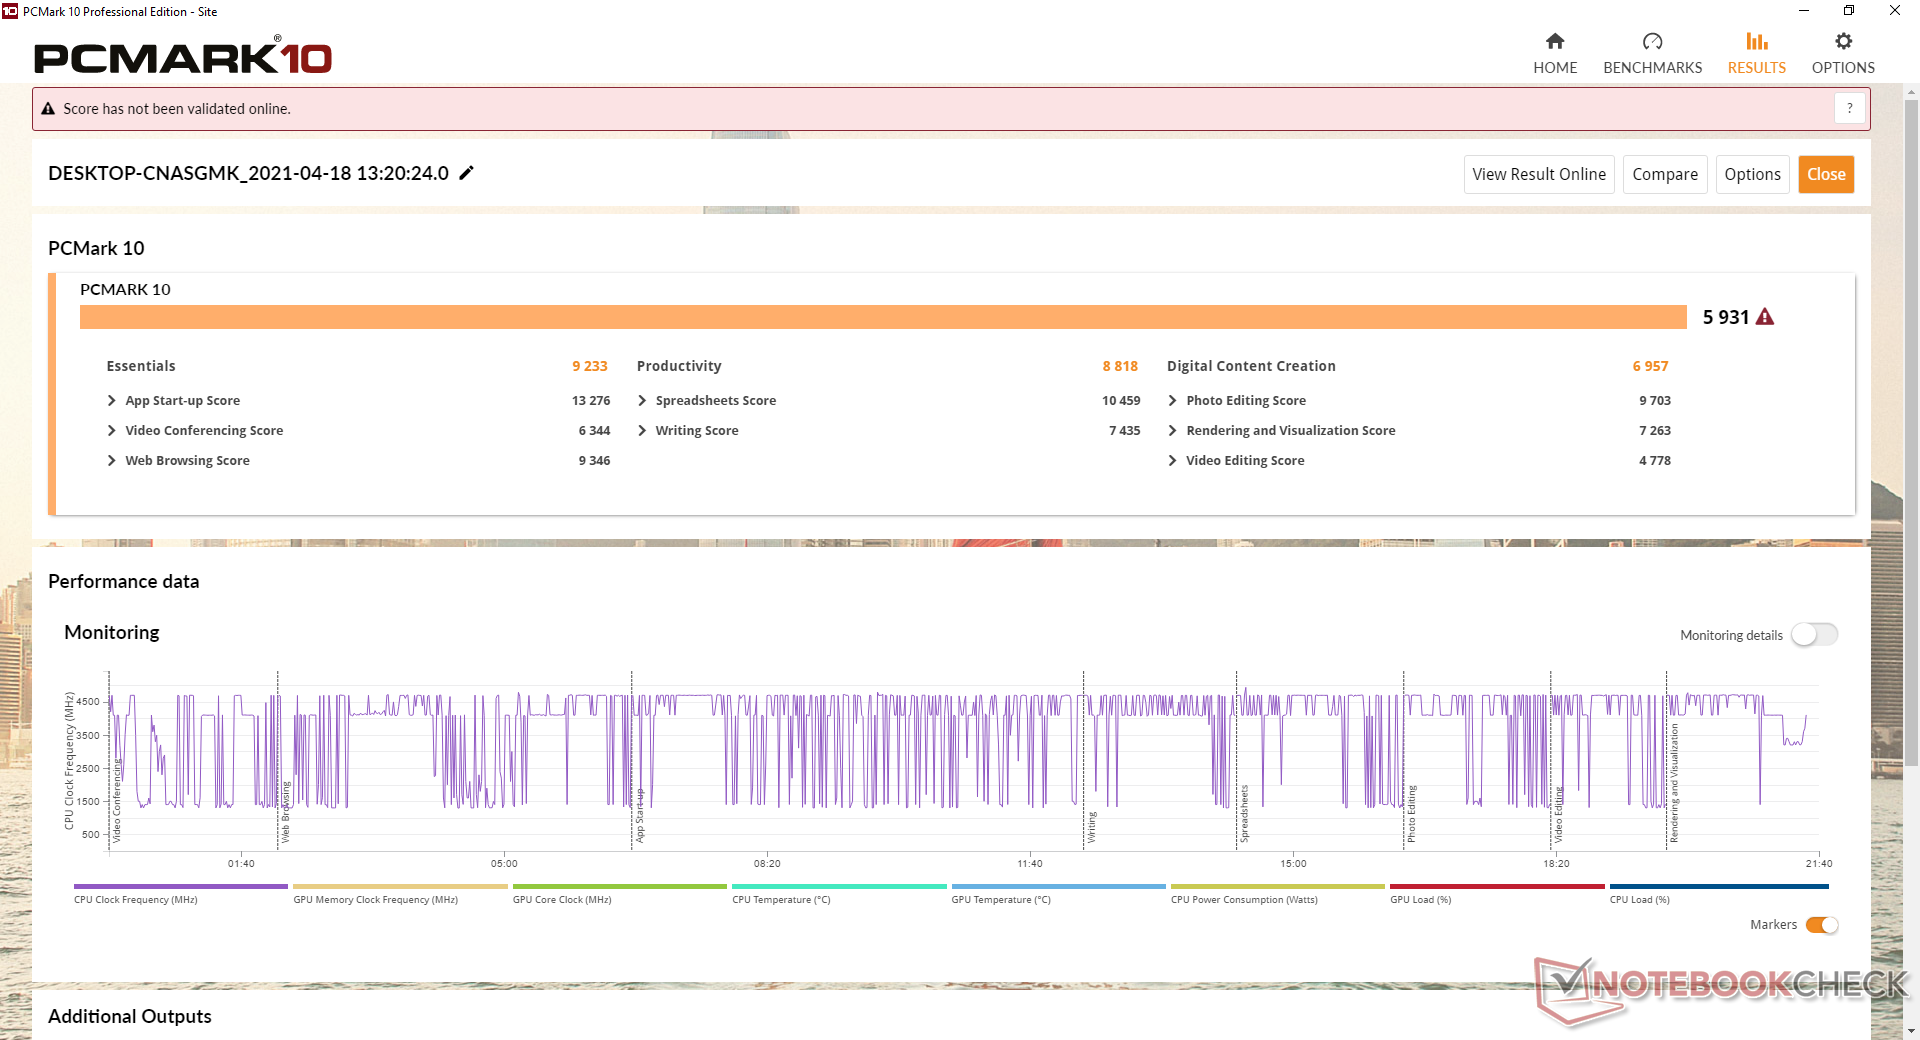
| PCMark 10 Score | 5931 points | |
Aide | ||
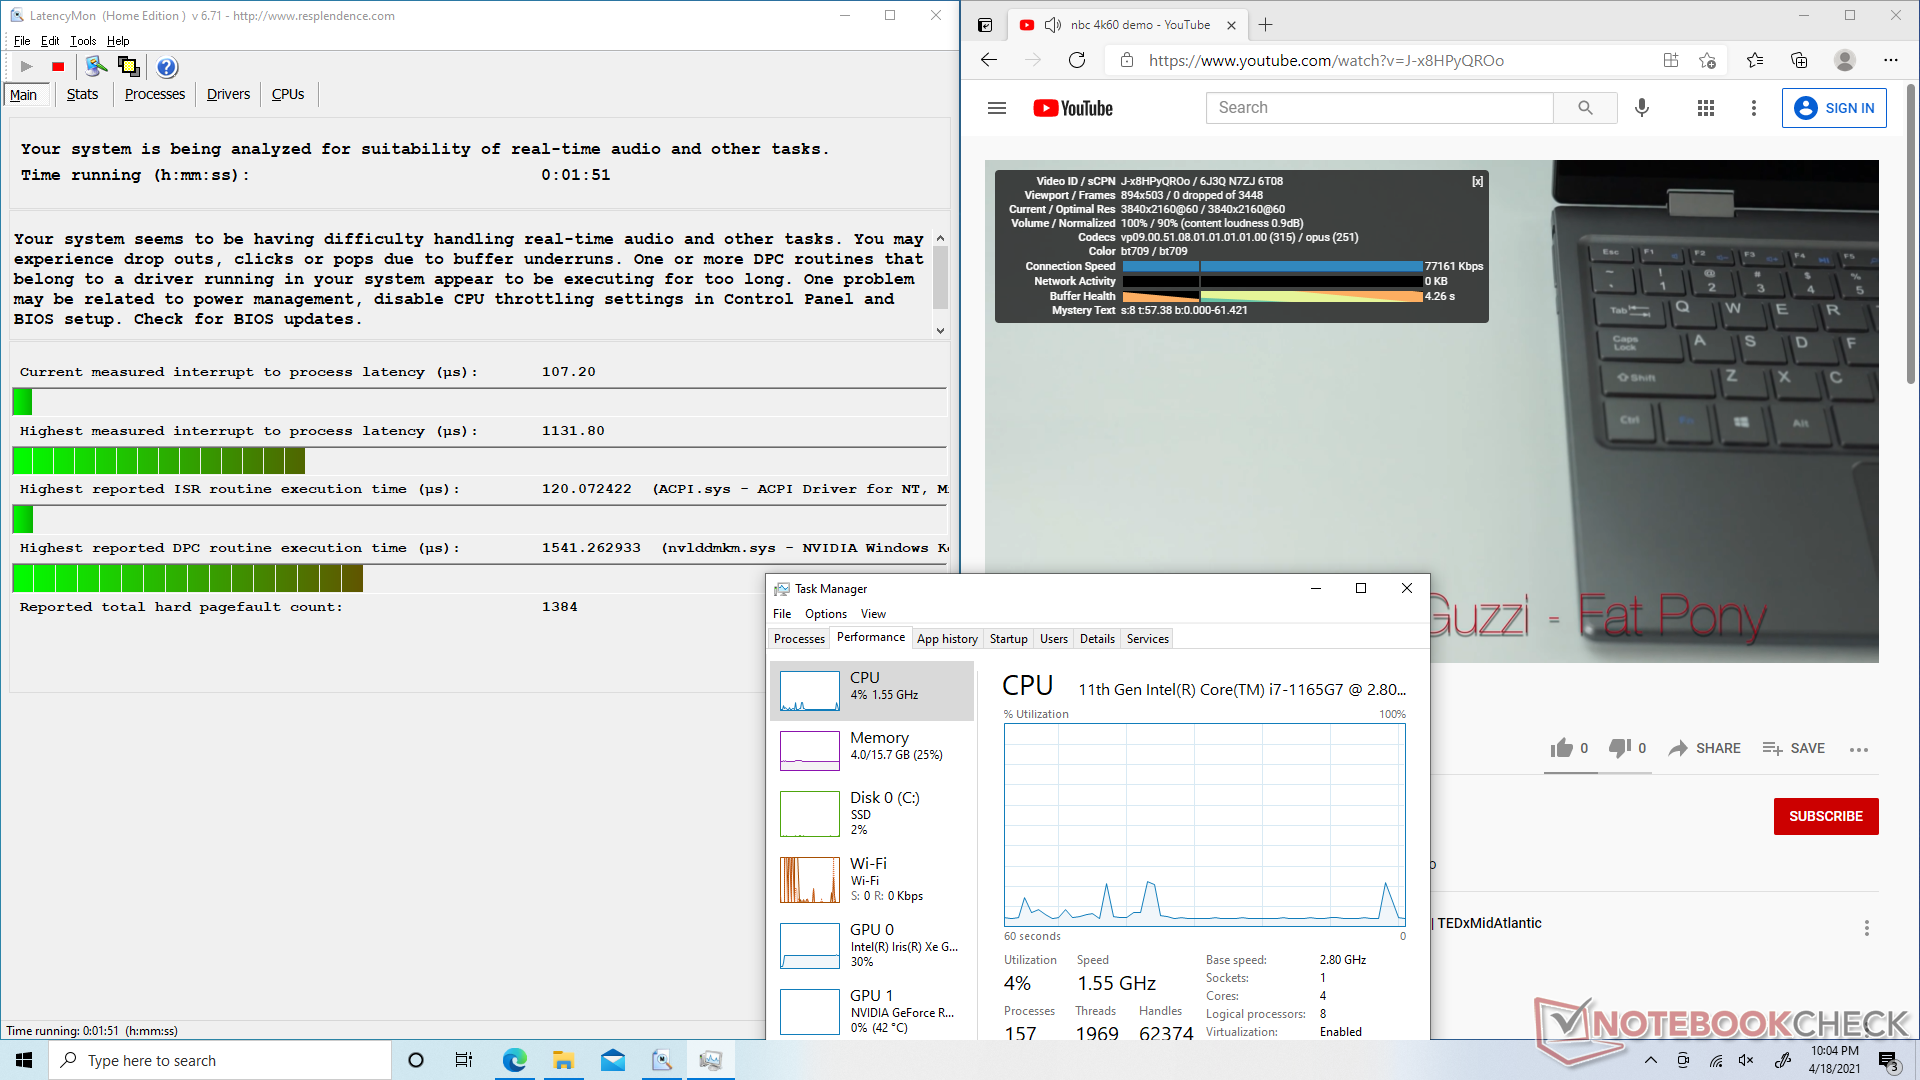
Latence DPC
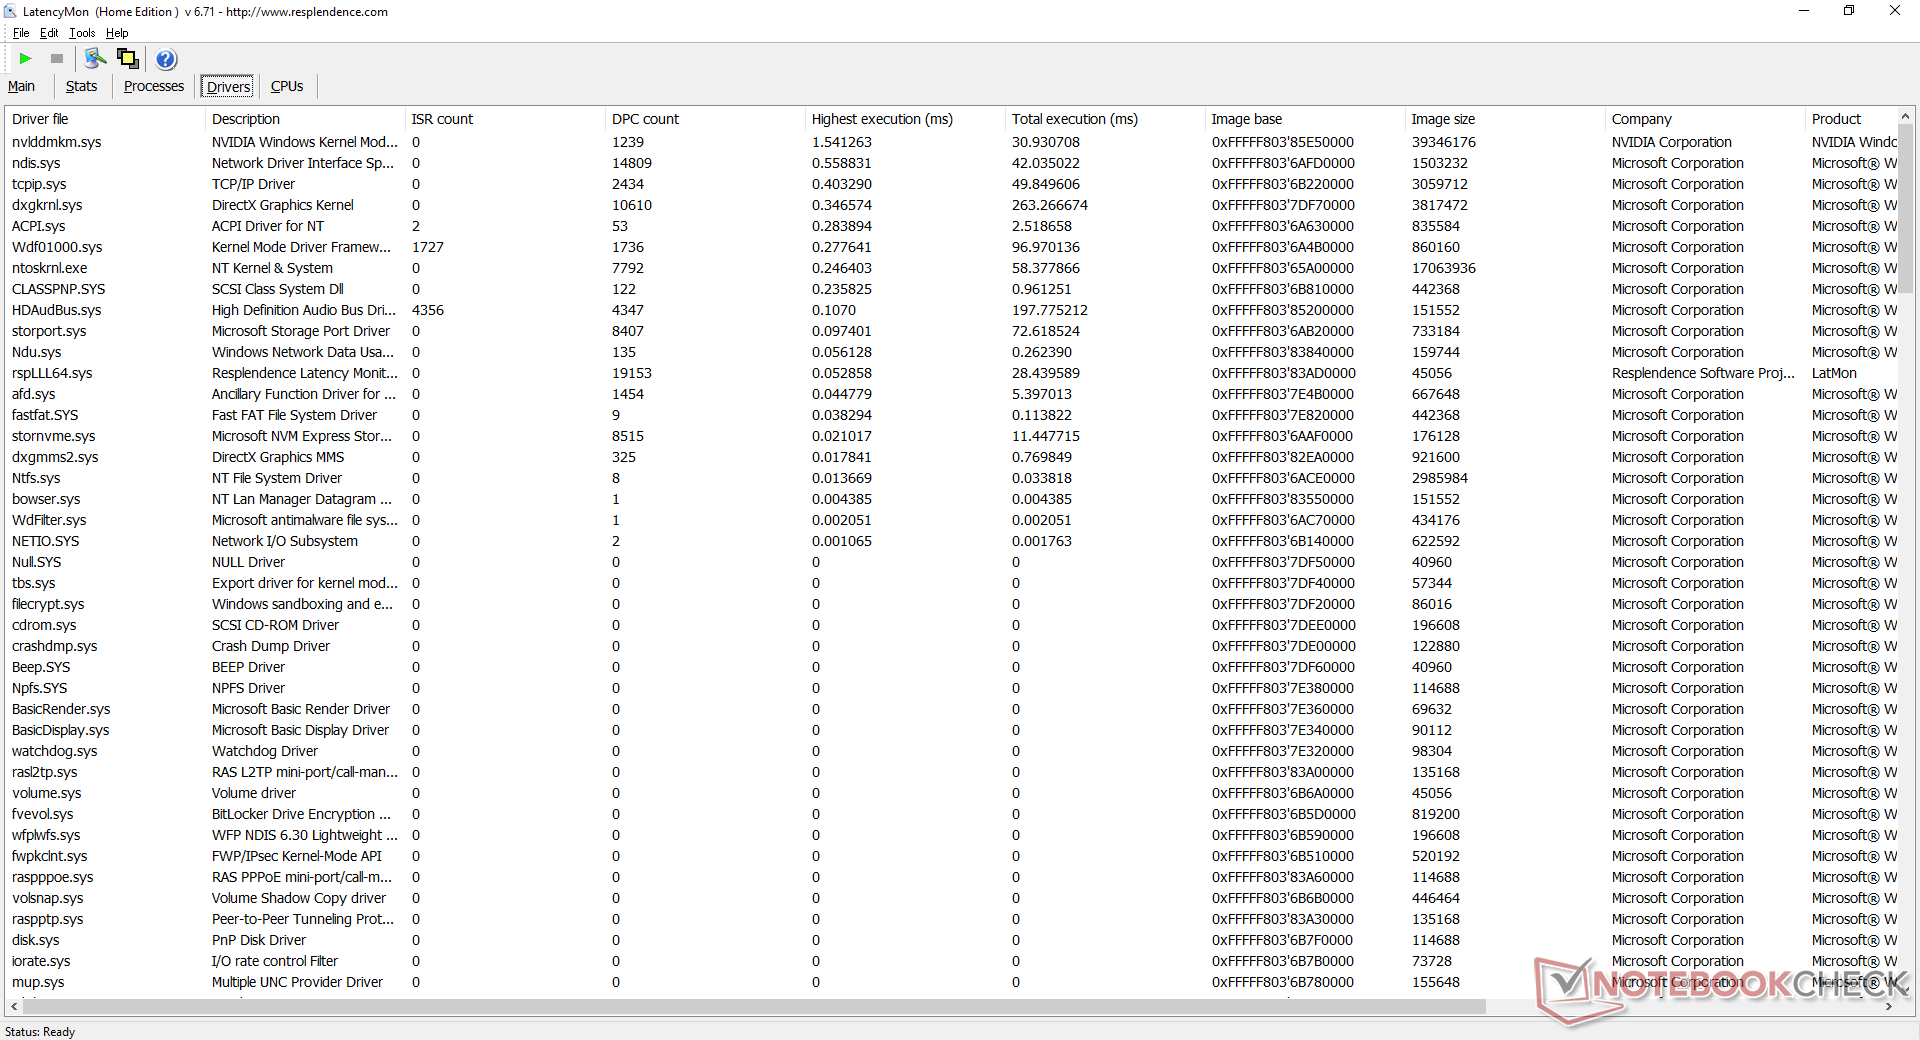
| DPC Latencies / LatencyMon - interrupt to process latency (max), Web, Youtube, Prime95 | |
| Intel NUC11PHKi7C | |
| GMK NucBox 2 | |
| Intel NUC11PAQi7 | |
* ... Moindre est la valeur, meilleures sont les performances
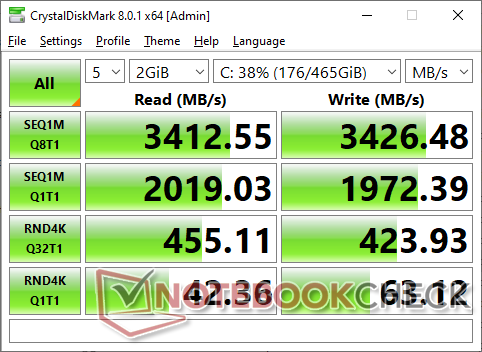
Périphériques de stockage
Alors que leNUC11PAQi7 prend en charge les vitesses des SSD NVMe PCIe 4.0 x4, le NUC11PHKi7C ne le fait pas car ses deux emplacements M.2 sont limités aux vitesses PCIe 3.0 x4 et SATA III, respectivement. C'est un peu décevant si l'on considère que le NUC11PHKi7C est censé être un produit "enthousiaste" ciblant les utilisateurs à hautes performances. Nous avons installé le même Samsung SSD 980 du NUC11PAQi7 sur notre NUC11PHKi7C et, bien sûr, nos taux de transfert n'étaient que la moitié de ceux du NUC11PAQi7.
Il est intéressant de noter que le système prend en charge les SSD M.2 22110 plus longs, alors que la plupart des autres systèmes sont limités à 2280.
| Intel NUC11PHKi7C Samsung SSD 980 Pro 500GB MZ-V8P500BW | Intel Hades Canyon NUC8i7HVK Intel Optane 120 GB SSDPEK1W120GA | Intel NUC11PAQi7 Samsung SSD 980 Pro 500GB MZ-V8P500BW | GMK NucBox 2 Netac S930E8/256GPN | Zotac ZBOX Magnus EK71080 Samsung PM961 MZVLW256HEHP | |
|---|---|---|---|---|---|
| AS SSD | 3% | 47% | -33% | -8% | |
| Seq Read (MB/s) | 2562 | 1379 -46% | 3257 27% | 2069 -19% | 2119 -17% |
| Seq Write (MB/s) | 1265 | 553 -56% | 3937 211% | 1203 -5% | 1205 -5% |
| 4K Read (MB/s) | 39.24 | 127.9 226% | 51.3 31% | 41.66 6% | 46.69 19% |
| 4K Write (MB/s) | 63.5 | 103.5 63% | 75.7 19% | 136.9 116% | 105.2 66% |
| 4K-64 Read (MB/s) | 1143 | 1258 10% | 2283 100% | 366.3 -68% | 1170 2% |
| 4K-64 Write (MB/s) | 1733 | 556 -68% | 2206 27% | 340.5 -80% | 443.8 -74% |
| Access Time Read * (ms) | 0.075 | 0.025 67% | 0.056 25% | 0.064 15% | 0.06 20% |
| Access Time Write * (ms) | 0.193 | 0.033 83% | 0.154 20% | 0.347 -80% | 0.04 79% |
| Score Read (Points) | 1439 | 1524 6% | 2660 85% | 615 -57% | 1429 -1% |
| Score Write (Points) | 1923 | 714 -63% | 2676 39% | 598 -69% | 669 -65% |
| Score Total (Points) | 4036 | 3023 -25% | 6725 67% | 1497 -63% | 2791 -31% |
| Copy ISO MB/s (MB/s) | 1675 | 1125 -33% | 2030 21% | 1186 -29% | 1649 -2% |
| Copy Program MB/s (MB/s) | 1030 | 342.4 -67% | 883 -14% | 428.6 -58% | 468 -55% |
| Copy Game MB/s (MB/s) | 1810 | 768 -58% | 1817 0% | 435.7 -76% | 1010 -44% |
| CrystalDiskMark 5.2 / 6 | 21% | 111% | 6% | -2% | |
| Write 4K (MB/s) | 67.3 | 133.7 99% | 244.6 263% | 178.4 165% | 132.7 97% |
| Read 4K (MB/s) | 38.32 | 178.6 366% | 80.4 110% | 61 59% | 44.48 16% |
| Write Seq (MB/s) | 1985 | 608 -69% | 4094 106% | 1040 -48% | 1193 -40% |
| Read Seq (MB/s) | 2049 | 1428 -30% | 4099 100% | 1919 -6% | 1371 -33% |
| Write 4K Q32T1 (MB/s) | 432.3 | 323.6 -25% | 715 65% | 417.7 -3% | 398.5 -8% |
| Read 4K Q32T1 (MB/s) | 452.4 | 282.3 -38% | 783 73% | 325.6 -28% | 483.5 7% |
| Write Seq Q32T1 (MB/s) | 3423 | 627 -82% | 5065 48% | 1144 -67% | 1202 -65% |
| Read Seq Q32T1 (MB/s) | 3123 | 1521 -51% | 6884 120% | 2379 -24% | 3388 8% |
| Moyenne finale (programmes/paramètres) | 12% /
10% | 79% /
70% | -14% /
-19% | -5% /
-6% |
* ... Moindre est la valeur, meilleures sont les performances

Disk Throttling: DiskSpd Read Loop, Queue Depth 8
Performances du GPU
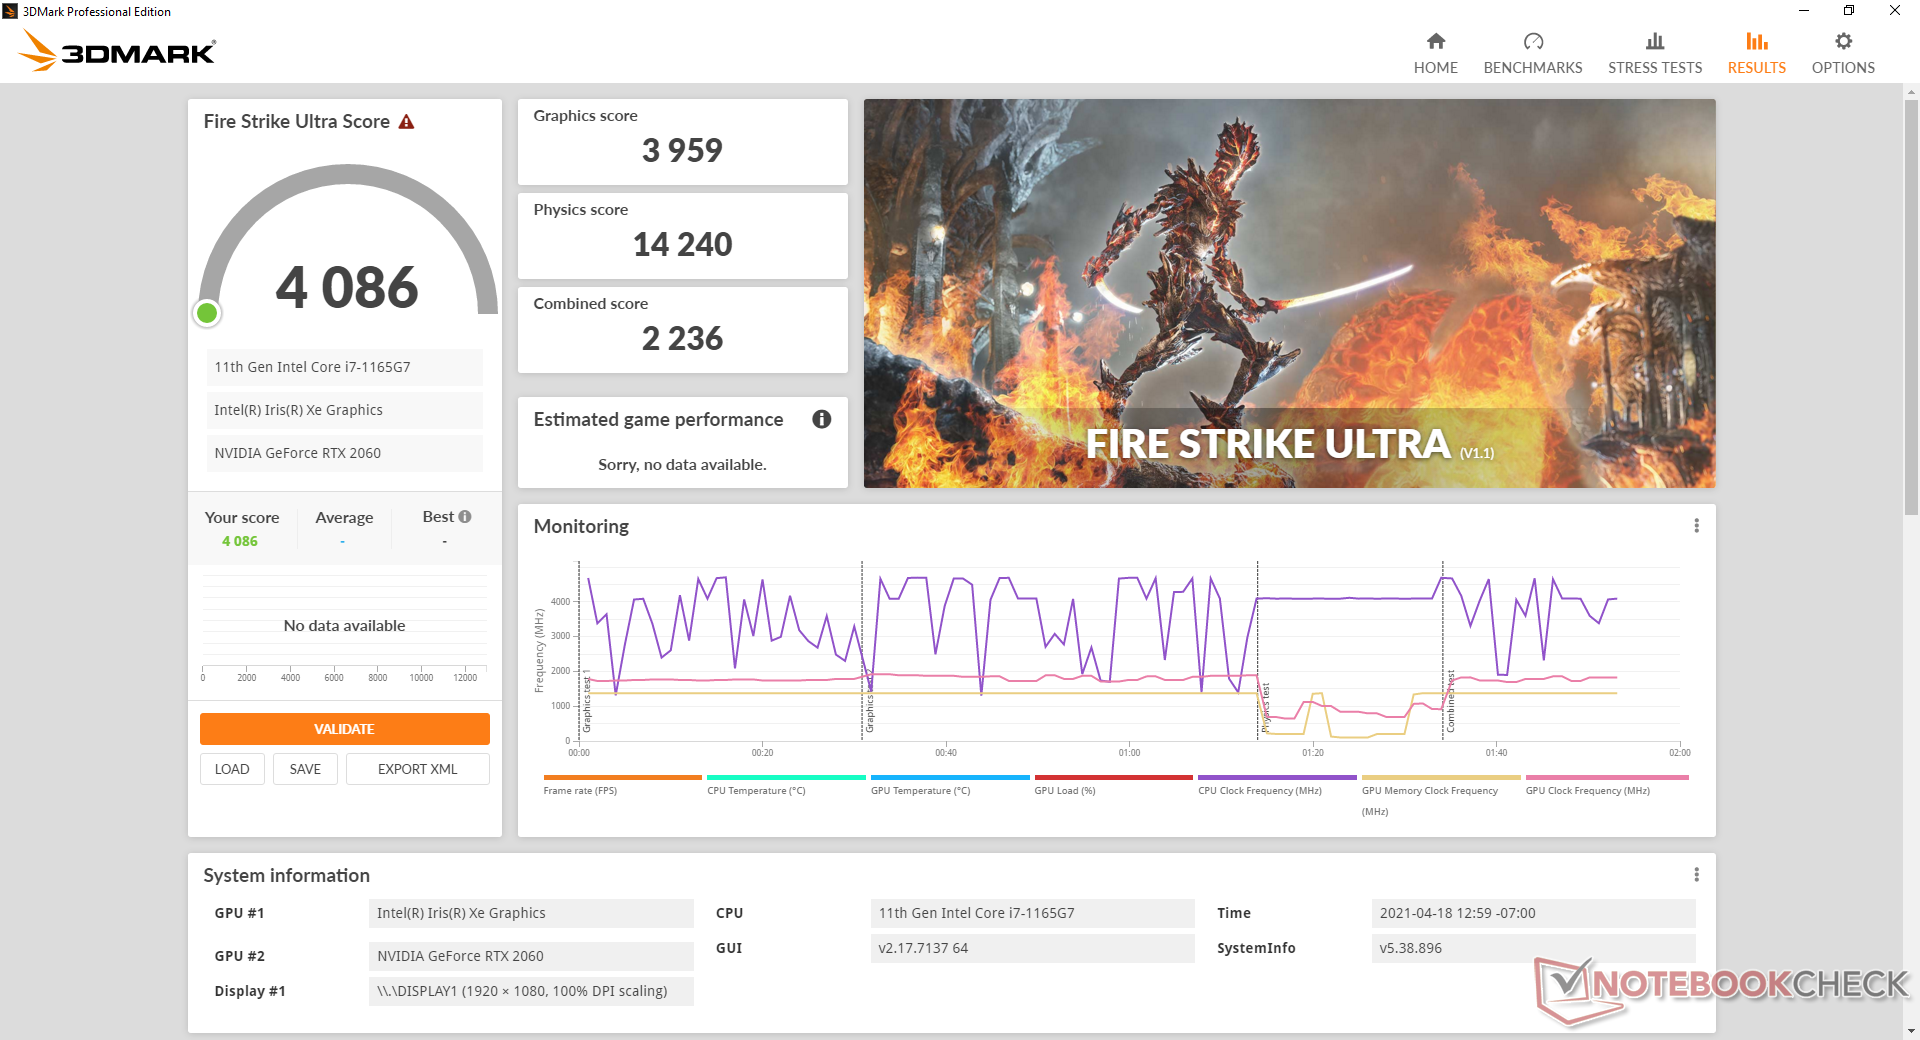
Les performances graphiques sont là où nous les attendons par rapport à celles d'un ordinateur portable moyen équipé du même GPU RTX 2060 GeForce. Plus particulièrement, les performances sont près de 70 % plus rapides que celles du Radeon RX Vega M GH sur l'ancien site Hades Canyon, selon 3DMark Fire Strike, tandis que Time Spy montre un gain de performance encore plus important d'un peu plus de 2 fois. Cela suggère que les jeux fonctionnant sous DX12 bénéficieront des meilleures performances d'une génération à l'autre.
Un PC de bureau avec une RTX 2060 "correcte" GeForce sera toujours plus performant que la rTX 2060 mobile mobile de notre NUC d'environ 15 à 20 %
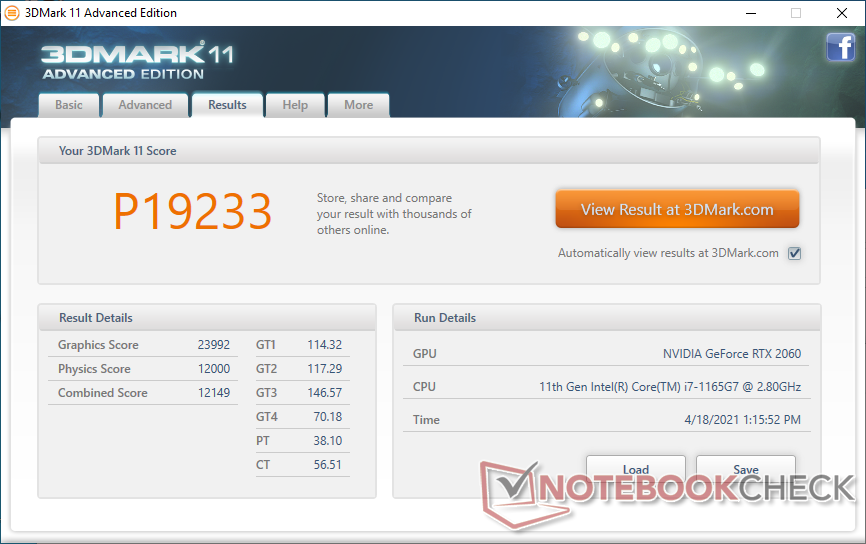

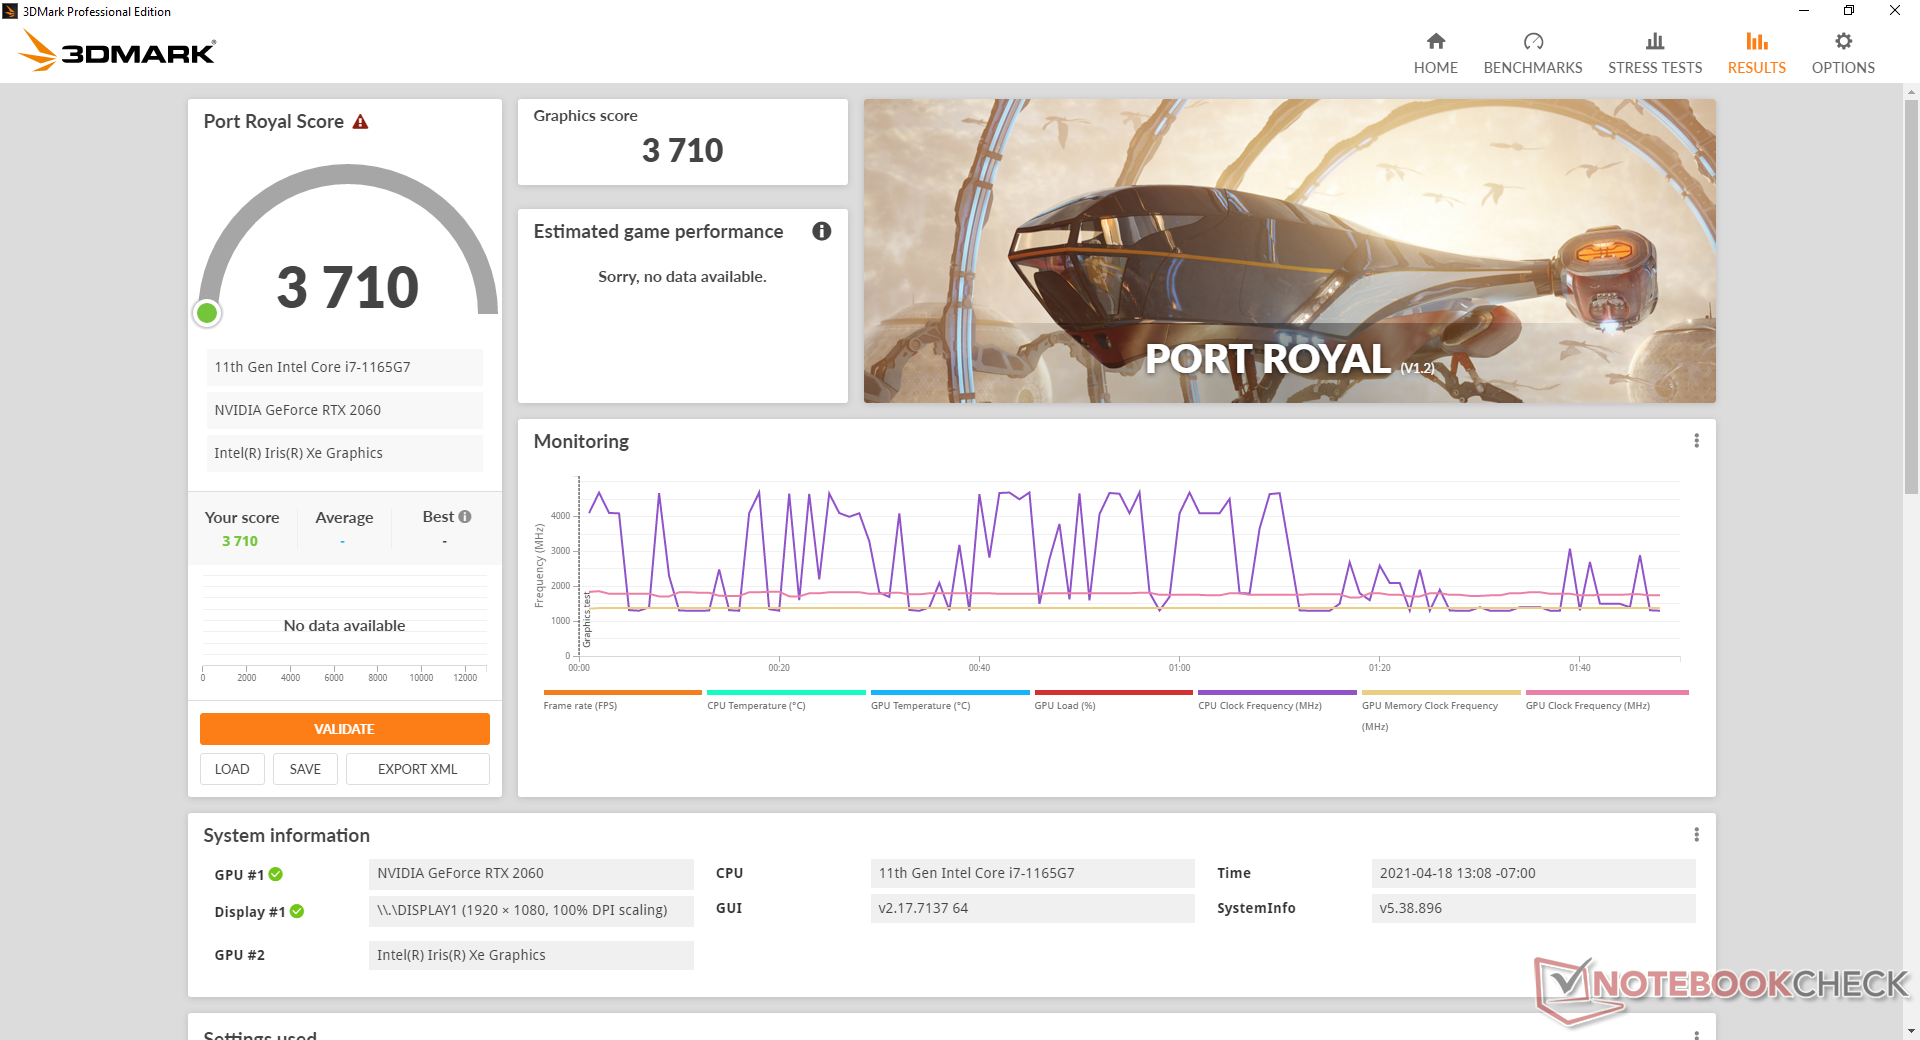
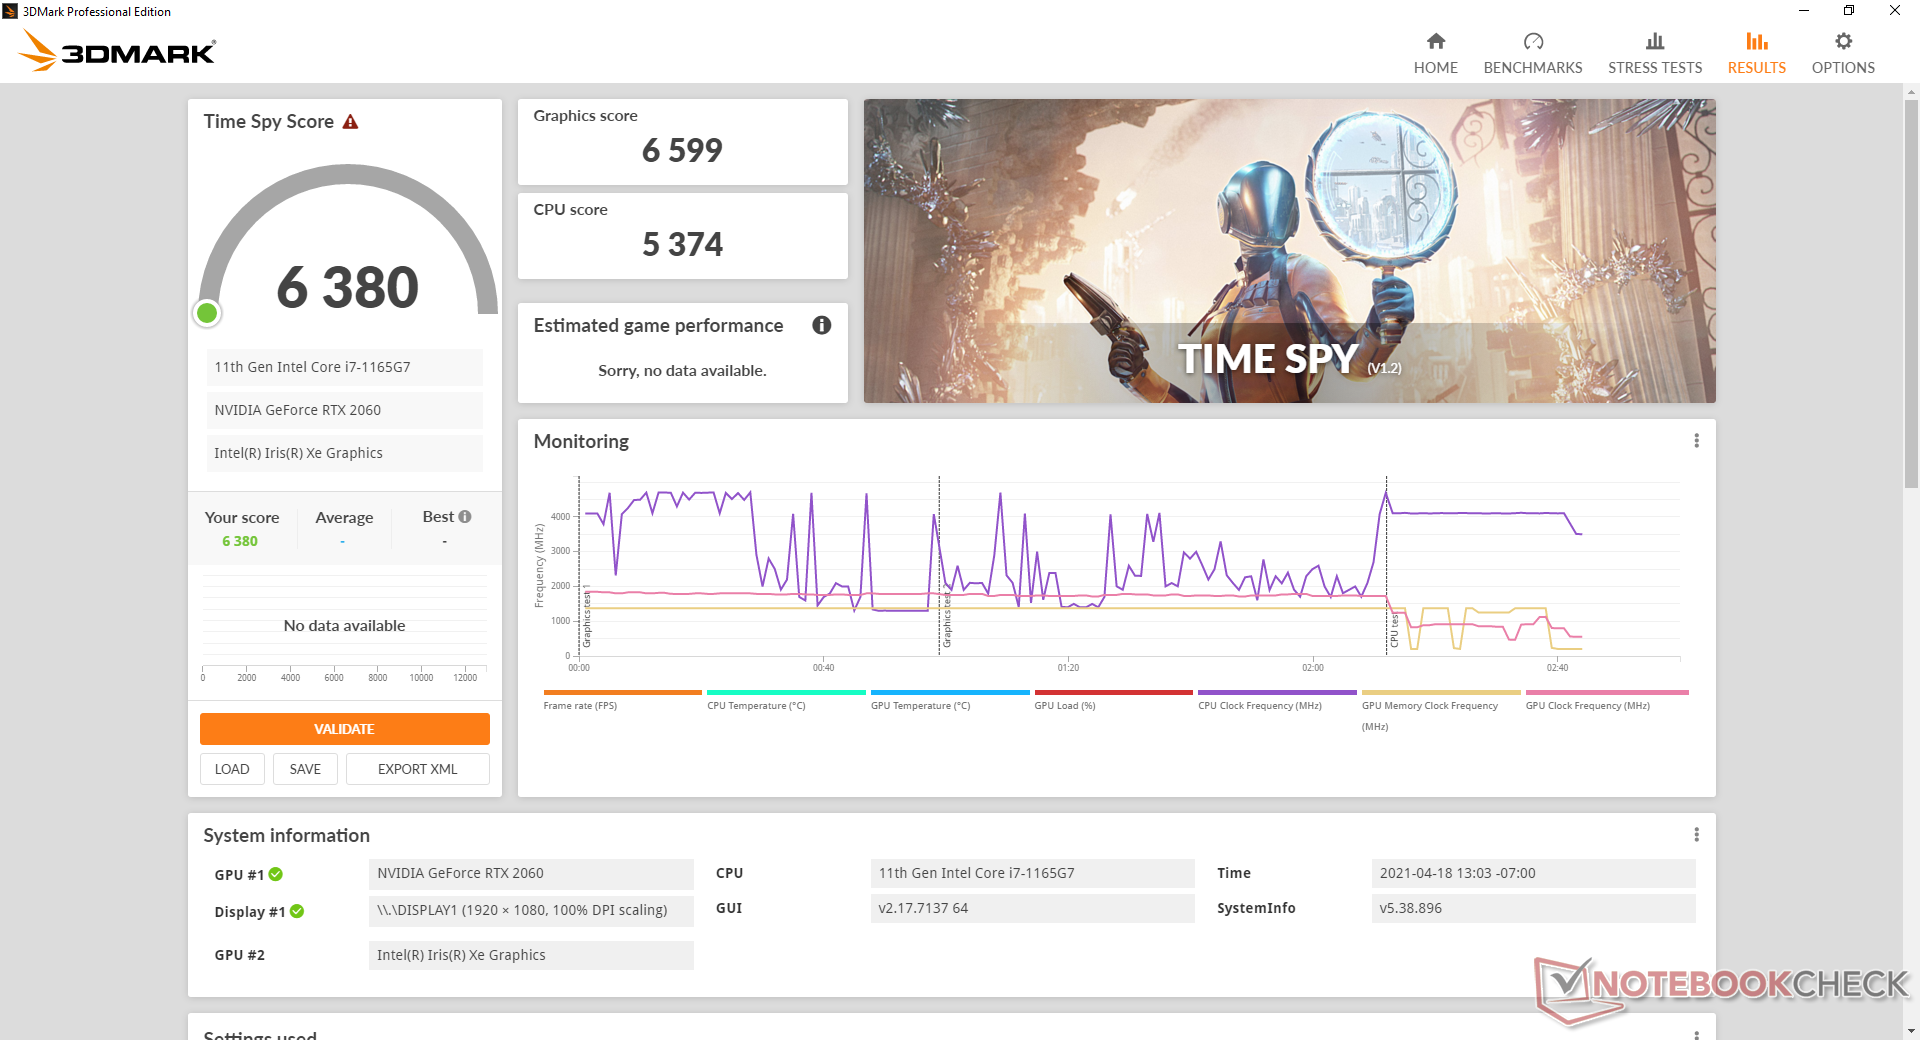
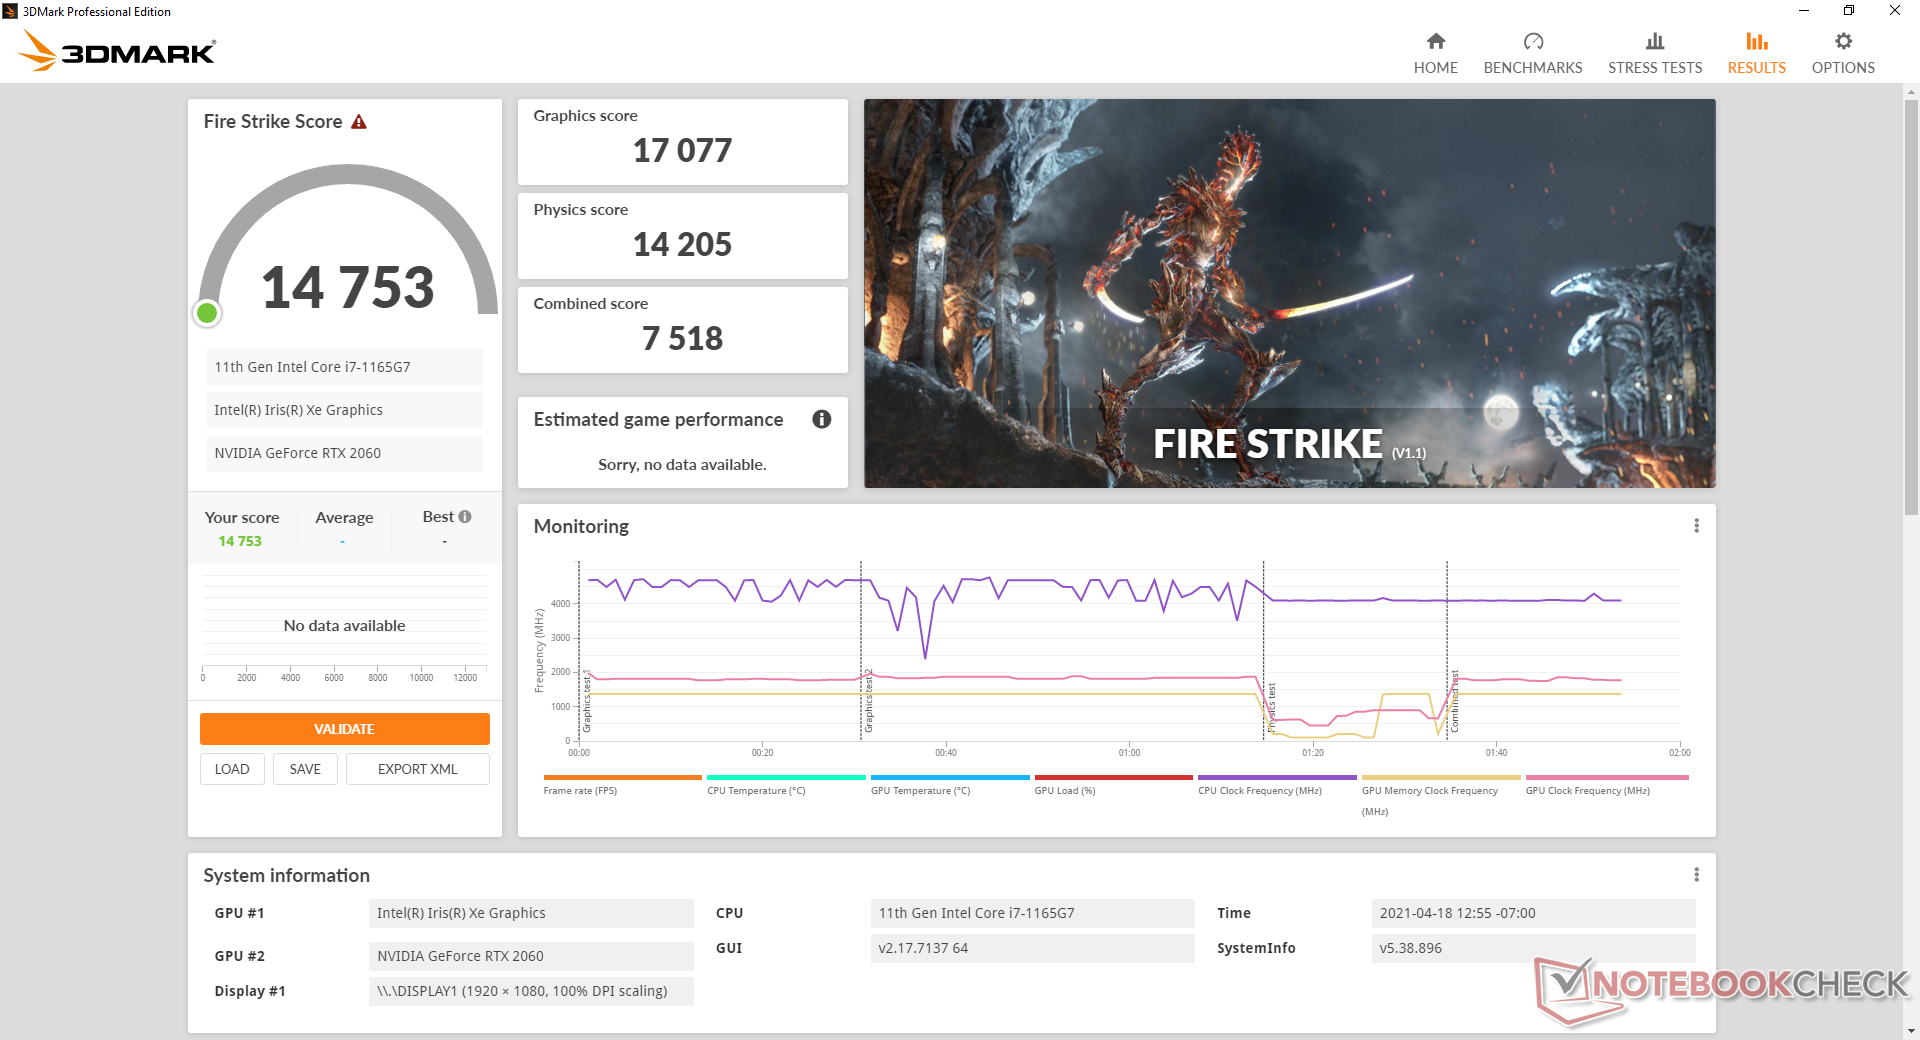
| 3DMark 11 Performance | 19233 points | |
| 3DMark Cloud Gate Standard Score | 30679 points | |
| 3DMark Fire Strike Score | 14753 points | |
| 3DMark Time Spy Score | 6380 points | |
Aide | ||
| Bas | Moyen | Élevé | Ultra | |
|---|---|---|---|---|
| GTA V (2015) | 168 | 158 | 119 | 69.6 |
| The Witcher 3 (2015) | 220.7 | 152.2 | 101.5 | 61.4 |
| Dota 2 Reborn (2015) | 139 | 123 | 116 | 112 |
| Final Fantasy XV Benchmark (2018) | 130 | 89.2 | 67.5 | |
| X-Plane 11.11 (2018) | 94.8 | 81.3 | 69.8 | |
| Strange Brigade (2018) | 287 | 148 | 124 | 109 |
Emissions
Bruit du système
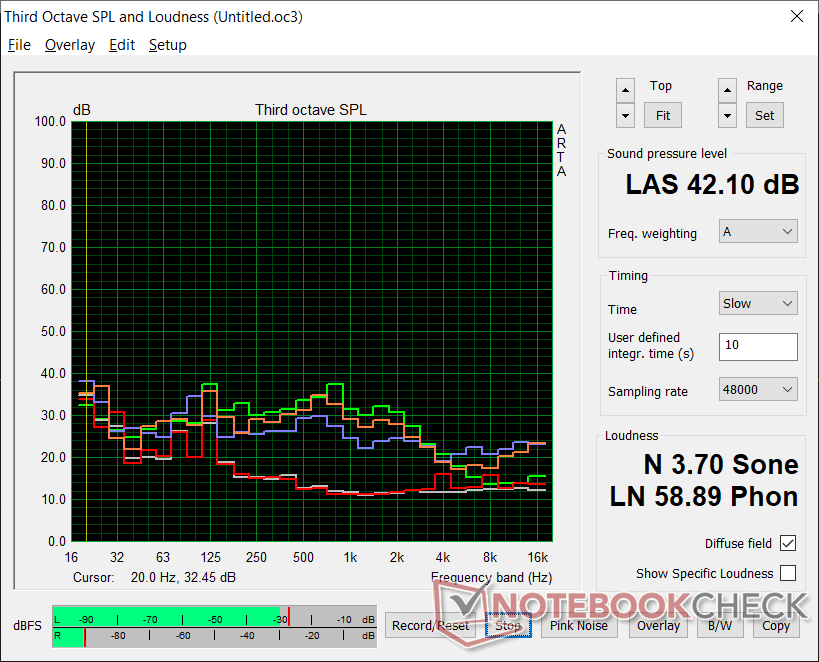
Nous avons pu enregistrer un gémissement de bobine de 25,3 dB(A) lorsque le moteur tourne au ralenti sur le bureau contre un fond silencieux de 24,5 dB(A). Le bruit du ventilateur est par ailleurs proche de celui que nous avons enregistré sur le NUC Hades Canyon. Lors de l'exécution de Witcher 3par exemple, le bruit du ventilateur augmente lentement jusqu'à atteindre un niveau stable de 39,7 dB(A). Lors de l'exécution de charges plus extrêmes comme Prime95 ou FurMark, le bruit du ventilateur augmente temporairement jusqu'à 47,9 dB(A) avant de baisser et de se stabiliser à 42,1 dB(A).
| Intel NUC11PHKi7C GeForce RTX 2060 Mobile, i7-1165G7, Samsung SSD 980 Pro 500GB MZ-V8P500BW | Intel Hades Canyon NUC8i7HVK Vega M GH, i7-8809G, Intel Optane 120 GB SSDPEK1W120GA | Intel NUC11PAQi7 Iris Xe G7 96EUs, i7-1165G7, Samsung SSD 980 Pro 500GB MZ-V8P500BW | GMK NucBox 2 Iris Plus Graphics 655, i5-8259U, Netac S930E8/256GPN | Zotac ZBOX Magnus EK71080 GeForce GTX 1080 (Desktop), i7-7700HQ, Samsung PM961 MZVLW256HEHP | Aorus Gaming Box GeForce RTX 2080 Ti , i7-1165G7 | |
|---|---|---|---|---|---|---|
| Noise | -10% | 0% | 3% | -28% | -25% | |
| arrêt / environnement * (dB) | 24.5 | 28.7 -17% | 25.6 -4% | 25.6 -4% | 29.9 -22% | 26.5 -8% |
| Idle Minimum * (dB) | 25.3 | 29 -15% | 25.6 -1% | 25.7 -2% | 38.6 -53% | 34.7 -37% |
| Idle Average * (dB) | 25.3 | 29 -15% | 25.6 -1% | 25.7 -2% | 38.6 -53% | 39.1 -55% |
| Idle Maximum * (dB) | 25.3 | 29 -15% | 25.6 -1% | 25.7 -2% | 39 -54% | 39.1 -55% |
| Load Average * (dB) | 36.4 | 36 1% | 33.6 8% | 35.3 3% | 40.6 -12% | 39.5 -9% |
| Witcher 3 ultra * (dB) | 39.7 | 42 -6% | 33.6 15% | 41.7 -5% | 43.7 -10% | |
| Load Maximum * (dB) | 47.9 | 49.4 -3% | 54.5 -14% | 35.1 27% | 47 2% | 48 -0% |
* ... Moindre est la valeur, meilleures sont les performances
Degré de la nuisance sonore
| Au repos |
| 25.3 / 25.3 / 25.3 dB(A) |
| Fortement sollicité |
| 36.4 / 47.9 dB(A) |
 | ||
30 dB silencieux 40 dB(A) audible 50 dB(A) bruyant |
||
min: | ||
Température

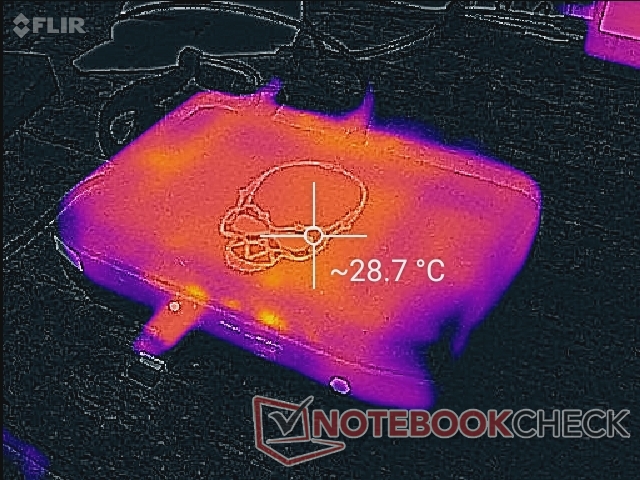
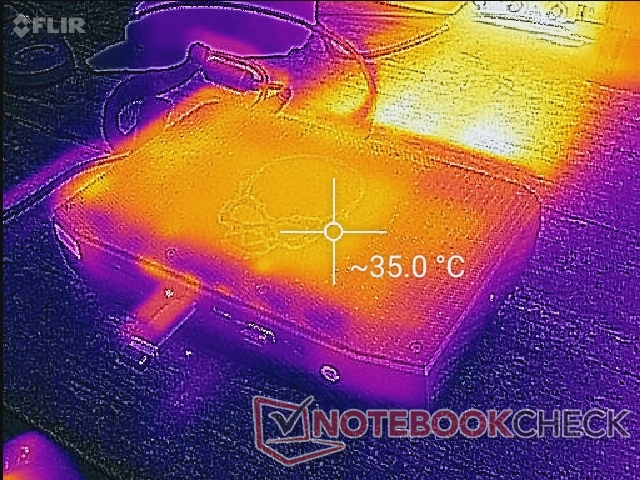
Les températures de surface ne sont pas un problème, car le point chaud sur le dessus n'est que d'environ 35°C lors des jeux. Cependant, toute l'évacuation se fait par l'arrière, et il faut donc prévoir un espace suffisant derrière pour une ventilation adéquate.
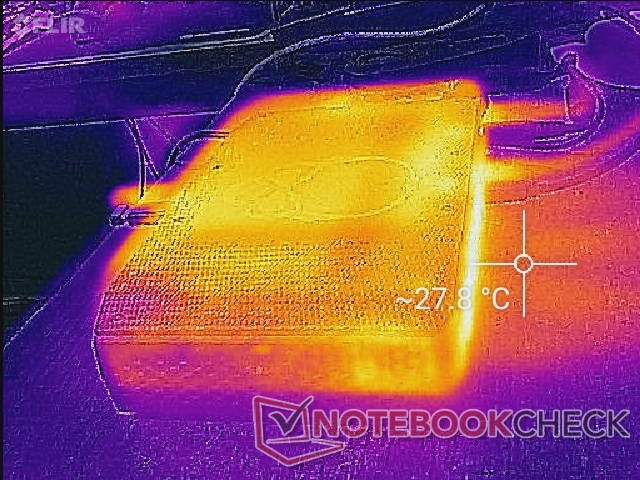
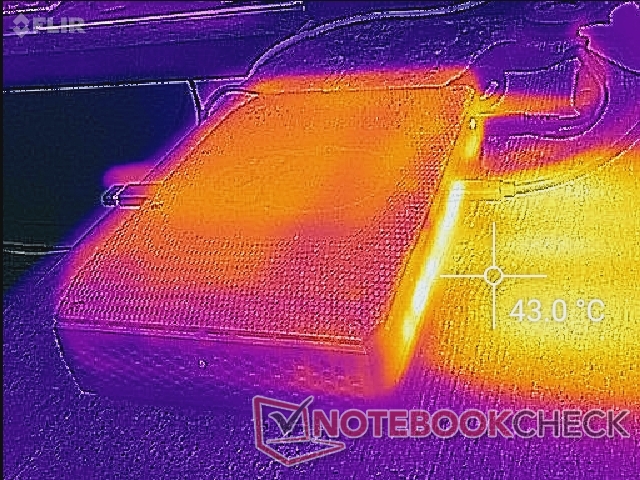
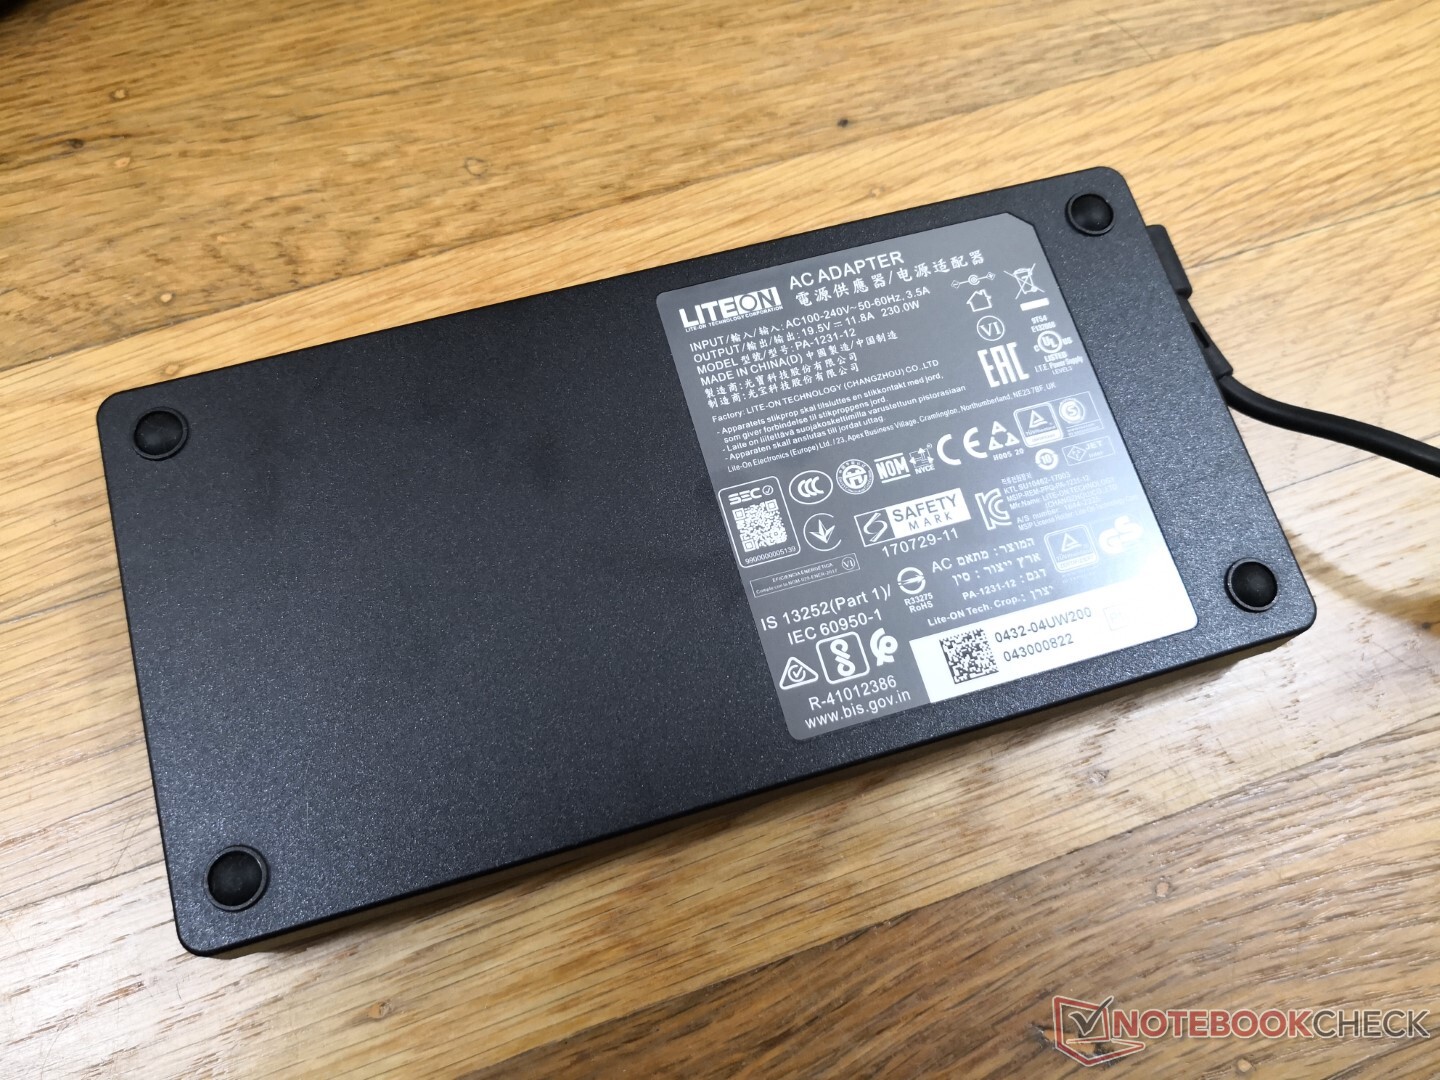
L'adaptateur secteur peut devenir plus chaud que le NUC lui-même à 43 C lors des jeux. Intel aurait probablement pu concevoir un adaptateur secteur plus petit et plus dense, mais il aurait probablement été encore plus chaud, comme ce que nous avons observé sur la série des Série Razer Blade.
Test de stress
Lors de l'exécution de Prime95 pour stresser le CPU, les fréquences d'horloge augmentent à 4,1 GHz pendant environ 20 secondes jusqu'à atteindre une température centrale de 89 C. Ensuite, les fréquences d'horloge diminuent régulièrement jusqu'à se stabiliser entre 3,0 et 3,2 GHz et une température centrale de 67 C. Si le NUC est réglé en mode équilibré, les fréquences d'horloge diminuent encore à 2,8 GHz pour une température centrale plus froide de 57 C.
Lors de l'exécution Witcher 3 pour représenter les charges de jeu du monde réel, les températures du CPU et du GPU se stabilisent à 63 C et 69 C, respectivement, avec une consommation constante de la carte GPU d'environ 116 W. Le CPU Kaby Lake-G du NUC Hades Canyon se stabilise dans une plage de température similaire lors de l'exécution du même jeu.
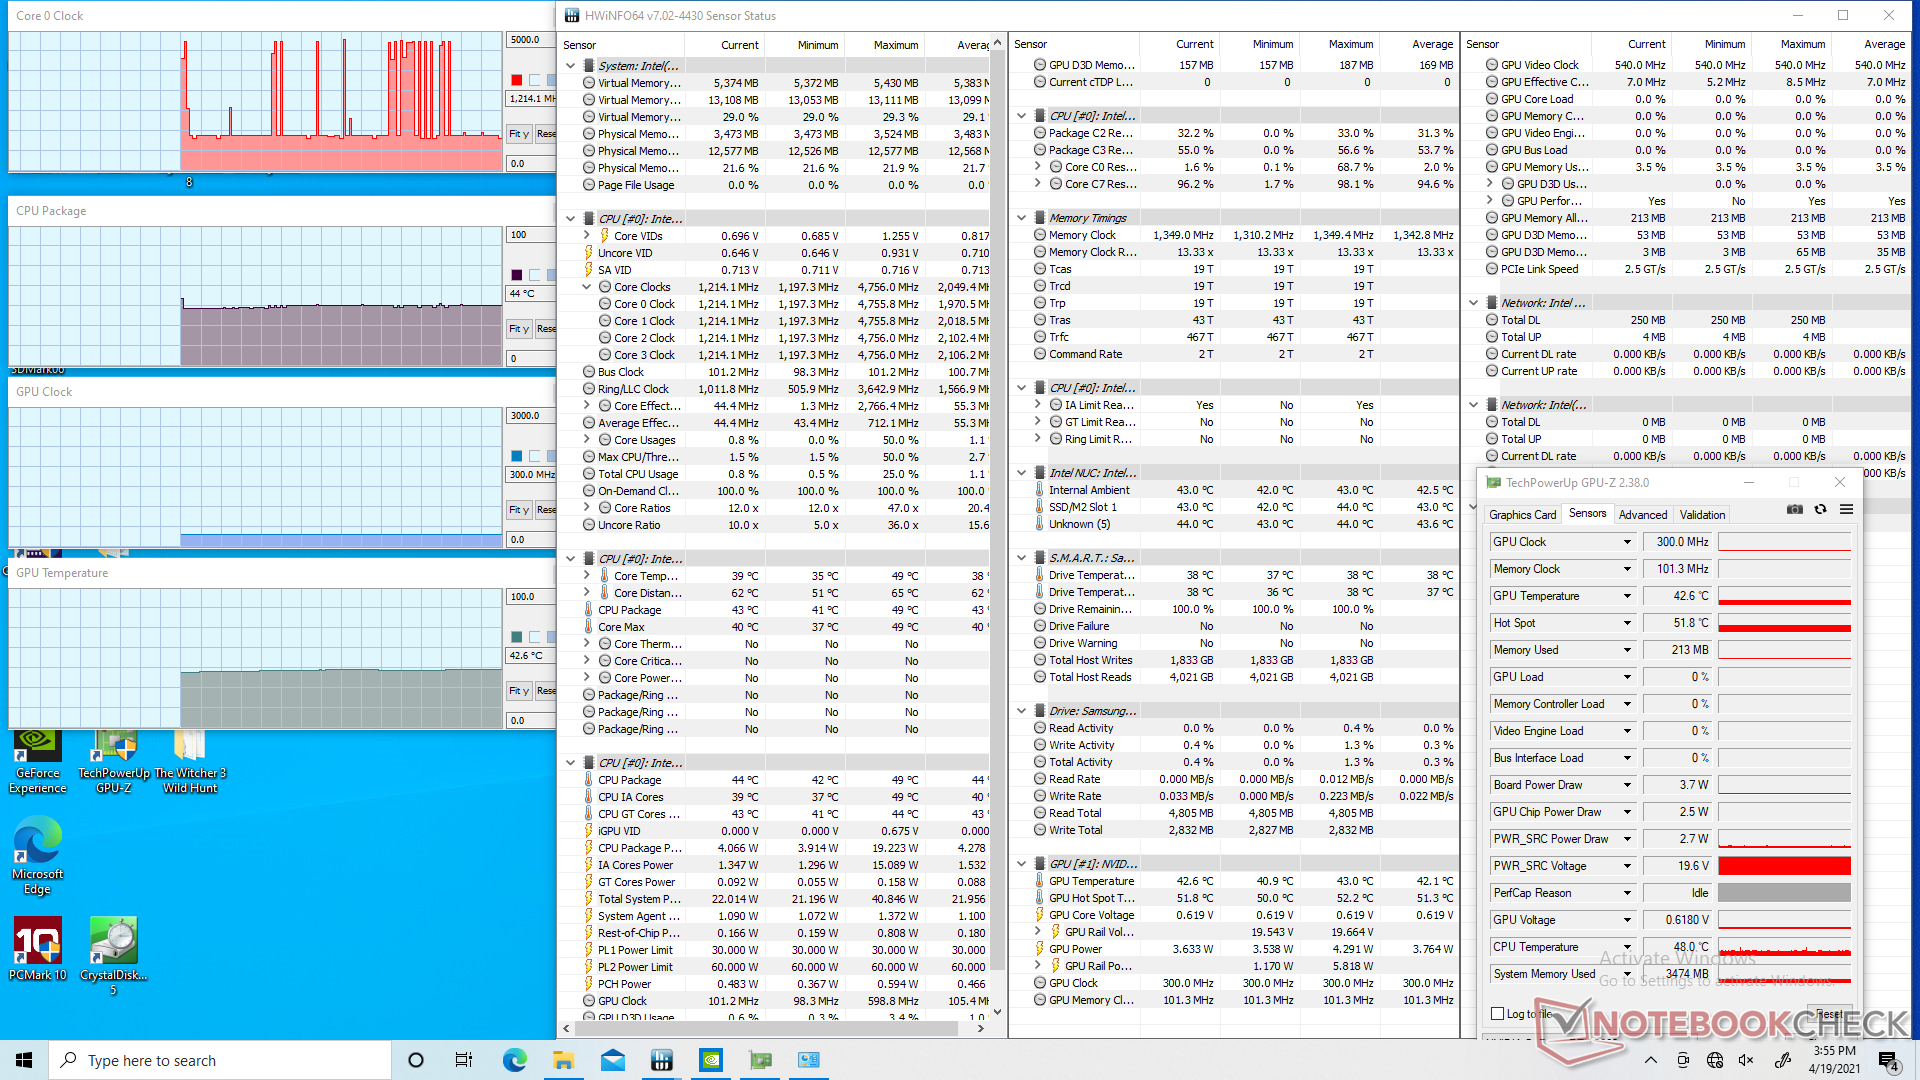
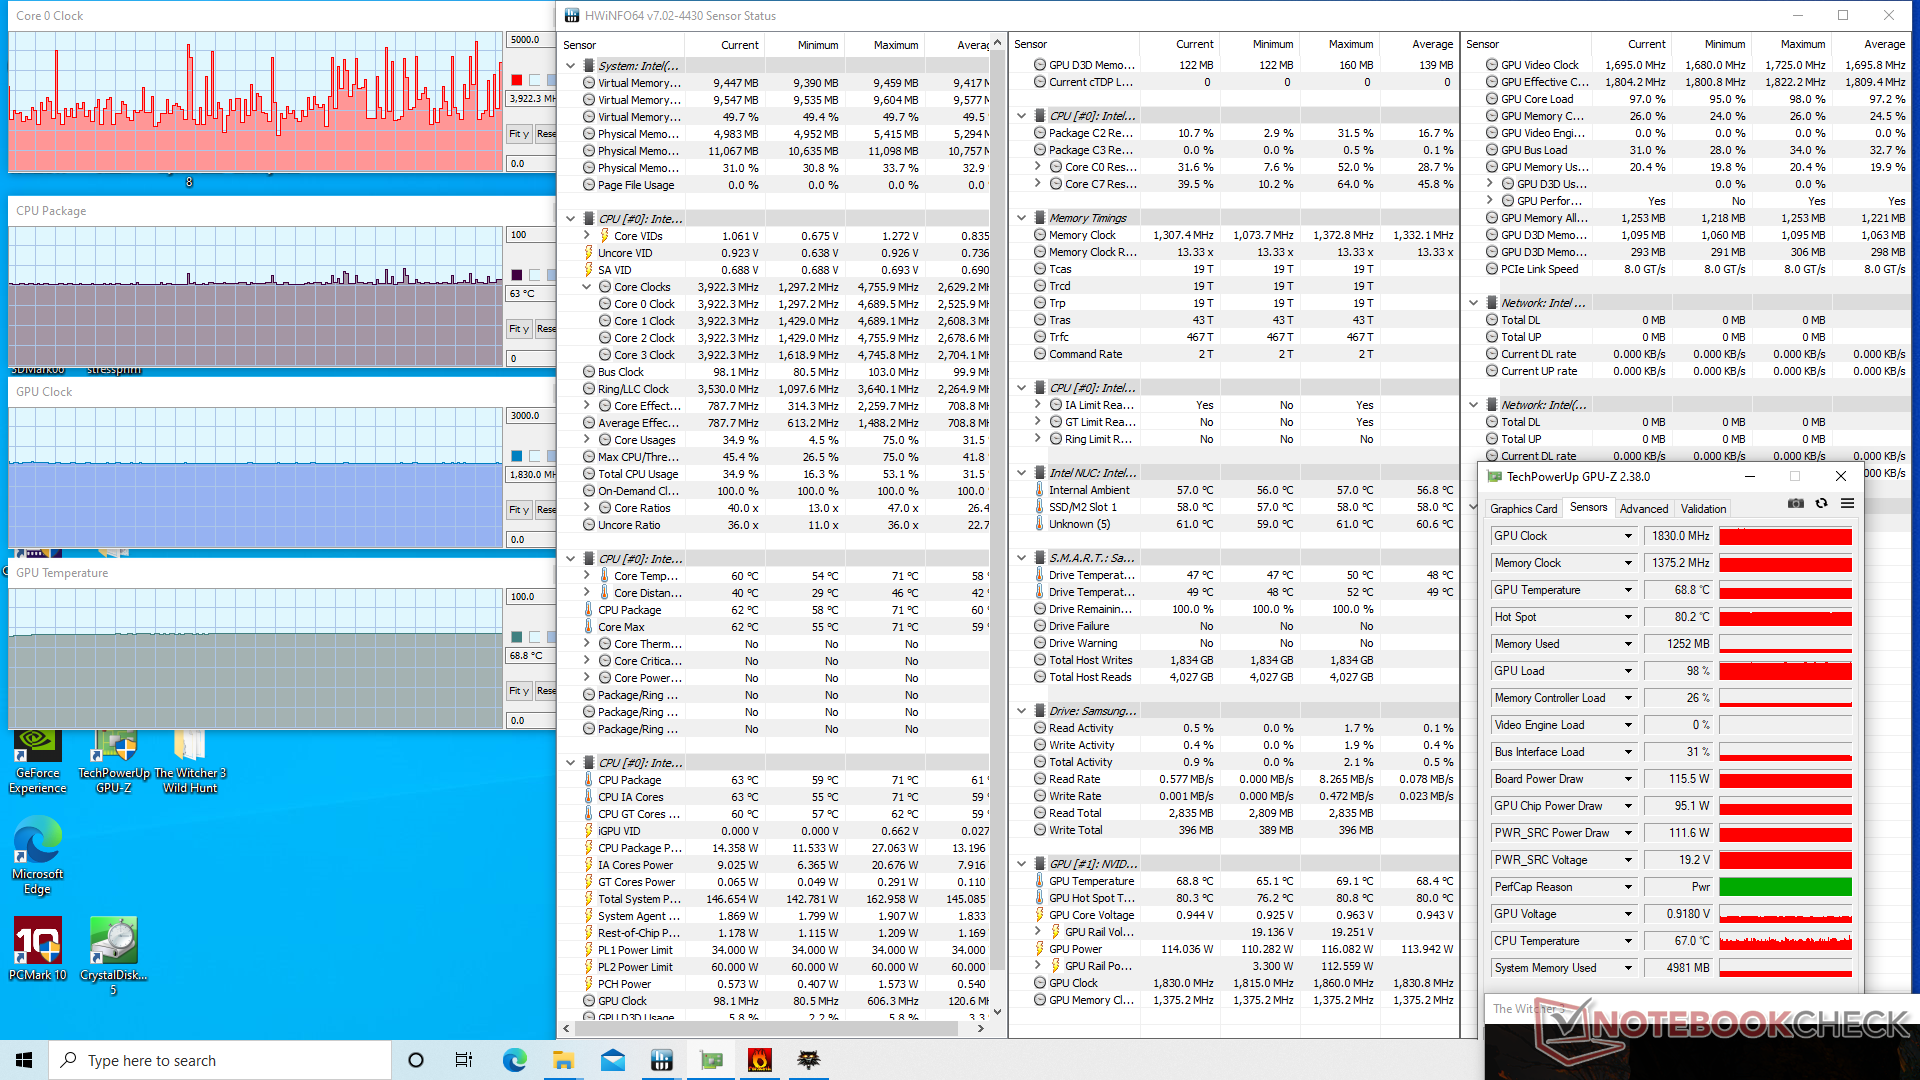
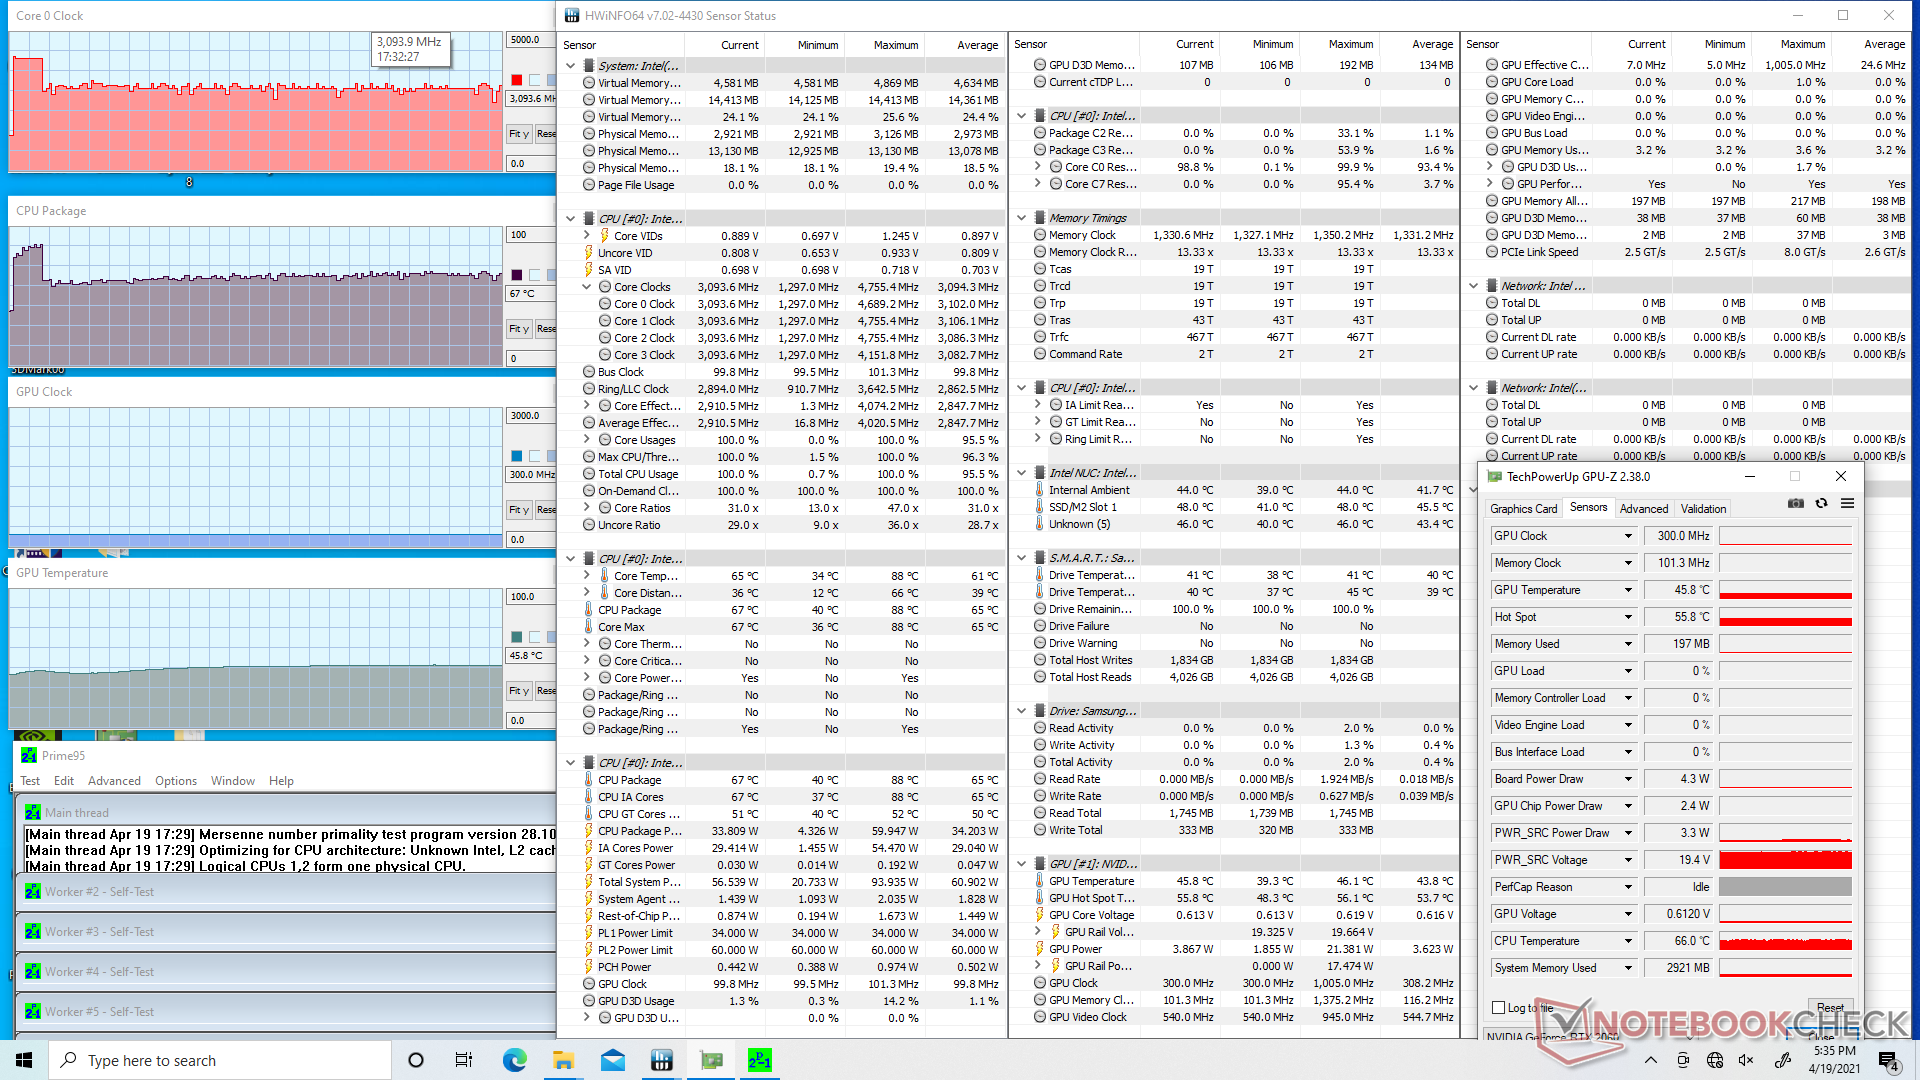
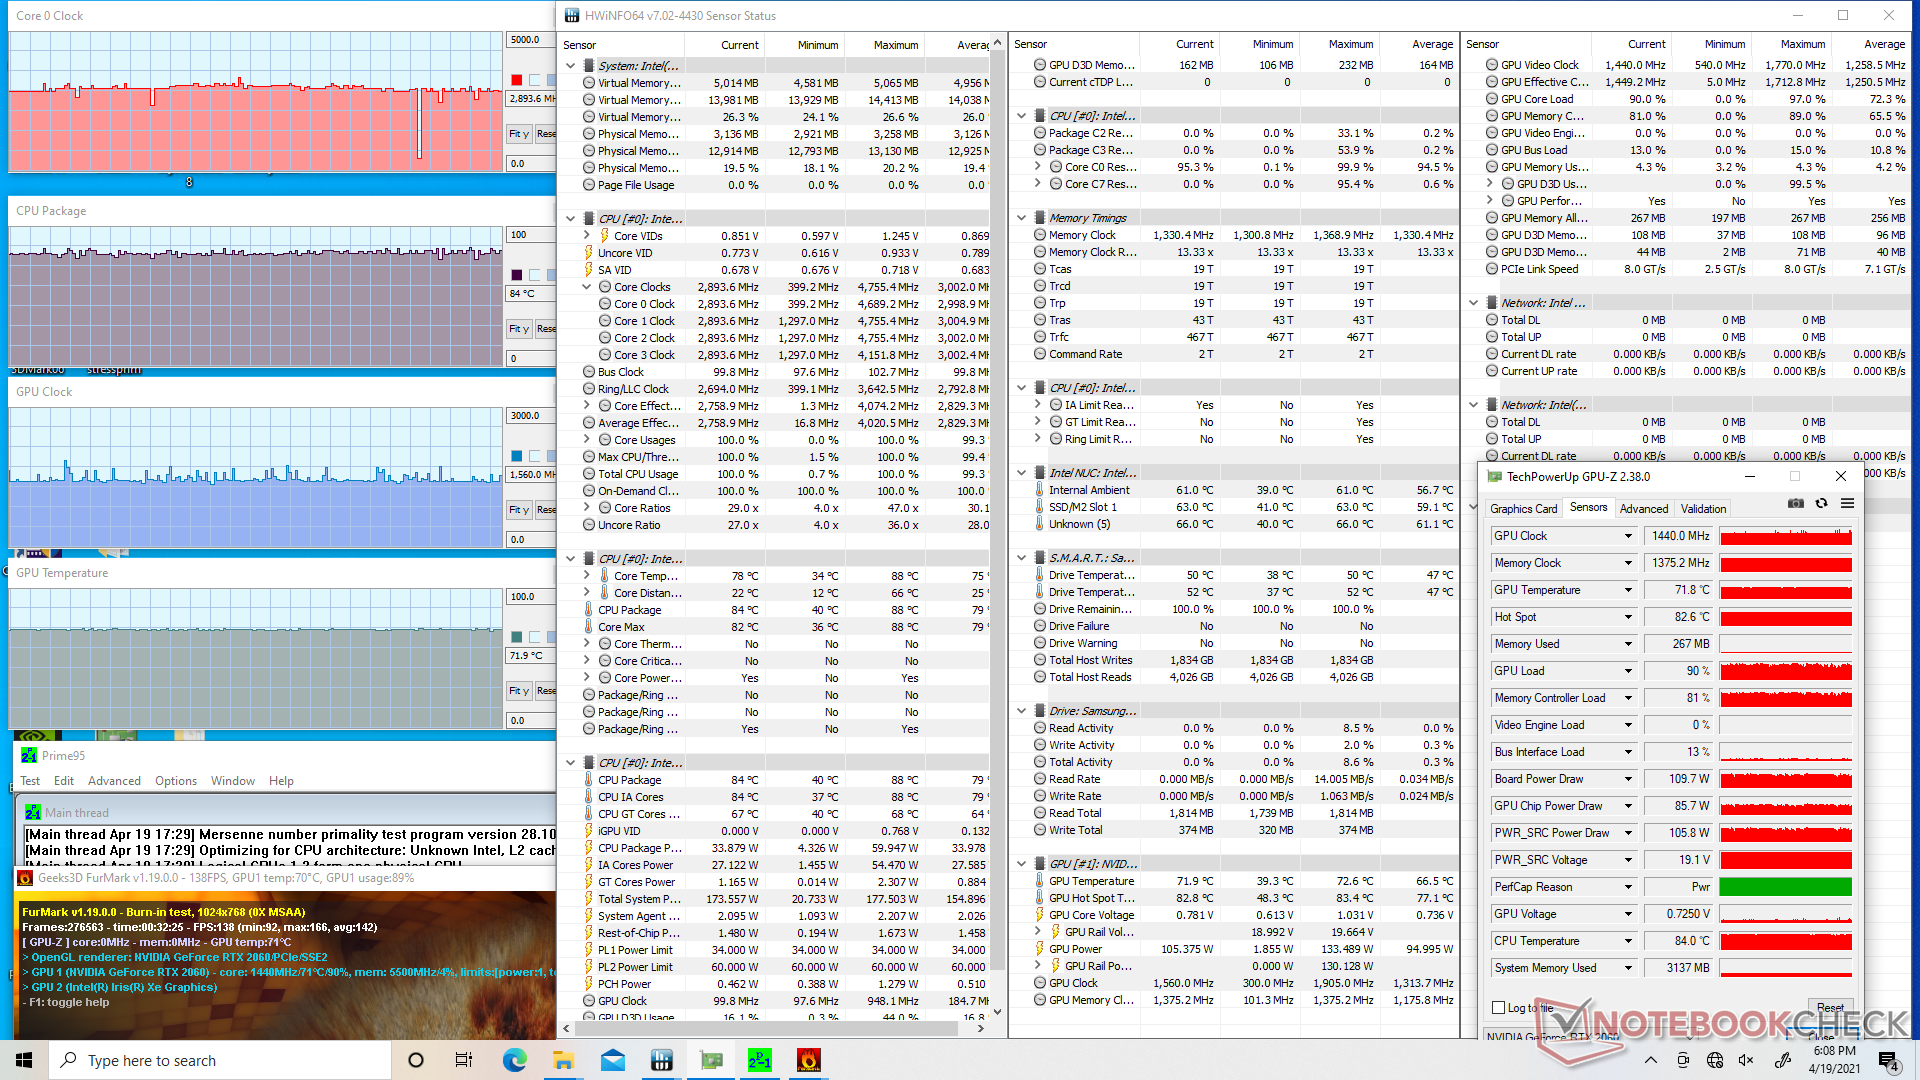
| Fréquence CPU(GHz) | Fréquence GPU(MHz) | Température CPU moyenne(°C) | Température GPUmoyenne(°C) |
| Système au repos | -- | ||
| Prime95 Stress | 3.0 - 3.2 | -- | 67 |
| Prime95+ FurMark Stress | 2.9 | 1440 | 84 |
| Witcher 3 Stress | 1.5 - 4.2 | 1830 | 63 |
Energy Management
Consommation d'énergie
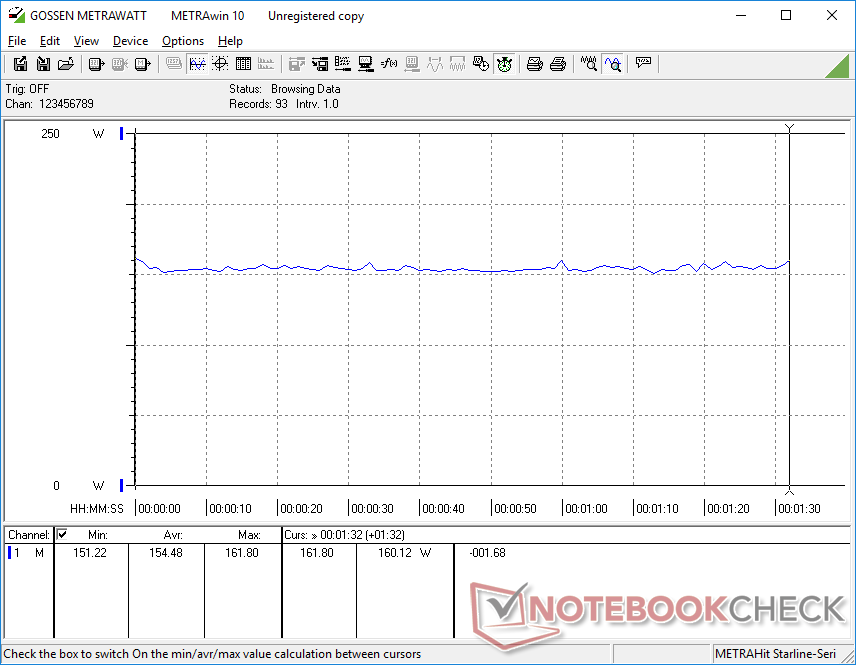
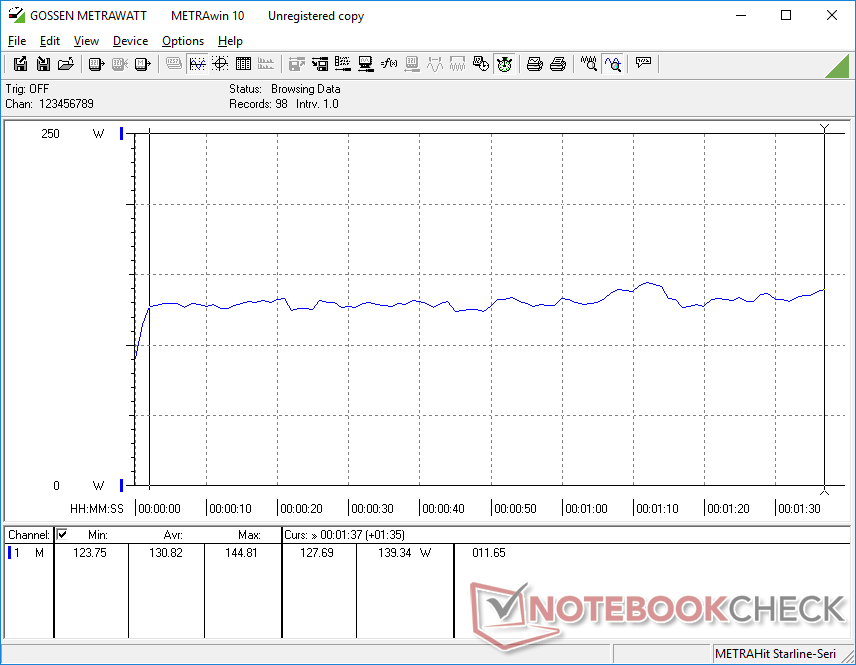
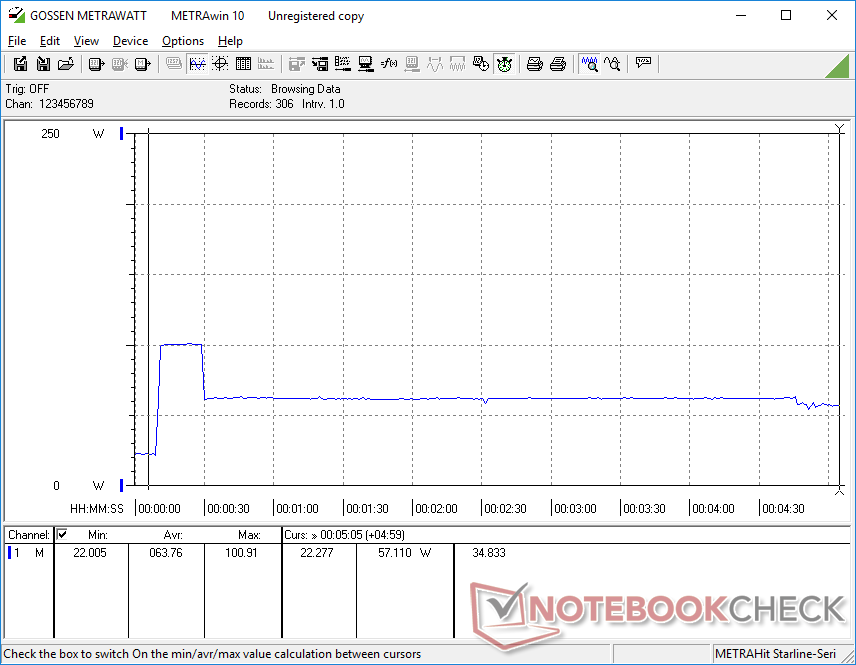
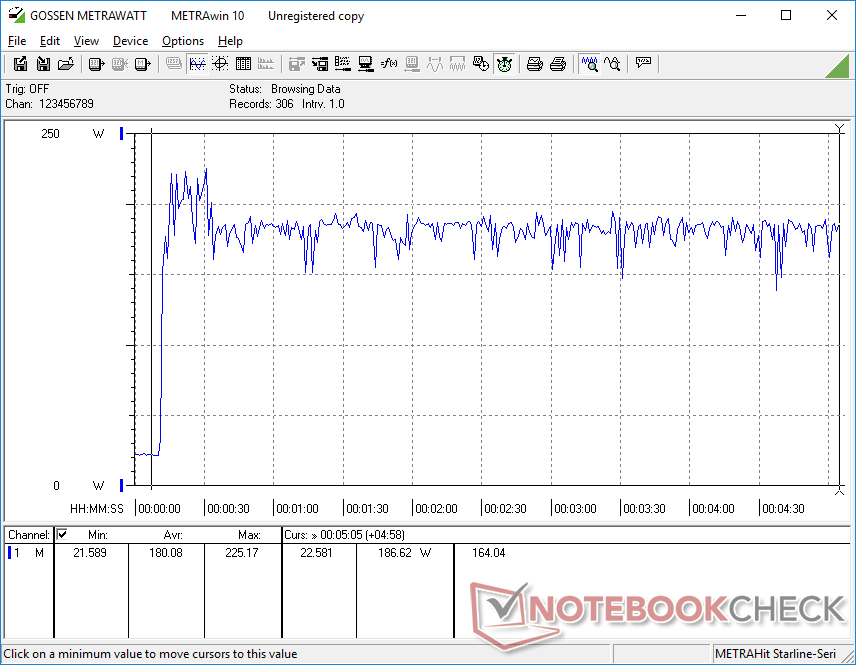
Le fonctionnement au ralenti sur le bureau ne consomme que 5 à 6 W lorsqu'aucun écran ou périphérique USB n'est connecté et 21 W lorsque les claviers, souris et écrans sont connectés avec le GPU discret actif. La consommation d'énergie lors des jeux peut être de 30 à 60 % plus élevée que celle du NUC Hades Canyon, ce qui est juste compte tenu de l'augmentation de 70 à 100 % des performances graphiques.
Nous avons pu enregistrer une consommation temporaire maximale de 225 W sur le grand (~20 x 10 x 2 cm) adaptateur secteur de 240 W en exécutant Prime95 et FurMark simultanément. Notez que le NUC11 Phantom Canyon utilise le même adaptateur secteur Lite-On que le NUC8 Hades Canyon et qu'ils sont donc interchangeables.
| Éteint/en veille | |
| Au repos | |
| Fortement sollicité |
|
Légende:
min: | |
| Intel NUC11PHKi7C i7-1165G7, GeForce RTX 2060 Mobile, Samsung SSD 980 Pro 500GB MZ-V8P500BW, , x, | Intel Hades Canyon NUC8i7HVK i7-8809G, Vega M GH, Intel Optane 120 GB SSDPEK1W120GA, , x, | Intel NUC11PAQi7 i7-1165G7, Iris Xe G7 96EUs, Samsung SSD 980 Pro 500GB MZ-V8P500BW, , x, | Zotac ZBOX Magnus EK71080 i7-7700HQ, GeForce GTX 1080 (Desktop), Samsung PM961 MZVLW256HEHP, , x, 0" | Aorus Gaming Box GeForce RTX 2080 Ti i7-1165G7, , , , x, | |
|---|---|---|---|---|---|
| Power Consumption | -40% | 49% | -131% | -154% | |
| Idle Minimum * (Watt) | 5.8 | 15.5 -167% | 5.6 3% | 27.1 -367% | 29.6 -410% |
| Idle Average * (Watt) | 5.9 | 16.2 -175% | 5.6 5% | 27.4 -364% | 29.6 -402% |
| Idle Maximum * (Watt) | 20.7 | 16.5 20% | 6 71% | 28.8 -39% | 29.6 -43% |
| Load Average * (Watt) | 130.8 | 83.4 36% | 31.4 76% | 100.4 23% | 79.9 39% |
| Witcher 3 ultra * (Watt) | 154.4 | 121.7 21% | 39 75% | 243.1 -57% | 252 -63% |
| Load Maximum * (Watt) | 225.2 | 173.5 23% | 80.5 64% | 186.7 17% | 319.8 -42% |
* ... Moindre est la valeur, meilleures sont les performances
Points positifs
Points négatifs
Verdict
Phantom Canyon est la preuve qu'Intel a tourné la page de Kaby Lake-G. La nouveauté d'un chipset Intel-AMD a disparu au profit de processeurs et de modules VRAM plus courants sur les ultrabooks et les ordinateurs portables de jeu. Cela signifie en fin de compte une prise en charge des pilotes plus fiable et une compatibilité avec les jeux plus aisée que ce que Hades Canyon pouvait espérer.
Hades Canyon se sent presque obsolète face à Phantom Canyon. Le dernier NUC est peut-être un peu plus gros, mais il est nettement plus rapide sans avoir besoin de fonctionner plus bruyamment ou plus chaudement pour compenser l'augmentation de taille d'une génération à l'autre.
Les performances globales sont plus rapides que celles de Hades Canyon, comme prévu, mais il est bon de voir que cela ne se fait pas au prix d'une augmentation sensible du bruit des ventilateurs ou d'une augmentation de la température du cœur, ce qui est toujours la crainte lors de la mise à niveau vers des PC plus rapides.
Les inconvénients sont la taille légèrement plus épaisse et la consommation d'énergie plus élevée que Hades Canyon, la brique d'alimentation inesthétique, et son prix de vente élevé de plus de 1000 $ US pour une unité nue. Les utilisateurs devront vraiment apprécier le facteur de forme et la qualité du nom NUC, car des ordinateurs portables de jeu plus puissants - dotés de RAM et de stockage, soit dit en passant - sont disponibles à peu près au même prix.
Prix et disponibilité
Le NUC11PHKi7C Phantom Canyon d'Intel n'est pas encore disponible à l'heure actuelle. Simplynuc.com propose actuellement des précommandes pour le système à partir de 1339 USD.
Price comparison

