Test du mini-PC Beelink GTI 11 : notre meilleure alternative à l'Intel NUC 11
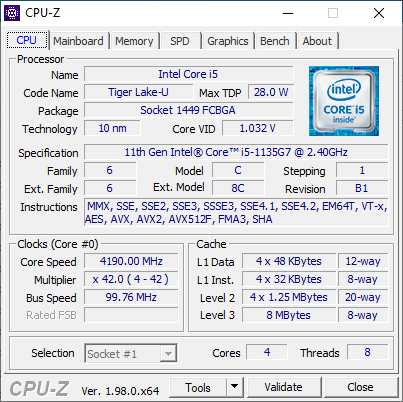
Beelink propose toute une gamme de mini-PC destinés aux acheteurs intéressés par l'expérience Intel NUC sans avoir à payer les prix élevés de ces derniers. Le modèle le plus récent est le GTI 11 qui utilise le dernier processeur Core i5-1135G7 de 11e génération Tiger Lake-U avec des graphiques Iris Xe 80 EUs intégrés. Ce détail est remarquable car la plupart des autres mini-PC Beelink utilisent généralement des processeurs plus anciens ou plus lents afin de maintenir les coûts à des niveaux plus abordables. Le GTI 11 est donc l'un des mini-PC les plus rapides et les plus chers de la gamme actuelle de Beelink.
Les alternatives au GTI 11 incluent d'autres mini-PC alimentés par des CPU Intel Core U-series de 11ème génération comme le Intel NUC11 Phantom Canyon, Beelink GMK NucBoc 2ou Zotac ZBox CI665 Nano
Plus de commentaires sur Beelink :
Potential Competitors in Comparison
Note | Date | Modèle | Poids | Épaisseur | Taille | Résolution | Prix |
|---|---|---|---|---|---|---|---|
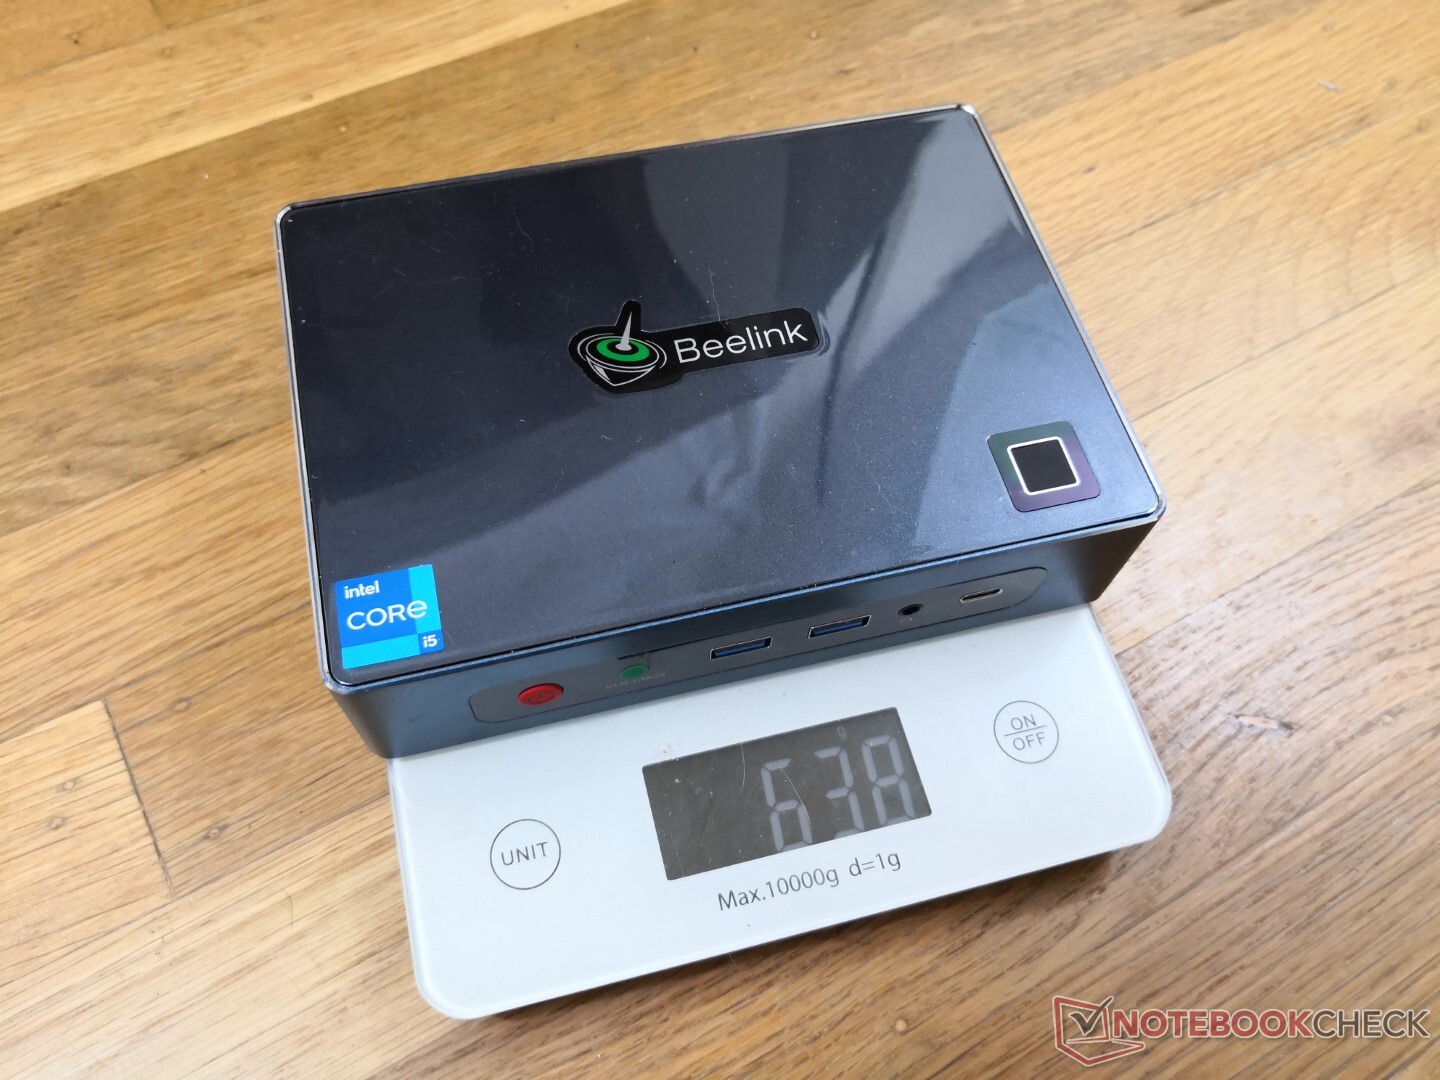
v (old) | 12/21 | Beelink GTI 11 i5-1135G7, Iris Xe G7 80EUs | 638 g | 39 mm | x | ||
v (old) | 11/21 | Beelink SER3 R7 3750H, Vega 10 | 492 g | 40 mm | x | ||
v (old) | 04/21 | Intel NUC11TNKi5 i5-1135G7, Iris Xe G7 80EUs | 504 g | 37 mm | x | ||
v (old) | 02/20 | Intel NUC10i7FNH i7-10710U, UHD Graphics 620 | 697 g | 51 mm | 0.00" | 0x0 | |
v (old) | 03/21 | GMK NucBox 2 i5-8259U, Iris Plus Graphics 655 | 430 g | 50 mm | x | ||
v (old) | 04/18 | Intel Hades Canyon NUC8i7HVK i7-8809G, Vega M GH | 1.3 kg | 39 mm | x |
Cas
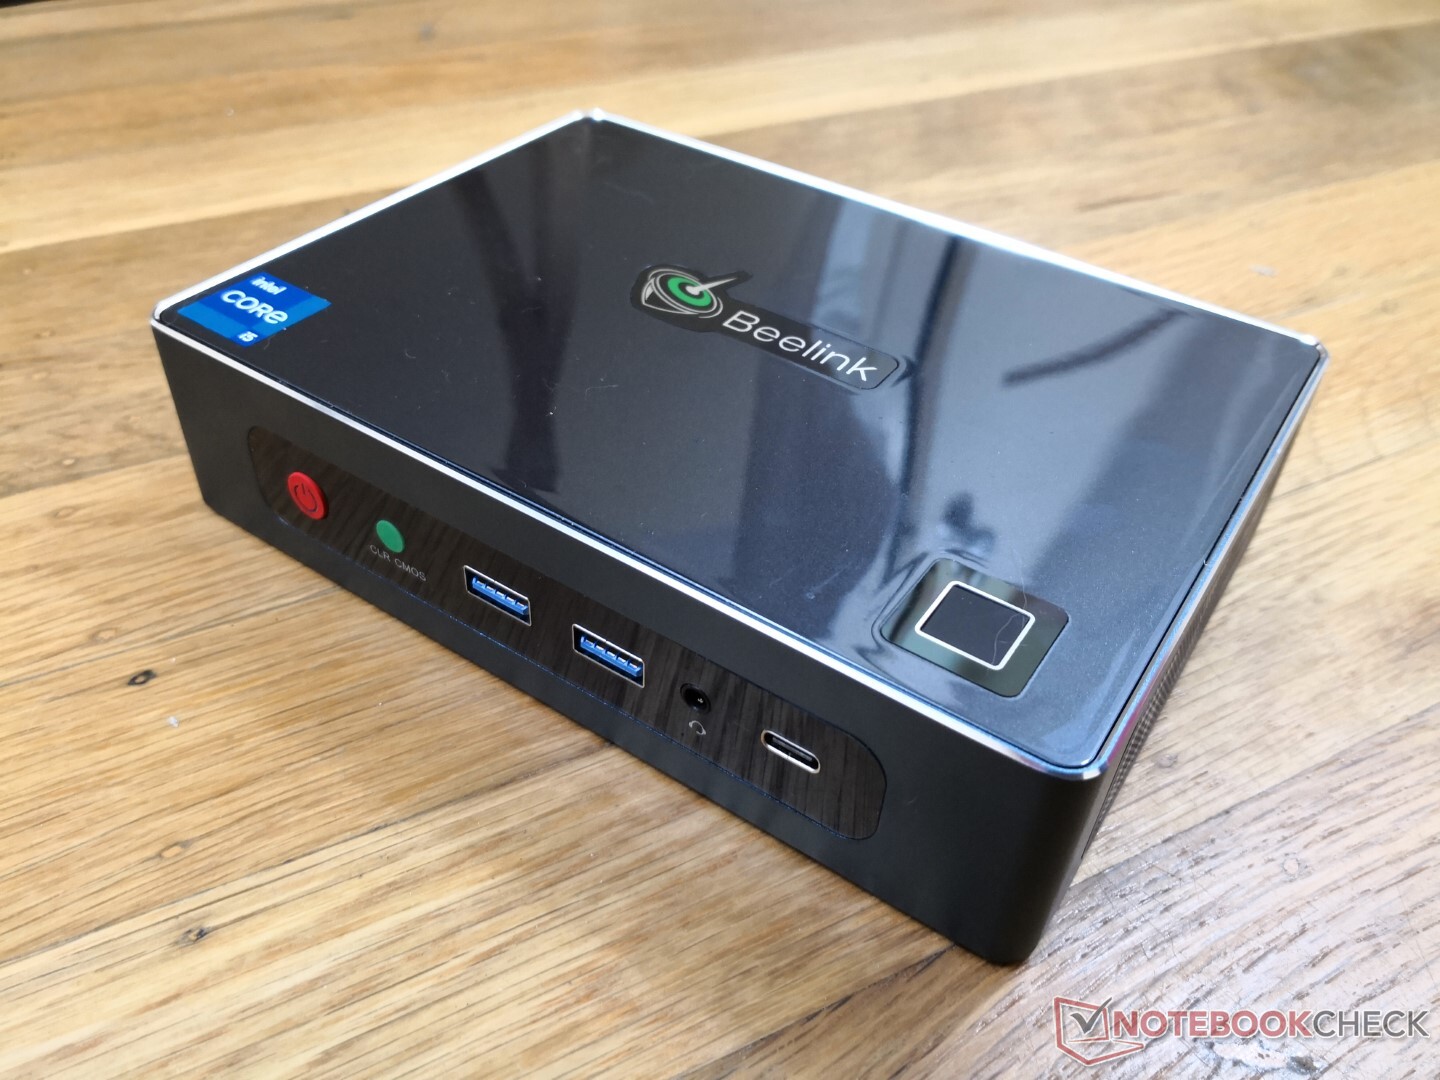
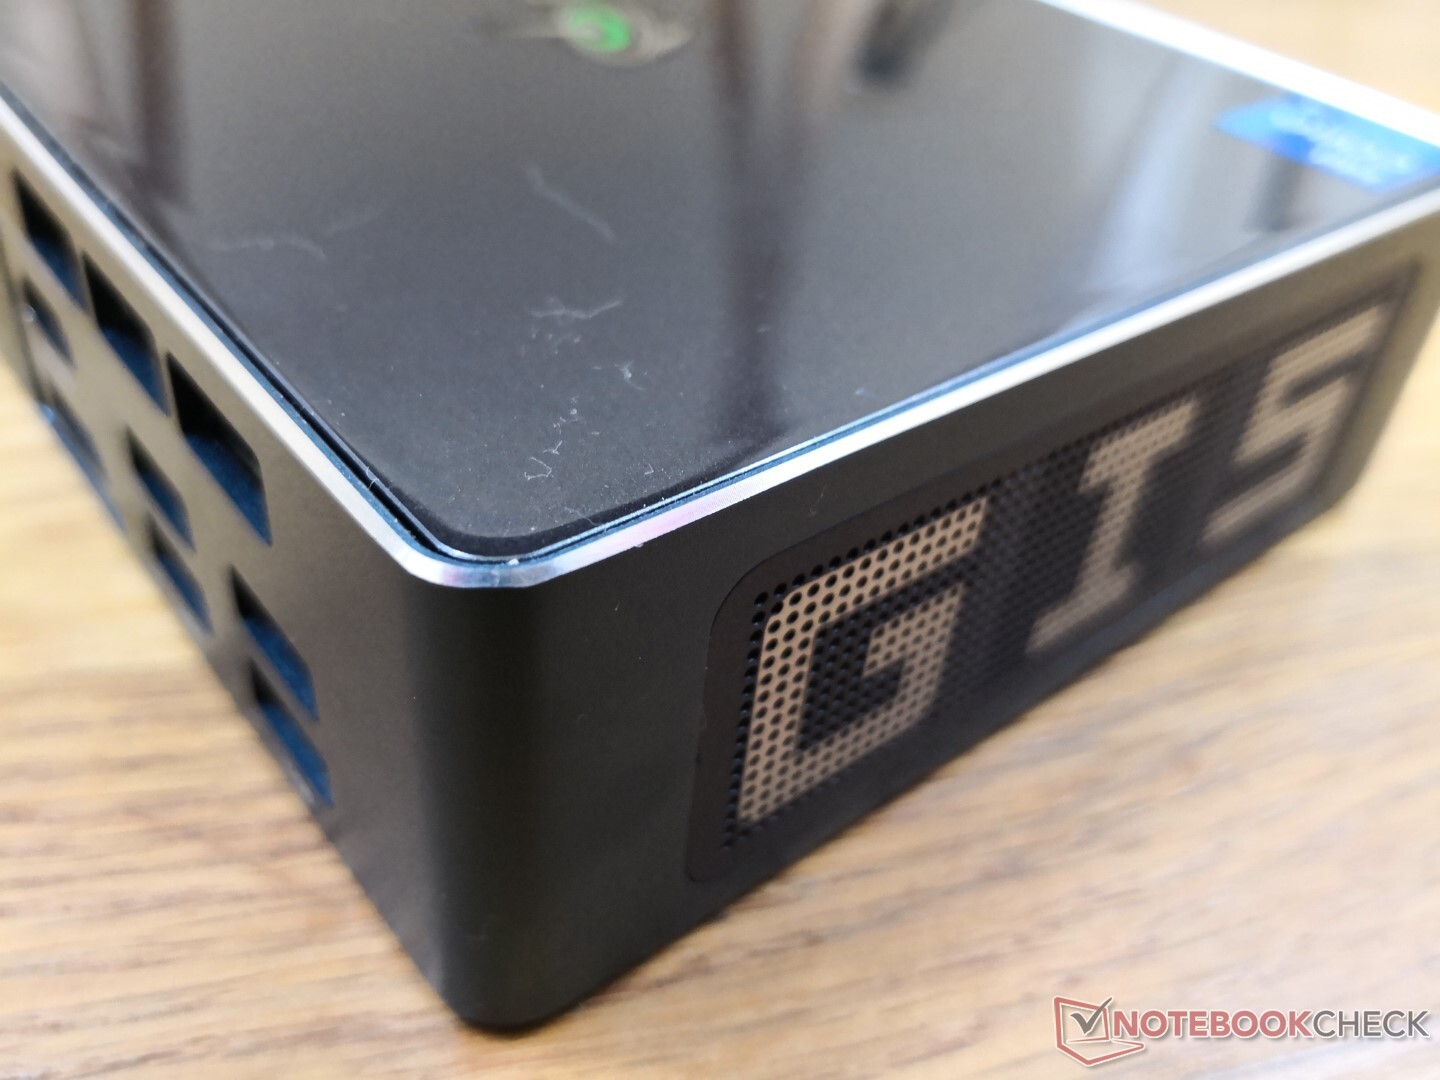
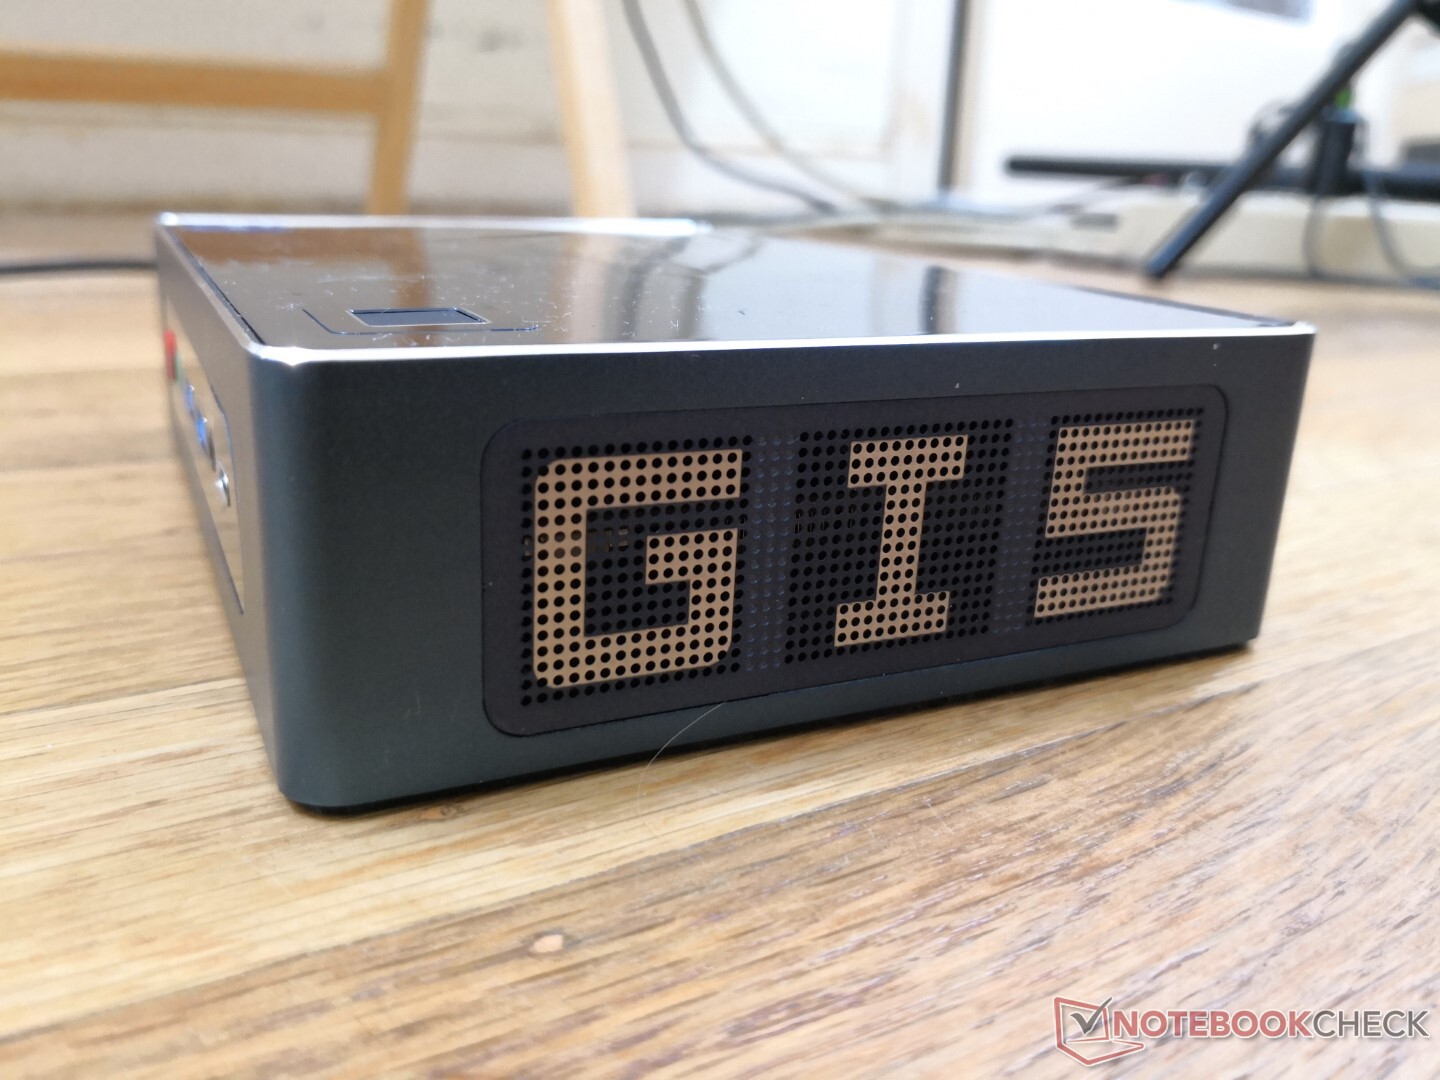
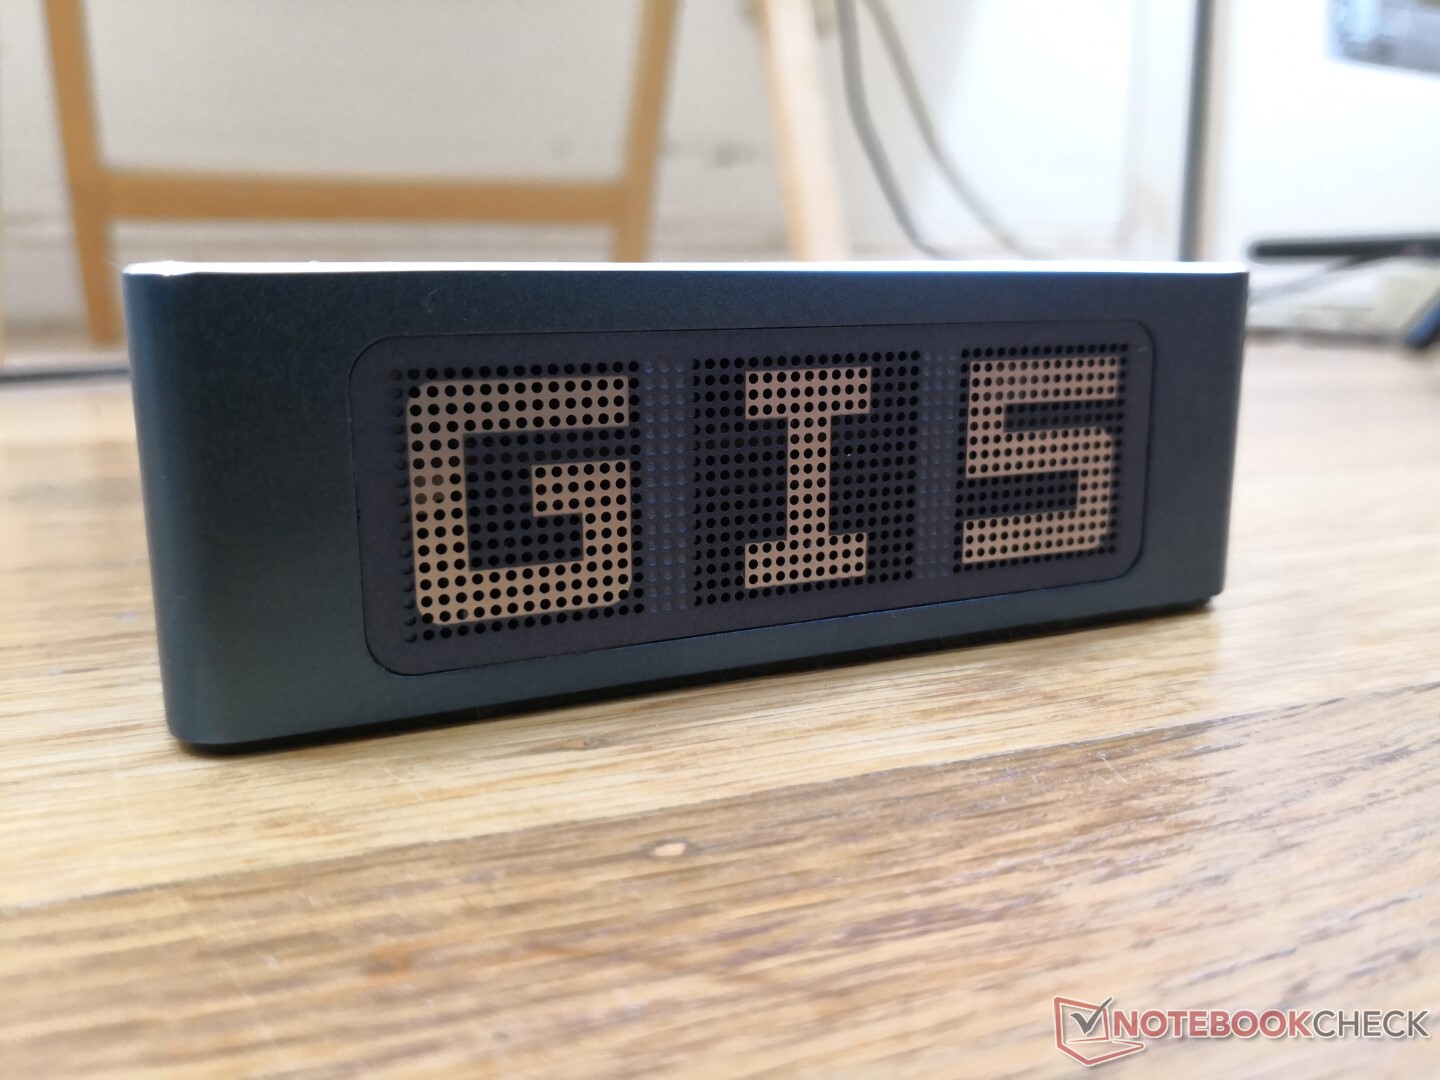
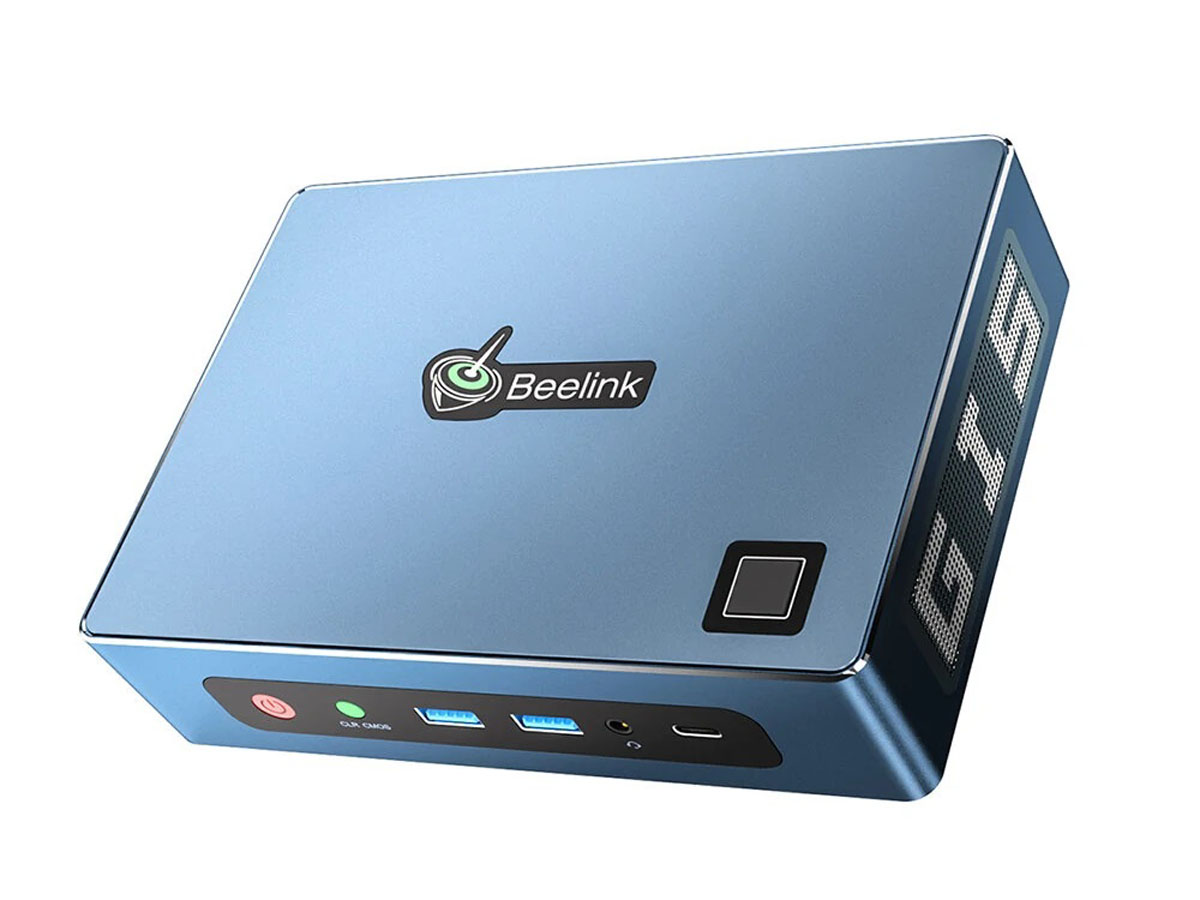
Le squelette est fait de matériaux plus fins et de moins de métal que sur un Intel NUC, probablement pour réduire les coûts et le poids. La qualité de construction est toujours excellente, sans flexion ni points faibles visibles. Nous n'aimons pas particulièrement le dessus en plastique brillant, cependant, car il attire à la fois les empreintes digitales et les rayures très rapidement
Connectivité
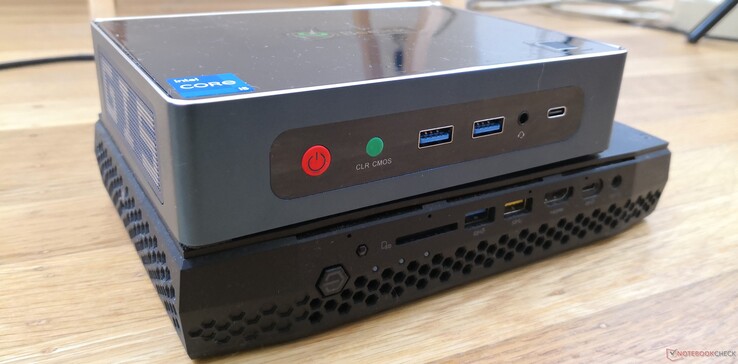
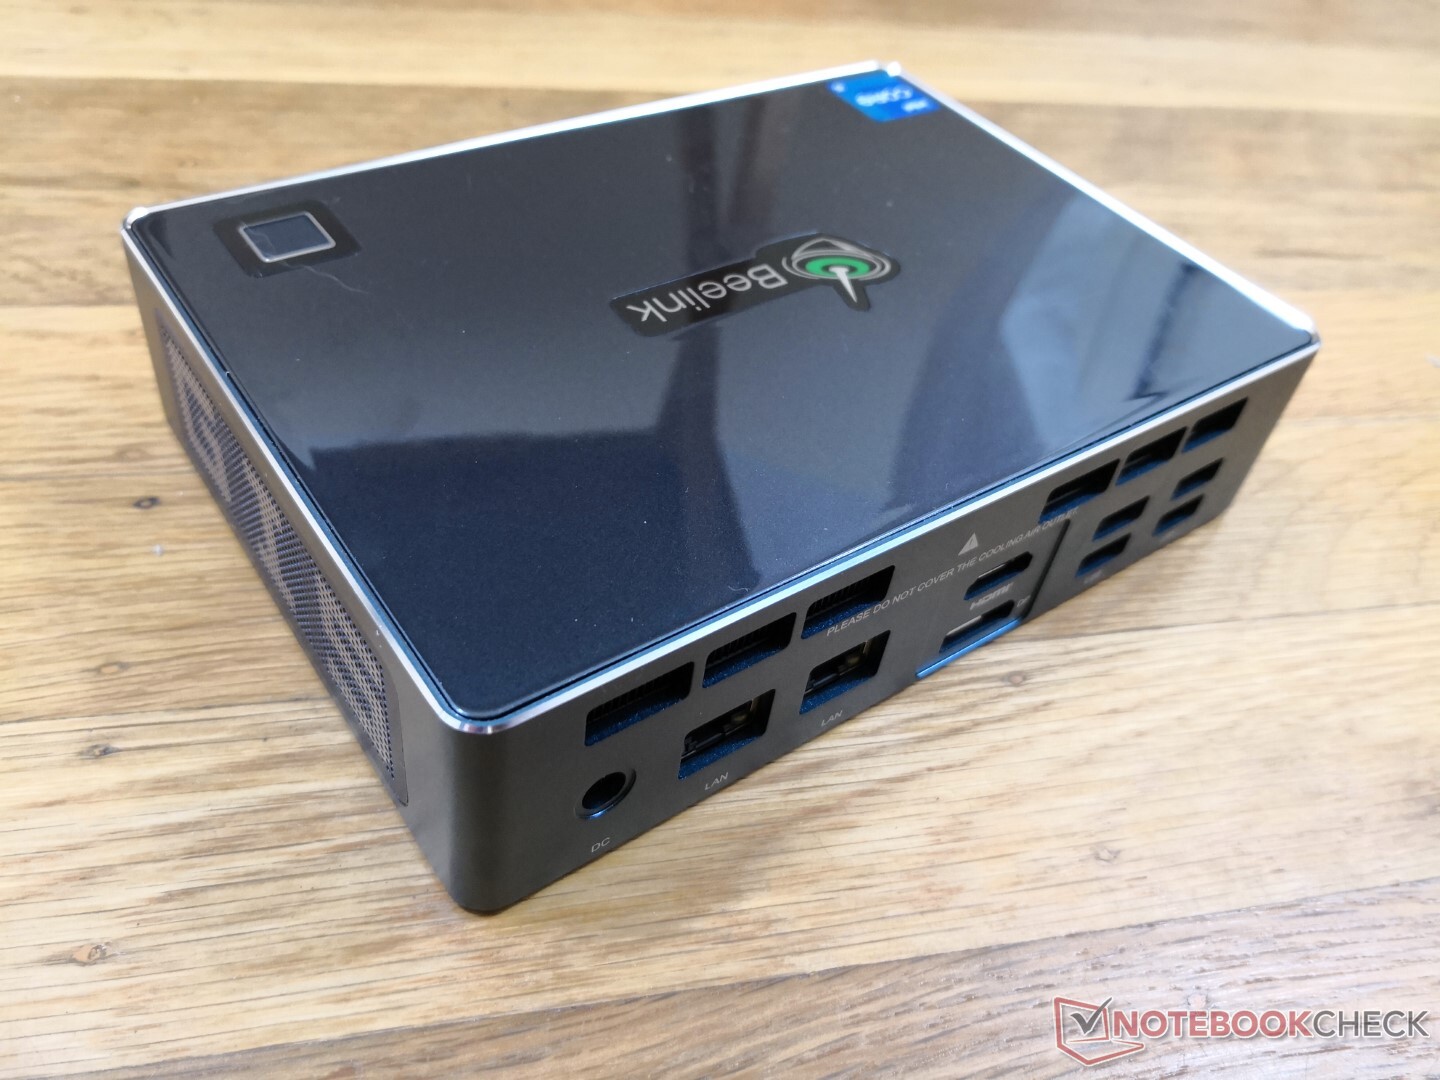
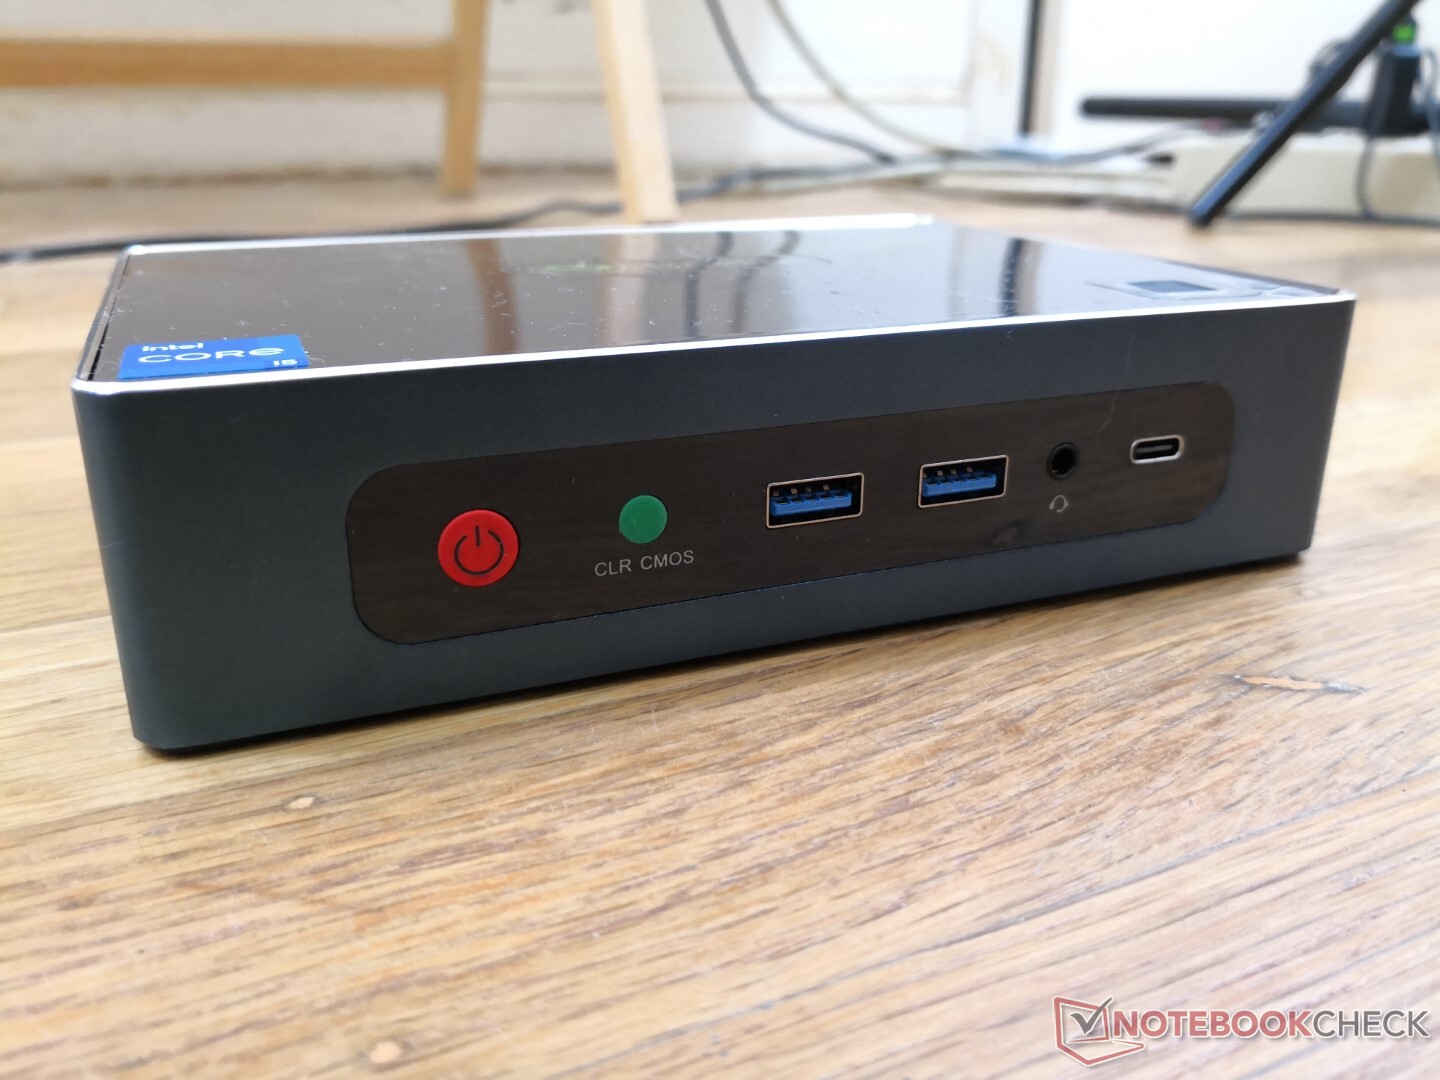
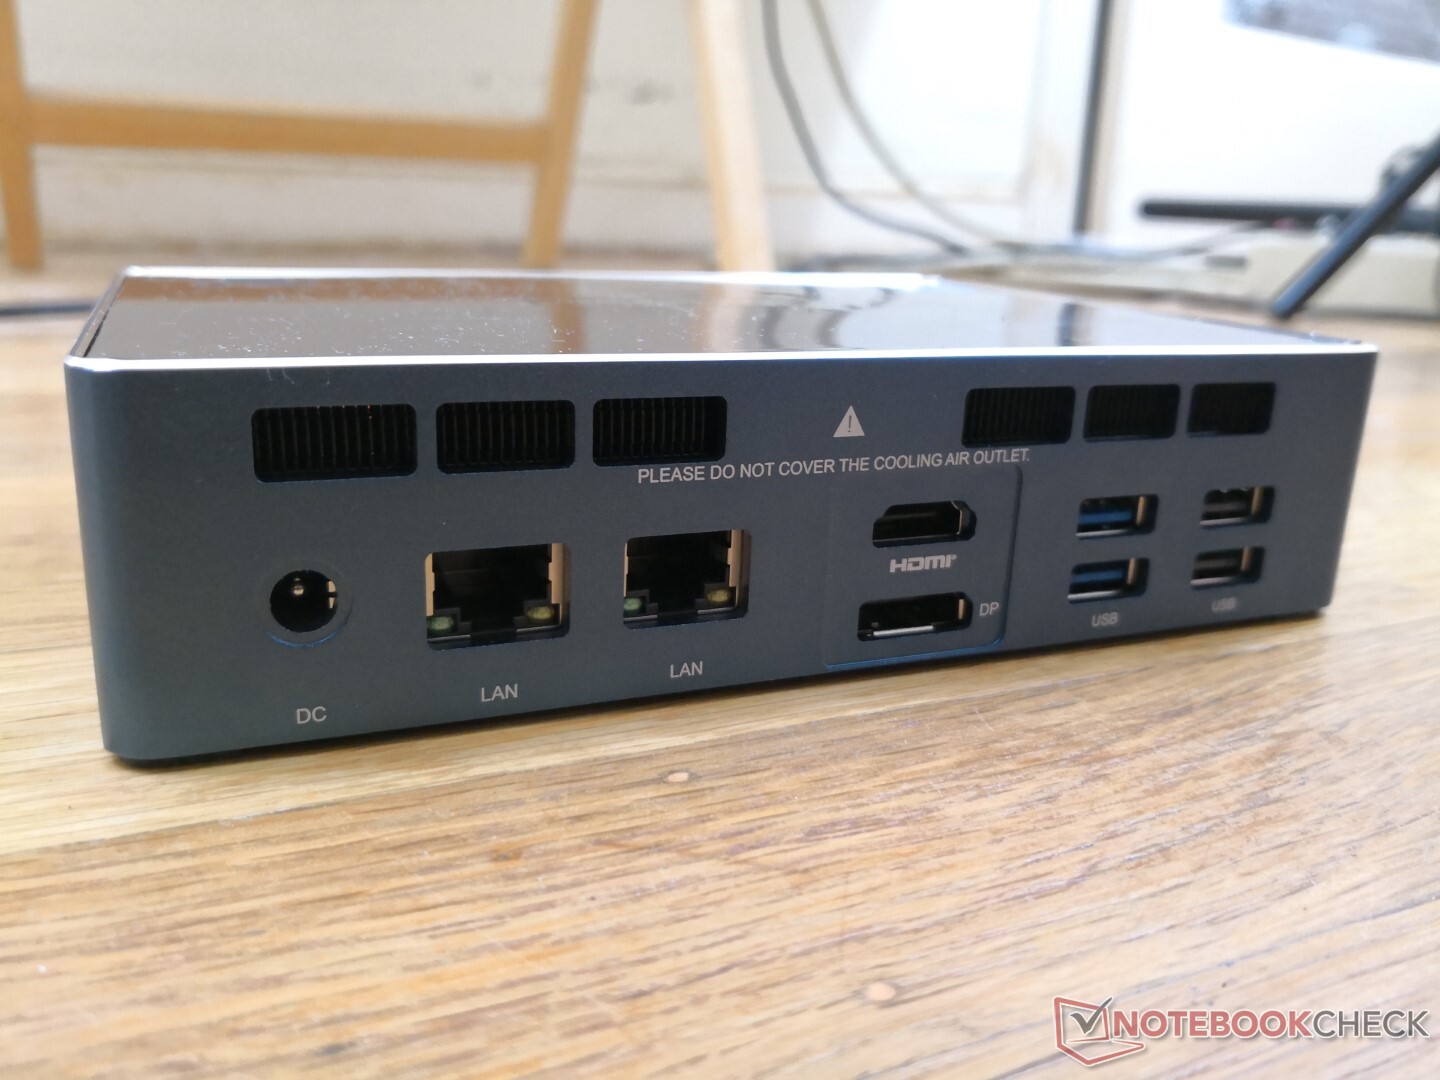
Les ports ne manquent pas, notamment les multiples ports RJ-45, les multiples ports HDMI et les six ports USB-A. Le port USB-C prend également en charge les périphériques Thunderbolt 4, même si le fabricant n'en fait pas la publicité. Le Thunderbolt Control Center est préinstallé et son fichier DxDiag confirme également la prise en charge de Thunderbolt.
L'unique port USB-C peut sembler contraignant et il n'y a pas de mini-DisplayPort ou de verrou Kensington, contrairement au NUC11TNKi5 Pro d'Intel.
Il faut noter que le Beelink peut être alimenté par USB-C au lieu de l'adaptateur secteur propriétaire. Nous avons testé cela avec un adaptateur USB-C de 130 W provenant d'un Dell XPS 15 9500 qui a fonctionné sans problème sur notre unité Beelink.
Communication
Modules de communication filaires et sans fil intégrés, comparaison des données de test du réseau avec celles des concurrents, solutions alternatives disponibles (5G/LTE) ?, Irrégularités (réception radio) ?
| Networking | |
| iperf3 transmit AX12 | |
| Intel NUC11TNKi5 | |
| Beelink GTI 11 | |
| GMK NucBox 2 | |
| Intel Hades Canyon NUC8i7HVK | |
| Beelink SER3 | |
| iperf3 receive AX12 | |
| Intel NUC11TNKi5 | |
| Beelink GTI 11 | |
| Beelink SER3 | |
| GMK NucBox 2 | |
| Intel Hades Canyon NUC8i7HVK | |
Maintenance
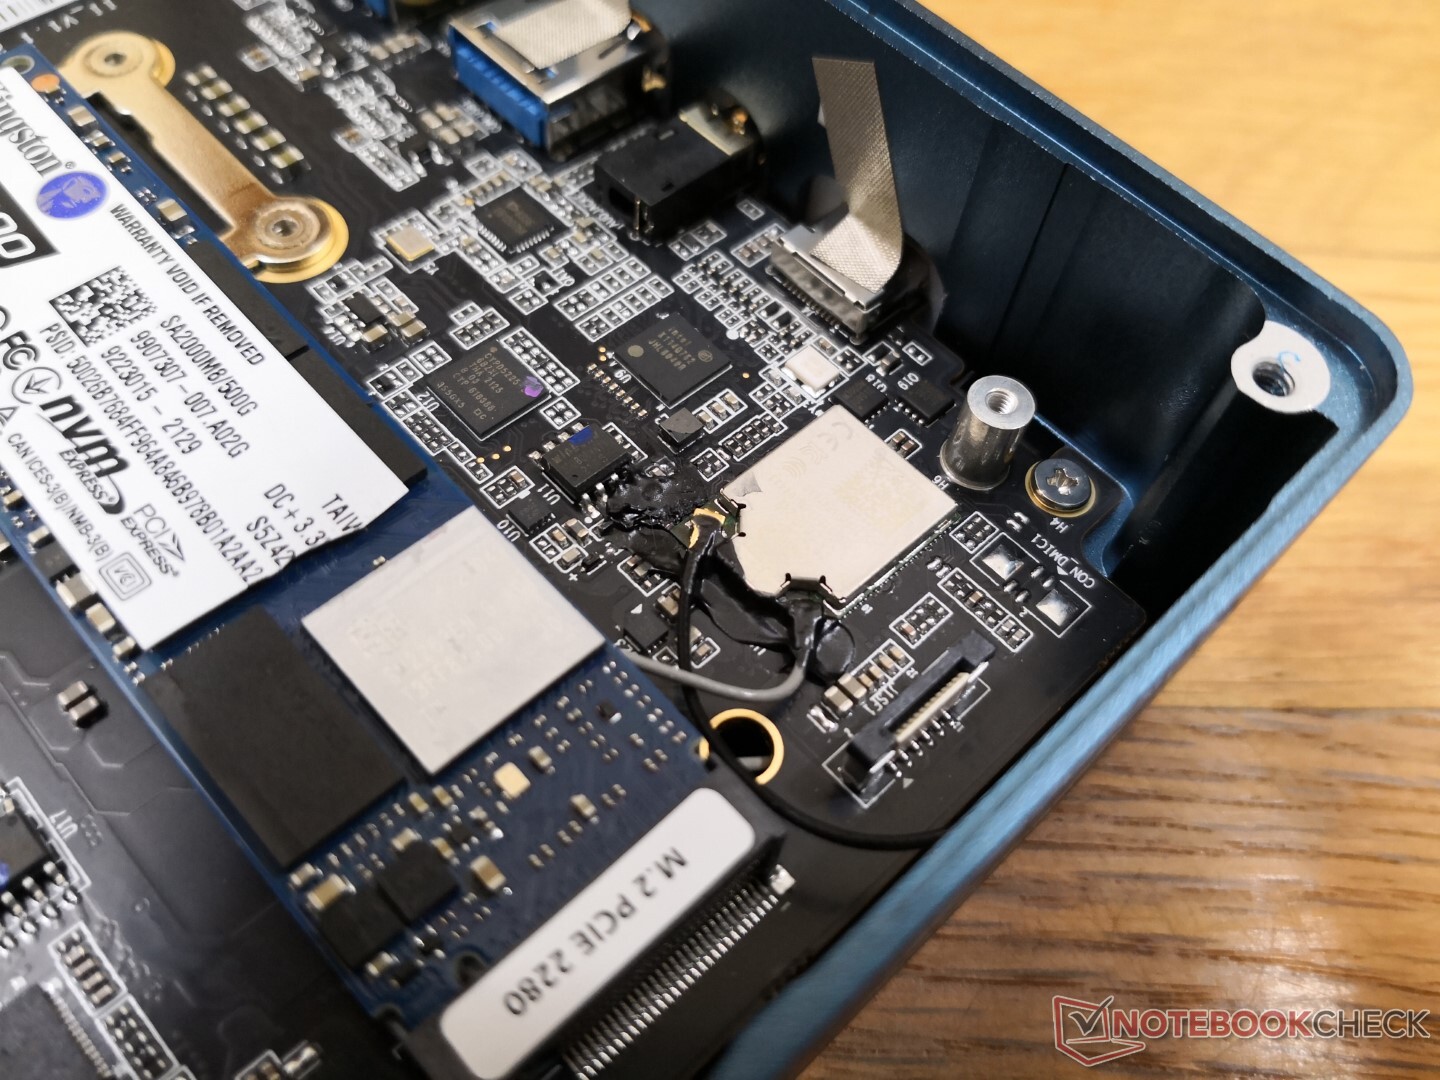
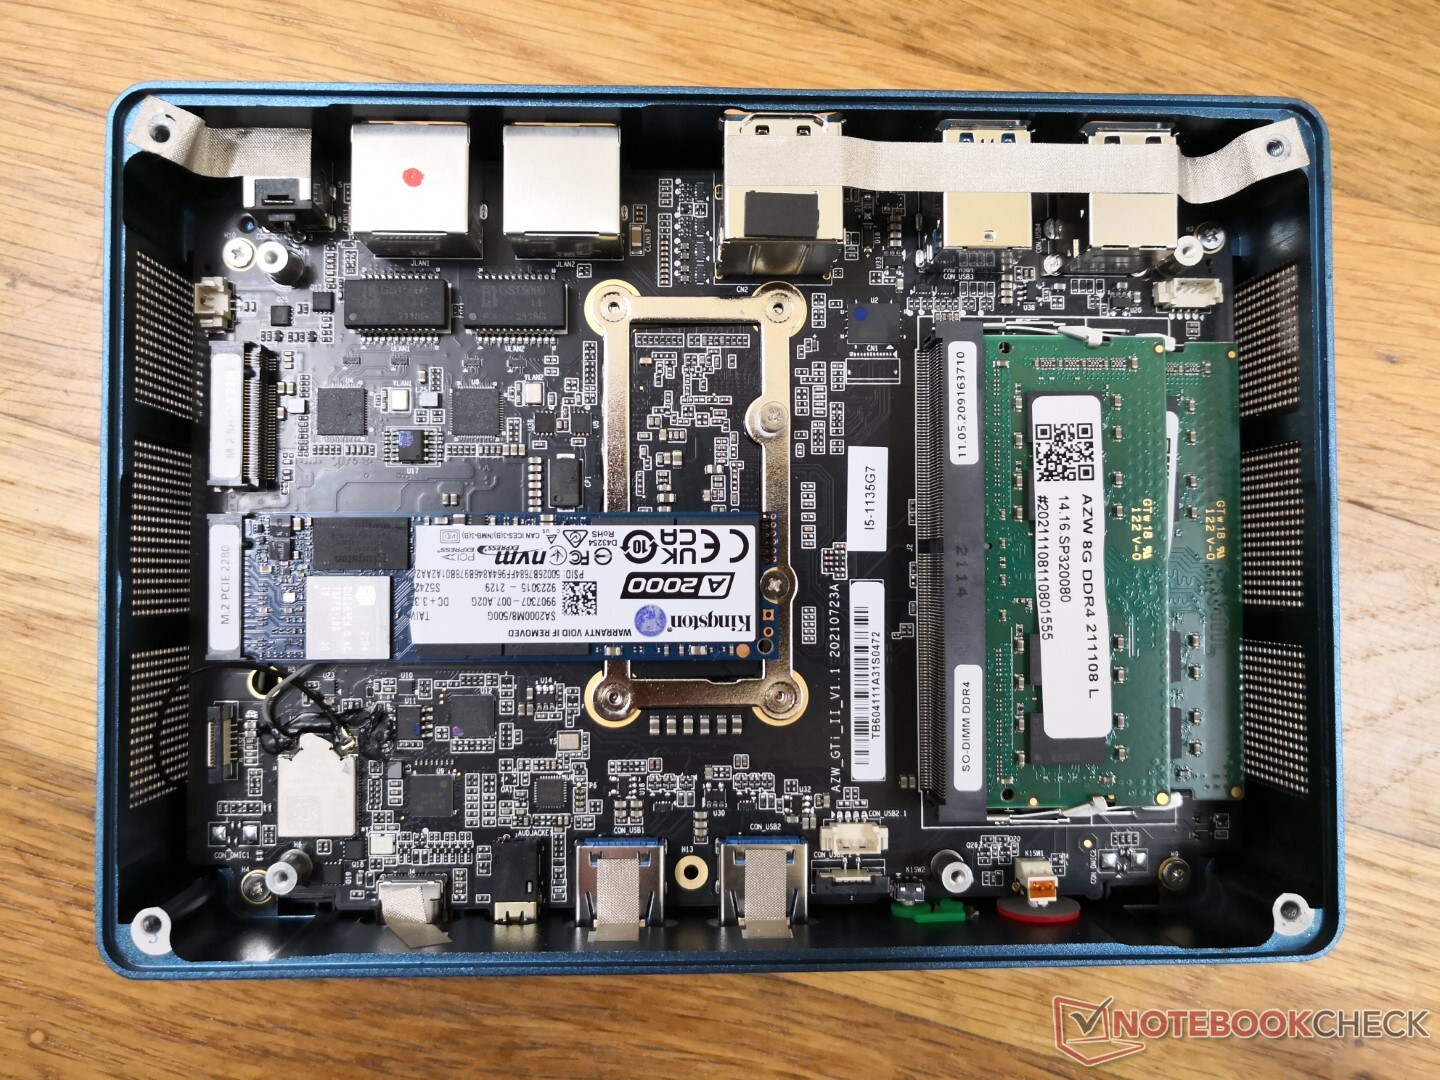
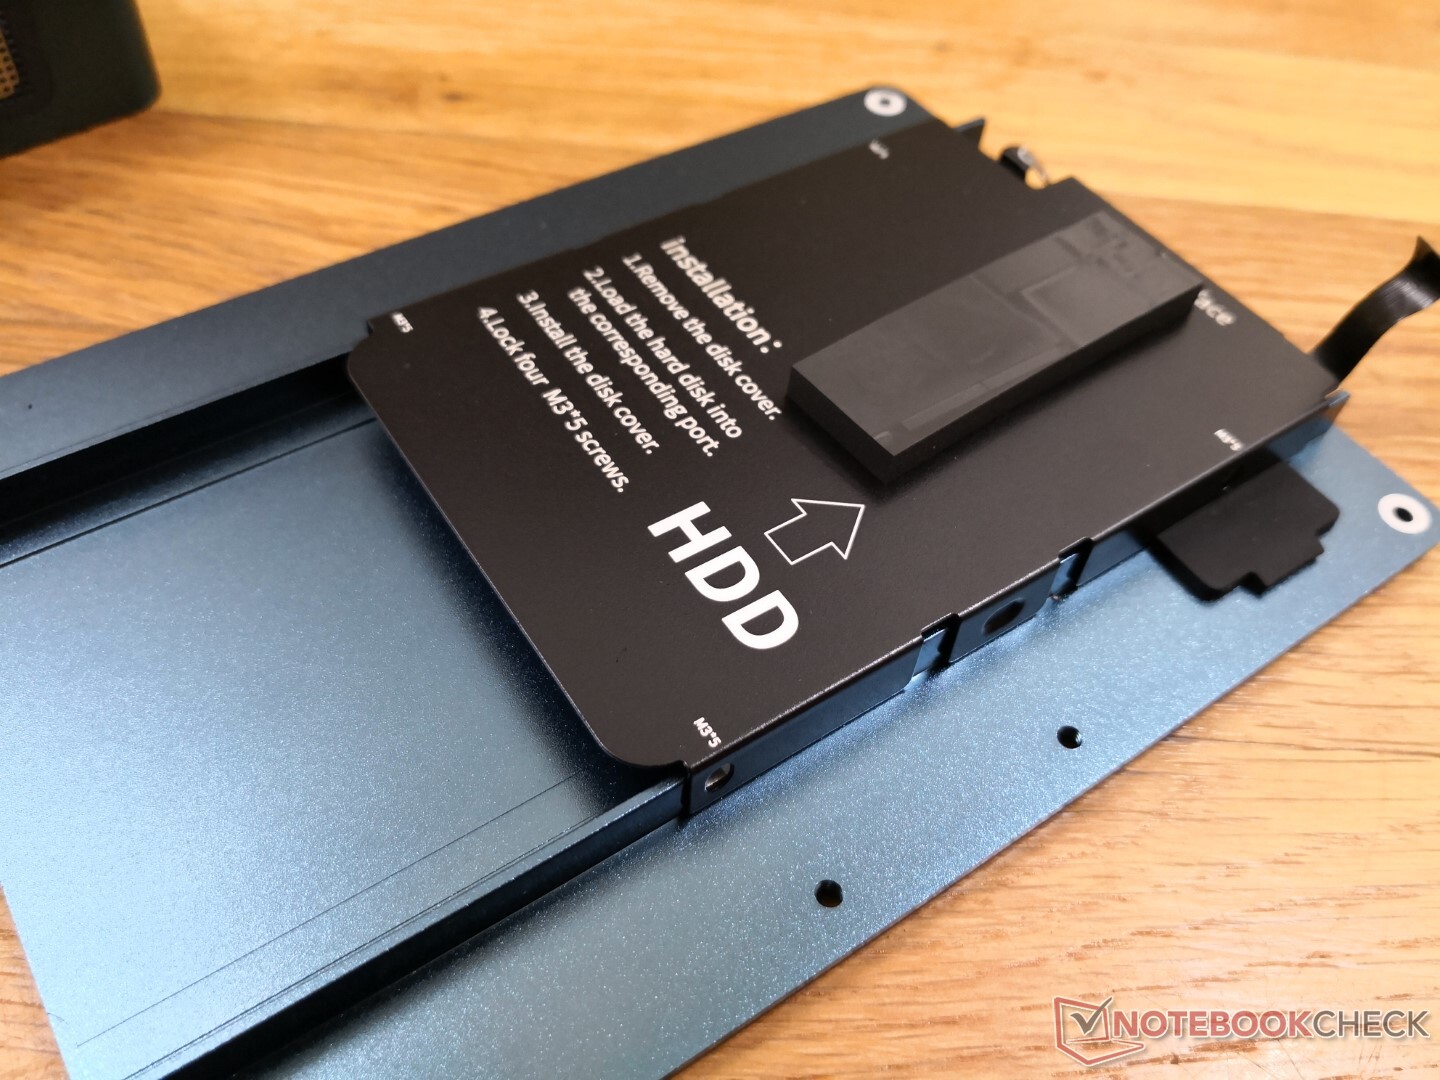
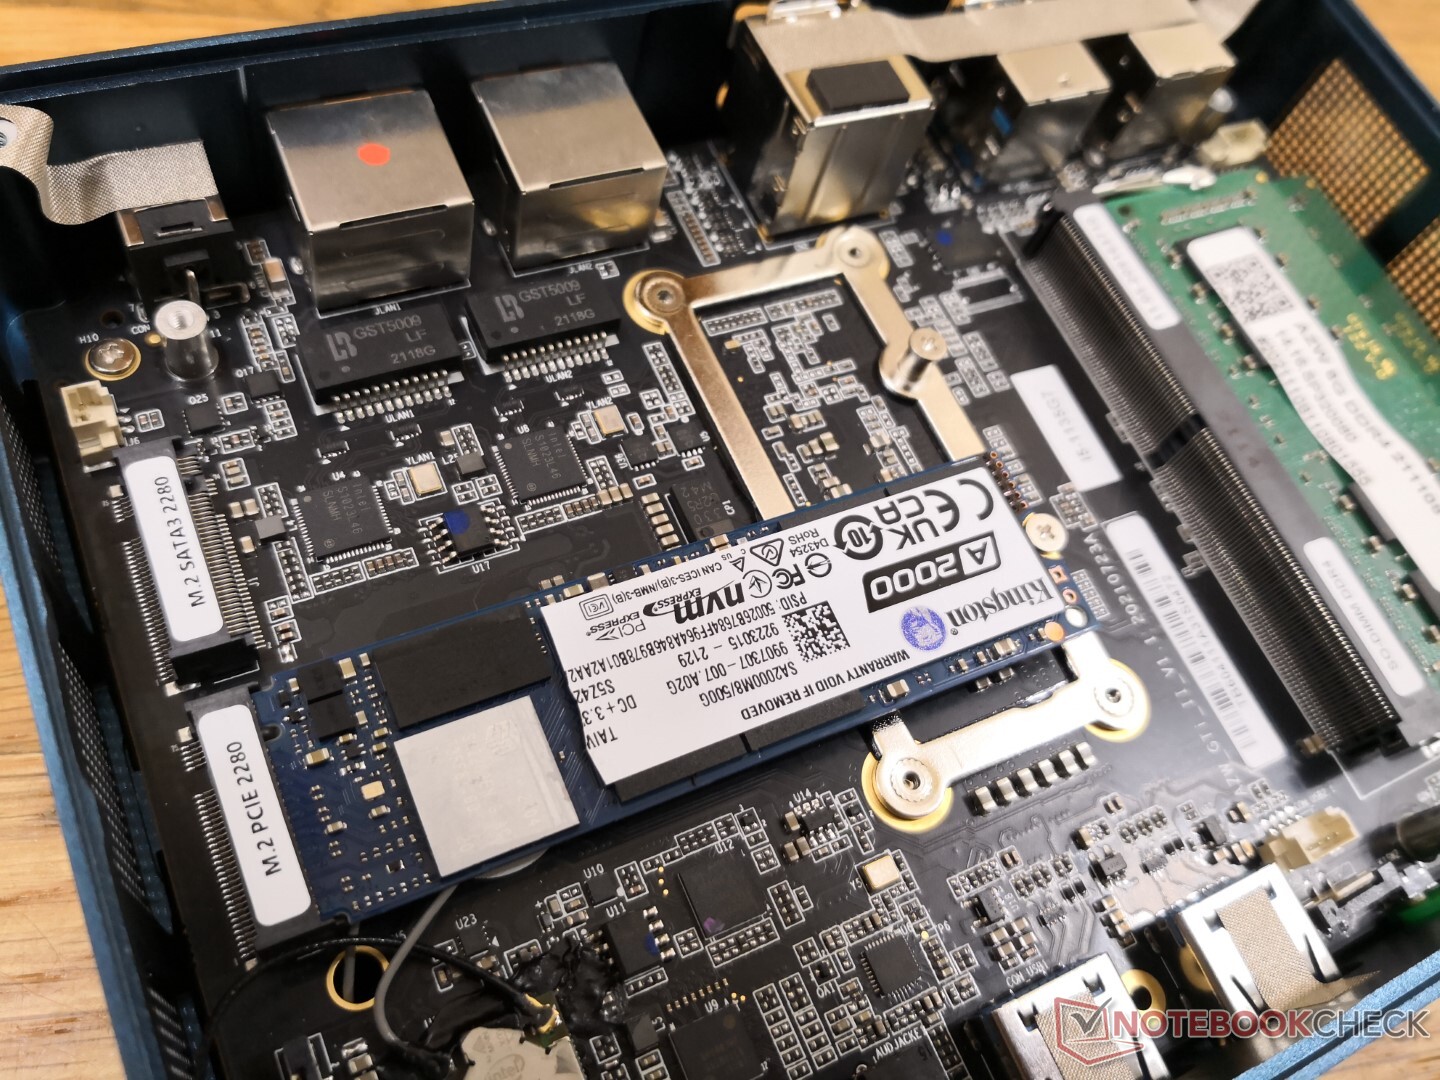
Le panneau inférieur peut être retiré à l'aide d'un simple tournevis Philips. Les utilisateurs doivent prendre soin de détacher également le ruban qui relie le panneau inférieur à la carte mère. Une fois le panneau inférieur retiré, on peut accéder directement aux deux emplacements SODIMM, aux deux emplacements M.2 2280 et à la baie SATA III de 2,5 pouces.
Accessoires et garantie
Les extras comprennent deux câbles HDMI, des vis supplémentaires et un support de comptage VESA 50/100 mm.
La garantie limitée standard d'un an s'applique. Le recours à la garantie peut être difficile pour certains utilisateurs car l'expédition se fait à l'étranger.
Performance
Processeur
Les performances brutes du processeur multithread sont 15 à 20 % plus rapides que celles d'un PC ou d'un ordinateur portable moyen doté du même Core i5-1135G7 CORE I5-1135G7. Même l'ancien Kaby Lake-G de 100 WCore i7-8809G Hades Canyon mini PC est à la traîne derrière notre processeur Core i7 de 11e génération. L'ordinateur haut de gammeCore i7-1165G7plus haut de gamme, qui n'est pas disponible sur le GTI 11, permet aux utilisateurs d'obtenir des performances multithread jusqu'à 25 % supérieures à celles de notre Core i5-1135G7
Lors de l'exécution de CineBench R15 xT en boucle, le score initial de 915 points tombait rapidement à ~840 points pour représenter une baisse de performance de 8 pour cent en raison de la durabilité limitée de Turbo Boost comme détaillé dans notre section Stress Test ci-dessous.
Cinebench R15 Multi Loop
Cinebench R23: Multi Core | Single Core
Cinebench R20: CPU (Multi Core) | CPU (Single Core)
Cinebench R15: CPU Multi 64Bit | CPU Single 64Bit
Blender: v2.79 BMW27 CPU
7-Zip 18.03: 7z b 4 | 7z b 4 -mmt1
Geekbench 5.5: Multi-Core | Single-Core
HWBOT x265 Benchmark v2.2: 4k Preset
LibreOffice : 20 Documents To PDF
R Benchmark 2.5: Overall mean
| CPU Performance rating | |
| Intel NUC11PAQi7 -1! | |
| Lenovo Yoga 6 13ALC6 -2! | |
| Intel NUC10i7FNH -3! | |
| Asus Vivobook 15 K513EQ -2! | |
| Beelink GTI 11 | |
| Lenovo Yoga 6 13 82ND0009US -2! | |
| Intel NUC11TNKi5 | |
| Intel Hades Canyon NUC8i7HVK -6! | |
| Moyenne Intel Core i5-1135G7 | |
| Infinix INBook X1 Pro -2! | |
| Asus VivoBook S13 S333JA-DS51 | |
| GMK NucBox 2 | |
| Beelink SER3 -2! | |
| Beelink GTR35 II-G-16512D00W64PRO-1T -2! | |
| Cinebench R23 / Multi Core | |
| Lenovo Yoga 6 13ALC6 | |
| Intel NUC11PAQi7 | |
| Lenovo Yoga 6 13 82ND0009US | |
| Asus Vivobook 15 K513EQ | |
| Beelink GTI 11 | |
| Intel NUC11TNKi5 | |
| Moyenne Intel Core i5-1135G7 (2786 - 6136, n=55) | |
| Infinix INBook X1 Pro | |
| Asus VivoBook S13 S333JA-DS51 | |
| Beelink SER3 | |
| GMK NucBox 2 | |
| Cinebench R23 / Single Core | |
| Asus Vivobook 15 K513EQ | |
| Intel NUC11TNKi5 | |
| Beelink GTI 11 | |
| Moyenne Intel Core i5-1135G7 (1062 - 1373, n=53) | |
| Lenovo Yoga 6 13ALC6 | |
| Infinix INBook X1 Pro | |
| Lenovo Yoga 6 13 82ND0009US | |
| Asus VivoBook S13 S333JA-DS51 | |
| GMK NucBox 2 | |
| Beelink SER3 | |
| Cinebench R20 / CPU (Multi Core) | |
| Lenovo Yoga 6 13ALC6 | |
| Intel NUC11PAQi7 | |
| Lenovo Yoga 6 13 82ND0009US | |
| Intel NUC10i7FNH | |
| Asus Vivobook 15 K513EQ | |
| Beelink GTI 11 | |
| Intel Hades Canyon NUC8i7HVK | |
| Intel NUC11TNKi5 | |
| Moyenne Intel Core i5-1135G7 (979 - 2382, n=62) | |
| Infinix INBook X1 Pro | |
| Beelink GTR35 II-G-16512D00W64PRO-1T | |
| Asus VivoBook S13 S333JA-DS51 | |
| Beelink SER3 | |
| GMK NucBox 2 | |
| Cinebench R20 / CPU (Single Core) | |
| Intel NUC11PAQi7 | |
| Asus Vivobook 15 K513EQ | |
| Beelink GTI 11 | |
| Moyenne Intel Core i5-1135G7 (375 - 527, n=62) | |
| Intel NUC11TNKi5 | |
| Lenovo Yoga 6 13ALC6 | |
| Intel NUC10i7FNH | |
| Infinix INBook X1 Pro | |
| Lenovo Yoga 6 13 82ND0009US | |
| Intel Hades Canyon NUC8i7HVK | |
| GMK NucBox 2 | |
| Asus VivoBook S13 S333JA-DS51 | |
| Beelink SER3 | |
| Beelink GTR35 II-G-16512D00W64PRO-1T | |
| Cinebench R15 / CPU Multi 64Bit | |
| Lenovo Yoga 6 13ALC6 | |
| Intel NUC10i7FNH | |
| Lenovo Yoga 6 13 82ND0009US | |
| Intel NUC11PAQi7 | |
| Beelink GTI 11 | |
| Asus Vivobook 15 K513EQ | |
| Intel Hades Canyon NUC8i7HVK | |
| Intel NUC11TNKi5 | |
| Moyenne Intel Core i5-1135G7 (431 - 941, n=65) | |
| Beelink SER3 | |
| Beelink GTR35 II-G-16512D00W64PRO-1T | |
| Infinix INBook X1 Pro | |
| Asus VivoBook S13 S333JA-DS51 | |
| GMK NucBox 2 | |
| Cinebench R15 / CPU Single 64Bit | |
| Intel NUC11PAQi7 | |
| Asus Vivobook 15 K513EQ | |
| Intel NUC11TNKi5 | |
| Beelink GTI 11 | |
| Moyenne Intel Core i5-1135G7 (141.4 - 205, n=61) | |
| Intel NUC10i7FNH | |
| Lenovo Yoga 6 13ALC6 | |
| Infinix INBook X1 Pro | |
| Intel Hades Canyon NUC8i7HVK | |
| Lenovo Yoga 6 13 82ND0009US | |
| GMK NucBox 2 | |
| Beelink GTR35 II-G-16512D00W64PRO-1T | |
| Beelink SER3 | |
| Asus VivoBook S13 S333JA-DS51 | |
| Blender / v2.79 BMW27 CPU | |
| GMK NucBox 2 | |
| Asus VivoBook S13 S333JA-DS51 | |
| Infinix INBook X1 Pro | |
| Beelink SER3 | |
| Beelink GTR35 II-G-16512D00W64PRO-1T | |
| Moyenne Intel Core i5-1135G7 (499 - 1044, n=60) | |
| Intel NUC11TNKi5 | |
| Beelink GTI 11 | |
| Asus Vivobook 15 K513EQ | |
| Intel Hades Canyon NUC8i7HVK | |
| Lenovo Yoga 6 13 82ND0009US | |
| Intel NUC10i7FNH | |
| Intel NUC11PAQi7 | |
| Lenovo Yoga 6 13ALC6 | |
| 7-Zip 18.03 / 7z b 4 | |
| Lenovo Yoga 6 13ALC6 | |
| Lenovo Yoga 6 13 82ND0009US | |
| Intel NUC10i7FNH | |
| Intel NUC11PAQi7 | |
| Asus Vivobook 15 K513EQ | |
| Beelink GTI 11 | |
| Intel NUC11TNKi5 | |
| Moyenne Intel Core i5-1135G7 (14745 - 24873, n=62) | |
| Infinix INBook X1 Pro | |
| Intel Hades Canyon NUC8i7HVK | |
| GMK NucBox 2 | |
| Asus VivoBook S13 S333JA-DS51 | |
| Beelink SER3 | |
| Beelink GTR35 II-G-16512D00W64PRO-1T | |
| 7-Zip 18.03 / 7z b 4 -mmt1 | |
| Intel NUC11PAQi7 | |
| Asus Vivobook 15 K513EQ | |
| Beelink GTI 11 | |
| Intel NUC11TNKi5 | |
| Intel NUC10i7FNH | |
| Moyenne Intel Core i5-1135G7 (3924 - 4921, n=62) | |
| Lenovo Yoga 6 13ALC6 | |
| Infinix INBook X1 Pro | |
| Lenovo Yoga 6 13 82ND0009US | |
| Intel Hades Canyon NUC8i7HVK | |
| GMK NucBox 2 | |
| Beelink SER3 | |
| Asus VivoBook S13 S333JA-DS51 | |
| Beelink GTR35 II-G-16512D00W64PRO-1T | |
| Geekbench 5.5 / Multi-Core | |
| Intel NUC10i7FNH | |
| Beelink GTI 11 | |
| Intel NUC11PAQi7 | |
| Moyenne Intel Core i5-1135G7 (3475 - 5472, n=58) | |
| Intel NUC11TNKi5 | |
| Asus VivoBook S13 S333JA-DS51 | |
| GMK NucBox 2 | |
| Beelink GTR35 II-G-16512D00W64PRO-1T | |
| Geekbench 5.5 / Single-Core | |
| Intel NUC11PAQi7 | |
| Beelink GTI 11 | |
| Intel NUC11TNKi5 | |
| Moyenne Intel Core i5-1135G7 (1147 - 1428, n=58) | |
| Intel NUC10i7FNH | |
| Asus VivoBook S13 S333JA-DS51 | |
| GMK NucBox 2 | |
| Beelink GTR35 II-G-16512D00W64PRO-1T | |
| HWBOT x265 Benchmark v2.2 / 4k Preset | |
| Lenovo Yoga 6 13ALC6 | |
| Intel NUC11PAQi7 | |
| Intel NUC10i7FNH | |
| Lenovo Yoga 6 13 82ND0009US | |
| Asus Vivobook 15 K513EQ | |
| Intel Hades Canyon NUC8i7HVK | |
| Beelink GTI 11 | |
| Intel NUC11TNKi5 | |
| Moyenne Intel Core i5-1135G7 (3.57 - 7.6, n=57) | |
| Infinix INBook X1 Pro | |
| Asus VivoBook S13 S333JA-DS51 | |
| GMK NucBox 2 | |
| Beelink SER3 | |
| Beelink GTR35 II-G-16512D00W64PRO-1T | |
| LibreOffice / 20 Documents To PDF | |
| Beelink SER3 | |
| Beelink GTR35 II-G-16512D00W64PRO-1T | |
| Lenovo Yoga 6 13 82ND0009US | |
| GMK NucBox 2 | |
| Lenovo Yoga 6 13ALC6 | |
| Asus VivoBook S13 S333JA-DS51 | |
| Infinix INBook X1 Pro | |
| Beelink GTI 11 | |
| Moyenne Intel Core i5-1135G7 (44.2 - 62.9, n=60) | |
| Intel NUC11TNKi5 | |
| Asus Vivobook 15 K513EQ | |
| Intel NUC11PAQi7 | |
| R Benchmark 2.5 / Overall mean | |
| GMK NucBox 2 | |
| Asus VivoBook S13 S333JA-DS51 | |
| Beelink GTR35 II-G-16512D00W64PRO-1T | |
| Beelink SER3 | |
| Infinix INBook X1 Pro | |
| Intel NUC10i7FNH | |
| Moyenne Intel Core i5-1135G7 (0.619 - 0.727, n=59) | |
| Lenovo Yoga 6 13 82ND0009US | |
| Beelink GTI 11 | |
| Intel NUC11TNKi5 | |
| Lenovo Yoga 6 13ALC6 | |
| Asus Vivobook 15 K513EQ | |
| Intel NUC11PAQi7 | |
Cinebench R23: Multi Core | Single Core
Cinebench R20: CPU (Multi Core) | CPU (Single Core)
Cinebench R15: CPU Multi 64Bit | CPU Single 64Bit
Blender: v2.79 BMW27 CPU
7-Zip 18.03: 7z b 4 | 7z b 4 -mmt1
Geekbench 5.5: Multi-Core | Single-Core
HWBOT x265 Benchmark v2.2: 4k Preset
LibreOffice : 20 Documents To PDF
R Benchmark 2.5: Overall mean
* ... Moindre est la valeur, meilleures sont les performances
AIDA64: FP32 Ray-Trace | FPU Julia | CPU SHA3 | CPU Queen | FPU SinJulia | FPU Mandel | CPU AES | CPU ZLib | FP64 Ray-Trace | CPU PhotoWorxx
| Performance rating | |
| Beelink GTI 11 | |
| Intel NUC11TNKi5 | |
| Moyenne Intel Core i5-1135G7 | |
| GMK NucBox 2 | |
| Beelink SER3 | |
| AIDA64 / FP32 Ray-Trace | |
| Beelink GTI 11 | |
| Intel NUC11TNKi5 | |
| Moyenne Intel Core i5-1135G7 (4313 - 7952, n=45) | |
| GMK NucBox 2 | |
| Beelink SER3 | |
| AIDA64 / FPU Julia | |
| Beelink GTI 11 | |
| Intel NUC11TNKi5 | |
| Moyenne Intel Core i5-1135G7 (19402 - 32283, n=45) | |
| GMK NucBox 2 | |
| Beelink SER3 | |
| AIDA64 / CPU SHA3 | |
| Beelink GTI 11 | |
| Intel NUC11TNKi5 | |
| Moyenne Intel Core i5-1135G7 (1316 - 2172, n=45) | |
| GMK NucBox 2 | |
| Beelink SER3 | |
| AIDA64 / CPU Queen | |
| Beelink GTI 11 | |
| Intel NUC11TNKi5 | |
| Moyenne Intel Core i5-1135G7 (39000 - 46951, n=45) | |
| Beelink SER3 | |
| GMK NucBox 2 | |
| AIDA64 / FPU SinJulia | |
| Beelink SER3 | |
| Intel NUC11TNKi5 | |
| Beelink GTI 11 | |
| GMK NucBox 2 | |
| Moyenne Intel Core i5-1135G7 (3497 - 4445, n=45) | |
| AIDA64 / FPU Mandel | |
| Beelink GTI 11 | |
| Intel NUC11TNKi5 | |
| Moyenne Intel Core i5-1135G7 (12569 - 19635, n=45) | |
| GMK NucBox 2 | |
| Beelink SER3 | |
| AIDA64 / CPU AES | |
| Beelink GTI 11 | |
| Intel NUC11TNKi5 | |
| Moyenne Intel Core i5-1135G7 (28988 - 67977, n=45) | |
| Beelink SER3 | |
| GMK NucBox 2 | |
| AIDA64 / CPU ZLib | |
| Intel NUC11TNKi5 | |
| Beelink GTI 11 | |
| Beelink SER3 | |
| Moyenne Intel Core i5-1135G7 (265 - 373, n=51) | |
| GMK NucBox 2 | |
| AIDA64 / FP64 Ray-Trace | |
| Beelink GTI 11 | |
| Intel NUC11TNKi5 | |
| Moyenne Intel Core i5-1135G7 (2226 - 4291, n=45) | |
| GMK NucBox 2 | |
| Beelink SER3 | |
| AIDA64 / CPU PhotoWorxx | |
| Beelink GTI 11 | |
| Moyenne Intel Core i5-1135G7 (9004 - 45366, n=45) | |
| Intel NUC11TNKi5 | |
| Beelink SER3 | |
| GMK NucBox 2 | |
Performance du système
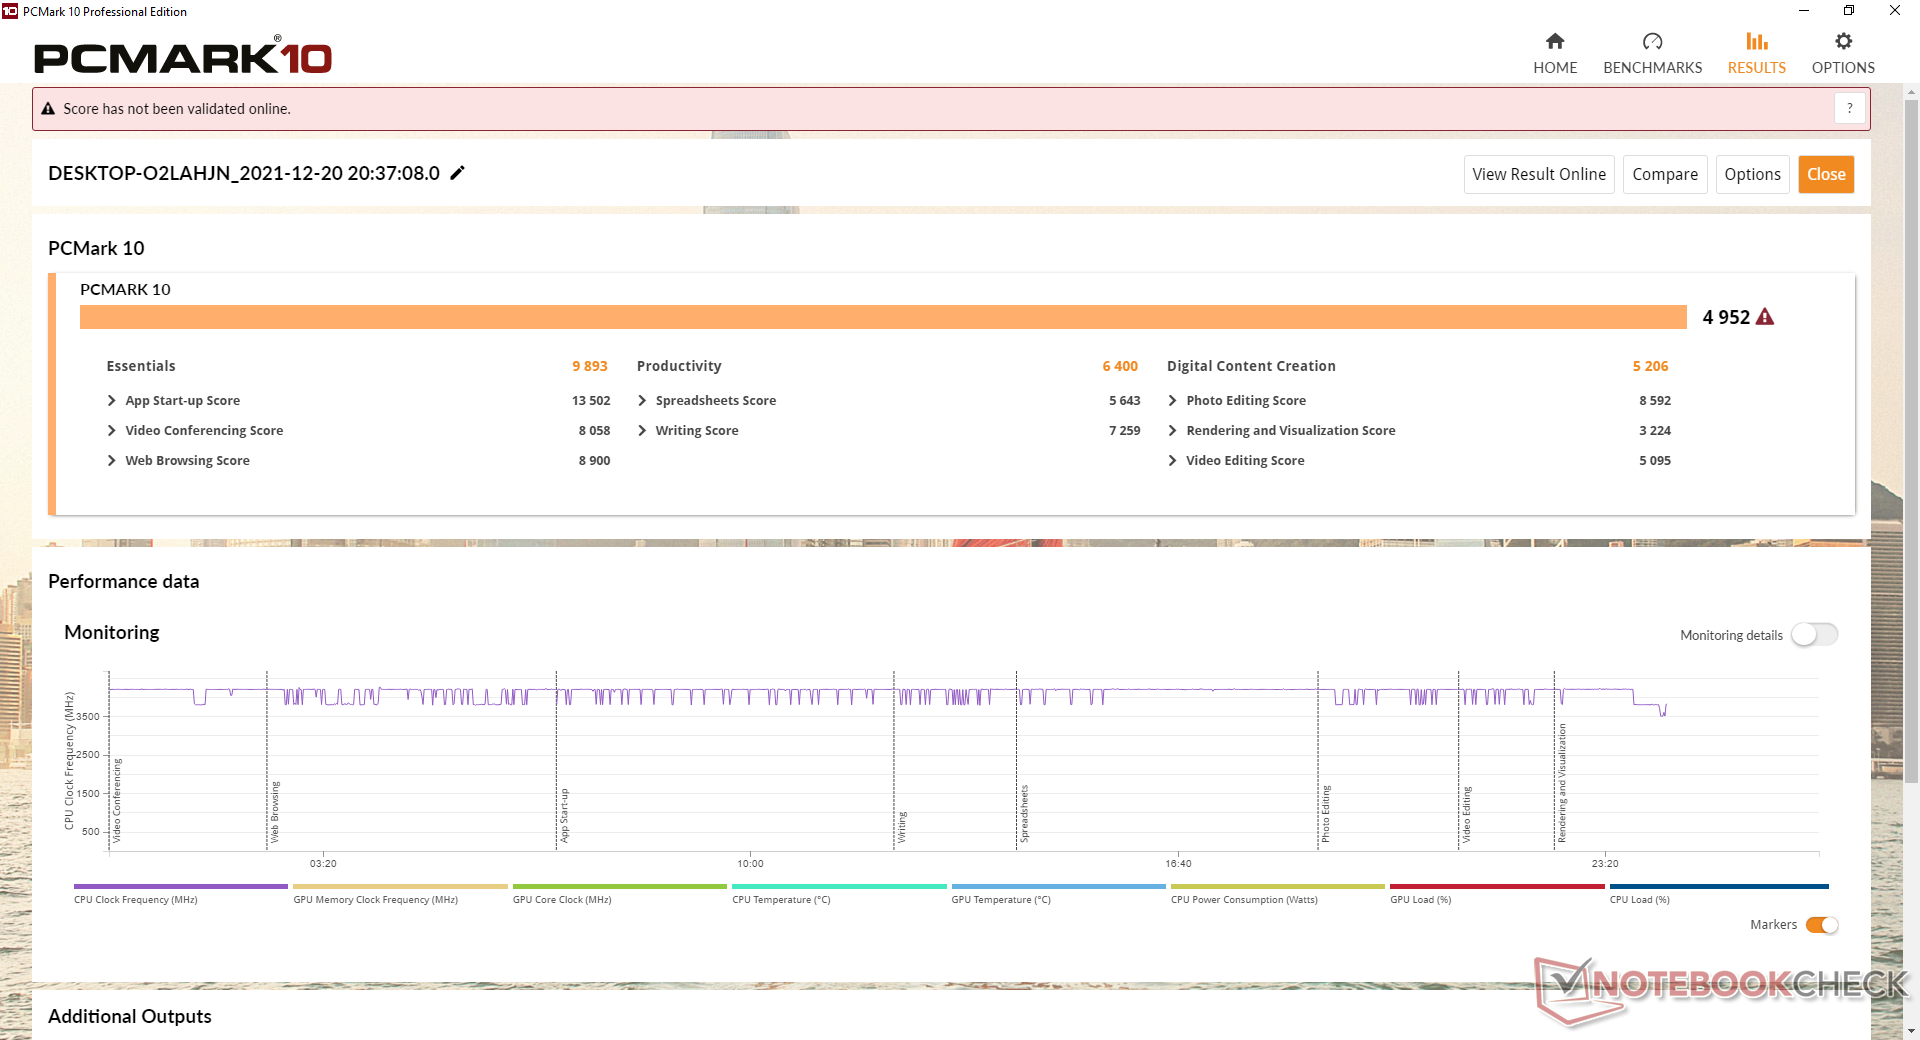
Les scores PCMark 10 sont excellents et systématiquement supérieurs à tous les systèmes Beelink qui ont précédé notre GTI 11. Les avantages de l'utilisation d'un processeur Intel de 11e génération plus léger et plus économe en énergie se traduisent par une expérience utilisateur plus fluide.
| PCMark 10 / Score | |
| Intel Hades Canyon NUC8i7HVK | |
| Beelink GTI 11 | |
| Moyenne Intel Core i5-1135G7, Intel Iris Xe Graphics G7 80EUs (4026 - 4952, n=53) | |
| Intel NUC11TNKi5 | |
| Intel NUC10i7FNH | |
| GMK NucBox 2 | |
| Beelink SER3 | |
| PCMark 10 / Essentials | |
| Beelink GTI 11 | |
| Moyenne Intel Core i5-1135G7, Intel Iris Xe Graphics G7 80EUs (8149 - 9917, n=53) | |
| Intel Hades Canyon NUC8i7HVK | |
| Intel NUC10i7FNH | |
| Intel NUC11TNKi5 | |
| GMK NucBox 2 | |
| Beelink SER3 | |
| PCMark 10 / Productivity | |
| Intel Hades Canyon NUC8i7HVK | |
| Intel NUC10i7FNH | |
| Beelink GTI 11 | |
| GMK NucBox 2 | |
| Moyenne Intel Core i5-1135G7, Intel Iris Xe Graphics G7 80EUs (5040 - 6619, n=53) | |
| Intel NUC11TNKi5 | |
| Beelink SER3 | |
| PCMark 10 / Digital Content Creation | |
| Intel Hades Canyon NUC8i7HVK | |
| Beelink GTI 11 | |
| Moyenne Intel Core i5-1135G7, Intel Iris Xe Graphics G7 80EUs (3548 - 5255, n=53) | |
| Intel NUC11TNKi5 | |
| Intel NUC10i7FNH | |
| GMK NucBox 2 | |
| Beelink SER3 | |
| PCMark 10 Score | 4952 points | |
Aide | ||
| AIDA64 / Memory Copy | |
| GMK NucBox 2 | |
| Beelink GTI 11 | |
| Moyenne Intel Core i5-1135G7 (17443 - 63889, n=45) | |
| Intel NUC11TNKi5 | |
| Beelink SER3 | |
| AIDA64 / Memory Read | |
| Beelink GTI 11 | |
| Moyenne Intel Core i5-1135G7 (19716 - 63705, n=45) | |
| GMK NucBox 2 | |
| Intel NUC11TNKi5 | |
| Beelink SER3 | |
| AIDA64 / Memory Write | |
| GMK NucBox 2 | |
| Beelink GTI 11 | |
| Moyenne Intel Core i5-1135G7 (18722 - 66778, n=45) | |
| Intel NUC11TNKi5 | |
| Beelink SER3 | |
| AIDA64 / Memory Latency | |
| Beelink SER3 | |
| Intel NUC11TNKi5 | |
| Moyenne Intel Core i5-1135G7 (68.3 - 107, n=51) | |
| Beelink GTI 11 | |
| GMK NucBox 2 | |
* ... Moindre est la valeur, meilleures sont les performances
Latence DPC
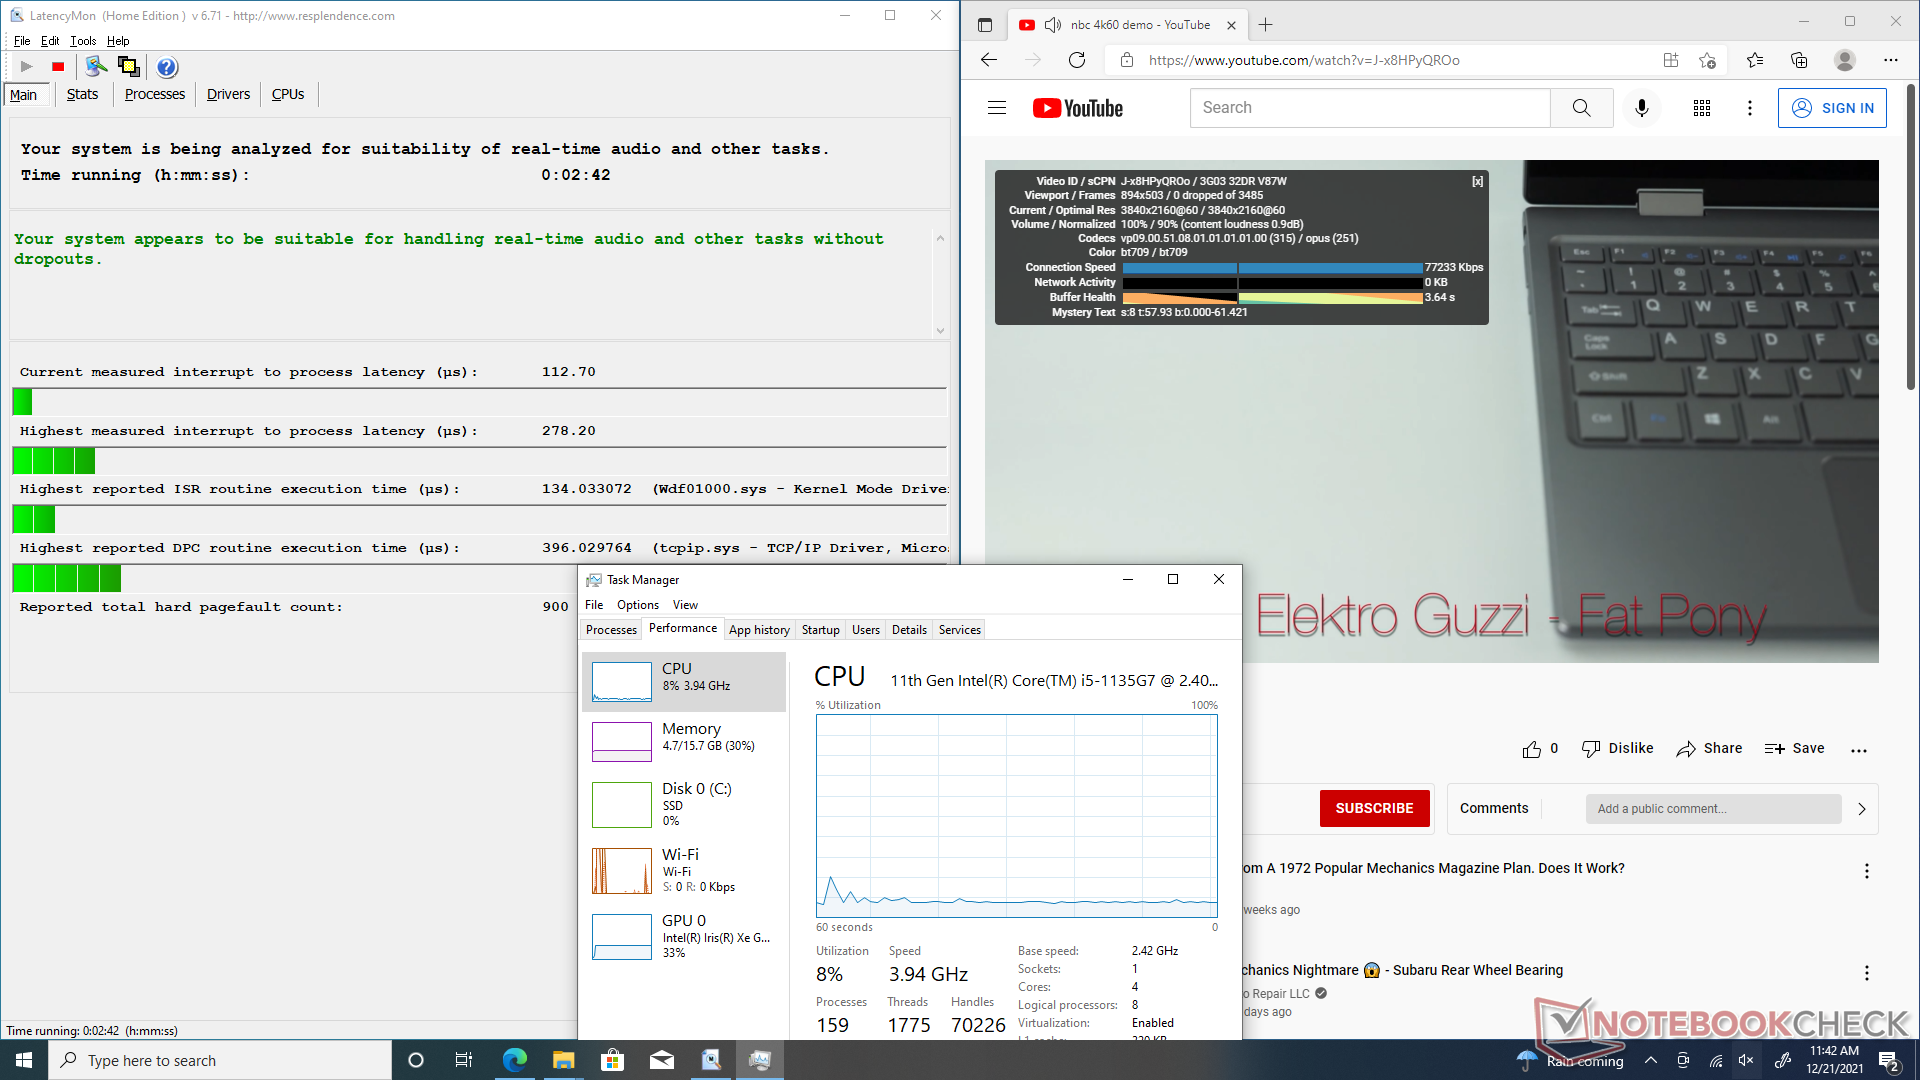
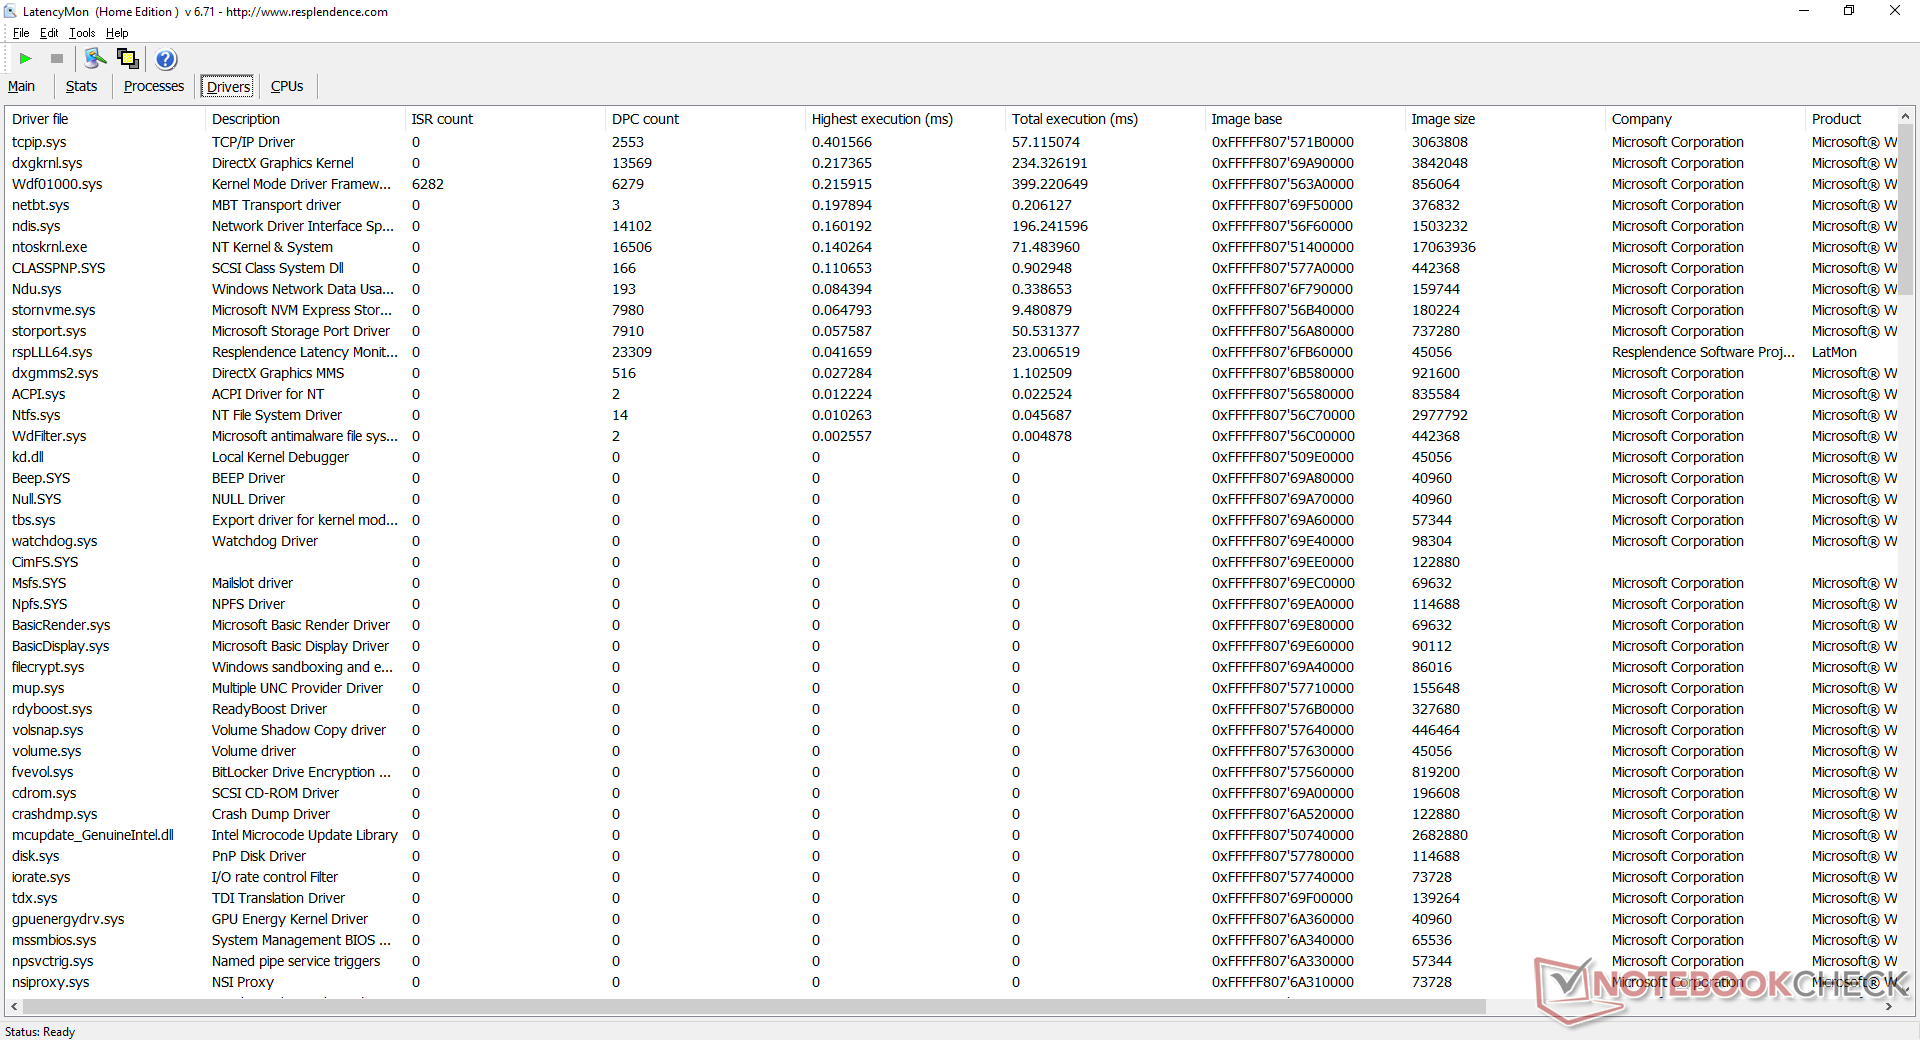
LatencyMon ne révèle aucun problème de CPD lors de l'ouverture de plusieurs onglets de navigateur sur notre page d'accueil. La lecture de vidéos 4K à 60 FPS est également fluide et sans aucune perte d'images.
| DPC Latencies / LatencyMon - interrupt to process latency (max), Web, Youtube, Prime95 | |
| GMK NucBox 2 | |
| Beelink SER3 | |
| Intel NUC11TNKi5 | |
| Beelink GTI 11 | |
* ... Moindre est la valeur, meilleures sont les performances
Périphériques de stockage
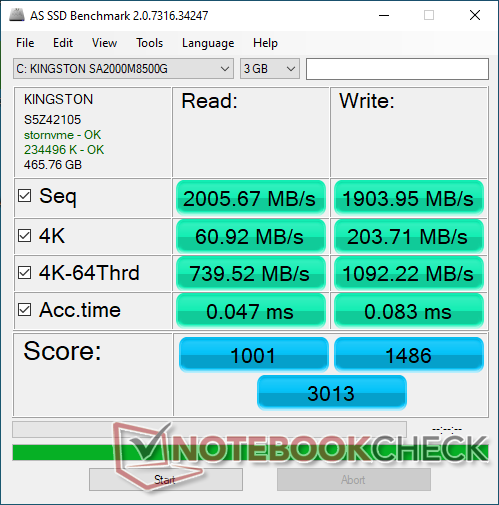
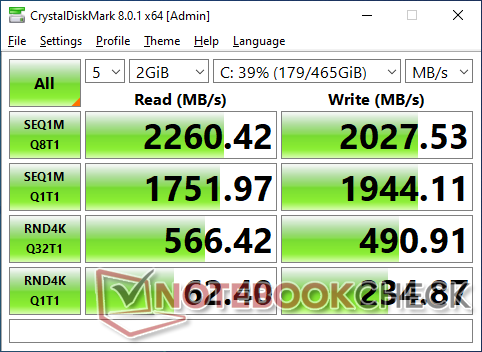
Le système peut prendre en charge jusqu'à trois disques internes (2x M.2 2280 + 1x 2,5 pouces SATA III). N'oubliez pas que le deuxième disque M.2 doit être un disque SATA III et non un disque NVMe. Le site 500 Go Kingston A2000 dans notre unité est un disque M.2 PCIe3 de milieu de gamme avec des taux de lecture et d'écriture séquentiels d'environ 2000 à 2200 Mo/s chacun. La durabilité des performances est également excellente, sans problème thermique lors de l'exécution de DiskSpd en boucle.
L'unité est livrée avec un lecteur PCIe3 au lieu de PCIe4, probablement pour réduire les coûts. Les utilisateurs peuvent installer leurs propres lecteurs PCIe4 s'ils le souhaitent.

| Drive Performance rating - Percent | |
| Beelink GTI 11 | |
| Intel Hades Canyon NUC8i7HVK -8! | |
| Beelink SER3 | |
| GMK NucBox 2 | |
| Intel NUC10i7FNH | |
| Intel NUC11TNKi5 | |
* ... Moindre est la valeur, meilleures sont les performances
Disk Throttling: DiskSpd Read Loop, Queue Depth 8
Performances du GPU
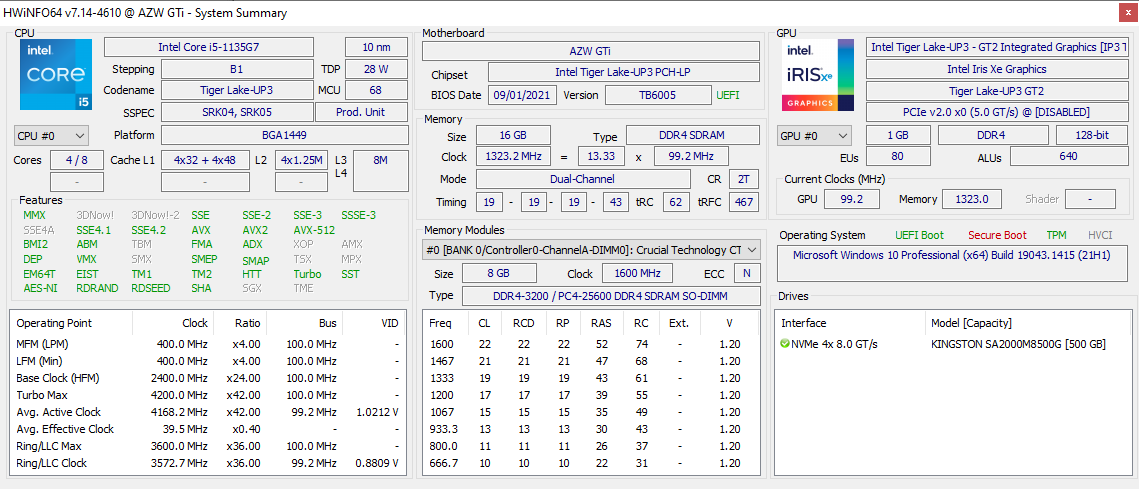
Les performances graphiques sont très bonnes, environ 13 % plus rapides que celles d'un ordinateur portable ou d'un PC moyen équipé de la même technologie intégrée Iris Xe 80 EU intégrés. Le GTI 11 est livré avec de la RAM double canal contrairement à notre Intel NUC11TNKi5 qui est équipé du même processeur Core i5-1135G7 mais d'une RAM à canal unique. Les performances graphiques sont environ 25 % plus rapides sur notre Beelink, principalement en raison de leurs différentes configurations de RAM
Si vous passez à un PC ou à un ordinateur portable équipé du Core i7-1165G7 haut de gamme et de sa mémoire vive intégrée, les performances graphiques sont d'environ 25 % supérieures sur notre Beelink Iris Xe 96 EU intégrés intégrés, les performances augmenteront de 25 à 35 % selon le modèle.
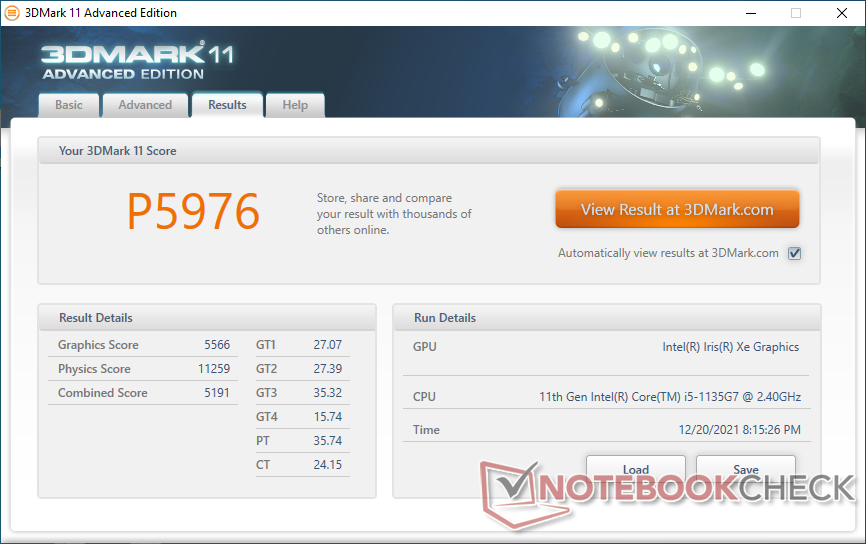

| 3DMark 11 Performance | 5976 points | |
| 3DMark Cloud Gate Standard Score | 18036 points | |
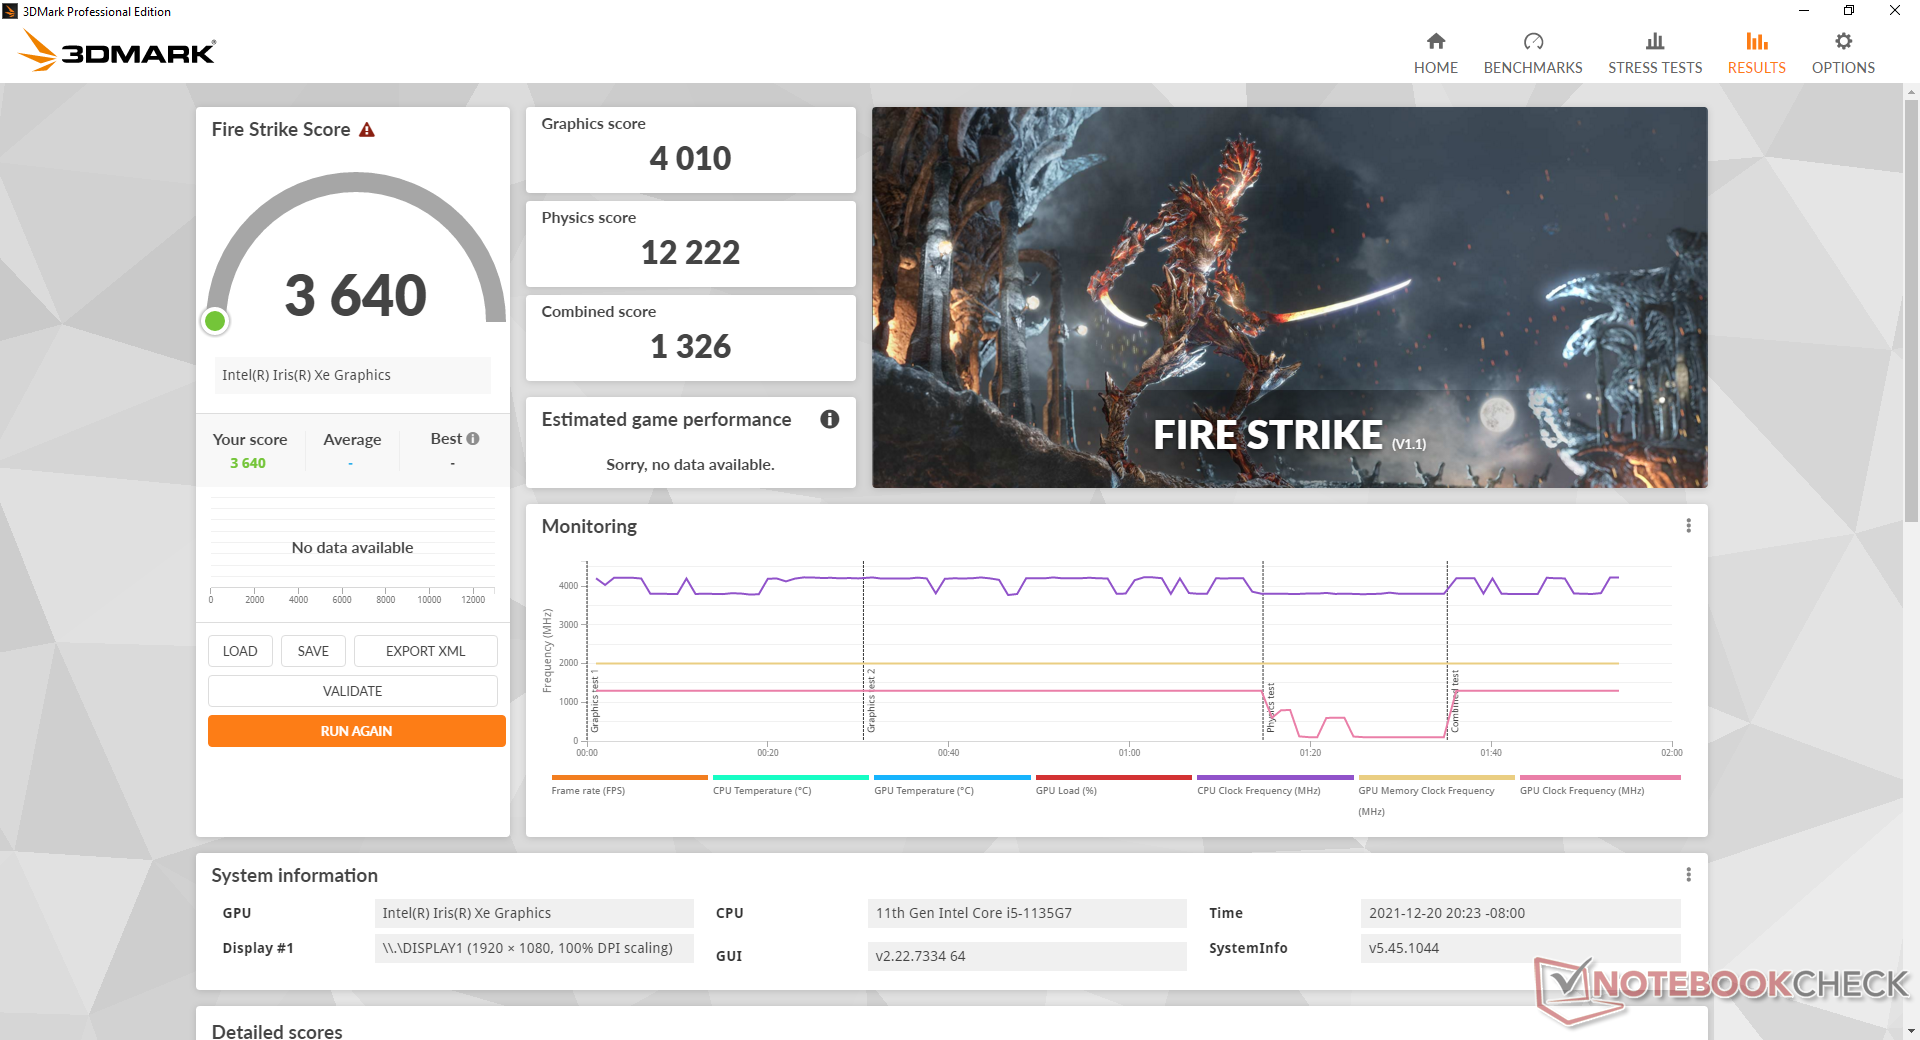
| 3DMark Fire Strike Score | 3640 points | |
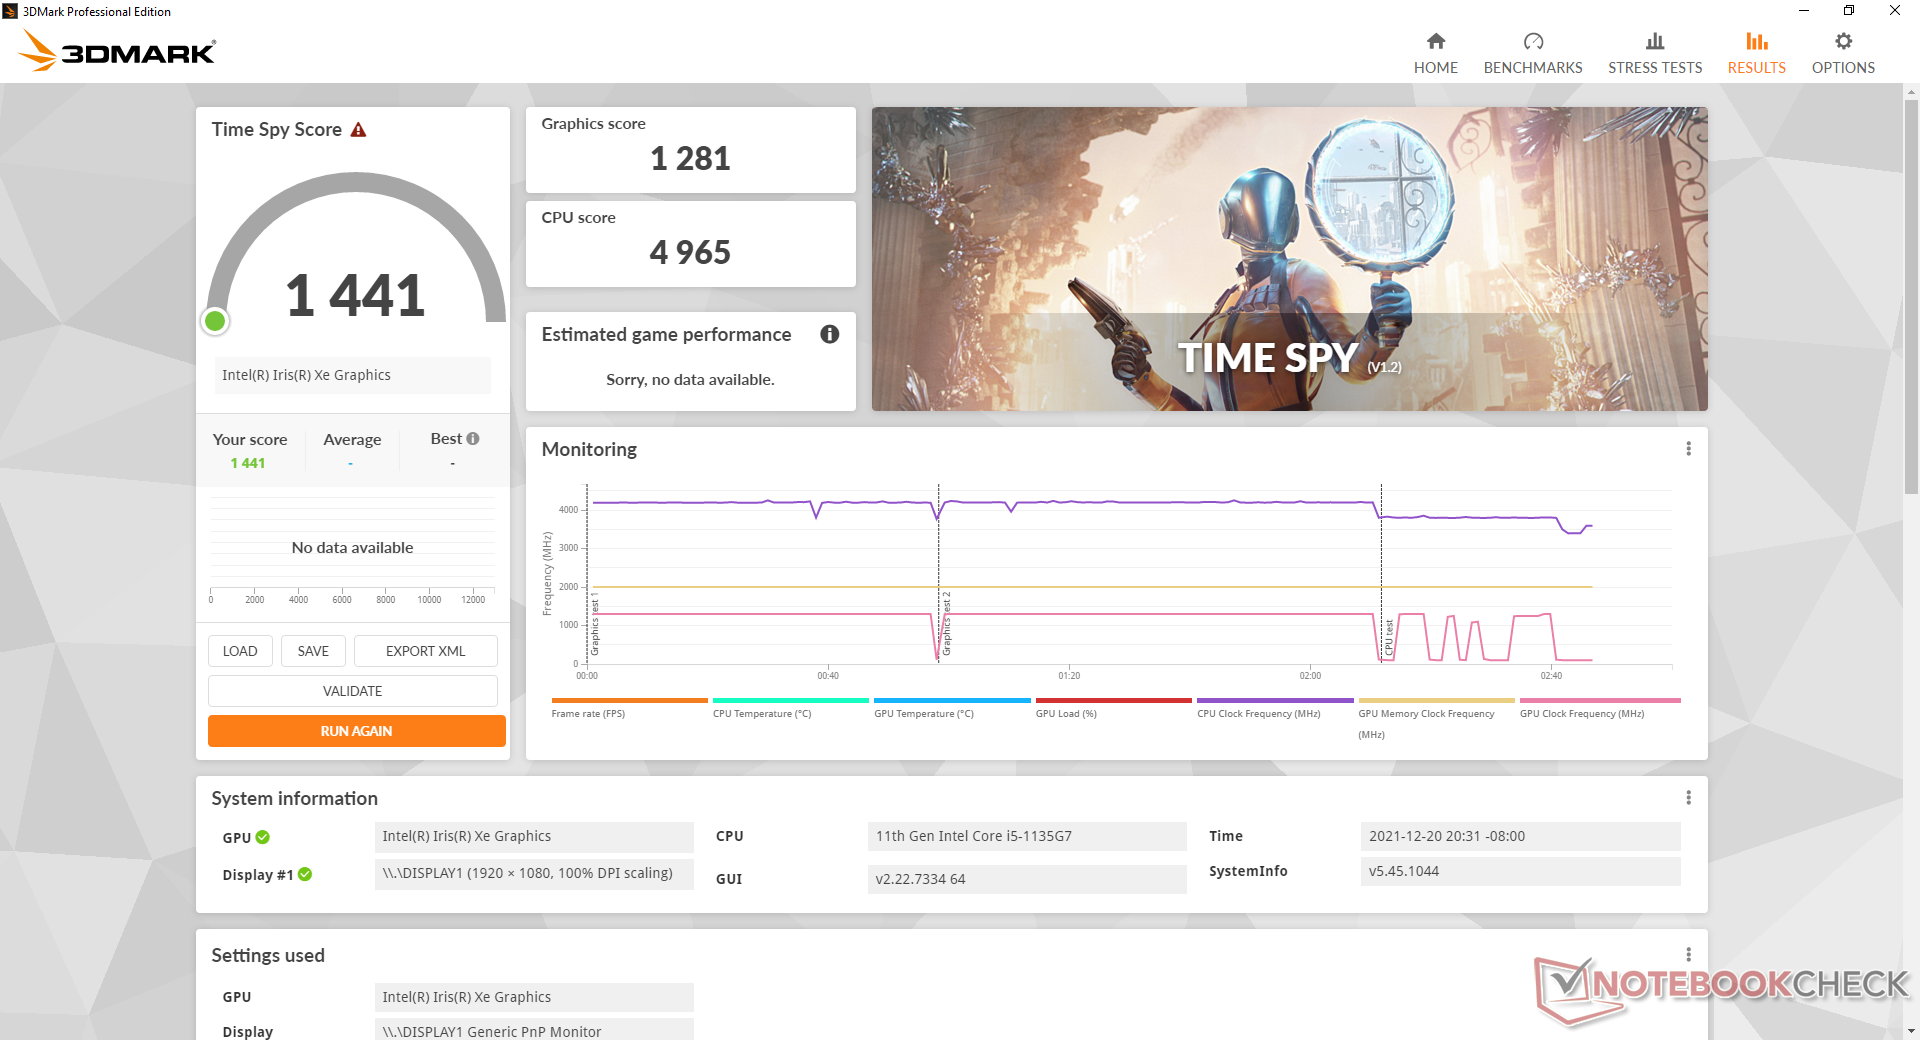
| 3DMark Time Spy Score | 1441 points | |
Aide | ||
Witcher 3 FPS Chart
| Bas | Moyen | Élevé | Ultra | |
|---|---|---|---|---|
| GTA V (2015) | 95.1 | 79.5 | 21.1 | 8.17 |
| The Witcher 3 (2015) | 77.1 | 46.6 | 23.1 | 11.5 |
| Dota 2 Reborn (2015) | 123 | 81 | 49.7 | 47.2 |
| Final Fantasy XV Benchmark (2018) | 36.7 | 18.7 | 13.5 | |
| X-Plane 11.11 (2018) | 24 | 21.4 | 21.9 | |
| Far Cry 5 (2018) | 47 | 23 | 22 | 21 |
| Strange Brigade (2018) | 76.5 | 30.8 | 25.2 | 20.2 |
Émissions
Bruit du système
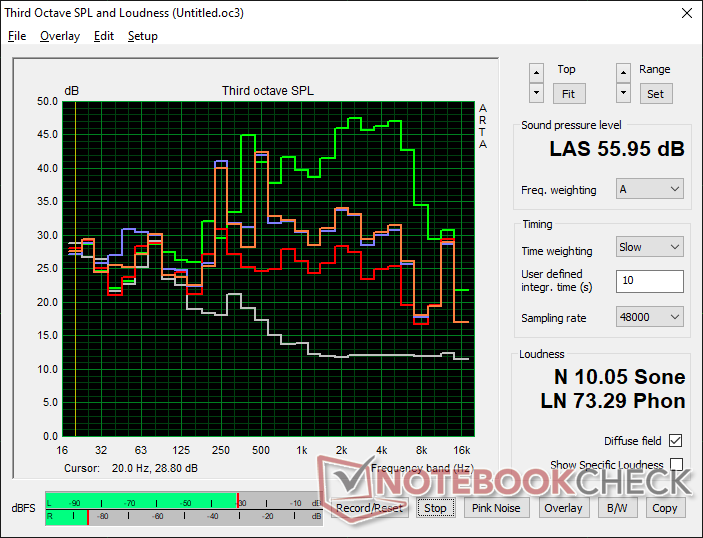
Le bruit du ventilateur est peut-être le pire aspect du GTI 11. Les deux ventilateurs internes émettent des pulsations fréquentes et perceptibles entre 28,4 dB(A) et 37,7 dB(A), même lorsque le système tourne au ralenti sur le bureau ou qu'on navigue sur le Web. Le comportement des ventilateurs ne change pas non plus lorsque l'on met le système en mode économie d'énergie.
L'exécution de charges plus élevées comme les jeux induit un bruit de ventilateur allant de 44 dB(A) à 56 dB(A), ce qui est beaucoup plus fort que ce que nous avons enregistré sur la plupart des autres mini PC, y compris la série Intel NUC. Notre appareil souffre également d'un léger bruit électronique ou d'un ronflement de la bobine, ce qui fait qu'il n'est jamais vraiment silencieux.
Degré de la nuisance sonore
| Au repos |
| 28.4 / 32 / 37.7 dB(A) |
| Fortement sollicité |
| 44.2 / 56 dB(A) |
 | ||
30 dB silencieux 40 dB(A) audible 50 dB(A) bruyant |
||
min: | ||
| Beelink GTI 11 Iris Xe G7 80EUs, i5-1135G7, Kingston SA2000M8500G | Beelink SER3 Vega 10, R7 3750H, GSemi AZW GSDFN512TS3F1OGCX | Intel NUC11TNKi5 Iris Xe G7 80EUs, i5-1135G7, Transcend M.2 SSD 430S TS512GMTS430S | GMK NucBox 2 Iris Plus Graphics 655, i5-8259U, Netac S930E8/256GPN | Intel Hades Canyon NUC8i7HVK Vega M GH, i7-8809G, Intel Optane 120 GB SSDPEK1W120GA | |
|---|---|---|---|---|---|
| Noise | 19% | 3% | 20% | 8% | |
| arrêt / environnement * (dB) | 25.7 | 23.4 9% | 24.8 4% | 25.6 -0% | 28.7 -12% |
| Idle Minimum * (dB) | 28.4 | 23.4 18% | 35.6 -25% | 25.7 10% | 29 -2% |
| Idle Average * (dB) | 32 | 23.4 27% | 35.6 -11% | 25.7 20% | 29 9% |
| Idle Maximum * (dB) | 37.7 | 29.4 22% | 35.6 6% | 25.7 32% | 29 23% |
| Load Average * (dB) | 44.2 | 35.2 20% | 36.2 18% | 35.3 20% | 36 19% |
| Witcher 3 ultra * (dB) | 44.5 | 37.2 16% | 38 15% | 42 6% | |
| Load Maximum * (dB) | 56 | 43.3 23% | 47.6 15% | 35.1 37% | 49.4 12% |
* ... Moindre est la valeur, meilleures sont les performances
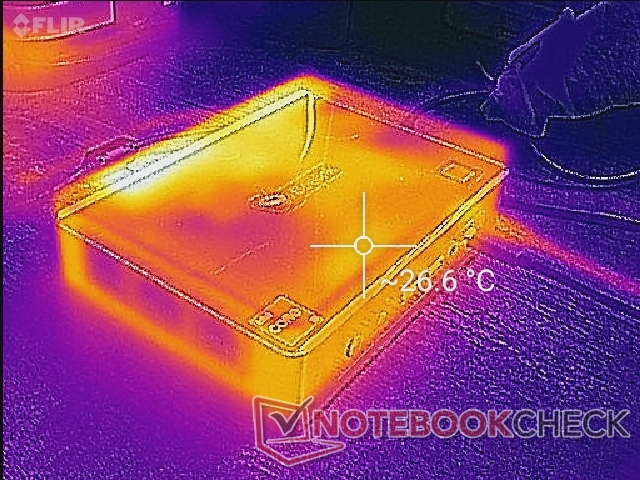
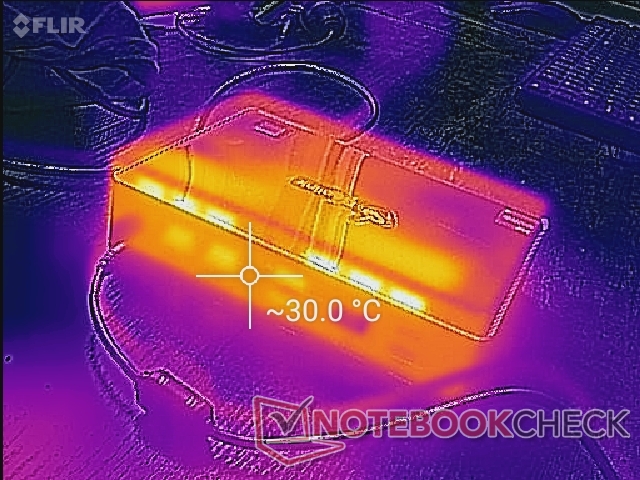
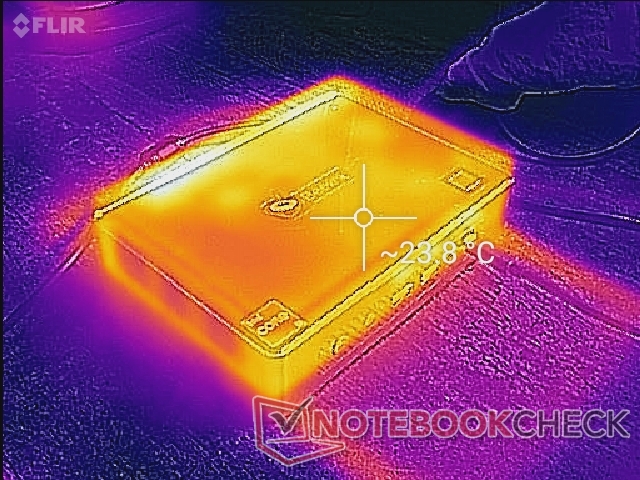
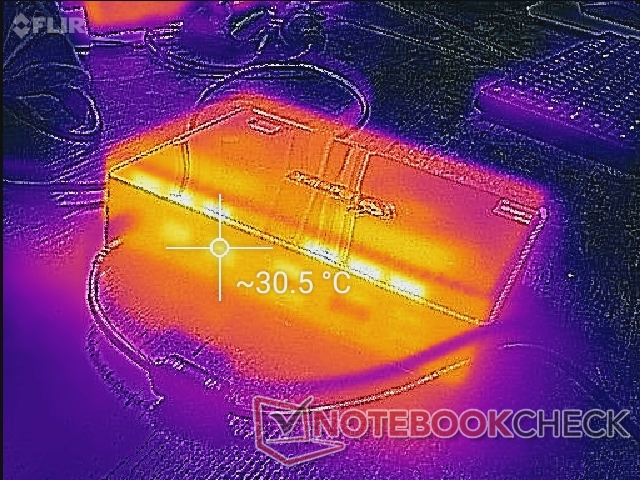
Température
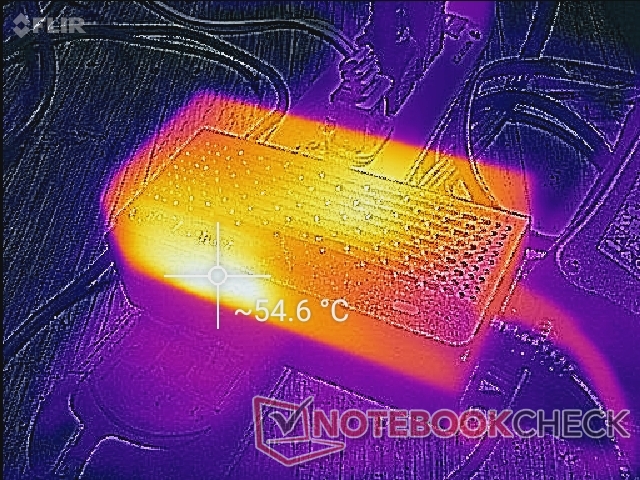
Les températures de surface ne sont pas un problème sur le GTI 11. En fait, les différences entre le ralenti et les charges de jeu sont assez mineures comme le montrent nos cartes de température ci-dessous. L'air frais entre par les deux côtés les plus éloignés du châssis et l'air chaud sort par l'arrière. Des objets peuvent être placés sur le dessus de l'unité sans obstruer le flux d'air, mais une orientation verticale peut avoir un impact sur le bruit du ventilateur ou la température.
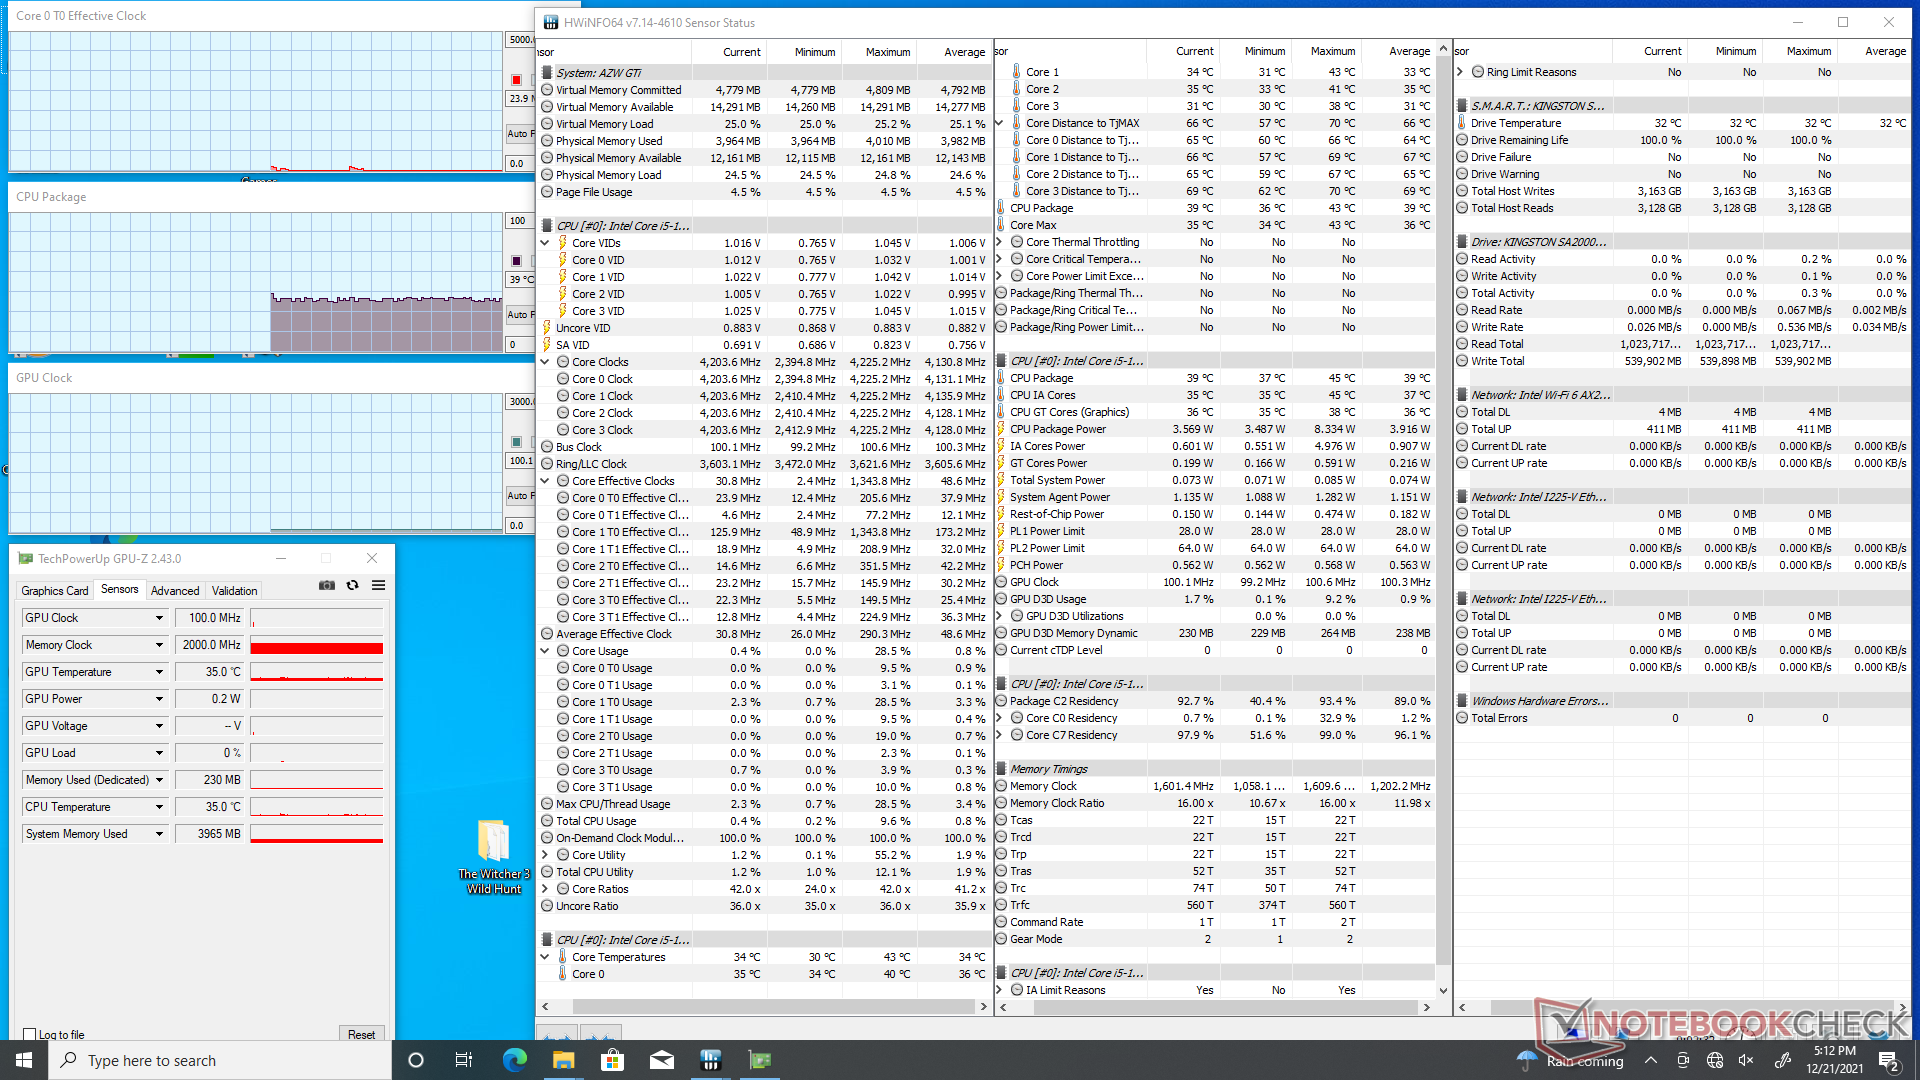
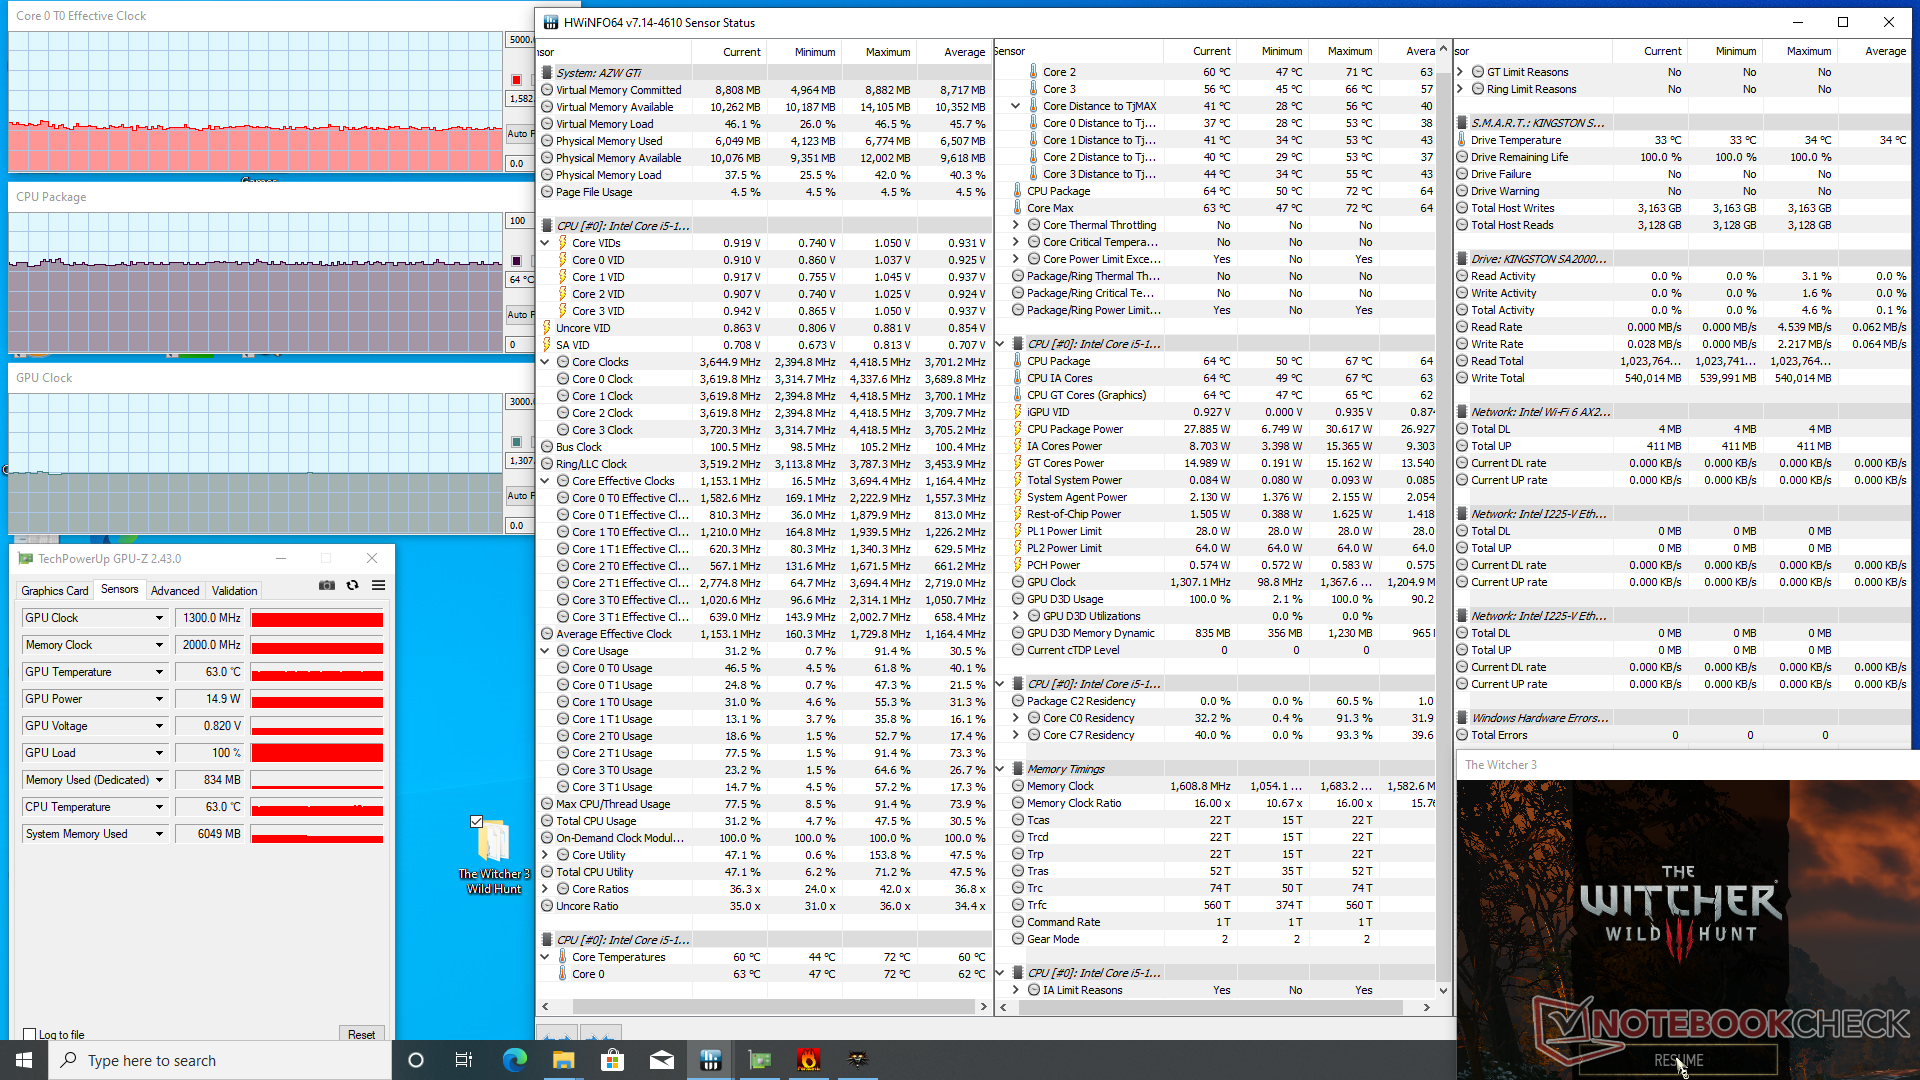
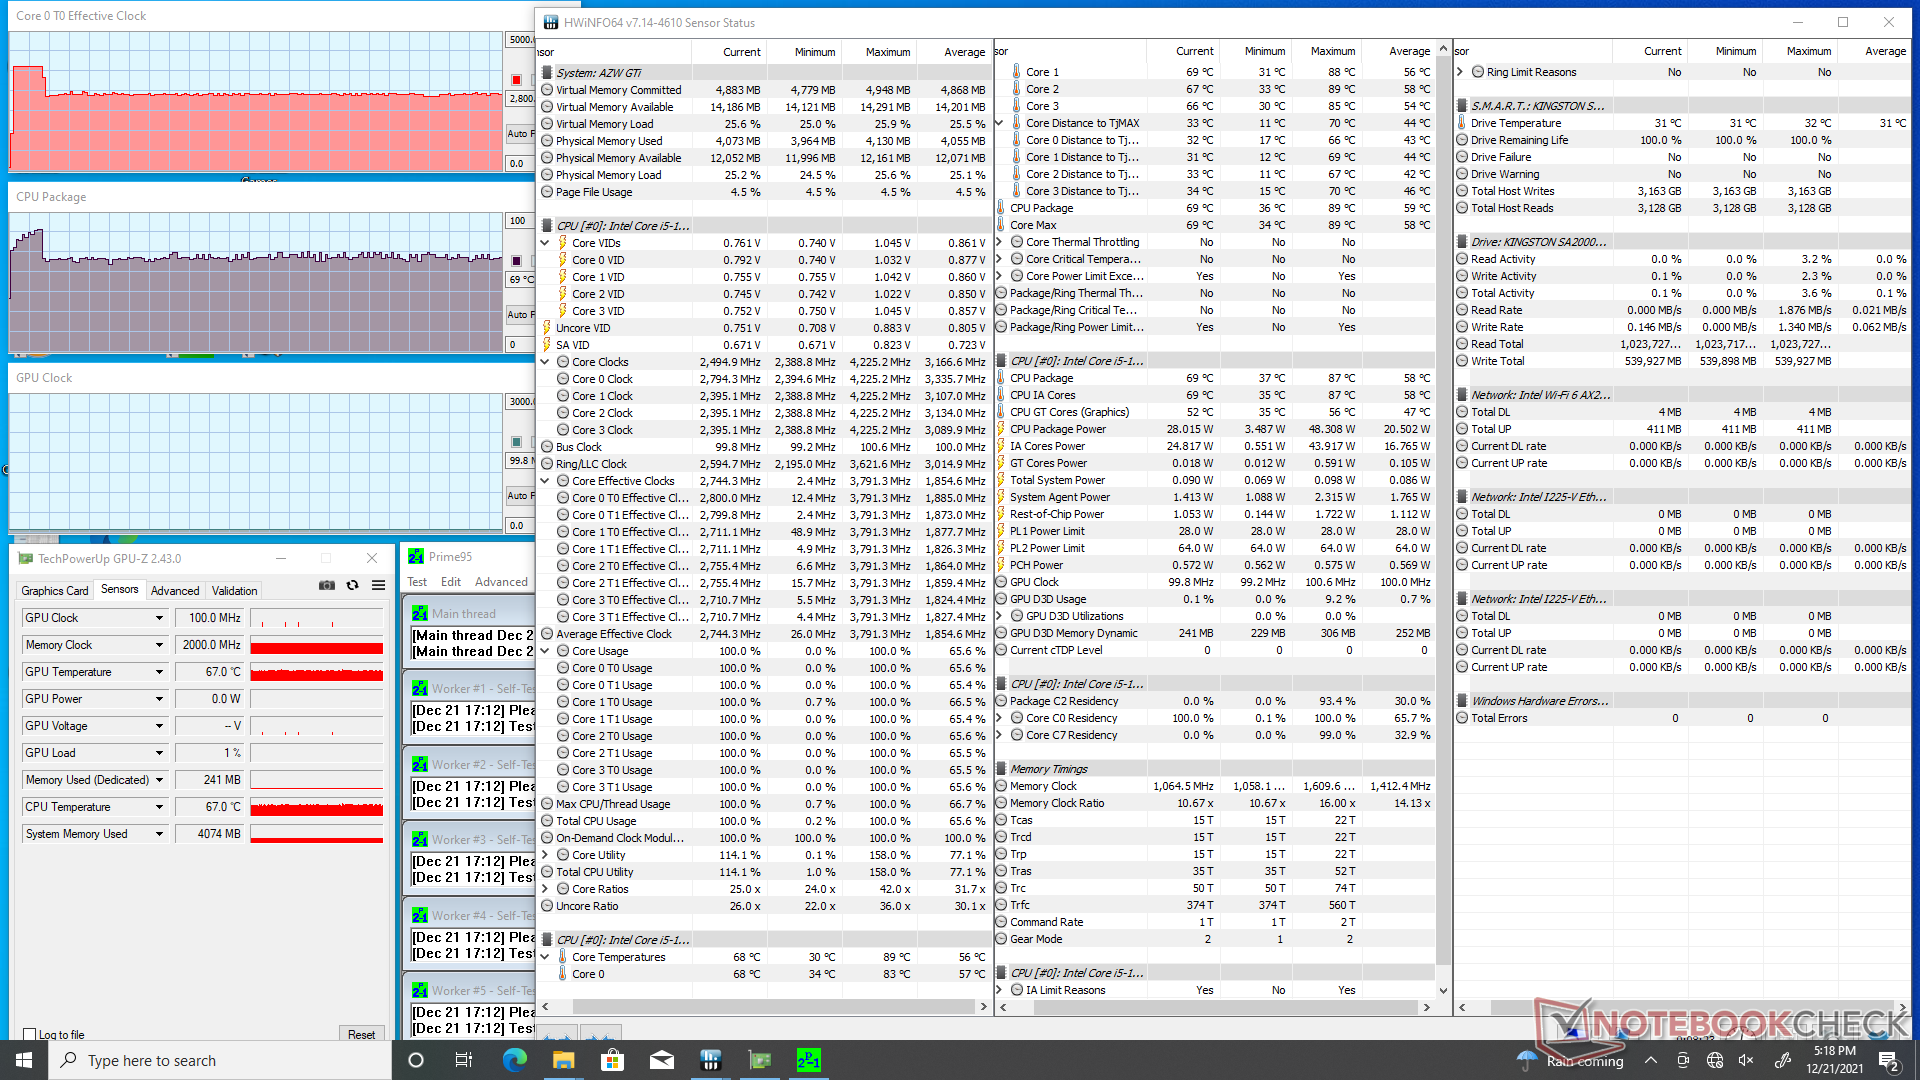
Test de stress
Lors de l'exécution de Prime95 pour stresser le CPU, les fréquences d'horloge augmentent à 3,8 GHz pendant les 20 premières secondes jusqu'à atteindre une température de 89 C. Les fréquences d'horloge baissent ensuite à 2,8 GHz afin de maintenir une température plus fraîche de 70 C. La puissance de l'ensemble du CPU baisse également de 48 W maximum à 28 W plus stable.
La température du cœur et la fréquence d'horloge du GPU se stabilisent à 64 C et 1300 MHz, respectivement, lorsqu'ils fonctionnent Witcher 3 pour représenter des charges élevées. Les résultats sont très similaires à ceux que nous avons enregistrés sur le NUC11TNKi5 concurrent lorsque les deux systèmes sont soumis à des conditions similaires.
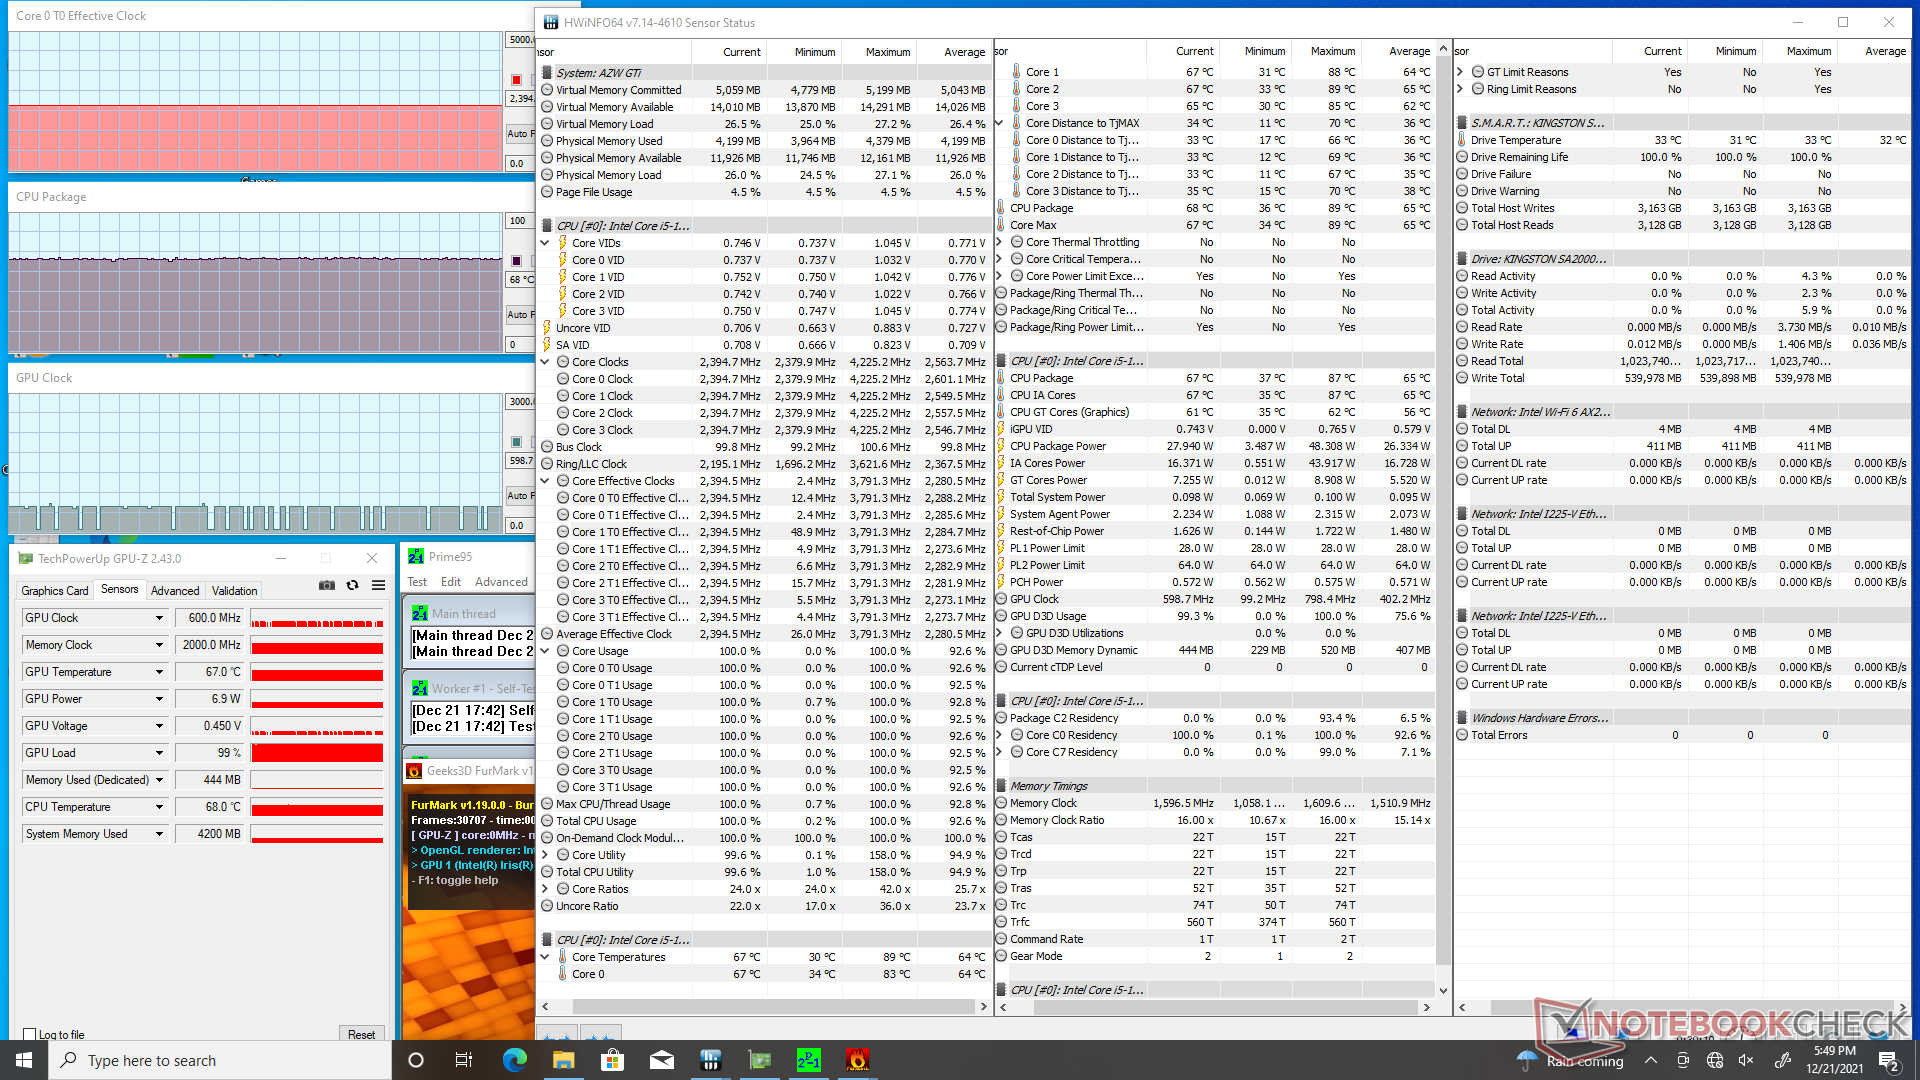
| Fréquence CPU(GHz) | Fréquence GPU(MHz) | Température CPUmoyenne(°C) | |
| Système au repos | - | - | 39 |
| Prime95 Stress | 2.8 | -- | 70 |
| Prime95+ FurMark Stress | 2.4 | 100 - 600 | 68 |
| Witcher 3 Stress | 1.6 | 1300 | 64 |
Gestion de l'énergie
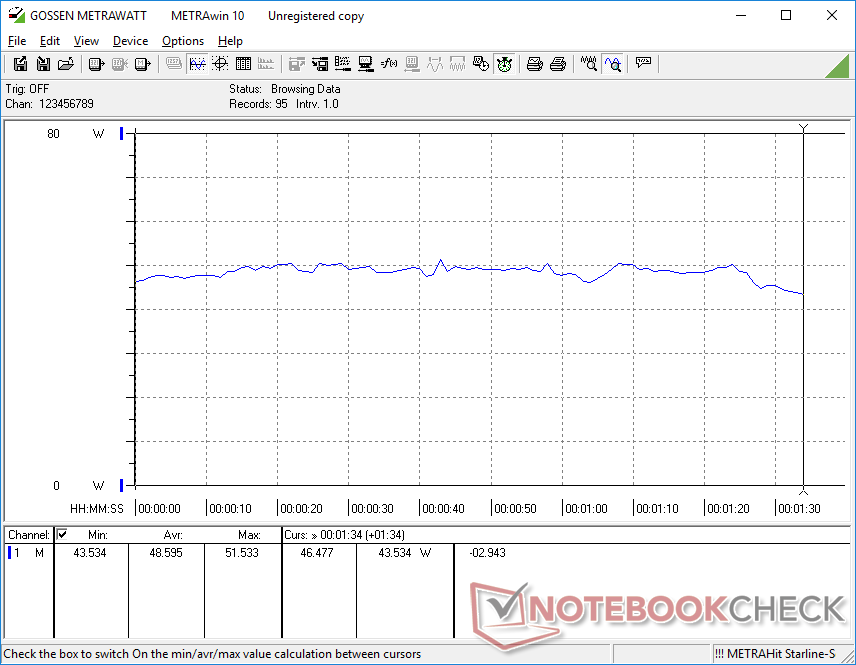
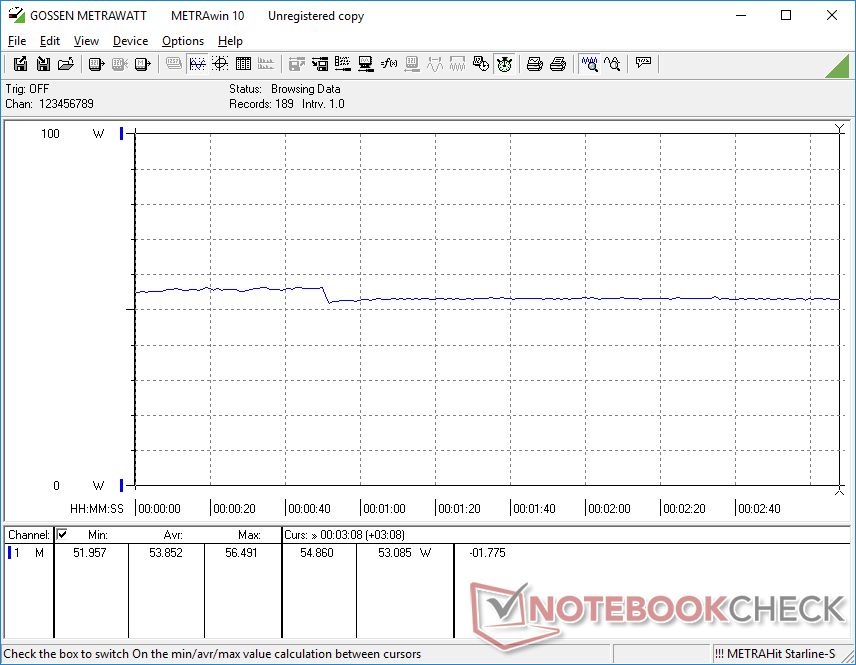
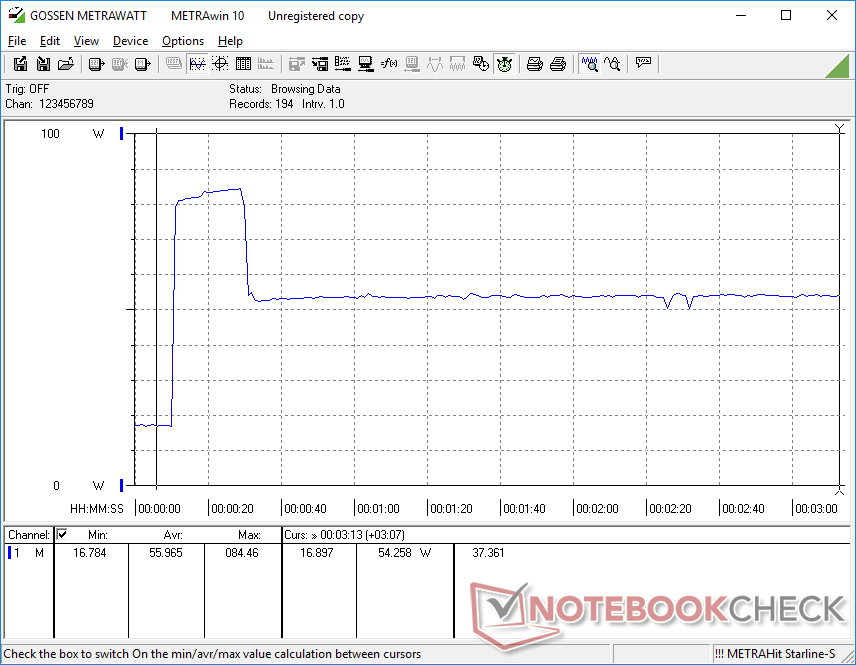
Consommation d'énergie
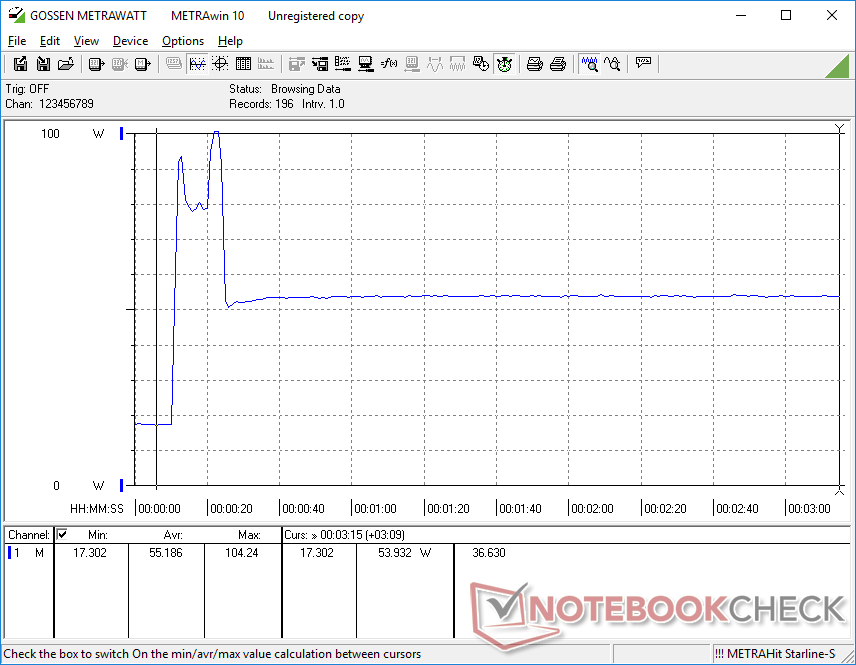
La consommation d'énergie globale est plus élevée que prévu. L'Intel NUC11TNKi5 avec exactement le même CPU, par exemple, demanderait plusieurs watts de moins dans toutes les conditions testées par rapport à notre unité Beelink. Les performances plus rapides du CPU et du GPU du Beelink par rapport à un PC moyen équipé du même CPU Core i5-1135G7 sont probablement responsables de sa consommation d'énergie plus élevée
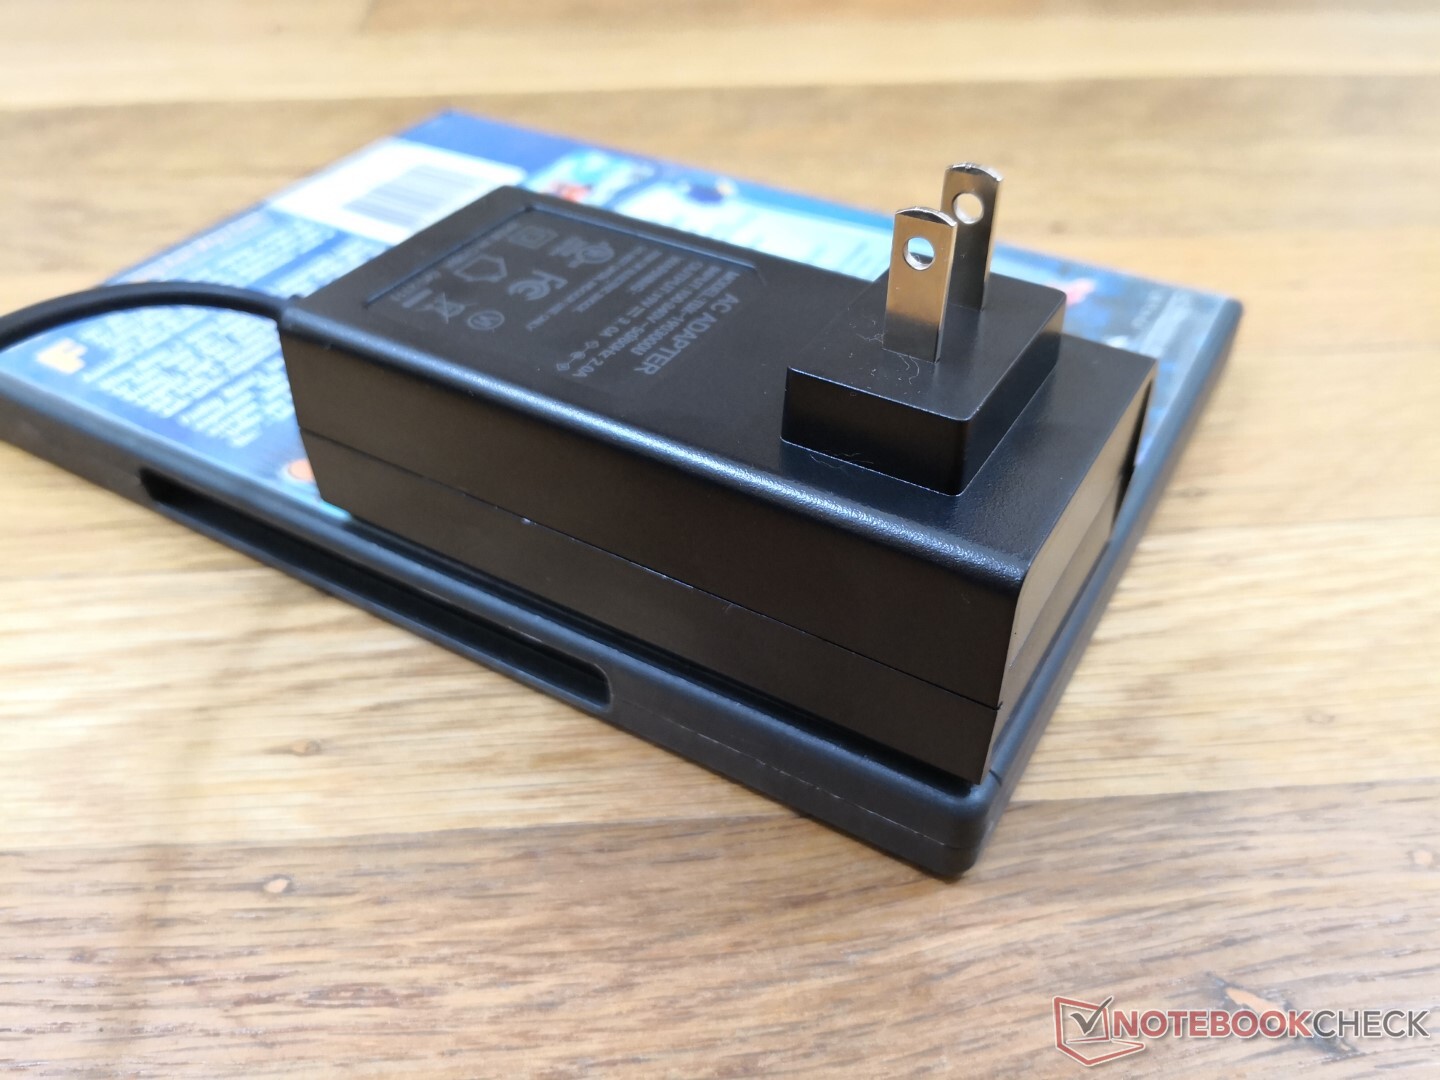
Nous avons pu mesurer une consommation maximale temporaire de 104 W de l'adaptateur secteur 57 W (19 V, 3A) de taille petite-moyenne (~9,8 x 5 x 3,4 cm) lors de l'exécution de Prime95. Ce pic dure environ 20 secondes avant de retomber et de se stabiliser à 56 W comme le montrent les graphiques ci-dessous.
| Éteint/en veille | |
| Au repos | |
| Fortement sollicité |
|
Légende:
min: | |
| Beelink GTI 11 i5-1135G7, Iris Xe G7 80EUs, Kingston SA2000M8500G, , x, | Beelink SER3 R7 3750H, Vega 10, GSemi AZW GSDFN512TS3F1OGCX, , x, | Intel NUC11TNKi5 i5-1135G7, Iris Xe G7 80EUs, Transcend M.2 SSD 430S TS512GMTS430S, , x, | Intel NUC10i7FNH i7-10710U, UHD Graphics 620, Kingston RBUSNS8154P3256GJ1, , 0x0, 0" | GMK NucBox 2 i5-8259U, Iris Plus Graphics 655, Netac S930E8/256GPN, , x, | Intel Hades Canyon NUC8i7HVK i7-8809G, Vega M GH, Intel Optane 120 GB SSDPEK1W120GA, , x, | |
|---|---|---|---|---|---|---|
| Power Consumption | 45% | 22% | 33% | 45% | -45% | |
| Idle Minimum * (Watt) | 15.2 | 7 54% | 11.5 24% | 6.1 60% | 15.5 -2% | |
| Idle Average * (Watt) | 16 | 9.1 43% | 12.4 22% | 8.4 47% | 6.8 57% | 16.2 -1% |
| Idle Maximum * (Watt) | 16 | 9.7 39% | 12.9 19% | 7.3 54% | 16.5 -3% | |
| Load Average * (Watt) | 48.6 | 29.5 39% | 40.7 16% | 46.3 5% | 83.4 -72% | |
| Witcher 3 ultra * (Watt) | 53.8 | 32.5 40% | 43.9 18% | 121.7 -126% | ||
| Load Maximum * (Watt) | 104.3 | 48.7 53% | 73.5 30% | 86 18% | 50.7 51% | 173.5 -66% |
* ... Moindre est la valeur, meilleures sont les performances
Power Consumption Witcher 3 / Stresstest
Power Consumption external Monitor
Points positifs
Points négatifs
Verdict : comme un Intel NUC, mais à un prix plus raisonnable
Le Beelink GTI 11 est très convaincant. Pour 600 à 700 dollars américains, les utilisateurs obtiennent le package complet avec RAM, stockage et Windows 10 Pro alors qu'un Intel NUC 11 avec le même processeur coûterait près de 600 $ en kit de base. Ainsi, il vous faudrait dépenser près de 800 $ sur un Intel NUC juste pour correspondre aux spécifications du Beelink. Le fait qu'il puisse prendre en charge les accessoires Thunderbolt 4, le Wi-Fi 6 et jusqu'à trois SSD internes signifie que les utilisateurs n'ont pas à renoncer à de nombreuses fonctionnalités importantes lorsqu'ils passent au Beelink.
L'inconvénient majeur à garder à l'esprit est le mauvais comportement du GTI 11 en matière de bruit du ventilateur. Le régime du ventilateur change fréquemment et sensiblement sans raison apparente. Attendez-vous à ce que le système soit globalement plus bruyant que la plupart des modèles Intel NUC.
Prix et disponibilité
Price comparison

