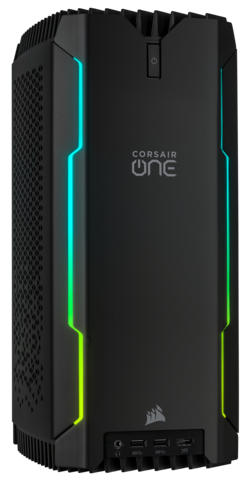
Test du Corsair One i300 : le PC de bureau au boîtier de 12 L dompte Core i9-12900K et RTX 3080 Ti

Corsair vend la série One depuis 2018, emballant le matériel de jeu actuel dans un boîtier compact qui comprend un refroidissement par eau. Nous avons déjà vu dans leCorsair One i160que ce système fonctionne.
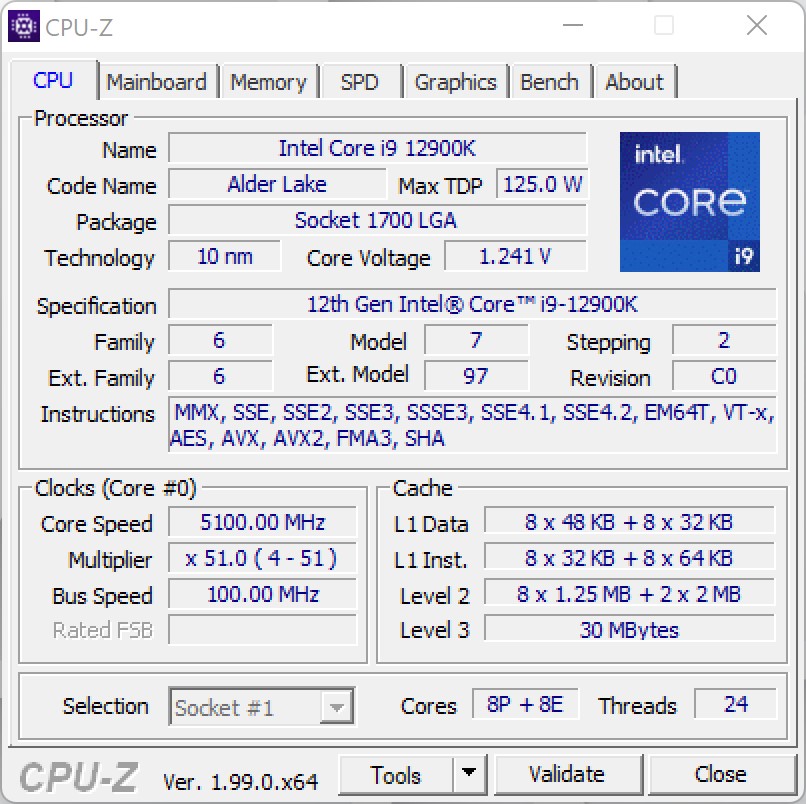
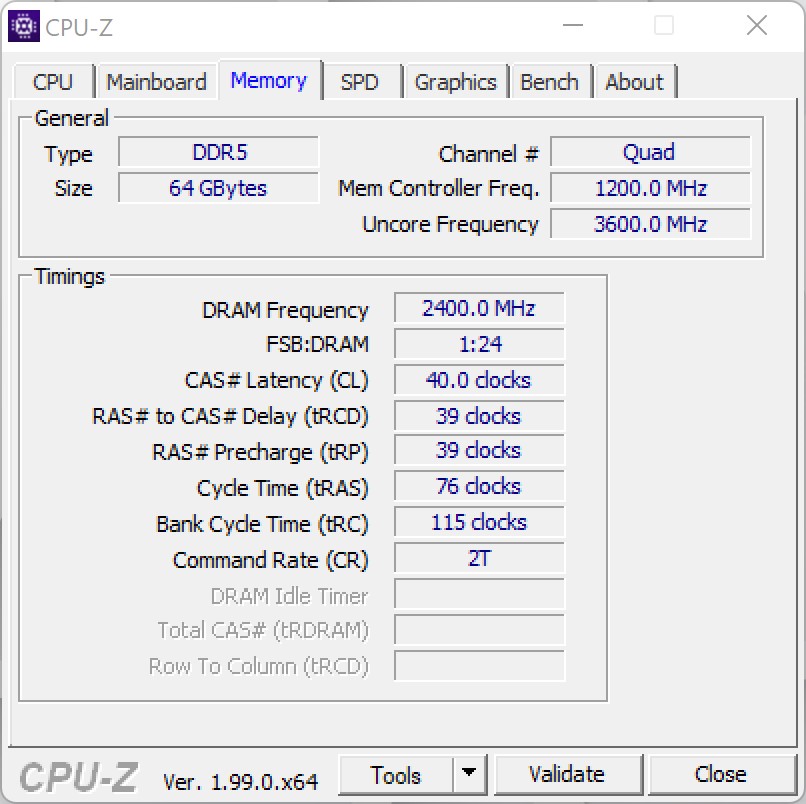
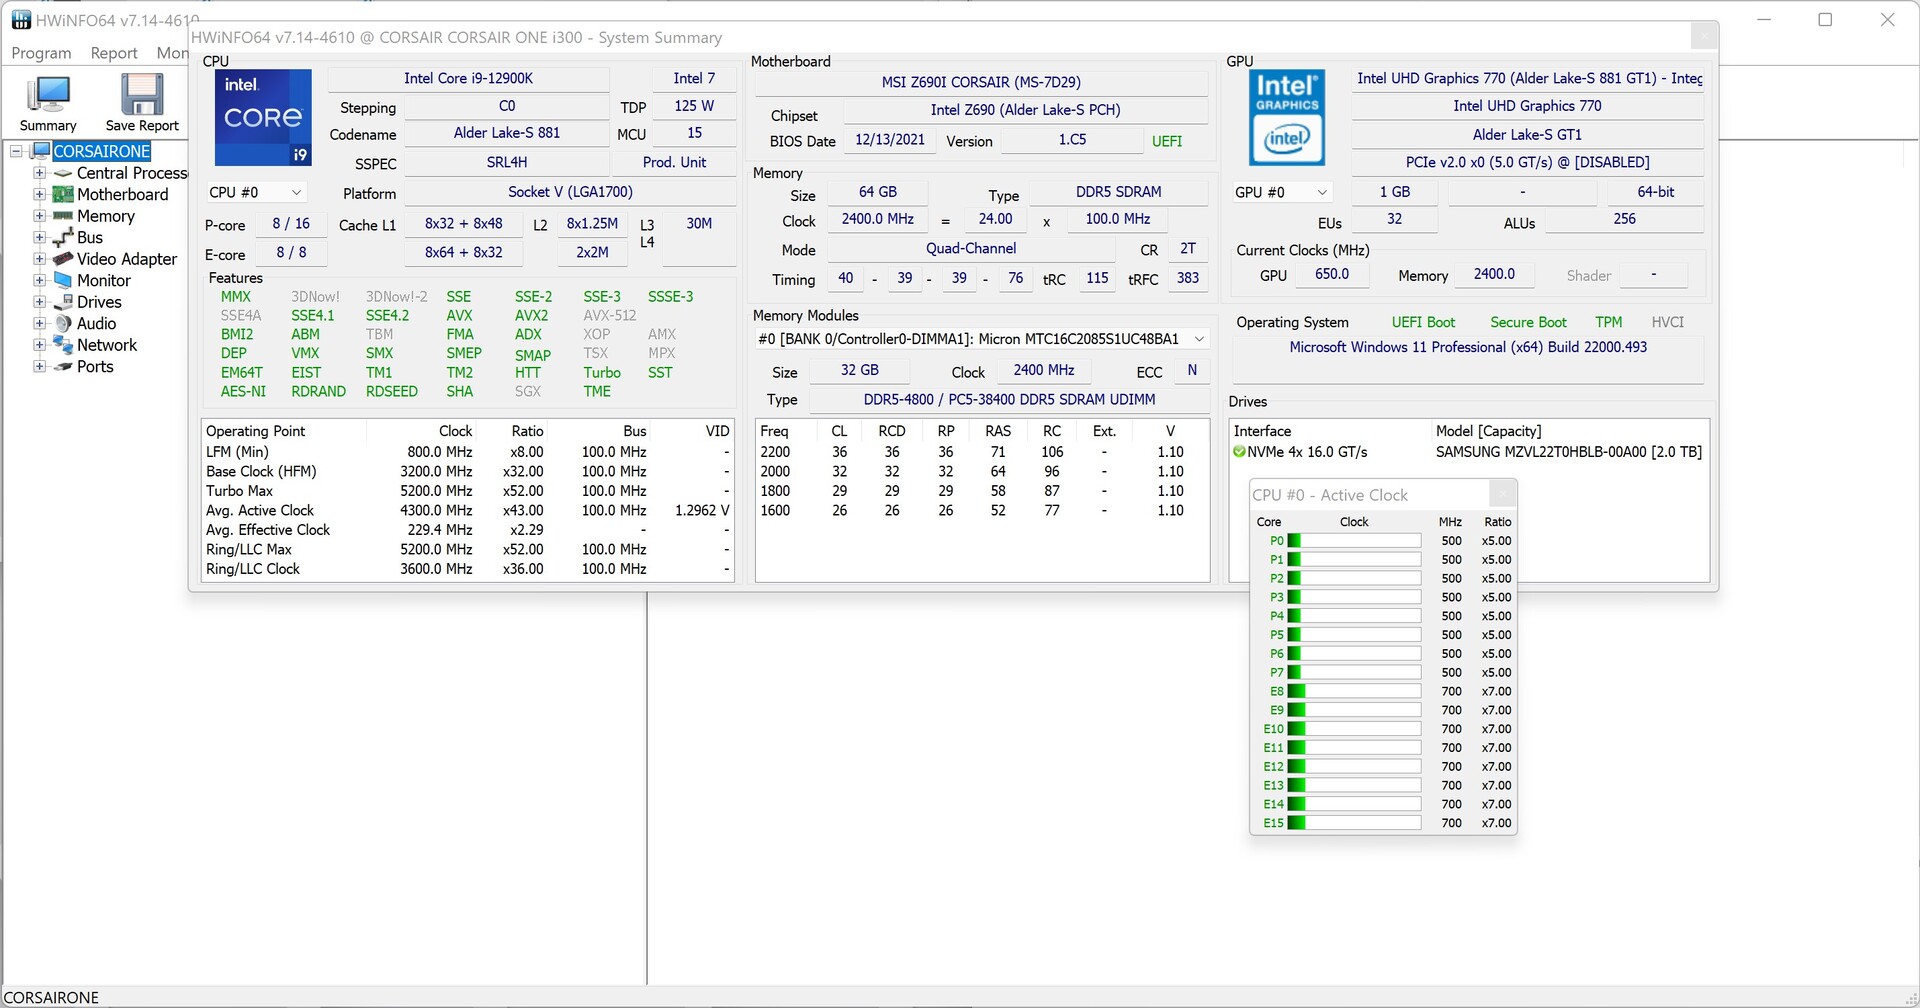
Au CES de cette année, Corsair a annoncé une mise à jour pour le Corsair One qui est équipé de la série actuelle Alder Lake, qui a maintenant regagné la couronne de performance en tant que processeur de jeu le plus rapide. En plus du Intel Core i9-12900Kcorsair inclut également unNvidia GeForce RTX 3080 Ti. Ces deux composants constituent une excellente base pour un jeu 4K sans compromis. Après nos premiers tests, nous avons également pu le confirmer, même si le fabricant tient encore un peu en laisse l'Intel Core i9-12900K. Nous y reviendrons plus tard dans ce test. En ce qui concerne les composants puissants, il y a également une mémoire de travail suffisante de 64 Go et un SSD de 2 To rapide comme l'éclair comprenant la version professionnelle de Windows 11.
Corsair demande 5100 euros (~5724 dollars) pour le système tel qu'équipé dans notre test. Si vous vous contentez d'une mémoire de travail de 32 Go et d'un SSD de 2 Go, vous pouvez vous contenter de la version professionnelle de Windows 11.Nvidia GeForce RTX 3080vous devrez payer exactement 1000 Euros (~$1122) de moins.
Cas
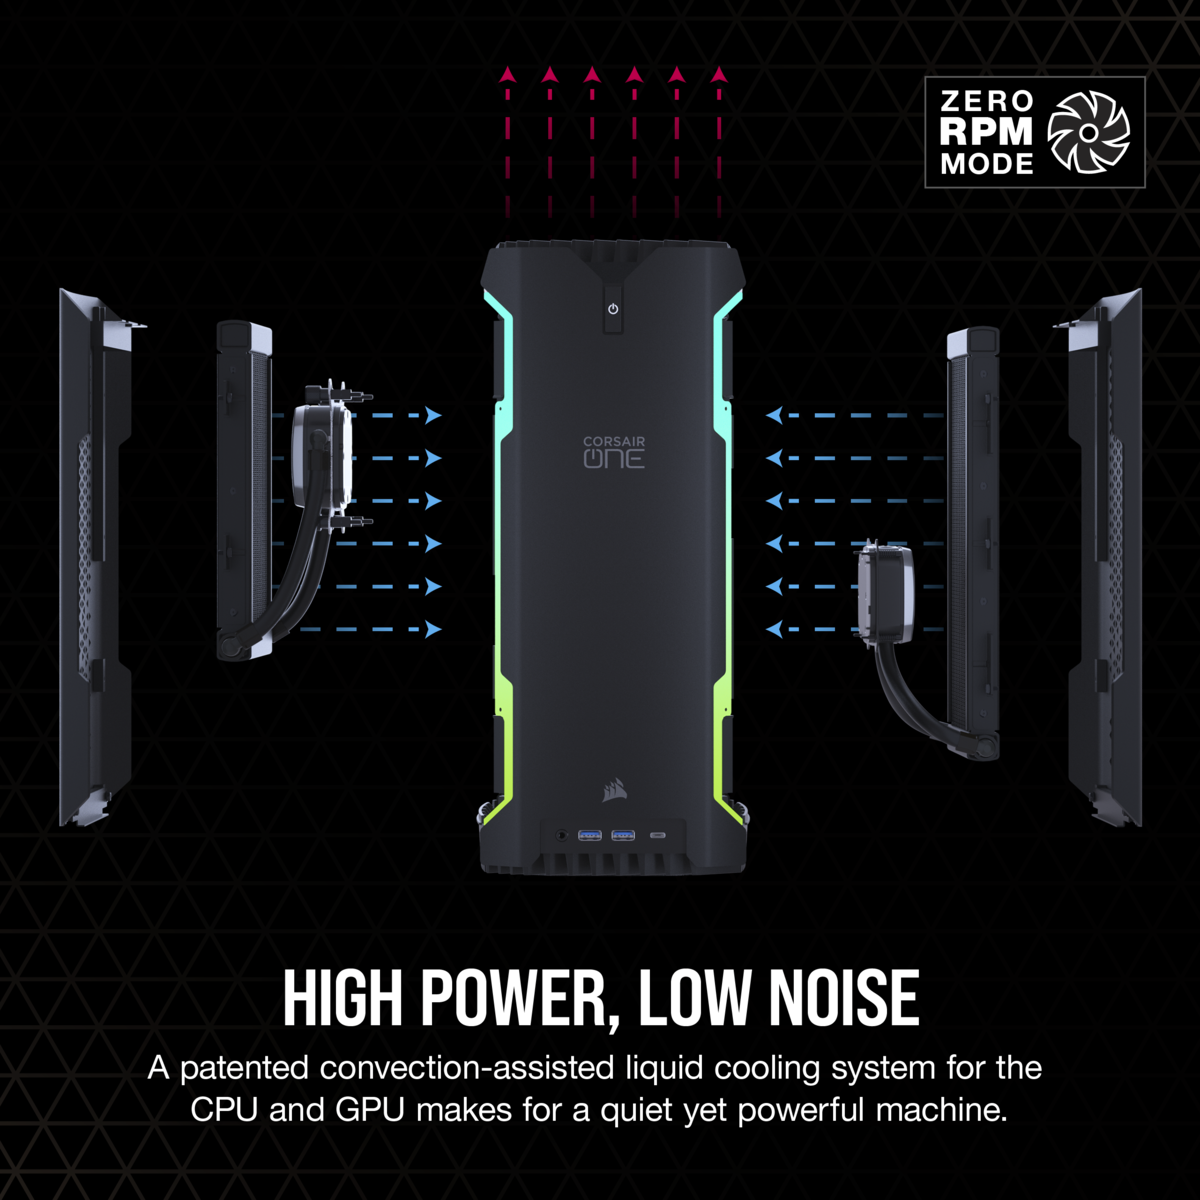
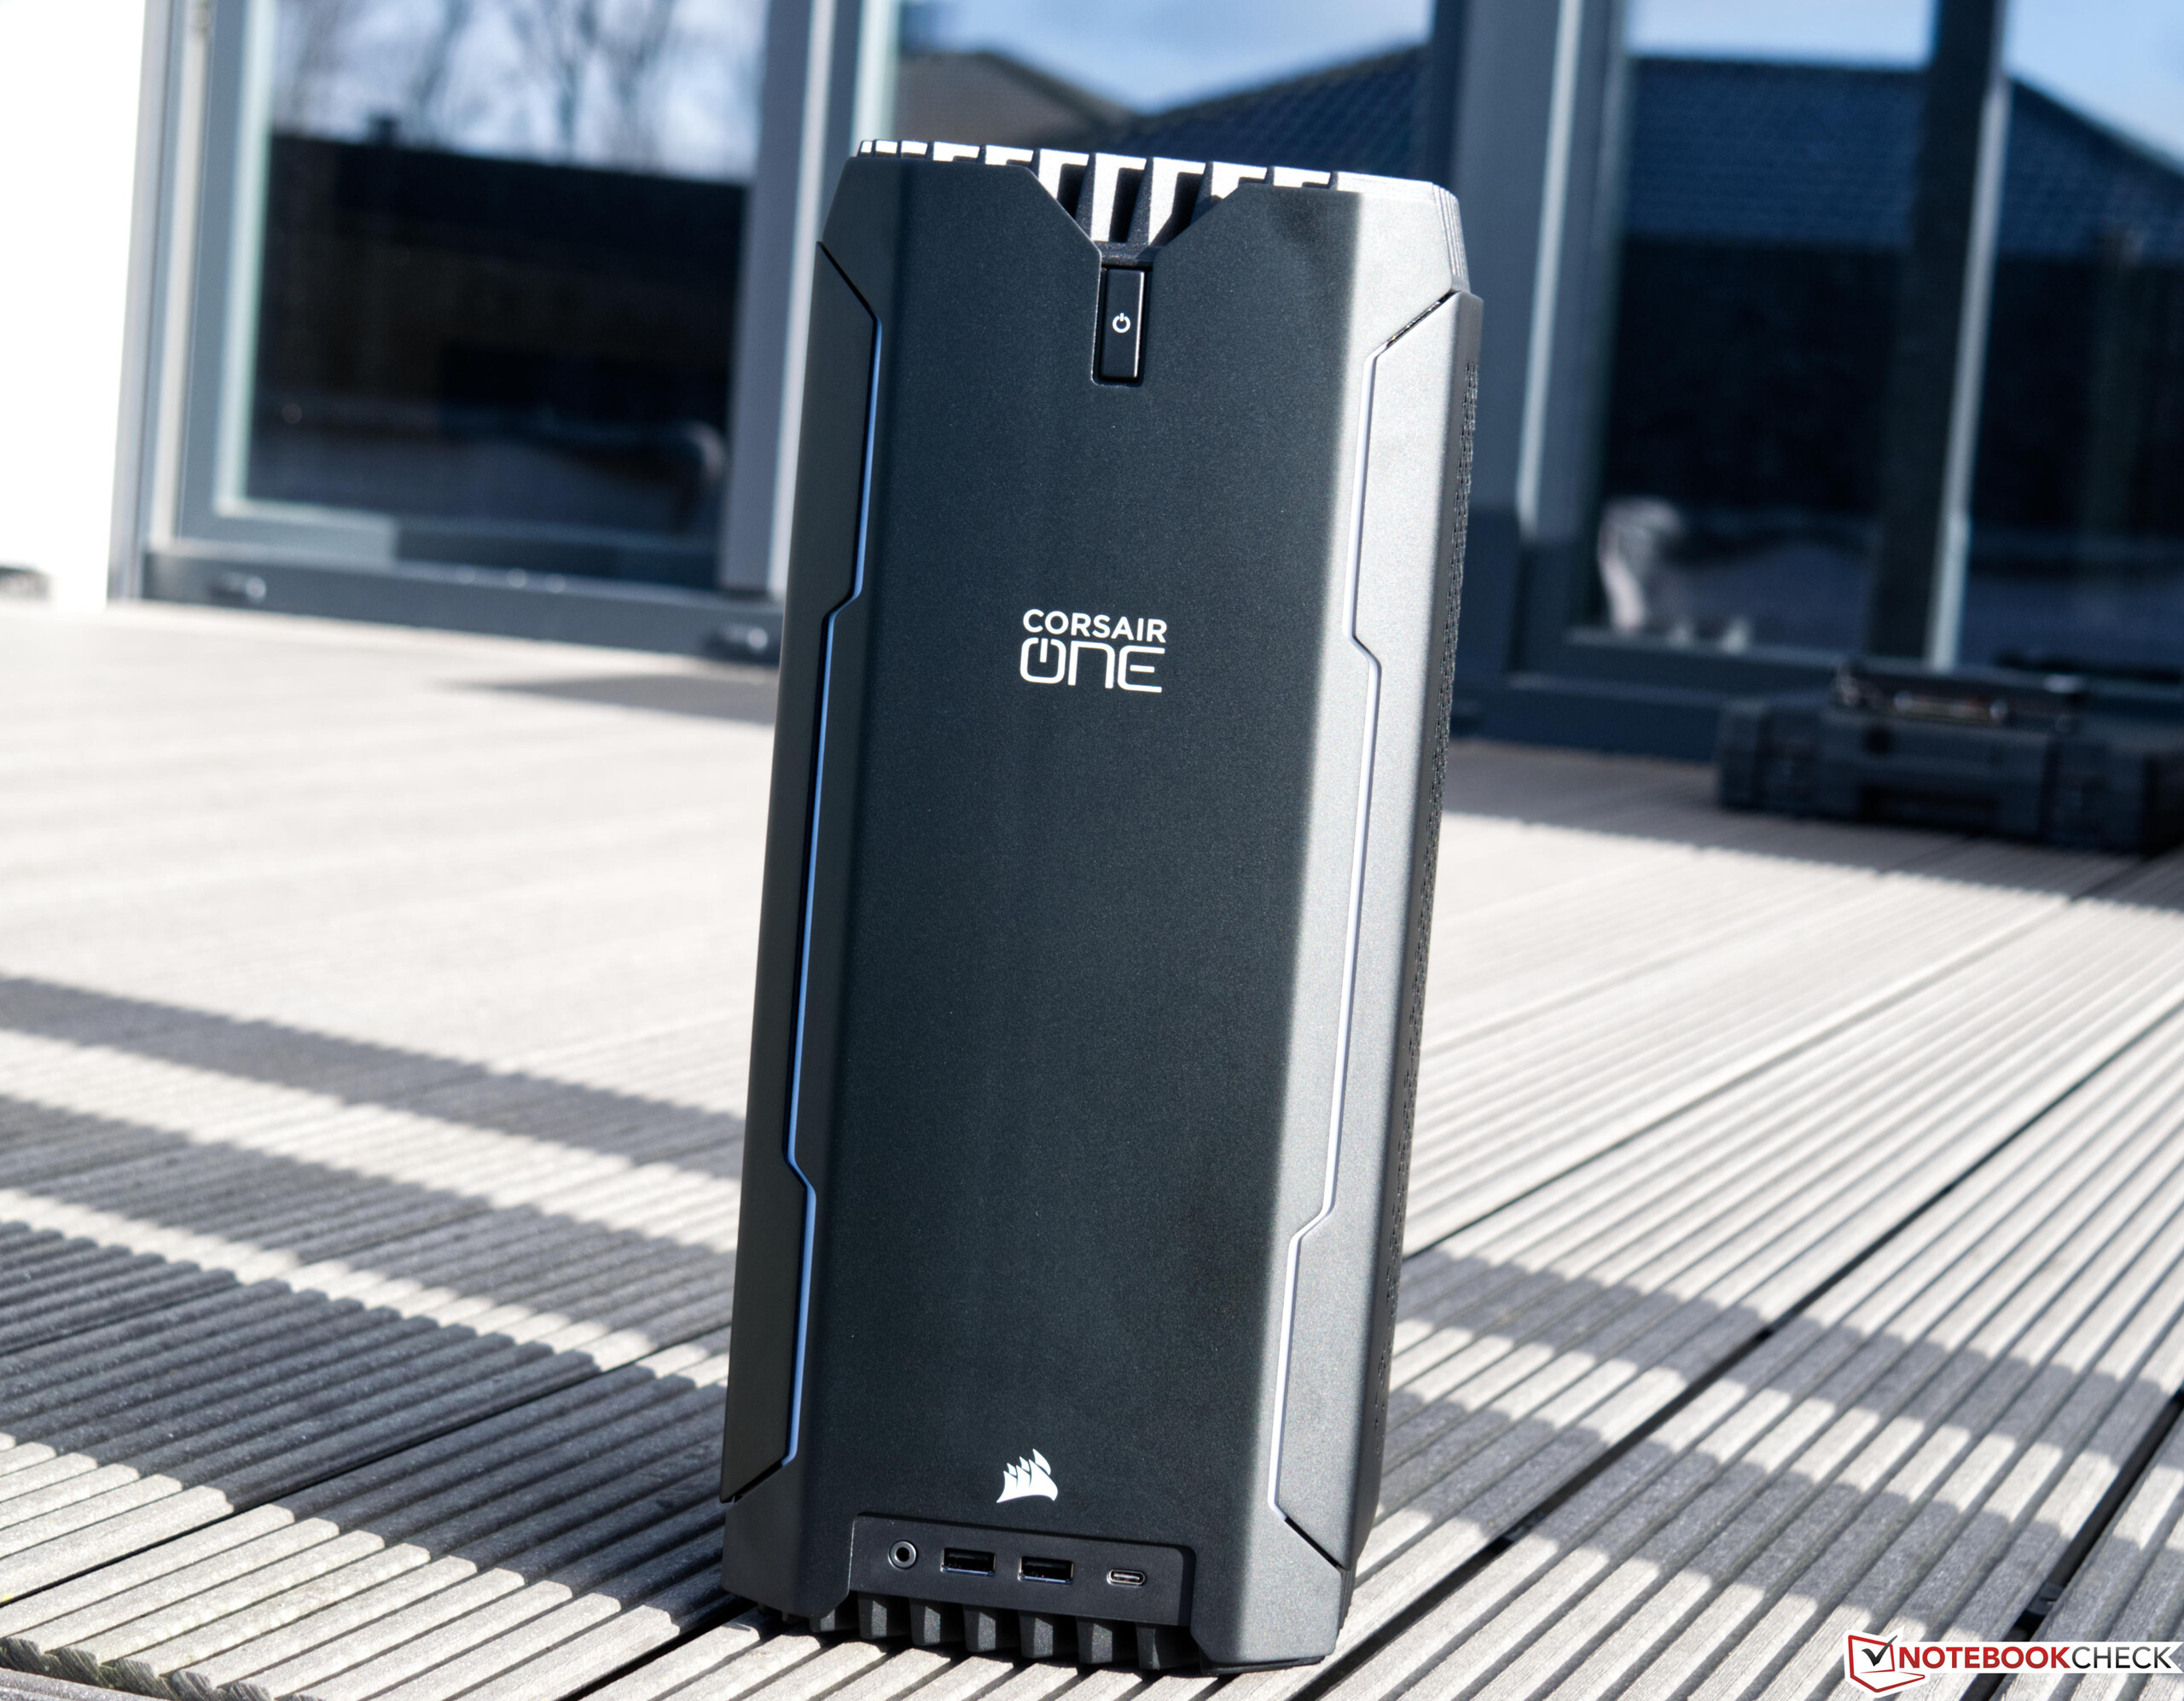
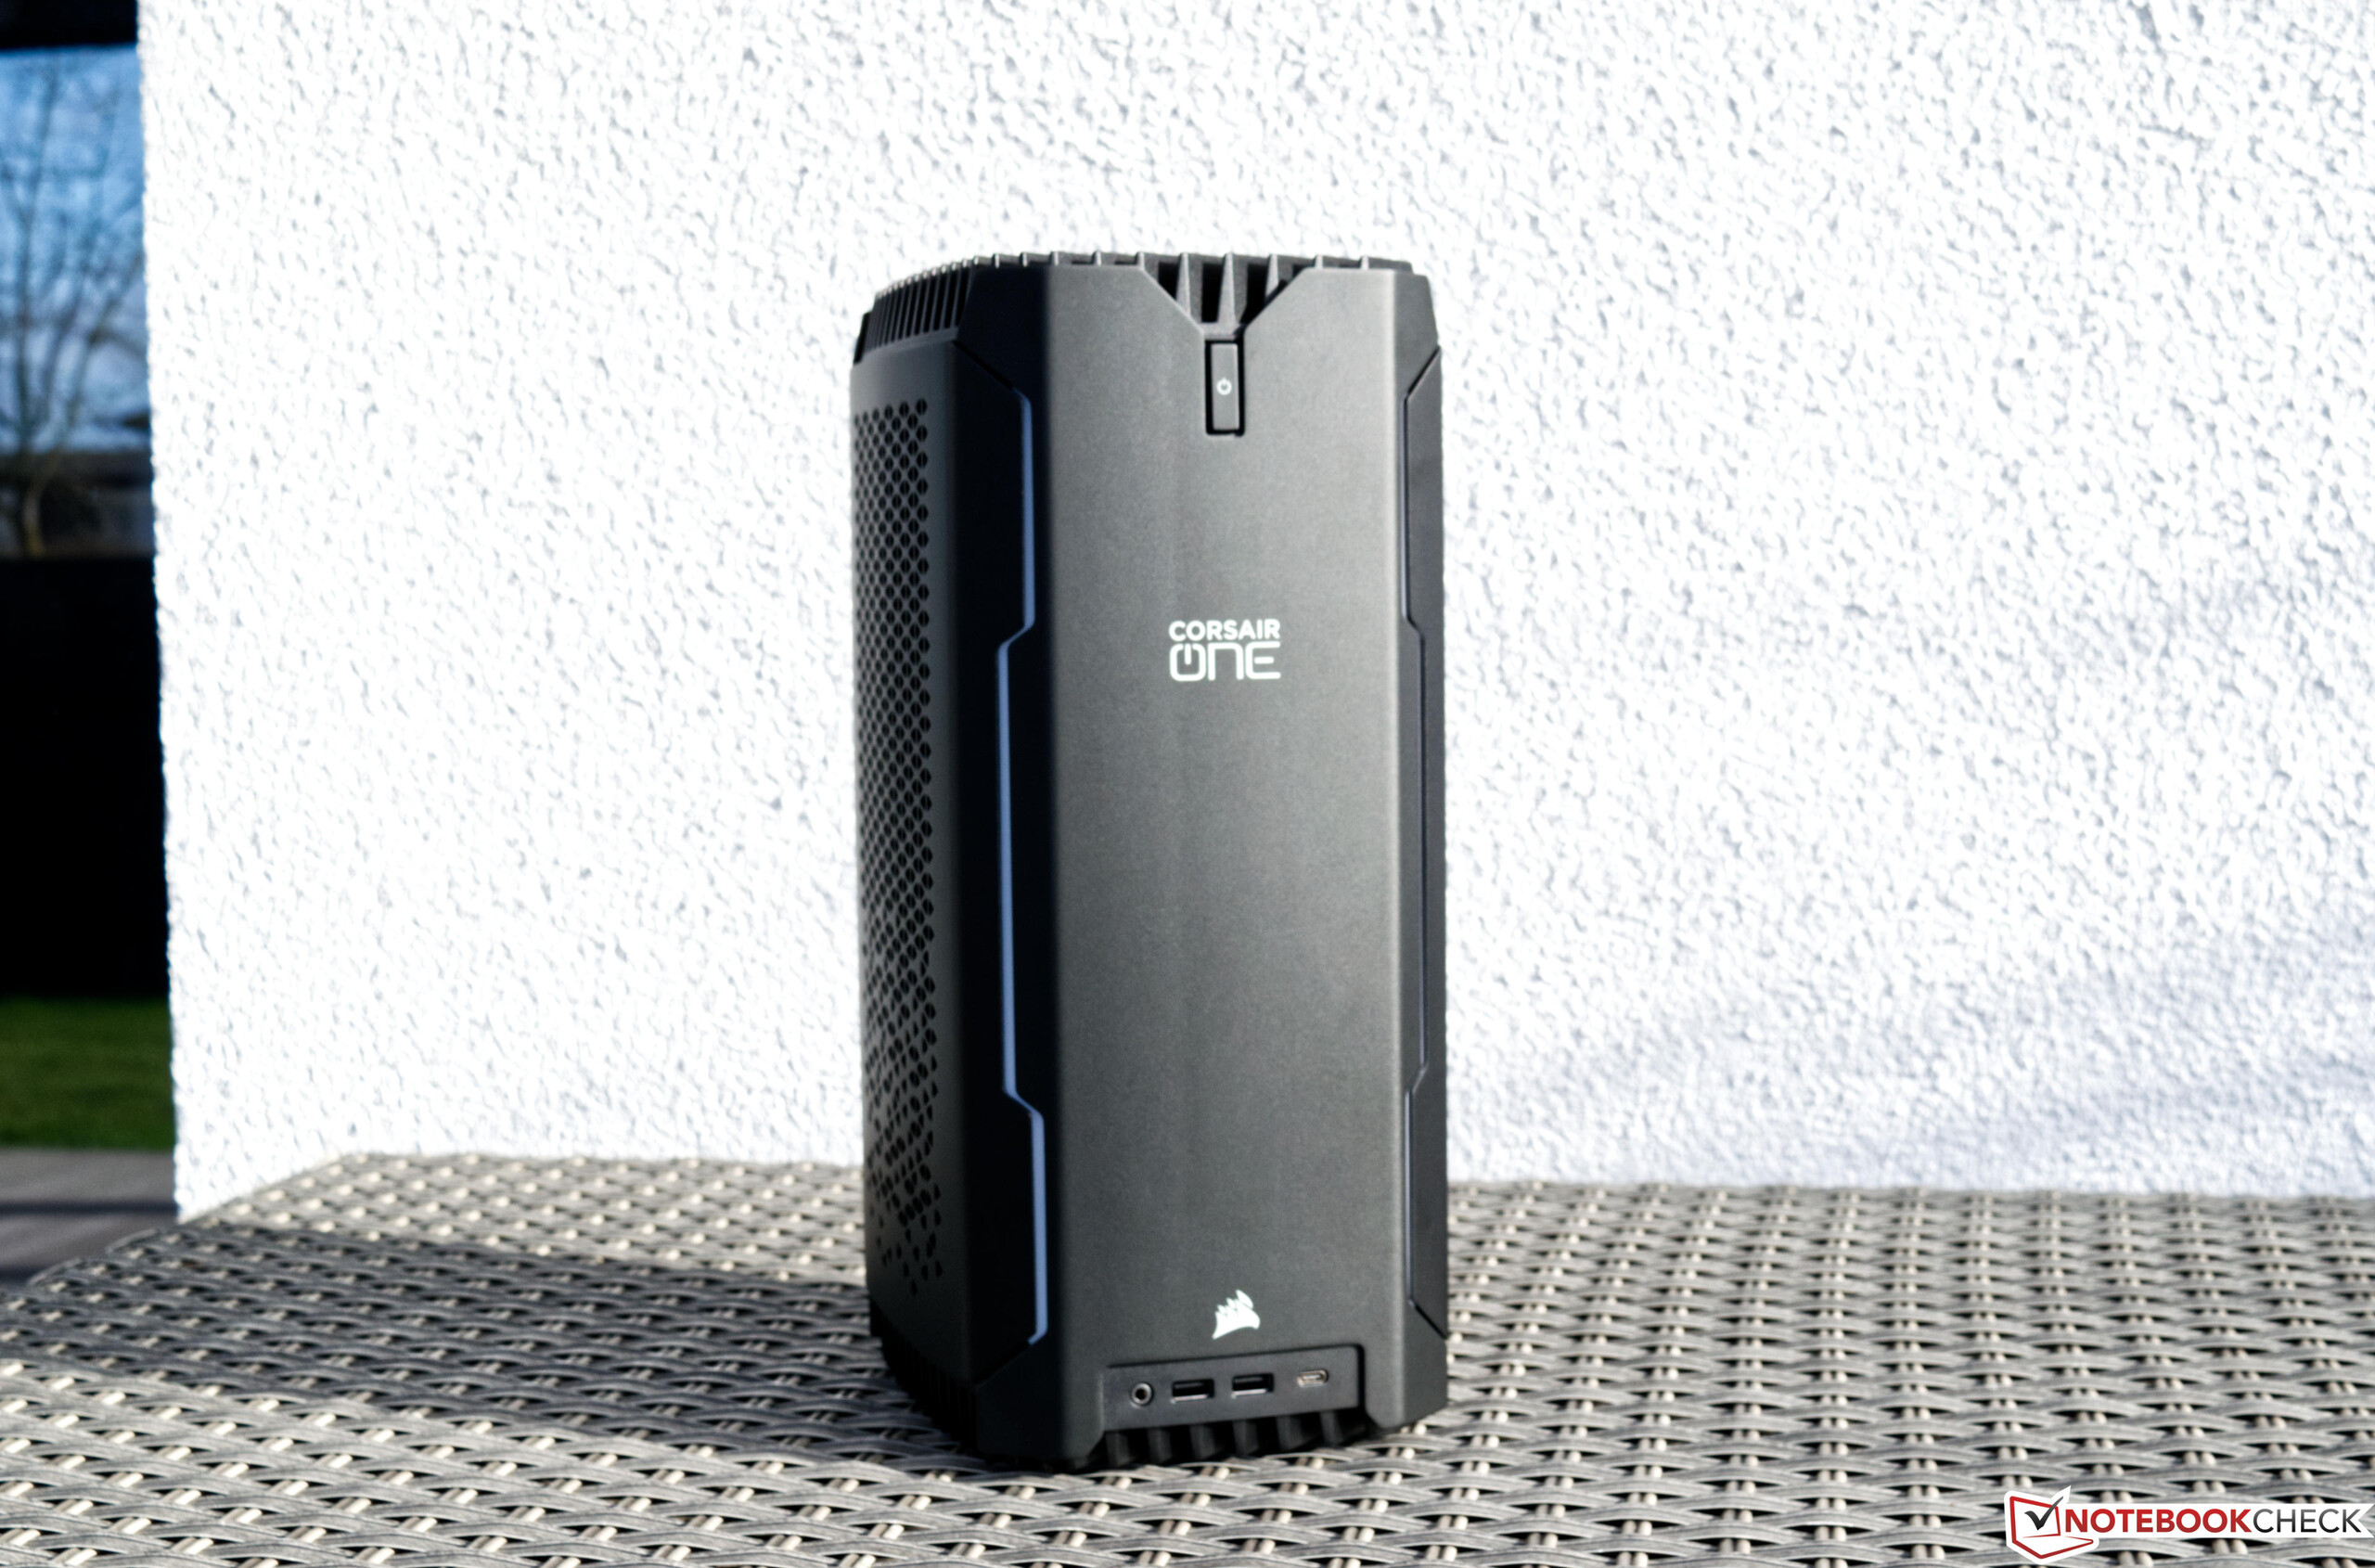
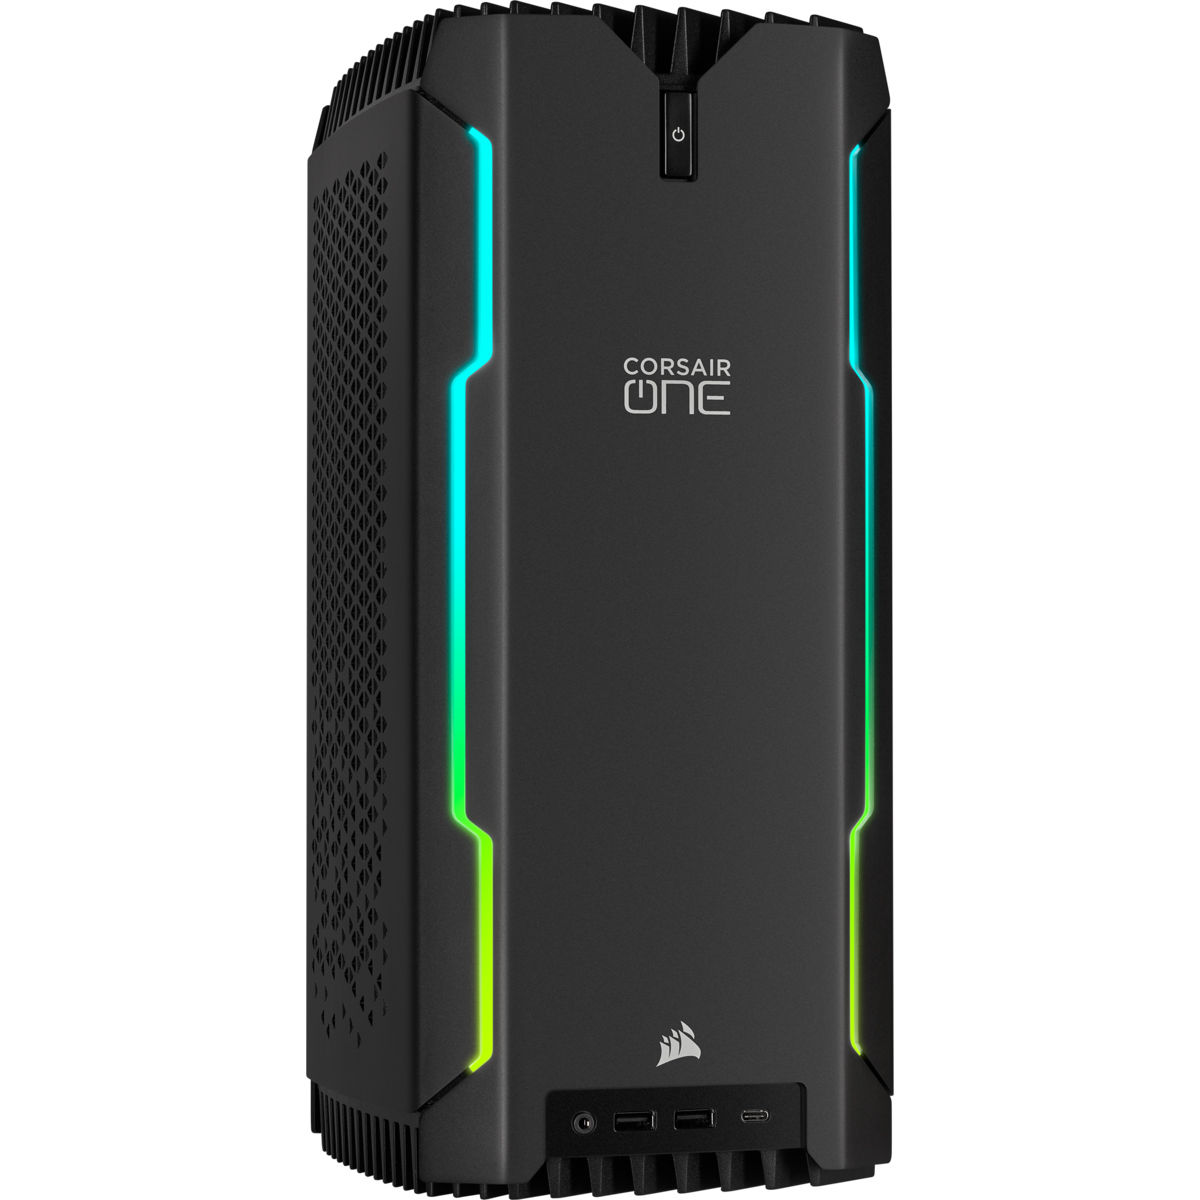
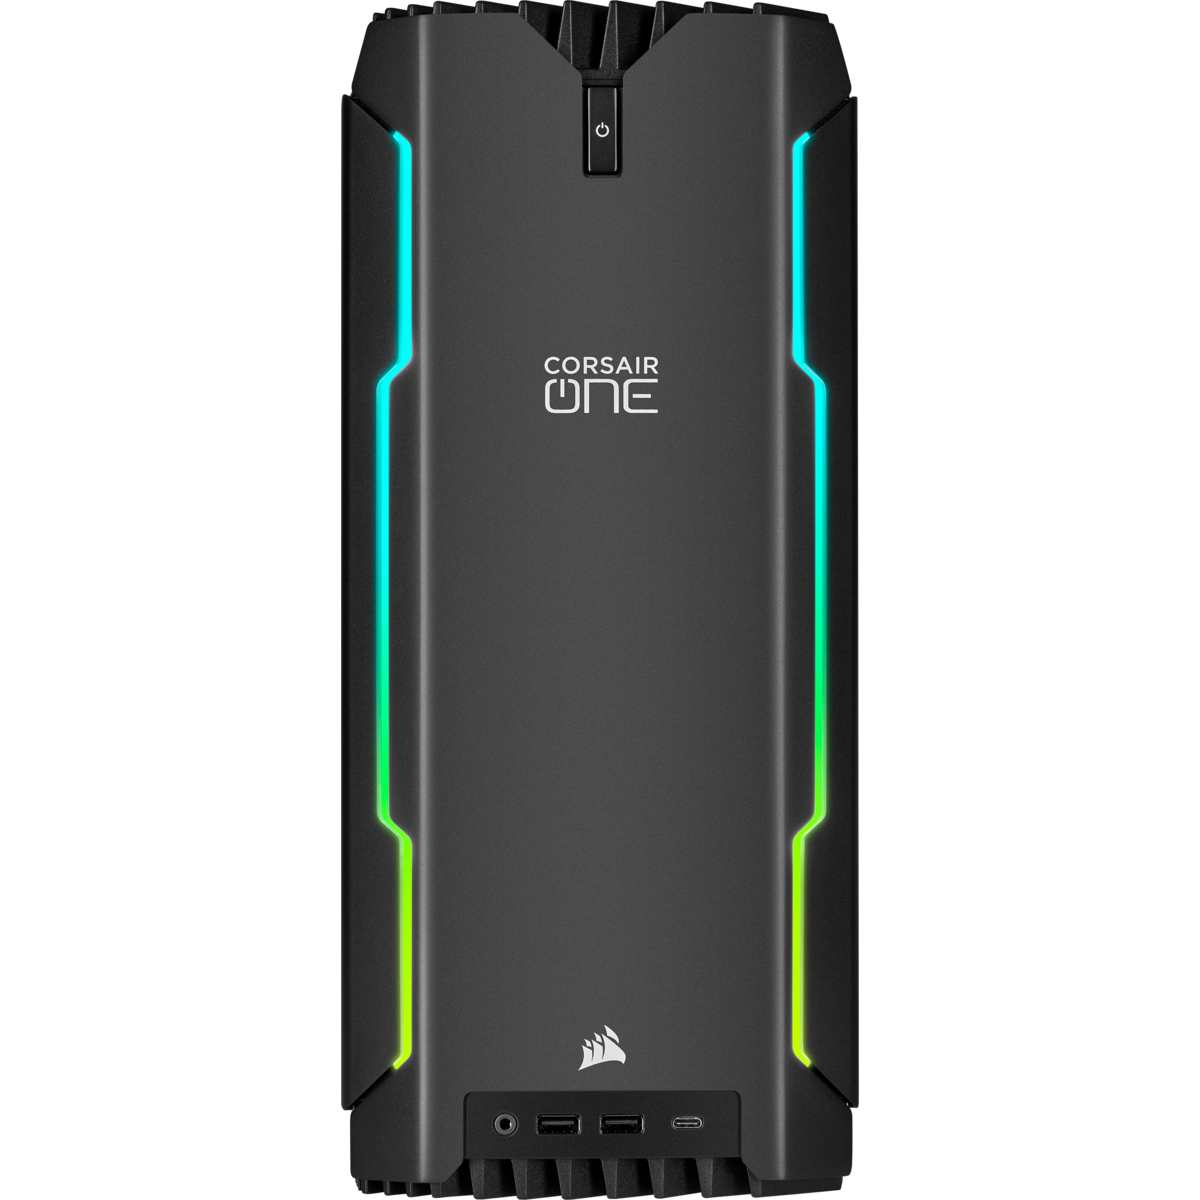
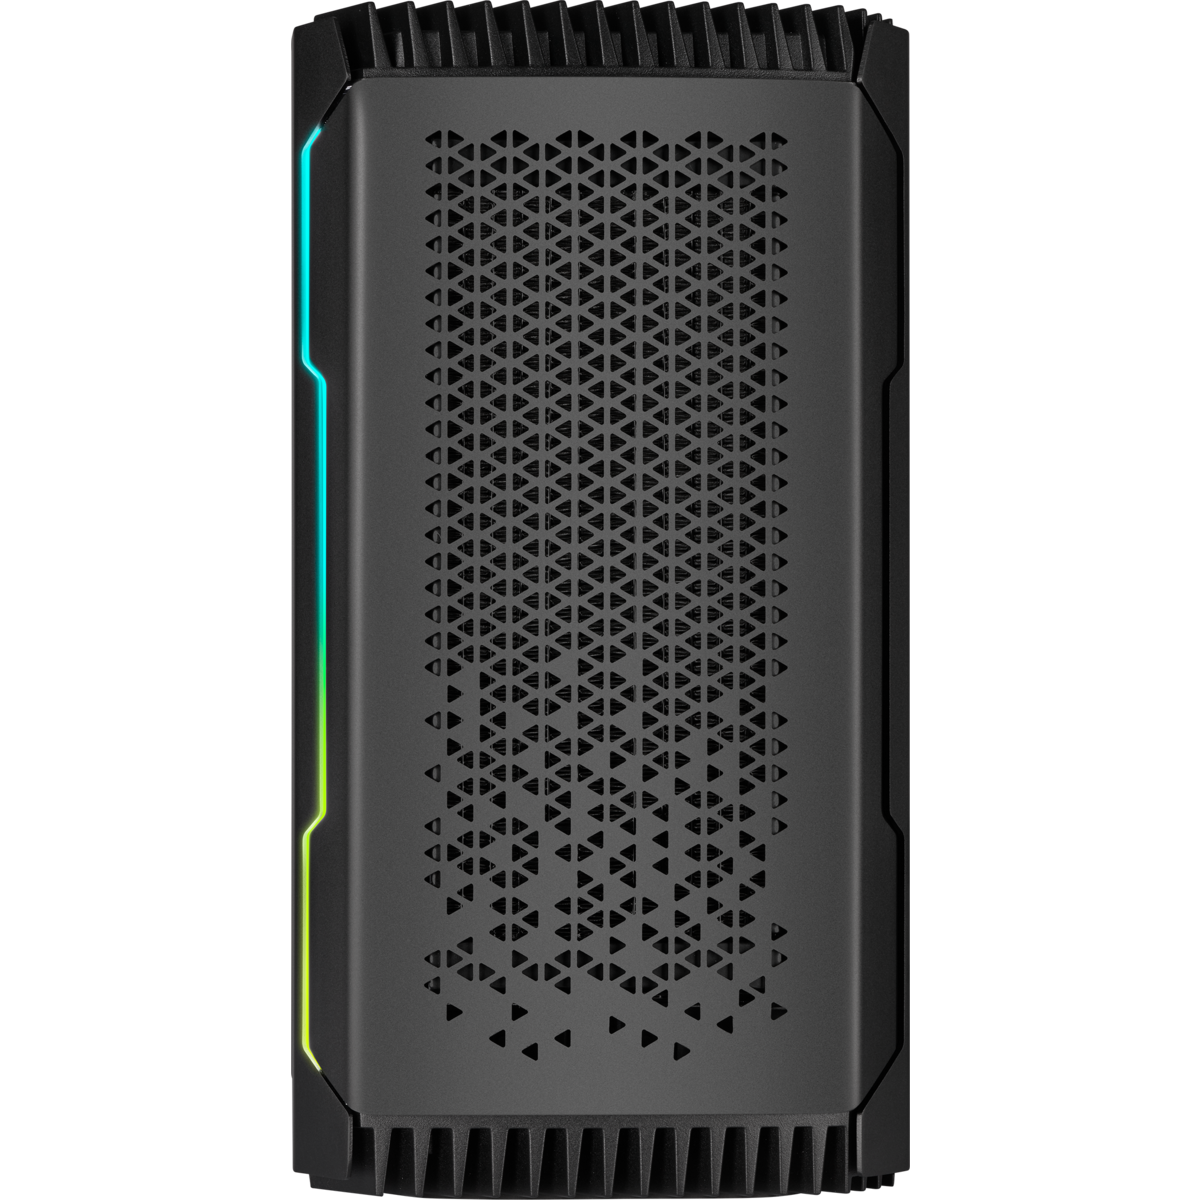
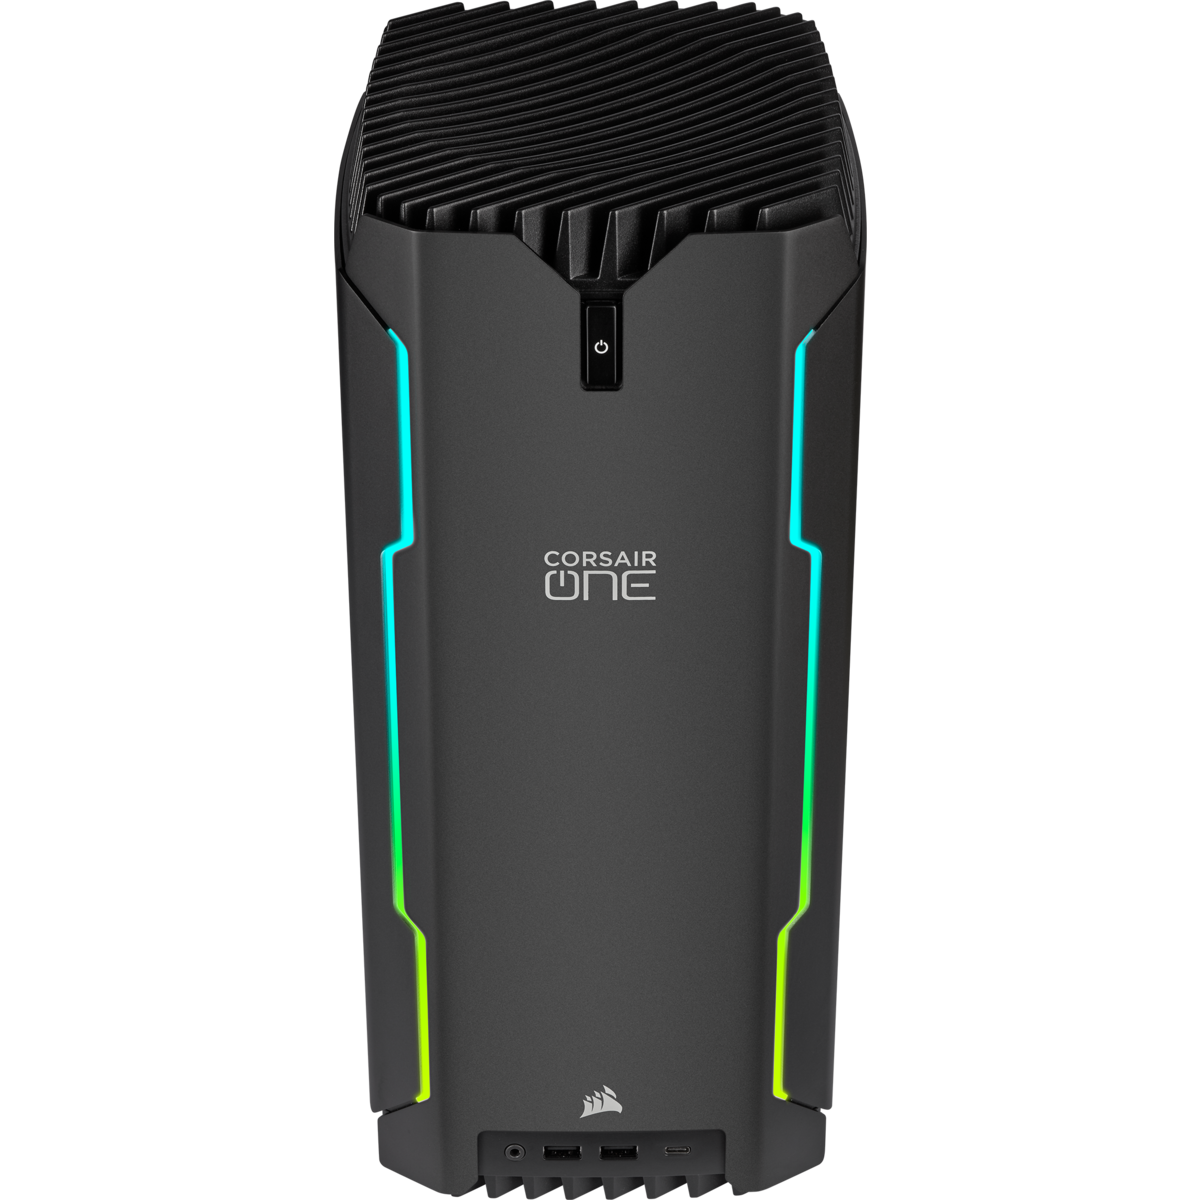
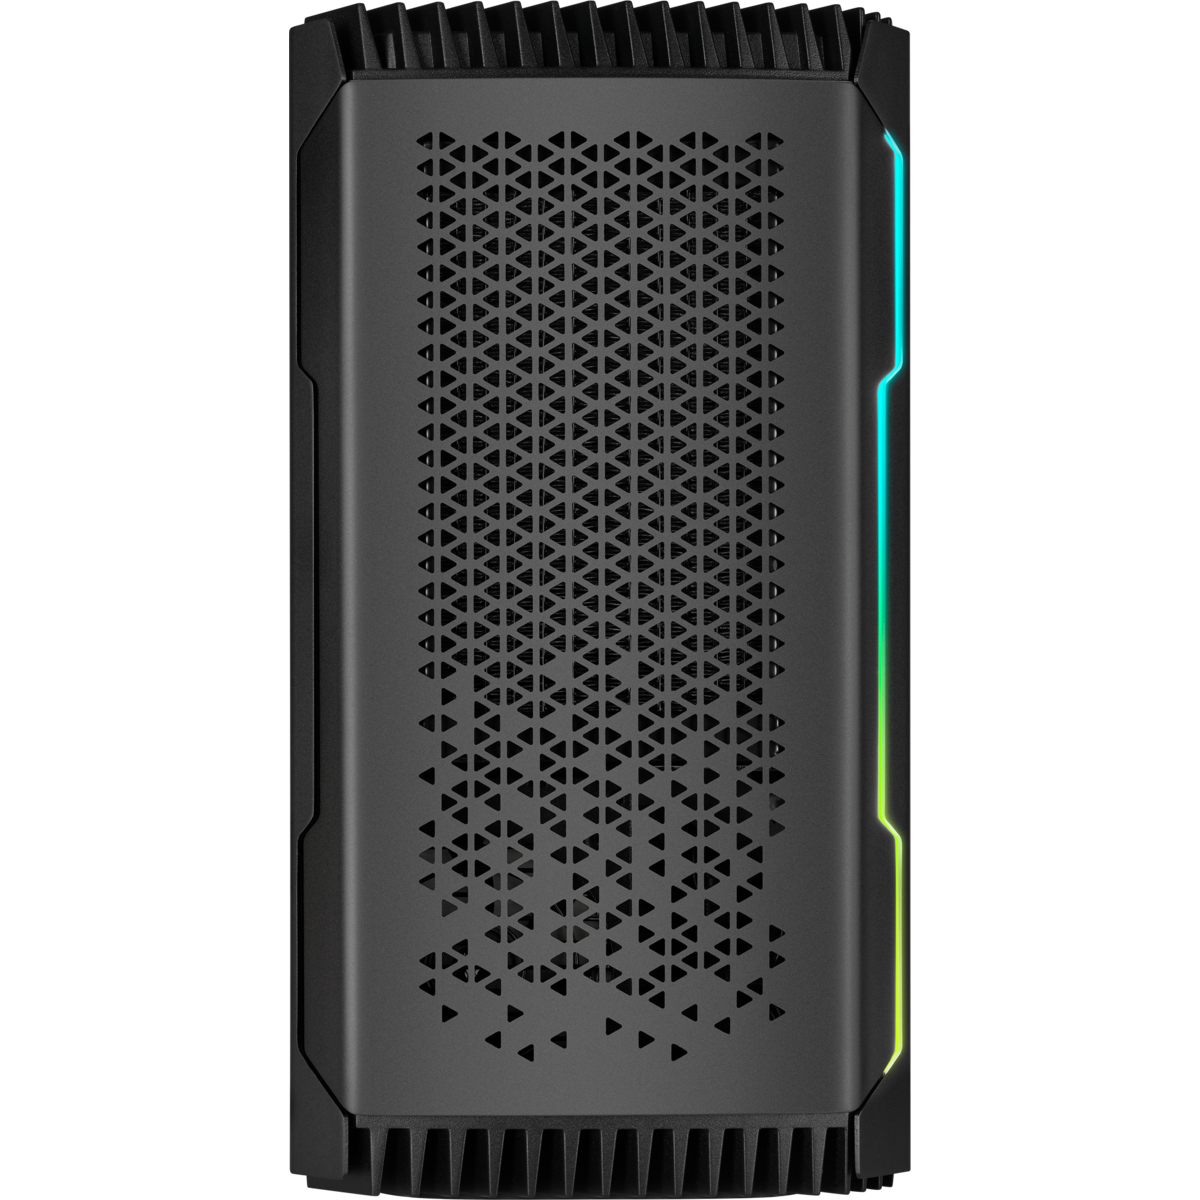
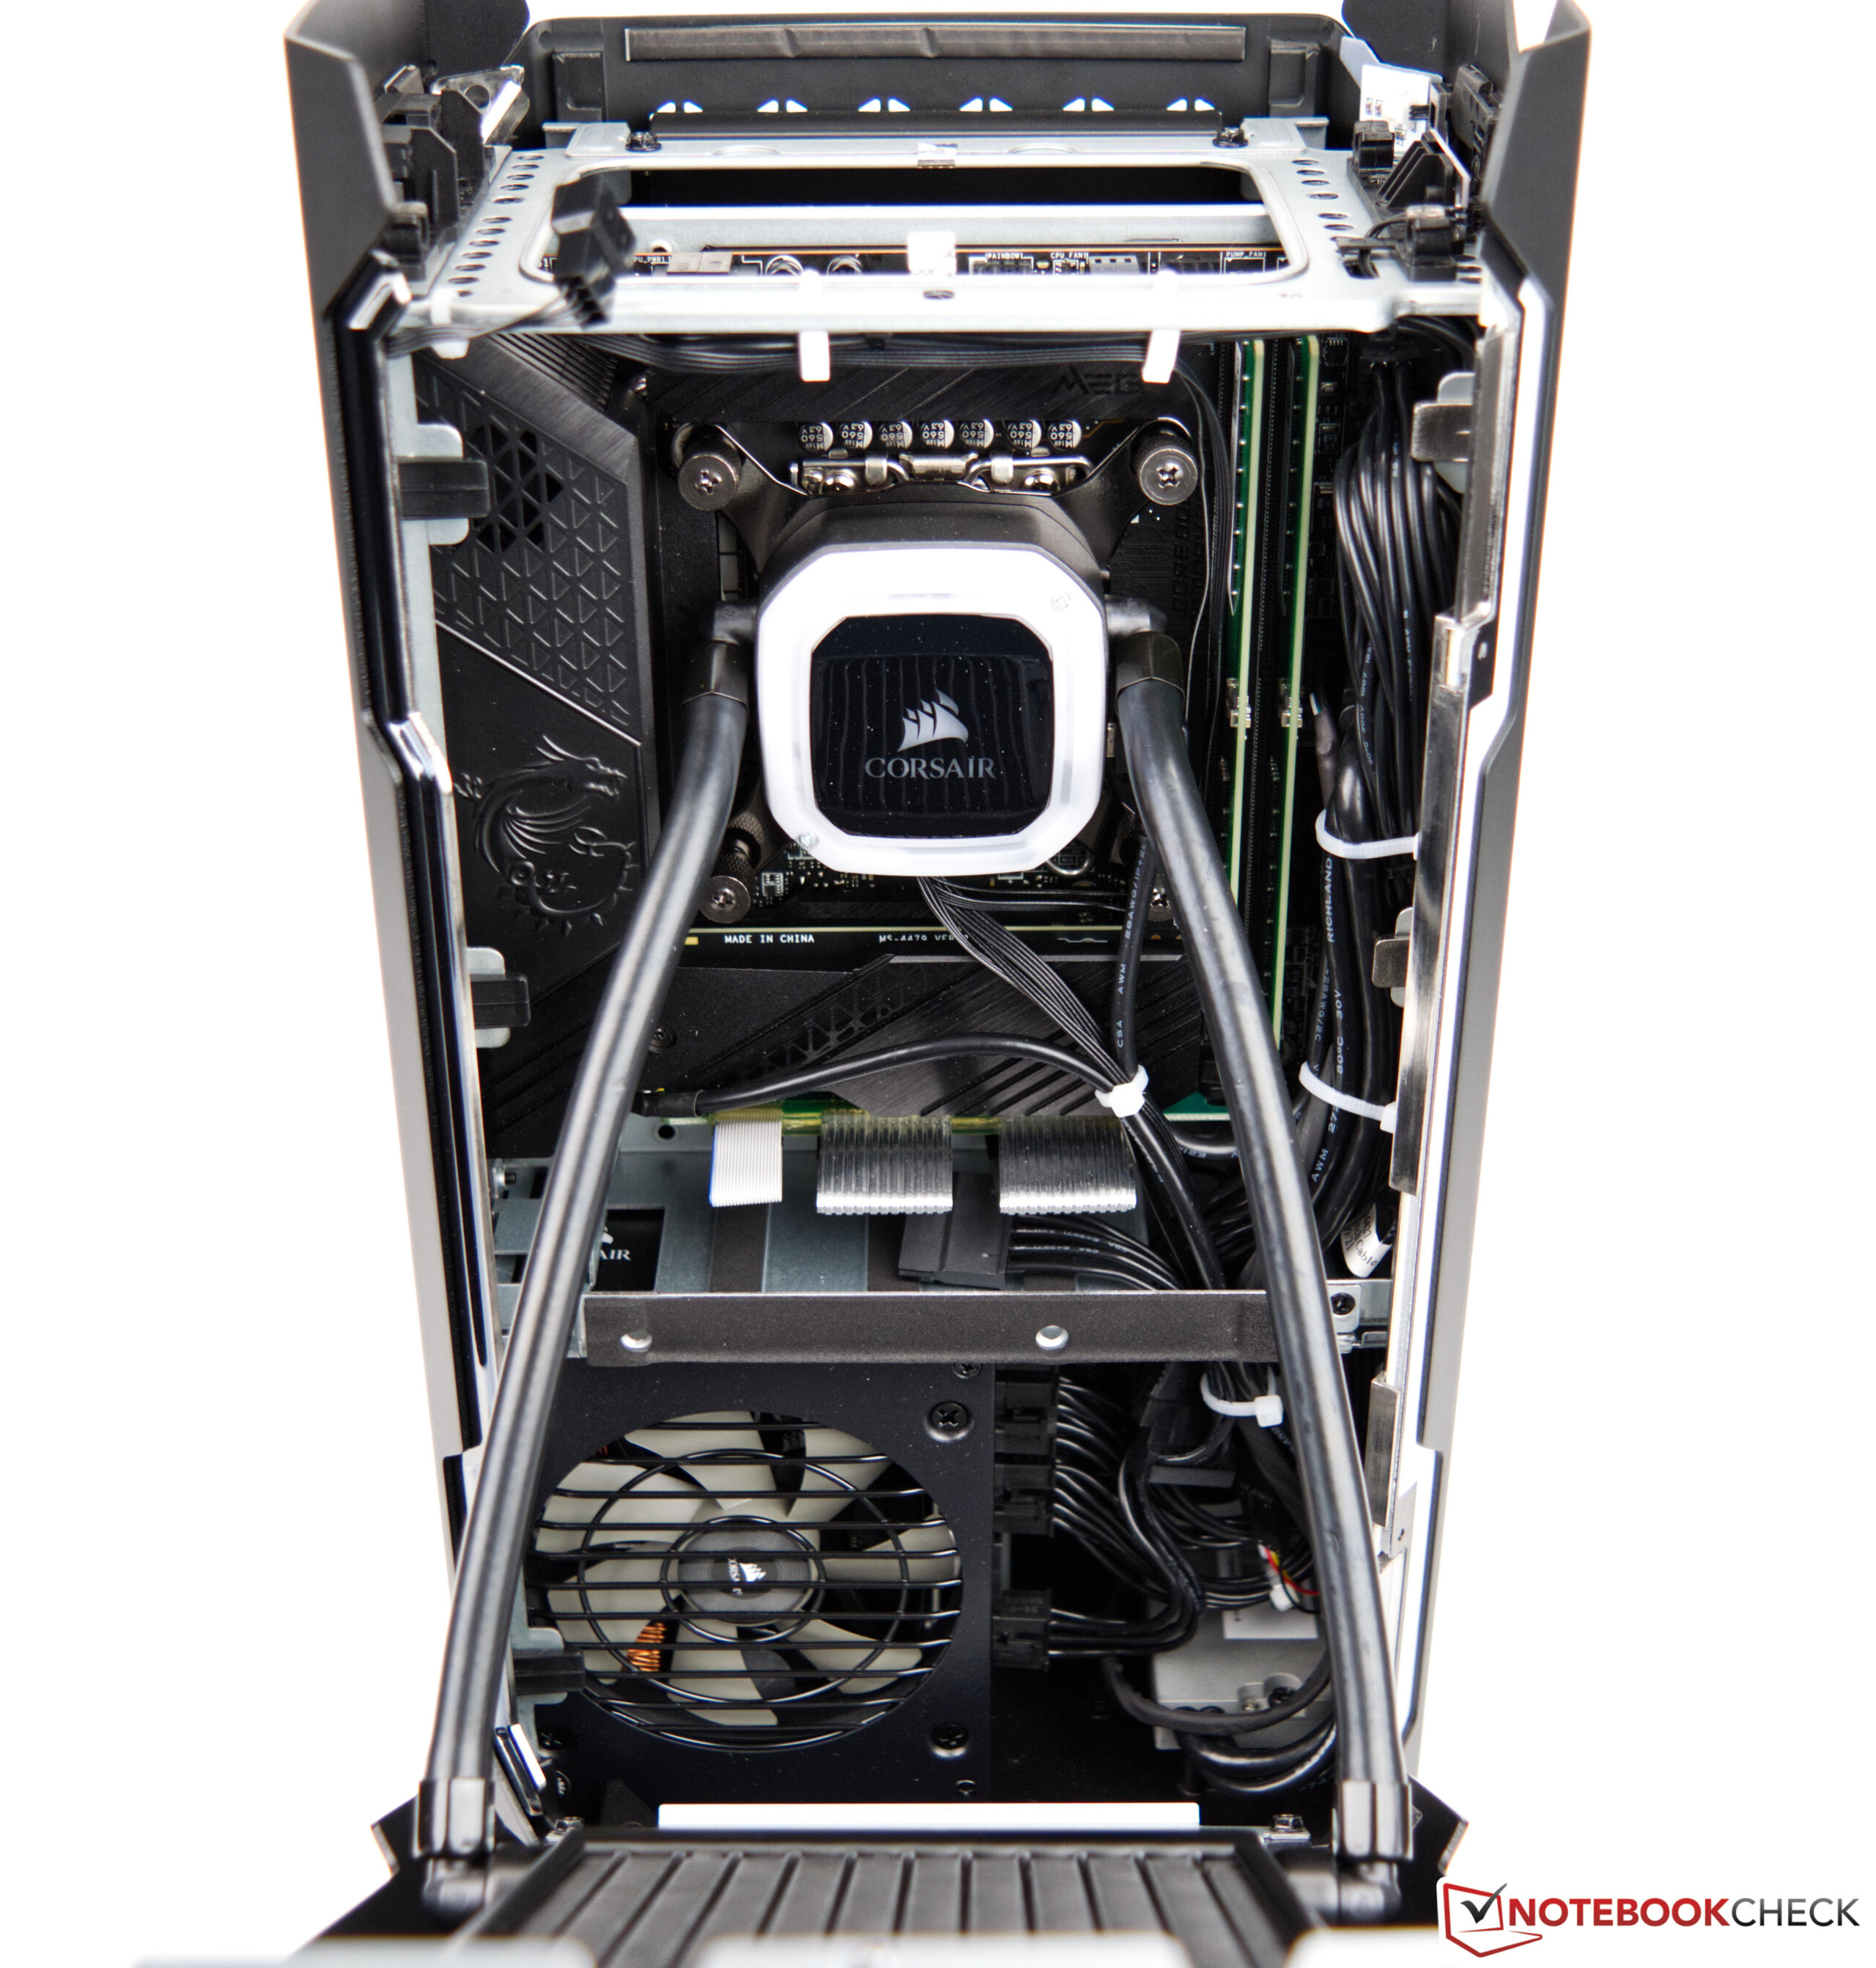
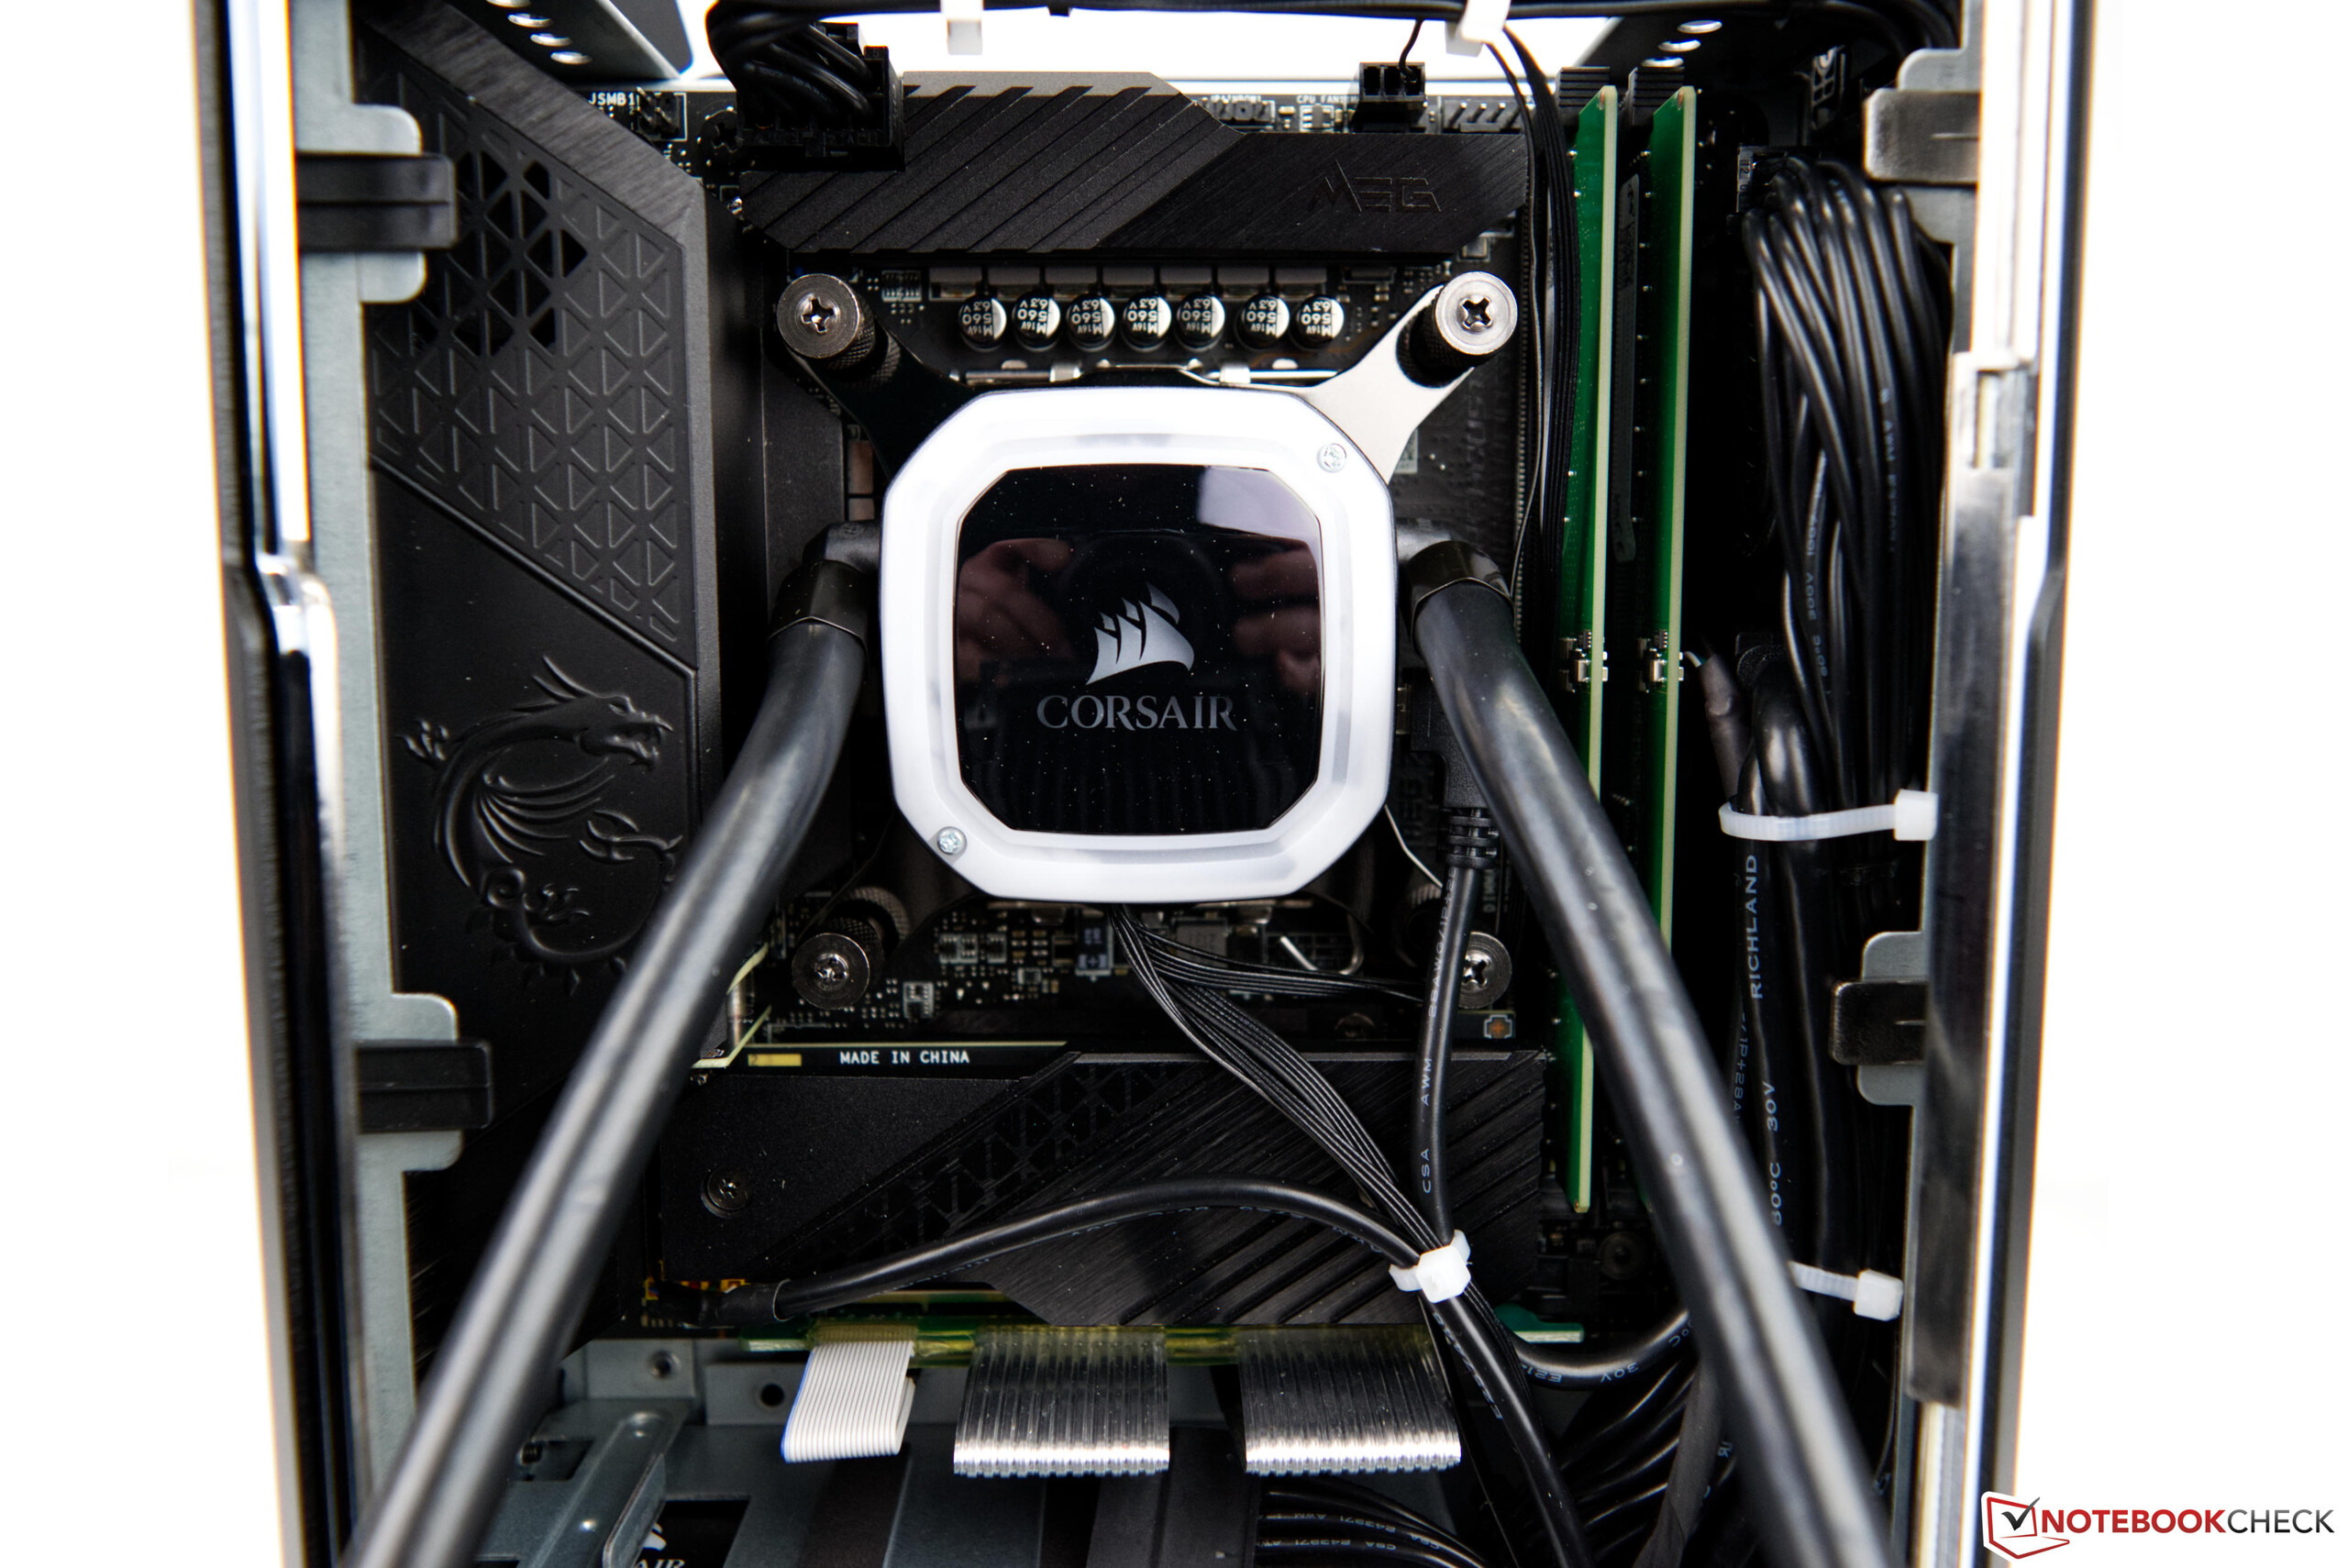
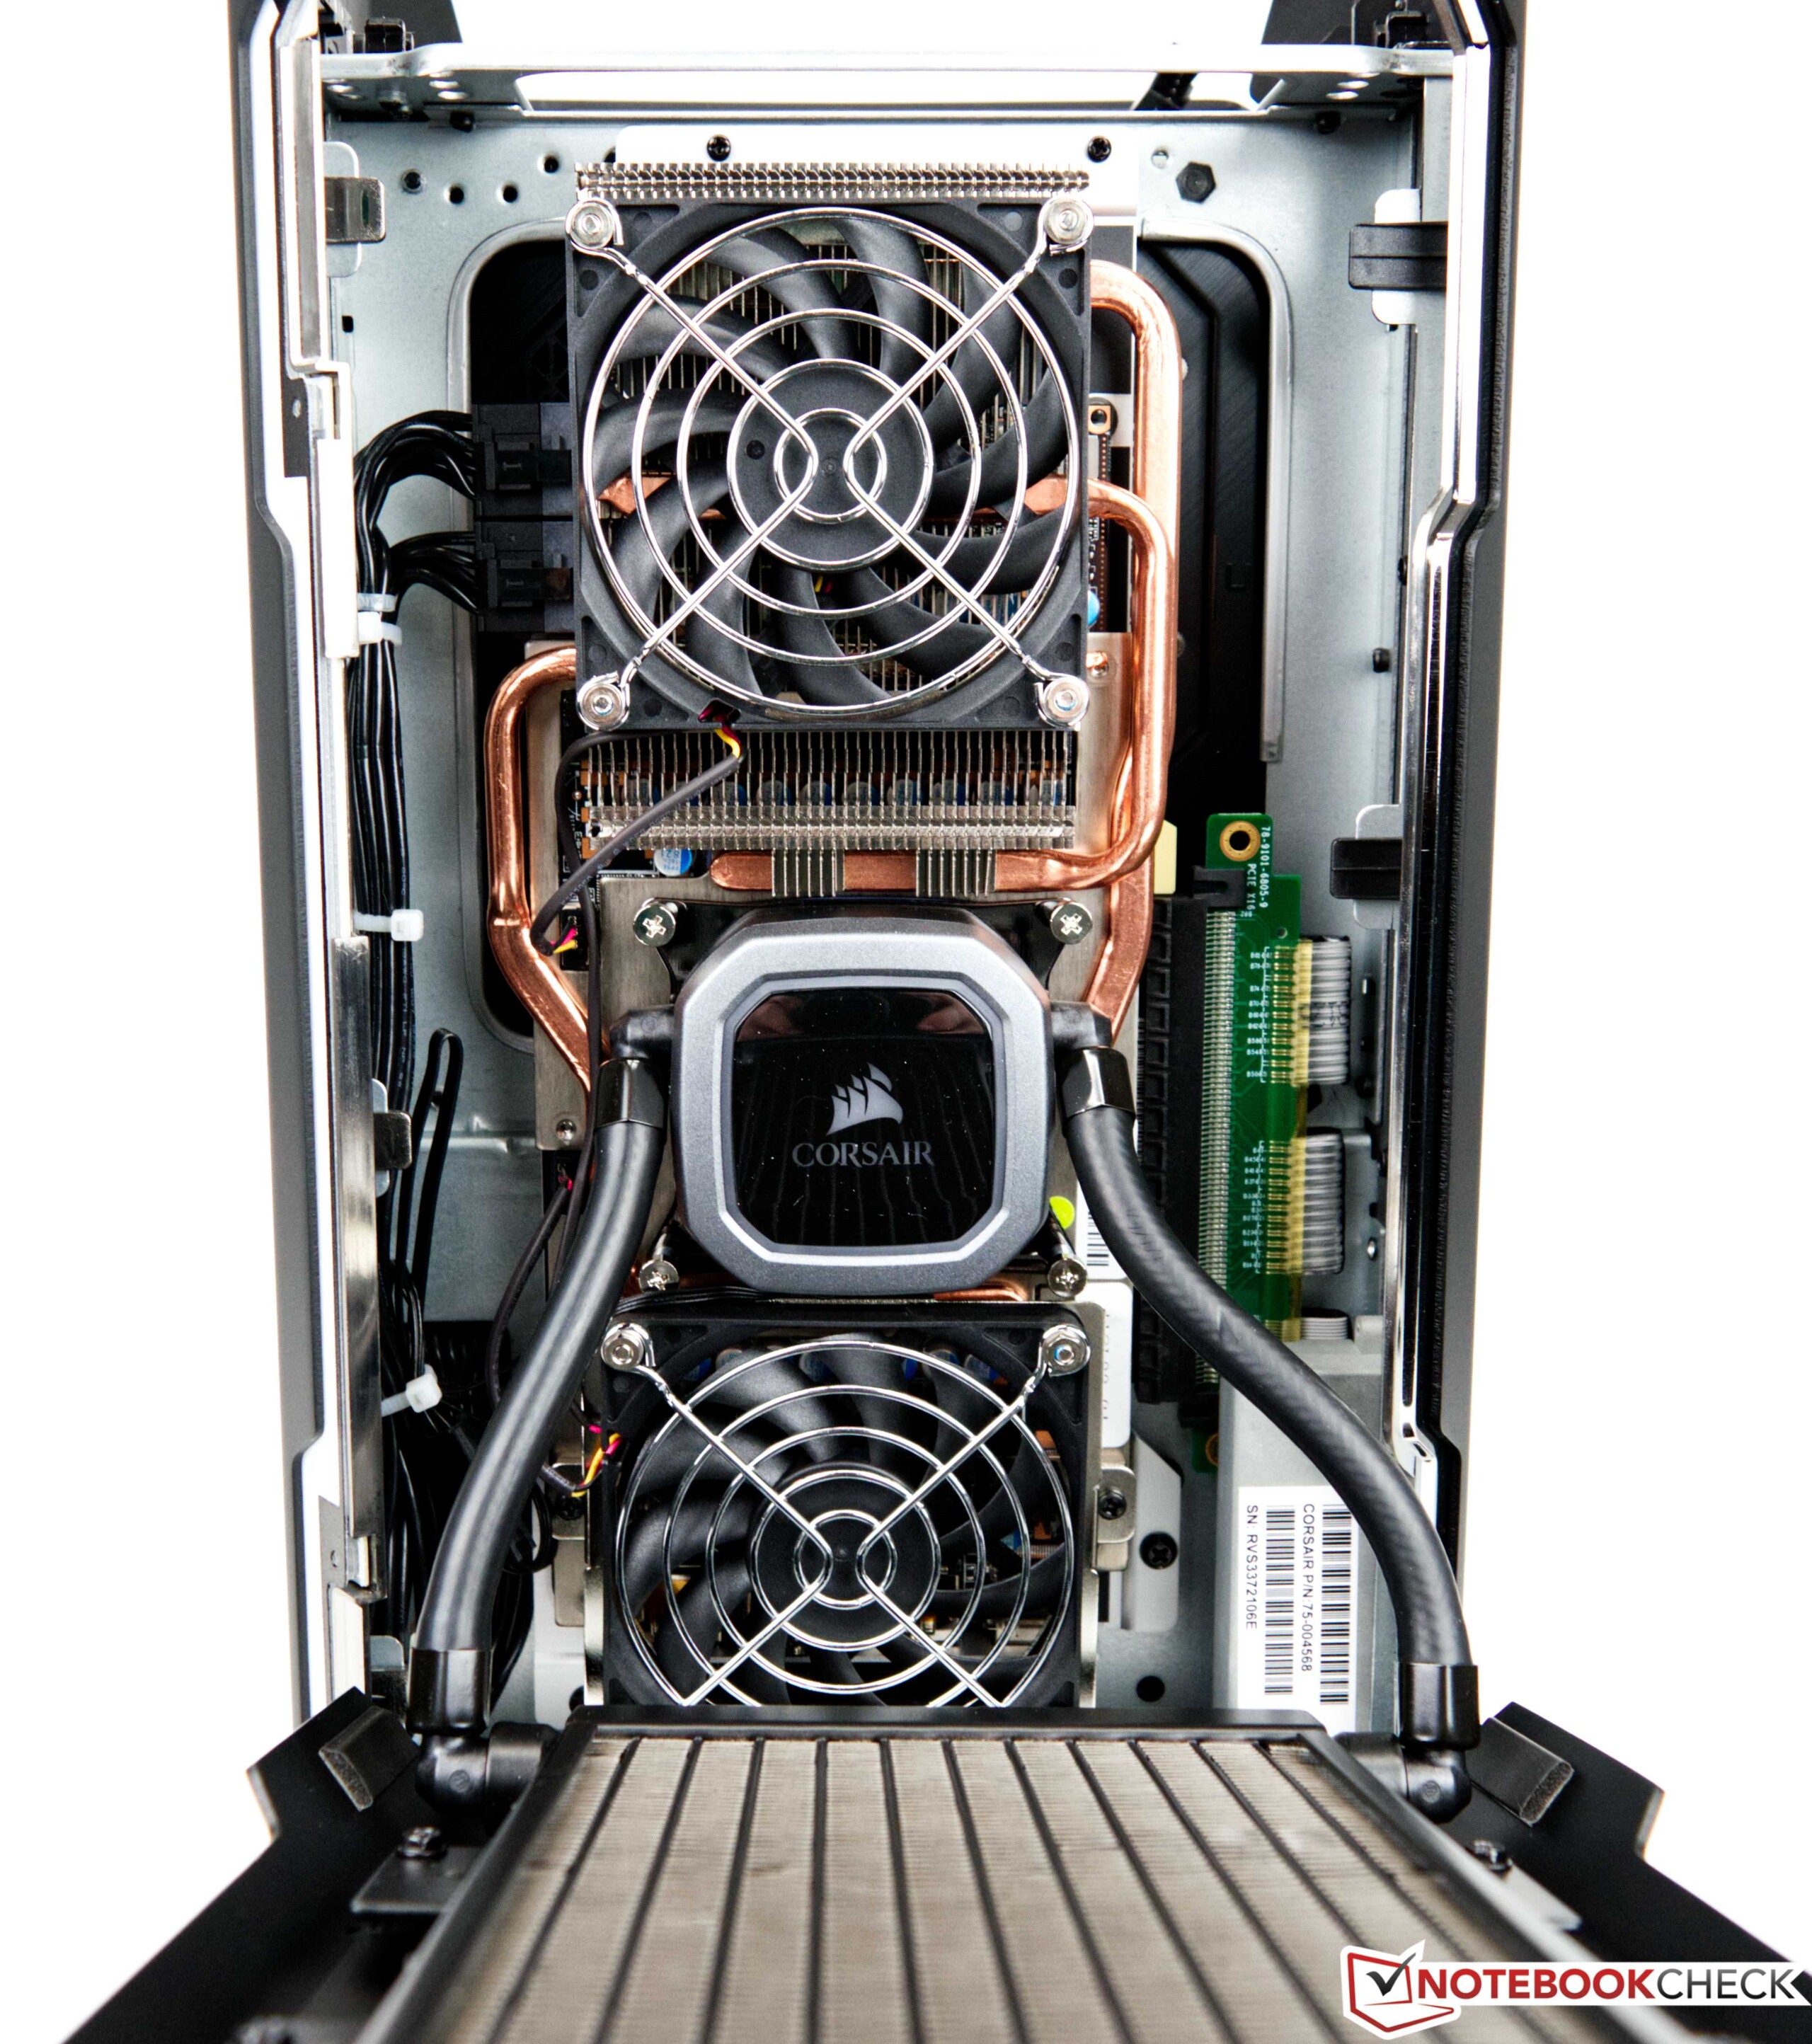
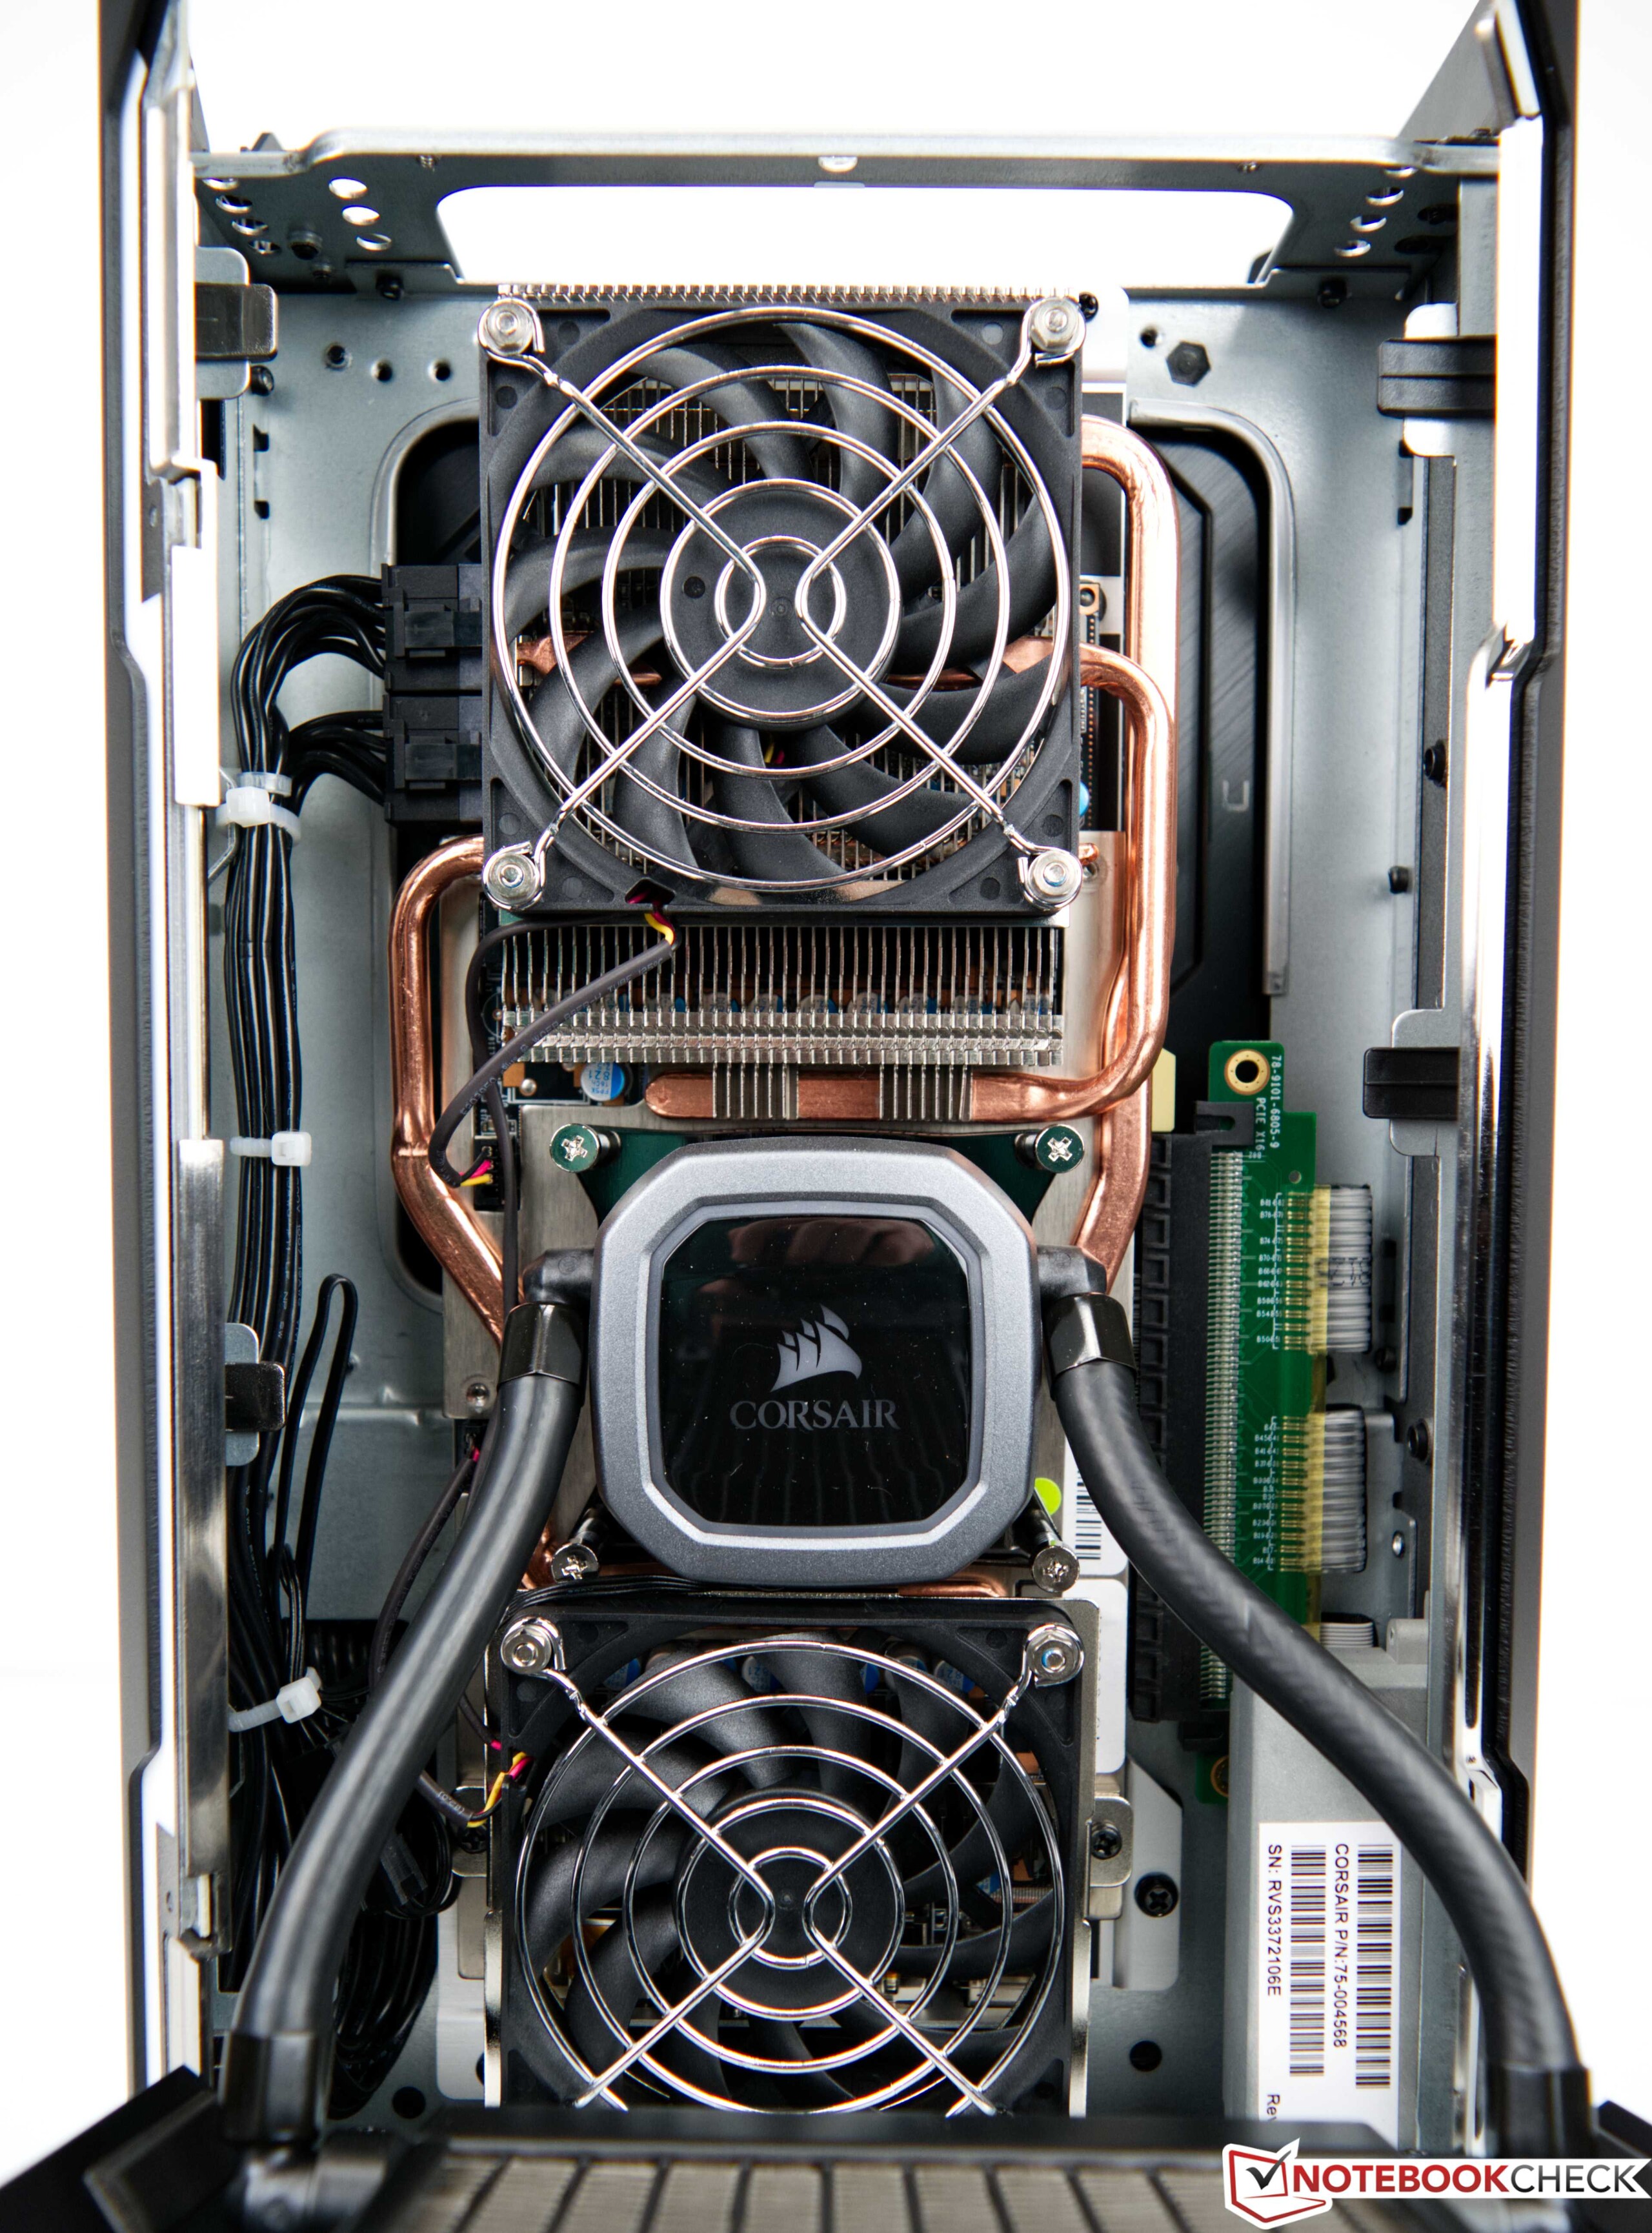
Visuellement, le boîtier du Corsair One i300 peut difficilement être distingué duCorsair One i160en ce qui concerne le choix des matériaux, le fabricant a également gardé le même concept avec toutes les surfaces en métal qui offrent une impression de haute qualité, et pas seulement en termes d'apparence. L'haptique donne également l'impression d'avoir toujours un produit de très haute qualité entre les mains. Le design noir et modeste est marqué par deux barres lumineuses RVB à l'avant, qui peuvent être réglées selon vos préférences à l'aide du logiciel iCUE. La fabrication est de premier ordre et nous n'avons constaté aucun défaut. La conception de l'intérieur offre de l'espace pour deux systèmes indépendants de refroidissement par eau pour le CPU et le GPU.
Malgré sa compacité, le petit PC pèse 7,5 kg sur la balance. On ne s'y attendrait pas à première vue, mais cela confirme également les matériaux utilisés, car dans un si petit boîtier, tout doit être utilisé pour transférer la chaleur créée

Équipement - Le plus récent
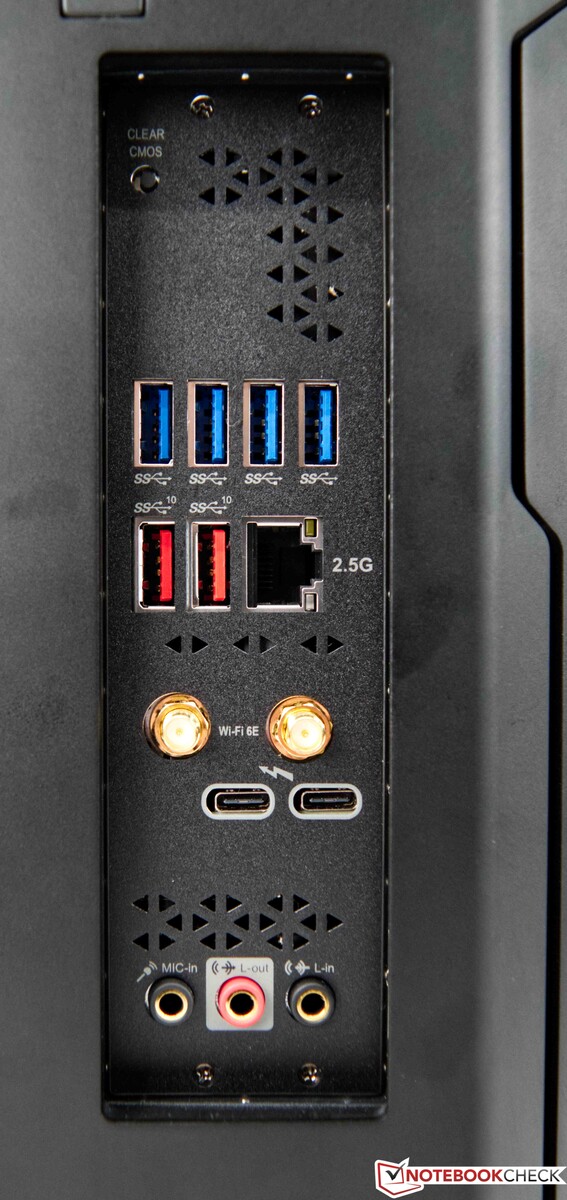
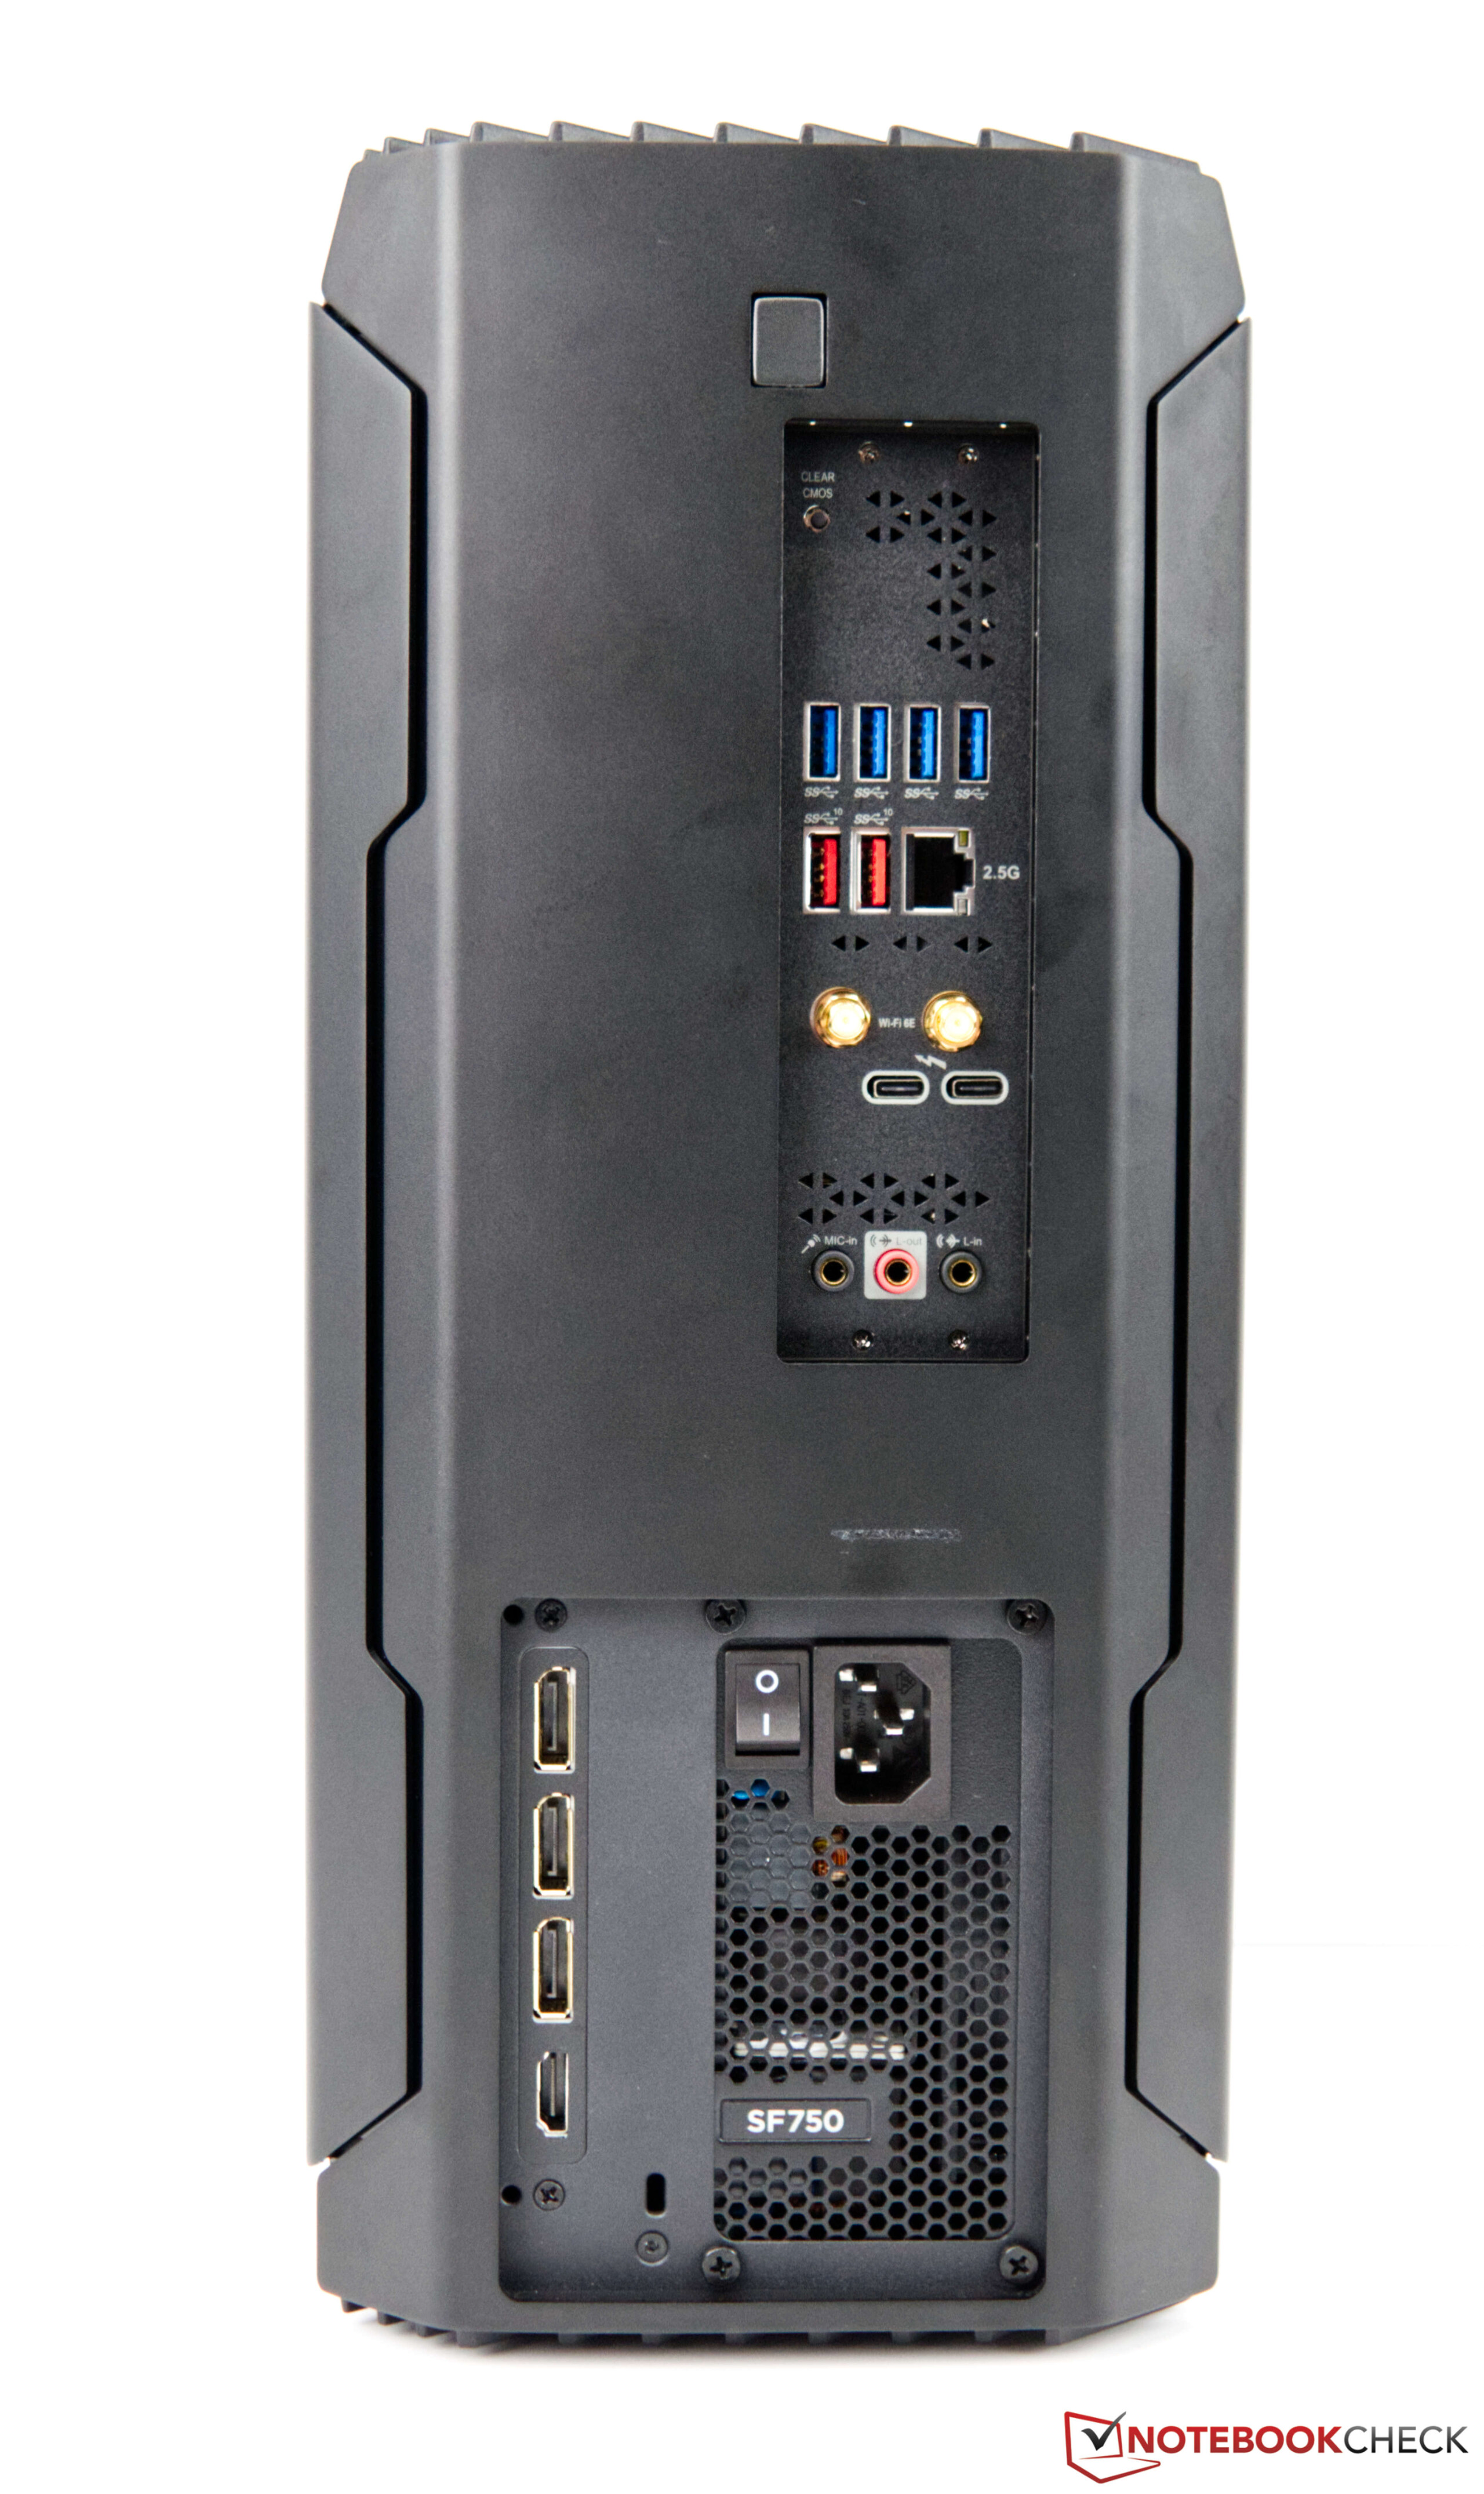
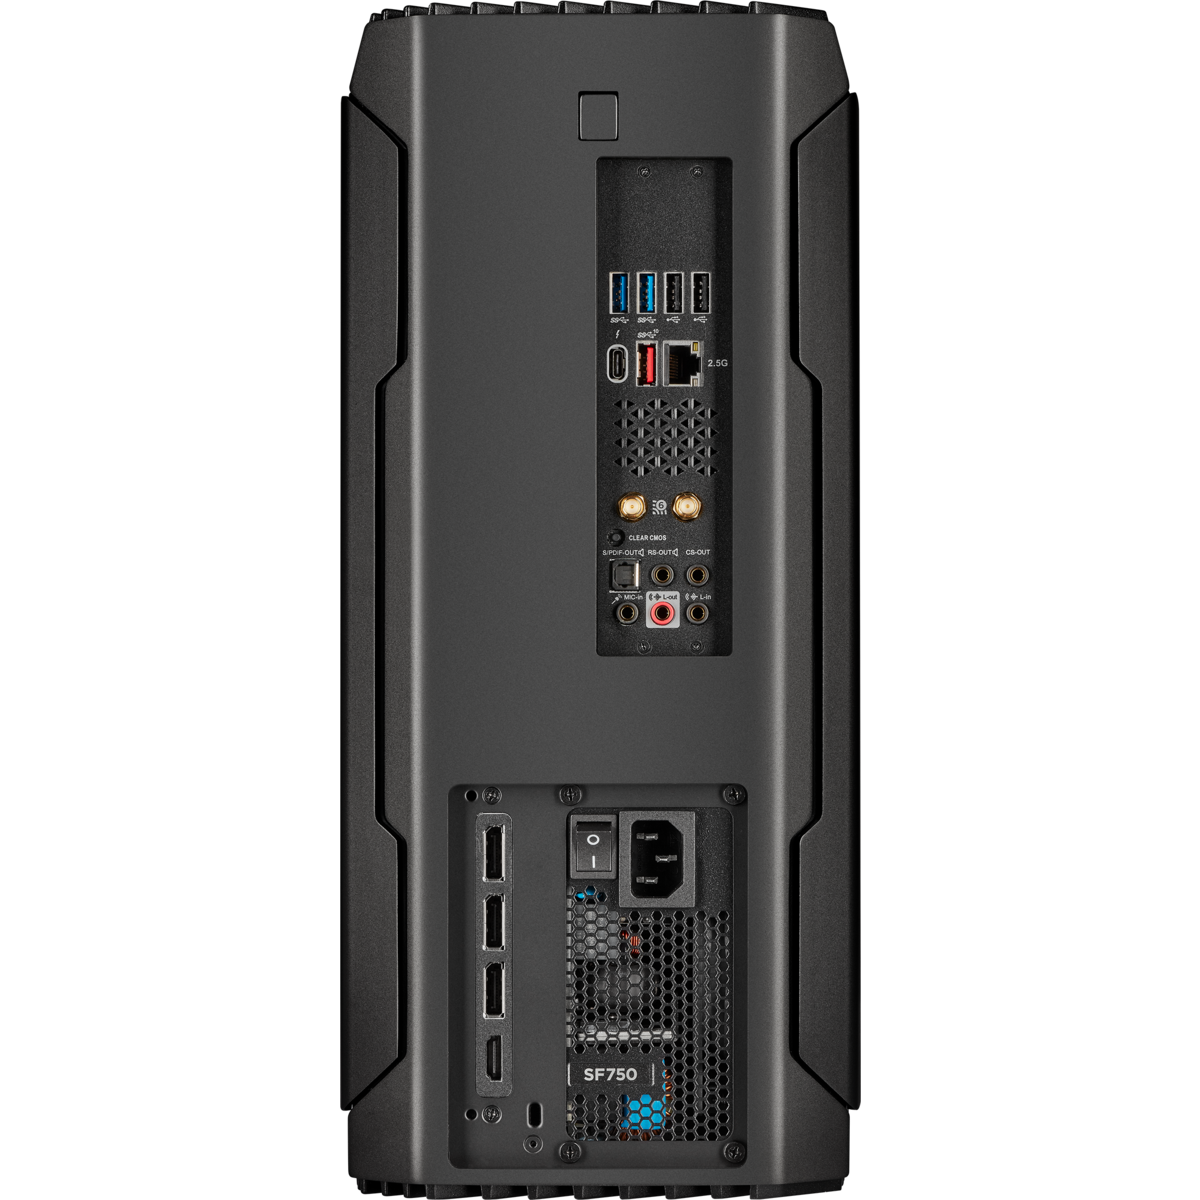
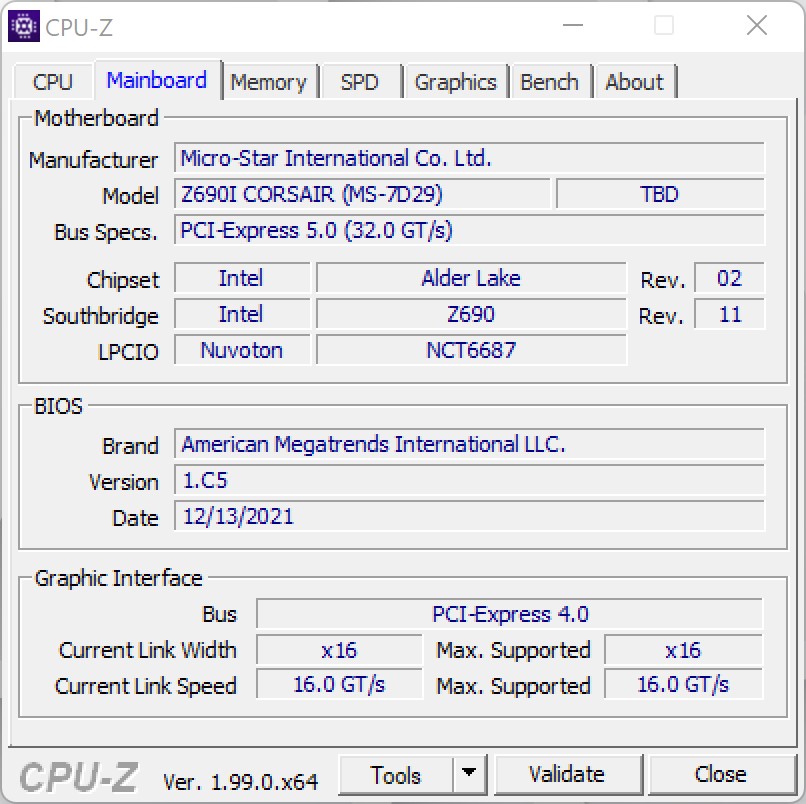
Dans le One i300, Corsair utilise une carte mère Mini-ITX conventionnelle de MSI. Pour être exact, Corsair utilise la MSI MEG Z690I Unify dans notre unité de test. Avec cela, le PC de bureau est également bien équipé en connexions externes. Il y a un total de 8 ports USB à l'arrière, dont deux prennent également en charge Thunderbolt 4. L'avant abrite 3 ports USB supplémentaires. La Nvidia GeForce RTX 3080 Ti elle-même ajoute également 3x DisplayPort et une connexion HDMI.
En ce qui concerne les connexions réseau, l'utilisateur peut choisir entre le WLAN à la norme la plus récente et Ethernet (2,5G).
Communication
Le module Intel Wi-Fi 6E AX211 intégré à la carte mère est le plus récent disponible, vous pouvez donc également utiliser les réseaux Wi-Fi 6G. En utilisant notre routeur de test actuel, qui supporte également la norme la plus récente, le Corsair One i300 fournit des taux de transfert rapides et stables dans notre test WLAN.
Remarque : Comme notre unité de test nous a malheureusement été envoyée sans les antennes WLAN d'origine, nous avons effectué ce test en utilisant des antennes alternatives. Nous sommes actuellement incapables de dire si les taux de transfert sont même légèrement meilleurs en utilisant les antennes d'origine.
| Networking | |
| iperf3 transmit AX12 | |
| Asus ROG Flow Z13 GZ301ZE | |
| Moyenne Intel Wi-Fi 6E AX211 (1003 - 1501, n=4) | |
| Huawei MateBook 13s i5 11300H | |
| iperf3 receive AX12 | |
| Moyenne Intel Wi-Fi 6E AX211 (1178 - 1623, n=4) | |
| Asus ROG Flow Z13 GZ301ZE | |
| Huawei MateBook 13s i5 11300H | |
| iperf3 receive AXE11000 | |
| MSI Stealth GS66 12UGS | |
| Moyenne Intel Wi-Fi 6E AX211 (582 - 1890, n=276) | |
| Corsair One i300 | |
| Moyenne de la classe Desktop (n=12 dernières années) | |
| iperf3 transmit AXE11000 | |
| Corsair One i300 | |
| Moyenne Intel Wi-Fi 6E AX211 (64 - 1921, n=276) | |
| Moyenne de la classe Desktop (n=12 dernières années) | |
Maintenance
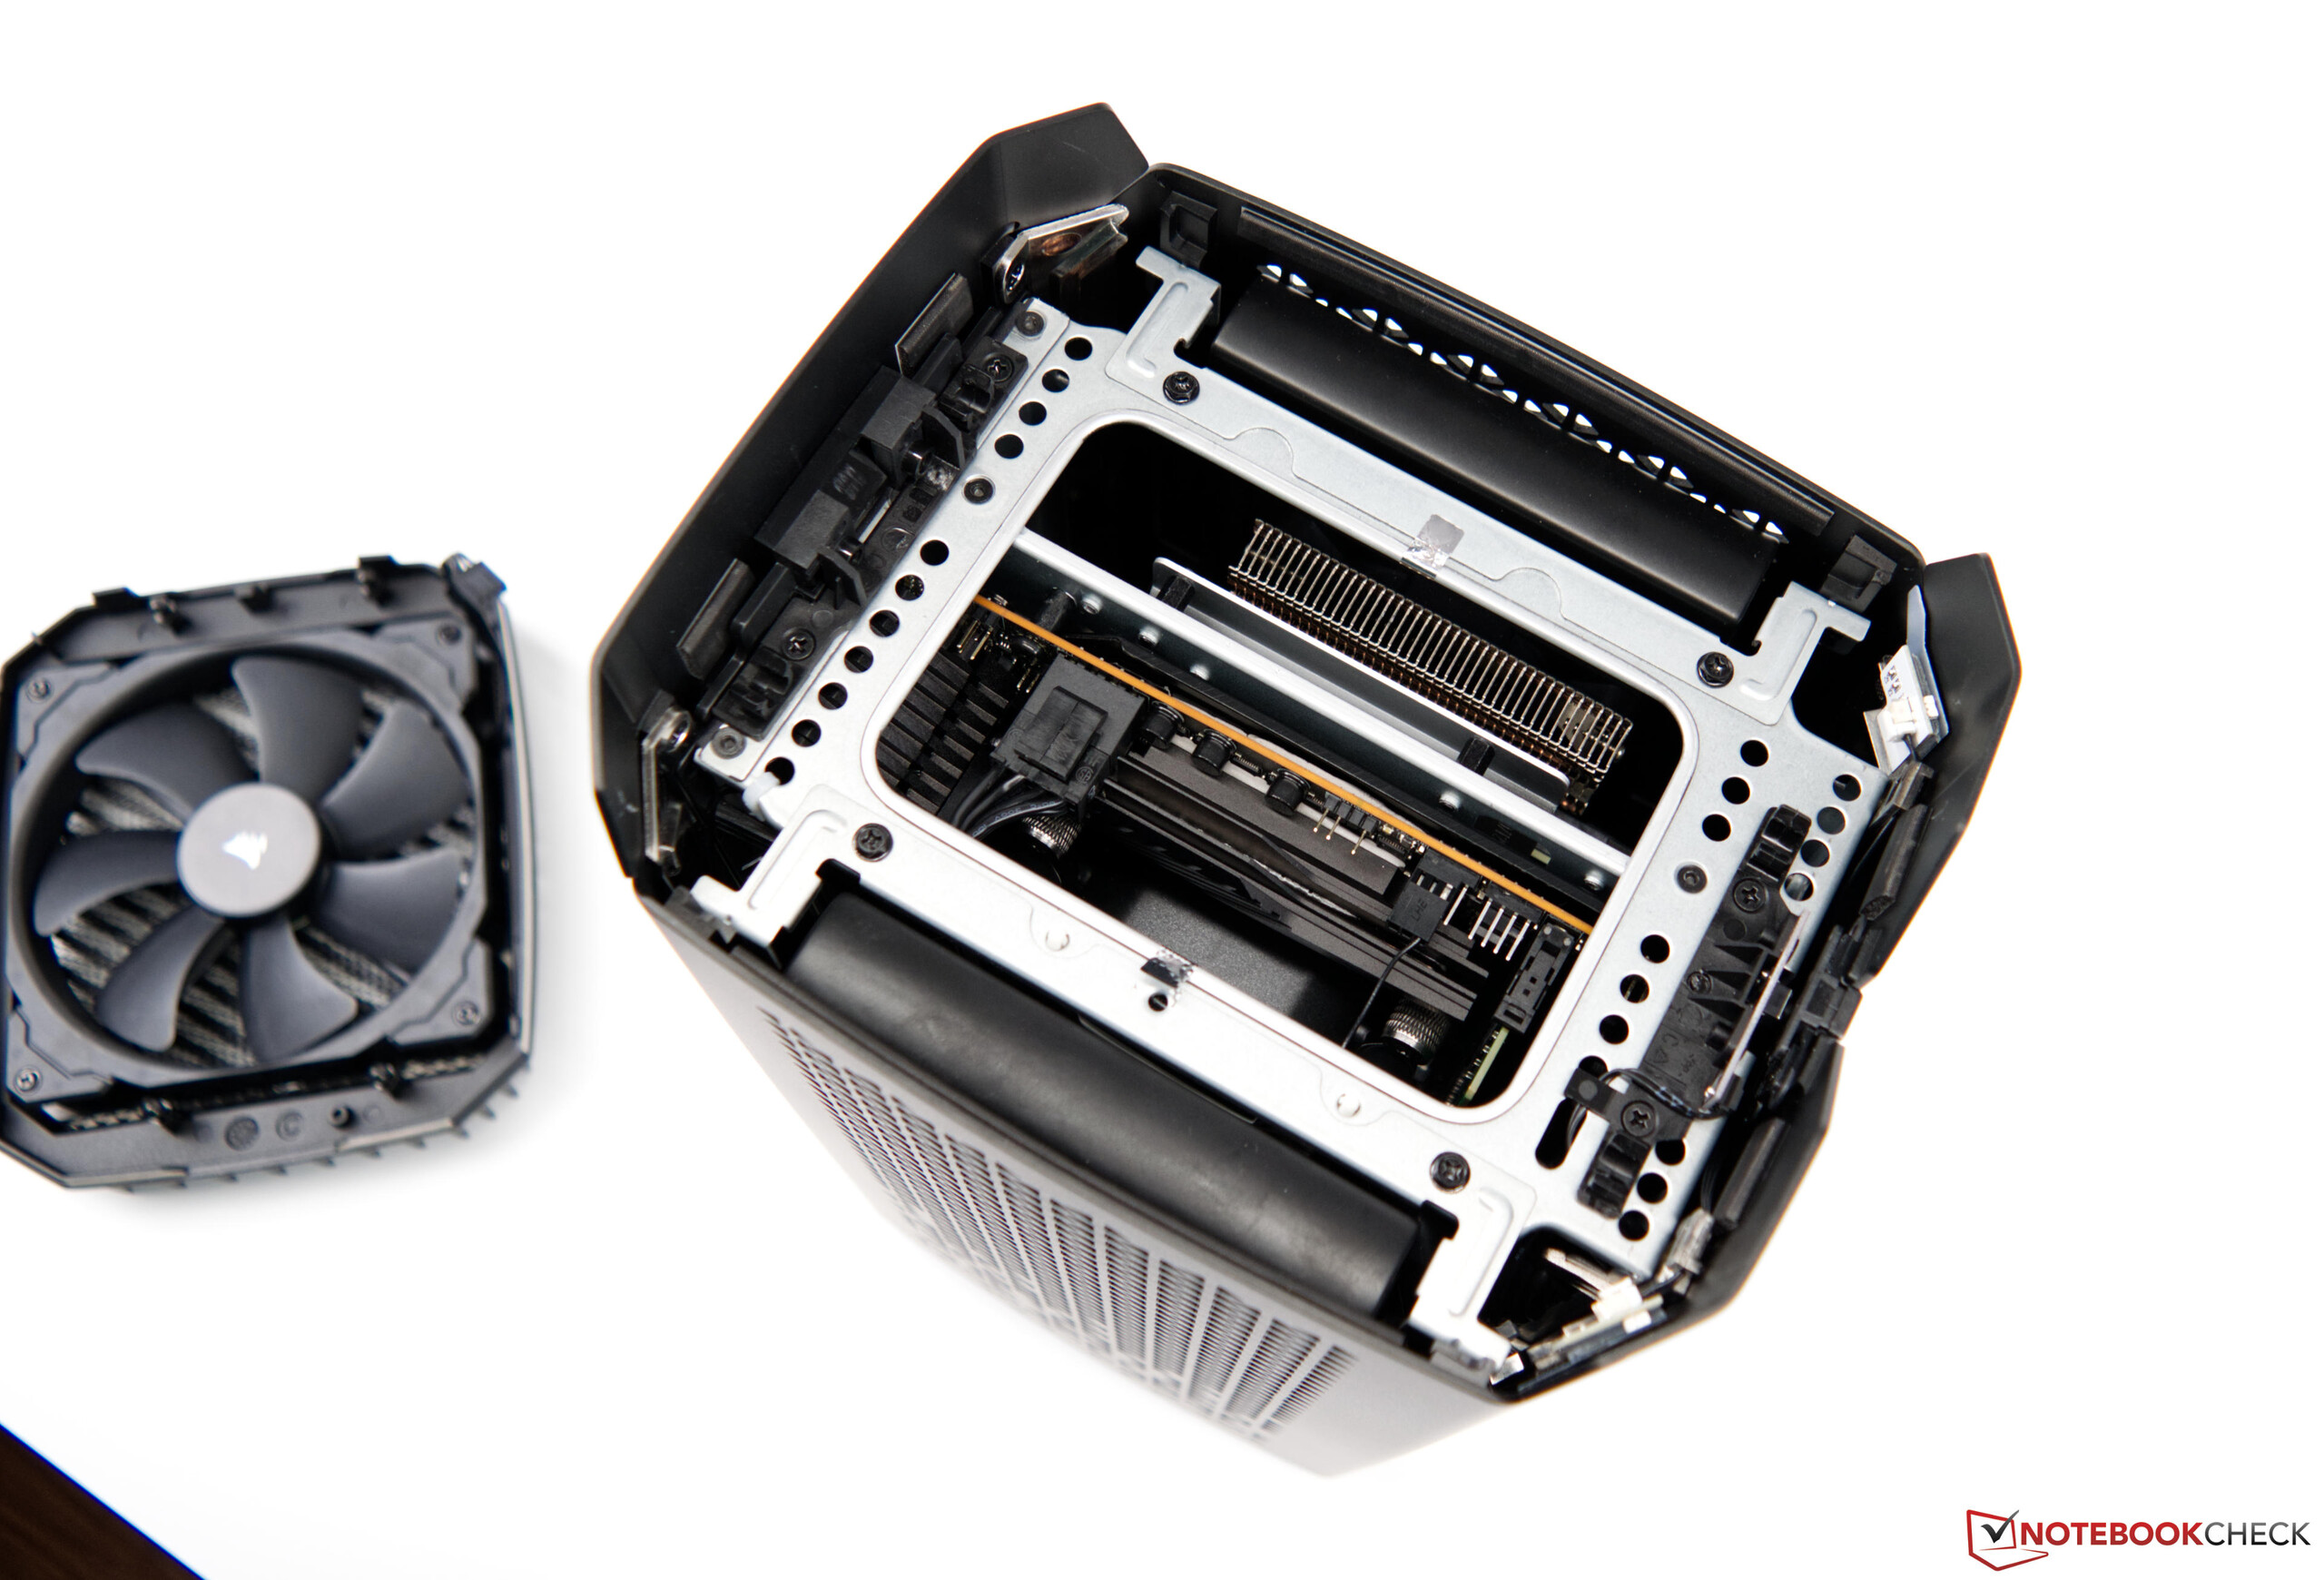
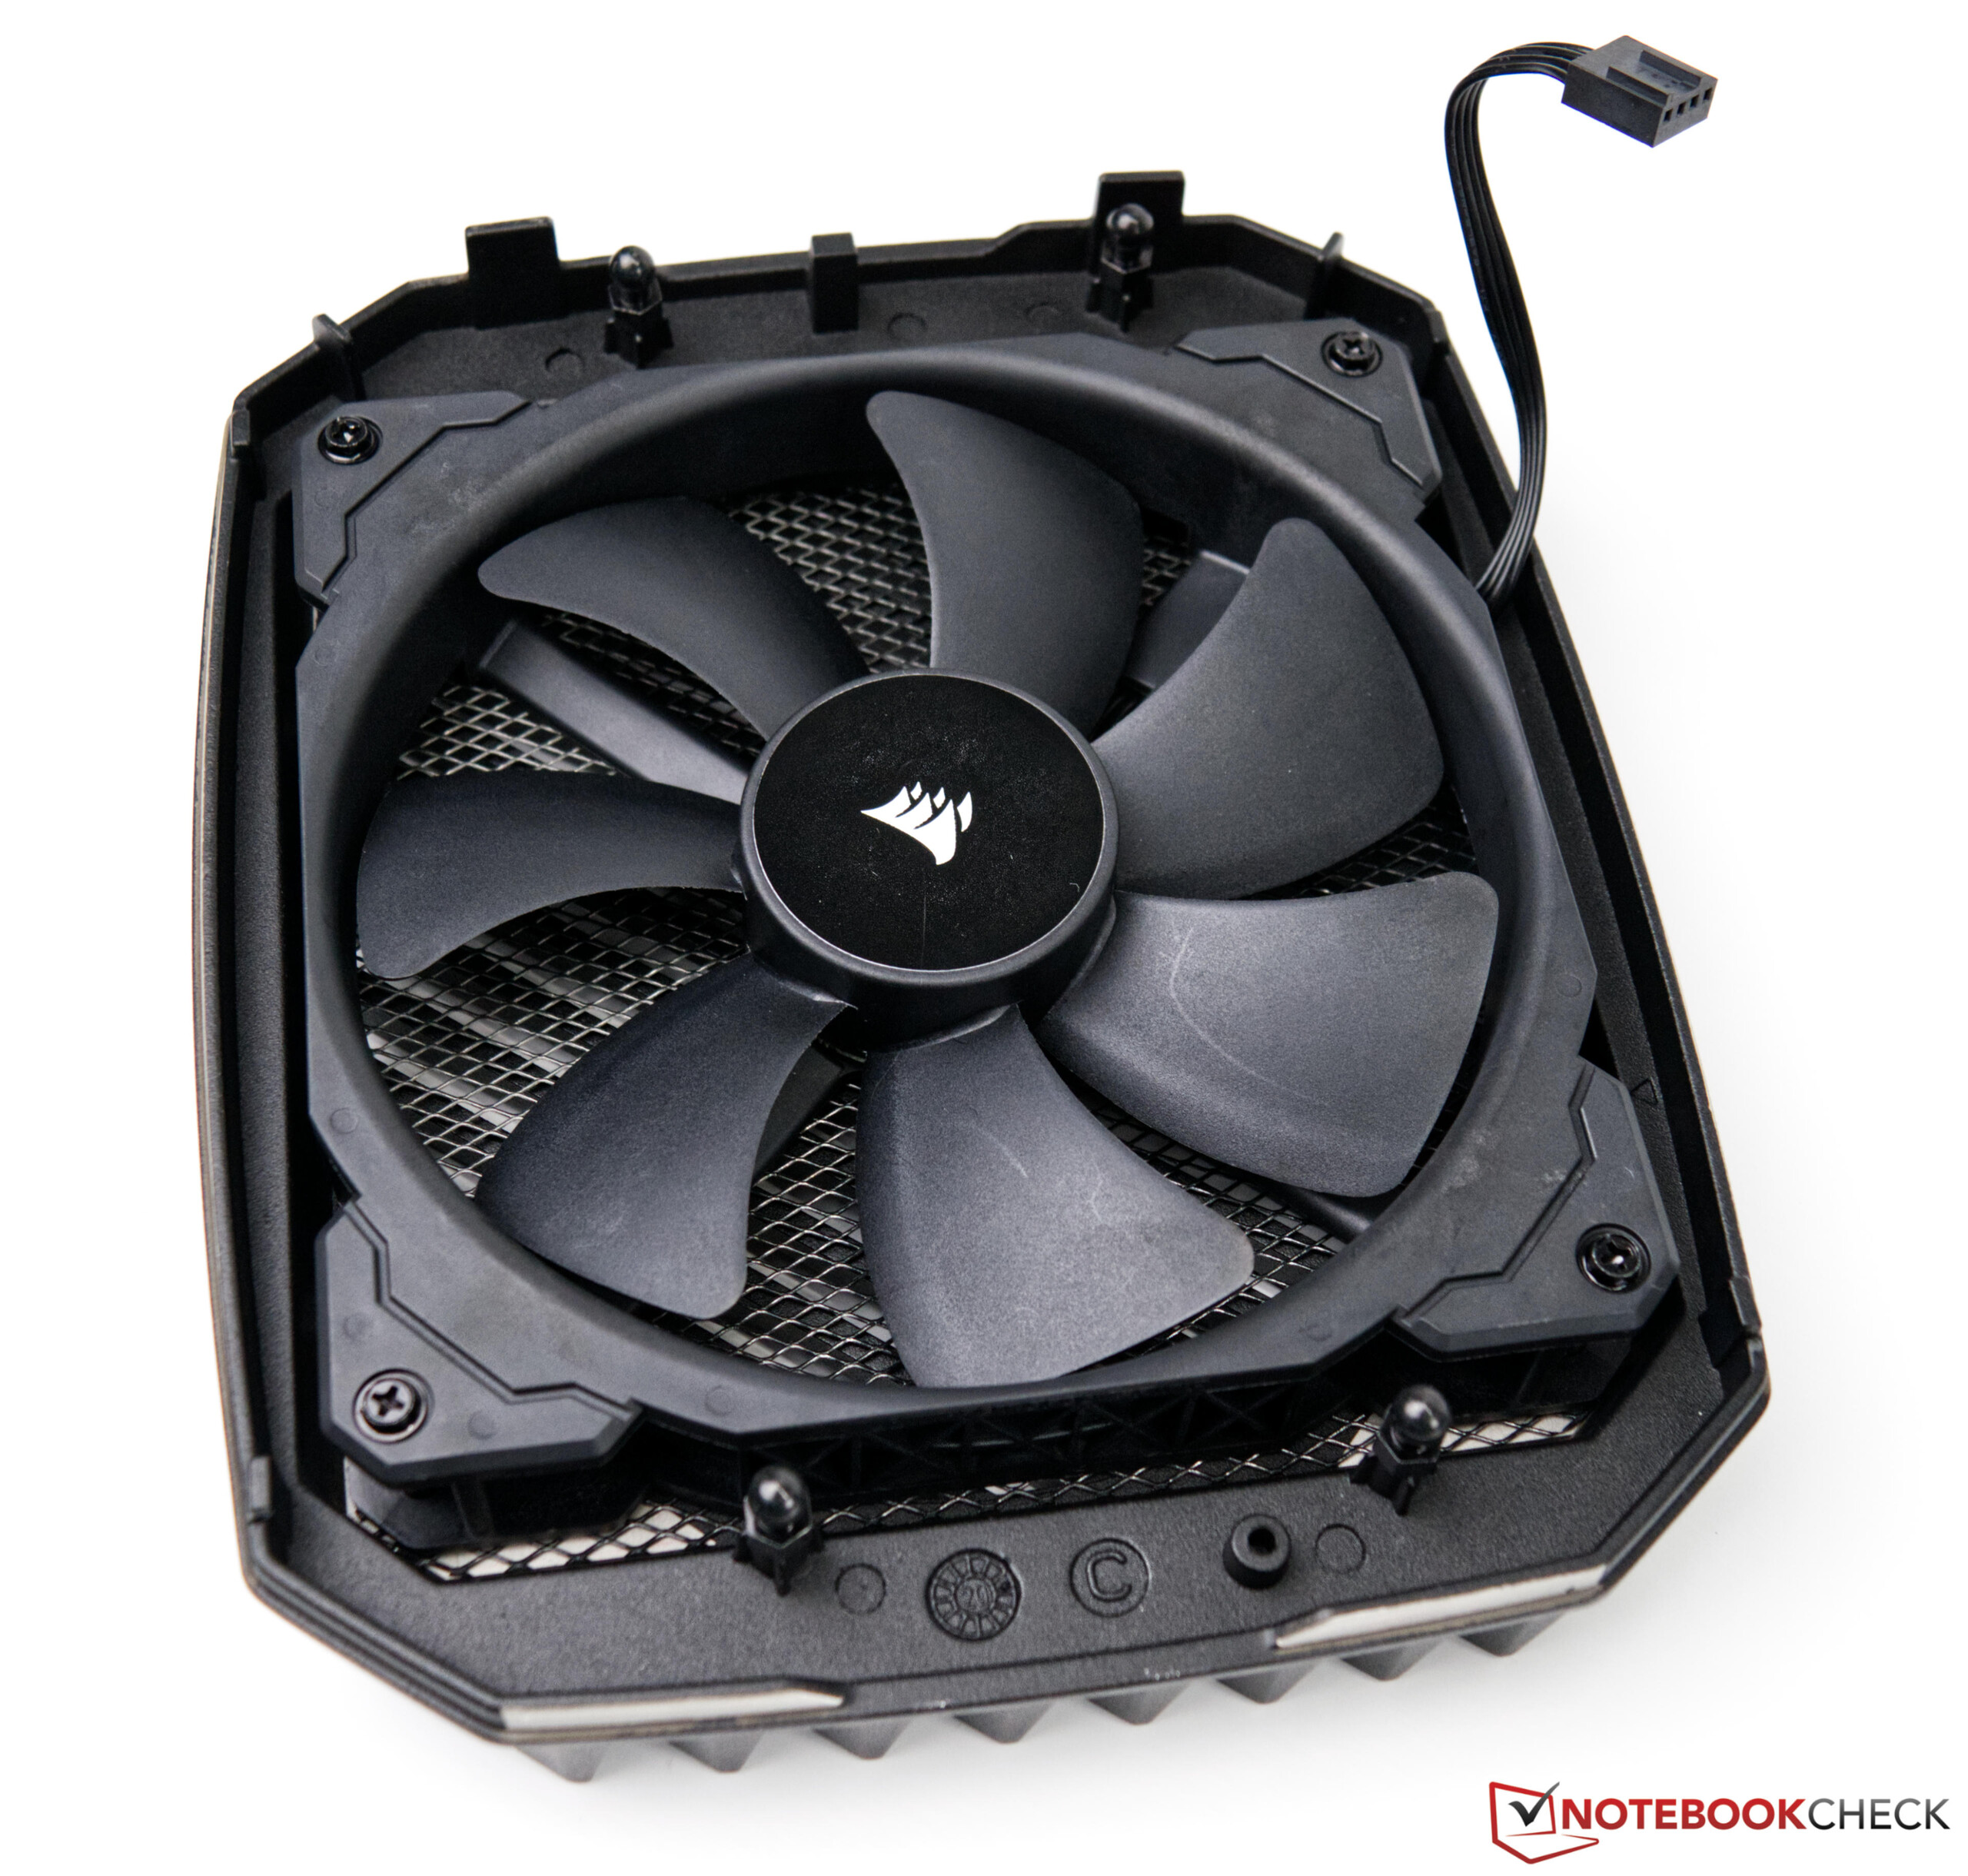
Si les performances du Corsair One i300 sont insuffisantes ou si la solution de stockage s'avère trop petite, vous pouvez également mettre l'ordinateur à niveau. Toutefois, vous devez faire attention, car l'espace intérieur est très limité. L'ordinateur de bureau peut être ouvert facilement. Le couvercle supérieur du boîtier avec le ventilateur de 140 mm est rapidement retiré et les couvercles latéraux ne sont fixés que par deux vis. Mais les tuyaux des AiOs empêcheront un remplacement rapide des composants. Si l'on peut encore accéder assez facilement à la mémoire de travail, les choses semblent plus difficiles si l'on veut accéder à la solution de stockage. Pour cette raison, nous aurions aimé avoir une autre option dans les configurations disponibles, puisqu'il y a un total de trois emplacements M.2 sur la carte mère. Cependant, le système est déjà bien équipé avec 2 To de stockage.
Performance
Si l'on considère uniquement les composants utilisés, le Corsair One i300 offre des processeurs très rapides pour le jeu avec le Intel Core i9-12900Ket leNvidia GeForce RTX 3080 Ti. Actuellement, la GeForce RTX 3080 Ti est la deuxième carte graphique la plus rapide de Nvidia, ne restant que quelques points de pourcentage derrière la GeForce RTX 3090. Bien que cette dernière aurait également pu entrer dans le boîtier si l'on ne considère que la taille physique, le refroidissement des puces VRAM a probablement conduit Corsair à n'utiliser "que" une GeForce RTX 3080 Ti. Le modèle un peu plus faible du Corsair One i300 est équipé d'une GeForce RTX 3080, ce qui pourrait être le choix le plus raisonnable en raison de son prix d'achat inférieur.
Processeur
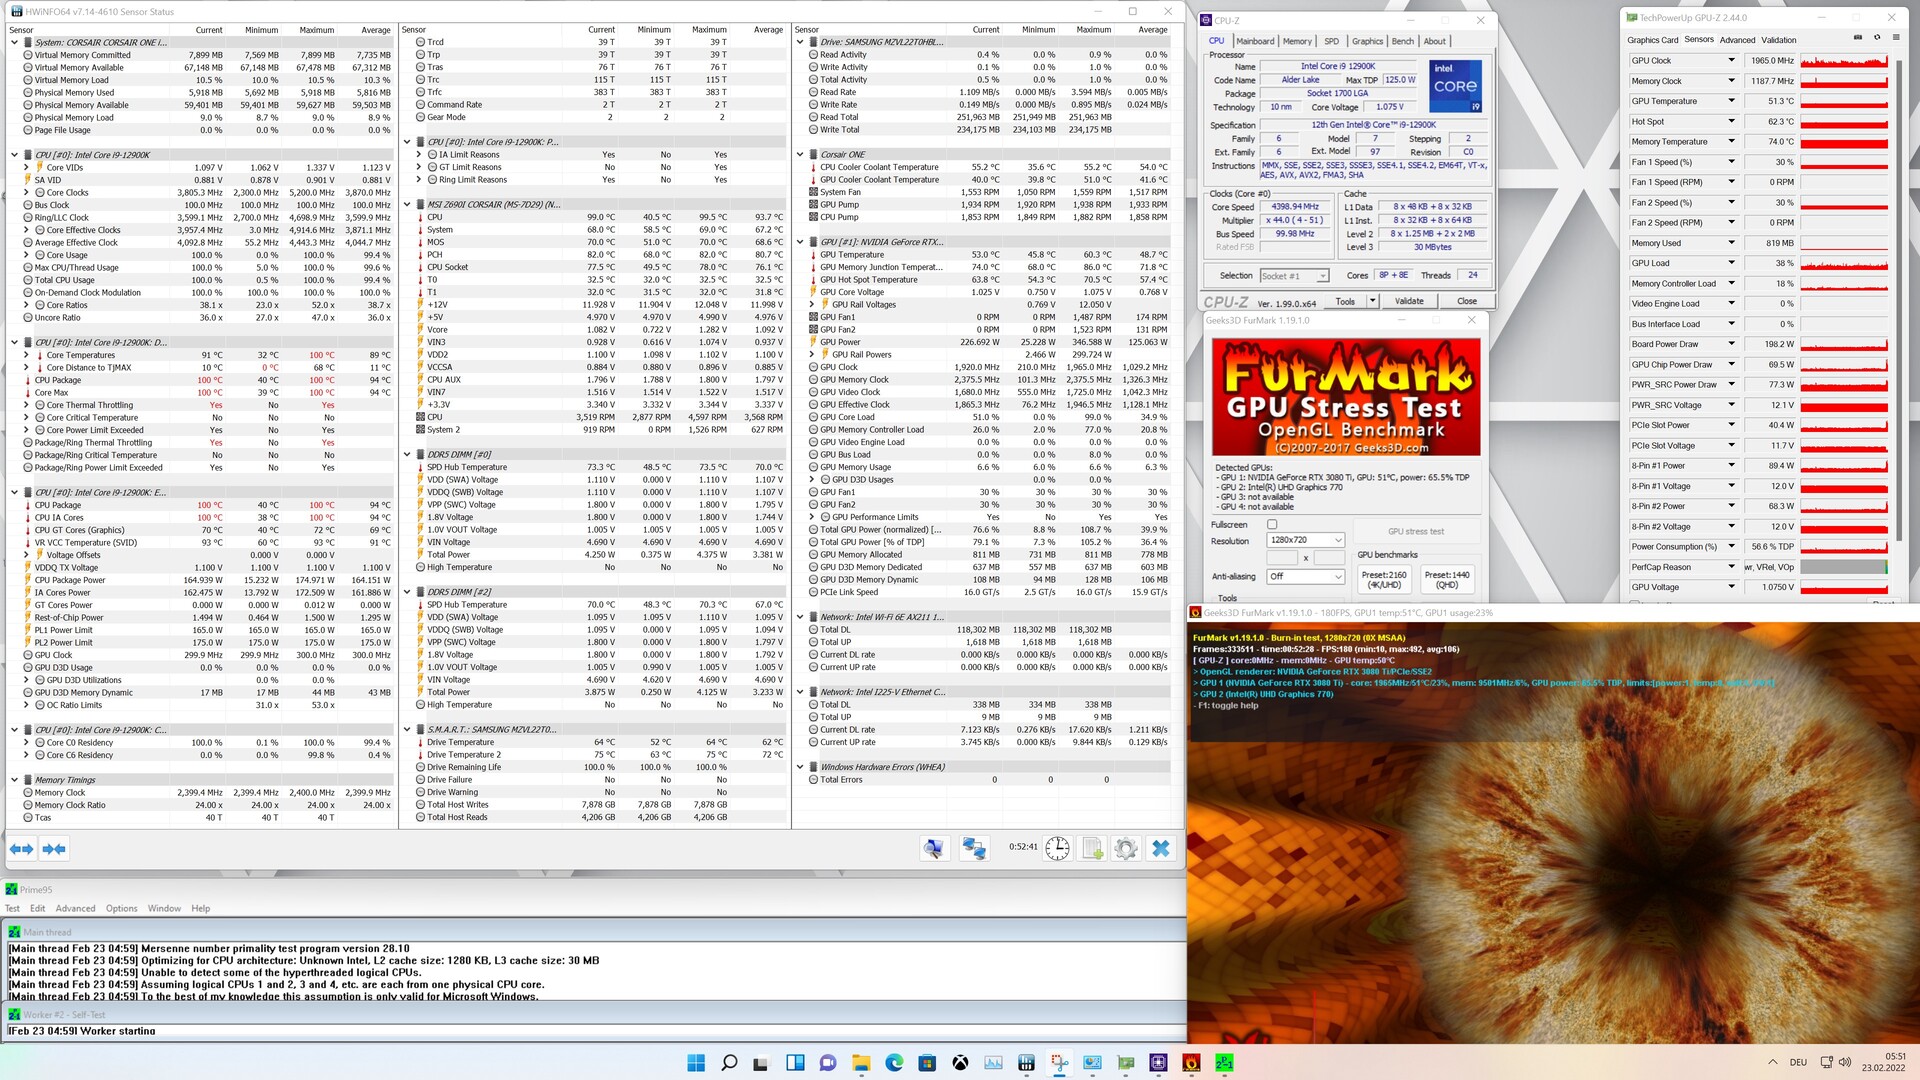
Le Corsair One i300 est équipé du processeur Intel le plus rapide actuellement disponible pour les jeux. Pour être exact, Corsair utilise leIntel Core i9-12900Kbasé sur une carte Z690 de MSI. Nous avons déjà pu voir à l'avance quelles performances peuvent être délivrées par le nouveau fleuron d'Intel. Pour plus de détails concernant le Intel Core i9-12900Knous vous renvoyons à cette page. Cependant, il y a une petite limitation dans le Corsair One i300 en termes de consommation d'énergie maximale. PL1 et aussi PL2 sont limités aux valeurs de 165 et 175 watts respectivement, ce qui signifie que le processeur est légèrement étranglé sous charge. Sans cette limitation, le Intel Core i9-12900Kdevrait être capable de consommer jusqu'à 241 watts. D'autre part, cette option peut être modifiée dans le BIOS. Mais cela se traduirait alors également par un volume sonore plus important et des températures plus élevées.
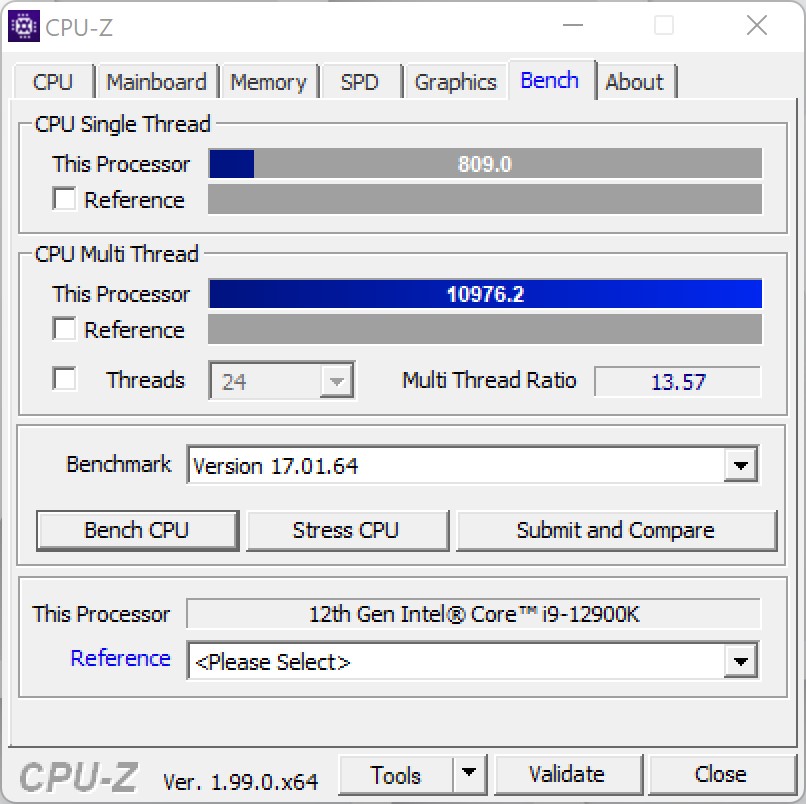
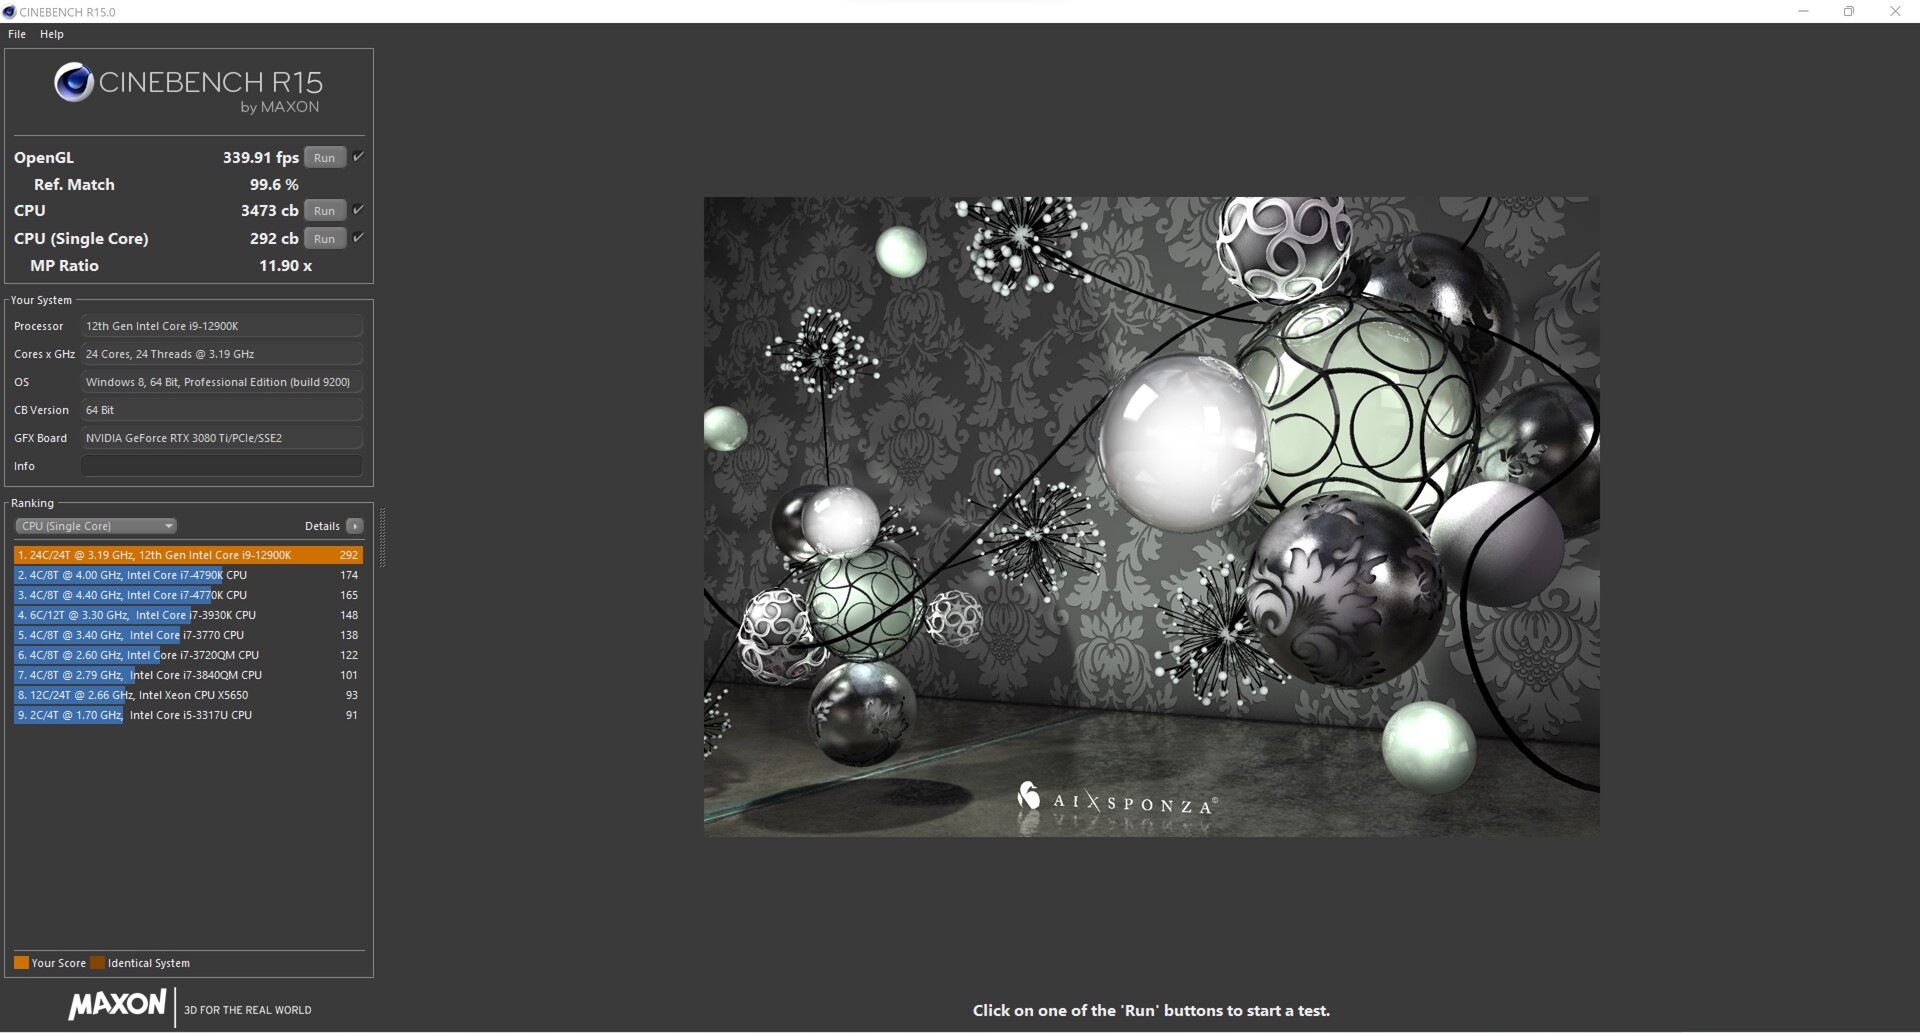
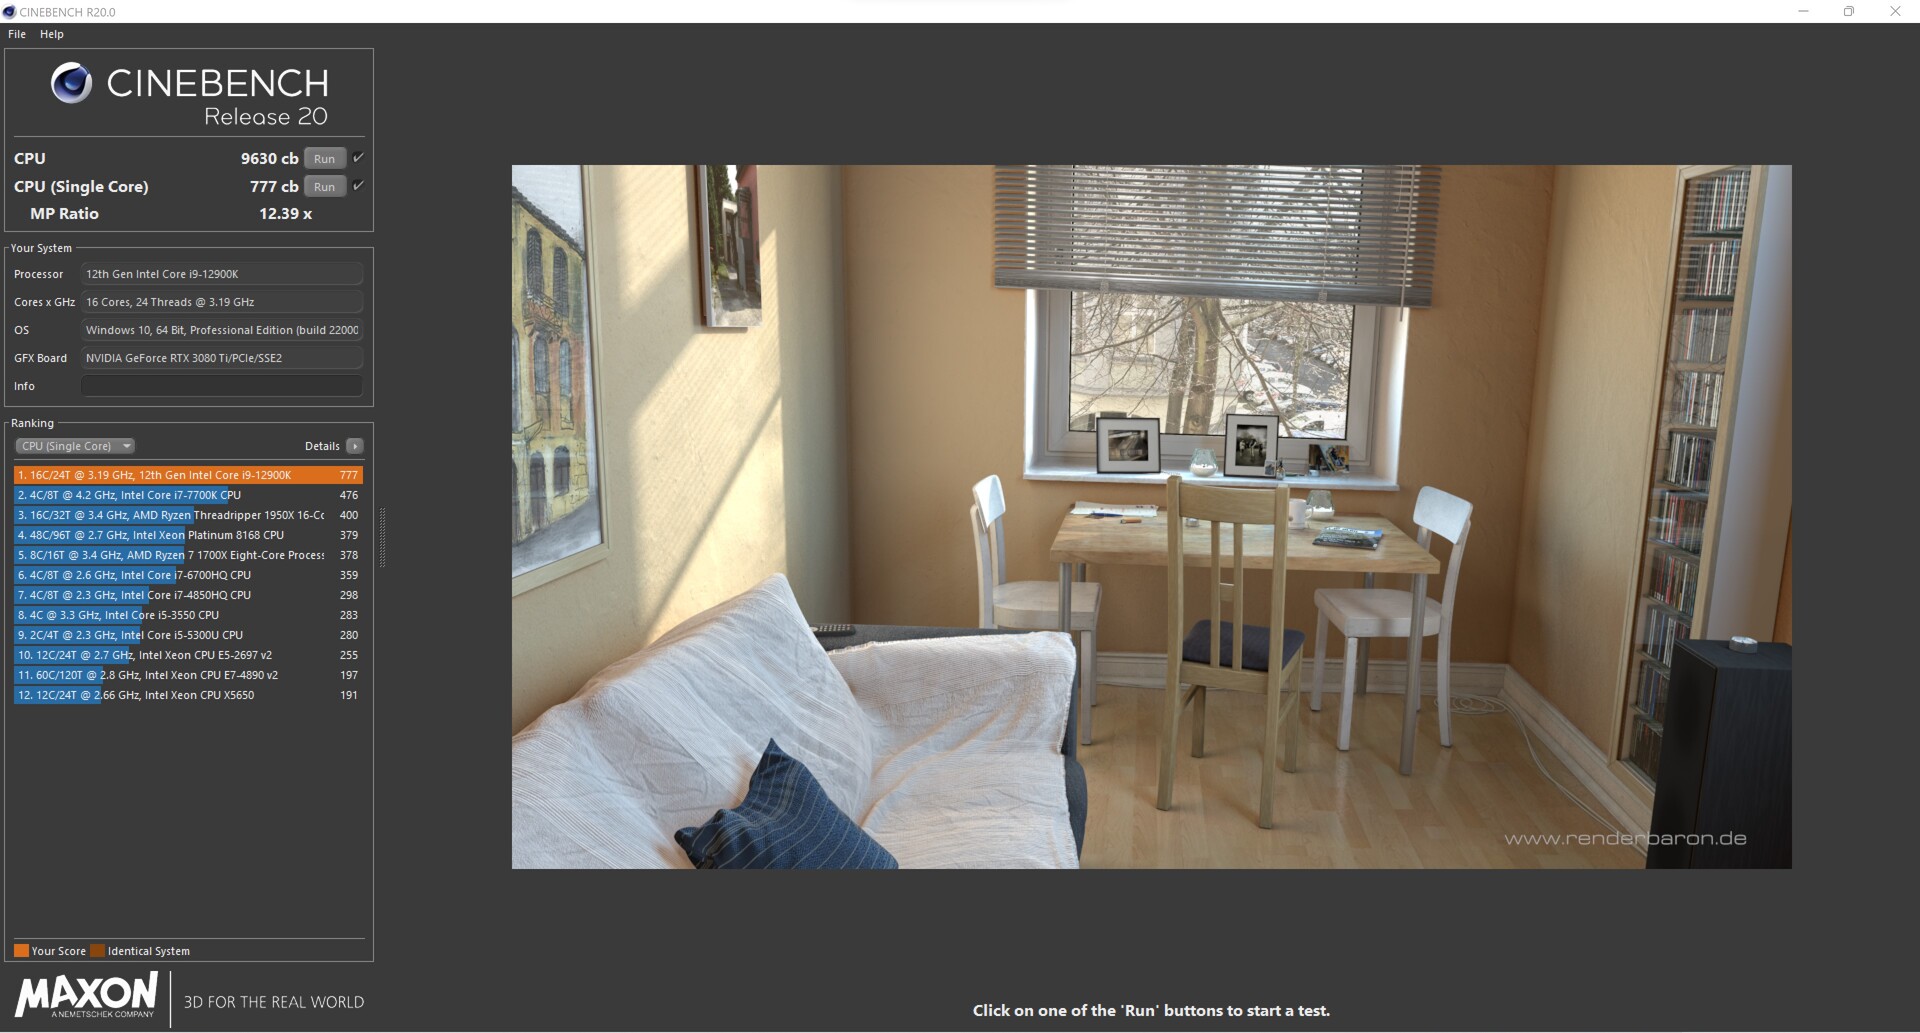
Dans le benchmark que nous réalisons, l'Intel Core i9-12900K s'en sort très bien, même s'il ne peut pas utiliser toutes ses performances en charge. L'augmentation des performances par rapport au Corsair One i160 est immense. Dans le classement général, le système actuel offre 48% de performances en plus.
Pour des comparaisons et des benchmarks supplémentaires, nous vous renvoyons à notre Tableau comparatif des CPU.
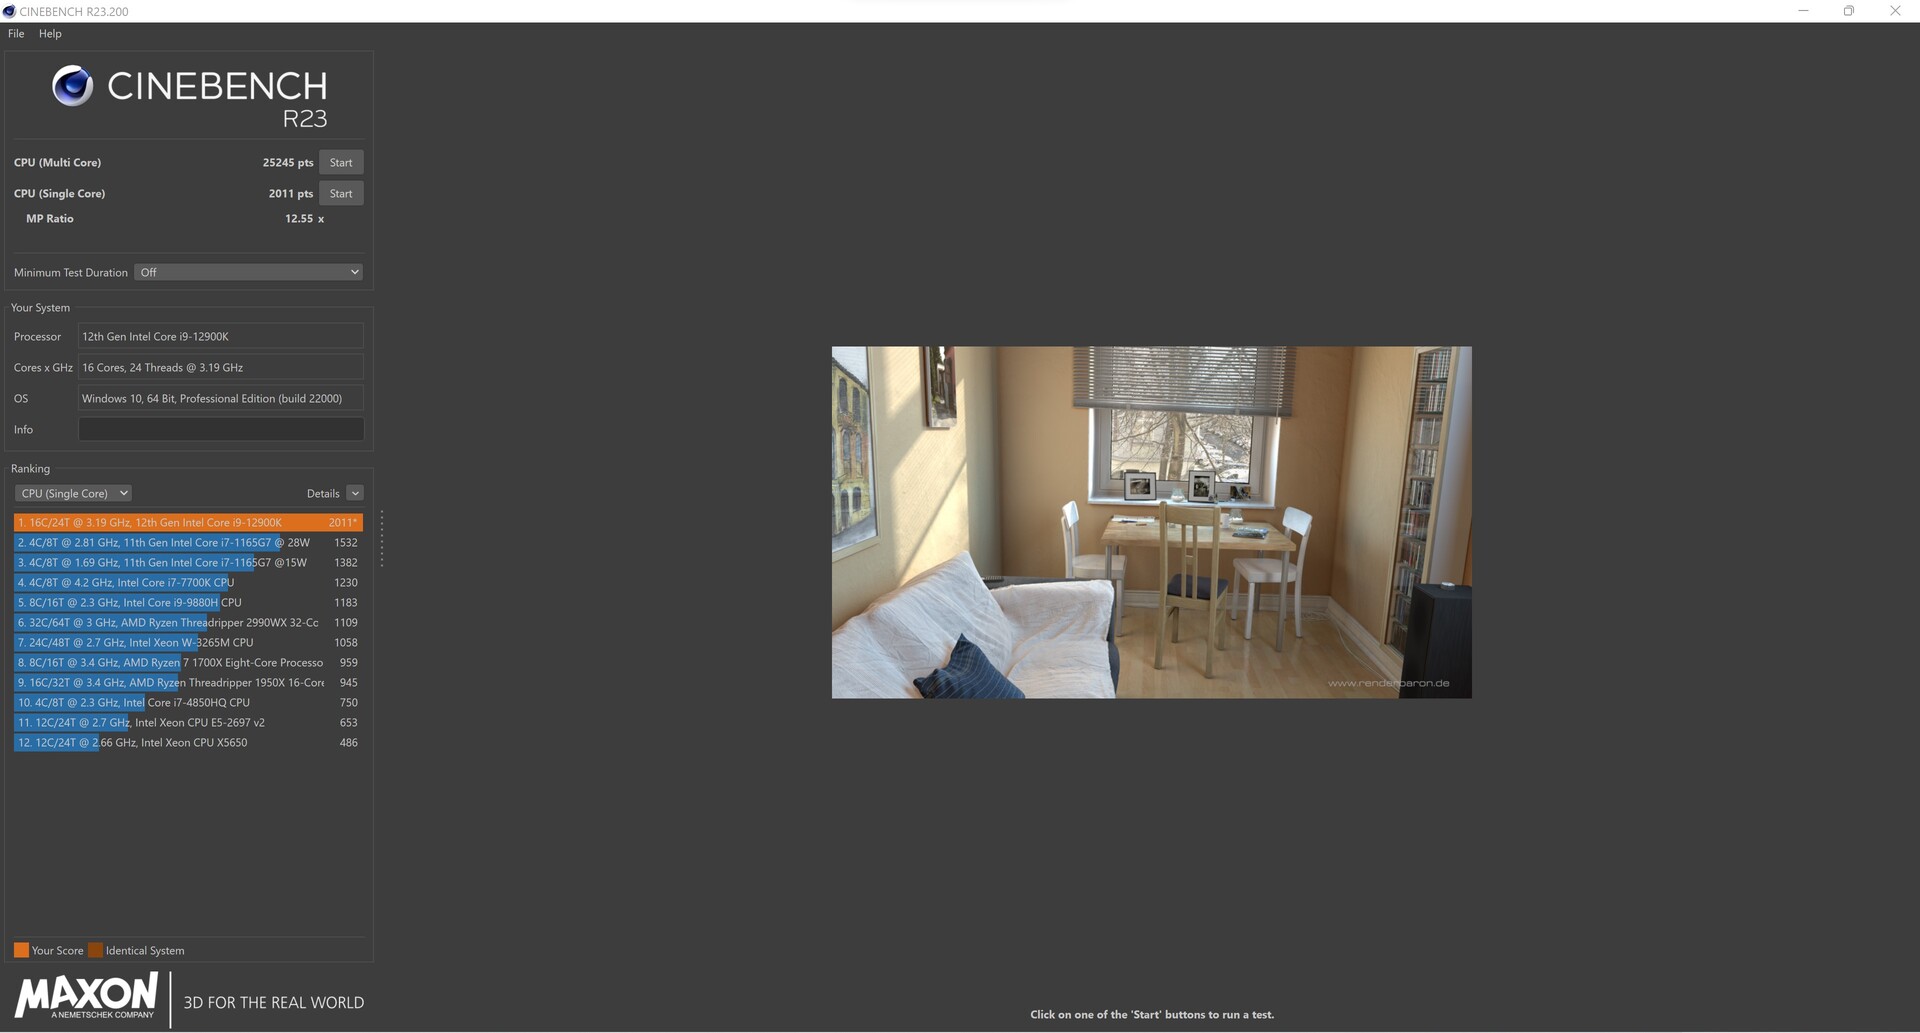
Cinebench R23: Multi Core | Single Core
Cinebench R20: CPU (Multi Core) | CPU (Single Core)
Cinebench R15: CPU Multi 64Bit | CPU Single 64Bit
Blender: v2.79 BMW27 CPU
7-Zip 18.03: 7z b 4 | 7z b 4 -mmt1
Geekbench 5.5: Multi-Core | Single-Core
HWBOT x265 Benchmark v2.2: 4k Preset
LibreOffice : 20 Documents To PDF
R Benchmark 2.5: Overall mean
| CPU Performance rating | |
| Moyenne de la classe Desktop | |
| Intel Core i9-12900K | |
| Moyenne Intel Core i9-12900K | |
| AMD Ryzen 9 5950X | |
| Intel Core i9-12900K | |
| AMD Ryzen 9 5900X | |
| Intel Core i9-11900K | |
| Intel Core i9-10900K | |
| Intel Core i9-9900K -6! | |
| Cinebench R23 / Multi Core | |
| Moyenne de la classe Desktop (16119 - 44253, n=16, 2 dernières années) | |
| AMD Ryzen 9 5950X | |
| Intel Core i9-12900K | |
| Moyenne Intel Core i9-12900K (25245 - 27005, n=2) | |
| Intel Core i9-12900K | |
| AMD Ryzen 9 5900X | |
| Intel Core i9-10900K | |
| Intel Core i9-11900K | |
| Cinebench R23 / Single Core | |
| Moyenne de la classe Desktop (1722 - 2439, n=16, 2 dernières années) | |
| Intel Core i9-12900K | |
| Moyenne Intel Core i9-12900K (1998 - 2011, n=2) | |
| Intel Core i9-12900K | |
| Intel Core i9-11900K | |
| AMD Ryzen 9 5950X | |
| AMD Ryzen 9 5900X | |
| Intel Core i9-10900K | |
| Cinebench R20 / CPU (Multi Core) | |
| Moyenne de la classe Desktop (5710 - 17190, n=15, 2 dernières années) | |
| AMD Ryzen 9 5950X | |
| Intel Core i9-12900K | |
| Moyenne Intel Core i9-12900K (9630 - 10240, n=2) | |
| Intel Core i9-12900K | |
| AMD Ryzen 9 5900X | |
| Intel Core i9-10900K | |
| Intel Core i9-11900K | |
| Intel Core i9-9900K | |
| Cinebench R20 / CPU (Single Core) | |
| Moyenne de la classe Desktop (674 - 922, n=15, 2 dernières années) | |
| Intel Core i9-12900K | |
| Moyenne Intel Core i9-12900K (766 - 777, n=2) | |
| Intel Core i9-12900K | |
| Intel Core i9-11900K | |
| AMD Ryzen 9 5950X | |
| AMD Ryzen 9 5900X | |
| Intel Core i9-10900K | |
| Intel Core i9-9900K | |
| Cinebench R15 / CPU Multi 64Bit | |
| Moyenne de la classe Desktop (2652 - 6656, n=16, 2 dernières années) | |
| AMD Ryzen 9 5950X | |
| Intel Core i9-12900K | |
| Moyenne Intel Core i9-12900K (3473 - 4102, n=3) | |
| AMD Ryzen 9 5900X | |
| Intel Core i9-12900K | |
| Intel Core i9-10900K | |
| Intel Core i9-11900K | |
| Intel Core i9-9900K | |
| Cinebench R15 / CPU Single 64Bit | |
| Moyenne de la classe Desktop (246 - 356, n=16, 2 dernières années) | |
| Intel Core i9-12900K | |
| Moyenne Intel Core i9-12900K (286 - 292, n=3) | |
| Intel Core i9-12900K | |
| AMD Ryzen 9 5950X | |
| AMD Ryzen 9 5900X | |
| Intel Core i9-11900K | |
| Intel Core i9-10900K | |
| Intel Core i9-9900K | |
| Blender / v2.79 BMW27 CPU | |
| Intel Core i9-9900K | |
| Intel Core i9-11900K | |
| Intel Core i9-10900K | |
| AMD Ryzen 9 5900X | |
| Intel Core i9-12900K | |
| Moyenne Intel Core i9-12900K (121.1 - 128.3, n=2) | |
| Intel Core i9-12900K | |
| Moyenne de la classe Desktop (75 - 218, n=15, 2 dernières années) | |
| AMD Ryzen 9 5950X | |
| 7-Zip 18.03 / 7z b 4 | |
| AMD Ryzen 9 5950X | |
| Moyenne de la classe Desktop (91898 - 163125, n=17, 2 dernières années) | |
| Intel Core i9-12900K | |
| Moyenne Intel Core i9-12900K (96960 - 97671, n=2) | |
| Intel Core i9-12900K | |
| AMD Ryzen 9 5900X | |
| Intel Core i9-10900K | |
| Intel Core i9-11900K | |
| Intel Core i9-9900K | |
| 7-Zip 18.03 / 7z b 4 -mmt1 | |
| Moyenne de la classe Desktop (5092 - 8790, n=17, 2 dernières années) | |
| AMD Ryzen 9 5950X | |
| AMD Ryzen 9 5900X | |
| Intel Core i9-11900K | |
| Intel Core i9-12900K | |
| Moyenne Intel Core i9-12900K (6571 - 6580, n=2) | |
| Intel Core i9-12900K | |
| Intel Core i9-10900K | |
| Intel Core i9-9900K | |
| Geekbench 5.5 / Multi-Core | |
| Moyenne de la classe Desktop (12626 - 28535, n=30, 2 dernières années) | |
| Intel Core i9-12900K | |
| Moyenne Intel Core i9-12900K (17698 - 17854, n=2) | |
| Intel Core i9-12900K | |
| AMD Ryzen 9 5950X | |
| AMD Ryzen 9 5900X | |
| Intel Core i9-10900K | |
| Intel Core i9-11900K | |
| Geekbench 5.5 / Single-Core | |
| Moyenne de la classe Desktop (1755 - 2597, n=30, 2 dernières années) | |
| Intel Core i9-12900K | |
| Moyenne Intel Core i9-12900K (1969 - 2042, n=2) | |
| Intel Core i9-12900K | |
| Intel Core i9-11900K | |
| AMD Ryzen 9 5950X | |
| AMD Ryzen 9 5900X | |
| Intel Core i9-10900K | |
| HWBOT x265 Benchmark v2.2 / 4k Preset | |
| Moyenne de la classe Desktop (18.6 - 48.5, n=15, 2 dernières années) | |
| AMD Ryzen 9 5950X | |
| Intel Core i9-12900K | |
| Moyenne Intel Core i9-12900K (29 - 30, n=2) | |
| Intel Core i9-12900K | |
| AMD Ryzen 9 5900X | |
| Intel Core i9-10900K | |
| Intel Core i9-11900K | |
| Intel Core i9-9900K | |
| LibreOffice / 20 Documents To PDF | |
| Intel Core i9-10900K | |
| Intel Core i9-11900K | |
| AMD Ryzen 9 5900X | |
| AMD Ryzen 9 5950X | |
| Moyenne de la classe Desktop (35.5 - 79.2, n=16, 2 dernières années) | |
| Intel Core i9-12900K | |
| Moyenne Intel Core i9-12900K (38.1 - 40.6, n=2) | |
| Intel Core i9-12900K | |
| R Benchmark 2.5 / Overall mean | |
| Intel Core i9-10900K | |
| Intel Core i9-11900K | |
| AMD Ryzen 9 5950X | |
| AMD Ryzen 9 5900X | |
| Intel Core i9-12900K | |
| Moyenne Intel Core i9-12900K (0.3946 - 0.4216, n=2) | |
| Intel Core i9-12900K | |
| Moyenne de la classe Desktop (0.3299 - 0.4909, n=16, 2 dernières années) | |
* ... Moindre est la valeur, meilleures sont les performances
AIDA64: FP32 Ray-Trace | FPU Julia | CPU SHA3 | CPU Queen | FPU SinJulia | FPU Mandel | CPU AES | CPU ZLib | FP64 Ray-Trace | CPU PhotoWorxx
| Performance rating | |
| Moyenne de la classe Desktop | |
| AMD Ryzen 9 5950X, NVIDIA Titan RTX | |
| AMD Ryzen 9 5900X, NVIDIA Titan RTX | |
| Intel Core i9-11900K, NVIDIA Titan RTX | |
| Intel Core i9-12900K, NVIDIA GeForce RTX 3080 Ti | |
| Moyenne Intel Core i9-12900K | |
| Intel Core i9-12900K, NVIDIA Titan RTX | |
| AIDA64 / FP32 Ray-Trace | |
| Moyenne de la classe Desktop (12248 - 84577, n=21, 2 dernières années) | |
| AMD Ryzen 9 5950X, NVIDIA Titan RTX | |
| AMD Ryzen 9 5900X, NVIDIA Titan RTX | |
| Intel Core i9-11900K, NVIDIA Titan RTX | |
| Intel Core i9-12900K, NVIDIA Titan RTX | |
| Moyenne Intel Core i9-12900K (12739 - 13345, n=3) | |
| Intel Core i9-12900K, NVIDIA GeForce RTX 3080 Ti | |
| AIDA64 / FPU Julia | |
| Moyenne de la classe Desktop (65152 - 246125, n=21, 2 dernières années) | |
| AMD Ryzen 9 5950X, NVIDIA Titan RTX | |
| AMD Ryzen 9 5900X, NVIDIA Titan RTX | |
| Intel Core i9-11900K, NVIDIA Titan RTX | |
| Intel Core i9-12900K, NVIDIA Titan RTX | |
| Moyenne Intel Core i9-12900K (58406 - 59419, n=3) | |
| Intel Core i9-12900K, NVIDIA GeForce RTX 3080 Ti | |
| AIDA64 / CPU SHA3 | |
| Moyenne de la classe Desktop (2982 - 10804, n=21, 2 dernières années) | |
| Intel Core i9-11900K, NVIDIA Titan RTX | |
| Moyenne Intel Core i9-12900K (4796 - 5127, n=3) | |
| Intel Core i9-12900K, NVIDIA Titan RTX | |
| Intel Core i9-12900K, NVIDIA GeForce RTX 3080 Ti | |
| AMD Ryzen 9 5950X, NVIDIA Titan RTX | |
| AMD Ryzen 9 5900X, NVIDIA Titan RTX | |
| AIDA64 / CPU Queen | |
| AMD Ryzen 9 5950X, NVIDIA Titan RTX | |
| AMD Ryzen 9 5900X, NVIDIA Titan RTX | |
| Moyenne de la classe Desktop (76512 - 187912, n=18, 2 dernières années) | |
| Intel Core i9-12900K, NVIDIA Titan RTX | |
| Moyenne Intel Core i9-12900K (112066 - 112694, n=3) | |
| Intel Core i9-12900K, NVIDIA GeForce RTX 3080 Ti | |
| Intel Core i9-11900K, NVIDIA Titan RTX | |
| AIDA64 / FPU SinJulia | |
| AMD Ryzen 9 5950X, NVIDIA Titan RTX | |
| AMD Ryzen 9 5900X, NVIDIA Titan RTX | |
| Moyenne de la classe Desktop (6443 - 35251, n=21, 2 dernières années) | |
| Intel Core i9-12900K, NVIDIA Titan RTX | |
| Moyenne Intel Core i9-12900K (14590 - 14664, n=3) | |
| Intel Core i9-12900K, NVIDIA GeForce RTX 3080 Ti | |
| Intel Core i9-11900K, NVIDIA Titan RTX | |
| AIDA64 / FPU Mandel | |
| Moyenne de la classe Desktop (31697 - 129745, n=21, 2 dernières années) | |
| AMD Ryzen 9 5950X, NVIDIA Titan RTX | |
| AMD Ryzen 9 5900X, NVIDIA Titan RTX | |
| Intel Core i9-11900K, NVIDIA Titan RTX | |
| Intel Core i9-12900K, NVIDIA Titan RTX | |
| Moyenne Intel Core i9-12900K (35801 - 39323, n=3) | |
| Intel Core i9-12900K, NVIDIA GeForce RTX 3080 Ti | |
| AIDA64 / CPU AES | |
| Intel Core i9-11900K, NVIDIA Titan RTX | |
| AMD Ryzen 9 5950X, NVIDIA Titan RTX | |
| Moyenne de la classe Desktop (57777 - 513073, n=21, 2 dernières années) | |
| Intel Core i9-12900K, NVIDIA GeForce RTX 3080 Ti | |
| Moyenne Intel Core i9-12900K (94062 - 140055, n=3) | |
| AMD Ryzen 9 5900X, NVIDIA Titan RTX | |
| Intel Core i9-12900K, NVIDIA Titan RTX | |
| AIDA64 / CPU ZLib | |
| AMD Ryzen 9 5950X, NVIDIA Titan RTX | |
| Moyenne de la classe Desktop (887 - 2674, n=21, 2 dernières années) | |
| Moyenne Intel Core i9-12900K (1537 - 1608, n=3) | |
| Intel Core i9-12900K, NVIDIA Titan RTX | |
| Intel Core i9-12900K, NVIDIA GeForce RTX 3080 Ti | |
| AMD Ryzen 9 5900X, NVIDIA Titan RTX | |
| Intel Core i9-11900K, NVIDIA Titan RTX | |
| AIDA64 / FP64 Ray-Trace | |
| Moyenne de la classe Desktop (6471 - 44013, n=21, 2 dernières années) | |
| AMD Ryzen 9 5950X, NVIDIA Titan RTX | |
| AMD Ryzen 9 5900X, NVIDIA Titan RTX | |
| Intel Core i9-11900K, NVIDIA Titan RTX | |
| Intel Core i9-12900K, NVIDIA Titan RTX | |
| Moyenne Intel Core i9-12900K (7586 - 8283, n=3) | |
| Intel Core i9-12900K, NVIDIA GeForce RTX 3080 Ti | |
| AIDA64 / CPU PhotoWorxx | |
| Intel Core i9-12900K, NVIDIA GeForce RTX 3080 Ti | |
| Intel Core i9-12900K, NVIDIA Titan RTX | |
| Moyenne de la classe Desktop (38071 - 63949, n=21, 2 dernières années) | |
| Moyenne Intel Core i9-12900K (33311 - 49236, n=3) | |
| Intel Core i9-11900K, NVIDIA Titan RTX | |
| AMD Ryzen 9 5950X, NVIDIA Titan RTX | |
| AMD Ryzen 9 5900X, NVIDIA Titan RTX | |
Test de charge constante multiple de Cinebench R15
Nous examinons le système sous une charge constante en utilisant la boucle Cinebench-R15 Multi. De cette façon, nous pouvons déterminer si le système de refroidissement est suffisamment puissant pour refroidir efficacement le processeur. Dans le Corsair One i300, le travail de l'AiO est très fiable, et le résultat reste constant même après 50 passages. Cependant, le TDP légèrement inférieur de lIntel Core i9-12900K est clairement perceptible ici. Si vous laissez le Core i9-12900K s'affranchir des limitations, il peut atteindre presque 500 points de plus.
Performance du système
Pendant notre période de test, l'ensemble du système a fonctionné très rapidement. Cela se reflète également dans les benchmarks du système. Dans les tests PCMark 10, le Corsair One i300 prend la tête dans tous les tests individuels. Il n'y a que dans les tests de rendu que le Corsair One i300 n'arrive pas à suivre à cause de la carte graphique. Le site Nvidia Titan RTXdes systèmes de comparaison est le meilleur choix ici, ce qui est dû à la proximité de la série quad.
| PCMark 10 | |
| Score | |
| Intel Core i9-12900K | |
| AMD Ryzen 9 5950X | |
| Intel Core i9-12900K | |
| AMD Ryzen 9 5900X | |
| Intel Core i9-11900K | |
| Intel Core i9-10900K | |
| Intel Core i9-9900K | |
| Essentials | |
| Intel Core i9-12900K | |
| AMD Ryzen 9 5950X | |
| Intel Core i9-12900K | |
| AMD Ryzen 9 5900X | |
| Intel Core i9-9900K | |
| Intel Core i9-11900K | |
| Intel Core i9-10900K | |
| Productivity | |
| AMD Ryzen 9 5950X | |
| Intel Core i9-12900K | |
| Intel Core i9-12900K | |
| AMD Ryzen 9 5900X | |
| Intel Core i9-11900K | |
| Intel Core i9-10900K | |
| Intel Core i9-9900K | |
| Digital Content Creation | |
| Intel Core i9-12900K | |
| AMD Ryzen 9 5950X | |
| Intel Core i9-12900K | |
| AMD Ryzen 9 5900X | |
| Intel Core i9-10900K | |
| Intel Core i9-9900K | |
| Intel Core i9-11900K | |
| LuxMark v2.0 64Bit | |
| Room GPUs-only | |
| Intel Core i9-12900K | |
| Intel Core i9-9900K | |
| Sala GPUs-only | |
| Intel Core i9-12900K | |
| Intel Core i9-9900K | |
| ComputeMark v2.1 | |
| 1024x600 Normal, Score | |
| Intel Core i9-12900K | |
| Intel Core i9-9900K | |
| 1024x600 Normal, Fluid 3DTex | |
| Intel Core i9-12900K | |
| Intel Core i9-9900K | |
| 1024x600 Normal, Fluid 2DTexArr | |
| Intel Core i9-12900K | |
| Intel Core i9-9900K | |
| 1024x600 Normal, Mandel Vector | |
| Intel Core i9-12900K | |
| Intel Core i9-9900K | |
| 1024x600 Normal, Mandel Scalar | |
| Intel Core i9-12900K | |
| Intel Core i9-9900K | |
| 1024x600 Normal, QJuliaRayTrace | |
| Intel Core i9-12900K | |
| Intel Core i9-9900K | |
| PCMark 10 Score | 8897 points | |
Aide | ||
Solution de stockage
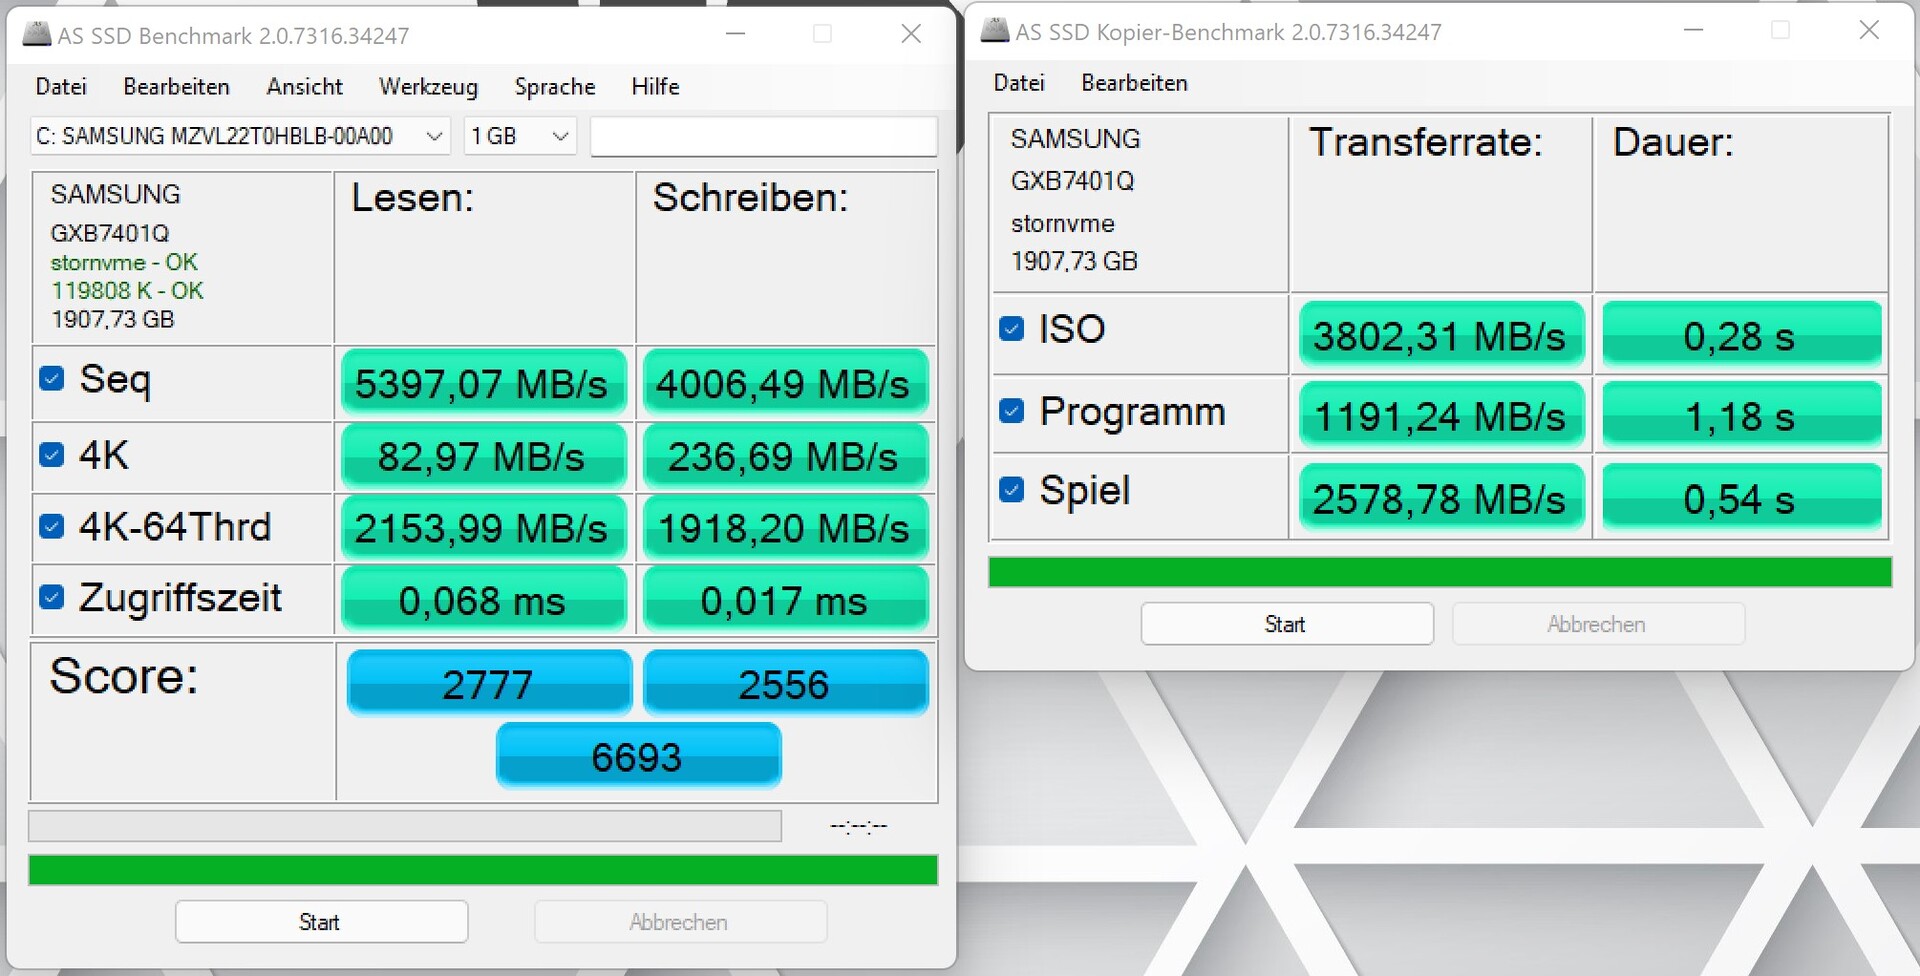
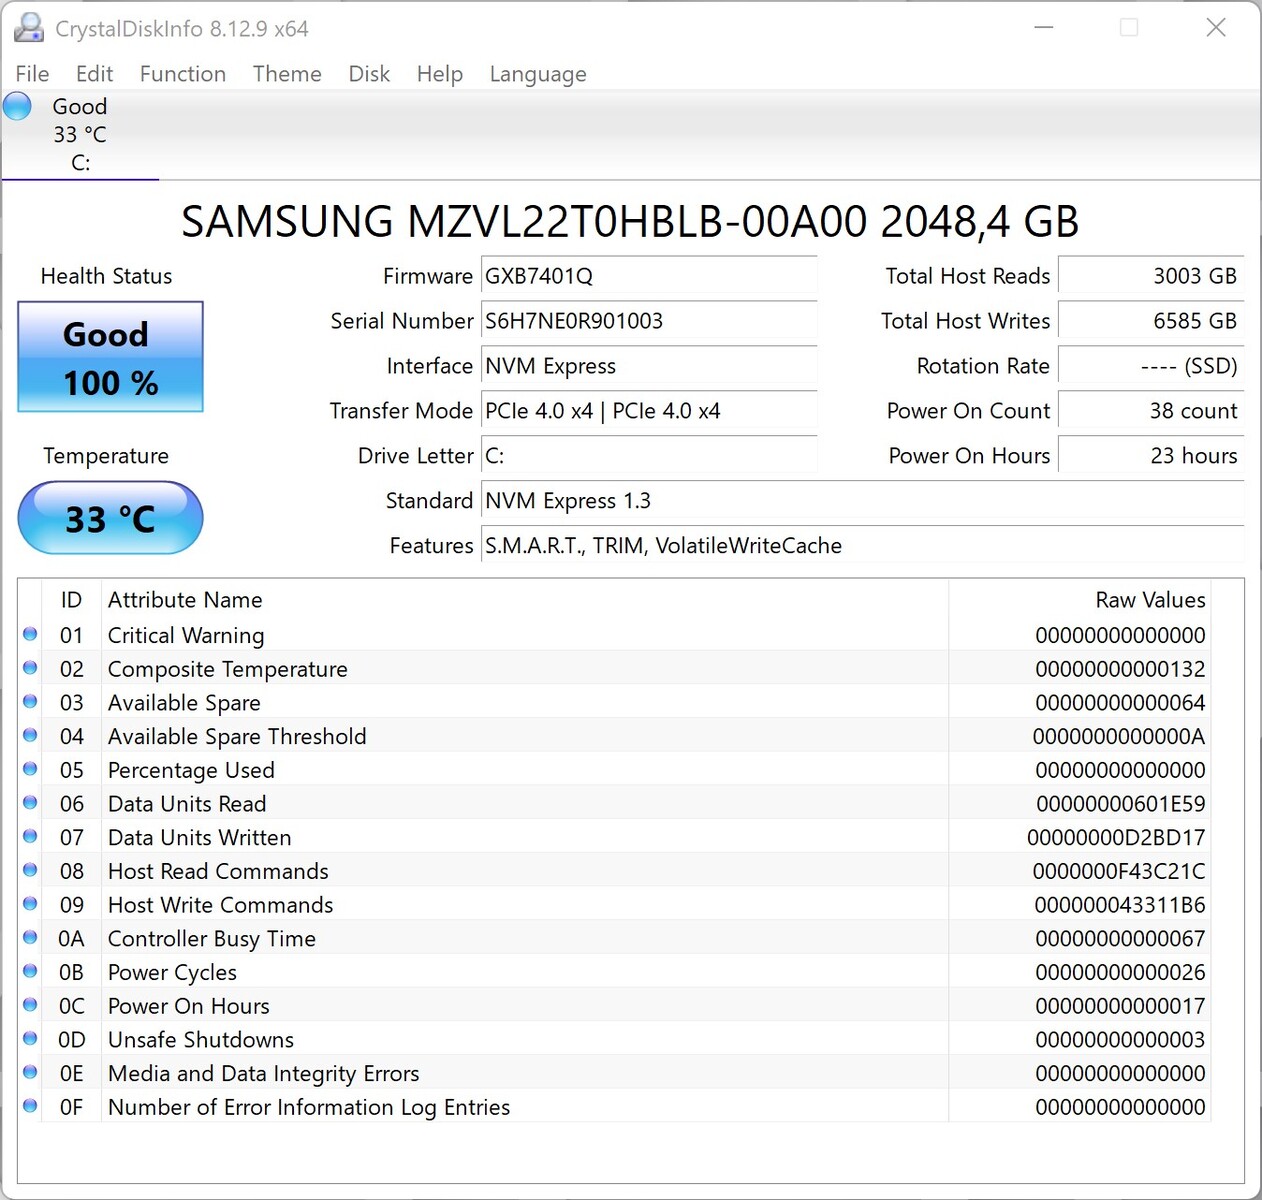
Comme déjà mentionné plus haut, le Corsair One i160 est équipé de deux modules de stockage. Le système est installé sur un SSD PCIe rapide de 512 Go de Samsung, et il y a également un disque dur conventionnel offrant 2 To de stockage.
Lors du test, le SSD de Samsung a fourni une très bonne performance, profitant à l'ensemble du système. Cependant, pour une performance globale encore meilleure, Corsair aurait dû équiper le PC uniquement de SSD. Le taux de transfert moyen du disque dur Seagate était de 107 Mo/s. Bien que cette valeur ne soit pas mauvaise, par rapport à un SSD, un disque dur présente des inconvénients importants en termes de performances.
Malheureusement, le boîtier compact n'offre aucun espace pour des modules de stockage supplémentaires.

* ... Moindre est la valeur, meilleures sont les performances
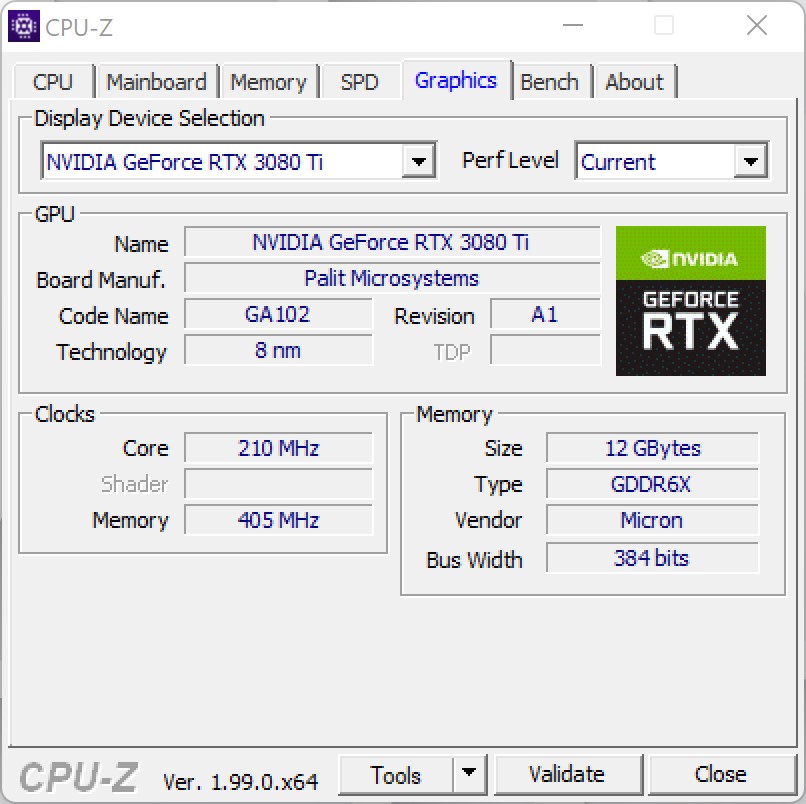
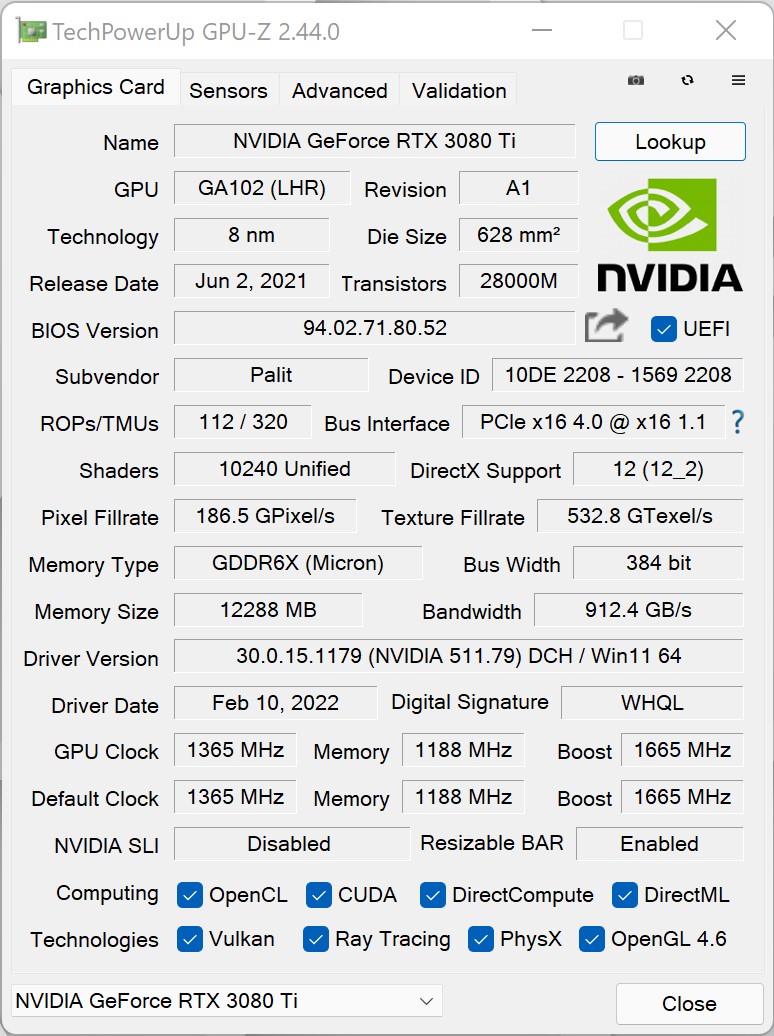
Carte graphique
Dans le système de jeu compact, Corsair utilise uneNvidia GeForce RTX 3080 Tiqui est presque identique à une Nvidia GeForce RTX 3090 en termes de performances. Cependant, avec 12 Go de VRAM, il n'offre que la moitié de la RAM du modèle supérieur de Nvidia, mais cela n'a pas beaucoup d'importance avec les jeux actuels. Le refroidissement de la carte graphique est très bien conçu, puisqu'un AiO est utilisé comme pour le processeur. En outre, il y a également deux petits ventilateurs sur la carte graphique, afin de fournir un refroidissement actif supplémentaire au transformateur et à la VRAM. Vous pouvez voir que cette conception fonctionne bien, si vous jetez un coup d'œil aux benchmarks synthétiques. Le Corsair One i300 atteint également les meilleures valeurs grâce au Intel Core i9-12900K.
Par rapport au Corsair One i160vous pouvez vous attendre à une augmentation des performances de 20 à 30 %.
| 3DMark 05 Standard | 63621 points | |
| 3DMark 06 Standard Score | 66161 points | |
| 3DMark Vantage P Result | 120236 points | |
| 3DMark 11 Performance | 47170 points | |
| 3DMark Ice Storm Standard Score | 336443 points | |
| 3DMark Cloud Gate Standard Score | 81921 points | |
| 3DMark Fire Strike Score | 40079 points | |
| 3DMark Fire Strike Extreme Score | 23109 points | |
| 3DMark Time Spy Score | 18985 points | |
Aide | ||
Performances en matière de jeux
Comme Corsair utilise le matériel le plus actuel dans le One i300, il était évident que les performances de jeu du système sont également au top niveau. Actuellement, vous pouvez profiter de tous les jeux sans aucun compromis en 2160p. Par rapport aux autres GPU de bureau que nous avons testés précédemment, les performances de notre unité de test s'avèrent nettement meilleures. L'avantage relativement élevé par rapport à la Nvidia GeForce RTX 3090 est dû au meilleur CPU du Corsair One i300. Notre système de test GPU est basé sur un AMD Ryzen 9 5900Xqui présente un désavantage significatif par rapport au Intel Core i9-12900K.
Comme déjà dans les tests CPU, nous avons également mis la carte graphique sous charge pendant une période plus longue. Pour ce faire, nous utilisons "The Witcher 3" avec le préréglage Ultra. Pendant le test, les performances de la Nvidia GeForce RTX 3080 Tirestent stables tout au long du test, et nous ne remarquons aucune baisse de performance. Avec une moyenne de 189 images par seconde, le jeu fonctionne très bien, ce qui vous permet d'utiliser également des moniteurs avec 165 Hz.
| The Witcher 3 | |
| 1920x1080 Ultra Graphics & Postprocessing (HBAO+) | |
| Corsair One i300 | |
| Moyenne NVIDIA GeForce RTX 3090 (160 - 192.6, n=18) | |
| Moyenne AMD Radeon RX 6800 (152.1 - 156, n=3) | |
| Moyenne NVIDIA GeForce RTX 3080 (145 - 152, n=2) | |
| Moyenne NVIDIA Titan RTX (124 - 150, n=28) | |
| Moyenne AMD Radeon RX 6700 XT (117 - 130.4, n=3) | |
| Moyenne NVIDIA GeForce RTX 3070 (52.8 - 132.2, n=7) | |
| 3840x2160 High Graphics & Postprocessing (Nvidia HairWorks Off) | |
| Moyenne NVIDIA GeForce RTX 3090 (128 - 160.2, n=14) | |
| Corsair One i300 | |
| Moyenne NVIDIA GeForce RTX 3080 (114 - 115, n=2) | |
| Moyenne NVIDIA Titan RTX (94 - 107.1, n=28) | |
| Moyenne AMD Radeon RX 6800 (96.8 - 100.7, n=3) | |
| Moyenne NVIDIA GeForce RTX 3070 (84 - 93.9, n=5) | |
| Moyenne AMD Radeon RX 6700 XT (63 - 75.7, n=3) | |
| Rise of the Tomb Raider | |
| 1920x1080 Very High Preset AA:FX AF:16x | |
| Moyenne NVIDIA GeForce RTX 3090 (240 - 254, n=2) | |
| Moyenne NVIDIA GeForce RTX 3080 (217 - 233, n=2) | |
| Corsair One i300 | |
| Moyenne NVIDIA Titan RTX (n=1) | |
| Moyenne AMD Radeon RX 6800 (n=1) | |
| Moyenne NVIDIA GeForce RTX 3070 (151 - 169, n=3) | |
| Moyenne AMD Radeon RX 6700 XT (n=1) | |
| 3840x2160 High Preset AA:FX AF:4x | |
| Moyenne NVIDIA GeForce RTX 3090 (128 - 128.1, n=2) | |
| Corsair One i300 | |
| Moyenne NVIDIA GeForce RTX 3080 (107 - 114, n=2) | |
| Moyenne NVIDIA Titan RTX (n=1) | |
| Moyenne AMD Radeon RX 6800 (n=1) | |
| Moyenne NVIDIA GeForce RTX 3070 (76.7 - 83.8, n=3) | |
| Moyenne AMD Radeon RX 6700 XT (n=1) | |
| Far Cry 6 | |
| 1920x1080 Ultra Graphics Quality + HD Textures AA:T | |
| Corsair One i300 | |
| Moyenne NVIDIA GeForce RTX 3090 (94 - 177.6, n=10) | |
| Moyenne AMD Radeon RX 6800 (116 - 152.5, n=3) | |
| Moyenne NVIDIA Titan RTX (94.7 - 138.9, n=6) | |
| Moyenne AMD Radeon RX 6700 XT (102 - 136.6, n=3) | |
| Moyenne NVIDIA GeForce RTX 3070 (91 - 114.2, n=2) | |
| Moyenne NVIDIA GeForce RTX 3080 (n=1) | |
| 3840x2160 Ultra Graphics Quality + HD Textures AA:T | |
| Moyenne NVIDIA GeForce RTX 3090 (77 - 86.7, n=10) | |
| Corsair One i300 | |
| Moyenne NVIDIA GeForce RTX 3080 (n=1) | |
| Moyenne AMD Radeon RX 6800 (68.1 - 69.7, n=3) | |
| Moyenne NVIDIA Titan RTX (52.8 - 64.2, n=6) | |
| Moyenne AMD Radeon RX 6700 XT (50 - 52.7, n=3) | |
| Moyenne NVIDIA GeForce RTX 3070 (26.4 - 57, n=2) | |
| F1 2021 | |
| 1920x1080 Ultra High Preset + Raytracing AA:T AF:16x | |
| Corsair One i300 | |
| Moyenne NVIDIA GeForce RTX 3090 (154 - 244, n=13) | |
| Moyenne AMD Radeon RX 6800 (167 - 175.5, n=3) | |
| Moyenne NVIDIA Titan RTX (160 - 172, n=6) | |
| Moyenne NVIDIA GeForce RTX 3070 (148 - 158, n=2) | |
| Moyenne NVIDIA GeForce RTX 3080 (n=1) | |
| Moyenne AMD Radeon RX 6700 XT (143 - 145.2, n=3) | |
| 3840x2160 Ultra High Preset + Raytracing AA:T AF:16x | |
| Moyenne NVIDIA GeForce RTX 3090 (100.4 - 110, n=13) | |
| Corsair One i300 | |
| Moyenne NVIDIA GeForce RTX 3080 (n=1) | |
| Moyenne NVIDIA Titan RTX (71.9 - 74.5, n=6) | |
| Moyenne AMD Radeon RX 6800 (71.8 - 74, n=3) | |
| Moyenne NVIDIA GeForce RTX 3070 (64 - 67.3, n=2) | |
| Moyenne AMD Radeon RX 6700 XT (56.3 - 56.9, n=3) | |
The Witcher 3 FPS Chart
| Bas | Moyen | Élevé | Ultra | QHD | 4K | |
|---|---|---|---|---|---|---|
| GTA V (2015) | 187 | 187 | 187 | 149 | 147 | 180 |
| The Witcher 3 (2015) | 681 | 554 | 365 | 183 | 149 | |
| Dota 2 Reborn (2015) | 240.3 | 214.8 | 207.6 | 196.1 | 191.5 | |
| Rise of the Tomb Raider (2016) | 487 | 340 | 257 | 221 | 114 | |
| Final Fantasy XV Benchmark (2018) | 232 | 227 | 175 | 136 | 84 | |
| X-Plane 11.11 (2018) | 205 | 178 | 135 | 118 | ||
| Far Cry 5 (2018) | 230 | 200 | 190 | 175 | 168 | 108 |
| Strange Brigade (2018) | 667 | 484 | 392 | 345 | 260 | 156 |
| Shadow of the Tomb Raider (2018) | 245 | 226 | 226 | 212 | 164 | 93.7 |
| Far Cry New Dawn (2019) | 190 | 165 | 157 | 141 | 137 | 107 |
| Metro Exodus (2019) | 258 | 212 | 169 | 137 | 113 | 75 |
| Anno 1800 (2019) | 159 | 163 | 124 | 69.4 | 66.1 | 55.9 |
| Control (2019) | 240 | 233 | 187 | 124 | 63.9 | |
| Borderlands 3 (2019) | 208 | 181 | 167 | 152 | 125 | 72 |
| F1 2020 (2020) | 478 | 379 | 397 | 298 | 233 | 143 |
| F1 2021 (2021) | 534 | 498 | 410 | 219 | 170 | 101 |
| New World (2021) | 194 | 165 | 153 | 142 | 133 | 79.2 |
| Far Cry 6 (2021) | 200 | 176 | 155 | 149 | 129 | 81.6 |
| Guardians of the Galaxy (2021) | 194 | 196 | 191 | 191 | 186 | 110 |
| Riders Republic (2021) | 284 | 220 | 188 | 176 | 136 | 80 |
| Forza Horizon 5 (2021) | 292 | 200 | 188 | 126 | 111 | 84 |
| Battlefield 2042 (2021) | 216 | 194 | 169 | 150 | 123 | 83 |
| Farming Simulator 22 (2021) | 349 | 270 | 226 | 203 | 201 | 157 |
| Halo Infinite (2021) | 229 | 198 | 188 | 142 | 83.1 | |
| God of War (2022) | 209 | 181 | 163 | 117 | 98.7 | 64.7 |
| Rainbow Six Extraction (2022) | 365 | 353 | 348 | 282 | 194 | 104 |
| Dying Light 2 (2022) | 189 | 164 | 149 | 109 | 61.5 |
Émissions
Émissions sonores
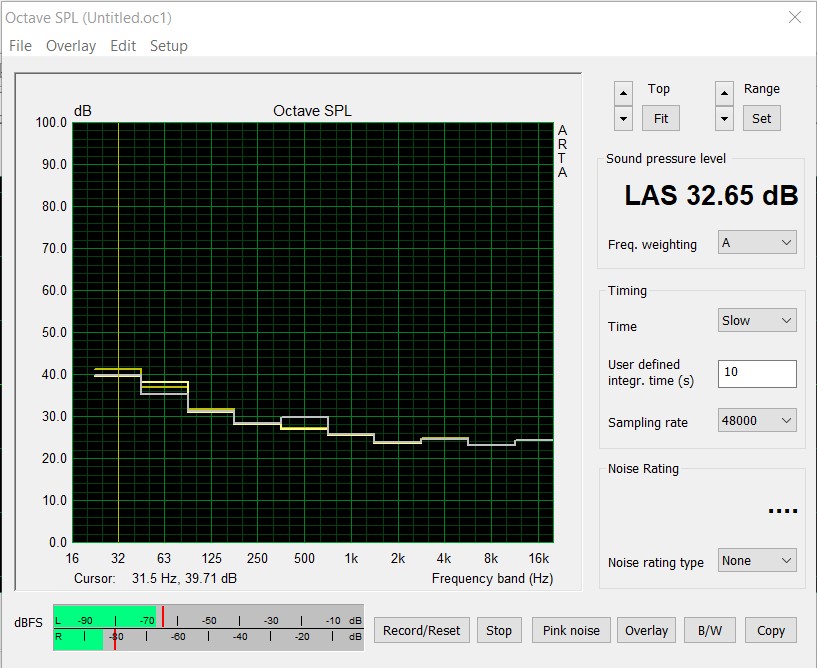
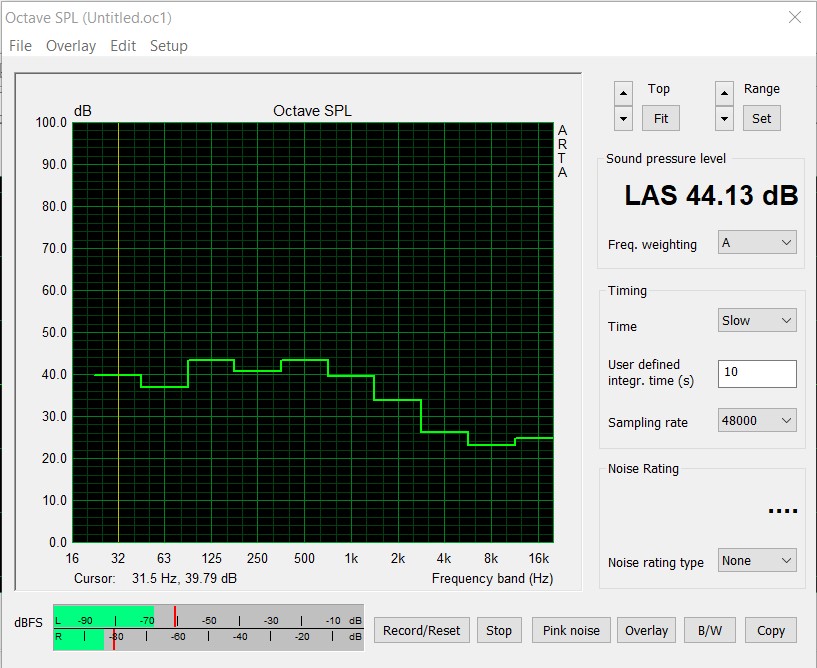
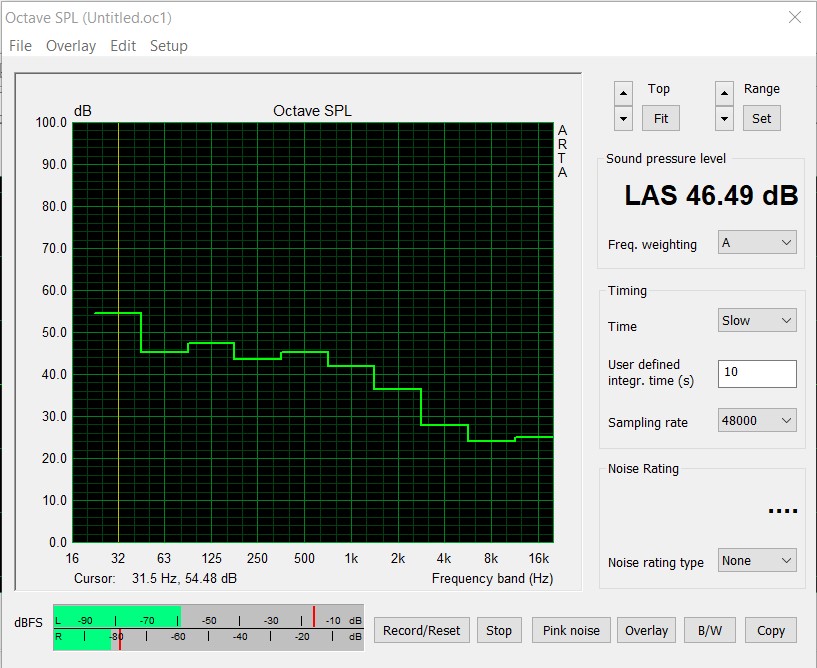
Le refroidissement du Corsair One i300 est basé sur la même méthode que celle du Corsair One i160. En fonctionnement 2D, le système est relativement silencieux avec environ 32,6 dB(A). A ce stade, le grand ventilateur de 140 mm ne tourne pas encore, mais on peut entendre les deux pompes de l'AiO et leur son reste toujours présent. Malheureusement, ce n'est pas très agréable à la longue. Il doit bien y avoir des pompes qui peuvent faire leur travail tout en restant nettement plus silencieuses. Sous charge, le ventilateur de 140 mm dans le couvercle du boîtier commence aussi à tourner après un court moment. A 44 dB(A) pendant le test de stress, le système peut alors être entendu clairement. Pendant le jeu, il devient même un peu plus bruyant avec un peu plus de 46 dB(A).
Degré de la nuisance sonore
| Au repos |
| 32.4 / 32.5 / 32.6 dB(A) |
| Fortement sollicité |
| / 44.13 dB(A) |
 | ||
30 dB silencieux 40 dB(A) audible 50 dB(A) bruyant |
||
min: | ||
Température et consommation d'énergie
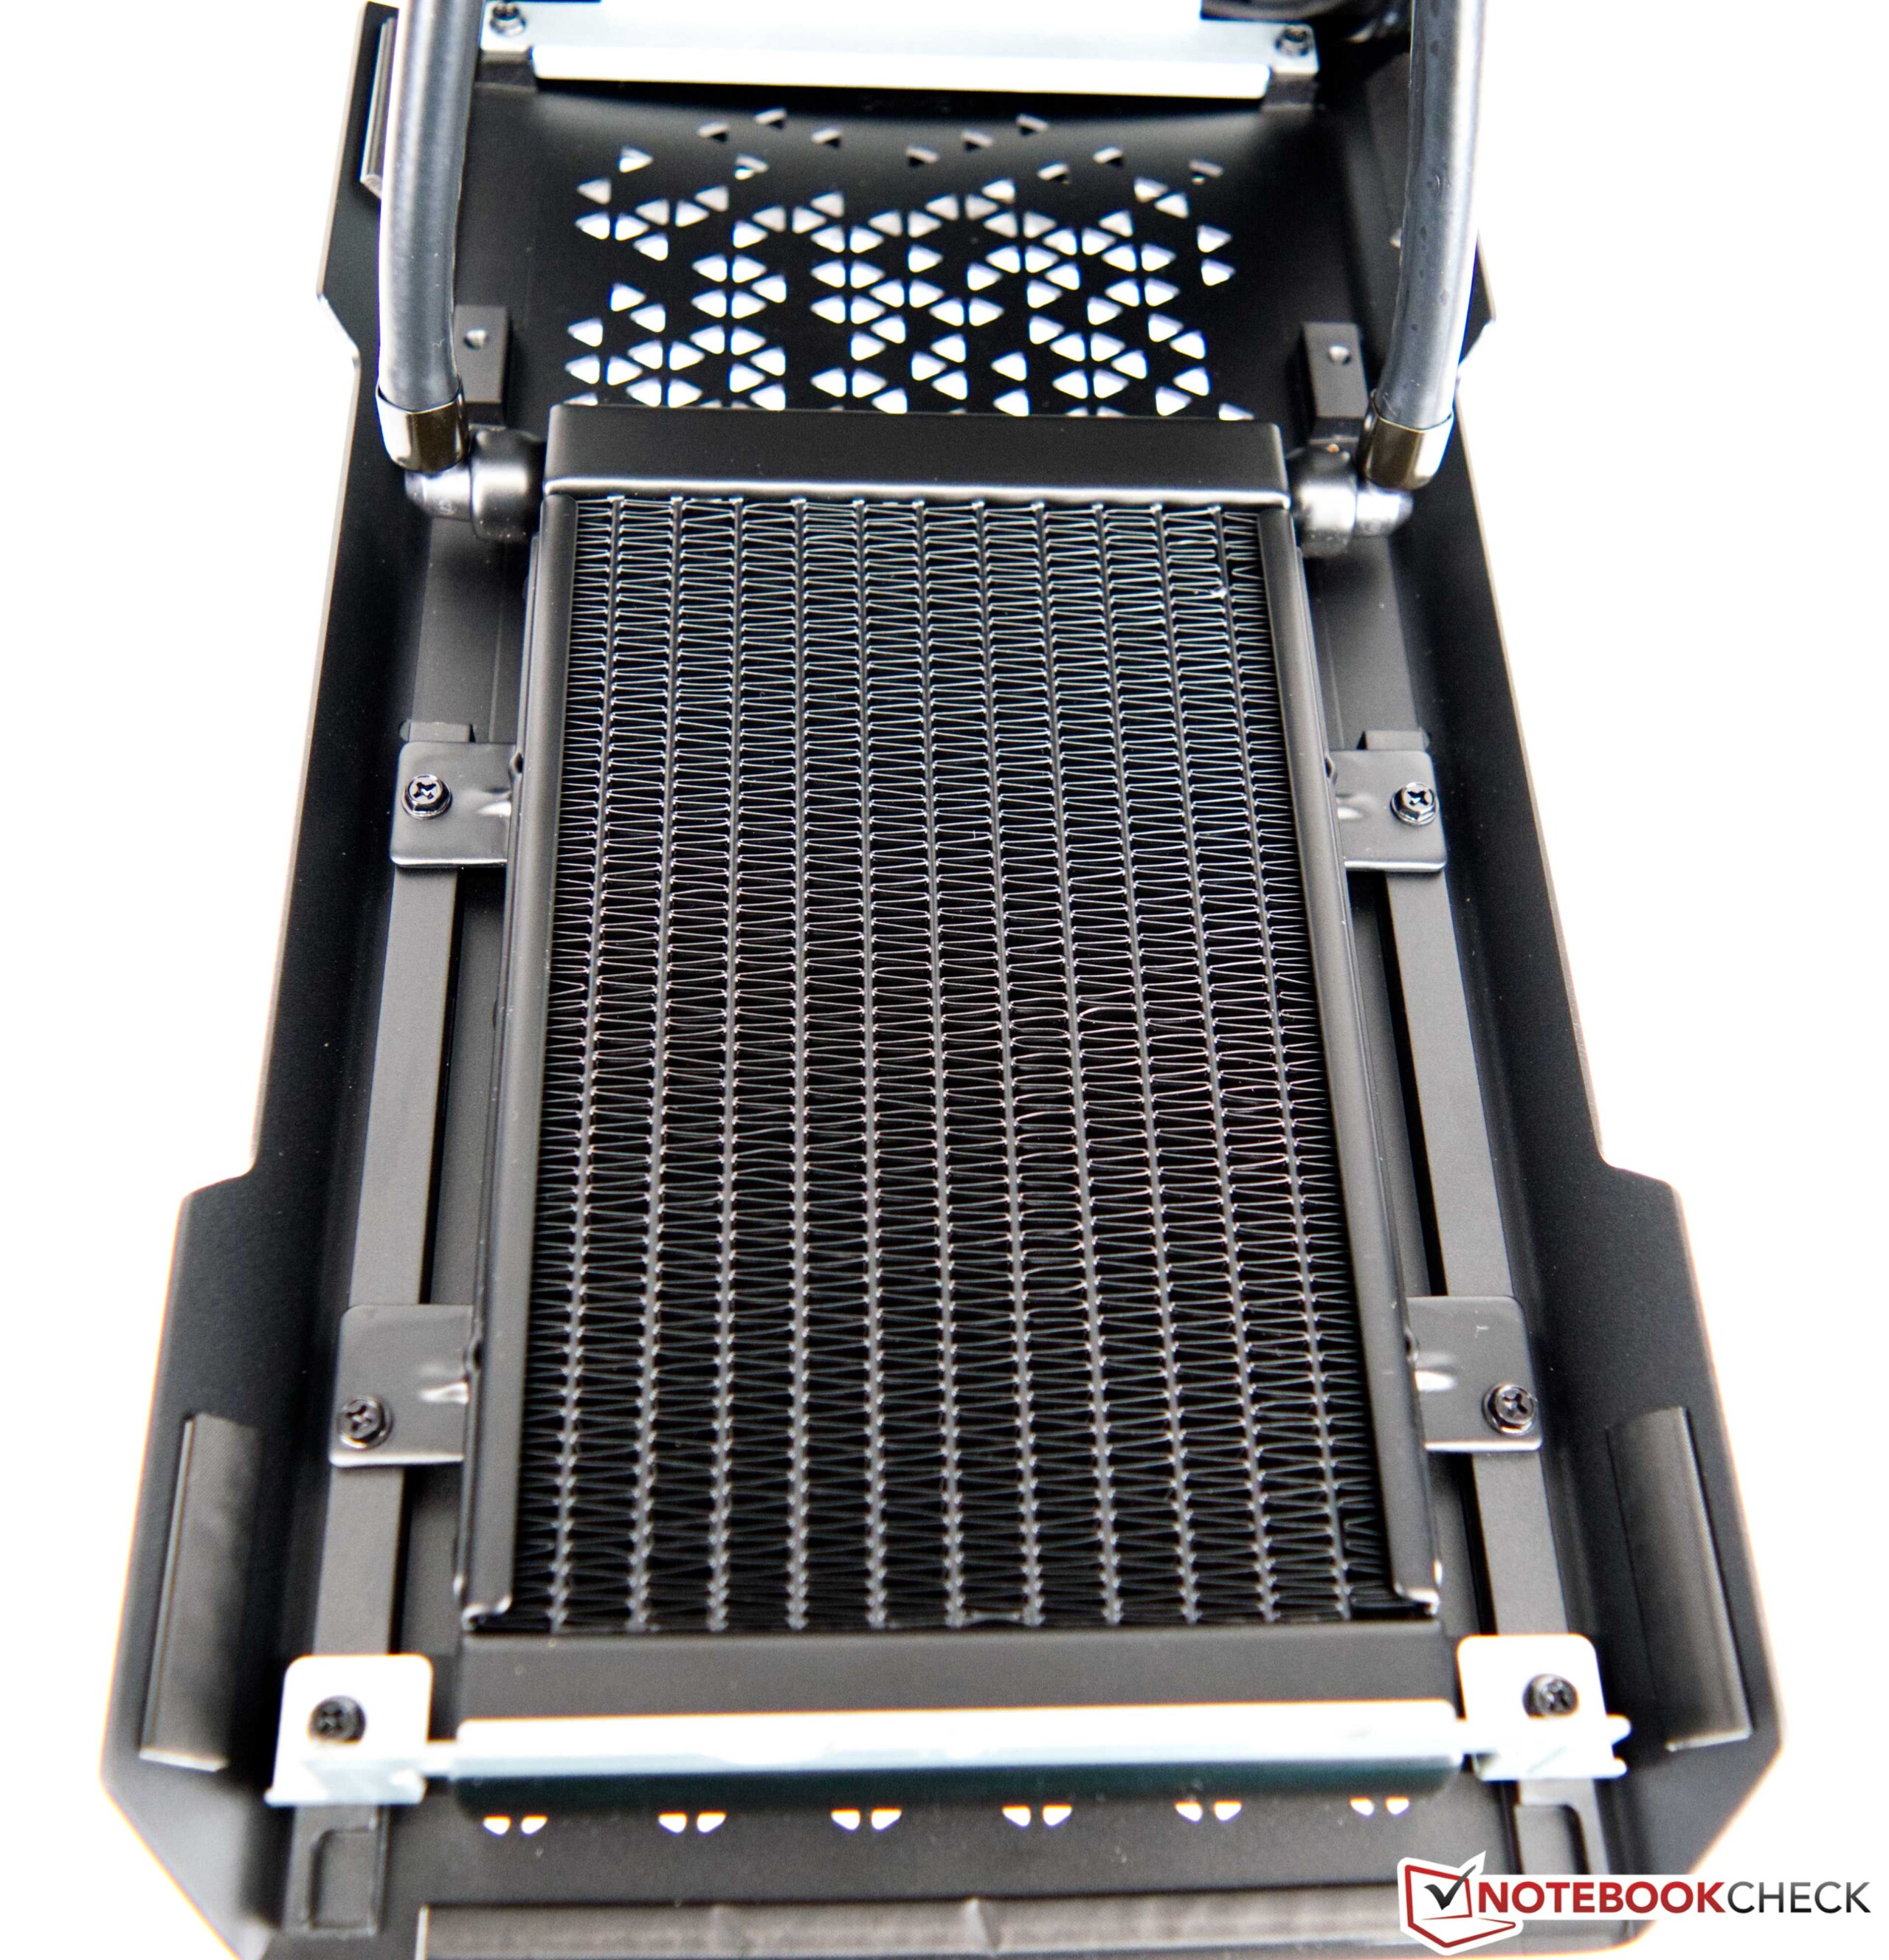
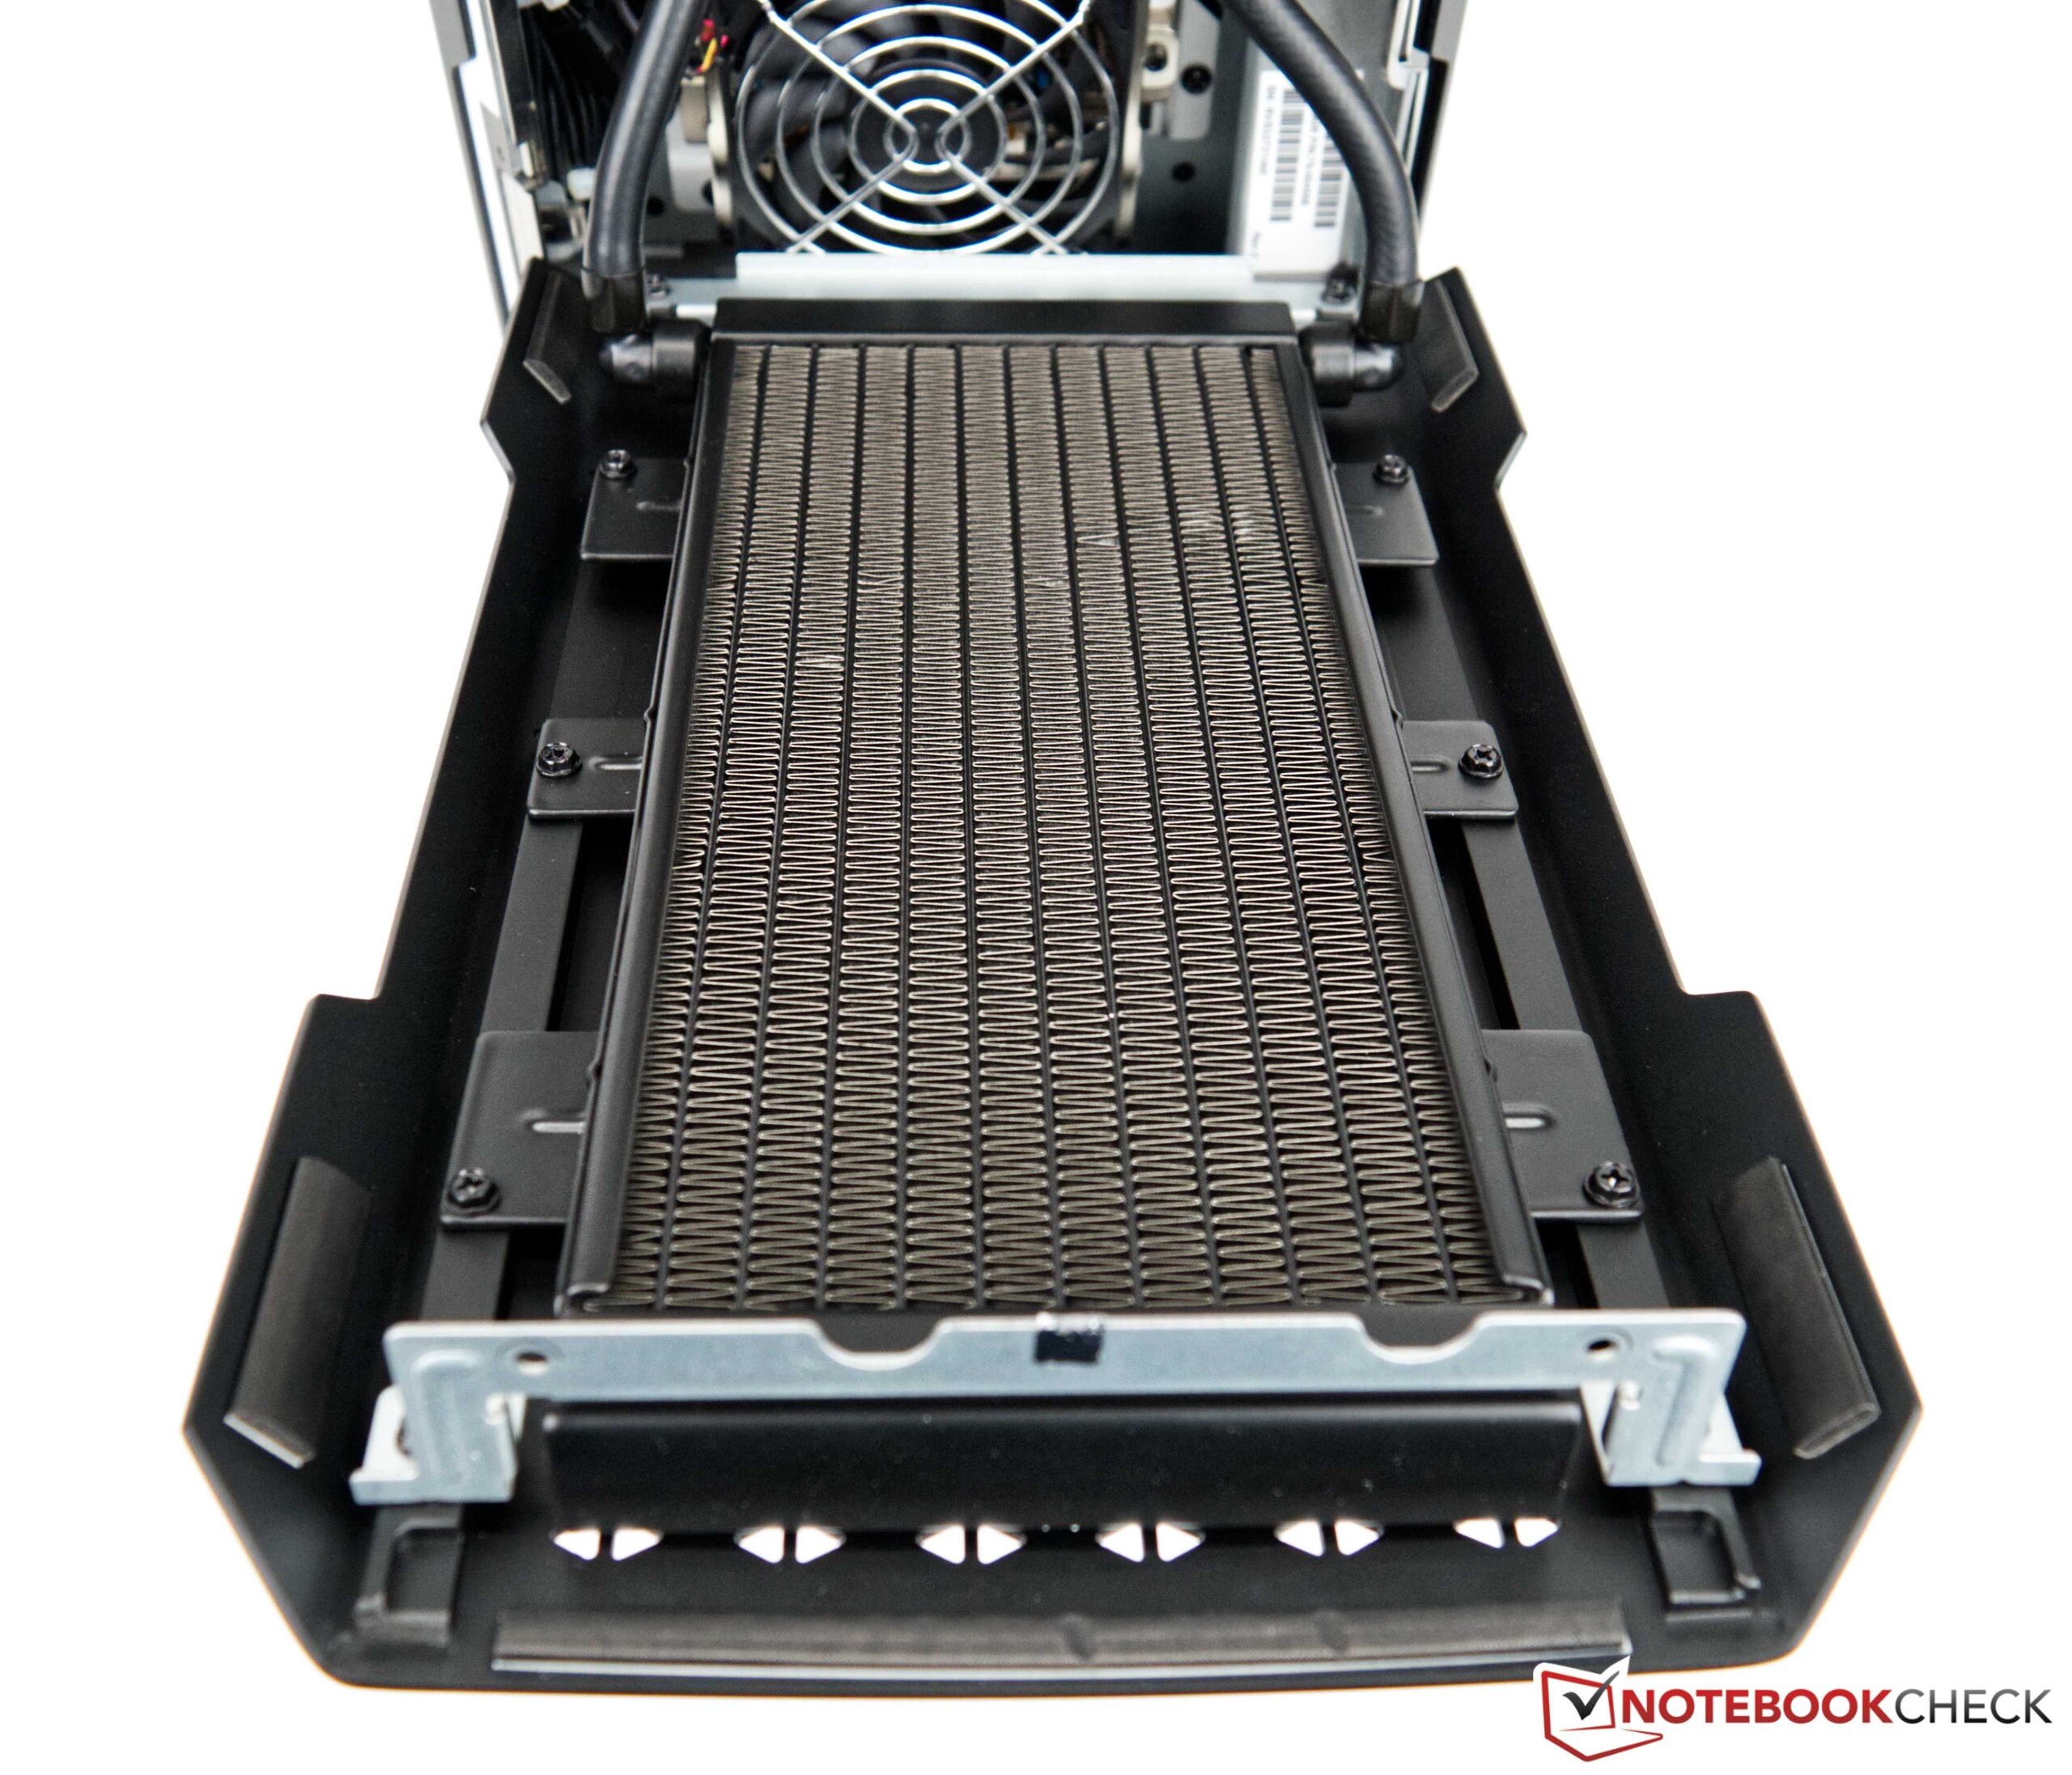
Le boîtier massif offre une très grande surface pour permettre le transfert de chaleur. En charge, il se réchauffe sensiblement et l'effet cheminée fait en sorte que l'air frais est aspiré sur les côtés et guidé directement sur les ailettes de refroidissement des deux AiO pour être ensuite expulsé du boîtier par le grand ventilateur de 140 mm situé sur le dessus. Pour un refroidissement efficace de la carte graphique, celle-ci est en outre équipée de deux ventilateurs plus petits pour refroidir le transformateur et la VRAM.
Ce concept de refroidissement fonctionne bien, et tous les composants sont refroidis efficacement, sans surchauffe à pleine charge. Cependant, le CPU a quand même atteint 100 °C (212 °F) pendant le test de stress. Cela montre pourquoi Corsair limite ses performances à un maximum de 175 watts. Ceux pour qui les 100 °C sont encore trop chauds peuvent également réduire davantage les performances dans le BIOS. Cependant, les températures du Intel Core i9-12900Kne posent toujours aucun problème, comme nous l'avons déjà constaté lors de la boucle Multi de Cinebench R15. Le test de stress avec FurMark et Prime95 fonctionnant en même temps représente un scénario extrême qui ne devrait pratiquement jamais se produire au quotidien
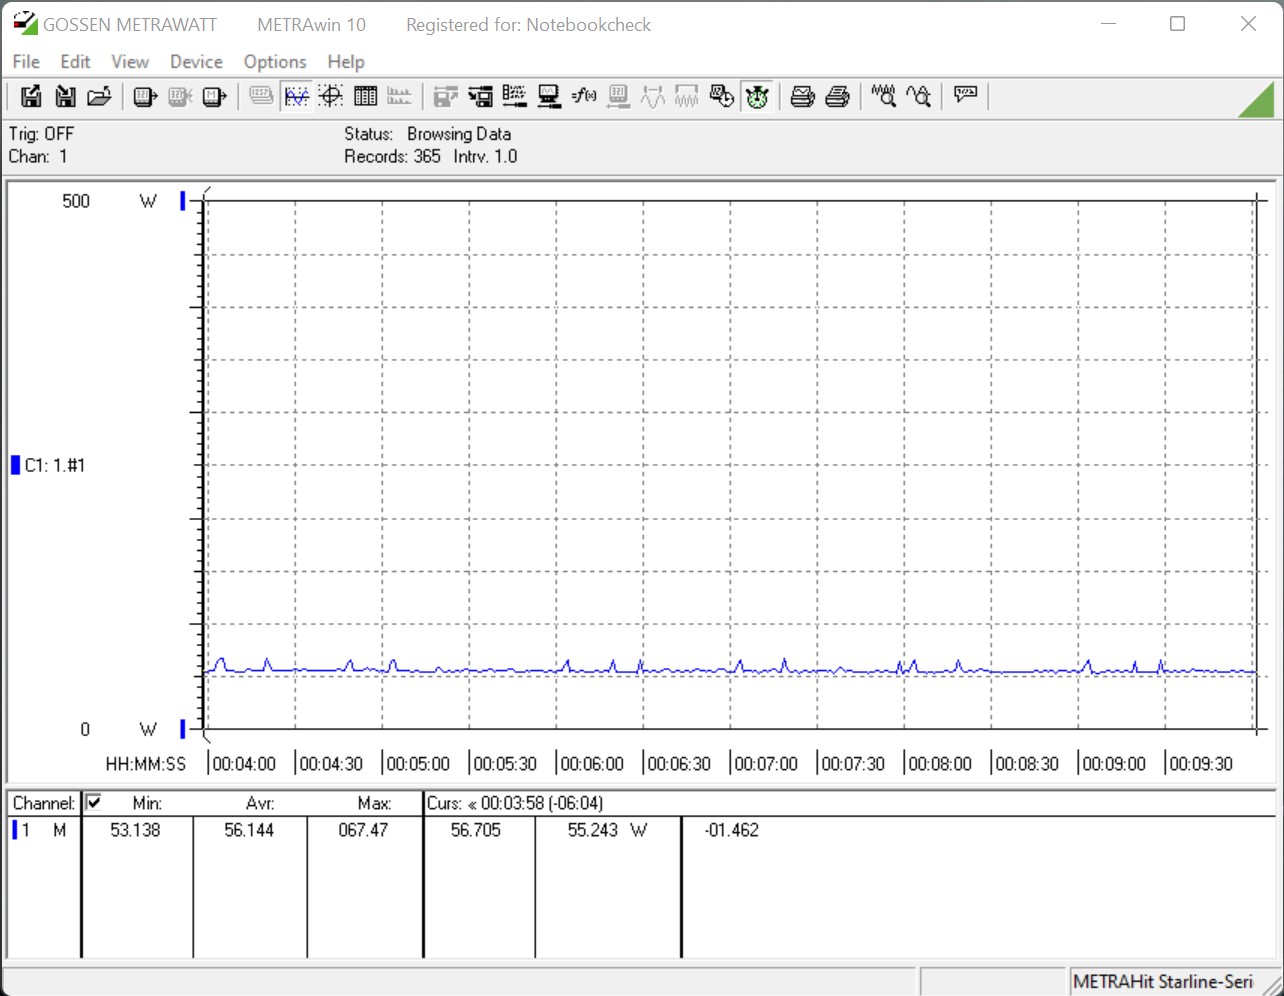
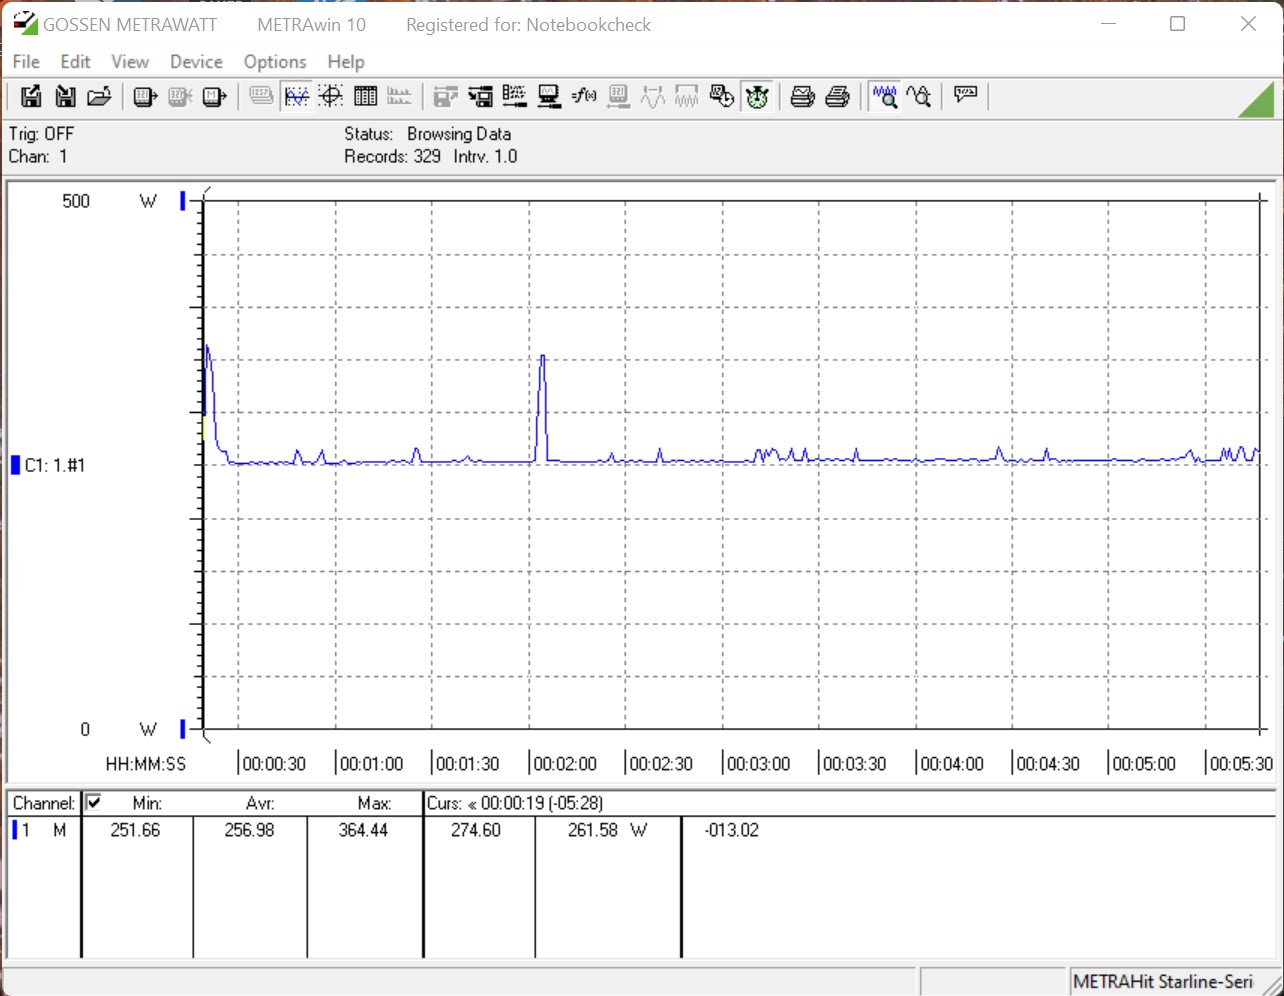
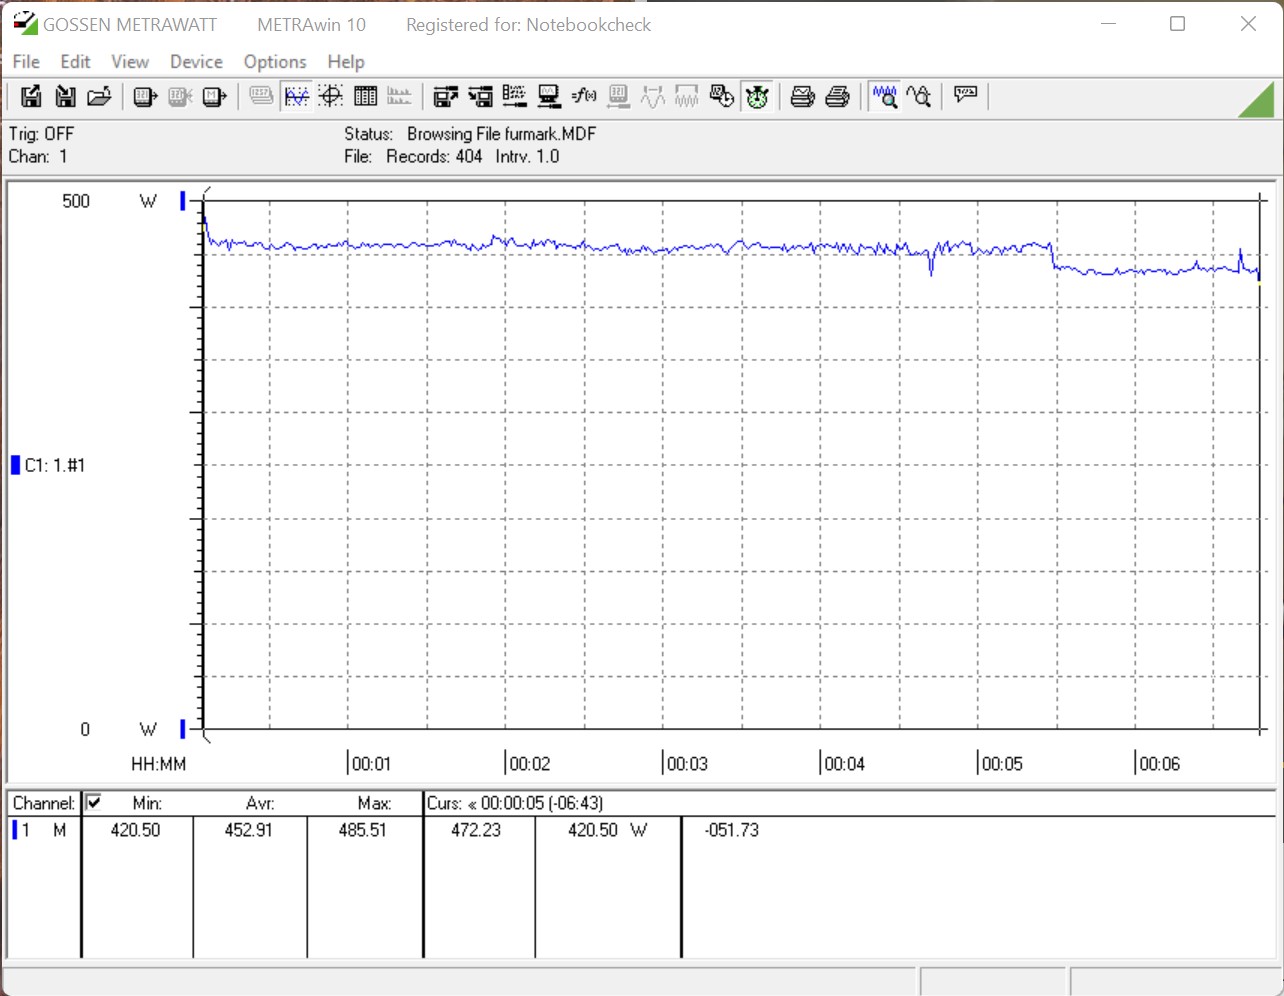
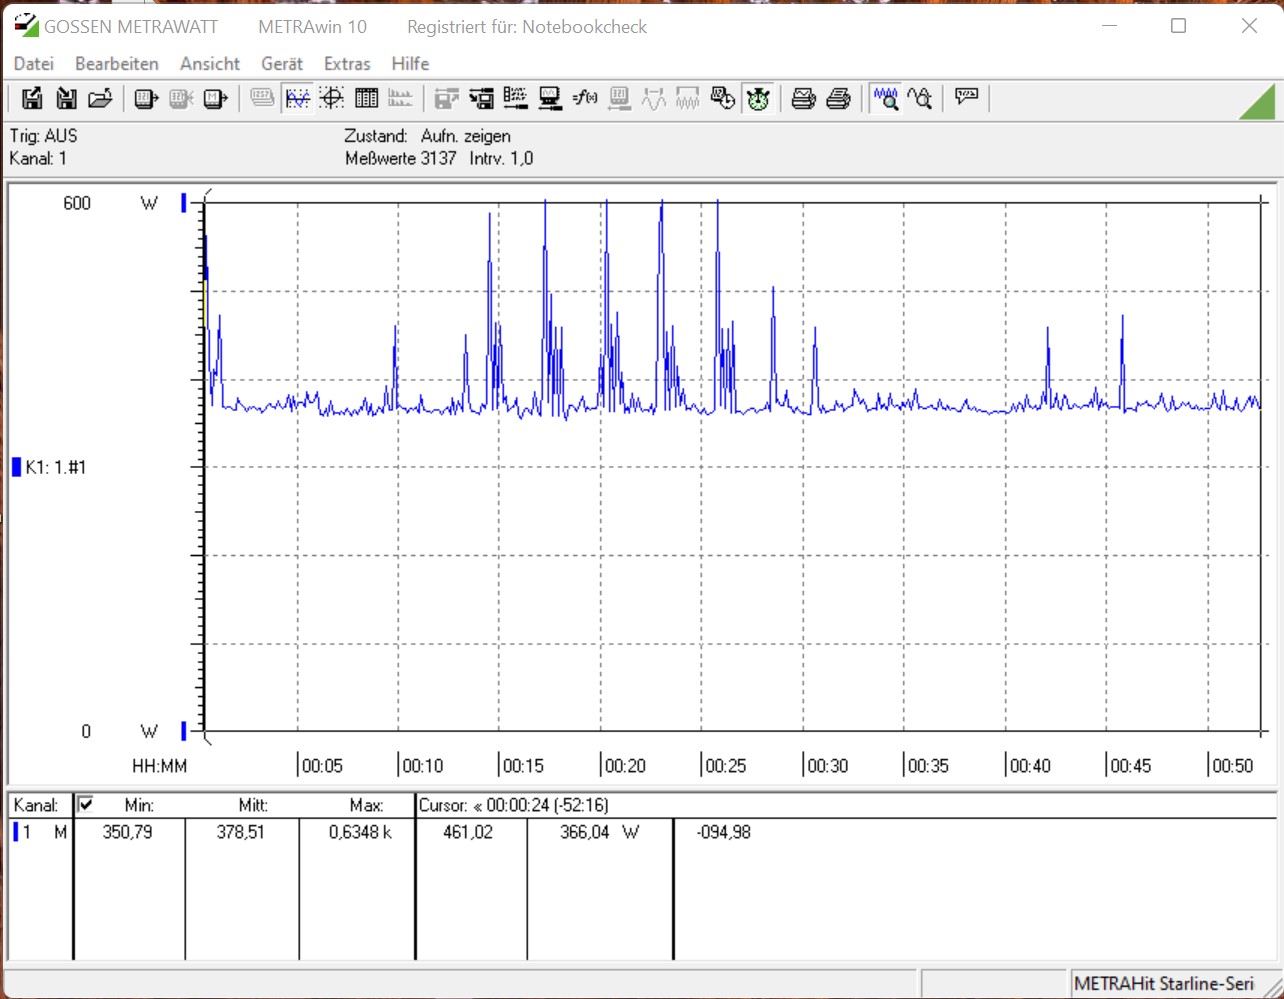
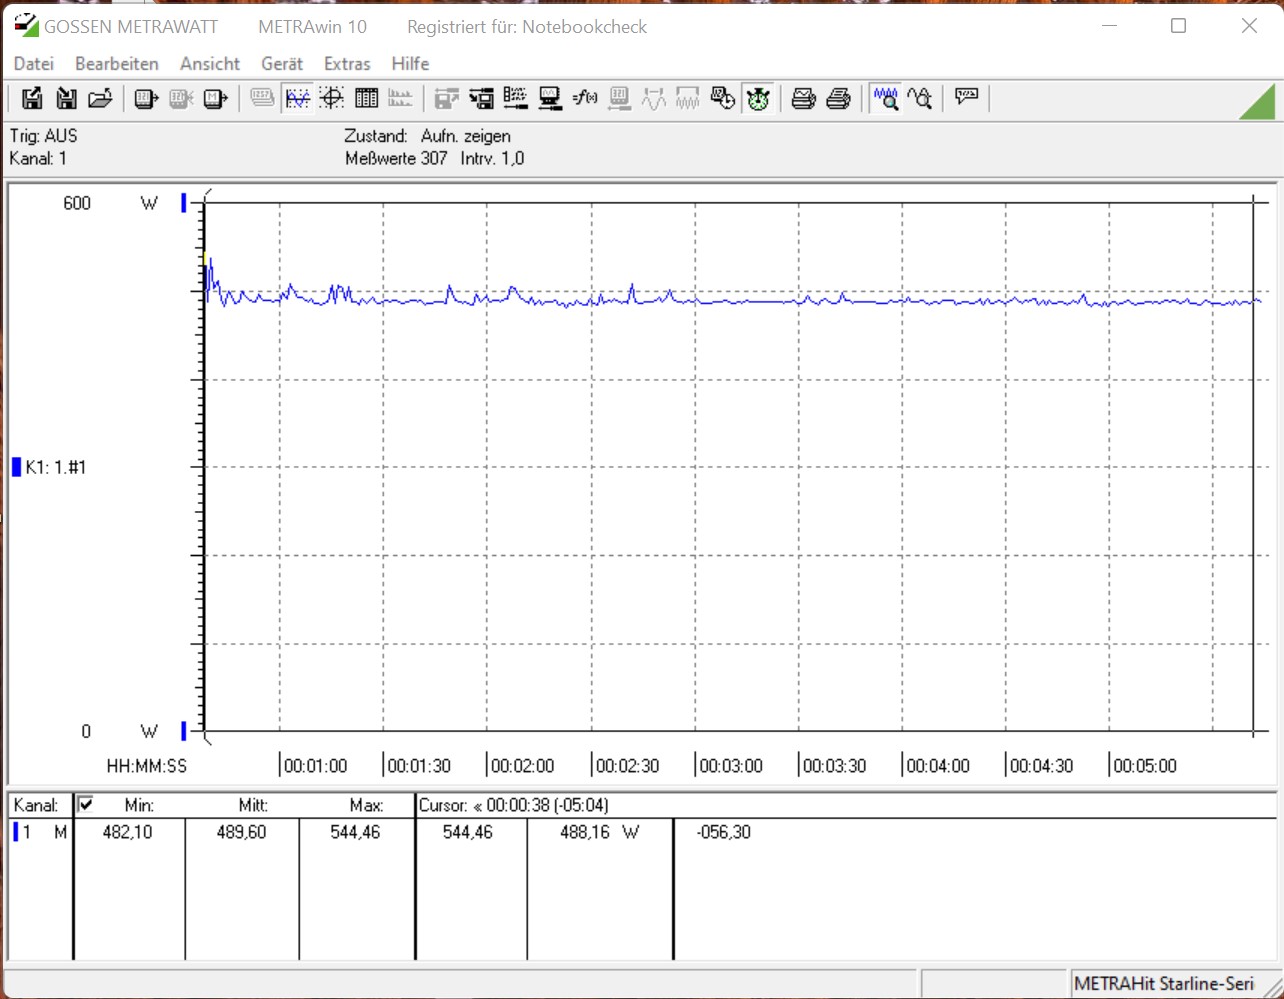
En ce qui concerne la consommation d'énergie, le système se distingue par une faible consommation en mode veille. Pendant le jeu, l'alimentation compacte de 750 watts (construction SFF) doit fournir 489 watts en moyenne, avec des pointes atteignant 544 watts. Pendant le test de stress, nous avons même brièvement mesuré 635 watts. L'alimentation a toujours été capable de gérer cela et nous n'avons remarqué aucun problème.
| Power Consumption - 1920x1080 The Witcher 3 ultra (external Monitor) | |
| Intel Core i9-12900K, NVIDIA GeForce RTX 3080 Ti | |
| Intel Core i9-12900K, NVIDIA Titan RTX (Idle: 70.5 W) | |
| AMD Ryzen 9 5950X, NVIDIA Titan RTX (Idle: 78 W) | |
| AMD Ryzen 9 5900X, NVIDIA Titan RTX (Idle: 78.1 W) | |
| Intel Core i5-11600K, NVIDIA Titan RTX (Idle: 69.49 W) | |
| Intel Core i5-12600K, NVIDIA Titan RTX (Idle: 70.45 W) | |
| Intel Core i9-11900K, NVIDIA Titan RTX (Idle: 57.3 W) | |
* ... Moindre est la valeur, meilleures sont les performances
| Power Consumption - 1280x720 FurMark 1.19 GPU Stress Test (external Monitor) | |
| AMD Ryzen 9 5900X, NVIDIA GeForce RTX 3090 (Idle: 105.9 W) | |
| AMD Ryzen 9 5900X, NVIDIA GeForce RTX 3080 (Idle: 88.3 W) | |
| Intel Core i9-12900K, NVIDIA GeForce RTX 3080 Ti | |
| AMD Ryzen 9 5950X, AMD Radeon RX 6800 XT (Idle: 99.5 W) | |
| AMD Ryzen 9 5900X, NVIDIA GeForce RTX 3070 (Idle: 95.1 W) | |
| AMD Ryzen 9 5900X, AMD Radeon RX 6800 (Idle: 81.4 W) | |
| AMD Ryzen 9 5900X, AMD Radeon RX 6700 XT (Idle: 77.1 W) | |
* ... Moindre est la valeur, meilleures sont les performances
Power consumption The Witcher 3 / stress test
Power consumption with external monitor
Verdict - Un PC de jeu 4K parfait
Points positifs
Points négatifs
Bien que le Corsair One i300 ne soit pas une nouveauté complète, ce n'est pas absolument nécessaire. L'apparence de ce PC compact haut de gamme est simple et moderne. De plus, la conception interne permet d'utiliser des composants conventionnels en termes de carte mère et d'alimentation. Seul le système de refroidissement est une conception interne. Dans notre modèle de test, il ne rend malheureusement pas justice au segment premium. Néanmoins, les deux AiOs fonctionnent bien, refroidissant le système de manière fiable. Cependant, les deux pompes se font remarquer sur le plan acoustique. A la longue, c'est désagréable et compte tenu du prix d'achat de 5099 Euros (~5722$), ce n'est pas non plus quelque chose que l'on doit accepter. Mais le design du système de refroidissement reste le point fort en plus des composants les plus actuels. Avec le Intel Core i9-12900Kon trouve le processeur de jeu le plus rapide, qui, combiné à une carte mère actuelle comprenant de la mémoire vive DDR5 et un processeur Nvidia RTX.Nvidia GeForce RTX 3080 Tipermet de jouer en 4K sans aucun compromis. En outre, il y a également un SSD de 2 To avec de très bons taux de transfert.
Grâce à un Intel Core i9-12900K et une Nvidia GeForce RTX 3080 Ti, leCorsair One i300 offredes performances de jeu4K
en utilisant un minimum d'espace.
Un produit premium a naturellement aussi son prix. À 5099 euros (~5722) pour notre unité de test, ce n'est pas exactement bon marché, et il ne faut quand même pas dire du mal des composants séparés. Le boîtier n'est pas disponible sur étagère et ne peut être acheté séparément. En outre, la disponibilité de diverses cartes graphiques et d'autres composants courants est encore un problème, ce qui rend presque le prix justifiable dans l'ensemble. Le système est également équipé de deux AiO qui ont été spécifiquement développés pour la série Corsair One. Cela doit être pris en compte dans l'évaluation du prix. Cependant, à notre avis, le Corsair One i300 avec un Intel Core i9-12900K et Nvidia GeForce RTX 3080 serait le système le plus raisonnable en termes de prix. Mais alors la RAM et le SSD ne seraient que la moitié de la taille avec 32 GB et 1 TB respectivement. Un système avec ces composants est disponible pour 4099 euros (4562 $). Le déficit de performance de la Nvidia GeForce RTX 3080 par rapport au modèle Ti est limité et acceptable.
Prix et disponibilité
Au moment de ce test, l'appareil peut être acheté directement sur Corsair pour 5000 $. Le plus petit modèle peut également être acheté sur le site Amazon pour 4 000 $.

