Test du Dell XPS 13 Plus 9320 : Core i5-1240P, i7-1260P, ou i7-1280P OLED ?
Après son dévoilement initial au CES 2022, le XPS 13 Plus 2022 est maintenant livré avec trois options de processeur à choisir (Core i5-1240P, Core i7-1260P, et Core i7-1280P) avec trois résolutions d'affichage différentes (1920 x 1200 IPS, 3456 x 2160 OLED, et 3840 x 2400 IPS). Nous avons déjà testé les configurations i5-1240P, i7-1260P, 1200p IPS, et 2400p IPS, il ne reste plus que la configuration i7-1280P 2160p OLED
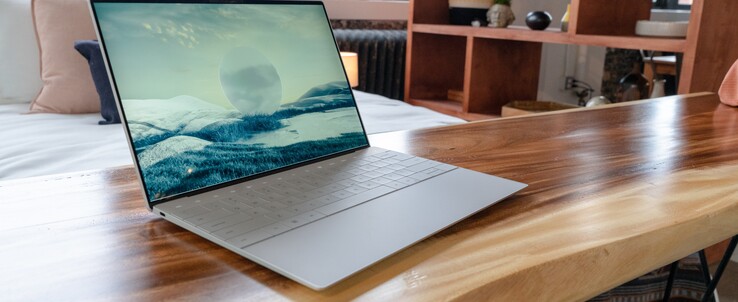
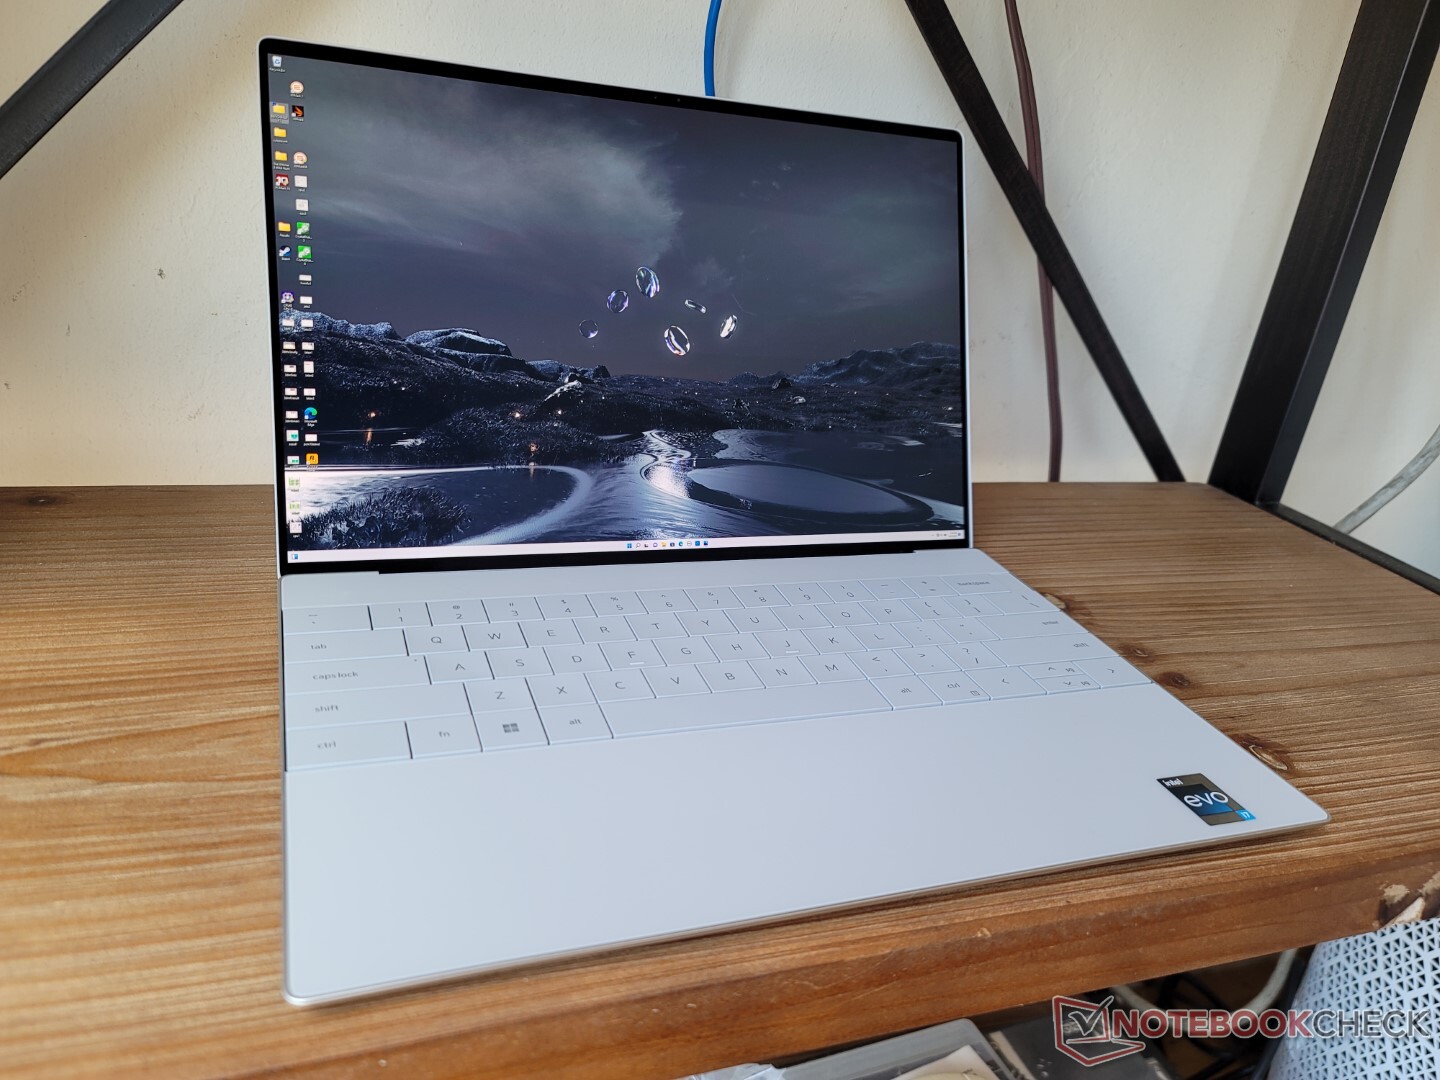
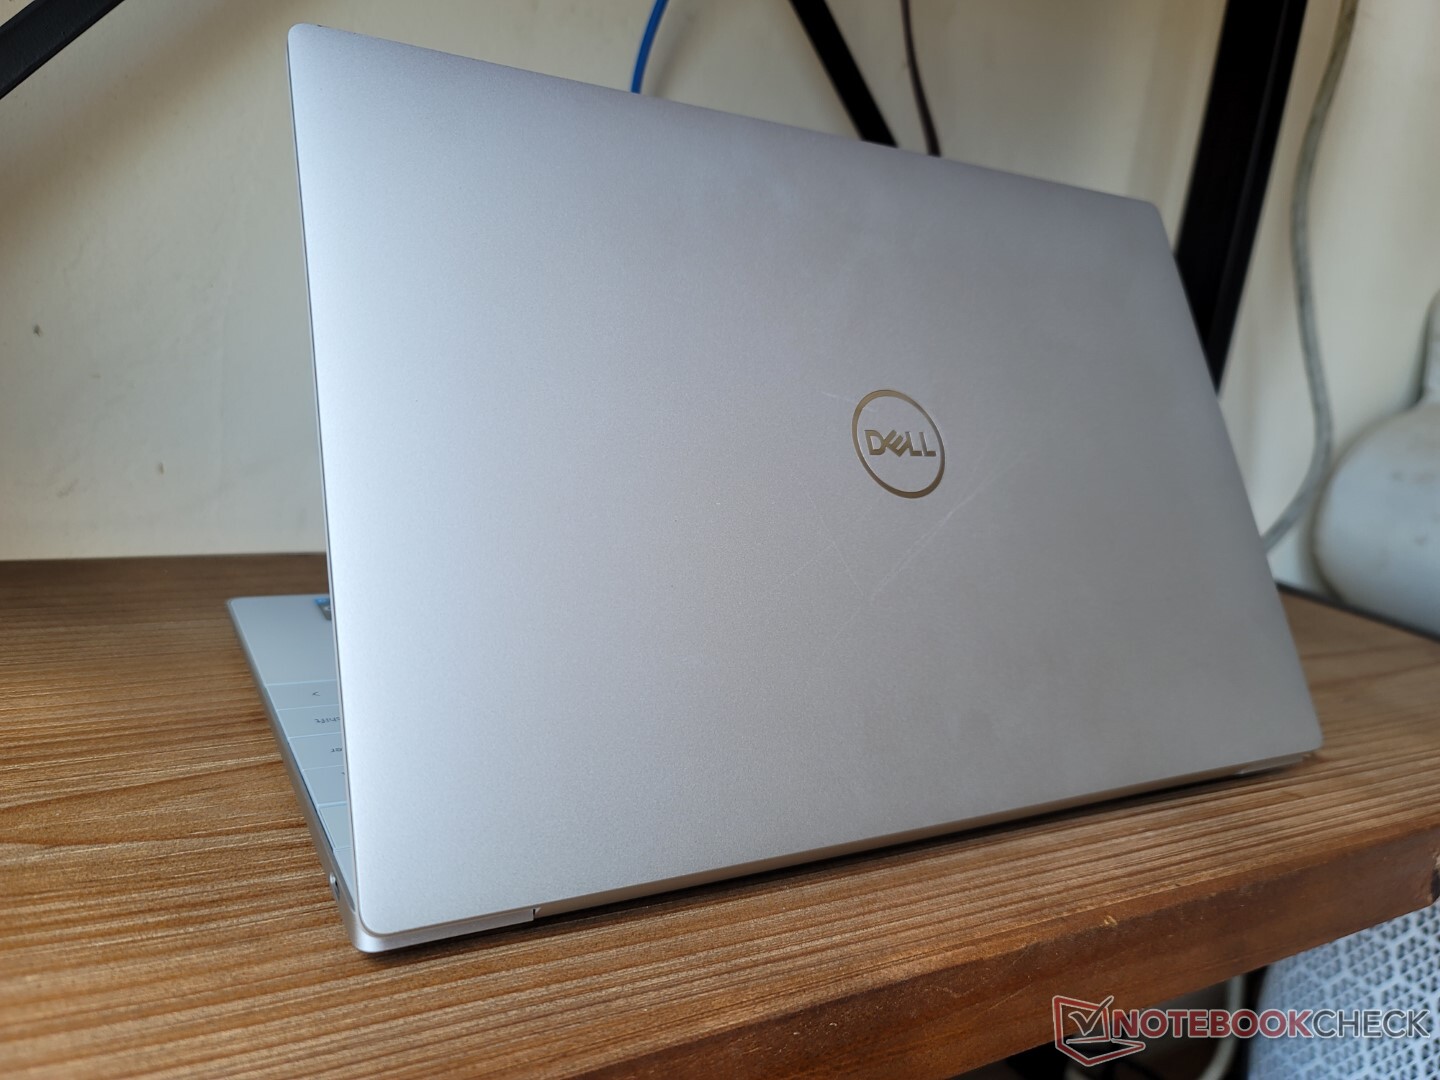
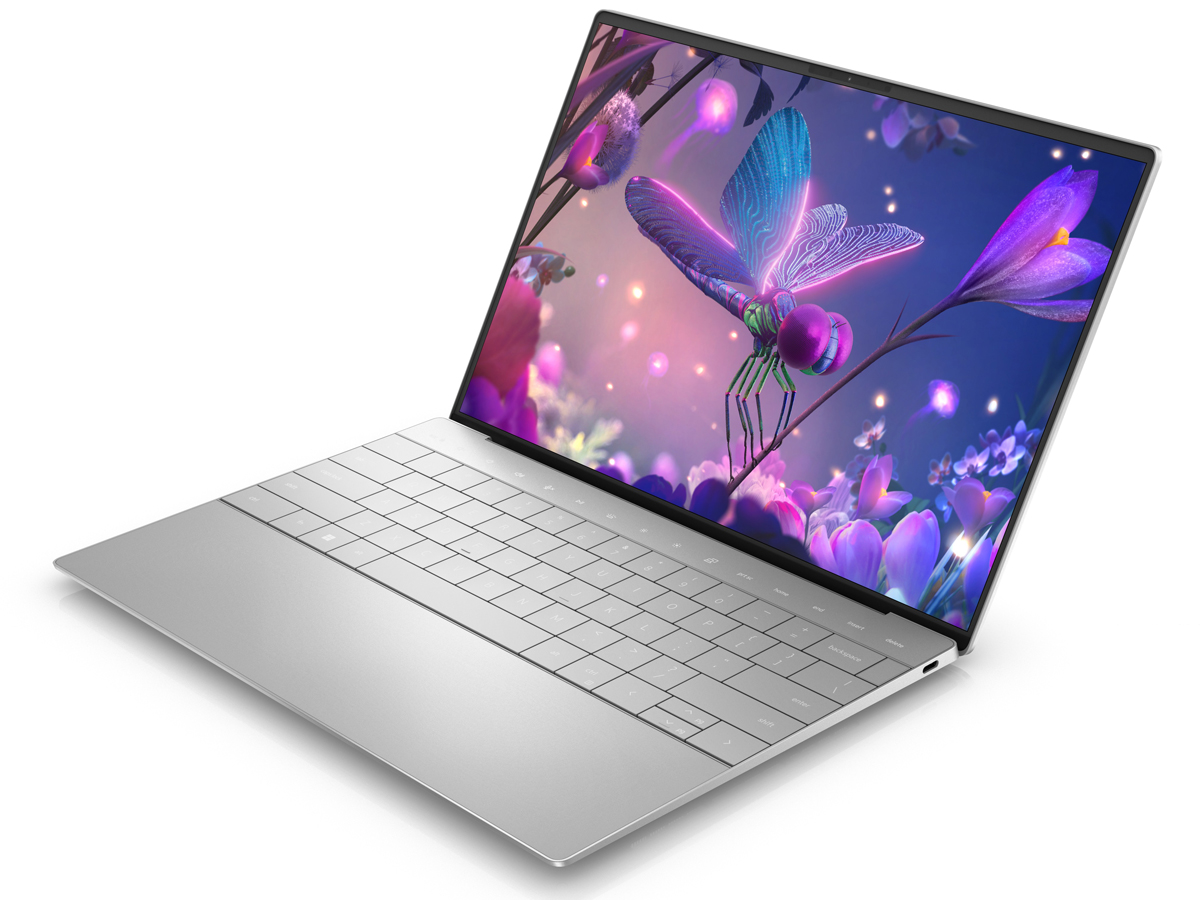
Cette revue se concentre sur la configuration i7-1280P et 2160p OLED et les différences auxquelles les utilisateurs peuvent s'attendre entre elle et les autres options du XPS 13 Plus. Tel que configuré, l'unité est actuellement vendue au prix de 1750 $ US. Nous vous recommandons de consulter notre existant deux critiques sur le XPS 13 Plus pour en savoir plus sur les caractéristiques physiques de ce modèle
Plus de commentaires sur Dell
Comparaison avec les concurrents potentiels
Note | Date | Modèle | Poids | Épaisseur | Taille | Résolution | Prix |
|---|---|---|---|---|---|---|---|
| 87.3 % v7 (old) | 09/22 | Dell XPS 13 Plus 9320 i7-1280P OLED i7-1280P, Iris Xe G7 96EUs | 1.3 kg | 15.28 mm | 13.40" | 3456x2160 | |
| 86.1 % v7 (old) | 08/22 | Dell XPS 13 Plus 9320 i5-1240p i5-1240P, Iris Xe G7 80EUs | 1.2 kg | 15.3 mm | 13.40" | 1920x1200 | |
| 88.2 % v7 (old) | 08/22 | Dell XPS 13 9315, i5-1230U i5-1230U, Iris Xe G7 80EUs | 1.2 kg | 14 mm | 13.40" | 1920x1200 | |
| 86.9 % v7 (old) | 07/22 | Dell XPS 13 Plus 9320 4K i7-1260P, Iris Xe G7 96EUs | 1.2 kg | 15.3 mm | 13.40" | 3840x2400 | |
| 86.7 % v7 (old) | 10/21 | Dell XPS 13 9310 2-in-1 i7-1165G7, Iris Xe G7 96EUs | 1.3 kg | 14.35 mm | 13.40" | 1920x1200 | |
| 88.3 % v7 (old) | 06/21 | Dell XPS 13 9310 OLED i7-1185G7, Iris Xe G7 96EUs | 1.2 kg | 14.8 mm | 13.40" | 3456x2160 |
Cas
Afficher
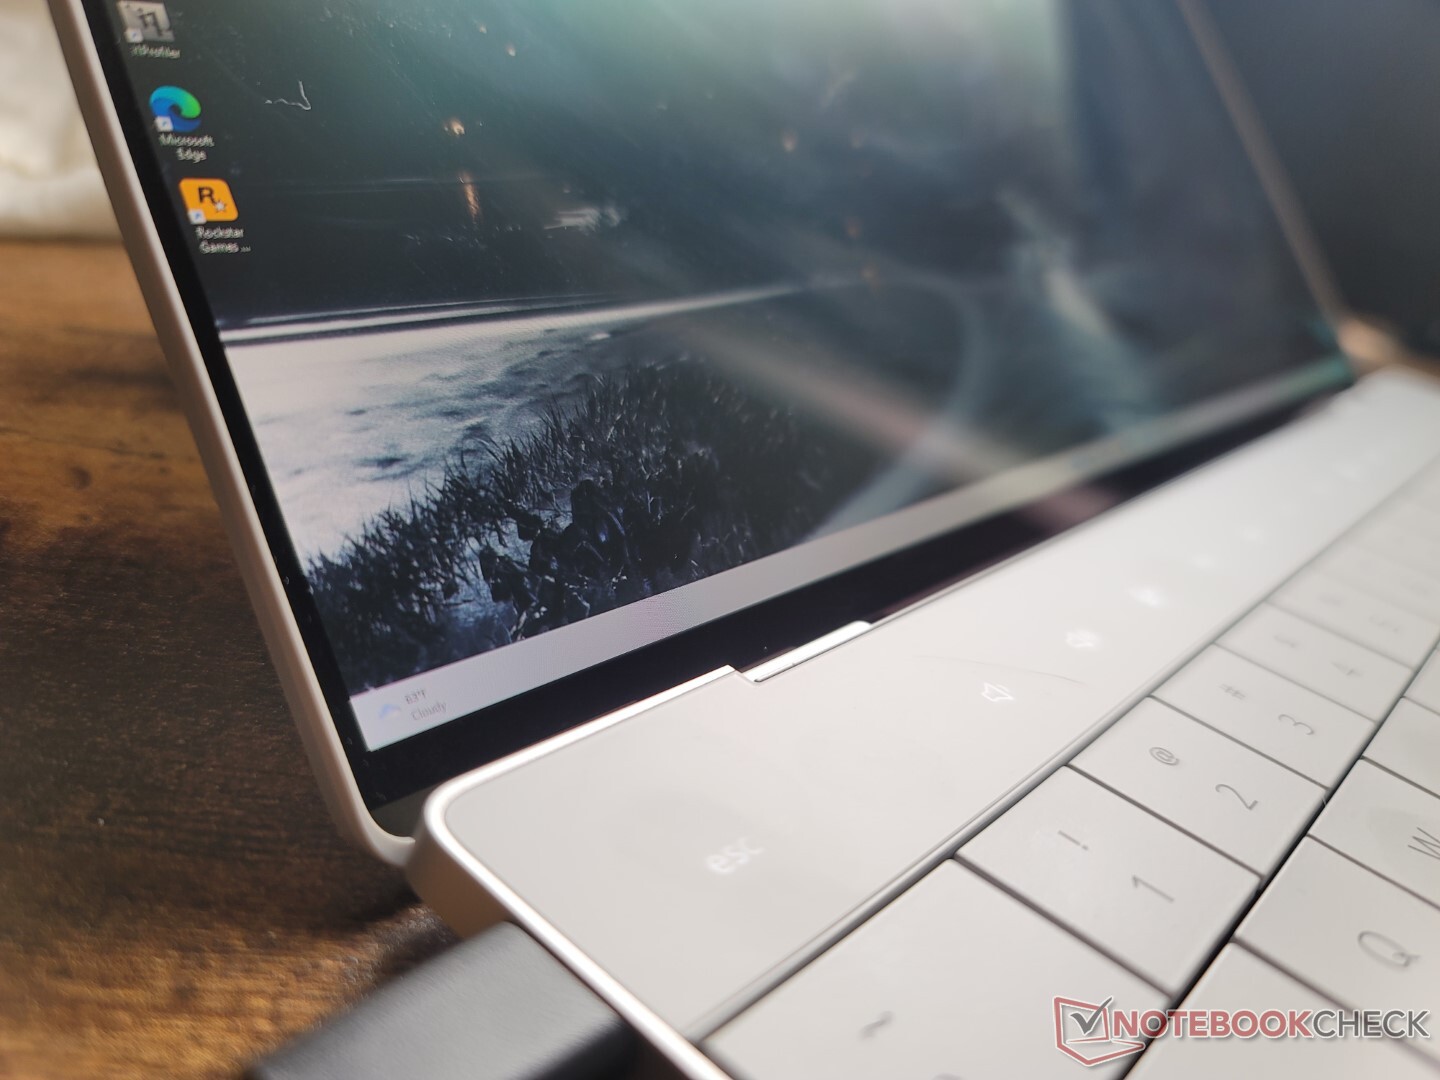
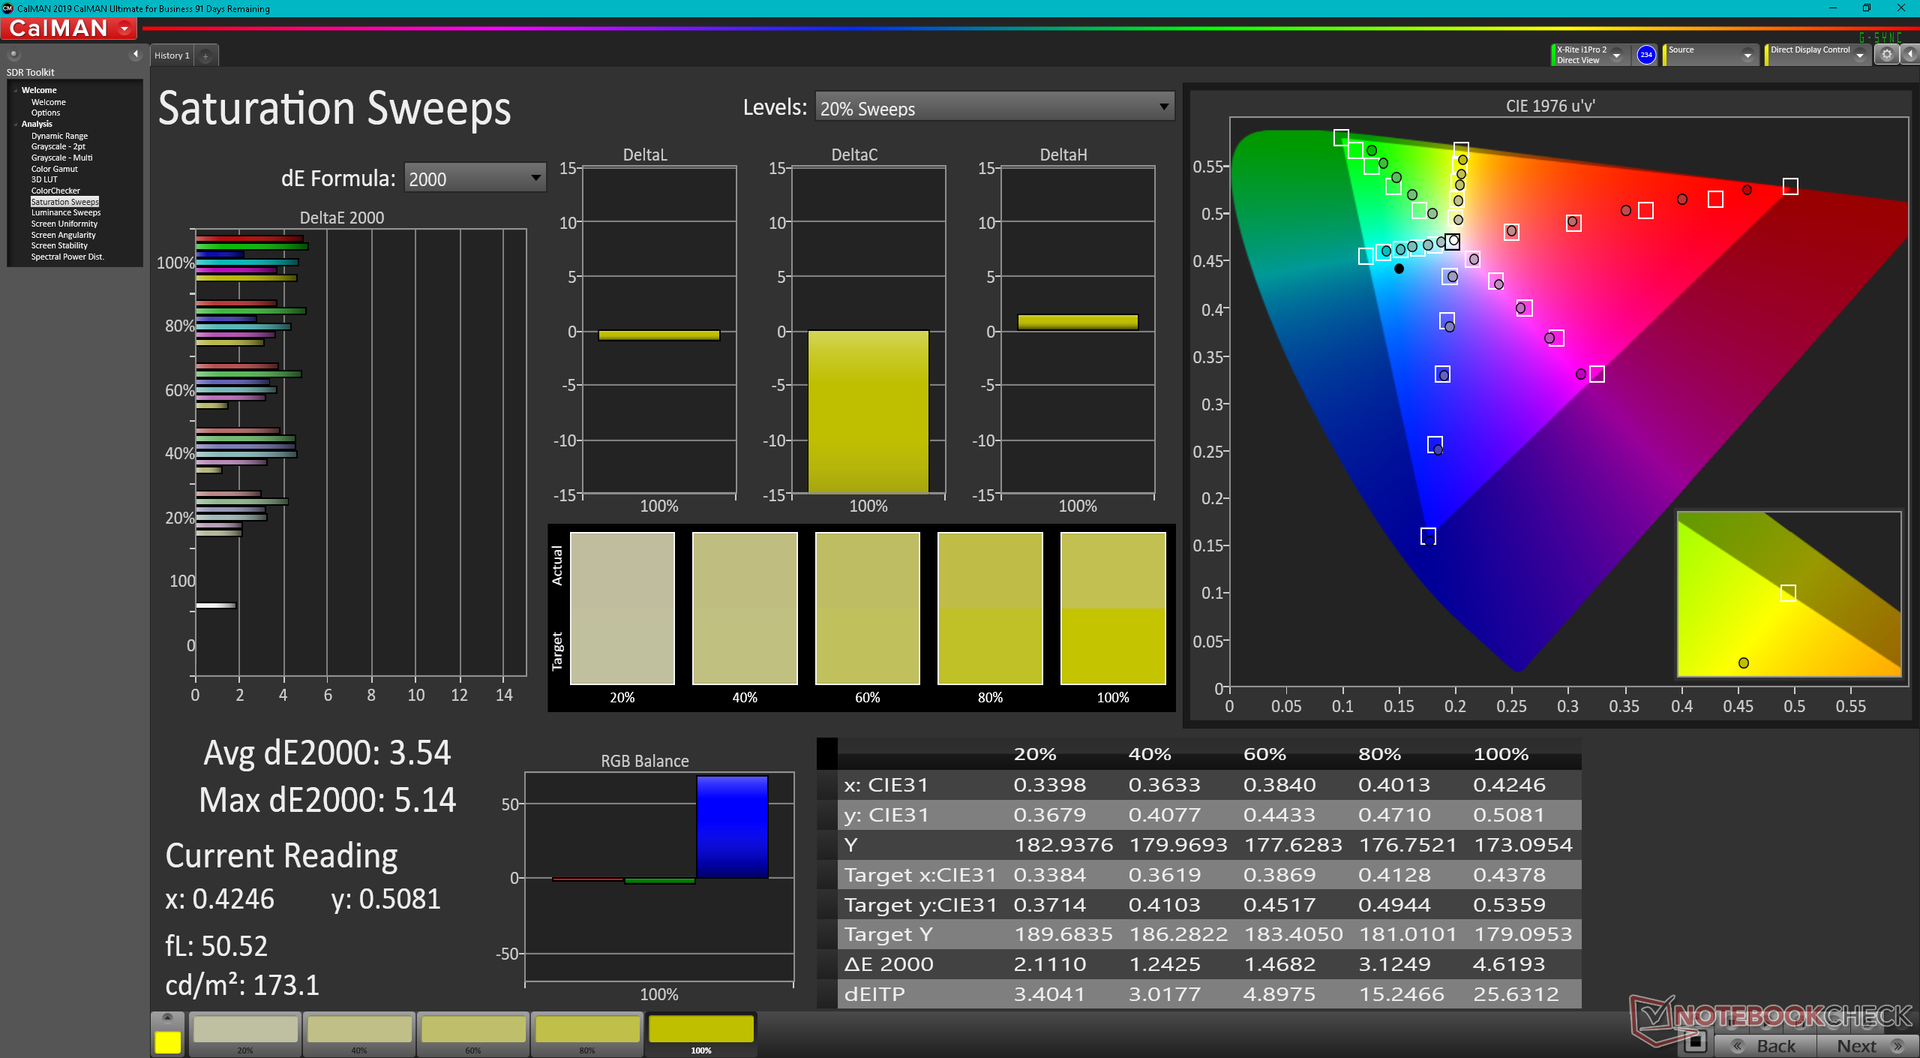
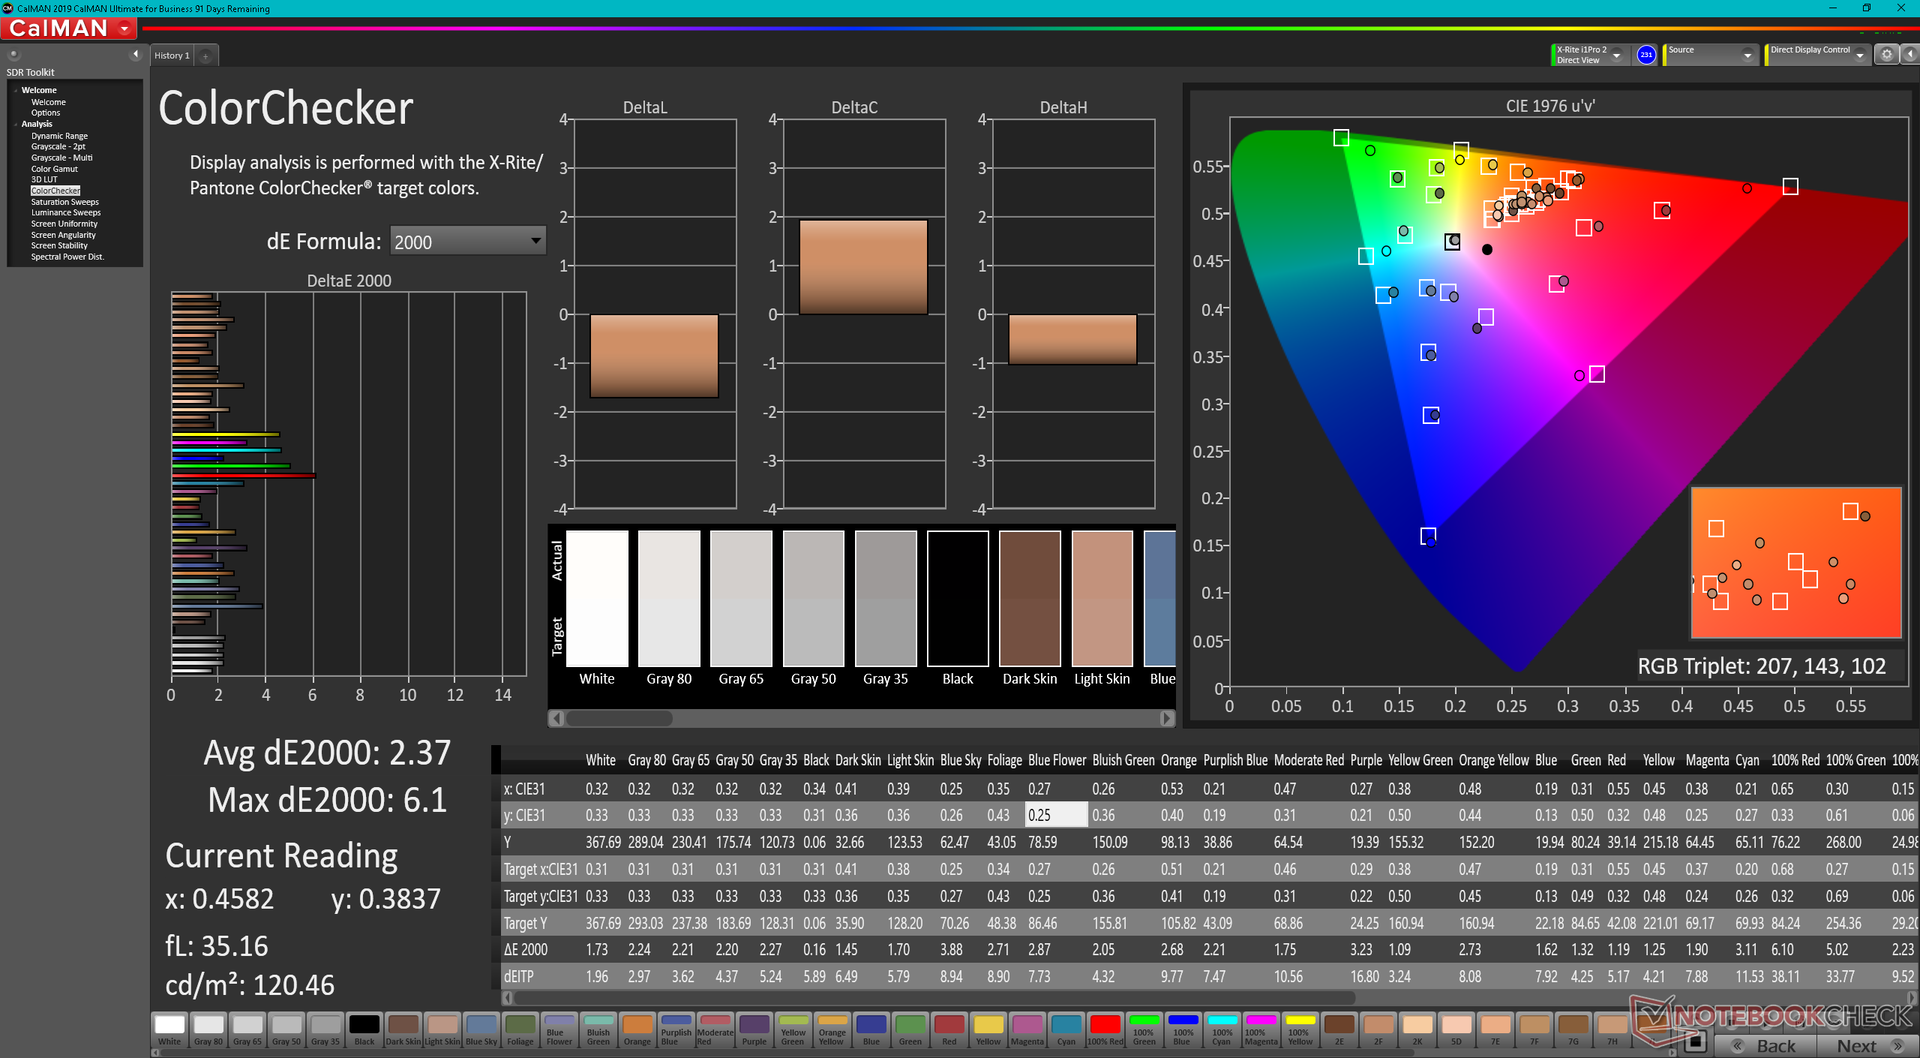
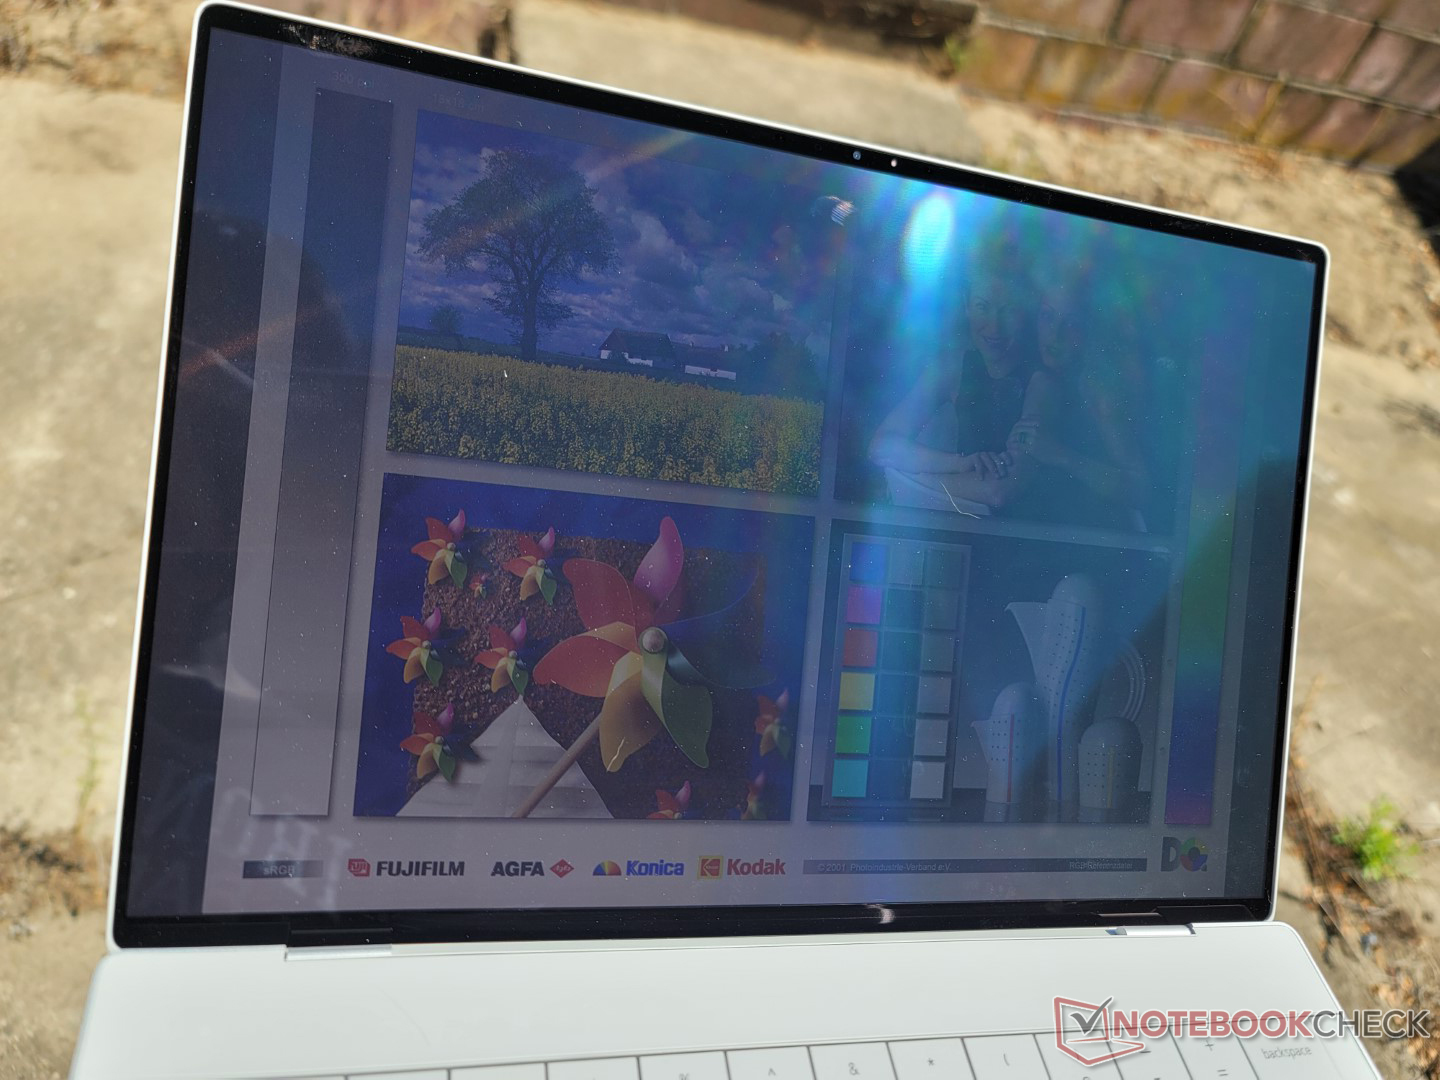
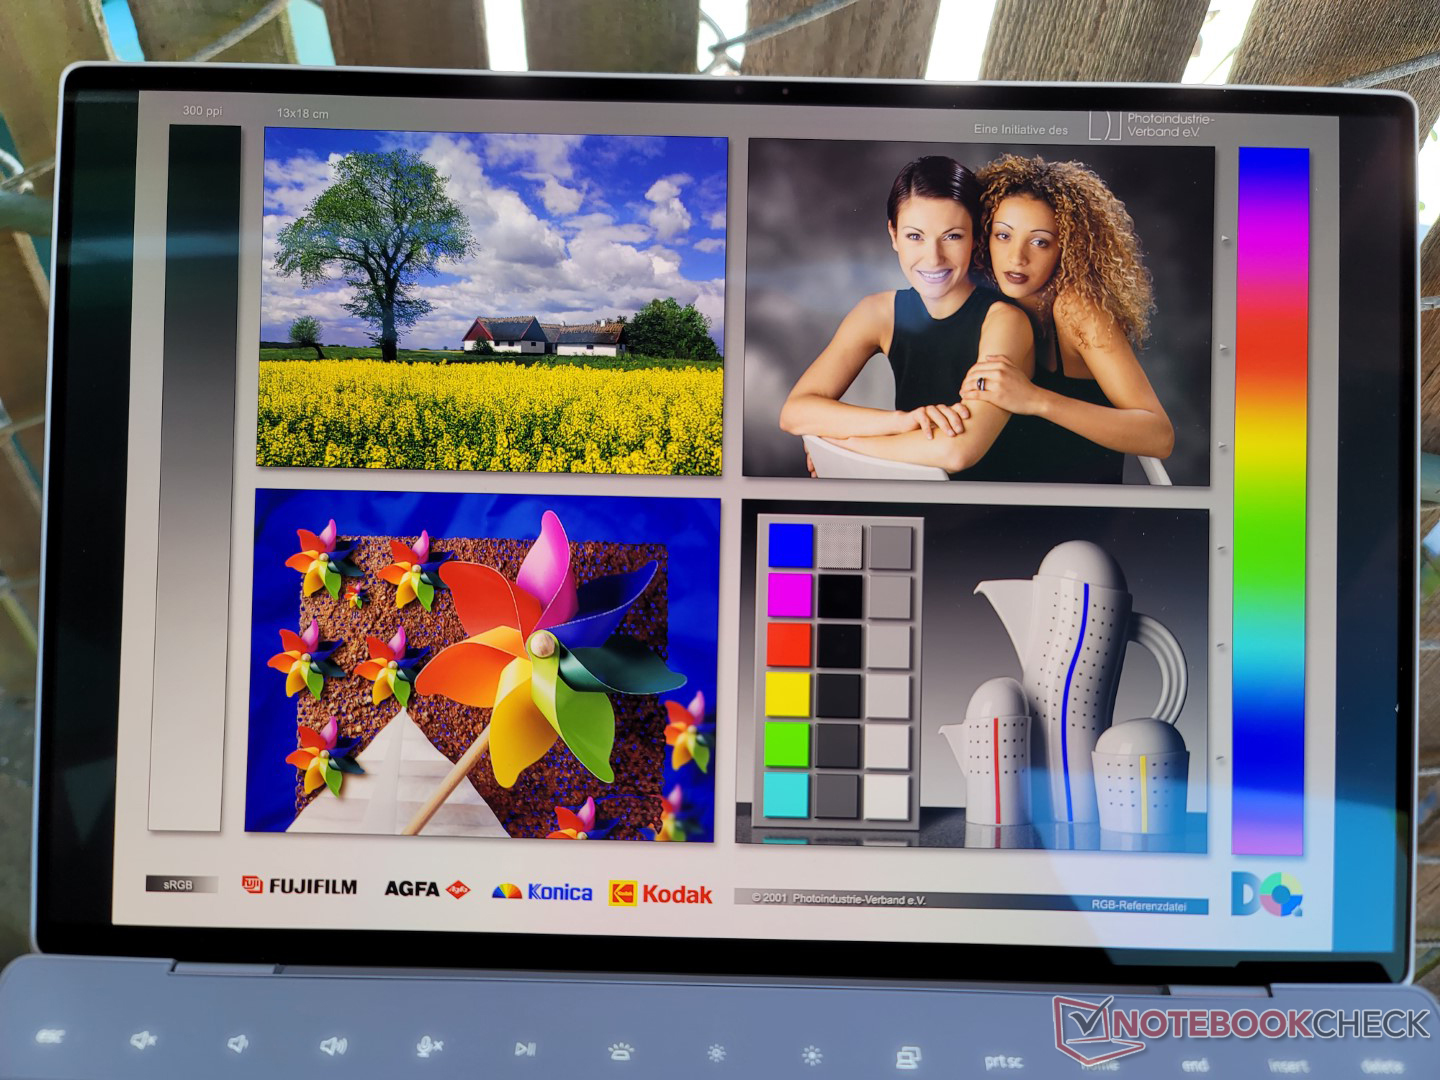
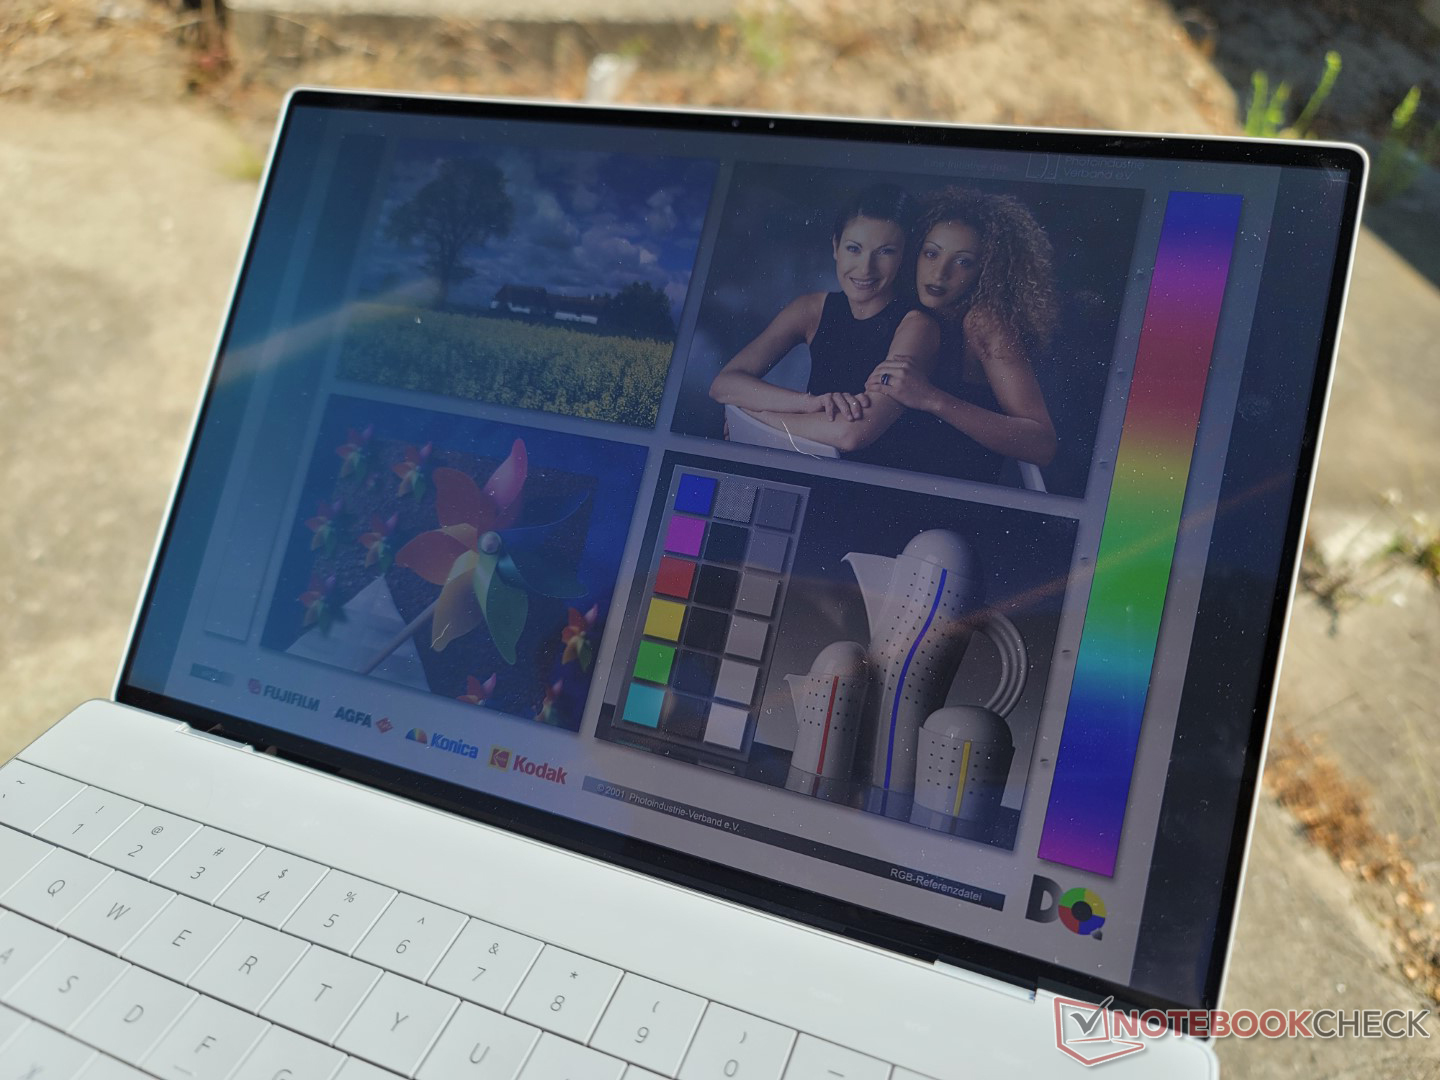
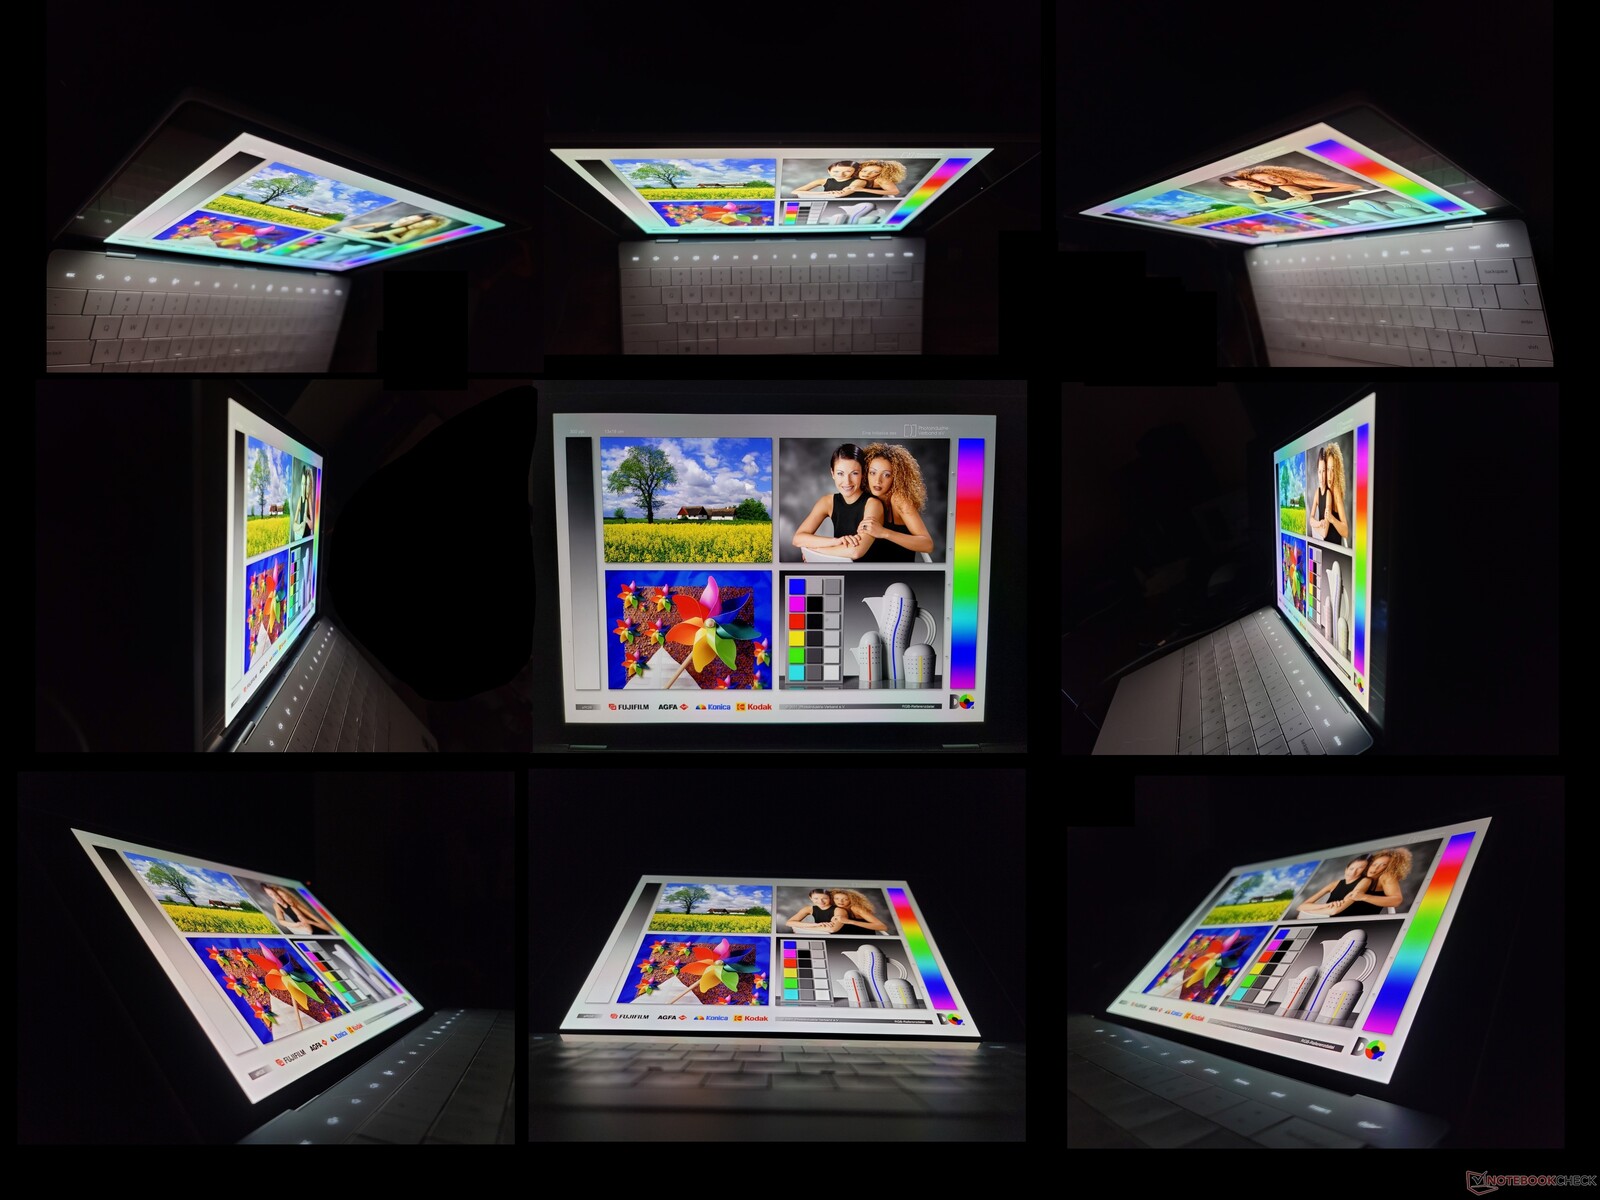
La dalle OLED n'est pas la solution miracle, car elle présente à la fois des avantages et des inconvénients par rapport à l'IPS. Les avantages comprennent une meilleure uniformité de la luminosité, des niveaux de noir plus profonds, une couverture P3 complète et des temps de réponse noir-blanc et gris-gris nettement plus rapides. Les inconvénients sont le scintillement de l'écran et une luminosité maximale plus faible de 100 nit. La différence de luminosité ne devrait pas être un problème si vous travaillez à l'intérieur, mais les panneaux IPS sont légèrement plus agréables pour les yeux si vous travaillez à l'extérieur.
Notez que le panneau OLED ici est presque exactement le même que celui utilisé pour la dernière génération du XPS 13 9310 (Samsung 134XK04 vs. Samsung 134XK01). Si vous avez déjà vu le XPS 13 9310 OLED, vous saurez exactement à quoi vous attendre avec le XPS 13 Plus 9320 OLED.

| |||||||||||||||||||||||||
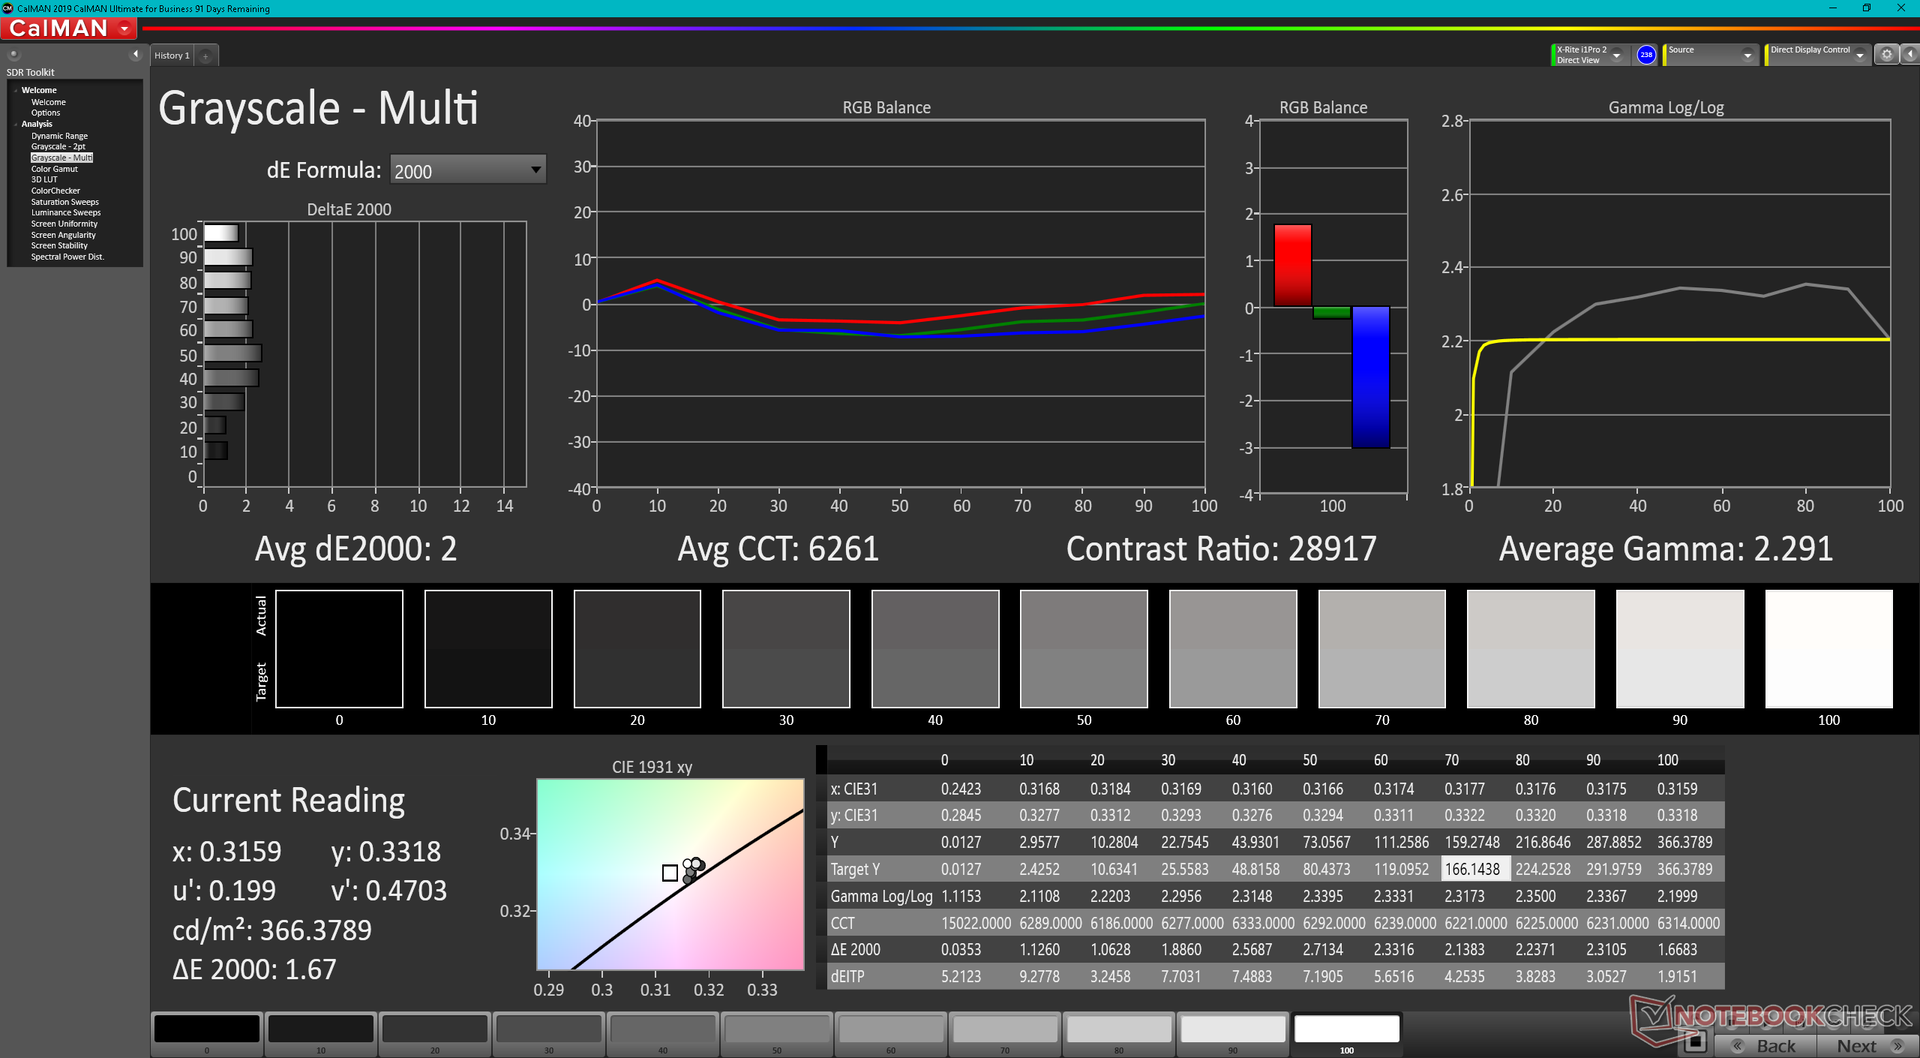
Homogénéité de la luminosité: 98 %
Valeur mesurée au centre, sur batterie: 371.8 cd/m²
Contraste: ∞:1 (Valeurs des noirs: 0 cd/m²)
ΔE ColorChecker Calman: 2.37 | ∀{0.5-29.43 Ø4.71}
ΔE Greyscale Calman: 2 | ∀{0.09-98 Ø4.96}
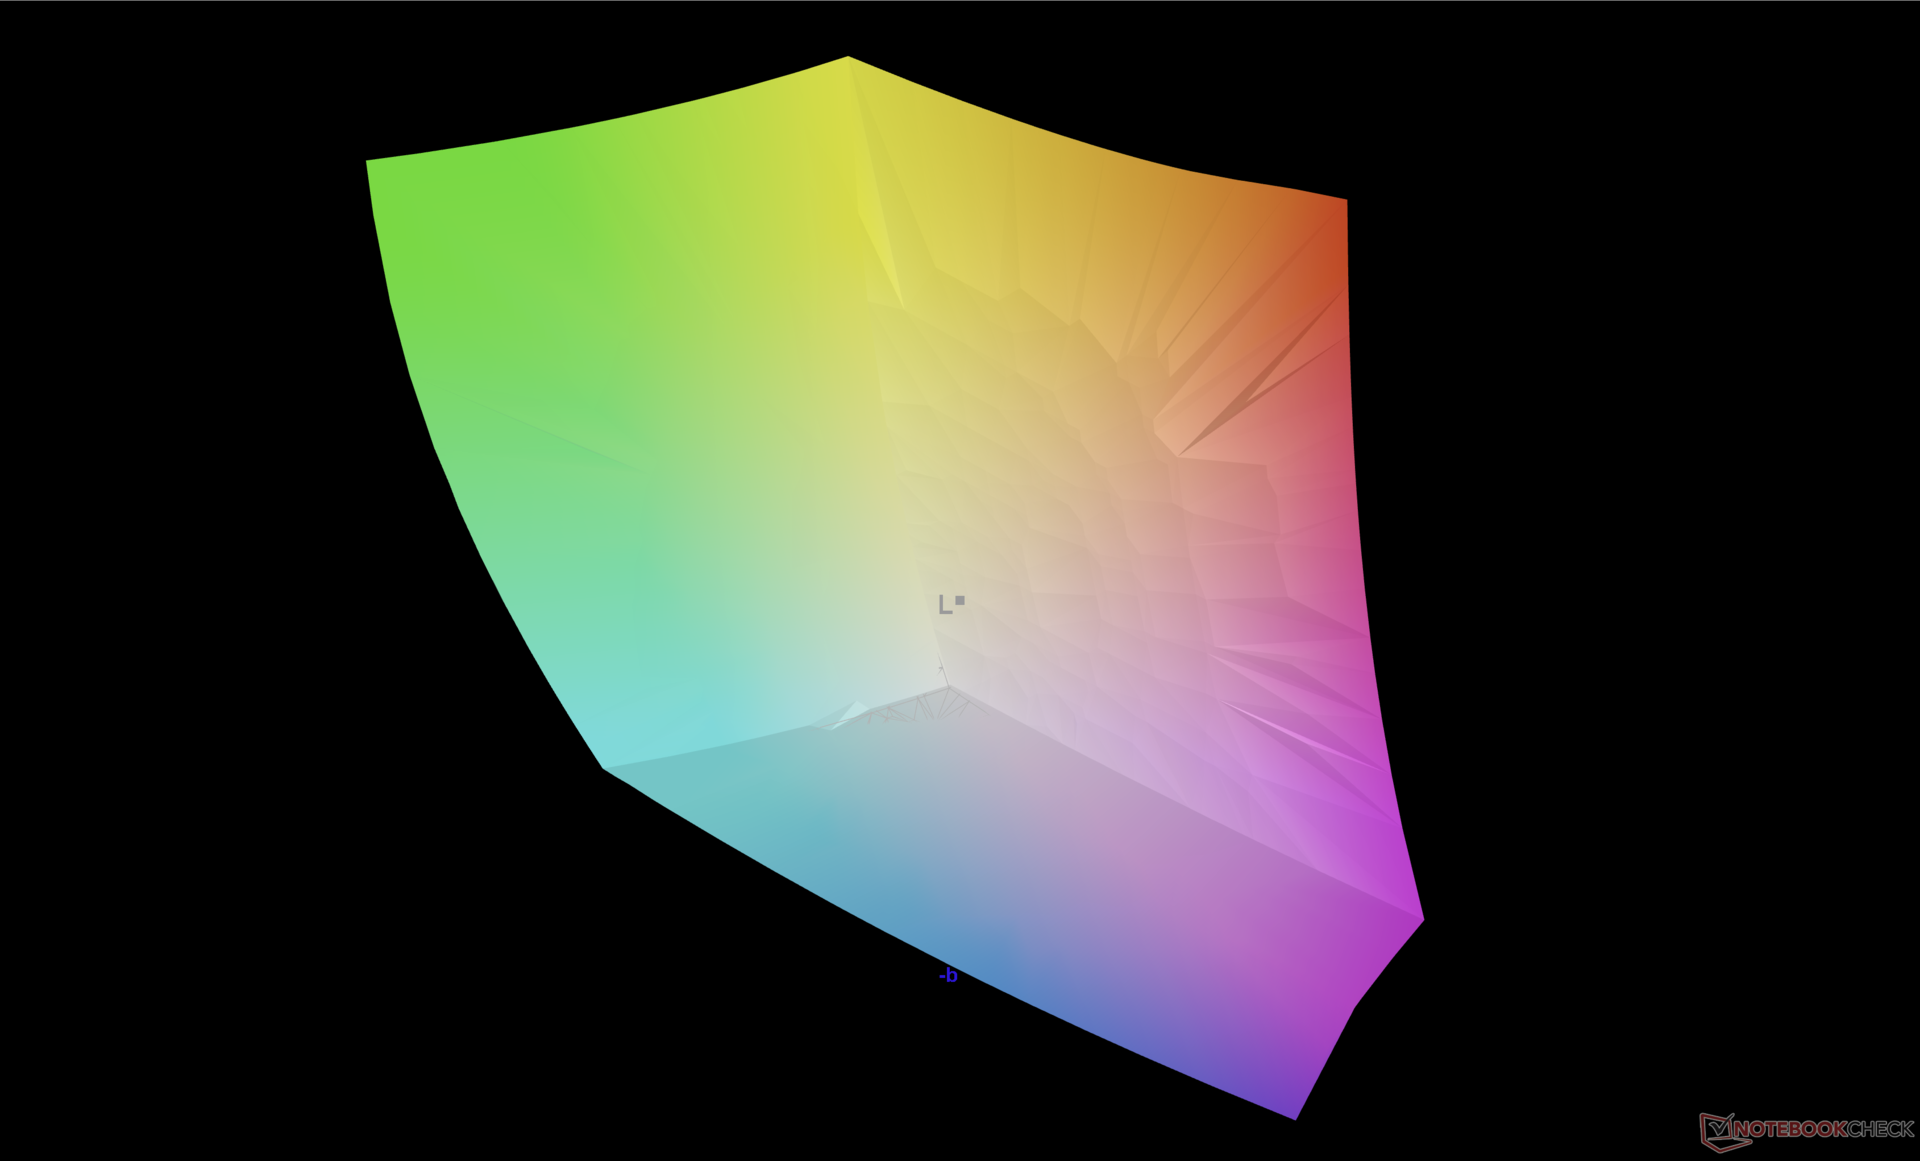
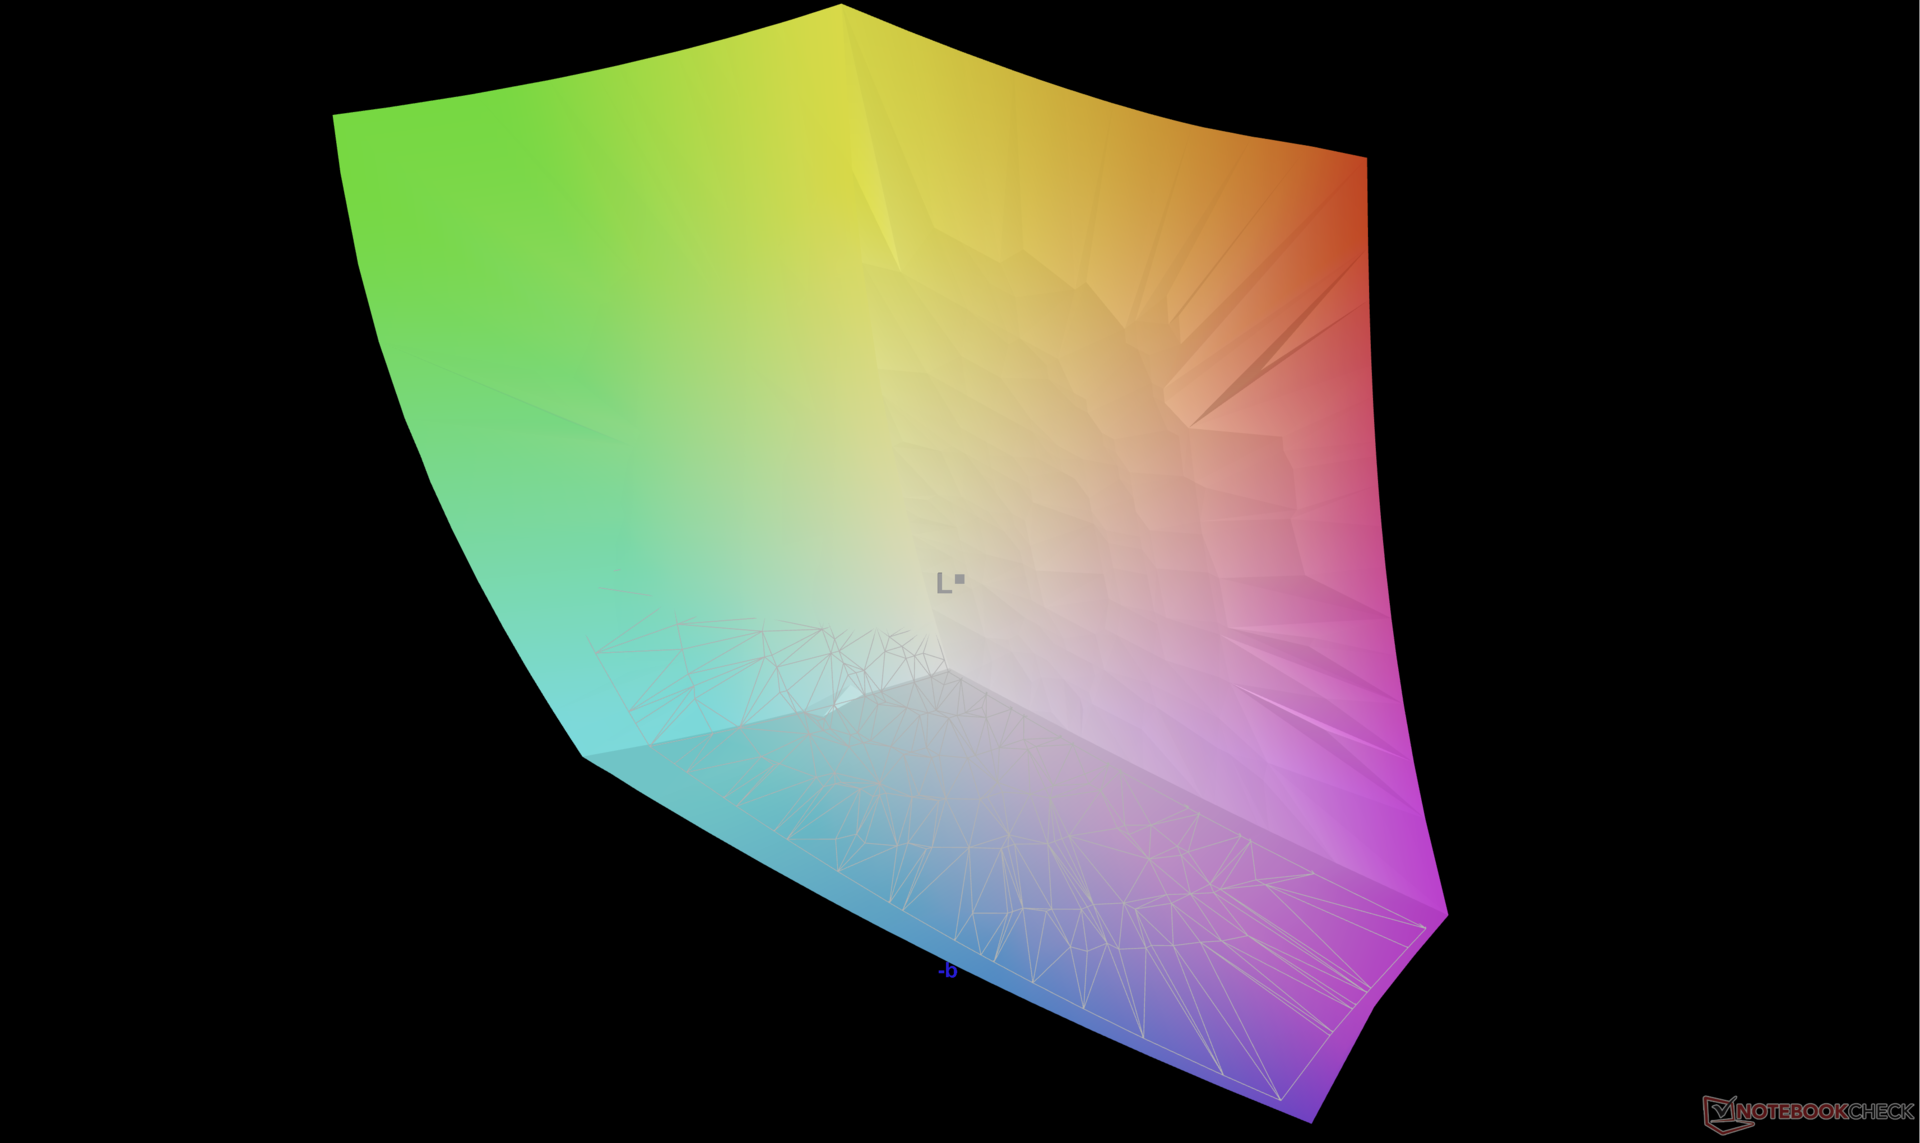
98.4% AdobeRGB 1998 (Argyll 3D)
100% sRGB (Argyll 3D)
99.5% Display P3 (Argyll 3D)
Gamma: 2.29
CCT: 6261 K
| Dell XPS 13 Plus 9320 i7-1280P OLED Samsung 134XK04, OLED, 3456x2160, 13.4" | Dell XPS 13 Plus 9320 i5-1240p Sharp SHP1548 LQ134N1, IPS, 1920x1200, 13.4" | Dell XPS 13 9315, i5-1230U Sharp SHP1548 LQ134N1, IPS, 1920x1200, 13.4" | Dell XPS 13 Plus 9320 4K LQ134R1, IPS, 3840x2400, 13.4" | Dell XPS 13 9310 2-in-1 Sharp LQ134N1, IPS, 1920x1200, 13.4" | Dell XPS 13 9310 OLED Samsung 134XK01, OLED, 3456x2160, 13.4" | |
|---|---|---|---|---|---|---|
| Display | -20% | -20% | -15% | -19% | -0% | |
| Display P3 Coverage (%) | 99.5 | 69 -31% | 69 -31% | 76.5 -23% | 69.7 -30% | 99.7 0% |
| sRGB Coverage (%) | 100 | 99 -1% | 100 0% | 100 0% | 99 -1% | 100 0% |
| AdobeRGB 1998 Coverage (%) | 98.4 | 71 -28% | 71 -28% | 76 -23% | 71.7 -27% | 97.7 -1% |
| Response Times | -1266% | -1193% | -1170% | -1931% | 5% | |
| Response Time Grey 50% / Grey 80% * (ms) | 2.6 ? | 45 ? -1631% | 40 ? -1438% | 38.9 ? -1396% | 55.6 ? -2038% | 2.2 ? 15% |
| Response Time Black / White * (ms) | 2.1 ? | 21 ? -900% | 22 ? -948% | 21.9 ? -943% | 40.4 ? -1824% | 2.2 ? -5% |
| PWM Frequency (Hz) | 59.5 | 2500 ? | 240.4 ? | |||
| Screen | -23% | -10% | -2% | -44% | -14% | |
| Brightness middle (cd/m²) | 371.8 | 498 34% | 466 25% | 494 33% | 555.7 49% | 384 3% |
| Brightness (cd/m²) | 374 | 460 23% | 442 18% | 474 27% | 528 41% | 387 3% |
| Brightness Distribution (%) | 98 | 85 -13% | 89 -9% | 89 -9% | 90 -8% | 97 -1% |
| Black Level * (cd/m²) | 0.53 | 0.4 | 0.28 | 0.35 | ||
| Colorchecker dE 2000 * | 2.37 | 3.65 -54% | 3.03 -28% | 3.1 -31% | 4.83 -104% | 4.56 -92% |
| Colorchecker dE 2000 max. * | 6.1 | 7.11 -17% | 6.68 -10% | 4.2 31% | 8.46 -39% | 7.27 -19% |
| Greyscale dE 2000 * | 2 | 4.25 -113% | 3.12 -56% | 3.2 -60% | 6.1 -205% | 1.5 25% |
| Gamma | 2.29 96% | 2.45 90% | 2.41 91% | 2.41 91% | 1.98 111% | 2.26 97% |
| CCT | 6261 104% | 6690 97% | 6418 101% | 6189 105% | 6686 97% | 6219 105% |
| Contrast (:1) | 940 | 1165 | 1764 | 1588 | ||
| Colorchecker dE 2000 calibrated * | 2.16 | 2.34 | 1.5 | 0.76 | 4.52 | |
| Color Space (Percent of AdobeRGB 1998) (%) | 87.1 | |||||
| Color Space (Percent of sRGB) (%) | 100 | |||||
| Moyenne finale (programmes/paramètres) | -436% /
-248% | -408% /
-228% | -396% /
-218% | -665% /
-381% | -3% /
-7% |
* ... Moindre est la valeur, meilleures sont les performances
Temps de réponse de l'écran
| ↔ Temps de réponse noir à blanc | ||
|---|---|---|
| 2.1 ms ... hausse ↗ et chute ↘ combinées | ↗ 0.8 ms hausse | 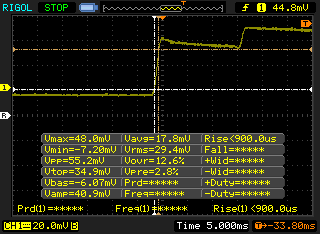 |
| ↘ 1.3 ms chute | ||
| L'écran montre de très faibles temps de réponse, parfait pour le jeu. En comparaison, tous les appareils testés affichent entre 0.1 (minimum) et 240 (maximum) ms. » 12 % des appareils testés affichent de meilleures performances. Cela signifie que les latences relevées sont meilleures que la moyenne (19.8 ms) de tous les appareils testés. | ||
| ↔ Temps de réponse gris 50% à gris 80% | ||
| 2.6 ms ... hausse ↗ et chute ↘ combinées | ↗ 1.3 ms hausse | 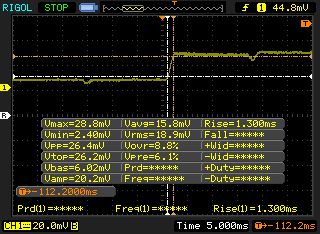 |
| ↘ 1.3 ms chute | ||
| L'écran montre de très faibles temps de réponse, parfait pour le jeu. En comparaison, tous les appareils testés affichent entre 0.165 (minimum) et 636 (maximum) ms. » 12 % des appareils testés affichent de meilleures performances. Cela signifie que les latences relevées sont meilleures que la moyenne (31 ms) de tous les appareils testés. | ||
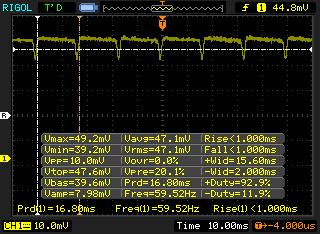
Scintillement / MLI (Modulation de largeur d'impulsion)
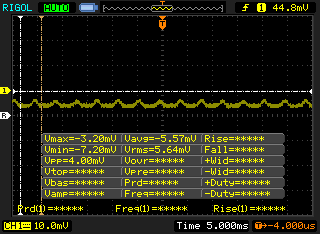
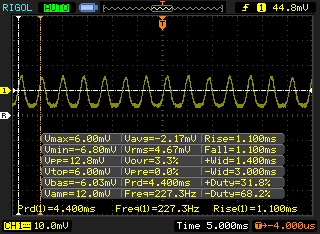
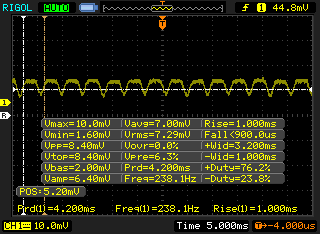
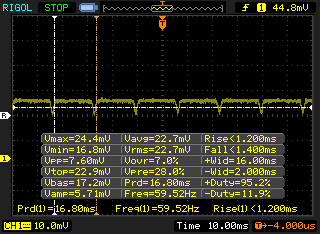
| Scintillement / MLI (Modulation de largeur d'impulsion) décelé | 59.5 Hz |  | |
Le rétroéclairage de l'écran scintille à la fréquence de 59.5 Hz (certainement du fait de l'utilisation d'une MDI - Modulation de largeur d'impulsion) . La fréquence de rafraîchissement de 59.5 Hz est extrêmement faible, de grands risques de fatigue oculaire accrue et de maux de tête en cas d'utilisation prolongée. En comparaison, 52 % des appareils testés n'emploient pas MDI pour assombrir leur écran. Nous avons relevé une moyenne à 7757 (minimum : 5 - maximum : 343500) Hz dans le cas où une MDI était active. | |||
Comme presque tous les autres ordinateurs portables dotés d'une dalle OLED, la dalle présente ici un scintillement ou une modulation de largeur d'impulsion. La fréquence est fixée à 227,3 Hz de 0 à 52 % de luminosité avant de passer à 59,5 Hz de 53 à 100 % de luminosité. Si vos yeux sont sensibles au scintillement, il est préférable d'opter pour les écrans IPS.
Performance
Conditions d'essai
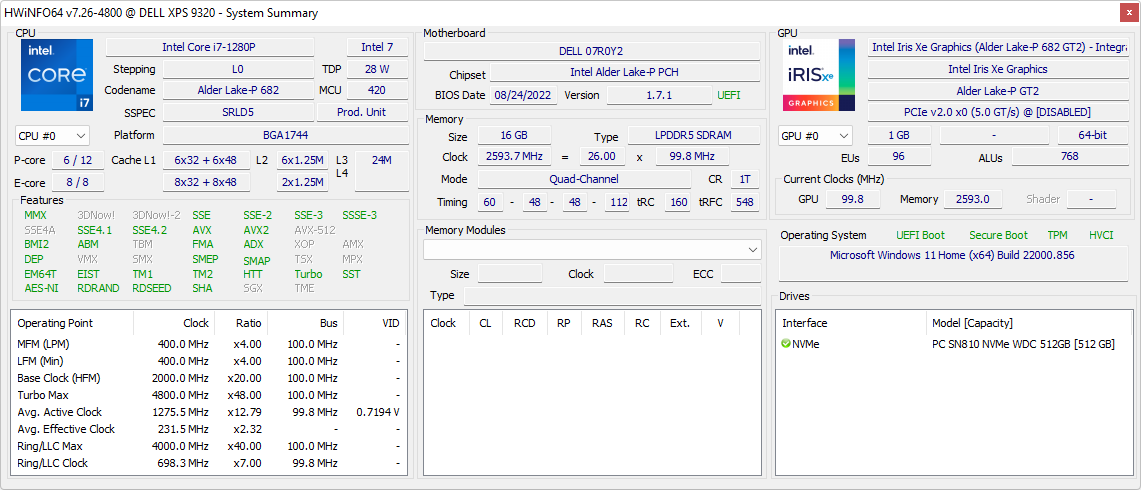
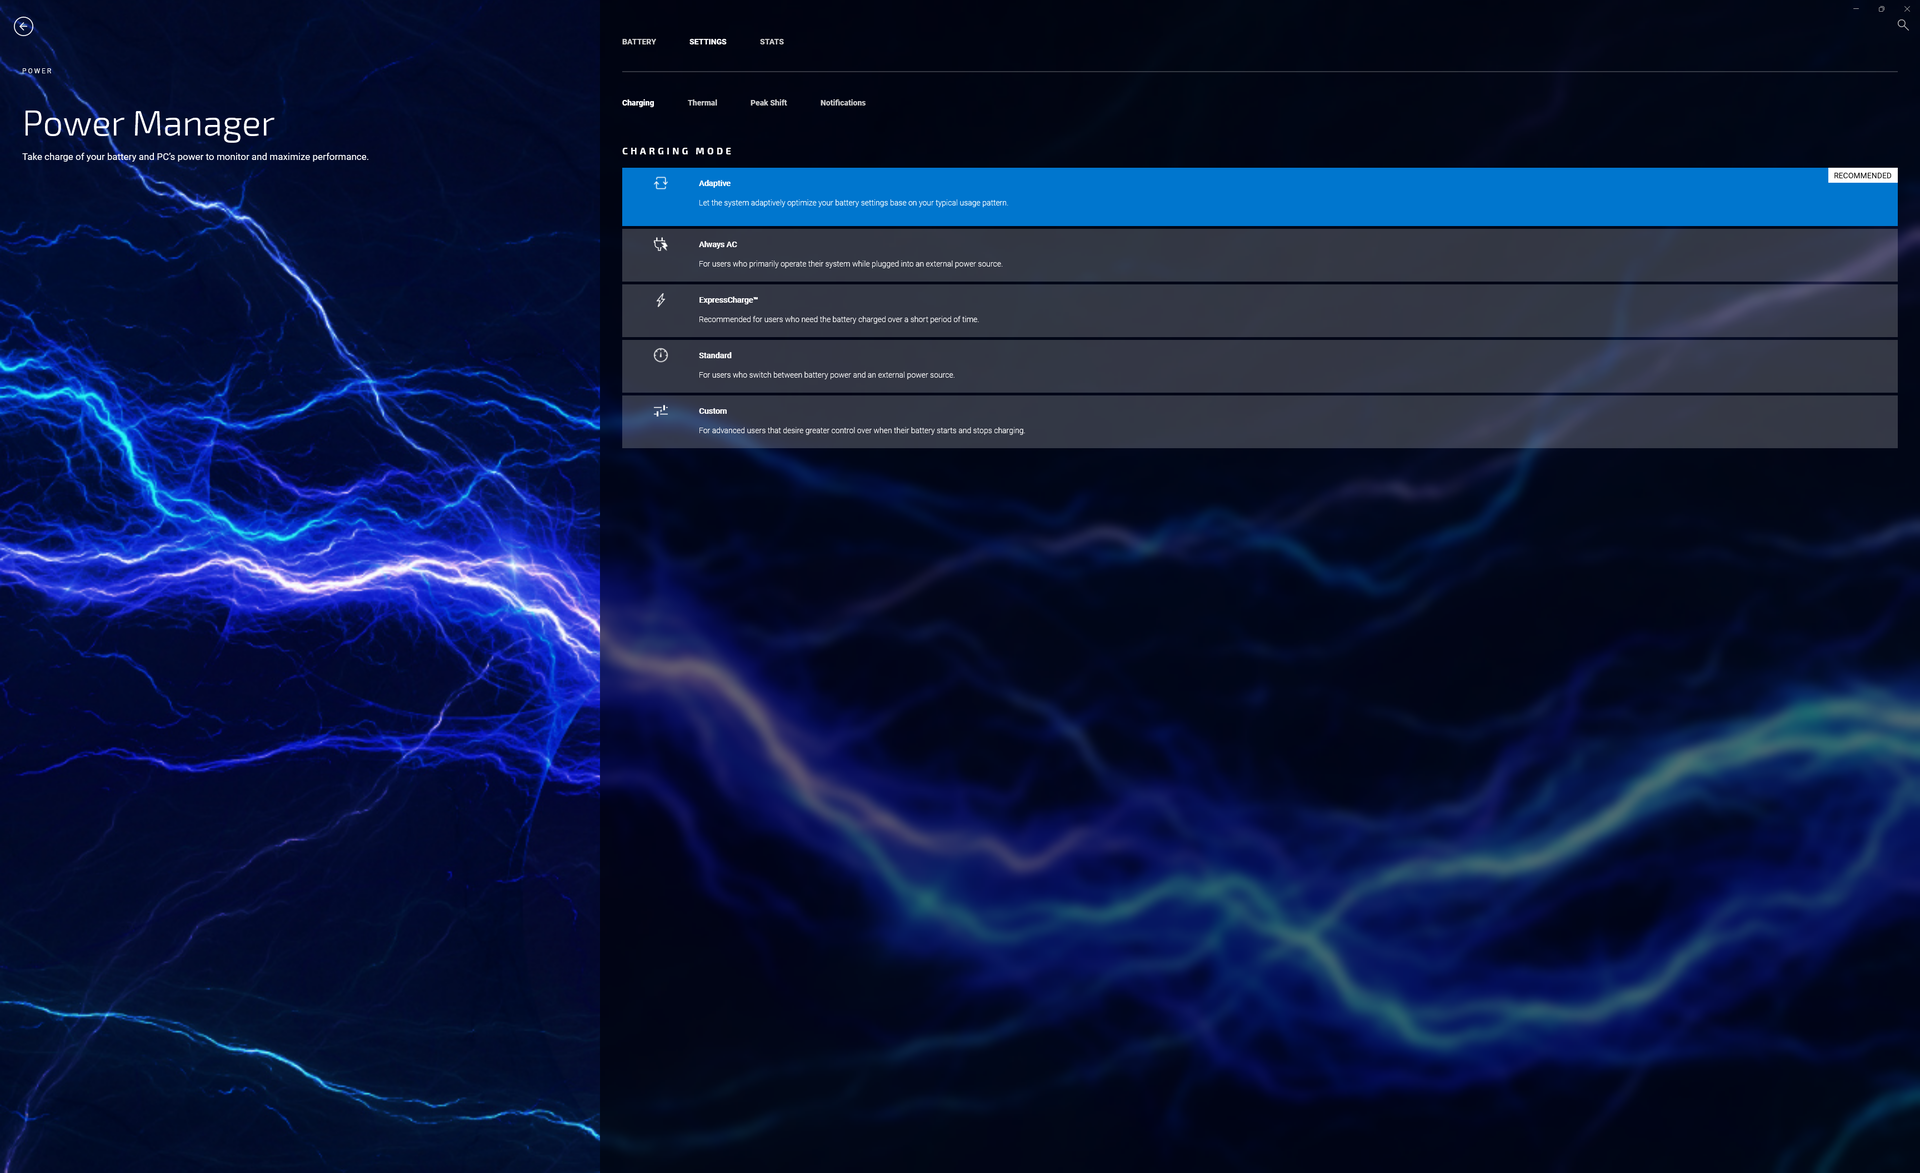
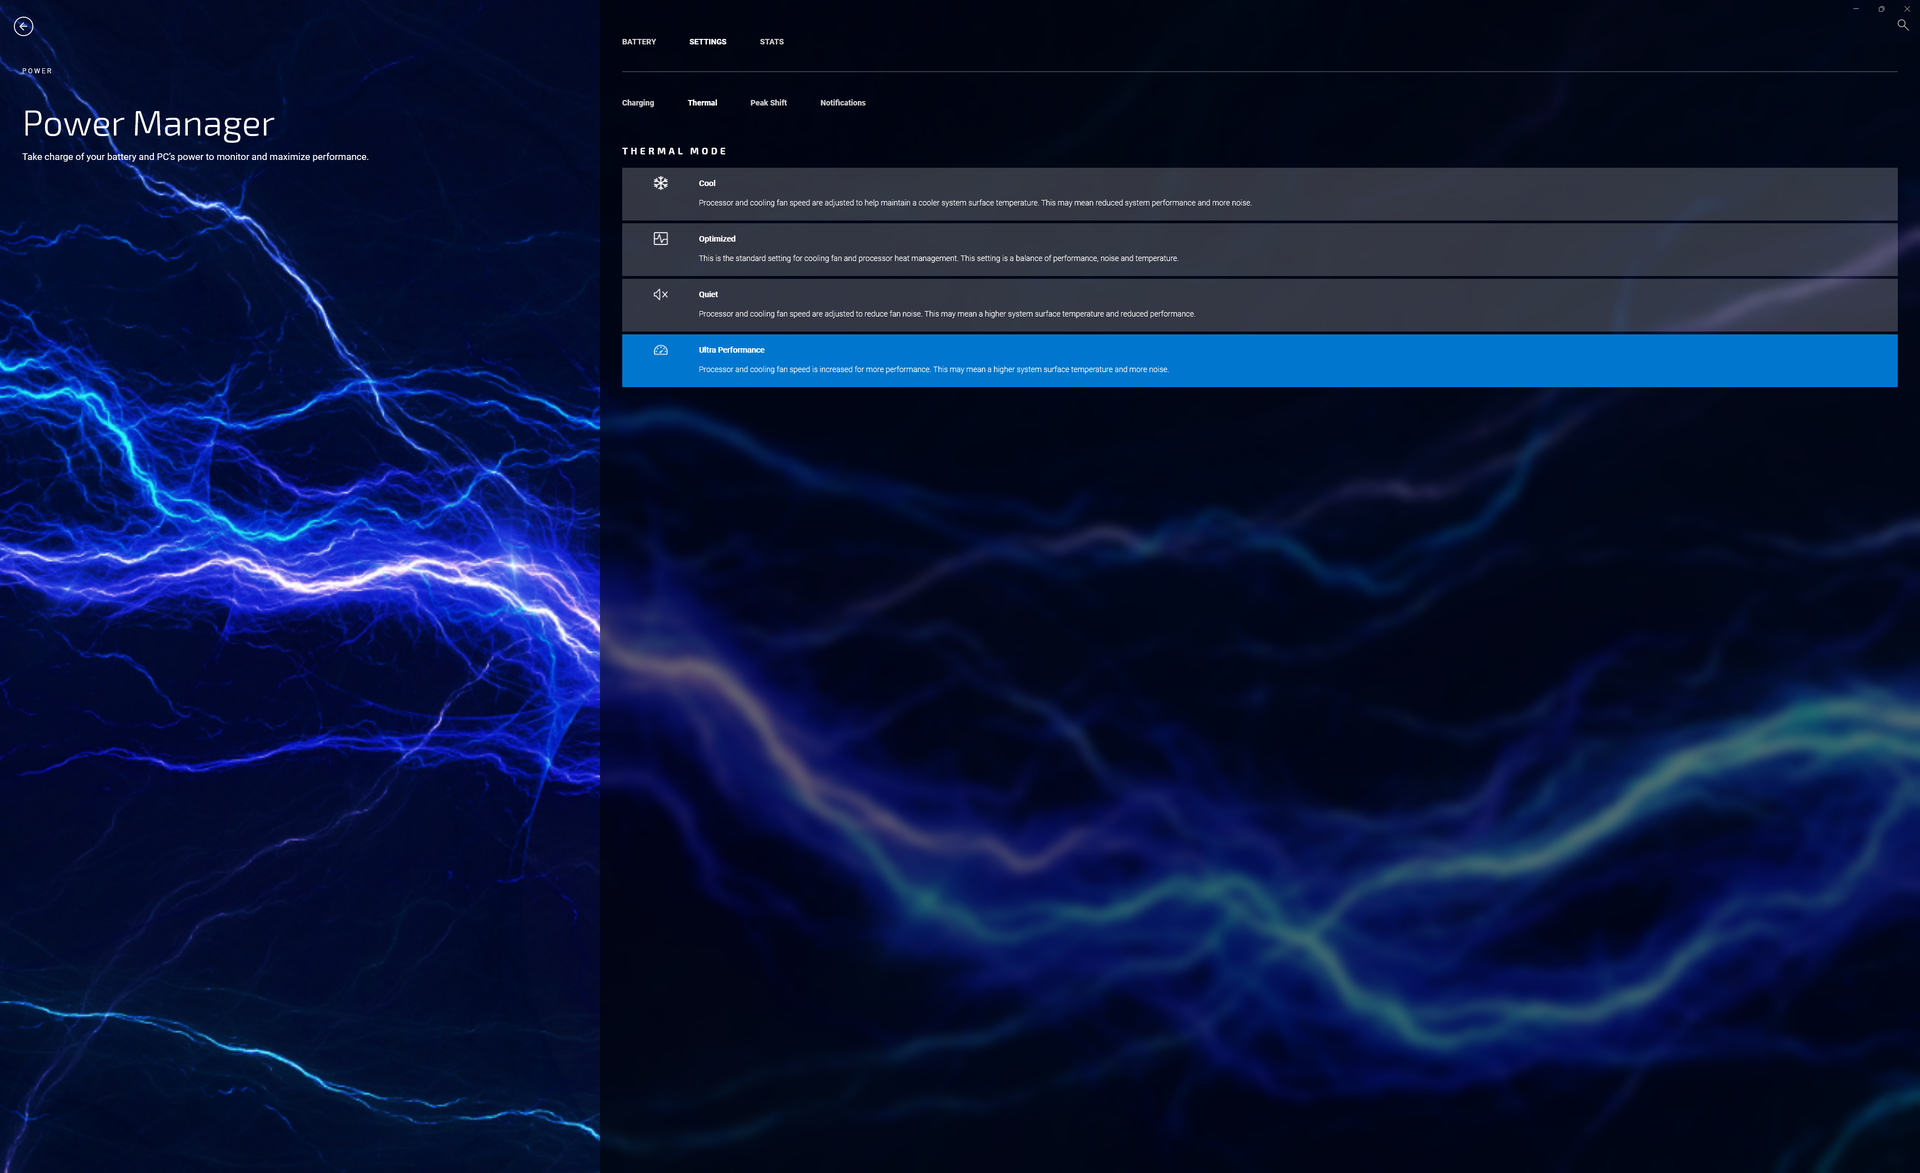
Nous avons réglé notre appareil en mode Performance via Windows et en mode Ultra Performance via le logiciel My Dell avant d'effectuer les tests de référence ci-dessous. Il est recommandé aux utilisateurs de se familiariser avec le logiciel My Dell, car il s'agit du centre de contrôle de l'ordinateur portable.
Processeur
Les performances multithread sont environ 15 % plus rapides que celles du Core i7-1260P ou environ 25 à 30 % plus rapide que la configuration Core i5-1240P et de 25 à 30 % par rapport à la configuration Core i5-1240P. Cependant, il est intéressant de noter que notre Core i7-1280P peut descendre en dessous du Core i7-1260P lorsqu'il est soumis à des tests de stress prolongés. Les résultats de notre test en boucle CineBench R15 xT ci-dessous montrent que le i7-1280P est plus performant que le i7-1260P pour les premiers passages avant d'être finalement plus lent de près de 8 %.
Cinebench R15 Multi Loop
Cinebench R23: Multi Core | Single Core
Cinebench R15: CPU Multi 64Bit | CPU Single 64Bit
Blender: v2.79 BMW27 CPU
7-Zip 18.03: 7z b 4 | 7z b 4 -mmt1
Geekbench 5.5: Multi-Core | Single-Core
HWBOT x265 Benchmark v2.2: 4k Preset
LibreOffice : 20 Documents To PDF
R Benchmark 2.5: Overall mean
| Cinebench R20 / CPU (Multi Core) | |
| Moyenne Intel Core i7-1280P (3283 - 5415, n=8) | |
| Dell XPS 13 Plus 9320 i7-1280P OLED | |
| Dell XPS 13 Plus 9320 4K | |
| Dell XPS 13 Plus 9320 i5-1240p | |
| Dell XPS 13 9310 OLED | |
| Dell XPS 13 9315, i5-1230U | |
| Dell XPS 13 9310 2-in-1 | |
| Cinebench R20 / CPU (Single Core) | |
| Dell XPS 13 Plus 9320 4K | |
| Moyenne Intel Core i7-1280P (615 - 701, n=8) | |
| Dell XPS 13 Plus 9320 i7-1280P OLED | |
| Dell XPS 13 Plus 9320 i5-1240p | |
| Dell XPS 13 9310 OLED | |
| Dell XPS 13 9310 2-in-1 | |
| Dell XPS 13 9315, i5-1230U | |
| Cinebench R23 / Multi Core | |
| Dell XPS 13 Plus 9320 i7-1280P OLED | |
| Moyenne Intel Core i7-1280P (8632 - 14803, n=8) | |
| Dell XPS 13 Plus 9320 4K | |
| Dell XPS 13 Plus 9320 i5-1240p | |
| Dell XPS 13 9310 OLED | |
| Dell XPS 13 9310 2-in-1 | |
| Dell XPS 13 9315, i5-1230U | |
| Cinebench R23 / Single Core | |
| Dell XPS 13 Plus 9320 4K | |
| Moyenne Intel Core i7-1280P (1609 - 1787, n=7) | |
| Dell XPS 13 Plus 9320 i5-1240p | |
| Dell XPS 13 Plus 9320 i7-1280P OLED | |
| Dell XPS 13 9310 OLED | |
| Dell XPS 13 9310 2-in-1 | |
| Dell XPS 13 9315, i5-1230U | |
| Cinebench R15 / CPU Multi 64Bit | |
| Moyenne Intel Core i7-1280P (1905 - 2332, n=7) | |
| Dell XPS 13 Plus 9320 i7-1280P OLED | |
| Dell XPS 13 Plus 9320 4K | |
| Dell XPS 13 Plus 9320 4K | |
| Dell XPS 13 Plus 9320 i5-1240p | |
| Dell XPS 13 9310 OLED | |
| Dell XPS 13 9310 2-in-1 | |
| Dell XPS 13 9315, i5-1230U | |
| Cinebench R15 / CPU Single 64Bit | |
| Dell XPS 13 Plus 9320 4K | |
| Moyenne Intel Core i7-1280P (203 - 258, n=7) | |
| Dell XPS 13 Plus 9320 i7-1280P OLED | |
| Dell XPS 13 Plus 9320 i5-1240p | |
| Dell XPS 13 9310 OLED | |
| Dell XPS 13 9315, i5-1230U | |
| Dell XPS 13 9310 2-in-1 | |
| Blender / v2.79 BMW27 CPU | |
| Dell XPS 13 9310 2-in-1 | |
| Dell XPS 13 9310 OLED | |
| Dell XPS 13 Plus 9320 i5-1240p | |
| Dell XPS 13 Plus 9320 4K | |
| Moyenne Intel Core i7-1280P (259 - 309, n=7) | |
| Dell XPS 13 Plus 9320 i7-1280P OLED | |
| 7-Zip 18.03 / 7z b 4 | |
| Moyenne Intel Core i7-1280P (45292 - 53710, n=7) | |
| Dell XPS 13 Plus 9320 i7-1280P OLED | |
| Dell XPS 13 Plus 9320 4K | |
| Dell XPS 13 Plus 9320 i5-1240p | |
| Dell XPS 13 9310 2-in-1 | |
| Dell XPS 13 9315, i5-1230U | |
| Dell XPS 13 9310 OLED | |
| 7-Zip 18.03 / 7z b 4 -mmt1 | |
| Moyenne Intel Core i7-1280P (4995 - 5874, n=7) | |
| Dell XPS 13 Plus 9320 4K | |
| Dell XPS 13 9310 2-in-1 | |
| Dell XPS 13 Plus 9320 i7-1280P OLED | |
| Dell XPS 13 Plus 9320 i5-1240p | |
| Dell XPS 13 9315, i5-1230U | |
| Dell XPS 13 9310 OLED | |
| Geekbench 5.5 / Multi-Core | |
| Dell XPS 13 Plus 9320 i7-1280P OLED | |
| Moyenne Intel Core i7-1280P (9623 - 11811, n=7) | |
| Dell XPS 13 Plus 9320 4K | |
| Dell XPS 13 9315, i5-1230U | |
| Dell XPS 13 9310 OLED | |
| Dell XPS 13 Plus 9320 i5-1240p | |
| Geekbench 5.5 / Single-Core | |
| Dell XPS 13 Plus 9320 i7-1280P OLED | |
| Dell XPS 13 Plus 9320 4K | |
| Moyenne Intel Core i7-1280P (1571 - 1802, n=7) | |
| Dell XPS 13 9315, i5-1230U | |
| Dell XPS 13 Plus 9320 i5-1240p | |
| Dell XPS 13 9310 OLED | |
| HWBOT x265 Benchmark v2.2 / 4k Preset | |
| Dell XPS 13 Plus 9320 i7-1280P OLED | |
| Moyenne Intel Core i7-1280P (9.62 - 14.5, n=5) | |
| Dell XPS 13 Plus 9320 4K | |
| Dell XPS 13 Plus 9320 i5-1240p | |
| Dell XPS 13 9310 OLED | |
| Dell XPS 13 9310 2-in-1 | |
| LibreOffice / 20 Documents To PDF | |
| Dell XPS 13 Plus 9320 i5-1240p | |
| Moyenne Intel Core i7-1280P (41 - 61.6, n=8) | |
| Dell XPS 13 Plus 9320 i7-1280P OLED | |
| Dell XPS 13 Plus 9320 4K | |
| Dell XPS 13 9310 OLED | |
| R Benchmark 2.5 / Overall mean | |
| Dell XPS 13 9310 2-in-1 | |
| Dell XPS 13 9310 OLED | |
| Dell XPS 13 Plus 9320 i5-1240p | |
| Dell XPS 13 Plus 9320 i7-1280P OLED | |
| Dell XPS 13 Plus 9320 4K | |
| Moyenne Intel Core i7-1280P (0.4505 - 0.512, n=7) | |
* ... Moindre est la valeur, meilleures sont les performances
AIDA64: FP32 Ray-Trace | FPU Julia | CPU SHA3 | CPU Queen | FPU SinJulia | FPU Mandel | CPU AES | CPU ZLib | FP64 Ray-Trace | CPU PhotoWorxx
| Performance rating | |
| Dell XPS 13 Plus 9320 i7-1280P OLED | |
| Moyenne Intel Core i7-1280P | |
| Dell XPS 13 Plus 9320 4K | |
| Dell XPS 13 Plus 9320 i5-1240p | |
| Dell XPS 13 9310 2-in-1 | |
| Dell XPS 13 9310 OLED | |
| Dell XPS 13 9315, i5-1230U | |
| AIDA64 / FP32 Ray-Trace | |
| Dell XPS 13 Plus 9320 i7-1280P OLED | |
| Moyenne Intel Core i7-1280P (7466 - 13068, n=6) | |
| Dell XPS 13 9310 2-in-1 | |
| Dell XPS 13 9310 OLED | |
| Dell XPS 13 Plus 9320 4K | |
| Dell XPS 13 Plus 9320 i5-1240p | |
| Dell XPS 13 9315, i5-1230U | |
| AIDA64 / FPU Julia | |
| Dell XPS 13 Plus 9320 i7-1280P OLED | |
| Moyenne Intel Core i7-1280P (38904 - 66081, n=6) | |
| Dell XPS 13 9310 2-in-1 | |
| Dell XPS 13 Plus 9320 4K | |
| Dell XPS 13 Plus 9320 i5-1240p | |
| Dell XPS 13 9310 OLED | |
| Dell XPS 13 9315, i5-1230U | |
| AIDA64 / CPU SHA3 | |
| Dell XPS 13 Plus 9320 i7-1280P OLED | |
| Moyenne Intel Core i7-1280P (1826 - 2992, n=6) | |
| Dell XPS 13 9310 2-in-1 | |
| Dell XPS 13 Plus 9320 4K | |
| Dell XPS 13 Plus 9320 i5-1240p | |
| Dell XPS 13 9310 OLED | |
| Dell XPS 13 9315, i5-1230U | |
| AIDA64 / CPU Queen | |
| Moyenne Intel Core i7-1280P (80180 - 100358, n=6) | |
| Dell XPS 13 Plus 9320 i7-1280P OLED | |
| Dell XPS 13 Plus 9320 4K | |
| Dell XPS 13 Plus 9320 i5-1240p | |
| Dell XPS 13 9315, i5-1230U | |
| Dell XPS 13 9310 2-in-1 | |
| Dell XPS 13 9310 OLED | |
| AIDA64 / FPU SinJulia | |
| Dell XPS 13 Plus 9320 i7-1280P OLED | |
| Moyenne Intel Core i7-1280P (5880 - 8571, n=6) | |
| Dell XPS 13 Plus 9320 4K | |
| Dell XPS 13 Plus 9320 i5-1240p | |
| Dell XPS 13 9310 2-in-1 | |
| Dell XPS 13 9310 OLED | |
| Dell XPS 13 9315, i5-1230U | |
| AIDA64 / FPU Mandel | |
| Dell XPS 13 Plus 9320 i7-1280P OLED | |
| Moyenne Intel Core i7-1280P (18907 - 32766, n=6) | |
| Dell XPS 13 9310 2-in-1 | |
| Dell XPS 13 Plus 9320 i5-1240p | |
| Dell XPS 13 Plus 9320 4K | |
| Dell XPS 13 9310 OLED | |
| Dell XPS 13 9315, i5-1230U | |
| AIDA64 / CPU AES | |
| Dell XPS 13 9310 2-in-1 | |
| Moyenne Intel Core i7-1280P (40691 - 99367, n=6) | |
| Dell XPS 13 Plus 9320 i7-1280P OLED | |
| Dell XPS 13 9310 OLED | |
| Dell XPS 13 Plus 9320 i5-1240p | |
| Dell XPS 13 Plus 9320 4K | |
| Dell XPS 13 9315, i5-1230U | |
| AIDA64 / CPU ZLib | |
| Moyenne Intel Core i7-1280P (540 - 880, n=6) | |
| Dell XPS 13 Plus 9320 i7-1280P OLED | |
| Dell XPS 13 Plus 9320 4K | |
| Dell XPS 13 Plus 9320 i5-1240p | |
| Dell XPS 13 9310 2-in-1 | |
| Dell XPS 13 9315, i5-1230U | |
| Dell XPS 13 9310 OLED | |
| AIDA64 / FP64 Ray-Trace | |
| Dell XPS 13 Plus 9320 i7-1280P OLED | |
| Moyenne Intel Core i7-1280P (4006 - 7184, n=6) | |
| Dell XPS 13 9310 2-in-1 | |
| Dell XPS 13 9310 OLED | |
| Dell XPS 13 Plus 9320 4K | |
| Dell XPS 13 Plus 9320 i5-1240p | |
| Dell XPS 13 9315, i5-1230U | |
| AIDA64 / CPU PhotoWorxx | |
| Dell XPS 13 Plus 9320 i7-1280P OLED | |
| Moyenne Intel Core i7-1280P (36663 - 48416, n=6) | |
| Dell XPS 13 Plus 9320 4K | |
| Dell XPS 13 9310 2-in-1 | |
| Dell XPS 13 Plus 9320 i5-1240p | |
| Dell XPS 13 9310 OLED | |
| Dell XPS 13 9315, i5-1230U | |
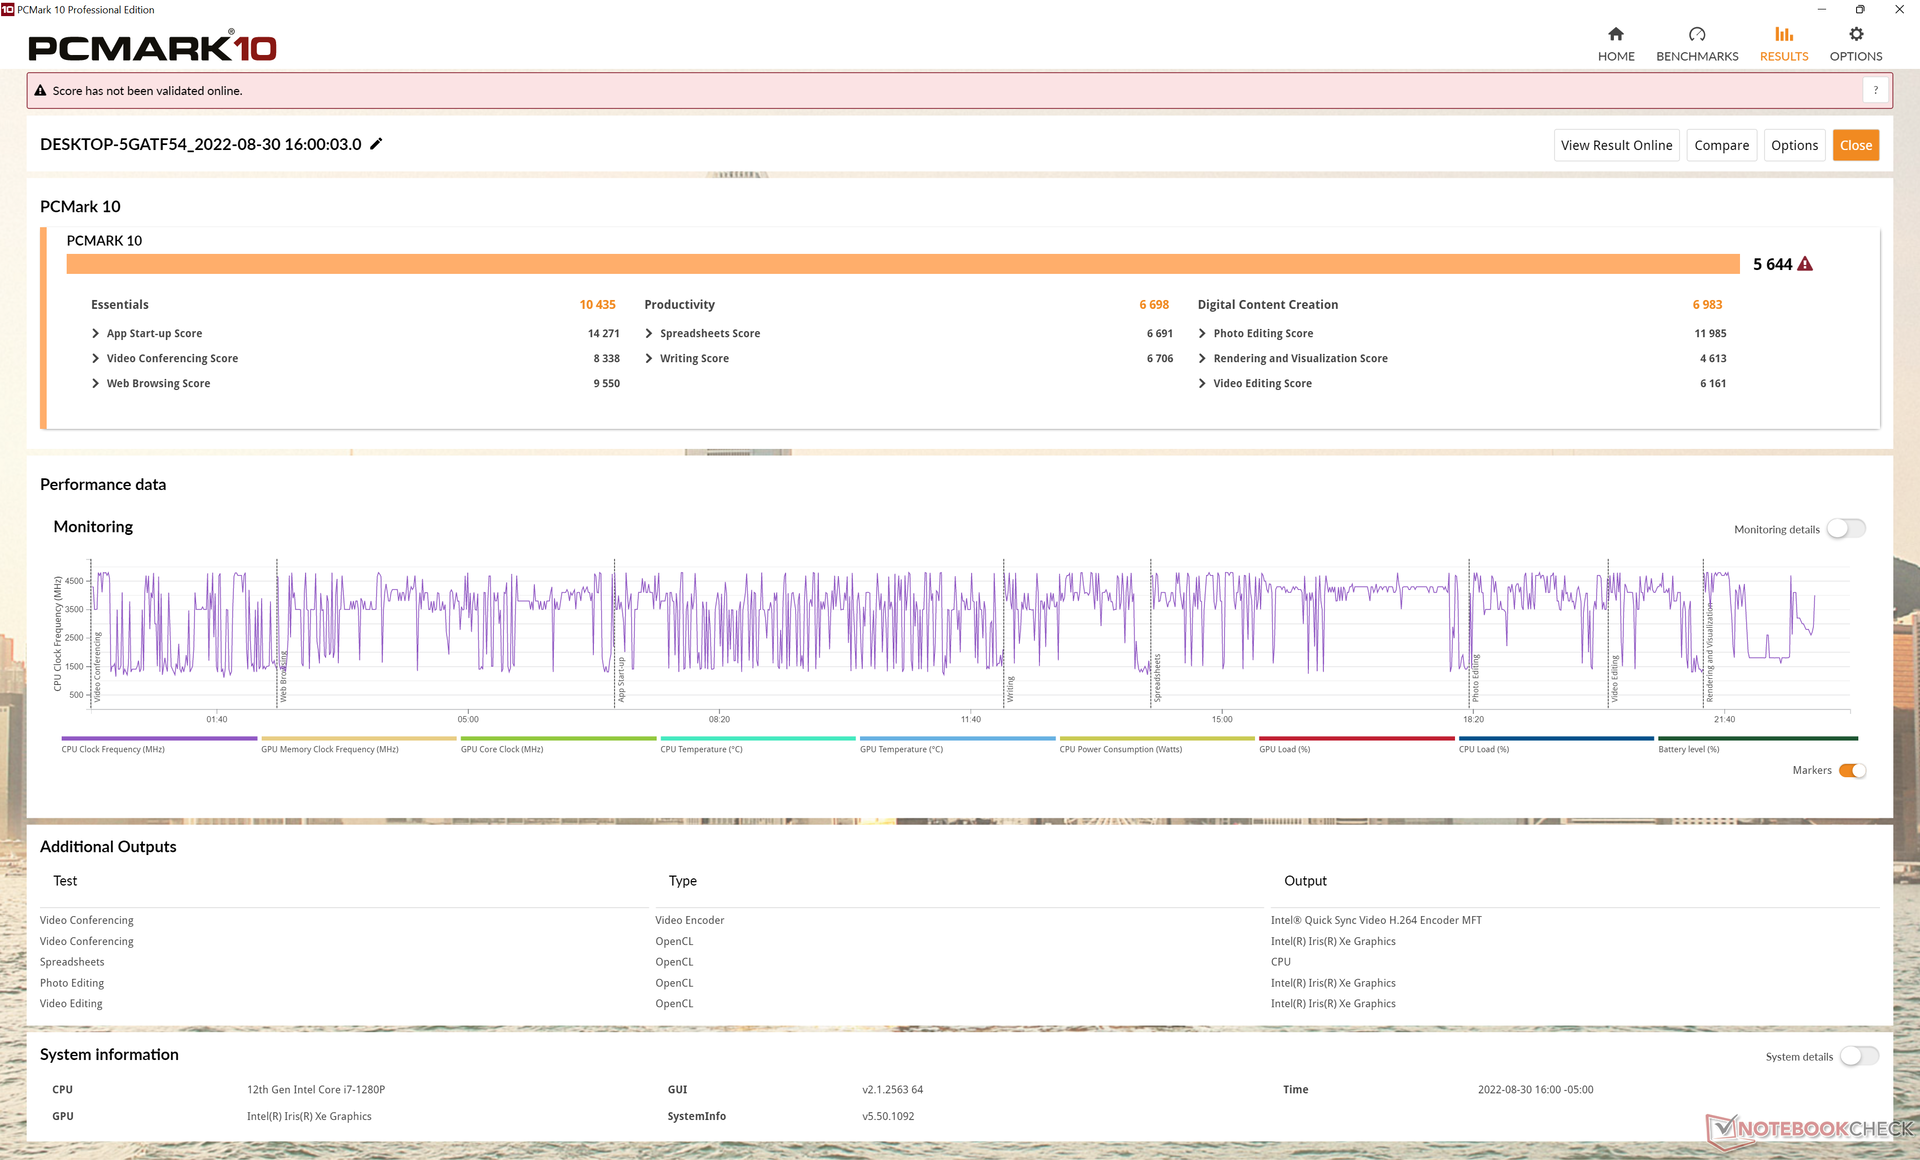
Performance du système
CrossMark: Overall | Productivity | Creativity | Responsiveness
| PCMark 10 / Score | |
| Moyenne de la classe Subnotebook (4920 - 9939, n=45, 2 dernières années) | |
| Dell XPS 13 Plus 9320 i7-1280P OLED | |
| Moyenne Intel Core i7-1280P, Intel Iris Xe Graphics G7 96EUs (5410 - 5994, n=4) | |
| Dell XPS 13 Plus 9320 4K | |
| Dell XPS 13 9310 OLED | |
| Dell XPS 13 9310 2-in-1 | |
| Dell XPS 13 Plus 9320 i5-1240p | |
| Dell XPS 13 9315, i5-1230U | |
| PCMark 10 / Essentials | |
| Dell XPS 13 9310 OLED | |
| Dell XPS 13 9310 2-in-1 | |
| Dell XPS 13 Plus 9320 i7-1280P OLED | |
| Moyenne de la classe Subnotebook (8552 - 11646, n=45, 2 dernières années) | |
| Dell XPS 13 Plus 9320 4K | |
| Moyenne Intel Core i7-1280P, Intel Iris Xe Graphics G7 96EUs (9719 - 10920, n=4) | |
| Dell XPS 13 9315, i5-1230U | |
| Dell XPS 13 Plus 9320 i5-1240p | |
| PCMark 10 / Productivity | |
| Moyenne de la classe Subnotebook (5435 - 16606, n=45, 2 dernières années) | |
| Dell XPS 13 9310 OLED | |
| Dell XPS 13 Plus 9320 4K | |
| Dell XPS 13 9310 2-in-1 | |
| Moyenne Intel Core i7-1280P, Intel Iris Xe Graphics G7 96EUs (6301 - 7453, n=4) | |
| Dell XPS 13 Plus 9320 i7-1280P OLED | |
| Dell XPS 13 Plus 9320 i5-1240p | |
| Dell XPS 13 9315, i5-1230U | |
| PCMark 10 / Digital Content Creation | |
| Moyenne de la classe Subnotebook (5722 - 13779, n=45, 2 dernières années) | |
| Dell XPS 13 Plus 9320 i7-1280P OLED | |
| Moyenne Intel Core i7-1280P, Intel Iris Xe Graphics G7 96EUs (6450 - 7180, n=4) | |
| Dell XPS 13 Plus 9320 4K | |
| Dell XPS 13 Plus 9320 i5-1240p | |
| Dell XPS 13 9310 OLED | |
| Dell XPS 13 9310 2-in-1 | |
| Dell XPS 13 9315, i5-1230U | |
| CrossMark / Overall | |
| Dell XPS 13 Plus 9320 i7-1280P OLED | |
| Moyenne Intel Core i7-1280P, Intel Iris Xe Graphics G7 96EUs (1677 - 1773, n=4) | |
| Dell XPS 13 Plus 9320 4K | |
| Moyenne de la classe Subnotebook (365 - 2356, n=60, 2 dernières années) | |
| Dell XPS 13 Plus 9320 i5-1240p | |
| Dell XPS 13 9315, i5-1230U | |
| CrossMark / Productivity | |
| Dell XPS 13 Plus 9320 i7-1280P OLED | |
| Moyenne Intel Core i7-1280P, Intel Iris Xe Graphics G7 96EUs (1585 - 1709, n=4) | |
| Dell XPS 13 Plus 9320 4K | |
| Moyenne de la classe Subnotebook (364 - 2277, n=60, 2 dernières années) | |
| Dell XPS 13 Plus 9320 i5-1240p | |
| Dell XPS 13 9315, i5-1230U | |
| CrossMark / Creativity | |
| Dell XPS 13 Plus 9320 i7-1280P OLED | |
| Moyenne Intel Core i7-1280P, Intel Iris Xe Graphics G7 96EUs (1849 - 1928, n=4) | |
| Moyenne de la classe Subnotebook (372 - 2743, n=60, 2 dernières années) | |
| Dell XPS 13 Plus 9320 4K | |
| Dell XPS 13 Plus 9320 i5-1240p | |
| Dell XPS 13 9315, i5-1230U | |
| CrossMark / Responsiveness | |
| Moyenne Intel Core i7-1280P, Intel Iris Xe Graphics G7 96EUs (1394 - 1746, n=4) | |
| Dell XPS 13 Plus 9320 i7-1280P OLED | |
| Dell XPS 13 Plus 9320 4K | |
| Moyenne de la classe Subnotebook (312 - 1854, n=60, 2 dernières années) | |
| Dell XPS 13 Plus 9320 i5-1240p | |
| Dell XPS 13 9315, i5-1230U | |
| PCMark 10 Score | 5644 points | |
Aide | ||
| AIDA64 / Memory Copy | |
| Dell XPS 13 Plus 9320 i7-1280P OLED | |
| Dell XPS 13 Plus 9320 4K | |
| Moyenne Intel Core i7-1280P (56337 - 73486, n=6) | |
| Dell XPS 13 Plus 9320 i5-1240p | |
| Dell XPS 13 9310 2-in-1 | |
| Dell XPS 13 9310 OLED | |
| Dell XPS 13 9315, i5-1230U | |
| AIDA64 / Memory Read | |
| Dell XPS 13 Plus 9320 i7-1280P OLED | |
| Dell XPS 13 Plus 9320 i5-1240p | |
| Moyenne Intel Core i7-1280P (63221 - 73719, n=6) | |
| Dell XPS 13 Plus 9320 4K | |
| Dell XPS 13 9315, i5-1230U | |
| Dell XPS 13 9310 2-in-1 | |
| Dell XPS 13 9310 OLED | |
| AIDA64 / Memory Write | |
| Dell XPS 13 9310 OLED | |
| Dell XPS 13 9310 2-in-1 | |
| Dell XPS 13 Plus 9320 i7-1280P OLED | |
| Moyenne Intel Core i7-1280P (58729 - 68247, n=6) | |
| Dell XPS 13 Plus 9320 4K | |
| Dell XPS 13 9315, i5-1230U | |
| Dell XPS 13 Plus 9320 i5-1240p | |
| AIDA64 / Memory Latency | |
| Dell XPS 13 9310 OLED | |
| Moyenne Intel Core i7-1280P (93.1 - 153.3, n=6) | |
| Dell XPS 13 Plus 9320 i7-1280P OLED | |
| Dell XPS 13 9310 2-in-1 | |
| Dell XPS 13 9315, i5-1230U | |
* ... Moindre est la valeur, meilleures sont les performances
Latence DPC
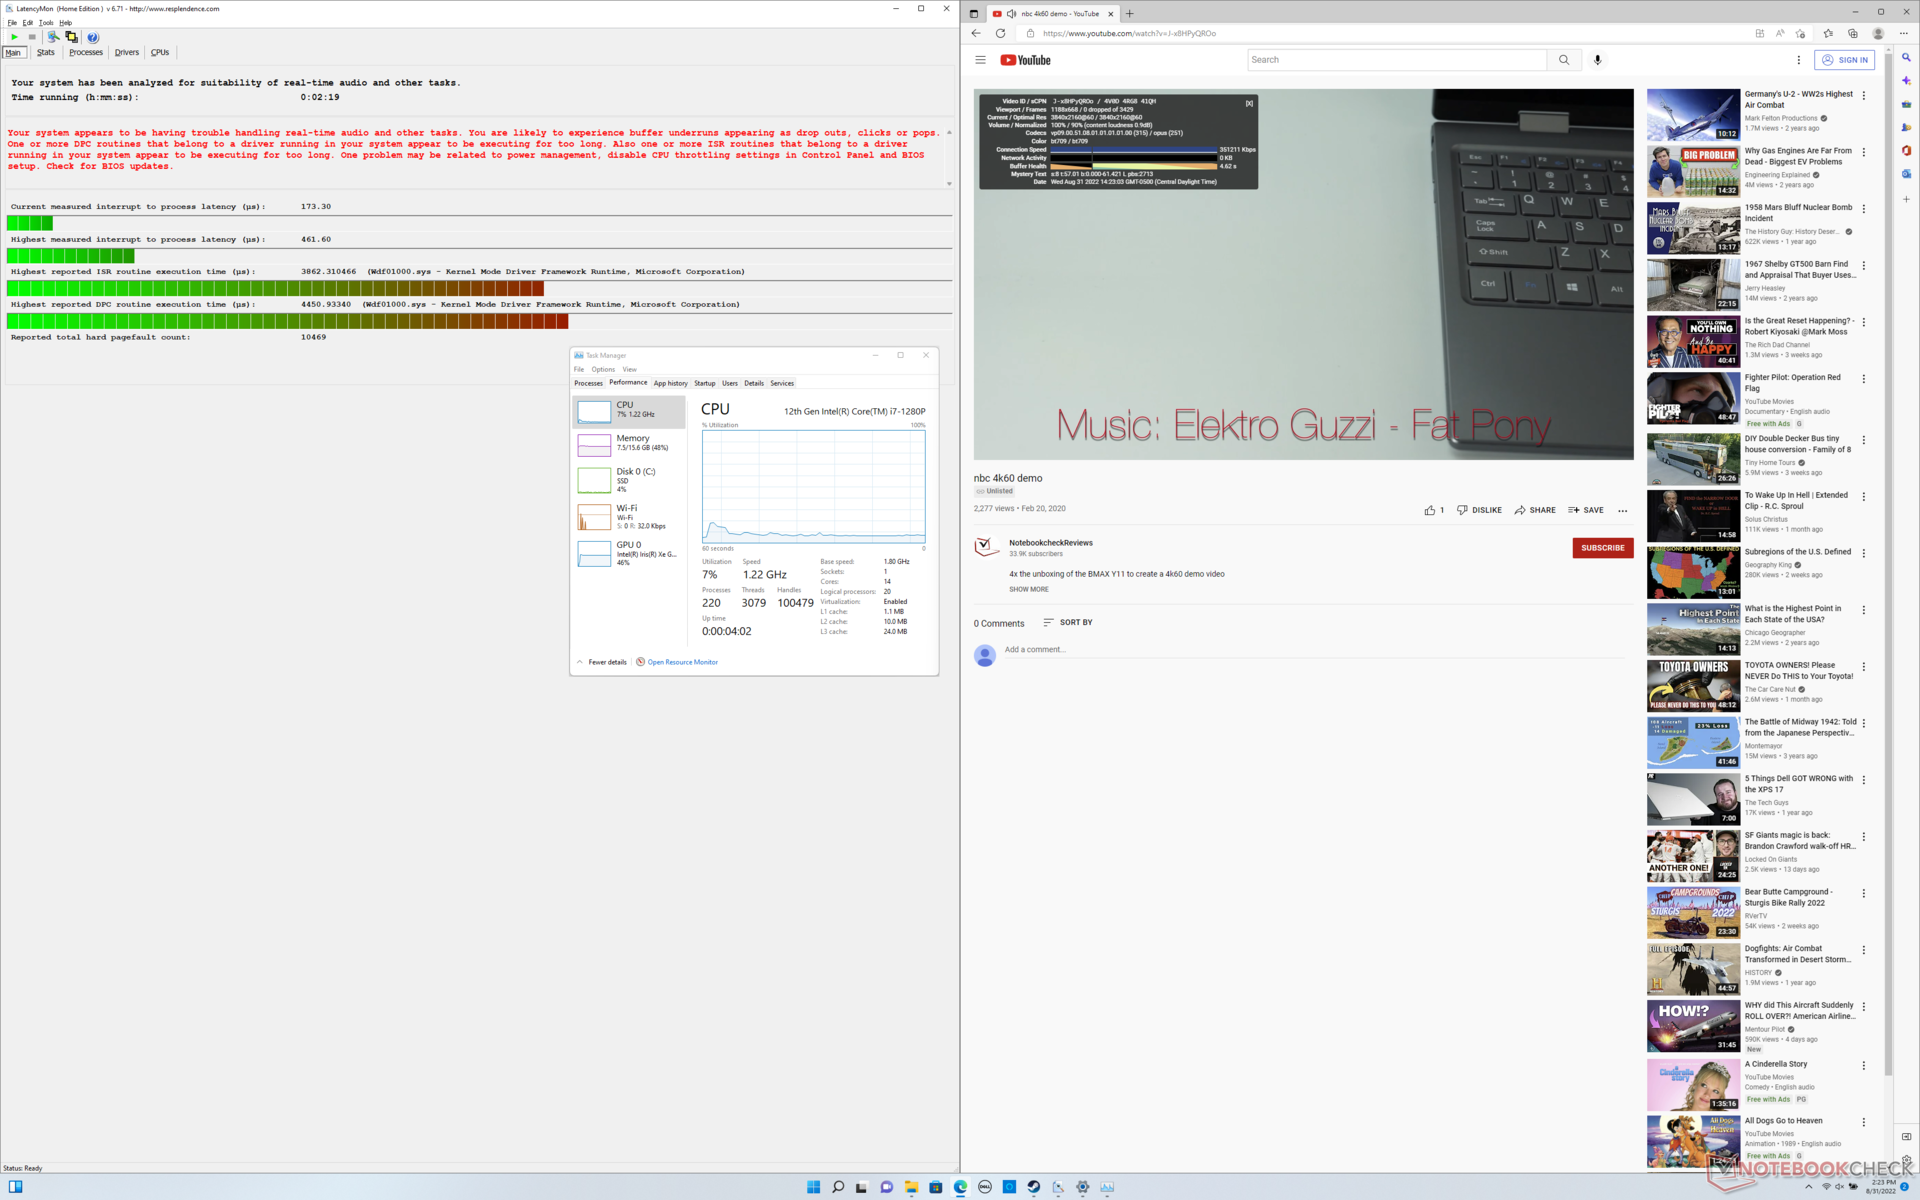
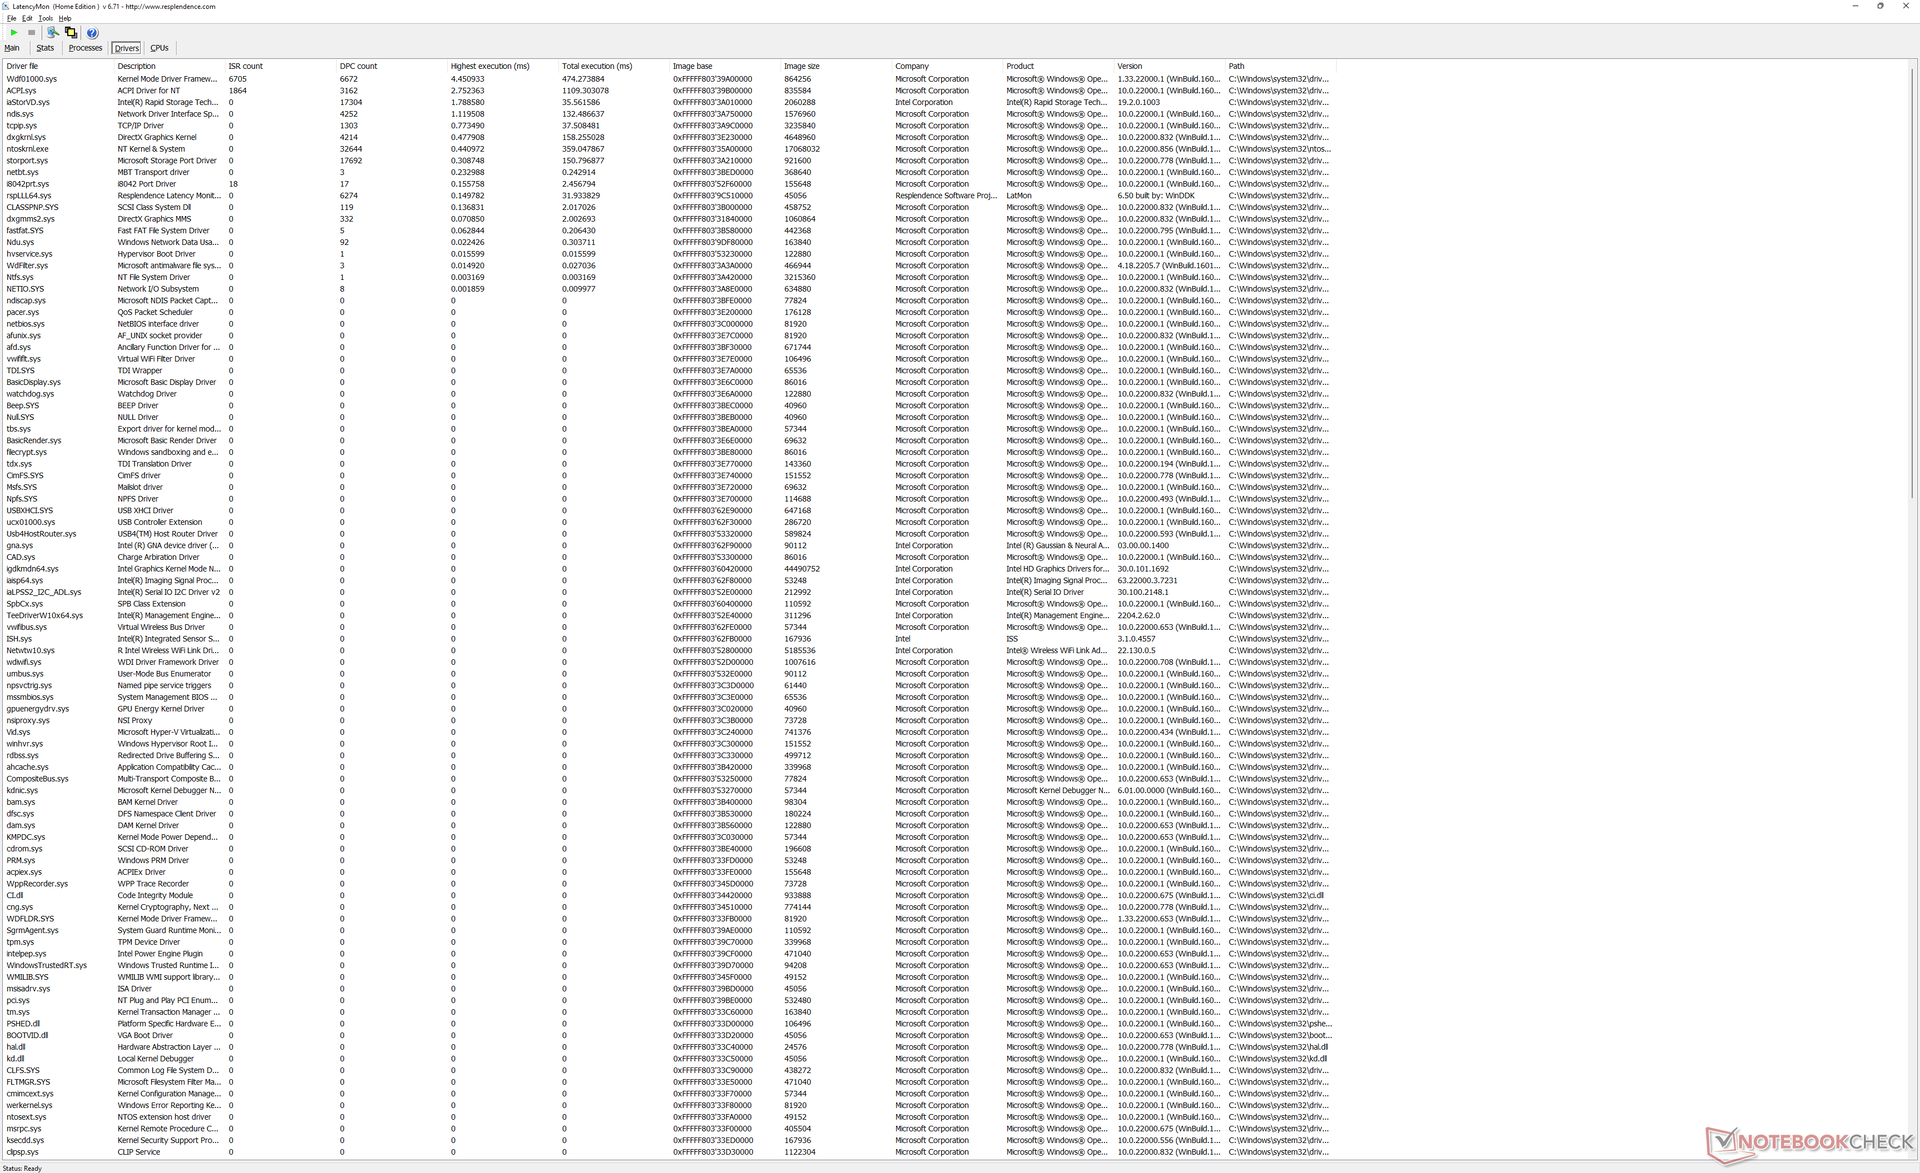
| DPC Latencies / LatencyMon - interrupt to process latency (max), Web, Youtube, Prime95 | |
| Dell XPS 13 9315, i5-1230U | |
| Dell XPS 13 Plus 9320 i5-1240p | |
| Dell XPS 13 9310 OLED | |
| Dell XPS 13 Plus 9320 4K | |
| Dell XPS 13 9310 2-in-1 | |
| Dell XPS 13 Plus 9320 i7-1280P OLED | |
* ... Moindre est la valeur, meilleures sont les performances
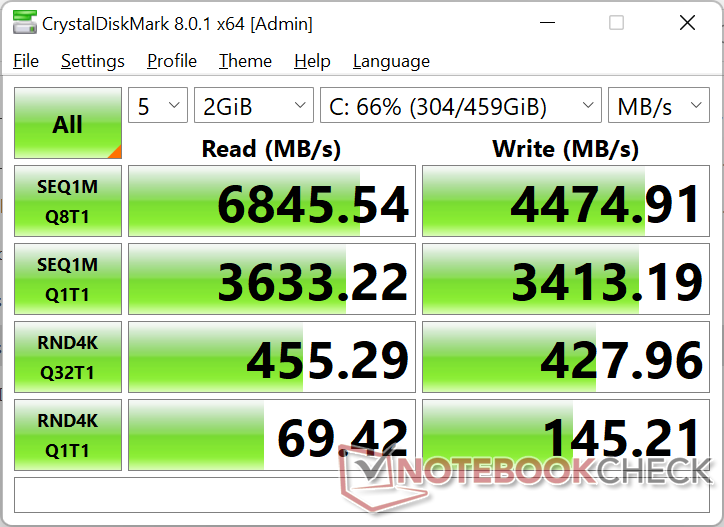
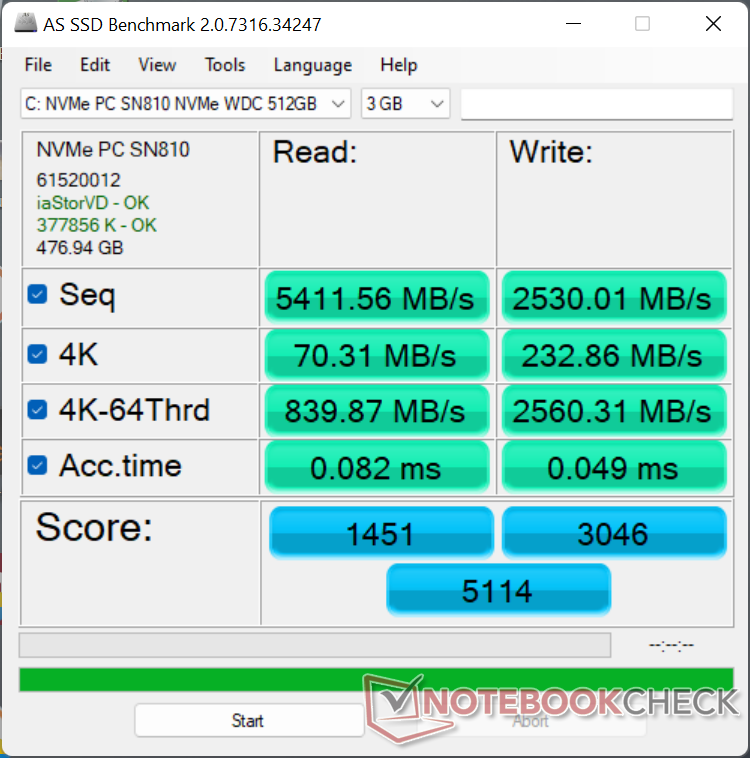
Périphériques de stockage
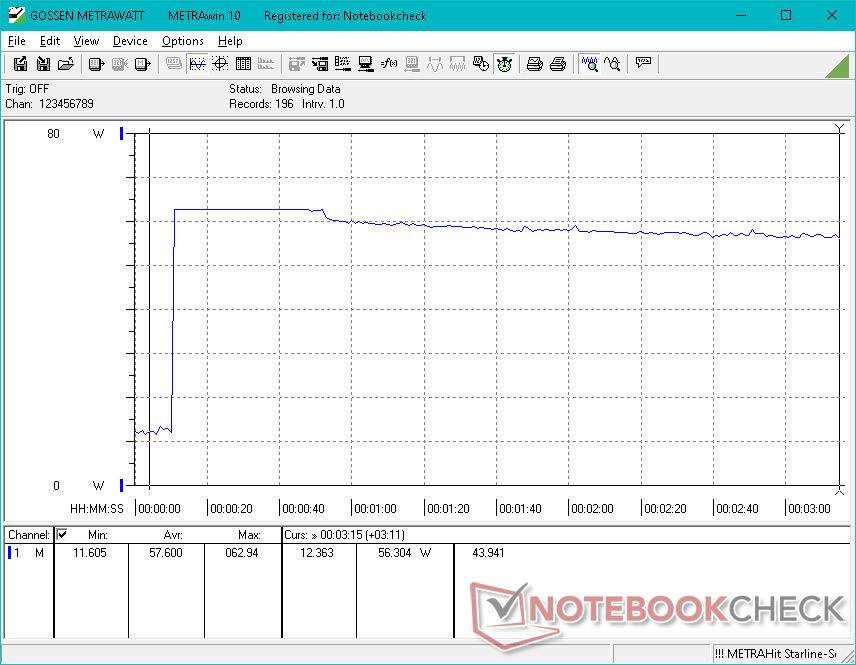
Dell semble s'approvisionner en SSD auprès de plusieurs fabricants pour sa série XPS 13 Plus. Alors que nos deux unités de test précédentes étaient livrées avec des SSD NVMe PCIe4 x4 Micron 3400 ou Samsung PM9A1, notre unité de test i7-1280P était livrée avec le SSD Western Digital SN810 Western Digital SN810 à la place. Malheureusement, ce disque WD semble inférieur au Samsung ou au Micron, car les performances sont réduites à seulement 3000 Mo/s lorsque DiskSpd fonctionne en boucle, comme le montre le graphique ci-dessous. En comparaison, les disques Samsung ou Micron affichent des taux de transfert stables lorsqu'ils sont soumis au même test de stress.

| Drive Performance rating - Percent | |
| Dell XPS 13 Plus 9320 i7-1280P OLED | |
| Dell XPS 13 Plus 9320 4K | |
| Dell XPS 13 9310 OLED | |
| Dell XPS 13 Plus 9320 i5-1240p | |
| Dell XPS 13 9315, i5-1230U | |
| Dell XPS 13 9310 2-in-1 | |
* ... Moindre est la valeur, meilleures sont les performances
Disk Throttling: DiskSpd Read Loop, Queue Depth 8
Performances du GPU
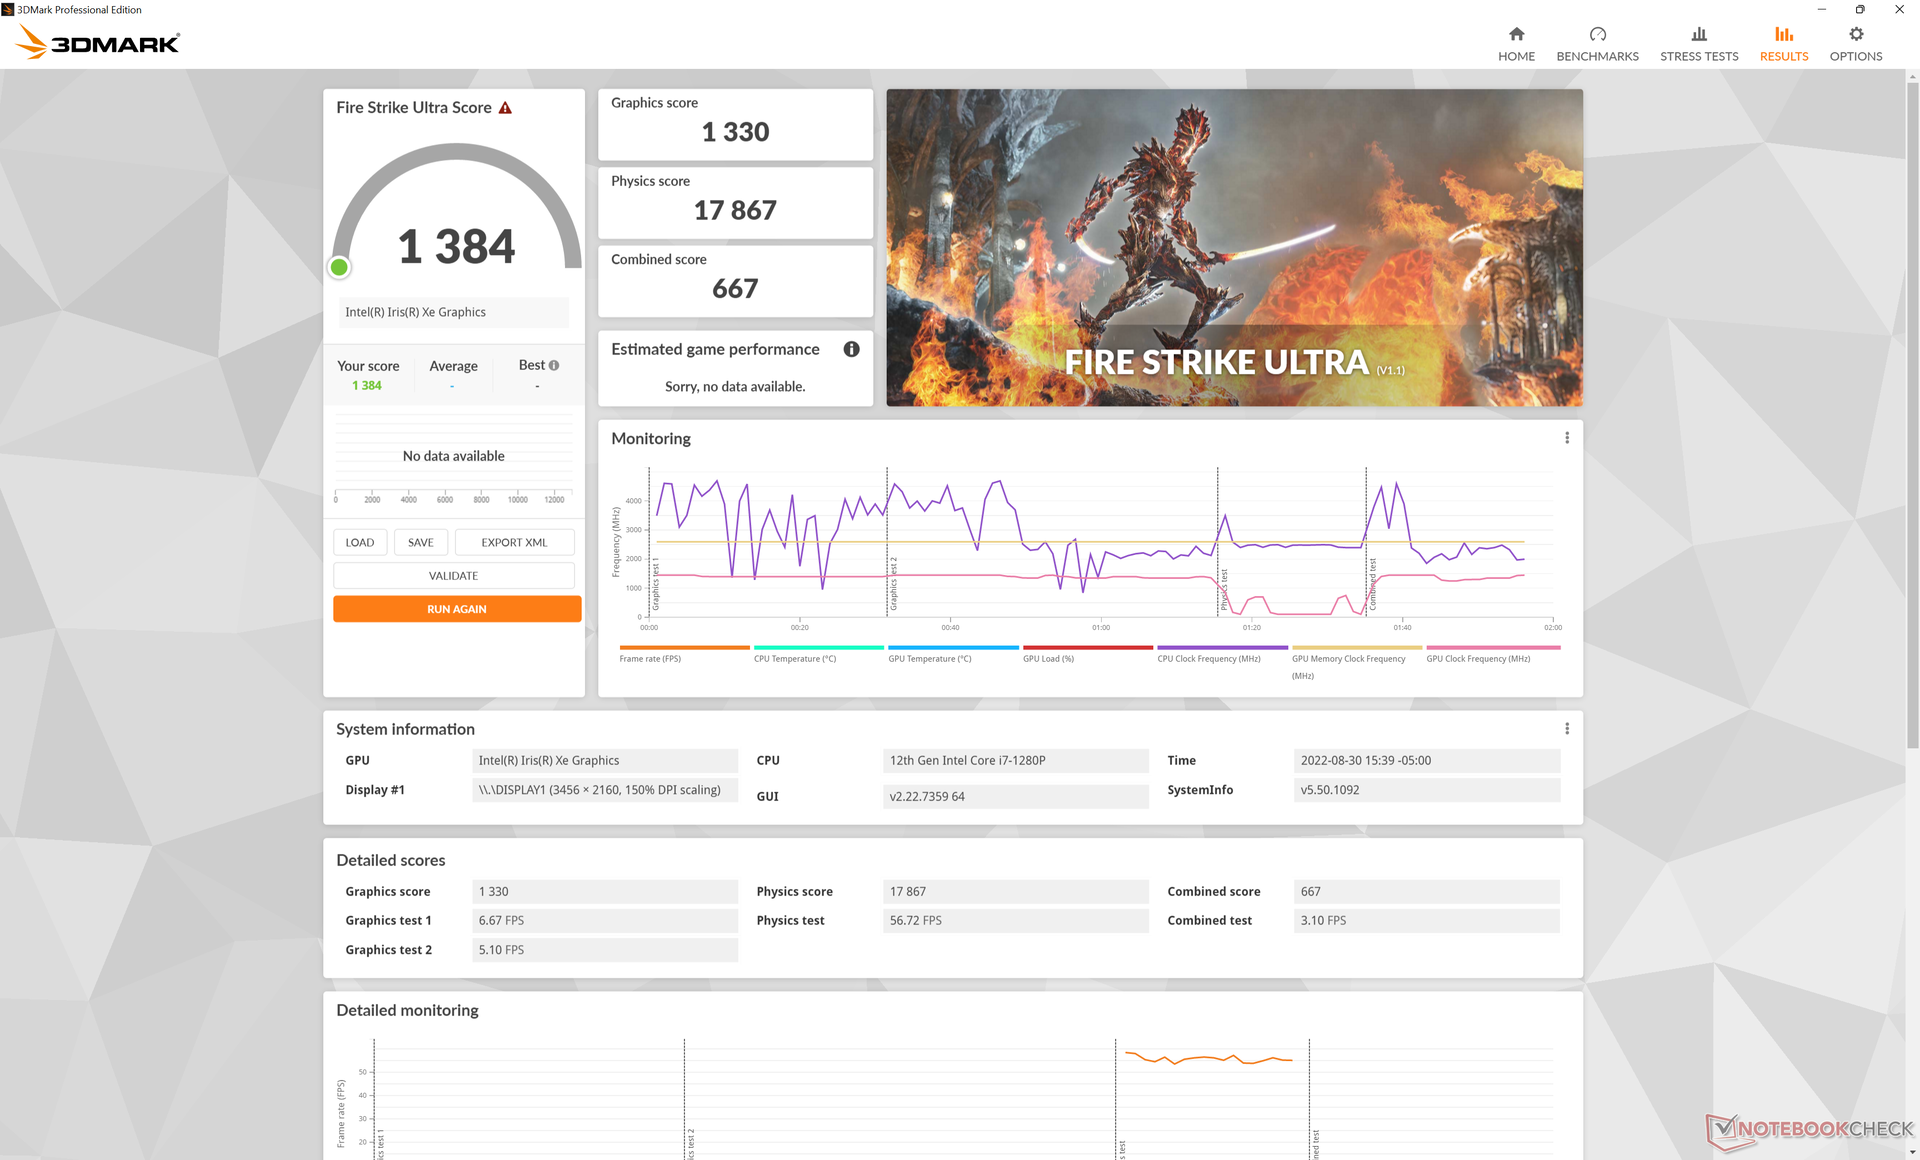
Les performances graphiques sont essentiellement identiques à celles de la configuration Core i7-1260P. Par rapport à l'option Core i5-1240P avec 8 Go de RAM et des cartes Iris Xe 80 EUscependant, notre Iris Xe 96 EUs est environ 30 à 65 % plus rapide. Vous voudrez configurer votre ordinateur avec au moins 16 Go de RAM et un processeur Core i7 si vous souhaitez maximiser les performances du GPU.
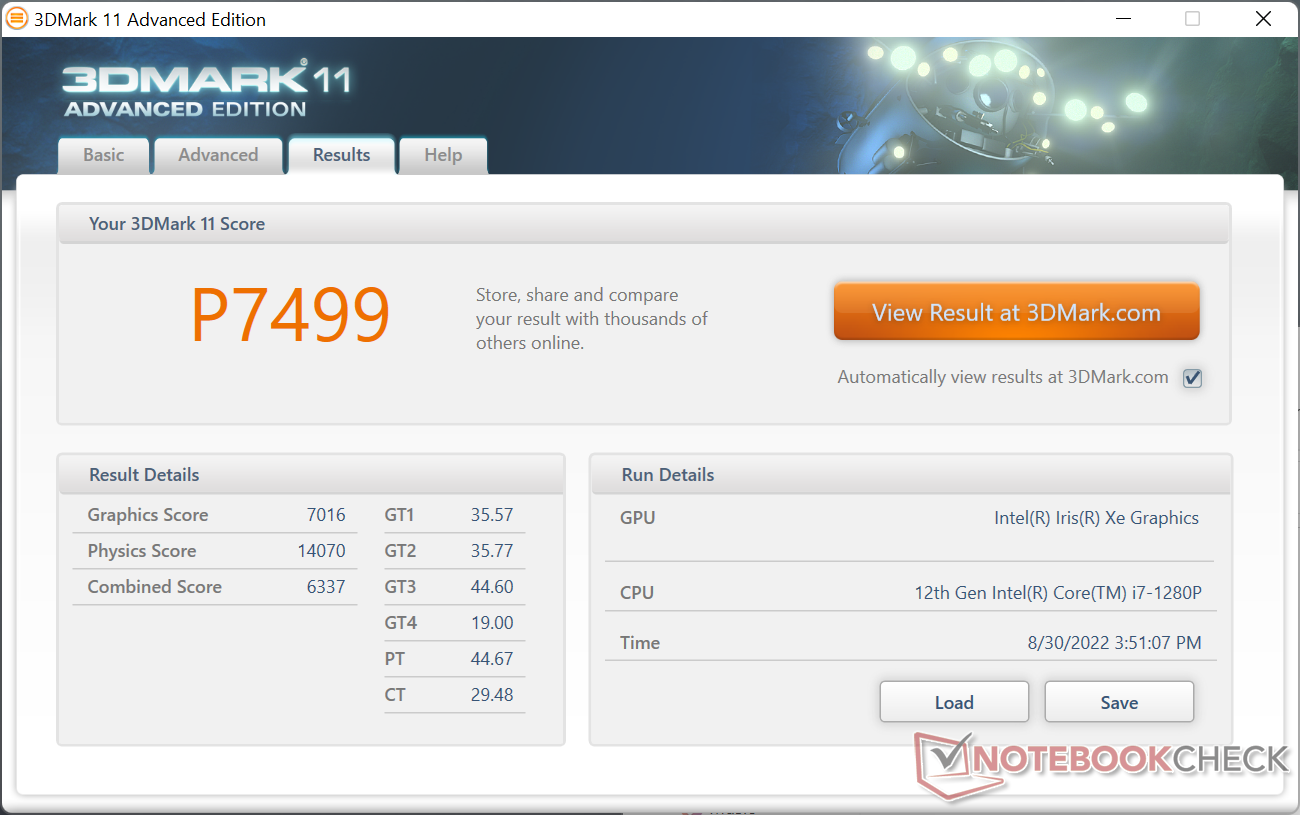
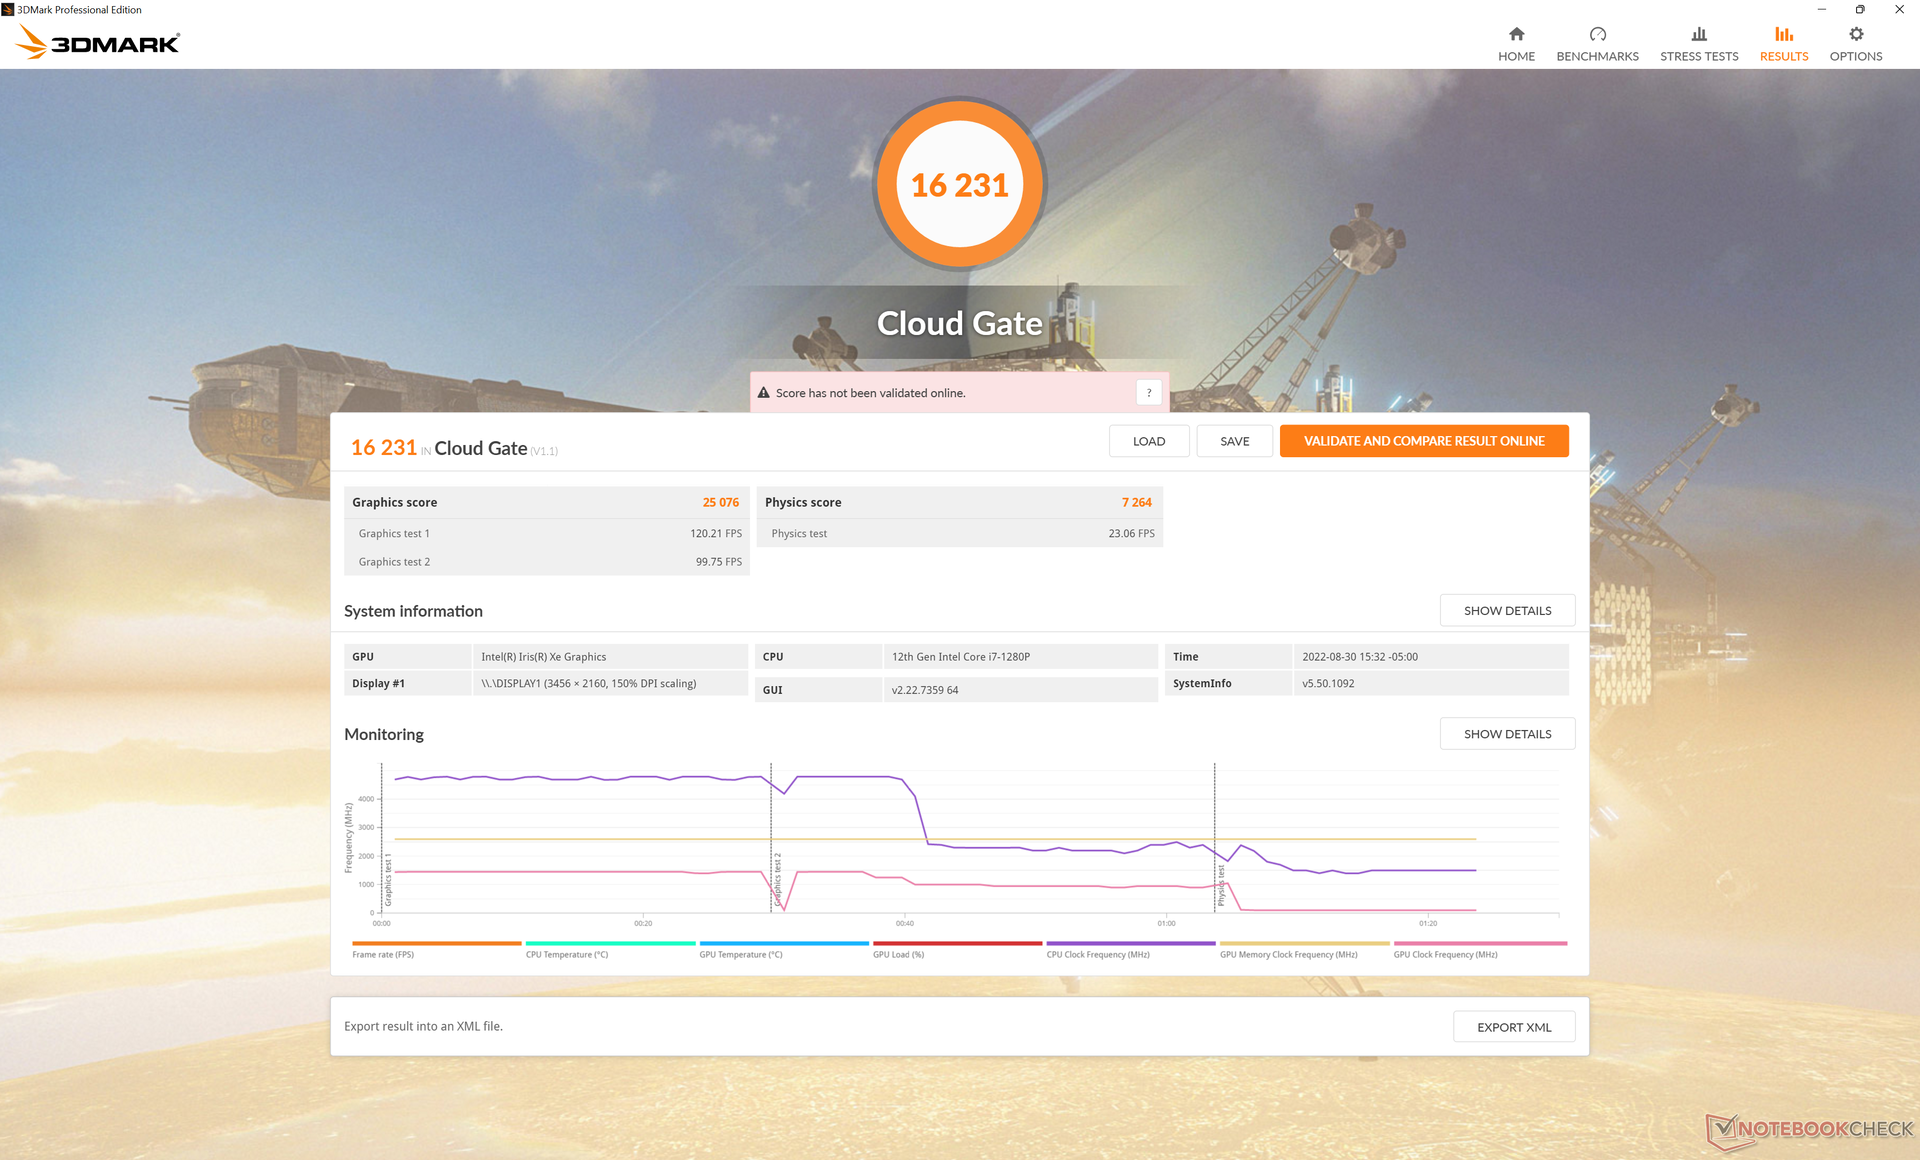
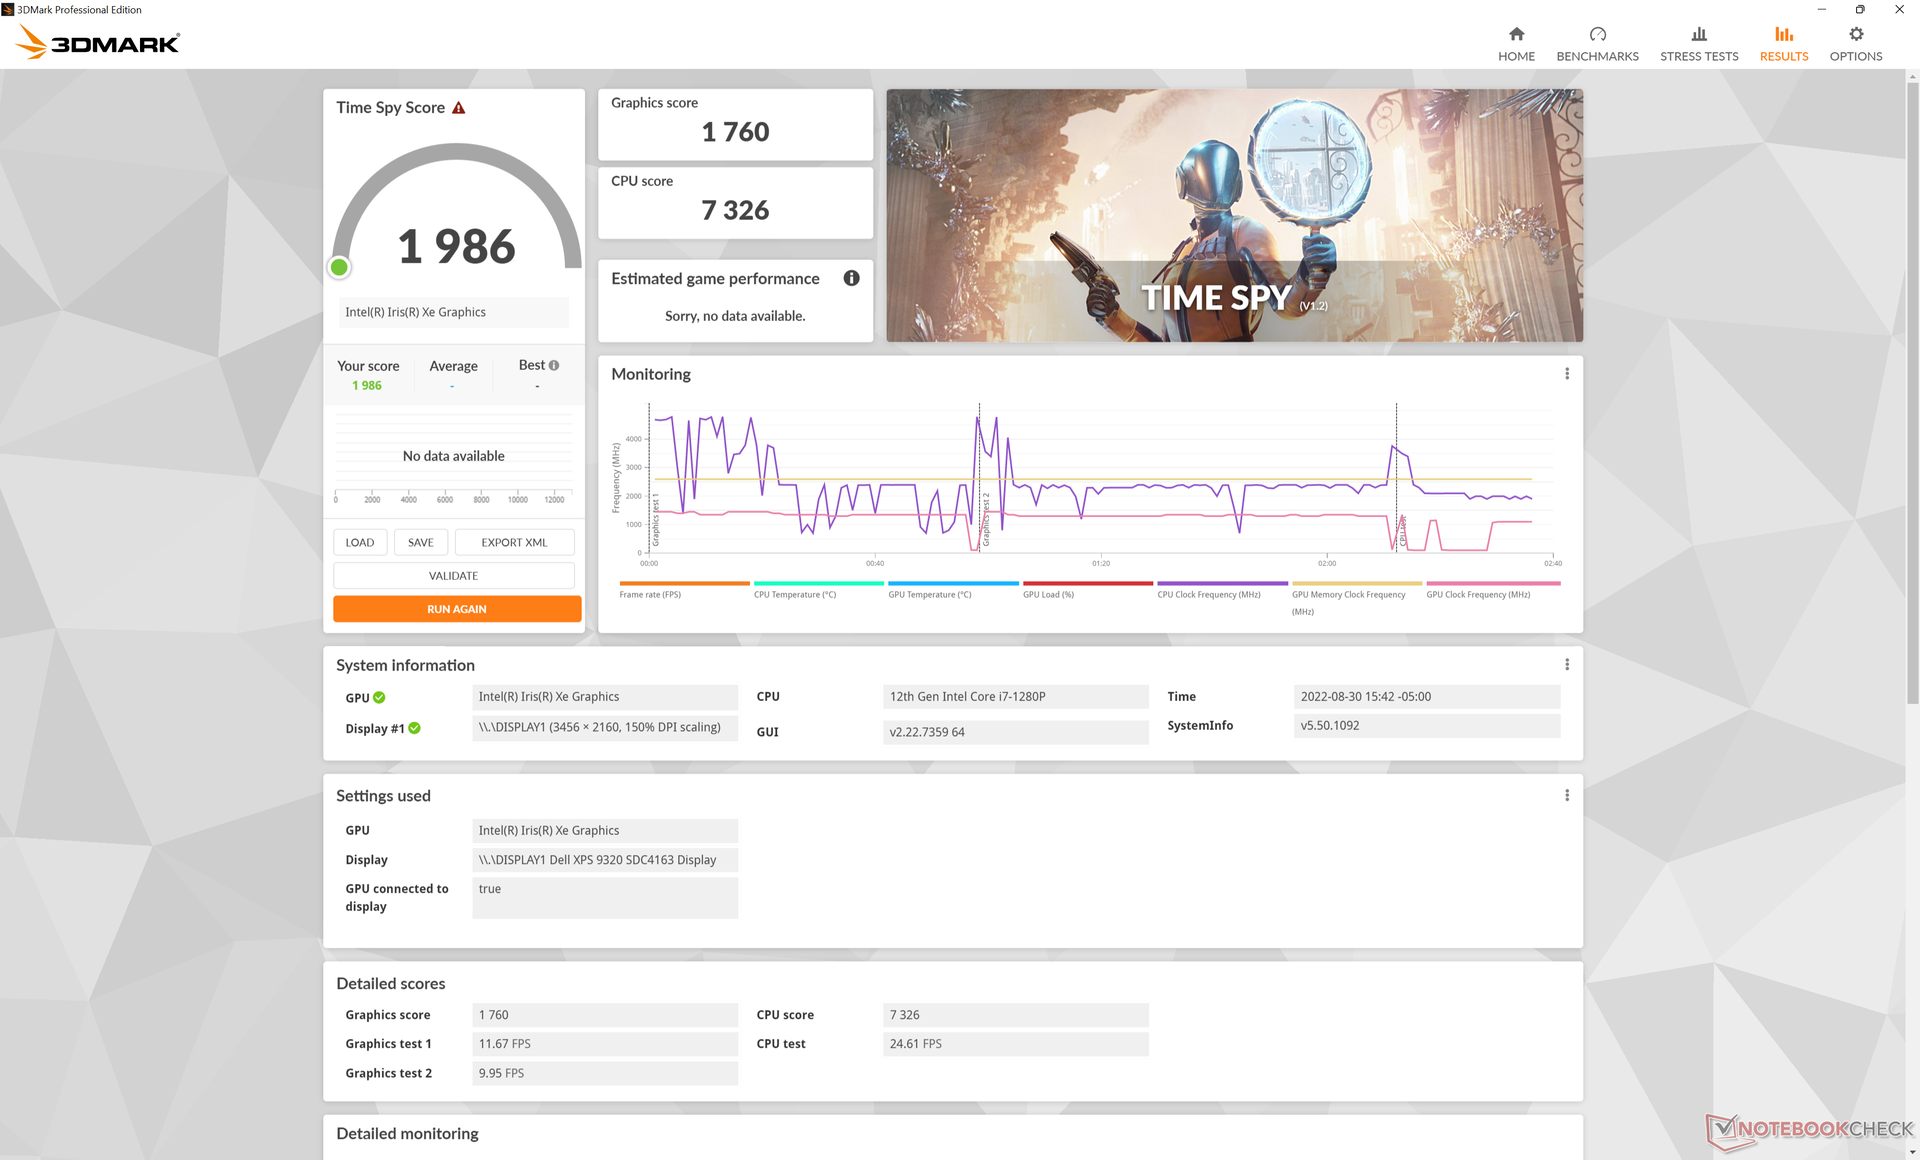
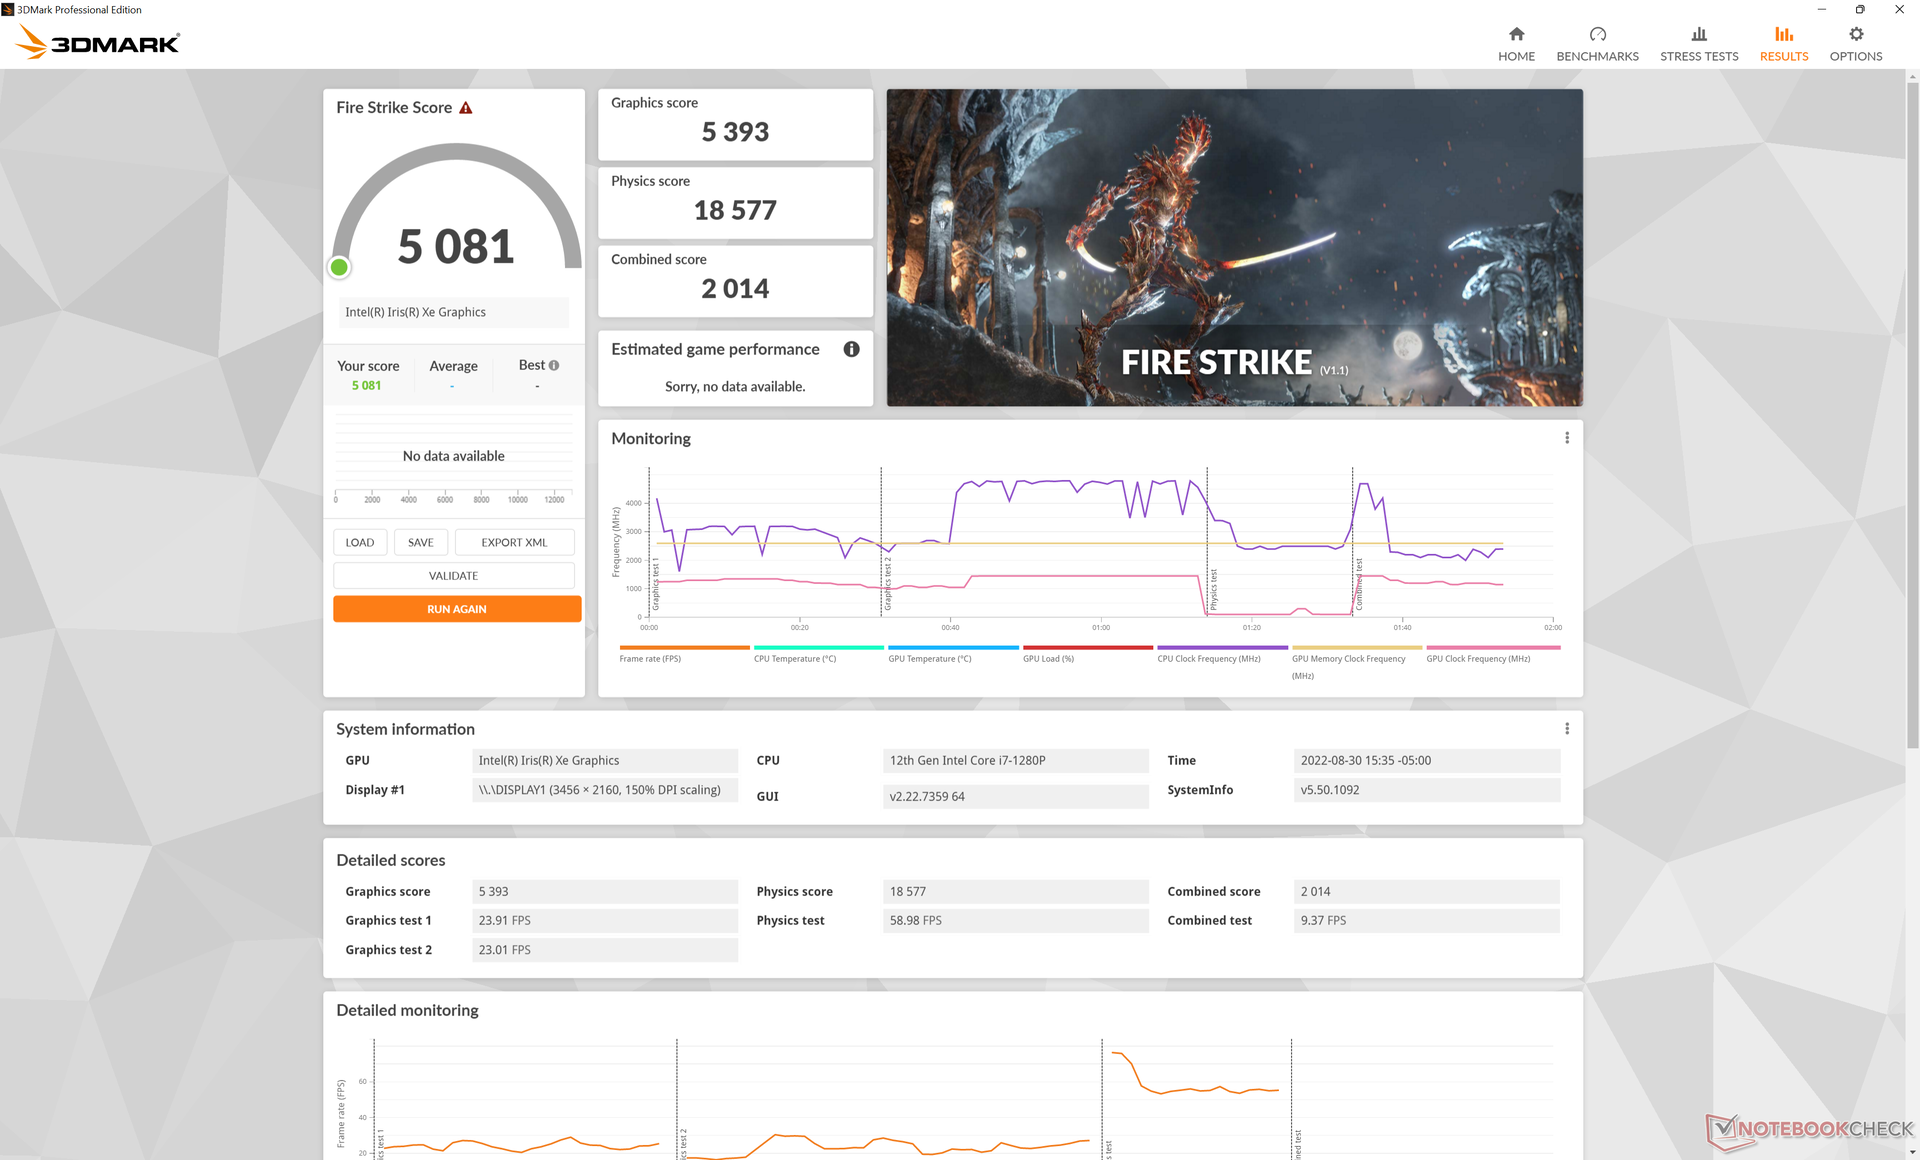
| 3DMark 11 Performance | 7499 points | |
| 3DMark Cloud Gate Standard Score | 16231 points | |
| 3DMark Fire Strike Score | 5081 points | |
| 3DMark Time Spy Score | 1986 points | |
Aide | ||
| Cyberpunk 2077 1.6 | |
| 1920x1080 Low Preset | |
| Dell XPS 13 Plus 9320 i7-1280P OLED | |
| Moyenne Intel Iris Xe Graphics G7 96EUs (13 - 25.9, n=42) | |
| 1920x1080 Medium Preset | |
| Dell XPS 13 Plus 9320 i7-1280P OLED | |
| Moyenne Intel Iris Xe Graphics G7 96EUs (10.8 - 21.7, n=37) | |
| 1920x1080 High Preset | |
| Dell XPS 13 Plus 9320 i7-1280P OLED | |
| Moyenne Intel Iris Xe Graphics G7 96EUs (9.8 - 16.9, n=34) | |
| 1920x1080 Ultra Preset | |
| Dell XPS 13 Plus 9320 i7-1280P OLED | |
| Moyenne Intel Iris Xe Graphics G7 96EUs (7.4 - 16.8, n=32) | |
Witcher 3 FPS Chart
| Bas | Moyen | Élevé | Ultra | |
|---|---|---|---|---|
| GTA V (2015) | 123.7 | 108.7 | 27.6 | 11.5 |
| The Witcher 3 (2015) | 104.8 | 65.7 | 36.9 | 16.4 |
| Dota 2 Reborn (2015) | 110.3 | 86.8 | 68.1 | 58.7 |
| Final Fantasy XV Benchmark (2018) | 46.1 | 25.3 | 17.6 | |
| X-Plane 11.11 (2018) | 55.2 | 40.7 | 37.6 | |
| Strange Brigade (2018) | 100.2 | 45.4 | 36.5 | 29.6 |
| Cyberpunk 2077 1.6 (2022) | 20.9 | 17.9 | 13.9 | 11.2 |
Émissions
Bruit du système
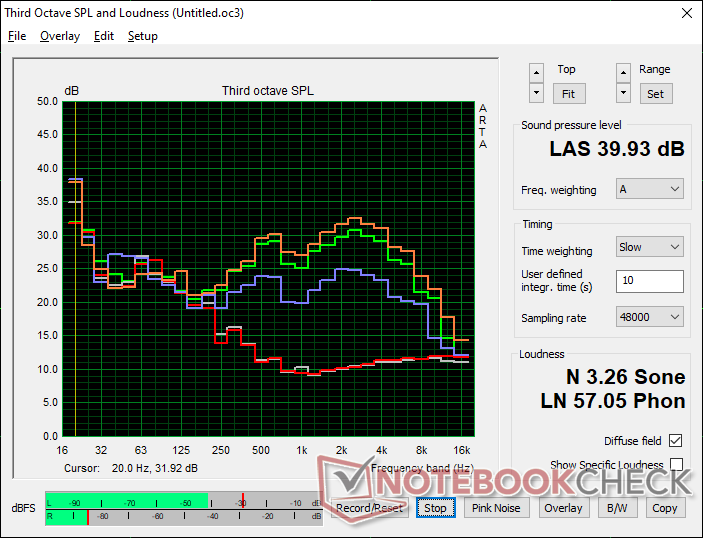
Les deux ventilateurs internes sont excellents pour rester silencieux lors de charges faibles à moyennes, car nous n'avons pu mesurer qu'un bruit de 25,4 dB(A) lors de la navigation ou du streaming vidéo, contre un fond silencieux de 23,4 dB(A). Des charges plus élevées, comme les jeux, induiront un bruit de ventilateur compris entre 35 et 42 dB(A). Étrangement, nous ne parvenons pas à atteindre le plafond de 45,5 dB(A) que nous avons enregistré sur la configuration i7-1260P, même en mode Ultra Performance. Les résultats globaux sont plutôt plus proches de ceux que nous avons enregistrés sur l'ancien XPS 13 9310 2-en-1.
Degré de la nuisance sonore
| Au repos |
| 23.4 / 23.4 / 23.4 dB(A) |
| Fortement sollicité |
| 35 / 39.9 dB(A) |
 | ||
30 dB silencieux 40 dB(A) audible 50 dB(A) bruyant |
||
min: | ||
| Dell XPS 13 Plus 9320 i7-1280P OLED Iris Xe G7 96EUs, i7-1280P, WDC PC SN810 512GB | Dell XPS 13 Plus 9320 i5-1240p Iris Xe G7 80EUs, i5-1240P, Micron 3400 MTFDKBA512TFH 512GB | Dell XPS 13 9315, i5-1230U Iris Xe G7 80EUs, i5-1230U, Micron 3460 256 GB Soldered | Dell XPS 13 Plus 9320 4K Iris Xe G7 96EUs, i7-1260P, Samsung PM9A1 MZVL21T0HCLR | Dell XPS 13 9310 2-in-1 Iris Xe G7 96EUs, i7-1165G7, Toshiba BG4 KBG40ZPZ512G | Dell XPS 13 9310 OLED Iris Xe G7 96EUs, i7-1185G7, Toshiba XG6 KXG60ZNV512G | |
|---|---|---|---|---|---|---|
| Noise | -13% | -8% | -8% | -4% | 4% | |
| arrêt / environnement * (dB) | 23.4 | 26 -11% | 26 -11% | 24.4 -4% | 24.3 -4% | 24.8 -6% |
| Idle Minimum * (dB) | 23.4 | 26.2 -12% | 26 -11% | 24.4 -4% | 24.8 -6% | 25 -7% |
| Idle Average * (dB) | 23.4 | 26.2 -12% | 26 -11% | 24.4 -4% | 24.8 -6% | 25 -7% |
| Idle Maximum * (dB) | 23.4 | 26.2 -12% | 27.5 -18% | 25.5 -9% | 24.8 -6% | 25 -7% |
| Load Average * (dB) | 35 | 38.4 -10% | 39.5 -13% | 40.4 -15% | 38 -9% | 25.3 28% |
| Witcher 3 ultra * (dB) | 41.6 | 39.6 5% | 45.5 -9% | 38 9% | 35.8 14% | |
| Load Maximum * (dB) | 39.9 | 47.1 -18% | 39.6 1% | 45.5 -14% | 41.5 -4% | 35.8 10% |
* ... Moindre est la valeur, meilleures sont les performances
Test de stress
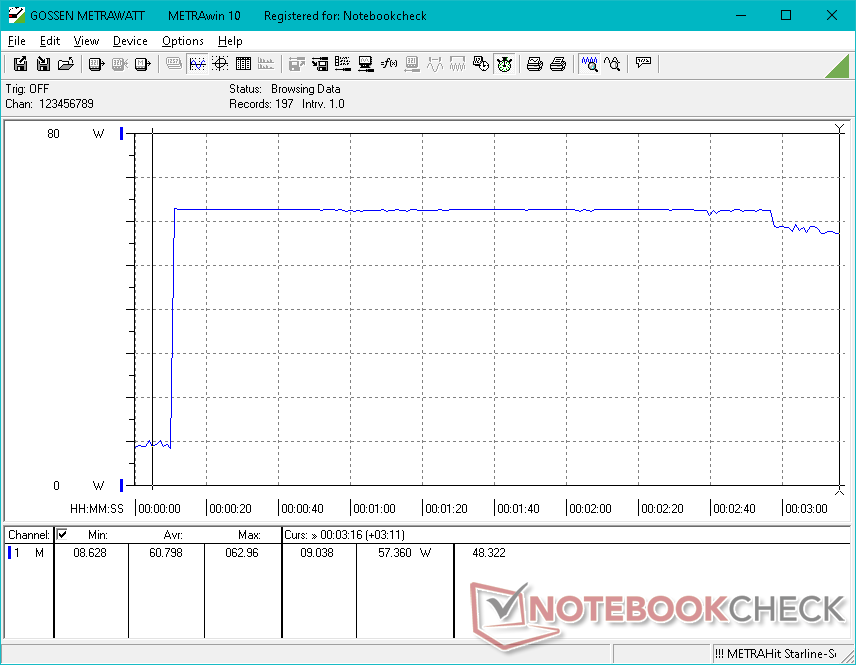
Le déclenchement du stress Prime95 fait monter en flèche la fréquence d'horloge du CPU, la température et la consommation d'énergie de la carte à 2,9 GHz, 100 C et 64 W, respectivement, pendant près de 3 minutes. Ensuite, les fréquences d'horloge, la température et la consommation électrique de la carte chutent et se stabilisent à 1,5 GHz, 85 C et 28 W, respectivement, comme le montre la capture d'écran ci-dessous. Ces résultats s'alignent sur le test de stress CineBench R15 xT ci-dessus où le score initial élevé n'était pas durable sur de longues périodes en raison du Turbo Boost limité de l'ordinateur portable. Il est intéressant de noter que la cible stable de 28 W est en fait inférieure à la cible stable de 34 W de la configuration i7-1260P, ce qui peut expliquer les résultats légèrement meilleurs de CineBench R15 xT de notre unité de test i7-1260P.
La fréquence d'horloge et la température du GPU se stabilisent à 1147 MHz et 81 C, respectivement, lors de l'exécution du test Witcher 3 pour représenter des charges graphiques exigeantes.
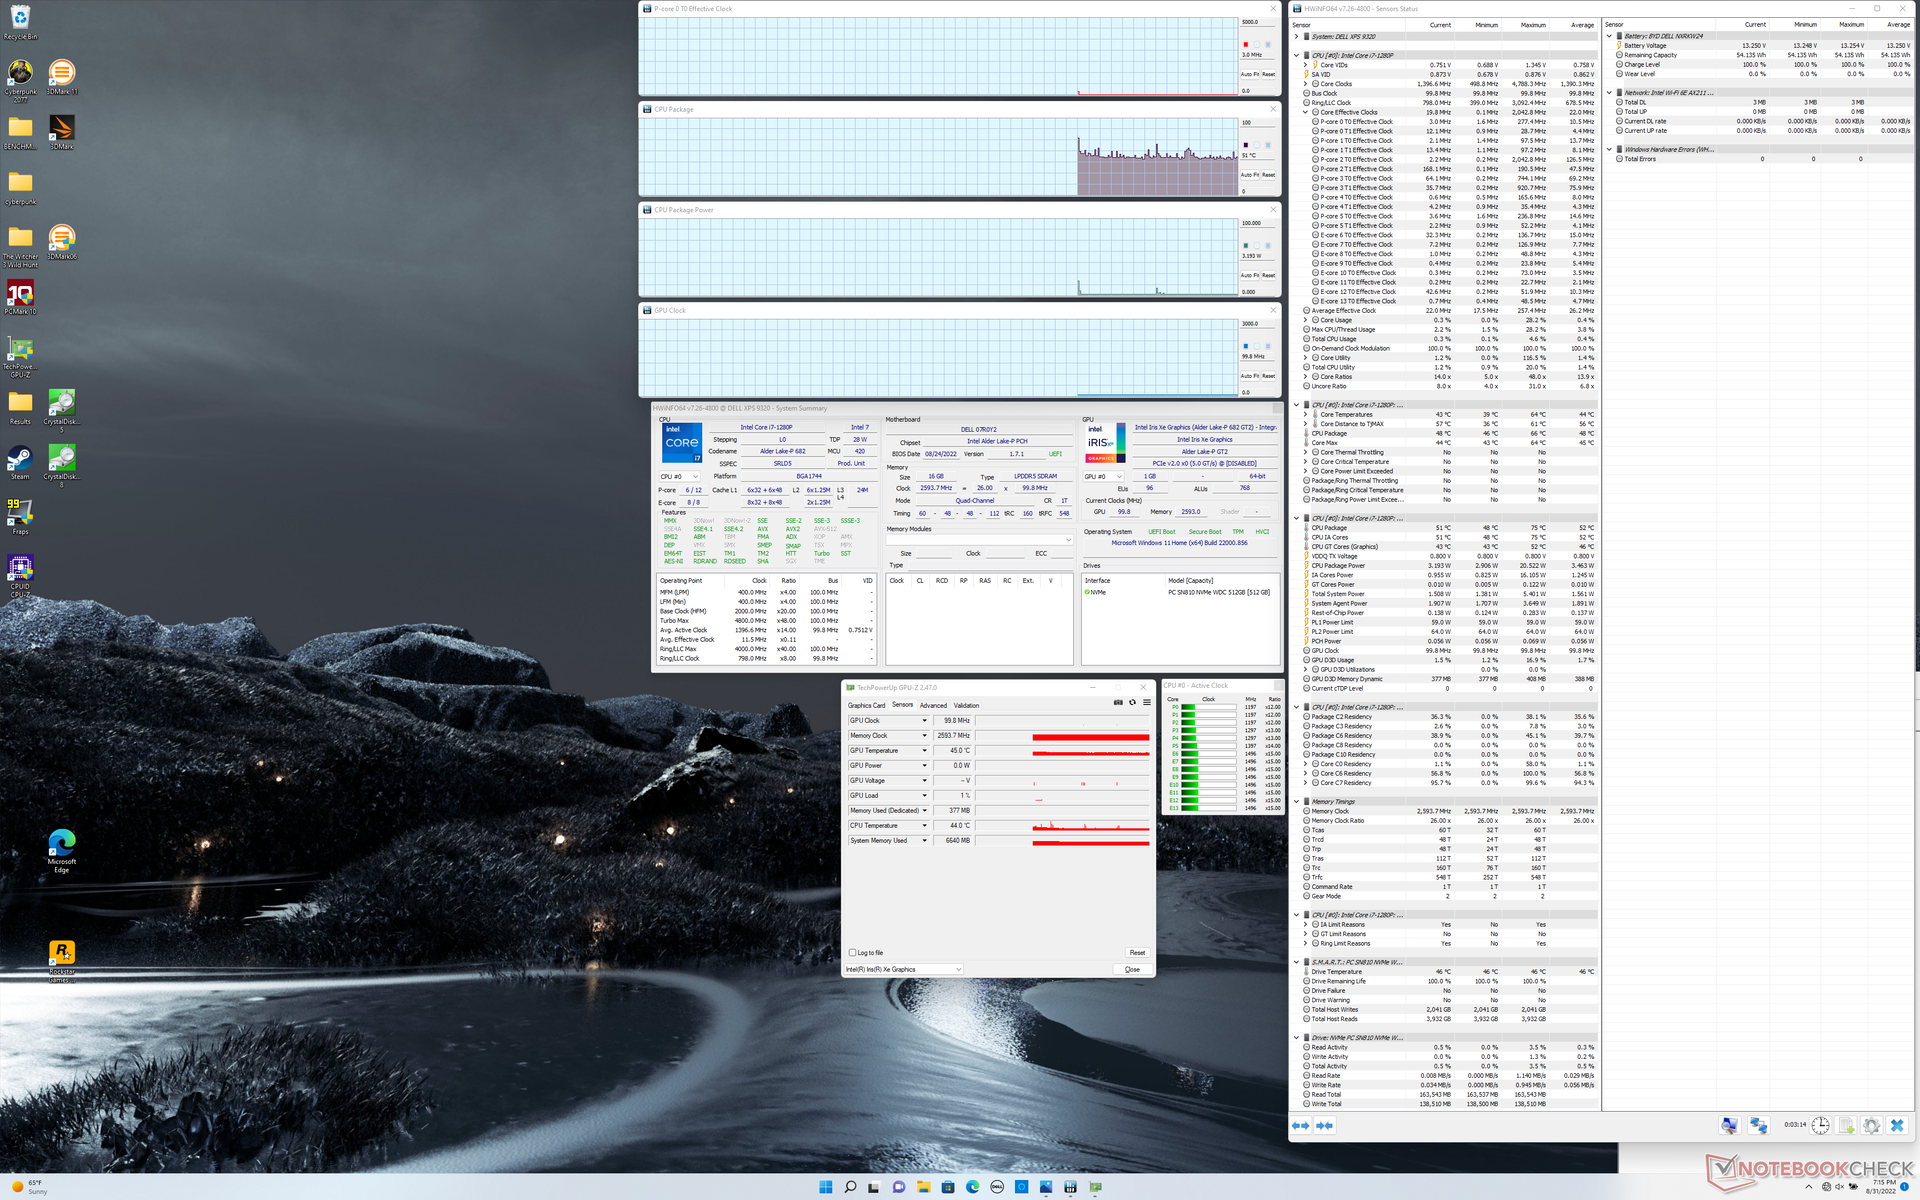
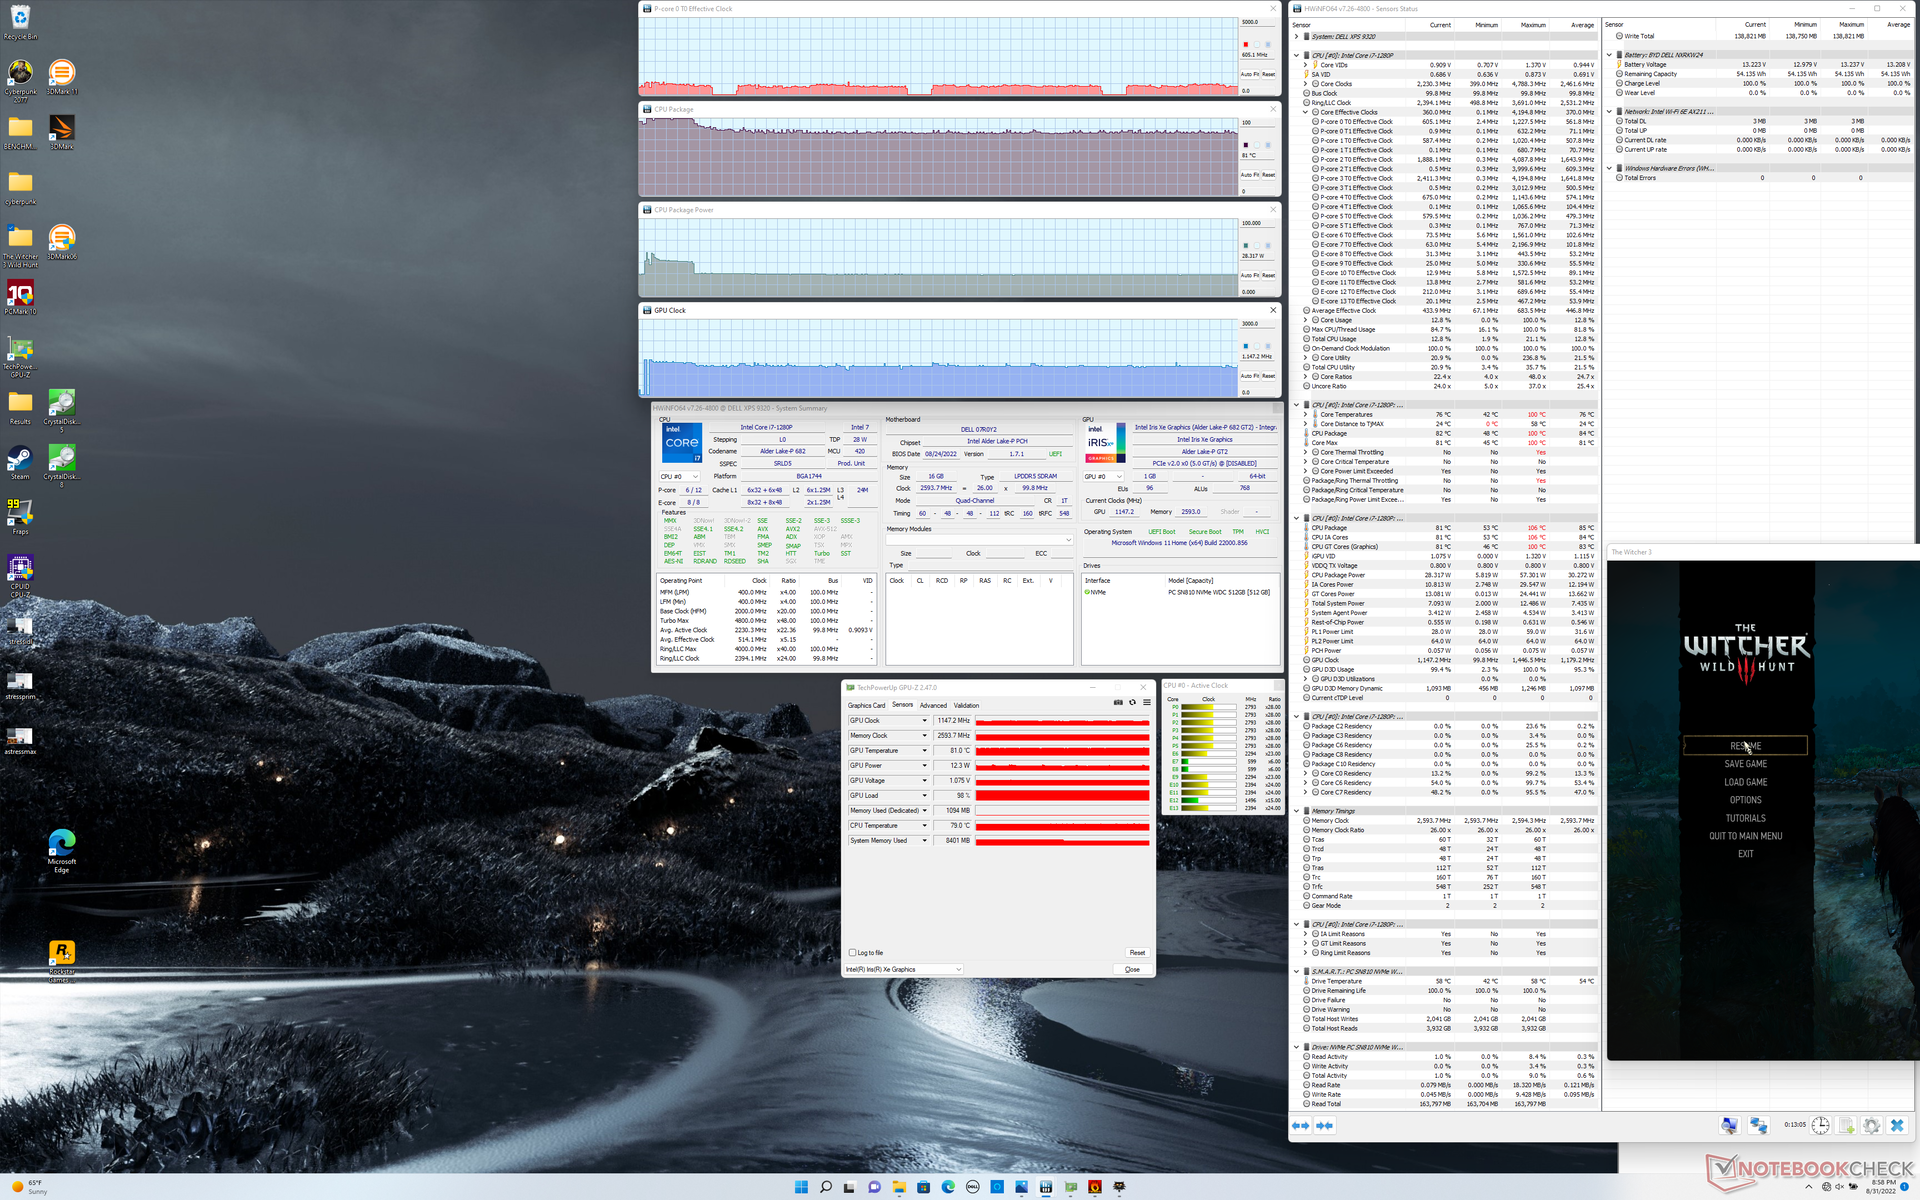
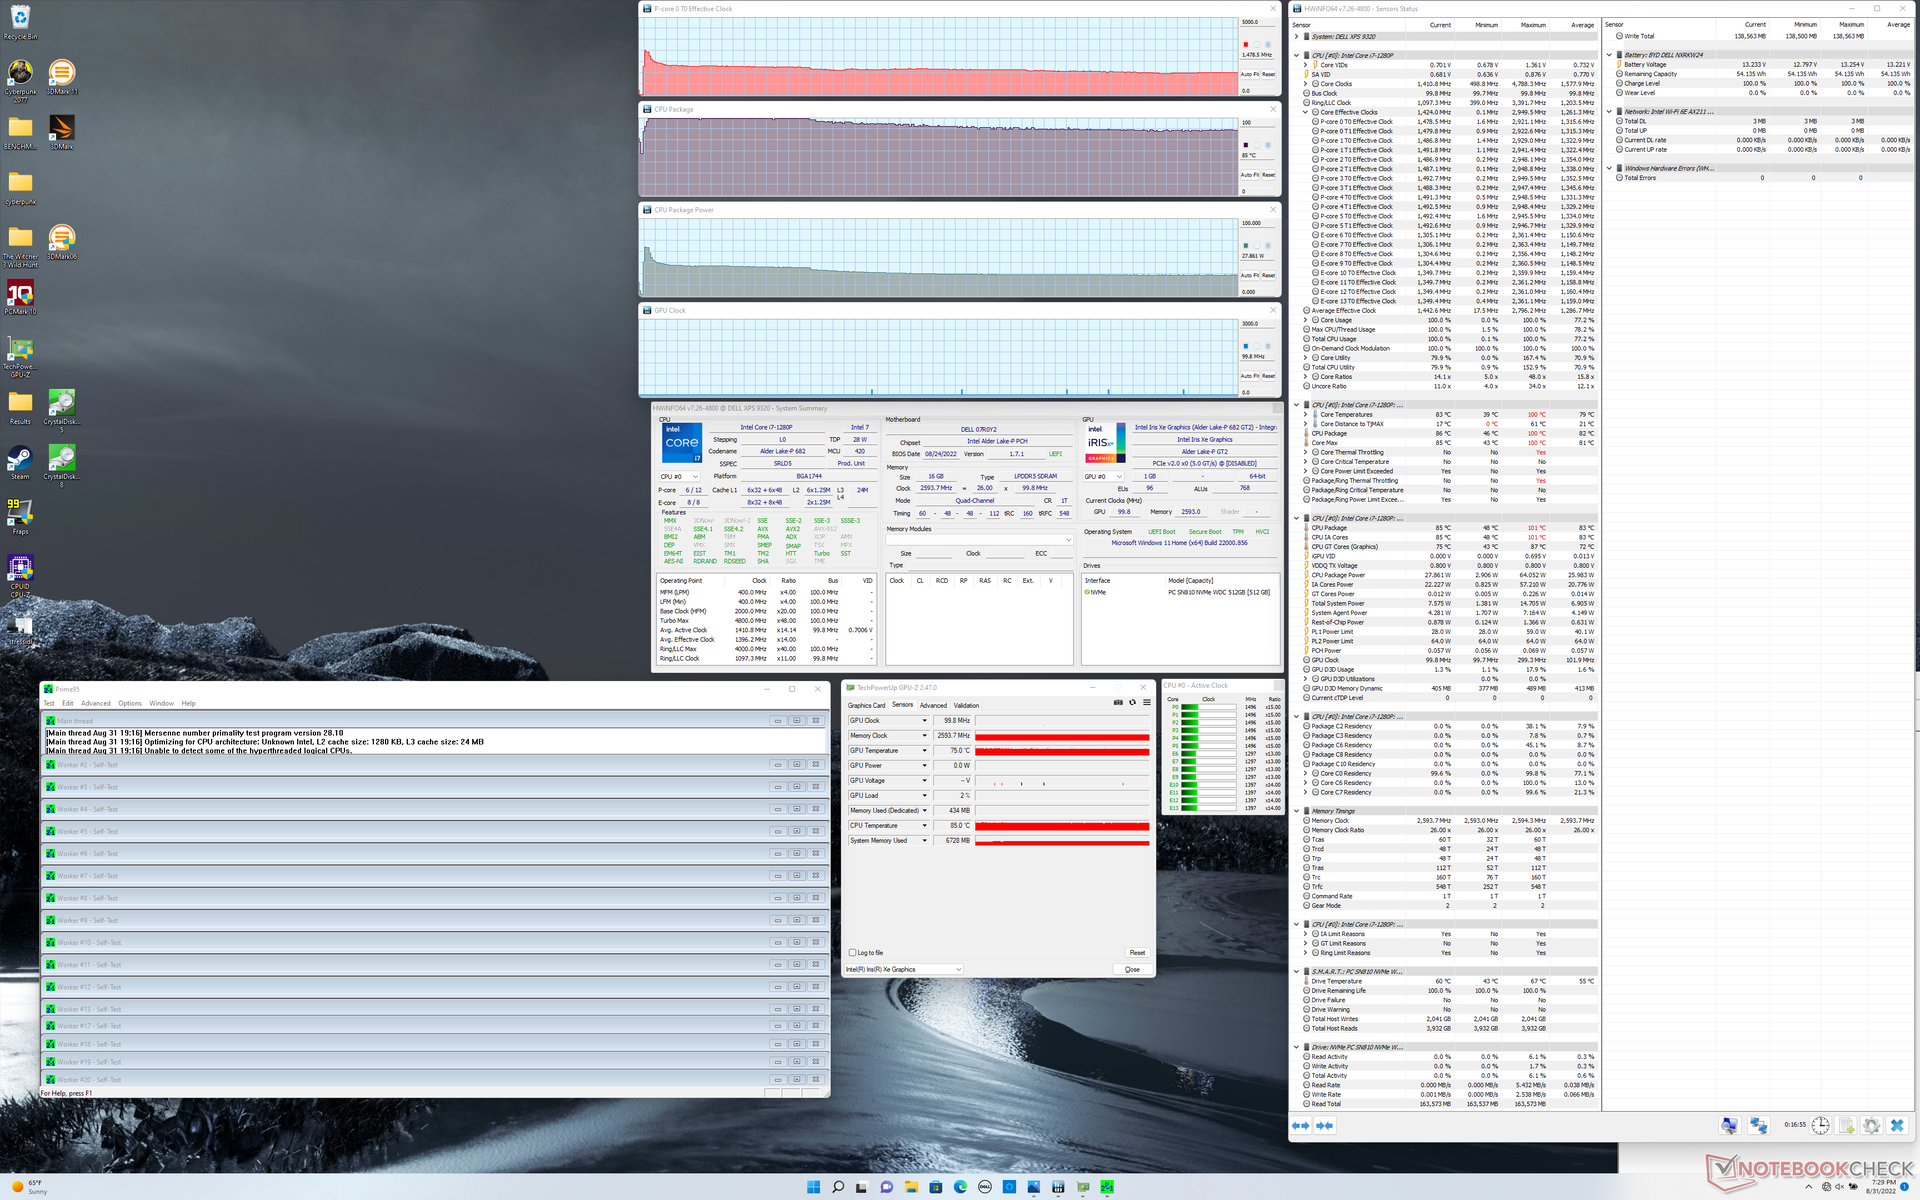
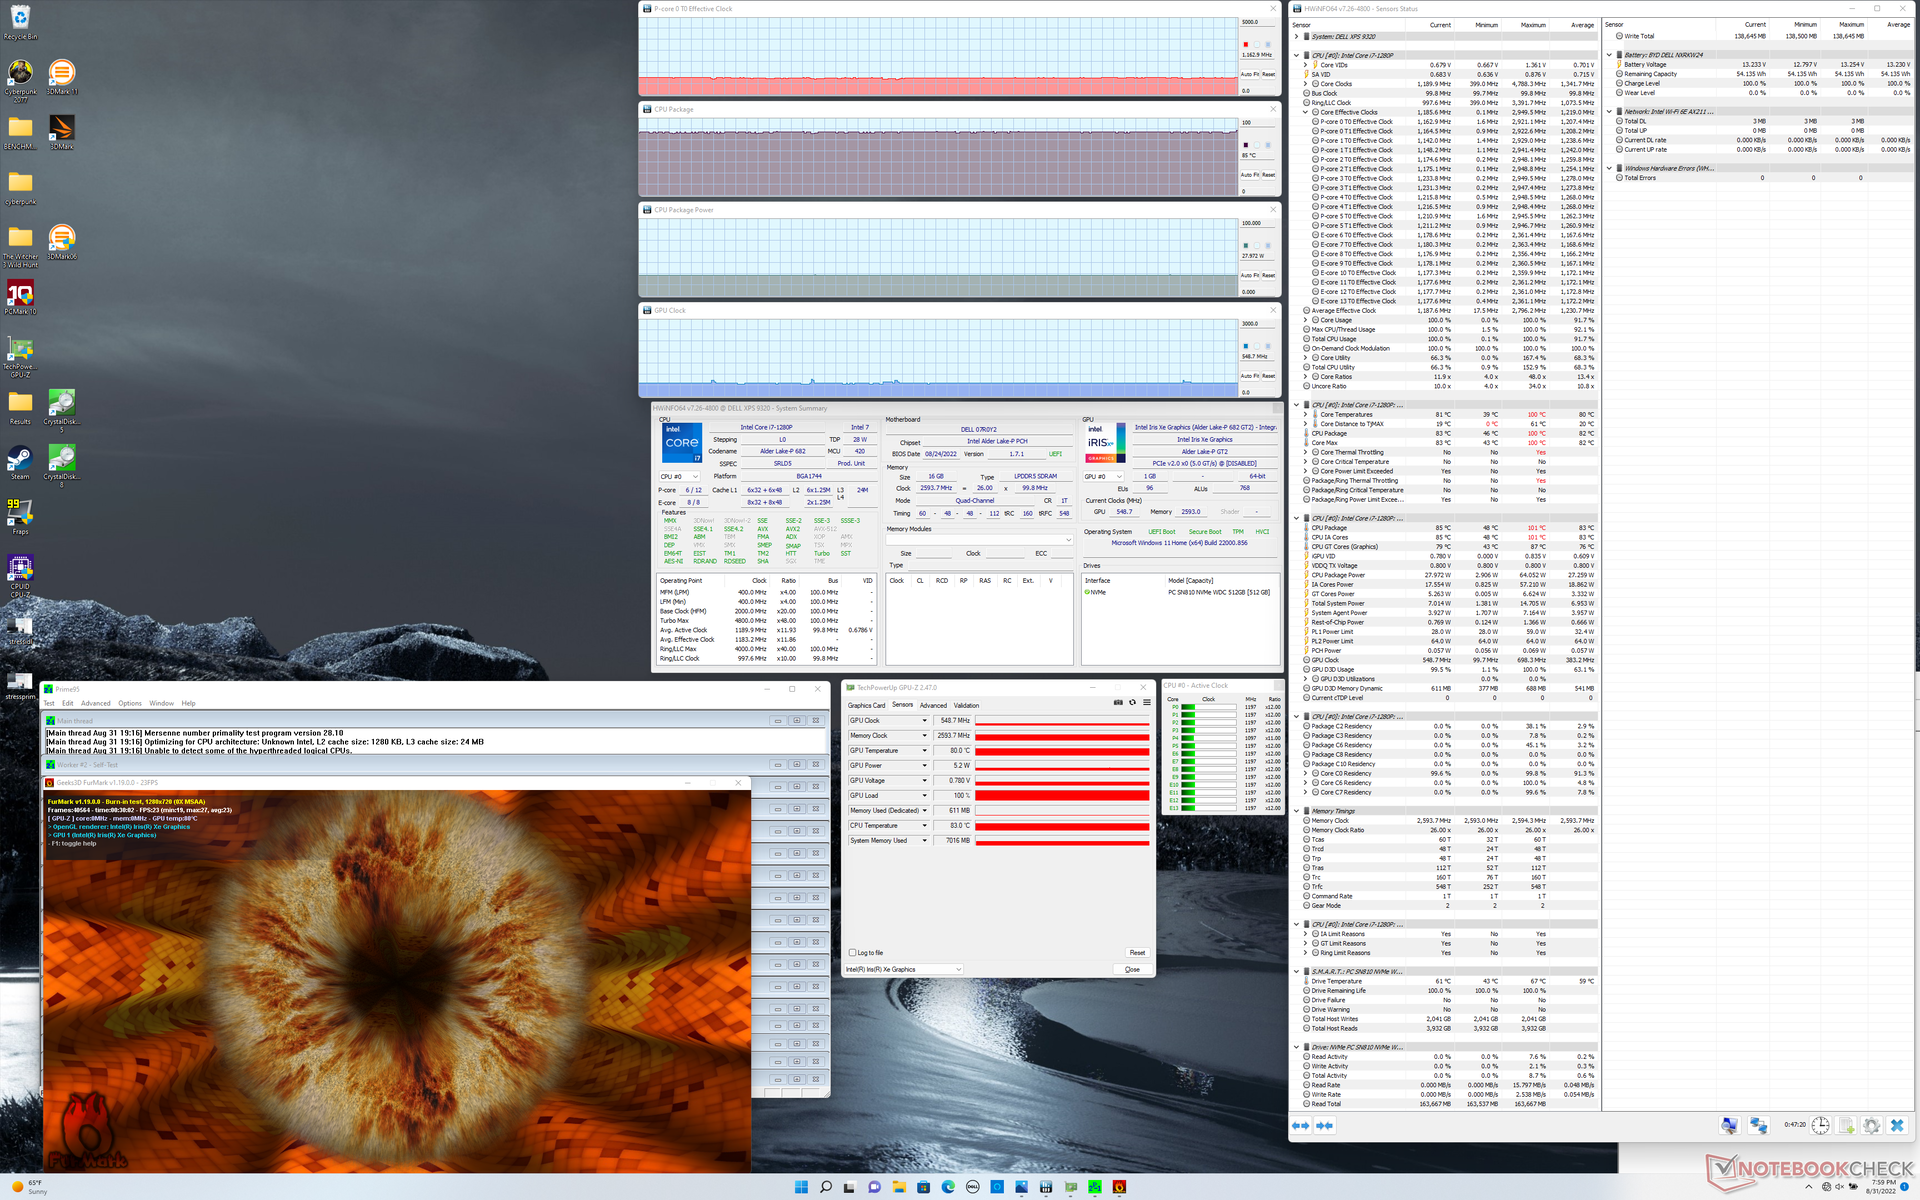
| Fréquence du CPU (GHz) | Fréquence du GPU (MHz) | Température moyenne du CPU (°C) | |
| Système au repos | -- | -- | 51 |
| Prime95 Stress | 1.5 | -- | 85 |
| Prime95 + FurMark Stress | 1.2 | 549 | 85 |
| Witcher 3 Stress | ~0.6 | 1147 | 81 |
Gestion de l'énergie
Consommation d'énergie
La consommation d'énergie peut être aussi faible que 6 W lors de l'affichage d'une image noire ou jusqu'à 13 W lors de l'affichage d'une image entièrement blanche au réglage de la luminosité maximale. En comparaison, les panneaux IPS des autres XPS 13 Plus n'augmentent que de 2 à 4 W entre leurs réglages de luminosité minimum et maximum. Nous avons exploré le rapport entre la consommation d'énergie et les panneaux OLED dans le passé et la tendance se poursuit sur ces configurations XPS 13 Plus. En bref, les options IPS seront plus économes en énergie dans la plupart des scénarios, en particulier parce que les sites Web, les feuilles de calcul et les programmes de traitement de texte ont tendance à être principalement de couleur blanche.
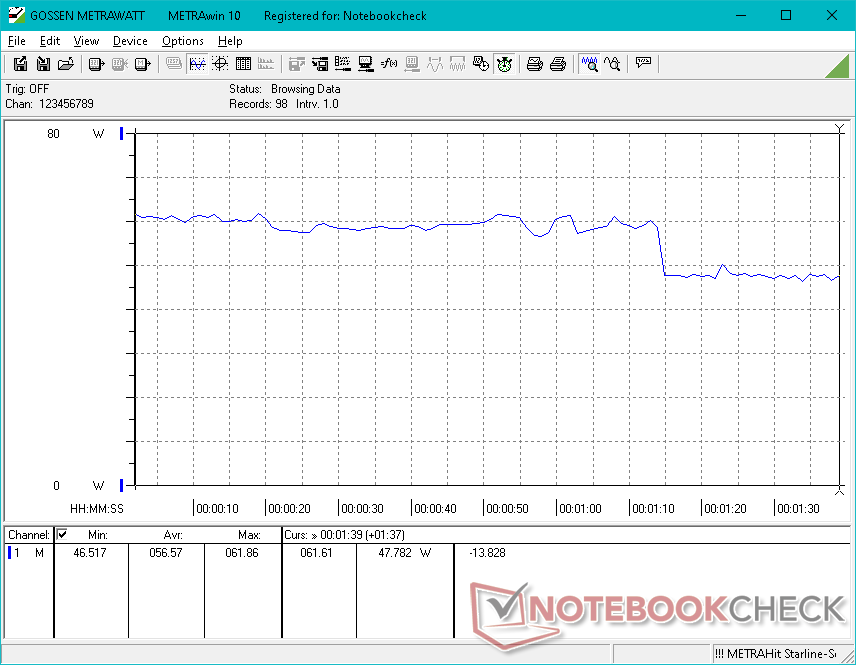
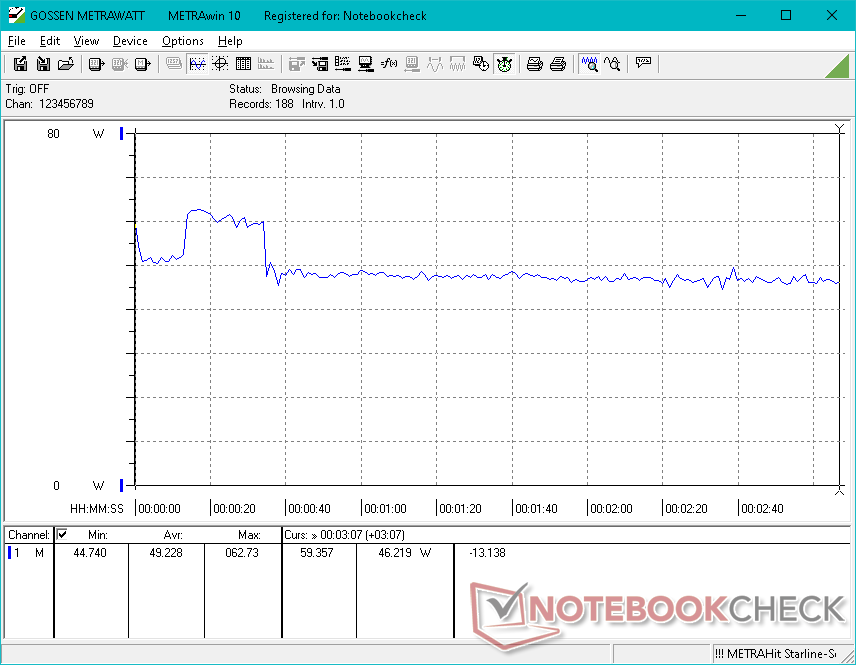
L'exécution de charges plus élevées comme des jeux montre une consommation d'énergie plus élevée que la configuration Core i5-1240P de 8 Go d'environ 15 à 55 %, ce qui correspond à peu près aux performances graphiques plus élevées de notre configuration i7-1280P de 16 Go. Les résultats sont par ailleurs très proches de ceux de la configuration Core i7-1260P, sauf lors de l'exécution de charges gourmandes en ressources CPU comme Prime95 pendant les premières minutes, comme le montre le graphique ci-dessous.
| Éteint/en veille | |
| Au repos | |
| Fortement sollicité |
|
Légende:
min: | |
| Dell XPS 13 Plus 9320 i7-1280P OLED i7-1280P, Iris Xe G7 96EUs, WDC PC SN810 512GB, OLED, 3456x2160, 13.4" | Dell XPS 13 Plus 9320 i5-1240p i5-1240P, Iris Xe G7 80EUs, Micron 3400 MTFDKBA512TFH 512GB, IPS, 1920x1200, 13.4" | Dell XPS 13 9315, i5-1230U i5-1230U, Iris Xe G7 80EUs, Micron 3460 256 GB Soldered, IPS, 1920x1200, 13.4" | Dell XPS 13 Plus 9320 4K i7-1260P, Iris Xe G7 96EUs, Samsung PM9A1 MZVL21T0HCLR, IPS, 3840x2400, 13.4" | Dell XPS 13 9310 2-in-1 i7-1165G7, Iris Xe G7 96EUs, Toshiba BG4 KBG40ZPZ512G, IPS, 1920x1200, 13.4" | Dell XPS 13 9310 OLED i7-1185G7, Iris Xe G7 96EUs, Toshiba XG6 KXG60ZNV512G, OLED, 3456x2160, 13.4" | |
|---|---|---|---|---|---|---|
| Power Consumption | -16% | 40% | -7% | 38% | 19% | |
| Idle Minimum * (Watt) | 6.5 | 10 -54% | 3.6 45% | 7 -8% | 2.6 60% | 5.7 12% |
| Idle Average * (Watt) | 7.8 | 12.3 -58% | 6.8 13% | 11 -41% | 6.4 18% | 6 23% |
| Idle Maximum * (Watt) | 13 | 15.5 -19% | 6.8 48% | 11.4 12% | 7.7 41% | 12.3 5% |
| Load Average * (Watt) | 56.6 | 43 24% | 24 58% | 59.7 -5% | 29.9 47% | 44.4 22% |
| Witcher 3 ultra * (Watt) | 49.2 | 43.1 12% | 23.6 52% | 49.4 -0% | 32.2 35% | 36.5 26% |
| Load Maximum * (Watt) | 63 | 62.8 -0% | 47 25% | 63 -0% | 47.5 25% | 47.8 24% |
* ... Moindre est la valeur, meilleures sont les performances
Power Consumption Witcher 3 / Stresstest
Power Consumption external Monitor
Autonomie de la batterie
Avec seulement 5,5 heures d'utilisation réelle du WLAN sur le profil d'alimentation équilibré, les durées d'exécution sont plus courtes que toute autre configuration du XPS 13 Plus, en grande partie à cause de la dalle OLED. Les autres modèles IPS durent environ 1 à 2 heures de plus.
| Dell XPS 13 Plus 9320 i7-1280P OLED i7-1280P, Iris Xe G7 96EUs, 55 Wh | Dell XPS 13 Plus 9320 i5-1240p i5-1240P, Iris Xe G7 80EUs, 55 Wh | Dell XPS 13 9315, i5-1230U i5-1230U, Iris Xe G7 80EUs, 51 Wh | Dell XPS 13 Plus 9320 4K i7-1260P, Iris Xe G7 96EUs, 55 Wh | Dell XPS 13 9310 2-in-1 i7-1165G7, Iris Xe G7 96EUs, 51 Wh | Dell XPS 13 9310 OLED i7-1185G7, Iris Xe G7 96EUs, 52 Wh | |
|---|---|---|---|---|---|---|
| Autonomie de la batterie | 38% | 155% | 19% | 84% | 12% | |
| WiFi v1.3 (h) | 5.8 | 8 38% | 14.8 155% | 6.9 19% | 10.7 84% | 6.5 12% |
| Load (h) | 1.6 | 2.6 | 1.3 | 3.4 | ||
| H.264 (h) | 11 | |||||
| Reader / Idle (h) | 25.4 |
Points positifs
Points négatifs
Verdict : plus rapide, mais pas vraiment meilleur
La configuration la plus haut de gamme avec le Core i7-1280P Et l'écran OLED est conçue pour un sous-ensemble très spécifique d'utilisateurs. Si vos charges de travail requièrent des couleurs P3 et un multitâche important entre les applications, le Turbo Boost initial plus rapide du CPU et de l'écran OLED peut valoir la peine d'investir par rapport au Core i7-1260P et IPS moins coûteux. Sinon, les inconvénients qu'ils comportent ne l'emportent pas nécessairement sur leurs avantages. L'OLED introduit un scintillement qui n'est pas présent sur les panneaux IPS, en plus d'une luminosité maximale plus faible et d'une durée de vie de la batterie plus courte. Le processeur i7-1280P n'est pas non plus garanti plus rapide que le i7-1260P lorsque le pic initial de performance Turbo Boost s'estompe inévitablement.
Un autre résultat inattendu concerne les performances du disque dur SSD WD SN810 qui s'emballait sur notre unité de test lorsqu'il était soumis à des contraintes. Si vous pouvez trouver des SKUs avec le Micron 3400 ou le Samsung PM9A1 à la place, alors ces disques peuvent offrir des performances plus stables.
Pour la plupart des utilisateurs, la configuration Core i7-1260P et IPS offre un meilleur équilibre entre performances et prix que la configuration i7-1280P et OLED. Elle offre même une plus grande autonomie de la batterie et un écran plus lumineux malgré son prix plus bas.
Les différences entre les SKUs i7-1260P et i7-1280P sont plus étroites que les différences entre les SKUs i5-1240P et i7-1260P en ce qui concerne les performances graphiques intégrées. Nous vous recommandons de configurer votre ordinateur avec au moins 16 Go de RAM, quelle que soit l'option de CPU choisie, sous peine de voir les performances graphiques chuter.
Prix et disponibilité
Les configurations avec le Core i7-1280P ne sont pas encore largement disponibles chez les revendeurs comme Newegg, Amazon ou Best Buy, car les SKU avec le i7-1260P sont beaucoup plus courants. Cependant, les options OLED sont largement disponibles, mais avec le i7-1260P. Les utilisateurs peuvent acheter directement auprès de Dell pour notre configuration exacte i7-1280P OLED pour $1750 USD.
Dell XPS 13 Plus 9320 i7-1280P OLED
- 09/02/2022 v7 (old)
Allen Ngo
Price comparison

