Critiques du Intel Core i5-1240P processeur
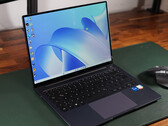
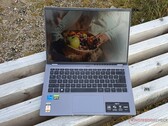
Test du Huawei MateBook 14 : une tentative d'alternative au MacBook Air
Huawei a mis à jour le MateBook 14 et propose désormais un processeur Intel de 12ème génération dans cet ultrabook de milieu de gamme de haute qualité. Notre test montre si une mise à jour vaut la peine et comment le modèle qui ressemble visuellement au MacBook Air s'en sort dans notre comparaison.
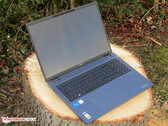
Intel Core i5-1240P, Iris Xe G7 80EUs, 14", 1.4 kgTest de l'Acer TravelMate P4 TMP416-51 : PC portable de bureau léger, endurant et puissant
L'Acer TravelMate est doté d'un puissant processeur Alder Lake, d'émissions modérées et d'une bonne autonomie de batterie. Un grand écran de 16 pouces au format 16:10 convivial (1 920 x 1 200 pixels) et une garantie de trois ans complètent l'ensemble.
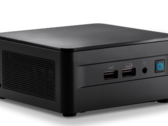
Intel Core i5-1240P, Iris Xe G7 80EUs, 16", 1.6 kgTest de l'Intel NUC 12 Pro Kit (Core i5-1240P) : connexion rapide et connectivité variée
Le kit Intel NUC 12 Pro est un mini PC minuscule mais puissant. Son puissant Core i5-1240P Alder Lake 12ème génération offre une grande puissance de calcul, bien que les performances graphiques soient insuffisantes. Comme son grand frère, sa plus grande force est peut-être son excellente sélection de ports, qui comprend deux ports Thunderbolt 4.
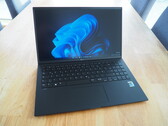
Intel Core i5-1240P, Iris Xe G7 80EUs, 549 gTest du LG Gram 15 (2022) : la portabilité avant tout
Avec le LG Gram 15, LG a créé un ordinateur portable de 15 pouces qui excelle non seulement en termes de portabilité, mais aussi en termes d'autonomie. Toutefois, comme le montre notre analyse, la finesse de l'appareil se traduit par des performances moindres.
Intel Core i5-1240P, Iris Xe G7 80EUs, 15.6", 1.1 kgTest de l'Acer Swift X 14 avec RTX 3050 : un i5-1240P sous-exploité
L'Acer Swift X 14 est un ordinateur portable léger de 1,4 kg (~3 lb) doté d'un Nvidia GeForce RTX 3050, d'une longue autonomie, d'un écran 16:10 et de performances système élevées. Cependant, les performances graphiques se plantent toujours complètement en mode batterie, et même le SSD rapide et le clavier craquant n'aideront pas dans ce cas.
Intel Core i5-1240P, NVIDIA GeForce RTX 3050 4GB Laptop GPU, 14", 1.4 kgAcer Swift X SFX16-52G-52VE: Intel Arc A370M, 16.00", 1.8 kg
Critique » Test de l'Acer Swift X SFX16-52G : un PC portable qui allie efficacité et performance
LG Gram 14Z90Q: Intel Iris Xe Graphics G7 80EUs, 14.00", 1 kg
Critique » Test du LG Gram 14 (2022) : élégant, léger, et économique
Lenovo ThinkPad T16 G1 21BWS00200: Intel Iris Xe Graphics G7 80EUs, 16.00", 1.9 kg
Critique » Test du Lenovo ThinkPad T16 G1 Intel : un marathonien de 16 pouces
Acer Aspire 5 A515-57G-53N8: NVIDIA GeForce RTX 2050 Mobile, 15.60", 1.8 kg
Critique » Test de l'Acer Aspire 5 A515-57G : des performances médiocres pour la RTX 2050
Dynabook Portégé X30L-K-139: Intel Iris Xe Graphics G7 80EUs, 13.30", 0.9 kg
Critique » Test du Dynabook Portégé X30L-K-139 : le PC portable d'affaires ne pèse que 900 grammes
LG Gram 17 (2022): Intel Iris Xe Graphics G7 80EUs, 17.00", 1.4 kg
Critique » Test du LG Gram 17 (2022) : PC portable de bureau léger, avec grand écran et une excellente autonomie
Dell XPS 13 Plus 9320 i5-1240p: Intel Iris Xe Graphics G7 80EUs, 13.40", 1.2 kg
Critique » Test du Dell XPS 13 Plus : la configuration de base est-elle le meilleur choix ?
Lenovo Yoga Slim 7i Pro 14IAP G7: Intel Iris Xe Graphics G7 80EUs, 14.00", 1.3 kg
Critique » Test du Lenovo Yoga Slim 7i Pro 14IAP : PC portable abordable avec 12 cœurs et écran 2.8K
Samsung Galaxy Book2 Pro 13 NP930XED-KA1DE: Intel Iris Xe Graphics G7 80EUs, 13.30", 0.9 kg
Critique » Test du Samsung Galaxy Book2 Pro 13 : ultraportable avec i5 Alder Lake efficace
Acer TravelMate P4 TMP416-51-55KN: Intel Iris Xe Graphics G7 80EUs, 16.00", 1.6 kg
Autres tests » Acer TravelMate P4 TMP416-51-55KN
Asus ExpertBook B5 B5602: Intel Iris Xe Graphics G7 80EUs, 16.00", 1.5 kg
Autres tests » Asus ExpertBook B5 B5602
Lenovo Yoga Slim 6 14IAP8, i5-1240P: Intel Iris Xe Graphics G7 80EUs, 14.00", 1.3 kg
Autres tests » Lenovo Yoga Slim 6 14IAP8, i5-1240P
Huawei MateBook D 14 2023: Intel Iris Xe Graphics G7 80EUs, 14.00", 1.4 kg
Autres tests » Huawei MateBook D 14 2023
HP Pavilion 15-eg2000TU: Intel Iris Xe Graphics G7 80EUs, 15.60", 1.7 kg
Autres tests » HP Pavilion 15-eg2000TU
Acer Aspire 7 A715-51G-51BY: NVIDIA GeForce RTX 3050 Ti Laptop GPU, 15.60", 2.1 kg
Autres tests » Acer Aspire 7 A715-51G-51BY
HP Pavilion Plus 14-eh0000ns: Intel Iris Xe Graphics G7 80EUs, 14.00", 1.4 kg
Autres tests » HP Pavilion Plus 14-eh0000ns
Lenovo ThinkPad P16s G1, i5-1240P: NVIDIA T550 Laptop GPU, 16.00", 1.7 kg
Autres tests » Lenovo ThinkPad P16s G1, i5-1240P
Lenovo ThinkBook 14 G4, i5-1240P: Intel Iris Xe Graphics G7 80EUs, 14.00", 1.4 kg
Autres tests » Lenovo ThinkBook 14 G4, i5-1240P
Asus Zenbook 14 Q409ZA, i5-1240P: Intel Iris Xe Graphics G7 80EUs, 14.00", 1.4 kg
Autres tests » Asus Zenbook 14 Q409ZA, i5-1240P
HP Envy x360 15-ew0004ns: Intel Iris Xe Graphics G7 80EUs, 15.60", 1.8 kg
Autres tests » HP Envy x360 15-ew0004ns
Acer TravelMate Spin P4 TMP414RN-52-595S: Intel Iris Xe Graphics G7 80EUs, 14.00", 1.5 kg
Autres tests » Acer TravelMate Spin P4 TMP414RN-52-595S
Dynabook Portégé X40L-K-10S: Intel Iris Xe Graphics G7 80EUs, 14.00", 1.1 kg
Autres tests » Dynabook Portégé X40L-K-10S
Lenovo Yoga Slim 7 Pro 14IAP7, i5-1240P: Intel Iris Xe Graphics G7 80EUs, 14.00", 1.3 kg
Autres tests » Lenovo Yoga Slim 7 Pro 14IAP7, i5-1240P
Lenovo ThinkPad P14s G3 21AK003SGE: NVIDIA T550 Laptop GPU, 14.00", 1.2 kg
Autres tests » Lenovo ThinkPad P14s G3 21AK003SGE
Lenovo Ideapad 5 Pro 14IAP7, i5-1240P: Intel Iris Xe Graphics G7 80EUs, 14.00", 1.4 kg
Autres tests » Lenovo Ideapad 5 Pro 14IAP7, i5-1240P
Lenovo ThinkBook 13s G4 IAP, i5-1240P: Intel Iris Xe Graphics G7 80EUs, 13.30", 1.2 kg
Autres tests » Lenovo ThinkBook 13s G4 IAP, i5-1240P
Lenovo ThinkPad X13 G3, i5-1240P: Intel Iris Xe Graphics G7 80EUs, 13.30", 1.3 kg
Autres tests » Lenovo ThinkPad X13 G3, i5-1240P
Acer Chromebook 516 GE CBG516-1H-53SL: Intel Iris Xe Graphics G7 80EUs, 16.00", 1.7 kg
Autres tests » Acer Chromebook 516 GE CBG516-1H-53SL
Asus ExpertBook B5 B5402CB, i5-1240P: Intel Iris Xe Graphics G7 80EUs, 14.00", 1.3 kg
Autres tests » Asus ExpertBook B5 B5402CB, i5-1240P
Dell Vostro 16 5620, i5-1240P: Intel Iris Xe Graphics G7 80EUs, 16.00", 2 kg
Autres tests » Dell Vostro 16 5620, i5-1240P
Asus ExpertBook B5 Flip B5402F, i5-1240P: Intel Iris Xe Graphics G7 80EUs, 14.00", 1.3 kg
Autres tests » Asus ExpertBook B5 Flip B5402F, i5-1240P
LG Gram 14Z90Q: Intel Iris Xe Graphics G7 80EUs, 14.00", 1 kg
Autres tests » LG Gram 14Z90Q
Dynabook Portégé X30L-K-139: Intel Iris Xe Graphics G7 80EUs, 13.30", 0.9 kg
Autres tests » Dynabook Portégé X30L-K-139
Acer Aspire 7 A715-51G-529E: NVIDIA GeForce RTX 3050 4GB Laptop GPU, 15.60", 2.1 kg
Autres tests » Acer Aspire 7 A715-51G-529E
MSI Prestige 14 A12UC-228: NVIDIA GeForce RTX 3050 4GB Laptop GPU, 14.00", 1.3 kg
Autres tests » MSI Prestige 14 A12UC-228
Huawei MateBook 14 (2024): Intel Iris Xe Graphics G7 80EUs, 14.00", 1.4 kg
Autres tests » Huawei MateBook 14 2022, i5-1240P
Lenovo ThinkPad T16 G1 21BV006DGE: Intel Iris Xe Graphics G7 80EUs, 16.00", 1.7 kg
Autres tests » Lenovo ThinkPad T16 G1 21BV006DGE
MSI Prestige 14 Evo A12M-229: Intel Iris Xe Graphics G7 80EUs, 14.00", 1.3 kg
Autres tests » MSI Prestige 14 Evo A12M-229
Lenovo Yoga 7 14IAL7-82QE003GGE: Intel Iris Xe Graphics G7 80EUs, 14.00", 1.4 kg
Autres tests » Lenovo Yoga 7 14IAL7-82QE003GGE
MSI Summit E14 Evo A12M-051: Intel Iris Xe Graphics G7 80EUs, 14.00", 1.6 kg
Autres tests » MSI Summit E14 Evo A12M-051
Asus ExpertBook B2 Flip B2502FBA-N80113X: Intel Iris Xe Graphics G7 80EUs, 14.00", 1.6 kg
Autres tests » Asus ExpertBook B2 Flip B2502FBA-N80113X
LG Gram 17 (2022): Intel Iris Xe Graphics G7 80EUs, 17.00", 1.4 kg
Autres tests » LG Gram 17 (2022)
Asus Zenbook 14 UX3402ZA, i5-1240P: Intel Iris Xe Graphics G7 80EUs, 14.00", 1.4 kg
Autres tests » Asus Zenbook 14 UX3402ZA, i5-1240P
Samsung Galaxy Book2 Pro 15, i5-1240P: Intel Iris Xe Graphics G7 80EUs, 15.60", 1.1 kg
Autres tests » Samsung Galaxy Book2 Pro 15, i5-1240P
Acer Swift 3 SF314-512-50F6: Intel Iris Xe Graphics G7 80EUs, 14.00", 1.3 kg
Autres tests » Acer Swift 3 SF314-512-50F6
Dell XPS 13 Plus 9320 i5-1240p: Intel Iris Xe Graphics G7 80EUs, 13.40", 1.2 kg
Autres tests » Dell XPS 13 Plus 9320 i5-1240p
Asus VivoBook 15 X1502ZA-BQ165W: Intel Iris Xe Graphics G7 80EUs, 15.60", 1.7 kg
Autres tests » Asus VivoBook 15 X1502ZA-BQ165W
Samsung Galaxy Book2 Pro 13 NP930XED-KA1DE: Intel Iris Xe Graphics G7 80EUs, 13.30", 0.9 kg
Autres tests » Samsung Galaxy Book2 Pro 13 NP930XED-KA1DE