Critiques du Intel Core i7-1280P processeur
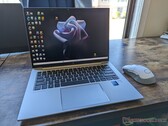
Test du HP EliteBook 840 G9 : l'alternative au Lenovo ThinkPad X1 Carbon
Contrairement à la plupart des autres ordinateurs portables professionnels, l'EliteBook 840/845 G9 est livré avec des options Intel vPro et AMD PRO pour attirer les fans des deux côtés de la barrière. Après avoir récemment passé en revue l'option haut de gamme Ryzen 9 PRO 6950HS d'AMD, nous pouvons enfin la comparer à l'option haut de gamme Intel Core i7-1280P.
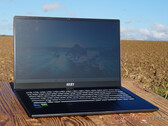
Intel Core i7-1280P, Iris Xe G7 96EUs, 14", 1.5 kgTest du MSI Prestige 15 : Qualité d'image 4K éblouissante, performances solides
L'ordinateur portable Creator de MSI associe des valeurs d'image exceptionnelles à un processeur efficace et puissant ainsi qu'à une puce graphique séparée avec ray tracing implémenté. Cette combinaison semble particulièrement adaptée à l'édition/au traitement d'images à un niveau supérieur
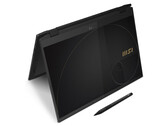
Intel Core i7-1280P, NVIDIA GeForce RTX 3050 Ti Laptop GPU, 15.6", 1.8 kgTest du MSI Summit E16 Flip : PC portable 2-en-1 avec stylet, écran 16/10 et RTX 3050 Ti
Le Summit E16 Flip offre un écran tactile de 16 pouces au format 16:10, plus adapté à la bureautique, un port Thunderbolt 4 et un GPU dédié GeForce RTX 3050 Ti Laptop. L'écran tactile peut être utilisé avec les doigts ou avec le stylo de saisie MSI inclus.
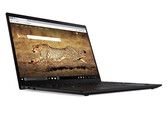
Intel Core i7-1280P, NVIDIA GeForce RTX 3050 Ti Laptop GPU, 16", 1.9 kgTest du Lenovo Yoga Slim 9i : sans doute l'ordinateur portable Evo le plus puissant
Le Core i7-1280P d'Intel fait du Lenovo Yoga Slim 9i l'ultrabook vraisemblablement le plus rapide du moment. Grâce à l'écran OLED 3K 90 Hz, aux faibles émissions et aux quadruple haut-parleurs de haute qualité, vous obtenez un ordinateur portable robuste et astucieux.
Intel Core i7-1280P, Iris Xe G7 96EUs, 14", 1.4 kgTest du Lenovo ThinkPad X1 Nano Gen 2 : le plus petit ordinateur portable X1 jamais conçu
450 nits, couleurs sRGB complètes, rapport d'aspect 16:10, WAN 5G Sub 6 et CPU Core P de 12e génération, le tout dans un système pesant moins de 1 kg. Peut-on vraiment faire tenir toutes ces caractéristiques dans un petit format de 13 pouces sans faire de compromis ?
Intel Core i7-1280P, Iris Xe G7 96EUs, 13", 958 gDell XPS 13 Plus 9320 i7-1280P OLED: Intel Iris Xe Graphics G7 96EUs, 13.40", 1.3 kg
Critique » Test du Dell XPS 13 Plus 9320 : Core i5-1240P, i7-1260P, ou i7-1280P OLED ?
Getac B360 G2: Intel Iris Xe Graphics G7 96EUs, 13.30", 2.3 kg
Autres tests » Getac B360 G2
MSI Prestige 13 Evo A12M: Intel Iris Xe Graphics G7 96EUs, 13.30", 1 kg
Autres tests » MSI Prestige 13 Evo A12M
Lenovo ThinkPad P16s G1, i7-1280P: NVIDIA T550 Laptop GPU, 16.00", 1.7 kg
Autres tests » Lenovo ThinkPad P16s G1, i7-1280P
HP EliteBook 840 G9: Intel Iris Xe Graphics G7 96EUs, 14.00", 1.5 kg
Autres tests » HP EliteBook 840 G9
MSI Summit E13 Flip Evo A12MT-059RU: Intel Iris Xe Graphics G7 96EUs, 13.40", 1.4 kg
Autres tests » MSI Summit E13 Flip Evo A12MT-059RU
MSI Prestige 14 Evo A12M-248RU: Intel Iris Xe Graphics G7 96EUs, 14.00", 1.3 kg
Autres tests » MSI Prestige 14 Evo A12M-248RU
Lenovo Yoga 9 14IAP7-82LU007FGE: Intel Iris Xe Graphics G7 96EUs, 14.00", 1.4 kg
Autres tests » Lenovo Yoga 9 14IAP7-82LU007FGE
Lenovo ThinkPad X1 Nano Gen 2 Core i7-1280P: Intel Iris Xe Graphics G7 96EUs, 13.00", 1 kg
Autres tests » Lenovo ThinkPad X1 Nano Gen 2 Core i7-1280P
MSI Summit E16 Flip Evo A12MT: Intel Iris Xe Graphics G7 96EUs, 16.00", 1.9 kg
Autres tests » MSI Summit E16 Flip Evo A12MT
Lenovo Yoga Slim 9 14IAP7: Intel Iris Xe Graphics G7 96EUs, 14.00", 1.4 kg
Autres tests » Lenovo Yoga Slim 9 14IAP7
MSI Summit E13 Flip Evo A12MT-023: Intel Iris Xe Graphics G7 96EUs, 13.40", 1.4 kg
Autres tests » MSI Summit E13 Flip Evo A12MT-023
MSI Prestige 14 A12SC-086CA: NVIDIA GeForce GTX 1650 Mobile, 14.00", 1.6 kg
Autres tests » MSI Prestige 14 A12SC-086CA
MSI Stealth 17M A12UE: NVIDIA GeForce RTX 3060 Laptop GPU, 17.30", 2.2 kg
Autres tests » MSI Stealth 17M A12UE
MSI Prestige 14 Evo A12M-089: Intel Iris Xe Graphics G7 96EUs, 14.00", 1.3 kg
Autres tests » MSI Prestige 14 Evo A12M-089
MSI Summit E16 Flip A12UDT-031: NVIDIA GeForce RTX 3050 Ti Laptop GPU, 16.00", 1.9 kg
Autres tests » MSI Summit E16 Flip A12UDT-031
MSI Prestige 15 A12UD-049ES: NVIDIA GeForce RTX 3050 Ti Laptop GPU, 15.60", 1.7 kg
Autres tests » MSI Prestige 15 A12UD-049ES
Dell XPS 13 Plus 9320 i7-1280P FHD: Intel Iris Xe Graphics G7 96EUs, 13.40", 1.3 kg
Autres tests » Dell XPS 13 Plus 9320 i7-1280P FHD
Dell XPS 13 Plus 9320 i7-1280P OLED: Intel Iris Xe Graphics G7 96EUs, 13.40", 1.3 kg
Autres tests » Dell XPS 13 Plus 9320 i7-1280P OLED
MSI Prestige 14 A12UC, i7-1280P: NVIDIA GeForce RTX 3050 4GB Laptop GPU, 14.00", 1.3 kg
Autres tests » MSI Prestige 14 A12UC, i7-1280P
MSI Stealth 15M B12UE: NVIDIA GeForce RTX 3060 Laptop GPU, 15.60", 1.9 kg
Autres tests » MSI Stealth 15M B12UE
MSI Prestige 15 A12UC: NVIDIA GeForce RTX 3050 4GB Laptop GPU, 15.60", 1.7 kg
Autres tests » MSI Prestige 15 A12UC
MSI Prestige 15 A12UD-093: NVIDIA GeForce RTX 3050 Ti Laptop GPU, 15.60", 1.8 kg
Autres tests » MSI Prestige 15 A12UD-093
MSI Summit E14 Evo A12M-050: Intel Iris Xe Graphics G7 96EUs, 14.00", 1.6 kg
Autres tests » MSI Summit E14 Evo A12M-050