Test du GMKtec NucBox M3 : le Core i5-12450H est trop gourmand en énergie pour ce mini PC

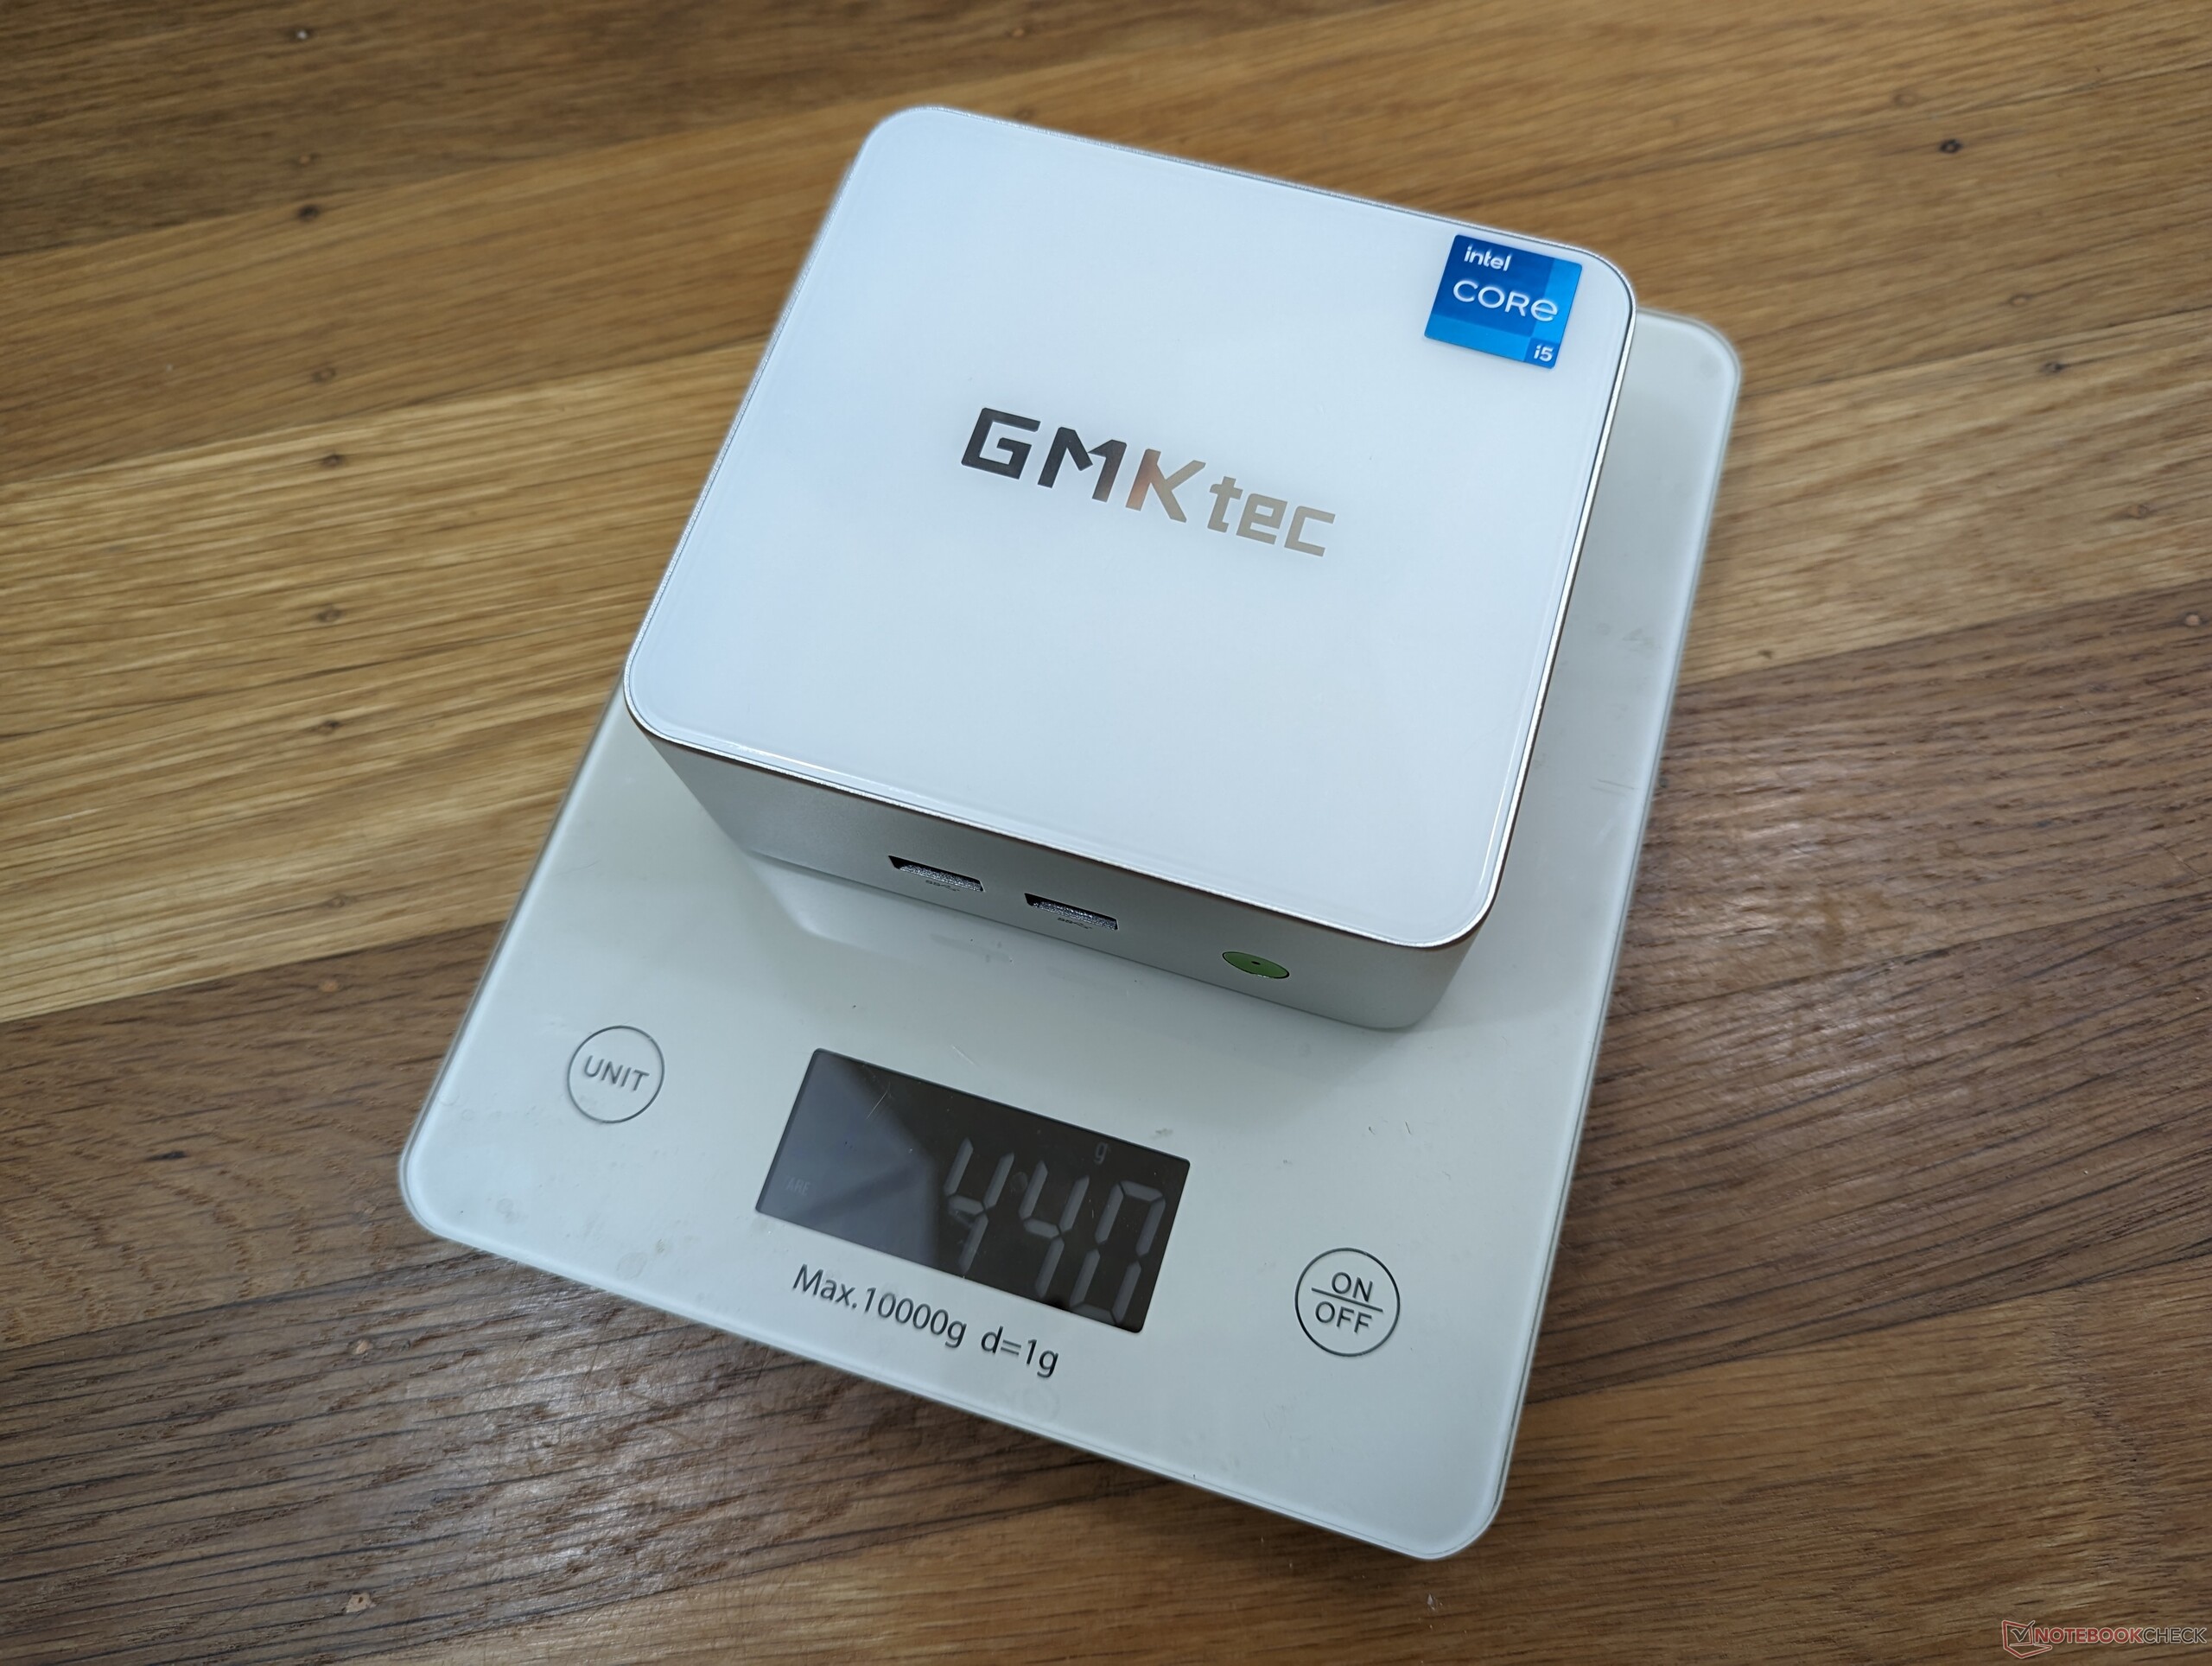
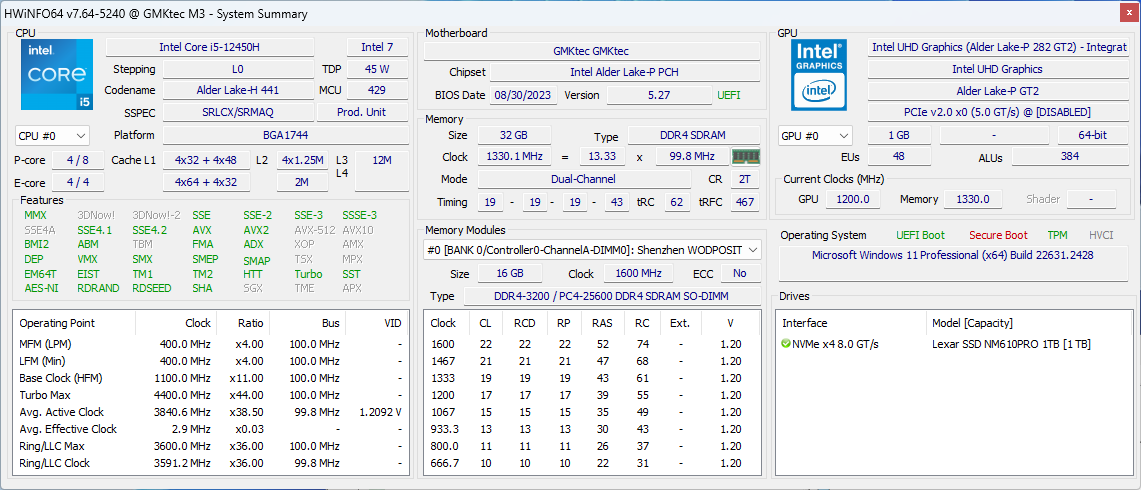
La NucBox M3 succède à la NucBox M2 de l'année dernière en remplaçant les CPU Intel Core H de la 11e génération Tiger Lake par des options Alder Lake de la 12e génération, ainsi que par un châssis légèrement révisé. Notre unité de test spécifique est configurée avec le Core i5-12450H, 32 Go de RAM et 1 To de SSD pour environ 480 USD, mais les options barebone commencent à partir de 370 USD.
Les alternatives à la NucBox M3 comprennent d'autres mini-PC orientés vers le budget comme le Beelink SER5, Geekom A5ou leBMAX B7.
Plus de commentaires sur GMK :
Comparaison avec les concurrents potentiels
Note | Date | Modèle | Poids | Épaisseur | Taille | Résolution | Prix |
|---|---|---|---|---|---|---|---|
| 78.7 % v7 (old) | 11/23 | GMK NucBox M3 i5-12450H, UHD Graphics Xe G4 48EUs | 440 g | 42.4 mm | x | ||
| 82.8 % v7 (old) | GMK NucBox K3 Pro i7-12650H, UHD Graphics 64EUs | 396 g | 43.2 mm | x | |||
| 82.1 % v7 (old) | 11/23 | Beelink SER5 R5 5560U, Vega 6 | 439 g | 42 mm | x | ||
| 73.1 % v7 (old) | Beelink Mini S12 Pro N100, UHD Graphics 24EUs (Alder Lake-N) | 335 g | 39.1 mm | x | |||
| 81.2 % v7 (old) | 10/23 | Geekom A5 R7 5800H, Vega 8 | 555 g | 49.2 mm | x | ||
| 80.8 % v7 (old) | 04/23 | Intel NUC 13 Pro Kit NUC13ANK i7-1360P, Iris Xe G7 96EUs | 538 g | 37 mm | x |
Cas
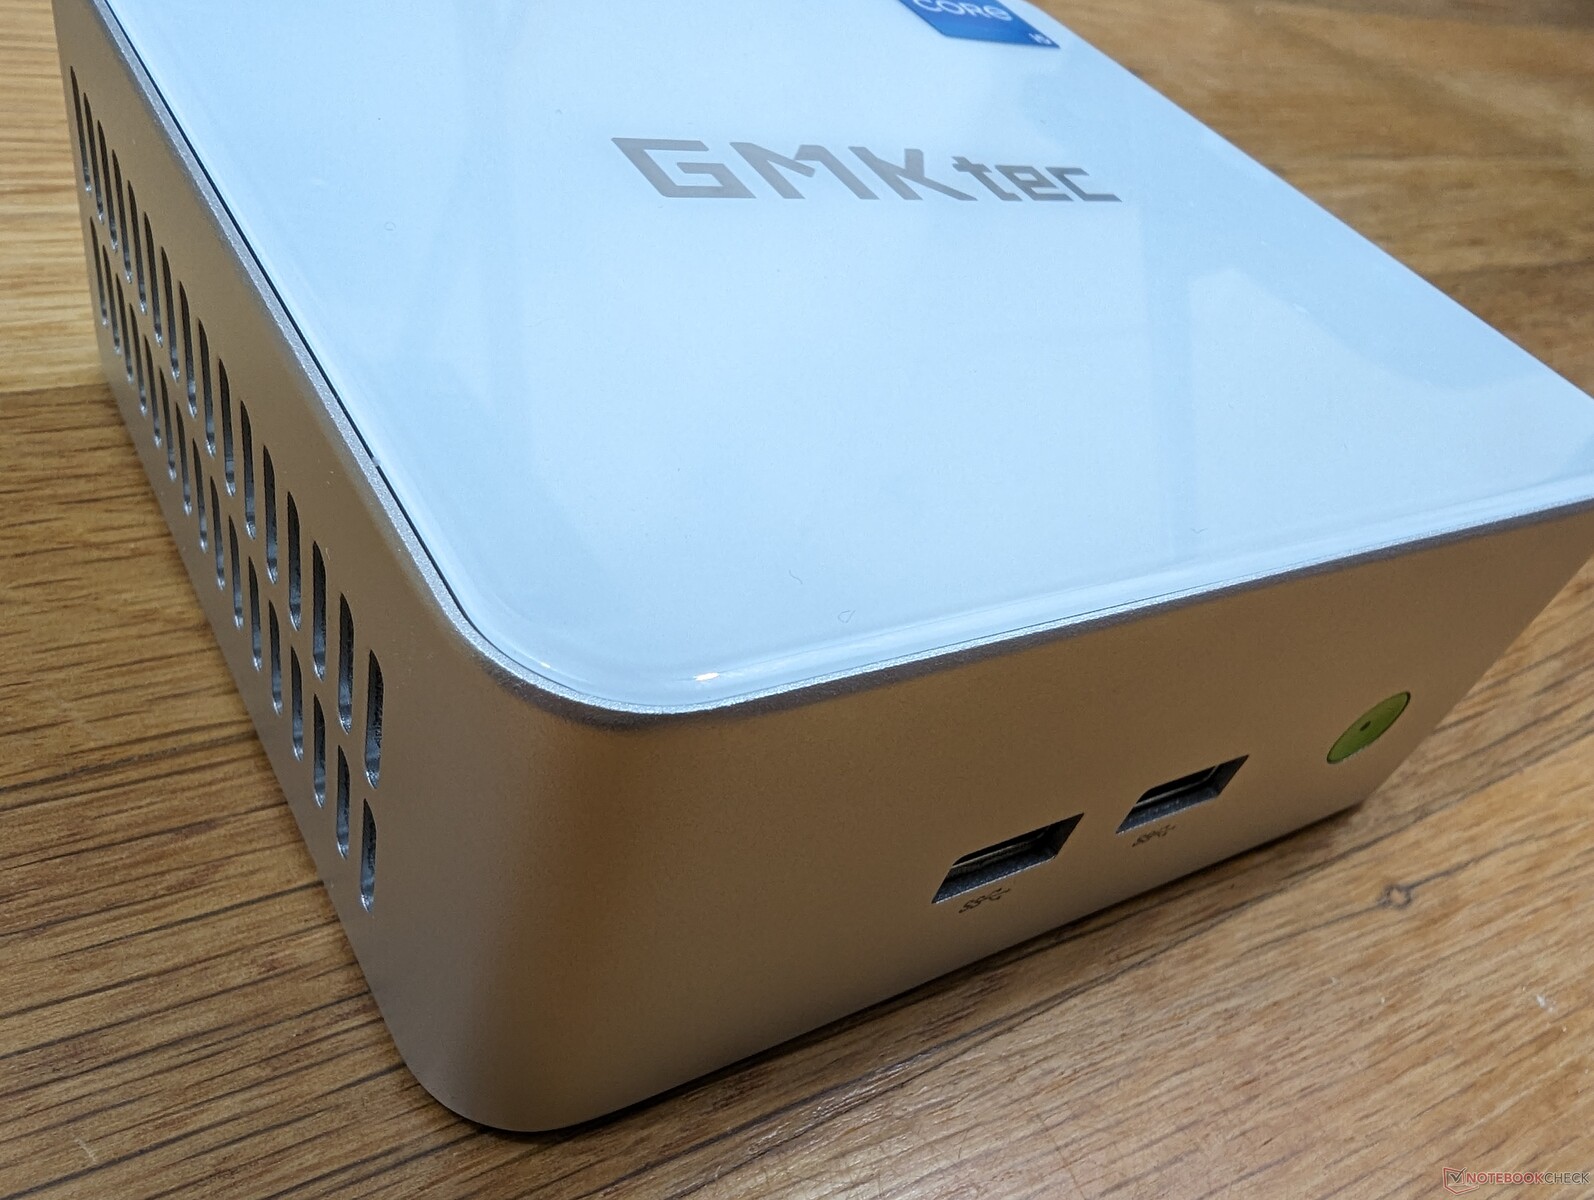
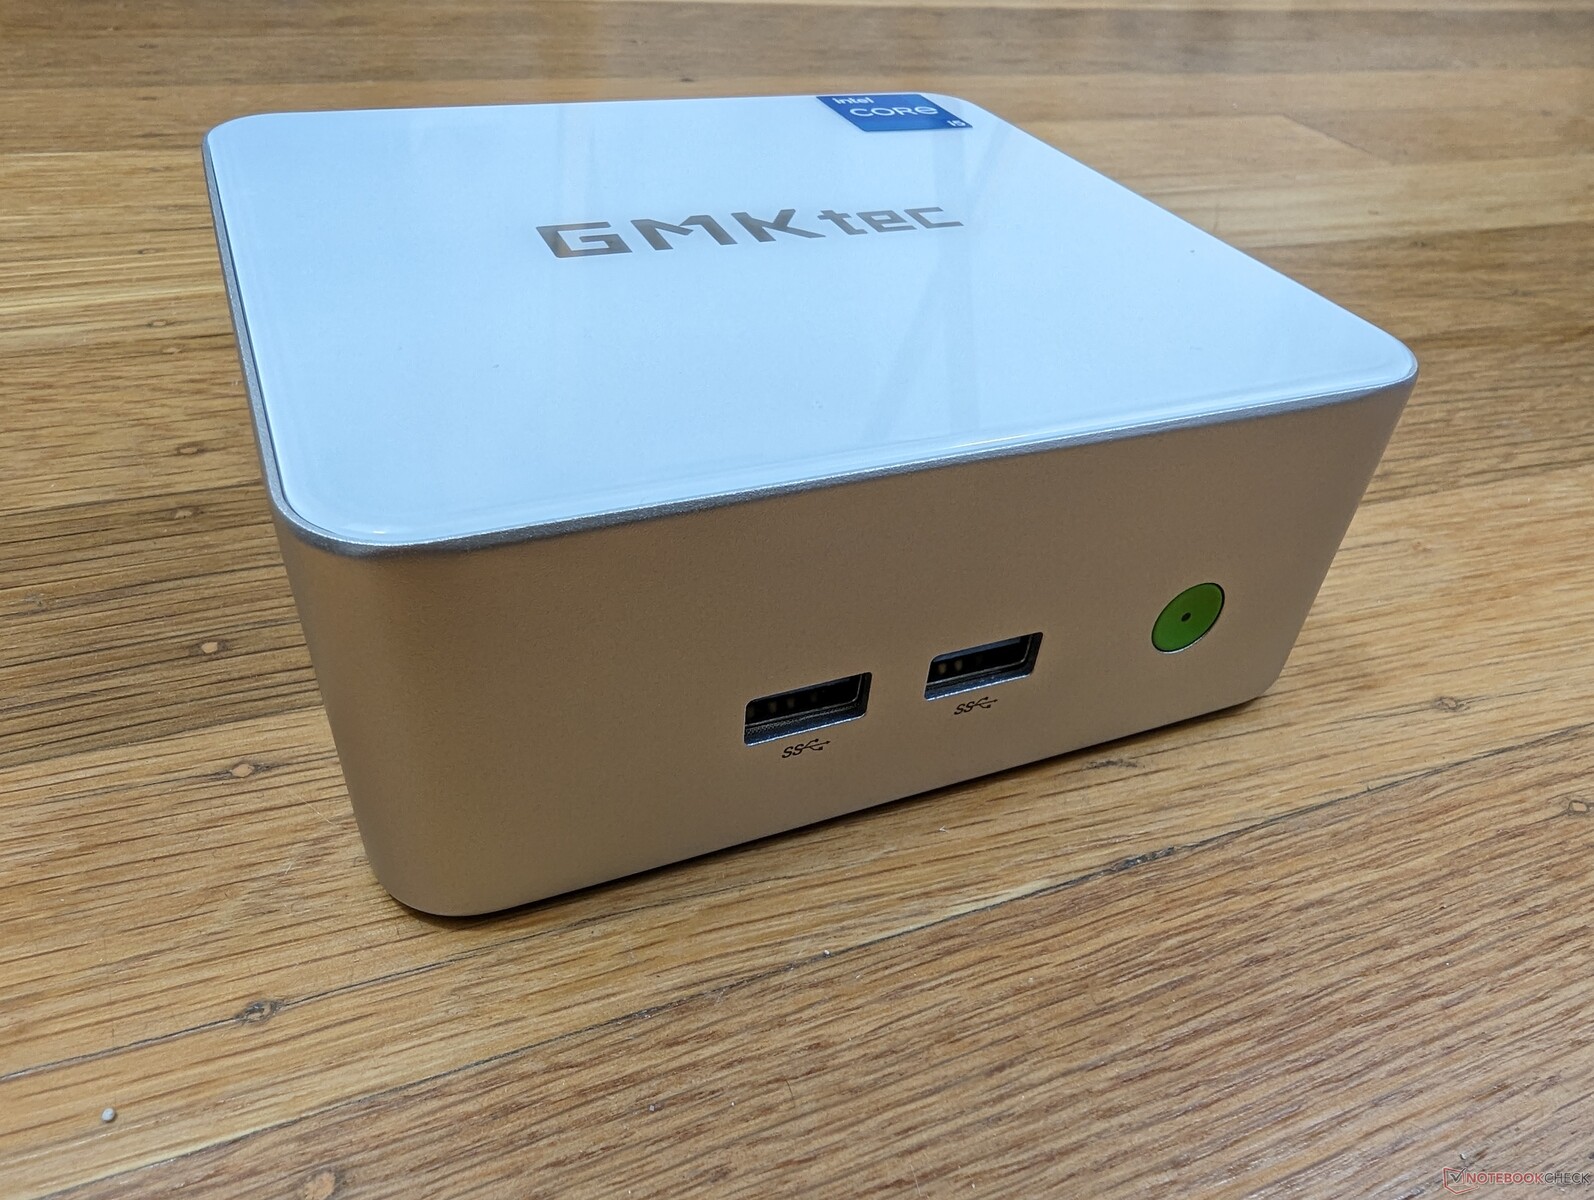
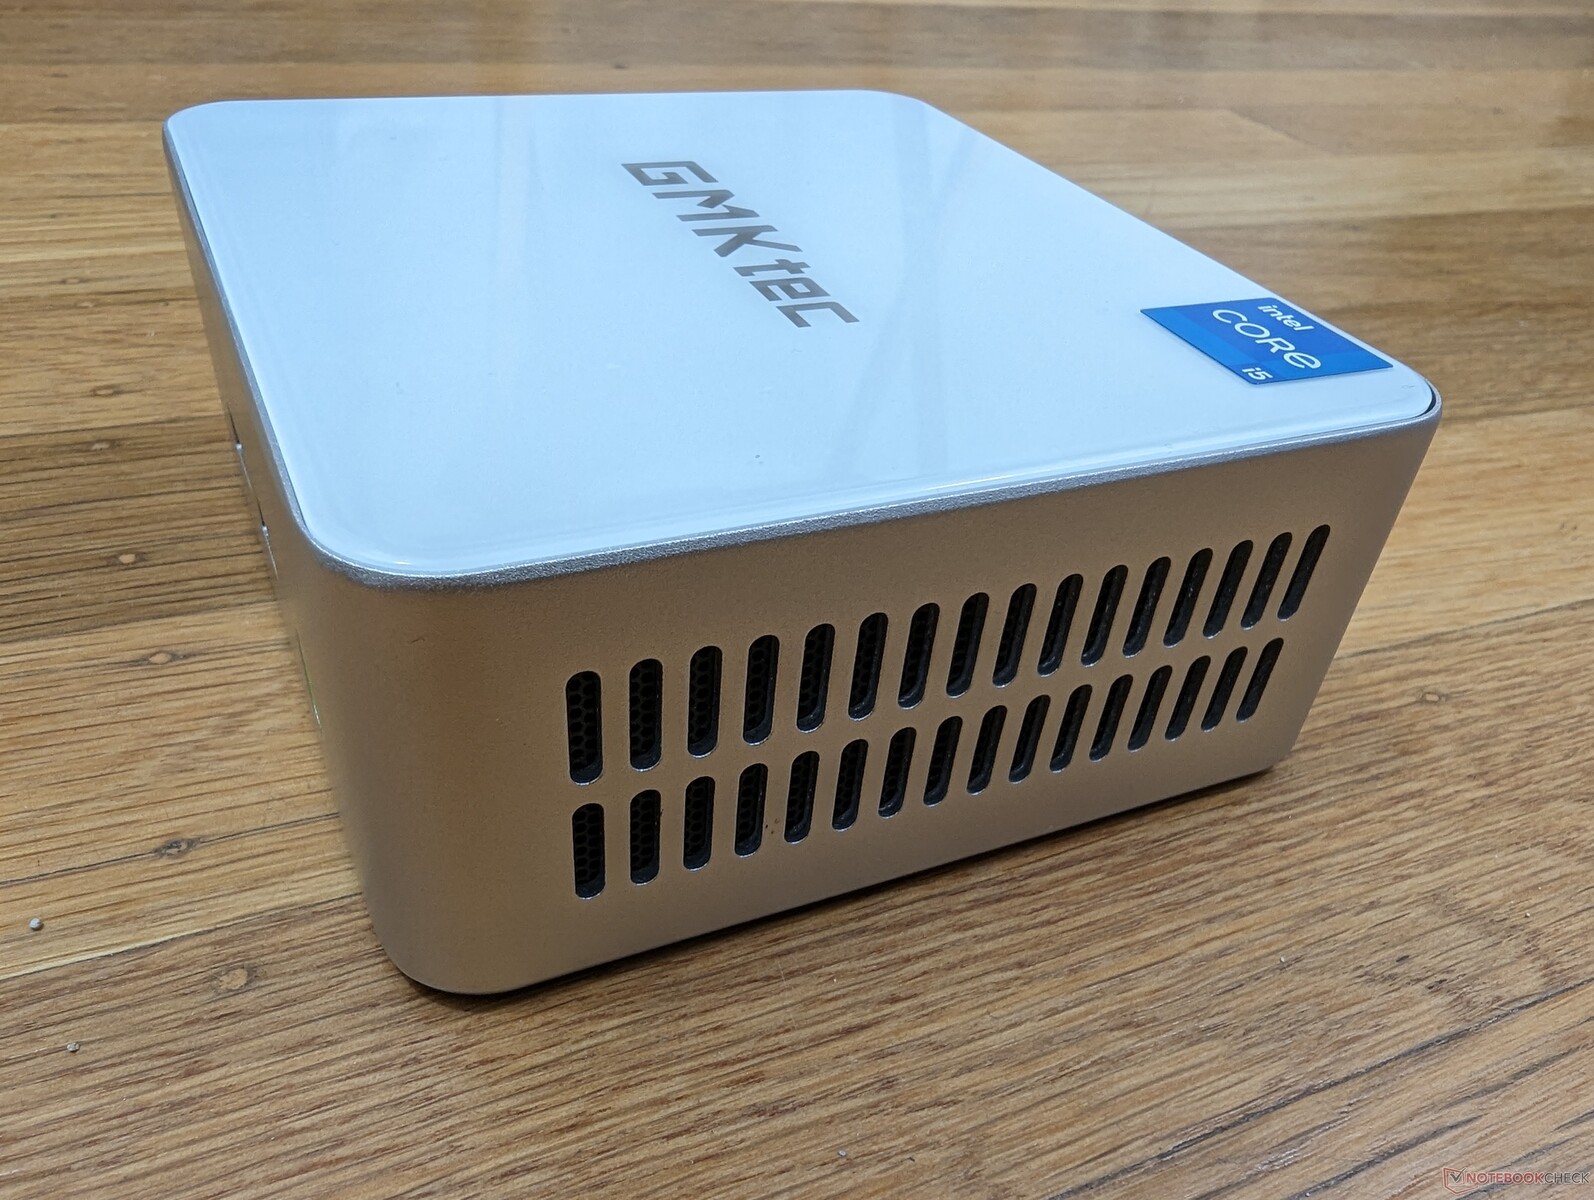
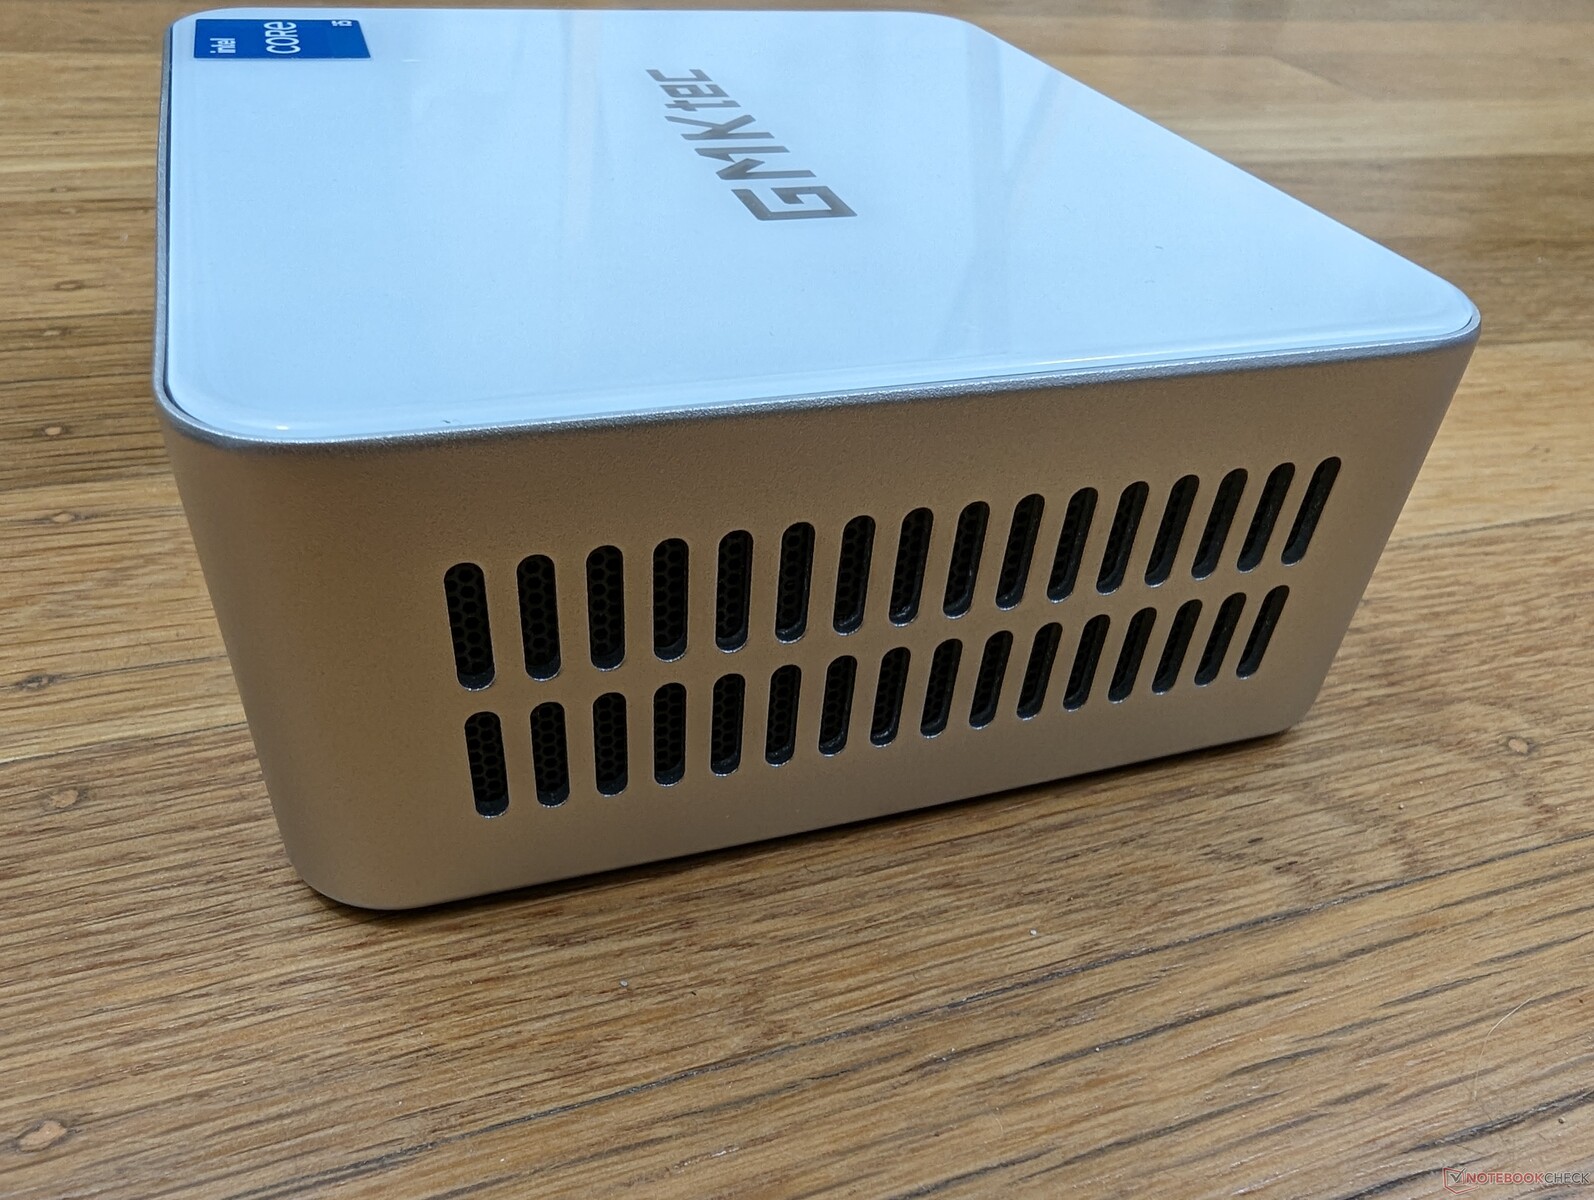
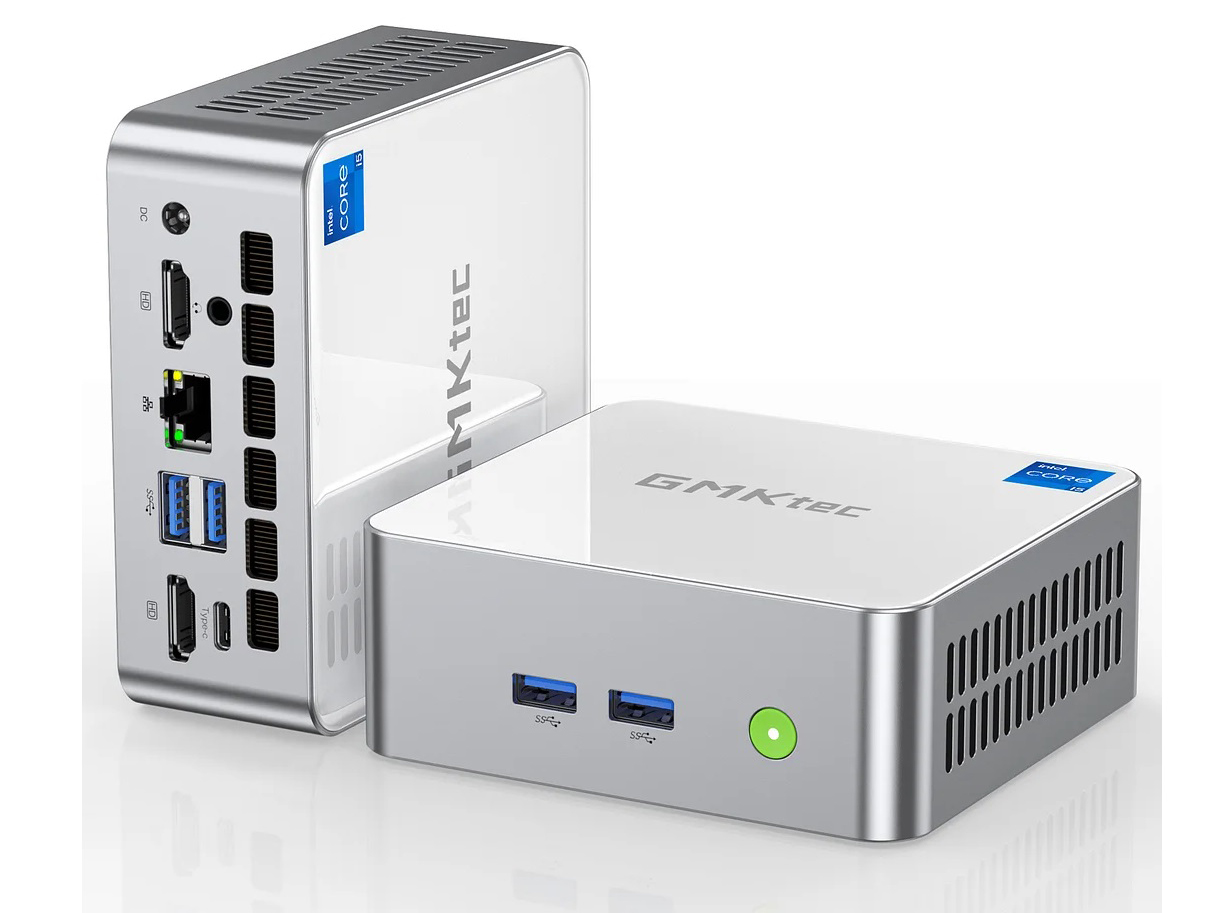
La NucBox M3 est plus petite que la NucBox K3 Pro tout en étant plus lourde pour une sensation plus dense. Le châssis est composé de métal sur les côtés et de plastique sur le dessus et le dessous. Bien que la qualité de construction soit solide et sans défaut notable sur notre unité, le plastique sur le dessus et le dessous donne l'impression que le système est bon marché par rapport à la série des Intel NUC.
Connectivité
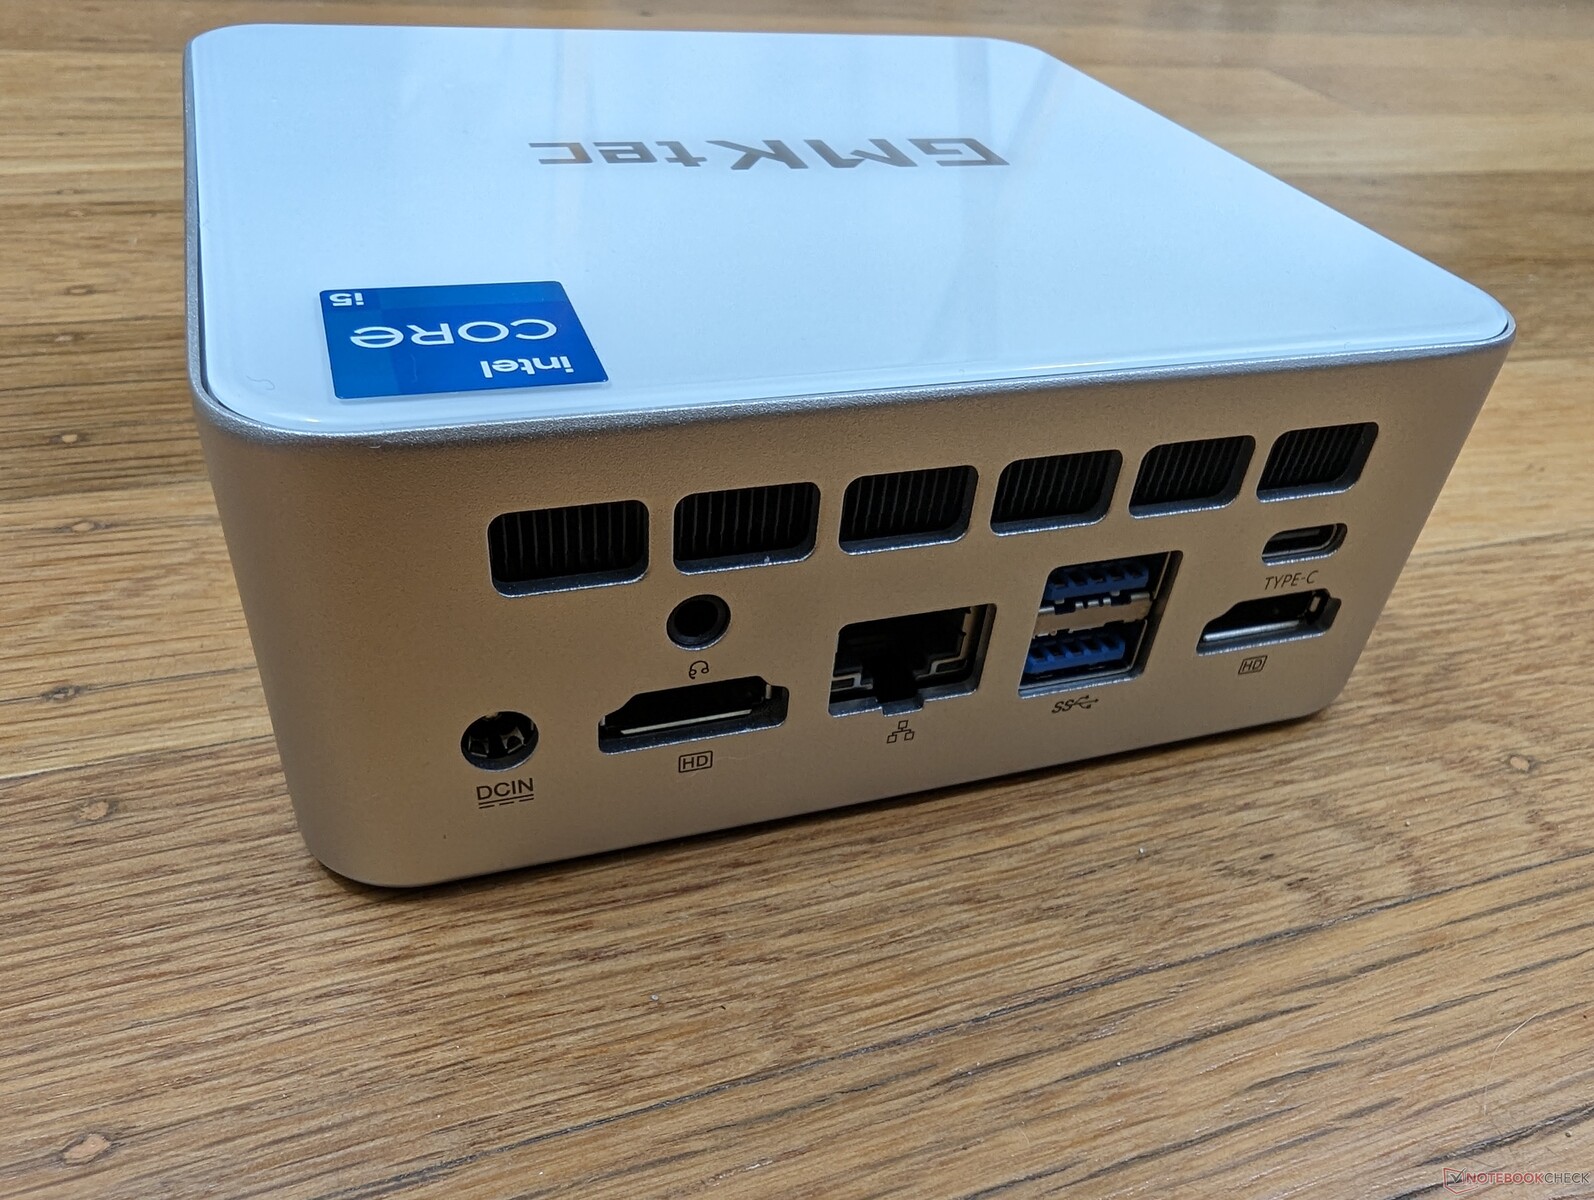
Bien que les options de port soient décentes, l'unique port USB-C semble avoir des problèmes de sortie vidéo. Le fabricant annonce une compatibilité USB-C DisplayPort, mais aucun de nos moniteurs externes USB-C ne fonctionnait. Thunderbolt n'est pas non plus pris en charge, probablement pour réduire les coûts.
Communication
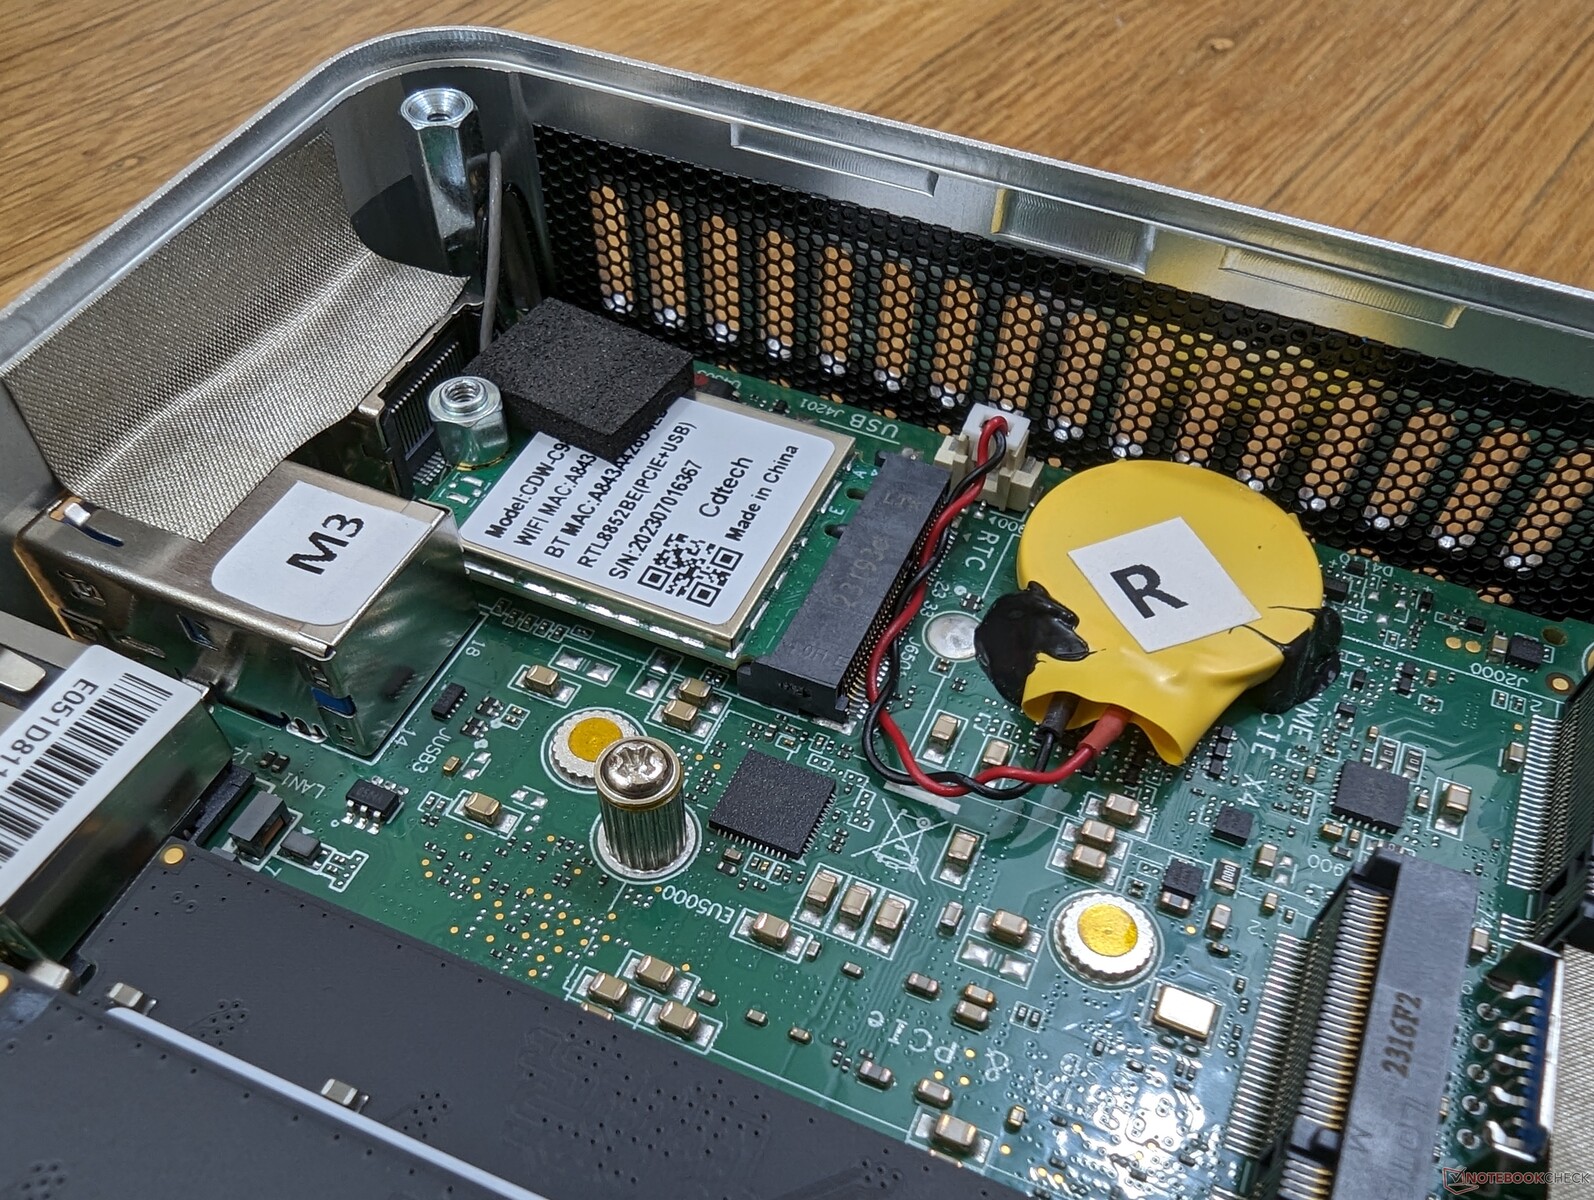
Le modèle est livré sans prise en charge du Wi-Fi 6E, probablement pour réduire les coûts. La connectivité Wi-Fi 6 est par ailleurs stable et fiable.
| Networking | |
| iperf3 transmit AXE11000 | |
| Beelink SER5 | |
| GMK NucBox K3 Pro | |
| GMK NucBox M3 | |
| Geekom A5 | |
| Intel NUC 13 Pro Kit NUC13ANK | |
| Beelink Mini S12 Pro | |
| iperf3 receive AXE11000 | |
| Beelink SER5 | |
| GMK NucBox K3 Pro | |
| Geekom A5 | |
| Intel NUC 13 Pro Kit NUC13ANK | |
| GMK NucBox M3 | |
| Beelink Mini S12 Pro | |
| iperf3 transmit AXE11000 6GHz | |
| Intel NUC 13 Pro Kit NUC13ANK | |
| iperf3 receive AXE11000 6GHz | |
| Intel NUC 13 Pro Kit NUC13ANK | |
Maintenance
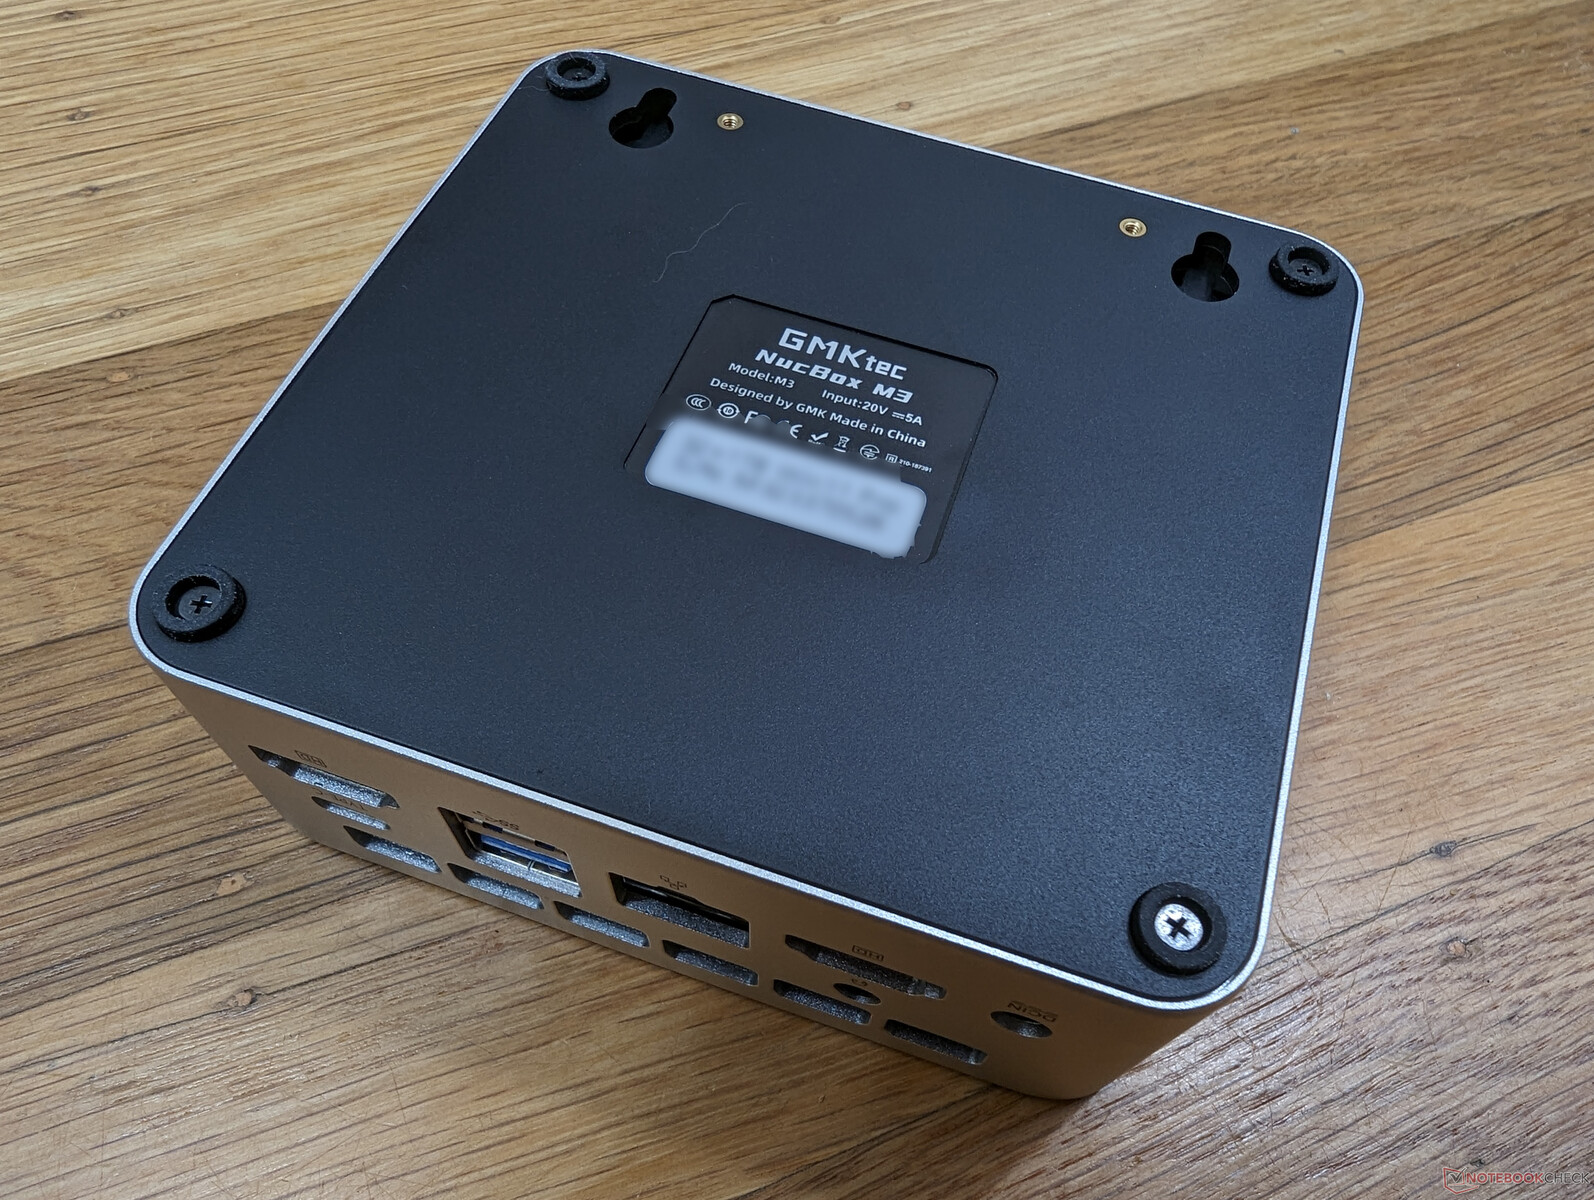
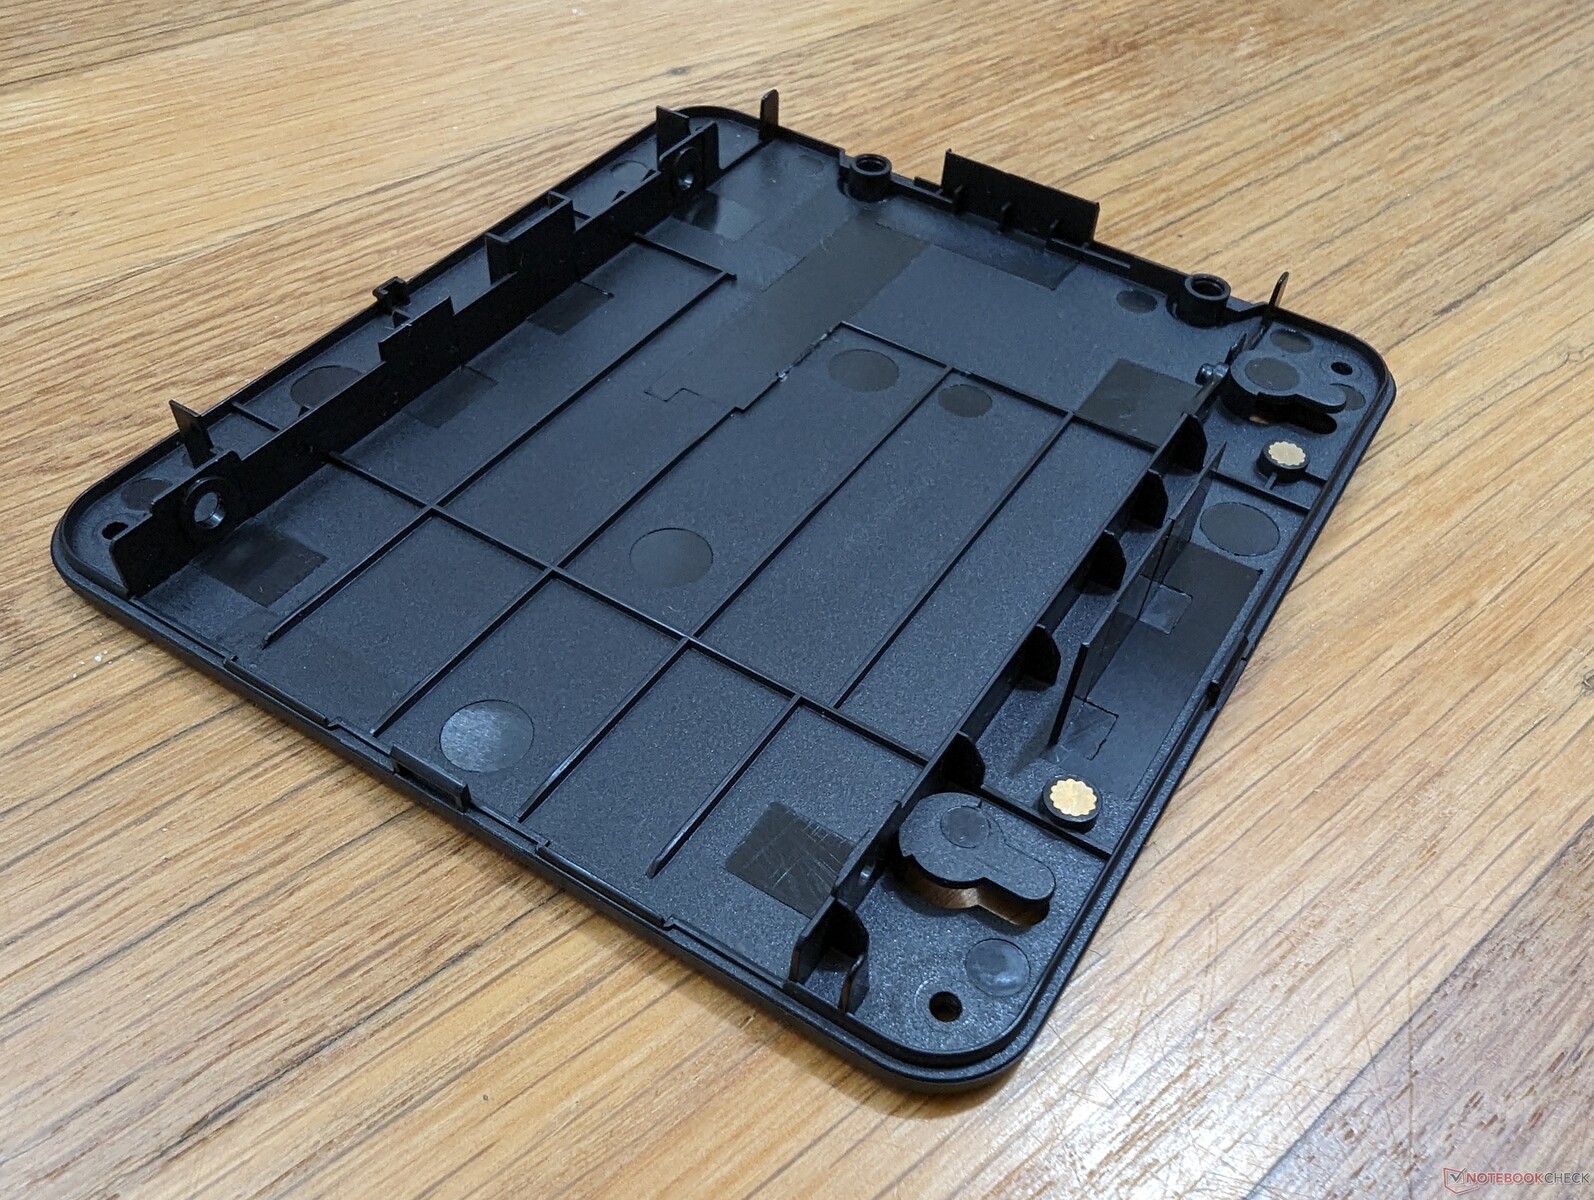
Le panneau inférieur est fixé par quatre vis Phillips pour faciliter l'entretien.
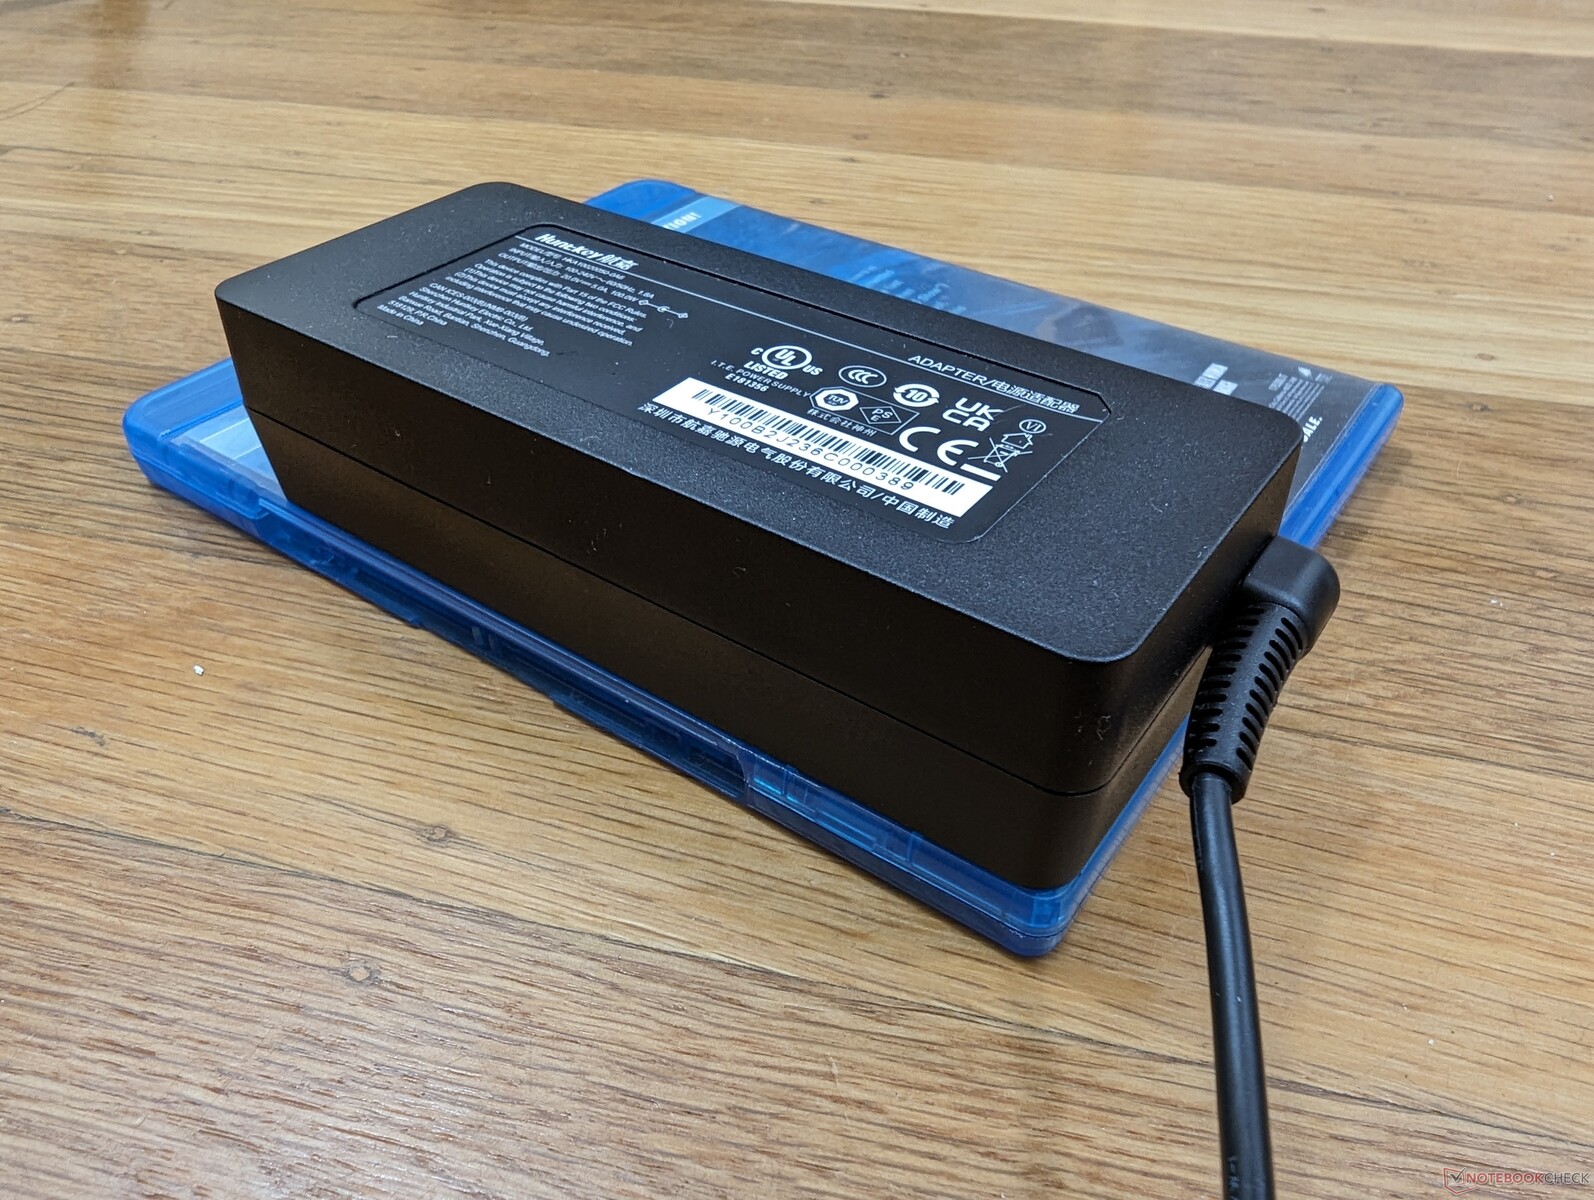
Accessoires et garantie
L'emballage comprend un câble HDMI, un adaptateur secteur, des papiers et un support VESA avec des vis. La garantie limitée habituelle d'un an du fabricant s'applique si vous achetez l'appareil aux États-Unis.
Performance
Conditions d'essai
Nous avons réglé Windows sur le mode Performance avant d'exécuter les tests de référence ci-dessous. Le fabricant n'installe aucun logiciel spécialisé permettant de modifier les caractéristiques spécifiques d'un modèle.
Processeur
Les performances multithread de notre Core i5-12450H est environ 25 à 30 % plus lente que celle du Core i7-12650H qui équipe la NucBox K3 Pro. Ce déficit est suffisant pour que notre processeur soit au coude à coude avec le processeur Ryzen 5 5560U qui est une alternative moins chère et plus économe en énergie. Le Core i5-12450H excelle plutôt dans les performances à un seul thread, où il est à distance de frappe avec le Core i7-13700H.
Cinebench R15 Multi Loop
Cinebench R23: Multi Core | Single Core
Cinebench R20: CPU (Multi Core) | CPU (Single Core)
Cinebench R15: CPU Multi 64Bit | CPU Single 64Bit
Blender: v2.79 BMW27 CPU
7-Zip 18.03: 7z b 4 | 7z b 4 -mmt1
Geekbench 5.5: Multi-Core | Single-Core
HWBOT x265 Benchmark v2.2: 4k Preset
LibreOffice : 20 Documents To PDF
R Benchmark 2.5: Overall mean
| CPU Performance rating | |
| Dell OptiPlex Micro | |
| Beelink SER7 | |
| Lenovo IdeaCentre Mini 01IRH8 | |
| Intel NUC 13 Pro Kit NUC13ANK | |
| Minisforum Neptune Series HX77G | |
| Geekom AS 6, R9 6900HX | |
| GMK NucBox K3 Pro | |
| Geekom AS 5 | |
| Geekom A5 | |
| Moyenne Intel Core i5-12450H | |
| GMK NucBox M3 | |
| LG Gram 15Z90Q | |
| Beelink SER5 | |
| BMAX B7 Power G7A2 | |
| Beelink Mini S12 Pro | |
| Cinebench R23 / Multi Core | |
| Dell OptiPlex Micro | |
| Beelink SER7 | |
| Lenovo IdeaCentre Mini 01IRH8 | |
| Minisforum Neptune Series HX77G | |
| Intel NUC 13 Pro Kit NUC13ANK | |
| Geekom AS 6, R9 6900HX | |
| Geekom AS 5 | |
| Geekom A5 | |
| GMK NucBox K3 Pro | |
| Moyenne Intel Core i5-12450H (7662 - 10633, n=6) | |
| LG Gram 15Z90Q | |
| Beelink SER5 | |
| GMK NucBox M3 | |
| BMAX B7 Power G7A2 | |
| Beelink Mini S12 Pro | |
| Cinebench R23 / Single Core | |
| Dell OptiPlex Micro | |
| Intel NUC 13 Pro Kit NUC13ANK | |
| Lenovo IdeaCentre Mini 01IRH8 | |
| GMK NucBox K3 Pro | |
| Beelink SER7 | |
| GMK NucBox M3 | |
| Moyenne Intel Core i5-12450H (1601 - 1688, n=6) | |
| Minisforum Neptune Series HX77G | |
| Geekom AS 6, R9 6900HX | |
| LG Gram 15Z90Q | |
| Geekom AS 5 | |
| BMAX B7 Power G7A2 | |
| Geekom A5 | |
| Beelink SER5 | |
| Beelink Mini S12 Pro | |
| Cinebench R20 / CPU (Multi Core) | |
| Dell OptiPlex Micro | |
| Beelink SER7 | |
| Lenovo IdeaCentre Mini 01IRH8 | |
| Minisforum Neptune Series HX77G | |
| Intel NUC 13 Pro Kit NUC13ANK | |
| Geekom AS 6, R9 6900HX | |
| Geekom AS 5 | |
| Geekom A5 | |
| GMK NucBox K3 Pro | |
| Moyenne Intel Core i5-12450H (2952 - 4105, n=6) | |
| LG Gram 15Z90Q | |
| Beelink SER5 | |
| GMK NucBox M3 | |
| BMAX B7 Power G7A2 | |
| Beelink Mini S12 Pro | |
| Cinebench R20 / CPU (Single Core) | |
| Intel NUC 13 Pro Kit NUC13ANK | |
| Lenovo IdeaCentre Mini 01IRH8 | |
| Dell OptiPlex Micro | |
| Beelink SER7 | |
| GMK NucBox K3 Pro | |
| GMK NucBox M3 | |
| Moyenne Intel Core i5-12450H (622 - 646, n=6) | |
| Minisforum Neptune Series HX77G | |
| Geekom AS 6, R9 6900HX | |
| Geekom AS 5 | |
| LG Gram 15Z90Q | |
| Geekom A5 | |
| BMAX B7 Power G7A2 | |
| Beelink SER5 | |
| Beelink Mini S12 Pro | |
| Cinebench R15 / CPU Multi 64Bit | |
| Dell OptiPlex Micro | |
| Beelink SER7 | |
| Minisforum Neptune Series HX77G | |
| Lenovo IdeaCentre Mini 01IRH8 | |
| Intel NUC 13 Pro Kit NUC13ANK | |
| Geekom AS 6, R9 6900HX | |
| Geekom AS 5 | |
| Geekom A5 | |
| GMK NucBox K3 Pro | |
| LG Gram 15Z90Q | |
| Moyenne Intel Core i5-12450H (1150 - 1591, n=6) | |
| Beelink SER5 | |
| GMK NucBox M3 | |
| BMAX B7 Power G7A2 | |
| Beelink Mini S12 Pro | |
| Cinebench R15 / CPU Single 64Bit | |
| Beelink SER7 | |
| Dell OptiPlex Micro | |
| Intel NUC 13 Pro Kit NUC13ANK | |
| Lenovo IdeaCentre Mini 01IRH8 | |
| GMK NucBox K3 Pro | |
| Minisforum Neptune Series HX77G | |
| Geekom AS 6, R9 6900HX | |
| Geekom AS 5 | |
| GMK NucBox M3 | |
| Moyenne Intel Core i5-12450H (225 - 239, n=6) | |
| Geekom A5 | |
| LG Gram 15Z90Q | |
| BMAX B7 Power G7A2 | |
| Beelink SER5 | |
| Beelink Mini S12 Pro | |
| Blender / v2.79 BMW27 CPU | |
| Beelink Mini S12 Pro | |
| BMAX B7 Power G7A2 | |
| LG Gram 15Z90Q | |
| GMK NucBox M3 | |
| Beelink SER5 | |
| Moyenne Intel Core i5-12450H (330 - 429, n=7) | |
| GMK NucBox K3 Pro | |
| Geekom A5 | |
| Intel NUC 13 Pro Kit NUC13ANK | |
| Geekom AS 5 | |
| Geekom AS 6, R9 6900HX | |
| Minisforum Neptune Series HX77G | |
| Lenovo IdeaCentre Mini 01IRH8 | |
| Beelink SER7 | |
| Dell OptiPlex Micro | |
| 7-Zip 18.03 / 7z b 4 | |
| Dell OptiPlex Micro | |
| Beelink SER7 | |
| Minisforum Neptune Series HX77G | |
| Geekom AS 6, R9 6900HX | |
| Lenovo IdeaCentre Mini 01IRH8 | |
| Geekom A5 | |
| Intel NUC 13 Pro Kit NUC13ANK | |
| Geekom AS 5 | |
| GMK NucBox K3 Pro | |
| Beelink SER5 | |
| Moyenne Intel Core i5-12450H (31119 - 38415, n=7) | |
| GMK NucBox M3 | |
| LG Gram 15Z90Q | |
| BMAX B7 Power G7A2 | |
| Beelink Mini S12 Pro | |
| 7-Zip 18.03 / 7z b 4 -mmt1 | |
| Beelink SER7 | |
| Dell OptiPlex Micro | |
| Lenovo IdeaCentre Mini 01IRH8 | |
| Intel NUC 13 Pro Kit NUC13ANK | |
| Minisforum Neptune Series HX77G | |
| GMK NucBox K3 Pro | |
| Geekom AS 6, R9 6900HX | |
| Geekom AS 5 | |
| BMAX B7 Power G7A2 | |
| Geekom A5 | |
| GMK NucBox M3 | |
| Moyenne Intel Core i5-12450H (4824 - 5386, n=7) | |
| LG Gram 15Z90Q | |
| Beelink SER5 | |
| Beelink Mini S12 Pro | |
| Geekbench 5.5 / Multi-Core | |
| Dell OptiPlex Micro | |
| Beelink SER7 | |
| Intel NUC 13 Pro Kit NUC13ANK | |
| Lenovo IdeaCentre Mini 01IRH8 | |
| Minisforum Neptune Series HX77G | |
| GMK NucBox K3 Pro | |
| Geekom AS 6, R9 6900HX | |
| Geekom AS 5 | |
| Geekom A5 | |
| LG Gram 15Z90Q | |
| Moyenne Intel Core i5-12450H (6777 - 8330, n=7) | |
| GMK NucBox M3 | |
| Beelink SER5 | |
| BMAX B7 Power G7A2 | |
| Beelink Mini S12 Pro | |
| Geekbench 5.5 / Single-Core | |
| Beelink SER7 | |
| Dell OptiPlex Micro | |
| Intel NUC 13 Pro Kit NUC13ANK | |
| Lenovo IdeaCentre Mini 01IRH8 | |
| GMK NucBox K3 Pro | |
| GMK NucBox M3 | |
| Minisforum Neptune Series HX77G | |
| Moyenne Intel Core i5-12450H (1527 - 1665, n=7) | |
| LG Gram 15Z90Q | |
| Geekom AS 6, R9 6900HX | |
| Geekom AS 5 | |
| Geekom A5 | |
| BMAX B7 Power G7A2 | |
| Beelink SER5 | |
| Beelink Mini S12 Pro | |
| HWBOT x265 Benchmark v2.2 / 4k Preset | |
| Dell OptiPlex Micro | |
| Beelink SER7 | |
| Minisforum Neptune Series HX77G | |
| Lenovo IdeaCentre Mini 01IRH8 | |
| Geekom AS 6, R9 6900HX | |
| Geekom AS 5 | |
| Intel NUC 13 Pro Kit NUC13ANK | |
| Geekom A5 | |
| GMK NucBox K3 Pro | |
| Moyenne Intel Core i5-12450H (8.78 - 12.3, n=6) | |
| Beelink SER5 | |
| GMK NucBox M3 | |
| LG Gram 15Z90Q | |
| BMAX B7 Power G7A2 | |
| Beelink Mini S12 Pro | |
| LibreOffice / 20 Documents To PDF | |
| Beelink Mini S12 Pro | |
| Beelink SER5 | |
| Geekom A5 | |
| LG Gram 15Z90Q | |
| BMAX B7 Power G7A2 | |
| Geekom AS 5 | |
| Minisforum Neptune Series HX77G | |
| Moyenne Intel Core i5-12450H (41.1 - 60.3, n=7) | |
| Geekom AS 6, R9 6900HX | |
| Intel NUC 13 Pro Kit NUC13ANK | |
| GMK NucBox M3 | |
| GMK NucBox K3 Pro | |
| Beelink SER7 | |
| Lenovo IdeaCentre Mini 01IRH8 | |
| Dell OptiPlex Micro | |
| R Benchmark 2.5 / Overall mean | |
| Beelink Mini S12 Pro | |
| Beelink SER5 | |
| BMAX B7 Power G7A2 | |
| LG Gram 15Z90Q | |
| Geekom A5 | |
| Moyenne Intel Core i5-12450H (0.4949 - 0.54, n=7) | |
| Geekom AS 5 | |
| GMK NucBox M3 | |
| Geekom AS 6, R9 6900HX | |
| Minisforum Neptune Series HX77G | |
| GMK NucBox K3 Pro | |
| Lenovo IdeaCentre Mini 01IRH8 | |
| Intel NUC 13 Pro Kit NUC13ANK | |
| Beelink SER7 | |
| Dell OptiPlex Micro | |
Cinebench R23: Multi Core | Single Core
Cinebench R20: CPU (Multi Core) | CPU (Single Core)
Cinebench R15: CPU Multi 64Bit | CPU Single 64Bit
Blender: v2.79 BMW27 CPU
7-Zip 18.03: 7z b 4 | 7z b 4 -mmt1
Geekbench 5.5: Multi-Core | Single-Core
HWBOT x265 Benchmark v2.2: 4k Preset
LibreOffice : 20 Documents To PDF
R Benchmark 2.5: Overall mean
* ... Moindre est la valeur, meilleures sont les performances
AIDA64: FP32 Ray-Trace | FPU Julia | CPU SHA3 | CPU Queen | FPU SinJulia | FPU Mandel | CPU AES | CPU ZLib | FP64 Ray-Trace | CPU PhotoWorxx
| Performance rating | |
| Geekom A5 | |
| Intel NUC 13 Pro Kit NUC13ANK | |
| GMK NucBox K3 Pro | |
| Beelink SER5 | |
| Moyenne Intel Core i5-12450H | |
| GMK NucBox M3 | |
| Beelink Mini S12 Pro | |
| AIDA64 / FP32 Ray-Trace | |
| Geekom A5 | |
| Intel NUC 13 Pro Kit NUC13ANK | |
| GMK NucBox K3 Pro | |
| Beelink SER5 | |
| Moyenne Intel Core i5-12450H (7229 - 10474, n=6) | |
| GMK NucBox M3 | |
| Beelink Mini S12 Pro | |
| AIDA64 / FPU Julia | |
| Geekom A5 | |
| Beelink SER5 | |
| Intel NUC 13 Pro Kit NUC13ANK | |
| GMK NucBox K3 Pro | |
| Moyenne Intel Core i5-12450H (37583 - 51636, n=6) | |
| GMK NucBox M3 | |
| Beelink Mini S12 Pro | |
| AIDA64 / CPU SHA3 | |
| Intel NUC 13 Pro Kit NUC13ANK | |
| Geekom A5 | |
| GMK NucBox K3 Pro | |
| Moyenne Intel Core i5-12450H (1724 - 2359, n=6) | |
| Beelink SER5 | |
| GMK NucBox M3 | |
| Beelink Mini S12 Pro | |
| AIDA64 / CPU Queen | |
| Geekom A5 | |
| Intel NUC 13 Pro Kit NUC13ANK | |
| GMK NucBox K3 Pro | |
| Beelink SER5 | |
| Moyenne Intel Core i5-12450H (59539 - 68897, n=6) | |
| GMK NucBox M3 | |
| Beelink Mini S12 Pro | |
| AIDA64 / FPU SinJulia | |
| Geekom A5 | |
| Beelink SER5 | |
| Intel NUC 13 Pro Kit NUC13ANK | |
| GMK NucBox K3 Pro | |
| Moyenne Intel Core i5-12450H (5007 - 6147, n=6) | |
| GMK NucBox M3 | |
| Beelink Mini S12 Pro | |
| AIDA64 / FPU Mandel | |
| Geekom A5 | |
| Beelink SER5 | |
| Intel NUC 13 Pro Kit NUC13ANK | |
| GMK NucBox K3 Pro | |
| Moyenne Intel Core i5-12450H (18516 - 25115, n=6) | |
| GMK NucBox M3 | |
| Beelink Mini S12 Pro | |
| AIDA64 / CPU AES | |
| Geekom A5 | |
| Intel NUC 13 Pro Kit NUC13ANK | |
| GMK NucBox K3 Pro | |
| Beelink SER5 | |
| GMK NucBox M3 | |
| Moyenne Intel Core i5-12450H (46835 - 78537, n=6) | |
| Beelink Mini S12 Pro | |
| AIDA64 / CPU ZLib | |
| Intel NUC 13 Pro Kit NUC13ANK | |
| Geekom A5 | |
| GMK NucBox K3 Pro | |
| Moyenne Intel Core i5-12450H (490 - 708, n=6) | |
| Beelink SER5 | |
| GMK NucBox M3 | |
| Beelink Mini S12 Pro | |
| AIDA64 / FP64 Ray-Trace | |
| Geekom A5 | |
| Intel NUC 13 Pro Kit NUC13ANK | |
| GMK NucBox K3 Pro | |
| Moyenne Intel Core i5-12450H (4025 - 5614, n=6) | |
| Beelink SER5 | |
| GMK NucBox M3 | |
| Beelink Mini S12 Pro | |
| AIDA64 / CPU PhotoWorxx | |
| GMK NucBox K3 Pro | |
| Intel NUC 13 Pro Kit NUC13ANK | |
| GMK NucBox M3 | |
| Geekom A5 | |
| Moyenne Intel Core i5-12450H (12271 - 28682, n=6) | |
| Beelink SER5 | |
| Beelink Mini S12 Pro | |
Performance du système
CrossMark: Overall | Productivity | Creativity | Responsiveness
| PCMark 10 / Score | |
| Intel NUC 13 Pro Kit NUC13ANK | |
| Geekom A5 | |
| GMK NucBox K3 Pro | |
| Beelink SER5 | |
| GMK NucBox M3 | |
| Moyenne Intel Core i5-12450H, Intel UHD Graphics Xe G4 48EUs (n=1) | |
| Beelink Mini S12 Pro | |
| PCMark 10 / Essentials | |
| Intel NUC 13 Pro Kit NUC13ANK | |
| GMK NucBox K3 Pro | |
| GMK NucBox M3 | |
| Moyenne Intel Core i5-12450H, Intel UHD Graphics Xe G4 48EUs (n=1) | |
| Geekom A5 | |
| Beelink SER5 | |
| Beelink Mini S12 Pro | |
| PCMark 10 / Productivity | |
| Geekom A5 | |
| Beelink SER5 | |
| Intel NUC 13 Pro Kit NUC13ANK | |
| GMK NucBox K3 Pro | |
| GMK NucBox M3 | |
| Moyenne Intel Core i5-12450H, Intel UHD Graphics Xe G4 48EUs (n=1) | |
| Beelink Mini S12 Pro | |
| PCMark 10 / Digital Content Creation | |
| Intel NUC 13 Pro Kit NUC13ANK | |
| Geekom A5 | |
| GMK NucBox K3 Pro | |
| Beelink SER5 | |
| GMK NucBox M3 | |
| Moyenne Intel Core i5-12450H, Intel UHD Graphics Xe G4 48EUs (n=1) | |
| Beelink Mini S12 Pro | |
| CrossMark / Overall | |
| Intel NUC 13 Pro Kit NUC13ANK | |
| GMK NucBox K3 Pro | |
| GMK NucBox M3 | |
| Moyenne Intel Core i5-12450H, Intel UHD Graphics Xe G4 48EUs (n=1) | |
| Geekom A5 | |
| Beelink SER5 | |
| Beelink Mini S12 Pro | |
| CrossMark / Productivity | |
| Intel NUC 13 Pro Kit NUC13ANK | |
| GMK NucBox M3 | |
| Moyenne Intel Core i5-12450H, Intel UHD Graphics Xe G4 48EUs (n=1) | |
| GMK NucBox K3 Pro | |
| Geekom A5 | |
| Beelink SER5 | |
| Beelink Mini S12 Pro | |
| CrossMark / Creativity | |
| Intel NUC 13 Pro Kit NUC13ANK | |
| GMK NucBox K3 Pro | |
| Geekom A5 | |
| GMK NucBox M3 | |
| Moyenne Intel Core i5-12450H, Intel UHD Graphics Xe G4 48EUs (n=1) | |
| Beelink SER5 | |
| Beelink Mini S12 Pro | |
| CrossMark / Responsiveness | |
| Intel NUC 13 Pro Kit NUC13ANK | |
| GMK NucBox M3 | |
| Moyenne Intel Core i5-12450H, Intel UHD Graphics Xe G4 48EUs (n=1) | |
| GMK NucBox K3 Pro | |
| Geekom A5 | |
| Beelink SER5 | |
| Beelink Mini S12 Pro | |
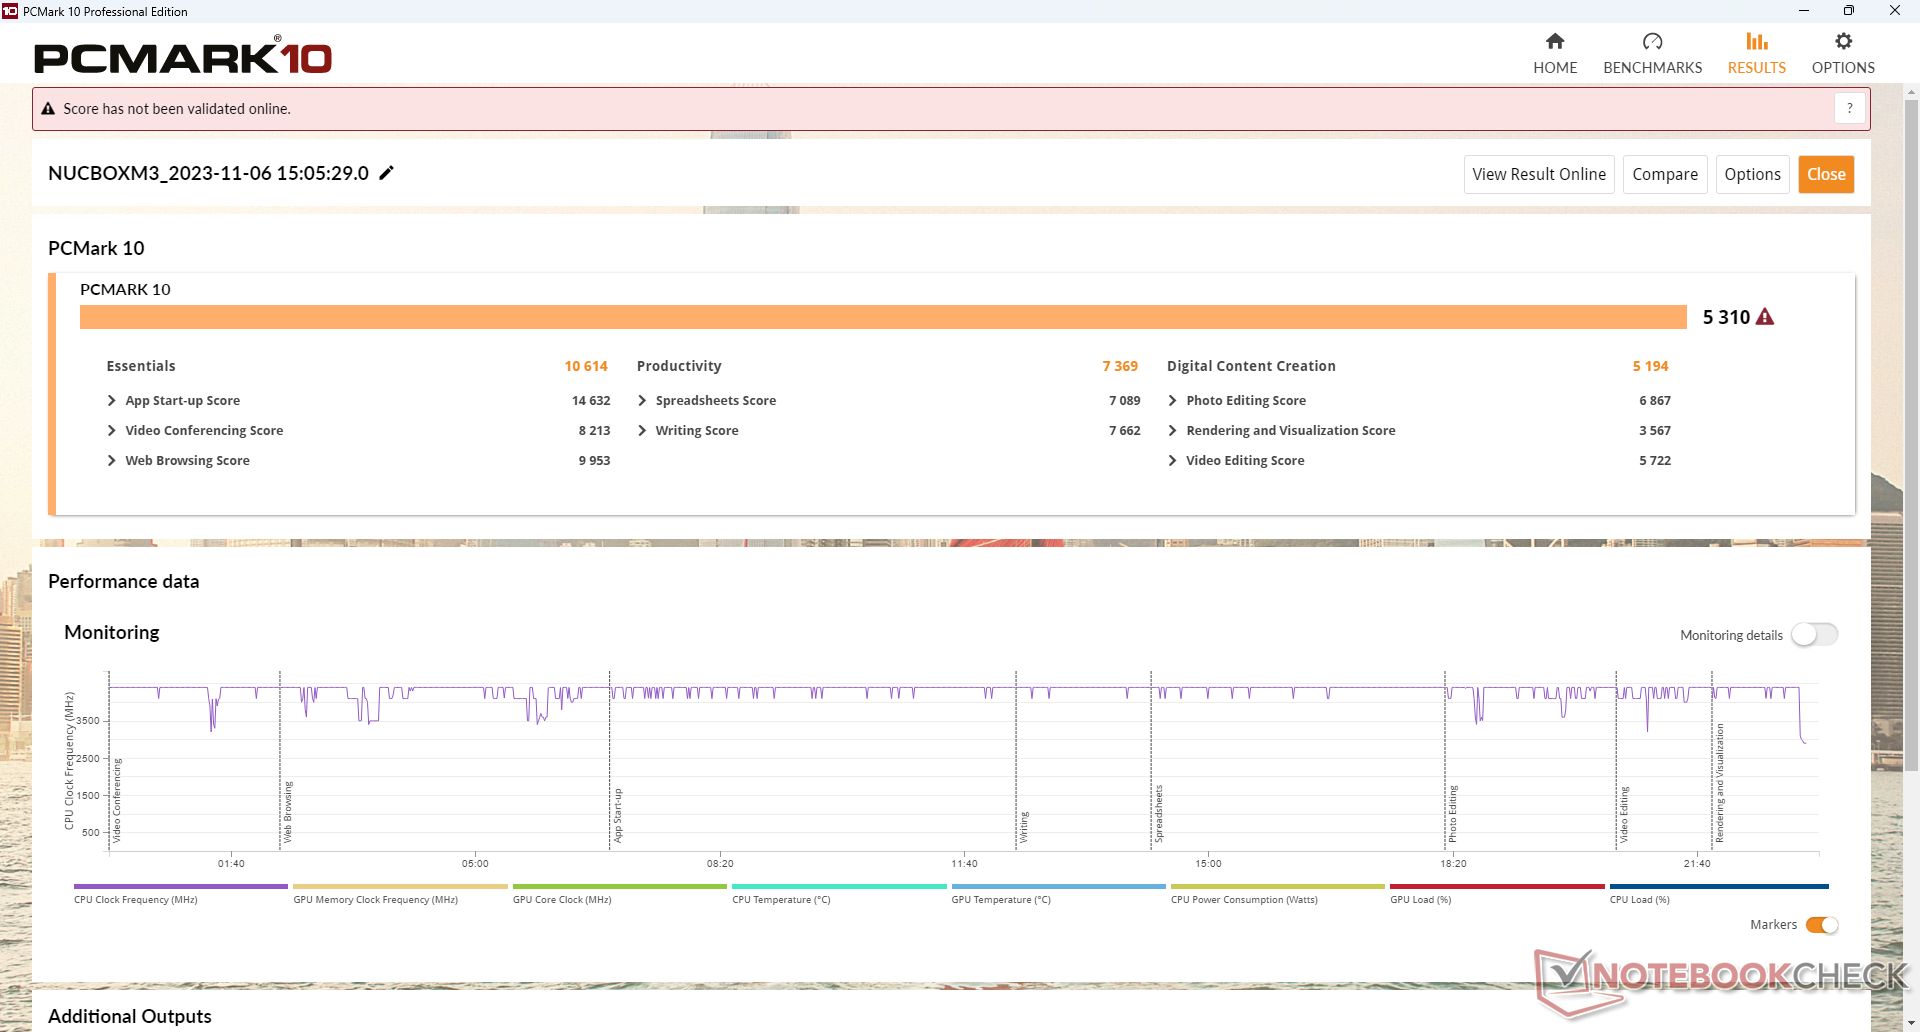
| PCMark 10 Score | 5310 points | |
Aide | ||
| AIDA64 / Memory Copy | |
| GMK NucBox K3 Pro | |
| Intel NUC 13 Pro Kit NUC13ANK | |
| Geekom A5 | |
| GMK NucBox M3 | |
| Moyenne Intel Core i5-12450H (21750 - 43918, n=6) | |
| Beelink SER5 | |
| Beelink Mini S12 Pro | |
| AIDA64 / Memory Read | |
| GMK NucBox K3 Pro | |
| Geekom A5 | |
| Intel NUC 13 Pro Kit NUC13ANK | |
| GMK NucBox M3 | |
| Moyenne Intel Core i5-12450H (22956 - 47555, n=6) | |
| Beelink SER5 | |
| Beelink Mini S12 Pro | |
| AIDA64 / Memory Write | |
| GMK NucBox K3 Pro | |
| GMK NucBox M3 | |
| Geekom A5 | |
| Intel NUC 13 Pro Kit NUC13ANK | |
| Moyenne Intel Core i5-12450H (22297 - 46963, n=6) | |
| Beelink SER5 | |
| Beelink Mini S12 Pro | |
| AIDA64 / Memory Latency | |
| Beelink Mini S12 Pro | |
| GMK NucBox K3 Pro | |
| Intel NUC 13 Pro Kit NUC13ANK | |
| Beelink SER5 | |
| Moyenne Intel Core i5-12450H (76.5 - 100.9, n=6) | |
| Geekom A5 | |
| GMK NucBox M3 | |
* ... Moindre est la valeur, meilleures sont les performances
Latence DPC
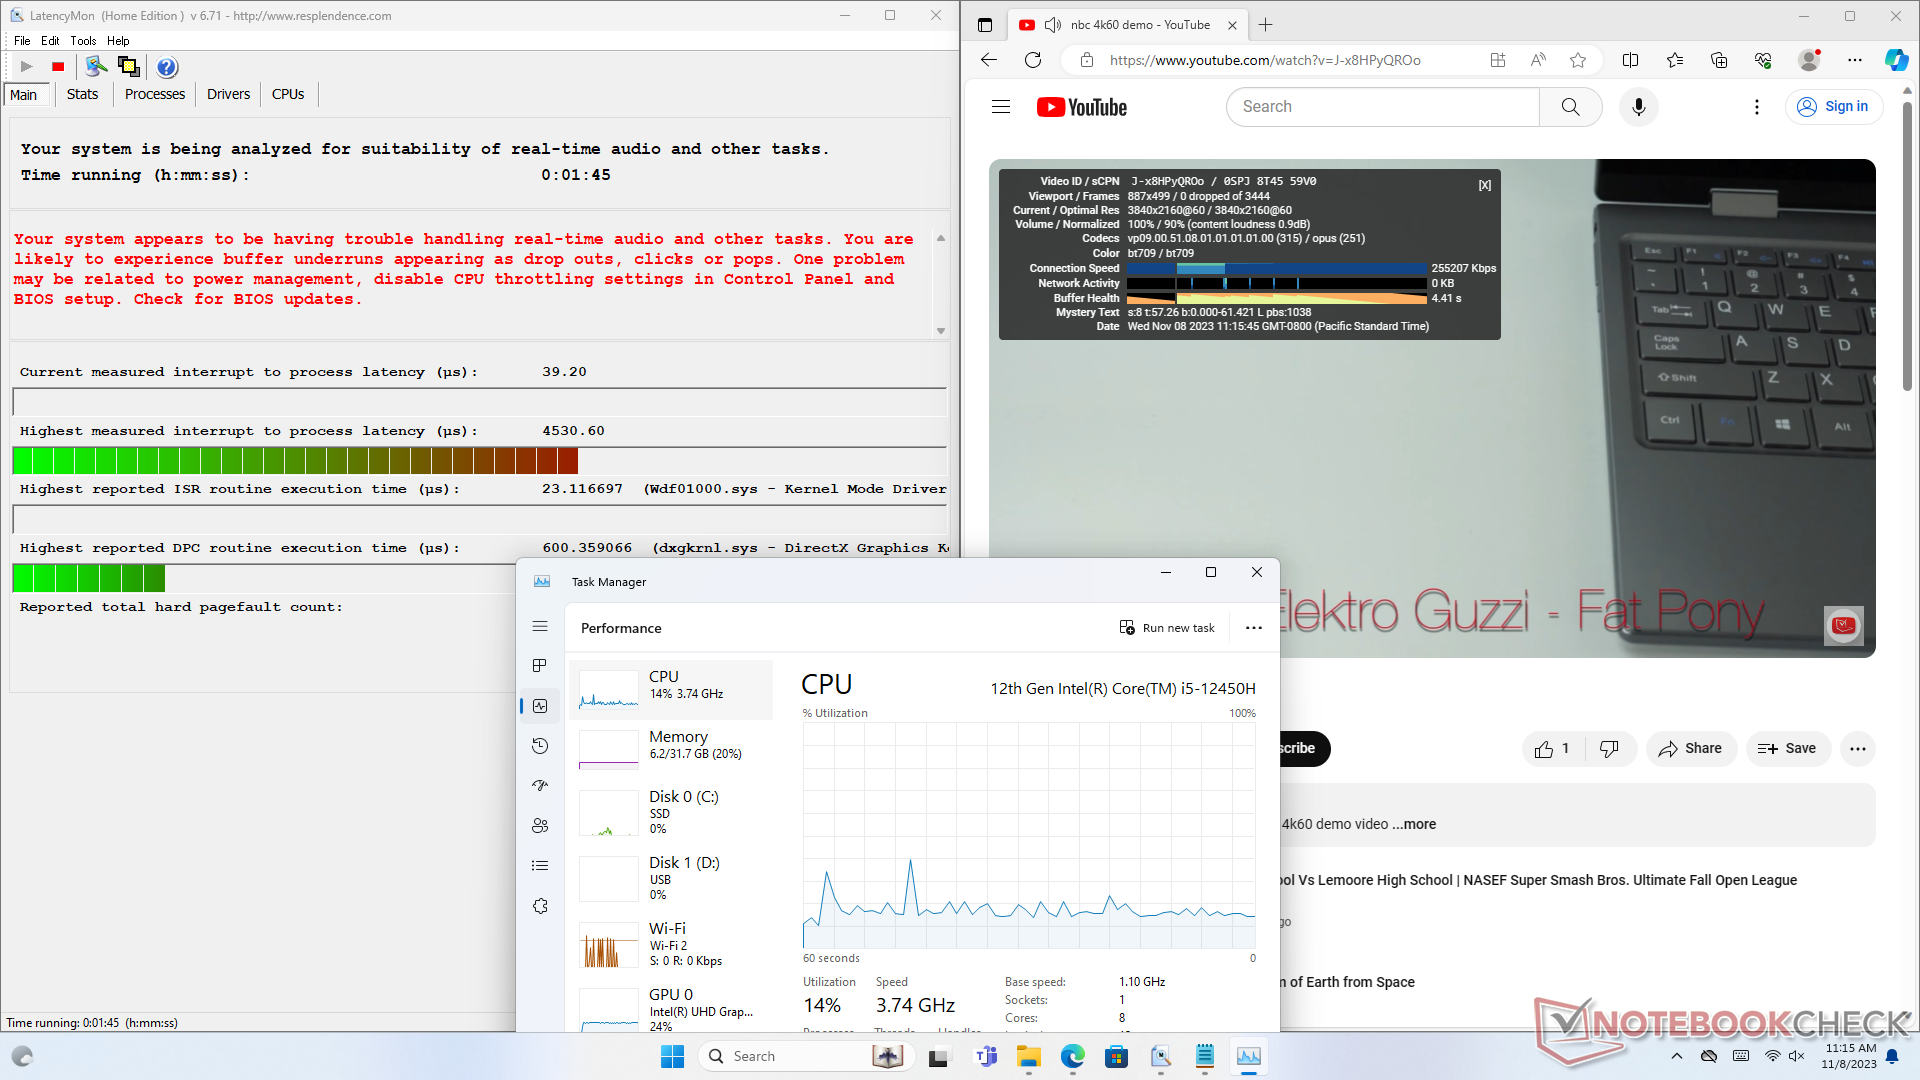
LatencyMon révèle des problèmes de DPC lors de l'ouverture de plusieurs onglets de notre page d'accueil. la lecture de vidéos 4K à 60 FPS est par ailleurs parfaite et aucune image n'a été perdue.
| DPC Latencies / LatencyMon - interrupt to process latency (max), Web, Youtube, Prime95 | |
| Beelink Mini S12 Pro | |
| GMK NucBox M3 | |
| GMK NucBox K3 Pro | |
| Geekom A5 | |
| Intel NUC 13 Pro Kit NUC13ANK | |
| Beelink SER5 | |
* ... Moindre est la valeur, meilleures sont les performances
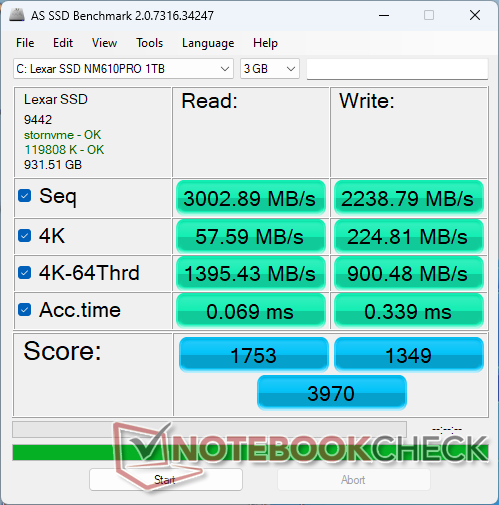
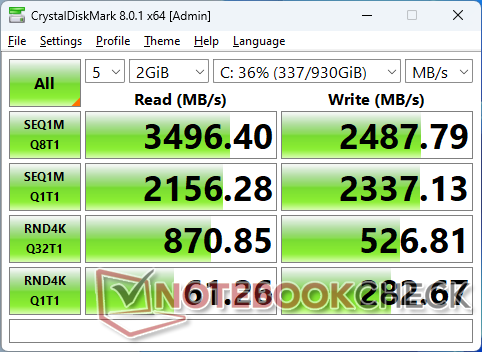
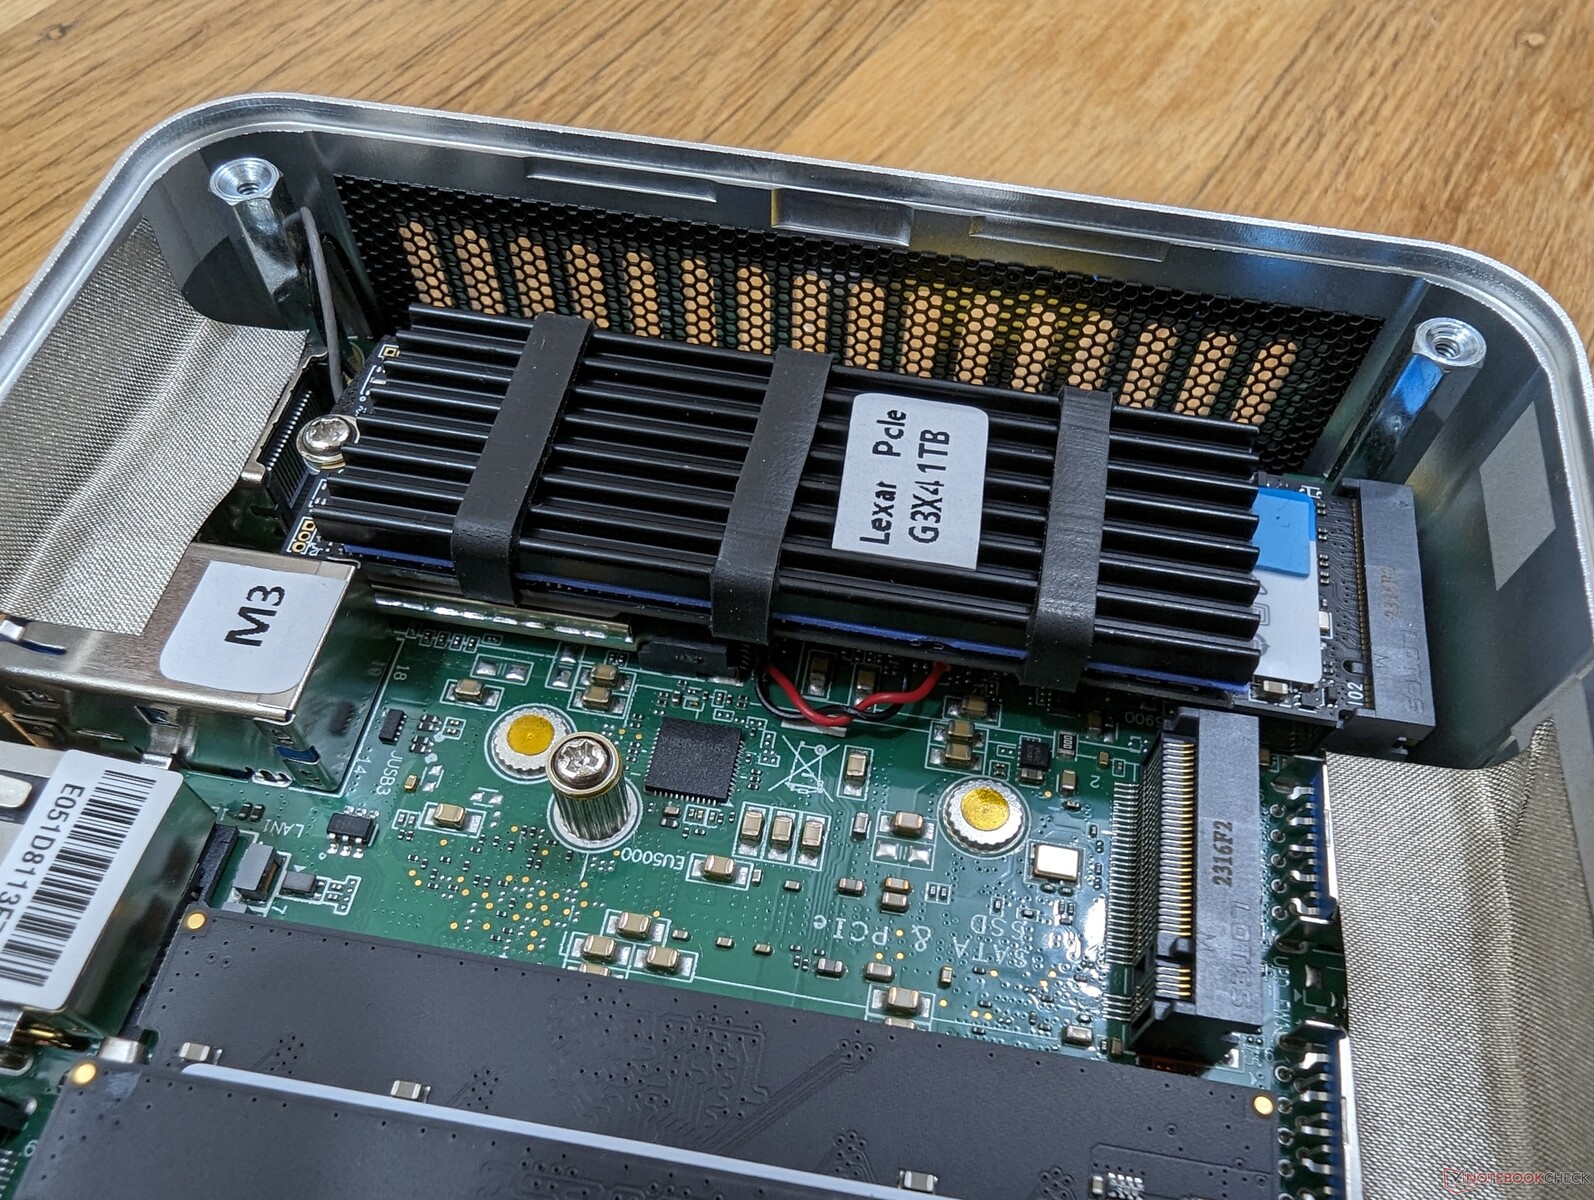
Dispositifs de stockage
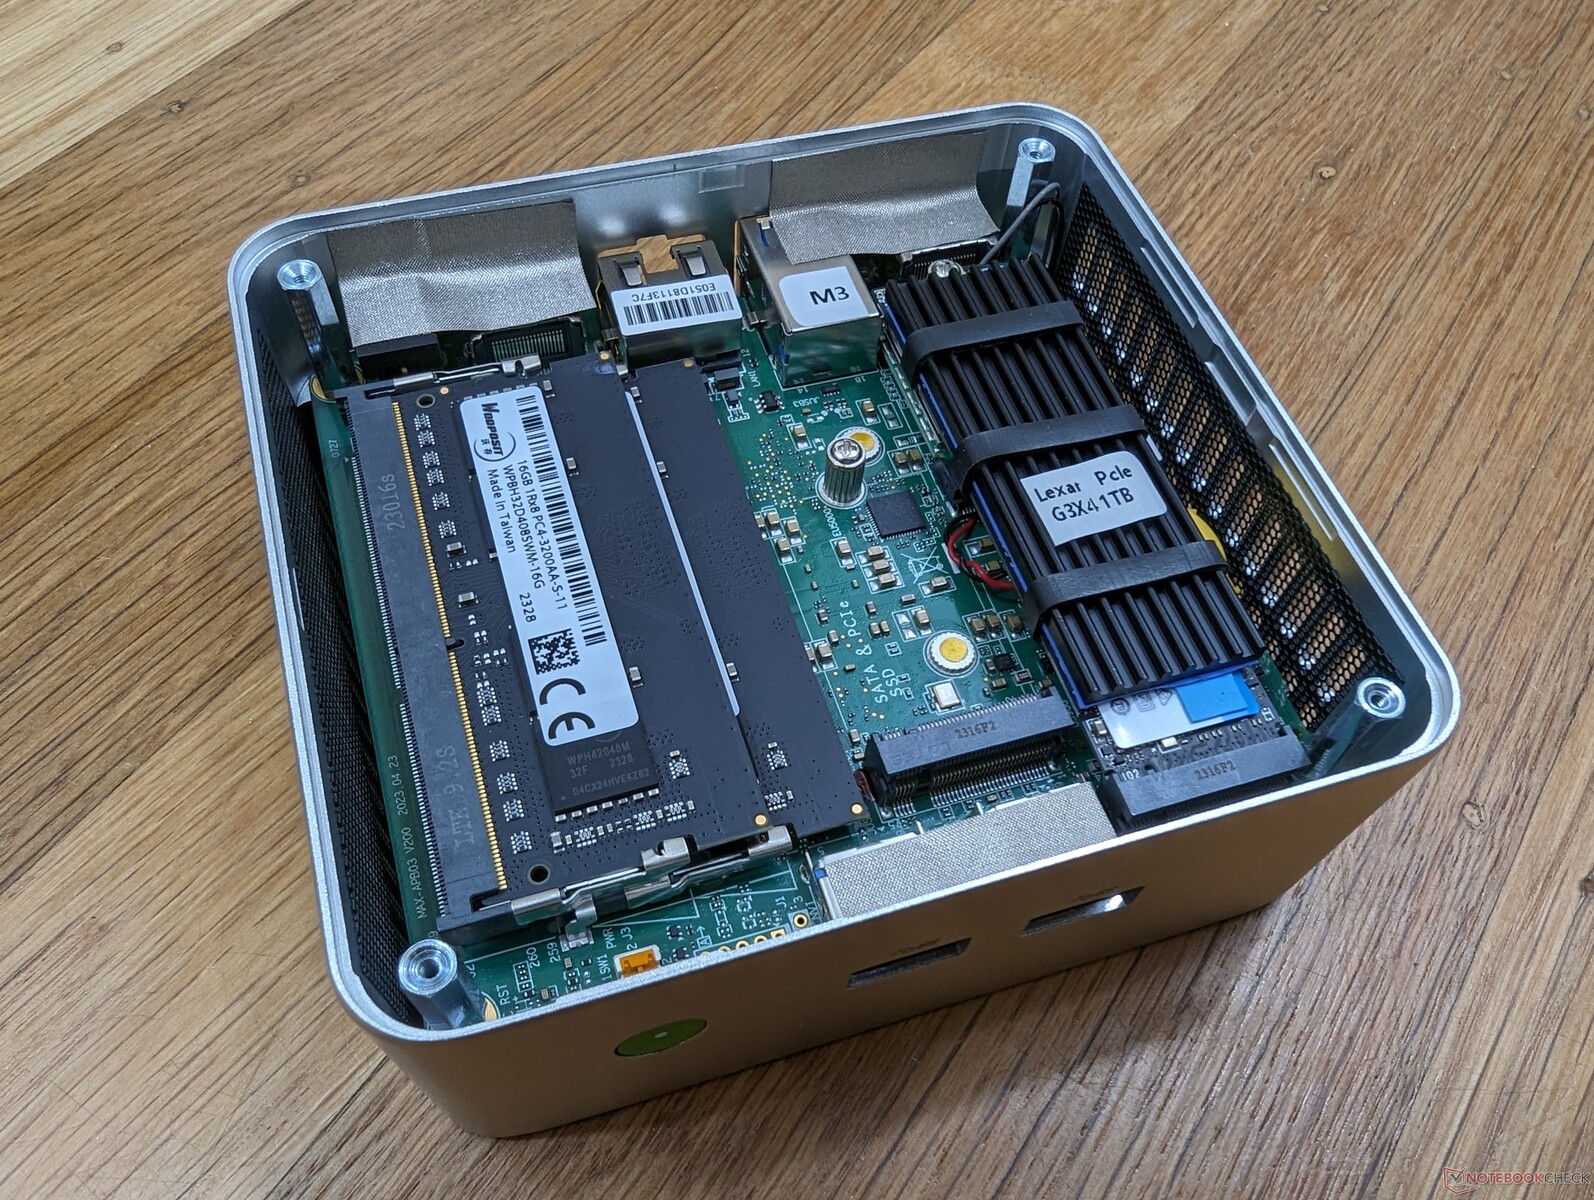
GMK déploie la mêmeLexar NM610 Pro PCIe3 x4 NVMe SSD pour ses modèles NucBox M3 et NucBox K3 Pro. Le système n'est pas livré avec un SSD PCIe4, probablement pour réduire les coûts.
Un deuxième SSD peut être installé, mais il doit avoir une longueur de 42 mm ou moins.

| Drive Performance rating - Percent | |
| Intel NUC 13 Pro Kit NUC13ANK | |
| Beelink SER5 | |
| Geekom A5 | |
| GMK NucBox M3 | |
| GMK NucBox K3 Pro | |
| Beelink Mini S12 Pro | |
| DiskSpd | |
| seq read | |
| Intel NUC 13 Pro Kit NUC13ANK | |
| Beelink SER5 | |
| Geekom A5 | |
| GMK NucBox M3 | |
| GMK NucBox K3 Pro | |
| Beelink Mini S12 Pro | |
| seq write | |
| Intel NUC 13 Pro Kit NUC13ANK | |
| Beelink SER5 | |
| Geekom A5 | |
| GMK NucBox M3 | |
| GMK NucBox K3 Pro | |
| Beelink Mini S12 Pro | |
| seq q8 t1 read | |
| Intel NUC 13 Pro Kit NUC13ANK | |
| Beelink SER5 | |
| GMK NucBox K3 Pro | |
| GMK NucBox M3 | |
| Geekom A5 | |
| Beelink Mini S12 Pro | |
| seq q8 t1 write | |
| Beelink SER5 | |
| Geekom A5 | |
| Intel NUC 13 Pro Kit NUC13ANK | |
| GMK NucBox M3 | |
| GMK NucBox K3 Pro | |
| Beelink Mini S12 Pro | |
| 4k q1 t1 read | |
| GMK NucBox M3 | |
| Geekom A5 | |
| Beelink SER5 | |
| Intel NUC 13 Pro Kit NUC13ANK | |
| GMK NucBox K3 Pro | |
| Beelink Mini S12 Pro | |
| 4k q1 t1 write | |
| GMK NucBox M3 | |
| Intel NUC 13 Pro Kit NUC13ANK | |
| Beelink SER5 | |
| GMK NucBox K3 Pro | |
| Geekom A5 | |
| Beelink Mini S12 Pro | |
| 4k q32 t16 read | |
| Beelink SER5 | |
| Geekom A5 | |
| GMK NucBox M3 | |
| Intel NUC 13 Pro Kit NUC13ANK | |
| GMK NucBox K3 Pro | |
| Beelink Mini S12 Pro | |
| 4k q32 t16 write | |
| Beelink SER5 | |
| Geekom A5 | |
| GMK NucBox M3 | |
| Beelink Mini S12 Pro | |
| Intel NUC 13 Pro Kit NUC13ANK | |
| GMK NucBox K3 Pro | |
* ... Moindre est la valeur, meilleures sont les performances
Disk Throttling: DiskSpd Read Loop, Queue Depth 8
Performance du GPU
Les performances graphiques sont supérieures à celles d'un PC moyen équipé de la même carte Iris Xe 48 EU Iris Xe 48 EUs car ce GPU intégré est généralement associé à des CPU Core U plus lents. Dans ce cas, le processeur Core H plus rapide de notre NucBox M3 contribue à améliorer les performances globales du GPU. Néanmoins, le système est encore loin d'être assez rapide pour faire tourner la plupart des jeux en mode natif.
| 3DMark Performance rating - Percent | |
| Beelink SER7 -1! | |
| Geekom AS 6, R9 6900HX | |
| Intel NUC 13 Pro Kit NUC13ANK | |
| Geekom A5 | |
| Geekom AS 5 | |
| Lenovo IdeaCentre Mini 01IRH8 -1! | |
| Intel NUC 12 Pro Kit NUC12WSBi5 -1! | |
| GMK NucBox K3 Pro -1! | |
| Beelink SER5 | |
| GMK NucBox M3 | |
| BMAX B7 Power G7A2 | |
| Moyenne Intel UHD Graphics Xe G4 48EUs | |
| Dell OptiPlex Micro -1! | |
| Beelink Mini S12 Pro | |
| 3DMark 11 - 1280x720 Performance GPU | |
| Beelink SER7 | |
| Geekom AS 6, R9 6900HX | |
| Geekom AS 5 | |
| Intel NUC 13 Pro Kit NUC13ANK | |
| Geekom A5 | |
| Lenovo IdeaCentre Mini 01IRH8 | |
| Intel NUC 12 Pro Kit NUC12WSBi5 | |
| GMK NucBox K3 Pro | |
| BMAX B7 Power G7A2 | |
| Beelink SER5 | |
| GMK NucBox M3 | |
| Dell OptiPlex Micro | |
| Moyenne Intel UHD Graphics Xe G4 48EUs (2156 - 4524, n=16) | |
| Beelink Mini S12 Pro | |
| 3DMark | |
| 1280x720 Cloud Gate Standard Graphics | |
| Geekom AS 6, R9 6900HX | |
| Geekom A5 | |
| Geekom AS 5 | |
| Intel NUC 13 Pro Kit NUC13ANK | |
| Intel NUC 12 Pro Kit NUC12WSBi5 | |
| Beelink SER5 | |
| GMK NucBox M3 | |
| Moyenne Intel UHD Graphics Xe G4 48EUs (11270 - 24880, n=15) | |
| BMAX B7 Power G7A2 | |
| Beelink Mini S12 Pro | |
| 1920x1080 Fire Strike Graphics | |
| Beelink SER7 | |
| Geekom AS 6, R9 6900HX | |
| Intel NUC 13 Pro Kit NUC13ANK | |
| Lenovo IdeaCentre Mini 01IRH8 | |
| GMK NucBox K3 Pro | |
| Geekom A5 | |
| Geekom AS 5 | |
| Intel NUC 12 Pro Kit NUC12WSBi5 | |
| GMK NucBox M3 | |
| Beelink SER5 | |
| Dell OptiPlex Micro | |
| BMAX B7 Power G7A2 | |
| Moyenne Intel UHD Graphics Xe G4 48EUs (1602 - 3588, n=16) | |
| Beelink Mini S12 Pro | |
| 2560x1440 Time Spy Graphics | |
| Beelink SER7 | |
| Geekom AS 6, R9 6900HX | |
| Intel NUC 13 Pro Kit NUC13ANK | |
| Lenovo IdeaCentre Mini 01IRH8 | |
| Geekom AS 5 | |
| Geekom A5 | |
| GMK NucBox K3 Pro | |
| Beelink SER5 | |
| BMAX B7 Power G7A2 | |
| GMK NucBox M3 | |
| Moyenne Intel UHD Graphics Xe G4 48EUs (634 - 1028, n=14) | |
| Dell OptiPlex Micro | |
| Beelink Mini S12 Pro | |
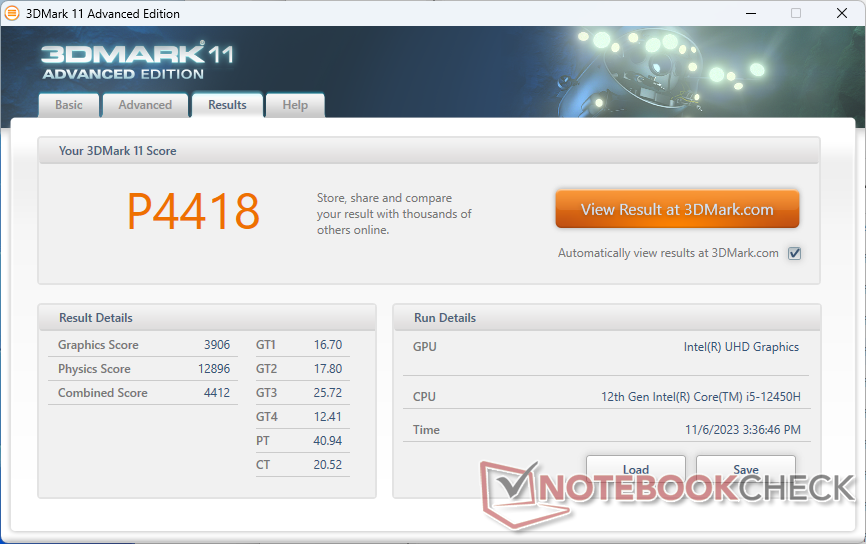
| 3DMark 11 Performance | 4418 points | |
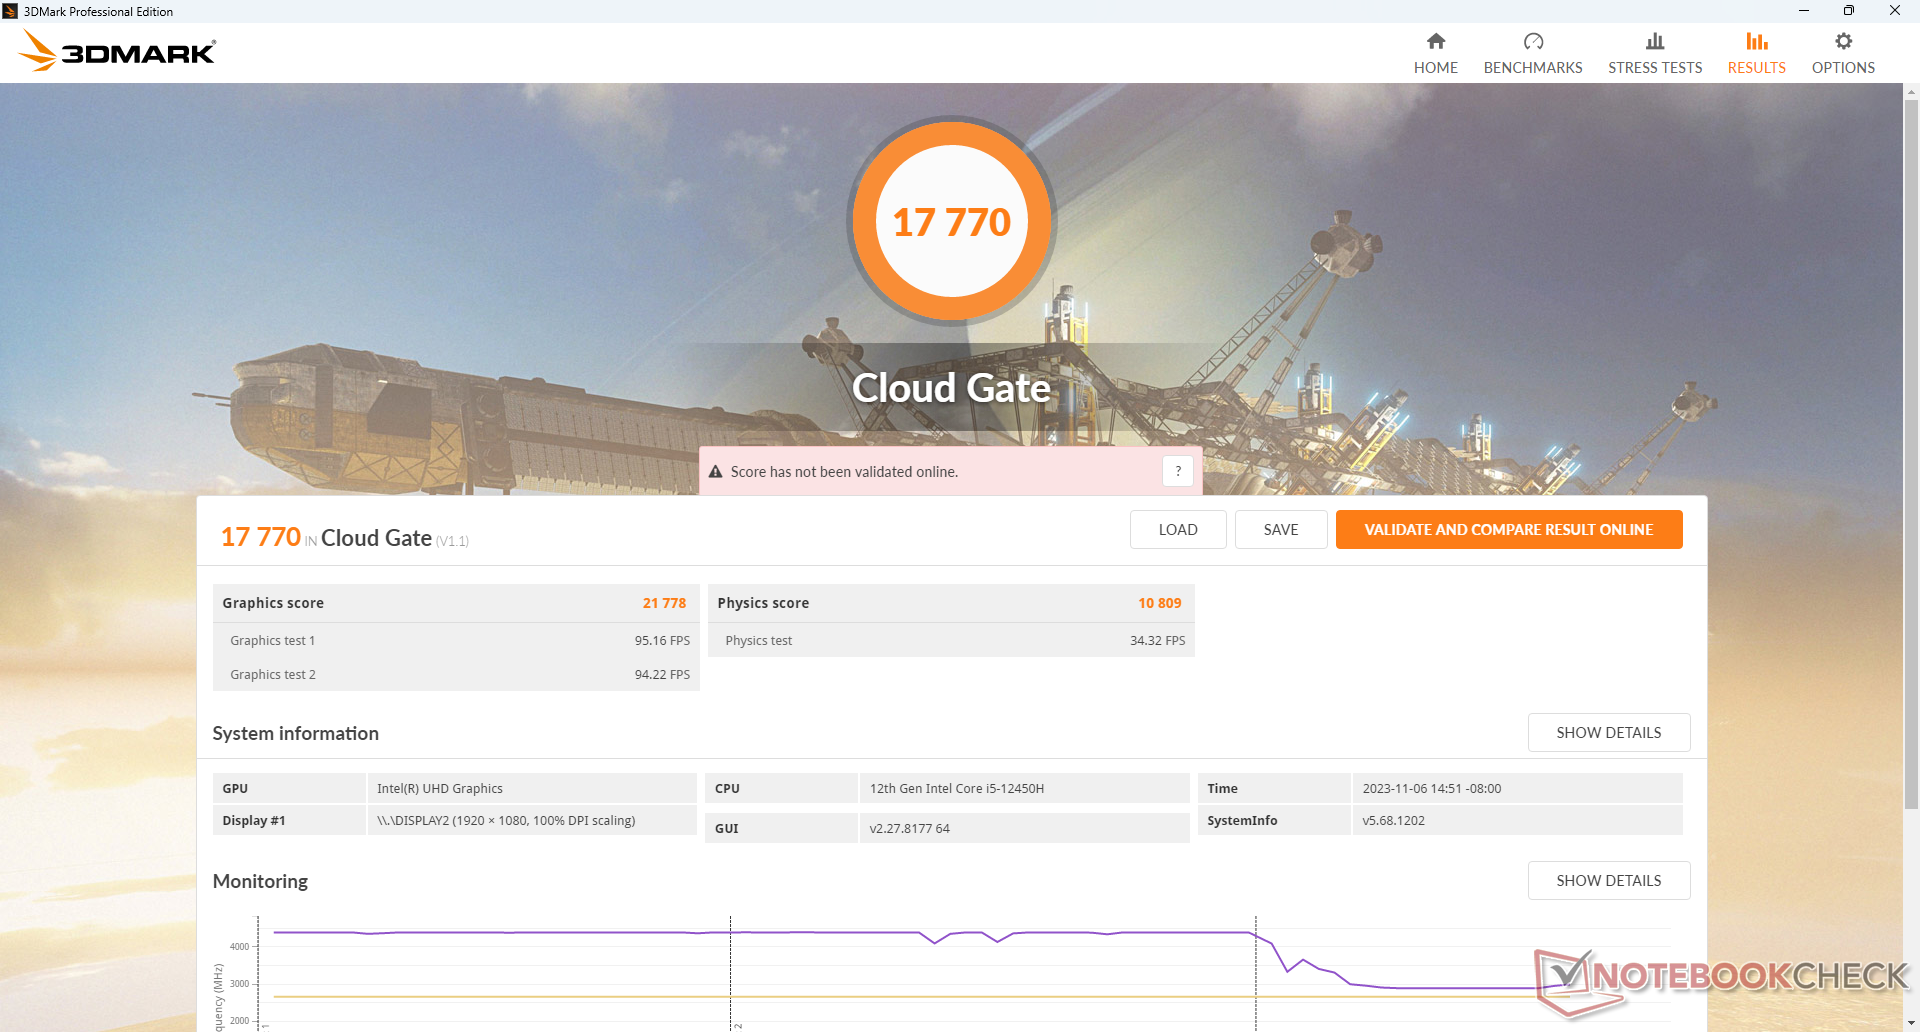
| 3DMark Cloud Gate Standard Score | 17770 points | |
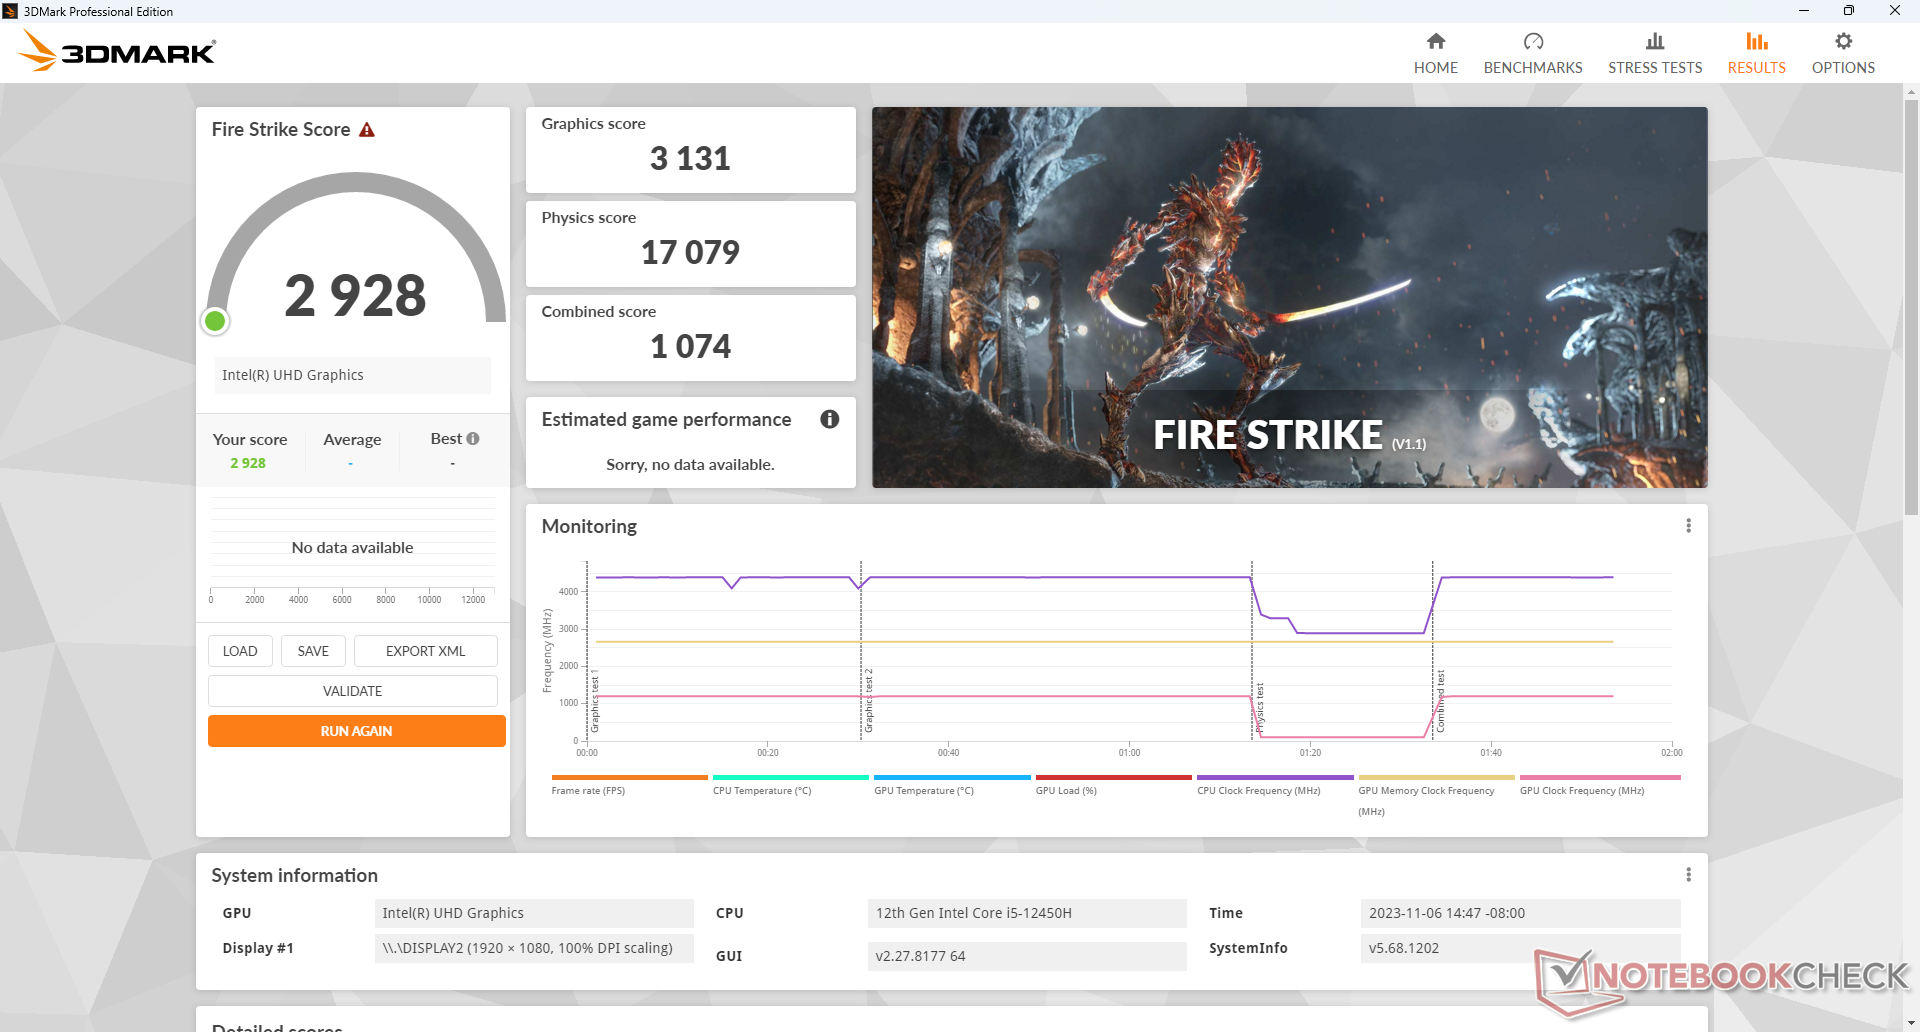
| 3DMark Fire Strike Score | 2928 points | |
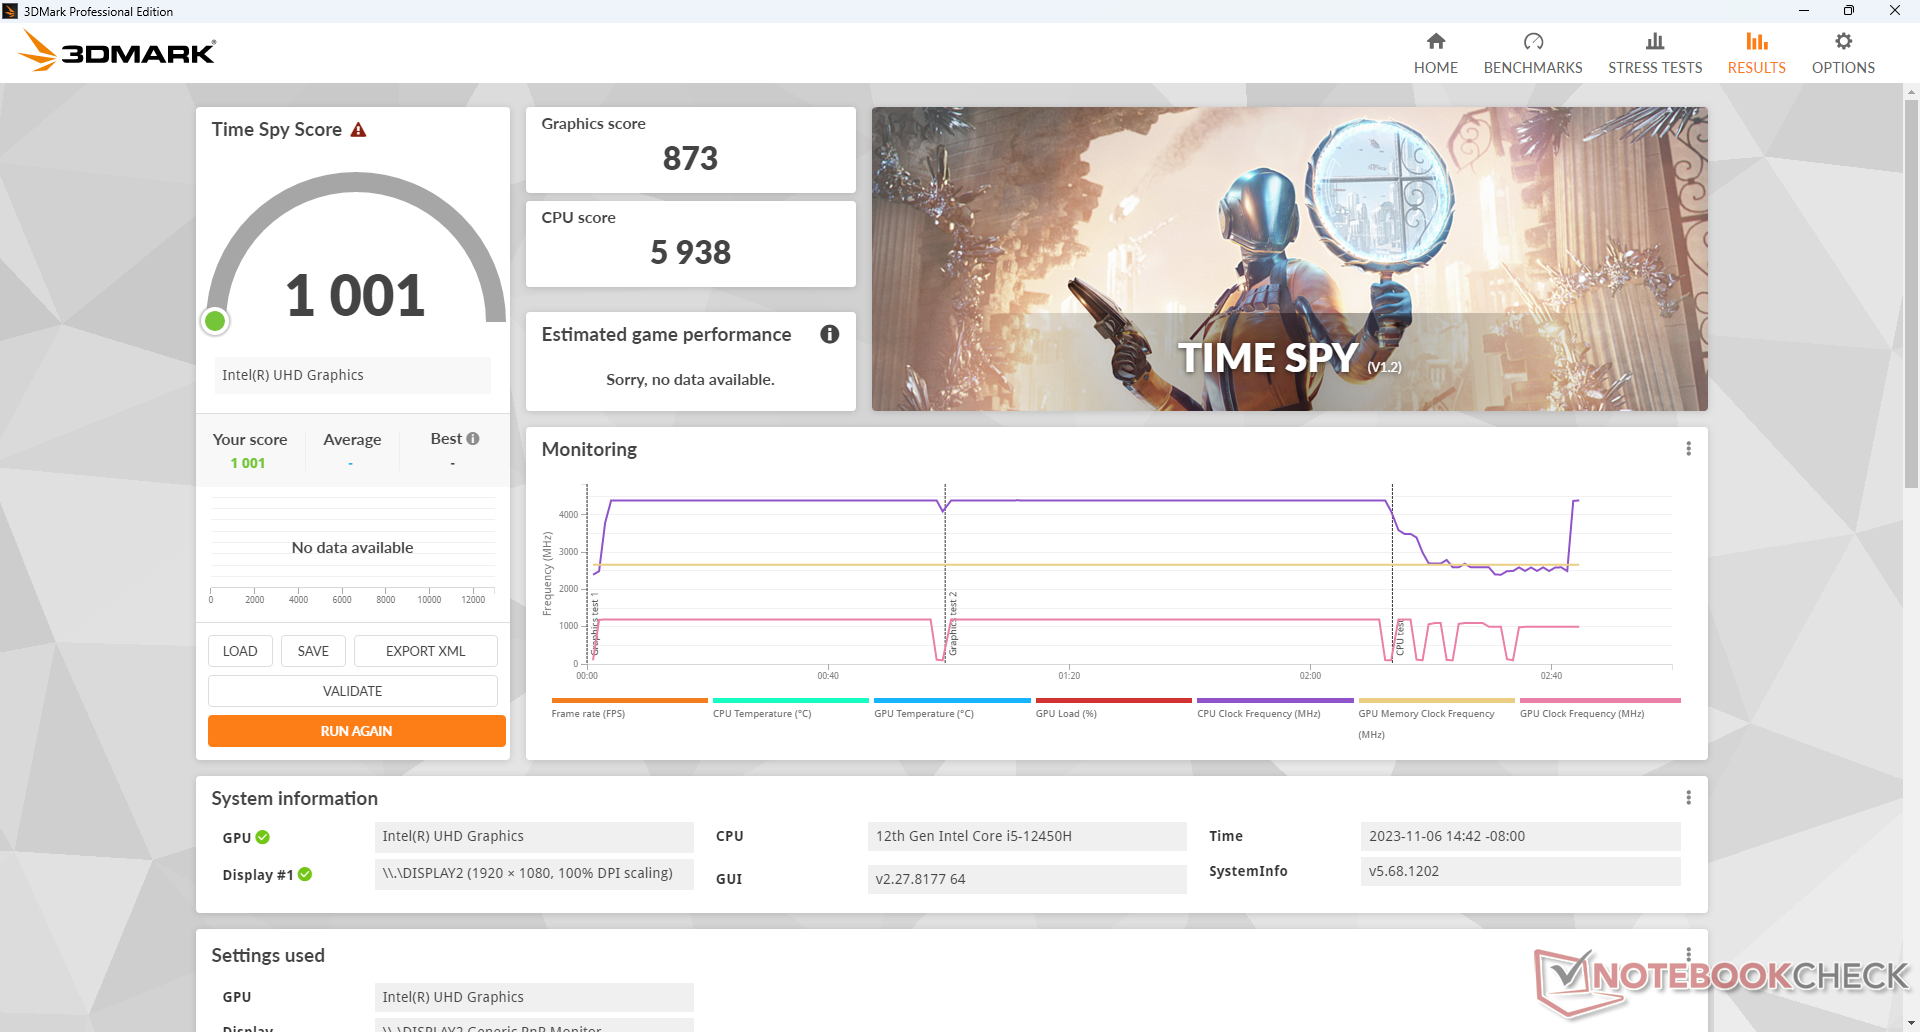
| 3DMark Time Spy Score | 1001 points | |
Aide | ||
| Blender | |
| v3.3 Classroom HIP/AMD | |
| Beelink SER5 | |
| Geekom AS 5 | |
| Geekom A5 | |
| Geekom AS 6, R9 6900HX | |
| v3.3 Classroom CPU | |
| Beelink Mini S12 Pro | |
| Moyenne Intel UHD Graphics Xe G4 48EUs (520 - 2408, n=8) | |
| BMAX B7 Power G7A2 | |
| GMK NucBox M3 | |
| Beelink SER5 | |
| Intel NUC 12 Pro Kit NUC12WSBi5 | |
| GMK NucBox K3 Pro | |
| Geekom A5 | |
| Intel NUC 13 Pro Kit NUC13ANK | |
| Geekom AS 5 | |
| Geekom AS 6, R9 6900HX | |
| Lenovo IdeaCentre Mini 01IRH8 | |
| Dell OptiPlex Micro | |
| Beelink SER7 | |
* ... Moindre est la valeur, meilleures sont les performances
| Final Fantasy XV Benchmark | |
| 1280x720 Lite Quality | |
| Beelink SER7 | |
| Geekom AS 6, R9 6900HX | |
| Geekom A5 | |
| Geekom AS 5 | |
| GMK NucBox K3 Pro | |
| Intel NUC 12 Pro Kit NUC12WSBi5 | |
| Lenovo IdeaCentre Mini 01IRH8 | |
| Beelink SER5 | |
| GMK NucBox M3 | |
| Dell OptiPlex Micro | |
| Moyenne Intel UHD Graphics Xe G4 48EUs (14.6 - 33.8, n=17) | |
| BMAX B7 Power G7A2 | |
| Beelink Mini S12 Pro | |
| 1920x1080 Standard Quality | |
| Beelink SER7 | |
| Geekom AS 6, R9 6900HX | |
| Geekom A5 | |
| Geekom AS 5 | |
| GMK NucBox K3 Pro | |
| Lenovo IdeaCentre Mini 01IRH8 | |
| Intel NUC 12 Pro Kit NUC12WSBi5 | |
| Beelink SER5 | |
| GMK NucBox M3 | |
| Dell OptiPlex Micro | |
| Moyenne Intel UHD Graphics Xe G4 48EUs (8.88 - 19, n=12) | |
| BMAX B7 Power G7A2 | |
| 1920x1080 High Quality | |
| Beelink SER7 | |
| Geekom AS 6, R9 6900HX | |
| Geekom AS 5 | |
| Geekom A5 | |
| GMK NucBox K3 Pro | |
| Lenovo IdeaCentre Mini 01IRH8 | |
| Beelink SER5 | |
| Moyenne Intel UHD Graphics Xe G4 48EUs (3.86 - 19, n=10) | |
| GMK NucBox M3 | |
| Dell OptiPlex Micro | |
| BMAX B7 Power G7A2 | |
| X-Plane 11.11 | |
| 1280x720 low (fps_test=1) | |
| Beelink SER7 | |
| Geekom AS 6, R9 6900HX | |
| Geekom AS 5 | |
| Geekom A5 | |
| Dell OptiPlex Micro | |
| Lenovo IdeaCentre Mini 01IRH8 | |
| GMK NucBox K3 Pro | |
| BMAX B7 Power G7A2 | |
| Beelink SER5 | |
| GMK NucBox M3 | |
| Moyenne Intel UHD Graphics Xe G4 48EUs (21.8 - 46.1, n=12) | |
| Beelink Mini S12 Pro | |
| 1920x1080 med (fps_test=2) | |
| Geekom AS 6, R9 6900HX | |
| Beelink SER7 | |
| Geekom AS 5 | |
| Geekom A5 | |
| GMK NucBox K3 Pro | |
| Lenovo IdeaCentre Mini 01IRH8 | |
| Dell OptiPlex Micro | |
| BMAX B7 Power G7A2 | |
| Beelink SER5 | |
| GMK NucBox M3 | |
| Moyenne Intel UHD Graphics Xe G4 48EUs (15.8 - 31.3, n=12) | |
| Beelink Mini S12 Pro | |
| 1920x1080 high (fps_test=3) | |
| Beelink SER7 | |
| Geekom AS 6, R9 6900HX | |
| Geekom AS 5 | |
| Geekom A5 | |
| Dell OptiPlex Micro | |
| Lenovo IdeaCentre Mini 01IRH8 | |
| BMAX B7 Power G7A2 | |
| GMK NucBox K3 Pro | |
| Beelink SER5 | |
| GMK NucBox M3 | |
| Moyenne Intel UHD Graphics Xe G4 48EUs (14.1 - 27.8, n=12) | |
| Beelink Mini S12 Pro | |
Witcher 3 FPS Chart
| Bas | Moyen | Élevé | Ultra | |
|---|---|---|---|---|
| GTA V (2015) | 106.7 | 90.7 | 15 | 6.32 |
| The Witcher 3 (2015) | 61.1 | 38.6 | 20.1 | 9.5 |
| Dota 2 Reborn (2015) | 37 | 36.2 | 35.4 | 34.7 |
| Final Fantasy XV Benchmark (2018) | 28.5 | 14.8 | 10.6 | |
| X-Plane 11.11 (2018) | 36.3 | 23.8 | 22 | |
| Far Cry 5 (2018) | 34 | 17 | 16 | 15 |
| Strange Brigade (2018) | 64.4 | 25.6 | 20 | 17.7 |
| Cyberpunk 2077 1.6 (2022) | 10.8 | |||
| Tiny Tina's Wonderlands (2022) | 17.1 | 13.3 | ||
| F1 22 (2022) | 27.9 | 24.8 | 17.5 | 13.5 |
Émissions
Bruit du système
Le bruit du ventilateur est probablement le pire aspect de la NucBox M3. Le ventilateur émet des pulsations fréquentes et bien plus souvent que sur la plupart des autres mini PC. Par exemple, le ventilateur monte brièvement à 39 dB(A) lors du lancement d'applications ou même sans raison apparente lors de la navigation sur le web, avant de revenir à la normale. Le passage à un processeur de la série U au lieu de la série H aurait sans doute permis de résoudre ce problème gênant.
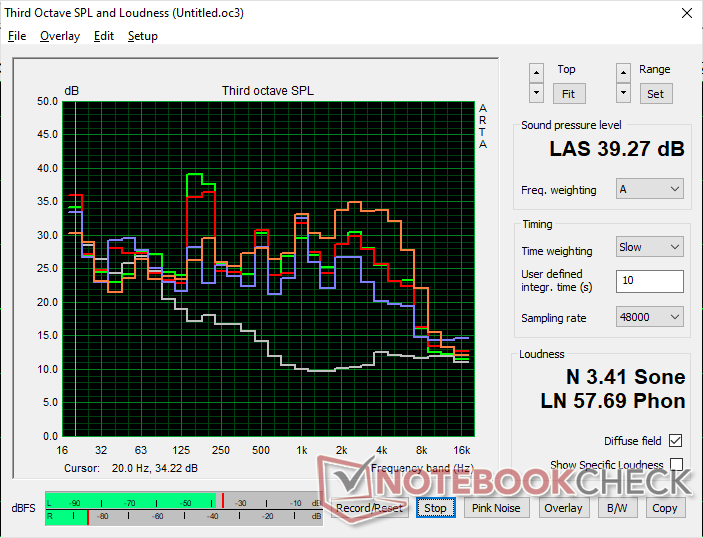
Degré de la nuisance sonore
| Au repos |
| 25.7 / 25.7 / 39.1 dB(A) |
| Fortement sollicité |
| 37 / 43.5 dB(A) |
 | ||
30 dB silencieux 40 dB(A) audible 50 dB(A) bruyant |
||
min: | ||
| GMK NucBox M3 UHD Graphics Xe G4 48EUs, i5-12450H, Lexar NM610 Pro NM610P001T-HNNNG | GMK NucBox K3 Pro UHD Graphics 64EUs, i7-12650H, Lexar NM610 Pro NM610P001T-HNNNG | Beelink SER5 Vega 6, R5 5560U, Crucial P3 Plus CT1000P3PSSD8 | Beelink Mini S12 Pro UHD Graphics 24EUs (Alder Lake-N), N100 | Geekom A5 Vega 8, R7 5800H, Lexar NM620 512GB | Intel NUC 13 Pro Kit NUC13ANK Iris Xe G7 96EUs, i7-1360P, Samsung PM9A1 MZVL2512HCJQ | |
|---|---|---|---|---|---|---|
| Noise | 7% | 20% | 12% | -6% | -8% | |
| arrêt / environnement * (dB) | 23.9 | 23.1 3% | 23.7 1% | 23.3 3% | 25 -5% | 29.8 -25% |
| Idle Minimum * (dB) | 25.7 | 25 3% | 23.9 7% | 26.3 -2% | 28.2 -10% | 30.2 -18% |
| Idle Average * (dB) | 25.7 | 25.5 1% | 23.9 7% | 26.3 -2% | 28.2 -10% | 31.1 -21% |
| Idle Maximum * (dB) | 39.1 | 25.5 35% | 23.9 39% | 26.3 33% | 28.2 28% | 31.9 18% |
| Load Average * (dB) | 37 | 39.9 -8% | 28 24% | 31.9 14% | 47.8 -29% | 40 -8% |
| Witcher 3 ultra * (dB) | 43.5 | 39.9 8% | 27.6 37% | 33 24% | ||
| Load Maximum * (dB) | 43.5 | 39.9 8% | 32.8 25% | 36.7 16% | 47.4 -9% | 40.5 7% |
* ... Moindre est la valeur, meilleures sont les performances
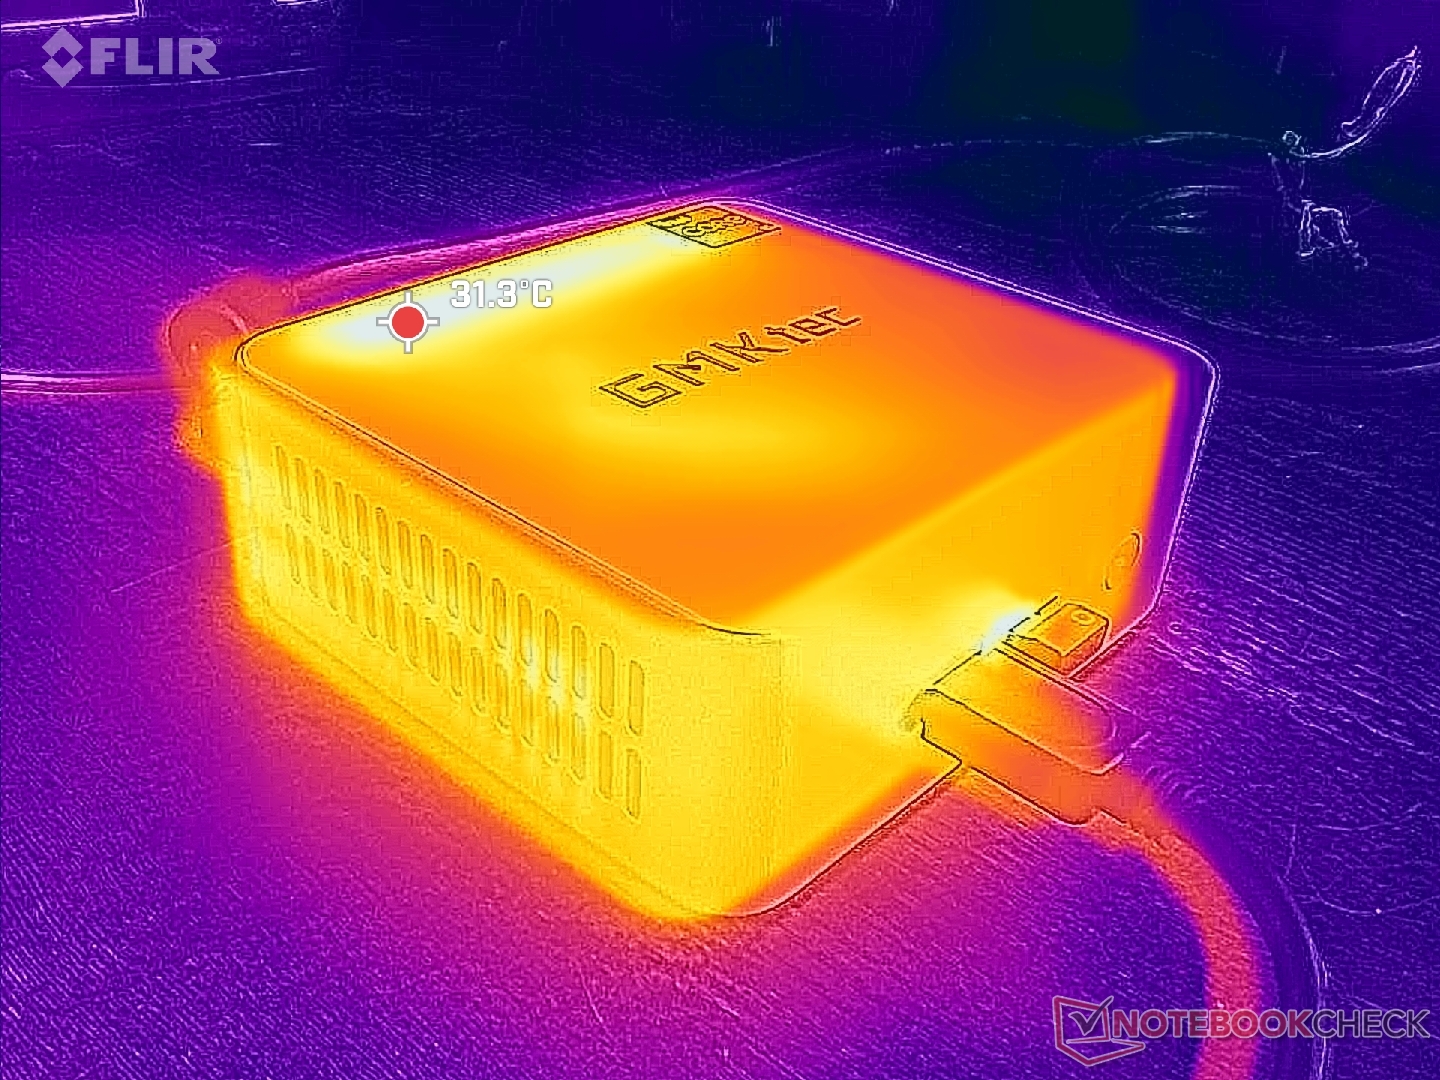
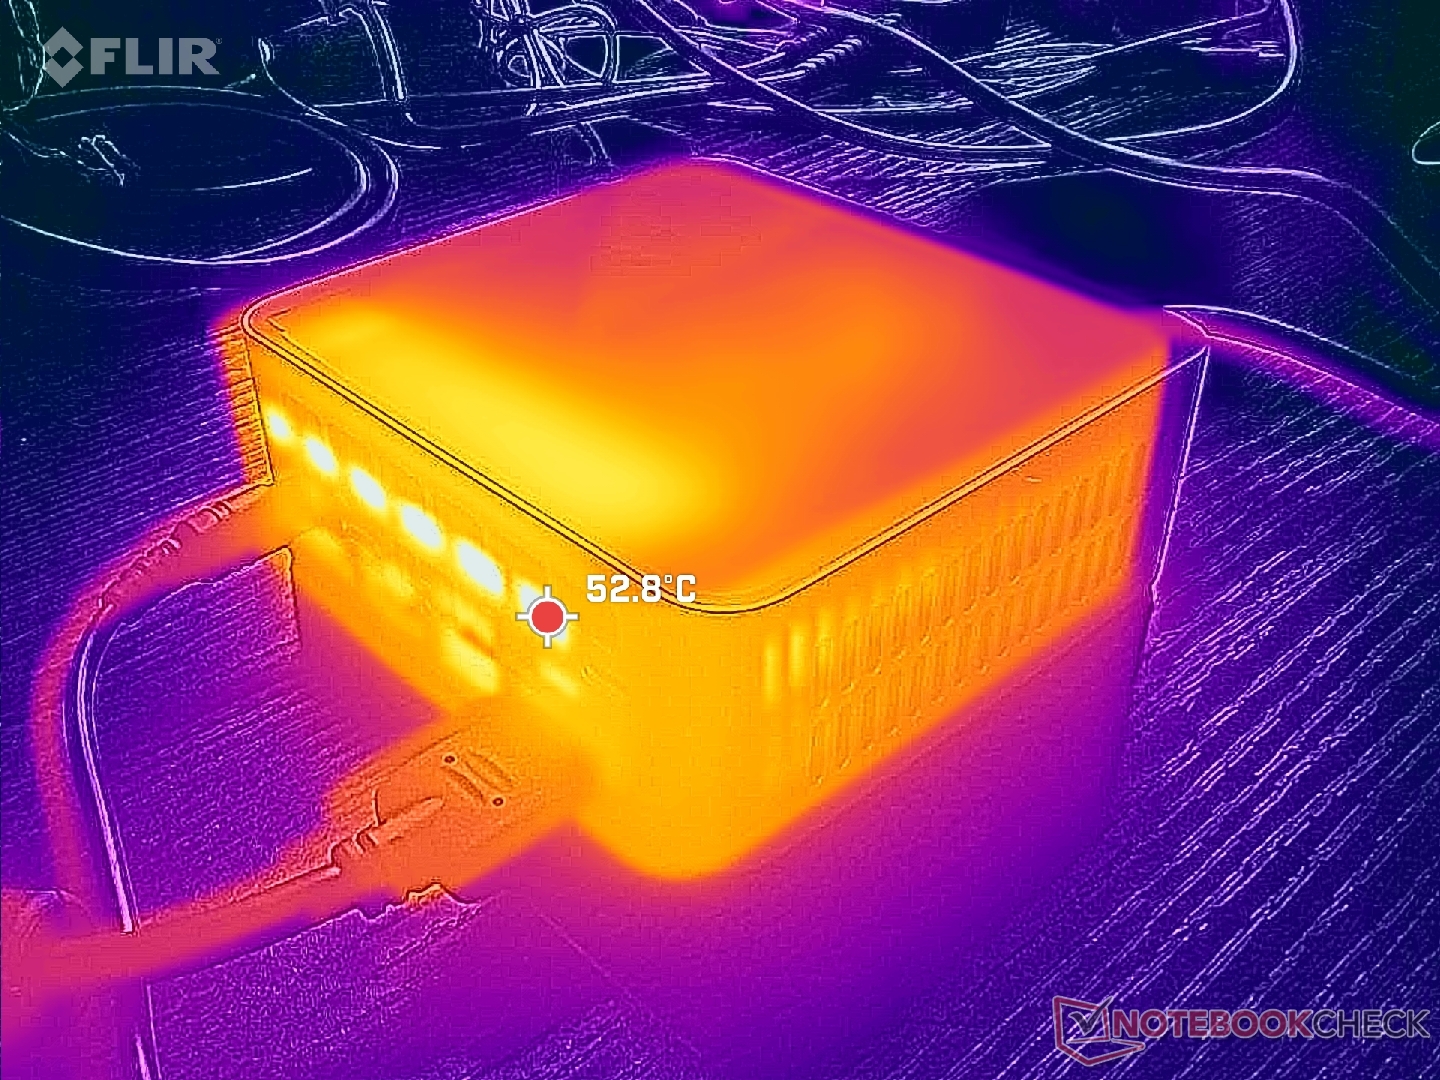
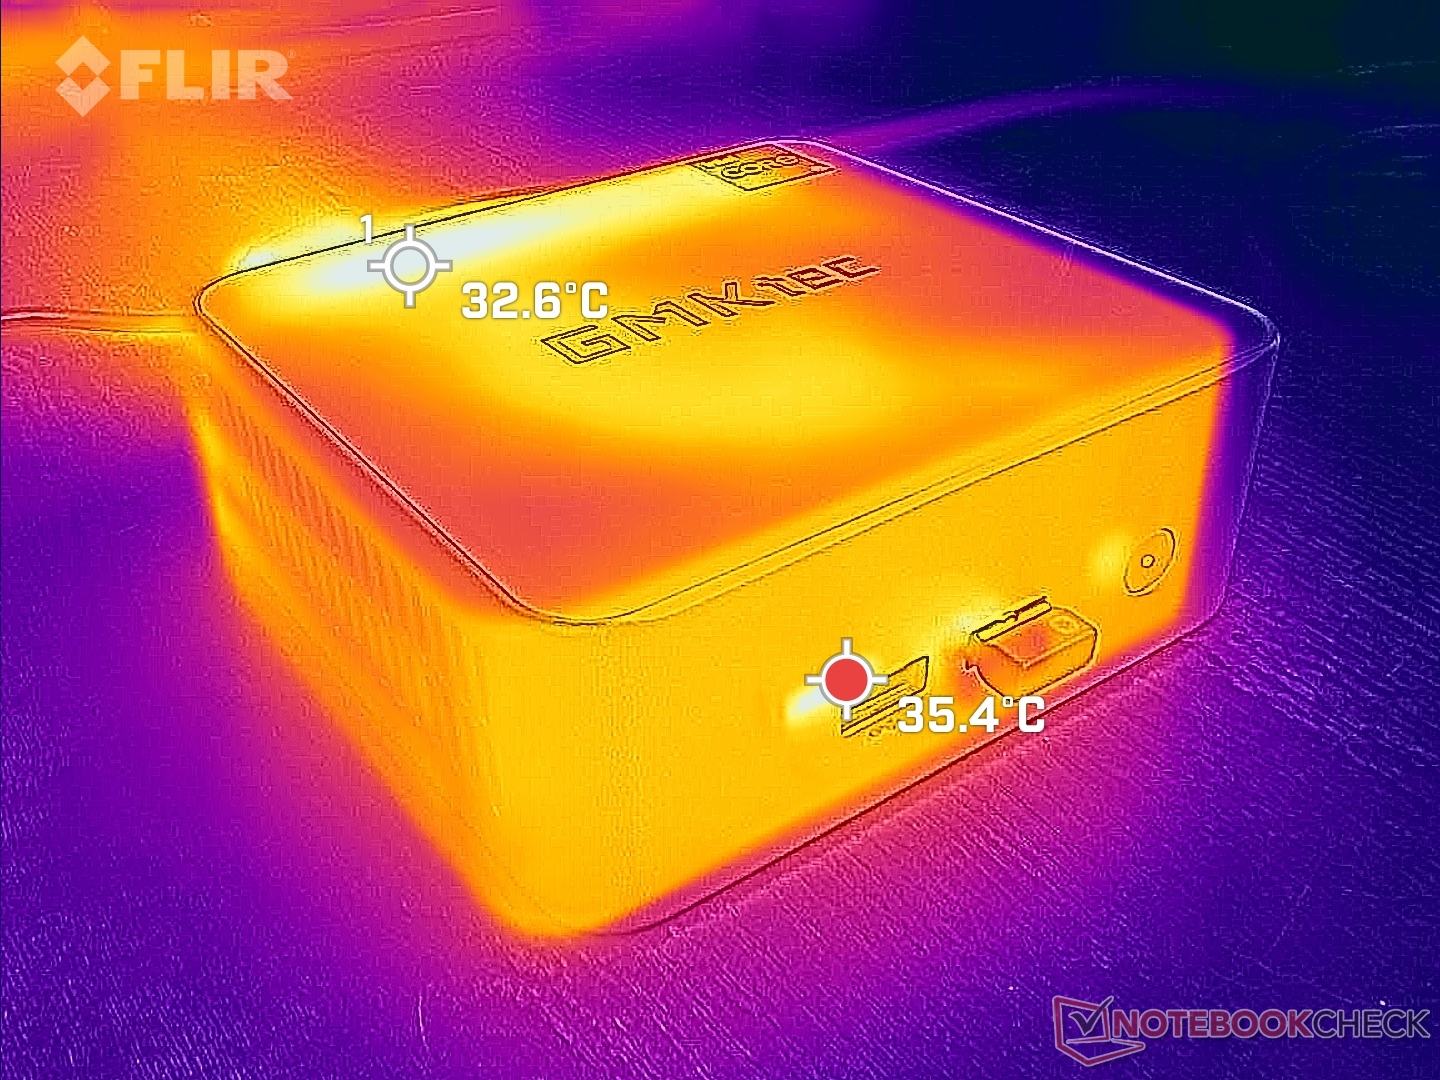
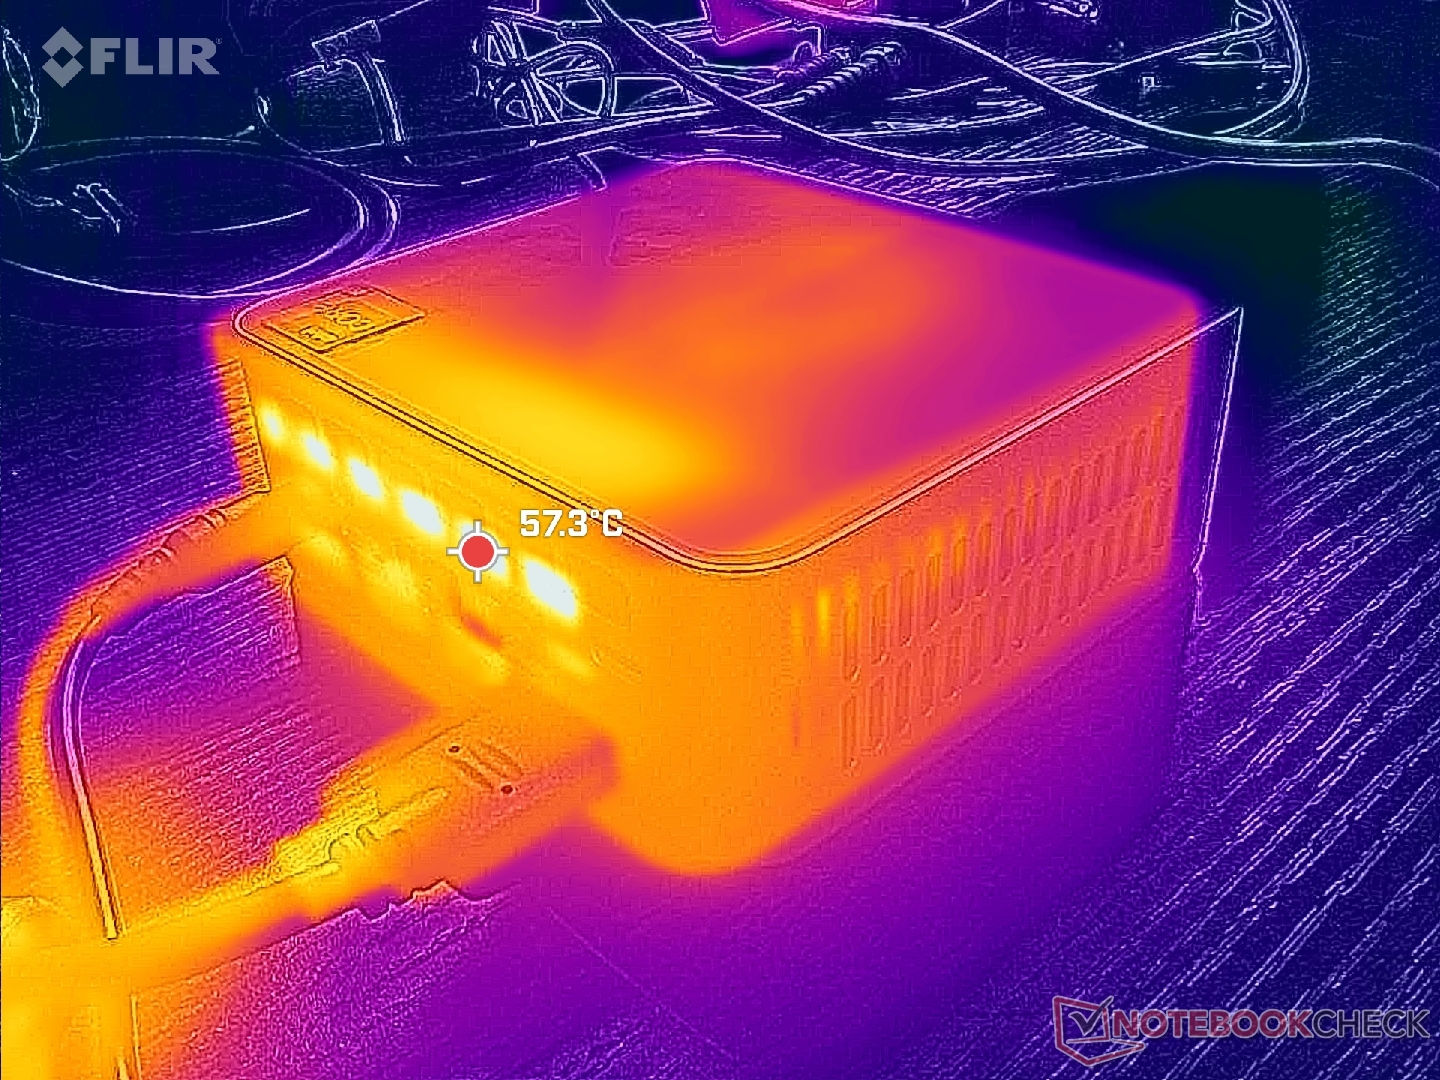
Température

L'air frais entre par les côtés de l'appareil et non par le haut, contrairement aux modèles récents Beelink SER5. Vous pouvez donc placer des objets en toute sécurité sur le dessus de l'appareil, à condition que les côtés et l'arrière disposent d'un espace suffisant pour la circulation de l'air.
Test de stress
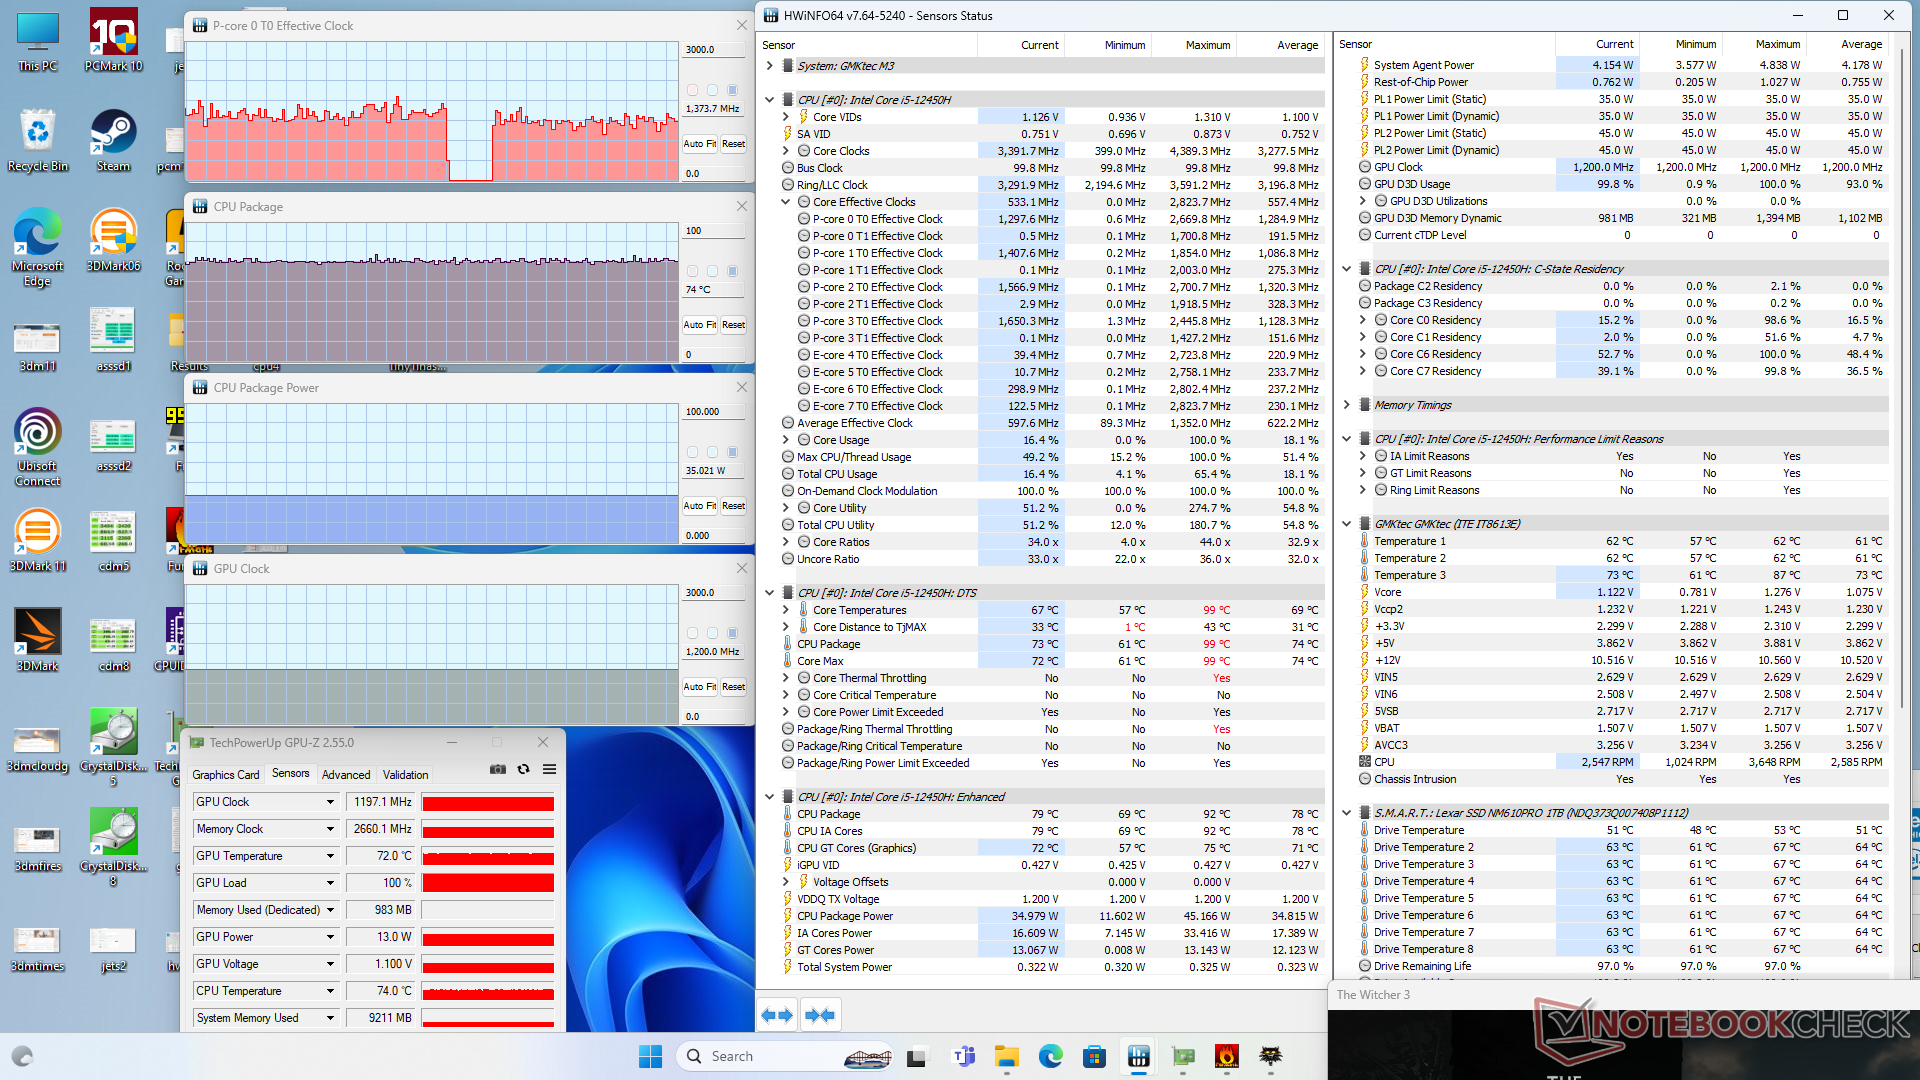
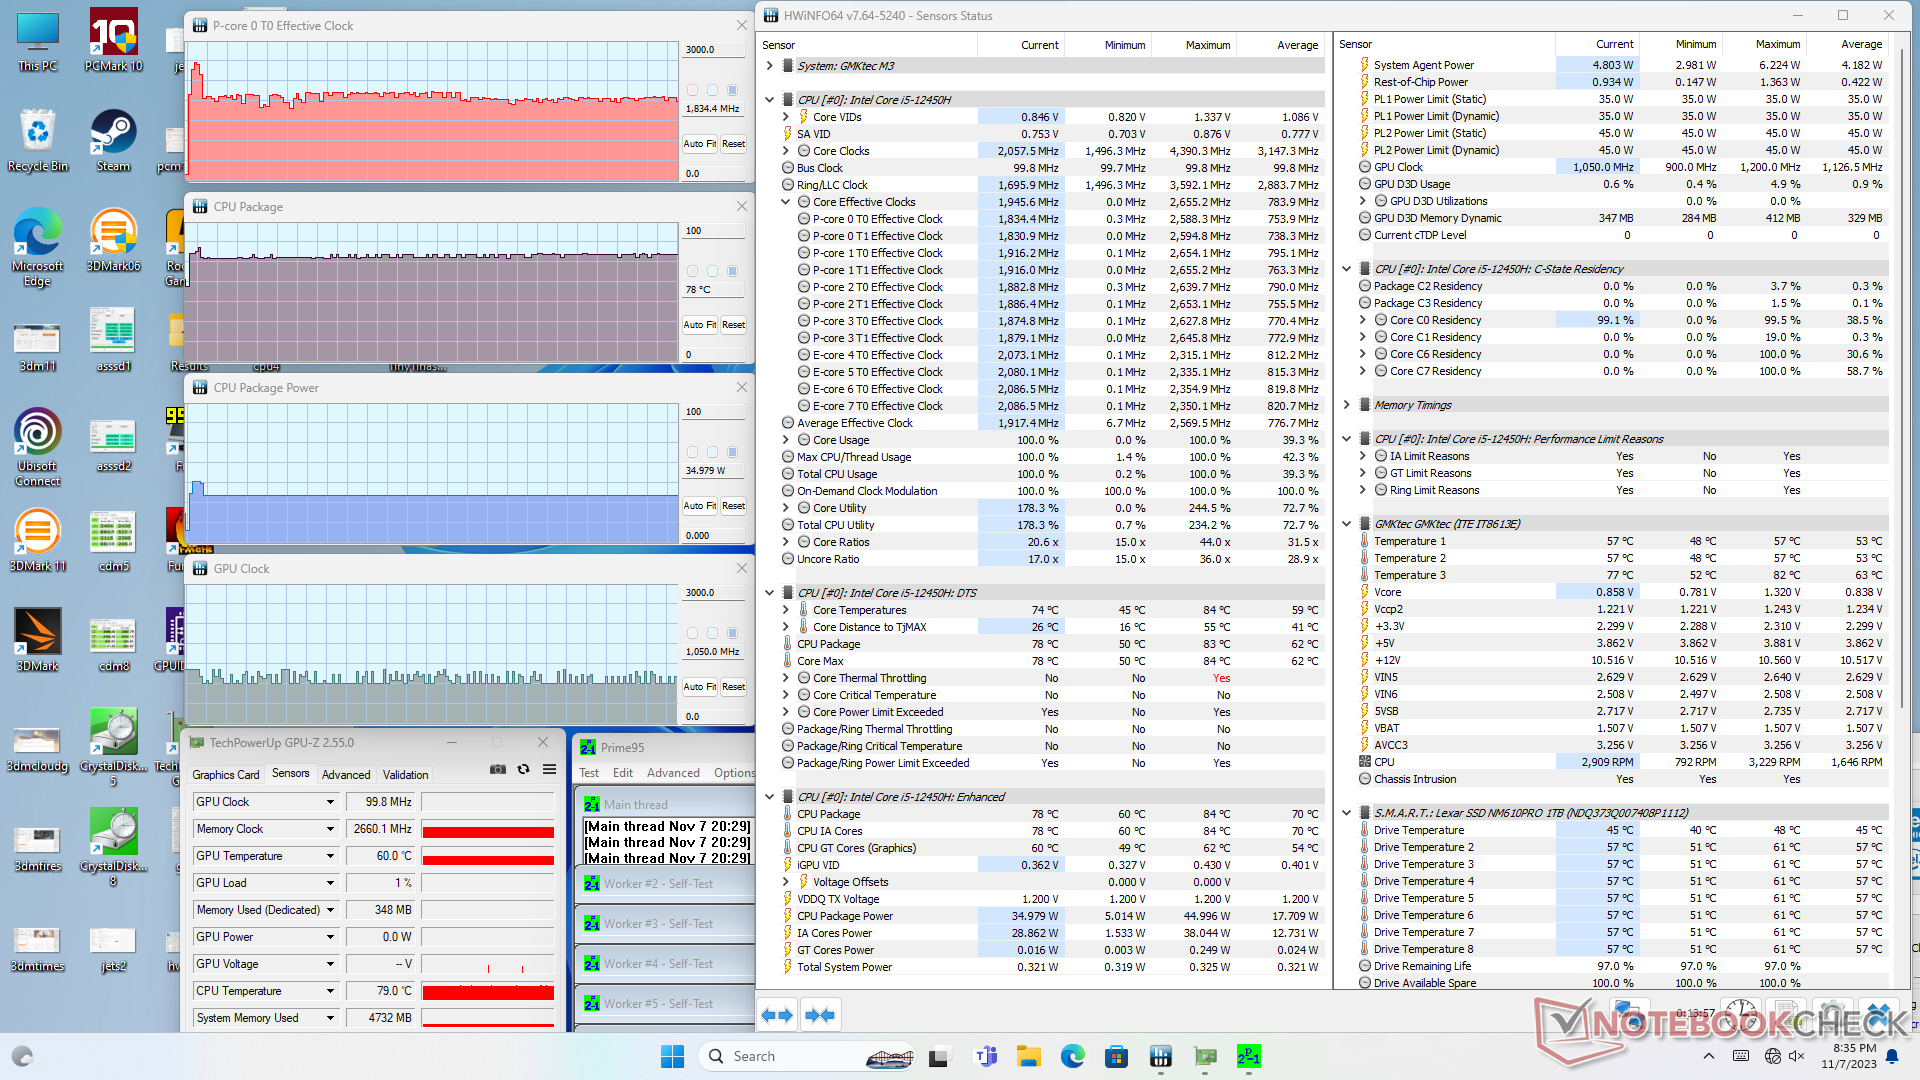
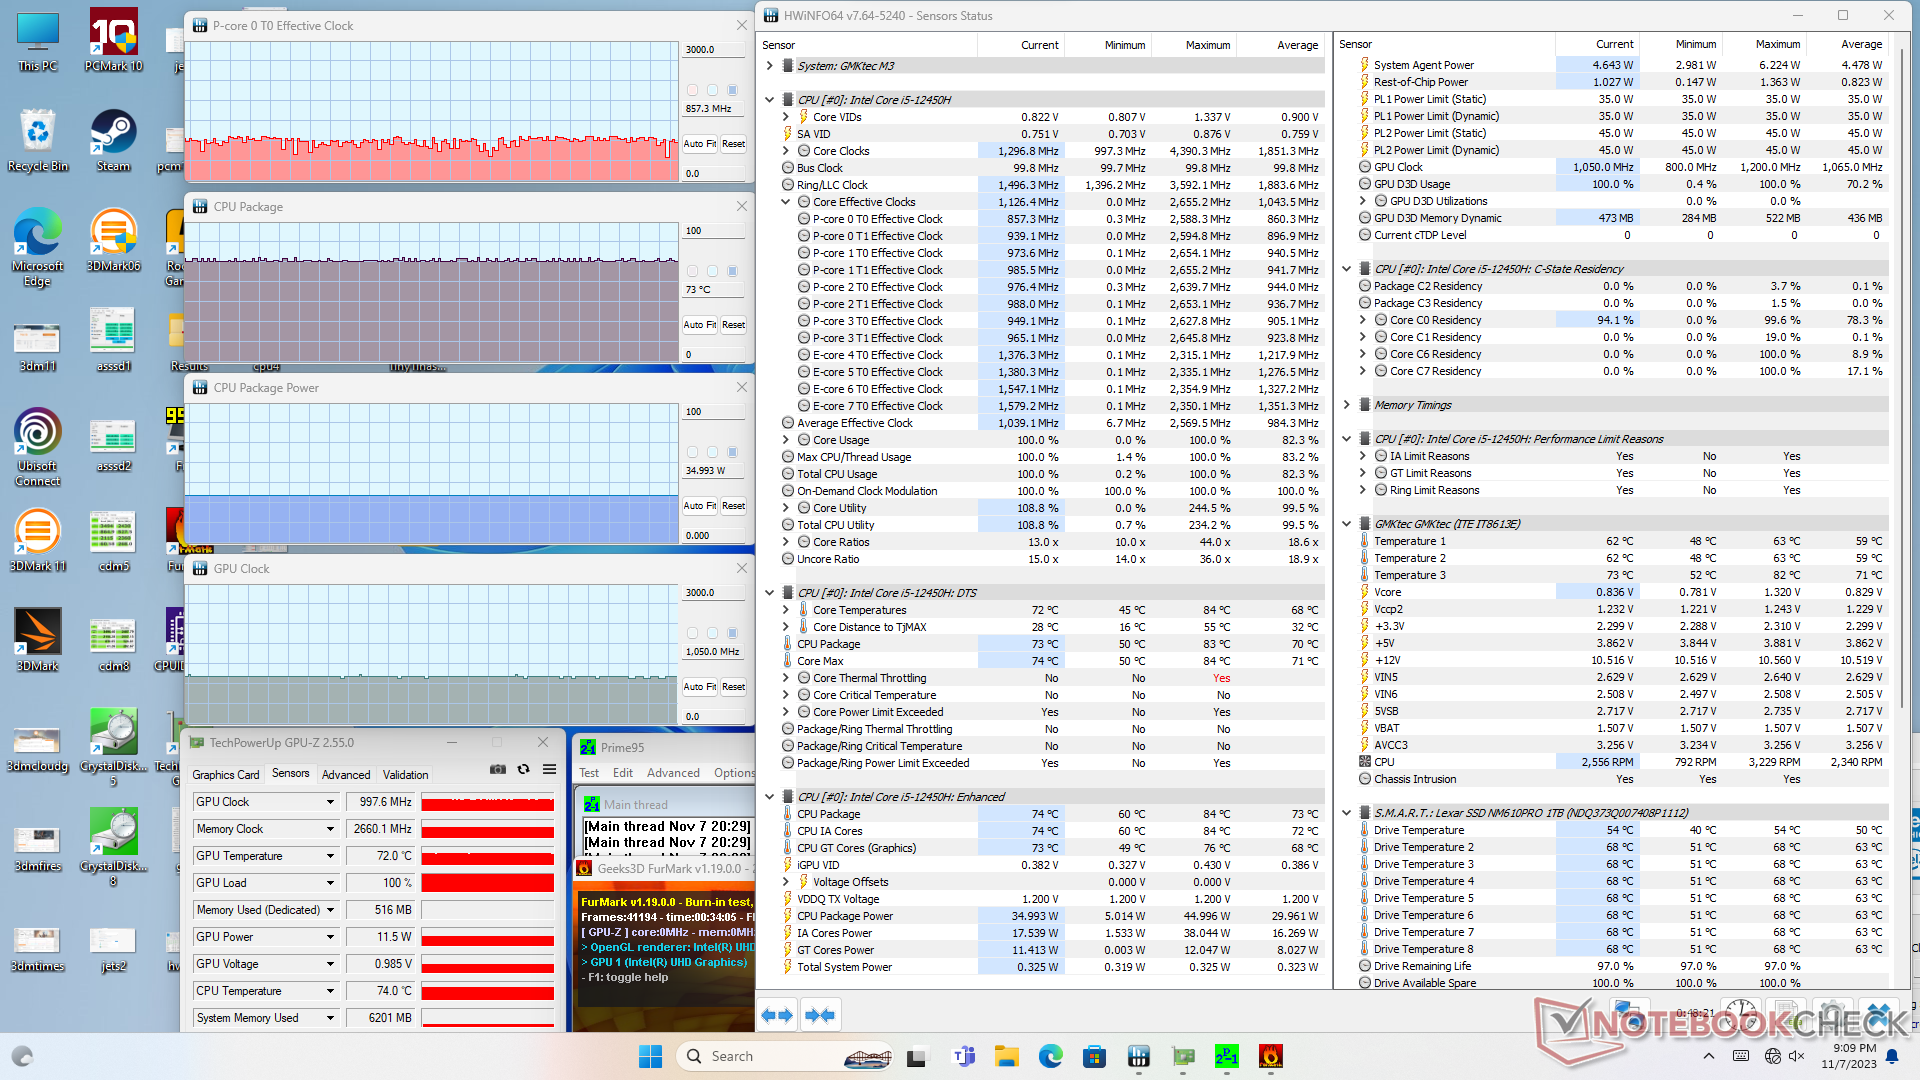
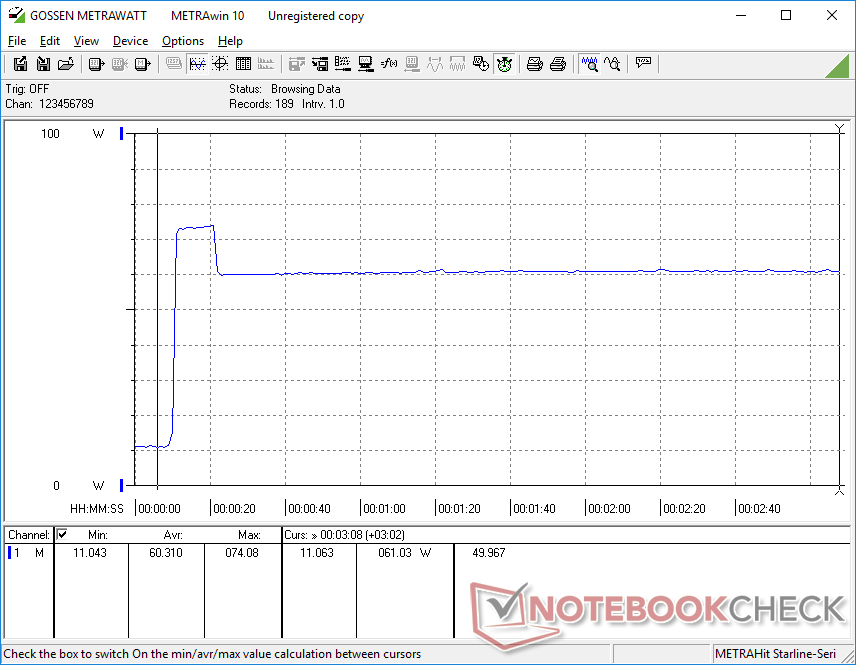
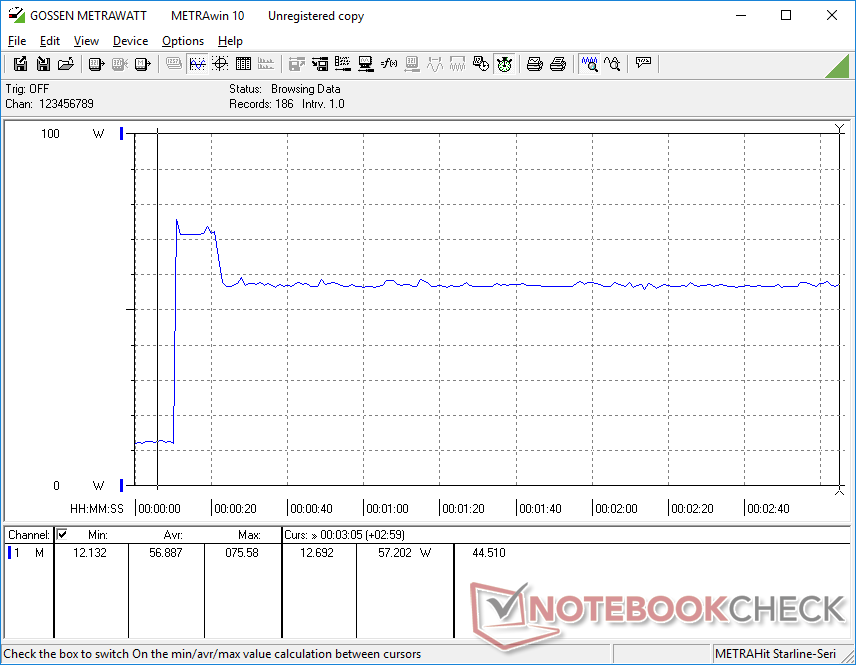
Lors de l'exécution de Prime95, le CPU est monté à 2,6 GHz et 45 W pendant seulement 10 secondes avant de redescendre et de se stabiliser à 1,8 GHz et 35 W afin de maintenir une température raisonnable de 75 C. Le potentiel maximum de Turbo Boost est donc de courte durée sur la NucBox M3. En répétant ce même test sur la NucBox K3 Pro avec le Core i7-12650H plus rapide, on obtiendrait à la fois des fréquences d'horloge plus élevées et des températures de cœur plus chaudes avoisinant les 84°C.
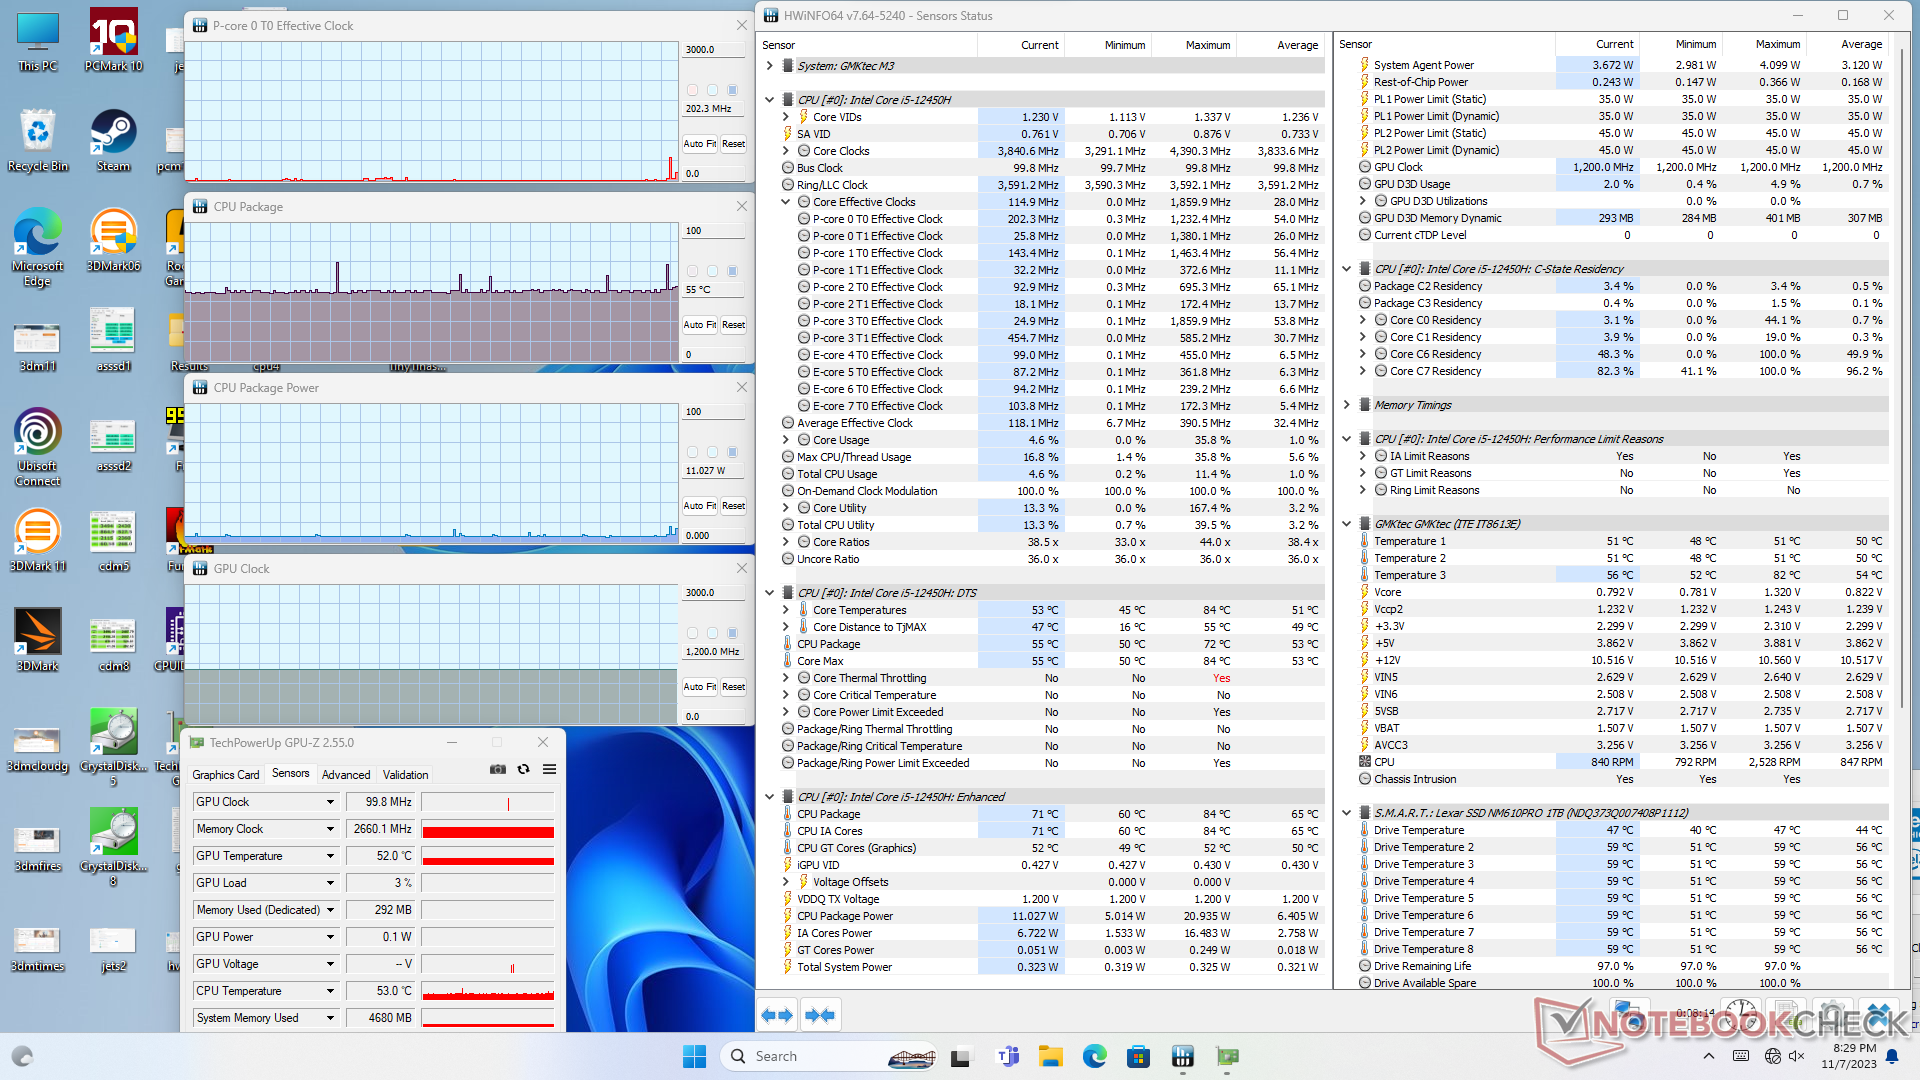
| Horloge du CPU (GHz) | Horloge du GPU (MHz) | Température moyenne du CPU (°C) | |
| Système au repos | -- | -- | 54 |
| Prime95 Stress | 1.8 | -- | 78 |
| Prime95 + FurMark Stress | 0.9 | 998 | 73 |
| Witcher 3 Stress | 1.4 | 1197 | 74 |
Gestion de l'énergie
Consommation électrique
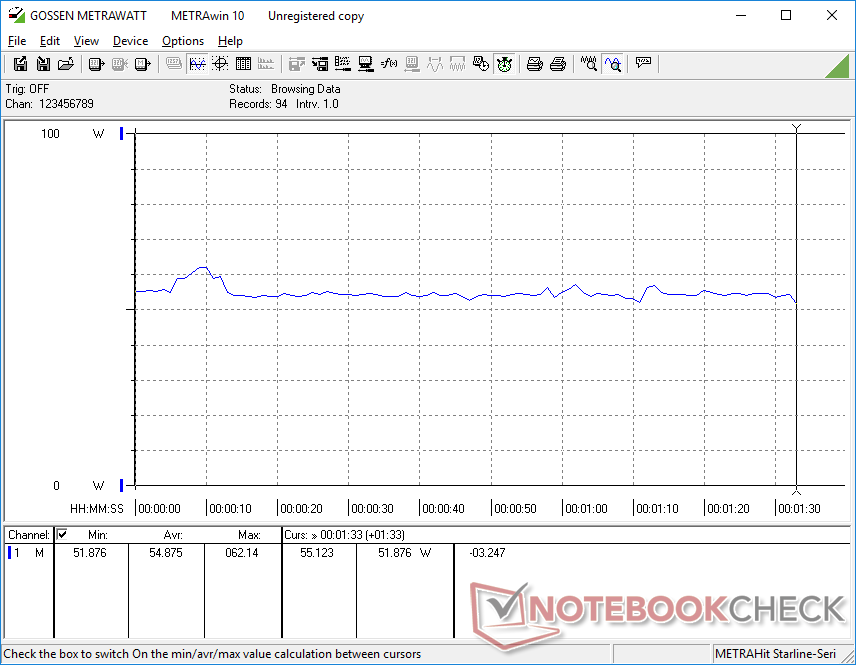
Ce n'est un secret pour personne que les processeurs Intel de la 12ème génération peuvent être très gourmands en énergie, en particulier ceux de la famille Core-H. Le Core i5-12450H ne déroge pas à la règle. Le Core i5-12450H n'est pas différent puisqu'il est presque aussi exigeant que le Ryzen 7 5800H dans l'étude du Geekom A5 même si le CPU AMD offre des performances multithread plus rapides. Pire encore, notre système termine CineBench R15 xT à peu près en même temps que le processeur Ryzen 5 5560U dans le Beelink SER5, mais il consomme près de 80 % d'énergie en plus.
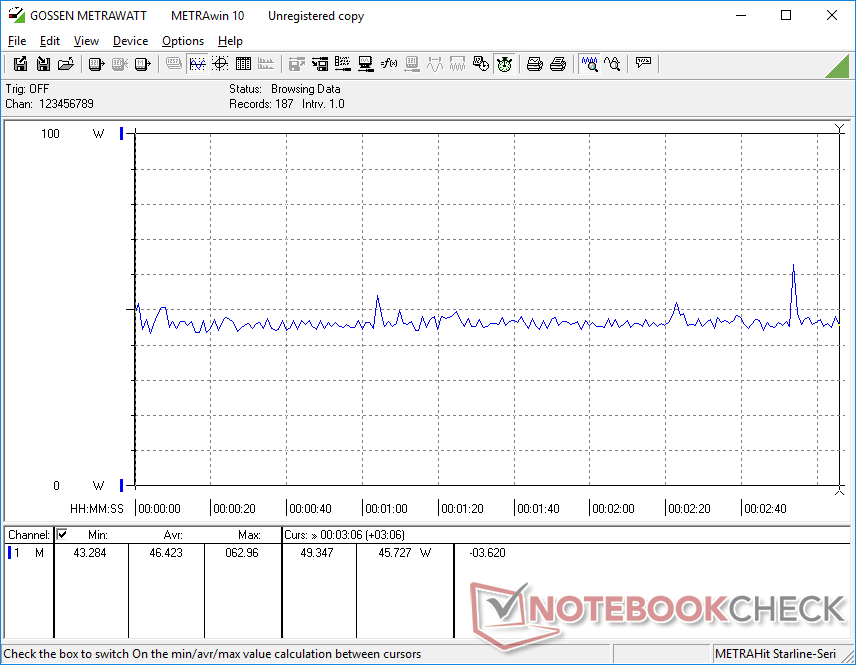
La consommation d'énergie lors de l'exécution d'applications gourmandes en GPU, comme les jeux, ne donne pas non plus une image favorable de notre système GMK. L'exécution de Witcher 3 en effet, l'exécution d'un jeu vidéo exige près de 60 % d'énergie en plus que sur le Beelink SER5, même si les performances graphiques sont similaires entre les deux modèles.
| Éteint/en veille | |
| Au repos | |
| Fortement sollicité |
|
Légende:
min: | |
| GMK NucBox M3 i5-12450H, UHD Graphics Xe G4 48EUs, Lexar NM610 Pro NM610P001T-HNNNG, , x, | GMK NucBox K3 Pro i7-12650H, UHD Graphics 64EUs, Lexar NM610 Pro NM610P001T-HNNNG, , x, | Beelink SER5 R5 5560U, Vega 6, Crucial P3 Plus CT1000P3PSSD8, , x, | Beelink Mini S12 Pro N100, UHD Graphics 24EUs (Alder Lake-N), , , x, | Geekom A5 R7 5800H, Vega 8, Lexar NM620 512GB, , x, | Intel NUC 13 Pro Kit NUC13ANK i7-1360P, Iris Xe G7 96EUs, Samsung PM9A1 MZVL2512HCJQ, , x, | |
|---|---|---|---|---|---|---|
| Power Consumption | 5% | 51% | 42% | 14% | 11% | |
| Idle Minimum * (Watt) | 10.6 | 7.1 33% | 4.4 58% | 8.3 22% | 6.9 35% | 5.1 52% |
| Idle Average * (Watt) | 11.9 | 10.1 15% | 5 58% | 8.8 26% | 7.9 34% | 5.8 51% |
| Idle Maximum * (Watt) | 12.5 | 18.6 -49% | 5.3 58% | 8.9 29% | 8.9 29% | 10.2 18% |
| Load Average * (Watt) | 54.9 | 45.3 17% | 29.8 46% | 20.1 63% | 60.8 -11% | 68.1 -24% |
| Witcher 3 ultra * (Watt) | 46.4 | 55.2 -19% | 28.8 38% | 21.5 54% | ||
| Load Maximum * (Watt) | 75.6 | 52.9 30% | 40.4 47% | 32.2 57% | 89.7 -19% | 108.3 -43% |
* ... Moindre est la valeur, meilleures sont les performances
Power Consumption Witcher 3 / Stresstest
Power Consumption external Monitor
Points positifs
Points négatifs
Verdict
L'une des principales raisons d'utiliser un mini PC basé sur un Core H plutôt qu'un Core U ou un Ryzen U est la rapidité des performances. Malheureusement, le Core i5-12450H n'offre pas suffisamment d'avantages par rapport aux CPU de la série U pour justifier l'augmentation de la consommation d'énergie et du bruit des ventilateurs. La NucBox M3 est nettement plus bruyante que les alternatives de la série U comme le Beelink SER5 sans offrir d'avantages significatifs en termes de performances multithread ou de performances graphiques. Ajoutez à cela que la plupart des mini PC de la série U sont moins chers que la NucBox M3 et il devient plus difficile de recommander ce modèle.
La NucBox M3 est plus bruyante et plus chaude que la plupart des autres mini PC équipés de processeurs de la série U, sans pour autant offrir de meilleures performances.
Les points forts de la NucBox M3 sont des composants internes facilement accessibles et de nombreuses options de ports. Cependant, ces points forts sont partagés par la plupart des mini PC et ne peuvent donc pas être considérés comme des avantages majeurs. Le modèle devrait faire plus pour mieux se distinguer de l'océan d'alternatives comme l'entretien sans outil, le support Thunderbolt, les multiples ports USB-C, l'adaptateur secteur intégré ou un bruit de ventilateur plus silencieux.
Prix et disponibilité
Amazon ne propose pas encore la NucBox M3. Les utilisateurs peuvent acheter directement auprès du fabricant au prix de 380 USD s'il est configuré avec 32 Go de RAM et 1 To de SSD.
GMK NucBox M3
- 11/09/2023 v7 (old)
Allen Ngo
Transparency
La sélection des appareils à examiner est effectuée par notre équipe éditoriale. L'échantillon de test a été prêté à l'auteur par le fabricant ou le détaillant pour les besoins de cet examen. Le prêteur n'a pas eu d'influence sur cette évaluation et le fabricant n'a pas reçu de copie de cette évaluation avant sa publication. Il n'y avait aucune obligation de publier cet article. En tant que média indépendant, Notebookcheck n'est pas soumis à l'autorité des fabricants, des détaillants ou des éditeurs.
Voici comment Notebookcheck teste
Chaque année, Notebookcheck examine de manière indépendante des centaines d'ordinateurs portables et de smartphones en utilisant des procédures standardisées afin de garantir que tous les résultats sont comparables. Nous avons continuellement développé nos méthodes de test depuis environ 20 ans et avons établi des normes industrielles dans le processus. Dans nos laboratoires de test, des équipements de mesure de haute qualité sont utilisés par des techniciens et des rédacteurs expérimentés. Ces tests impliquent un processus de validation en plusieurs étapes. Notre système d'évaluation complexe repose sur des centaines de mesures et de points de référence bien fondés, ce qui garantit l'objectivité.Price comparison

