Test du GMK NucBox K9 : mini PC Core Ultra 5 125H avec Arc 7
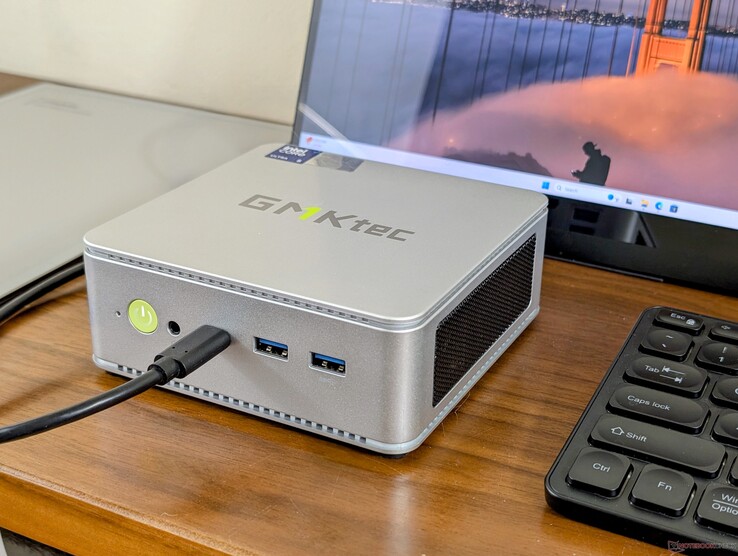
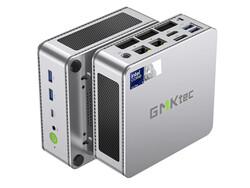
Après avoir passé en revue la GMK NucBox K6 il y a quelques mois, nous sommes maintenant prêts à nous attaquer à la NucBox K9 équipée du nouveau processeur Meteor Lake-H compatible avec l'IA. Mis à part le changement de processeur d'AMD à Intel, le châssis reste identique entre les deux modèles et nous vous recommandons donc de consulter notre article sur la NucBox K6 pour en savoir plus sur les caractéristiques physiques du système.
Notre unité de test est équipée d'un processeur Core Ultra 5 125H, d'un disque dur de 1 To et de 32 Go de RAM pour environ 860 $ ou 570 $ en cas de vente. Les utilisateurs peuvent configurer le système sans RAM ni SSD pour une configuration dépouillée, mais le CPU Core Ultra 5 est fixe dans toutes les options.
Les alternatives incluent d'autres mini PC performants comme le Beelink SER8, Bosgame M1ou le Geekom AX8 Pro.
Plus de commentaires sur GMKtec :
Comparaison avec les concurrents potentiels
Note | Version | Date | Modèle | Poids | Épaisseur | Taille | Résolution | Prix |
|---|---|---|---|---|---|---|---|---|
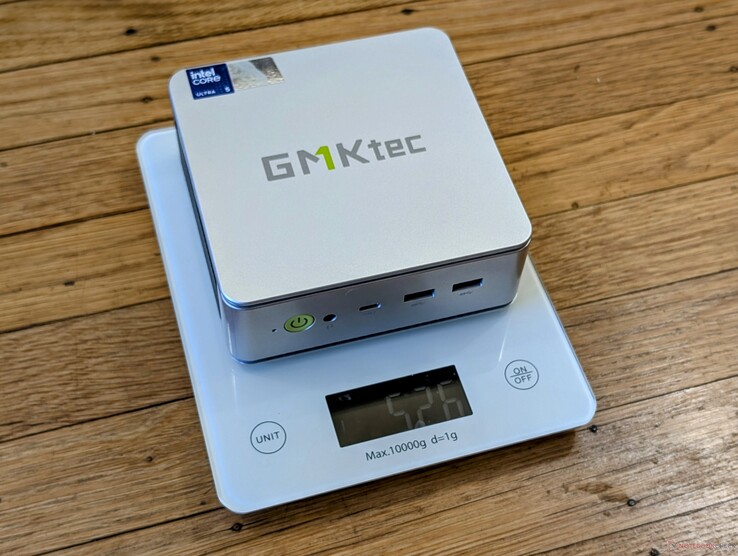
| 67.3 % | v8 | 09/24 | GMK NucBox K9 Ultra 5 125H, Arc 7-Core | 528 g | 47 mm | x | ||
| 83.6 % v7 (old) | v7 (old) | 04/24 | GMK NucBox K6 R7 7840HS, Radeon 780M | 514 g | 47 mm | x | ||
| 63.6 % | v8 | 07/24 | GMK NucBox M6 R5 6600H, Radeon 660M | 526 g | 48 mm | x | ||
| 74.9 % | v8 | 07/24 | Beelink SER8 R7 8845HS, Radeon 780M | 776 g | 44.7 mm | x | ||
v (old) | 12/22 | Beelink SEi12 Core i5-1235U i5-1235U, Iris Xe G7 80EUs | 465 g | 42 mm | x | |||
| 84.5 % v7 (old) | v7 (old) | 05/24 | BOSGAME M1 R7 7840HS, Radeon 780M | 766 g | 51 mm | x |
Top 10
» Le Top 10 des PC portables multimédia
» Le Top 10 des PC portables de jeu
» Le Top 10 des PC portables de jeu légers
» Le Top 10 des ordinateurs portables bureautiques
» Le Top 10 des PC portables bureautiques premium/professionnels
» Le Top 10 des Stations de travail mobiles
» Le Top 10 des Ultraportables
» Le Top 10 des Ultrabooks
» Le Top 10 des Convertibles
» Le Top 10 des Tablettes
» Le Top 10 des Tablettes Windows
» Le Top 10 des Smartphones
» Le Top 10 des PC Portables á moins de 300 euros
» Le Top 10 des PC Portables á moins de 500 euros
» Le Top 25 des meilleurs écrans d'ordinateurs
Note : Nous avons récemment mis à jour notre système d'évaluation et les résultats de la version 8 ne sont pas comparables à ceux de la version 7. De plus amples informations sont disponibles ici .
Cas - Un changement de couleur
Le châssis en plastique et en métal reste identique à celui de la NucBox K6 alimentée par AMD, mais dans une couleur gris mat/argent.
Connectivité - Ports USB plus rapides
Alors que les options et le positionnement des ports n'ont pas changé par rapport à la NucBox K6, les ports USB ont été améliorés. Tous les ports USB-A sont désormais des ports USB4 au lieu de 2.0 ou 3.2. Par ailleurs, le port USB-C prend officiellement en charge Thunderbolt 4.
Les adaptateurs secteur USB-C tiers peuvent alimenter le système à la place de l'adaptateur secteur en barillet s'ils peuvent fournir suffisamment de puissance. Les performances et la compatibilité avec tous les adaptateurs USB-C ne sont toutefois pas garanties.
Communication
Un Intel AX201 est livré en standard à la place du MediaTek RZ616 pour la connectivité Wi-Fi 6 et Bluetooth 5.2. Le Wi-Fi 6E et le Wi-Fi 7 ne sont pas inclus pour des raisons d'économie.
| Networking | |
| iperf3 transmit AXE11000 | |
| GMK NucBox M6 | |
| Beelink SEi12 Core i5-1235U | |
| BOSGAME M1 | |
| GMK NucBox K9 | |
| Beelink SER8 | |
| GMK NucBox K6 | |
| iperf3 receive AXE11000 | |
| BOSGAME M1 | |
| GMK NucBox M6 | |
| Beelink SEi12 Core i5-1235U | |
| GMK NucBox K6 | |
| Beelink SER8 | |
| GMK NucBox K9 | |
| iperf3 transmit AXE11000 6GHz | |
| BOSGAME M1 | |
| GMK NucBox K6 | |
| GMK NucBox M6 | |
| iperf3 receive AXE11000 6GHz | |
| BOSGAME M1 | |
| GMK NucBox K6 | |
| GMK NucBox M6 | |
Maintenance
Les composants évolutifs sont identiques à ceux de la NucBox K6.
Durabilité
Le fabricant annonce un système de "fabrication durable" sans entrer dans les détails de ce que cela implique. L'emballage lui-même est principalement en carton avec un peu d'emballage en plastique.
Accessoires et garantie
L'emballage comprend un support de montage VESA et un câble HDMI, ainsi que les documents habituels et l'adaptateur secteur. Une garantie constructeur d'un an s'applique si vous l'achetez aux États-Unis.
Performance - Norme du lac Meteor
Conditions d'essai
Nous avons réglé Windows sur le mode Performance avant d'effectuer les tests ci-dessous.
Processeur
Les performances du processeur sont celles que nous attendons par rapport à d'autres PC de notre base de données ayant les mêmes caractéristiques Core Ultra 5 125H de notre base de données. Le processeur Meteor Lake est au coude à coude avec le processeur de dernière génération Core i9-13900H ce qui semble excellent sur le papier jusqu'à ce que vous vous rappeliez que la NucBox K6 alimentée par AMD avec l'ancien processeur Ryzen 7 7840HS est encore plus rapide que les deux solutions d'Intel. Ainsi, l'absence d'une option Core Ultra 7 est étrange si l'on considère que la NucBox K9 est la plus récente.
Bien qu'une IA intégrée soit incluse, elle n'est pas compatible avec Co-Pilot+.
Cinebench R15 Multi Loop
Cinebench R23: Multi Core | Single Core
Cinebench R20: CPU (Multi Core) | CPU (Single Core)
Cinebench R15: CPU Multi 64Bit | CPU Single 64Bit
Blender: v2.79 BMW27 CPU
7-Zip 18.03: 7z b 4 | 7z b 4 -mmt1
Geekbench 6.5: Multi-Core | Single-Core
Geekbench 5.5: Multi-Core | Single-Core
HWBOT x265 Benchmark v2.2: 4k Preset
LibreOffice : 20 Documents To PDF
R Benchmark 2.5: Overall mean
* ... Moindre est la valeur, meilleures sont les performances
AIDA64: FP32 Ray-Trace | FPU Julia | CPU SHA3 | CPU Queen | FPU SinJulia | FPU Mandel | CPU AES | CPU ZLib | FP64 Ray-Trace | CPU PhotoWorxx
| Performance rating | |
| Beelink SER8 | |
| BOSGAME M1 | |
| GMK NucBox K6 | |
| GMK NucBox M6 | |
| GMK NucBox K9 | |
| Moyenne Intel Core Ultra 5 125H | |
| Beelink SEi12 Core i5-1235U | |
| AIDA64 / FP32 Ray-Trace | |
| Beelink SER8 | |
| BOSGAME M1 | |
| GMK NucBox K6 | |
| GMK NucBox M6 | |
| Moyenne Intel Core Ultra 5 125H (8430 - 13639, n=7) | |
| GMK NucBox K9 | |
| Beelink SEi12 Core i5-1235U | |
| AIDA64 / FPU Julia | |
| Beelink SER8 | |
| BOSGAME M1 | |
| GMK NucBox K6 | |
| GMK NucBox M6 | |
| GMK NucBox K9 | |
| Moyenne Intel Core Ultra 5 125H (43652 - 70880, n=7) | |
| Beelink SEi12 Core i5-1235U | |
| AIDA64 / CPU SHA3 | |
| Beelink SER8 | |
| BOSGAME M1 | |
| GMK NucBox K6 | |
| GMK NucBox K9 | |
| Moyenne Intel Core Ultra 5 125H (2047 - 3404, n=7) | |
| GMK NucBox M6 | |
| Beelink SEi12 Core i5-1235U | |
| AIDA64 / CPU Queen | |
| BOSGAME M1 | |
| Beelink SER8 | |
| GMK NucBox K6 | |
| GMK NucBox M6 | |
| GMK NucBox K9 | |
| Moyenne Intel Core Ultra 5 125H (76983 - 79986, n=7) | |
| Beelink SEi12 Core i5-1235U | |
| AIDA64 / FPU SinJulia | |
| Beelink SER8 | |
| BOSGAME M1 | |
| GMK NucBox K6 | |
| GMK NucBox M6 | |
| GMK NucBox K9 | |
| Moyenne Intel Core Ultra 5 125H (6588 - 7851, n=7) | |
| Beelink SEi12 Core i5-1235U | |
| AIDA64 / FPU Mandel | |
| Beelink SER8 | |
| BOSGAME M1 | |
| GMK NucBox K6 | |
| GMK NucBox M6 | |
| Moyenne Intel Core Ultra 5 125H (21210 - 35321, n=7) | |
| GMK NucBox K9 | |
| Beelink SEi12 Core i5-1235U | |
| AIDA64 / CPU AES | |
| Beelink SER8 | |
| BOSGAME M1 | |
| GMK NucBox K6 | |
| GMK NucBox K9 | |
| GMK NucBox M6 | |
| Beelink SEi12 Core i5-1235U | |
| Moyenne Intel Core Ultra 5 125H (45524 - 108402, n=7) | |
| AIDA64 / CPU ZLib | |
| Beelink SER8 | |
| BOSGAME M1 | |
| GMK NucBox K6 | |
| GMK NucBox K9 | |
| Moyenne Intel Core Ultra 5 125H (594 - 994, n=7) | |
| GMK NucBox M6 | |
| Beelink SEi12 Core i5-1235U | |
| AIDA64 / FP64 Ray-Trace | |
| Beelink SER8 | |
| BOSGAME M1 | |
| GMK NucBox K6 | |
| GMK NucBox M6 | |
| Moyenne Intel Core Ultra 5 125H (4345 - 7221, n=7) | |
| GMK NucBox K9 | |
| Beelink SEi12 Core i5-1235U | |
| AIDA64 / CPU PhotoWorxx | |
| GMK NucBox K9 | |
| Moyenne Intel Core Ultra 5 125H (23499 - 49844, n=7) | |
| BOSGAME M1 | |
| GMK NucBox K6 | |
| Beelink SER8 | |
| GMK NucBox M6 | |
| Beelink SEi12 Core i5-1235U | |
Test de stress
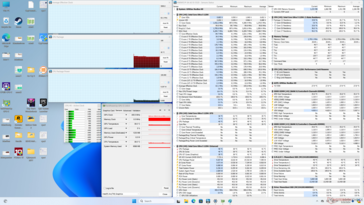
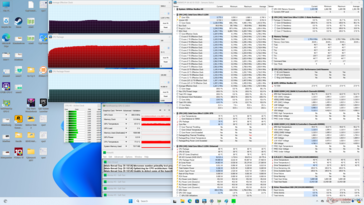
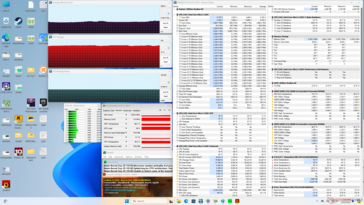
Lors du lancement du test Prime95, le CPU atteignait 2,3 GHz et 45 W et maintenait ces valeurs pendant toute la durée du test. La température du cœur se stabilise à 80°C, ce qui est légèrement plus froid que ce que nous avons enregistré sur la NucBox K6, plus rapide et équipée d'AMD.
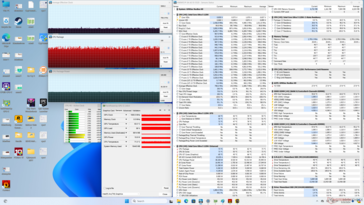
Lors de l'exécution de Cyberpunk 2077 pour représenter le stress de jeu, la température du cœur se stabilise à 72°C, ce qui est similaire à la NucBox K6, même si la NucBox K9 exécute les jeux plus lentement, comme le montre notre section sur les performances de jeu ci-dessous.
| Horloge moyenne du CPU (GHz) | Horloge du GPU (MHz) | Température moyenne du CPU (°C) | |
| Système au repos | -- | -- | 40 |
| Prime95 Stress | 2.3 | -- | 79 |
| Prime95 + FurMark Stress | 2.2 | 1150 | 79 |
| Cyberpunk 2077 Stress | 0.9 | 1600 | 72 |
Performance du système
CrossMark: Overall | Productivity | Creativity | Responsiveness
WebXPRT 3: Overall
WebXPRT 4: Overall
Mozilla Kraken 1.1: Total
| PCMark 10 / Score | |
| Beelink SER8 | |
| GMK NucBox K6 | |
| BOSGAME M1 | |
| GMK NucBox K9 | |
| Moyenne Intel Core Ultra 5 125H, Intel Arc 7-Core iGPU (6024 - 6463, n=7) | |
| GMK NucBox M6 | |
| Beelink SEi12 Core i5-1235U | |
| PCMark 10 / Essentials | |
| Beelink SER8 | |
| GMK NucBox K6 | |
| BOSGAME M1 | |
| Beelink SEi12 Core i5-1235U | |
| GMK NucBox K9 | |
| GMK NucBox M6 | |
| Moyenne Intel Core Ultra 5 125H, Intel Arc 7-Core iGPU (9427 - 10697, n=7) | |
| PCMark 10 / Productivity | |
| GMK NucBox K6 | |
| Beelink SER8 | |
| BOSGAME M1 | |
| GMK NucBox M6 | |
| Moyenne Intel Core Ultra 5 125H, Intel Arc 7-Core iGPU (7042 - 8000, n=7) | |
| GMK NucBox K9 | |
| Beelink SEi12 Core i5-1235U | |
| PCMark 10 / Digital Content Creation | |
| Beelink SER8 | |
| BOSGAME M1 | |
| GMK NucBox K6 | |
| GMK NucBox K9 | |
| Moyenne Intel Core Ultra 5 125H, Intel Arc 7-Core iGPU (8149 - 9506, n=7) | |
| GMK NucBox M6 | |
| Beelink SEi12 Core i5-1235U | |
| CrossMark / Overall | |
| BOSGAME M1 | |
| Beelink SER8 | |
| GMK NucBox K6 | |
| Beelink SEi12 Core i5-1235U | |
| GMK NucBox K9 | |
| Moyenne Intel Core Ultra 5 125H, Intel Arc 7-Core iGPU (1480 - 1633, n=6) | |
| GMK NucBox M6 | |
| CrossMark / Productivity | |
| BOSGAME M1 | |
| GMK NucBox K6 | |
| Beelink SER8 | |
| Beelink SEi12 Core i5-1235U | |
| GMK NucBox K9 | |
| GMK NucBox M6 | |
| Moyenne Intel Core Ultra 5 125H, Intel Arc 7-Core iGPU (1432 - 1594, n=6) | |
| CrossMark / Creativity | |
| BOSGAME M1 | |
| Beelink SER8 | |
| GMK NucBox K6 | |
| GMK NucBox K9 | |
| Moyenne Intel Core Ultra 5 125H, Intel Arc 7-Core iGPU (1520 - 1765, n=6) | |
| GMK NucBox M6 | |
| Beelink SEi12 Core i5-1235U | |
| CrossMark / Responsiveness | |
| Beelink SEi12 Core i5-1235U | |
| BOSGAME M1 | |
| Beelink SER8 | |
| GMK NucBox K6 | |
| GMK NucBox K9 | |
| GMK NucBox M6 | |
| Moyenne Intel Core Ultra 5 125H, Intel Arc 7-Core iGPU (1171 - 1520, n=6) | |
| WebXPRT 3 / Overall | |
| Beelink SER8 | |
| GMK NucBox K6 | |
| BOSGAME M1 | |
| Beelink SEi12 Core i5-1235U | |
| GMK NucBox K9 | |
| Moyenne Intel Core Ultra 5 125H, Intel Arc 7-Core iGPU (245 - 263, n=7) | |
| GMK NucBox M6 | |
| WebXPRT 4 / Overall | |
| GMK NucBox K6 | |
| Beelink SER8 | |
| BOSGAME M1 | |
| Beelink SEi12 Core i5-1235U | |
| GMK NucBox K9 | |
| Moyenne Intel Core Ultra 5 125H, Intel Arc 7-Core iGPU (222 - 240, n=6) | |
| GMK NucBox M6 | |
| Mozilla Kraken 1.1 / Total | |
| GMK NucBox M6 | |
| Beelink SEi12 Core i5-1235U | |
| Moyenne Intel Core Ultra 5 125H, Intel Arc 7-Core iGPU (560 - 607, n=7) | |
| GMK NucBox K9 | |
| GMK NucBox K6 | |
| BOSGAME M1 | |
| Beelink SER8 | |
* ... Moindre est la valeur, meilleures sont les performances
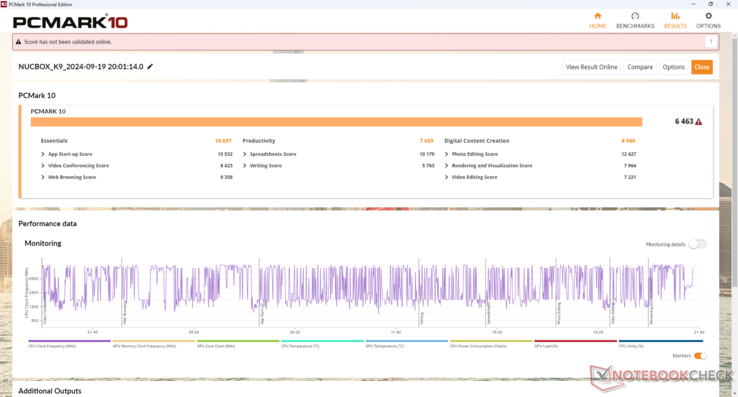
| PCMark 10 Score | 6463 points | |
Aide | ||
| AIDA64 / Memory Copy | |
| Moyenne Intel Core Ultra 5 125H (37664 - 87473, n=7) | |
| BOSGAME M1 | |
| GMK NucBox K6 | |
| Beelink SER8 | |
| GMK NucBox K9 | |
| GMK NucBox M6 | |
| Beelink SEi12 Core i5-1235U | |
| AIDA64 / Memory Read | |
| GMK NucBox K9 | |
| Moyenne Intel Core Ultra 5 125H (41700 - 76803, n=7) | |
| Beelink SER8 | |
| BOSGAME M1 | |
| GMK NucBox K6 | |
| GMK NucBox M6 | |
| Beelink SEi12 Core i5-1235U | |
| AIDA64 / Memory Write | |
| BOSGAME M1 | |
| GMK NucBox K6 | |
| Beelink SER8 | |
| GMK NucBox K9 | |
| Moyenne Intel Core Ultra 5 125H (35730 - 72443, n=7) | |
| GMK NucBox M6 | |
| Beelink SEi12 Core i5-1235U | |
| AIDA64 / Memory Latency | |
| Moyenne Intel Core Ultra 5 125H (127.3 - 184.8, n=7) | |
| GMK NucBox K9 | |
| Beelink SEi12 Core i5-1235U | |
| BOSGAME M1 | |
| Beelink SER8 | |
| GMK NucBox K6 | |
| GMK NucBox M6 | |
* ... Moindre est la valeur, meilleures sont les performances
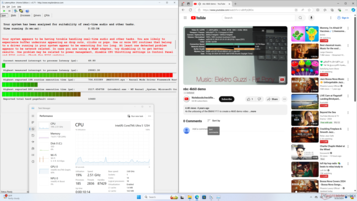
Latence DPC
| DPC Latencies / LatencyMon - interrupt to process latency (max), Web, Youtube, Prime95 | |
| GMK NucBox K9 | |
| GMK NucBox M6 | |
| GMK NucBox K6 | |
| BOSGAME M1 | |
| Beelink SER8 | |
| Beelink SEi12 Core i5-1235U | |
* ... Moindre est la valeur, meilleures sont les performances
Dispositifs de stockage
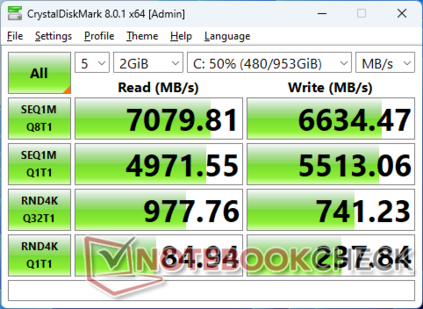
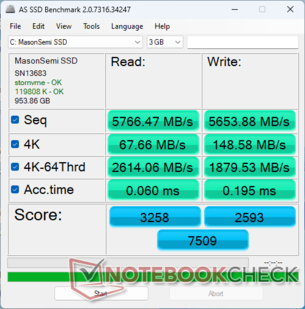
GMK utilise le même système de stockage de 1 TB MasonSemi MC7000 PCIe4 x4 NVMe SSD de 1 To pour ses modèles NucBox K6 et K9. Les performances sont rapides et comparables à celles de la série Samsung PM9A1 que l'on trouve couramment sur les PC haut de gamme, malgré le nom de marque moins connu. Nous n'avons observé aucun ralentissement notable des performances lors de l'exécution en boucle de DiskSpd.
| Drive Performance rating - Percent | |
| GMK NucBox K6 | |
| GMK NucBox K9 | |
| Beelink SEi12 Core i5-1235U | |
| Beelink SER8 | |
| BOSGAME M1 | |
| GMK NucBox M6 | |
* ... Moindre est la valeur, meilleures sont les performances
Disk Throttling: DiskSpd Read Loop, Queue Depth 8
Performance du GPU
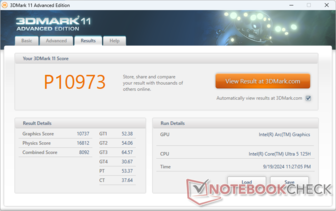
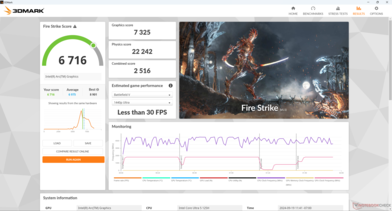
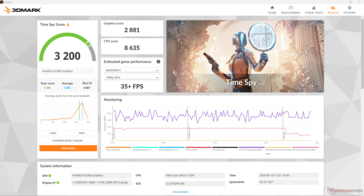
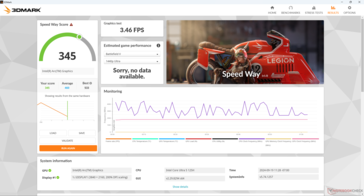
Les performances graphiques sont légèrement inférieures à celles d'un PC moyen de notre base de données avec le même système d'exploitation Arc 7 intégré gPU Arc 7 D'environ 5 %. Le GPU Arc 8 intégré sur les processeurs Core Ultra 7-H et Core Ultra 9-H haut de gamme est plus rapide que notre solution Arc 7 d'environ 15 %, mais il n'y a malheureusement pas de SKU de ce type disponible avec la NucBox K9. Néanmoins, les performances globales sont comparables à celles de la solution concurrente de dernière génération, la Radeon 780M de dernière génération, selon les benchmarks 3DMark.
| 3DMark 11 Performance | 10973 points | |
| 3DMark Cloud Gate Standard Score | 28997 points | |
| 3DMark Fire Strike Score | 6716 points | |
| 3DMark Time Spy Score | 3200 points | |
| 3DMark Steel Nomad Score | 581 points | |
Aide | ||
* ... Moindre est la valeur, meilleures sont les performances
Performances des jeux
Malheureusement, les performances de jeu sont beaucoup plus lentes que celles de la NucBox K6, même si les résultats de 3DMark ci-dessus suggèrent le contraire. La plupart des titres testés, y compris GTA V, DOTA 2 Reborn, Final Fantasy XV, F1 22 et Baldur's Gate 3 , tournent entre 10 et 40 % plus lentement sur notre NucBox K9 équipée d'un processeur Intel. Les taux de rafraîchissement stagnent également lorsque le jeu Cyberpunk 2077 tourne au ralenti, comme le montre notre graphique ci-dessous.
| Performance rating - Percent | |
| BOSGAME M1 -1! | |
| Beelink SER8 -1! | |
| GMK NucBox K6 | |
| GMK NucBox K9 | |
| GMK NucBox M6 -1! | |
| Beelink SEi12 Core i5-1235U -1! | |
| GTA V - 1920x1080 Highest AA:4xMSAA + FX AF:16x | |
| GMK NucBox K6 | |
| GMK NucBox K9 | |
| Beelink SEi12 Core i5-1235U | |
| Final Fantasy XV Benchmark - 1920x1080 High Quality | |
| BOSGAME M1 | |
| Beelink SER8 | |
| GMK NucBox K6 | |
| GMK NucBox K9 | |
| GMK NucBox M6 | |
| Beelink SEi12 Core i5-1235U | |
| Strange Brigade - 1920x1080 ultra AA:ultra AF:16 | |
| BOSGAME M1 | |
| Beelink SER8 | |
| GMK NucBox K6 | |
| GMK NucBox K9 | |
| GMK NucBox M6 | |
| Beelink SEi12 Core i5-1235U | |
| Dota 2 Reborn - 1920x1080 ultra (3/3) best looking | |
| Beelink SER8 | |
| BOSGAME M1 | |
| GMK NucBox K6 | |
| GMK NucBox K9 | |
| GMK NucBox M6 | |
| Beelink SEi12 Core i5-1235U | |
| X-Plane 11.11 - 1920x1080 high (fps_test=3) | |
| GMK NucBox K6 | |
| Beelink SER8 | |
| BOSGAME M1 | |
| GMK NucBox K9 | |
| GMK NucBox M6 | |
| Beelink SEi12 Core i5-1235U | |
| Far Cry 5 - 1920x1080 Ultra Preset AA:T | |
| BOSGAME M1 | |
| Beelink SER8 | |
| GMK NucBox K6 | |
| GMK NucBox K9 | |
| GMK NucBox M6 | |
| F1 22 | |
| 1280x720 Ultra Low Preset AA:T AF:16x | |
| GMK NucBox K6 | |
| Beelink SER8 | |
| GMK NucBox K9 | |
| Moyenne Intel Arc 7-Core iGPU (n=1) | |
| Framework Laptop 13.5 Core Ultra 7 155H | |
| GMK NucBox M6 | |
| 1920x1080 Low Preset AA:T AF:16x | |
| GMK NucBox K6 | |
| Beelink SER8 | |
| GMK NucBox K9 | |
| Moyenne Intel Arc 7-Core iGPU (n=1) | |
| Framework Laptop 13.5 Core Ultra 7 155H | |
| GMK NucBox M6 | |
| 1920x1080 Medium Preset AA:T AF:16x | |
| GMK NucBox K6 | |
| Beelink SER8 | |
| GMK NucBox K9 | |
| Moyenne Intel Arc 7-Core iGPU (n=1) | |
| Framework Laptop 13.5 Core Ultra 7 155H | |
| GMK NucBox M6 | |
| 1920x1080 High Preset AA:T AF:16x | |
| GMK NucBox K6 | |
| Beelink SER8 | |
| Framework Laptop 13.5 Core Ultra 7 155H | |
| GMK NucBox K9 | |
| Moyenne Intel Arc 7-Core iGPU (n=1) | |
| GMK NucBox M6 | |
Cyberpunk 2077 ultra FPS Chart
| Bas | Moyen | Élevé | Ultra | |
|---|---|---|---|---|
| GTA V (2015) | 143.6 | 125.5 | 33.6 | 12.7 |
| Dota 2 Reborn (2015) | 97.7 | 83.1 | 75.6 | 73.3 |
| Final Fantasy XV Benchmark (2018) | 59.6 | 33.3 | 22.3 | |
| X-Plane 11.11 (2018) | 57 | 44.8 | 37.3 | |
| Far Cry 5 (2018) | 71 | 40 | 37 | 35 |
| Strange Brigade (2018) | 148.6 | 63.9 | 53.5 | 43.5 |
| Tiny Tina's Wonderlands (2022) | 50.7 | 39.4 | 26.8 | 22.4 |
| F1 22 (2022) | 79.4 | 71.9 | 52.9 | |
| Baldur's Gate 3 (2023) | 33.7 | 27.9 | 24.2 | 23.1 |
| Cyberpunk 2077 (2023) | 30.9 | 25.2 | 21.3 | 18.8 |
Émissions - Les ventilateurs sont toujours en marche
Bruit du système
Le bruit du ventilateur est toujours présent sur l'unité, quelle que soit la charge à l'écran, un peu comme ce que nous avons enregistré sur la NucBox K6. Le simple fait de tourner au ralenti sur le bureau est déjà de 30 à 36 dB(A) contre un arrière-plan silencieux de 23 dB(A), même en mode économie d'énergie. Cependant, le bruit du ventilateur lors des jeux ou d'autres charges exigeantes semble être plus silencieux sur la NucBox K9 avec environ 44 dB(A) contre presque 48 dB(A) sur la NucBox K6.
Degré de la nuisance sonore
| Au repos |
| 29.8 / 35.7 / 35.7 dB(A) |
| Fortement sollicité |
| 41.9 / 44 dB(A) |
 | ||
30 dB silencieux 40 dB(A) audible 50 dB(A) bruyant |
||
min: | ||
| GMK NucBox K9 Arc 7-Core, Ultra 5 125H, MasonSemi 1TB MC7000 | GMK NucBox K6 Radeon 780M, R7 7840HS, MasonSemi 1TB MC7000 | GMK NucBox M6 Radeon 660M, R5 6600H, AirDisk APF 10-512G | Beelink SER8 Radeon 780M, R7 8845HS, Crucial P3 Plus CT1000P3PSSD8 | Beelink SEi12 Core i5-1235U Iris Xe G7 80EUs, i5-1235U, Kingston NV1 SNVS/500GCN | BOSGAME M1 Radeon 780M, R7 7840HS, Kingston OM8PGP41024N-A0 | |
|---|---|---|---|---|---|---|
| Noise | -2% | -4% | 14% | 14% | 4% | |
| arrêt / environnement * (dB) | 23 | 23.2 -1% | 24.2 -5% | 23.6 -3% | 23.3 -1% | 23.2 -1% |
| Idle Minimum * (dB) | 29.8 | 31.3 -5% | 31.9 -7% | 28.8 3% | 27.8 7% | 32 -7% |
| Idle Average * (dB) | 35.7 | 31.3 12% | 32 10% | 28.8 19% | 27.8 22% | 32 10% |
| Idle Maximum * (dB) | 35.7 | 33.4 6% | 33.8 5% | 30.5 15% | 27.8 22% | 32 10% |
| Load Average * (dB) | 41.9 | 47.5 -13% | 48.5 -16% | 34.6 17% | 32 24% | 38.7 8% |
| Cyberpunk 2077 ultra * (dB) | 43.8 | 34.1 22% | ||||
| Load Maximum * (dB) | 44 | 47.7 -8% | 48.5 -10% | 34.5 22% | 39.2 11% | 42 5% |
| Witcher 3 ultra * (dB) | 43.6 | 48.5 | 34.1 | 41.7 |
* ... Moindre est la valeur, meilleures sont les performances
Température
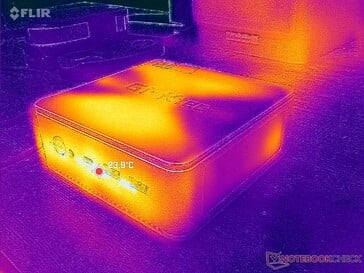
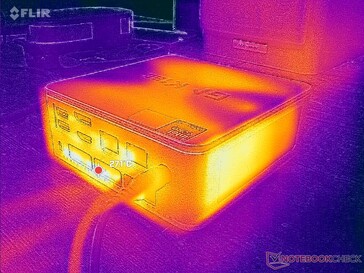
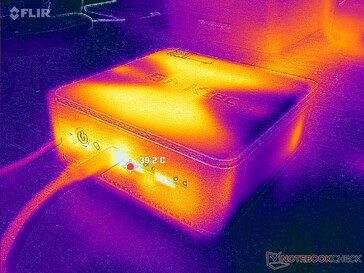
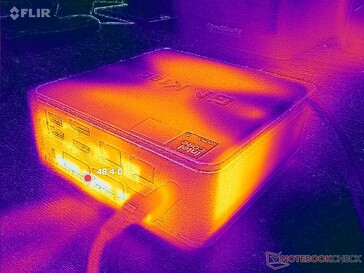
Les grilles d'aération se trouvent de chaque côté de l'appareil, à l'exception de la surface supérieure, ce qui signifie que vous pouvez placer des ordinateurs portables et d'autres petits objets sur le dessus sans gêner la circulation de l'air.
Gestion de l'énergie
Consommation électrique
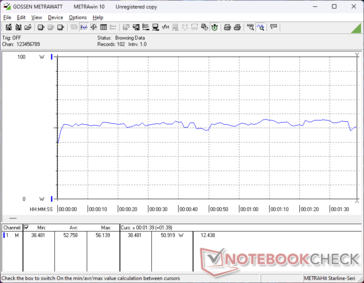
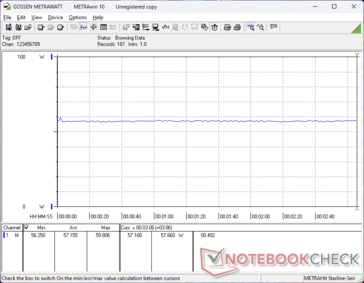
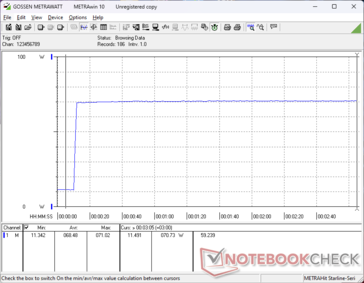
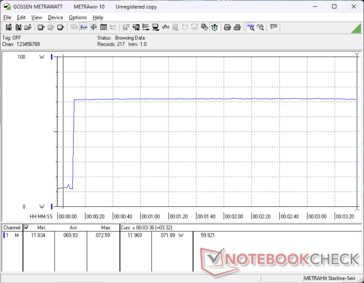
La consommation au ralenti sur le bureau est plus élevée que prévu, avec environ 11 W même en mode économie d'énergie, contre 6 à 8 W sur d'autres modèles comme la NucBox M6 ou le Beelink SER8. Lors de l'exécution de charges plus exigeantes comme 3DMark 06 ou Cyberpunk 2077, cependant, la consommation serait sensiblement inférieure à celle de la NucBox K6, plus rapide.
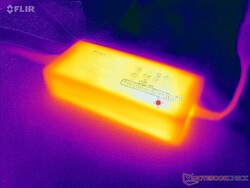
Nous avons pu enregistrer une consommation maximale de 73 W à partir de l'adaptateur AC 120 W de petite et moyenne taille (~14,5 x 6,4 x 3 cm). Cette consommation importante peut être attribuée au port Thunderbolt 4 au cas où des moniteurs ou des accessoires connectés nécessiteraient une alimentation supplémentaire.
| Éteint/en veille | |
| Au repos | |
| Fortement sollicité |
|
Légende:
min: | |
| GMK NucBox K9 Ultra 5 125H, Arc 7-Core, MasonSemi 1TB MC7000, , x, | GMK NucBox K6 R7 7840HS, Radeon 780M, MasonSemi 1TB MC7000, , x, | GMK NucBox M6 R5 6600H, Radeon 660M, AirDisk APF 10-512G, , x, | Beelink SER8 R7 8845HS, Radeon 780M, Crucial P3 Plus CT1000P3PSSD8, , x, | Beelink SEi12 Core i5-1235U i5-1235U, Iris Xe G7 80EUs, Kingston NV1 SNVS/500GCN, , x, | BOSGAME M1 R7 7840HS, Radeon 780M, Kingston OM8PGP41024N-A0, , x, | |
|---|---|---|---|---|---|---|
| Power Consumption | 10% | 10% | 9% | -43% | 4% | |
| Idle Minimum * (Watt) | 10.9 | 6.7 39% | 7.9 28% | 7.3 33% | 15.8 -45% | 7.3 33% |
| Idle Average * (Watt) | 11 | 7 36% | 8 27% | 7.3 34% | 16.8 -53% | 7.3 34% |
| Idle Maximum * (Watt) | 11.4 | 7.6 33% | 8.3 27% | 8.4 26% | 17 -49% | 8.4 26% |
| Load Average * (Watt) | 52.8 | 74.3 -41% | 61.5 -16% | 68.2 -29% | 54.4 -3% | 72.7 -38% |
| Cyberpunk 2077 ultra external monitor * (Watt) | 57.1 | |||||
| Load Maximum * (Watt) | 72.2 | 85.7 -19% | 84.6 -17% | 84.3 -17% | 119.1 -65% | 99.1 -37% |
| Witcher 3 ultra * (Watt) | 75 | 47.3 | 75.1 | 50.7 | 80.5 |
* ... Moindre est la valeur, meilleures sont les performances
Power Consumption Prime95+FurMark Stress Test
Power Consumption external Monitor
Points positifs
Points négatifs
Verdict - Plus récent, mais pas plus rapide
Pour 570 $ en vente avec 32 Go de RAM et 1 To de stockage, la NucBox K9 représente un bon rapport qualité-prix par rapport à la Beelink SER8 qui est actuellement plus chère à 630 $ sur Amazon. Le plus grand ennemi de GMK est probablement GMK lui-même, car des modèles comme la NucBox K6 sont à la fois moins chers et plus rapides que la NucBox K9 dans ce qui est essentiellement le même design de châssis avec les mêmes caractéristiques physiques. Dans ce scénario, il n'y a pratiquement aucune raison d'acheter la NucBox K9 plutôt que la K6, à moins que vous ne donniez la priorité à la NPU intégrée plutôt qu'à la puissance brute du CPU et du GPU. Même le modèle concurrent Bosgame M1 est actuellement moins chère et plus rapide à 500$. Il est vrai que la NucBox K9 est un peu plus silencieuse, mais c'est seulement parce que le modèle est aussi un peu plus lent au départ.
La NucBox K9 n'est pas un mauvais mini PC, loin de là, mais son prix plus élevé et ses performances plus lentes que l'ancienne NucBox K6 sont susceptibles de déconcerter beaucoup d'acheteurs, en particulier ceux qui ne sont pas intéressés par l'accélération de l'IA.
Au-delà des disparités de prix et de performances entre les modèles NucBox K6 et K9, le design de la série commence à montrer ses limites. Des concurrents comme Bosgame ont des châssis métalliques plus robustes, tandis que Beelink a récemment redessiné sa série SER pour la rendre plus professionnelle, voire luxueuse. La GMK NucBox, principalement en plastique, fonctionne assez bien, mais il est peut-être temps de la revoir avec des matériaux de meilleure qualité ou un entretien sans outil.
Prix et disponibilité
La GMKtec NucBox K9 est maintenant expédiée telle que configurée dans cette revue sur Amazon pour $720 (après coupon) ou directement du fabricant pour 570 $. Une version dépouillée est également disponible pour 400 $.
Note : Nous avons récemment mis à jour notre système d'évaluation et les résultats de la version 8 ne sont pas comparables à ceux de la version 7. De plus amples informations sont disponibles ici .
GMK NucBox K9
- 10/30/2024 v8
Allen Ngo
Transparency
La sélection des appareils à examiner est effectuée par notre équipe éditoriale. L'échantillon de test a été prêté à l'auteur par le fabricant ou le détaillant pour les besoins de cet examen. Le prêteur n'a pas eu d'influence sur cette évaluation et le fabricant n'a pas reçu de copie de cette évaluation avant sa publication. Il n'y avait aucune obligation de publier cet article. En tant que média indépendant, Notebookcheck n'est pas soumis à l'autorité des fabricants, des détaillants ou des éditeurs.
Voici comment Notebookcheck teste
Chaque année, Notebookcheck examine de manière indépendante des centaines d'ordinateurs portables et de smartphones en utilisant des procédures standardisées afin de garantir que tous les résultats sont comparables. Nous avons continuellement développé nos méthodes de test depuis environ 20 ans et avons établi des normes industrielles dans le processus. Dans nos laboratoires de test, des équipements de mesure de haute qualité sont utilisés par des techniciens et des rédacteurs expérimentés. Ces tests impliquent un processus de validation en plusieurs étapes. Notre système d'évaluation complexe repose sur des centaines de mesures et de points de référence bien fondés, ce qui garantit l'objectivité.



 Total Sustainability Score:
