Critiques du Intel Core i7-12650H processeur
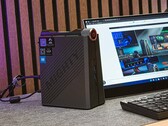
Test du Nipogi AD08 : mini-PC élégant avec Core i7-12650H, design mini-tour, et trois modes d'alimentation
NiPoGi a doté son AD08 d'un Intel Core i7-12650H qui offre suffisamment de performances pour maîtriser les tâches bureautiques quotidiennes. En tant que PC de jeu compact au format tour, le fabricant a choisi une voie légèrement différente en ce qui concerne son design. Dans cet article, vous découvrirez les avantages qui en découlent et les performances du NiPoGi AD08 par rapport à d'autres mini-PC équipés de manière similaire.
Intel Core i7-12650H, UHD Graphics 64EUs, 878 gTest du Nipogi AD08 : mini-PC élégant avec Core i7-12650H, design mini-tour, et trois modes d'alimentation
NiPoGi a doté son AD08 d'un Intel Core i7-12650H qui offre suffisamment de performances pour maîtriser les tâches bureautiques quotidiennes. En tant que PC de jeu compact au format tour, le fabricant a choisi une voie légèrement différente en ce qui concerne son design. Dans cet article, vous découvrirez les avantages qui en découlent et les performances du NiPoGi AD08 par rapport à d'autres mini-PC équipés de manière similaire.
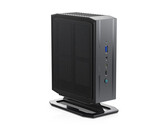
Intel Core i7-12650H, UHD Graphics 64EUs, 878 gTest du Minisforum Neptune HN2673 : mini PC avec Core i7-12650H et Arc A730M dans un boîtier réussi
Minisforum est l'un des rares fabricants à avoir osé intégrer une carte graphique Intel actuelle en tant que carte graphique dédiée dans un mini PC. La série Neptune HN2673 réunit l'Intel Arc A730M et l'Intel Core i7-12650H. Dans cette revue, nous avons résumé les aspects les plus importants, y compris une série de benchmarks et de mesures.
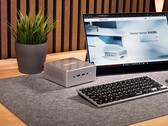
Intel Core i7-12650H, A730M, 1.7 kgTest du Minisforum Venus NAB6 : mini PC élégant avec i7-12650H puissant et refroidissement actif du SSD !
Minisforum a élargi son portefeuille de la série Venus avec la sortie de l'élégant mini PC NAB6. Basé sur un Intel Core i7-12650H, le NAB6 est bien préparé pour de nombreuses utilisations. Son prix est correct, mais il faudra probablement faire quelques compromis. Nous verrons de quels compromis il s'agit dans notre analyse détaillée.
Intel Core i7-12650H, UHD Graphics 64EUs, 616 gMSI Cyborg 15 A12VF: NVIDIA GeForce RTX 4060 Laptop GPU, 15.60", 2 kg
Critique » Test du MSI Cyborg 15 A12VF : PC portable de jeu avec RTX 4060 basse consommation
MSI Katana 15 B12VEK: NVIDIA GeForce RTX 4050 Laptop GPU, 15.60", 2.3 kg
Critique » Test du MSI Katana 15 : gamer à petit prix avec une RTX 4050 et un processeur Alder Lake
Asus TUF Dash F15 FX517ZC: NVIDIA GeForce RTX 3050 4GB Laptop GPU, 15.60", 1.9 kg
Critique » Test de l'Asus TUF Dash F15 FX517ZC : 1440p, 165 Hz, couleurs P3 complètes à moins de 1000 €
Asus TUF Dash F15 FX517ZR: NVIDIA GeForce RTX 3070 Laptop GPU, 15.60", 2 kg
Critique » Test de l'Asus TUF Dash F15 FX517ZR : PC portable avec RTX 3070 mobile et autonomie acceptable
Acer Aspire 7 A715-76G, i7-12650H RTX 3050: NVIDIA GeForce RTX 3050 4GB Laptop GPU, 15.60", 2.1 kg
Autres tests » Acer Aspire 7 A715-76G, i7-12650H RTX 3050
Acer Aspire 5 A515-57, i7-12650H: Intel UHD Graphics 64EUs (Alder Lake 12th Gen), 15.60", 1.8 kg
Autres tests » Acer Aspire 5 A515-57, i7-12650H
HP Victus 15-fa1: NVIDIA GeForce RTX 4050 Laptop GPU, 15.60", 2.3 kg
Autres tests » HP Victus 15-fa1
Medion Erazer Deputy P60: NVIDIA GeForce RTX 4070 Laptop GPU, 15.60", 2.1 kg
Autres tests » Medion Erazer Deputy P60
MSI Thin 15 B12UC: NVIDIA GeForce RTX 3050 6GB Laptop GPU, 15.60", 1.9 kg
Autres tests » MSI Thin 15 B12UC
Acer Nitro 5 AN515-58, i7-12650H RTX 4050: NVIDIA GeForce RTX 4050 Laptop GPU, 15.60", 2.5 kg
Autres tests » Acer Nitro 5 AN515-58, i7-12650H RTX 4050
MSI GF63 Thin 12UCX: NVIDIA GeForce RTX 2050 Mobile, 15.60", 1.9 kg
Autres tests » MSI GF63 Thin 12UCX
Asus VivoBook 16X K3605ZF: NVIDIA GeForce RTX 2050 Mobile, 16.00", 1.8 kg
Autres tests » Asus VivoBook 16X K3605ZF
MSI Katana GF66 12UCK: NVIDIA GeForce RTX 3050 4GB Laptop GPU, 15.60", 2.3 kg
Autres tests » MSI Katana GF66 12UCK
Asus Vivobook Pro 15 K6501ZM: NVIDIA GeForce RTX 3060 Laptop GPU, 15.60", 2.1 kg
Autres tests » Asus Vivobook Pro 15 K6501ZM
Asus Vivobook 16X K3605ZC: NVIDIA GeForce RTX 3050 4GB Laptop GPU, 16.00", 1.8 kg
Autres tests » Asus Vivobook 16X K3605ZC
Asus Vivobook 16X K3605ZU: NVIDIA GeForce RTX 4050 Laptop GPU, 16.00", 1.8 kg
Autres tests » Asus Vivobook 16X K3605ZU
MSI Crosshair 15 C12VF: NVIDIA GeForce RTX 4060, 15.60", 2.3 kg
Autres tests » MSI Crosshair 15 C12VF
MSI Katana 15 B12VGK: NVIDIA GeForce RTX 4070 Laptop GPU, 15.60", 2.3 kg
Autres tests » MSI Katana 15 B12VGK
MSI Crosshair 15 C12VG: NVIDIA GeForce RTX 4070 Laptop GPU, 15.60", 2.3 kg
Autres tests » MSI Crosshair 15 C12VG
MSI Katana GF66 12UE: NVIDIA GeForce RTX 3060 Laptop GPU, 15.60", 2.3 kg
Autres tests » MSI Katana GF66 12UE
Asus VivoBook Pro 16 K6602ZC, i7-12650H: NVIDIA GeForce RTX 3050 4GB Laptop GPU, 16.00", 1.7 kg
Autres tests » Asus VivoBook Pro 16 K6602ZC, i7-12650H
MSI Katana 17 B12VFK: NVIDIA GeForce RTX 4060 Laptop GPU, 17.30", 2.6 kg
Autres tests » MSI Katana 17 B12VFK
MSI Cyborg 15 A12VE, i7-12650H: NVIDIA GeForce RTX 4050 Laptop GPU, 15.60", 2 kg
Autres tests » MSI Cyborg 15 A12VE, i7-12650H
MSI Cyborg 15 A12VF: NVIDIA GeForce RTX 4060 Laptop GPU, 15.60", 2 kg
Autres tests » MSI Cyborg 15 A12VF
MSI Cyborg 15 A12VE: NVIDIA GeForce RTX 4050 Laptop GPU, 15.60", 2 kg
Autres tests » MSI Cyborg 15 A12VE
Lenovo IdeaPad Gaming 3 16IAH7: NVIDIA GeForce RTX 3060 Laptop GPU, 16.00", 2.6 kg
Autres tests » Lenovo IdeaPad Gaming 3 16IAH7
MSI GF63 Thin 12VE-066US: NVIDIA GeForce RTX 4050 Laptop GPU, 15.60", 1.9 kg
Autres tests » MSI GF63 Thin 12VE-066US
MSI Sword 15 A12UE: NVIDIA GeForce RTX 3060 Laptop GPU, 15.60", 2.3 kg
Autres tests » MSI Sword 15 A12UE
MSI Katana GF66 12UD-436: NVIDIA GeForce RTX 3050 Ti Laptop GPU, 15.60", 2.3 kg
Autres tests » MSI Katana GF66 12UD-436
MSI Katana 15 B12VEK: NVIDIA GeForce RTX 4050 Laptop GPU, 15.60", 2.3 kg
Autres tests » MSI Katana 15 B12VEK
Asus Vivobook Pro 16X N7601ZM-MQ712WS: NVIDIA GeForce RTX 3060 Laptop GPU, 16.00", 2.3 kg
Autres tests » Asus Vivobook Pro 16X N7601ZM-MQ712WS
Asus TUF Gaming F15 FX507ZR, i7-12650H: NVIDIA GeForce RTX 3070 Laptop GPU, 15.60", 2.2 kg
Autres tests » Asus TUF Gaming F15 FX507ZR, i7-12650H
MSI Creator M16 A12UEV-468: NVIDIA GeForce RTX 3060 Laptop GPU, 16.00", 2.3 kg
Autres tests » MSI Creator M16 A12UEV-468
Asus TUF Dash F15 FX517ZR: NVIDIA GeForce RTX 3070 Laptop GPU, 15.60", 2 kg
Autres tests » Asus TUF Dash F15 FX517ZR
Acer Swift 3 SF314-71-79ZW: Intel UHD Graphics 64EUs (Alder Lake 12th Gen), 14.00", 1.4 kg
Autres tests » Acer Swift 3 SF314-71-79ZW
Lenovo IdeaPad Gaming 3 15IAH7, i7-12650H RTX 3050 Ti: NVIDIA GeForce RTX 3050 Ti Laptop GPU, 15.60", 2.3 kg
Autres tests » Lenovo IdeaPad Gaming 3 15IAH7, i7-12650H RTX 3050 Ti
Asus TUF Dash F15 FX517ZE: NVIDIA GeForce RTX 3050 Ti Laptop GPU, 15.60", 2 kg
Autres tests » Asus TUF Dash F15 FX517ZE
Asus TUF Dash 15 FX517ZM-AS73: NVIDIA GeForce RTX 3060 Laptop GPU, 15.60", 2 kg
Autres tests » Asus TUF Dash 15 FX517ZM-AS73
Xiaomi RedmiBook Pro 15 2022, i7 RTX 2050: NVIDIA GeForce RTX 2050 Mobile, 15.60", 1.8 kg
Autres tests » Xiaomi RedmiBook Pro 15 2022, i7 RTX 2050
Asus TUF Dash F15 FX517ZC: NVIDIA GeForce RTX 3050 4GB Laptop GPU, 15.60", 1.9 kg
Autres tests » Asus TUF Dash F15 FX517ZC
Asus ROG Zephyrus M16 GU603ZM, i7-12650H RTX 3060: NVIDIA GeForce RTX 3060 Laptop GPU, 16.10", 1.9 kg
Autres tests » Asus ROG Zephyrus M16 GU603ZM, i7-12650H RTX 3060
Xiaomi RedmiBook Pro 15 2022, i7 RTX 2050: NVIDIA GeForce RTX 2050 Mobile, 15.60", 1.8 kg
» Xiaomi rafraîchit le RedmiBook Pro 15 2022 avec un processeur plus puissant et une réduction de prix
Asus TUF Dash F15 FX517ZC: NVIDIA GeForce RTX 3050 4GB Laptop GPU, 15.60", 1.9 kg
» Une des meilleures configurations de l'Asus TUF Gaming F15 avec l'écran 1440p 165 Hz est trop difficile à trouver