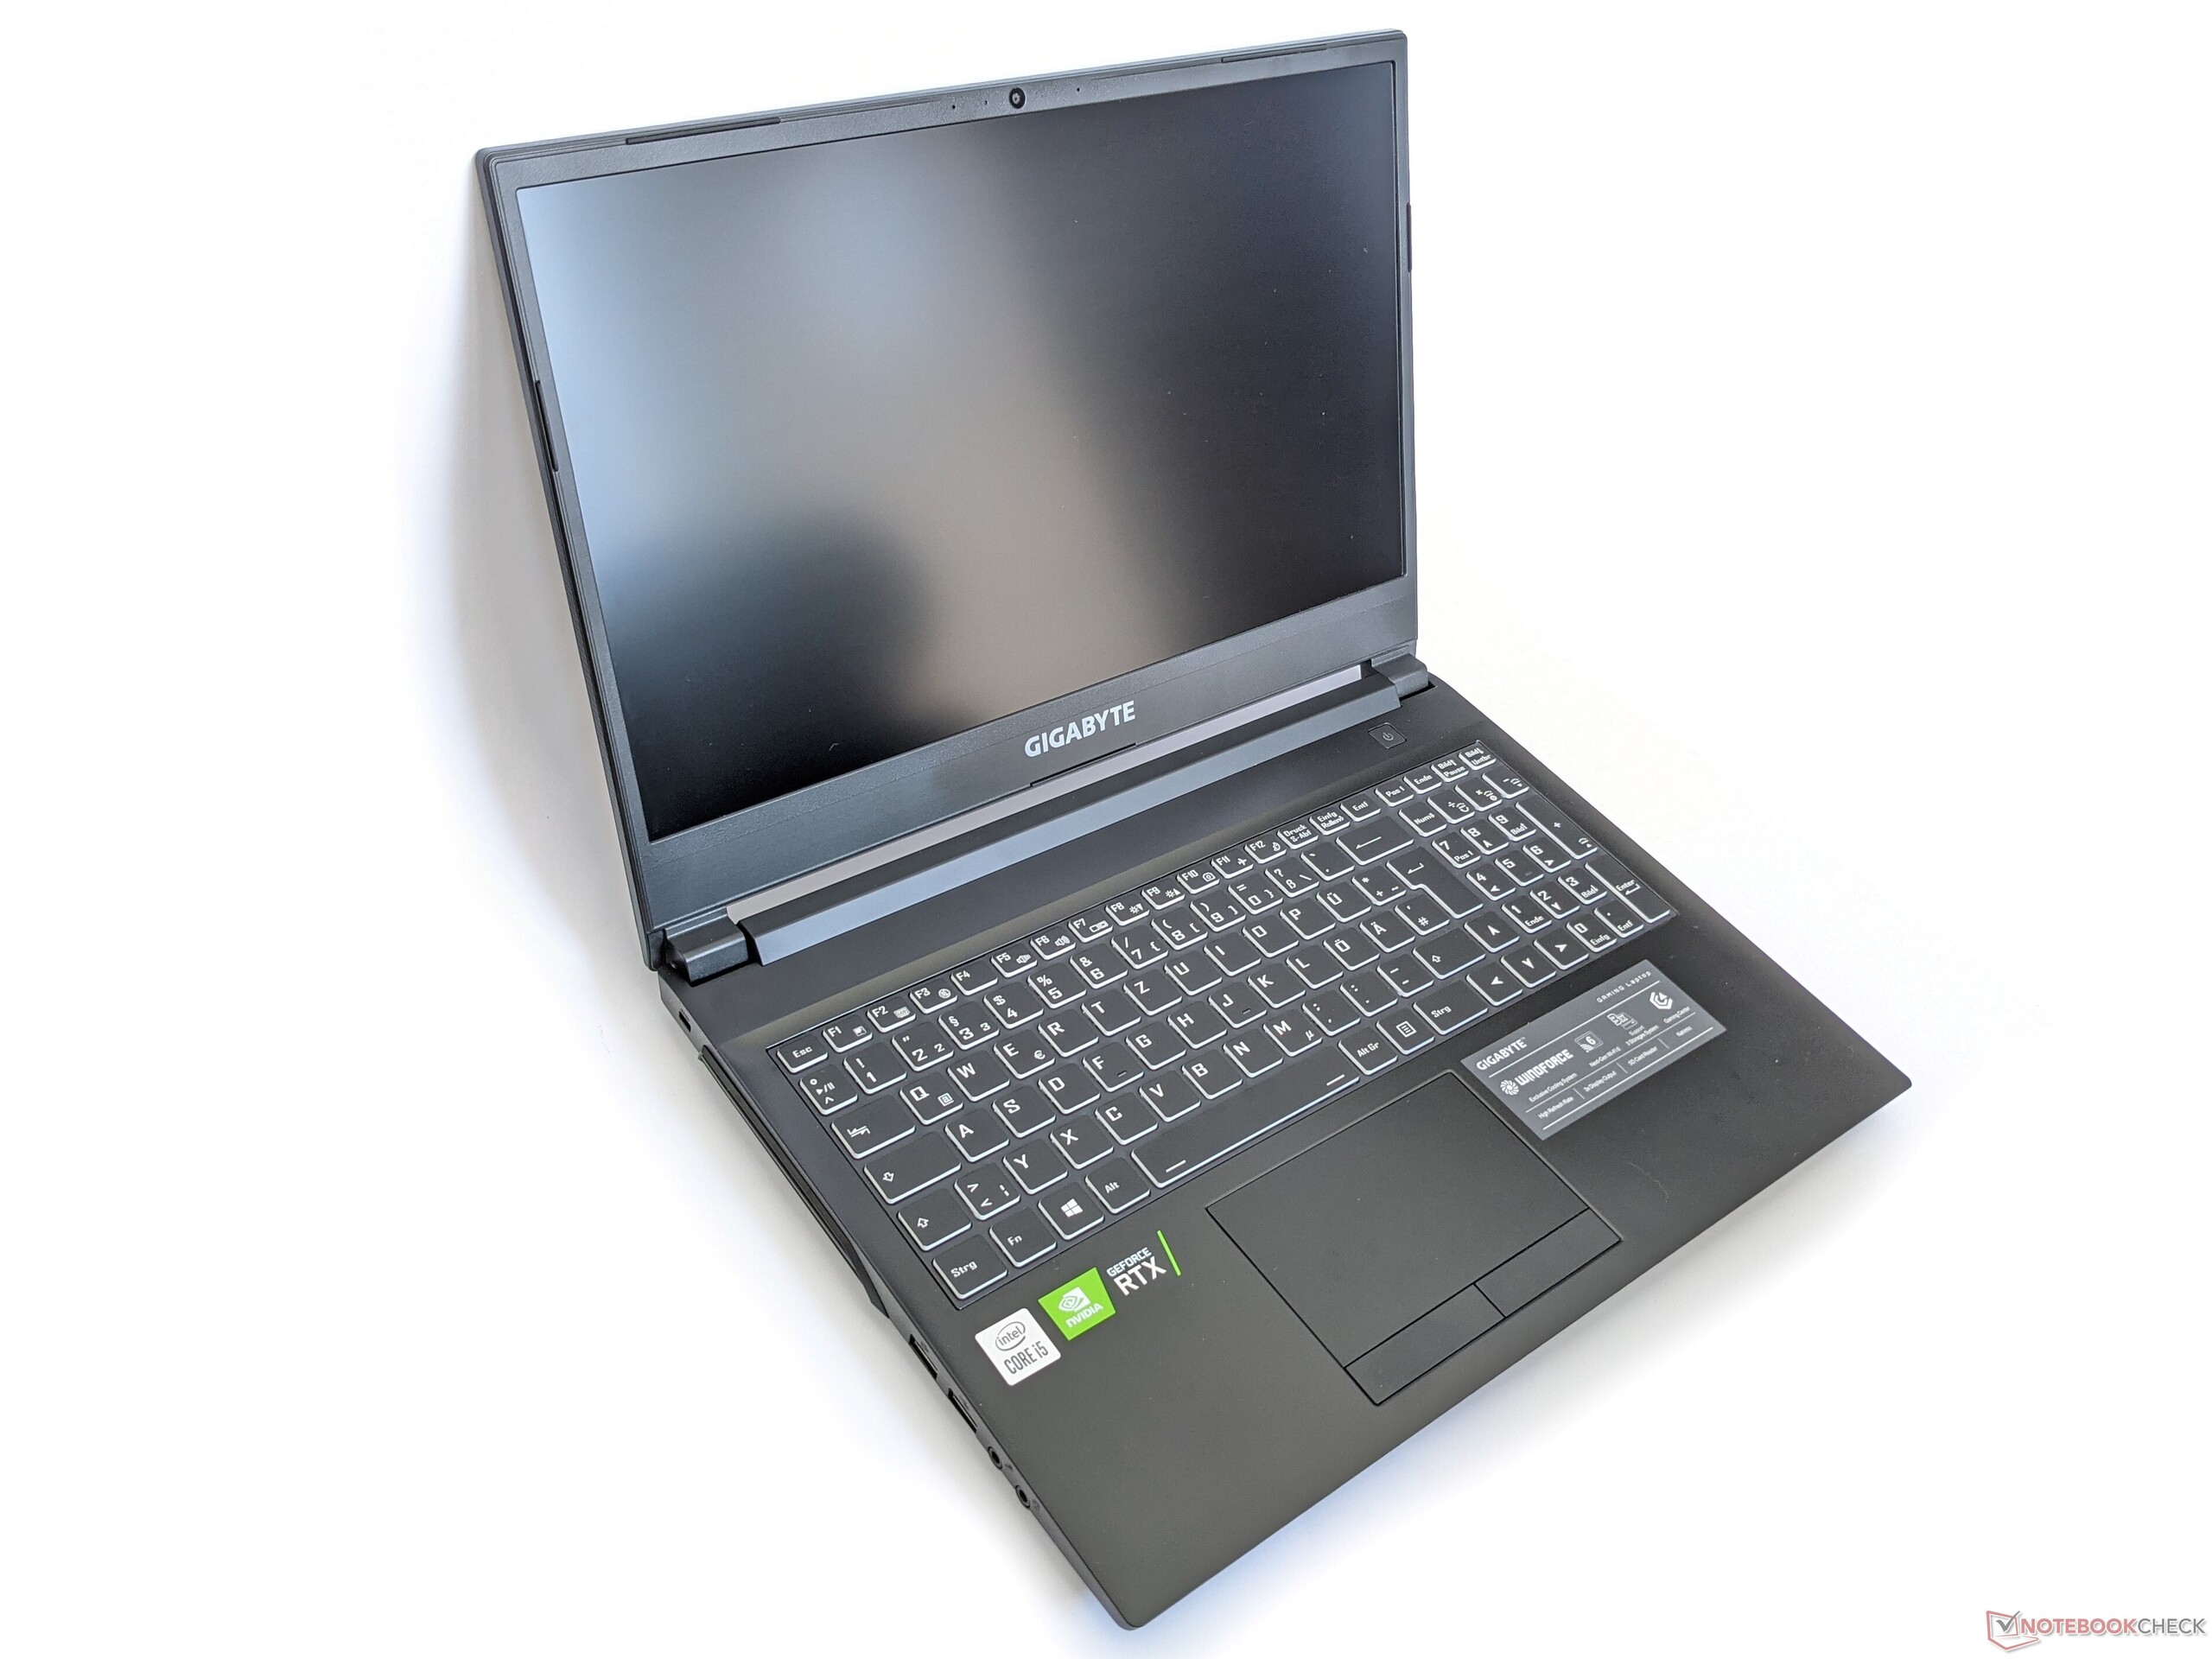
Test du Gigabyte G5 GD : un PC portable de jeu abordable sans Windows

Sa configuration (Core i5-11400H,GeForce RTX 3050) et son prix (environ 750 euros (~848 $)) positionnent le Gigabyte G5 GD comme un ordinateur portable de jeu d'entrée de gamme. Les concurrents incluent des appareils comme le Lenovo Legion 5 15ACHleMSI GF65 Thin 10UEet le Dell G15 5515.
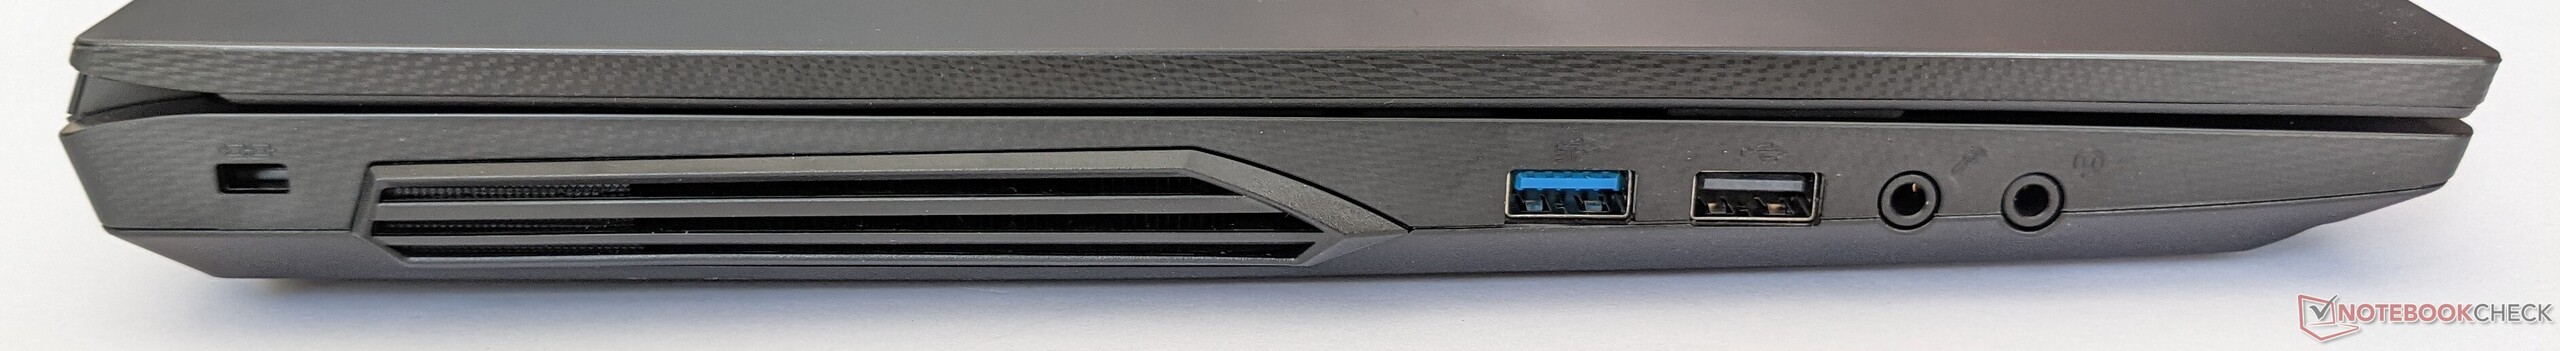
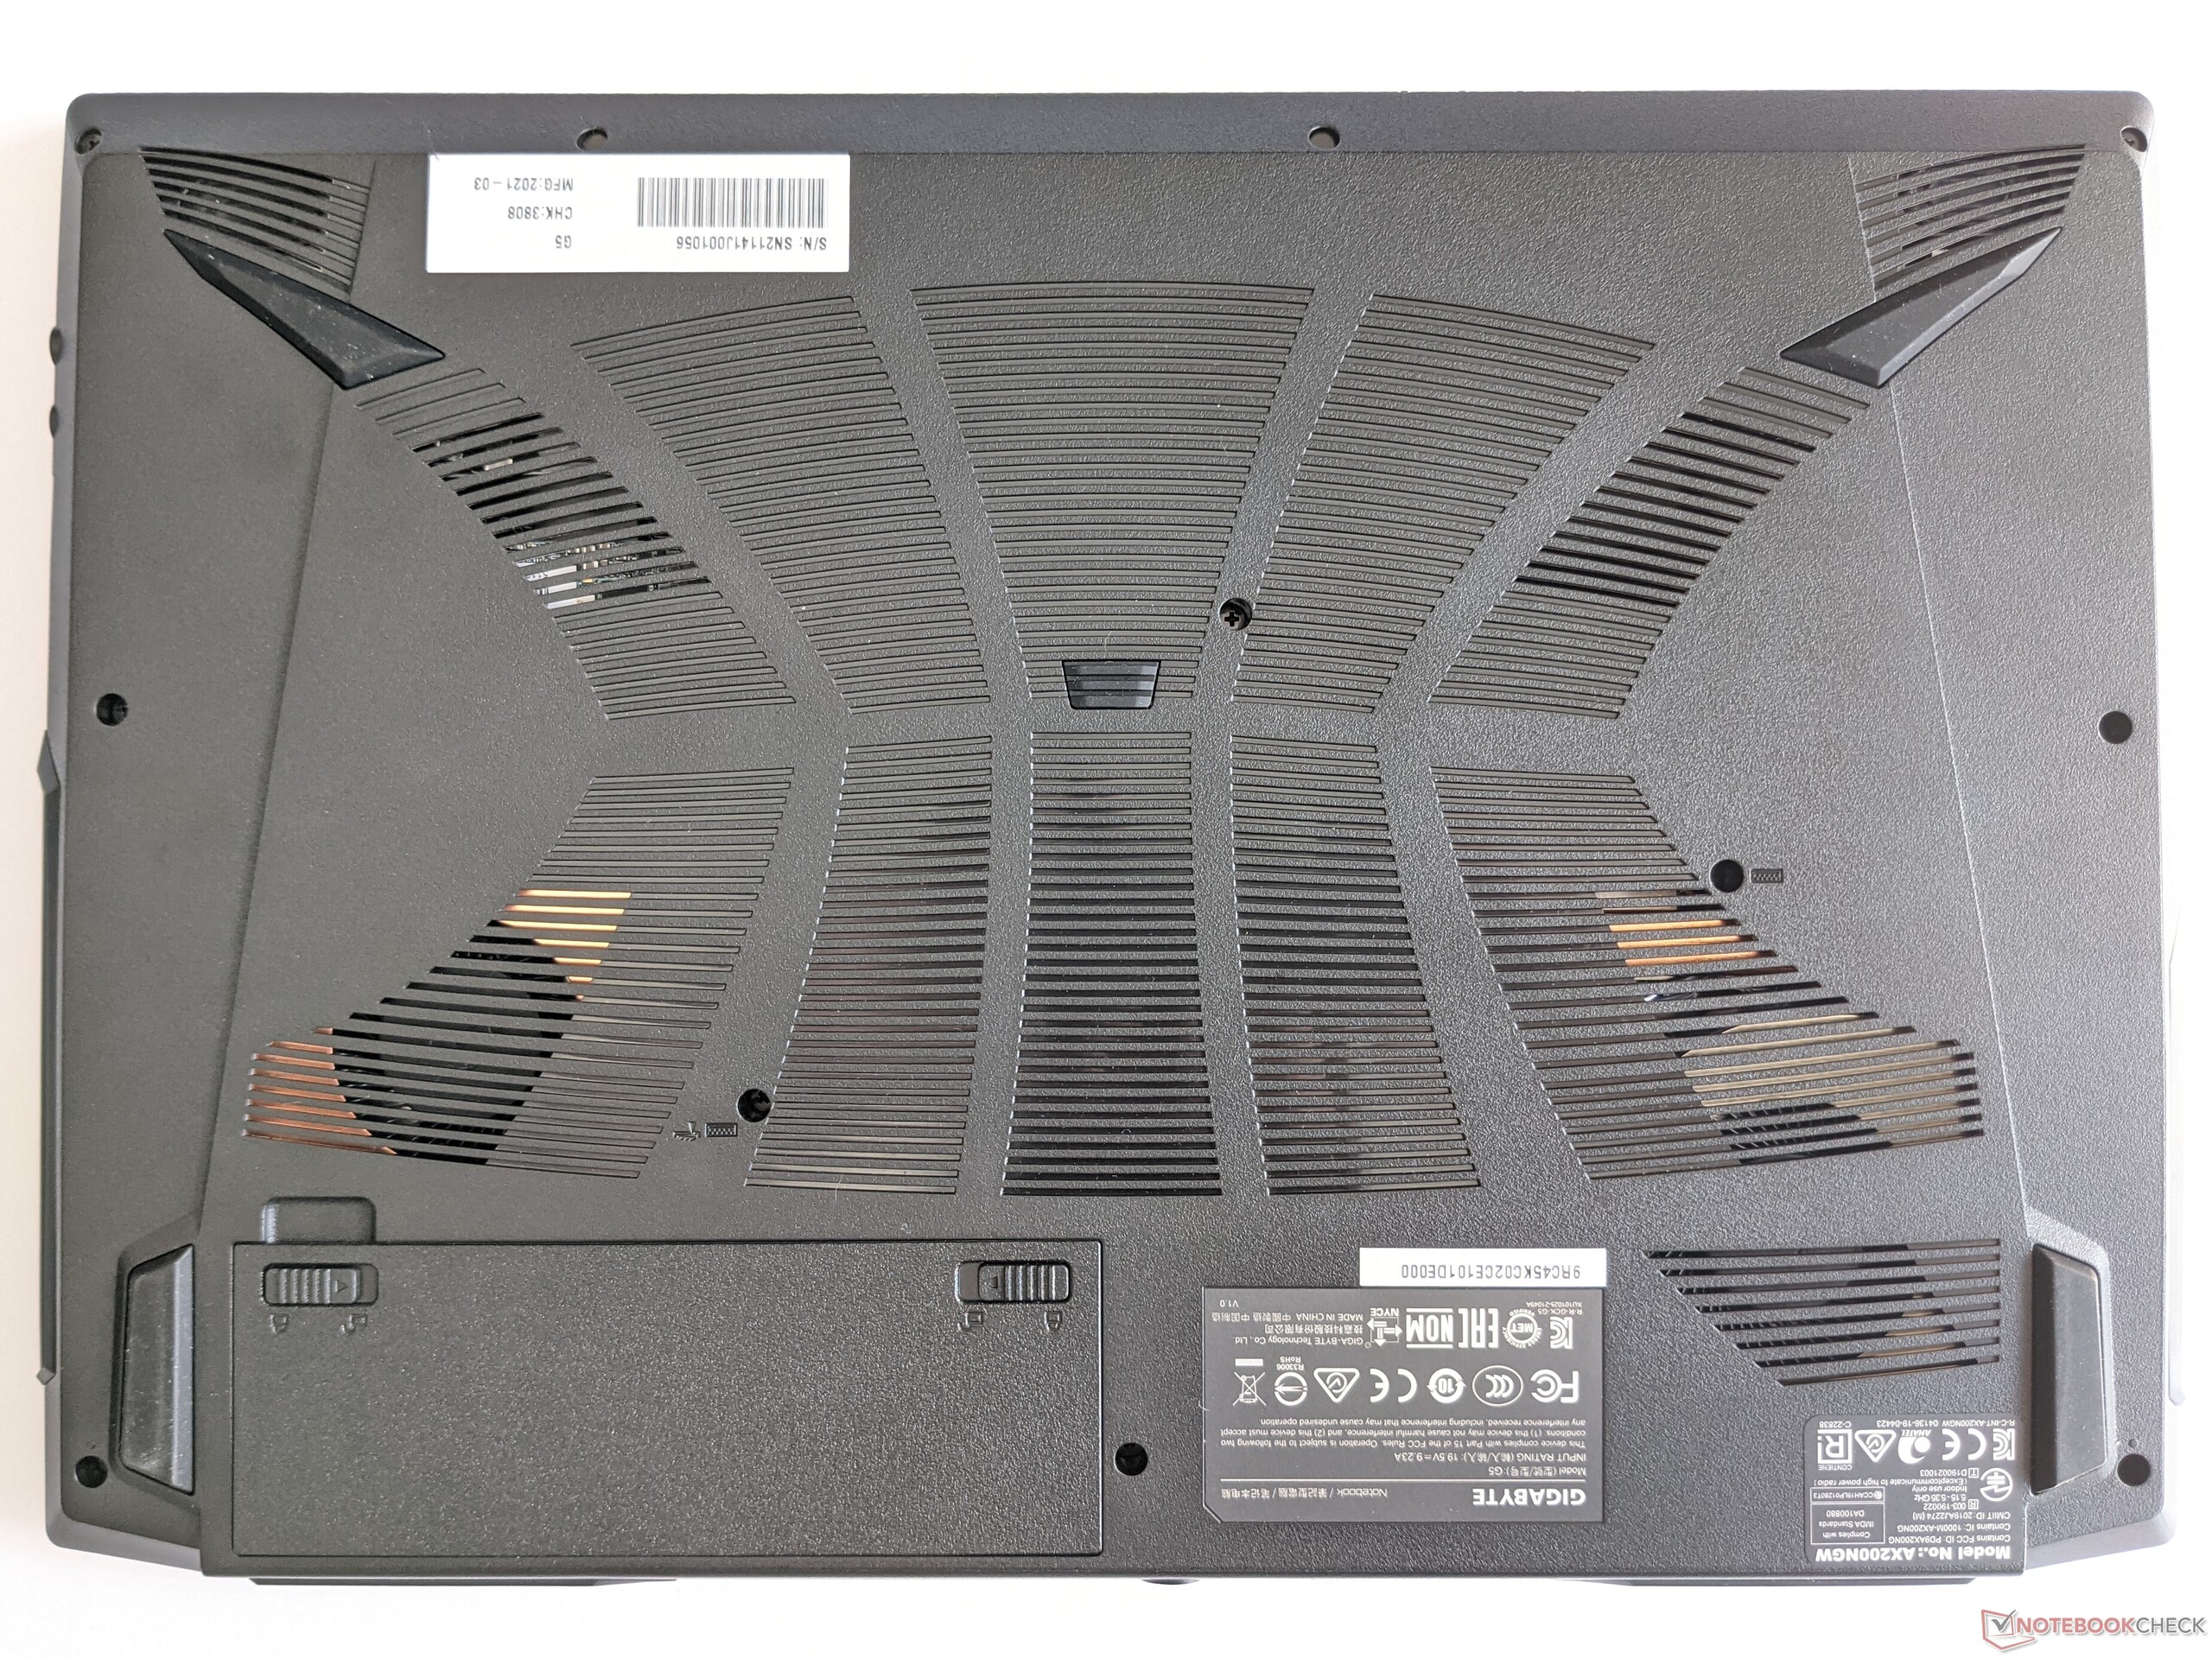
Nous n'entrerons pas dans les détails concernant le boîtier, la connectivité, les périphériques d'entrée et les haut-parleurs dans cette revue. Les informations correspondantes peuvent être trouvées dans la revue du Gigabyte G5 KC de construction identique.
Possible contenders in comparison
Note | Date | Modèle | Poids | Épaisseur | Taille | Résolution | Prix |
|---|---|---|---|---|---|---|---|
| 81.7 % v7 (old) | 11/21 | Gigabyte G5 GD i5-11400H, GeForce RTX 3050 4GB Laptop GPU | 2.1 kg | 31.6 mm | 15.60" | 1920x1080 | |
| 82.7 % v7 (old) | 10/21 | Dell G15 5515 R7 5800H, GeForce RTX 3050 Ti Laptop GPU | 2.4 kg | 24.9 mm | 15.60" | 1920x1080 | |
| 83.4 % v7 (old) | 09/21 | Lenovo Legion 5 15ACH-82JU00C6GE-FL R7 5800H, GeForce RTX 3060 Laptop GPU | 2.5 kg | 26 mm | 15.60" | 1920x1080 | |
| 80.4 % v7 (old) | 03/21 | MSI GF65 Thin 10UE i7-10750H, GeForce RTX 3060 Laptop GPU | 1.9 kg | 21.7 mm | 15.60" | 1920x1080 |


| SD Card Reader | |
| average JPG Copy Test (av. of 3 runs) | |
| Moyenne de la classe Gaming (20.9 - 210, n=54, 2 dernières années) | |
| Gigabyte G5 GD (AV PRO microSD 128 GB V60) | |
| Gigabyte G5 KC (AV PRO microSD 128 GB V60) | |
| maximum AS SSD Seq Read Test (1GB) | |
| Moyenne de la classe Gaming (25.5 - 261, n=51, 2 dernières années) | |
| Gigabyte G5 GD (AV PRO microSD 128 GB V60) | |
| Gigabyte G5 KC (AV PRO microSD 128 GB V60) | |


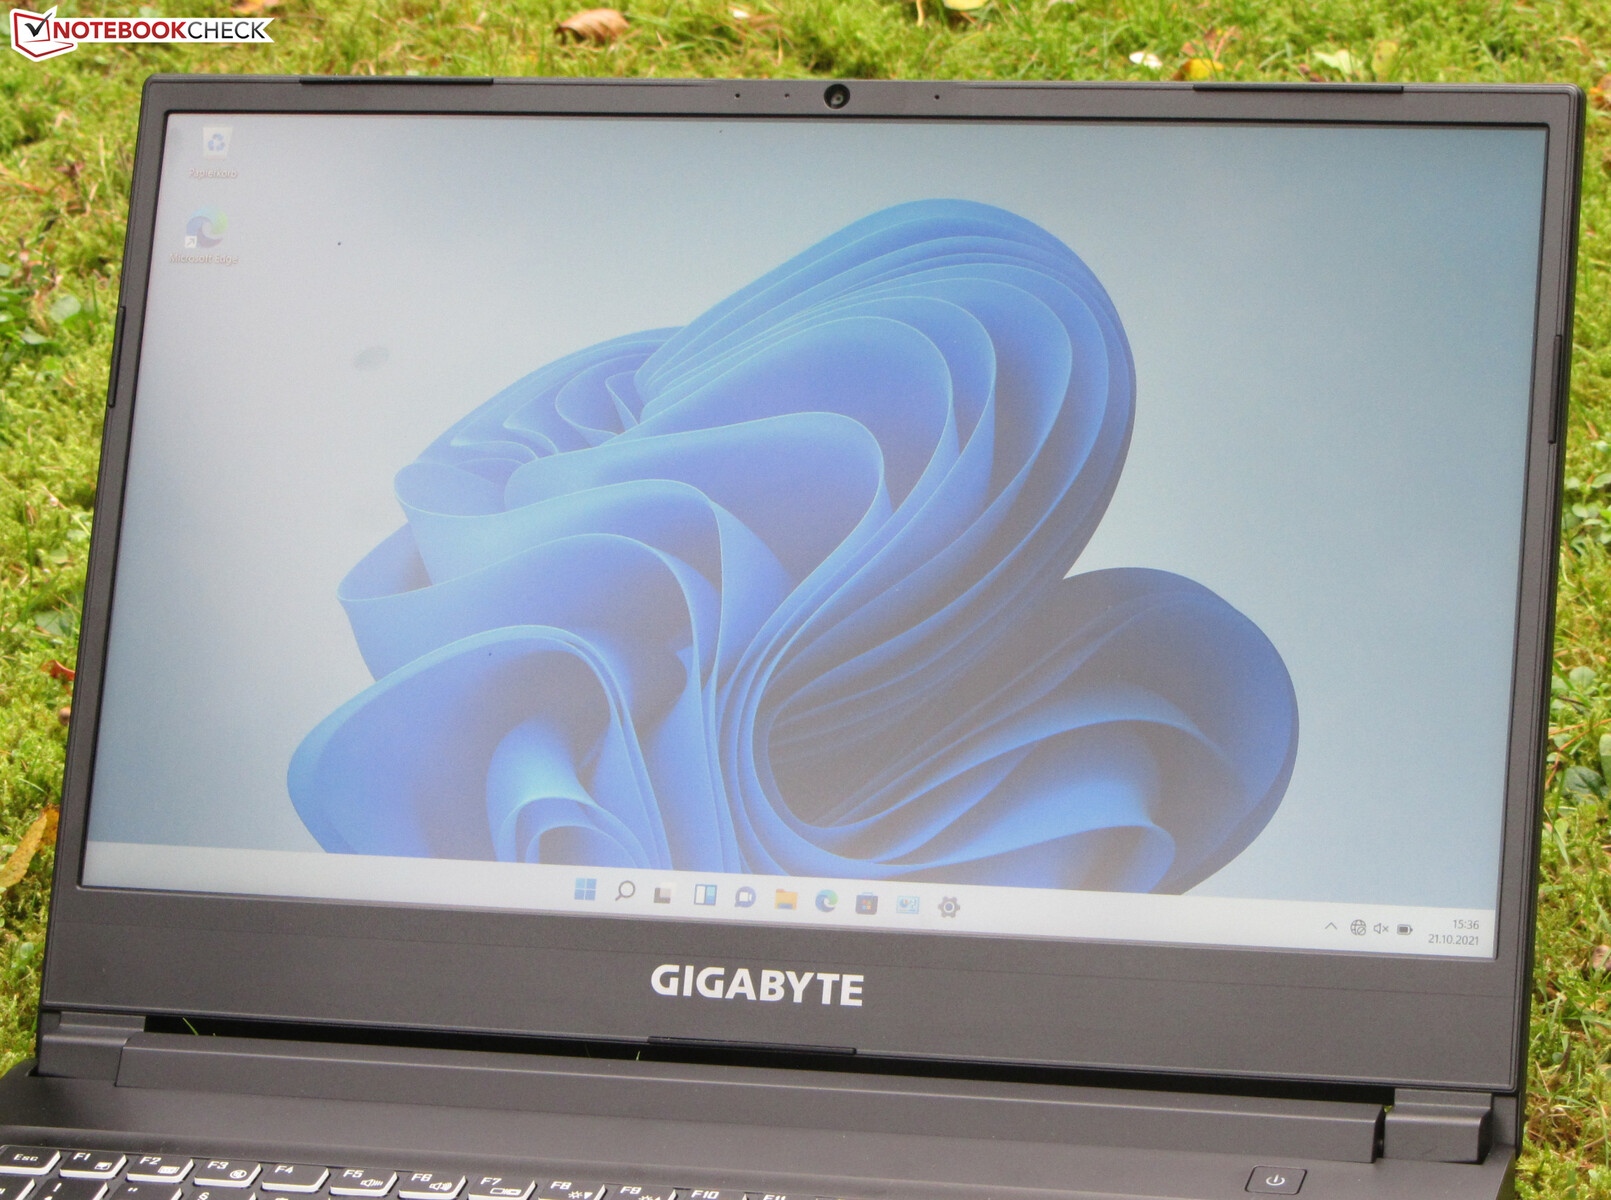
Affichage - 144 Hz IPS
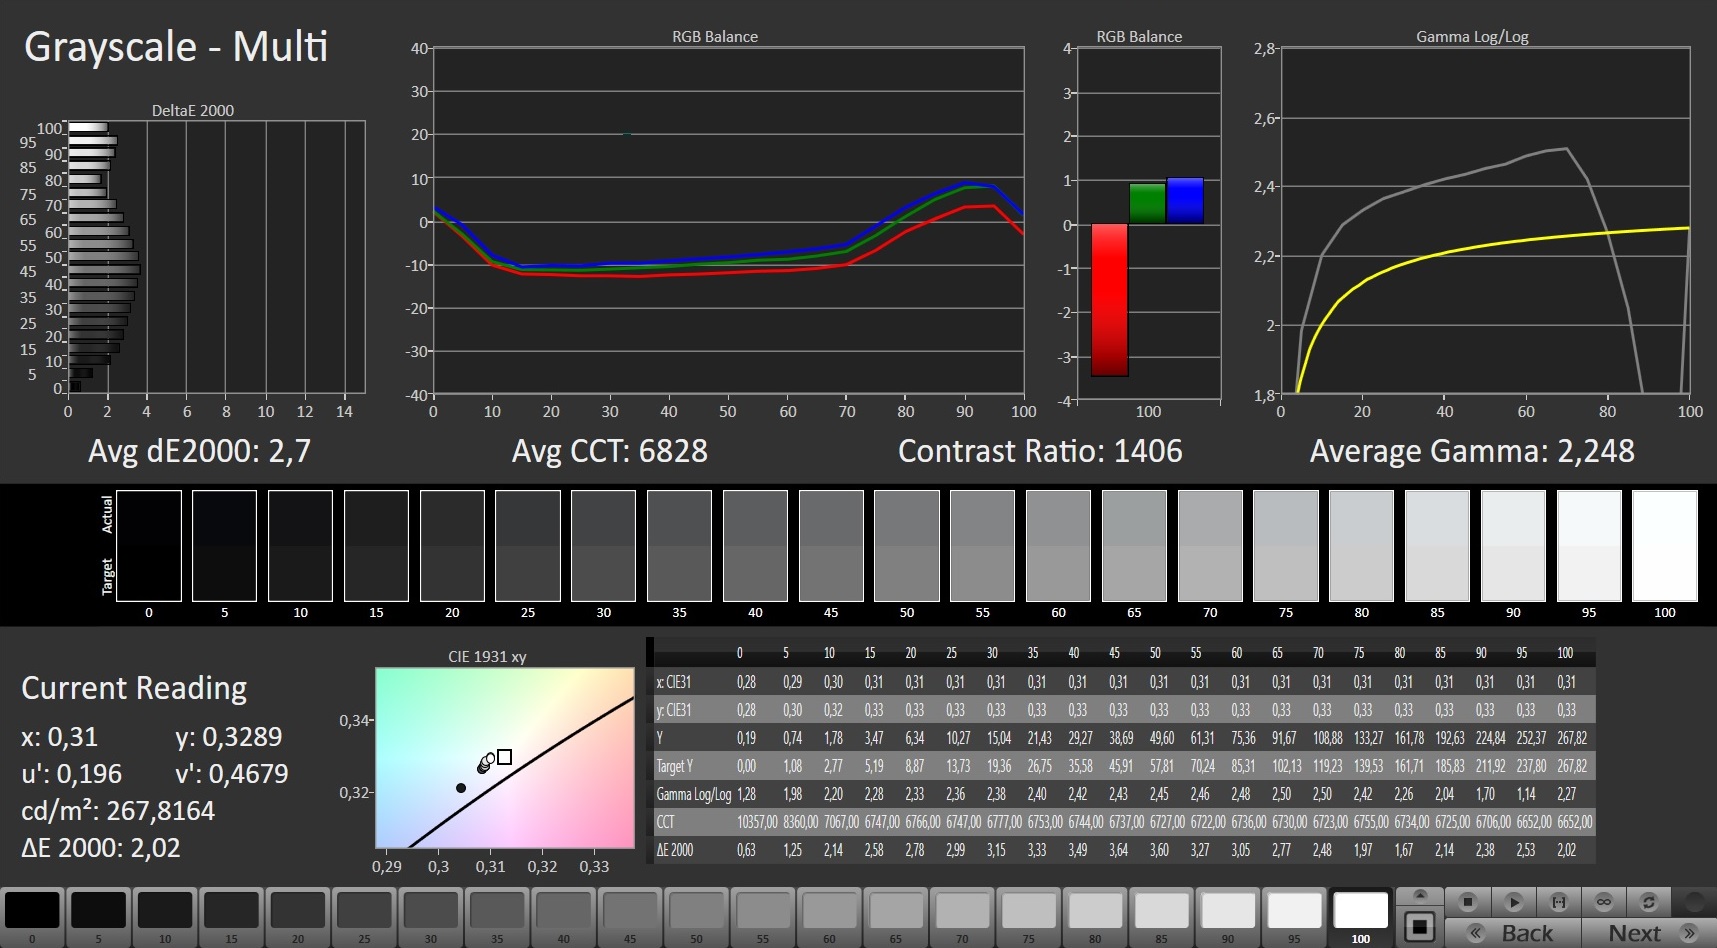
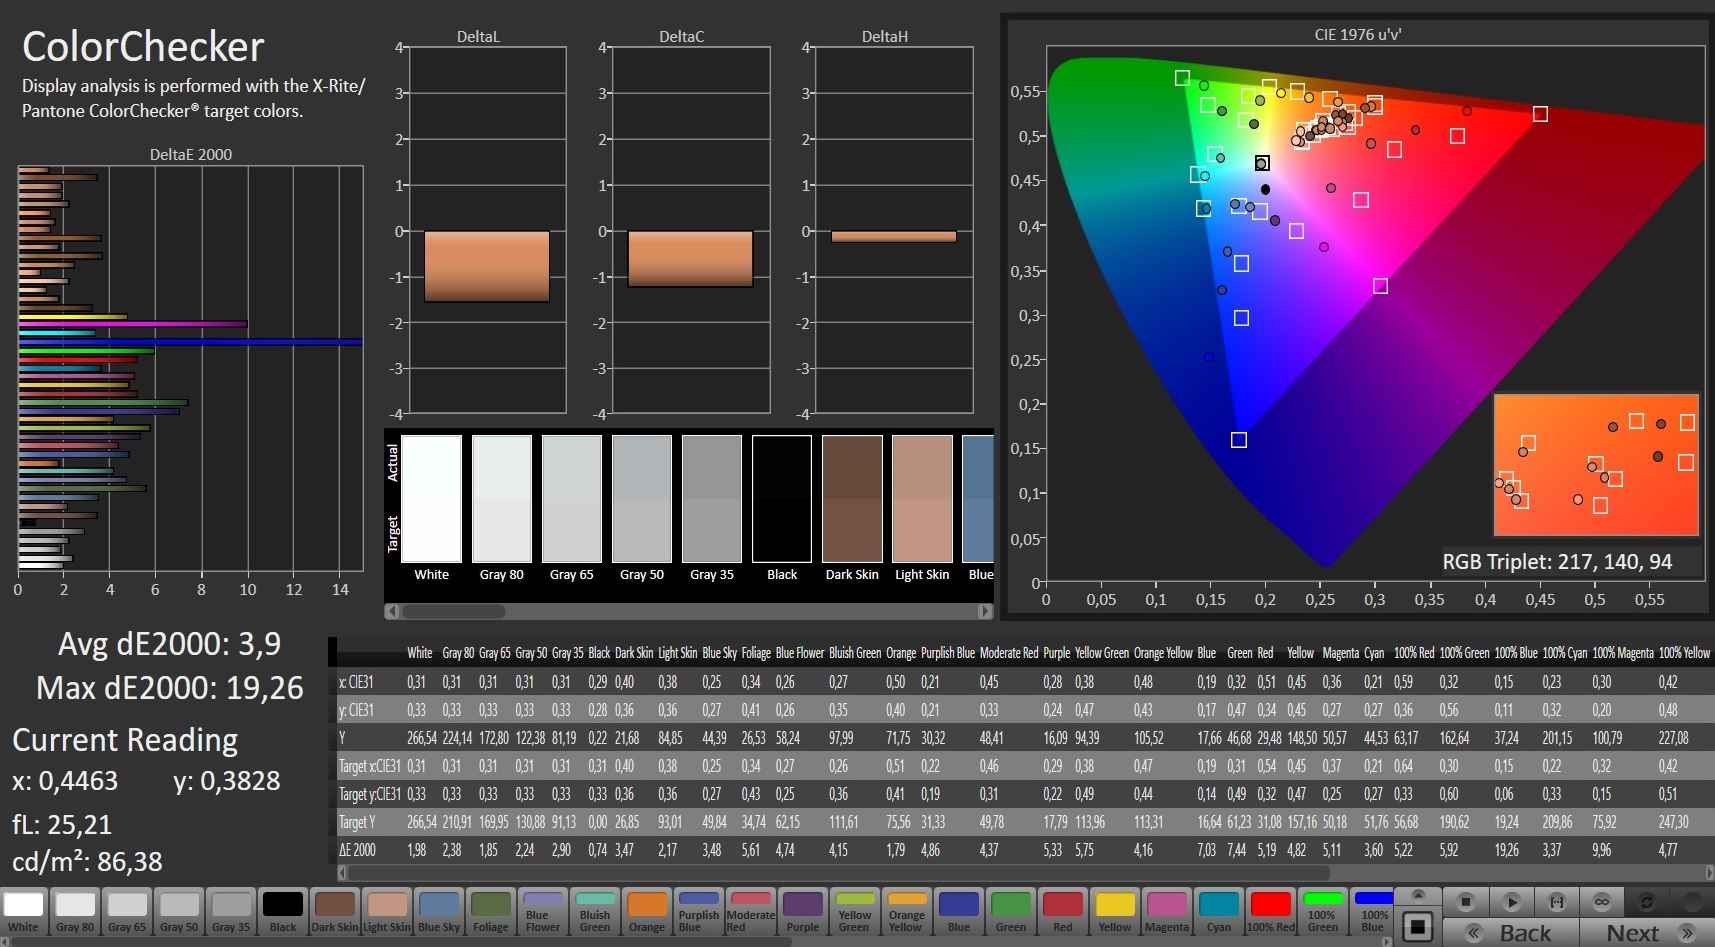
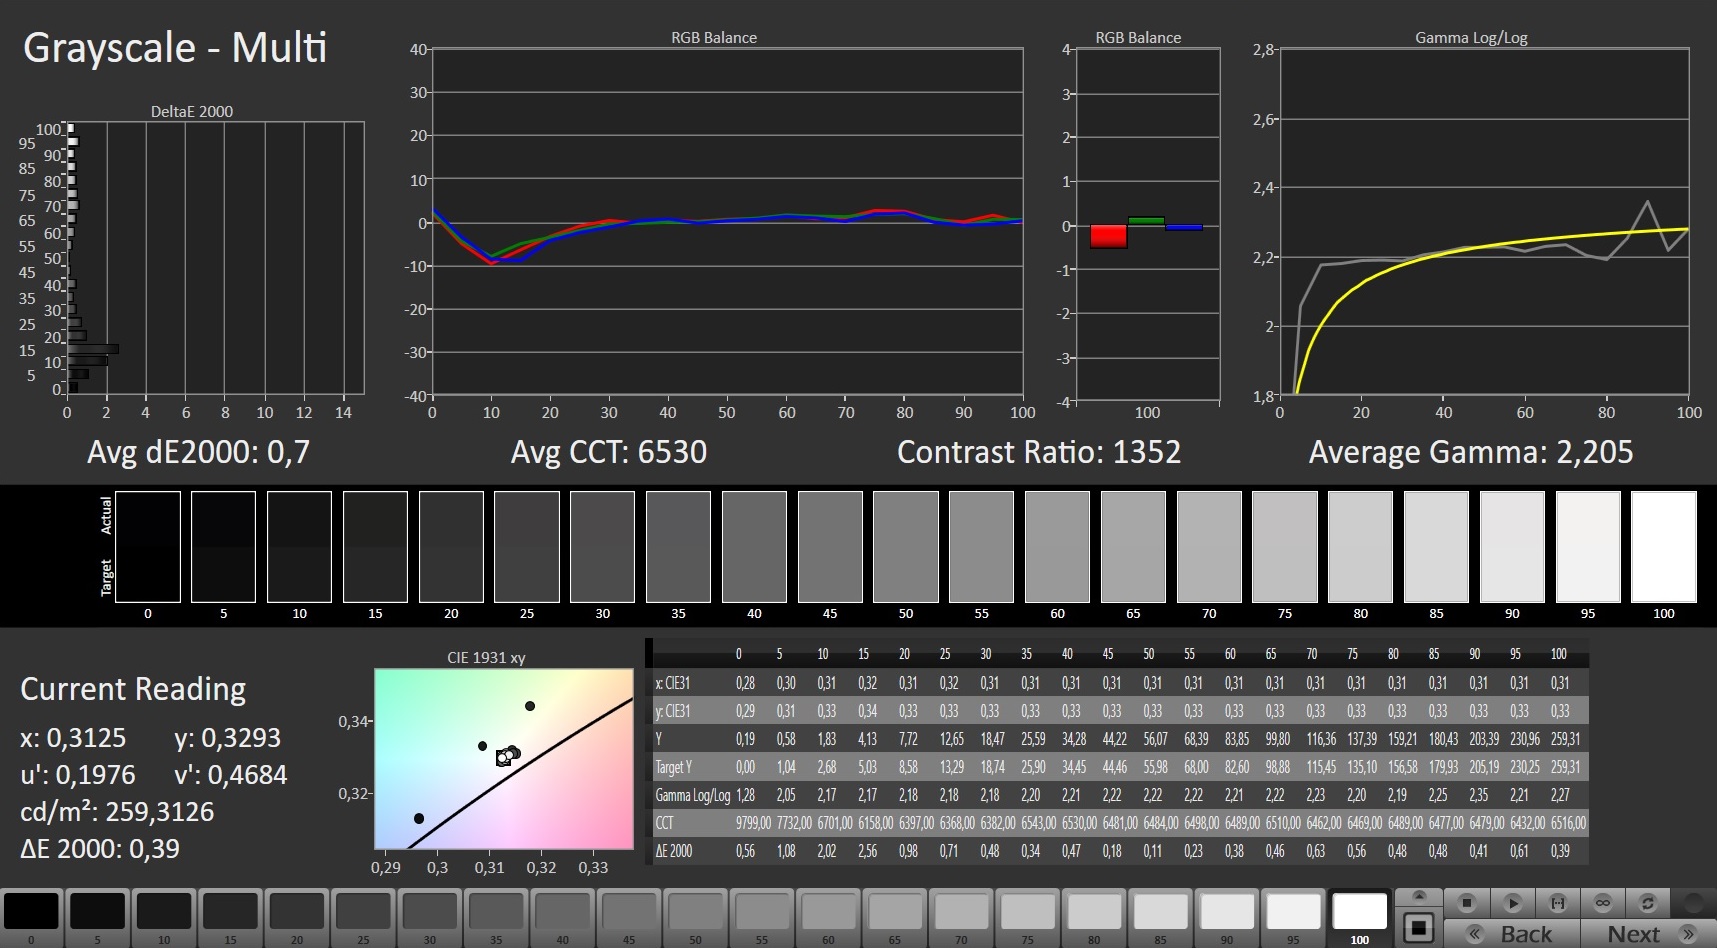
Si le contraste (1 374:1) de l'écran mat de 15,6 pouces (1 920 x 1 080 pixels) atteint l'objectif (> 1 000:1), la luminosité moyenne (245,7 cd/m²) est trop faible. Nous considérons que les valeurs supérieures à 300 cd/m² sont bonnes. La dalle 144 Hz présente des temps de réponse médiocres. Aucun scintillement PWM n'a été observé
| |||||||||||||||||||||||||
Homogénéité de la luminosité: 87 %
Valeur mesurée au centre, sur batterie: 261 cd/m²
Contraste: 1374:1 (Valeurs des noirs: 0.19 cd/m²)
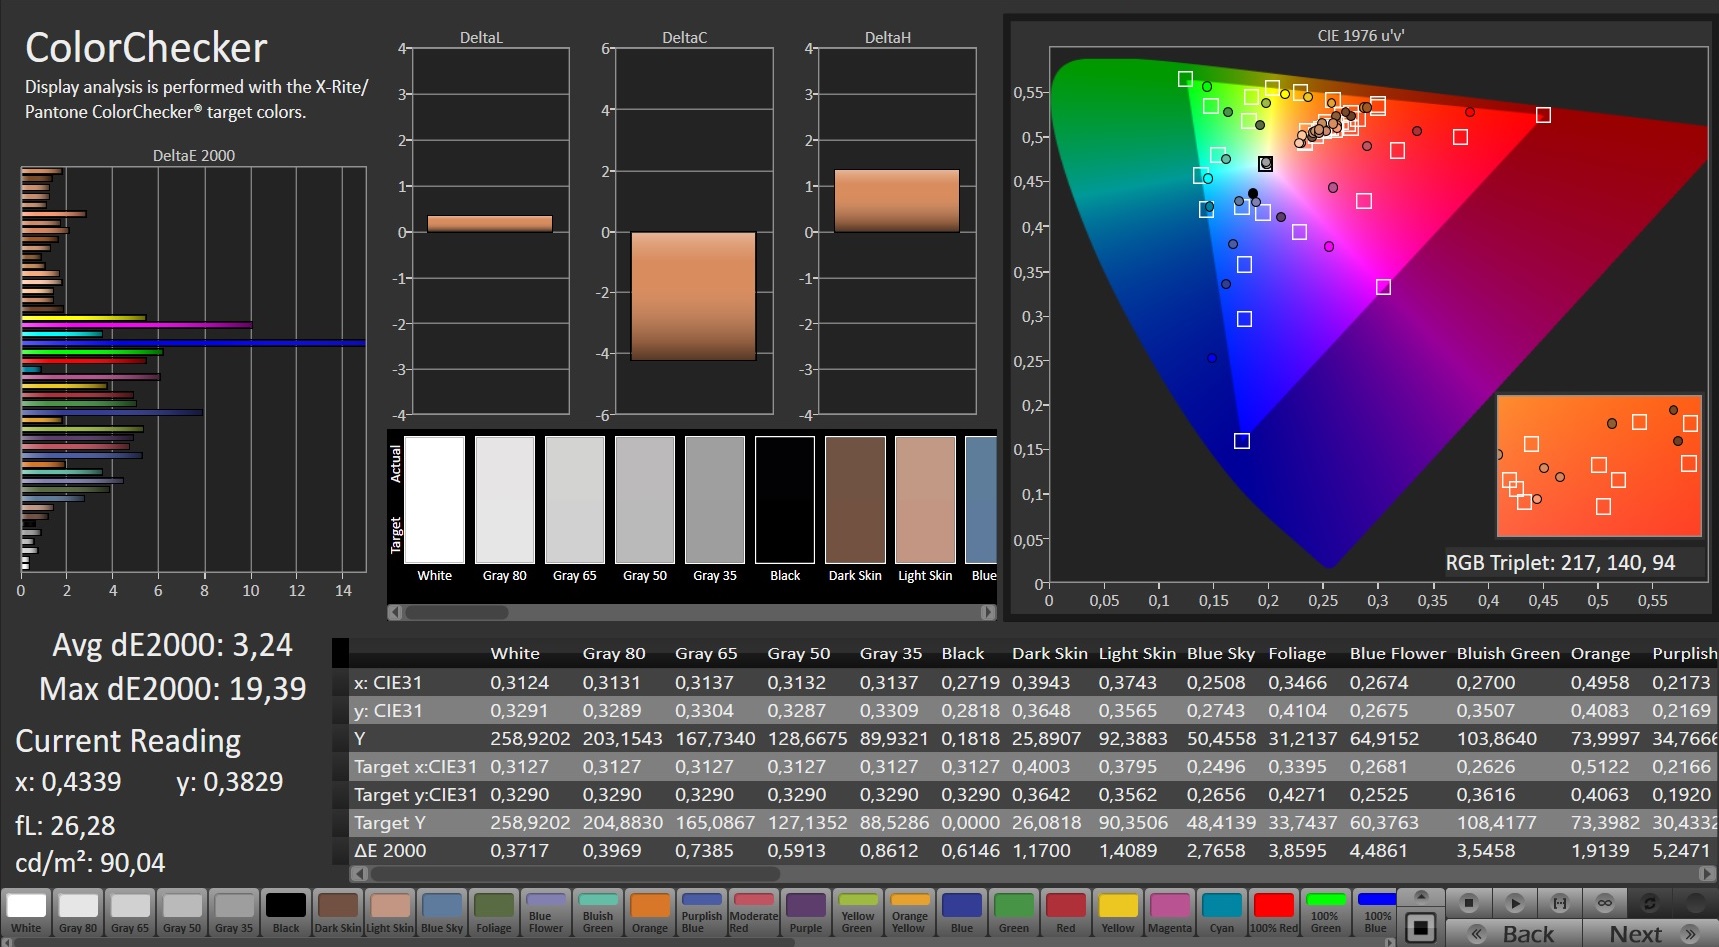
ΔE ColorChecker Calman: 3.9 | ∀{0.5-29.43 Ø4.71}
calibrated: 3.24
ΔE Greyscale Calman: 2.7 | ∀{0.09-98 Ø4.96}
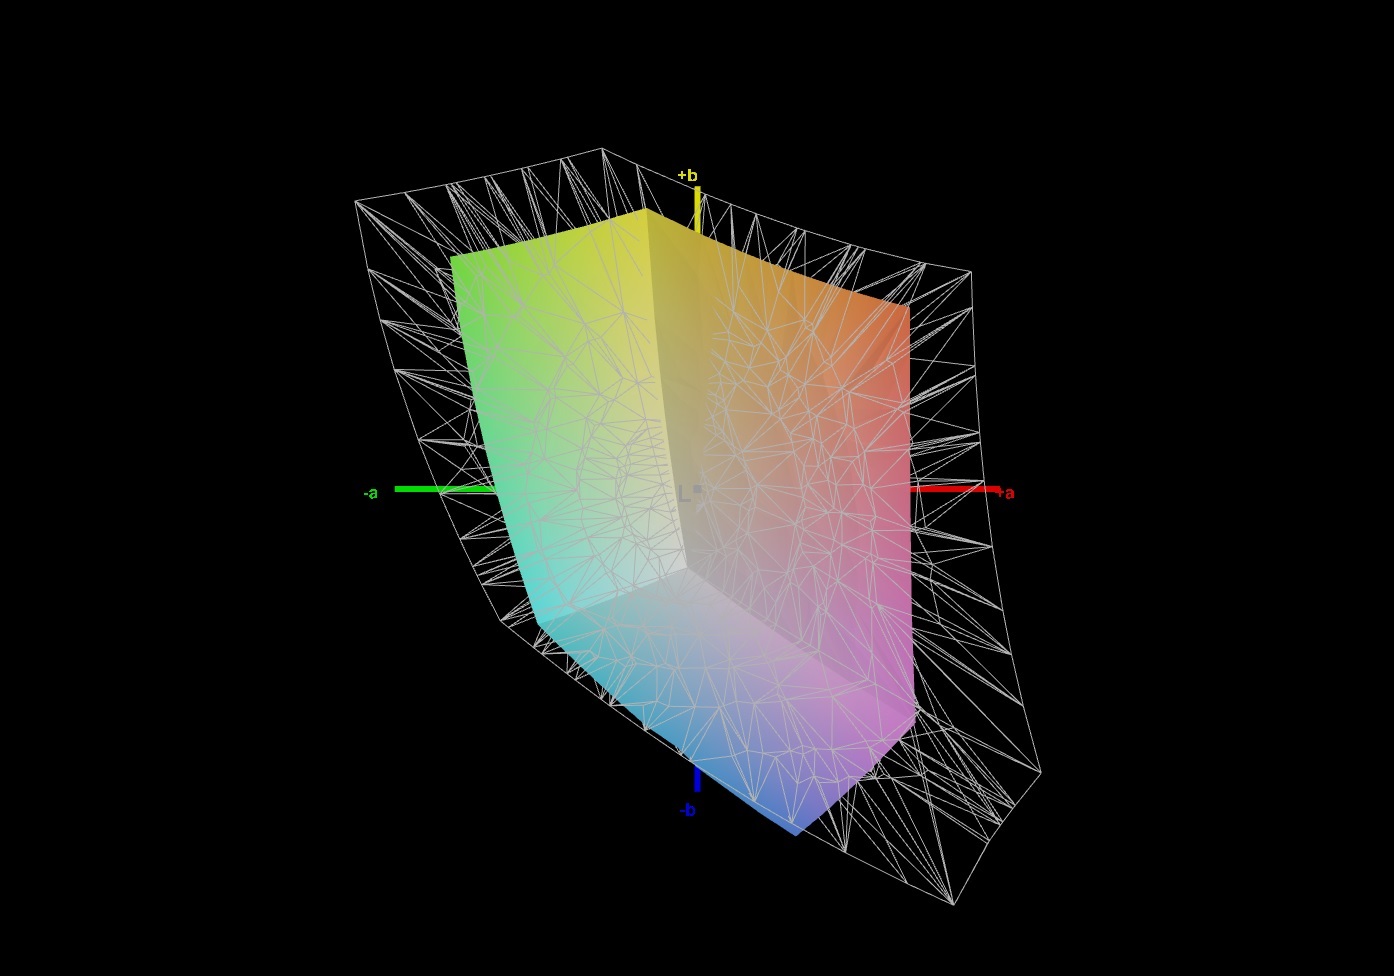
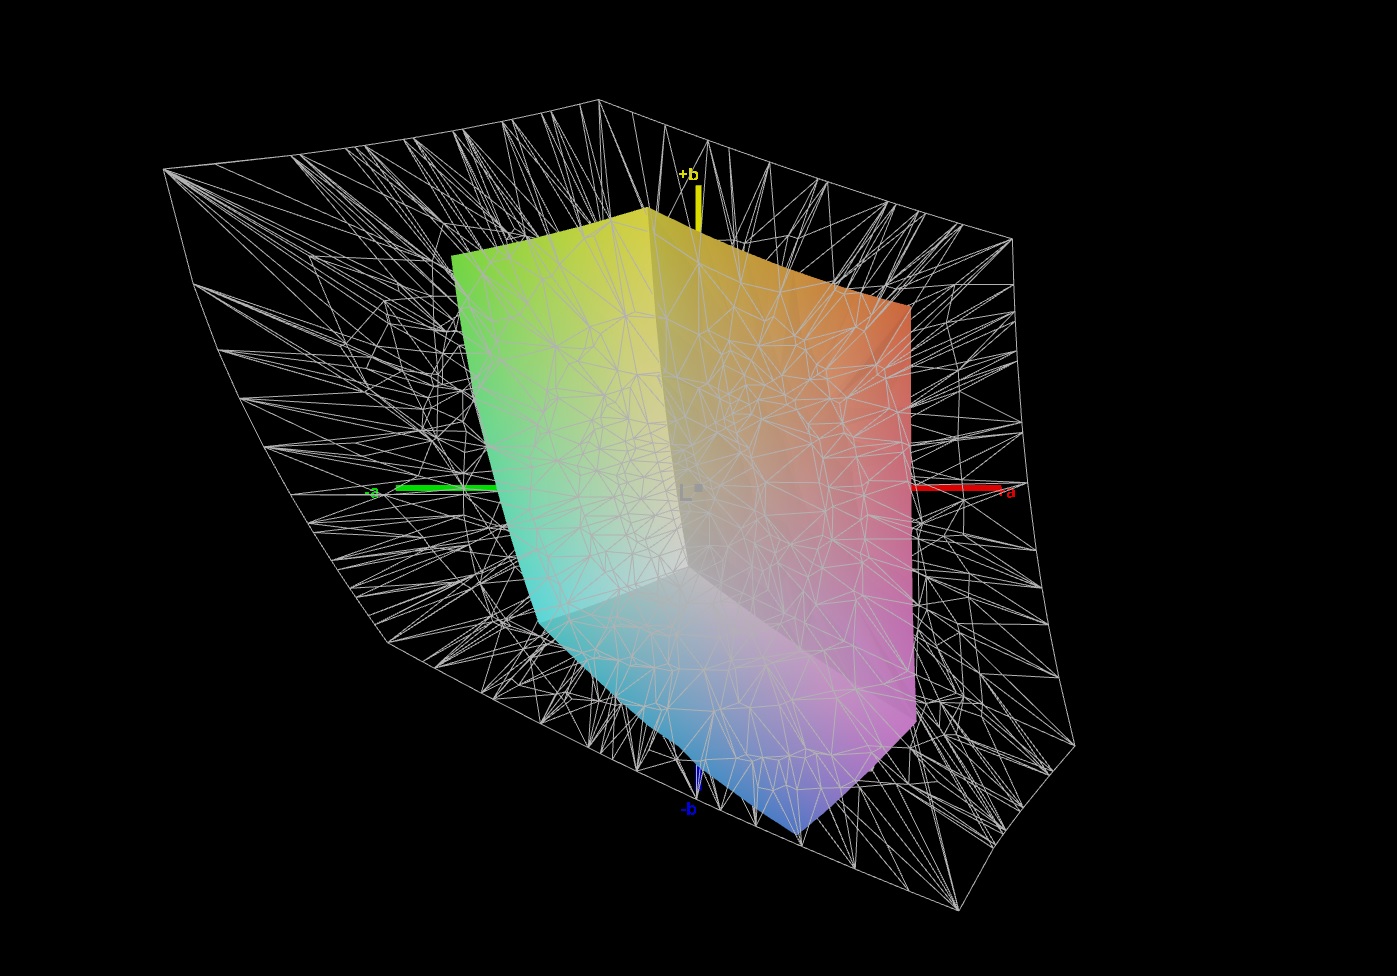
43.2% AdobeRGB 1998 (Argyll 3D)
62.3% sRGB (Argyll 3D)
41.8% Display P3 (Argyll 3D)
Gamma: 2.248
CCT: 6828 K
| Gigabyte G5 GD Chi Mei N156HRA-EA1, IPS, 1920x1080, 15.6" | Dell G15 5515 BOE092A, IPS, 1920x1080, 15.6" | Lenovo Legion 5 15ACH-82JU00C6GE-FL B156HAN12.H, , 1920x1080, 15.6" | MSI GF65 Thin 10UE AU Optronics B156HAN08.4, IPS, 1920x1080, 15.6" | Gigabyte G5 KC LM156LF-1F02, IPS, 1920x1080, 15.6" | |
|---|---|---|---|---|---|
| Display | -7% | 56% | -10% | 60% | |
| Display P3 Coverage (%) | 41.8 | 39.1 -6% | 65.4 56% | 37.65 -10% | 68.2 63% |
| sRGB Coverage (%) | 62.3 | 56.9 -9% | 96.3 55% | 56.3 -10% | 96.7 55% |
| AdobeRGB 1998 Coverage (%) | 43.2 | 40.4 -6% | 67.5 56% | 38.9 -10% | 69.6 61% |
| Response Times | 28% | 60% | -22% | 63% | |
| Response Time Grey 50% / Grey 80% * (ms) | 34.4 ? | 25.2 ? 27% | 13.6 ? 60% | 36.8 ? -7% | 10 ? 71% |
| Response Time Black / White * (ms) | 23.2 ? | 16.8 ? 28% | 9.2 ? 60% | 31.6 ? -36% | 10.4 ? 55% |
| PWM Frequency (Hz) | 200 ? | ||||
| Screen | -26% | 2% | -12% | -24% | |
| Brightness middle (cd/m²) | 261 | 278 7% | 350 34% | 266.5 2% | 295 13% |
| Brightness (cd/m²) | 246 | 262 7% | 350 42% | 262 7% | 275 12% |
| Brightness Distribution (%) | 87 | 83 -5% | 96 10% | 91 5% | 86 -1% |
| Black Level * (cd/m²) | 0.19 | 0.36 -89% | 0.3 -58% | 0.18 5% | 0.23 -21% |
| Contrast (:1) | 1374 | 772 -44% | 1167 -15% | 1481 8% | 1283 -7% |
| Colorchecker dE 2000 * | 3.9 | 5.74 -47% | 3.9 -0% | 5.33 -37% | 5.21 -34% |
| Colorchecker dE 2000 max. * | 19.26 | 19.63 -2% | 8.2 57% | 18.28 5% | 14.03 27% |
| Colorchecker dE 2000 calibrated * | 3.24 | 4.7 -45% | 1.6 51% | 4.36 -35% | 1.73 47% |
| Greyscale dE 2000 * | 2.7 | 3.1 -15% | 5.5 -104% | 4.5 -67% | 9.4 -248% |
| Gamma | 2.248 98% | 2.011 109% | 2.15 102% | 2.35 94% | 2.046 108% |
| CCT | 6828 95% | 6207 105% | 7414 88% | 6289 103% | 8002 81% |
| Color Space (Percent of AdobeRGB 1998) (%) | 35.6 | ||||
| Color Space (Percent of sRGB) (%) | 55.8 | ||||
| Moyenne finale (programmes/paramètres) | -2% /
-14% | 39% /
22% | -15% /
-13% | 33% /
7% |
* ... Moindre est la valeur, meilleures sont les performances
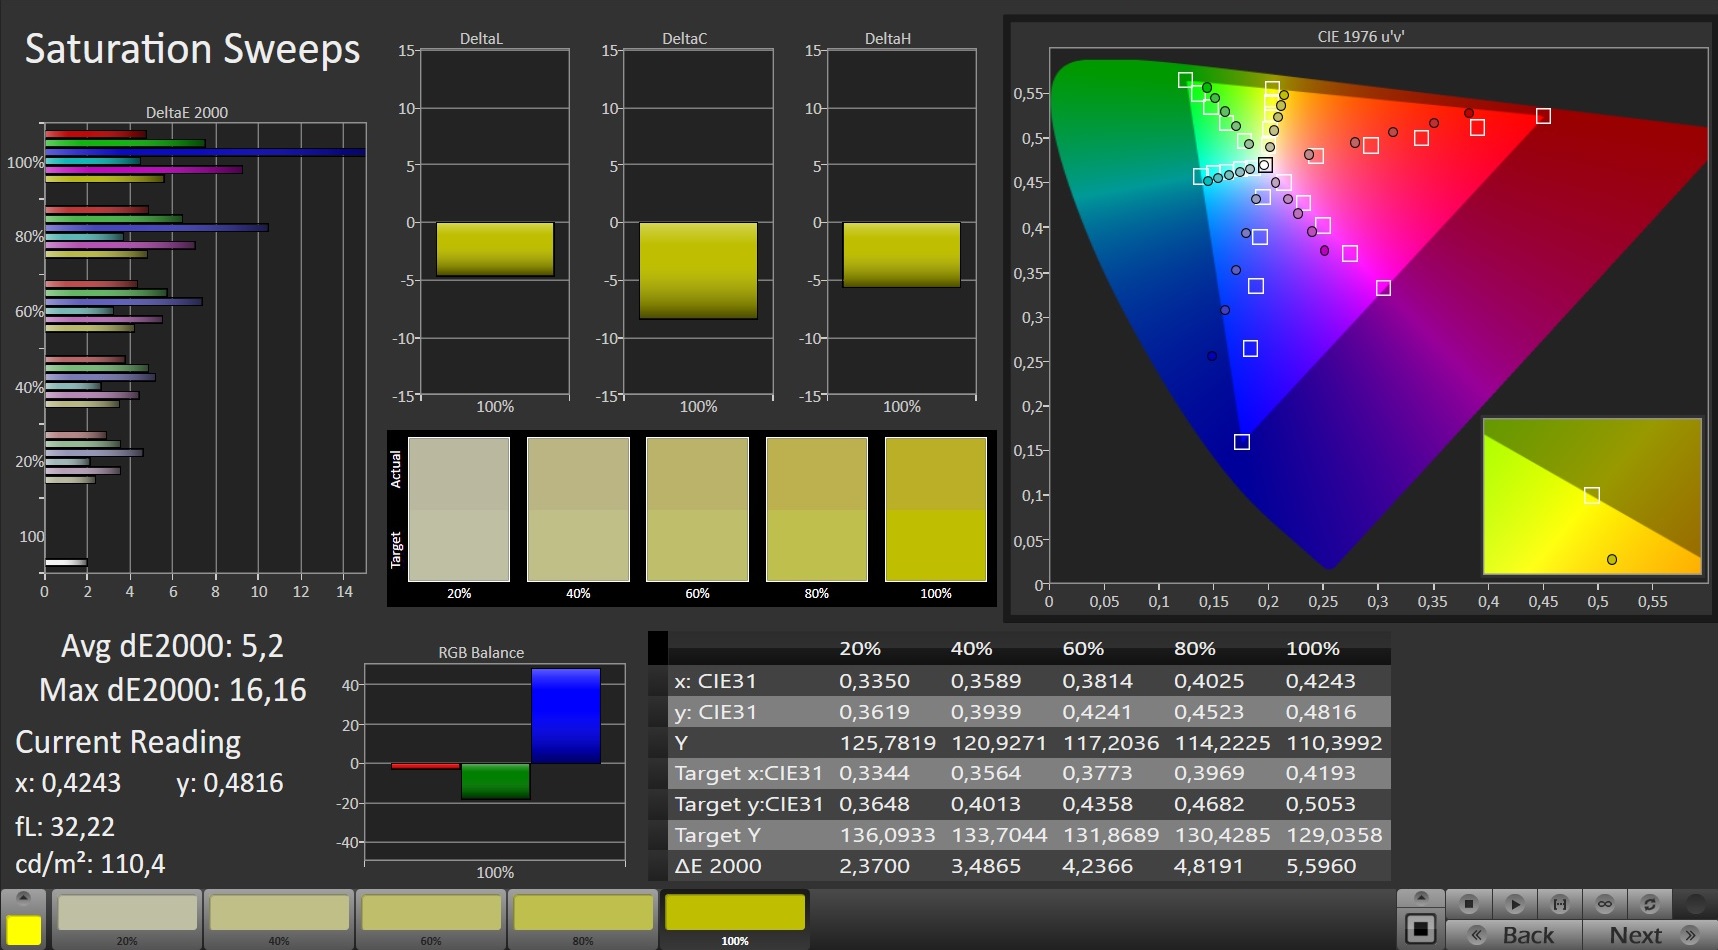
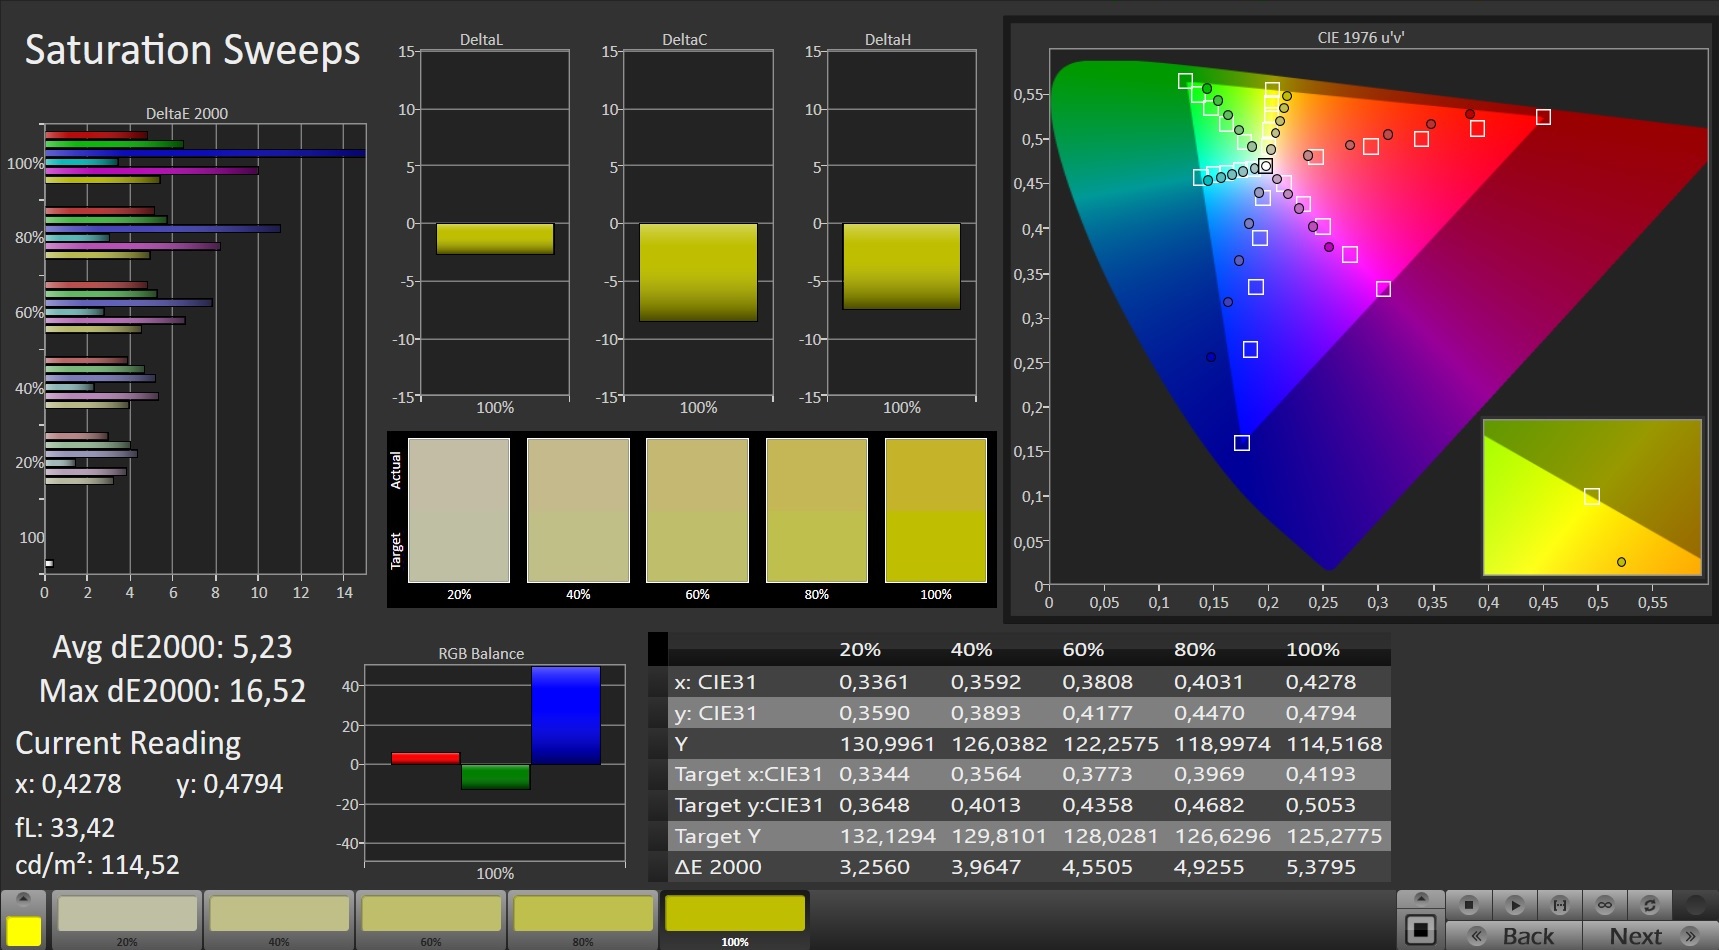
En sortie de boîte, la reproduction des couleurs s'écarte légèrement de l'objectif. Toutefois, cela n'est pas perceptible. L'étalonnage n'apporte que des améliorations mineures. En outre, le panneau ne souffre pas d'une teinte bleue. L'écran ne peut pas représenter les espaces couleur AdobeRGB (43 %), sRGB (62 %) et DCI-P3 (42 %)
Temps de réponse de l'écran
| ↔ Temps de réponse noir à blanc | ||
|---|---|---|
| 23.2 ms ... hausse ↗ et chute ↘ combinées | ↗ 13.2 ms hausse | 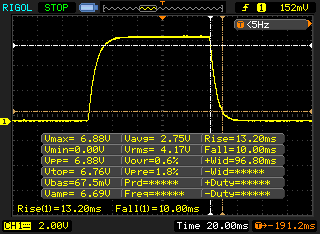 |
| ↘ 10 ms chute | ||
| L'écran montre de bons temps de réponse, mais insuffisant pour du jeu compétitif. En comparaison, tous les appareils testés affichent entre 0.1 (minimum) et 240 (maximum) ms. » 53 % des appareils testés affichent de meilleures performances. Cela signifie que les latences relevées sont moins bonnes que la moyenne (19.8 ms) de tous les appareils testés. | ||
| ↔ Temps de réponse gris 50% à gris 80% | ||
| 34.4 ms ... hausse ↗ et chute ↘ combinées | ↗ 16.4 ms hausse | 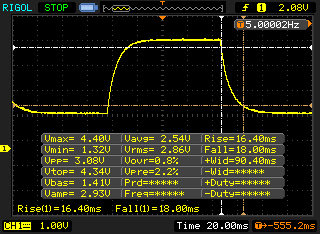 |
| ↘ 18 ms chute | ||
| L'écran souffre de latences très élevées, à éviter pour le jeu. En comparaison, tous les appareils testés affichent entre 0.165 (minimum) et 636 (maximum) ms. » 48 % des appareils testés affichent de meilleures performances. Cela signifie que les latences relevées sont moins bonnes que la moyenne (31 ms) de tous les appareils testés. | ||
Scintillement / MLI (Modulation de largeur d'impulsion)
| Scintillement / MLI (Modulation de largeur d'impulsion) non décelé | 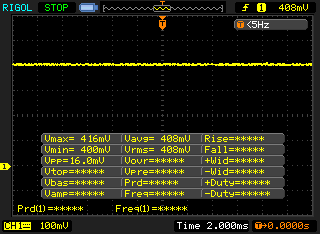 | ||
En comparaison, 52 % des appareils testés n'emploient pas MDI pour assombrir leur écran. Nous avons relevé une moyenne à 7754 (minimum : 5 - maximum : 343500) Hz dans le cas où une MDI était active. | |||
L'écran IPS à angle de vision stable peut être lu depuis n'importe quelle position. La lecture en extérieur est possible lorsque le soleil ne brille pas trop fort

Performances - Ordinateur portable Gigabyte avec toutes les performances de la RTX 3050
Le Gigabyte G5 GD est un ordinateur portable de jeu de 15,6 pouces qui permet d'afficher tous les jeux modernes à l'écran

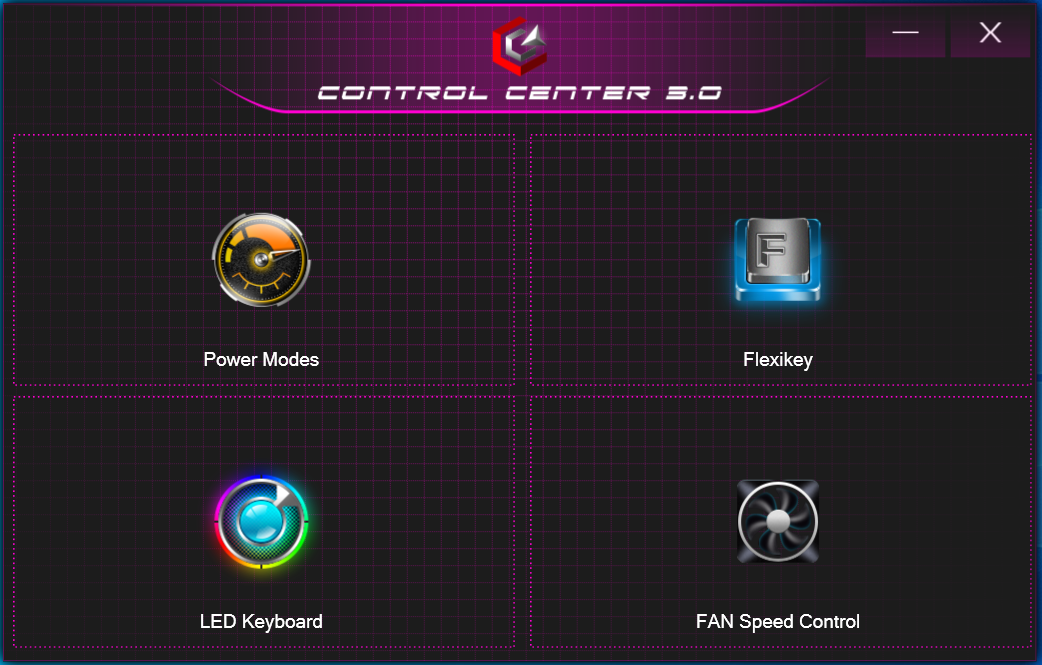
Conditions d'essai
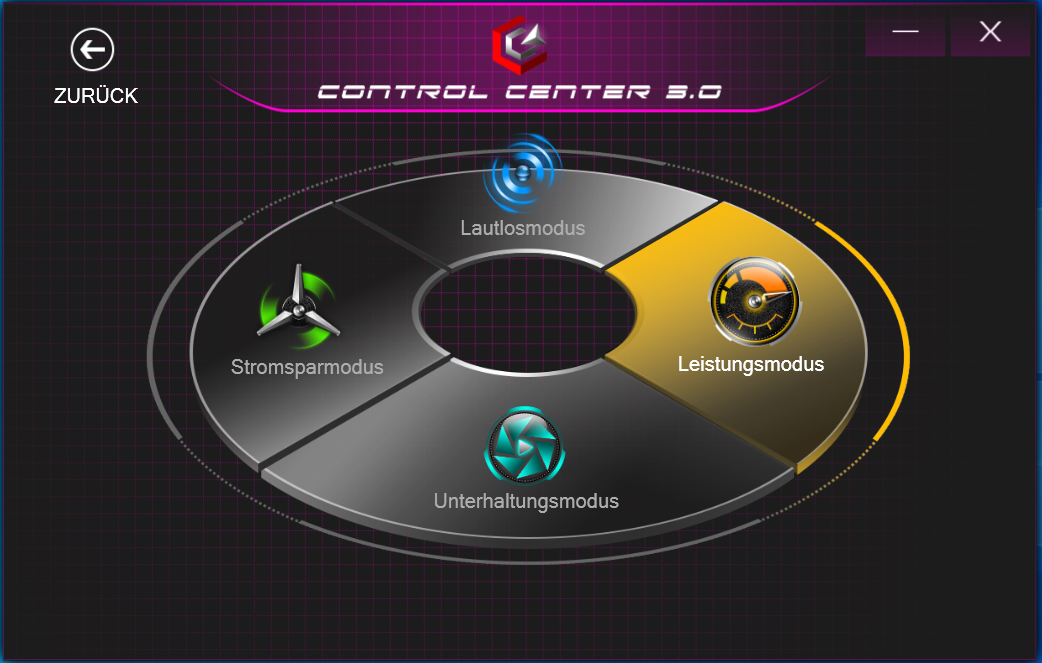
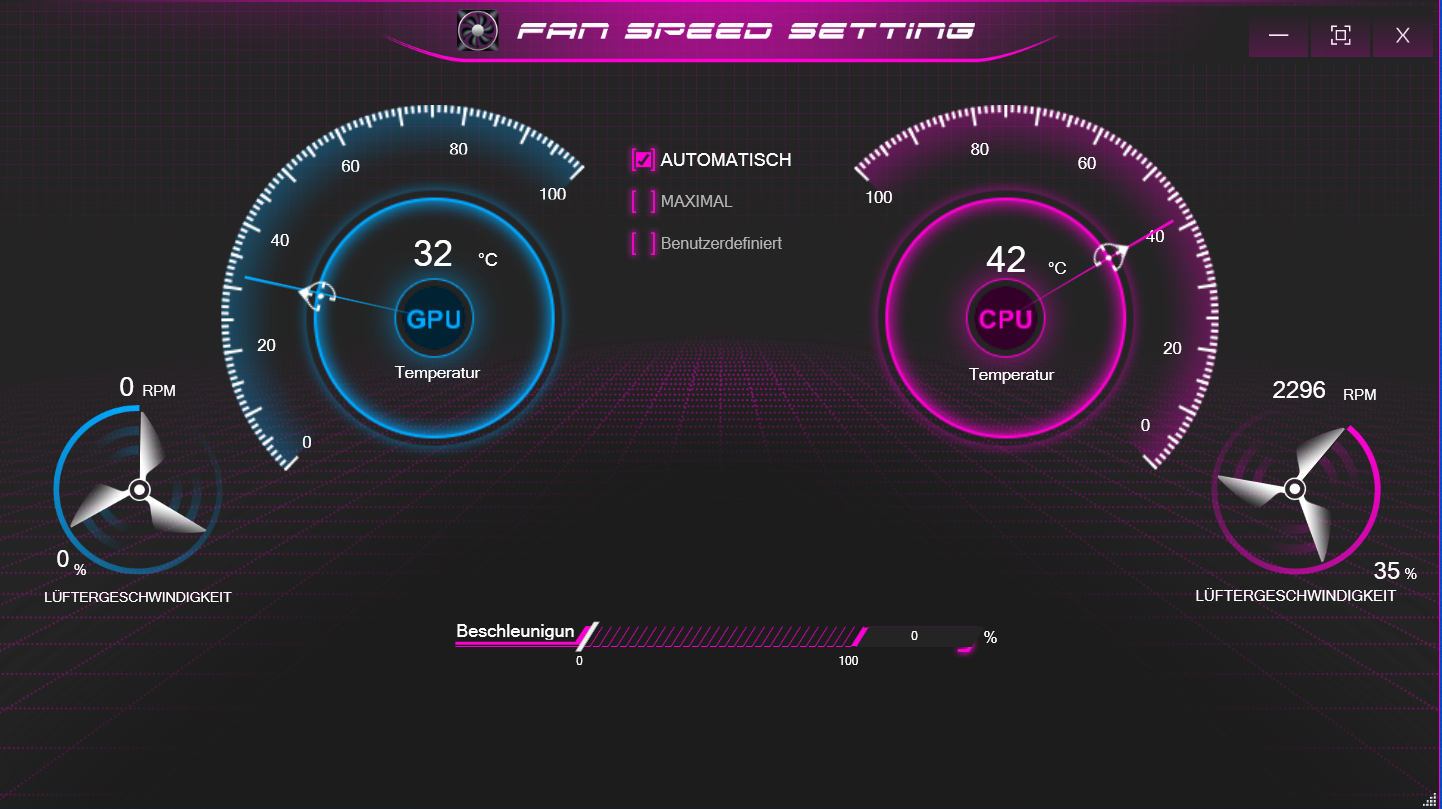
Le centre de contrôle préinstallé permet, entre autres, de choisir un profil de performance (voir tableau). Nous avons utilisé le profil "Entertainment Mode" incluant le contrôle automatique du ventilateur. Nous avons également effectué quelques benchmarks sous les profils "Performance Mode" et "Power Saving Mode". Les résultats se trouvent dans les tableaux comparatifs.
| Mode Performance | Mode Divertissement | Mode Economie d'énergie | Mode Silence | |
|---|---|---|---|---|
| Limite de puissance 1 | 60 watts | 45 watts | 30 watts | 15 watts |
| Limite de puissance 2 | 135 watts | 109 watts | 30 watts | 30 watts |

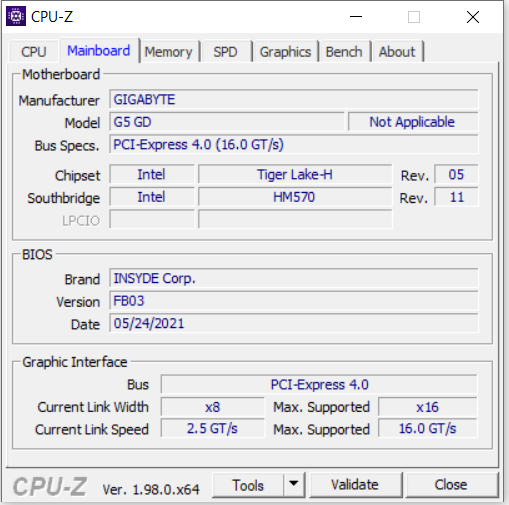
Conseils d'auto-assistance : Problèmes de BIOS avec le G5 GD
L'appareil de test qui nous a été fourni présentait un problème : l'accélération du processeur lors de l'exécution d'applications 3D. Cela se traduisait par des jeux saccadés, parfois dans une plus grande mesure, parfois dans une moindre mesure. Il a été possible de faire remonter le problème au BIOS : Sur les sept versions de BIOS publiées à ce jour, seules les trois premières (FB01 à FB03) fonctionnent sans problème - notre appareil de test était livré avec la version FB07 du BIOS. Par conséquent, nous avons finalement choisi d'installer la version FB03 du BIOS pour effectuer nos tests
Windows 10 ou Windows 11 - Cela dépend de la version du BIOS
Le G5 n'est compatible avec Windows 11 qu'à partir de la version FB06 du BIOS. Les versions antérieures provoquent le blocage de l'ordinateur portable avant même le démarrage effectif d'un système d'exploitation Windows 11 préalablement installé. Windows 10 fonctionne avec toutes les versions du BIOS.
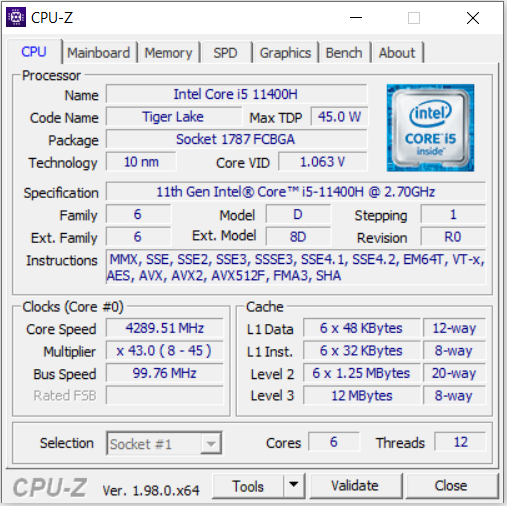
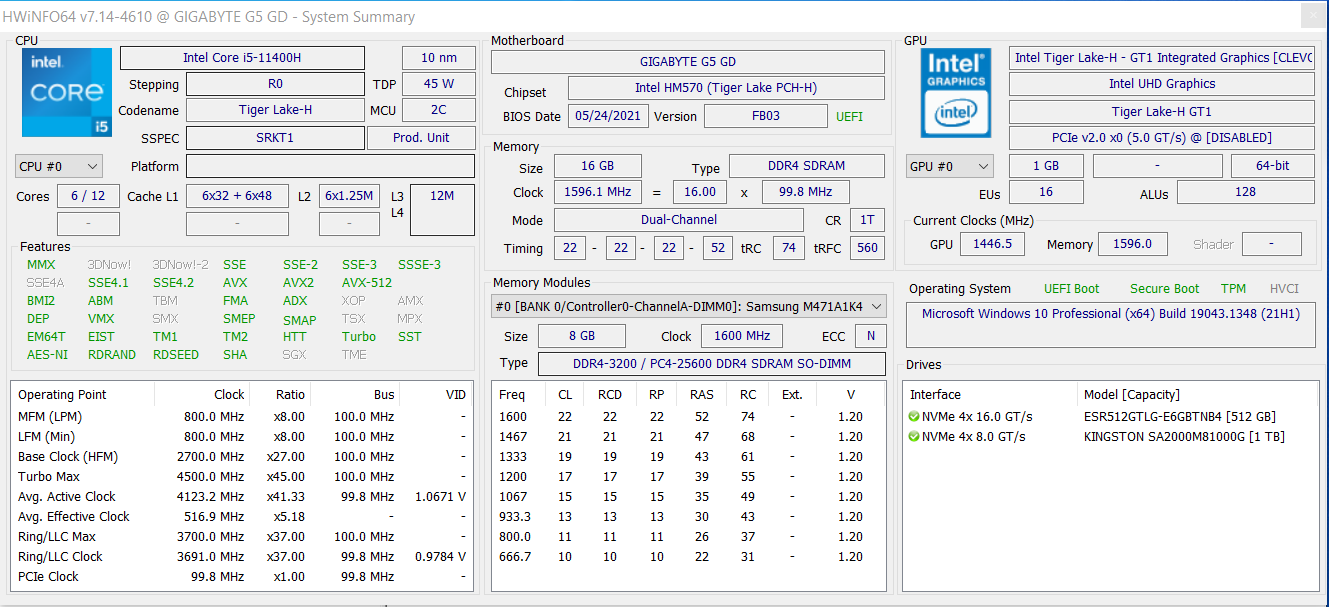
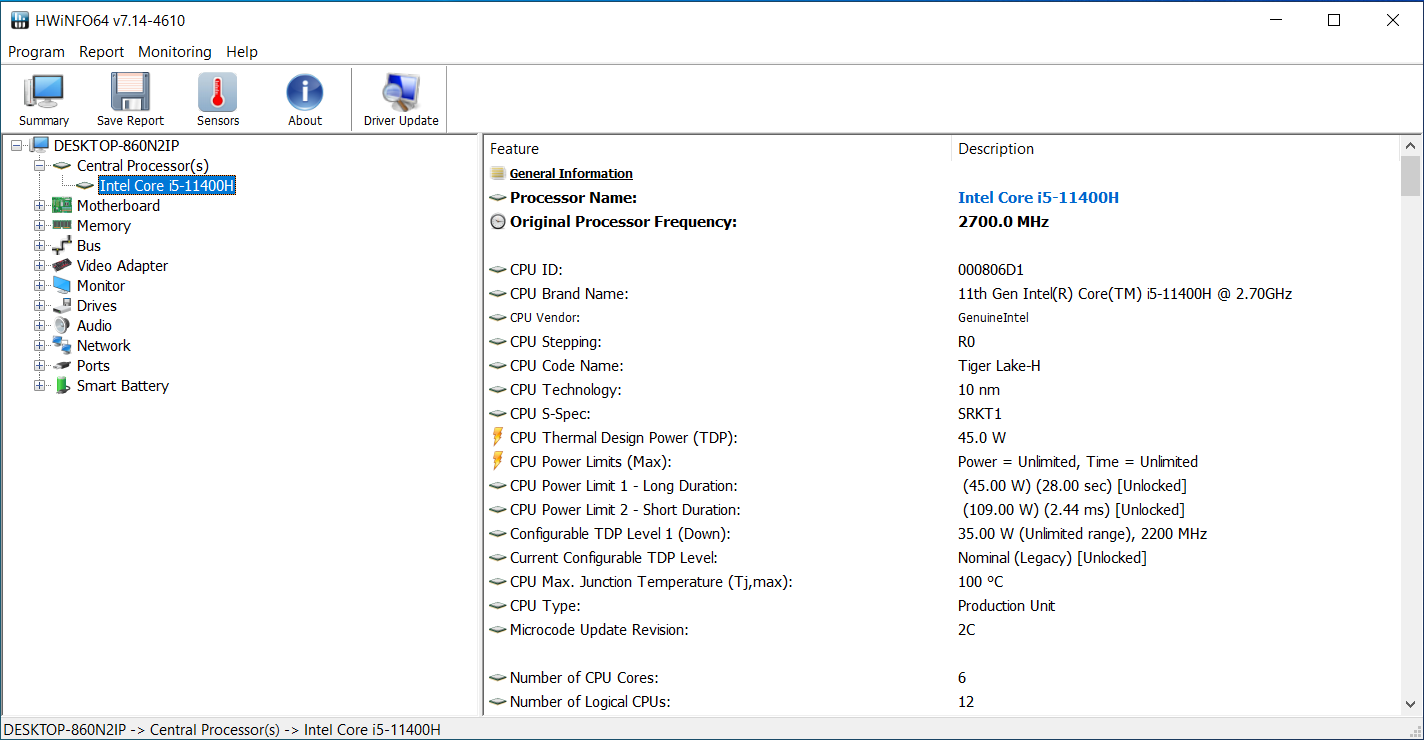
Processeur
Le processeur hexa-cœur Core i7-11400H (Tiger Lake) atteint des fréquences d'horloge de 4,1 GHz (six cœurs) à 4,5 GHz (un cœur). L'Hyper-Threading (deux threads par cœur) est pris en charge. Les tests CPU du benchmark CB R15 sont effectués à 4,1 GHz (multi) et 4,1 à 4,5 GHz (single). Les fréquences d'horloge sont de 1,9 à 2 GHz (multi) et de 3,1 à 4,5 GHz (single), respectivement, sur batterie
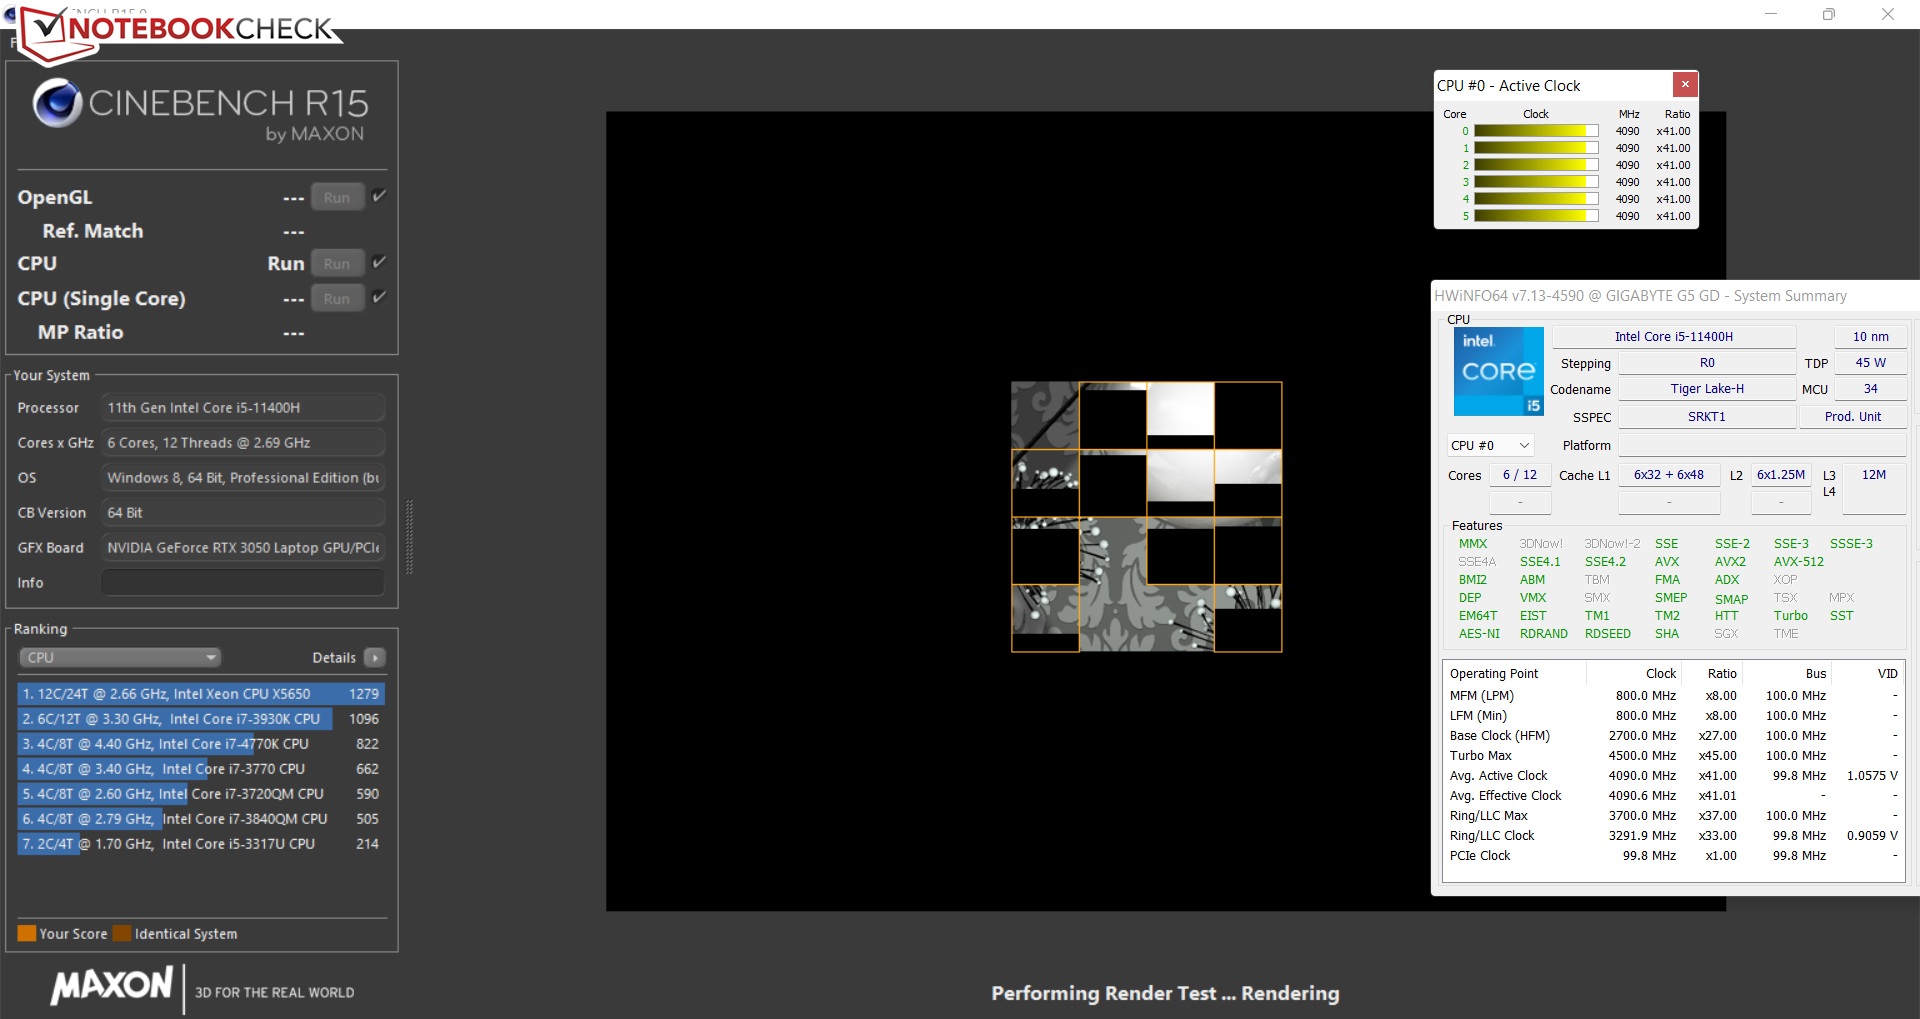
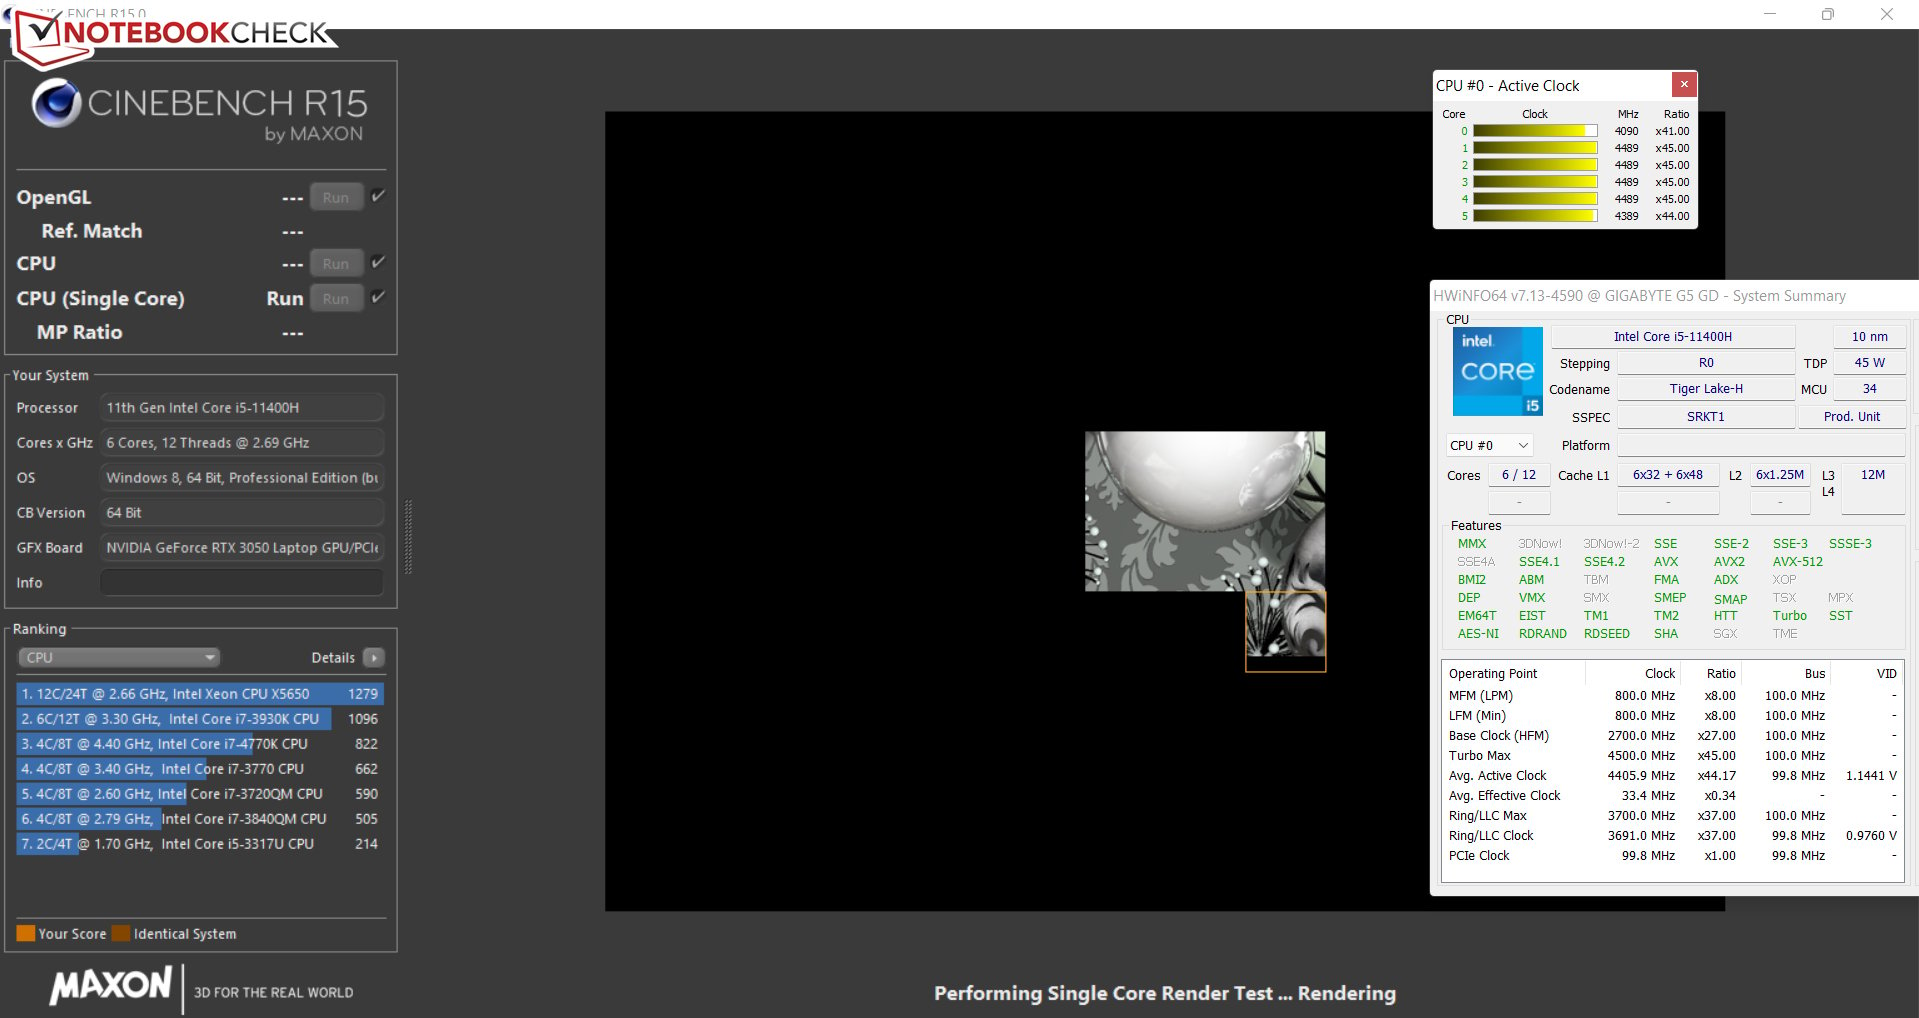
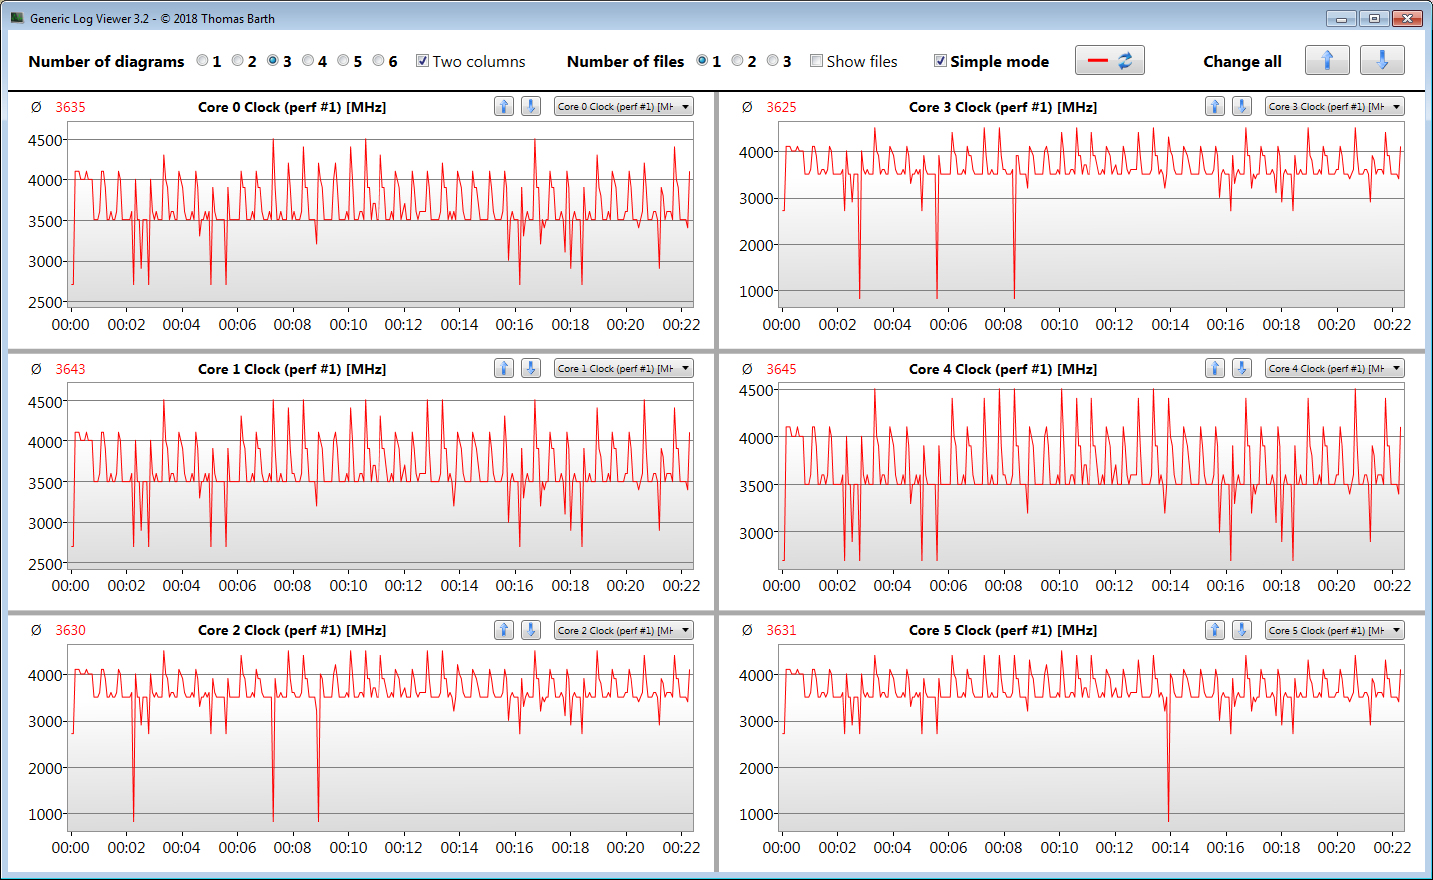
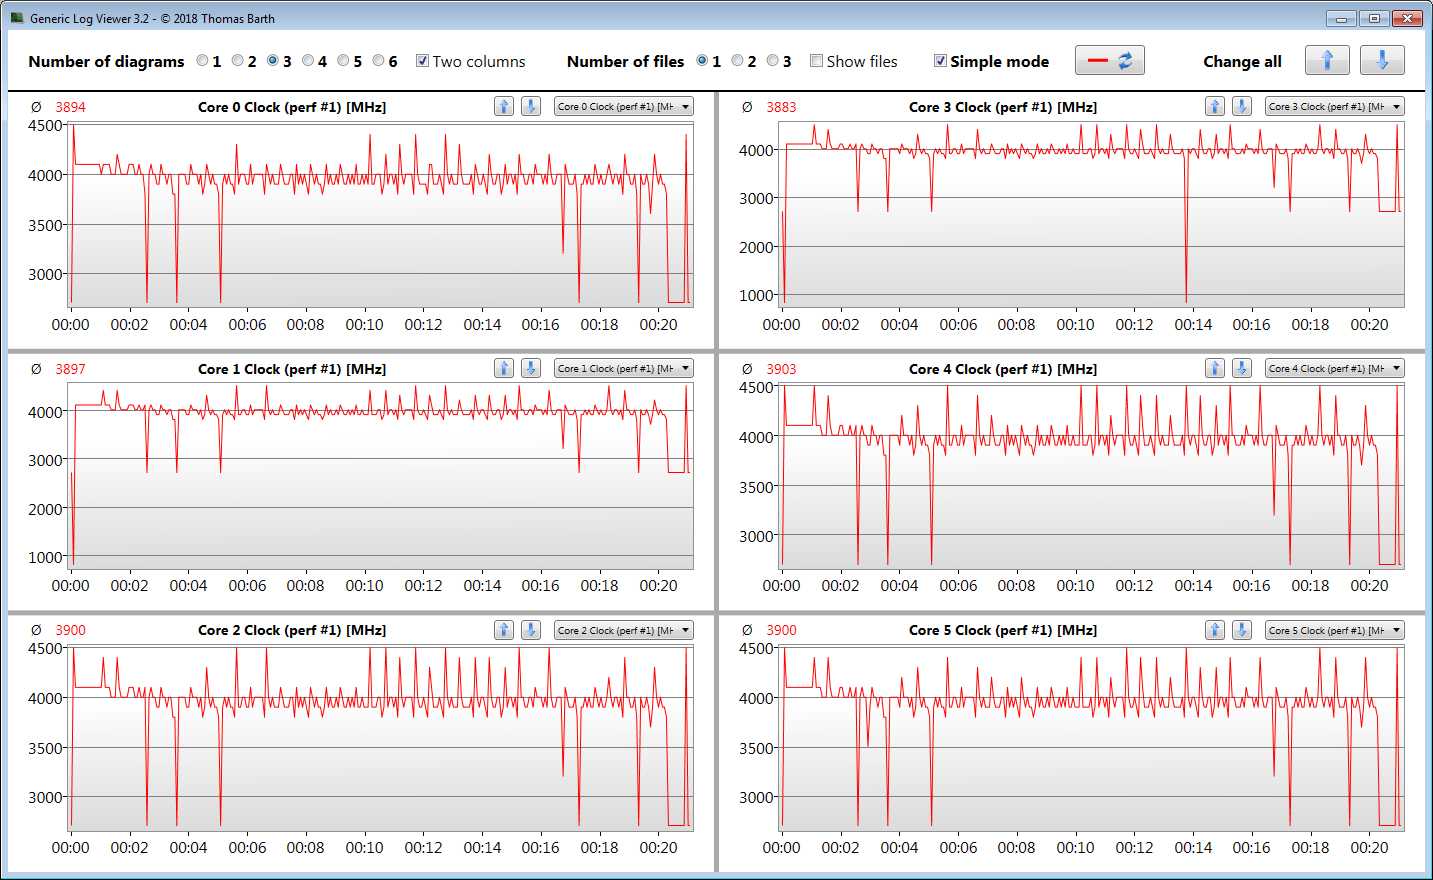
Le test d'endurance multiple Cinebench R15 (min. 30 minutes) montre que le CPU Turbo est utilisé en permanence - à un niveau moyen. Une légère augmentation de la fréquence d'horloge Turbo est obtenue en sélectionnant le profil "Performance Mode".
Impair : Alors que le profil "Performance Mode" augmente un peu les performances multithread, les performances single-thread diminuent en même temps. Cela pourrait être lié à la version obsolète du BIOS que nous avons dû installer.
Cinebench R15 Multi endurance test
| CPU Performance rating - Percent | |
| Moyenne de la classe Gaming | |
| Lenovo Legion 5 15ACH-82JU00C6GE-FL | |
| Dell G15 5515 | |
| Gigabyte G5 GD | |
| Gigabyte G5 GD | |
| Moyenne Intel Core i5-11400H | |
| Gigabyte G5 GD | |
| MSI GF65 Thin 10UE | |
| Gigabyte G5 KC | |
| Cinebench R23 | |
| Multi Core | |
| Moyenne de la classe Gaming (10488 - 42661, n=107, 2 dernières années) | |
| Lenovo Legion 5 15ACH-82JU00C6GE-FL | |
| Dell G15 5515 | |
| Gigabyte G5 GD (Leistungsmodus) | |
| Gigabyte G5 GD | |
| Moyenne Intel Core i5-11400H (6674 - 9406, n=7) | |
| MSI GF65 Thin 10UE | |
| Gigabyte G5 KC | |
| Gigabyte G5 GD (Stromsparmodus) | |
| Single Core | |
| Moyenne de la classe Gaming (1166 - 2415, n=107, 2 dernières années) | |
| Gigabyte G5 GD | |
| Gigabyte G5 GD (Stromsparmodus) | |
| Moyenne Intel Core i5-11400H (1349 - 1472, n=6) | |
| Dell G15 5515 | |
| Lenovo Legion 5 15ACH-82JU00C6GE-FL | |
| Gigabyte G5 GD (Leistungsmodus) | |
| MSI GF65 Thin 10UE | |
| Gigabyte G5 KC | |
| Cinebench R20 | |
| CPU (Multi Core) | |
| Moyenne de la classe Gaming (4029 - 16433, n=106, 2 dernières années) | |
| Lenovo Legion 5 15ACH-82JU00C6GE-FL | |
| Dell G15 5515 | |
| Gigabyte G5 GD (Leistungsmodus) | |
| Gigabyte G5 GD | |
| Moyenne Intel Core i5-11400H (2550 - 3740, n=7) | |
| Gigabyte G5 KC | |
| MSI GF65 Thin 10UE | |
| Gigabyte G5 GD (Stromsparmodus) | |
| CPU (Single Core) | |
| Moyenne de la classe Gaming (442 - 913, n=106, 2 dernières années) | |
| Gigabyte G5 GD | |
| Gigabyte G5 GD (Stromsparmodus) | |
| Moyenne Intel Core i5-11400H (522 - 569, n=6) | |
| Dell G15 5515 | |
| Lenovo Legion 5 15ACH-82JU00C6GE-FL | |
| Gigabyte G5 GD (Leistungsmodus) | |
| MSI GF65 Thin 10UE | |
| Gigabyte G5 KC | |
| Cinebench R15 | |
| CPU Multi 64Bit | |
| Moyenne de la classe Gaming (1578 - 6330, n=105, 2 dernières années) | |
| Lenovo Legion 5 15ACH-82JU00C6GE-FL | |
| Dell G15 5515 | |
| Gigabyte G5 GD (Leistungsmodus) | |
| Gigabyte G5 GD | |
| Moyenne Intel Core i5-11400H (1014 - 1532, n=7) | |
| Gigabyte G5 KC | |
| MSI GF65 Thin 10UE | |
| Gigabyte G5 GD (Stromsparmodus) | |
| CPU Single 64Bit | |
| Moyenne de la classe Gaming (188.8 - 350, n=106, 2 dernières années) | |
| Dell G15 5515 | |
| Lenovo Legion 5 15ACH-82JU00C6GE-FL | |
| Gigabyte G5 GD (Stromsparmodus) | |
| Gigabyte G5 GD | |
| Moyenne Intel Core i5-11400H (202 - 219, n=6) | |
| MSI GF65 Thin 10UE | |
| Gigabyte G5 GD (Leistungsmodus) | |
| Gigabyte G5 KC | |
| Blender - v2.79 BMW27 CPU | |
| Gigabyte G5 GD (Stromsparmodus) | |
| MSI GF65 Thin 10UE | |
| Moyenne Intel Core i5-11400H (340 - 483, n=6) | |
| Gigabyte G5 KC | |
| Gigabyte G5 GD | |
| Gigabyte G5 GD (Leistungsmodus) | |
| Dell G15 5515 | |
| Lenovo Legion 5 15ACH-82JU00C6GE-FL | |
| Moyenne de la classe Gaming (79 - 330, n=104, 2 dernières années) | |
| 7-Zip 18.03 | |
| 7z b 4 | |
| Moyenne de la classe Gaming (33491 - 148086, n=105, 2 dernières années) | |
| Dell G15 5515 | |
| Lenovo Legion 5 15ACH-82JU00C6GE-FL | |
| Gigabyte G5 GD (Leistungsmodus) | |
| Gigabyte G5 GD | |
| Moyenne Intel Core i5-11400H (27615 - 40268, n=6) | |
| MSI GF65 Thin 10UE | |
| Gigabyte G5 KC | |
| Gigabyte G5 GD (Stromsparmodus) | |
| 7z b 4 -mmt1 | |
| Moyenne de la classe Gaming (4199 - 7436, n=105, 2 dernières années) | |
| Dell G15 5515 | |
| Lenovo Legion 5 15ACH-82JU00C6GE-FL | |
| MSI GF65 Thin 10UE | |
| Gigabyte G5 GD | |
| Gigabyte G5 GD (Stromsparmodus) | |
| Moyenne Intel Core i5-11400H (4802 - 5343, n=6) | |
| Gigabyte G5 KC | |
| Gigabyte G5 GD (Leistungsmodus) | |
| Geekbench 5.5 | |
| Multi-Core | |
| Moyenne de la classe Gaming (6460 - 28263, n=105, 2 dernières années) | |
| Lenovo Legion 5 15ACH-82JU00C6GE-FL | |
| Dell G15 5515 | |
| Gigabyte G5 GD (Leistungsmodus) | |
| Gigabyte G5 GD | |
| MSI GF65 Thin 10UE | |
| Gigabyte G5 KC | |
| Gigabyte G5 KC | |
| Moyenne Intel Core i5-11400H (4679 - 7018, n=7) | |
| Gigabyte G5 GD (Stromsparmodus) | |
| Single-Core | |
| Moyenne de la classe Gaming (986 - 2474, n=105, 2 dernières années) | |
| Gigabyte G5 GD (Stromsparmodus) | |
| Gigabyte G5 GD | |
| Moyenne Intel Core i5-11400H (1396 - 1528, n=7) | |
| Lenovo Legion 5 15ACH-82JU00C6GE-FL | |
| Dell G15 5515 | |
| Gigabyte G5 GD (Leistungsmodus) | |
| MSI GF65 Thin 10UE | |
| Gigabyte G5 KC | |
| Gigabyte G5 KC | |
| HWBOT x265 Benchmark v2.2 - 4k Preset | |
| Moyenne de la classe Gaming (11.5 - 44.4, n=105, 2 dernières années) | |
| Lenovo Legion 5 15ACH-82JU00C6GE-FL | |
| Dell G15 5515 | |
| Gigabyte G5 GD (Leistungsmodus) | |
| Gigabyte G5 GD | |
| Moyenne Intel Core i5-11400H (8.19 - 11.3, n=6) | |
| MSI GF65 Thin 10UE | |
| Gigabyte G5 KC | |
| Gigabyte G5 GD (Stromsparmodus) | |
| LibreOffice - 20 Documents To PDF | |
| Lenovo Legion 5 15ACH-82JU00C6GE-FL | |
| Dell G15 5515 | |
| Gigabyte G5 KC | |
| Moyenne de la classe Gaming (33.2 - 88.8, n=105, 2 dernières années) | |
| Moyenne Intel Core i5-11400H (41.4 - 53, n=6) | |
| MSI GF65 Thin 10UE | |
| Gigabyte G5 GD (Leistungsmodus) | |
| Gigabyte G5 GD | |
| Gigabyte G5 GD (Stromsparmodus) | |
| R Benchmark 2.5 - Overall mean | |
| Gigabyte G5 KC | |
| Gigabyte G5 GD (Leistungsmodus) | |
| Moyenne Intel Core i5-11400H (0.581 - 0.644, n=6) | |
| MSI GF65 Thin 10UE | |
| Gigabyte G5 GD | |
| Gigabyte G5 GD (Stromsparmodus) | |
| Lenovo Legion 5 15ACH-82JU00C6GE-FL | |
| Dell G15 5515 | |
| Moyenne de la classe Gaming (0.3439 - 0.759, n=106, 2 dernières années) | |
* ... Moindre est la valeur, meilleures sont les performances
| Performance rating - Percent | |
| Moyenne de la classe Gaming | |
| Lenovo Legion 5 15ACH-82JU00C6GE-FL | |
| Dell G15 5515 | |
| Gigabyte G5 GD | |
| Gigabyte G5 GD | |
| Moyenne Intel Core i5-11400H | |
| Gigabyte G5 KC | |
Performance du système
Le système rapide et fluide offre une puissance de calcul suffisante pour toutes les tâches courantes - les jeux, le montage vidéo et le traitement d'images ne posent aucun problème majeur à l'ordinateur portable. Cela s'accompagne de bons résultats dans PCMark
| PCMark 8 Home Score Accelerated v2 | 4312 points | |
| PCMark 8 Creative Score Accelerated v2 | 5850 points | |
| PCMark 8 Work Score Accelerated v2 | 6010 points | |
| PCMark 10 Score | 5895 points | |
Aide | ||
| PCMark 10 / Score | |
| Moyenne de la classe Gaming (5828 - 12414, n=93, 2 dernières années) | |
| Lenovo Legion 5 15ACH-82JU00C6GE-FL | |
| Dell G15 5515 | |
| Gigabyte G5 KC | |
| Gigabyte G5 GD | |
| Moyenne Intel Core i5-11400H, NVIDIA GeForce RTX 3050 4GB Laptop GPU (5136 - 5895, n=2) | |
| MSI GF65 Thin 10UE | |
| PCMark 10 / Essentials | |
| Moyenne de la classe Gaming (8810 - 11935, n=97, 2 dernières années) | |
| Lenovo Legion 5 15ACH-82JU00C6GE-FL | |
| Dell G15 5515 | |
| Gigabyte G5 GD | |
| MSI GF65 Thin 10UE | |
| Gigabyte G5 KC | |
| Moyenne Intel Core i5-11400H, NVIDIA GeForce RTX 3050 4GB Laptop GPU (8610 - 9155, n=2) | |
| PCMark 10 / Productivity | |
| Moyenne de la classe Gaming (6845 - 25323, n=95, 2 dernières années) | |
| Lenovo Legion 5 15ACH-82JU00C6GE-FL | |
| Dell G15 5515 | |
| Gigabyte G5 GD | |
| Moyenne Intel Core i5-11400H, NVIDIA GeForce RTX 3050 4GB Laptop GPU (8149 - 8506, n=2) | |
| Gigabyte G5 KC | |
| MSI GF65 Thin 10UE | |
| PCMark 10 / Digital Content Creation | |
| Moyenne de la classe Gaming (7602 - 19954, n=95, 2 dernières années) | |
| Gigabyte G5 KC | |
| Lenovo Legion 5 15ACH-82JU00C6GE-FL | |
| Dell G15 5515 | |
| Gigabyte G5 GD | |
| Moyenne Intel Core i5-11400H, NVIDIA GeForce RTX 3050 4GB Laptop GPU (5242 - 7140, n=2) | |
| MSI GF65 Thin 10UE | |
| AIDA64 / Memory Copy | |
| Moyenne de la classe Gaming (21750 - 129946, n=105, 2 dernières années) | |
| Gigabyte G5 GD | |
| Dell G15 5515 | |
| Lenovo Legion 5 15ACH-82JU00C6GE-FL | |
| Gigabyte G5 KC | |
| Moyenne Intel Core i5-11400H (20513 - 42471, n=4) | |
| AIDA64 / Memory Read | |
| Moyenne de la classe Gaming (22956 - 118858, n=105, 2 dernières années) | |
| Gigabyte G5 GD | |
| Dell G15 5515 | |
| Lenovo Legion 5 15ACH-82JU00C6GE-FL | |
| Gigabyte G5 KC | |
| Moyenne Intel Core i5-11400H (23172 - 48221, n=4) | |
| AIDA64 / Memory Write | |
| Moyenne de la classe Gaming (22297 - 135096, n=105, 2 dernières années) | |
| Gigabyte G5 GD | |
| Gigabyte G5 KC | |
| Dell G15 5515 | |
| Moyenne Intel Core i5-11400H (21862 - 45893, n=4) | |
| Lenovo Legion 5 15ACH-82JU00C6GE-FL | |
| AIDA64 / Memory Latency | |
| Moyenne de la classe Gaming (75.3 - 259, n=105, 2 dernières années) | |
| Gigabyte G5 GD | |
| Lenovo Legion 5 15ACH-82JU00C6GE-FL | |
| Dell G15 5515 | |
| Moyenne Intel Core i5-11400H (73.3 - 95.9, n=5) | |
| Gigabyte G5 KC | |
* ... Moindre est la valeur, meilleures sont les performances
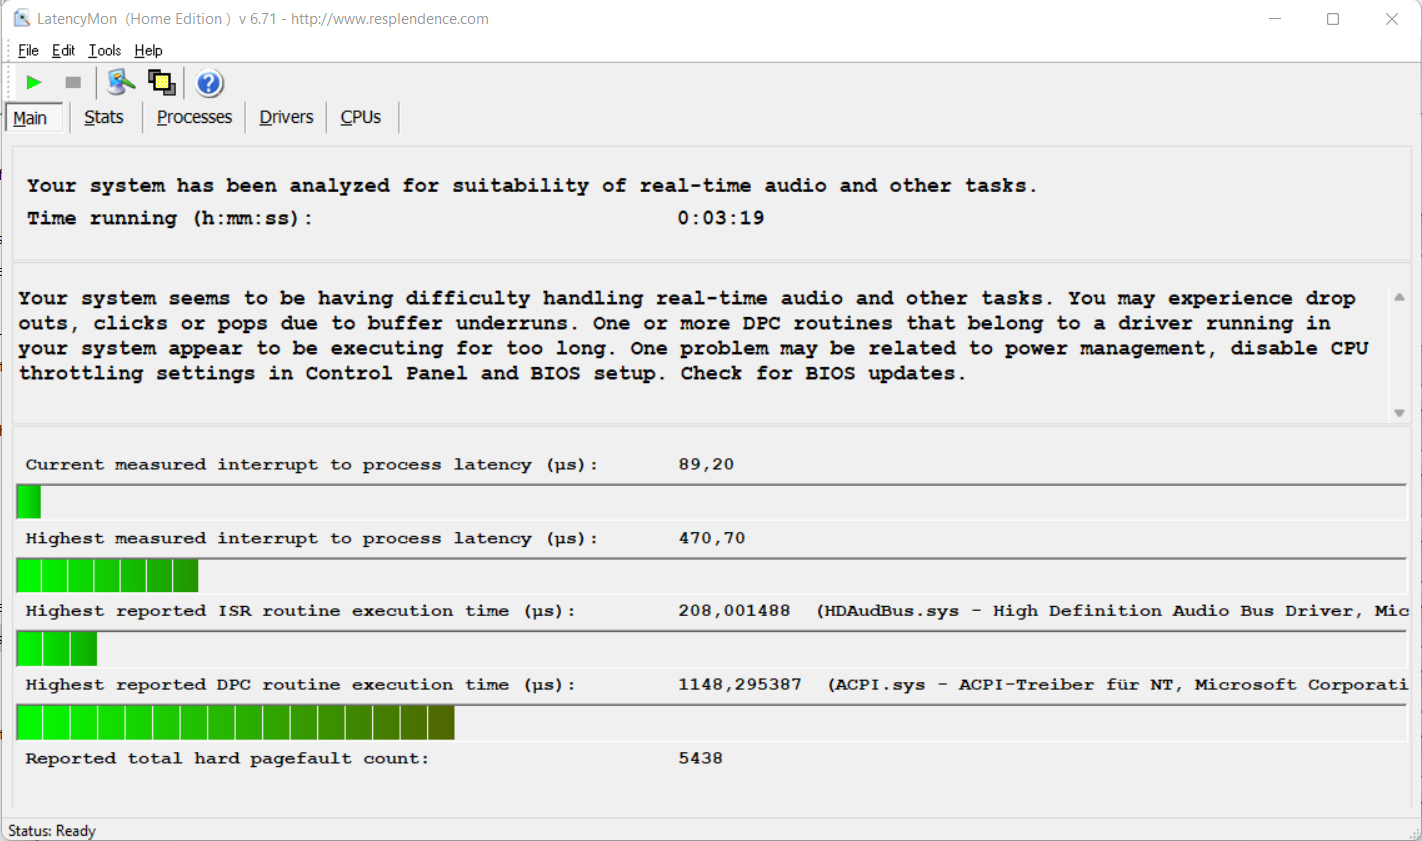
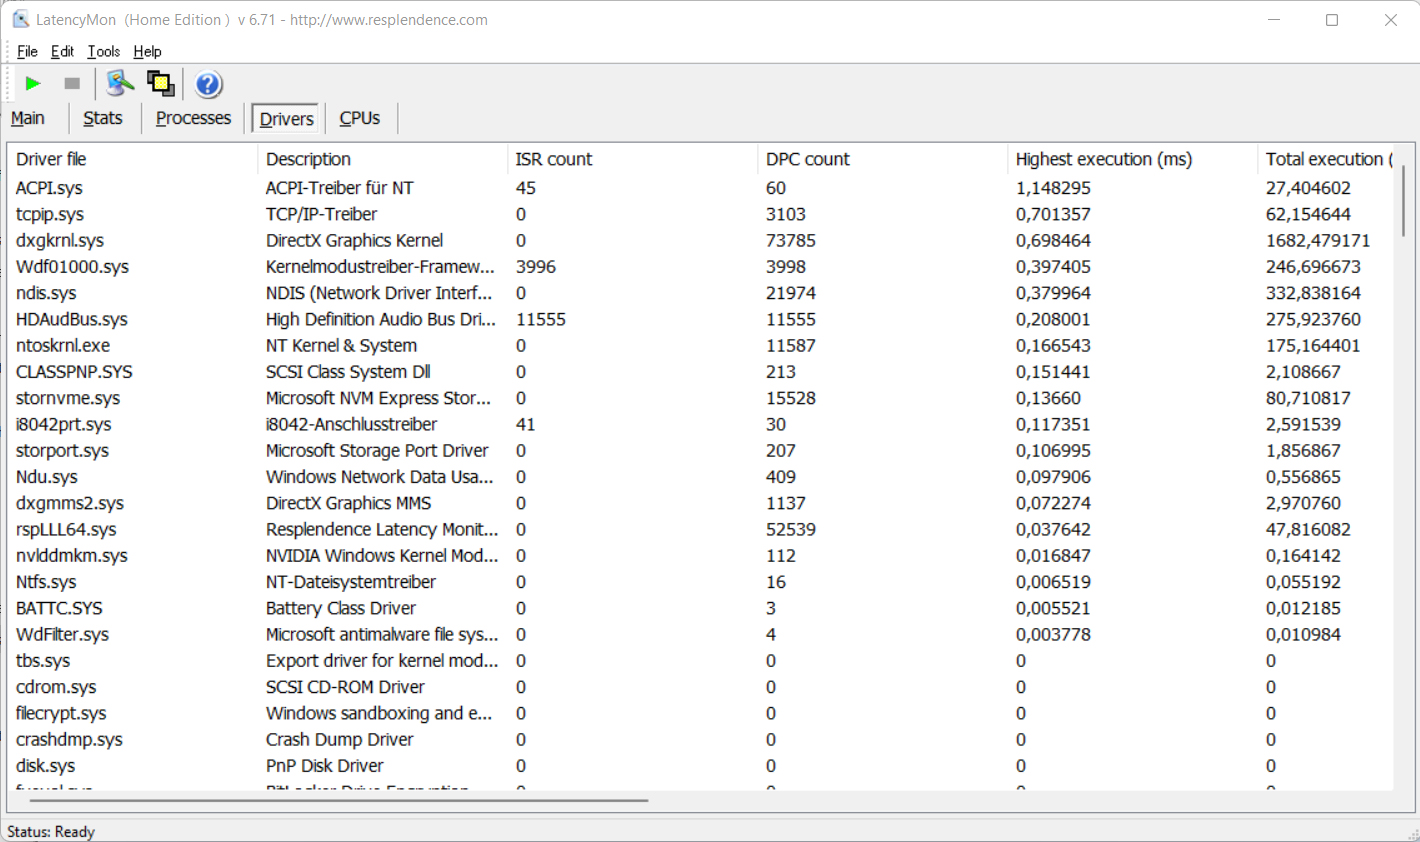
Latences DPC
Notre test de contrôle de latence standardisé (navigation web, lecture vidéo 4K, Prime95 à forte charge) a révélé des irrégularités au niveau des latences DPC. Le système ne semble pas être adapté à l'édition vidéo et audio en temps réel. Les futures mises à jour logicielles pourraient conduire à des améliorations ou même à une dégradation des performances
| DPC Latencies / LatencyMon - interrupt to process latency (max), Web, Youtube, Prime95 | |
| MSI GF65 Thin 10UE | |
| Lenovo Legion 5 15ACH-82JU00C6GE-FL | |
| Dell G15 5515 | |
| Gigabyte G5 KC | |
| Gigabyte G5 GD | |
* ... Moindre est la valeur, meilleures sont les performances
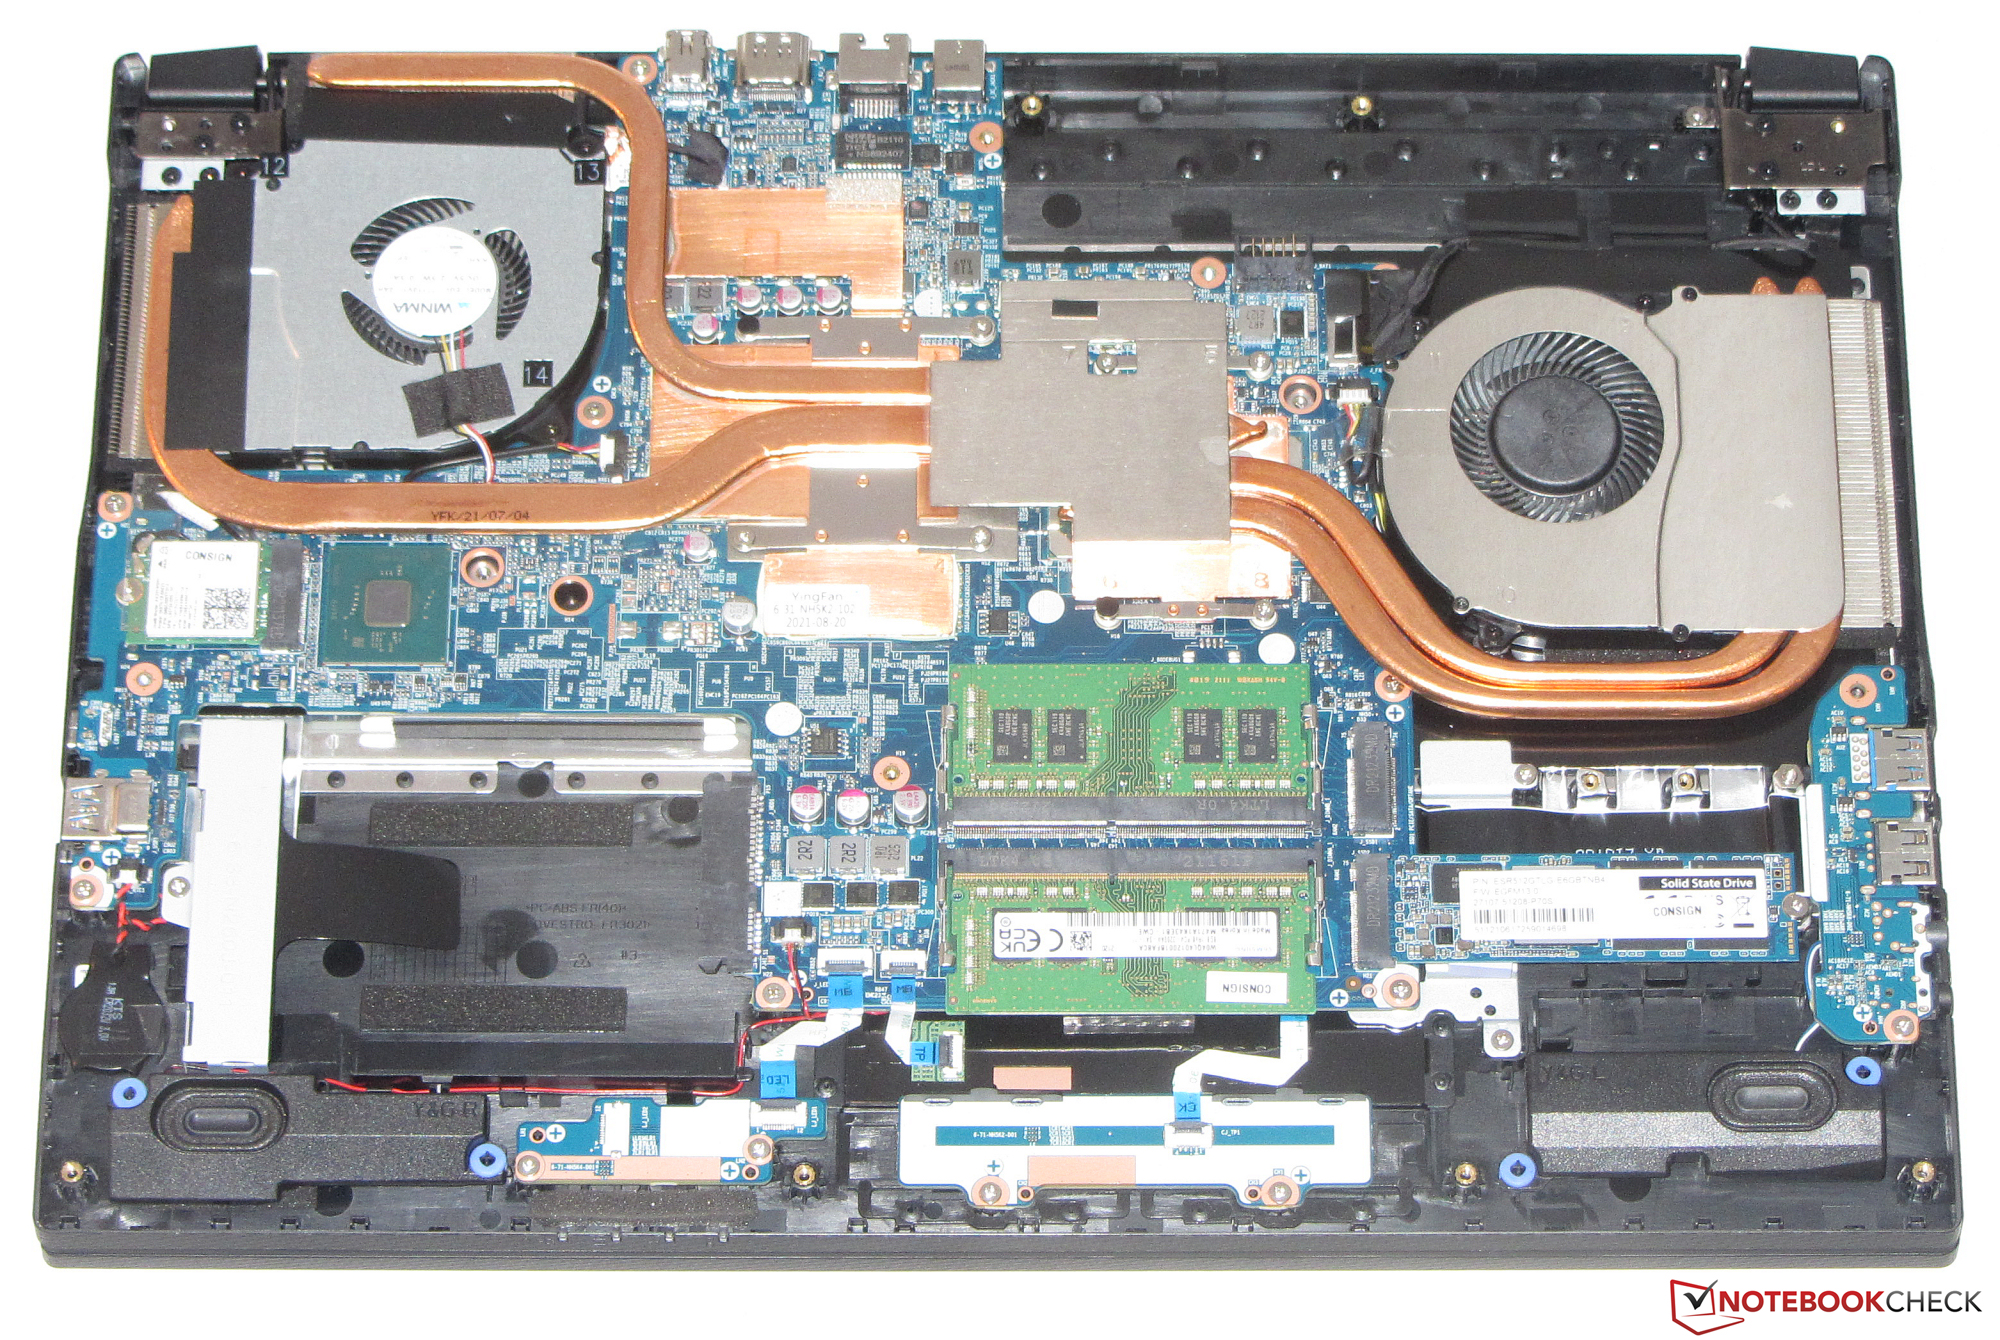
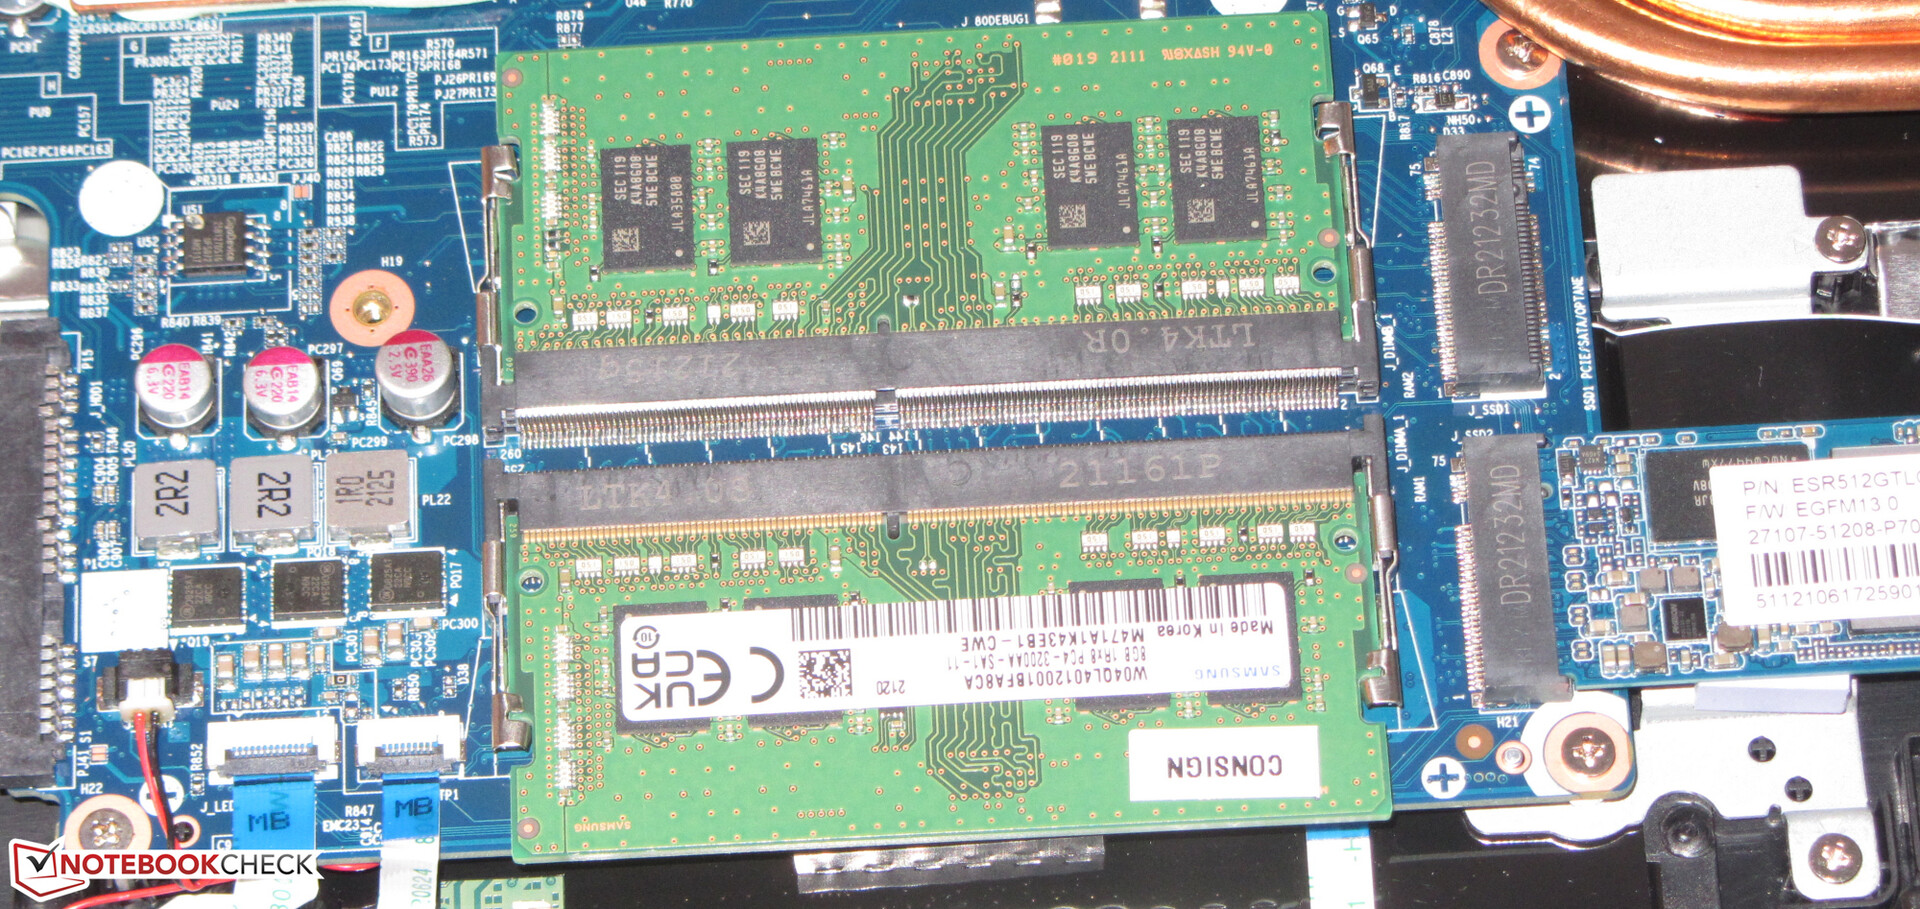
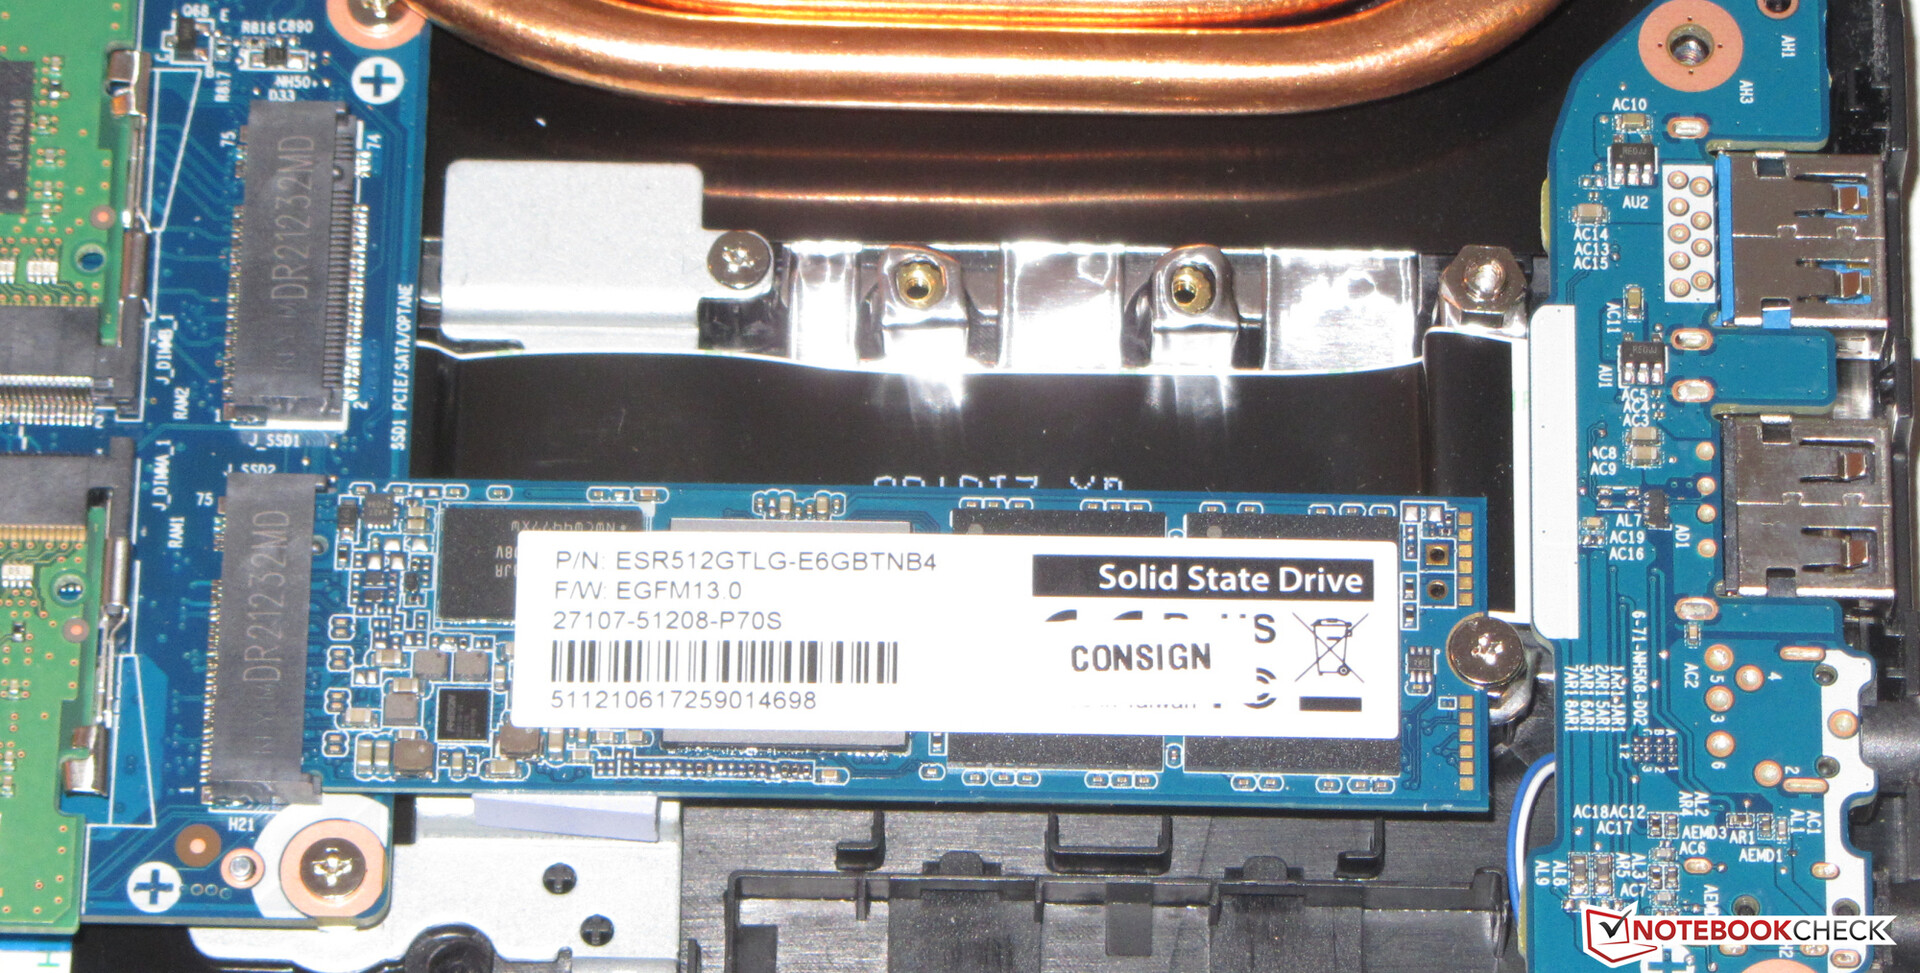
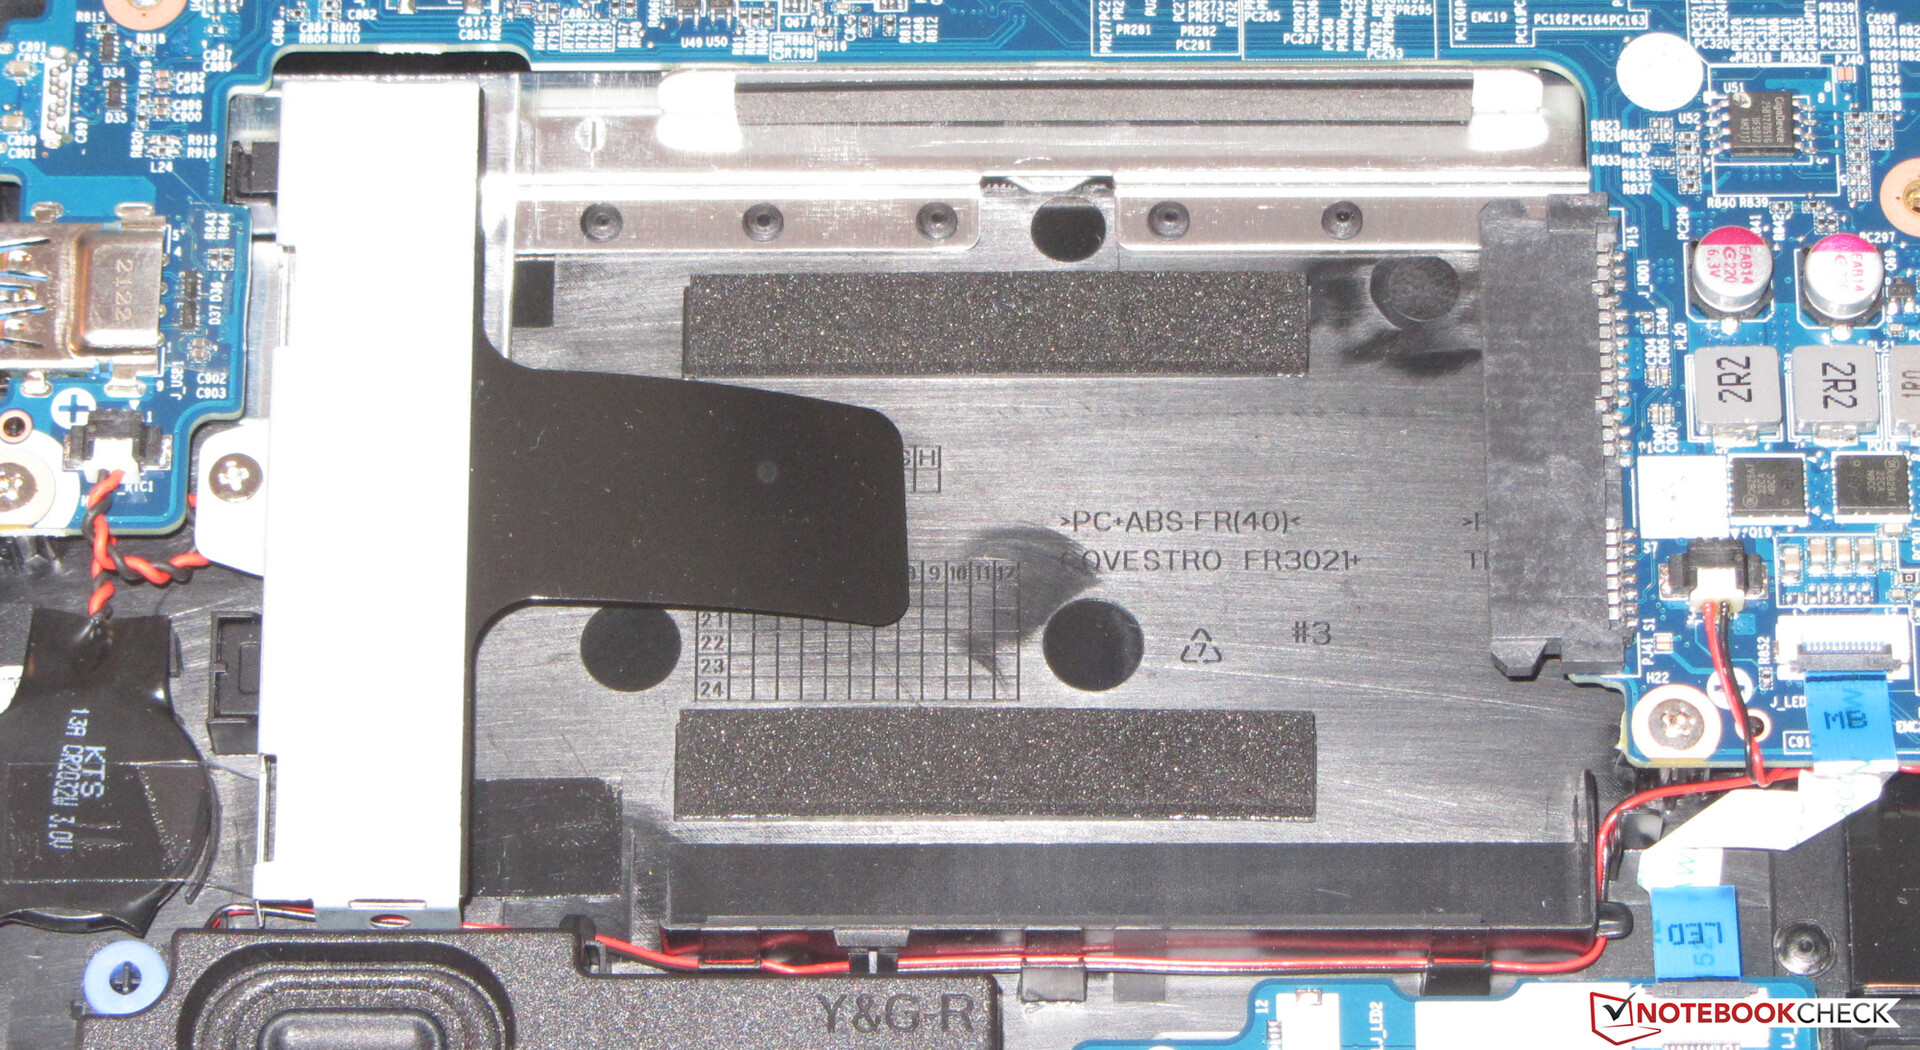
Stockage
Un SSD NVMe de 512 Go (M.2 2280) de Phison sert de lecteur système. La connexion via PCIe 4 permet d'obtenir de très bons taux de transfert. L'espace de stockage peut être étendu grâce à un deuxième SSD M.2 (PCIe 3/SATA) et à un disque de stockage de 2,5 pouces. Les deux emplacements M.2 peuvent accueillir des SSD aux formats 2242, 2260 et 2280

| Drive Performance rating - Percent | |
| Moyenne de la classe Gaming | |
| Gigabyte G5 GD | |
| Gigabyte G5 KC | |
| Moyenne ESR512GTLG-E6GBTNB4 | |
| MSI GF65 Thin 10UE | |
| Lenovo Legion 5 15ACH-82JU00C6GE-FL | |
| Dell G15 5515 | |
* ... Moindre est la valeur, meilleures sont les performances
Continuous load read: DiskSpd Read Loop, Queue Depth 8
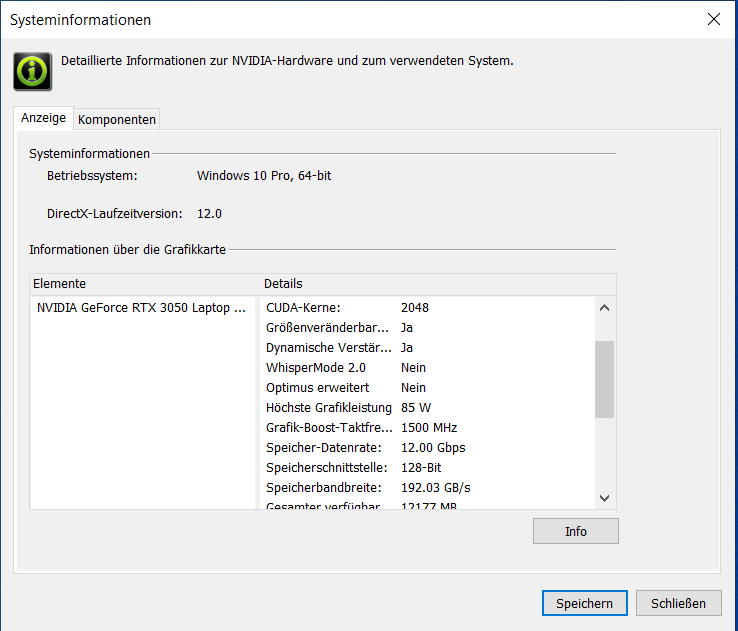
Performances du GPU
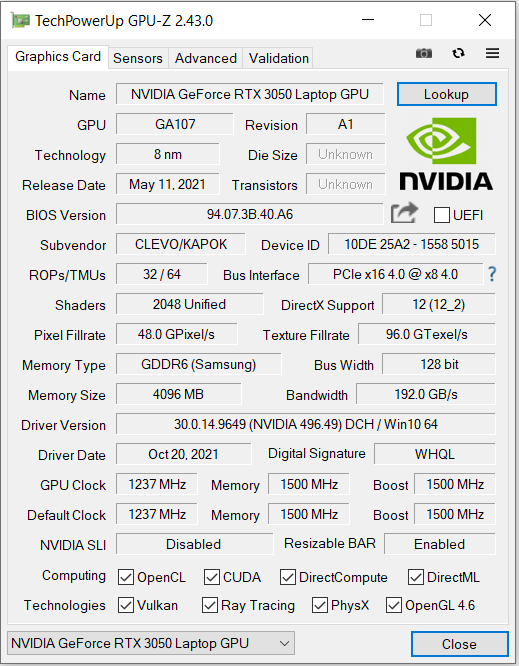
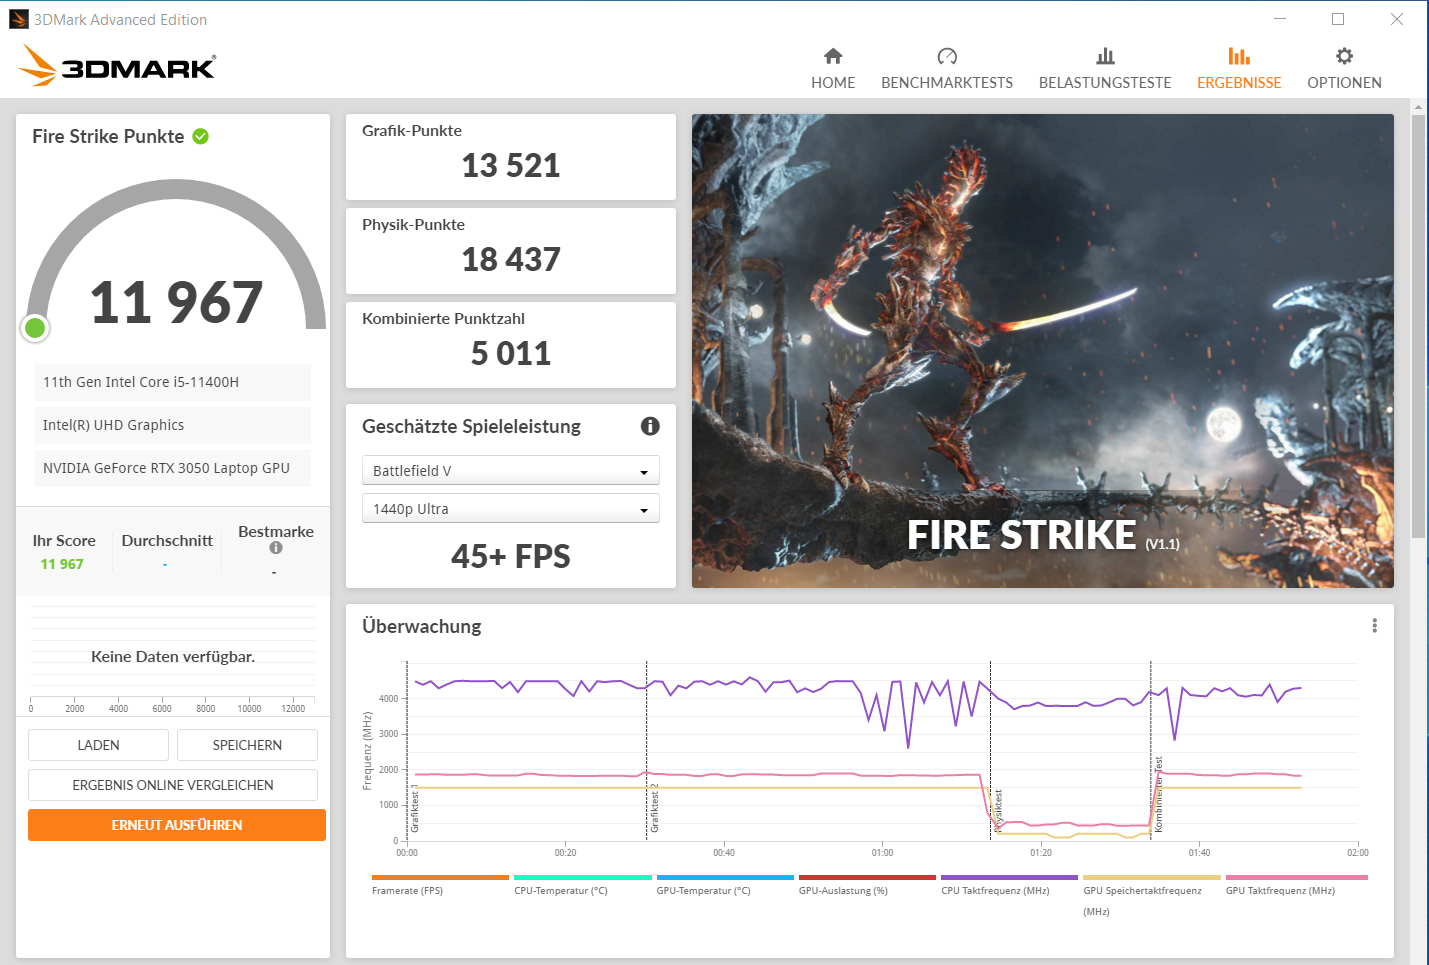
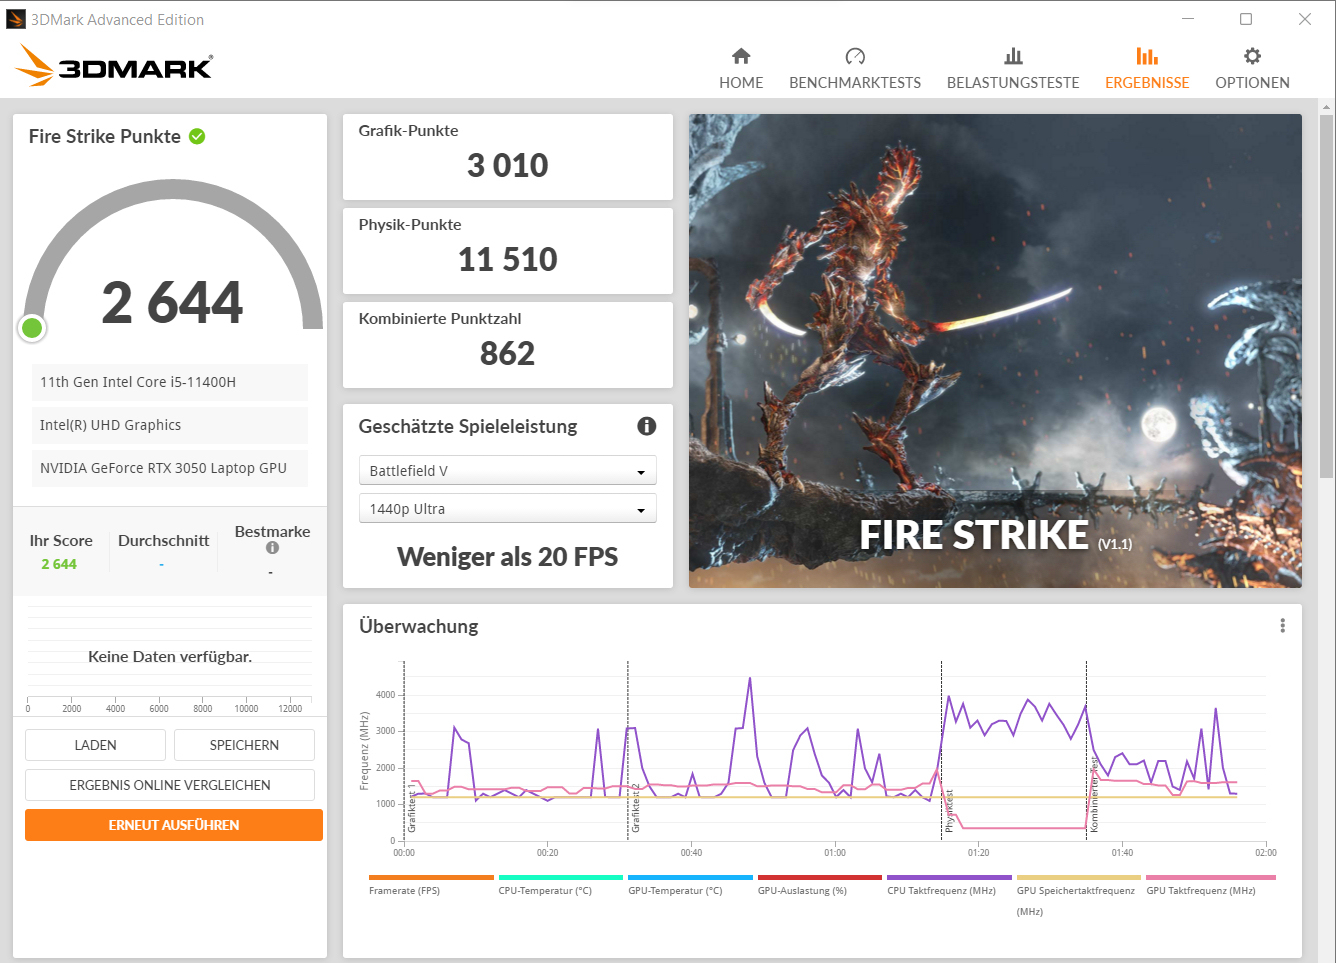
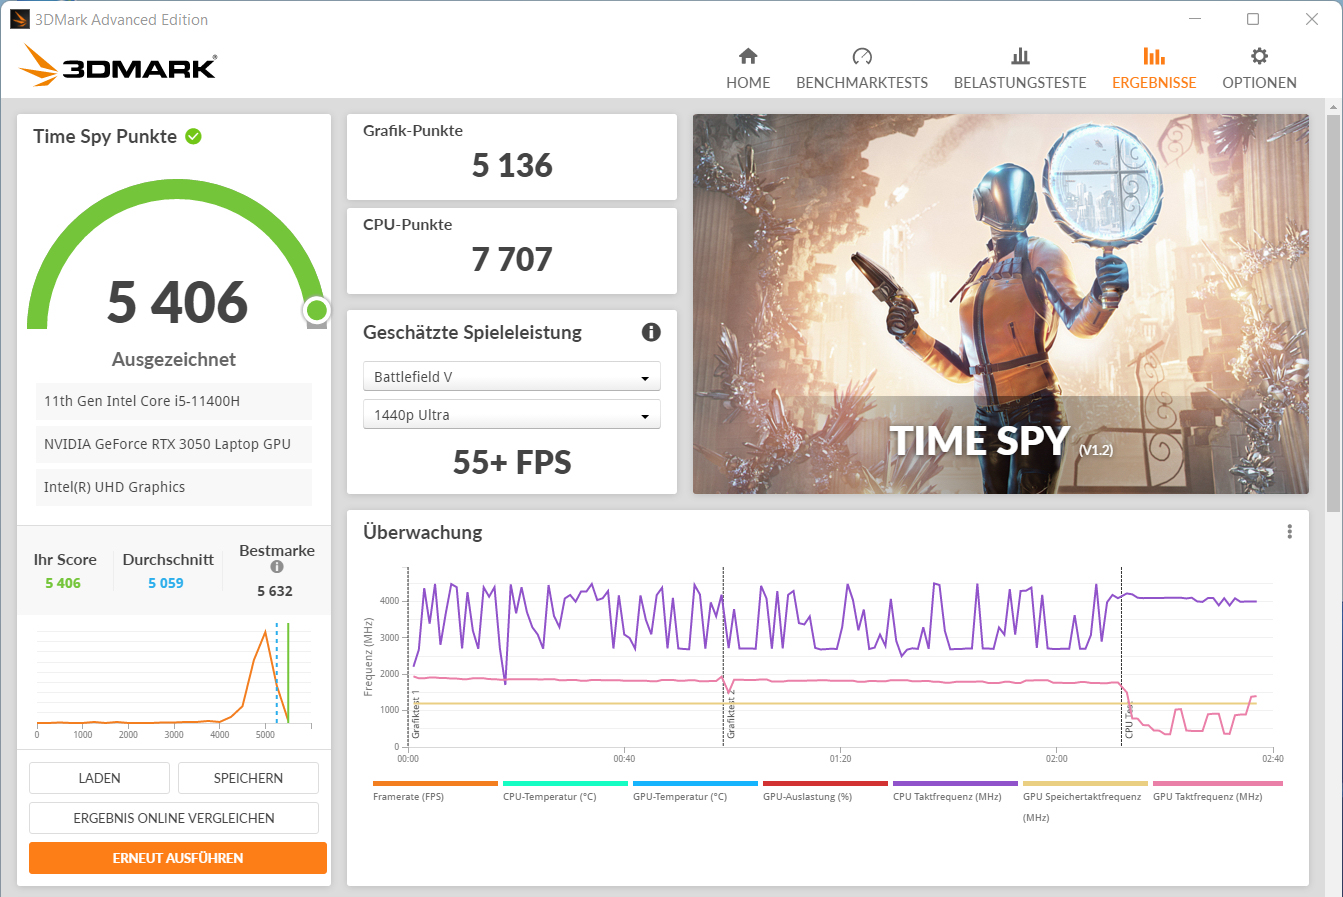
Gigabyte accorde leGeForce portable RTX 3050 GPU (aperçu de tous les ordinateurs portables RTX 3050, y compris leurs TGP) un TGP maximum de 85 watts. Par conséquent, il fournit les meilleurs résultats 3DMark que nous avons pu déterminer avec le RTX 3050 jusqu'à présent. Le profil "Performance Mode" conduit à une légère augmentation des performances graphiques.
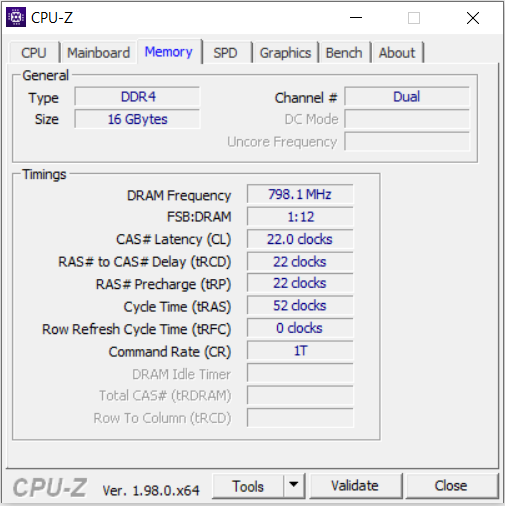
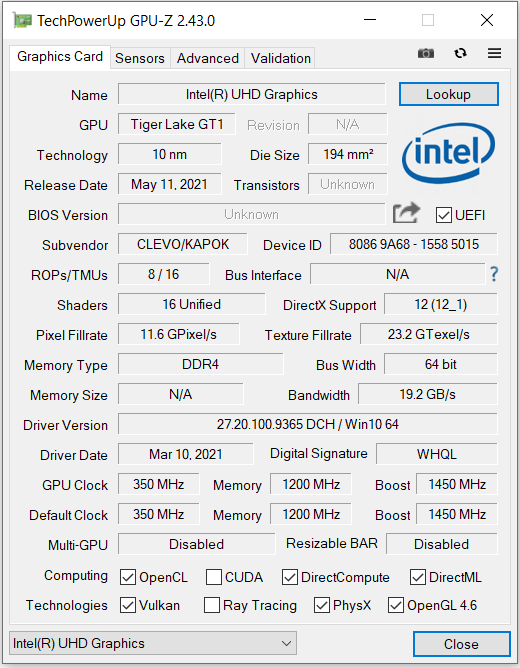
La RTX 3050 peut accéder à la mémoire graphique rapide GDDR6 (4,096 MB). Le siteUHD Graphics Xe 16EUs intégré au processeur est actif, et l'ordinateur portable fonctionne avec la solution de commutation graphique Optimus de Nvidia.
| 3DMark 06 Standard Score | 42599 points | |
| 3DMark 11 Performance | 16190 points | |
| 3DMark Cloud Gate Standard Score | 37239 points | |
| 3DMark Fire Strike Score | 11967 points | |
| 3DMark Time Spy Score | 5406 points | |
Aide | ||
| 3DMark Performance rating - Percent | |
| Moyenne de la classe Gaming | |
| Lenovo Legion 5 15ACH-82JU00C6GE-FL | |
| Gigabyte G5 KC | |
| MSI GF65 Thin 10UE | |
| Dell G15 5515 | |
| Gigabyte G5 GD | |
| Gigabyte G5 GD -1! | |
| Moyenne NVIDIA GeForce RTX 3050 4GB Laptop GPU | |
| Acer Nitro 5 AN517-53-54DQ | |
| Gigabyte G5 GD -1! | |
| 3DMark 11 - 1280x720 Performance GPU | |
| Moyenne de la classe Gaming (21841 - 80022, n=104, 2 dernières années) | |
| Lenovo Legion 5 15ACH-82JU00C6GE-FL | |
| Gigabyte G5 KC | |
| MSI GF65 Thin 10UE | |
| Dell G15 5515 | |
| Gigabyte G5 GD (Leistungsmodus) | |
| Gigabyte G5 GD | |
| Acer Nitro 5 AN517-53-54DQ | |
| Moyenne NVIDIA GeForce RTX 3050 4GB Laptop GPU (11980 - 18557, n=23) | |
| Gigabyte G5 GD (Stromsparmodus) | |
| 3DMark | |
| 1280x720 Cloud Gate Standard Graphics | |
| Moyenne de la classe Gaming (86886 - 223650, n=60, 2 dernières années) | |
| Lenovo Legion 5 15ACH-82JU00C6GE-FL | |
| Gigabyte G5 KC | |
| MSI GF65 Thin 10UE | |
| Gigabyte G5 GD | |
| Dell G15 5515 | |
| Moyenne NVIDIA GeForce RTX 3050 4GB Laptop GPU (33426 - 87403, n=18) | |
| Acer Nitro 5 AN517-53-54DQ | |
| 1920x1080 Fire Strike Graphics | |
| Moyenne de la classe Gaming (12242 - 62849, n=115, 2 dernières années) | |
| Lenovo Legion 5 15ACH-82JU00C6GE-FL | |
| Gigabyte G5 KC | |
| MSI GF65 Thin 10UE | |
| Dell G15 5515 | |
| Gigabyte G5 GD (Leistungsmodus) | |
| Gigabyte G5 GD | |
| Acer Nitro 5 AN517-53-54DQ | |
| Moyenne NVIDIA GeForce RTX 3050 4GB Laptop GPU (9138 - 14157, n=22) | |
| Gigabyte G5 GD (Stromsparmodus) | |
| 2560x1440 Time Spy Graphics | |
| Moyenne de la classe Gaming (5012 - 26212, n=115, 2 dernières années) | |
| Lenovo Legion 5 15ACH-82JU00C6GE-FL | |
| Gigabyte G5 KC | |
| MSI GF65 Thin 10UE | |
| Dell G15 5515 | |
| Gigabyte G5 GD (Leistungsmodus) | |
| Gigabyte G5 GD | |
| Acer Nitro 5 AN517-53-54DQ | |
| Moyenne NVIDIA GeForce RTX 3050 4GB Laptop GPU (3281 - 5295, n=23) | |
| Gigabyte G5 GD (Stromsparmodus) | |
Performances de jeu
L'ordinateur portable fait apparaître à l'écran tous les jeux les plus récents de manière fluide. En général, il est possible de sélectionner une résolution Full HD et des paramètres de qualité élevés à maximaux. Certains titres gourmands en performances - Cyberpunk 2077, par exemple - nécessiteront des compromis en termes de niveaux de qualité. Le G5 GD offre les meilleures fréquences d'images que nous ayons pu enregistrer avec laRTX 3050 pour ordinateur portable Jusqu'à présent. L'écart avec laRTX 3050 Ti pour ordinateur portablede l'ordinateur portableDell G15 5515 n'est pas si important
| The Witcher 3 - 1920x1080 Ultra Graphics & Postprocessing (HBAO+) | |
| Moyenne de la classe Gaming (104.7 - 240, n=7, 2 dernières années) | |
| Gigabyte G5 KC | |
| Lenovo Legion 5 15ACH-82JU00C6GE-FL (Ultra Performance) | |
| Lenovo Legion 5 15ACH-82JU00C6GE-FL (Auto) | |
| Lenovo Legion 5 15ACH-82JU00C6GE-FL (Eco) | |
| MSI GF65 Thin 10UE | |
| Dell G15 5515 | |
| Gigabyte G5 GD (Leistungsmodus) | |
| Gigabyte G5 GD | |
| Moyenne NVIDIA GeForce RTX 3050 4GB Laptop GPU (31.5 - 55.8, n=21) | |
| Gigabyte G5 GD (Stromsparmodus) | |
| Dota 2 Reborn - 1920x1080 ultra (3/3) best looking | |
| Moyenne de la classe Gaming (84.8 - 248, n=107, 2 dernières années) | |
| Gigabyte G5 GD (Leistungsmodus) | |
| Gigabyte G5 GD | |
| Gigabyte G5 KC | |
| Gigabyte G5 GD (Stromsparmodus) | |
| Moyenne NVIDIA GeForce RTX 3050 4GB Laptop GPU (82.8 - 147.7, n=22) | |
| Dell G15 5515 | |
| Lenovo Legion 5 15ACH-82JU00C6GE-FL | |
| MSI GF65 Thin 10UE | |
| X-Plane 11.11 - 1920x1080 high (fps_test=3) | |
| Moyenne de la classe Gaming (55.5 - 143.5, n=109, 2 dernières années) | |
| Gigabyte G5 GD (Leistungsmodus) | |
| Gigabyte G5 KC | |
| Gigabyte G5 GD | |
| Gigabyte G5 GD (Stromsparmodus) | |
| Moyenne NVIDIA GeForce RTX 3050 4GB Laptop GPU (51.6 - 103.1, n=22) | |
| Dell G15 5515 | |
| Lenovo Legion 5 15ACH-82JU00C6GE-FL | |
| MSI GF65 Thin 10UE | |
| Final Fantasy XV Benchmark - 1920x1080 High Quality | |
| Moyenne de la classe Gaming (41 - 215, n=95, 2 dernières années) | |
| Lenovo Legion 5 15ACH-82JU00C6GE-FL (1.3) | |
| Gigabyte G5 KC (1.3) | |
| MSI GF65 Thin 10UE (1.3) | |
| Dell G15 5515 (1.3) | |
| Gigabyte G5 GD (1.3, Leistungsmodus) | |
| Gigabyte G5 GD (1.3) | |
| Moyenne NVIDIA GeForce RTX 3050 4GB Laptop GPU (35.9 - 53.5, n=21) | |
| Gigabyte G5 GD (1.3, Stromsparmodus) | |
| GTA V - 1920x1080 Highest AA:4xMSAA + FX AF:16x | |
| Moyenne de la classe Gaming (48.3 - 186.9, n=94, 2 dernières années) | |
| Gigabyte G5 KC | |
| Lenovo Legion 5 15ACH-82JU00C6GE-FL | |
| Dell G15 5515 | |
| Gigabyte G5 GD | |
| MSI GF65 Thin 10UE | |
| Gigabyte G5 GD (Leistungsmodus) | |
| Moyenne NVIDIA GeForce RTX 3050 4GB Laptop GPU (48 - 72.5, n=21) | |
| Gigabyte G5 GD (Stromsparmodus) | |
| Strange Brigade - 1920x1080 ultra AA:ultra AF:16 | |
| Moyenne de la classe Gaming (76.3 - 458, n=87, 2 dernières années) | |
| Gigabyte G5 KC (1.47.22.14 D3D12) | |
| MSI GF65 Thin 10UE (1.47.22.14 D3D12) | |
| Dell G15 5515 (1.47.22.14 D3D12) | |
| Gigabyte G5 GD (1.47.22.14 D3D12, Leistungsmodus) | |
| Gigabyte G5 GD (1.47.22.14 D3D12) | |
| Moyenne NVIDIA GeForce RTX 3050 4GB Laptop GPU (57.9 - 95.1, n=21) | |
| Gigabyte G5 GD (1.47.22.14 D3D12, Stromsparmodus) | |
| F1 2021 - 1920x1080 Ultra High Preset + Raytracing AA:T AF:16x | |
| Gigabyte G5 KC (803111) | |
| Lenovo Legion 5 15ACH-82JU00C6GE-FL | |
| Dell G15 5515 (807588) | |
| Gigabyte G5 GD (824817) | |
| Moyenne NVIDIA GeForce RTX 3050 4GB Laptop GPU (44.1 - 62, n=8) | |
| Gigabyte G5 GD (824817, Stromsparmodus) | |
| Deathloop - 1920x1080 High Preset | |
| Gigabyte G5 GD | |
| Moyenne NVIDIA GeForce RTX 3050 4GB Laptop GPU (n=1) | |
| New World - 1920x1080 Very High Video Quality | |
| Dell G15 5515 | |
| Gigabyte G5 GD | |
| Moyenne NVIDIA GeForce RTX 3050 4GB Laptop GPU (n=1) | |
| Alan Wake Remastered - 1920x1080 High Preset | |
| Gigabyte G5 GD | |
| Moyenne NVIDIA GeForce RTX 3050 4GB Laptop GPU (n=1) | |
| Far Cry 6 - 1920x1080 Ultra Graphics Quality + HD Textures AA:T | |
| Moyenne de la classe Gaming (n=12 dernières années) | |
| Gigabyte G5 GD | |
| Dell G15 5515 | |
| Moyenne NVIDIA GeForce RTX 3050 4GB Laptop GPU (45 - 59, n=3) | |
| Back 4 Blood - 1920x1080 Epic Preset (DX12) AA:T | |
| Gigabyte G5 GD | |
| Moyenne NVIDIA GeForce RTX 3050 4GB Laptop GPU (n=1) | |
| Guardians of the Galaxy - 1920x1080 High Preset | |
| Gigabyte G5 GD | |
| Moyenne NVIDIA GeForce RTX 3050 4GB Laptop GPU (n=1) | |
| Riders Republic - 1920x1080 Ultra Preset | |
| Gigabyte G5 GD | |
| Moyenne NVIDIA GeForce RTX 3050 4GB Laptop GPU (n=1) | |
| Forza Horizon 5 - 1920x1080 High Preset | |
| Gigabyte G5 GD | |
| Moyenne NVIDIA GeForce RTX 3050 4GB Laptop GPU (n=1) | |
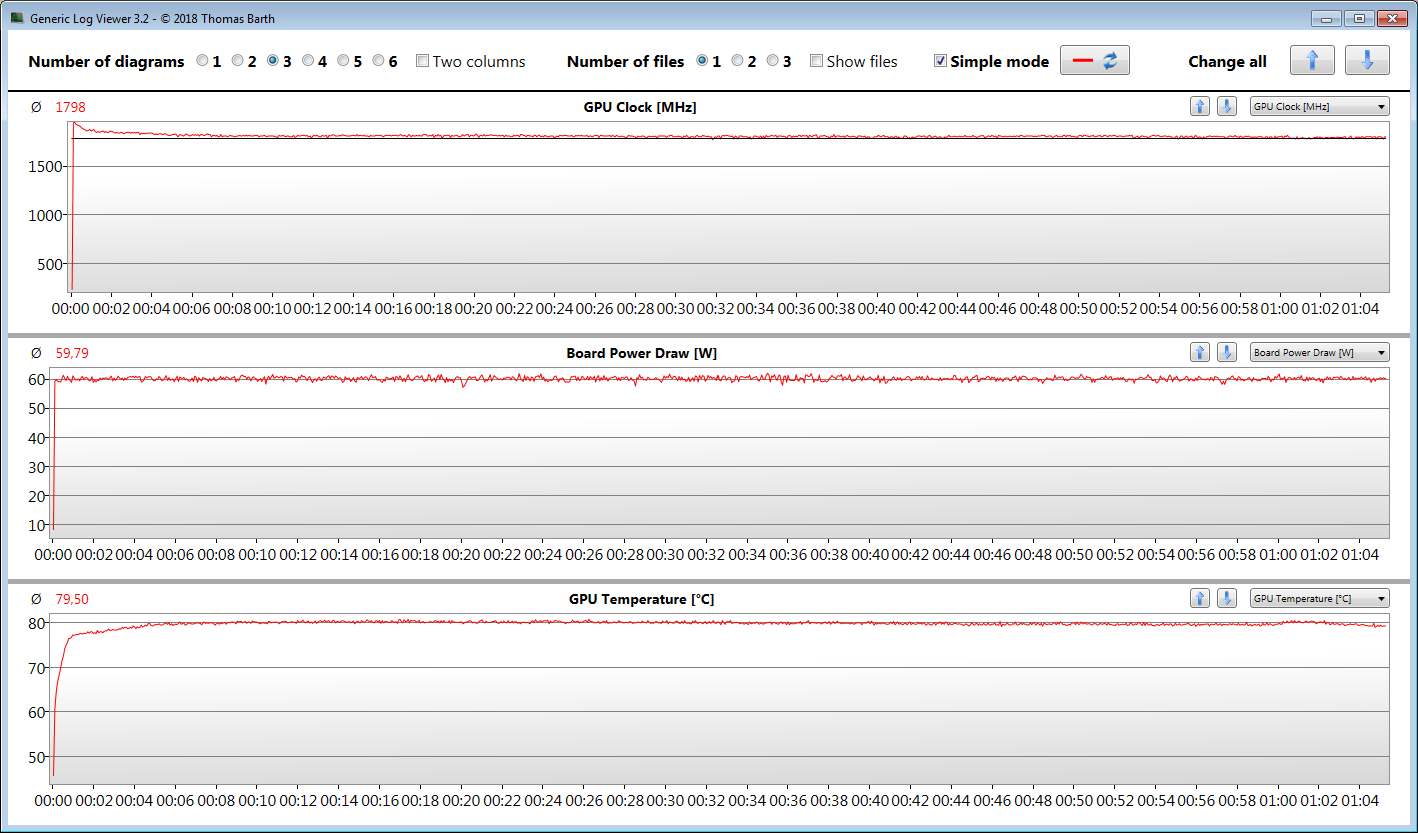
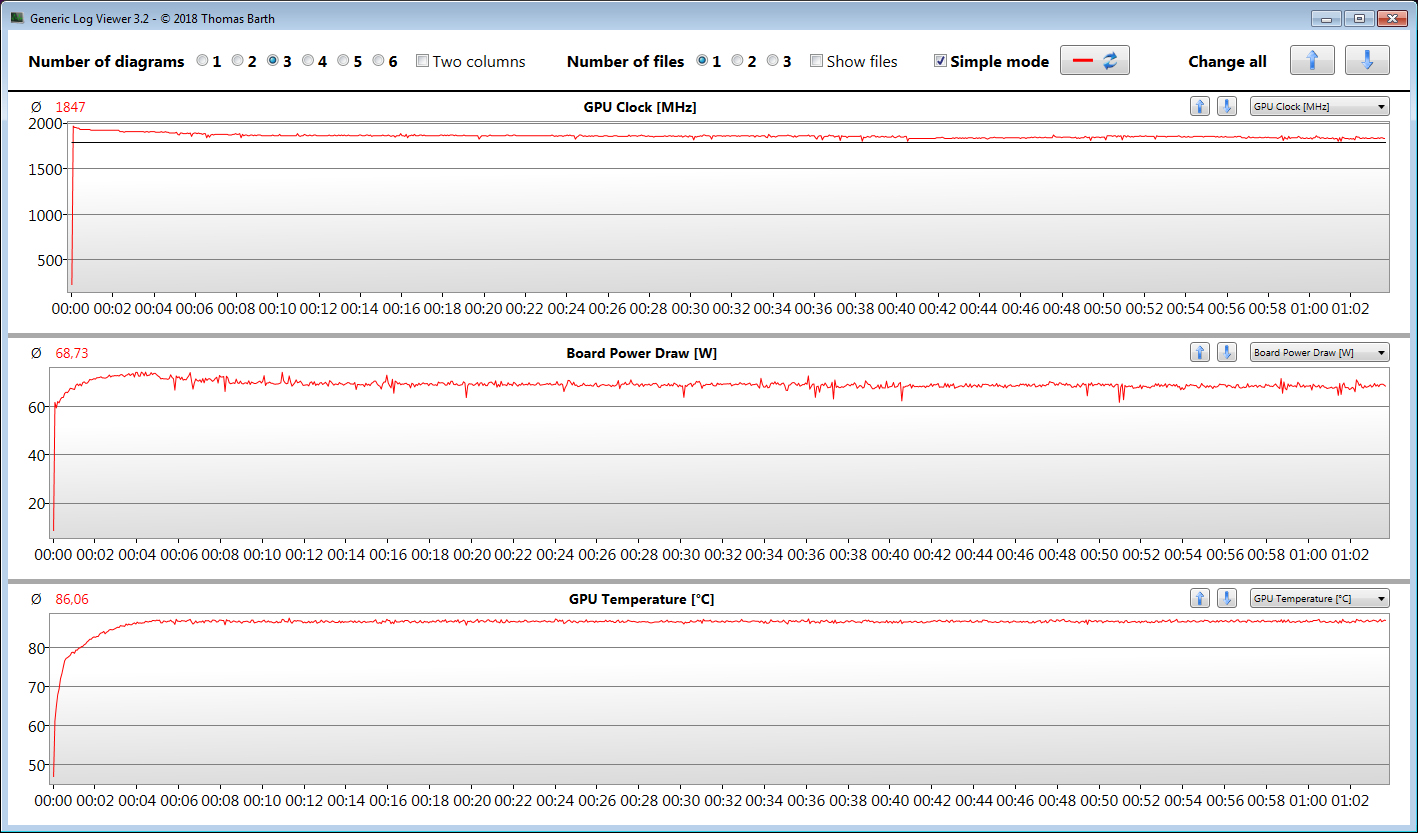
Afin de vérifier si les fréquences d'images restent largement constantes sur une période prolongée, nous avons laissé le jeu The Witcher 3 tourner pendant environ 60 minutes en résolution Full HD et avec les paramètres de qualité maximum. Le personnage n'est pas déplacé. Une baisse des taux d'images n'a pas été constatée
The Witcher 3 FPS diagram
| Bas | Moyen | Élevé | Ultra | |
|---|---|---|---|---|
| GTA V (2015) | 178 | 171 | 138 | 70.8 |
| The Witcher 3 (2015) | 258 | 166 | 93.6 | 51.7 |
| Dota 2 Reborn (2015) | 146 | 137 | 131 | 123 |
| Final Fantasy XV Benchmark (2018) | 136 | 73.1 | 51.1 | |
| X-Plane 11.11 (2018) | 112 | 95.7 | 77.3 | |
| Far Cry 5 (2018) | 131 | 84 | 79 | 75 |
| Strange Brigade (2018) | 287 | 130 | 105 | 91.3 |
| F1 2021 (2021) | 235 | 150 | 126 | 59.4 |
| Deathloop (2021) | 109 | 63.4 | 51.7 | 38.1 |
| New World (2021) | 95 | 65.2 | 60.2 | 49.2 |
| Alan Wake Remastered (2021) | 91.9 | 70.6 | 64.2 | |
| Far Cry 6 (2021) | 110 | 77 | 67 | 59 |
| Back 4 Blood (2021) | 247 | 138 | 112 | 103 |
| Guardians of the Galaxy (2021) | 96 | 74 | 73 | 32 |
| Riders Republic (2021) | 144 | 80 | 61 | 55 |
| Forza Horizon 5 (2021) | 154 | 87 | 77 | 28 |
Émissions - Le G5 produit beaucoup de bruit en charge
Bruit du ventilateur
En utilisation quotidienne (bureau, Internet), les deux ventilateurs fonctionnent à faible vitesse et sont à peine audibles. De temps en temps, ils s'arrêtent. Cependant, il devient assez bruyant sous charge avec des niveaux de pression sonore maximum de 54 dB(A) (test de stress) et 52 dB(A) (notre test The Witcher 3 ), respectivement. Le niveau sonore sous charge peut être considérablement réduit en utilisant les profils "Power Saving Mode" et "Silent Mode" - avec une diminution des performances informatiques. Dans l'ensemble, leDell G15 5515 produit moins de bruit
| Gigabyte G5 GD GeForce RTX 3050 4GB Laptop GPU, i5-11400H | Dell G15 5515 GeForce RTX 3050 Ti Laptop GPU, R7 5800H | Lenovo Legion 5 15ACH-82JU00C6GE-FL GeForce RTX 3060 Laptop GPU, R7 5800H | MSI GF65 Thin 10UE GeForce RTX 3060 Laptop GPU, i7-10750H | Gigabyte G5 KC GeForce RTX 3060 Laptop GPU, i5-10500H | |
|---|---|---|---|---|---|
| Noise | 11% | 1% | 0% | -16% | |
| arrêt / environnement * (dB) | 24 | 24 -0% | 24.2 -1% | 24.7 -3% | 27 -13% |
| Idle Minimum * (dB) | 29 | 25 14% | 29 -0% | 33.1 -14% | 31 -7% |
| Idle Average * (dB) | 30 | 26 13% | 29 3% | 33.1 -10% | 32 -7% |
| Idle Maximum * (dB) | 32 | 30 6% | 29 9% | 33.1 -3% | 51 -59% |
| Load Average * (dB) | 53 | 44 17% | 53.5 -1% | 42.7 19% | 57 -8% |
| Witcher 3 ultra * (dB) | 52 | 44 15% | 53.5 -3% | 40.6 22% | 56 -8% |
| Load Maximum * (dB) | 54 | 48 11% | 53.5 1% | 59.4 -10% | 58 -7% |
* ... Moindre est la valeur, meilleures sont les performances
Degré de la nuisance sonore
| Au repos |
| 29 / 30 / 32 dB(A) |
| Fortement sollicité |
| 53 / 54 dB(A) |
 | ||
30 dB silencieux 40 dB(A) audible 50 dB(A) bruyant |
||
min: | ||
Température
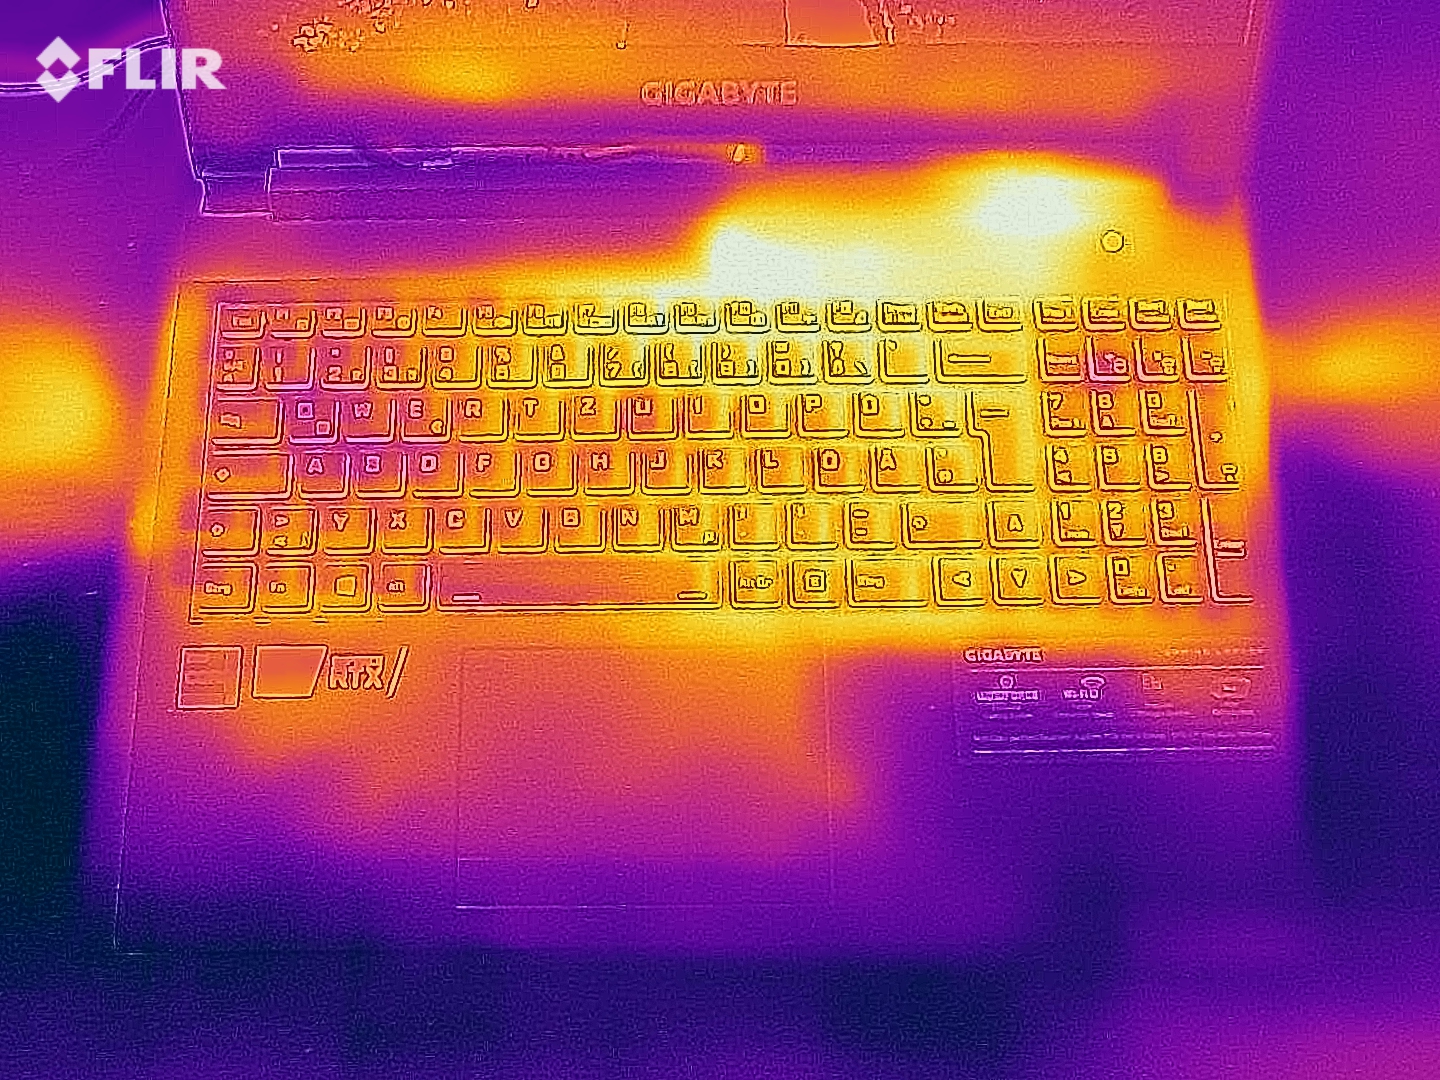
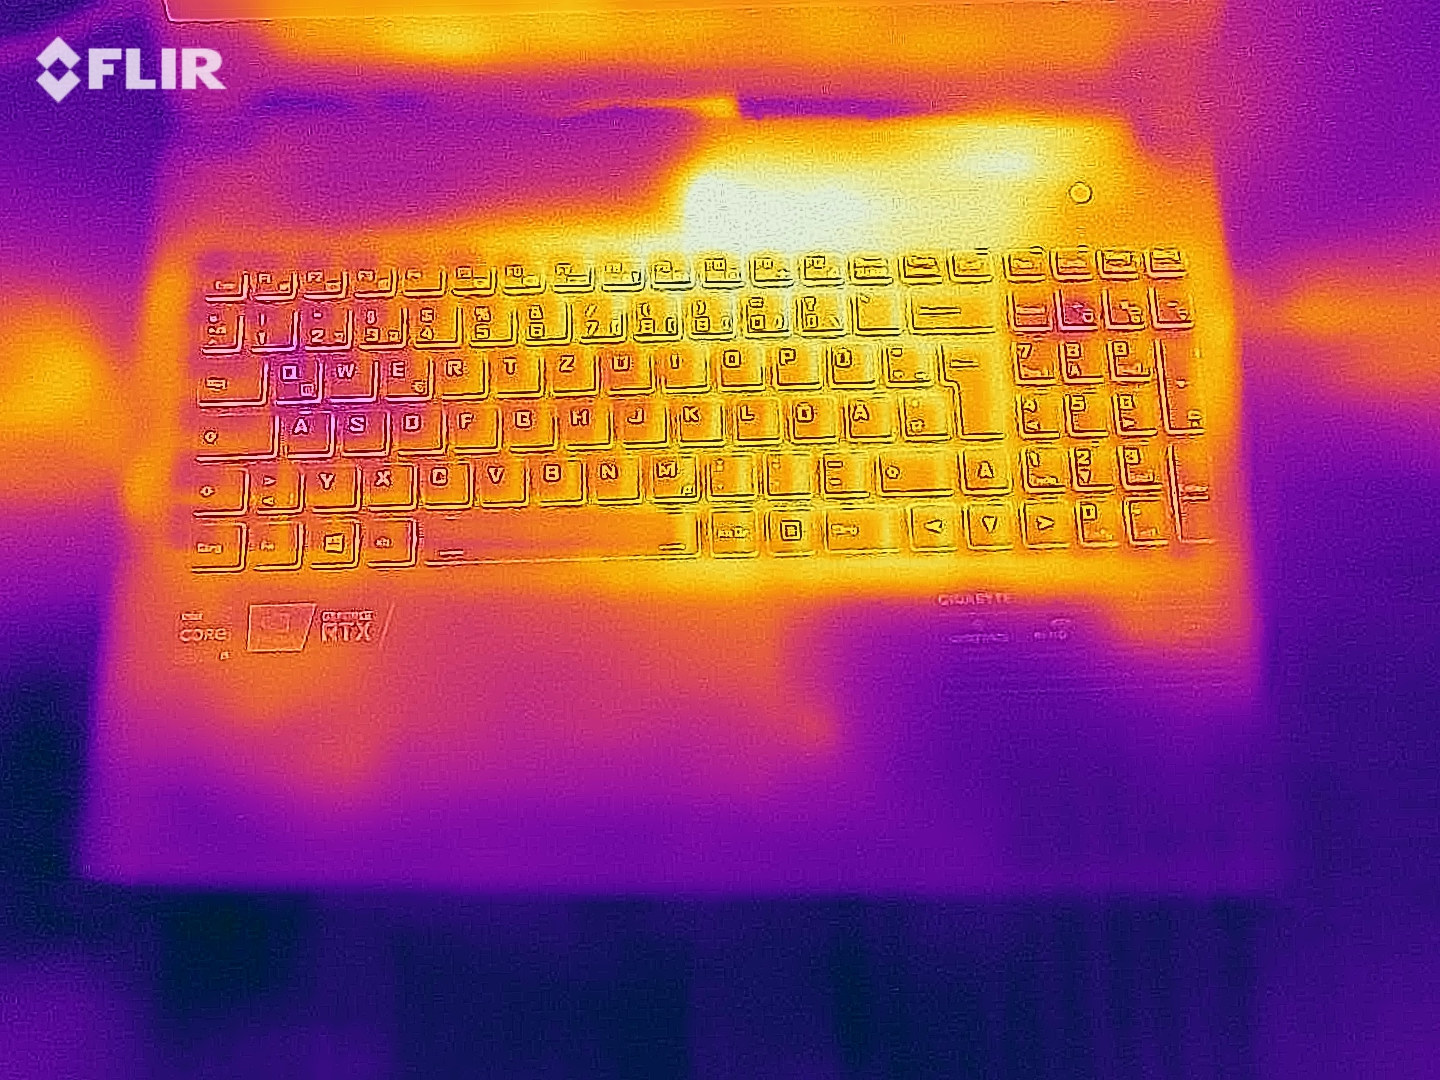
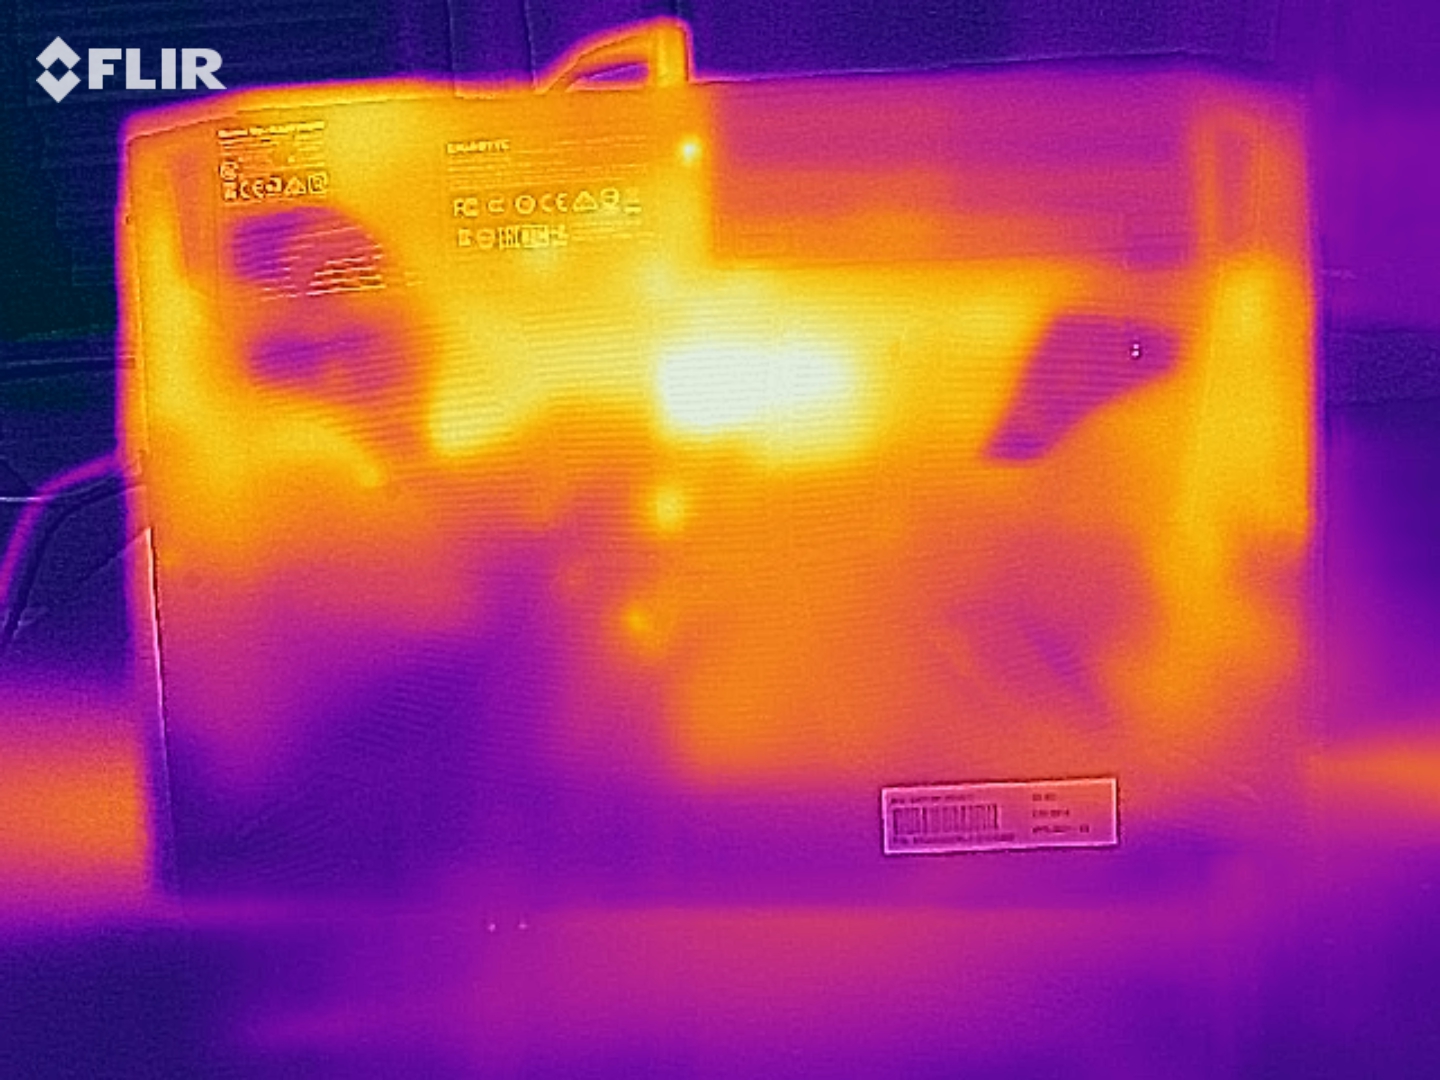
Les températures du boîtier du G5 restent bien dans la fourchette verte en utilisation quotidienne (bureau, Internet). En charge (test de stress, notre test The Witcher 3 ), les températures sont plus élevées à certains endroits, mais elles restent globalement modérées. La concurrence est généralement à la hauteur. Les températures du processeur ne suscitent pas non plus d'inquiétude
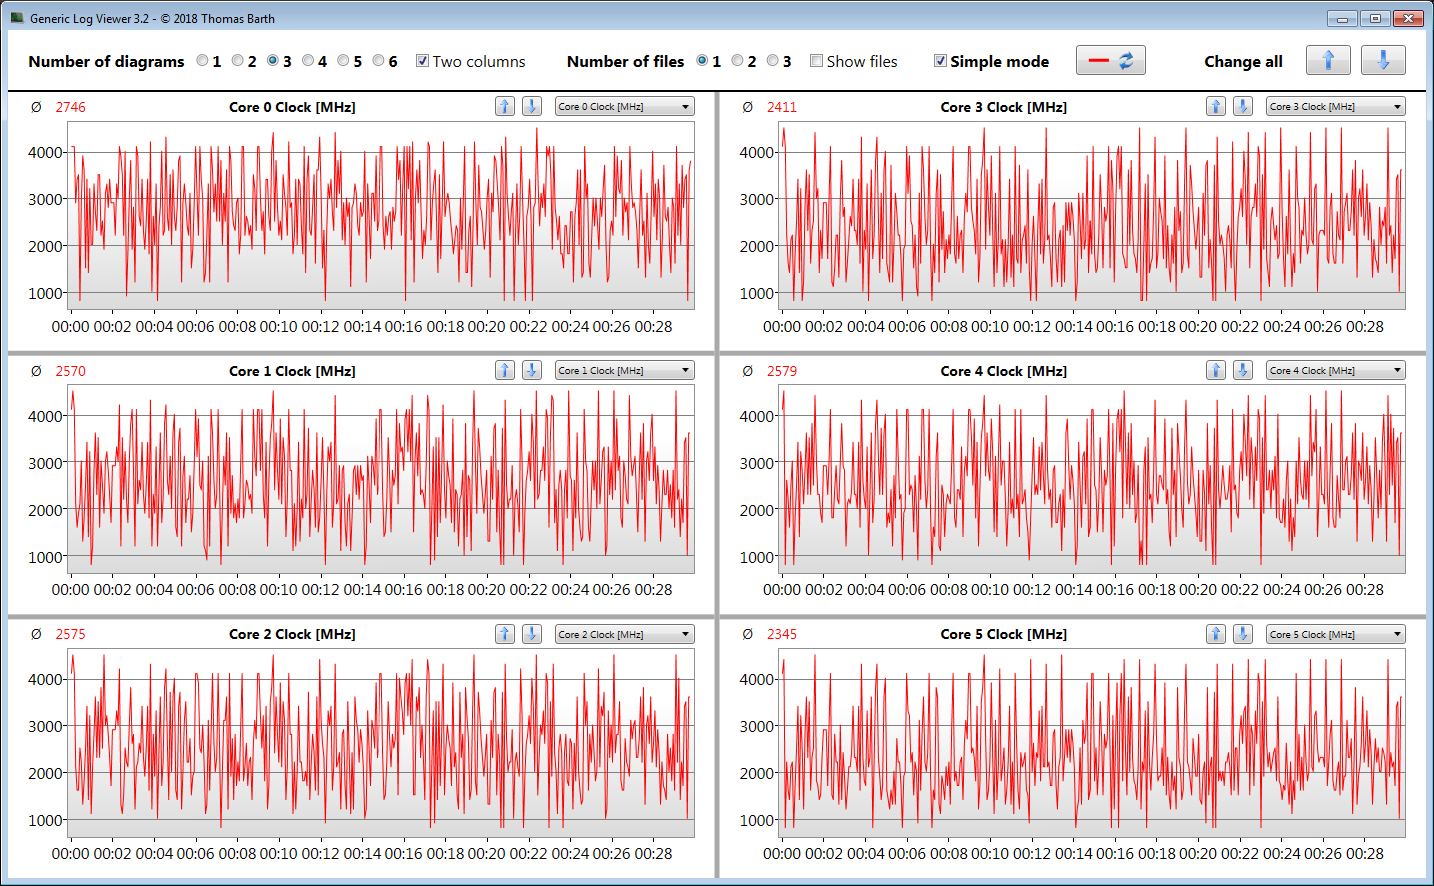
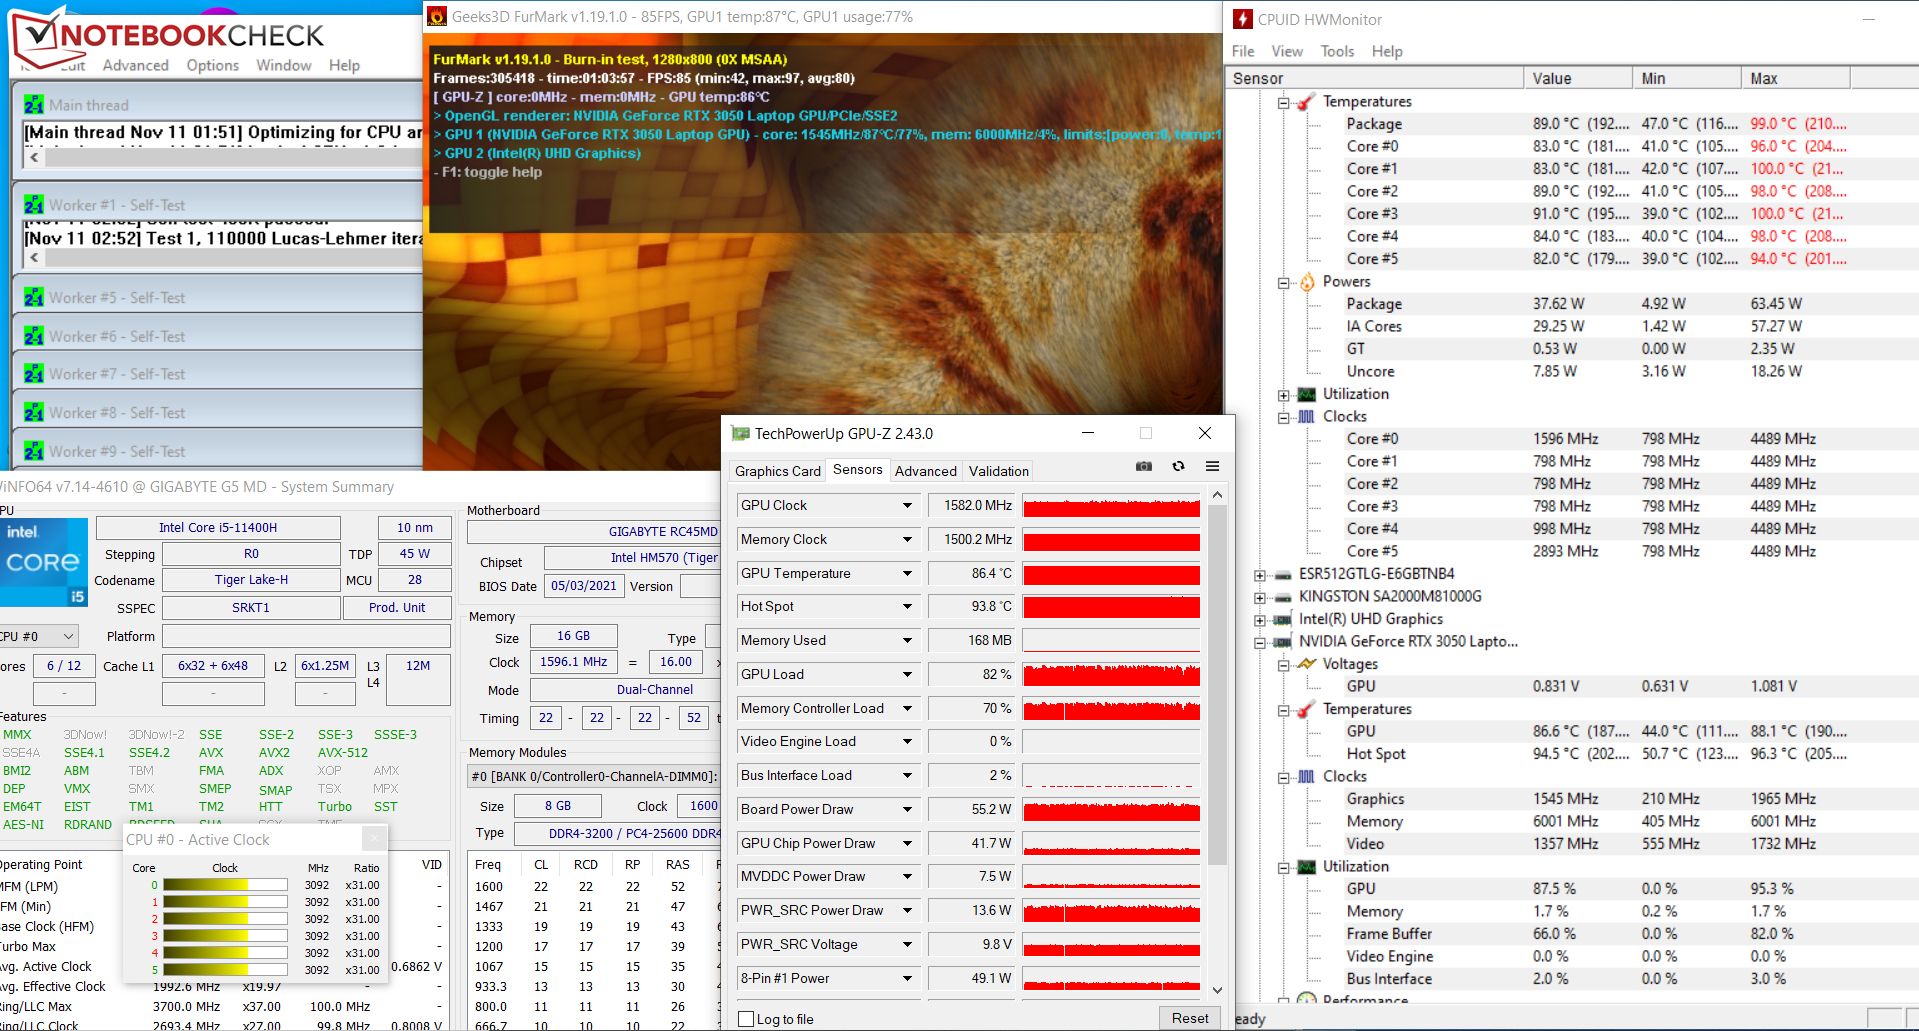
Test de stress
Le CPU et le GPU traitent le test de stress (Prime95 et FurMark fonctionnent pendant au moins une heure) à 2,6 à 3,1 GHz et à environ 1 600 MHz, respectivement. Ce test représente un scénario extrême que nous utilisons pour vérifier si le système reste stable à pleine charge
(±) La température maximale du côté supérieur est de 45 °C / 113 F, par rapport à la moyenne de 40.4 °C / 105 F, allant de 21.2 à 68.8 °C pour la classe Gaming.
(-) Le fond chauffe jusqu'à un maximum de 50 °C / 122 F, contre une moyenne de 43.2 °C / 110 F
(+) En utilisation inactive, la température moyenne du côté supérieur est de 26.7 °C / 80 F, par rapport à la moyenne du dispositif de 33.9 °C / 93 F.
(±) En jouant à The Witcher 3, la température moyenne du côté supérieur est de 36.3 °C / 97 F, alors que la moyenne de l'appareil est de 33.9 °C / 93 F.
(+) Les repose-poignets et le pavé tactile atteignent la température maximale de la peau (33 °C / 91.4 F) et ne sont donc pas chauds.
(-) La température moyenne de la zone de l'appui-paume de dispositifs similaires était de 28.8 °C / 83.8 F (-4.2 °C / #-7.6 F).
| Gigabyte G5 GD GeForce RTX 3050 4GB Laptop GPU, i5-11400H | Dell G15 5515 GeForce RTX 3050 Ti Laptop GPU, R7 5800H | Lenovo Legion 5 15ACH-82JU00C6GE-FL GeForce RTX 3060 Laptop GPU, R7 5800H | MSI GF65 Thin 10UE GeForce RTX 3060 Laptop GPU, i7-10750H | Gigabyte G5 KC GeForce RTX 3060 Laptop GPU, i5-10500H | |
|---|---|---|---|---|---|
| Heat | 4% | 8% | 5% | -9% | |
| Maximum Upper Side * (°C) | 45 | 50 -11% | 42.6 5% | 43.4 4% | 50 -11% |
| Maximum Bottom * (°C) | 50 | 49 2% | 52.2 -4% | 41.8 16% | 49 2% |
| Idle Upper Side * (°C) | 28 | 26 7% | 24.9 11% | 30.2 -8% | 33 -18% |
| Idle Bottom * (°C) | 31 | 26 16% | 25.3 18% | 28.4 8% | 34 -10% |
* ... Moindre est la valeur, meilleures sont les performances

Haut-parleurs
Gigabyte G5 GD analyse audio
(±) | le niveau sonore du haut-parleur est moyen mais bon (80# dB)
Basses 100 - 315 Hz
(-) | presque aucune basse - en moyenne 25.4% plus bas que la médiane
(-) | les basses ne sont pas linéaires (16.2% delta à la fréquence précédente)
Médiums 400 - 2000 Hz
(+) | médiane équilibrée - seulement 3.2% de la médiane
(+) | les médiums sont linéaires (4.6% delta à la fréquence précédente)
Aiguës 2 - 16 kHz
(+) | des sommets équilibrés - à seulement 3.9% de la médiane
(±) | la linéarité des aigus est moyenne (10.1% delta à la fréquence précédente)
Globalement 100 - 16 000 Hz
(±) | la linéarité du son global est moyenne (19.1% de différence avec la médiane)
Par rapport à la même classe
» 64% de tous les appareils testés de cette catégorie étaient meilleurs, 7% similaires, 28% pires
» Le meilleur avait un delta de 6%, la moyenne était de 18%, le pire était de 132%.
Par rapport à tous les appareils testés
» 46% de tous les appareils testés étaient meilleurs, 7% similaires, 47% pires
» Le meilleur avait un delta de 4%, la moyenne était de 23%, le pire était de 134%.
Dell G15 5515 analyse audio
(±) | le niveau sonore du haut-parleur est moyen mais bon (76# dB)
Basses 100 - 315 Hz
(-) | presque aucune basse - en moyenne 22% plus bas que la médiane
(±) | la linéarité des basses est moyenne (14.9% delta à la fréquence précédente)
Médiums 400 - 2000 Hz
(+) | médiane équilibrée - seulement 2.8% de la médiane
(+) | les médiums sont linéaires (3% delta à la fréquence précédente)
Aiguës 2 - 16 kHz
(+) | des sommets équilibrés - à seulement 1.4% de la médiane
(+) | les aigus sont linéaires (3.7% delta à la fréquence précédente)
Globalement 100 - 16 000 Hz
(±) | la linéarité du son global est moyenne (16.8% de différence avec la médiane)
Par rapport à la même classe
» 44% de tous les appareils testés de cette catégorie étaient meilleurs, 11% similaires, 45% pires
» Le meilleur avait un delta de 6%, la moyenne était de 18%, le pire était de 132%.
Par rapport à tous les appareils testés
» 30% de tous les appareils testés étaient meilleurs, 8% similaires, 63% pires
» Le meilleur avait un delta de 4%, la moyenne était de 23%, le pire était de 134%.
Consommation d'énergie - L'ordinateur portable Gigabyte n'offre qu'une courte autonomie de batterie
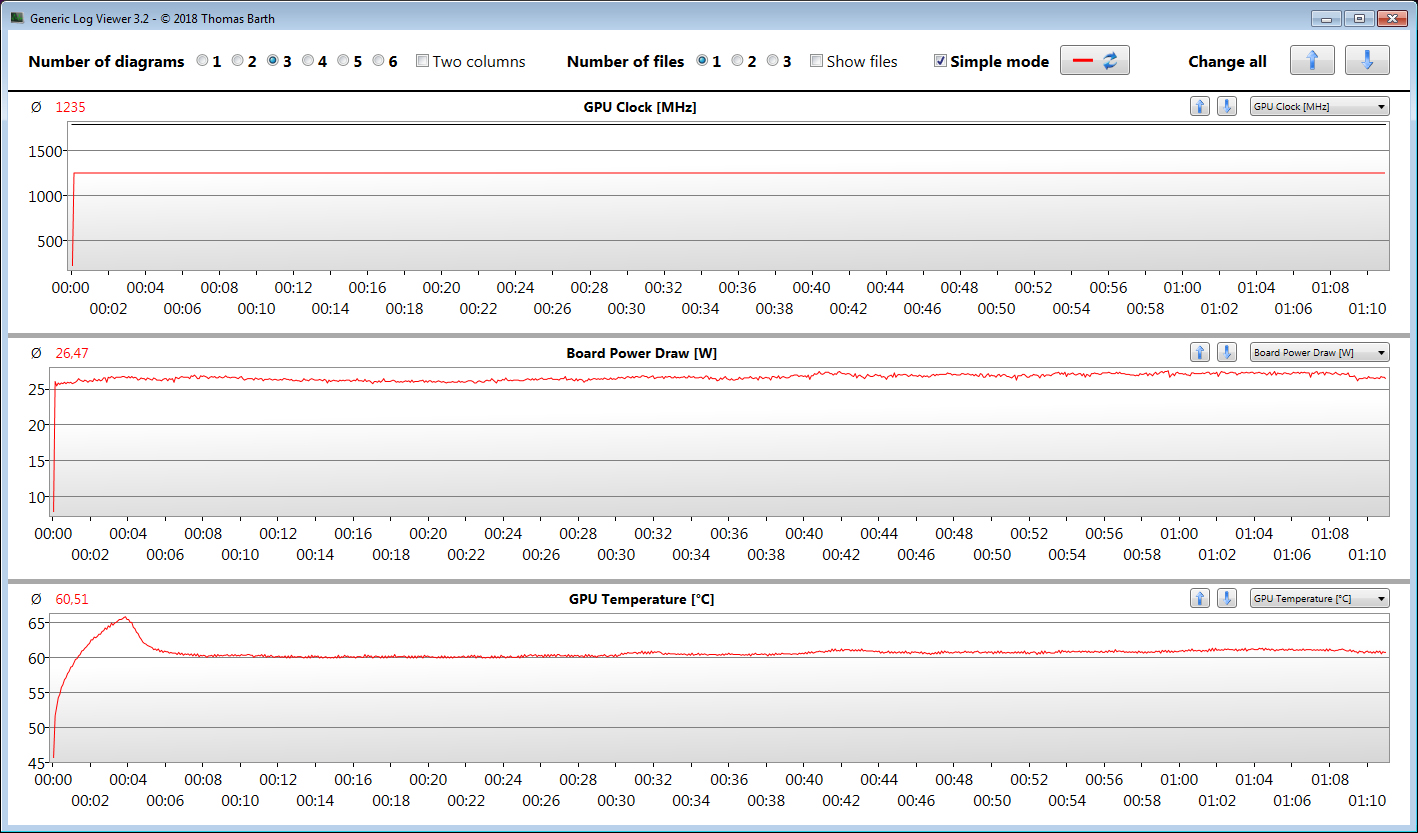
Le G5 consomme une quantité relativement élevée d'énergie en mode veille et sous faible charge. La concurrence fait mieux à ce niveau. La demande est normale pour le matériel installé ici lorsque l'appareil est soumis à une charge moyenne à élevée. Le diagramme suivant illustre la consommation d'énergie constante de l'ordinateur portable pendant notre test The Witcher 3. L'adaptateur d'alimentation semble avoir une capacité adéquate avec une sortie nominale de 150 watts. La batterie ne se vide pas lorsque le matériel de l'ordinateur portable est sous pleine charge
| Éteint/en veille | |
| Au repos | |
| Fortement sollicité |
|
Légende:
min: | |
Energy consumption during The Witcher 3
| Gigabyte G5 GD i5-11400H, GeForce RTX 3050 4GB Laptop GPU | Dell G15 5515 R7 5800H, GeForce RTX 3050 Ti Laptop GPU | Lenovo Legion 5 15ACH-82JU00C6GE-FL R7 5800H, GeForce RTX 3060 Laptop GPU | MSI GF65 Thin 10UE i7-10750H, GeForce RTX 3060 Laptop GPU | Gigabyte G5 KC i5-10500H, GeForce RTX 3060 Laptop GPU | Moyenne de la classe Gaming | |
|---|---|---|---|---|---|---|
| Power Consumption | 16% | -1% | 13% | -7% | -27% | |
| Idle Minimum * (Watt) | 13 | 5 62% | 7.3 44% | 5.4 58% | 8 38% | 13 ? -0% |
| Idle Average * (Watt) | 15 | 9 40% | 10.5 30% | 12.8 15% | 13 13% | 19 ? -27% |
| Idle Maximum * (Watt) | 20 | 20 -0% | 15.7 22% | 19.5 2% | 20 -0% | 24.6 ? -23% |
| Load Average * (Watt) | 102 | 94 8% | 108 -6% | 86.6 15% | 98 4% | 110.7 ? -9% |
| Witcher 3 ultra * (Watt) | 124 | 123 1% | 175 -41% | 115.7 7% | 166 -34% | |
| Load Maximum * (Watt) | 148 | 172 -16% | 228 -54% | 175.2 -18% | 242 -64% | 259 ? -75% |
* ... Moindre est la valeur, meilleures sont les performances
Durée de vie de la batterie
L'écran de 15,6 pouces atteint des durées d'exécution de 3 h 06 et 3 h 34 dans le test Wi-Fi (accès à des sites Web via un script) et le test vidéo (court-métrage Big Buck Bunny
(codage H.264, Full HD) tournant en boucle), respectivement. Les fonctions d'économie d'énergie sont ici désactivées, et la luminosité de l'écran est réglée à environ 150 cd/m². En outre, les modules sans fil sont désactivés pour le test vidéo.L'utilisation des profils énergétiques "Power Saving Mode" et "Silent Mode" ne permet pas d'améliorer l'autonomie de la batterie.
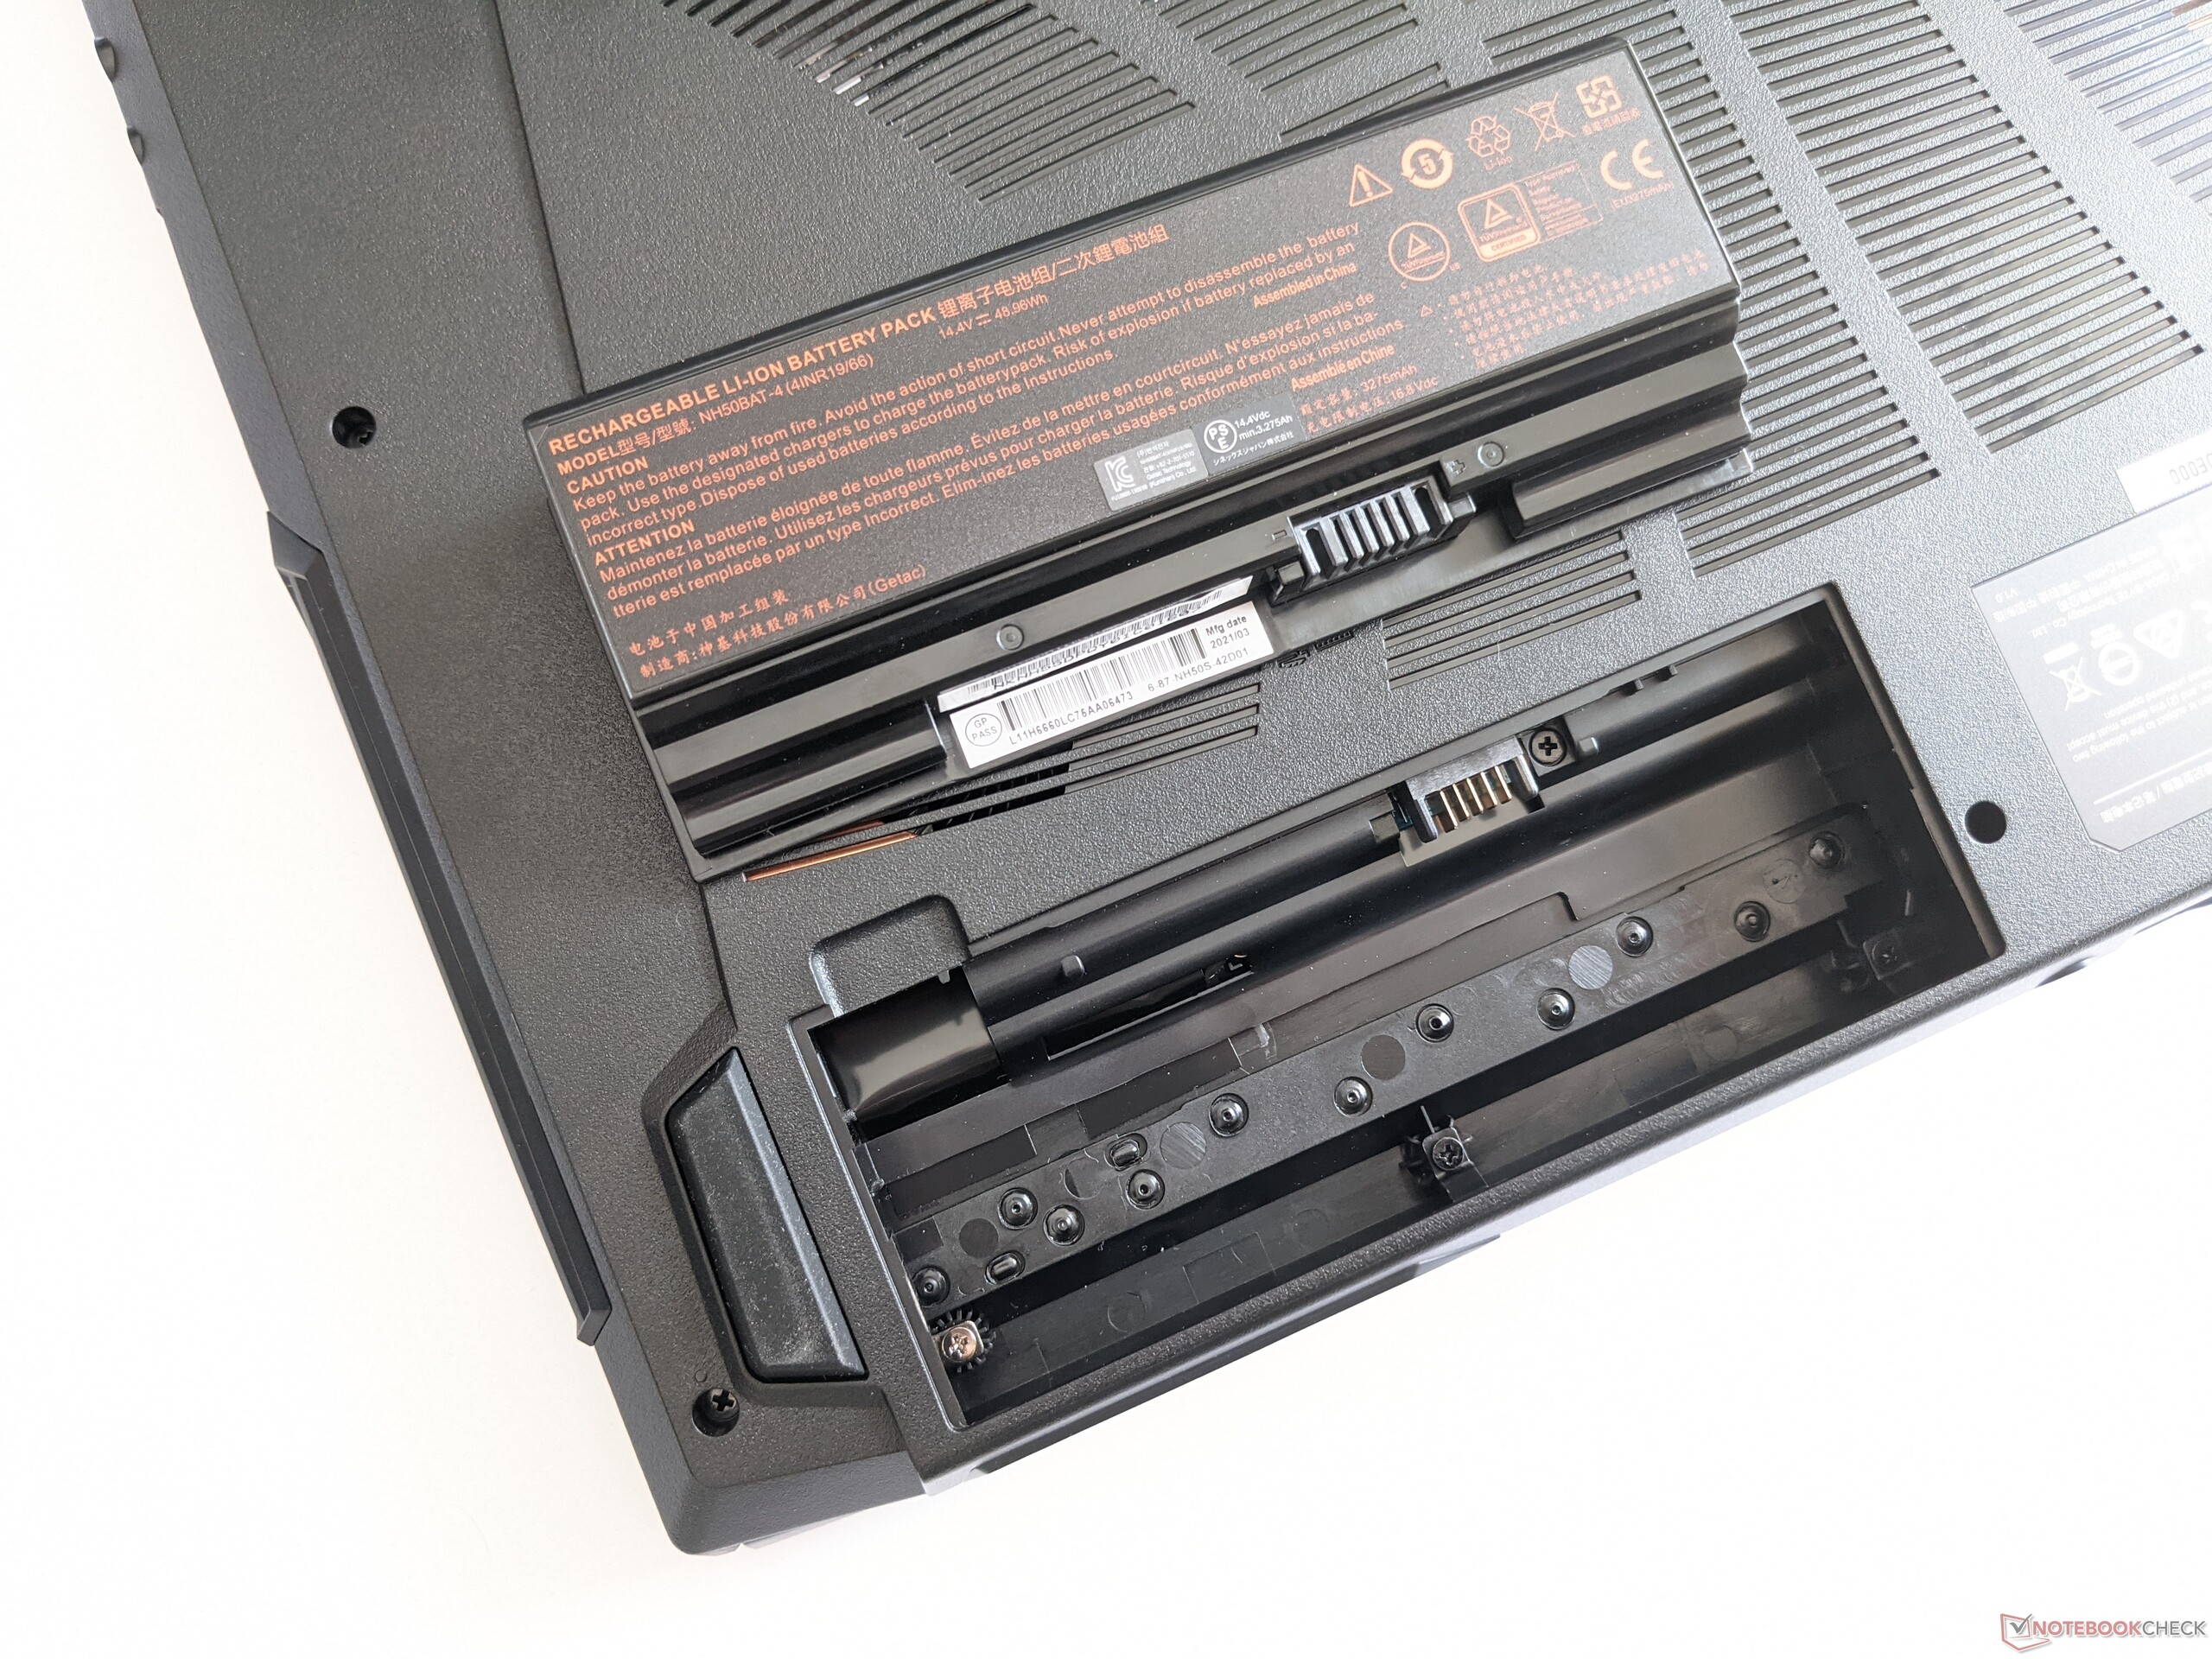
| Gigabyte G5 GD i5-11400H, GeForce RTX 3050 4GB Laptop GPU, 41 Wh | Dell G15 5515 R7 5800H, GeForce RTX 3050 Ti Laptop GPU, 56 Wh | Lenovo Legion 5 15ACH-82JU00C6GE-FL R7 5800H, GeForce RTX 3060 Laptop GPU, 80 Wh | MSI GF65 Thin 10UE i7-10750H, GeForce RTX 3060 Laptop GPU, 51 Wh | Gigabyte G5 KC i5-10500H, GeForce RTX 3060 Laptop GPU, 48.96 Wh | Moyenne de la classe Gaming | |
|---|---|---|---|---|---|---|
| Autonomie de la batterie | 119% | 46% | 48% | 2% | 86% | |
| Reader / Idle (h) | 5.7 | 13.5 137% | 11.1 95% | 5.2 -9% | 8.27 ? 45% | |
| H.264 (h) | 3.6 | 8.8 144% | 4.3 19% | 8.32 ? 131% | ||
| WiFi v1.3 (h) | 3.1 | 8 158% | 4.8 55% | 4.6 48% | 3.6 16% | 7.11 ? 129% |
| Load (h) | 1.1 | 1.5 36% | 1.8 64% | 1.1 0% | 1.1 0% | 1.502 ? 37% |
Points positifs
Points négatifs
Verdict : un ordinateur portable de jeu solide à un prix abordable
Le G5 GD a laissé une bonne impression générale, malgré quelques défauts. Pour un prix modique, vous disposez d'un ordinateur portable de jeu Full HD qui fait apparaître à l'écran tous les jeux les plus récents de manière fluide (même si ce n'est pas toujours avec le maximum de détails)
Le siteCore i5-11400H et l'ordinateur portableGeForce RTX 3050 laptop GPU peuvent travailler à des fréquences d'horloge constantes - si une version de BIOS fonctionnelle est installée. Grâce à un TGP de 85 watts, le GPU fournit les meilleurs résultats globaux que nous ayons pu déterminer pour la RTX 3050 jusqu'à présent
Gigabyte propose un ordinateur portable de jeu d'entrée de gamme bien équilibré avec le G5 GD, qui est disponible pour un peu moins de 750 euros (~848 $).
L'ordinateur portable chauffe sensiblement sous charge, mais pas excessivement. Le développement du bruit est un peu au-dessus de la moyenne. L'ordinateur portable fonctionne cependant sans bruit lors de l'exécution de tâches quotidiennes. Le profil énergétique "Power Saving Mode" est recommandé pour cela. La puissance de calcul réduite qui en résulte reste plus que suffisante pour les applications bureautiques et Internet ainsi que pour les jeux en HD
La maigre capacité de stockage (512 Go, PCIe 4) peut être étendue : Il y a de la place pour un deuxième SSD M.2 (PCIe 3 ou SATA) et un disque dur de 2,5 pouces. L'écran mat (Full HD, IPS, 144 Hz) offre des angles de vision stables, un bon contraste et une reproduction des couleurs décente. Des améliorations sont possibles en termes de luminosité, de couverture de l'espace colorimétrique et de temps de réponse. En outre, l'autonomie de la batterie n'a rien de particulier
Le prix relativement bas de 750 euros (~848 $) s'explique notamment par le fait qu'aucun système d'exploitation Windows n'est inclus. Par conséquent, Linux serait le premier choix évident pour un système d'exploitation, mais l'installation et la configuration du système seraient probablement trop fastidieuses pour plusieurs utilisateurs. Au final, le choix se portera probablement sur Windows 10 dans la plupart des cas. Windows 11 n'est actuellement compatible qu'avec les nouvelles versions de BIOS, ce qui pose des problèmes en termes de performances de jeu. Les utilisateurs devront attendre les futures mises à jour du BIOS ici
Une alternative au G5 GD serait le Dell G15 5515. Il est équipé de composants plus puissants, et en même temps, il offre une bien meilleure autonomie que le portable de Gigabyte.
Prix et disponibilité
Au moment de la rédaction de cet article, le Gigabyte G5 GD peut être trouvé sur Amazon dans notre même configuration de test (Core i5-11400H, GeForce RTX 3050, 16 Go de RAM, 512 Go SSD) et avec Windows 10 Home au prix réduit de 849 $ sur https://www.amazon.com/GIGABYTE-G5-GD-Anti-Glare-GD-51US123SH/dp/B093Z27X2L/?tag=nbcreviewsnet-20.
Gigabyte G5 GD
- 11/21/2021 v7 (old)
Sascha Mölck
Price comparison

