Test du Gigabyte G5 KE : PC portable de jeu du milieu de gamme assez réussi
Gigabyte propose plusieurs catégories d'ordinateurs portables en fonction des performances et du budget. Alors que les séries Aorus et Aero sont destinées aux segments du jeu haut de gamme et de la création de contenu, les variantes traditionnelles de Gigabyte telles que les G5 et G7 sont destinées à un public de joueurs plus grand public.
Nous avons déjà passé en revue l'ordinateur de 17,3 pouces Gigabyte G7 KE et maintenant nous testons le Gigabyte G5 KE de 15,6 pouces avec des spécifications largement similaires.
Notre Gigabyte G5 KE est équipé d'un processeur Intel 12ème génération Core i5-12500H de 12e génération, GPU pour ordinateur portable Nvidia GeForce RTX 306016 Go de RAM, un SSD de 512 Go et un écran IPS de 15,6 pouces à 144 Hz.
Cette configuration vous coûtera 94 990 ₹ (1 155 $ US) sur le marché indien. Dans cet article, nous allons tester le Gigabyte G5 KE et voir s'il peut rivaliser avec ses pairs dans le segment des ordinateurs de jeu de milieu de gamme.
Comparaison avec les concurrents potentiels
Note | Date | Modèle | Poids | Épaisseur | Taille | Résolution | Prix |
|---|---|---|---|---|---|---|---|
| 81.8 % v7 (old) | 04/23 | Gigabyte G5 KE i5-12500H, GeForce RTX 3060 Laptop GPU | 2 kg | 23.9 mm | 15.60" | 1920x1080 | |
| 82.8 % v7 (old) | 10/22 | Lenovo IdeaPad Gaming 3 15IAH7 i5-12500H, GeForce RTX 3050 Ti Laptop GPU | 2.4 kg | 26 mm | 15.60" | 1920x1080 | |
| 83.3 % v7 (old) | 01/23 | Gigabyte G7 KE i5-12500H, GeForce RTX 3060 Laptop GPU | 2.6 kg | 25 mm | 17.30" | 1920x1080 | |
| 87.4 % v7 (old) | 09/22 | Honor MagicBook 14 2022 i5-12500H, GeForce RTX 2050 Mobile | 1.6 kg | 16.9 mm | 14.00" | 2160x1440 | |
| 87.9 % v7 (old) | 01/23 | Schenker XMG Core 15 (M22) R7 6800H, GeForce RTX 3060 Laptop GPU | 2.1 kg | 23 mm | 15.60" | 2560x1440 | |
| 86.1 % v7 (old) | 10/22 | Dell G16 7620 i7-12700H, GeForce RTX 3060 Laptop GPU | 2.6 kg | 26.9 mm | 16.00" | 2560x1600 | |
| 82.3 % v7 (old) | 09/22 | Gigabyte A5 K1 R5 5600H, GeForce RTX 3060 Laptop GPU | 2.2 kg | 34 mm | 15.60" | 1920x1080 | |
| 87.2 % v7 (old) | 03/22 | Asus TUF Gaming F15 FX507ZM i7-12700H, GeForce RTX 3060 Laptop GPU | 2.1 kg | 24.95 mm | 15.60" | 1920x1080 | |
| 84.3 % v7 (old) | 09/21 | HP Victus 16-e0179ng R7 5800H, GeForce RTX 3060 Laptop GPU | 2.5 kg | 23.5 mm | 16.10" | 1920x1080 |
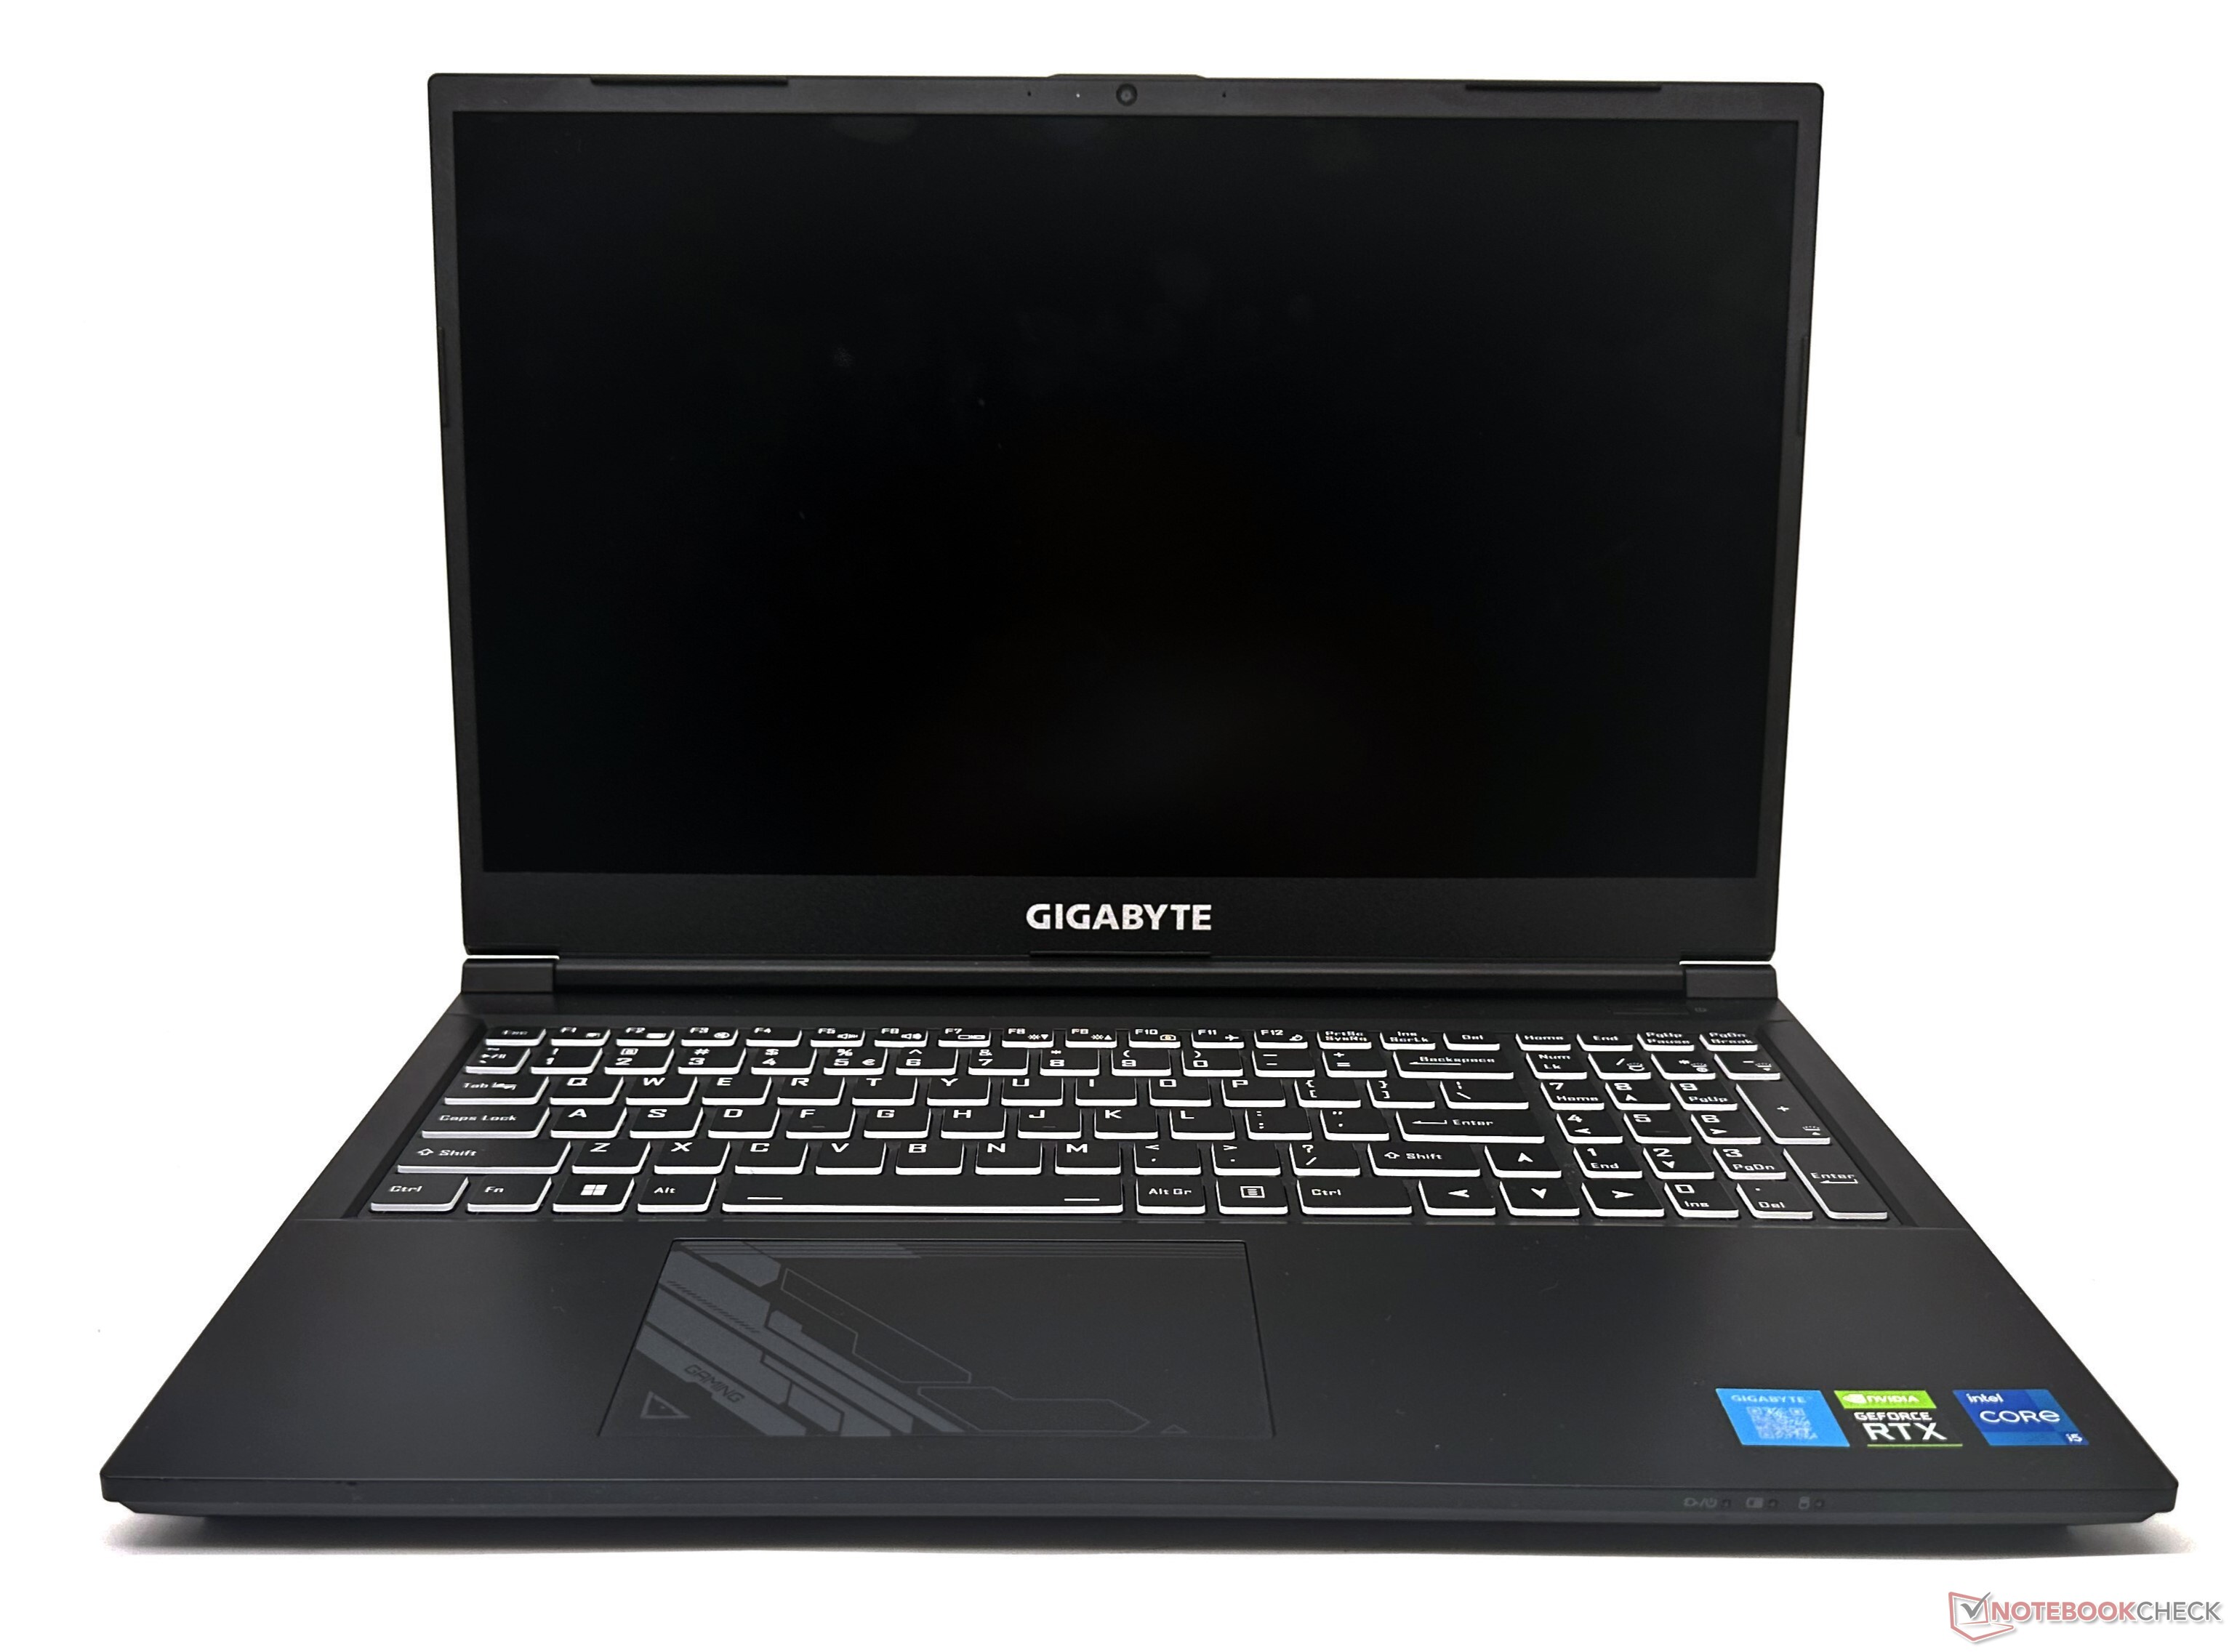
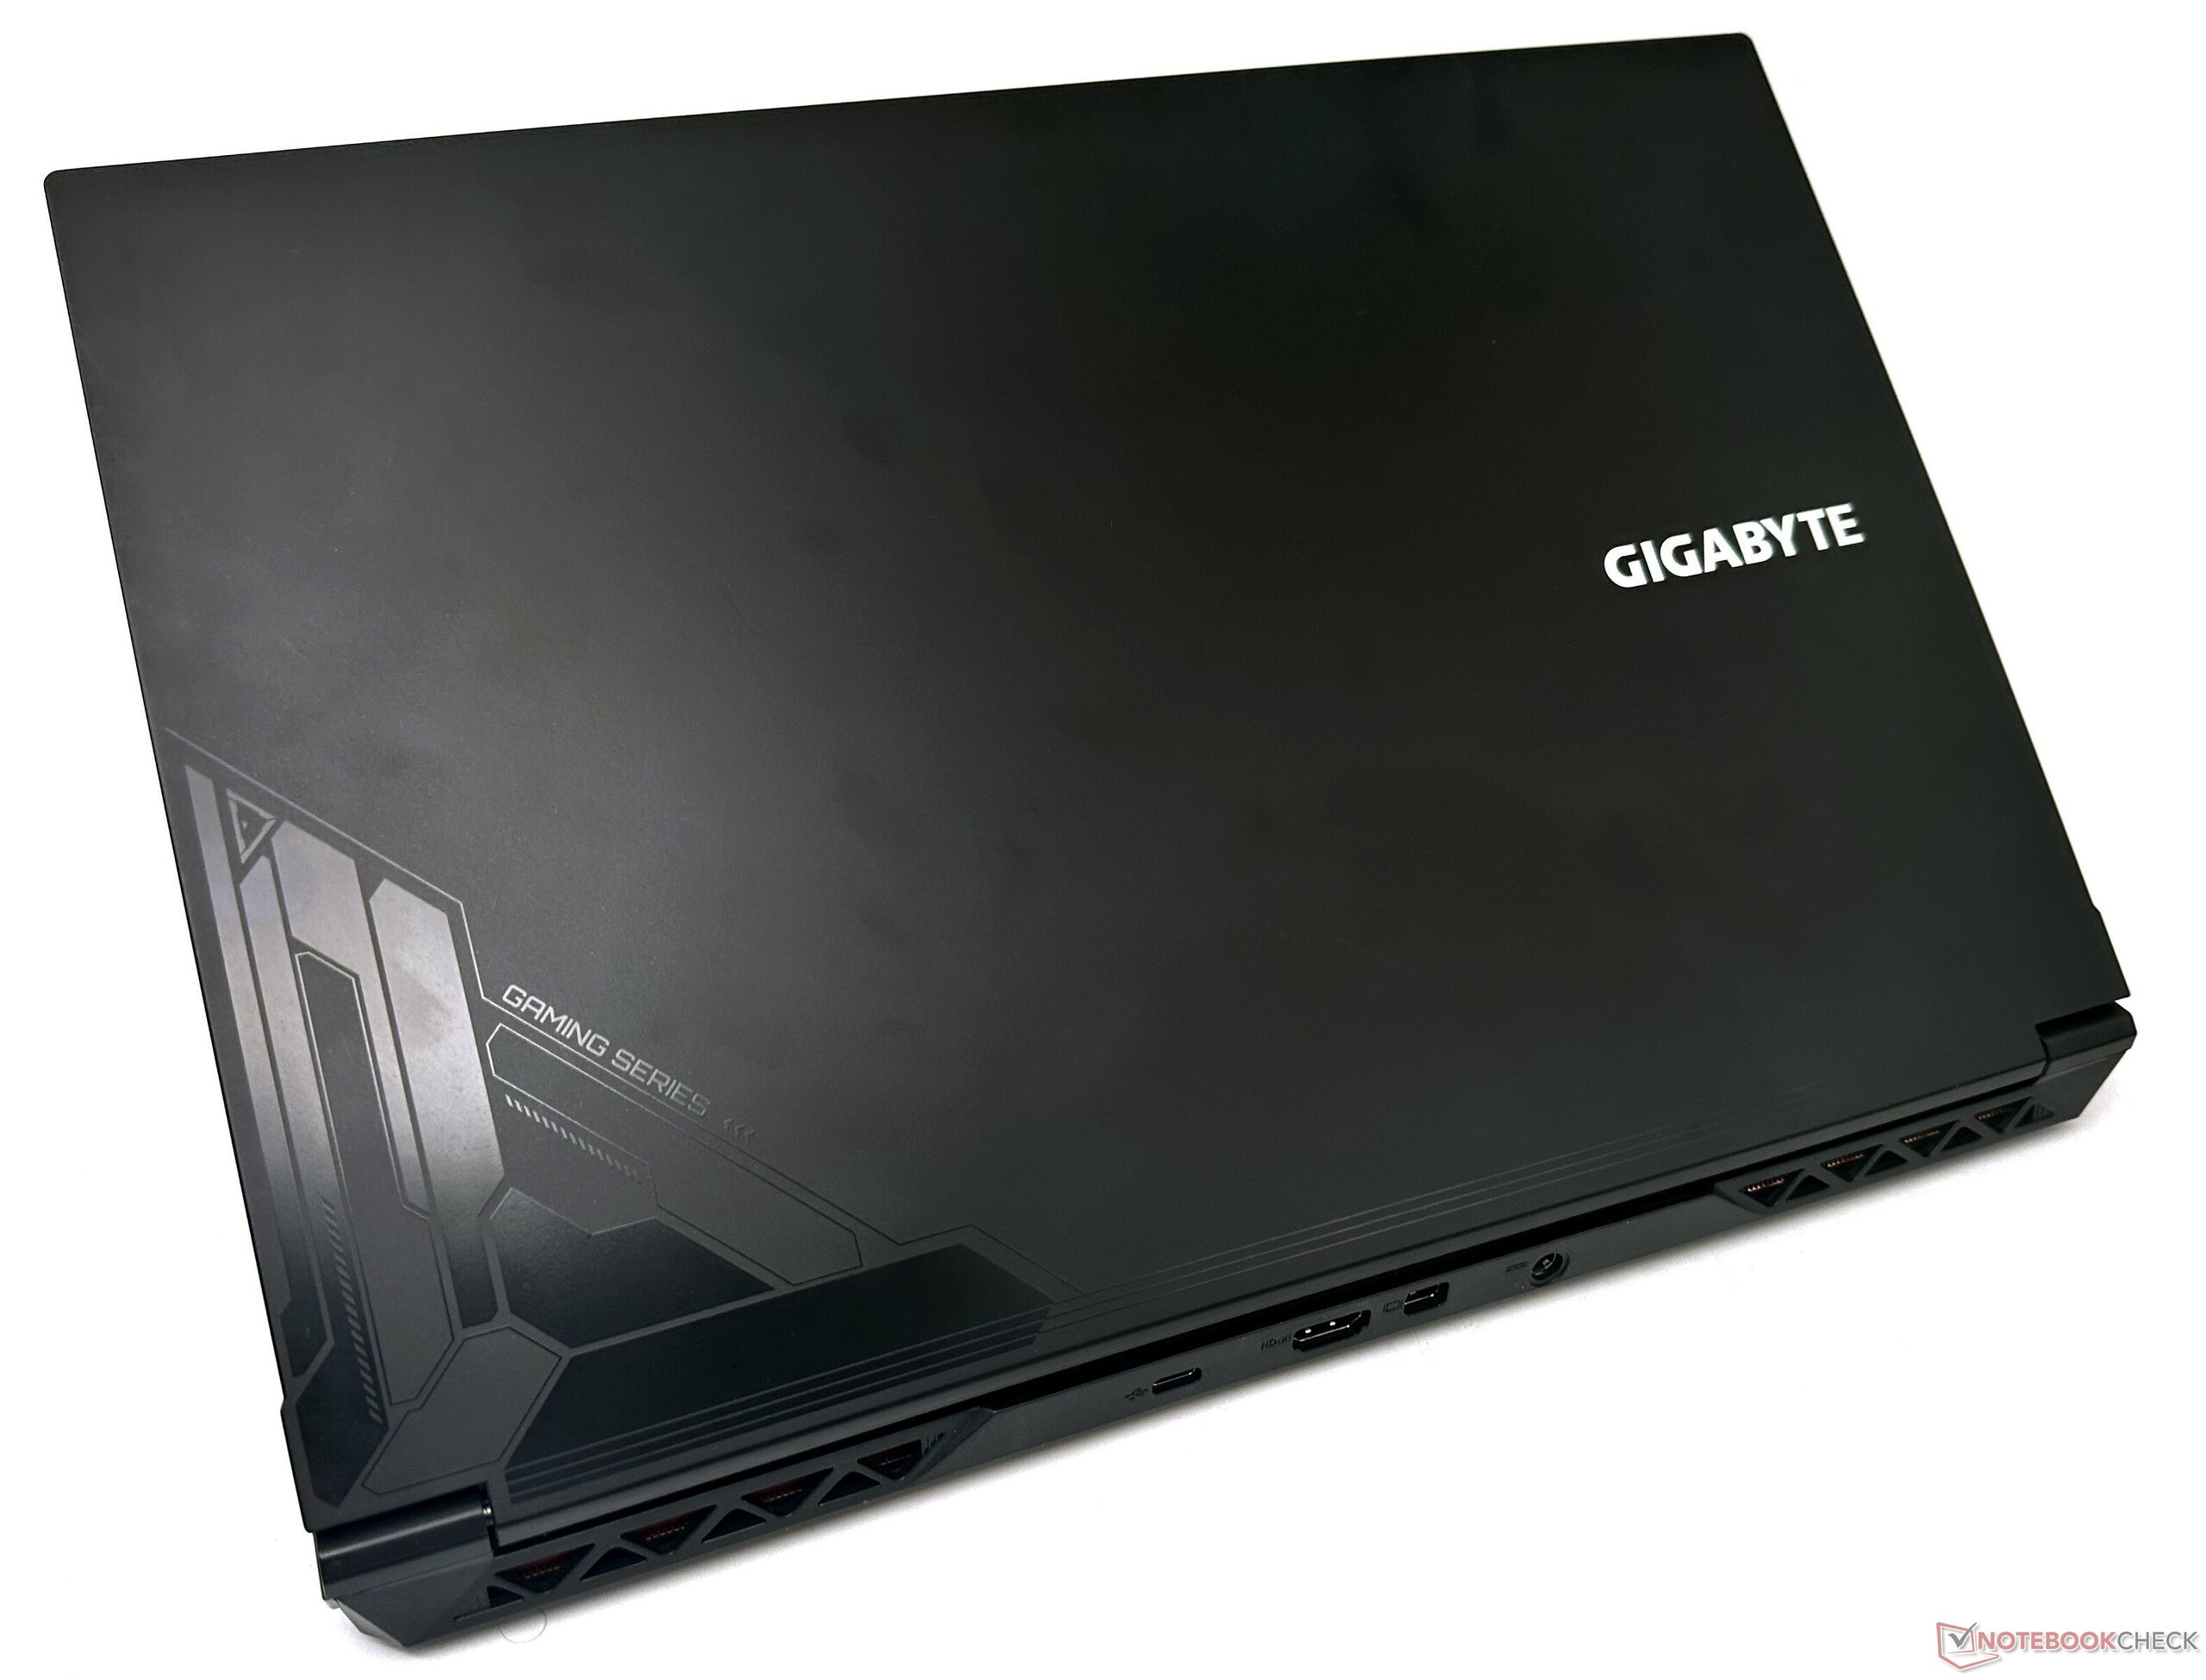
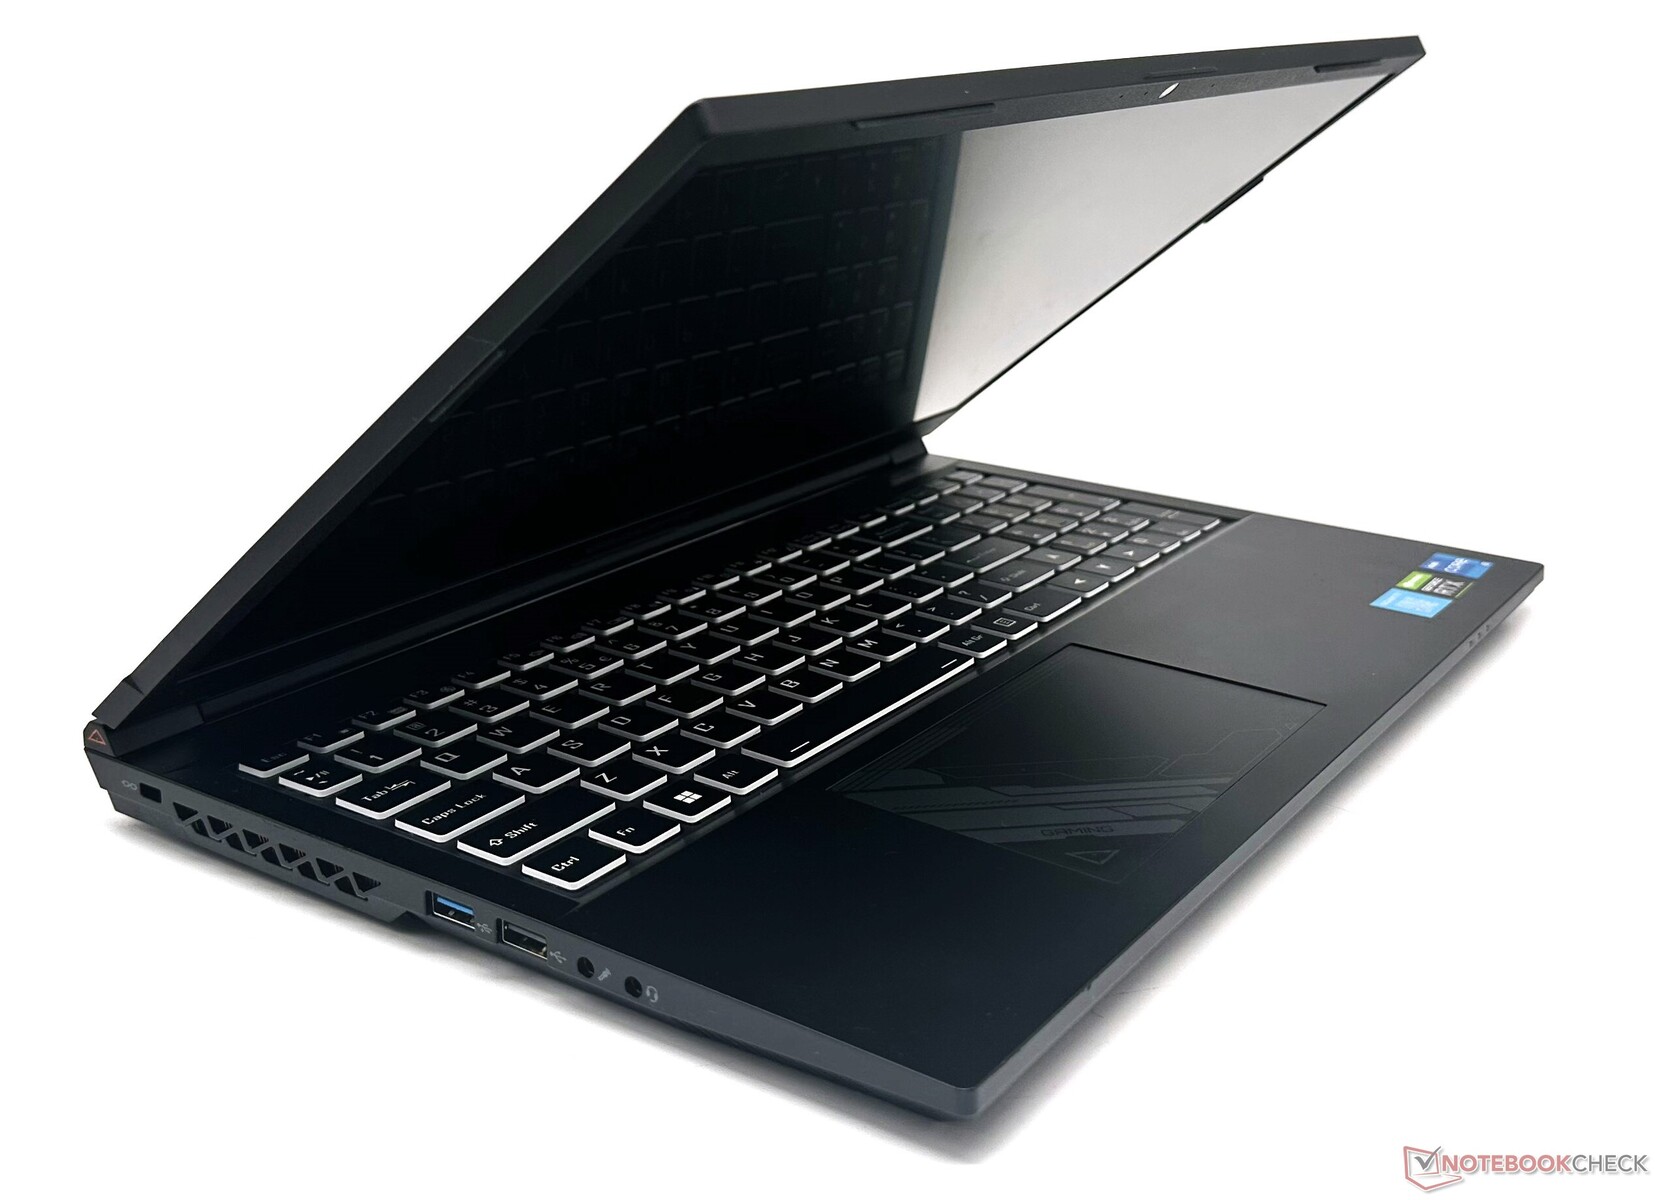
Châssis : Essentiellement en plastique avec un peu de souplesse
La construction du Gigabyte G5 KE est conforme aux attentes dans cette gamme de prix. Il s'agit essentiellement d'un design Clevo entièrement en plastique avec des surfaces lisses et mates avec quelques accents subtils à l'arrière du couvercle et sur le pavé tactile.
Avec 23,9 mm, l'épaisseur du G5 KE est similaire à celle de ses concurrents dans ce segment, tout en étant considérablement plus mince que le Gigabyte A5 K1 Gigabyte A5 K1.
Le châssis du G5 KE n'est pas le plus rigide que nous ayons vu - il y a une flexion considérable sous la pression du clavier et le couvercle peut se tordre. Cependant, il est peu probable que les utilisateurs en fassent l'expérience dans le cadre d'une utilisation quotidienne.
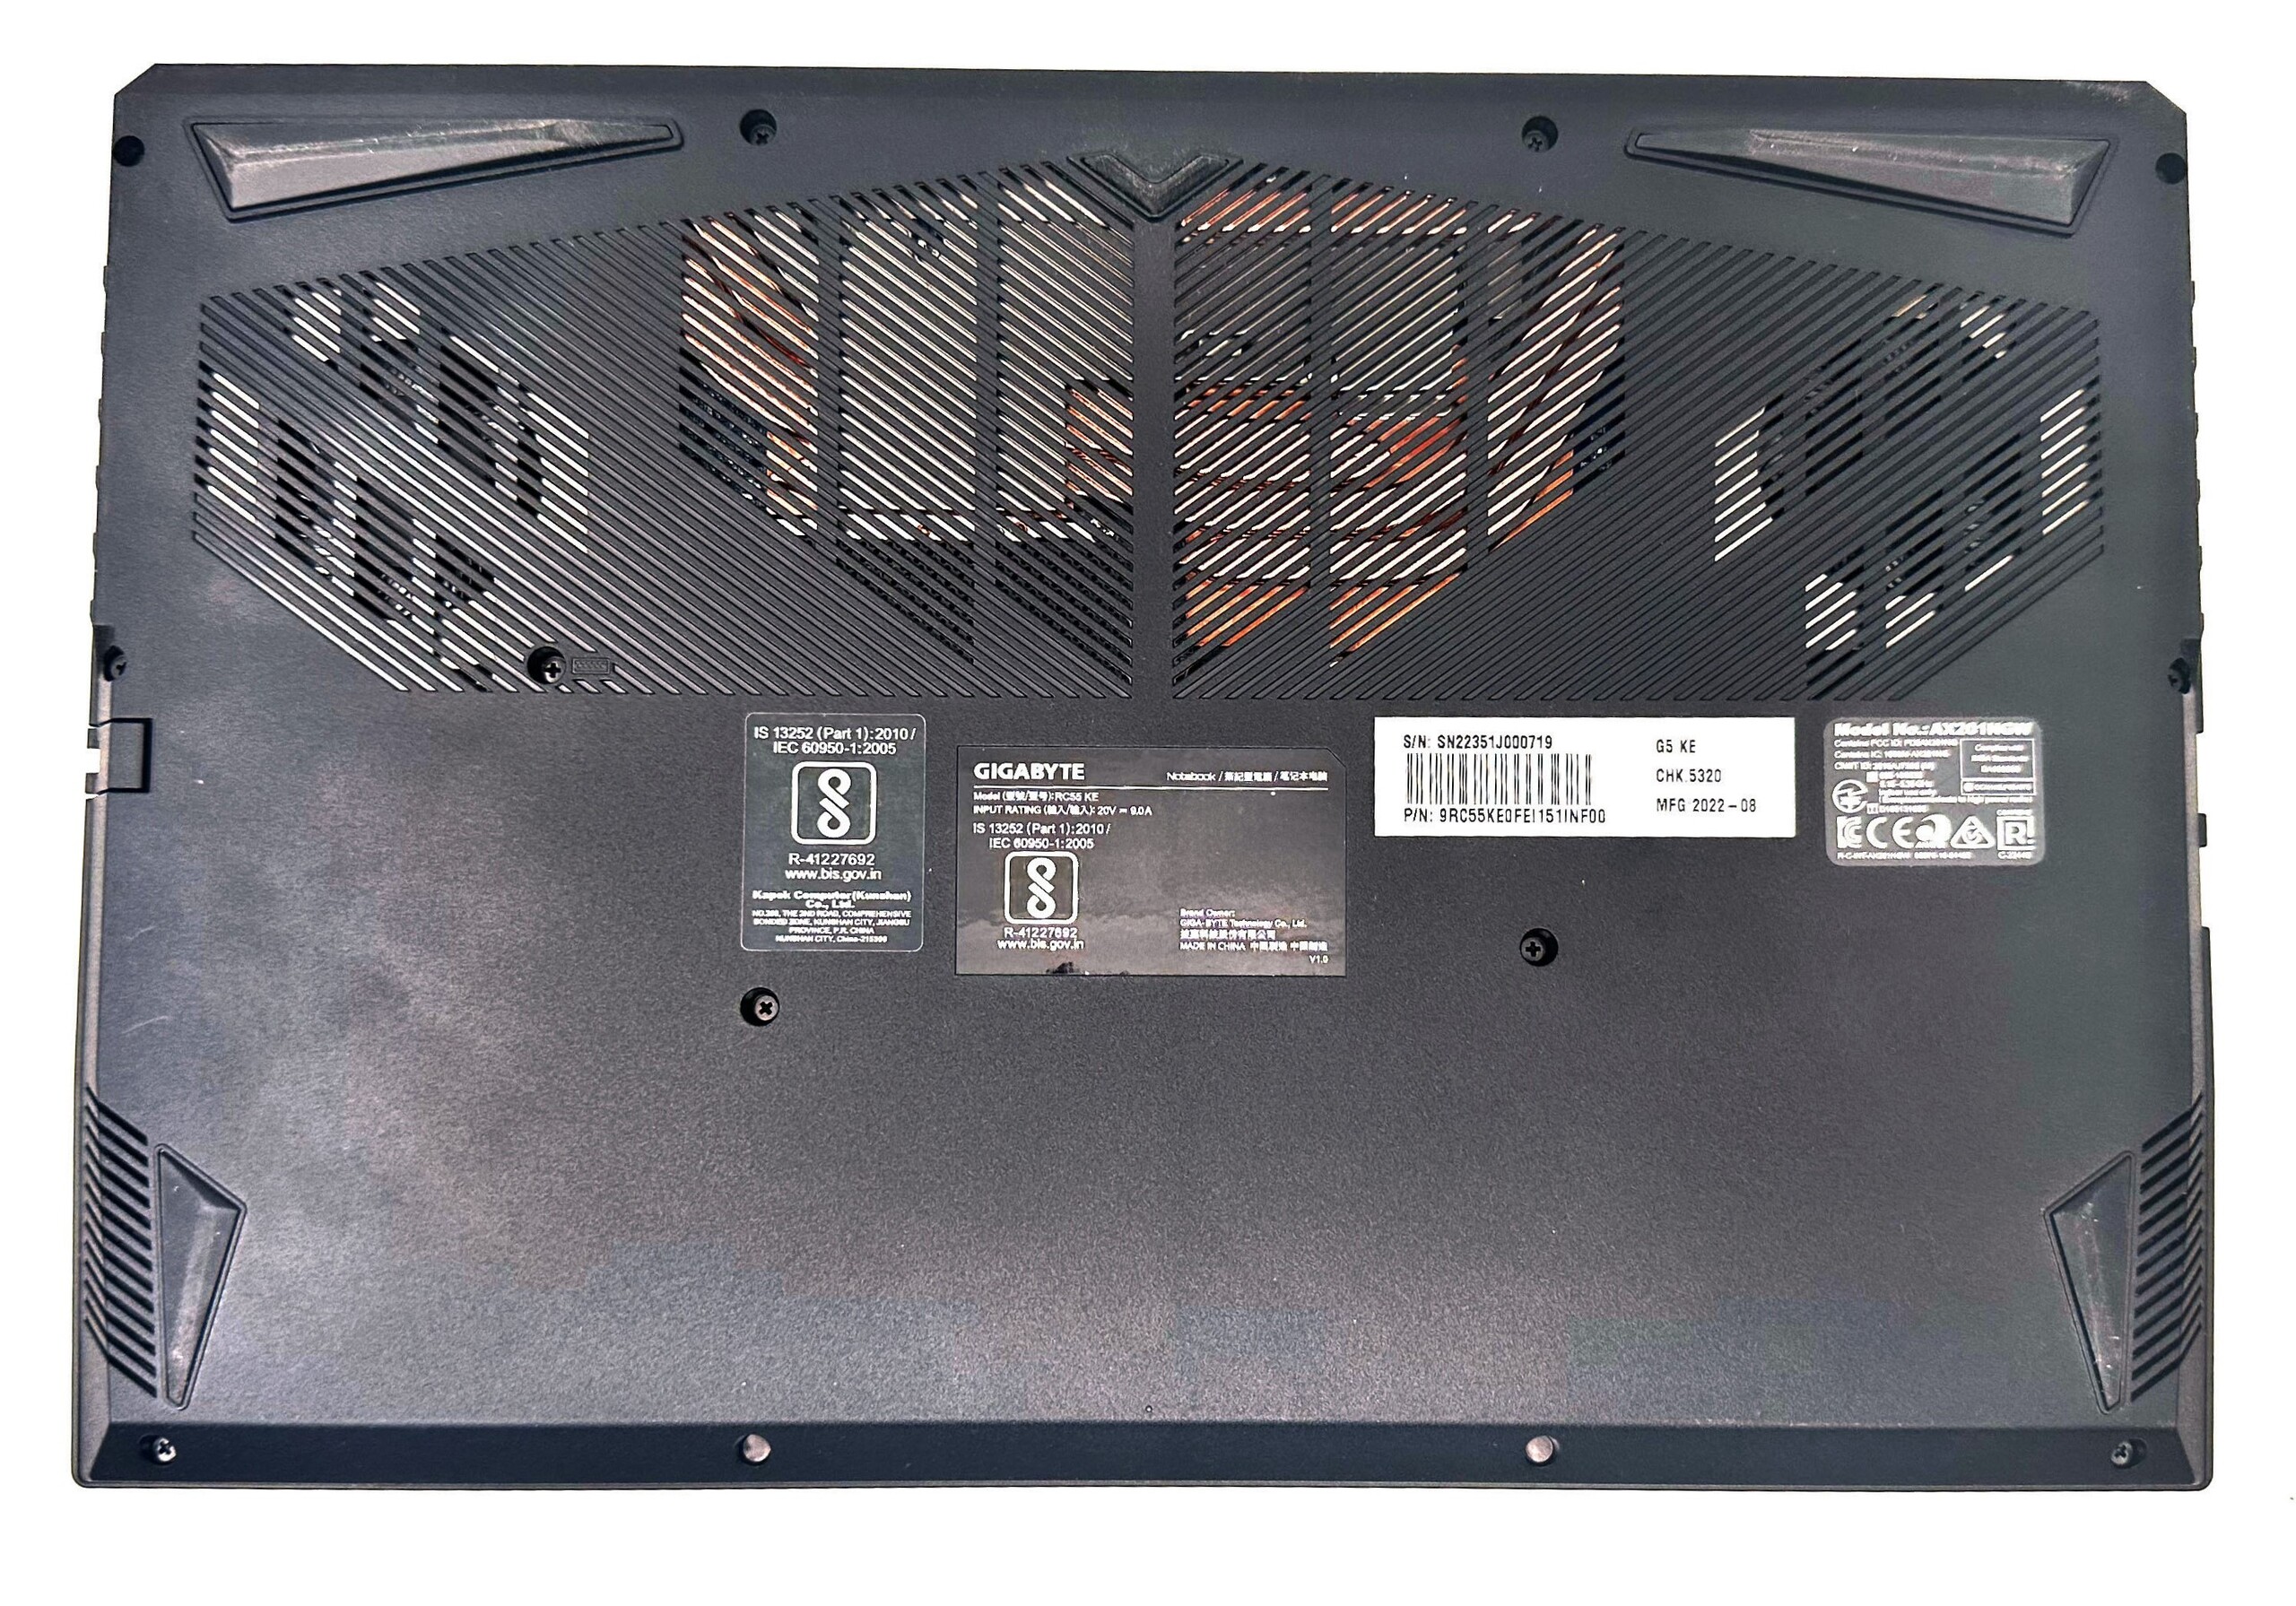
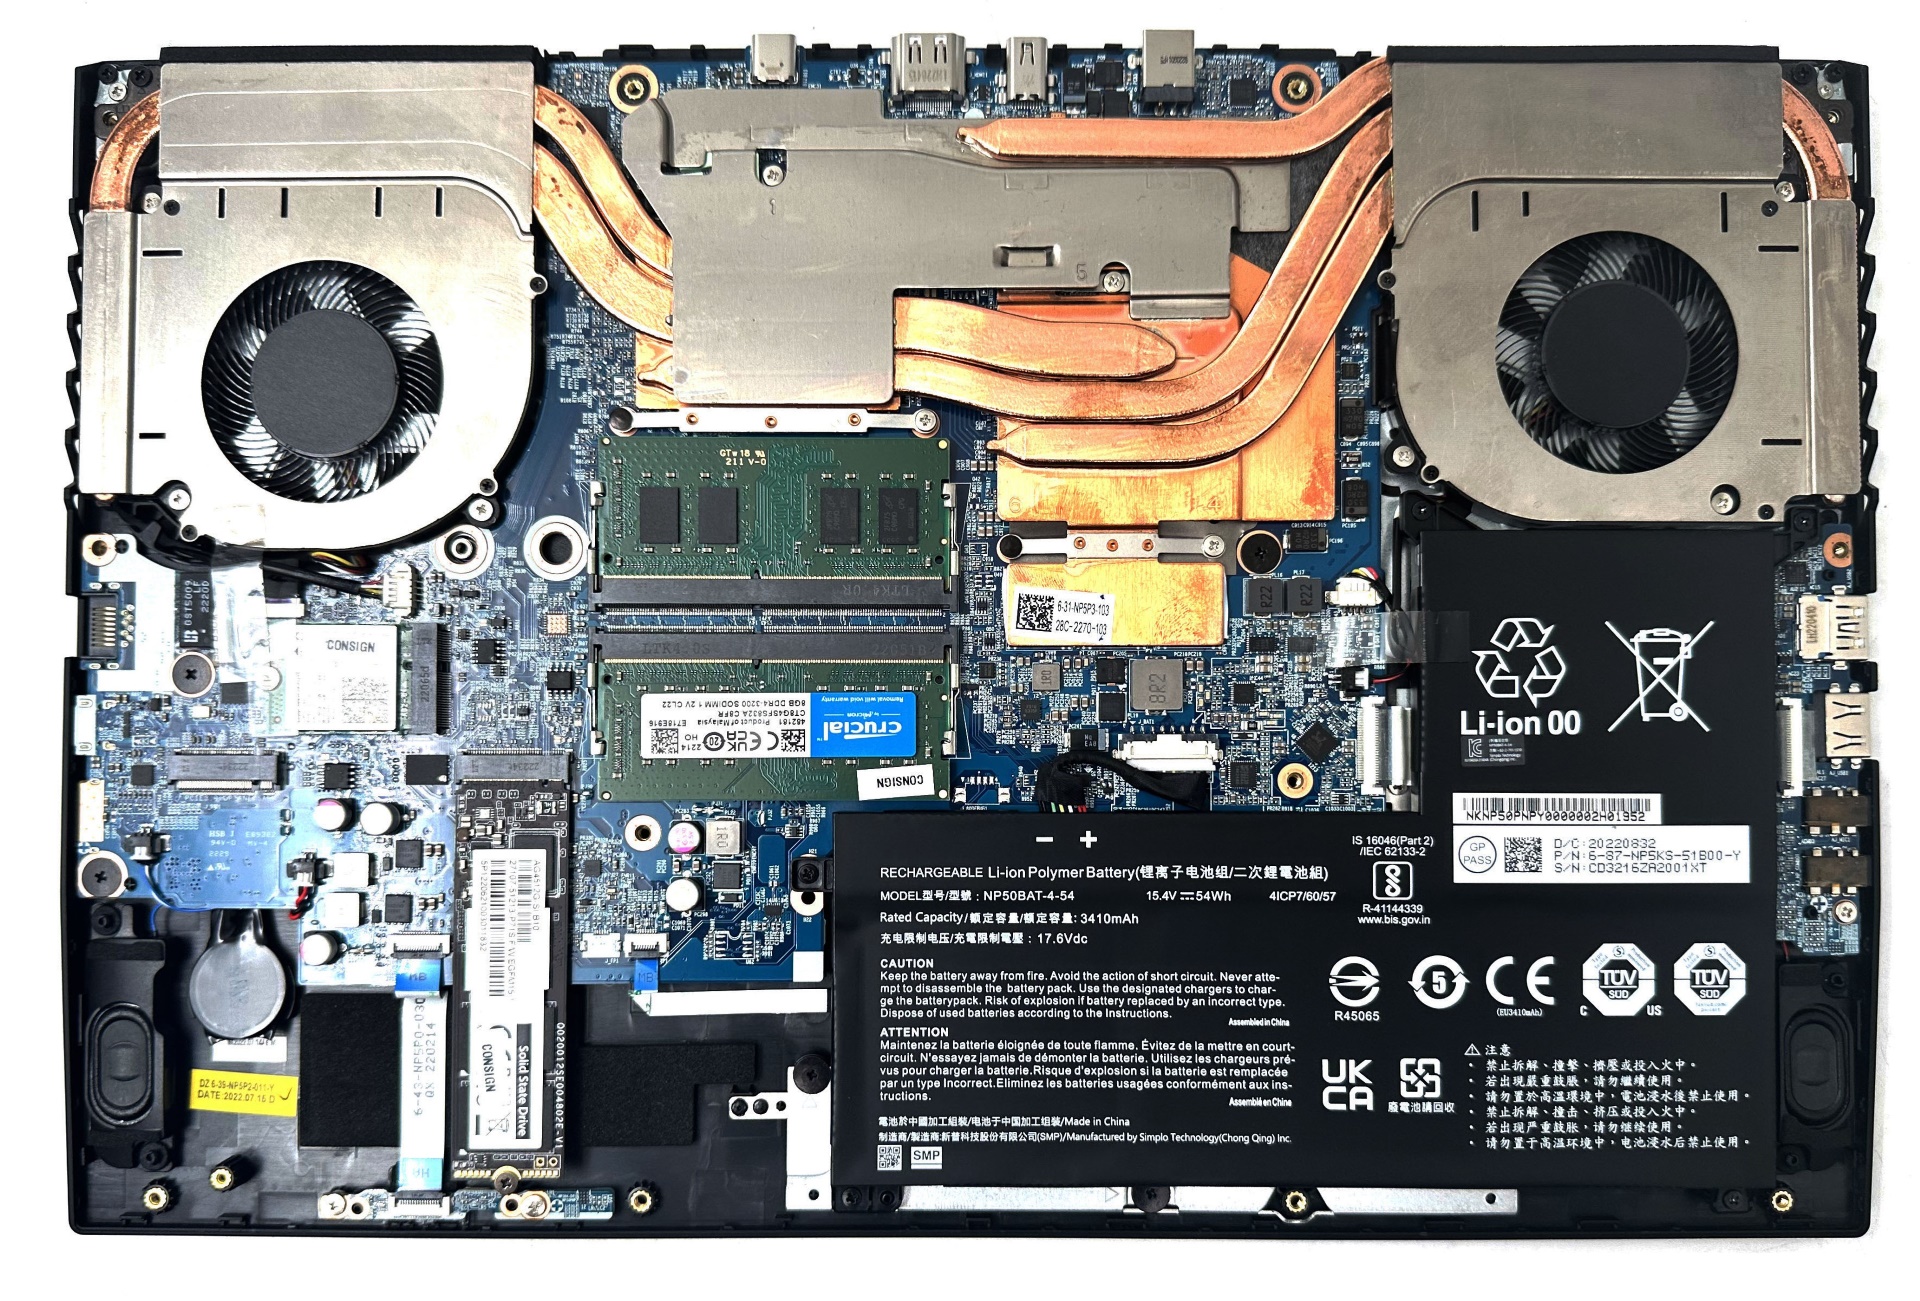
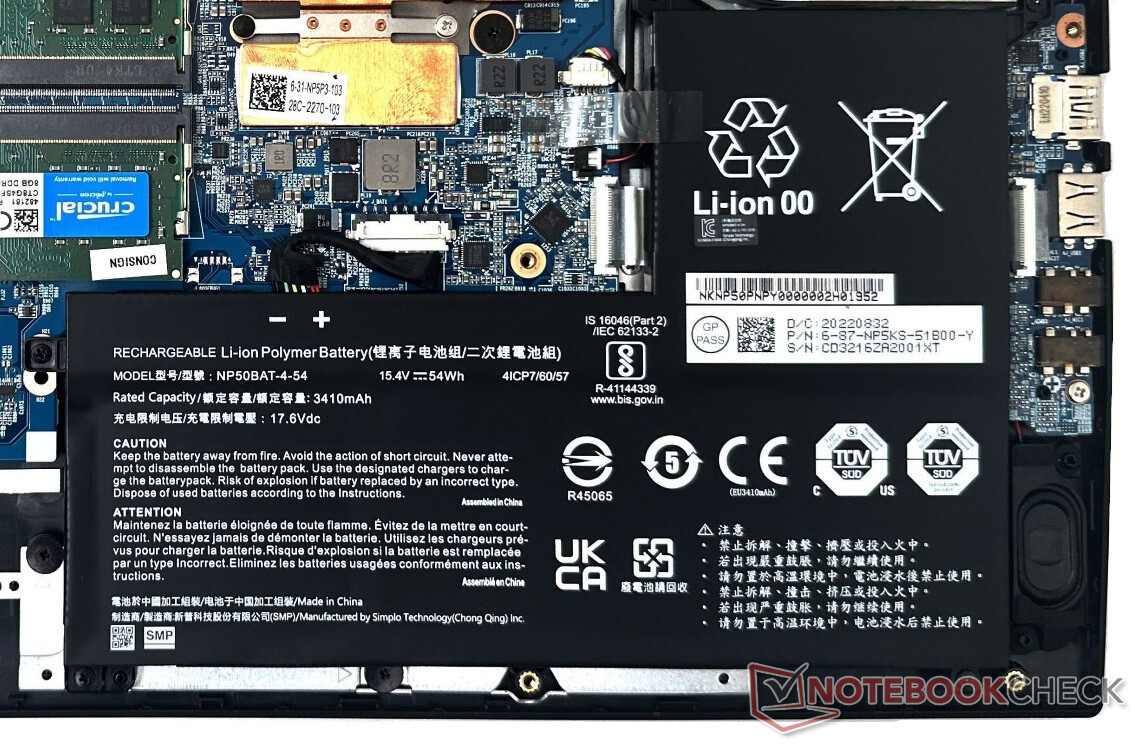
L'ouverture des 13 vis Philips permet de découvrir les composants internes. La RAM DDR4, la carte WLAN et les disques SSD peuvent être remplacés et mis à niveau si nécessaire.

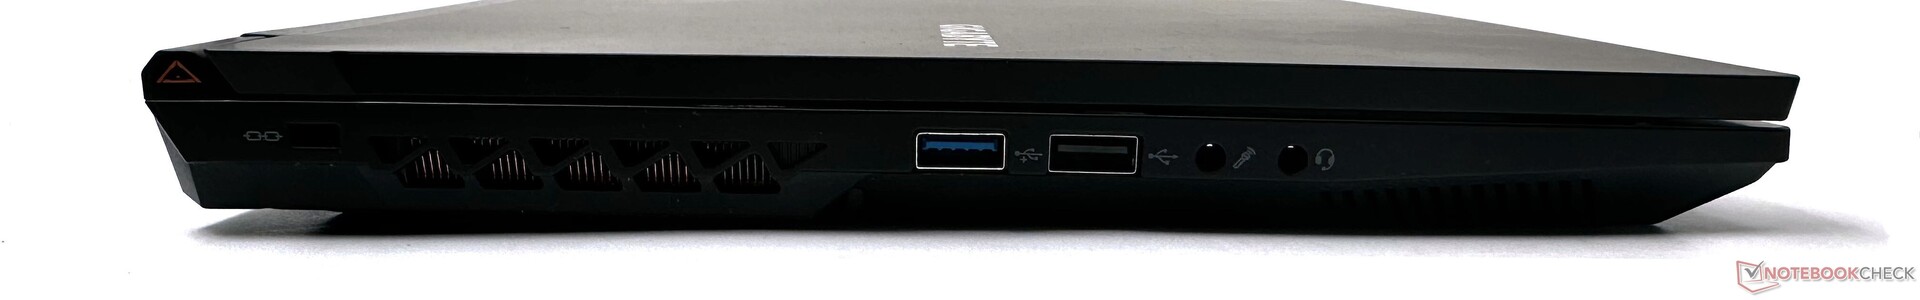
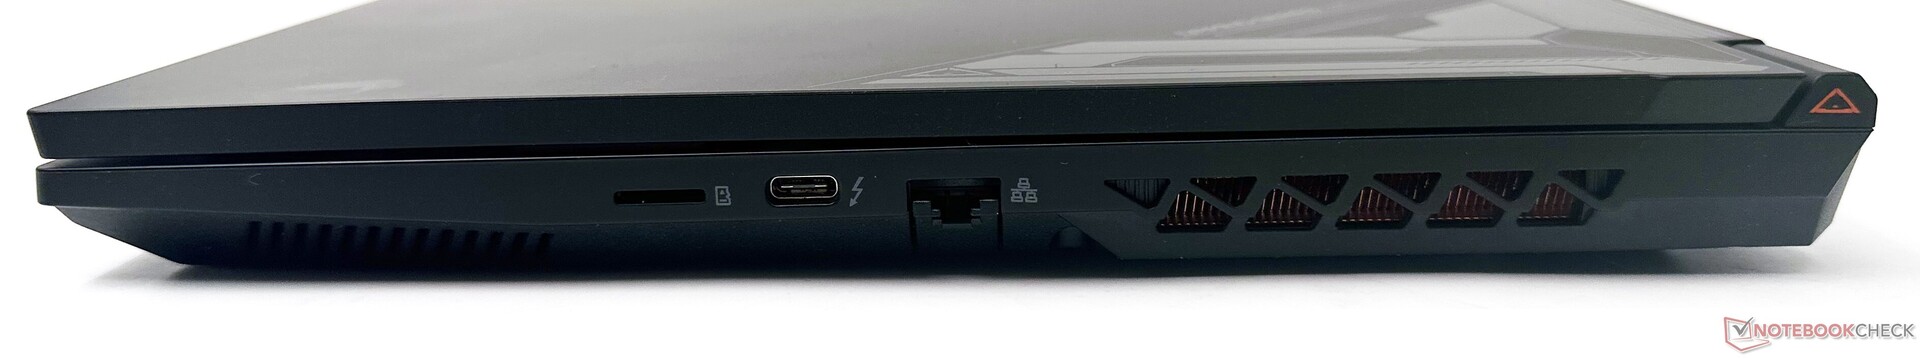
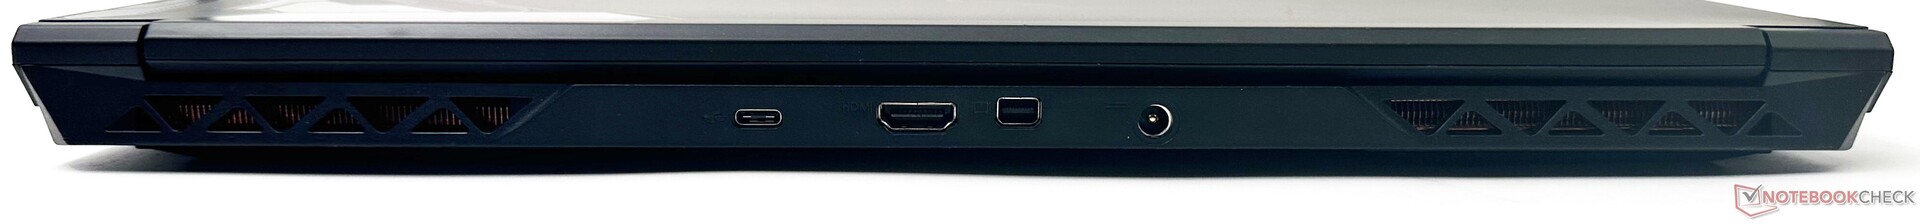
Connectivité : Sélection adéquate de ports et Wi-Fi stable
Le G5 KE offre une sélection de ports bien équilibrée avec une combinaison de ports USB Type-A et Type-C, y compris Thunderbolt 4. La présence d'un mini-port d'affichage 1.4 en plus d'une sortie HDMI 2.1 facilite le branchement d'écrans 4K avec des taux de rafraîchissement élevés.
Les ports ne posent aucun problème lors de la connexion de plusieurs appareils. Un port d'entrée micro dédié - une rareté de nos jours - s'avère pratique pour connecter des microphones de haute qualité, ou peut être reconfiguré pour prendre en charge l'audio multicanal.
La vitesse de lecture des cartes microSD aurait pu être meilleure, mais le G5 KE n'a pas beaucoup de concurrence dans ce domaine.
| SD Card Reader | |
| average JPG Copy Test (av. of 3 runs) | |
| Moyenne de la classe Gaming (20.9 - 210, n=54, 2 dernières années) | |
| Gigabyte G5 KE (AV PRO microSD 128 GB V60) | |
| Schenker XMG Core 15 (M22) (AV PRO microSD 128 GB V60) | |
| HP Victus 16-e0179ng (AV PRO microSD 128 GB V60) | |
| maximum AS SSD Seq Read Test (1GB) | |
| Moyenne de la classe Gaming (25.5 - 261, n=51, 2 dernières années) | |
| Gigabyte G5 KE (AV PRO microSD 128 GB V60) | |
| Gigabyte G7 KE (AV PRO microSD 128 GB V60) | |
| Schenker XMG Core 15 (M22) (AV PRO microSD 128 GB V60) | |
| HP Victus 16-e0179ng (AV PRO microSD 128 GB V60) | |
Le G5 KE n'offre pas le Wi-Fi 6E. Néanmoins, nous avons observé un débit très bon et assez constant dans la bande 5 GHz lors des tests avec notre routeur de référence Asus ROG Rapture GT-AXE11000.
La webcam 720p présente d'importants écarts de couleur et les images manquent de netteté. Elle devrait néanmoins permettre de passer un ou deux appels vidéo.


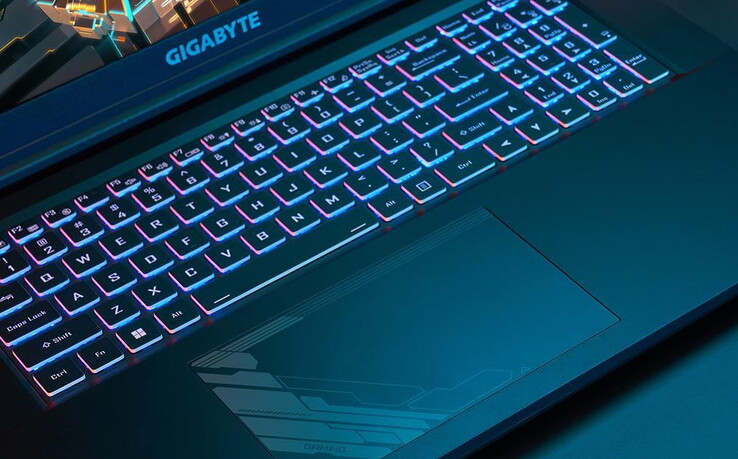
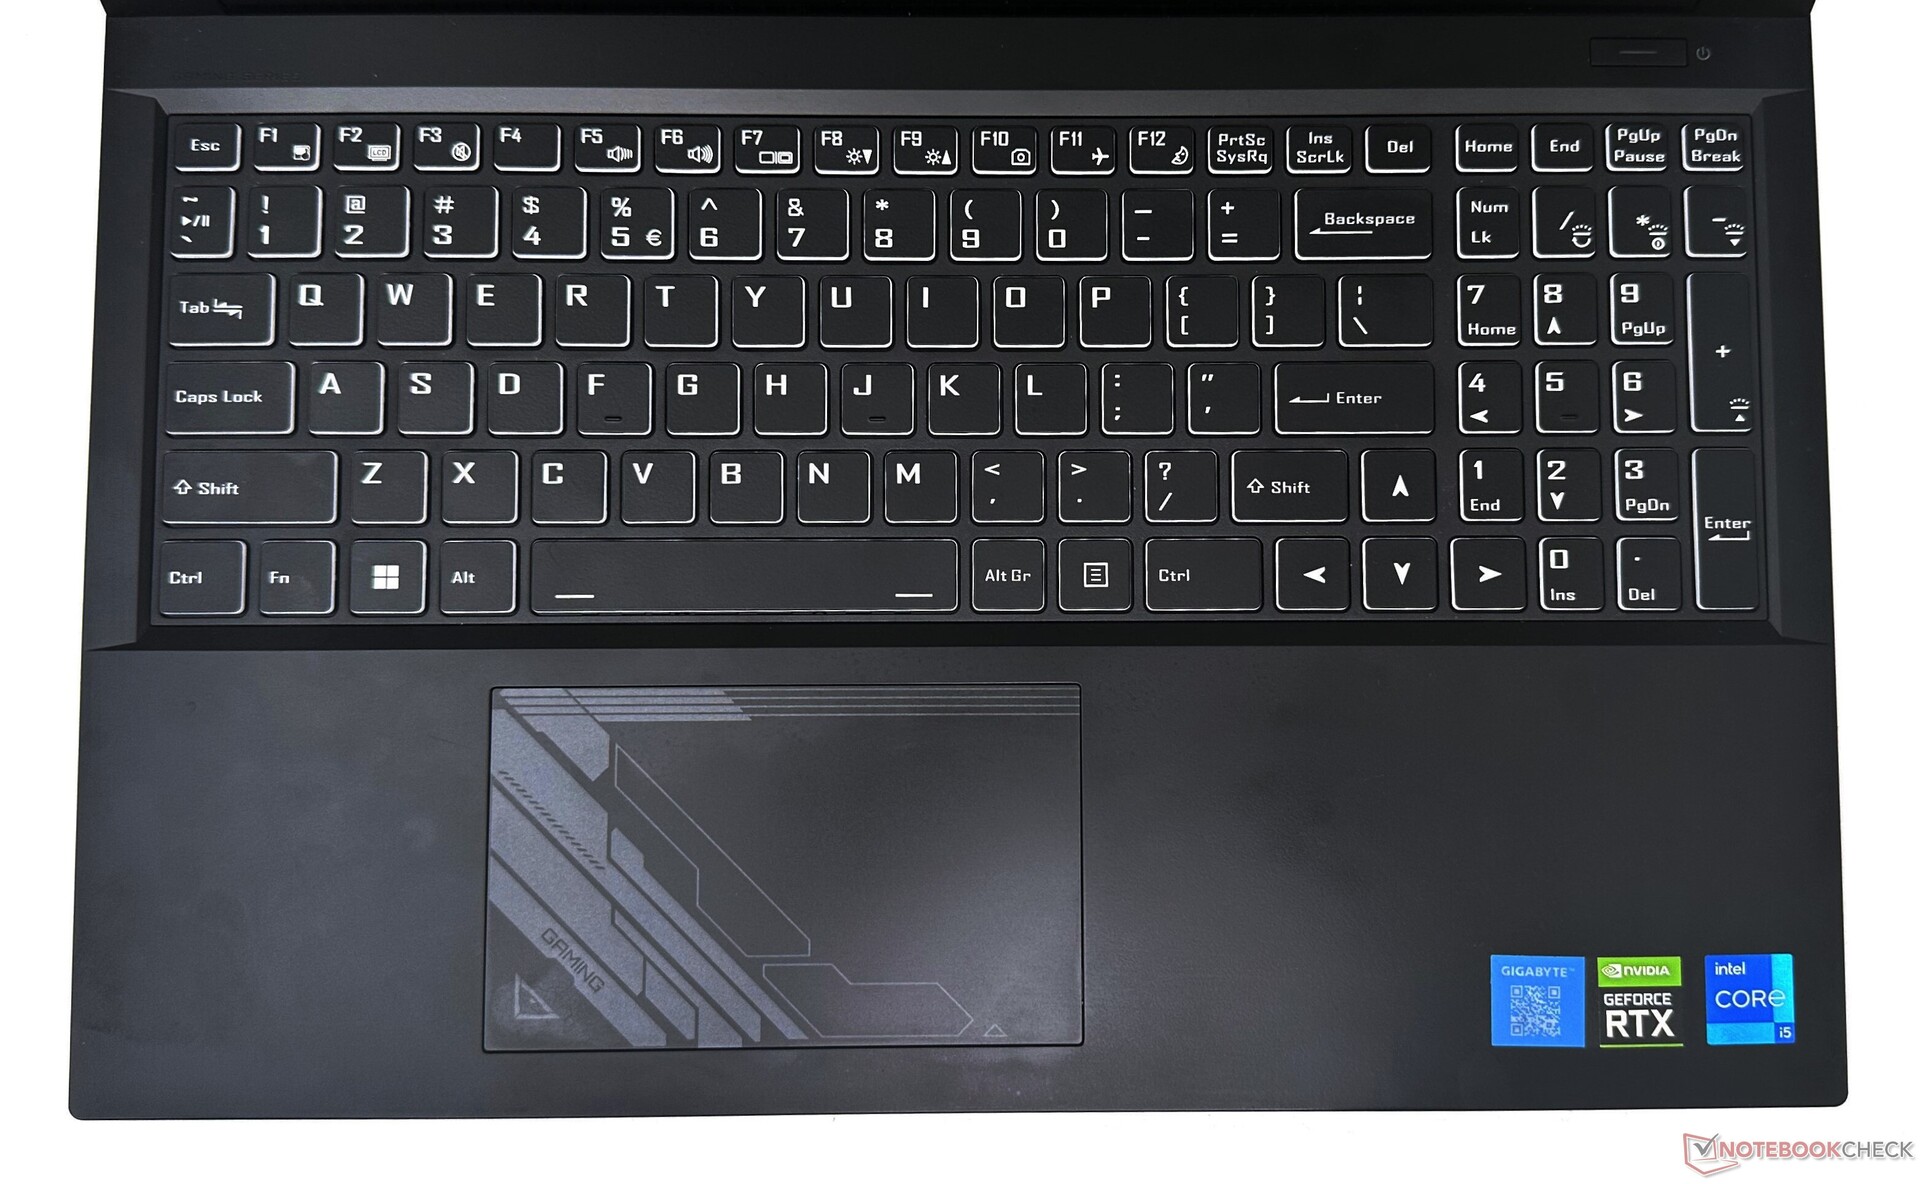
Périphériques d'entrée : Touches fléchées de taille normale
Le clavier chiclet offre une course et une action correctes. Cependant, la frappe est un peu molle et le retour d'information tactile est un peu insuffisant. Les touches fléchées de grande taille permettent une navigation confortable dans les documents et les feuilles de calcul.
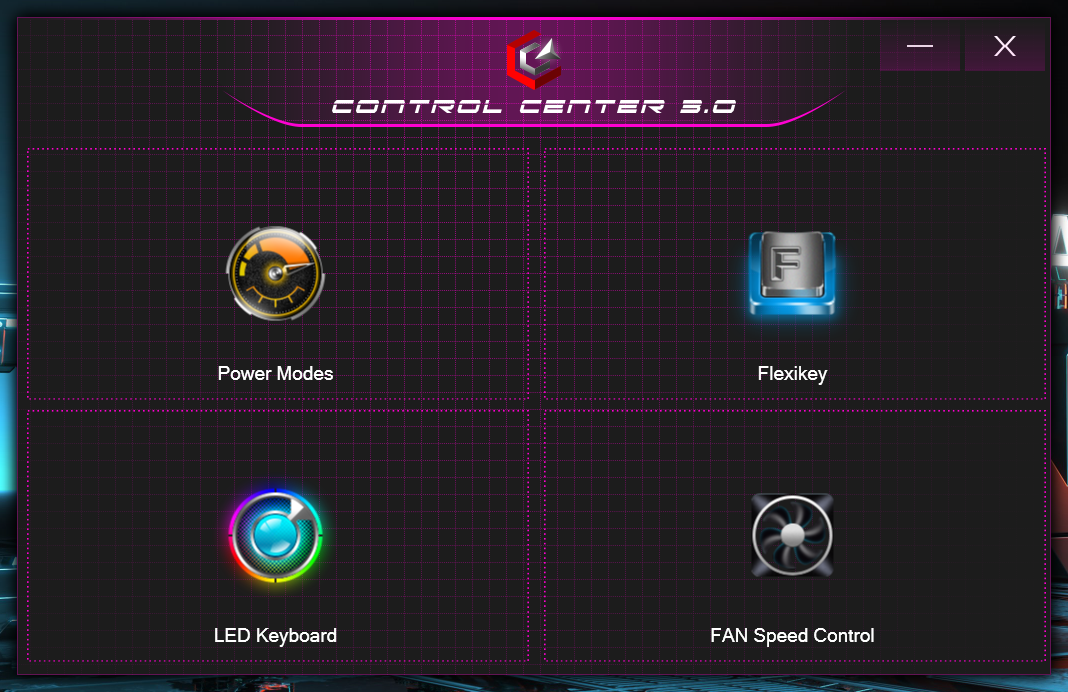
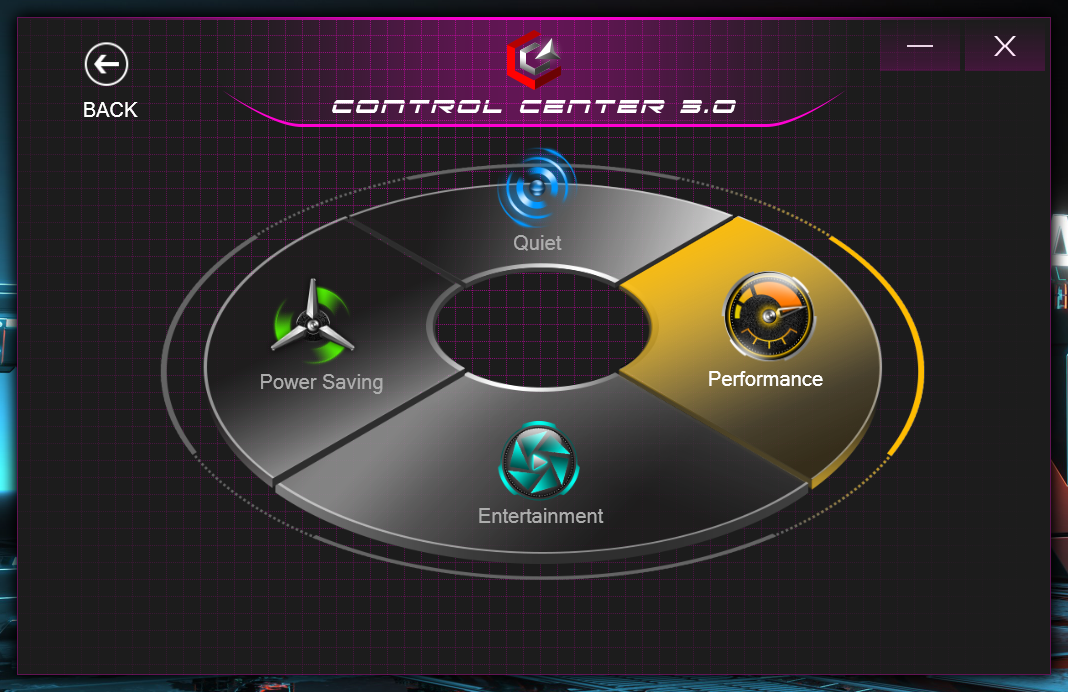
Le rétroéclairage RVB peut être réglé en quatre étapes. Il ne s'agit pas d'un clavier RGB multizone, mais il est possible de le personnaliser via le logiciel Control Center 3.0.
Le pavé tactile de 12 cm x 7,5 cm est suffisamment spacieux, prend en charge les gestes Windows Precision et offre une bonne expérience de glissement avec une résistance minimale. L'ensemble de la surface fait office de bouton gauche de la souris. Les clics ont une course courte et une bonne tactilité.
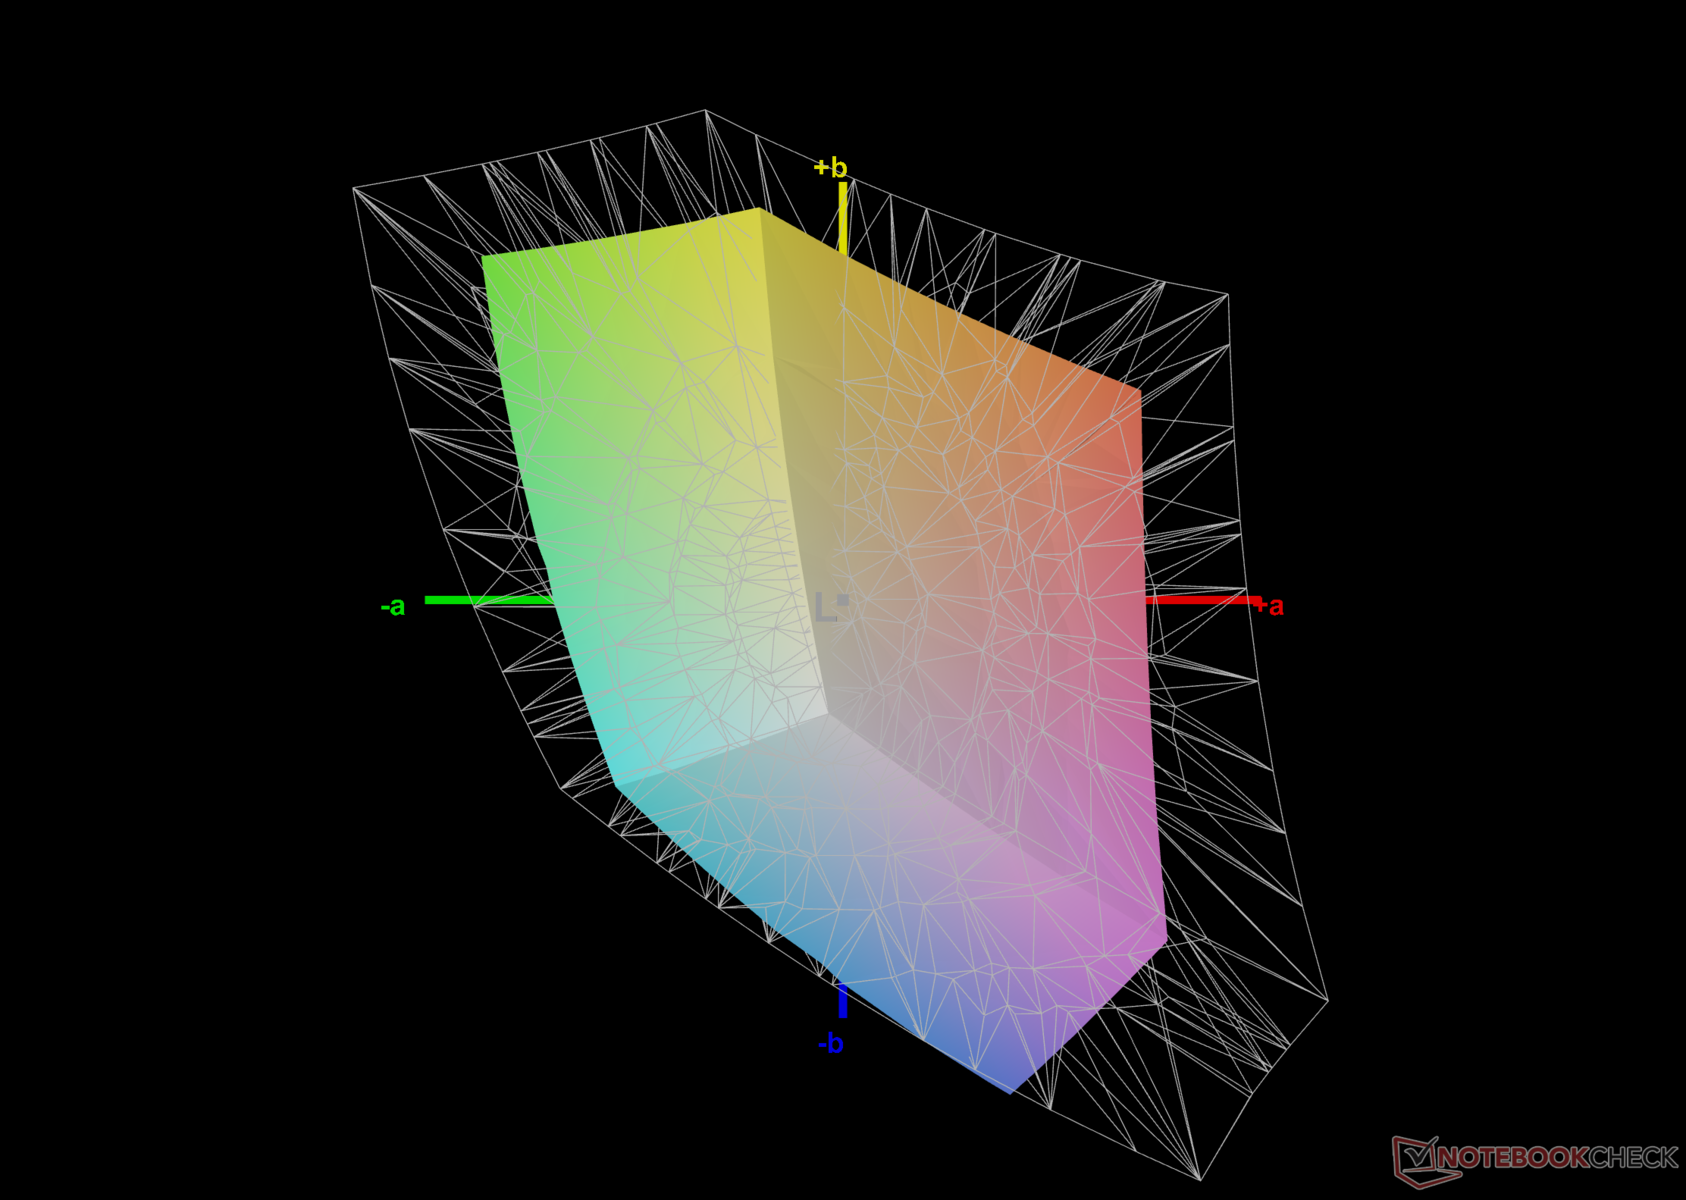
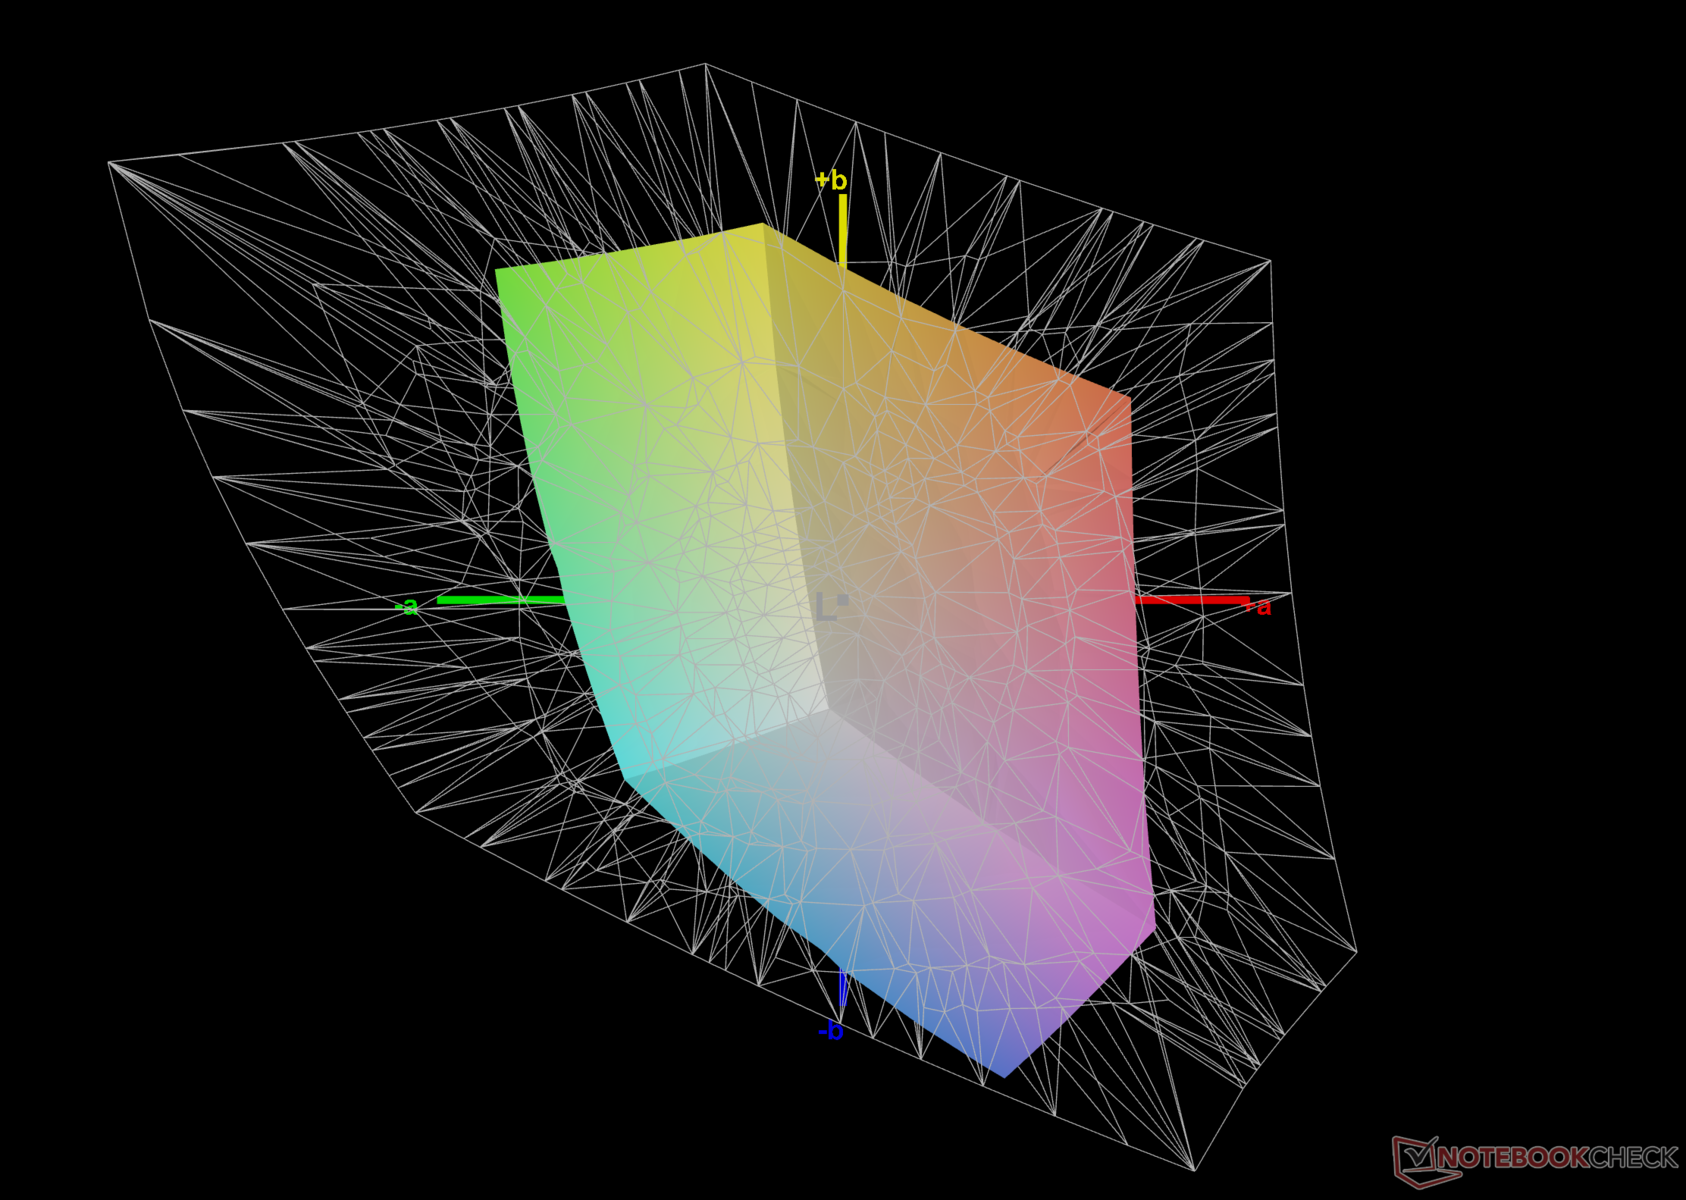
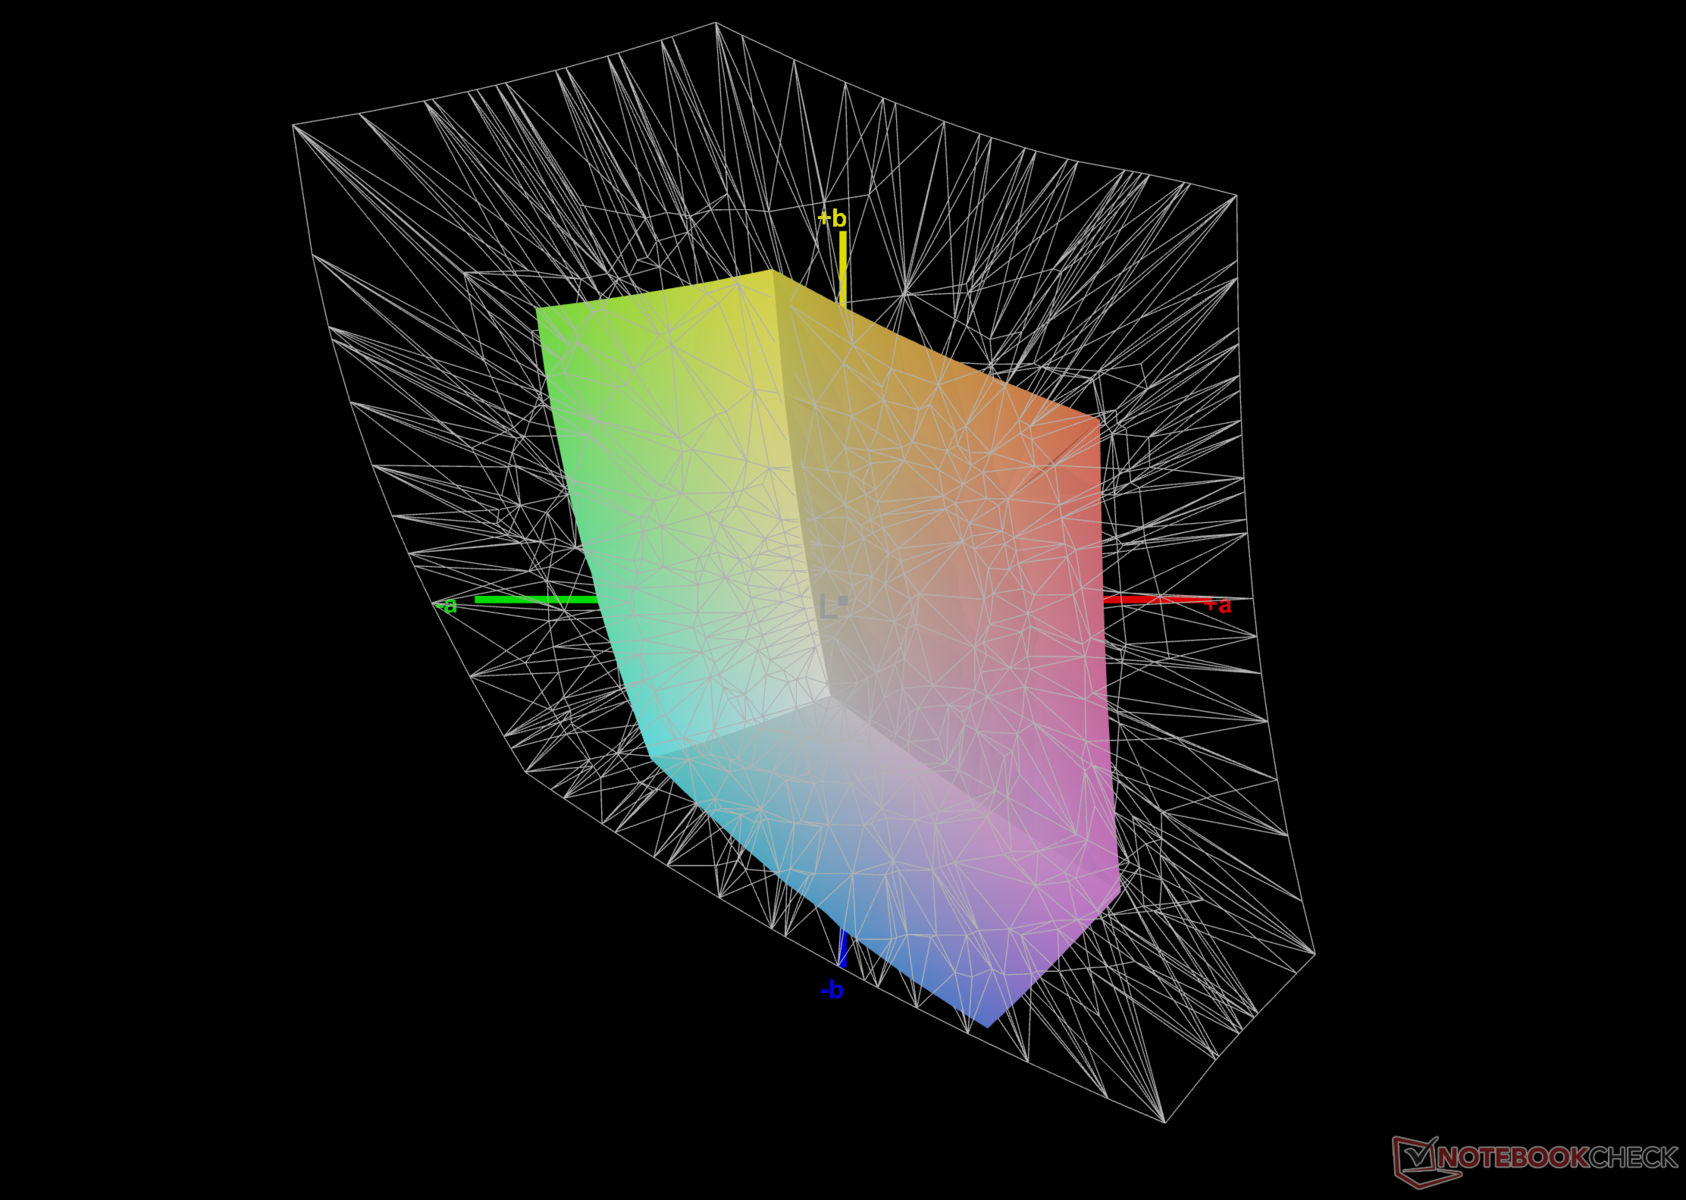
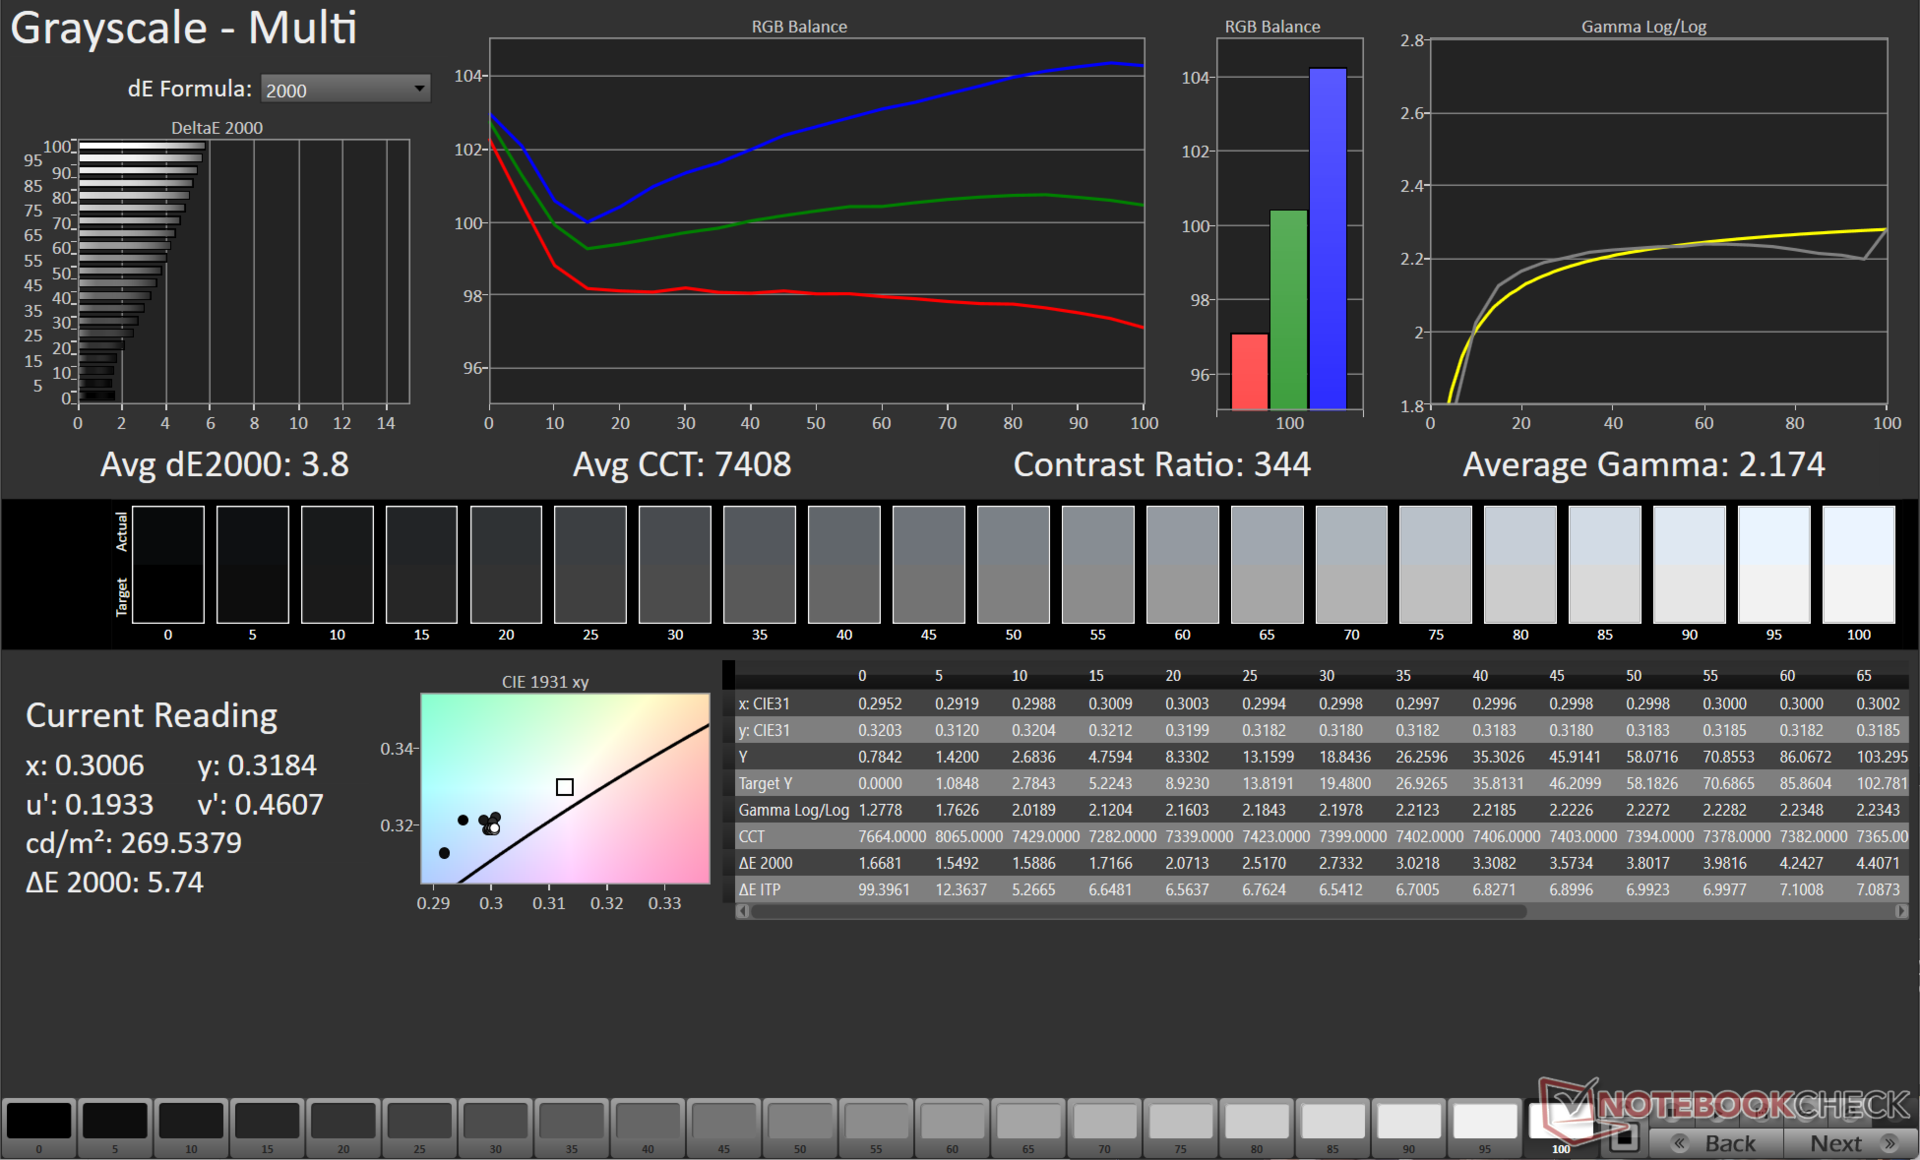
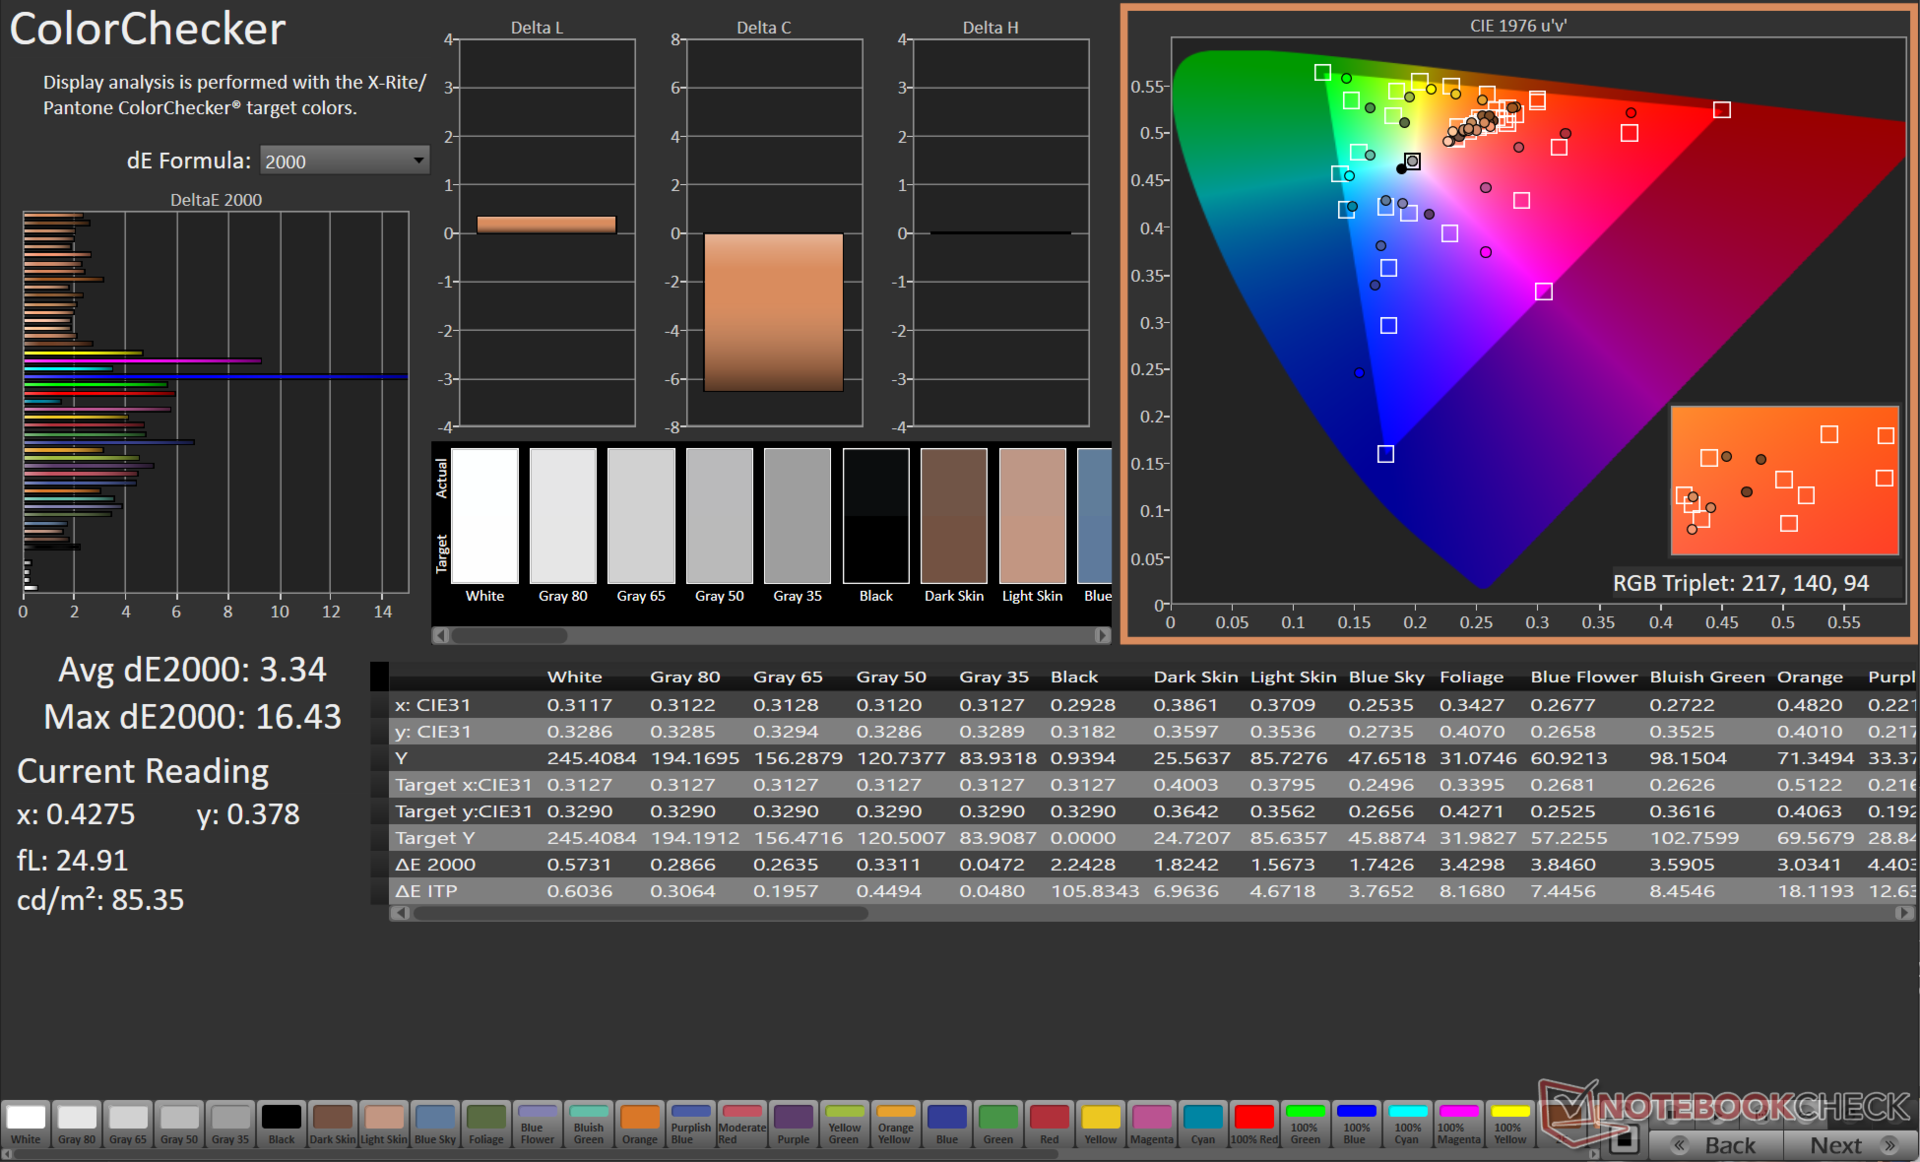
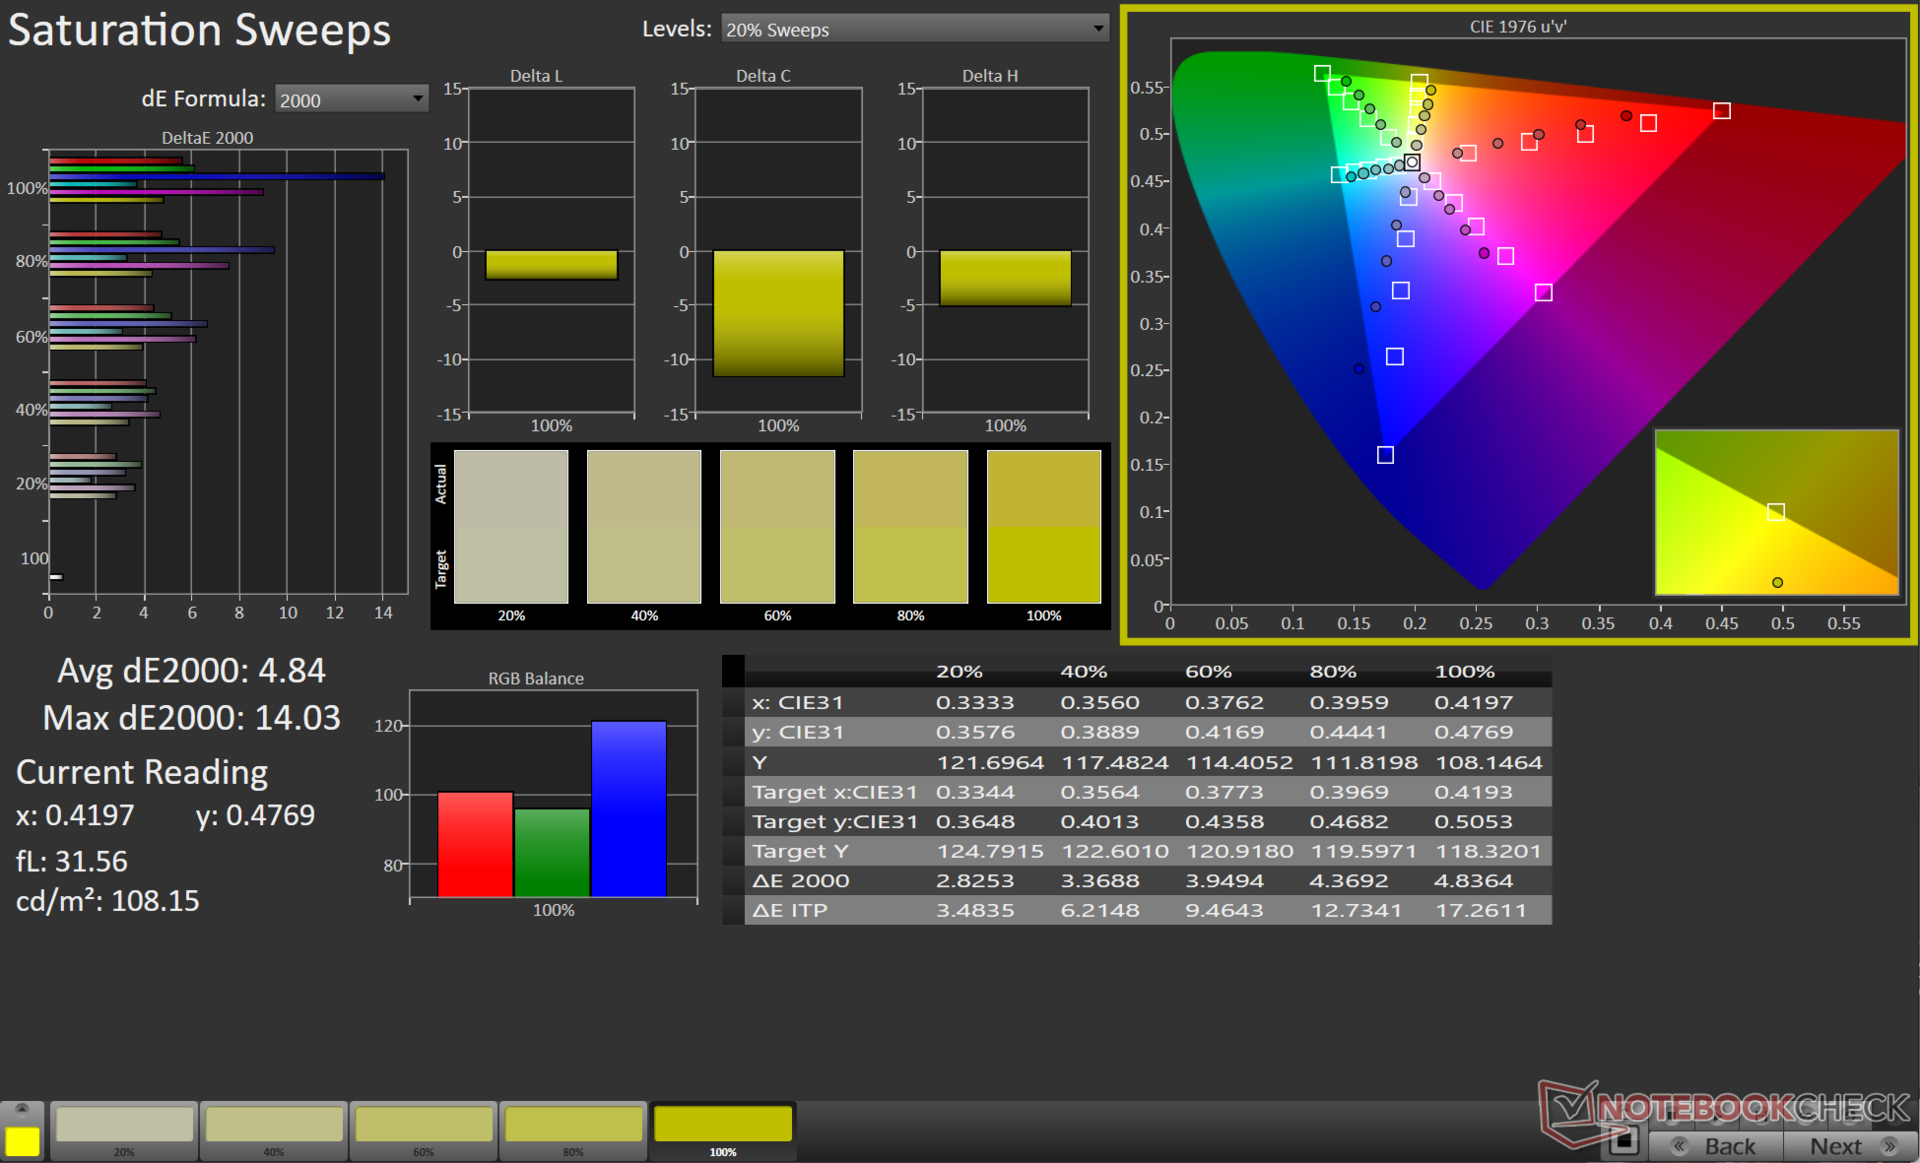
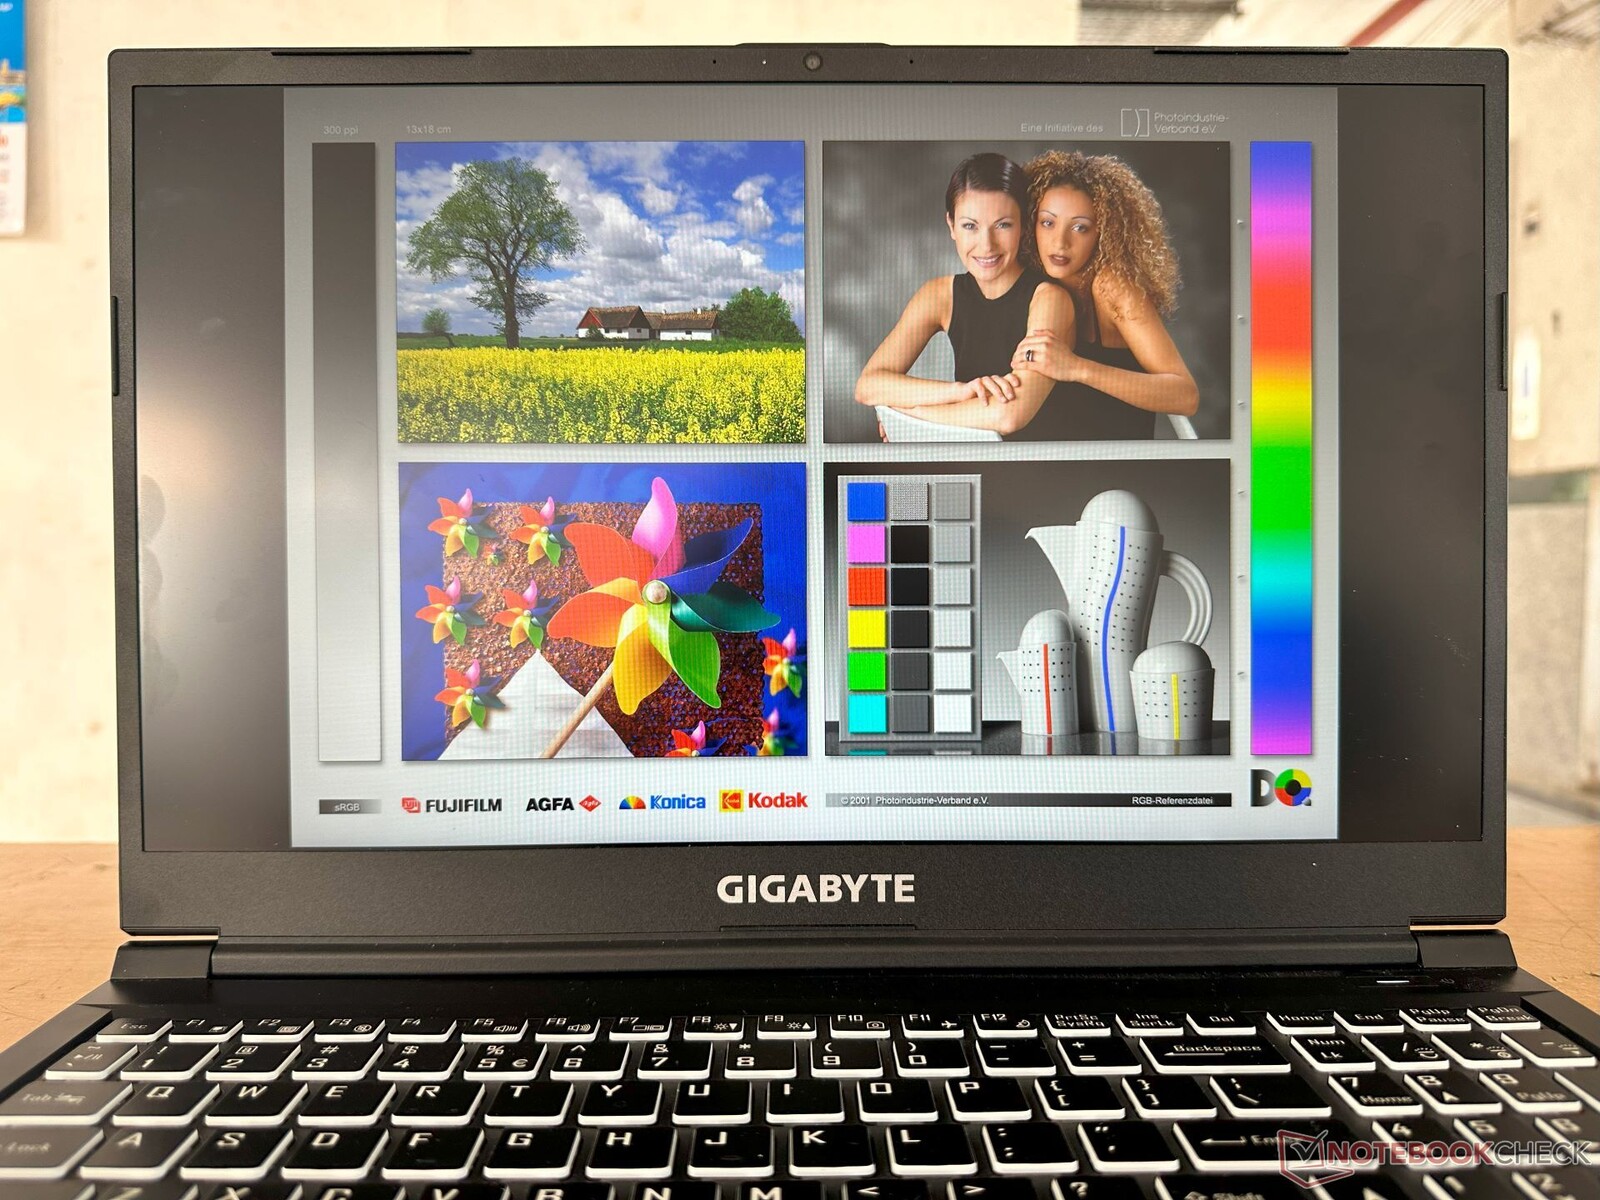
Affichage : Mauvaise couverture de la gamme de couleurs, temps de réponse élevés et absence de PWM
La dalle Chi Mei 1080p 144 Hz du Gigabyte G5 KE commence à montrer des signes de fatigue. Nous avons déjà vu cette dalle dans le 2021 Gigabyte G5 GD et Asus TUF Gaming F15 FX506HM. La concurrence a évolué vers de meilleures dalles avec une couverture de la gamme de couleurs beaucoup plus large.
La distribution de la luminosité est décente à 85%, mais la gamme de couleurs est médiocre pour un ordinateur portable 2023 avec une couverture sRGB d'environ 61%.


| |||||||||||||||||||||||||
Homogénéité de la luminosité: 85 %
Valeur mesurée au centre, sur batterie: 266 cd/m²
Contraste: 538:1 (Valeurs des noirs: 0.5 cd/m²)
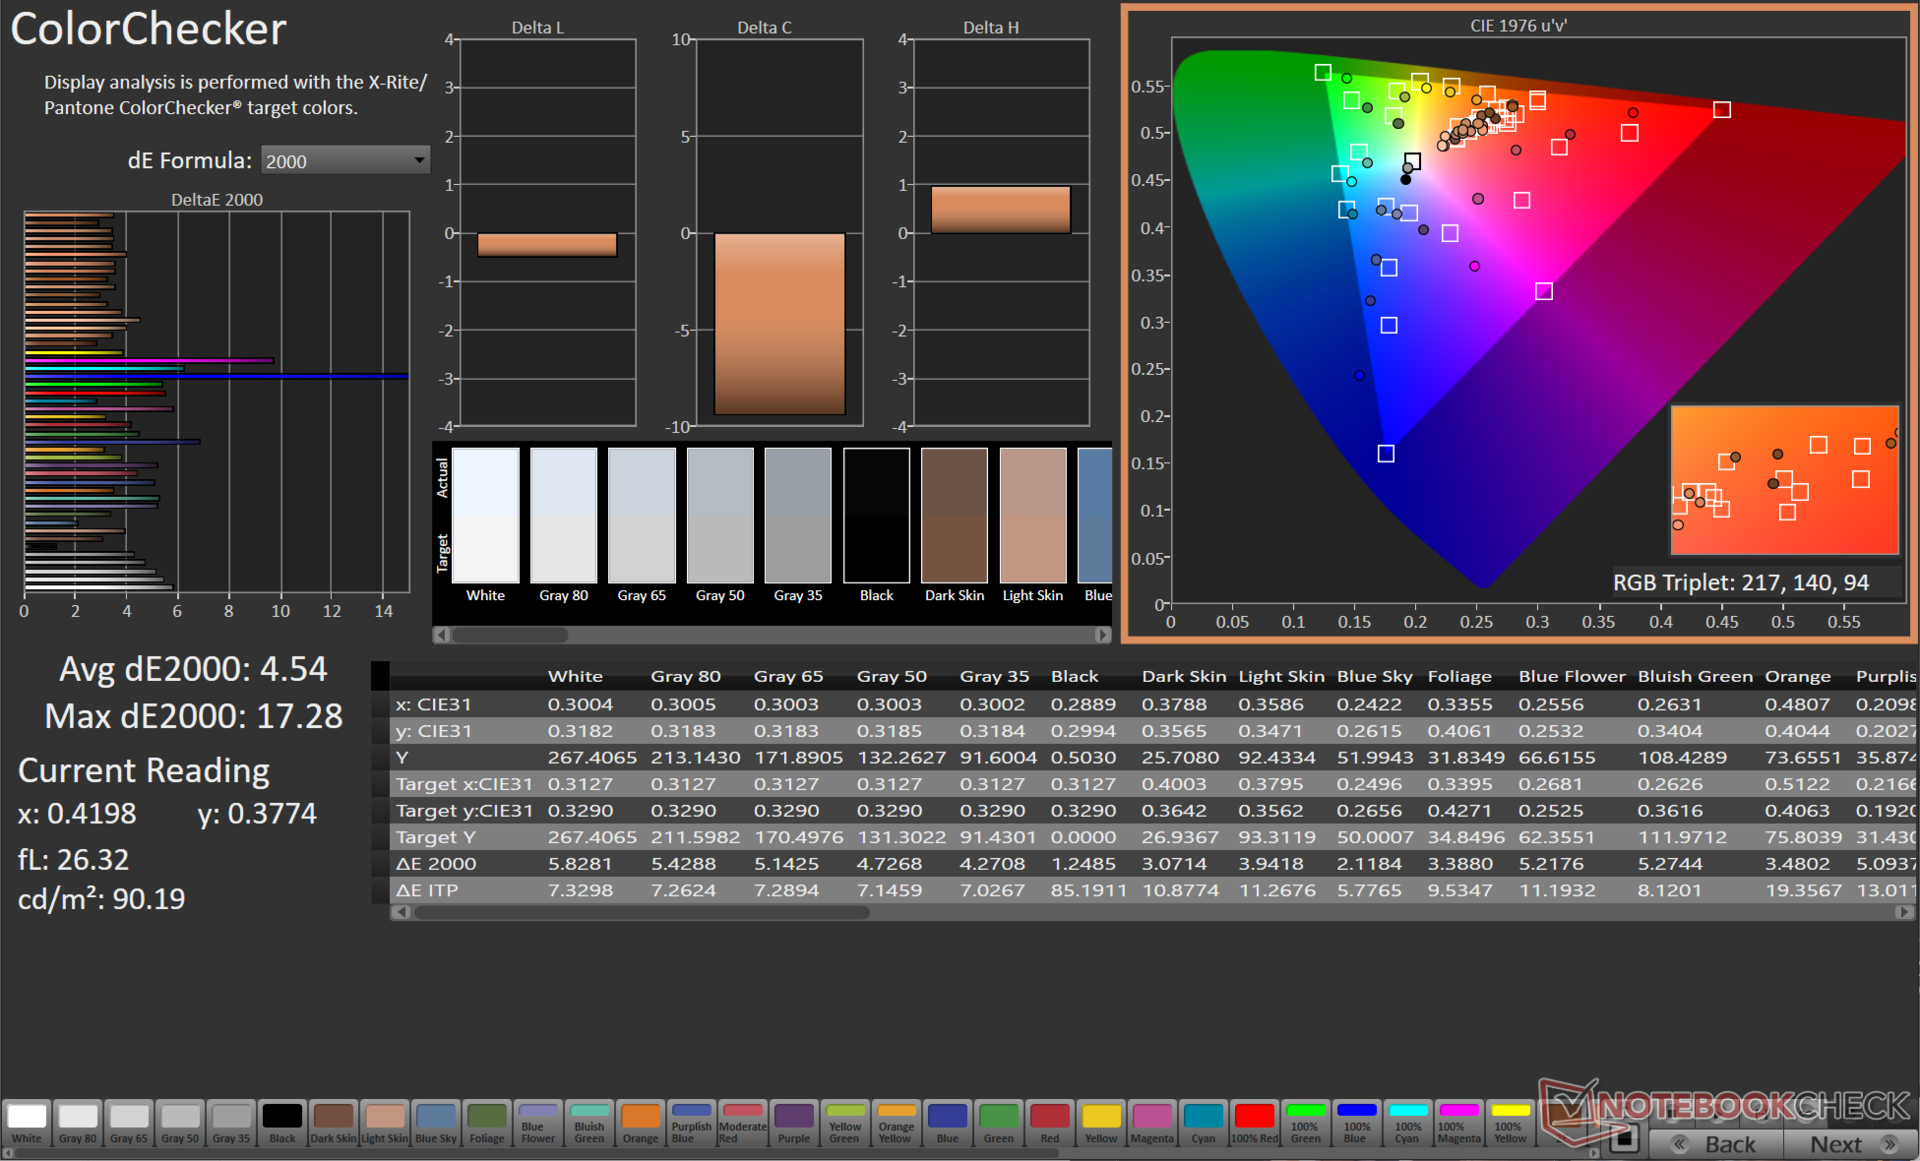
ΔE ColorChecker Calman: 4.54 | ∀{0.5-29.43 Ø4.73}
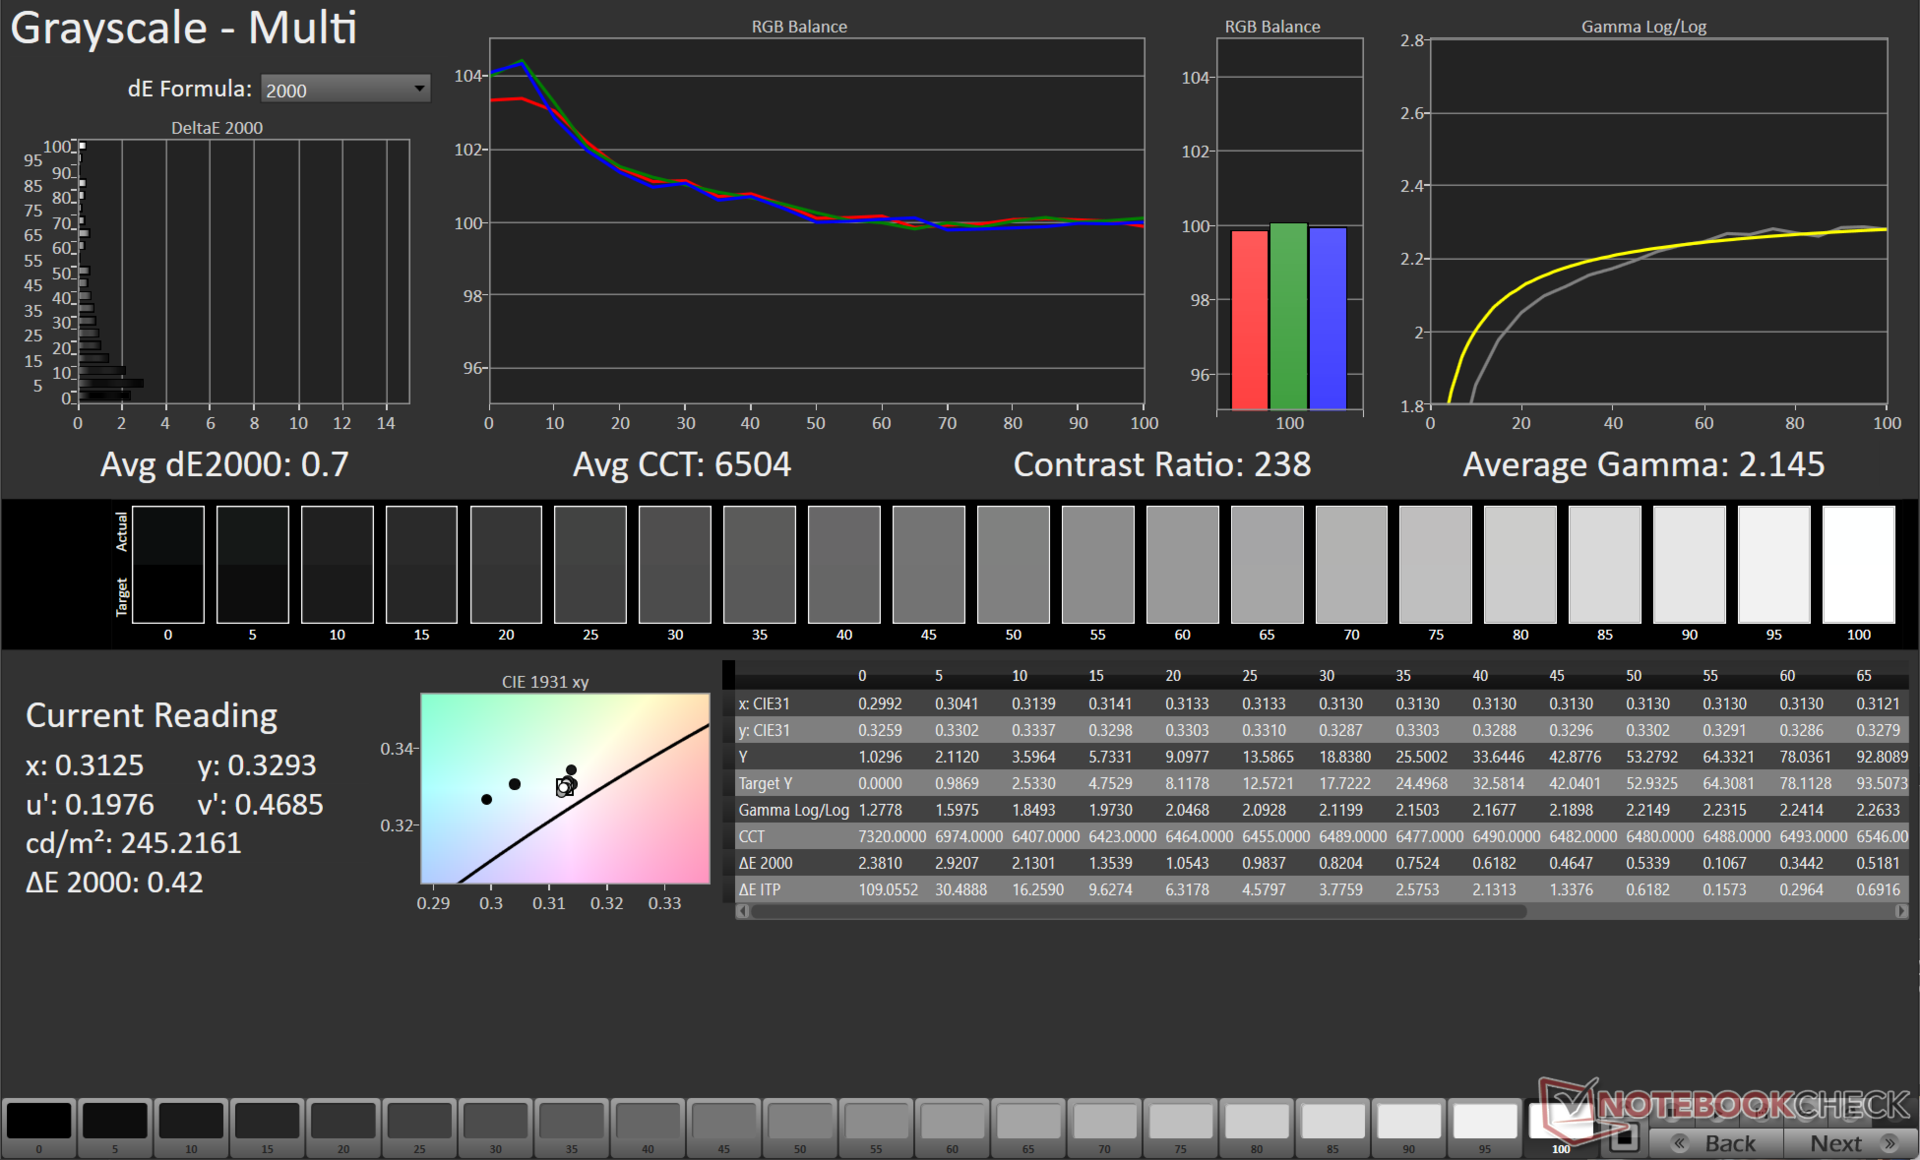
calibrated: 3.34
ΔE Greyscale Calman: 3.8 | ∀{0.09-98 Ø4.97}
42.1% AdobeRGB 1998 (Argyll 3D)
61% sRGB (Argyll 3D)
40.7% Display P3 (Argyll 3D)
Gamma: 2.17
CCT: 7408 K
| Gigabyte G5 KE Chi Mei N156HRA-EA1, , 1920x1080, 15.6" | Lenovo IdeaPad Gaming 3 15IAH7 Lenovo LEN156FHD, , 1920x1080, 15.6" | Gigabyte G7 KE AU Optronics B173HAN05.1, , 1920x1080, 17.3" | Honor MagicBook 14 2022 HD140ZB-01A, , 2160x1440, 14" | Schenker XMG Core 15 (M22) CSOT MNF601CA1-1, , 2560x1440, 15.6" | Dell G16 7620 BOE NE16QDM, , 2560x1600, 16" | Gigabyte A5 K1 BOEhydis NV156FHM-N4K (BOE08B3), , 1920x1080, 15.6" | Asus TUF Gaming F15 FX507ZM TL156VDXP0101, , 1920x1080, 15.6" | HP Victus 16-e0179ng BOE09BE, , 1920x1080, 16.1" | |
|---|---|---|---|---|---|---|---|---|---|
| Display | 66% | 69% | 64% | 66% | 65% | 56% | 62% | 72% | |
| Display P3 Coverage (%) | 40.7 | 69.1 70% | 70.4 73% | 67.9 67% | 68.8 69% | 68.3 68% | 64.4 58% | 66.4 63% | 72.6 78% |
| sRGB Coverage (%) | 61 | 99.2 63% | 99.8 64% | 98.5 61% | 99.3 63% | 98 61% | 92.5 52% | 97 59% | 100 64% |
| AdobeRGB 1998 Coverage (%) | 42.1 | 69.9 66% | 71.7 70% | 68.7 63% | 69.9 66% | 70.5 67% | 66.1 57% | 68.5 63% | 73.5 75% |
| Response Times | 53% | 68% | -41% | 50% | 56% | 48% | 55% | 44% | |
| Response Time Grey 50% / Grey 80% * (ms) | 26.64 ? | 13 ? 51% | 5 ? 81% | 37.2 ? -40% | 16 ? 40% | 8.6 ? 68% | 14.5 ? 46% | 5.6 ? 79% | 9.6 ? 64% |
| Response Time Black / White * (ms) | 18.65 ? | 8.4 ? 55% | 8.3 ? 55% | 26.3 ? -41% | 7.6 ? 59% | 10.4 ? 44% | 9.5 ? 49% | 12.8 ? 31% | 14.4 ? 23% |
| PWM Frequency (Hz) | 28400 ? | ||||||||
| Screen | 40% | 61% | 57% | 40% | 49% | 31% | 52% | 43% | |
| Brightness middle (cd/m²) | 269 | 338 26% | 307 14% | 330 23% | 378 41% | 369.4 37% | 295 10% | 353.7 31% | 361 34% |
| Brightness (cd/m²) | 248 | 329 33% | 301 21% | 320 29% | 371 50% | 348 40% | 281 13% | 340 37% | 341 38% |
| Brightness Distribution (%) | 85 | 92 8% | 93 9% | 90 6% | 93 9% | 83 -2% | 83 -2% | 89 5% | 88 4% |
| Black Level * (cd/m²) | 0.5 | 0.27 46% | 0.2 60% | 0.21 58% | 0.33 34% | 0.32 36% | 0.29 42% | 0.34 32% | 0.3 40% |
| Contrast (:1) | 538 | 1252 133% | 1535 185% | 1571 192% | 1145 113% | 1154 114% | 1017 89% | 1040 93% | 1203 124% |
| Colorchecker dE 2000 * | 4.54 | 2.88 37% | 1.32 71% | 1.8 60% | 2.84 37% | 1.78 61% | 4.36 4% | 1.74 62% | 2.44 46% |
| Colorchecker dE 2000 max. * | 17.28 | 9.35 46% | 4.6 73% | 4.7 73% | 5.51 68% | 4.41 74% | 6.92 60% | 3.63 79% | 6.37 63% |
| Colorchecker dE 2000 calibrated * | 3.34 | 1.22 63% | 1.03 69% | 1.6 52% | 2.75 18% | 1.22 63% | 1.2 64% | 0.5 85% | 1.26 62% |
| Greyscale dE 2000 * | 3.8 | 5 -32% | 2.1 45% | 3 21% | 4.08 -7% | 3.2 16% | 3.9 -3% | 2.1 45% | 4.6 -21% |
| Gamma | 2.17 101% | 2.162 102% | 2.247 98% | 2.18 101% | 2.4 92% | 2.2 100% | 2.106 104% | 2.3 96% | 2.268 97% |
| CCT | 7408 88% | 7497 87% | 6815 95% | 6697 97% | 5841 111% | 6750 96% | 7300 89% | 6257 104% | 6609 98% |
| Moyenne finale (programmes/paramètres) | 53% /
48% | 66% /
64% | 27% /
45% | 52% /
47% | 57% /
53% | 45% /
39% | 56% /
55% | 53% /
50% |
* ... Moindre est la valeur, meilleures sont les performances
Notre routine d'étalonnage utilisant le spectrophotomètre X-Rite i1Basic Pro 3 et le logiciel d'étalonnage des couleurs Calman Ultimate de Portrait Displays a permis d'obtenir une valeur Delta E 2000 en niveaux de gris nettement améliorée.
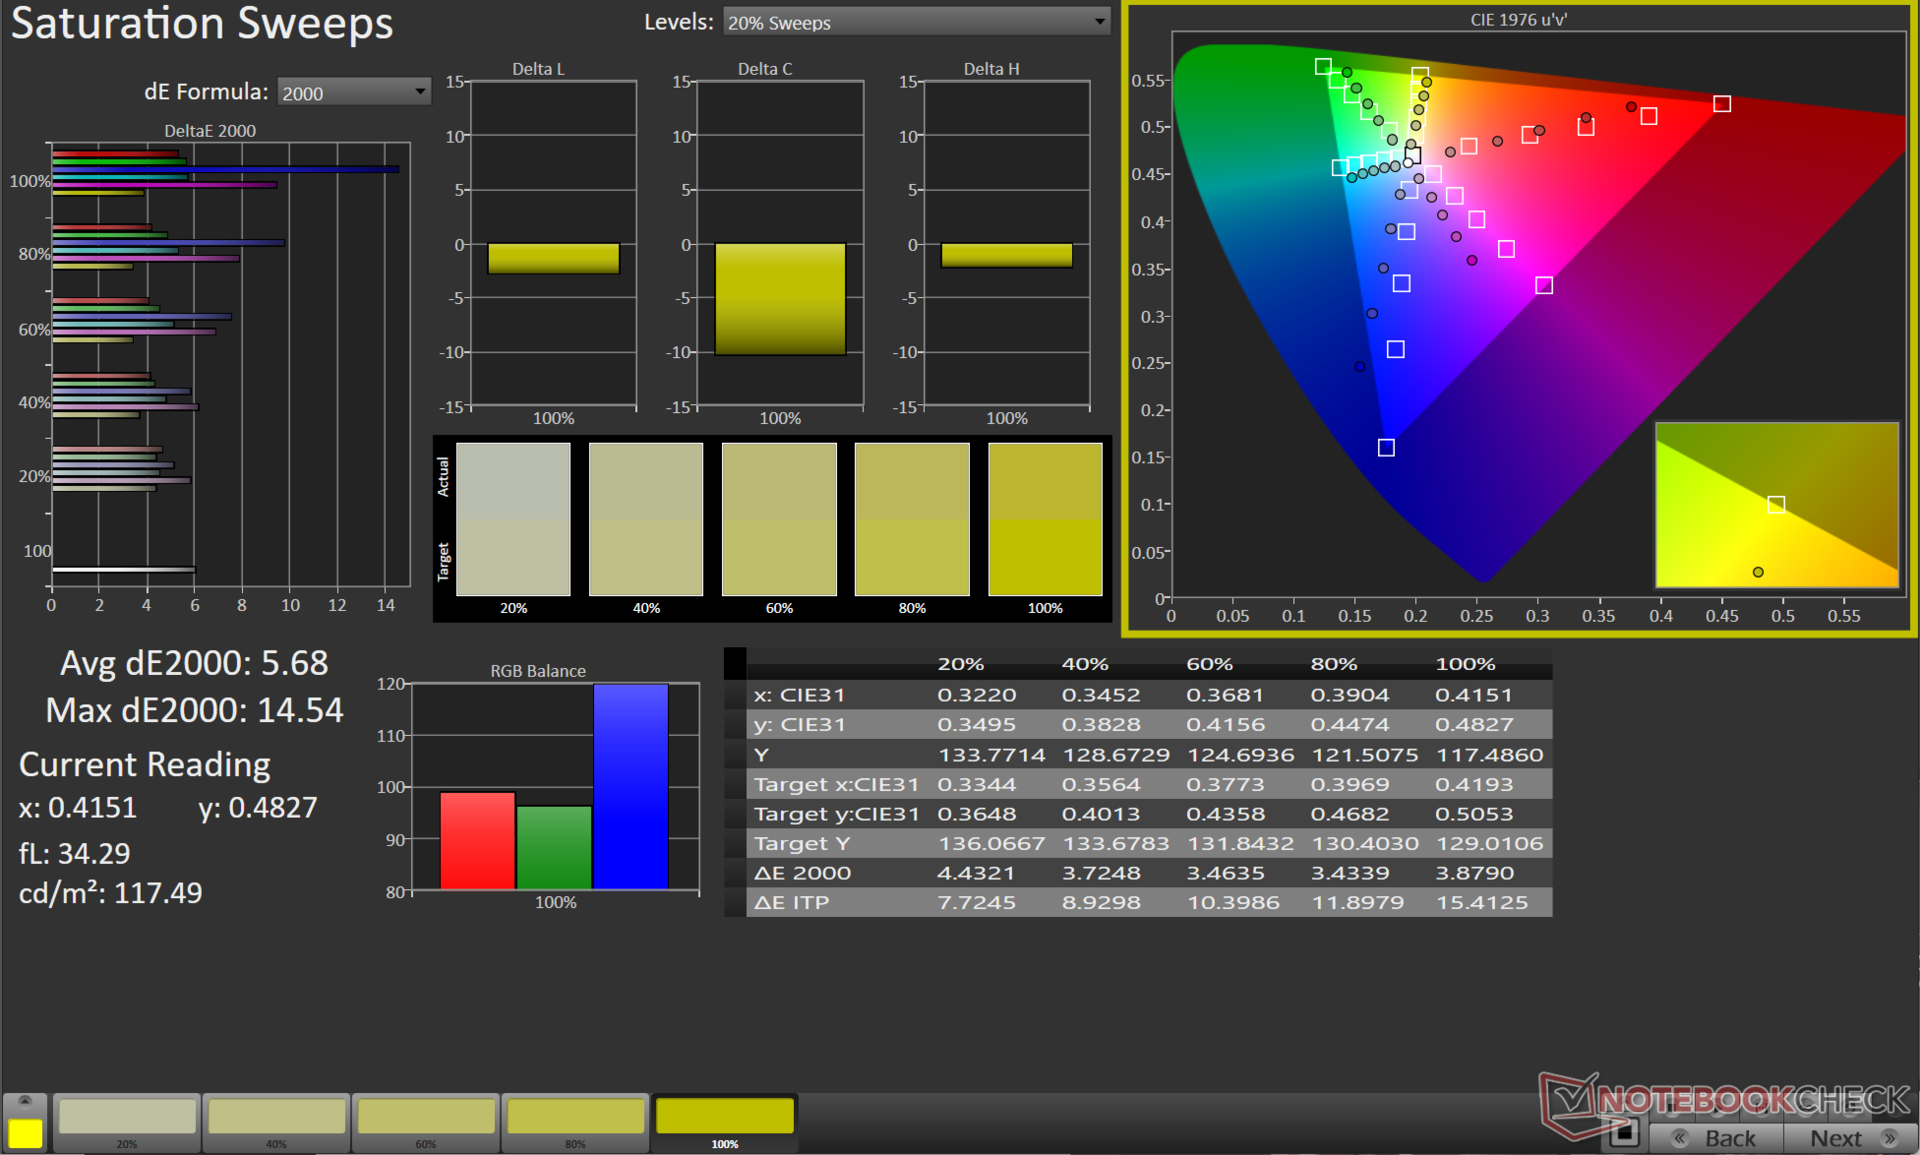
Cependant, il n'y a pas beaucoup de possibilités d'amélioration des valeurs ColorChecker. Les couleurs 100 % bleu et 100 % magenta contribuent à des écarts importants dans la précision des couleurs.
Le profil ICC calibré peut être téléchargé à partir du lien ci-dessus.
Temps de réponse de l'écran
| ↔ Temps de réponse noir à blanc | ||
|---|---|---|
| 18.65 ms ... hausse ↗ et chute ↘ combinées | ↗ 10.83 ms hausse | 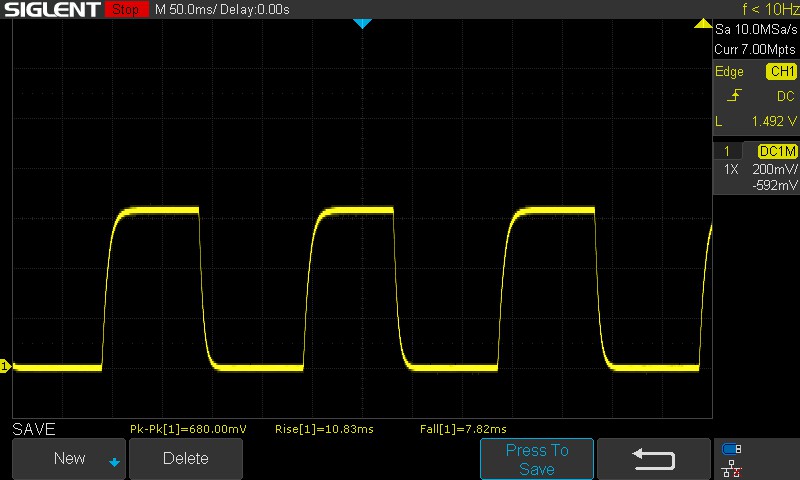 |
| ↘ 7.82 ms chute | ||
| L'écran montre de bons temps de réponse, mais insuffisant pour du jeu compétitif. En comparaison, tous les appareils testés affichent entre 0.1 (minimum) et 240 (maximum) ms. » 41 % des appareils testés affichent de meilleures performances. Cela signifie que les latences relevées sont similaires à la moyenne (19.9 ms) de tous les appareils testés. | ||
| ↔ Temps de réponse gris 50% à gris 80% | ||
| 26.64 ms ... hausse ↗ et chute ↘ combinées | ↗ 12.52 ms hausse | 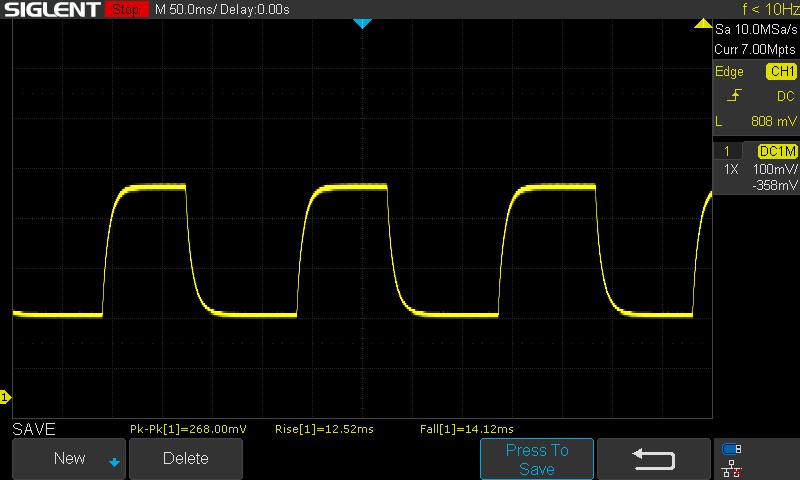 |
| ↘ 14.12 ms chute | ||
| L'écran souffre de latences relativement élevées, insuffisant pour le jeu. En comparaison, tous les appareils testés affichent entre 0.165 (minimum) et 636 (maximum) ms. » 36 % des appareils testés affichent de meilleures performances. Cela signifie que les latences relevées sont meilleures que la moyenne (31.1 ms) de tous les appareils testés. | ||
Scintillement / MLI (Modulation de largeur d'impulsion)
| Scintillement / MLI (Modulation de largeur d'impulsion) non décelé | 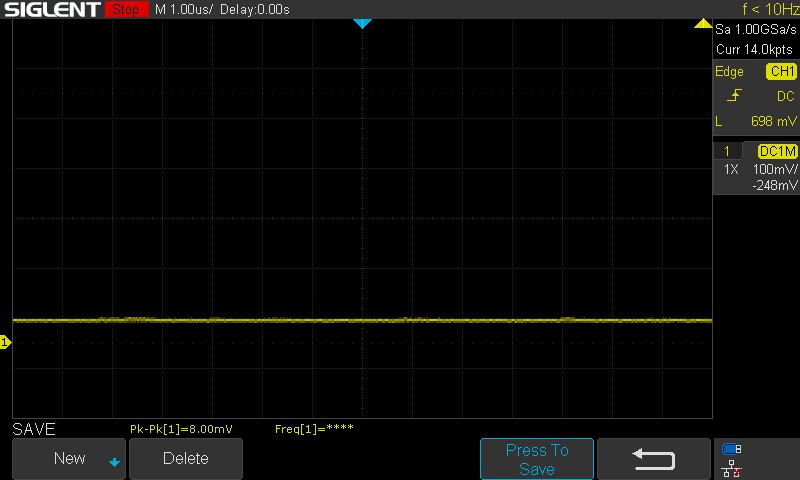 | ||
| ≤ 100 Niveau de luminosité en cd/m² | |||
En comparaison, 52 % des appareils testés n'emploient pas MDI pour assombrir leur écran. Nous avons relevé une moyenne à 7794 (minimum : 5 - maximum : 343500) Hz dans le cas où une MDI était active. | |||
Les temps de réponse de l'écran, en particulier les transitions de 50 % de gris à 80 % de gris, sont un peu élevés pour un ordinateur portable de jeu. Nous n'avons pas observé de PWM à tous les niveaux de luminosité testés.
Reportez-vous à notre article sur le PWM ainsi que notre tableau de classement pour plus d'informations et de comparaisons entre les appareils testés.
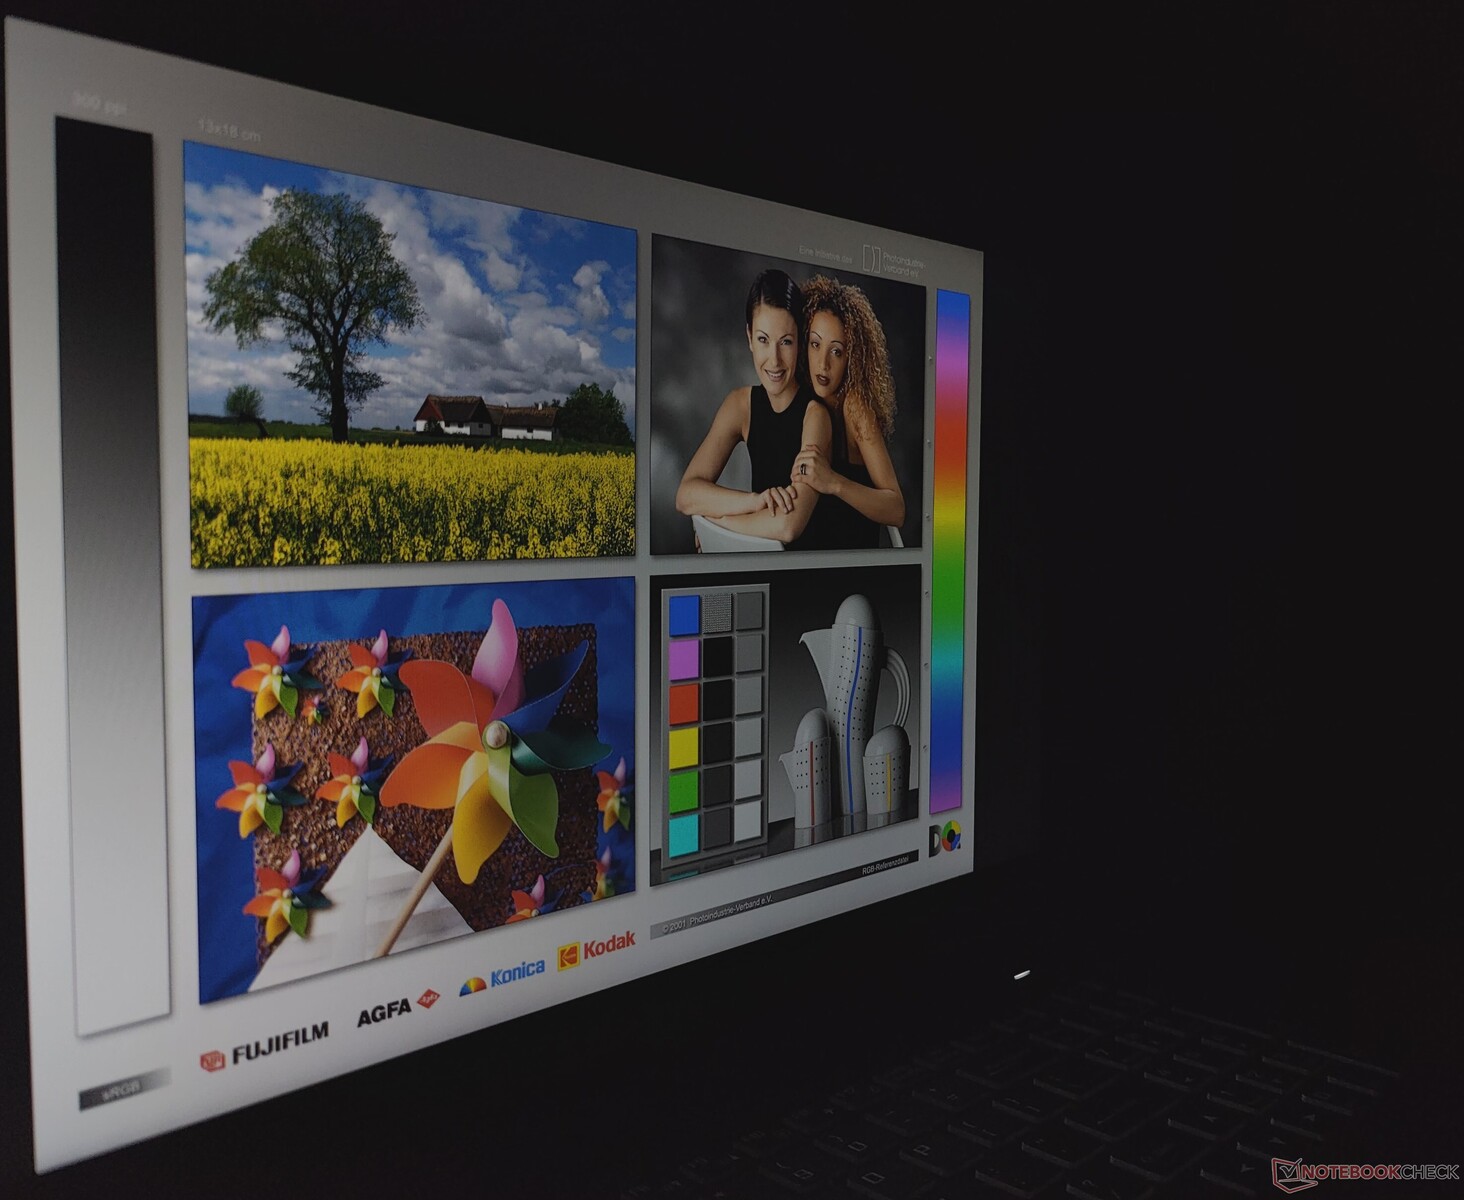
L'affichage à l'extérieur est lisible tant que la lumière directe du soleil ne tombe pas sur l'écran. Il y a une perte de luminosité et d'informations sur les couleurs dans les angles de vue extrêmes.


Performances : La combinaison Core i5-12500H et RTX 3060 ne réserve pas de grandes surprises
Gigabyte propose le G5 en deux variantes : le G5 KE et le G5 ME avec le 12C/16TIntel Core i5-12500H 12C/16T. Le G5 KE offre un processeur 12C/16T Intel Core i5-12500H GPU Nvidia GeForce RTX 3060 pour ordinateur portablele G5 ME se contente d'un GPU pour ordinateur portable RTX 3050 Ti pour ordinateur portable et ne dispose pas d'un port Thunderbolt 4.
Le G5 KE offre quatre modes de performance, comme le montre le tableau ci-dessous :
| Mode Performance | PL1 (PBP) / Tau | PL2 (MTP) / Tau |
|---|---|---|
| Mode silencieux | 15 W / 8 s | 30 W / 2,44 ms |
| Économiseur d'énergie | 30 W / 8 s | 30 W / 2,44 ms |
| Divertissement | 50 W / 28 s | 115 W / 2,44 ms |
| Performance | 115 W / 80 s | 135 W / 2,44 ms |
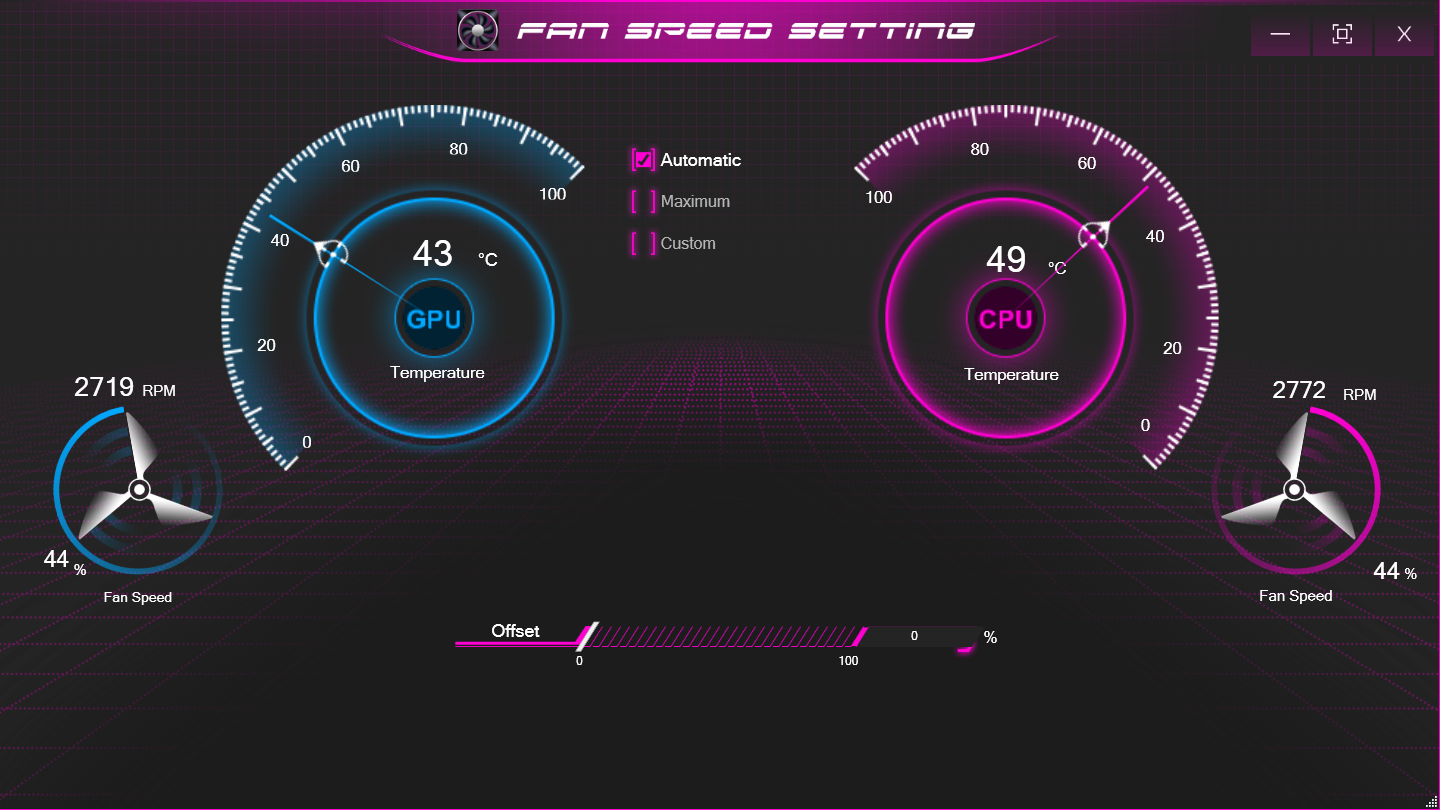
Nous avons utilisé le profil Performance pour tous les benchmarks, tandis que les tests de batterie ont été effectués en mode Economiseur d'énergie. Le Control Center 3.0 de Clevo permet de sélectionner différents profils de performance et de régler la vitesse du ventilateur.
Processeur
Le Core i5-12500H de la G5 KE est très proche de celui de la G7 KE ainsi que de la AMD Ryzen 7 6800H du XMG Core 15 (M22) en ce qui concerne les scores cumulés de l'unité centrale. Toutefois, il accuse un retard de 15 % par rapport au Core i7-12700H du Asus TUF Gaming F15.
Les performances soutenues dans notre test en boucle multi-cœur Cinebench R15 sont bonnes pour la plupart, à l'exception d'une baisse momentanée minime des scores au milieu de l'exécution.
Cinebench R15 Multi Loop
Cinebench R20: CPU (Single Core) | CPU (Multi Core)
Cinebench R15: CPU Single 64Bit | CPU Multi 64Bit
Blender: v2.79 BMW27 CPU
7-Zip 18.03: 7z b 4 -mmt1 | 7z b 4
Geekbench 5.5: Single-Core | Multi-Core
HWBOT x265 Benchmark v2.2: 4k Preset
LibreOffice : 20 Documents To PDF
R Benchmark 2.5: Overall mean
| CPU Performance rating | |
| Moyenne de la classe Gaming | |
| Asus TUF Gaming F15 FX507ZM | |
| Dell G16 7620 | |
| Gigabyte G7 KE | |
| Schenker XMG Core 15 (M22) | |
| Gigabyte G5 KE | |
| Honor MagicBook 14 2022 | |
| Lenovo IdeaPad Gaming 3 15IAH7 | |
| Moyenne Intel Core i5-12500H | |
| HP Victus 16-e0179ng | |
| Gigabyte A5 K1 | |
| Cinebench R20 / CPU (Single Core) | |
| Moyenne de la classe Gaming (442 - 895, n=111, 2 dernières années) | |
| Asus TUF Gaming F15 FX507ZM | |
| Dell G16 7620 | |
| Gigabyte G7 KE | |
| Lenovo IdeaPad Gaming 3 15IAH7 | |
| Honor MagicBook 14 2022 | |
| Moyenne Intel Core i5-12500H (602 - 656, n=9) | |
| Gigabyte G5 KE | |
| Schenker XMG Core 15 (M22) | |
| HP Victus 16-e0179ng | |
| Gigabyte A5 K1 | |
| Cinebench R20 / CPU (Multi Core) | |
| Moyenne de la classe Gaming (4029 - 16108, n=111, 2 dernières années) | |
| Asus TUF Gaming F15 FX507ZM | |
| Dell G16 7620 | |
| Lenovo IdeaPad Gaming 3 15IAH7 | |
| Schenker XMG Core 15 (M22) | |
| Gigabyte G7 KE | |
| Moyenne Intel Core i5-12500H (4687 - 5640, n=9) | |
| Gigabyte G5 KE | |
| Honor MagicBook 14 2022 | |
| HP Victus 16-e0179ng | |
| Gigabyte A5 K1 | |
| Cinebench R15 / CPU Single 64Bit | |
| Moyenne de la classe Gaming (188.8 - 343, n=111, 2 dernières années) | |
| Asus TUF Gaming F15 FX507ZM | |
| Schenker XMG Core 15 (M22) | |
| Gigabyte G7 KE | |
| Lenovo IdeaPad Gaming 3 15IAH7 | |
| Dell G16 7620 | |
| Gigabyte G5 KE | |
| Honor MagicBook 14 2022 | |
| Moyenne Intel Core i5-12500H (220 - 250, n=9) | |
| HP Victus 16-e0179ng | |
| Gigabyte A5 K1 | |
| Cinebench R15 / CPU Multi 64Bit | |
| Moyenne de la classe Gaming (1578 - 6271, n=111, 2 dernières années) | |
| Asus TUF Gaming F15 FX507ZM | |
| Dell G16 7620 | |
| Schenker XMG Core 15 (M22) | |
| Lenovo IdeaPad Gaming 3 15IAH7 | |
| Gigabyte G7 KE | |
| Moyenne Intel Core i5-12500H (1970 - 2283, n=10) | |
| Gigabyte G5 KE | |
| Honor MagicBook 14 2022 | |
| Honor MagicBook 14 2022 | |
| HP Victus 16-e0179ng | |
| Gigabyte A5 K1 | |
| Blender / v2.79 BMW27 CPU | |
| Gigabyte A5 K1 | |
| Honor MagicBook 14 2022 | |
| HP Victus 16-e0179ng | |
| Moyenne Intel Core i5-12500H (223 - 288, n=9) | |
| Gigabyte G5 KE | |
| Gigabyte G7 KE | |
| Lenovo IdeaPad Gaming 3 15IAH7 | |
| Schenker XMG Core 15 (M22) | |
| Dell G16 7620 | |
| Asus TUF Gaming F15 FX507ZM | |
| Moyenne de la classe Gaming (80 - 330, n=109, 2 dernières années) | |
| 7-Zip 18.03 / 7z b 4 -mmt1 | |
| Moyenne de la classe Gaming (4199 - 7436, n=110, 2 dernières années) | |
| Schenker XMG Core 15 (M22) | |
| HP Victus 16-e0179ng | |
| Gigabyte G7 KE | |
| Lenovo IdeaPad Gaming 3 15IAH7 | |
| Gigabyte A5 K1 | |
| Gigabyte G5 KE | |
| Asus TUF Gaming F15 FX507ZM | |
| Dell G16 7620 | |
| Moyenne Intel Core i5-12500H (5151 - 5563, n=9) | |
| Honor MagicBook 14 2022 | |
| 7-Zip 18.03 / 7z b 4 | |
| Moyenne de la classe Gaming (33491 - 148086, n=110, 2 dernières années) | |
| Asus TUF Gaming F15 FX507ZM | |
| Dell G16 7620 | |
| Schenker XMG Core 15 (M22) | |
| HP Victus 16-e0179ng | |
| Gigabyte G5 KE | |
| Gigabyte G7 KE | |
| Honor MagicBook 14 2022 | |
| Moyenne Intel Core i5-12500H (44105 - 54380, n=9) | |
| Gigabyte A5 K1 | |
| Lenovo IdeaPad Gaming 3 15IAH7 | |
| Geekbench 5.5 / Single-Core | |
| Moyenne de la classe Gaming (986 - 2474, n=110, 2 dernières années) | |
| Asus TUF Gaming F15 FX507ZM | |
| Honor MagicBook 14 2022 | |
| Gigabyte G7 KE | |
| Dell G16 7620 | |
| Gigabyte G5 KE | |
| Lenovo IdeaPad Gaming 3 15IAH7 | |
| Moyenne Intel Core i5-12500H (1471 - 1693, n=9) | |
| Schenker XMG Core 15 (M22) | |
| HP Victus 16-e0179ng | |
| Gigabyte A5 K1 | |
| Geekbench 5.5 / Multi-Core | |
| Moyenne de la classe Gaming (6460 - 27010, n=110, 2 dernières années) | |
| Asus TUF Gaming F15 FX507ZM | |
| Dell G16 7620 | |
| Honor MagicBook 14 2022 | |
| Gigabyte G7 KE | |
| Gigabyte G5 KE | |
| Schenker XMG Core 15 (M22) | |
| Moyenne Intel Core i5-12500H (7962 - 10828, n=9) | |
| Lenovo IdeaPad Gaming 3 15IAH7 | |
| HP Victus 16-e0179ng | |
| Gigabyte A5 K1 | |
| HWBOT x265 Benchmark v2.2 / 4k Preset | |
| Moyenne de la classe Gaming (11.5 - 44.3, n=110, 2 dernières années) | |
| Asus TUF Gaming F15 FX507ZM | |
| Dell G16 7620 | |
| Schenker XMG Core 15 (M22) | |
| Gigabyte G7 KE | |
| Gigabyte G5 KE | |
| Lenovo IdeaPad Gaming 3 15IAH7 | |
| HP Victus 16-e0179ng | |
| Moyenne Intel Core i5-12500H (12 - 16.6, n=9) | |
| Honor MagicBook 14 2022 | |
| Gigabyte A5 K1 | |
| LibreOffice / 20 Documents To PDF | |
| Gigabyte A5 K1 | |
| Schenker XMG Core 15 (M22) | |
| Gigabyte G5 KE | |
| HP Victus 16-e0179ng | |
| Dell G16 7620 | |
| Asus TUF Gaming F15 FX507ZM | |
| Moyenne de la classe Gaming (19 - 88.8, n=110, 2 dernières années) | |
| Lenovo IdeaPad Gaming 3 15IAH7 | |
| Moyenne Intel Core i5-12500H (40.1 - 58.5, n=9) | |
| Gigabyte G7 KE | |
| Honor MagicBook 14 2022 | |
| R Benchmark 2.5 / Overall mean | |
| Gigabyte A5 K1 | |
| HP Victus 16-e0179ng | |
| Lenovo IdeaPad Gaming 3 15IAH7 | |
| Moyenne Intel Core i5-12500H (0.4748 - 0.535, n=9) | |
| Dell G16 7620 | |
| Honor MagicBook 14 2022 | |
| Gigabyte G5 KE | |
| Schenker XMG Core 15 (M22) | |
| Gigabyte G7 KE | |
| Asus TUF Gaming F15 FX507ZM | |
| Moyenne de la classe Gaming (0.3439 - 0.759, n=111, 2 dernières années) | |
* ... Moindre est la valeur, meilleures sont les performances
Notre système dédié Intel Core i5-12500Hfournit plus d'informations et des comparaisons de performances.
Performance du système
Les performances globales du G5 KE dans PCMark 10 sont comparables à celles des ordinateurs portables basés sur le Core i7-12700H, ainsi qu'à celles du Schenker XMG Core 15 (M22) équipé d'un Ryzen 7 6800H, avec une avance perceptible dans CrossMark.
CrossMark: Overall | Productivity | Creativity | Responsiveness
| PCMark 10 / Score | |
| Moyenne de la classe Gaming (5828 - 11574, n=95, 2 dernières années) | |
| Asus TUF Gaming F15 FX507ZM | |
| Schenker XMG Core 15 (M22) | |
| Dell G16 7620 | |
| Gigabyte G5 KE | |
| Lenovo IdeaPad Gaming 3 15IAH7 | |
| Moyenne Intel Core i5-12500H, NVIDIA GeForce RTX 3060 Laptop GPU (6126 - 7201, n=2) | |
| HP Victus 16-e0179ng | |
| Honor MagicBook 14 2022 | |
| Gigabyte A5 K1 | |
| Gigabyte G7 KE | |
| PCMark 10 / Essentials | |
| Gigabyte G5 KE | |
| Schenker XMG Core 15 (M22) | |
| Moyenne Intel Core i5-12500H, NVIDIA GeForce RTX 3060 Laptop GPU (10301 - 11150, n=2) | |
| Moyenne de la classe Gaming (8810 - 12600, n=99, 2 dernières années) | |
| Honor MagicBook 14 2022 | |
| Asus TUF Gaming F15 FX507ZM | |
| Gigabyte G7 KE | |
| Dell G16 7620 | |
| Gigabyte A5 K1 | |
| Lenovo IdeaPad Gaming 3 15IAH7 | |
| HP Victus 16-e0179ng | |
| PCMark 10 / Productivity | |
| Moyenne de la classe Gaming (6845 - 18766, n=97, 2 dernières années) | |
| Schenker XMG Core 15 (M22) | |
| Lenovo IdeaPad Gaming 3 15IAH7 | |
| Gigabyte G5 KE | |
| Moyenne Intel Core i5-12500H, NVIDIA GeForce RTX 3060 Laptop GPU (9038 - 9475, n=2) | |
| Asus TUF Gaming F15 FX507ZM | |
| Gigabyte G7 KE | |
| HP Victus 16-e0179ng | |
| Dell G16 7620 | |
| Honor MagicBook 14 2022 | |
| Gigabyte A5 K1 | |
| PCMark 10 / Digital Content Creation | |
| Moyenne de la classe Gaming (7602 - 19657, n=97, 2 dernières années) | |
| Asus TUF Gaming F15 FX507ZM | |
| Dell G16 7620 | |
| Schenker XMG Core 15 (M22) | |
| Gigabyte G5 KE | |
| Lenovo IdeaPad Gaming 3 15IAH7 | |
| HP Victus 16-e0179ng | |
| Moyenne Intel Core i5-12500H, NVIDIA GeForce RTX 3060 Laptop GPU (6703 - 9593, n=2) | |
| Honor MagicBook 14 2022 | |
| Gigabyte A5 K1 | |
| Gigabyte G7 KE | |
| CrossMark / Overall | |
| Moyenne de la classe Gaming (1366 - 2409, n=97, 2 dernières années) | |
| Gigabyte G7 KE | |
| Honor MagicBook 14 2022 | |
| Moyenne Intel Core i5-12500H, NVIDIA GeForce RTX 3060 Laptop GPU (1752 - 1824, n=2) | |
| Dell G16 7620 | |
| Gigabyte G5 KE | |
| Schenker XMG Core 15 (M22) | |
| CrossMark / Productivity | |
| Moyenne de la classe Gaming (1386 - 2254, n=97, 2 dernières années) | |
| Gigabyte G7 KE | |
| Moyenne Intel Core i5-12500H, NVIDIA GeForce RTX 3060 Laptop GPU (1720 - 1804, n=2) | |
| Honor MagicBook 14 2022 | |
| Gigabyte G5 KE | |
| Dell G16 7620 | |
| Schenker XMG Core 15 (M22) | |
| CrossMark / Creativity | |
| Honor MagicBook 14 2022 | |
| Moyenne de la classe Gaming (1343 - 2729, n=97, 2 dernières années) | |
| Dell G16 7620 | |
| Gigabyte G7 KE | |
| Moyenne Intel Core i5-12500H, NVIDIA GeForce RTX 3060 Laptop GPU (1778 - 1800, n=2) | |
| Gigabyte G5 KE | |
| Schenker XMG Core 15 (M22) | |
| CrossMark / Responsiveness | |
| Gigabyte G7 KE | |
| Moyenne Intel Core i5-12500H, NVIDIA GeForce RTX 3060 Laptop GPU (1771 - 1966, n=2) | |
| Gigabyte G5 KE | |
| Honor MagicBook 14 2022 | |
| Moyenne de la classe Gaming (1226 - 2334, n=97, 2 dernières années) | |
| Dell G16 7620 | |
| Schenker XMG Core 15 (M22) | |
| PCMark 8 Home Score Accelerated v2 | 5554 points | |
| PCMark 8 Work Score Accelerated v2 | 5937 points | |
| PCMark 10 Score | 7201 points | |
Aide | ||
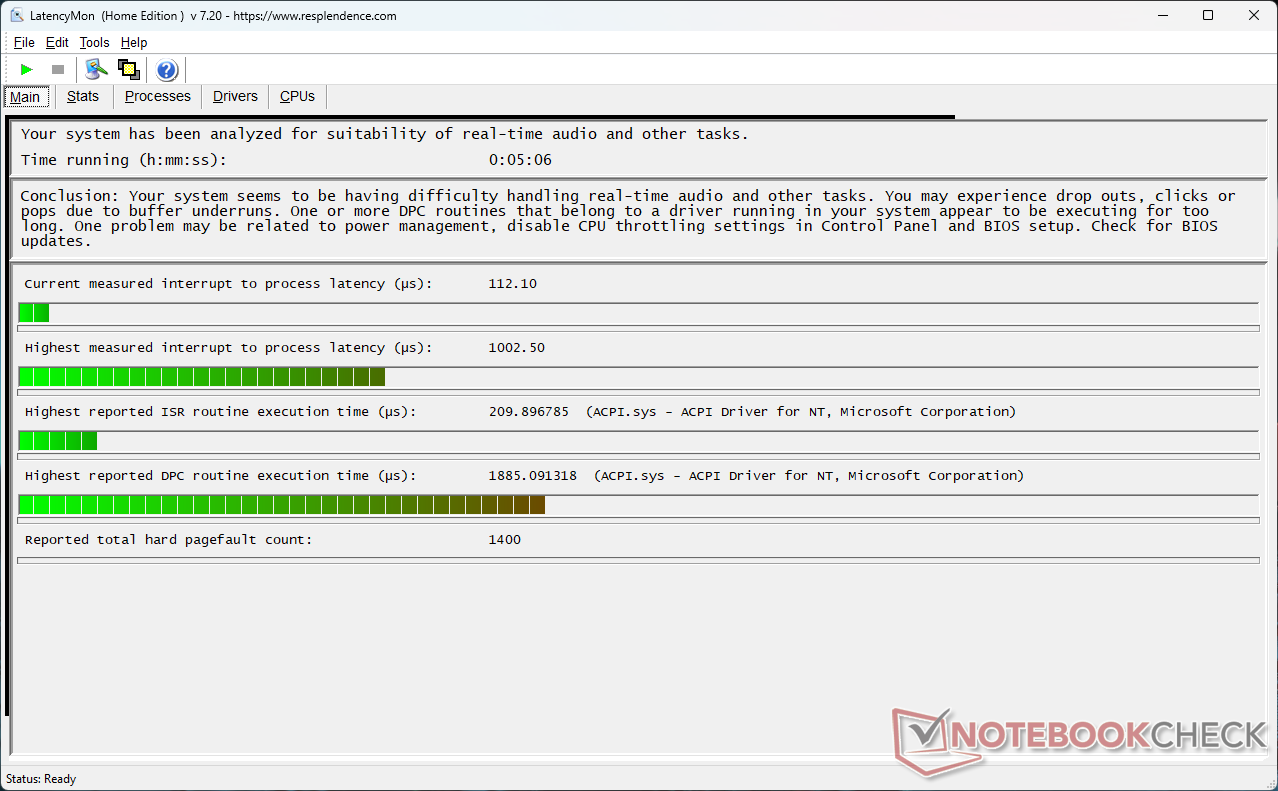
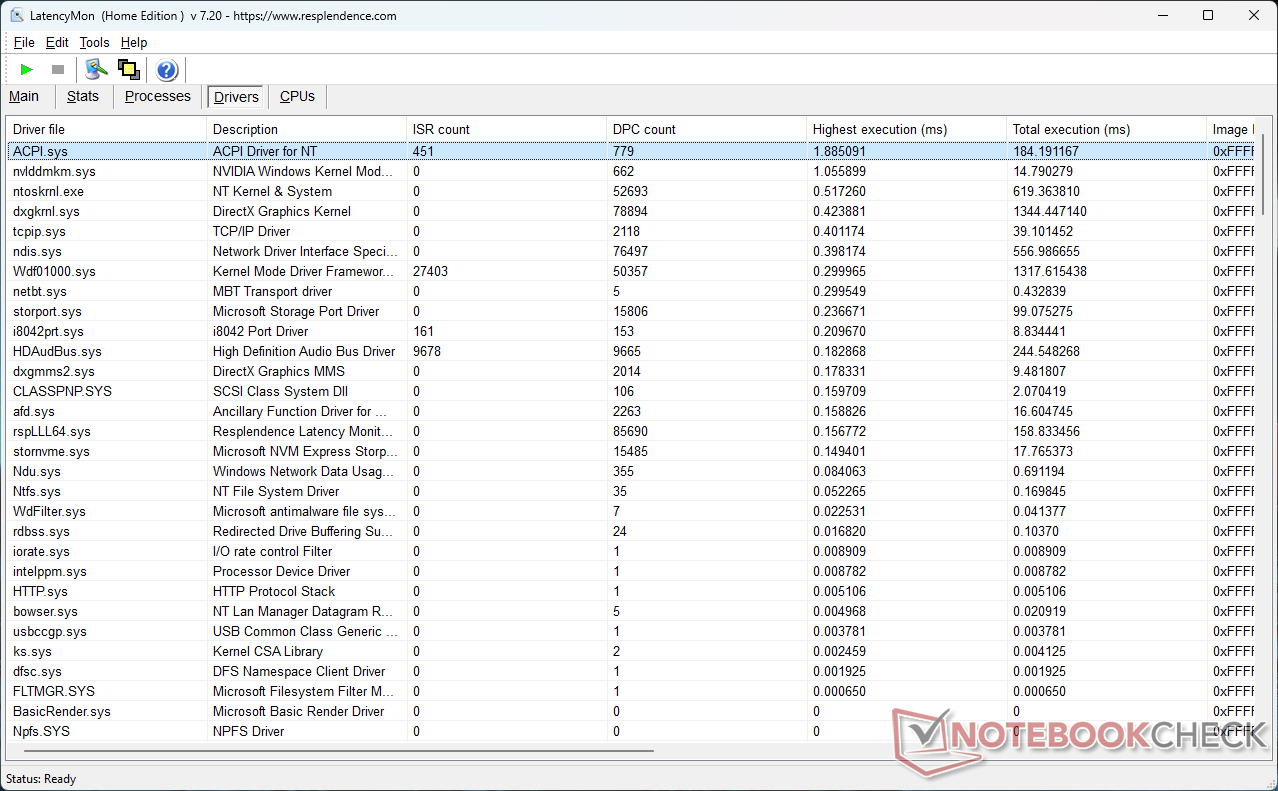
Latence DPC
La latence DPC de la G5 KE est sans doute meilleure que celle de la plupart de ses concurrents, mais les valeurs sont encore plus élevées.
| DPC Latencies / LatencyMon - interrupt to process latency (max), Web, Youtube, Prime95 | |
| Schenker XMG Core 15 (M22) | |
| Gigabyte G7 KE | |
| Lenovo IdeaPad Gaming 3 15IAH7 | |
| HP Victus 16-e0179ng | |
| Gigabyte A5 K1 | |
| Gigabyte G5 KE | |
| Dell G16 7620 | |
| Asus TUF Gaming F15 FX507ZM | |
| Honor MagicBook 14 2022 | |
* ... Moindre est la valeur, meilleures sont les performances
Reportez-vous à notreComparaison des temps de latence DPCpour plus de comparaisons de latence entre les appareils examinés.
Dispositifs de stockage
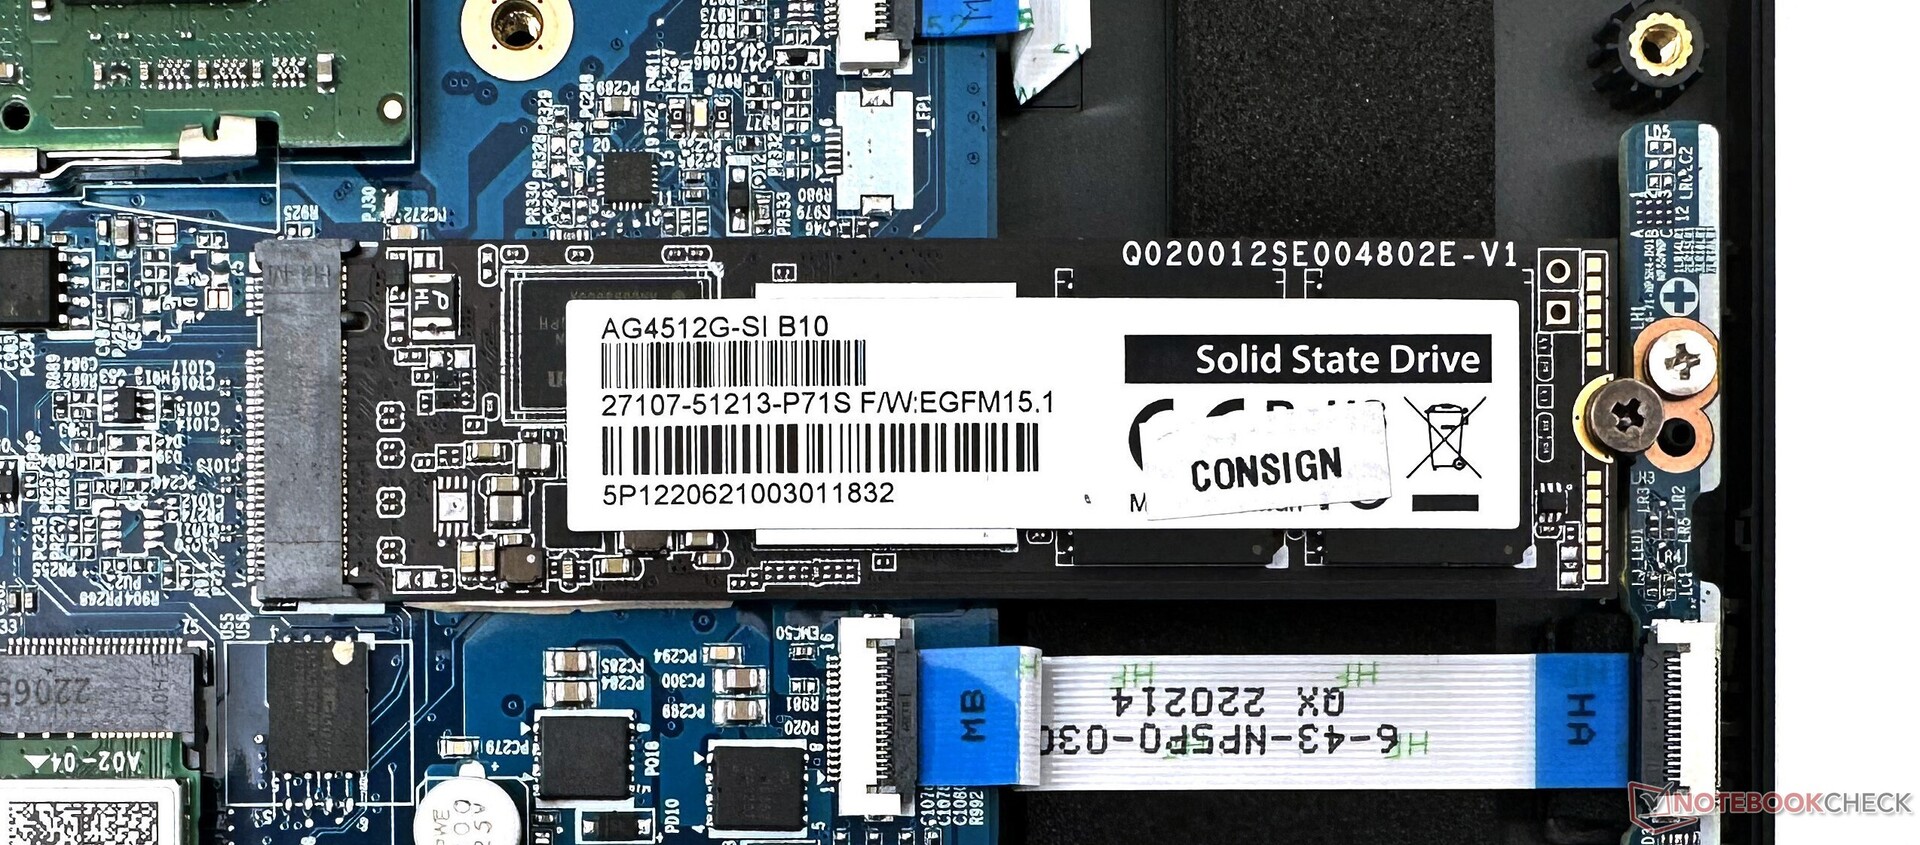
Notre G5 KE était équipé d'un SSD NVMe Gigabyte de 512 Go. Cependant, nous trouvons que la variante de 1 To de ce disque dans le G7 KE est plus performante à presque tous les égards. Le SSD souffre d'un étranglement drastique dans notre test de boucle de lecture DiskSpd.
Il est possible d'installer un second SSD NVMe, mais il n'est pas possible d'ajouter un disque SATA de 2,5 pouces.
| Gigabyte G5 KE Gigabyte AG4512G-SI B10 | Lenovo IdeaPad Gaming 3 15IAH7 Intel SSD 660p SSDPEKNW512G8 | Gigabyte G7 KE Gigabyte AG470S1TB-SI B10 | Honor MagicBook 14 2022 Samsung PM9A1 MZVL2512HCJQ | Asus TUF Gaming F15 FX507ZM SK Hynix HFM001TD3JX013N | HP Victus 16-e0179ng WDC PC SN730 SDBPNTY-1T00 | Moyenne Gigabyte AG4512G-SI B10 | Moyenne de la classe Gaming | |
|---|---|---|---|---|---|---|---|---|
| CrystalDiskMark 5.2 / 6 | -42% | 22% | 43% | -8% | -16% | 0% | 25% | |
| Write 4K (MB/s) | 303.3 | 64 -79% | 363.1 20% | 229.88 -24% | 217.7 -28% | 157.3 -48% | 303 ? 0% | 202 ? -33% |
| Read 4K (MB/s) | 64.25 | 77.05 20% | 59.23 -8% | 91.45 42% | 70.1 9% | 49 -24% | 64.3 ? 0% | 78.1 ? 22% |
| Write Seq (MB/s) | 2258 | 93.07 -96% | 2605 15% | 2844 26% | 2983 32% | 2258 ? 0% | 3703 ? 64% | |
| Read Seq (MB/s) | 2561 | 2570 0% | 2337 -9% | 2492 -3% | 2247 -12% | 2561 ? 0% | 3592 ? 40% | |
| Write 4K Q32T1 (MB/s) | 620.6 | 184.6 -70% | 806.9 30% | 627.94 1% | 408.3 -34% | 395 -36% | 621 ? 0% | 611 ? -2% |
| Read 4K Q32T1 (MB/s) | 866.2 | 461.5 -47% | 1019 18% | 868.92 0% | 524 -40% | 557 -36% | 866 ? 0% | 715 ? -17% |
| Write Seq Q32T1 (MB/s) | 2264.3 | 1659 -27% | 3612 60% | 5118.5 126% | 3011 33% | 3094 37% | 2264 ? 0% | 5192 ? 129% |
| Read Seq Q32T1 (MB/s) | 4717.3 | 2936 -38% | 7067 50% | 6866.5 46% | 3553 -25% | 2871 -39% | 4717 ? 0% | 6958 ? 47% |
| Write 4K Q8T8 (MB/s) | 2239.2 | 2910.25 30% | 2239 ? 0% | 1306 ? -42% | ||||
| Read 4K Q8T8 (MB/s) | 1188.1 | 2687.03 126% | 1188 ? 0% | 1633 ? 37% | ||||
| AS SSD | -48% | 39% | 28% | -23% | -21% | 0% | 18% | |
| Seq Read (MB/s) | 3697.92 | 2432.02 -34% | 4540.75 23% | 5233 42% | 3013 -19% | 2383 -36% | 3698 ? 0% | 5490 ? 48% |
| Seq Write (MB/s) | 2106.21 | 1229.14 -42% | 3805.55 81% | 3857 83% | 2768 31% | 2466 17% | 2106 ? 0% | 3914 ? 86% |
| 4K Read (MB/s) | 82.5 | 75.66 -8% | 99.79 21% | 85.14 3% | 66.9 -19% | 44.14 -46% | 82.5 ? 0% | 70 ? -15% |
| 4K Write (MB/s) | 312.09 | 242.19 -22% | 325.41 4% | 216.33 -31% | 184.8 -41% | 117.5 -62% | 312 ? 0% | 215 ? -31% |
| 4K-64 Read (MB/s) | 1675.54 | 441.63 -74% | 2914.54 74% | 2468.58 47% | 1923 15% | 1734 3% | 1676 ? 0% | 1633 ? -3% |
| 4K-64 Write (MB/s) | 1865.08 | 1218.61 -35% | 2915.33 56% | 3003.26 61% | 2198 18% | 2088 12% | 1865 ? 0% | 2875 ? 54% |
| Access Time Read * (ms) | 0.066 | 0.073 -11% | 0.094 -42% | 0.023 65% | 0.03 55% | 0.049 26% | 0.066 ? -0% | 0.06415 ? 3% |
| Access Time Write * (ms) | 0.013 | 0.033 -154% | 0.012 8% | 0.02 -54% | 0.081 -523% | 0.032 -146% | 0.013 ? -0% | 0.03953 ? -204% |
| Score Read (Points) | 2128 | 760 -64% | 3468 63% | 3077 45% | 2291 8% | 2017 -5% | 2128 ? 0% | 2252 ? 6% |
| Score Write (Points) | 2388 | 1584 -34% | 3621 52% | 3605 51% | 2660 11% | 2452 3% | 2388 ? 0% | 3481 ? 46% |
| Score Total (Points) | 5541 | 2702 -51% | 8837 59% | 8195 48% | 6117 10% | 5503 -1% | 5541 ? 0% | 6815 ? 23% |
| Copy ISO MB/s (MB/s) | 1077.37 | 1949.01 81% | 2093.45 94% | 2143 99% | 1077 ? 0% | 3074 ? 185% | ||
| Copy Program MB/s (MB/s) | 827.5 | 1079.42 30% | 447.36 -46% | 871 5% | 828 ? 0% | 951 ? 15% | ||
| Copy Game MB/s (MB/s) | 1460.58 | 2042.84 40% | 1195.09 -18% | 1840 26% | 1461 ? 0% | 2035 ? 39% | ||
| Moyenne finale (programmes/paramètres) | -45% /
-46% | 31% /
33% | 36% /
34% | -16% /
-18% | -19% /
-19% | 0% /
0% | 22% /
21% |
* ... Moindre est la valeur, meilleures sont les performances

Disk Throttling: DiskSpd Read Loop, Queue Depth 8
Consultez nos tests dédiés aux SSD et aux disques durs Benchmarks SSD et HDD pour d'autres comparaisons de périphériques de stockage.
Performance du GPU
Le GPU 115 W Nvidia GeForce RTX 3060 pour ordinateur portable se comporte comme il se doit dans les tests 3DMark. La G5 KE a une bonne longueur d'avance sur la HP Victus dans les tests synthétiques en raison de la configuration TGP de 95 W de cette dernière.
| 3DMark 11 Performance | 26505 points | |
| 3DMark Ice Storm Standard Score | 188480 points | |
| 3DMark Cloud Gate Standard Score | 53162 points | |
| 3DMark Fire Strike Score | 19966 points | |
| 3DMark Fire Strike Extreme Score | 10252 points | |
| 3DMark Time Spy Score | 8922 points | |
Aide | ||
Performance des jeux
Les performances de jeu du Gigabyte G5 KE sont similaires à celles des autres ordinateurs portables basés sur la RTX 3060 que nous avons testés et parviennent même à dépasser le G7 KE avec la même configuration dans plusieurs jeux.
Nous n'avons remarqué aucune perte d'images perceptible en sollicitant l'ordinateur portable avec The Witcher 3 en 1080p Ultra.
The Witcher 3 FPS Chart
| Cyberpunk 2077 1.6 | |
| 1920x1080 High Preset | |
| Dell G16 7620 | |
| Gigabyte G5 KE | |
| Moyenne NVIDIA GeForce RTX 3060 Laptop GPU (42.2 - 87.7, n=14) | |
| Gigabyte G7 KE | |
| Honor MagicBook 14 2022 | |
| 1920x1080 Ultra Preset | |
| Gigabyte G5 KE | |
| Dell G16 7620 | |
| Moyenne NVIDIA GeForce RTX 3060 Laptop GPU (40 - 78.8, n=16) | |
| Gigabyte G7 KE | |
| Honor MagicBook 14 2022 | |
| F1 2021 | |
| 1920x1080 High Preset AA:T AF:16x | |
| Gigabyte G5 KE | |
| Moyenne NVIDIA GeForce RTX 3060 Laptop GPU (119 - 227, n=9) | |
| Honor MagicBook 14 2022 | |
| 1920x1080 Ultra High Preset + Raytracing AA:T AF:16x | |
| Gigabyte G5 KE | |
| Moyenne NVIDIA GeForce RTX 3060 Laptop GPU (67 - 112.8, n=9) | |
| Honor MagicBook 14 2022 | |
| Bas | Moyen | Élevé | Ultra | |
|---|---|---|---|---|
| GTA V (2015) | 183.4 | 179.9 | 172.8 | 103 |
| The Witcher 3 (2015) | 333 | 255 | 168.7 | 87.6 |
| Dota 2 Reborn (2015) | 168.5 | 153.1 | 144.8 | 137.5 |
| Final Fantasy XV Benchmark (2018) | 179.3 | 118.9 | 90.3 | |
| X-Plane 11.11 (2018) | 118.4 | 105.6 | 86.7 | |
| Far Cry 5 (2018) | 159 | 134 | 129 | 118 |
| Strange Brigade (2018) | 385 | 216 | 175.3 | 153.3 |
| F1 2021 (2021) | 303 | 200 | 177.9 | 105.1 |
| Cyberpunk 2077 1.6 (2022) | 105.4 | 85.3 | 72.5 | 68 |
| F1 22 (2022) | 197 | 189.4 | 153.3 | 55.9 |
Consultez notre site dédié Nvidia GeForce RTX 3060 GPU pour ordinateur portable ainsi que notre liste exhaustive de comparaisons de jeux pour plus d'informations et de comparaisons de performances.
Emissions: High surface temperatures and fan noise under load
Bruit du système
Dans le mode Performance testé, le bruit du système au repos est un peu plus élevé, à environ 31 dB(A). Le bruit du ventilateur atteint 55 dB(A), quelle que soit la charge.
Gigabyte semble avoir plafonné le bruit du ventilateur à moins de 30 dB(A) dans le profil silencieux. Seul le test
Witcher 3 donne lieu à des émissions de bruit de ventilateur élevées dans le profil Power Saving, comme l'illustre le tableau ci-dessous
.| Mode de performance | Ralenti dB(A) | Charge moyenne dB(A) | Charge maximale dB(A) | Le Witcher 3 dB(A) |
|---|---|---|---|---|
| Silencieux | 22.21 | 25.73 | 24.64 | 27.62 |
| Économie d'énergie | 22.65 | 24.75 | 24.62 | 49.05 |
| Divertissement | 22,63 | 54,67 | 55,52 | 53,11 |
| Performance | 31.05 | 55.66 | 55.51 | 55.65 |
Degré de la nuisance sonore
| Au repos |
| 31.05 / 31.05 / 31.05 dB(A) |
| Fortement sollicité |
| 55.66 / 55.51 dB(A) |
 | ||
30 dB silencieux 40 dB(A) audible 50 dB(A) bruyant |
||
min: | ||
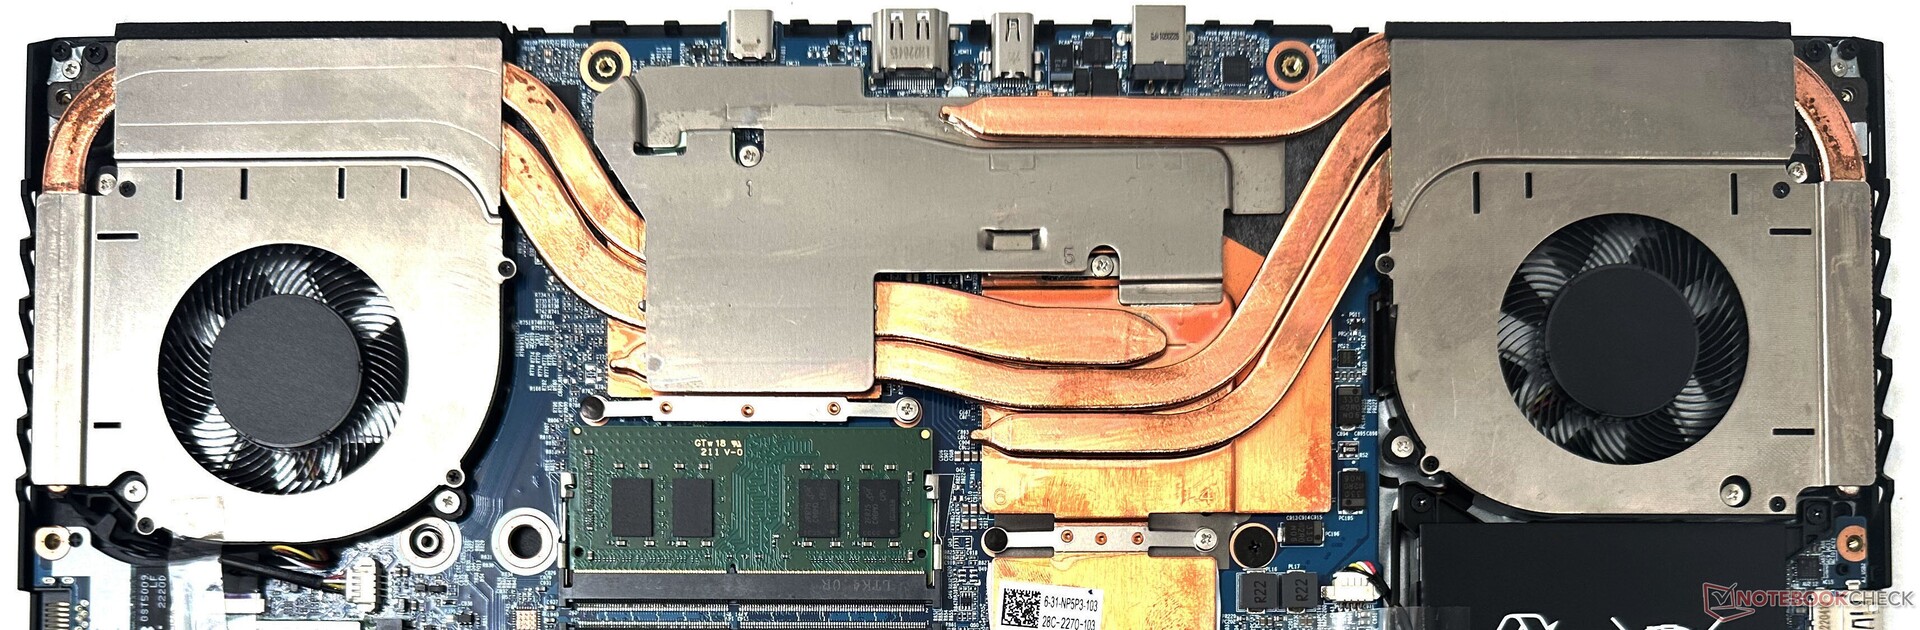
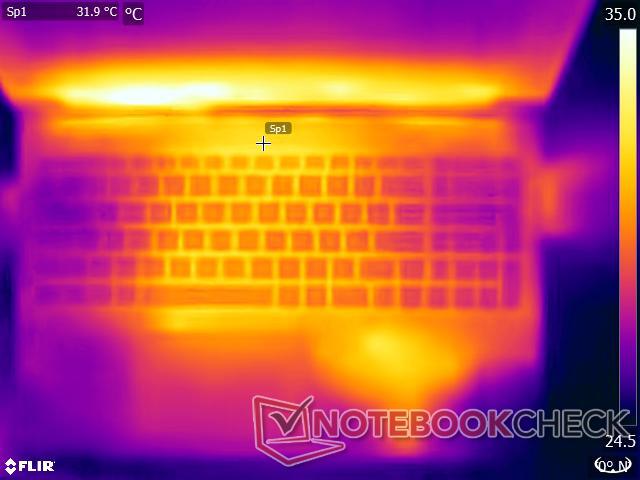
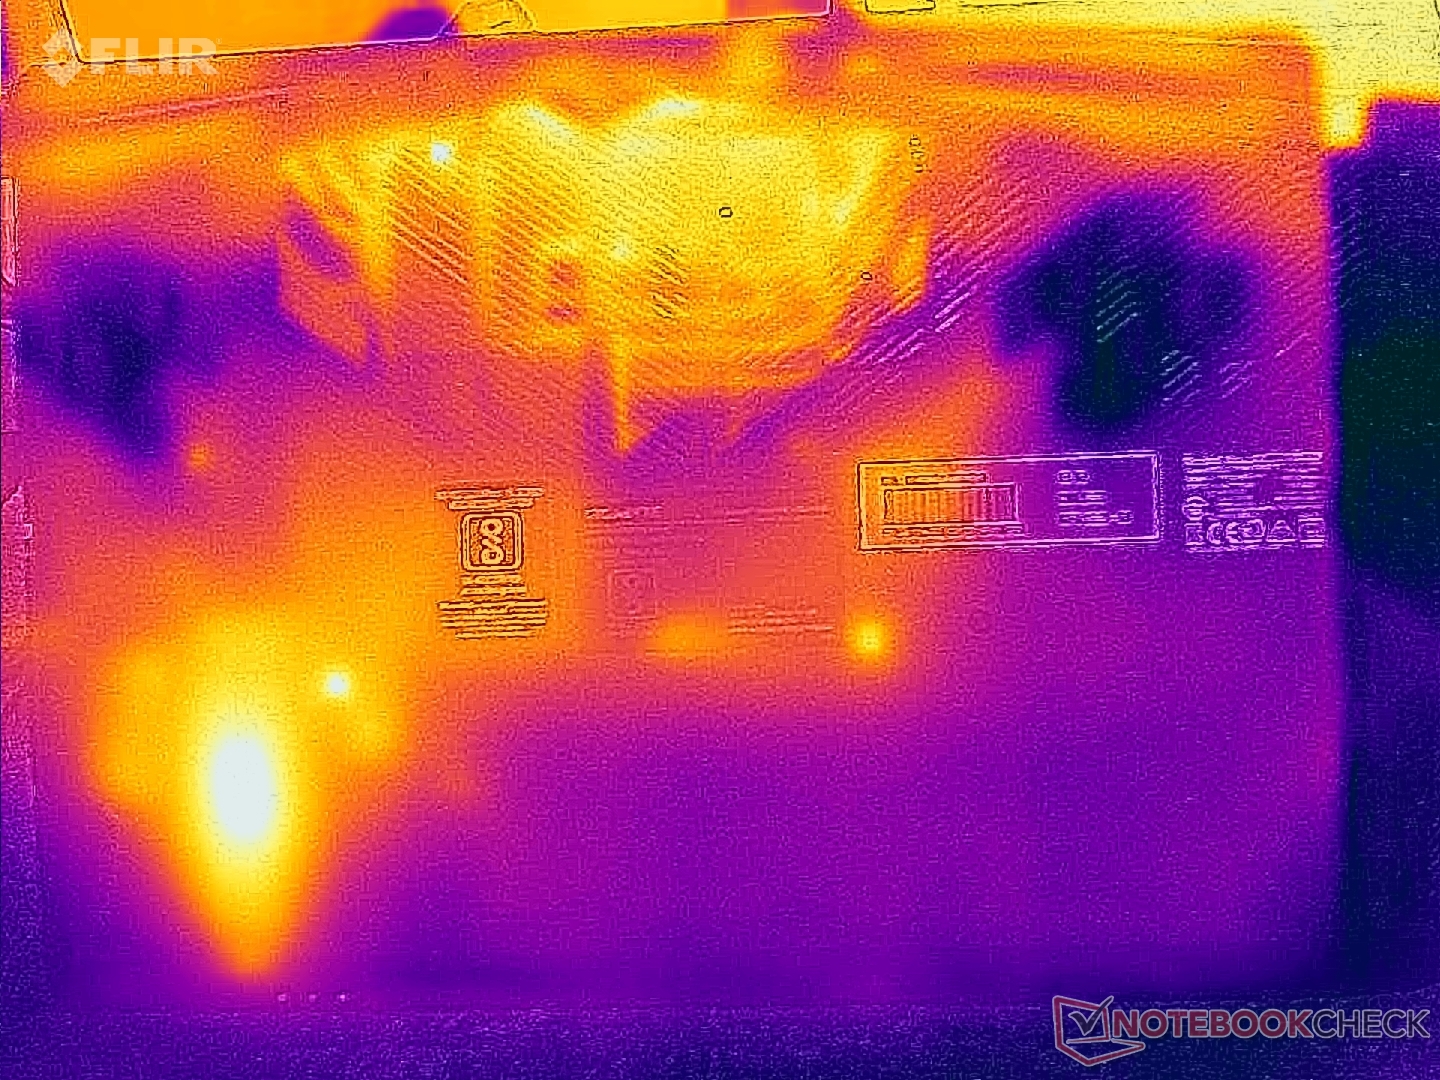
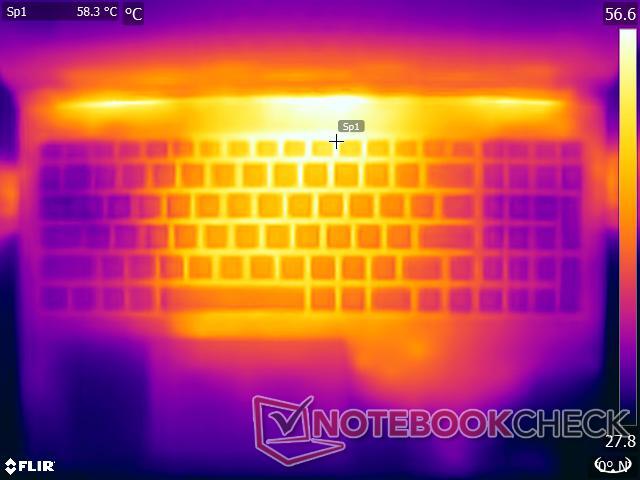
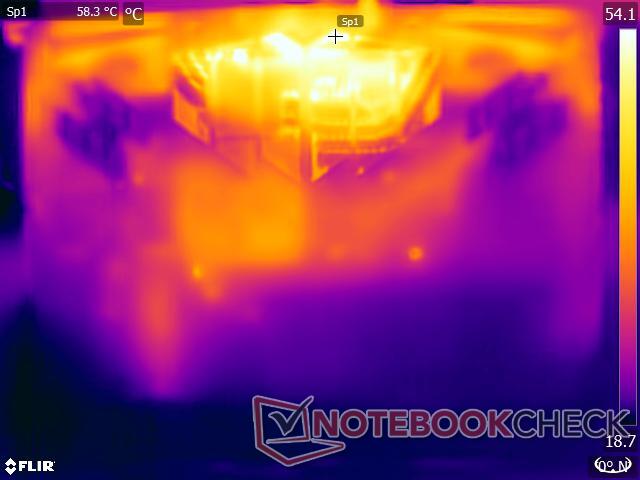
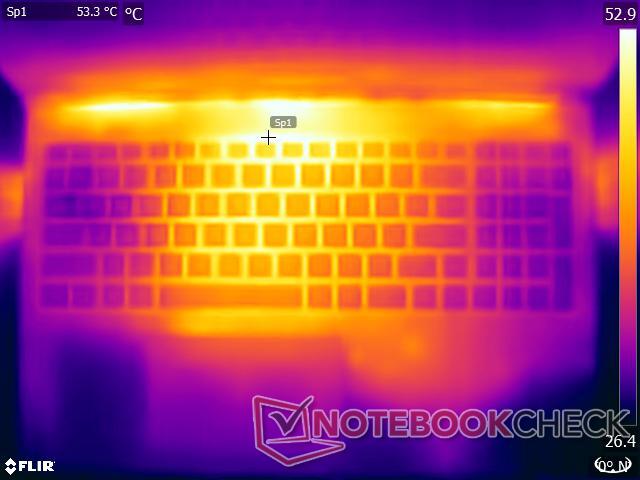
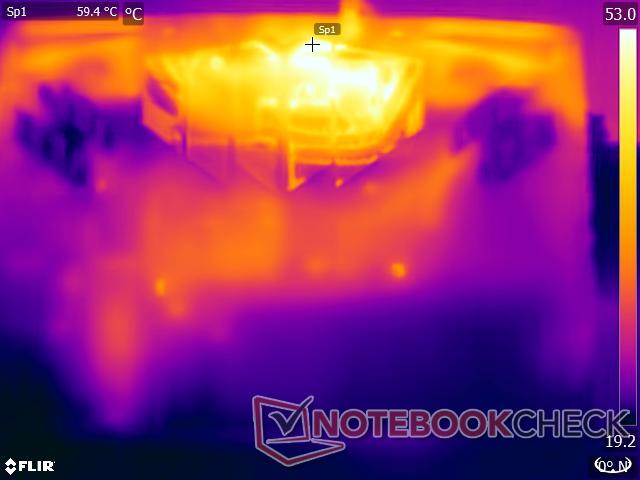
Température
Le système à double ventilateur et quadruple caloduc du Gigabyte G5 KE permet de maintenir les températures du cœur sous contrôle, mais les températures de surface peuvent atteindre 52,6 °C sur la partie supérieure et 62,4 °C sur la partie inférieure en cas de charge importante.
La zone du pavé tactile peut également chauffer.
(-) La température maximale du côté supérieur est de 52.6 °C / 127 F, par rapport à la moyenne de 40.4 °C / 105 F, allant de 21.2 à 68.8 °C pour la classe Gaming.
(-) Le fond chauffe jusqu'à un maximum de 62.4 °C / 144 F, contre une moyenne de 43.2 °C / 110 F
(±) En utilisation inactive, la température moyenne du côté supérieur est de 32 °C / 90 F, par rapport à la moyenne du dispositif de 33.9 °C / 93 F.
(-) En jouant à The Witcher 3, la température moyenne du côté supérieur est de 42.9 °C / 109 F, alors que la moyenne de l'appareil est de 33.9 °C / 93 F.
(-) Les repose-poignets et le pavé tactile peuvent devenir très chauds au toucher, avec un maximum de 41.2 °C / 106.2# F.
(-) La température moyenne de la zone de l'appui-paume de dispositifs similaires était de 28.8 °C / 83.8 F (-12.4 °C / #-22.4 F).
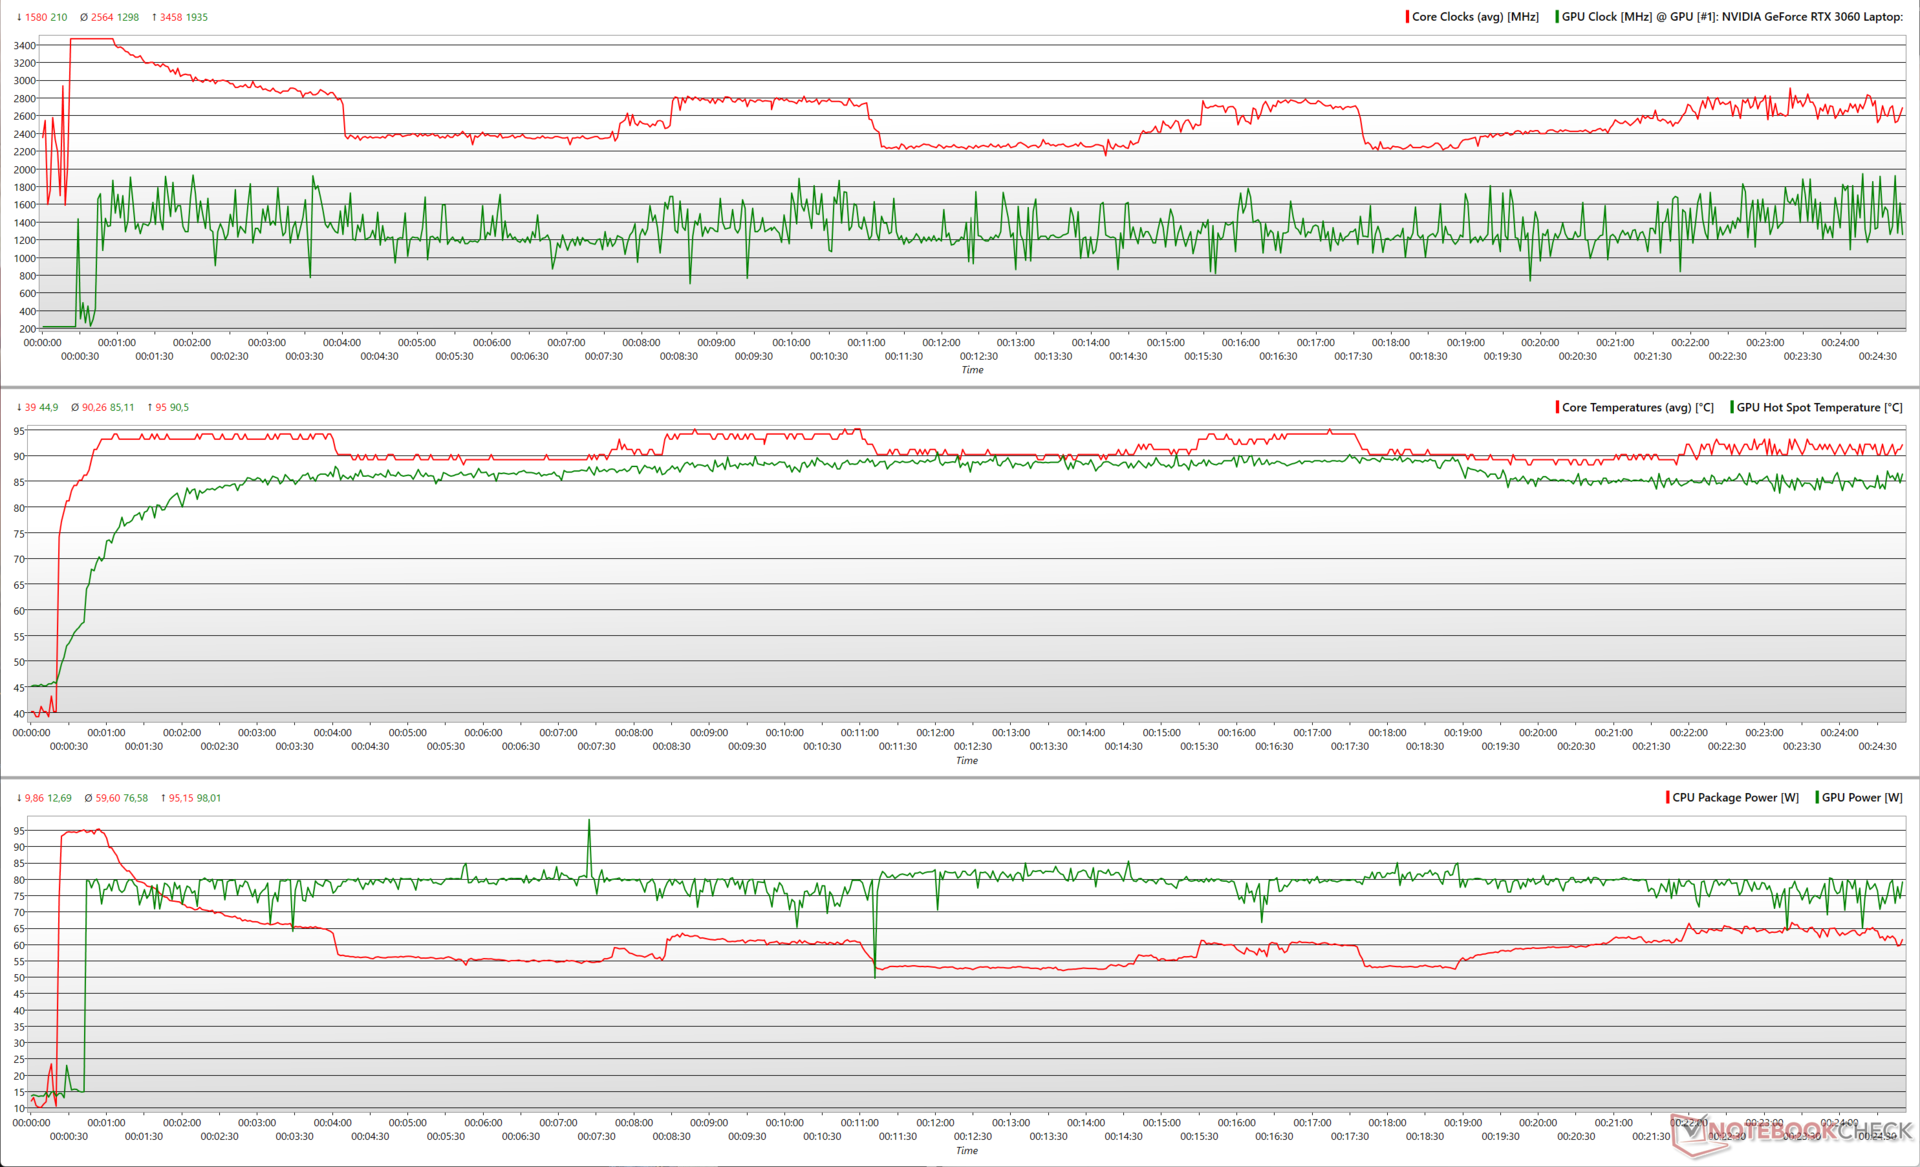
En combinant les tests Prime95 et FurMark, le Core i5-12500H atteint brièvement un pic d'environ 3,5 GHz à 95 W avant de redescendre à environ 2,5 GHz à près de 60 W en moyenne. Le GPU RTX 3060 Laptop se contente d'une moyenne de 75,6 W, mais atteint un pic de 98 W, ce qui se traduit par une horloge maximale de 1,9 GHz.
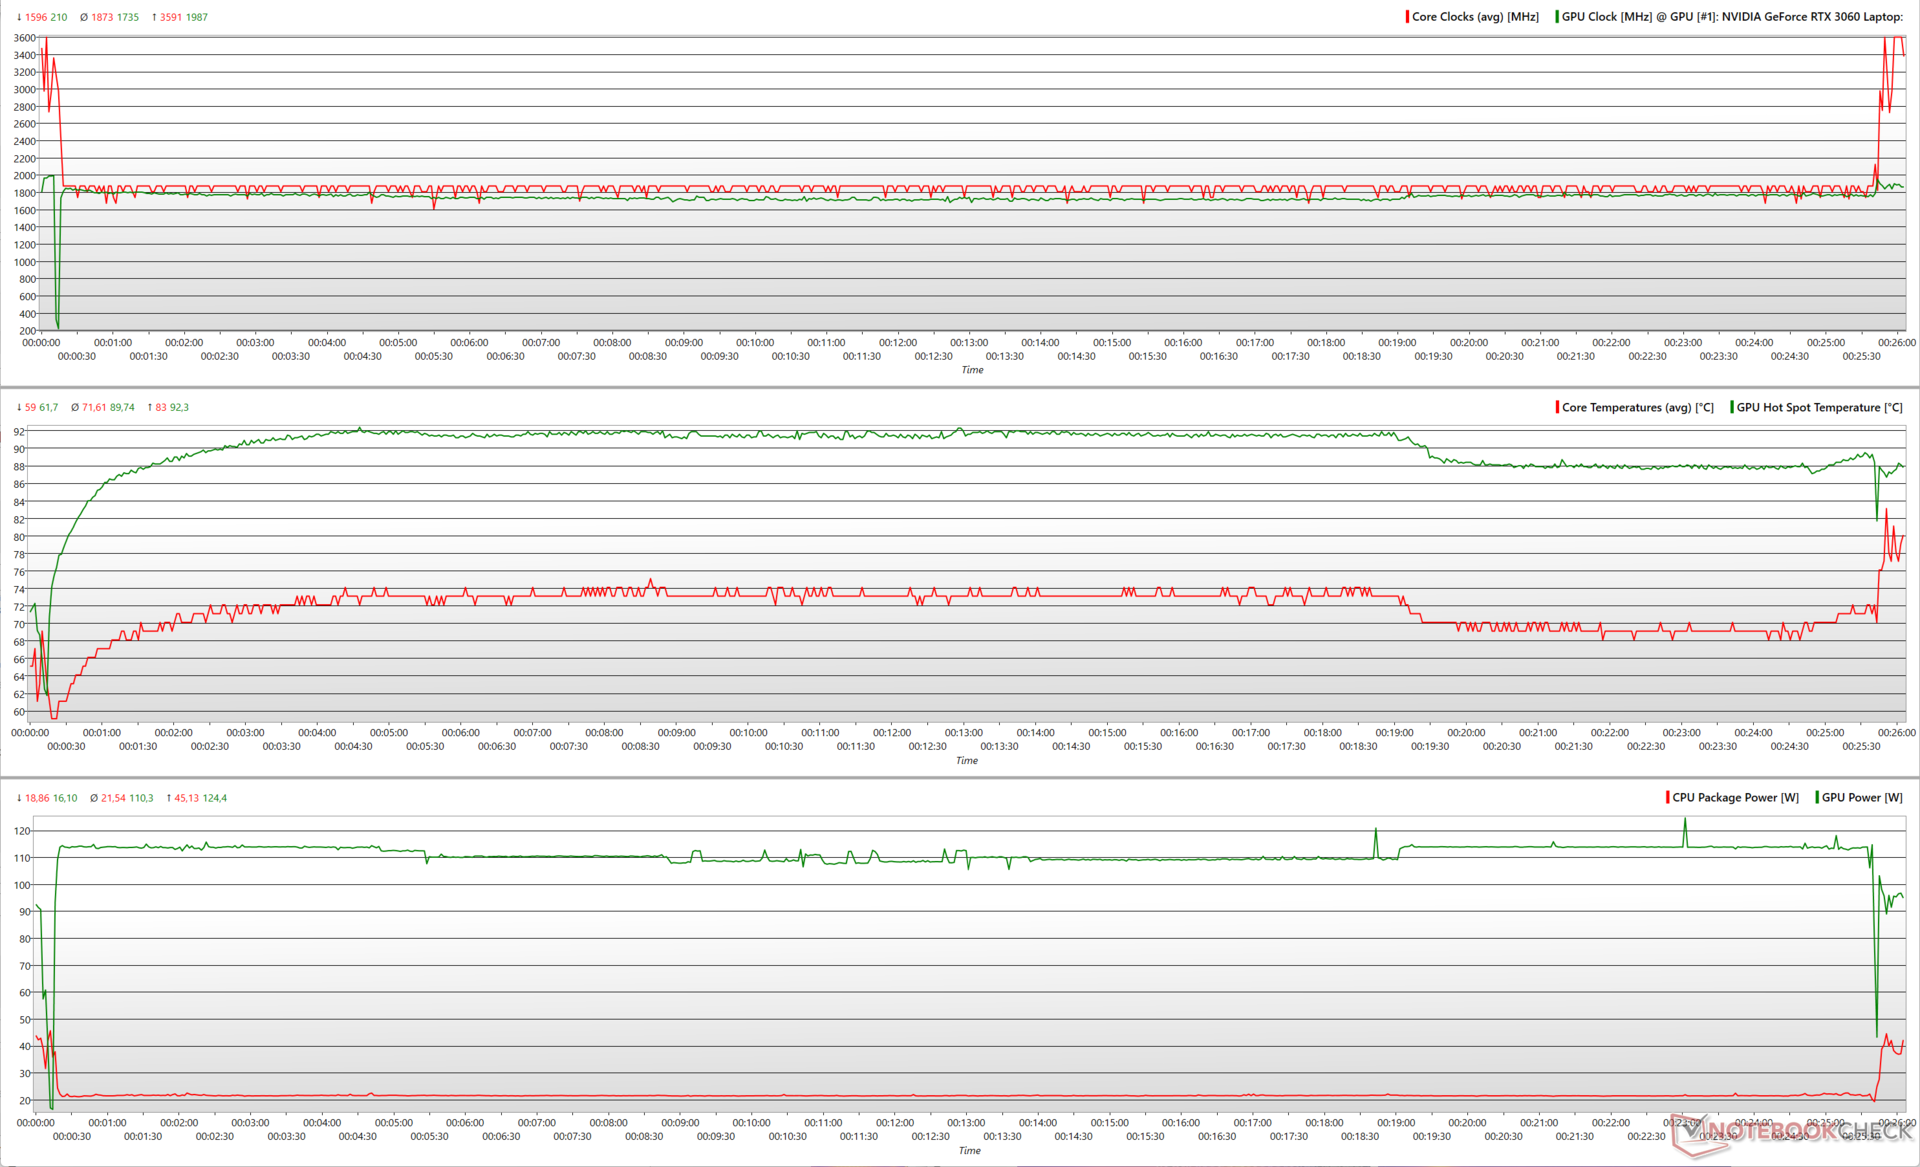
Nous observons des pics d'horloge similaires lors du stress The Witcher 3, mais la puissance moyenne du CPU chute à environ 21,5 W, ce qui permet à la RTX 3060 de consommer jusqu'à 110 W en moyenne.
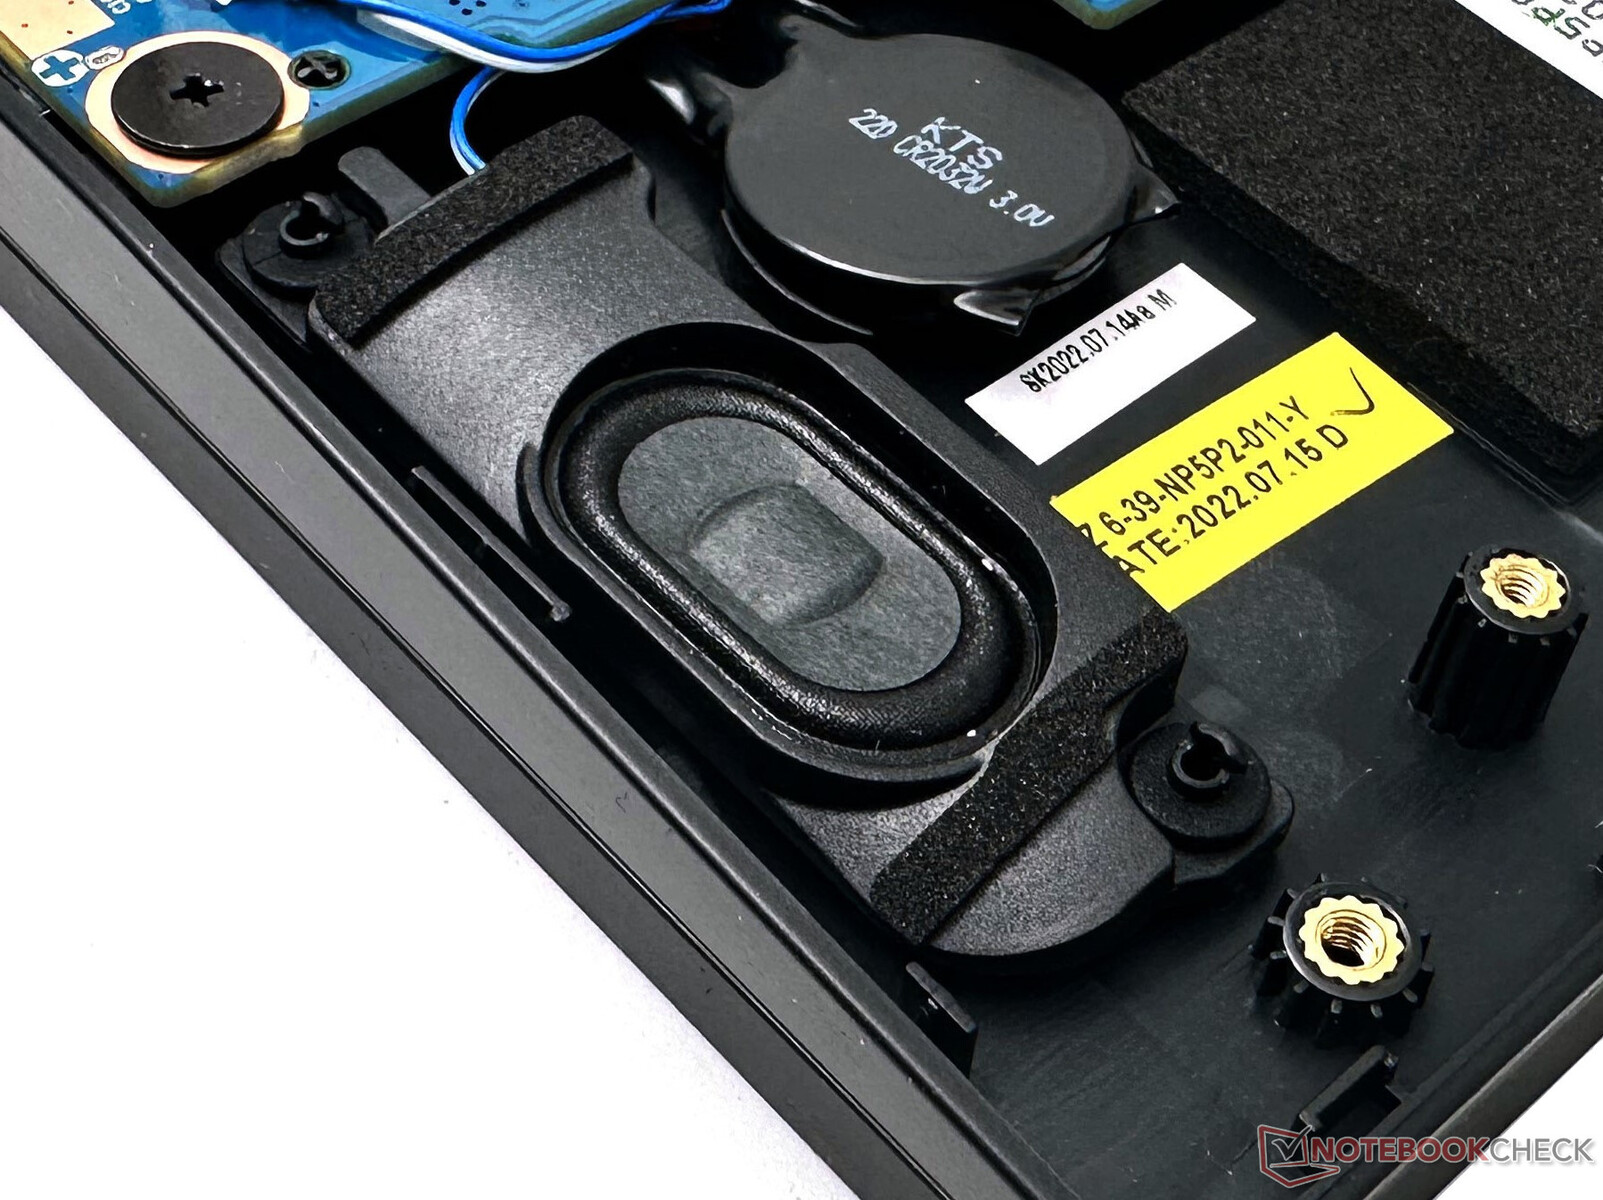
Intervenants
Les haut-parleurs de la G5 KE sont tout à fait fonctionnels pour la plupart, avec un niveau sonore proche de 75 dB(A). La réponse des basses est presque inexistante, mais les médiums et les aigus sont reproduits de manière décente.
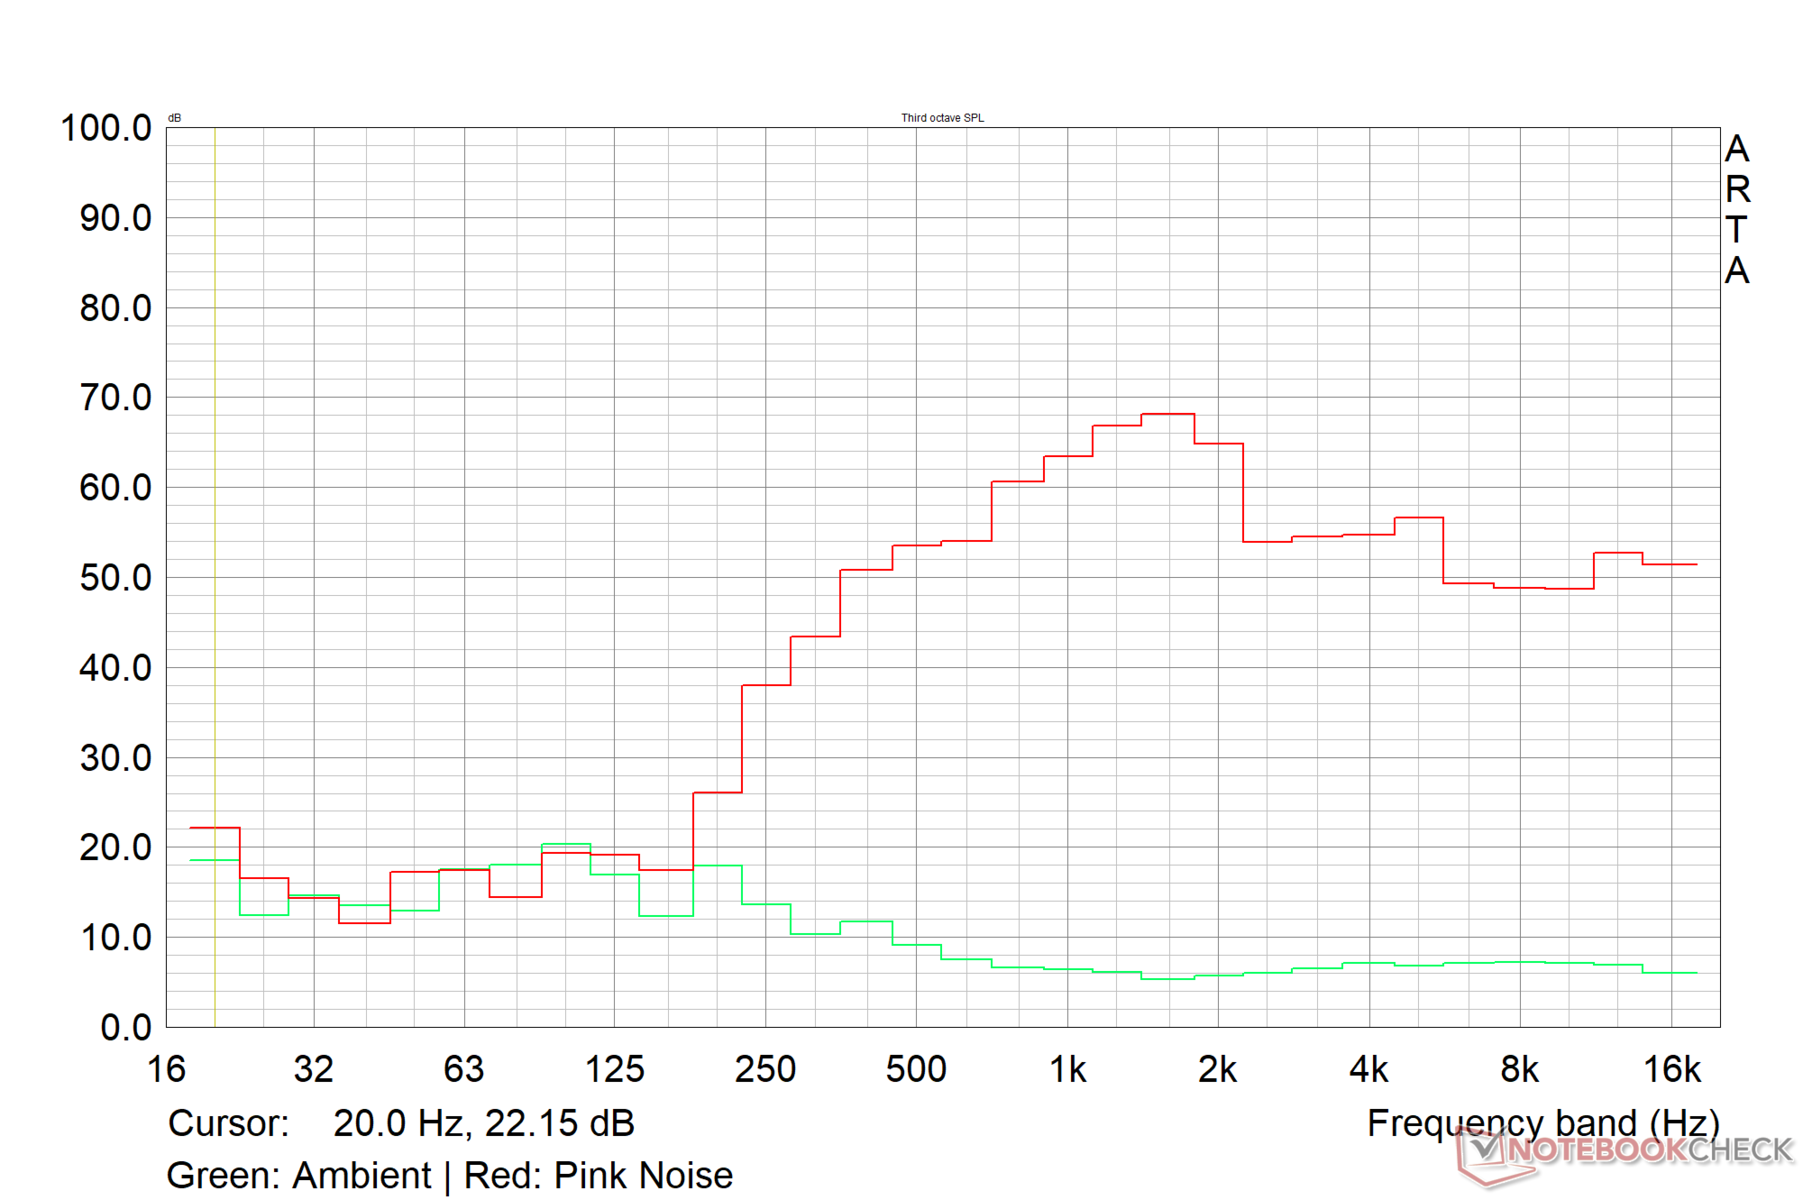
Gigabyte G5 KE analyse audio
(±) | le niveau sonore du haut-parleur est moyen mais bon (73.6# dB)
Basses 100 - 315 Hz
(-) | presque aucune basse - en moyenne 25.5% plus bas que la médiane
(±) | la linéarité des basses est moyenne (12% delta à la fréquence précédente)
Médiums 400 - 2000 Hz
(±) | médiane supérieure - en moyenne 8.1% supérieure à la médiane
(±) | la linéarité des médiums est moyenne (7.7% delta à la fréquence précédente)
Aiguës 2 - 16 kHz
(+) | des sommets équilibrés - à seulement 2.9% de la médiane
(+) | les aigus sont linéaires (6.7% delta à la fréquence précédente)
Globalement 100 - 16 000 Hz
(±) | la linéarité du son global est moyenne (25.1% de différence avec la médiane)
Par rapport à la même classe
» 90% de tous les appareils testés de cette catégorie étaient meilleurs, 3% similaires, 7% pires
» Le meilleur avait un delta de 6%, la moyenne était de 18%, le pire était de 132%.
Par rapport à tous les appareils testés
» 77% de tous les appareils testés étaient meilleurs, 5% similaires, 18% pires
» Le meilleur avait un delta de 4%, la moyenne était de 24%, le pire était de 134%.
Apple MacBook Pro 16 2021 M1 Pro analyse audio
(+) | les haut-parleurs peuvent jouer relativement fort (84.7# dB)
Basses 100 - 315 Hz
(+) | bonne basse - seulement 3.8% loin de la médiane
(+) | les basses sont linéaires (5.2% delta à la fréquence précédente)
Médiums 400 - 2000 Hz
(+) | médiane équilibrée - seulement 1.3% de la médiane
(+) | les médiums sont linéaires (2.1% delta à la fréquence précédente)
Aiguës 2 - 16 kHz
(+) | des sommets équilibrés - à seulement 1.9% de la médiane
(+) | les aigus sont linéaires (2.7% delta à la fréquence précédente)
Globalement 100 - 16 000 Hz
(+) | le son global est linéaire (4.6% différence à la médiane)
Par rapport à la même classe
» 0% de tous les appareils testés de cette catégorie étaient meilleurs, 0% similaires, 100% pires
» Le meilleur avait un delta de 5%, la moyenne était de 17%, le pire était de 45%.
Par rapport à tous les appareils testés
» 0% de tous les appareils testés étaient meilleurs, 0% similaires, 100% pires
» Le meilleur avait un delta de 4%, la moyenne était de 24%, le pire était de 134%.
Gestion de l'énergie : Consommation d'énergie économe en veille et autonomie médiocre de la batterie
Consommation électrique
Le Gigabyte G5 KE est un peu plus économe en termes de consommation d'énergie que le G7 KE, en particulier au ralenti.
L'IdeaPad Gaming 3 de Lenovo IdeaPad Gaming 3's RTX 3050 Ti du Lenovo IdeaPad Gaming 3 et la combinaison d'une RTX 3060 de 95 W et d'un GPU pour ordinateur portable HP Victus Ryzen 7 5800H permettent à ces appareils de consommer comparativement moins d'énergie.
| Éteint/en veille | |
| Au repos | |
| Fortement sollicité |
|
Légende:
min: | |
| Gigabyte G5 KE i5-12500H, GeForce RTX 3060 Laptop GPU, IPS, 1920x1080, 15.6" | Lenovo IdeaPad Gaming 3 15IAH7 i5-12500H, GeForce RTX 3050 Ti Laptop GPU, IPS, 1920x1080, 15.6" | Gigabyte G7 KE i5-12500H, GeForce RTX 3060 Laptop GPU, IPS, 1920x1080, 17.3" | Schenker XMG Core 15 (M22) R7 6800H, GeForce RTX 3060 Laptop GPU, IPS, 2560x1440, 15.6" | Dell G16 7620 i7-12700H, GeForce RTX 3060 Laptop GPU, IPS, 2560x1600, 16" | Asus TUF Gaming F15 FX507ZM i7-12700H, GeForce RTX 3060 Laptop GPU, IPS, 1920x1080, 15.6" | HP Victus 16-e0179ng R7 5800H, GeForce RTX 3060 Laptop GPU, IPS, 1920x1080, 16.1" | Moyenne NVIDIA GeForce RTX 3060 Laptop GPU | Moyenne de la classe Gaming | |
|---|---|---|---|---|---|---|---|---|---|
| Power Consumption | 9% | -33% | -14% | -42% | -8% | 9% | -18% | -41% | |
| Idle Minimum * (Watt) | 7.66 | 8 -4% | 15 -96% | 11.8 -54% | 14.4 -88% | 6.3 18% | 5 35% | 10.4 ? -36% | 13.2 ? -72% |
| Idle Average * (Watt) | 10.3 | 10 3% | 17 -65% | 14.7 -43% | 17.8 -73% | 9.8 5% | 10 3% | 14.5 ? -41% | 18.9 ? -83% |
| Idle Maximum * (Watt) | 16.05 | 16 -0% | 24 -50% | 15 7% | 31.5 -96% | 26.5 -65% | 20 -25% | 21.4 ? -33% | 24.3 ? -51% |
| Load Average * (Watt) | 115.8 | 99 15% | 111 4% | 100 14% | 101.2 13% | 103.8 10% | 108 7% | 109.3 ? 6% | 108 ? 7% |
| Witcher 3 ultra * (Watt) | 168.7 | 144.6 14% | 174.1 -3% | 184 -9% | 176.9 -5% | 189 -12% | 145 14% | ||
| Load Maximum * (Watt) | 234.6 | 168 28% | 208 11% | 237 -1% | 242.9 -4% | 241.9 -3% | 189 19% | 206 ? 12% | 254 ? -8% |
* ... Moindre est la valeur, meilleures sont les performances
Power Consumption: The Witcher 3 / Stress test
Power Consumption: External monitor
Autonomie de la batterie
L'autonomie de la batterie du Gigabyte G5 KE est faible, même avec une luminosité réduite à 150 nits. Cependant, cela n'est pas rare avec les ordinateurs portables de jeu.
Comme pour le G7 KE, nous avons constaté une durée d'autonomie très faible d'un peu plus de deux heures lors de notre test de lecture vidéo H.264 1080p en boucle à 150 nits, même avec tous les disques et les correctifs du système d'exploitation à jour.
Points positifs
Points négatifs
Verdict : Joueur grand public avec des compromis inévitables
Alors que Gigabyte proposera dans les semaines à venir une série d'ordinateurs portables Aorus, Aero et Gigabyte équipés d'un processeur Intel 13e génération et d'une RTX 40, le G5 KE équipé d'un processeur Intel Core i5-12500H et d'un processeur RTX 40 est un modèle de référence Intel Core i5-12500H Et un processeur GPU Nvidia RTX 3060 pour ordinateur portable reste une bonne option pour les jeux grand public.
Gigabyte fait bon usage du combo Core i5-12500H et GPU RTX 3060 Laptop, et nous n'avons pas constaté de problèmes de performances. Le système de refroidissement à double ventilateur et quadruple caloduc permet de s'assurer que le matériel sous-jacent ne s'essouffle pas sous la charge.
Le Gigabyte G5 KE est un ordinateur portable grand public capable de jouer en 1080p avec de très bonnes performances du CPU et du GPU. Cependant, il n'est pas à la hauteur dans d'autres domaines qui peuvent être critiques ou non en fonction de vos priorités.
Ceci étant dit, l'écran est en dessous de la norme 2023, en particulier lorsque des appareils concurrents tels que le Lenovo IdeaPad Gaming 3, Schenker XMG Core 15 (M22),Asus TUF Gaming F15et le propre Gigabyte G7 KE de Gigabyte offrent des dalles largement supérieures avec une large couverture de la gamme de couleurs et des temps de réponse rapides.
Parmi les autres défauts majeurs, citons un SSD qui s'essouffle considérablement sous charge, des températures de surface élevées, des ventilateurs bruyants et une faible autonomie de la batterie pendant la lecture de vidéos.
Si ces compromis n'ont pas beaucoup d'importance pour vous, le Gigabyte G5 KE est un ordinateur portable de milieu de gamme décent pour les jeux en FHD du point de vue des performances, qui devrait vous servir jusqu'en 2023.
Prix et disponibilité
En Inde, le Gigabyte G5 KE est actuellement en vente sur Flipkart à un prix réduit de 94 990 ₹, tandis qu'Amazon India propose le G5 ME avec une RTX 3050 Ti pour 95 901 ₹.
Le G5 KE avec une RTX 3060 est un peu difficile à trouver sur les marchés internationaux car l'ordinateur portable est supplanté par une configuration basée sur la RTX 4050 ou la RTX 4060.
Gigabyte G5 KE
- 04/24/2023 v7 (old)
Vaidyanathan Subramaniam
Transparency
La sélection des appareils à examiner est effectuée par notre équipe éditoriale. L'échantillon de test a été prêté à l'auteur par le fabricant ou le détaillant pour les besoins de cet examen. Le prêteur n'a pas eu d'influence sur cette évaluation et le fabricant n'a pas reçu de copie de cette évaluation avant sa publication. Il n'y avait aucune obligation de publier cet article. En tant que média indépendant, Notebookcheck n'est pas soumis à l'autorité des fabricants, des détaillants ou des éditeurs.
Voici comment Notebookcheck teste
Chaque année, Notebookcheck examine de manière indépendante des centaines d'ordinateurs portables et de smartphones en utilisant des procédures standardisées afin de garantir que tous les résultats sont comparables. Nous avons continuellement développé nos méthodes de test depuis environ 20 ans et avons établi des normes industrielles dans le processus. Dans nos laboratoires de test, des équipements de mesure de haute qualité sont utilisés par des techniciens et des rédacteurs expérimentés. Ces tests impliquent un processus de validation en plusieurs étapes. Notre système d'évaluation complexe repose sur des centaines de mesures et de points de référence bien fondés, ce qui garantit l'objectivité.Price comparison

