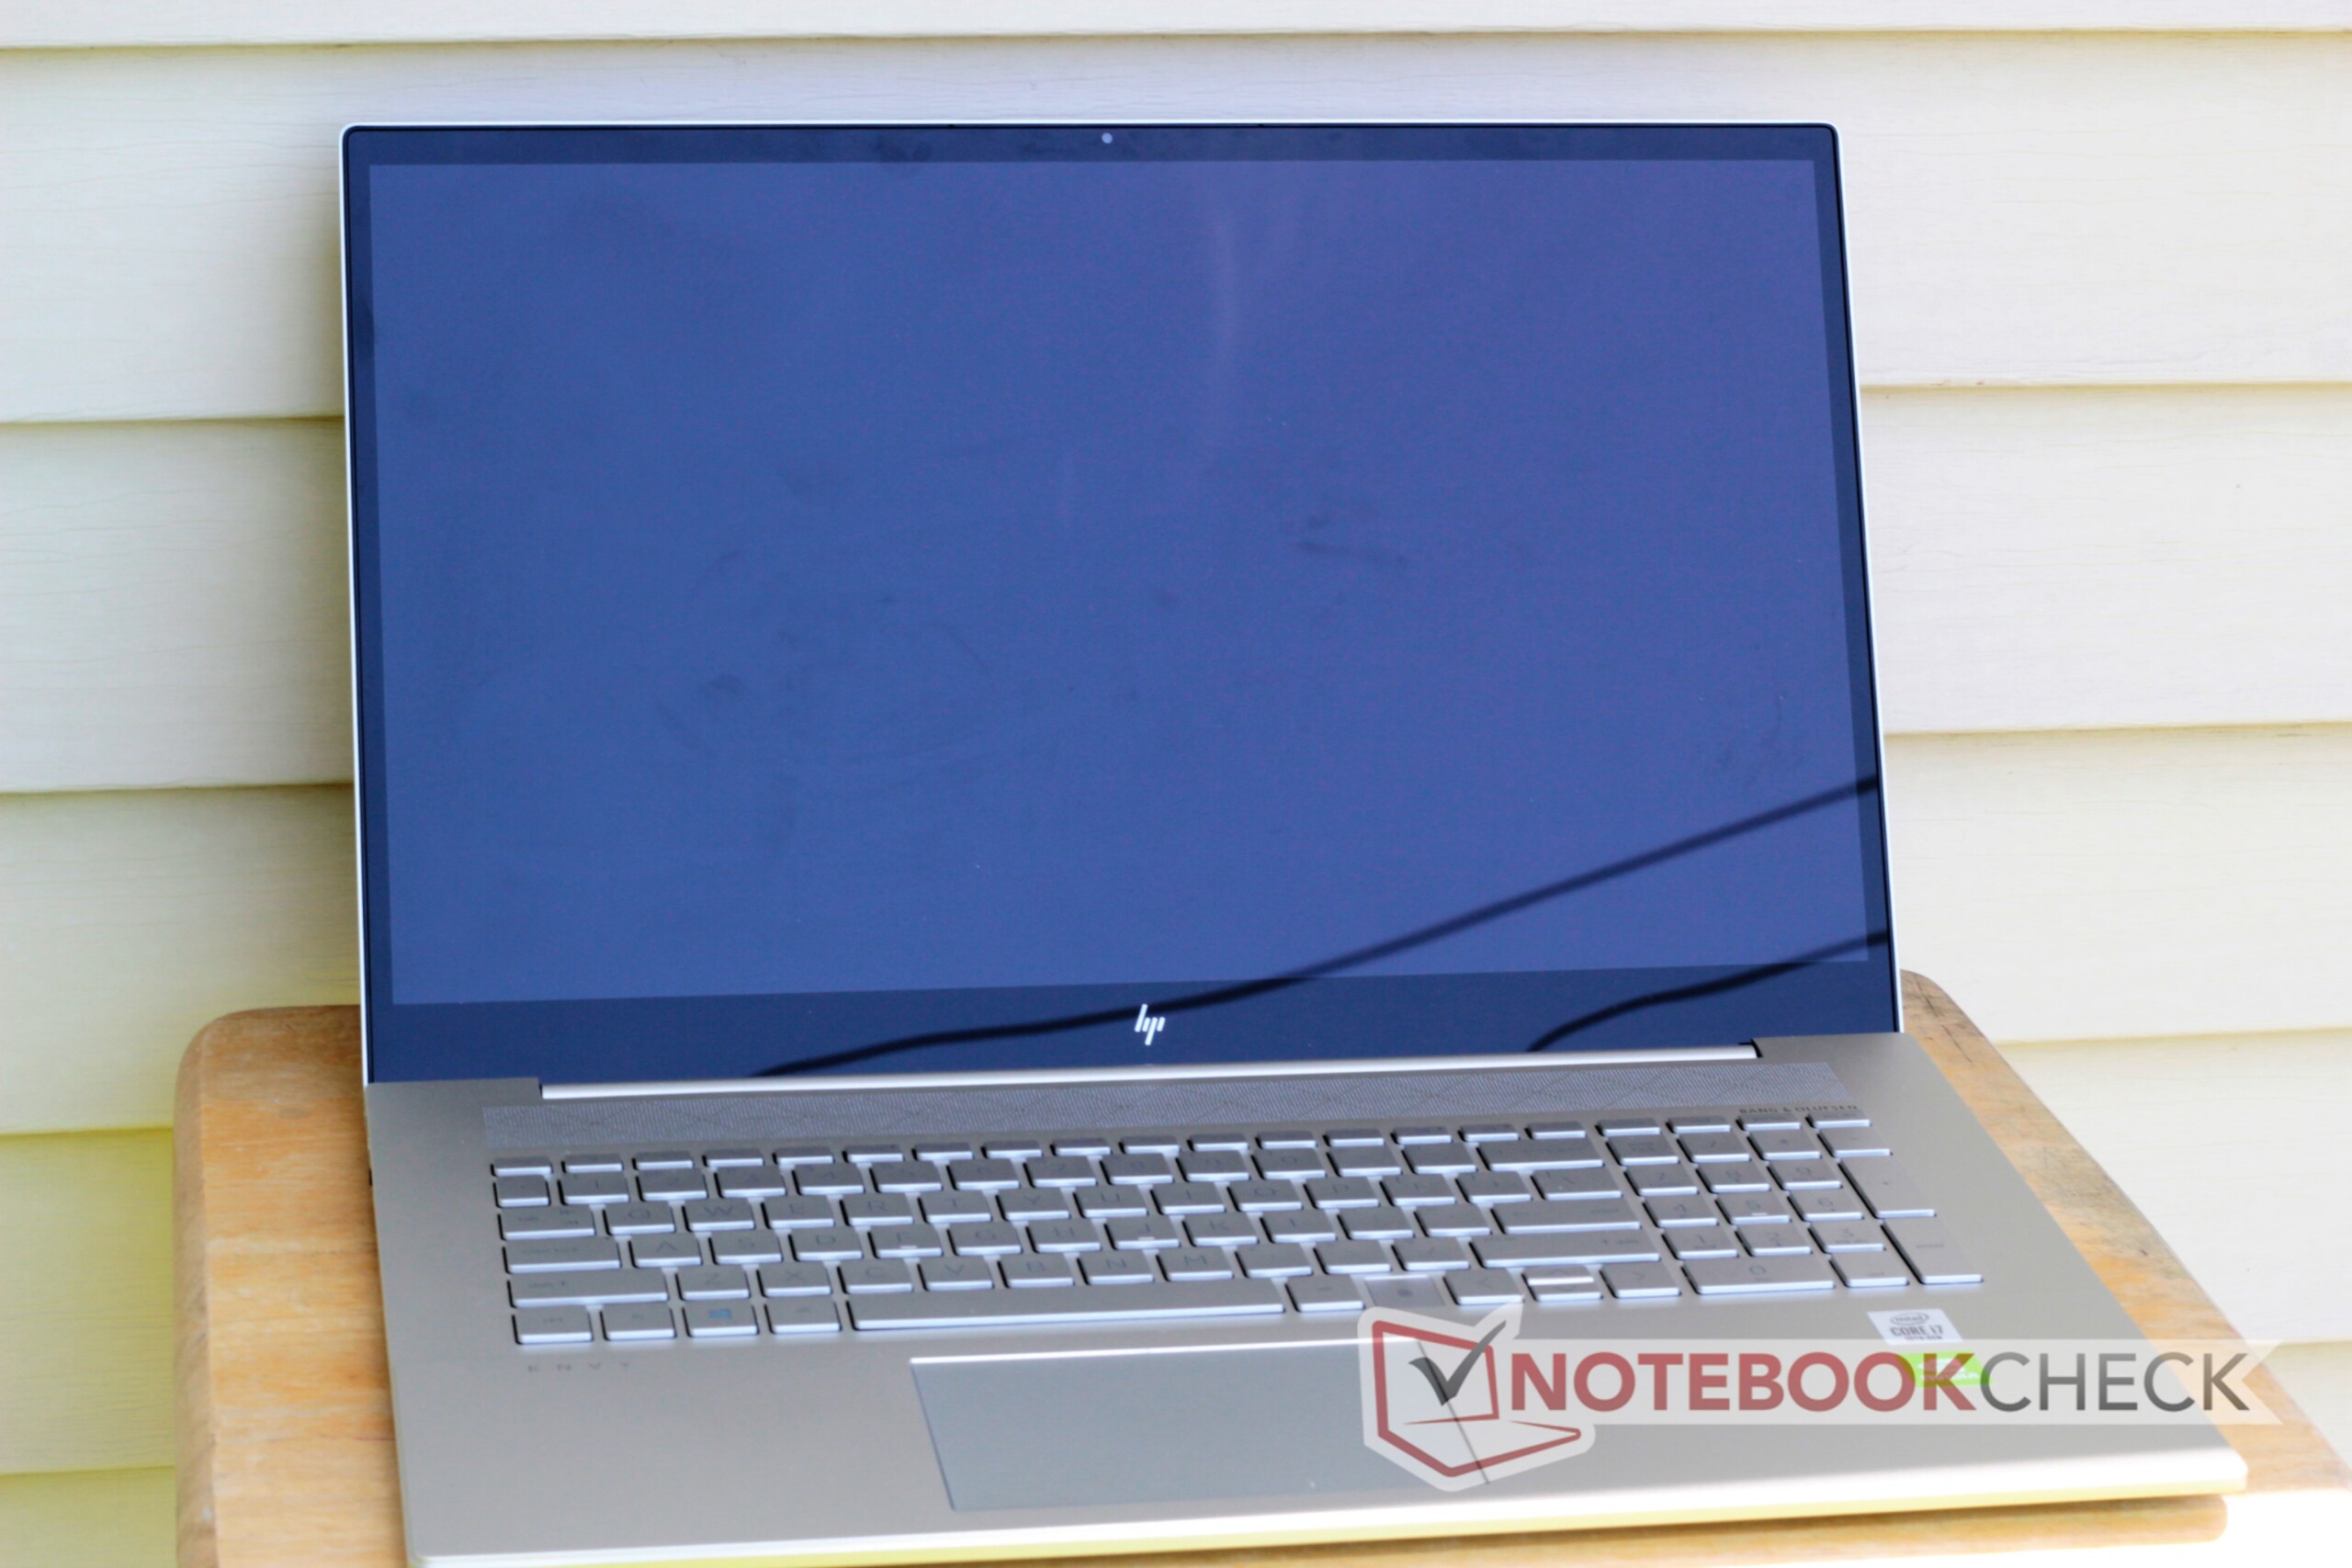
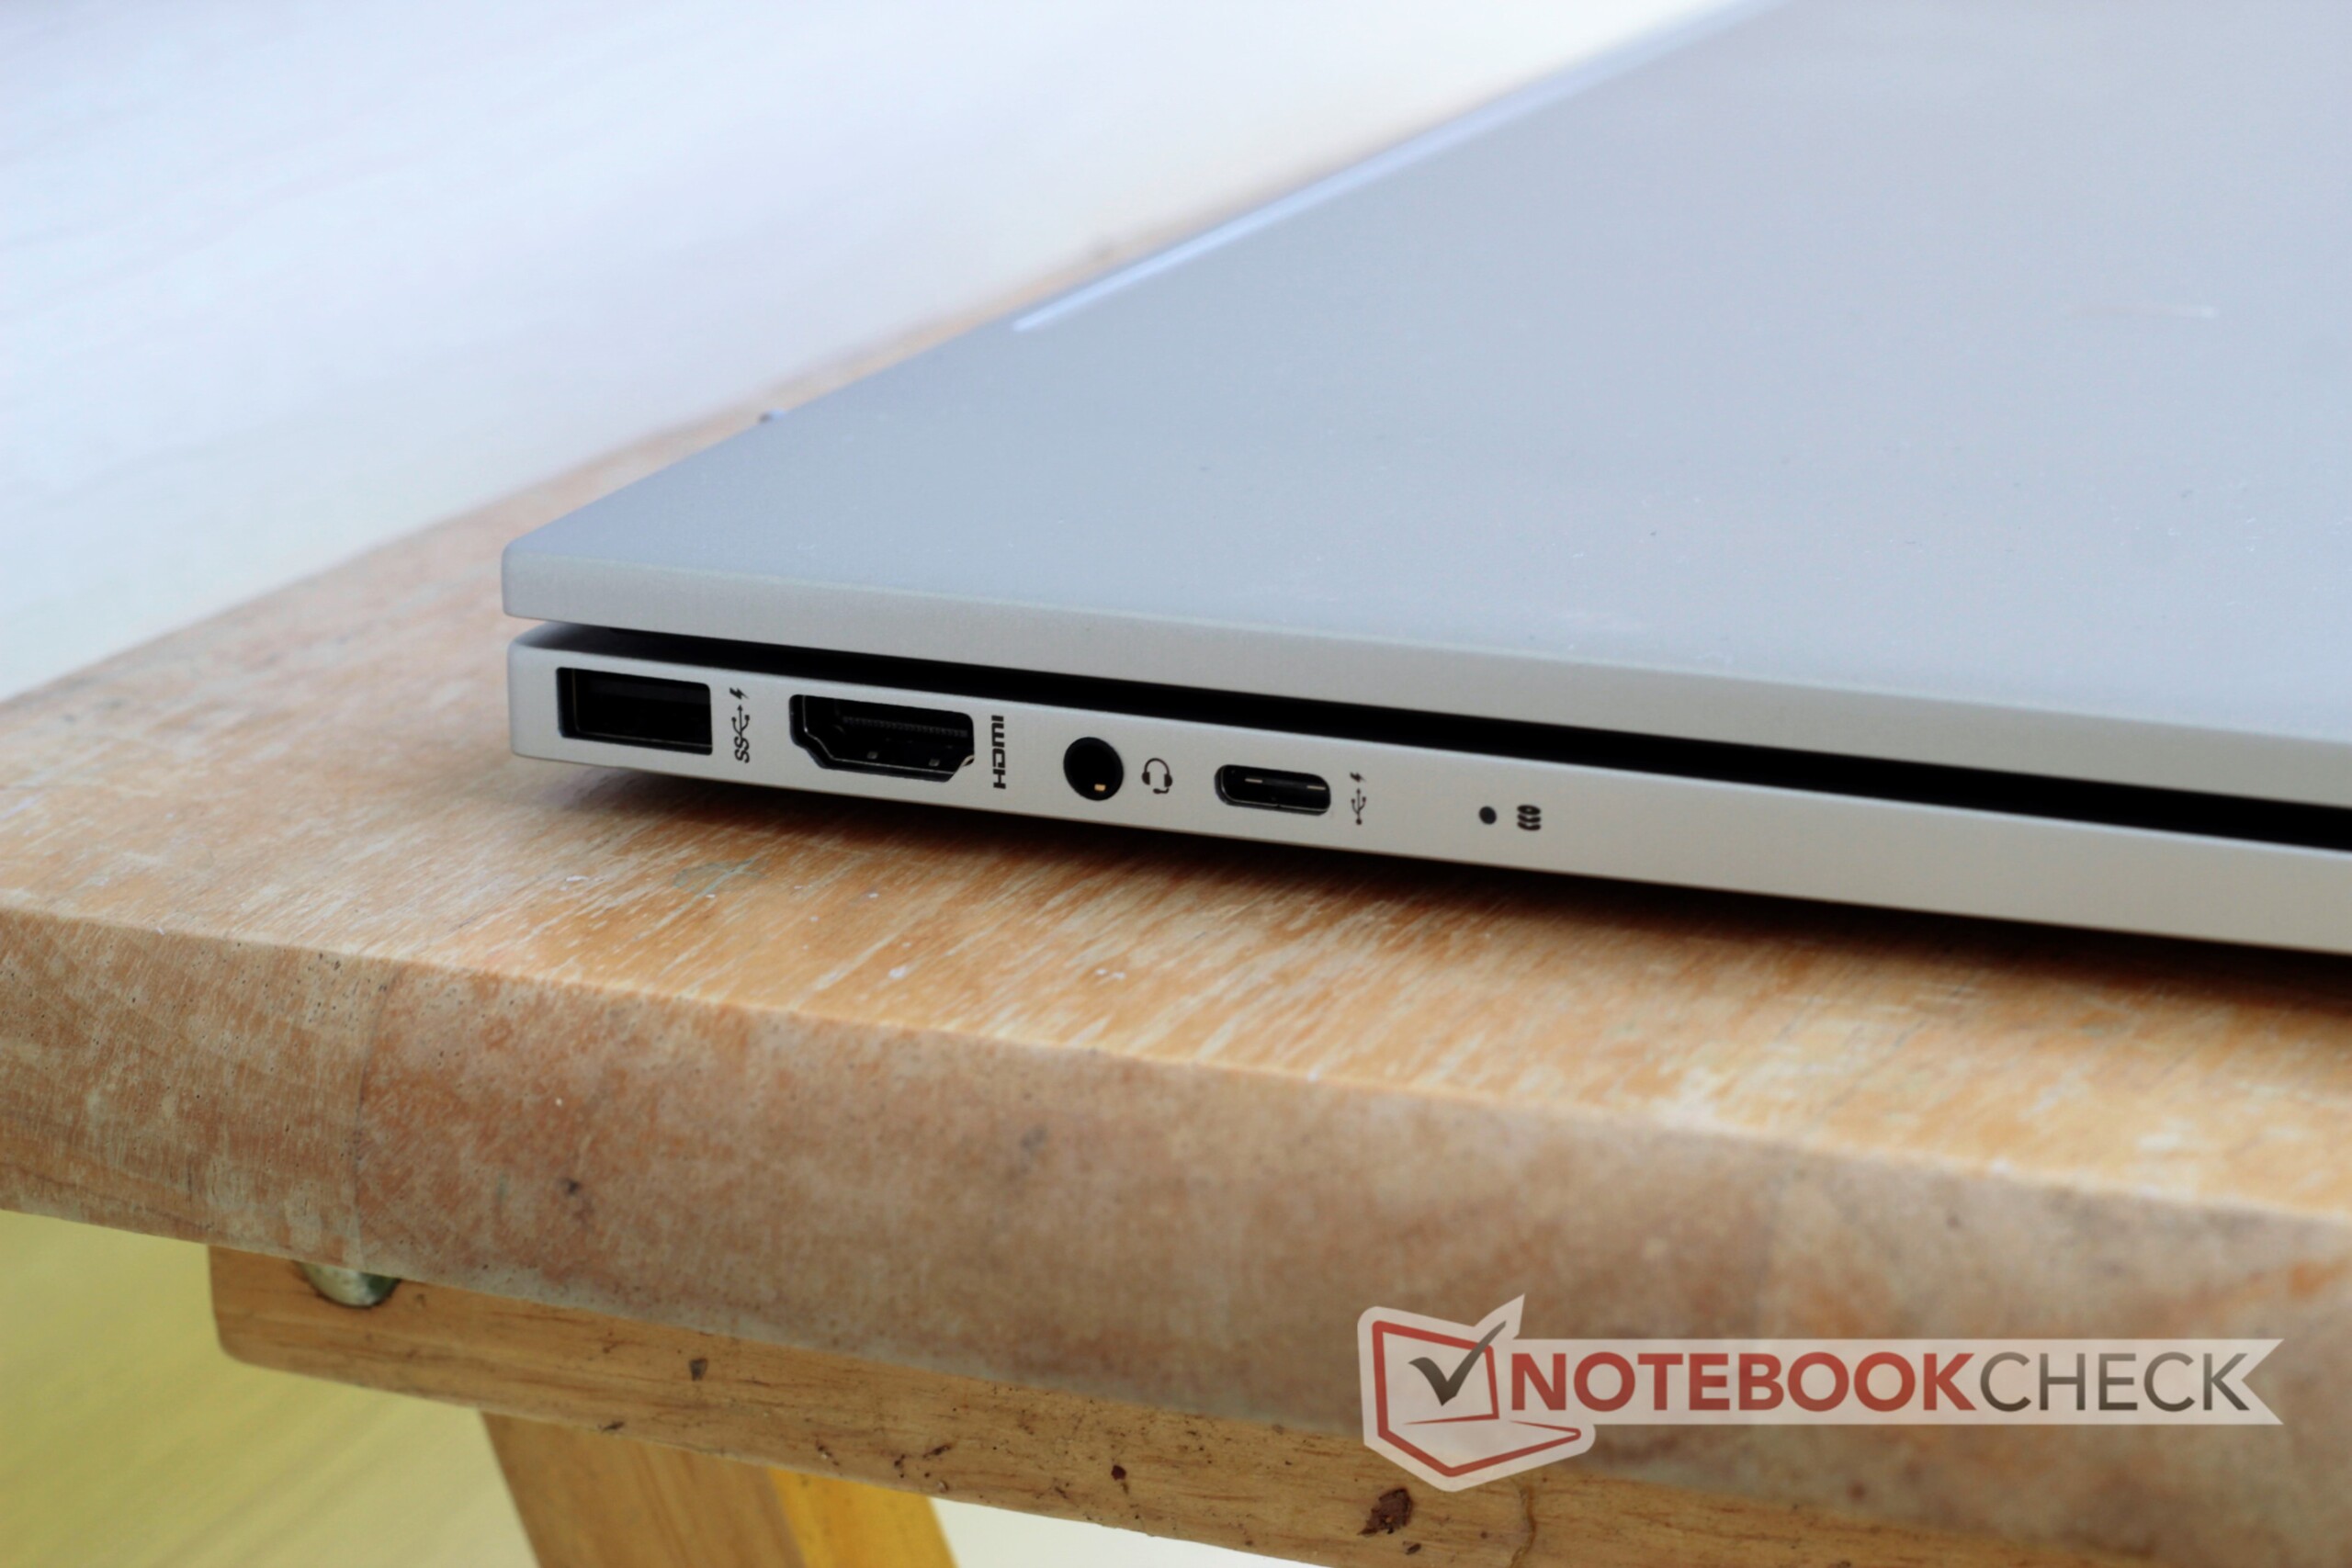
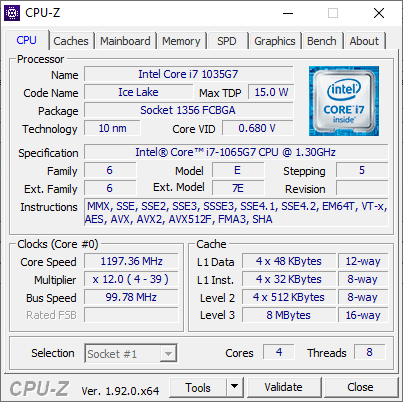
Test du HP Envy 17t (i7-1065G7, Nvidia MX330, 4K) : un 17 pouces élégant
Note | Date | Modèle | Poids | Épaisseur | Taille | Résolution | Prix |
|---|---|---|---|---|---|---|---|
| 80.9 % v7 (old) | 07/20 | HP Envy 17t-cg000 i7-1065G7, GeForce MX330 | 2.7 kg | 19.3 mm | 17.30" | 3840x2160 | |
| 79.3 % v7 (old) | Medion Akoya P17605 i7-10510U, GeForce MX250 | 2.3 kg | 18.45 mm | 17.30" | 1920x1080 | ||
| 75.6 % v7 (old) | 02/20 | Asus VivoBook 17 M712DA-AU017T R5 3500U, Vega 8 | 2.3 kg | 21 mm | 17.30" | 1920x1080 | |
| 78.5 % v7 (old) | 11/19 | HP Envy 17-ce1004ng i7-10510U, GeForce MX250 | 2.8 kg | 23 mm | 17.30" | 1920x1080 | |
| 78.9 % v6 (old) | 05/19 | Dell Inspiron 17 3780 i7-8565U, Radeon 520 | 2.8 kg | 25 mm | 17.30" | 1920x1080 | |
| 83.5 % v6 (old) | 04/19 | LG Gram 17Z990-R.AAS7U1 i7-8565U, UHD Graphics 620 | 1.3 kg | 17.8 mm | 17.00" | 2560x1600 |

| SD Card Reader | |
| average JPG Copy Test (av. of 3 runs) | |
| Dell XPS 15 9500 Core i7 4K UHD (Toshiba Exceria Pro SDXC 64 GB UHS-II) | |
| HP Envy 17t-cg000 (Toshiba Exceria Pro SDXC 64 GB UHS-II) | |
| LG Gram 17Z990-R.AAS7U1 (Toshiba Exceria Pro M501 64 GB UHS-II) | |
| HP Envy 17-ce1004ng (Toshiba Exceria Pro SDXC 64 GB UHS-II) | |
| Asus VivoBook 17 M712DA-AU017T (Toshiba Exceria Pro M501 microSDXC 64GB) | |
| Dell Inspiron 17 3780 (Toshiba Exceria Pro SDXC 64 GB UHS-II) | |
| Medion Akoya P17605 (Toshiba Exceria Pro SDXC 64 GB UHS-II) | |
| maximum AS SSD Seq Read Test (1GB) | |
| Dell XPS 15 9500 Core i7 4K UHD (Toshiba Exceria Pro SDXC 64 GB UHS-II) | |
| LG Gram 17Z990-R.AAS7U1 (Toshiba Exceria Pro M501 64 GB UHS-II) | |
| HP Envy 17t-cg000 (Toshiba Exceria Pro SDXC 64 GB UHS-II) | |
| HP Envy 17-ce1004ng (Toshiba Exceria Pro SDXC 64 GB UHS-II) | |
| Asus VivoBook 17 M712DA-AU017T (Toshiba Exceria Pro M501 microSDXC 64GB) | |
| Dell Inspiron 17 3780 (Toshiba Exceria Pro SDXC 64 GB UHS-II) | |
| Medion Akoya P17605 (Toshiba Exceria Pro SDXC 64 GB UHS-II) | |
| Networking | |
| iperf3 transmit AX12 | |
| Medion Akoya P17605 | |
| HP Envy 17t-cg000 | |
| LG Gram 17Z990-R.AAS7U1 | |
| HP Envy 17-ce1004ng | |
| Asus VivoBook 17 M712DA-AU017T | |
| Dell Inspiron 17 3780 | |
| iperf3 receive AX12 | |
| HP Envy 17t-cg000 | |
| Medion Akoya P17605 | |
| HP Envy 17-ce1004ng | |
| LG Gram 17Z990-R.AAS7U1 | |
| Asus VivoBook 17 M712DA-AU017T | |
| Dell Inspiron 17 3780 | |


| |||||||||||||||||||||||||
Homogénéité de la luminosité: 86 %
Valeur mesurée au centre, sur batterie: 383.4 cd/m²
Contraste: 1128:1 (Valeurs des noirs: 0.34 cd/m²)
ΔE ColorChecker Calman: 6.24 | ∀{0.5-29.43 Ø4.72}
calibrated: 3.7
ΔE Greyscale Calman: 6.6 | ∀{0.09-98 Ø4.97}
100% sRGB (Argyll 1.6.3 3D)
88% AdobeRGB 1998 (Argyll 1.6.3 3D)
99.8% AdobeRGB 1998 (Argyll 3D)
100% sRGB (Argyll 3D)
86.2% Display P3 (Argyll 3D)
Gamma: 2.272
CCT: 5973 K
| HP Envy 17t-cg000 AU Optronics AUO168E, IPS, 17.3", 3840x2160 | Medion Akoya P17605 AU Optronics AUO429D, IPS, 17.3", 1920x1080 | Asus VivoBook 17 M712DA-AU017T BOE084E, IPS, 17.3", 1920x1080 | HP Envy 17-ce1004ng BOE0825, IPS, 17.3", 1920x1080 | Dell Inspiron 17 3780 AU Optronics B173HAN01.3, IPS, 17.3", 1920x1080 | LG Gram 17Z990-R.AAS7U1 LG Philips LP170WQ1-SPA1, IPS, 17", 2560x1600 | Dell XPS 15 9500 Core i7 4K UHD Sharp LQ156R1, IPS, 15.6", 3840x2400 | |
|---|---|---|---|---|---|---|---|
| Display | -25% | -50% | -23% | -24% | -21% | 1% | |
| Display P3 Coverage (%) | 86.2 | 62.3 -28% | 40.76 -53% | 63.3 -27% | 63.7 -26% | 64.2 -26% | 89.7 4% |
| sRGB Coverage (%) | 100 | 88.6 -11% | 59.7 -40% | 91.5 -8% | 88.9 -11% | 96.3 -4% | 100 0% |
| AdobeRGB 1998 Coverage (%) | 99.8 | 63.7 -36% | 42.11 -58% | 64.6 -35% | 64.6 -35% | 66.3 -34% | 99.8 0% |
| Response Times | -3% | 43% | 37% | -11% | 1% | -16% | |
| Response Time Grey 50% / Grey 80% * (ms) | 45.2 ? | 45 ? -0% | 24 ? 47% | 30 ? 34% | 46 ? -2% | 42 ? 7% | 54 ? -19% |
| Response Time Black / White * (ms) | 29.6 ? | 31 ? -5% | 18 ? 39% | 18 ? 39% | 35.2 ? -19% | 31.2 ? -5% | 33.2 ? -12% |
| PWM Frequency (Hz) | |||||||
| Screen | 14% | -14% | -5% | 5% | 17% | 19% | |
| Brightness middle (cd/m²) | 383.4 | 298 -22% | 262 -32% | 293 -24% | 322.9 -16% | 370.6 -3% | 557.9 46% |
| Brightness (cd/m²) | 382 | 294 -23% | 234 -39% | 280 -27% | 322 -16% | 356 -7% | 541 42% |
| Brightness Distribution (%) | 86 | 88 2% | 84 -2% | 83 -3% | 84 -2% | 89 3% | 91 6% |
| Black Level * (cd/m²) | 0.34 | 0.255 25% | 0.265 22% | 0.335 1% | 0.26 24% | 0.28 18% | 0.39 -15% |
| Contrast (:1) | 1128 | 1169 4% | 989 -12% | 875 -22% | 1242 10% | 1324 17% | 1431 27% |
| Colorchecker dE 2000 * | 6.24 | 3.01 52% | 5.13 18% | 4.79 23% | 4.19 33% | 3.28 47% | 4.54 27% |
| Colorchecker dE 2000 max. * | 10.18 | 4.59 55% | 19.16 -88% | 11.42 -12% | 7.04 31% | 5.85 43% | 7.92 22% |
| Colorchecker dE 2000 calibrated * | 3.7 | 2.1 43% | 3.96 -7% | 1.76 52% | 3.55 4% | 1.03 72% | 3.82 -3% |
| Greyscale dE 2000 * | 6.6 | 2.29 65% | 1.22 82% | 6.32 4% | 4.5 32% | 4.9 26% | 3.2 52% |
| Gamma | 2.272 97% | 2.62 84% | 2.42 91% | 2.49 88% | 1.97 112% | 2.19 100% | 1.99 111% |
| CCT | 5973 109% | 6655 98% | 6584 99% | 8002 81% | 7041 92% | 6376 102% | 6451 101% |
| Color Space (Percent of AdobeRGB 1998) (%) | 88 | 58 -34% | 38 -57% | 59 -33% | 57.6 -35% | 60.8 -31% | 89.5 2% |
| Color Space (Percent of sRGB) (%) | 100 | 89 -11% | 59 -41% | 91 -9% | 88.4 -12% | 96.6 -3% | 100 0% |
| Moyenne finale (programmes/paramètres) | -5% /
5% | -7% /
-14% | 3% /
-3% | -10% /
-3% | -1% /
8% | 1% /
11% |
* ... Moindre est la valeur, meilleures sont les performances
Temps de réponse de l'écran
| ↔ Temps de réponse noir à blanc | ||
|---|---|---|
| 29.6 ms ... hausse ↗ et chute ↘ combinées | ↗ 16.4 ms hausse | 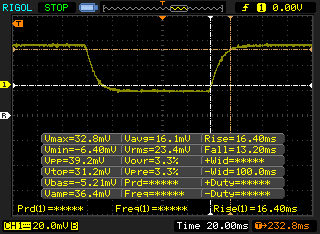 |
| ↘ 13.2 ms chute | ||
| L'écran souffre de latences relativement élevées, insuffisant pour le jeu. En comparaison, tous les appareils testés affichent entre 0.1 (minimum) et 240 (maximum) ms. » 79 % des appareils testés affichent de meilleures performances. Cela signifie que les latences relevées sont moins bonnes que la moyenne (19.8 ms) de tous les appareils testés. | ||
| ↔ Temps de réponse gris 50% à gris 80% | ||
| 45.2 ms ... hausse ↗ et chute ↘ combinées | ↗ 24 ms hausse | 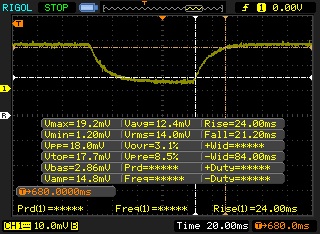 |
| ↘ 21 ms chute | ||
| L'écran souffre de latences très élevées, à éviter pour le jeu. En comparaison, tous les appareils testés affichent entre 0.165 (minimum) et 636 (maximum) ms. » 78 % des appareils testés affichent de meilleures performances. Cela signifie que les latences relevées sont moins bonnes que la moyenne (31 ms) de tous les appareils testés. | ||
Scintillement / MLI (Modulation de largeur d'impulsion)
| Scintillement / MLI (Modulation de largeur d'impulsion) non décelé | 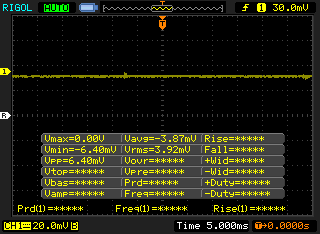 | ||
En comparaison, 52 % des appareils testés n'emploient pas MDI pour assombrir leur écran. Nous avons relevé une moyenne à 7772 (minimum : 5 - maximum : 343500) Hz dans le cas où une MDI était active. | |||
Cinebench R15: CPU Single 64Bit | CPU Multi 64Bit
Blender: v2.79 BMW27 CPU
7-Zip 18.03: 7z b 4 -mmt1 | 7z b 4
Geekbench 5.5: Single-Core | Multi-Core
HWBOT x265 Benchmark v2.2: 4k Preset
LibreOffice : 20 Documents To PDF
R Benchmark 2.5: Overall mean
| Cinebench R20 / CPU (Single Core) | |
| Moyenne de la classe Multimedia (425 - 853, n=64, 2 dernières années) | |
| HP Envy 17t-cg000 | |
| Acer Swift 3 SF314-42-R4XJ | |
| HP ProBook 445 G7 175W4EA | |
| Dell XPS 15 9500 Core i5 | |
| Moyenne Intel Core i7-1065G7 (358 - 474, n=31) | |
| Cinebench R20 / CPU (Multi Core) | |
| Moyenne de la classe Multimedia (1887 - 12912, n=64, 2 dernières années) | |
| Acer Swift 3 SF314-42-R4XJ | |
| HP ProBook 445 G7 175W4EA | |
| Dell XPS 15 9500 Core i5 | |
| HP Envy 17t-cg000 | |
| Moyenne Intel Core i7-1065G7 (1081 - 2024, n=31) | |
| Cinebench R15 / CPU Single 64Bit | |
| Moyenne de la classe Multimedia (184.8 - 326, n=66, 2 dernières années) | |
| HP Envy 17-ce1004ng | |
| HP Envy 17t-cg000 | |
| Dell XPS 15 9500 Core i5 | |
| Acer Swift 3 SF314-42-R4XJ | |
| HP ProBook 445 G7 175W4EA | |
| Moyenne Intel Core i7-1065G7 (141 - 190, n=35) | |
| LG Gram 17Z990-R.AAS7U1 | |
| Dell Inspiron 17 3780 | |
| Asus VivoBook 17 M712DA-AU017T | |
| Cinebench R15 / CPU Multi 64Bit | |
| Moyenne de la classe Multimedia (856 - 5224, n=68, 2 dernières années) | |
| Acer Swift 3 SF314-42-R4XJ | |
| HP ProBook 445 G7 175W4EA | |
| Dell XPS 15 9500 Core i5 | |
| HP Envy 17t-cg000 | |
| Moyenne Intel Core i7-1065G7 (288 - 836, n=36) | |
| Asus VivoBook 17 M712DA-AU017T | |
| Dell Inspiron 17 3780 | |
| HP Envy 17-ce1004ng | |
| LG Gram 17Z990-R.AAS7U1 | |
| Blender / v2.79 BMW27 CPU | |
| Moyenne Intel Core i7-1065G7 (675 - 1650, n=23) | |
| HP Envy 17t-cg000 | |
| HP ProBook 445 G7 175W4EA | |
| Acer Swift 3 SF314-42-R4XJ | |
| Dell XPS 15 9500 Core i5 | |
| Moyenne de la classe Multimedia (100 - 557, n=65, 2 dernières années) | |
| 7-Zip 18.03 / 7z b 4 -mmt1 | |
| Moyenne de la classe Multimedia (3666 - 7545, n=63, 2 dernières années) | |
| Dell XPS 15 9500 Core i5 | |
| HP Envy 17t-cg000 | |
| HP ProBook 445 G7 175W4EA | |
| Acer Swift 3 SF314-42-R4XJ | |
| Moyenne Intel Core i7-1065G7 (3289 - 4589, n=24) | |
| 7-Zip 18.03 / 7z b 4 | |
| Moyenne de la classe Multimedia (26062 - 130368, n=62, 2 dernières années) | |
| Acer Swift 3 SF314-42-R4XJ | |
| Dell XPS 15 9500 Core i5 | |
| HP ProBook 445 G7 175W4EA | |
| Moyenne Intel Core i7-1065G7 (10406 - 22898, n=24) | |
| HP Envy 17t-cg000 | |
| Geekbench 5.5 / Single-Core | |
| Moyenne de la classe Multimedia (805 - 2974, n=62, 2 dernières années) | |
| HP Envy 17t-cg000 | |
| Moyenne Intel Core i7-1065G7 (948 - 1348, n=18) | |
| Dell XPS 15 9500 Core i5 | |
| Acer Swift 3 SF314-42-R4XJ | |
| HP ProBook 445 G7 175W4EA | |
| Geekbench 5.5 / Multi-Core | |
| Moyenne de la classe Multimedia (4652 - 20422, n=62, 2 dernières années) | |
| Acer Swift 3 SF314-42-R4XJ | |
| HP ProBook 445 G7 175W4EA | |
| Dell XPS 15 9500 Core i5 | |
| Moyenne Intel Core i7-1065G7 (2464 - 4855, n=18) | |
| HP Envy 17t-cg000 | |
| HWBOT x265 Benchmark v2.2 / 4k Preset | |
| Moyenne de la classe Multimedia (5.26 - 36.1, n=63, 2 dernières années) | |
| Acer Swift 3 SF314-42-R4XJ | |
| Dell XPS 15 9500 Core i5 | |
| HP Envy 17t-cg000 | |
| Moyenne Intel Core i7-1065G7 (2.2 - 6.38, n=22) | |
| LibreOffice / 20 Documents To PDF | |
| HP ProBook 445 G7 175W4EA | |
| Dell XPS 15 9500 Core i5 | |
| Moyenne Intel Core i7-1065G7 (46.9 - 85.3, n=19) | |
| Acer Swift 3 SF314-42-R4XJ | |
| HP Envy 17t-cg000 | |
| Moyenne de la classe Multimedia (23.9 - 146.7, n=64, 2 dernières années) | |
| R Benchmark 2.5 / Overall mean | |
| Moyenne Intel Core i7-1065G7 (0.661 - 0.798, n=18) | |
| HP Envy 17t-cg000 | |
| Dell XPS 15 9500 Core i5 | |
| Acer Swift 3 SF314-42-R4XJ | |
| Moyenne de la classe Multimedia (0.3604 - 0.947, n=63, 2 dernières années) | |
* ... Moindre est la valeur, meilleures sont les performances
| PCMark 8 Home Score Accelerated v2 | 3762 points | |
| PCMark 8 Work Score Accelerated v2 | 5267 points | |
| PCMark 10 Score | 4102 points | |
Aide | ||
| DPC Latencies / LatencyMon - interrupt to process latency (max), Web, Youtube, Prime95 | |
| Dell XPS 15 9500 Core i7 4K UHD | |
| Razer Blade Stealth Core i7 GTX 1650 Ti Max-Q 4K | |
| HP Envy 17t-cg000 | |
* ... Moindre est la valeur, meilleures sont les performances
| HP Envy 17t-cg000 WDC PC SN520 SDAPNUW-512G | Medion Akoya P17605 Phison E12-256G-Phison-SSD-B16-BB1 | Asus VivoBook 17 M712DA-AU017T Intel SSD 660p SSDPEKNW512G8 | HP Envy 17-ce1004ng Intel SSD 660p SSDPEKNW512G8 | Dell Inspiron 17 3780 SK Hynix BC501 NVMe 256 GB | LG Gram 17Z990-R.AAS7U1 Samsung SSD PM871b MZNLN256HAJQ | |
|---|---|---|---|---|---|---|
| AS SSD | 38% | -20% | -24% | -33% | -52% | |
| Seq Read (MB/s) | 1161 | 2482 114% | 1592 37% | 1620 40% | 1061 -9% | 454.5 -61% |
| Seq Write (MB/s) | 809 | 1079 33% | 900 11% | 373.7 -54% | 491.4 -39% | 461 -43% |
| 4K Read (MB/s) | 40.63 | 59.3 46% | 45.24 11% | 53.8 32% | 39.13 -4% | 30.18 -26% |
| 4K Write (MB/s) | 138.6 | 194.6 40% | 104.3 -25% | 170.3 23% | 104 -25% | 71 -49% |
| 4K-64 Read (MB/s) | 857 | 1180 38% | 324 -62% | 321.5 -62% | 505 -41% | 369.6 -57% |
| 4K-64 Write (MB/s) | 1041 | 1058 2% | 835 -20% | 715 -31% | 314.8 -70% | 305.5 -71% |
| Access Time Read * (ms) | 0.067 | 0.047 30% | 0.058 13% | 0.081 -21% | 0.063 6% | 0.084 -25% |
| Access Time Write * (ms) | 0.026 | 0.019 27% | 0.047 -81% | 0.046 -77% | 0.034 -31% | 0.05 -92% |
| Score Read (Points) | 1013 | 1488 47% | 528 -48% | 537 -47% | 650 -36% | 445 -56% |
| Score Write (Points) | 1260 | 1361 8% | 1030 -18% | 923 -27% | 468 -63% | 423 -66% |
| Score Total (Points) | 2783 | 3552 28% | 1810 -35% | 1693 -39% | 1434 -48% | 1106 -60% |
| Copy ISO MB/s (MB/s) | 1350 | 876 -35% | 816 -40% | |||
| Copy Program MB/s (MB/s) | 766 | 653 -15% | 614 -20% | |||
| Copy Game MB/s (MB/s) | 1190 | 512 -57% | 414.9 -65% | |||
| CrystalDiskMark 5.2 / 6 | 44% | -12% | -5% | -7% | -36% | |
| Write 4K (MB/s) | 124.2 | 213.2 72% | 132 6% | 134.8 9% | 120.3 -3% | 89.7 -28% |
| Read 4K (MB/s) | 46.11 | 59.2 28% | 52 13% | 54.7 19% | 41.81 -9% | 36.59 -21% |
| Write Seq (MB/s) | 1124 | 973 | 872 | 619 | 422.4 | |
| Read Seq (MB/s) | 1156 | 1606 | 1447 | 1119 | 454.9 | |
| Write 4K Q32T1 (MB/s) | 447 | 588 32% | 210.4 -53% | 392.2 -12% | 492.2 10% | 321.1 -28% |
| Read 4K Q32T1 (MB/s) | 350.1 | 612 75% | 312.2 -11% | 331.6 -5% | 398.8 14% | 340.1 -3% |
| Write Seq Q32T1 (MB/s) | 1463 | 1112 -24% | 982 -33% | 920 -37% | 812 -44% | 509 -65% |
| Read Seq Q32T1 (MB/s) | 1751 | 3121 78% | 1847 5% | 1723 -2% | 1616 -8% | 545 -69% |
| Write 4K Q8T8 (MB/s) | 445.5 | |||||
| Read 4K Q8T8 (MB/s) | 926 | |||||
| Moyenne finale (programmes/paramètres) | 41% /
40% | -16% /
-17% | -15% /
-17% | -20% /
-25% | -44% /
-47% |
* ... Moindre est la valeur, meilleures sont les performances

Disk Throttling: DiskSpd Read Loop, Queue Depth 8
| 3DMark 11 Performance | 5180 points | |
| 3DMark Ice Storm Standard Score | 22597 points | |
| 3DMark Cloud Gate Standard Score | 15382 points | |
| 3DMark Fire Strike Score | 3470 points | |
| 3DMark Fire Strike Extreme Score | 1773 points | |
| 3DMark Time Spy Score | 1293 points | |
Aide | ||
| BioShock Infinite | |
| 1920x1080 Ultra Preset, DX11 (DDOF) | |
| MSI Prestige 15 A10SC | |
| HP Envy 17t-cg000 | |
| Moyenne NVIDIA GeForce MX330 (n=1) | |
| HP Envy 17-ce1004ng | |
| Microsoft Surface Laptop 3 15 i7-1065G7 | |
| 1366x768 High Preset | |
| MSI Prestige 15 A10SC | |
| HP Envy 17-ce1004ng | |
| HP Envy 17t-cg000 | |
| Moyenne NVIDIA GeForce MX330 (n=1) | |
| Microsoft Surface Laptop 3 15 i7-1065G7 | |
| 1366x768 Medium Preset | |
| MSI Prestige 15 A10SC | |
| HP Envy 17-ce1004ng | |
| HP Envy 17t-cg000 | |
| Moyenne NVIDIA GeForce MX330 (n=1) | |
| Microsoft Surface Laptop 3 15 i7-1065G7 | |
| 1280x720 Very Low Preset | |
| MSI Prestige 15 A10SC | |
| HP Envy 17t-cg000 | |
| Moyenne NVIDIA GeForce MX330 (n=1) | |
| HP Envy 17-ce1004ng | |
| Microsoft Surface Laptop 3 15 i7-1065G7 | |
| Bas | Moyen | Élevé | Ultra | 4K | |
|---|---|---|---|---|---|
| BioShock Infinite (2013) | 173.9 | 113.8 | 96 | 37.9 | |
| The Witcher 3 (2015) | 17 | ||||
| Dota 2 Reborn (2015) | 110 | 104 | 73.2 | 65.3 | 25.4 |
| X-Plane 11.11 (2018) | 71 | 56.5 | 51.3 | 23.9 | |
| Shadow of the Tomb Raider (2018) | 42 | 17 | 10 | 8 | |
| F1 2019 (2019) | 73 | 31 | 24 | 19 |
| HP Envy 17t-cg000 GeForce MX330, i7-1065G7, WDC PC SN520 SDAPNUW-512G | Medion Akoya P17605 GeForce MX250, i7-10510U, Phison E12-256G-Phison-SSD-B16-BB1 | Asus VivoBook 17 M712DA-AU017T Vega 8, R5 3500U, Intel SSD 660p SSDPEKNW512G8 | HP Envy 17-ce1004ng GeForce MX250, i7-10510U, Intel SSD 660p SSDPEKNW512G8 | Dell Inspiron 17 3780 Radeon 520, i7-8565U, SK Hynix BC501 NVMe 256 GB | LG Gram 17Z990-R.AAS7U1 UHD Graphics 620, i7-8565U, Samsung SSD PM871b MZNLN256HAJQ | |
|---|---|---|---|---|---|---|
| Noise | -2% | 4% | 2% | -5% | 7% | |
| arrêt / environnement * (dB) | 28.2 | 30.3 -7% | 30.3 -7% | 30 -6% | 28.1 -0% | 28.1 -0% |
| Idle Minimum * (dB) | 28.2 | 32.4 -15% | 30.3 -7% | 30 -6% | 31.7 -12% | 28.1 -0% |
| Idle Average * (dB) | 28.2 | 32.4 -15% | 30.3 -7% | 30 -6% | 31.8 -13% | 28.1 -0% |
| Idle Maximum * (dB) | 29.5 | 32.7 -11% | 30.3 -3% | 30 -2% | 31.8 -8% | 28.1 5% |
| Load Average * (dB) | 43.9 | 36.4 17% | 31.6 28% | 36.4 17% | 38.7 12% | 35 20% |
| Witcher 3 ultra * (dB) | 43.9 | |||||
| Load Maximum * (dB) | 43.9 | 36 18% | 35.7 19% | 36.5 17% | 48.5 -10% | 37.4 15% |
* ... Moindre est la valeur, meilleures sont les performances
Degré de la nuisance sonore
| Au repos |
| 28.2 / 28.2 / 29.5 dB(A) |
| Fortement sollicité |
| 43.9 / 43.9 dB(A) |
 | ||
30 dB silencieux 40 dB(A) audible 50 dB(A) bruyant |
||
min: | ||
(±) La température maximale du côté supérieur est de 42 °C / 108 F, par rapport à la moyenne de 36.8 °C / 98 F, allant de 21 à 71 °C pour la classe Multimedia.
(±) Le fond chauffe jusqu'à un maximum de 44.2 °C / 112 F, contre une moyenne de 39.1 °C / 102 F
(+) En utilisation inactive, la température moyenne du côté supérieur est de 29.3 °C / 85 F, par rapport à la moyenne du dispositif de 31.3 °C / 88 F.
(±) En jouant à The Witcher 3, la température moyenne du côté supérieur est de 32.2 °C / 90 F, alors que la moyenne de l'appareil est de 31.3 °C / 88 F.
(+) Les repose-poignets et le pavé tactile sont plus froids que la température de la peau avec un maximum de 28 °C / 82.4 F et sont donc froids au toucher.
(±) La température moyenne de la zone de l'appui-paume de dispositifs similaires était de 28.7 °C / 83.7 F (+0.7 °C / #1.3 F).
| Éteint/en veille | |
| Au repos | |
| Fortement sollicité |
|
Légende:
min: | |
| HP Envy 17t-cg000 i7-1065G7, GeForce MX330, WDC PC SN520 SDAPNUW-512G, IPS, 3840x2160, 17.3" | Medion Akoya P17605 i7-10510U, GeForce MX250, Phison E12-256G-Phison-SSD-B16-BB1, IPS, 1920x1080, 17.3" | Asus VivoBook 17 M712DA-AU017T R5 3500U, Vega 8, Intel SSD 660p SSDPEKNW512G8, IPS, 1920x1080, 17.3" | HP Envy 17-ce1004ng i7-10510U, GeForce MX250, Intel SSD 660p SSDPEKNW512G8, IPS, 1920x1080, 17.3" | Dell Inspiron 17 3780 i7-8565U, Radeon 520, SK Hynix BC501 NVMe 256 GB, IPS, 1920x1080, 17.3" | LG Gram 17Z990-R.AAS7U1 i7-8565U, UHD Graphics 620, Samsung SSD PM871b MZNLN256HAJQ, IPS, 2560x1600, 17" | |
|---|---|---|---|---|---|---|
| Power Consumption | 24% | 43% | 33% | 22% | 47% | |
| Idle Minimum * (Watt) | 6.1 | 4.2 31% | 4.2 31% | 3.6 41% | 5 18% | 2.7 56% |
| Idle Average * (Watt) | 13 | 9.9 24% | 7.9 39% | 8.5 35% | 10.9 16% | 8.1 38% |
| Idle Maximum * (Watt) | 13.5 | 11.6 14% | 8.4 38% | 10.4 23% | 12 11% | 10.2 24% |
| Load Average * (Watt) | 72.7 | 60 17% | 34 53% | 52.6 28% | 49.6 32% | 32.7 55% |
| Witcher 3 ultra * (Watt) | 62.2 | |||||
| Load Maximum * (Watt) | 97.1 | 64.1 34% | 43.7 55% | 61 37% | 66.9 31% | 34.8 64% |
* ... Moindre est la valeur, meilleures sont les performances
| HP Envy 17t-cg000 i7-1065G7, GeForce MX330, 55 Wh | Medion Akoya P17605 i7-10510U, GeForce MX250, 42.2 Wh | Asus VivoBook 17 M712DA-AU017T R5 3500U, Vega 8, 37 Wh | HP Envy 17-ce1004ng i7-10510U, GeForce MX250, 52 Wh | Dell Inspiron 17 3780 i7-8565U, Radeon 520, 42 Wh | LG Gram 17Z990-R.AAS7U1 i7-8565U, UHD Graphics 620, 72 Wh | |
|---|---|---|---|---|---|---|
| Autonomie de la batterie | 2% | -28% | 11% | -23% | 107% | |
| Reader / Idle (h) | 15.4 | 17 10% | 9.6 -38% | 34.8 126% | ||
| WiFi v1.3 (h) | 4.6 | 4.7 2% | 3.3 -28% | 4 -13% | 4.2 -9% | 11.9 159% |
| Load (h) | 1.4 | 1.9 36% | 1.1 -21% | 1.9 36% |
Points positifs
Points négatifs
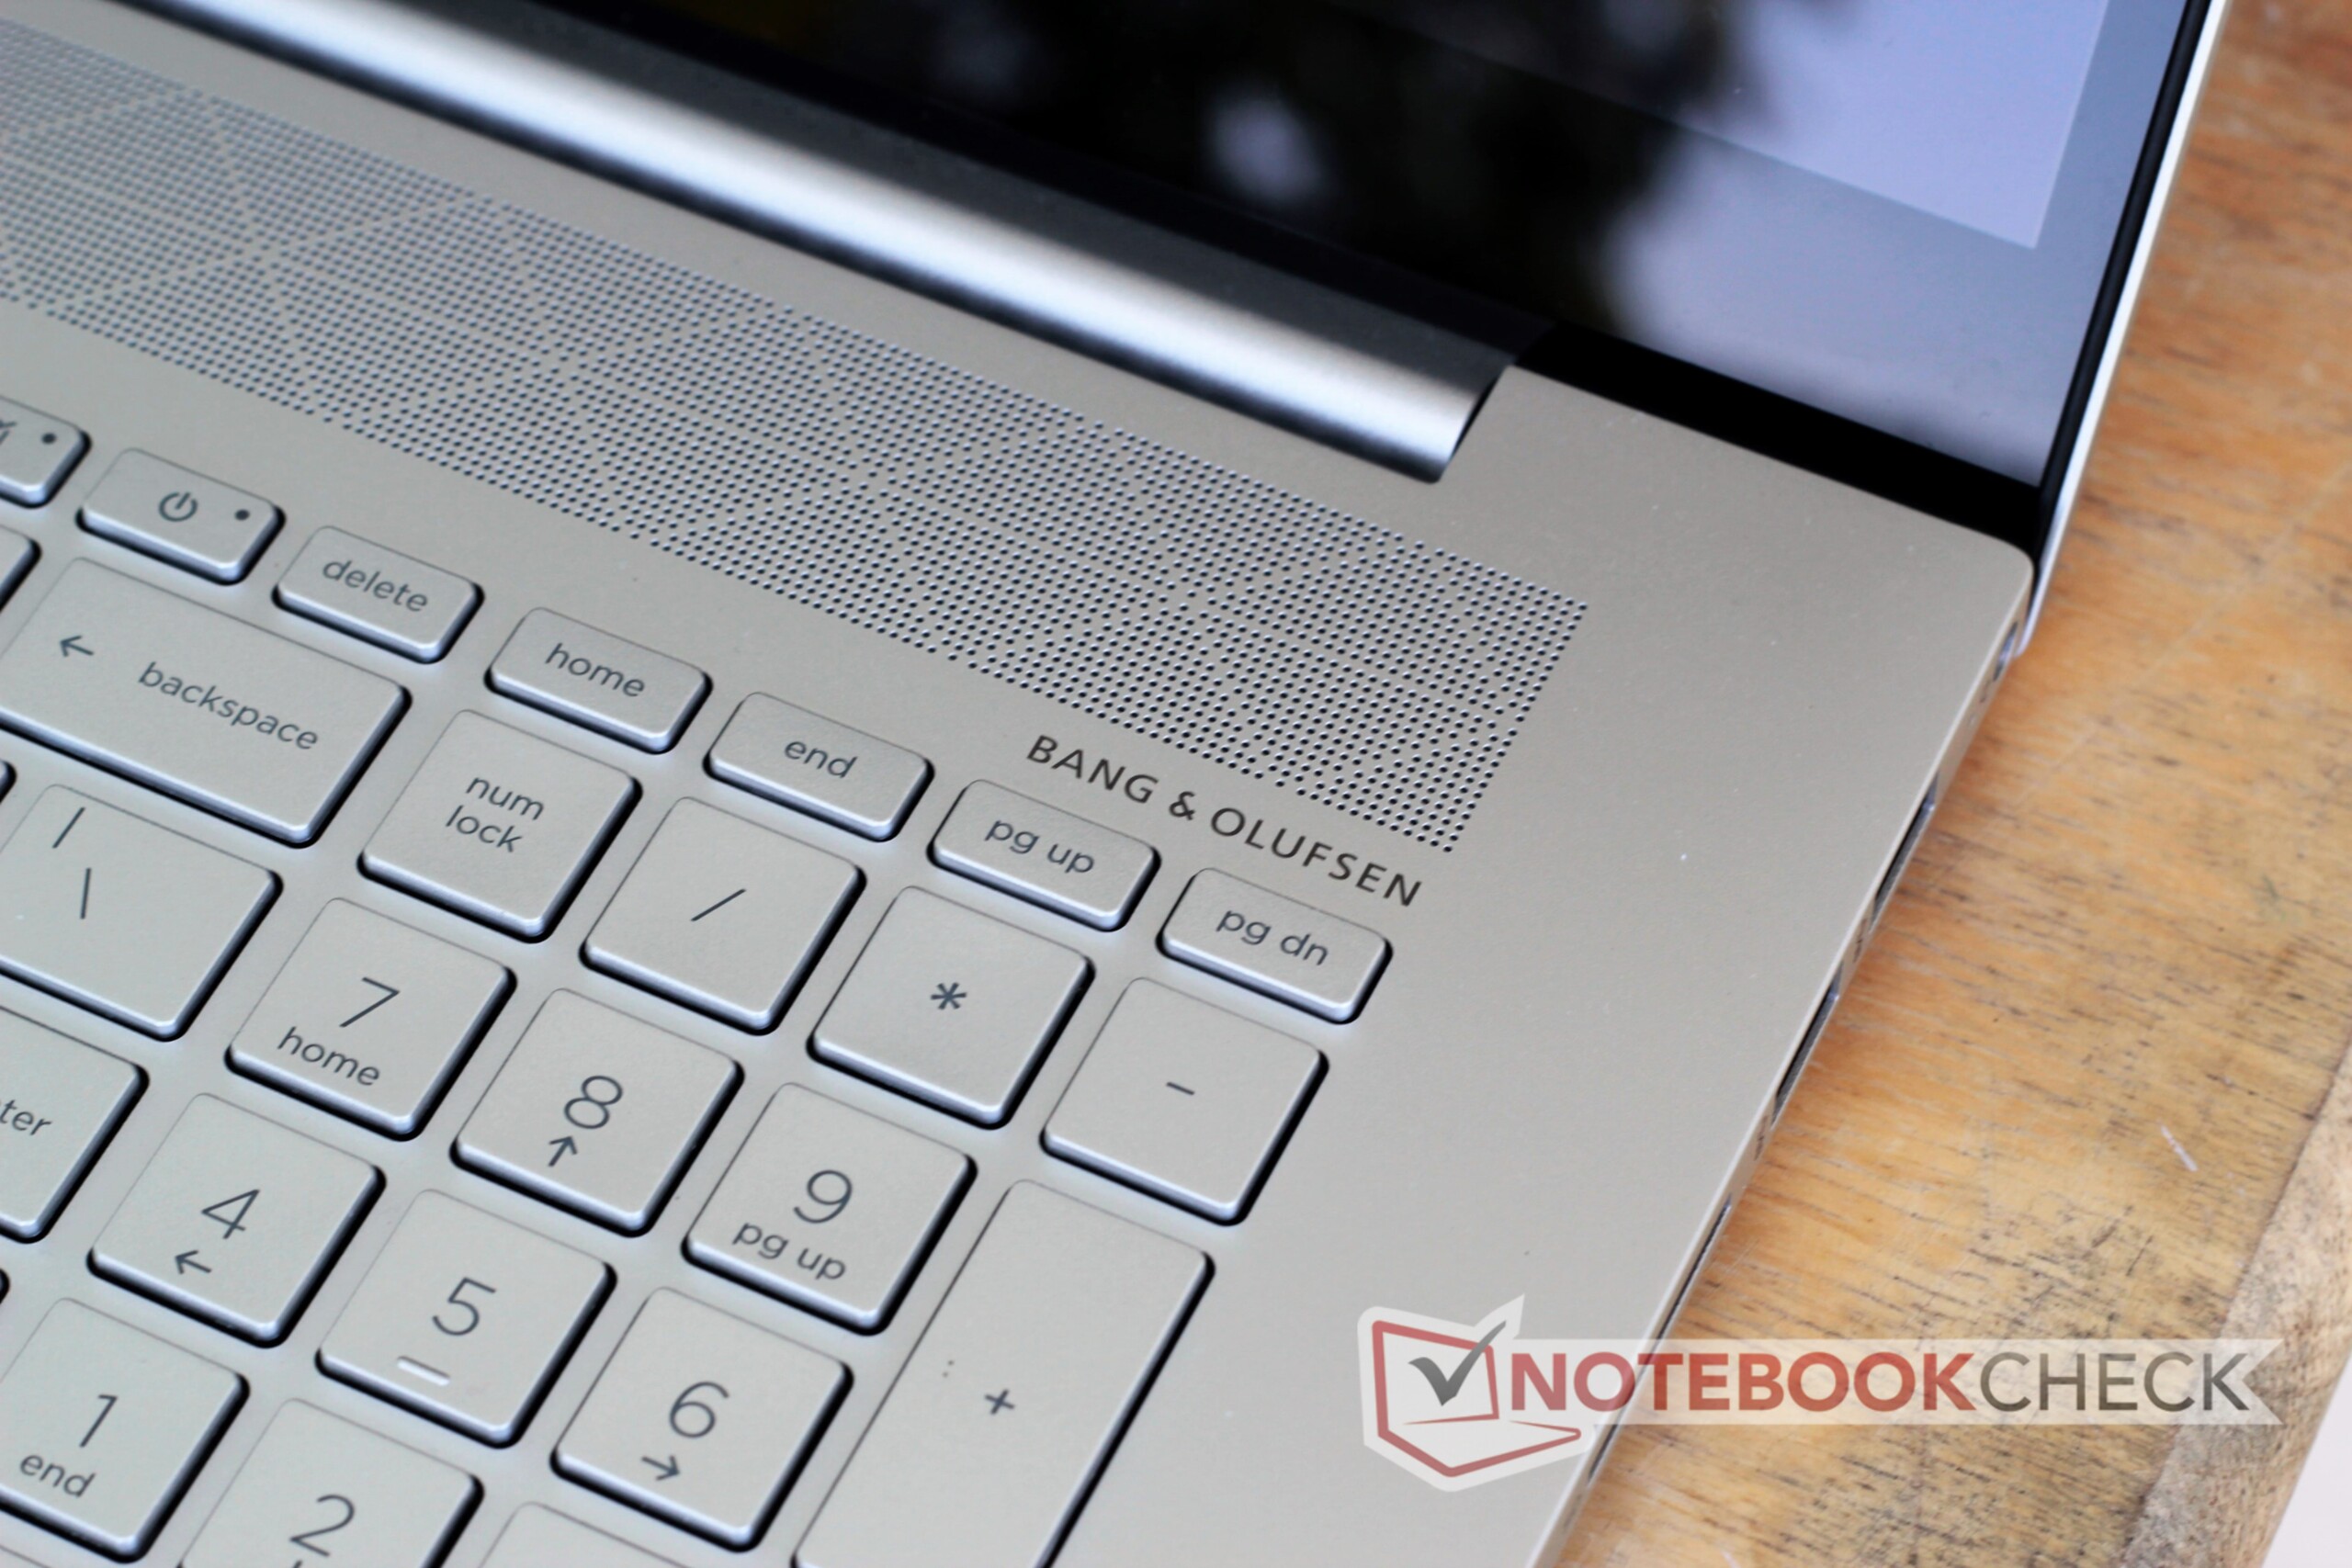
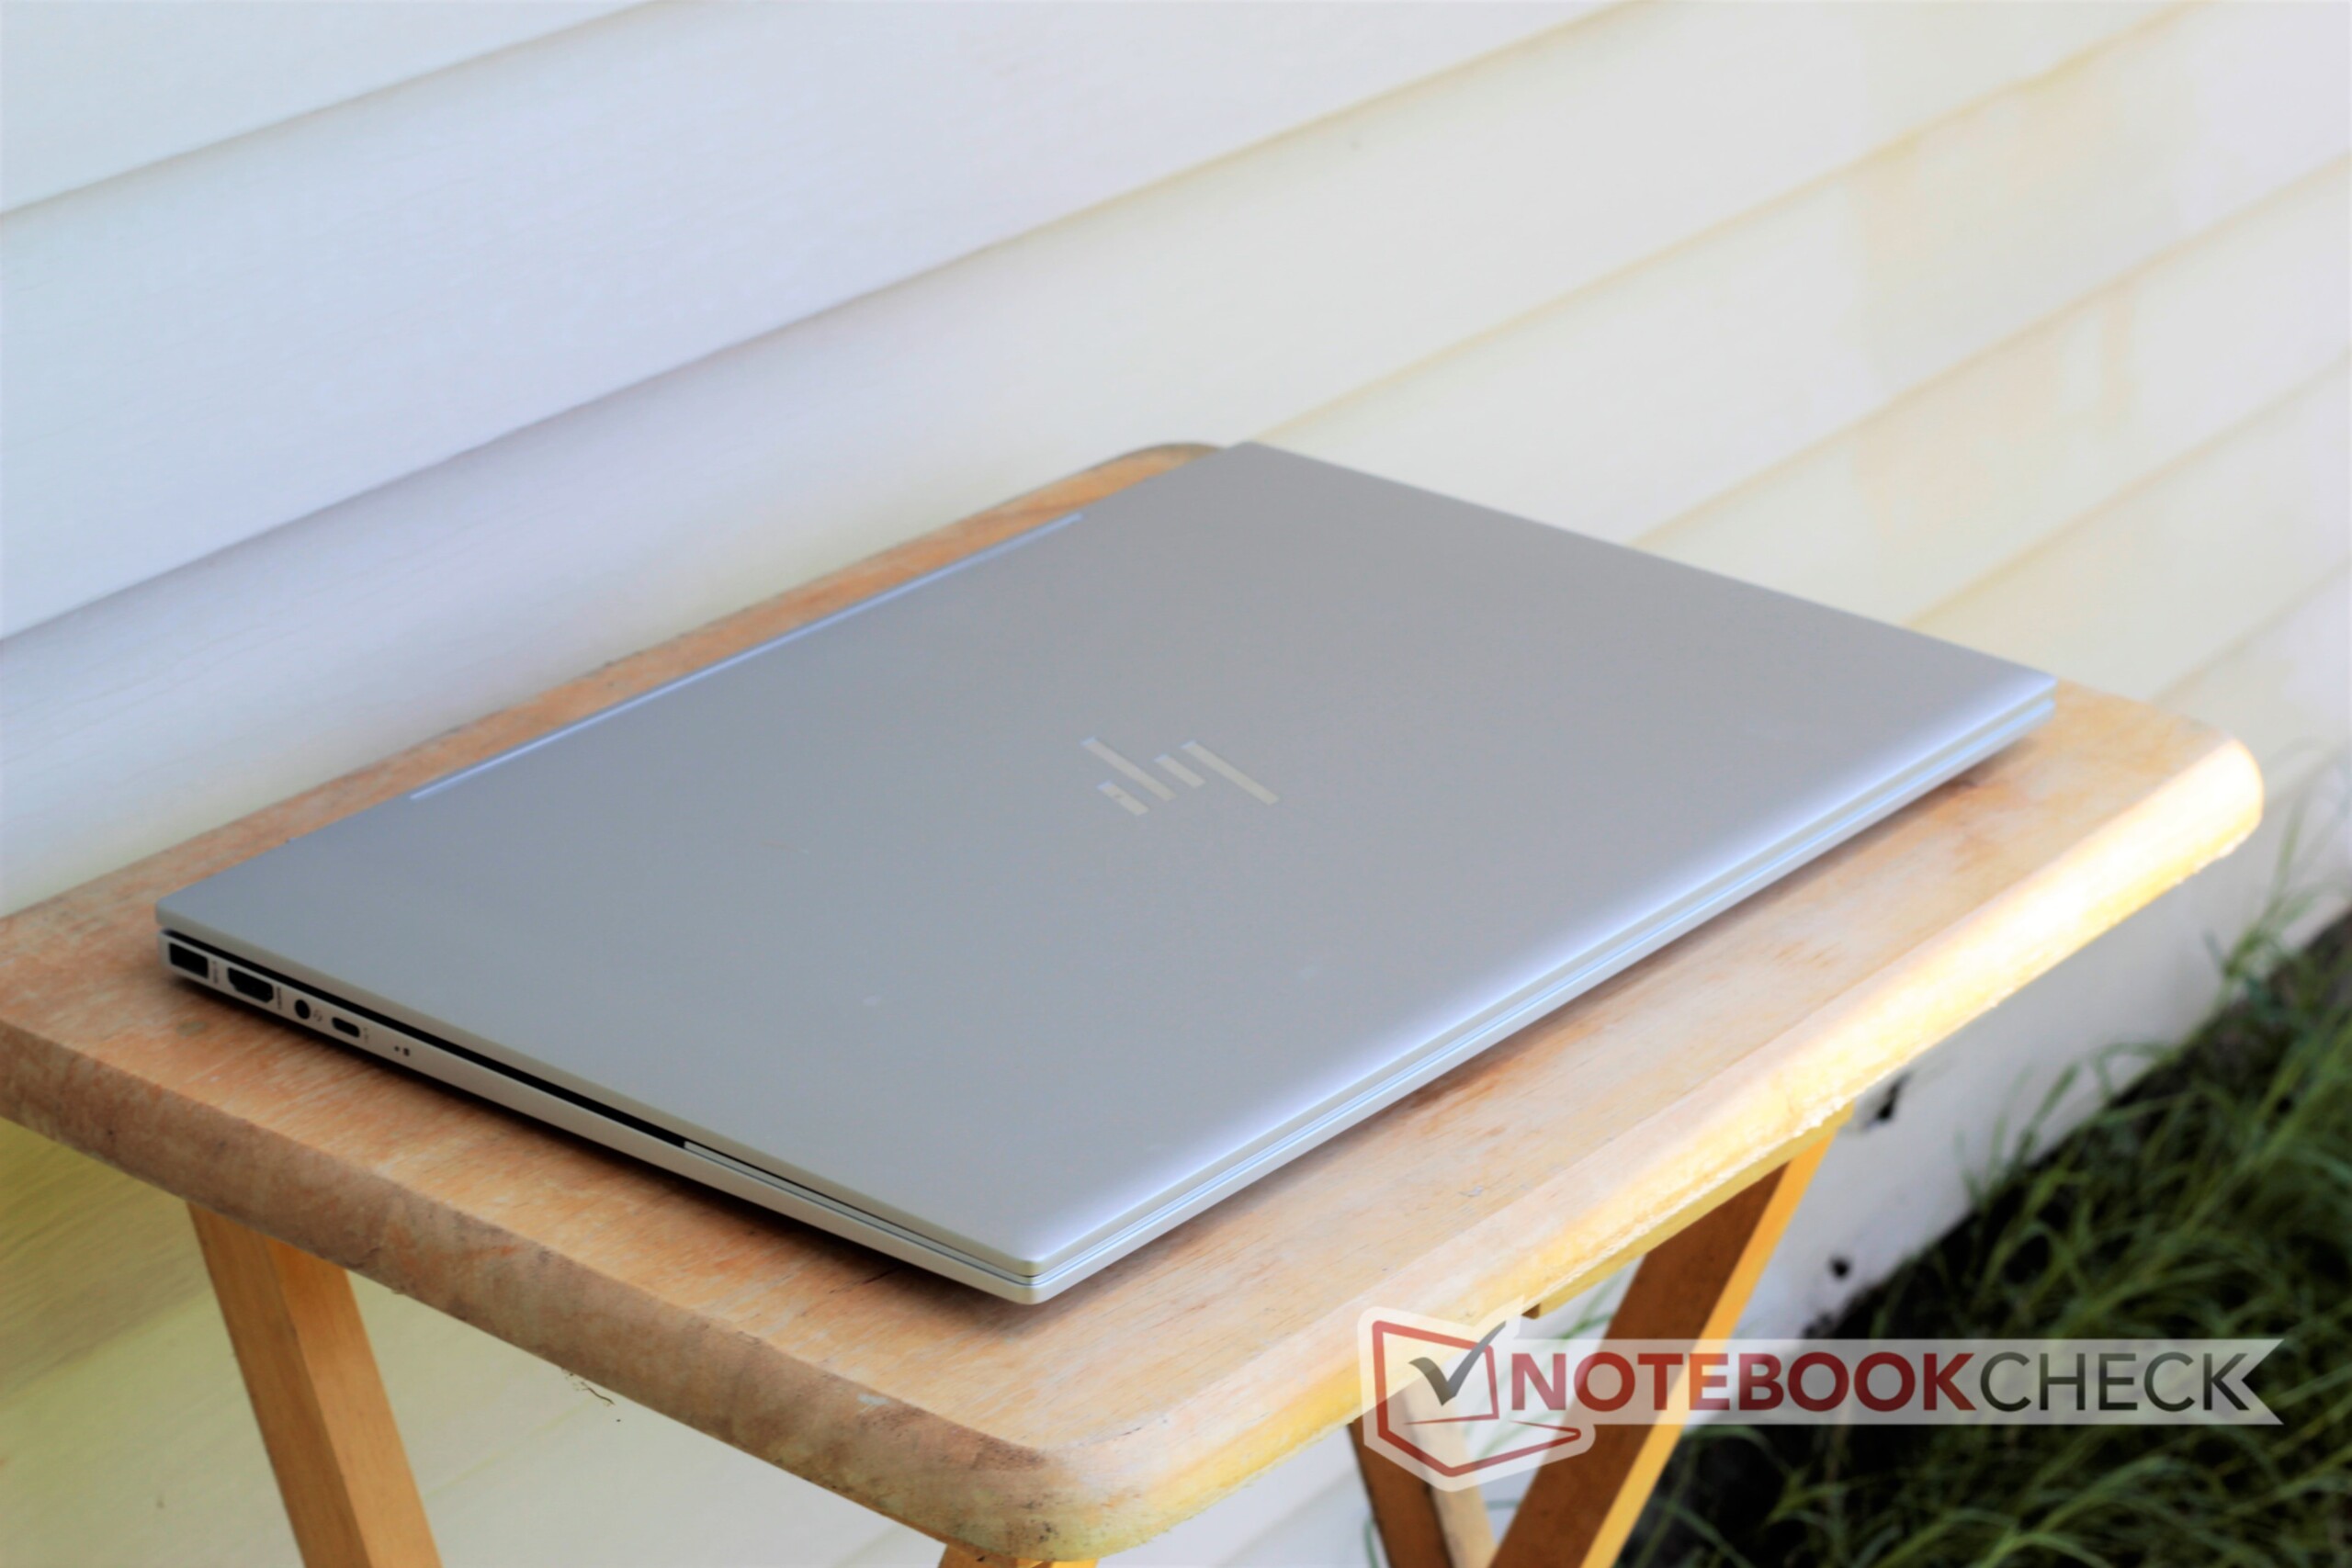
Avec le Envy 17t, HP marque des points. Son châssis en aluminium est bien construit et a belle allure. La finition anodisée devrait le garder élégant un moment. L'écran 4K lumineux est excellent, et ses couleurs fidèles. Le processeur Core i7 Ice Lake et la carte graphique MX330 permettent une utilisation média sans heurts, et peuvent gérer un peu de jeu. Le clavier et le touchpad sont bons, les haut-parleurs puissants, et l'expérience globale agréable... de façon globale.
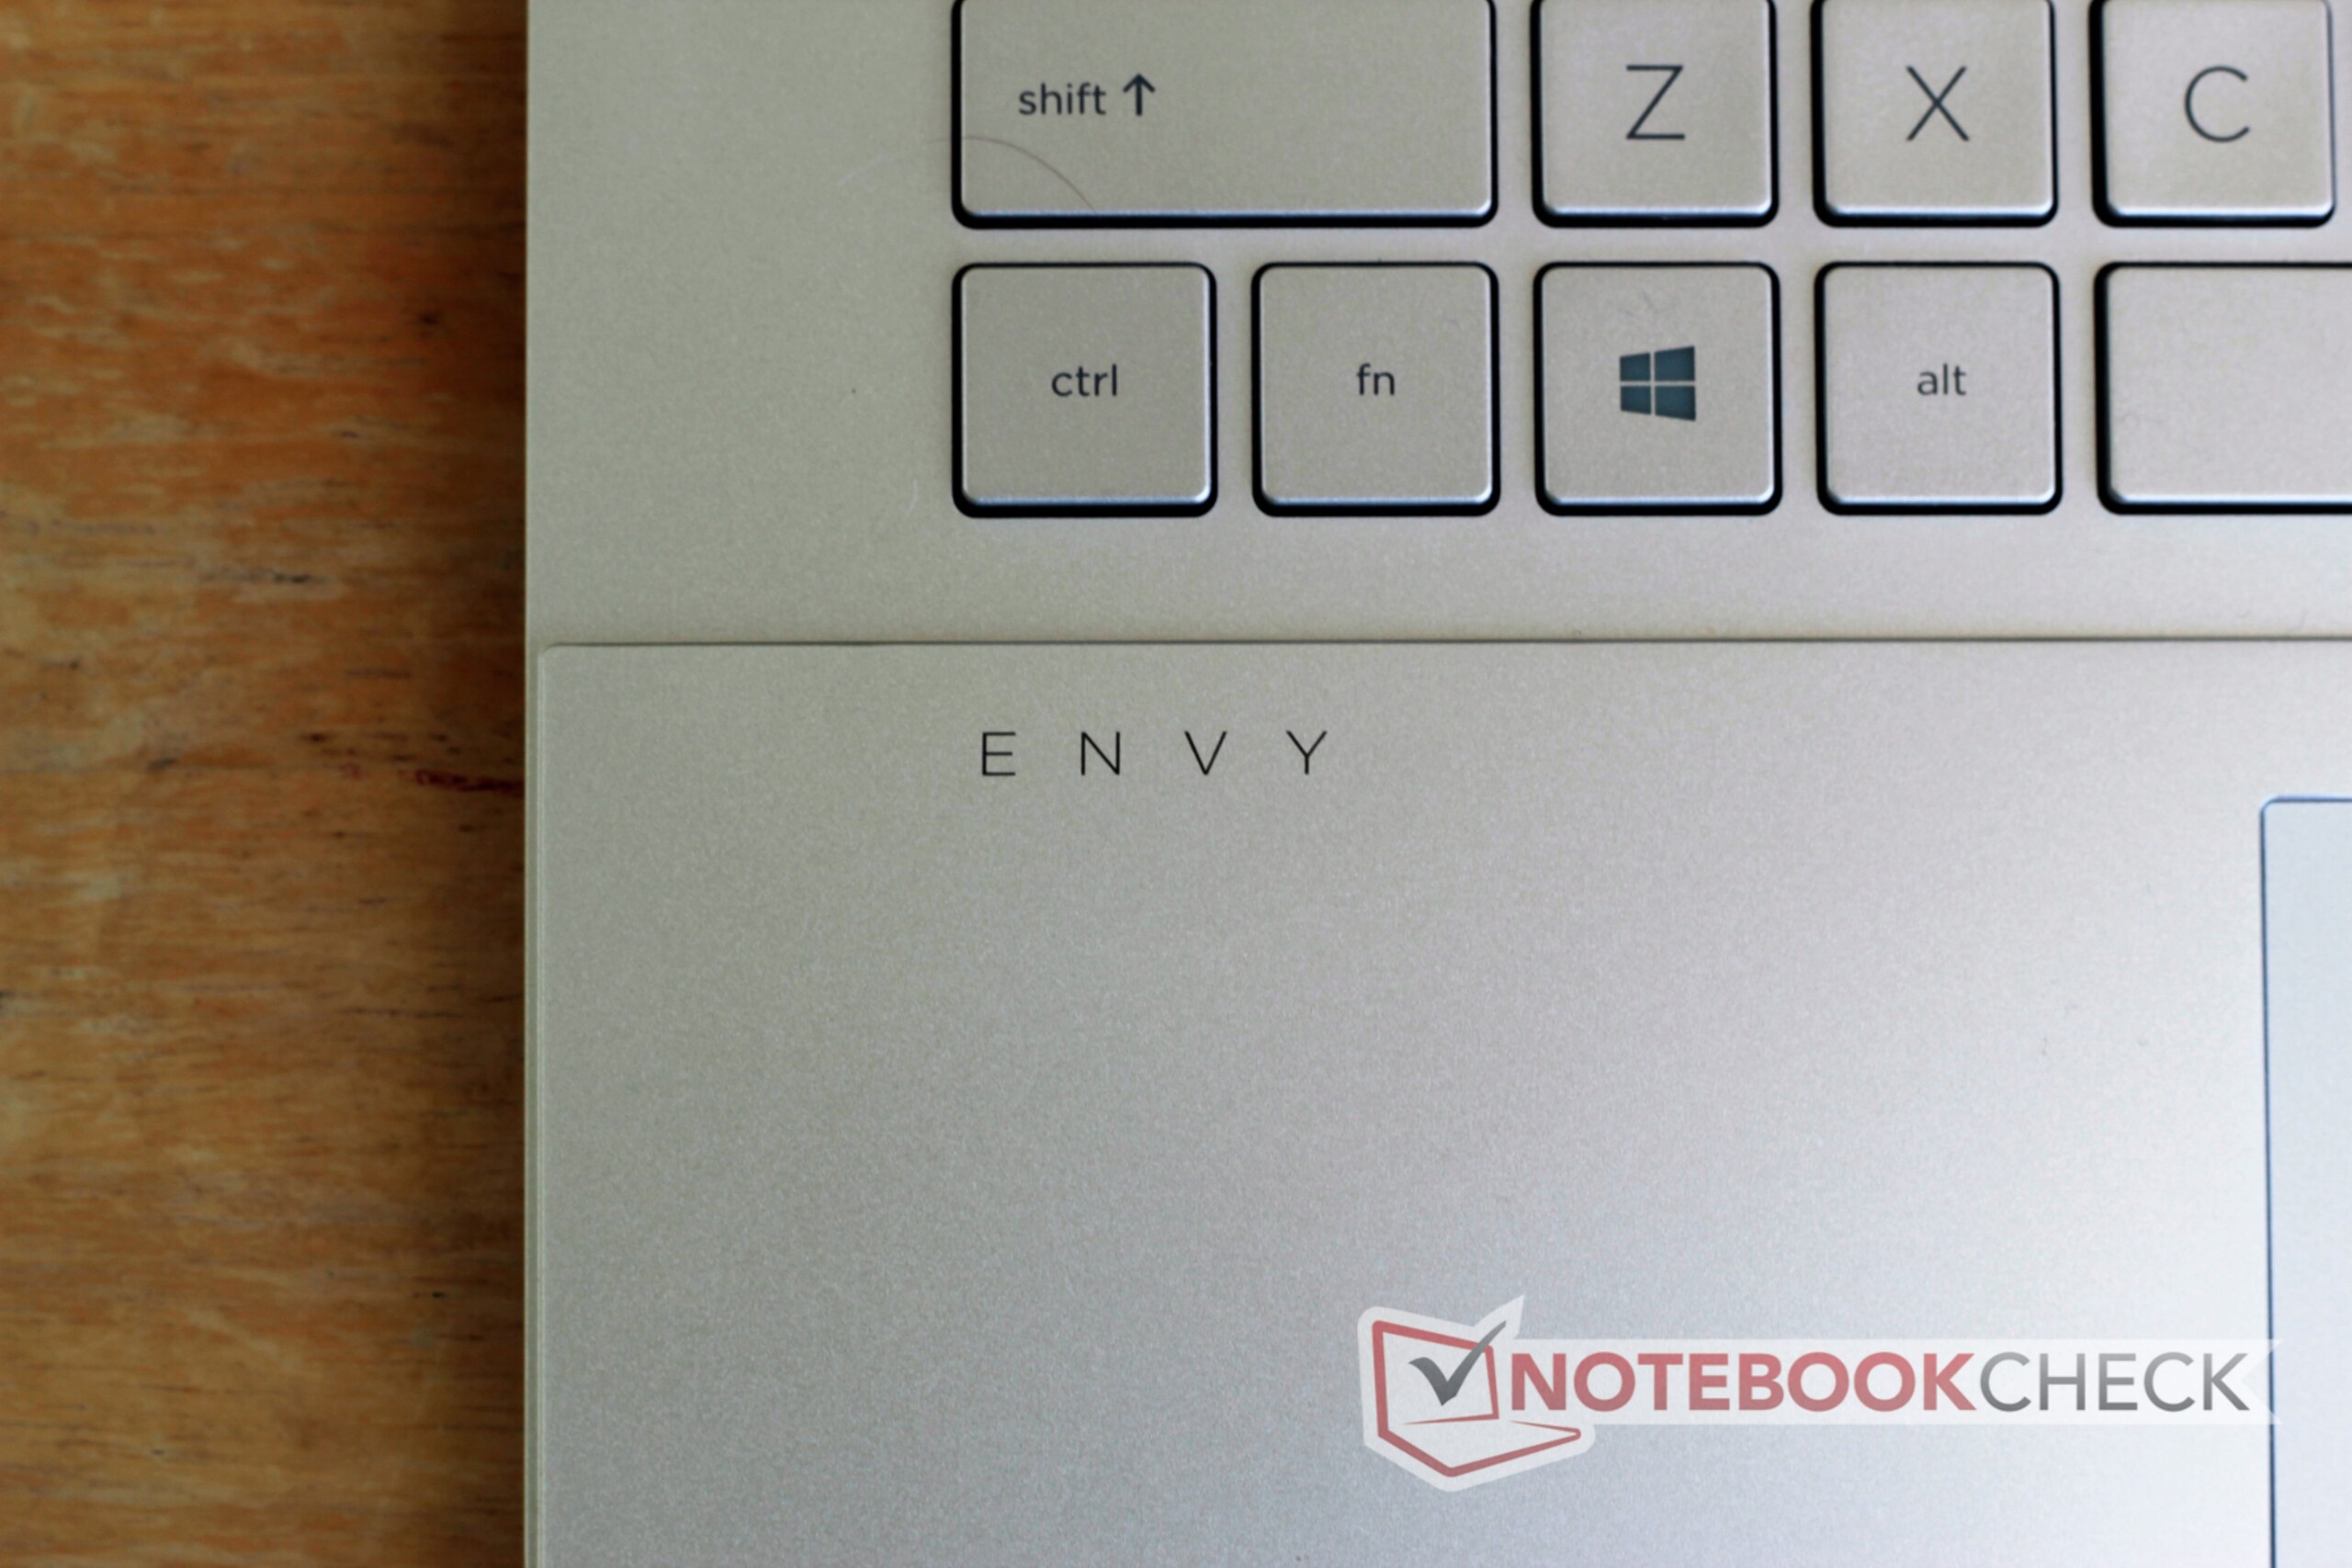
Plusieurs petits défauts viennent gâcher cette bonne expérience. D'abord, le remplacement du bouton Ctrl de droite par un lecteur d'empreintes est déstabilisant - vu le nombre de combinaisons qui utilisent cette touche, on peut se demander comment HP a pu penser que c'était une bonne idée de la faire disparaître... Ensuite, le ventilateur, s'il est silencieux en cas de faibles sollicitations, devient bruyant quand l'appareil est plus sollicité. Enfin, l'autonomie est décevante.
L'Envy 17t est plutôt bon pour ce qu'il est, mais à 1 600 $ les défauts notés sont vraiment gênants. Malgré ces défauts, l'Envy 17t est l'un des meilleurs 17,3 pouces multimédia actuellement disponibles. Mais il faut avouer qu'il y a mieux. Le convertible Inspiron 17-7786 de Dell possède des composants similaires, mais pour un prix légèrement inférieur. Le HP Pavilion Gaming 17 n'a pas la qualité de construction du Envy 17t, mais possède un GPU bien plus puissant et un processeur plus rapide, pour environ 300 $ de moins.
Le HP Envy 17t est un PC portable multimédia solide gâché par quelques défauts qui viennent ternir l'expérience globale.
L’intégralité de cette critique est disponible en anglais en suivant ce lien.
HP Envy 17t-cg000
- 06/10/2020 v7 (old)
Sam Medley
Price comparison
