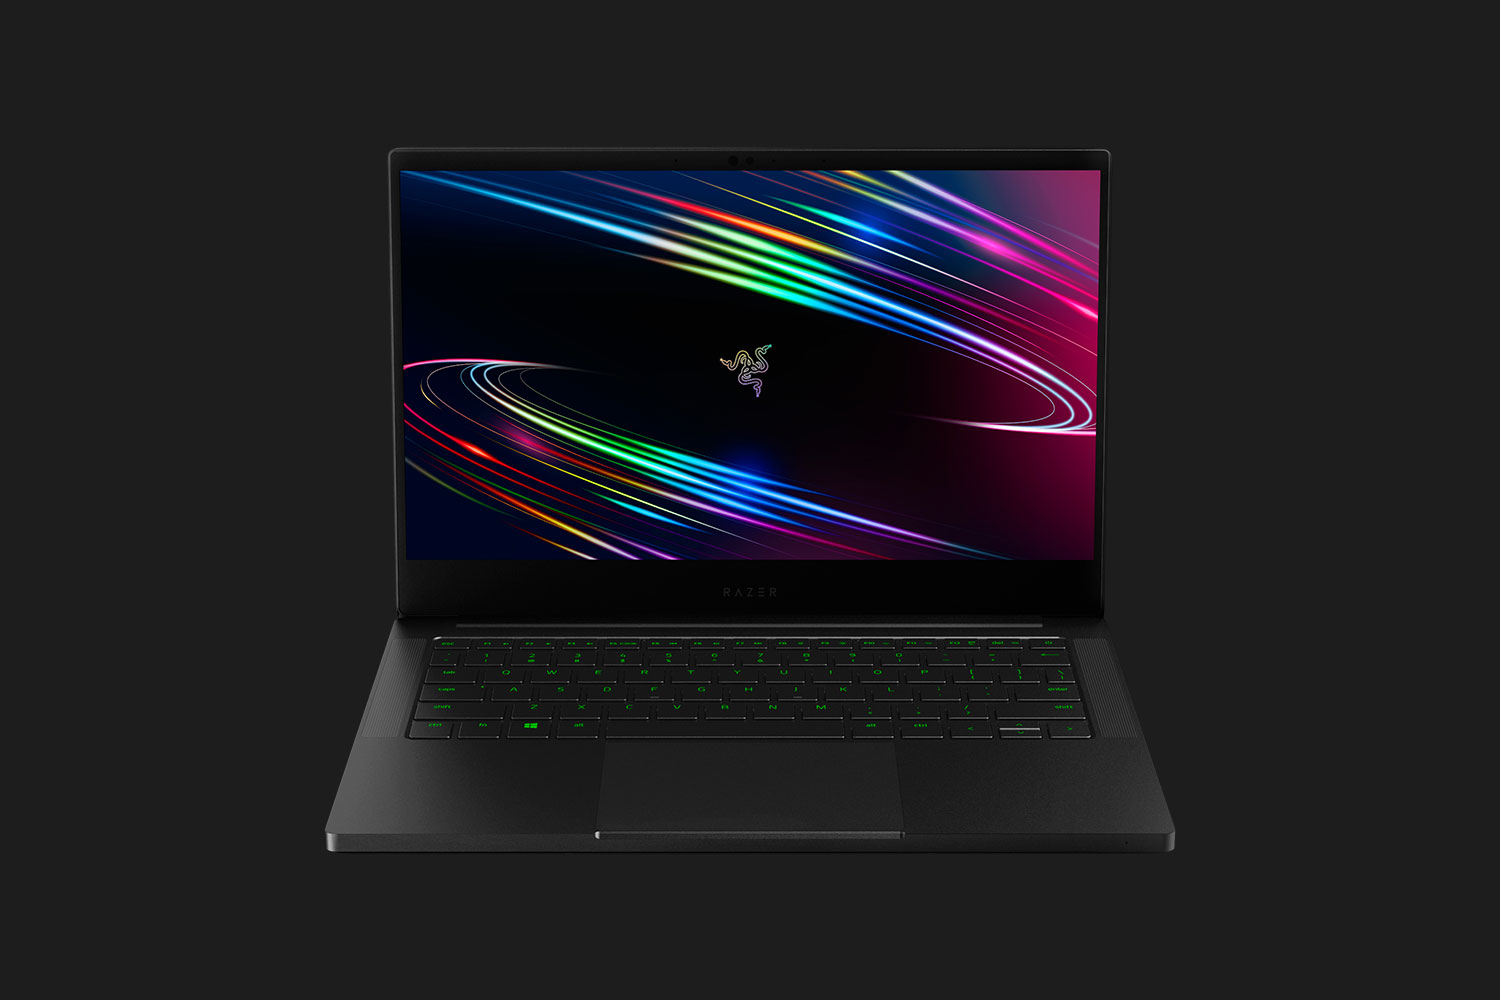
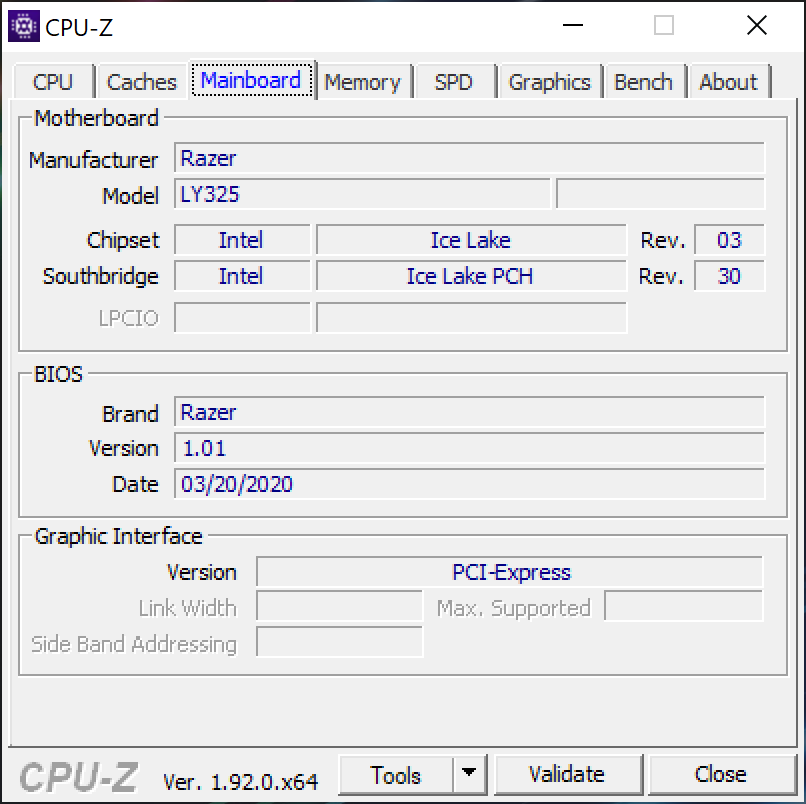
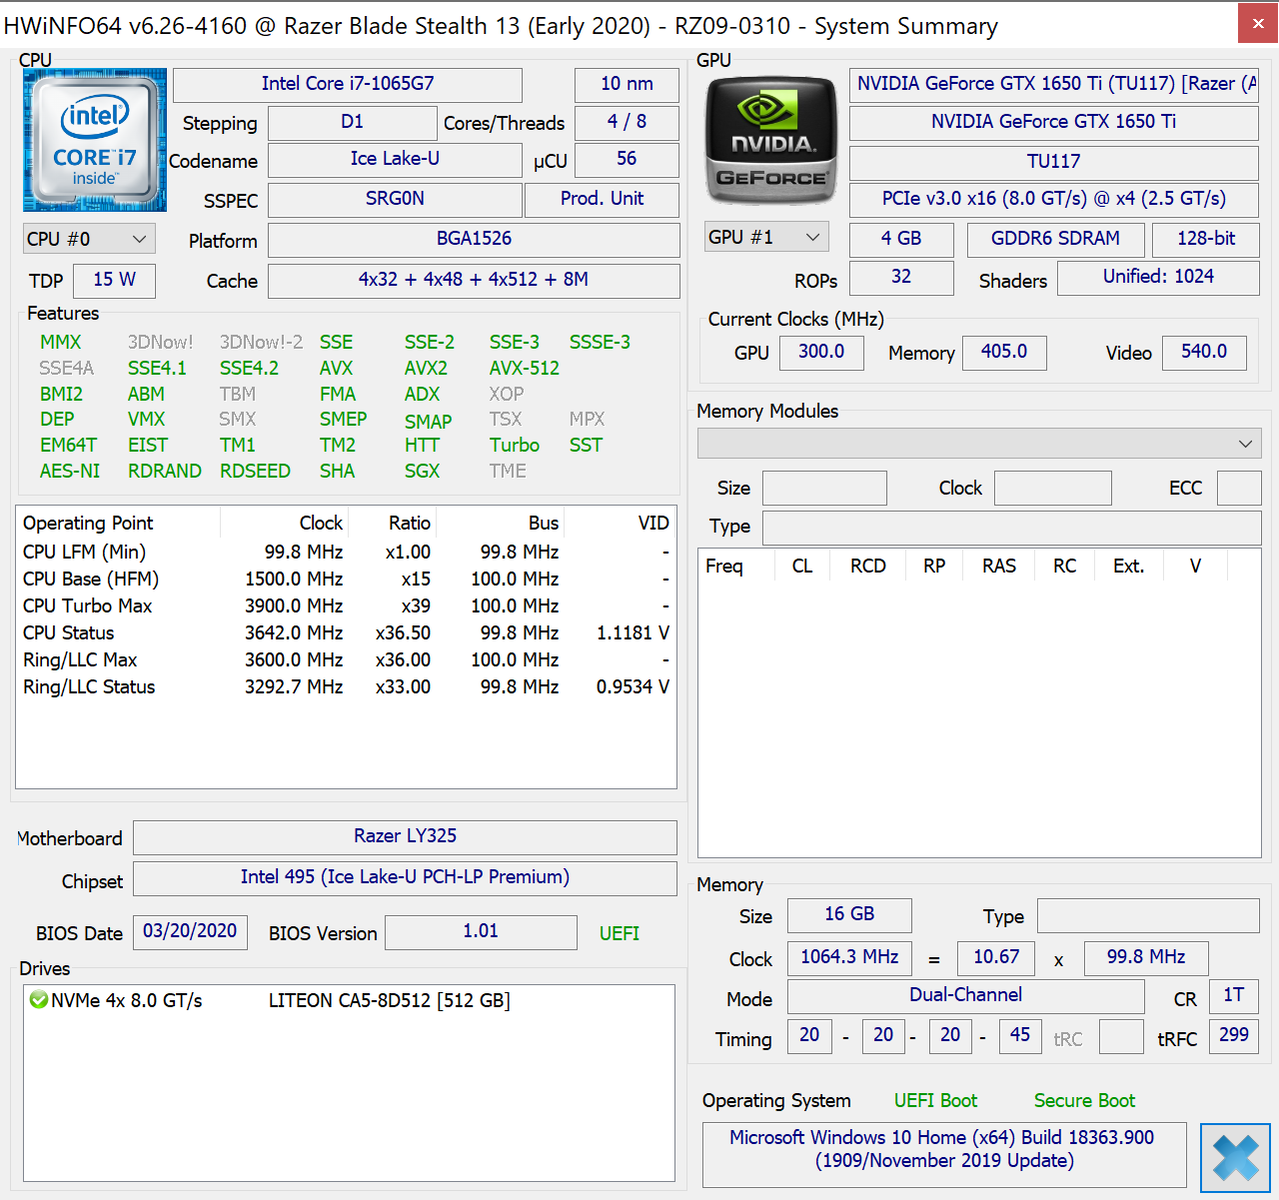
Test du Razer Blade Stealth 2020 (i7-1065G7, GTX 1650 Ti Max-Q, 4K UHD) : la version 2019 en mieux
Note | Date | Modèle | Poids | Épaisseur | Taille | Résolution | Prix |
|---|---|---|---|---|---|---|---|
| 84.8 % v7 (old) | 07/20 | Razer Blade Stealth Core i7 GTX 1650 Ti Max-Q 4K i7-1065G7, GeForce GTX 1650 Ti Max-Q | 1.5 kg | 15.3 mm | 13.30" | 3840x2160 | |
| 88 % v7 (old) | 06/20 | Dell XPS 13 9300 4K UHD i7-1065G7, Iris Plus Graphics G7 (Ice Lake 64 EU) | 1.2 kg | 14.8 mm | 13.40" | 3840x2400 | |
| 88.4 % v7 (old) | 01/20 | HP Spectre x360 13-aw0013dx i7-1065G7, Iris Plus Graphics G7 (Ice Lake 64 EU) | 1.2 kg | 16.9 mm | 13.30" | 1920x1080 | |
| 86.6 % v6 (old) | 05/19 | Asus ZenBook S13 UX392FN i7-8565U, GeForce MX150 | 1.1 kg | 12.9 mm | 13.90" | 1920x1080 | |
| 85 % v6 (old) | 09/19 | Lenovo IdeaPad S940-14IWL i7-8565U, UHD Graphics 620 | 1.2 kg | 12 mm | 14.00" | 3840x2160 | |
| 84.2 % v7 (old) | 03/20 | MSI Prestige 14 A10SC-009 i7-10710U, GeForce GTX 1650 Max-Q | 1.3 kg | 16 mm | 14.00" | 3840x2160 |


| |||||||||||||||||||||||||
Homogénéité de la luminosité: 92 %
Valeur mesurée au centre, sur batterie: 467 cd/m²
Contraste: 1197:1 (Valeurs des noirs: 0.39 cd/m²)
ΔE ColorChecker Calman: 2.1 | ∀{0.5-29.43 Ø4.72}
calibrated: 2.04
ΔE Greyscale Calman: 1.3 | ∀{0.09-98 Ø4.97}
93.4% sRGB (Argyll 1.6.3 3D)
59.5% AdobeRGB 1998 (Argyll 1.6.3 3D)
64.5% AdobeRGB 1998 (Argyll 3D)
93.7% sRGB (Argyll 3D)
63.7% Display P3 (Argyll 3D)
Gamma: 2.26
CCT: 6501 K
| Razer Blade Stealth Core i7 GTX 1650 Ti Max-Q 4K AUO272B, IPS, 13.3", 3840x2160 | Dell XPS 13 9300 4K UHD Sharp LQ134R1, IPS, 13.4", 3840x2400 | HP Spectre x360 13-aw0013dx AU Optronics AUO5E2D, IPS, 13.3", 1920x1080 | MSI Prestige 14 A10SC-009 IPS, 14", 3840x2160 | Razer Blade Stealth i7-8565U Sharp LQ133M1JW41, IPS, 13.3", 1920x1080 | Razer Blade Stealth 13, Core i7-1065G7 AUO202B, IPS LED, 13.3", 3840x2160 | |
|---|---|---|---|---|---|---|
| Display | 1% | 9% | 3% | 2% | ||
| Display P3 Coverage (%) | 63.7 | 64.5 1% | 69.6 9% | 65.5 3% | 64.3 1% | |
| sRGB Coverage (%) | 93.7 | 91.4 -2% | 98.9 6% | 96.3 3% | 95.8 2% | |
| AdobeRGB 1998 Coverage (%) | 64.5 | 66.6 3% | 71.5 11% | 66.3 3% | 65.7 2% | |
| Response Times | 30% | -3% | 4% | 5% | -7% | |
| Response Time Grey 50% / Grey 80% * (ms) | 57.6 ? | 41.6 ? 28% | 60.8 ? -6% | 55 ? 5% | 57.6 ? -0% | 62 ? -8% |
| Response Time Black / White * (ms) | 37.2 ? | 25.6 ? 31% | 36.8 ? 1% | 36 ? 3% | 34 ? 9% | 39 ? -5% |
| PWM Frequency (Hz) | 22730 ? | |||||
| Screen | -22% | -44% | 8% | 12% | -38% | |
| Brightness middle (cd/m²) | 467 | 414 -11% | 447.4 -4% | 567 21% | 429.8 -8% | 353 -24% |
| Brightness (cd/m²) | 448 | 401 -10% | 420 -6% | 516 15% | 403 -10% | 335 -25% |
| Brightness Distribution (%) | 92 | 94 2% | 85 -8% | 86 -7% | 89 -3% | 90 -2% |
| Black Level * (cd/m²) | 0.39 | 0.28 28% | 0.31 21% | 0.445 -14% | 0.32 18% | 0.25 36% |
| Contrast (:1) | 1197 | 1479 24% | 1443 21% | 1274 6% | 1343 12% | 1412 18% |
| Colorchecker dE 2000 * | 2.1 | 3.06 -46% | 4.23 -101% | 1.55 26% | 1.08 49% | 4.4 -110% |
| Colorchecker dE 2000 max. * | 5.1 | 6.5 -27% | 9.34 -83% | 5.14 -1% | 3.96 22% | 7.21 -41% |
| Colorchecker dE 2000 calibrated * | 2.04 | 3.5 -72% | 1.32 35% | 1.24 39% | 1.21 41% | 1.1 46% |
| Greyscale dE 2000 * | 1.3 | 3 -131% | 6.1 -369% | 1.48 -14% | 1.3 -0% | 5.49 -322% |
| Gamma | 2.26 97% | 2.42 91% | 2.11 104% | 2.19 100% | 2.23 99% | 2.26 97% |
| CCT | 6501 100% | 6840 95% | 6136 106% | 6741 96% | 6452 101% | 7689 85% |
| Color Space (Percent of AdobeRGB 1998) (%) | 59.5 | 61.1 3% | 64.8 9% | 61.4 3% | 61 3% | |
| Color Space (Percent of sRGB) (%) | 93.4 | 91.4 -2% | 98.9 6% | 96.3 3% | 96 3% | |
| Moyenne finale (programmes/paramètres) | 3% /
-11% | -13% /
-29% | 6% /
7% | 7% /
9% | -14% /
-27% |
* ... Moindre est la valeur, meilleures sont les performances
Temps de réponse de l'écran
| ↔ Temps de réponse noir à blanc | ||
|---|---|---|
| 37.2 ms ... hausse ↗ et chute ↘ combinées | ↗ 21.2 ms hausse | 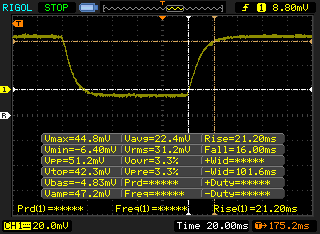 |
| ↘ 16 ms chute | ||
| L'écran souffre de latences très élevées, à éviter pour le jeu. En comparaison, tous les appareils testés affichent entre 0.1 (minimum) et 240 (maximum) ms. » 95 % des appareils testés affichent de meilleures performances. Cela signifie que les latences relevées sont moins bonnes que la moyenne (19.8 ms) de tous les appareils testés. | ||
| ↔ Temps de réponse gris 50% à gris 80% | ||
| 57.6 ms ... hausse ↗ et chute ↘ combinées | ↗ 28 ms hausse | 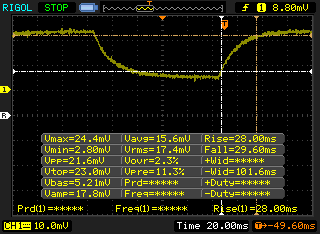 |
| ↘ 29.6 ms chute | ||
| L'écran souffre de latences très élevées, à éviter pour le jeu. En comparaison, tous les appareils testés affichent entre 0.165 (minimum) et 636 (maximum) ms. » 94 % des appareils testés affichent de meilleures performances. Cela signifie que les latences relevées sont moins bonnes que la moyenne (31 ms) de tous les appareils testés. | ||
Scintillement / MLI (Modulation de largeur d'impulsion)
| Scintillement / MLI (Modulation de largeur d'impulsion) non décelé | 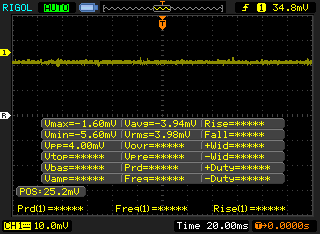 | ||
En comparaison, 52 % des appareils testés n'emploient pas MDI pour assombrir leur écran. Nous avons relevé une moyenne à 7775 (minimum : 5 - maximum : 343500) Hz dans le cas où une MDI était active. | |||
Cinebench R20: CPU (Multi Core) | CPU (Single Core)
Blender: v2.79 BMW27 CPU
7-Zip 18.03: 7z b 4 -mmt1 | 7z b 4
Geekbench 5.5: Single-Core | Multi-Core
HWBOT x265 Benchmark v2.2: 4k Preset
LibreOffice : 20 Documents To PDF
R Benchmark 2.5: Overall mean
| Blender / v2.79 BMW27 CPU | |
| Huawei MateBook X Pro 2020 i7 | |
| HP Spectre x360 13-ap0312ng | |
| Moyenne Intel Core i7-1065G7 (675 - 1650, n=23) | |
| Dell XPS 13 7390 Core i7-10710U | |
| Dell XPS 15 9500 Core i5 | |
| 7-Zip 18.03 / 7z b 4 -mmt1 | |
| Dell XPS 15 9500 Core i5 | |
| Huawei MateBook X Pro 2020 i7 | |
| Dell XPS 13 7390 Core i7-10710U | |
| Moyenne Intel Core i7-1065G7 (3289 - 4589, n=24) | |
| HP Spectre x360 13-ap0312ng | |
| Razer Blade Stealth Core i7 GTX 1650 Ti Max-Q 4K | |
| 7-Zip 18.03 / 7z b 4 | |
| Dell XPS 13 7390 Core i7-10710U | |
| Dell XPS 15 9500 Core i5 | |
| Razer Blade Stealth Core i7 GTX 1650 Ti Max-Q 4K | |
| Moyenne Intel Core i7-1065G7 (10406 - 22898, n=24) | |
| Huawei MateBook X Pro 2020 i7 | |
| HP Spectre x360 13-ap0312ng | |
| Geekbench 5.5 / Single-Core | |
| Moyenne Intel Core i7-1065G7 (948 - 1348, n=18) | |
| Razer Blade Stealth Core i7 GTX 1650 Ti Max-Q 4K | |
| Dell XPS 15 9500 Core i5 | |
| Huawei MateBook X Pro 2020 i7 | |
| Geekbench 5.5 / Multi-Core | |
| Razer Blade Stealth Core i7 GTX 1650 Ti Max-Q 4K | |
| Dell XPS 15 9500 Core i5 | |
| Moyenne Intel Core i7-1065G7 (2464 - 4855, n=18) | |
| Huawei MateBook X Pro 2020 i7 | |
| HWBOT x265 Benchmark v2.2 / 4k Preset | |
| Dell XPS 15 9500 Core i5 | |
| Dell XPS 13 7390 Core i7-10710U | |
| Moyenne Intel Core i7-1065G7 (2.2 - 6.38, n=22) | |
| Huawei MateBook X Pro 2020 i7 | |
| HP Spectre x360 13-ap0312ng | |
| LibreOffice / 20 Documents To PDF | |
| Dell XPS 15 9500 Core i5 | |
| Razer Blade Stealth Core i7 GTX 1650 Ti Max-Q 4K | |
| Moyenne Intel Core i7-1065G7 (46.9 - 85.3, n=19) | |
| Huawei MateBook X Pro 2020 i7 | |
| R Benchmark 2.5 / Overall mean | |
| Moyenne Intel Core i7-1065G7 (0.661 - 0.798, n=18) | |
| Dell XPS 15 9500 Core i5 | |
| Huawei MateBook X Pro 2020 i7 | |
* ... Moindre est la valeur, meilleures sont les performances
| PCMark 8 Home Score Accelerated v2 | 3424 points | |
| PCMark 8 Work Score Accelerated v2 | 4202 points | |
| PCMark 10 Score | 4497 points | |
Aide | ||
| DPC Latencies / LatencyMon - interrupt to process latency (max), Web, Youtube, Prime95 | |
| Dell XPS 15 9500 Core i7 4K UHD | |
| Razer Blade Stealth Core i7 GTX 1650 Ti Max-Q 4K | |
| Dell XPS 13 9300 4K UHD | |
| Asus Zephyrus G14 GA401IV | |
| Dell XPS 15 9500 Core i5 | |
| MSI GS66 10SGS | |
| Eluktronics RP-15 | |
* ... Moindre est la valeur, meilleures sont les performances
| Razer Blade Stealth Core i7 GTX 1650 Ti Max-Q 4K Lite-On CA5-8D512 | Dell XPS 13 9300 4K UHD Intel SSDPEMKF512G8 NVMe SSD | Asus ZenBook S13 UX392FN WDC PC SN520 SDAPNUW-512G | MSI Prestige 14 A10SC-009 Samsung SSD PM981 MZVLB1T0HALR | Razer Blade Stealth 13, Core i7-1065G7 Lite-On CA3-8D512 | |
|---|---|---|---|---|---|
| AS SSD | -11% | 8% | 39% | -5% | |
| Seq Read (MB/s) | 2220 | 1821 -18% | 1224 -45% | 2300 4% | 2666 20% |
| Seq Write (MB/s) | 2006 | 931 -54% | 907 -55% | 2051 2% | 1497 -25% |
| 4K Read (MB/s) | 51.4 | 56.4 10% | 41.46 -19% | 46.23 -10% | 53.7 4% |
| 4K Write (MB/s) | 119.2 | 127.2 7% | 126.2 6% | 84.6 -29% | 133.7 12% |
| 4K-64 Read (MB/s) | 740 | 462.6 -37% | 1021 38% | 1552 110% | 652 -12% |
| 4K-64 Write (MB/s) | 968 | 541 -44% | 1251 29% | 1789 85% | 272 -72% |
| Access Time Read * (ms) | 0.051 | 0.04 22% | 0.053 -4% | 0.049 4% | 0.075 -47% |
| Access Time Write * (ms) | 0.1 | 0.123 -23% | 0.027 73% | 0.045 55% | 0.032 68% |
| Score Read (Points) | 1013 | 701 -31% | 1185 17% | 1828 80% | 972 -4% |
| Score Write (Points) | 1288 | 762 -41% | 1468 14% | 2079 61% | 555 -57% |
| Score Total (Points) | 2822 | 1797 -36% | 3250 15% | 4831 71% | 1982 -30% |
| Copy ISO MB/s (MB/s) | 1881 | 1068 -43% | 1404 -25% | 1495 -21% | |
| Copy Program MB/s (MB/s) | 441.8 | 446.4 1% | 402.4 -9% | 458.4 4% | |
| Copy Game MB/s (MB/s) | 505 | 1163 130% | 902 79% | 964 91% | |
| CrystalDiskMark 5.2 / 6 | -23% | -22% | -11% | -7% | |
| Write 4K (MB/s) | 158.7 | 126.2 -20% | 149.2 -6% | 163.8 3% | 153 -4% |
| Read 4K (MB/s) | 58.2 | 61.1 5% | 47.18 -19% | 48.6 -16% | 59.5 2% |
| Write Seq (MB/s) | 2219 | 1049 -53% | 750 -66% | 2269 2% | 1608 -28% |
| Read Seq (MB/s) | 2444 | 2231 -9% | 1137 -53% | 1963 -20% | 2293 -6% |
| Write 4K Q32T1 (MB/s) | 475.9 | 410.1 -14% | 749 57% | 289.8 -39% | 497 4% |
| Read 4K Q32T1 (MB/s) | 509 | 418.9 -18% | 478.7 -6% | 373.6 -27% | 544 7% |
| Write Seq Q32T1 (MB/s) | 2202 | 784 -64% | 1453 -34% | 2395 9% | 1640 -26% |
| Read Seq Q32T1 (MB/s) | 3372 | 2964 -12% | 1713 -49% | 3479 3% | 3158 -6% |
| Write 4K Q8T8 (MB/s) | 960 | ||||
| Read 4K Q8T8 (MB/s) | 844 | ||||
| Moyenne finale (programmes/paramètres) | -17% /
-16% | -7% /
-3% | 14% /
18% | -6% /
-6% |
* ... Moindre est la valeur, meilleures sont les performances

Disk Throttling: DiskSpd Read Loop, Queue Depth 8
| 3DMark 06 Standard Score | 30266 points | |
| 3DMark Vantage P Result | 31116 points | |
| 3DMark 11 Performance | 11070 points | |
| 3DMark Cloud Gate Standard Score | 19073 points | |
| 3DMark Fire Strike Score | 7356 points | |
| 3DMark Time Spy Score | 3193 points | |
Aide | ||
| The Witcher 3 | |
| 1024x768 Low Graphics & Postprocessing | |
| Razer Blade 15 GTX 1660 Ti | |
| Razer Blade Stealth Core i7 GTX 1650 Ti Max-Q 4K | |
| Razer Blade Stealth 13, Core i7-1065G7 | |
| Razer Blade Stealth i7-8565U | |
| 1366x768 Medium Graphics & Postprocessing | |
| Razer Blade 15 GTX 1660 Ti | |
| Razer Blade Stealth Core i7 GTX 1650 Ti Max-Q 4K | |
| Razer Blade Stealth 13, Core i7-1065G7 | |
| Razer Blade Stealth i7-8565U | |
| 1920x1080 High Graphics & Postprocessing (Nvidia HairWorks Off) | |
| Razer Blade 15 GTX 1660 Ti | |
| Razer Blade Stealth Core i7 GTX 1650 Ti Max-Q 4K | |
| Razer Blade Stealth 13, Core i7-1065G7 | |
| Razer Blade Stealth i7-8565U | |
| 1920x1080 Ultra Graphics & Postprocessing (HBAO+) | |
| Razer Blade 15 GTX 1660 Ti | |
| Razer Blade Stealth Core i7 GTX 1650 Ti Max-Q 4K | |
| Razer Blade Stealth 13, Core i7-1065G7 | |
| Razer Blade Stealth i7-8565U | |
| Bas | Moyen | Élevé | Ultra | QHD | 4K | |
|---|---|---|---|---|---|---|
| The Witcher 3 (2015) | 159.5 | 92 | 52.6 | 29.8 | ||
| Dota 2 Reborn (2015) | 118 | 112 | 107 | 104 | 51.5 | |
| X-Plane 11.11 (2018) | 79 | 71.5 | 60.5 | 49.2 | ||
| Shadow of the Tomb Raider (2018) | 102 | 55 | 44 | 37 | ||
| Assassin´s Creed Odyssey (2018) | 63 | 49 | 41 | 19 | ||
| Apex Legends (2019) | 143.7 | 86.2 | 68.7 | 62.9 | ||
| Far Cry New Dawn (2019) | 89 | 56 | 53 | 49 | ||
| Metro Exodus (2019) | 83.1 | 40.1 | 29.8 | 23.2 | ||
| Dirt Rally 2.0 (2019) | 195.9 | 63.1 | 55.1 | 38.1 | ||
| The Division 2 (2019) | 93 | 51 | 41 | 30 | ||
| Anno 1800 (2019) | 89.4 | 65.8 | 41.1 | 21.5 | ||
| Total War: Three Kingdoms (2019) | 155.9 | 56 | 33.4 | 21.6 | ||
| F1 2019 (2019) | 171 | 89 | 71 | 62 | ||
| Control (2019) | 104.7 | 39.2 | 29.1 | |||
| Borderlands 3 (2019) | 102.8 | 52.6 | 34.7 | 26.1 | ||
| Ghost Recon Breakpoint (2019) | 74 | 45 | 34 | 22 | ||
| GRID 2019 (2019) | 114 | 76.9 | 64.3 | 27.5 | ||
| Need for Speed Heat (2019) | 61.8 | 49.3 | 45.8 | 33.9 | ||
| Star Wars Jedi Fallen Order (2019) | 63.3 | 53.2 | 46 | |||
| Escape from Tarkov (2020) | 120.7 | 71.2 | 52.8 | 47 | ||
| Hunt Showdown (2020) | 115.7 | 50.1 | 41.8 | |||
| Doom Eternal (2020) | 145.1 | 91.2 | 52.6 | |||
| Gears Tactics (2020) | 162.9 | 73.7 | 44.4 | 33.4 | 23.5 | 13.5 |
| Razer Blade Stealth Core i7 GTX 1650 Ti Max-Q 4K GeForce GTX 1650 Ti Max-Q, i7-1065G7, Lite-On CA5-8D512 | Dell XPS 13 9300 4K UHD Iris Plus Graphics G7 (Ice Lake 64 EU), i7-1065G7, Intel SSDPEMKF512G8 NVMe SSD | Asus ZenBook S13 UX392FN GeForce MX150, i7-8565U, WDC PC SN520 SDAPNUW-512G | MSI Prestige 14 A10SC-009 GeForce GTX 1650 Max-Q, i7-10710U, Samsung SSD PM981 MZVLB1T0HALR | Razer Blade Stealth 13, Core i7-1065G7 GeForce GTX 1650 Max-Q, i7-1065G7, Lite-On CA3-8D512 | Razer Blade Stealth i7-8565U GeForce MX150, i7-8565U, Lite-On CA3-8D256-Q11 | |
|---|---|---|---|---|---|---|
| Noise | 1% | 0% | -6% | 1% | -2% | |
| arrêt / environnement * (dB) | 28 | 29 -4% | 28.1 -0% | 30.3 -8% | 30 -7% | 28.4 -1% |
| Idle Minimum * (dB) | 28 | 29 -4% | 28.1 -0% | 30.3 -8% | 30 -7% | 28.5 -2% |
| Idle Average * (dB) | 28 | 29 -4% | 28.1 -0% | 30.3 -8% | 30 -7% | 29 -4% |
| Idle Maximum * (dB) | 28 | 29 -4% | 29 -4% | 30.3 -8% | 30 -7% | 29.1 -4% |
| Load Average * (dB) | 39 | 33.5 14% | 41.1 -5% | 40.2 -3% | 33.9 13% | 42.8 -10% |
| Witcher 3 ultra * (dB) | 42.7 | 40.5 5% | 41.1 4% | 38.1 11% | 41.4 3% | |
| Load Maximum * (dB) | 43.7 | 40.5 7% | 41.1 6% | 43.5 -0% | 38.1 13% | 41.6 5% |
* ... Moindre est la valeur, meilleures sont les performances
Degré de la nuisance sonore
| Au repos |
| 28 / 28 / 28 dB(A) |
| Fortement sollicité |
| 39 / 43.7 dB(A) |
 | ||
30 dB silencieux 40 dB(A) audible 50 dB(A) bruyant |
||
min: | ||
(-) La température maximale du côté supérieur est de 48.2 °C / 119 F, par rapport à la moyenne de 35.9 °C / 97 F, allant de 21.4 à 59 °C pour la classe Subnotebook.
(-) Le fond chauffe jusqu'à un maximum de 50 °C / 122 F, contre une moyenne de 39.2 °C / 103 F
(±) En utilisation inactive, la température moyenne du côté supérieur est de 32.3 °C / 90 F, par rapport à la moyenne du dispositif de 30.8 °C / 87 F.
(-) En jouant à The Witcher 3, la température moyenne du côté supérieur est de 40 °C / 104 F, alors que la moyenne de l'appareil est de 30.8 °C / 87 F.
(±) Les repose-poignets et le pavé tactile peuvent devenir très chauds au toucher, avec un maximum de 38.2 °C / 100.8# F.
(-) La température moyenne de la zone de l'appui-paume de dispositifs similaires était de 28.2 °C / 82.8 F (-10 °C / #-18 F).
| Éteint/en veille | |
| Au repos | |
| Fortement sollicité |
|
Légende:
min: | |
| Razer Blade Stealth Core i7 GTX 1650 Ti Max-Q 4K i7-1065G7, GeForce GTX 1650 Ti Max-Q, Lite-On CA5-8D512, IPS, 3840x2160, 13.3" | Dell XPS 13 9300 4K UHD i7-1065G7, Iris Plus Graphics G7 (Ice Lake 64 EU), Intel SSDPEMKF512G8 NVMe SSD, IPS, 3840x2400, 13.4" | HP Spectre x360 13-aw0013dx i7-1065G7, Iris Plus Graphics G7 (Ice Lake 64 EU), Intel Optane Memory H10 with Solid State Storage 32GB + 512GB HBRPEKNX0202A(L/H), IPS, 1920x1080, 13.3" | MSI Prestige 14 A10SC-009 i7-10710U, GeForce GTX 1650 Max-Q, Samsung SSD PM981 MZVLB1T0HALR, IPS, 3840x2160, 14" | Razer Blade Stealth i7-8565U i7-8565U, GeForce MX150, Lite-On CA3-8D256-Q11, IPS, 1920x1080, 13.3" | Razer Blade Stealth 13, Core i7-1065G7 i7-1065G7, GeForce GTX 1650 Max-Q, Lite-On CA3-8D512, IPS LED, 3840x2160, 13.3" | |
|---|---|---|---|---|---|---|
| Power Consumption | 34% | 49% | 10% | 18% | -8% | |
| Idle Minimum * (Watt) | 6 | 5.3 12% | 3.9 35% | 5.2 13% | 6.7 -12% | 10.7 -78% |
| Idle Average * (Watt) | 10.9 | 7.8 28% | 6.3 42% | 12.2 -12% | 8.6 21% | 13.6 -25% |
| Idle Maximum * (Watt) | 15.5 | 9.8 37% | 6.8 56% | 14.3 8% | 9.4 39% | 15.7 -1% |
| Load Average * (Watt) | 71.9 | 46 36% | 32.6 55% | 67 7% | 64.1 11% | 60 17% |
| Witcher 3 ultra * (Watt) | 72.9 | 43 41% | 25.6 65% | 63.7 13% | 64 12% | |
| Load Maximum * (Watt) | 100.5 | 48.3 52% | 59 41% | 67 33% | 64.1 36% | 71 29% |
* ... Moindre est la valeur, meilleures sont les performances
| Razer Blade Stealth Core i7 GTX 1650 Ti Max-Q 4K i7-1065G7, GeForce GTX 1650 Ti Max-Q, 53.1 Wh | Dell XPS 13 9300 4K UHD i7-1065G7, Iris Plus Graphics G7 (Ice Lake 64 EU), 52 Wh | HP Spectre x360 13-aw0013dx i7-1065G7, Iris Plus Graphics G7 (Ice Lake 64 EU), 60 Wh | MSI Prestige 14 A10SC-009 i7-10710U, GeForce GTX 1650 Max-Q, 52 Wh | Razer Blade Stealth i7-8565U i7-8565U, GeForce MX150, 53.1 Wh | Razer Blade Stealth 13, Core i7-1065G7 i7-1065G7, GeForce GTX 1650 Max-Q, 53.1 Wh | |
|---|---|---|---|---|---|---|
| Autonomie de la batterie | 75% | 162% | 14% | 79% | 1% | |
| Reader / Idle (h) | 7.8 | 37.1 376% | 9.9 27% | 20.5 163% | 8.3 6% | |
| WiFi v1.3 (h) | 6.5 | 11.4 75% | 9.9 52% | 5.9 -9% | 9.5 46% | 5.5 -15% |
| Load (h) | 1.7 | 2.7 59% | 2.1 24% | 2.2 29% | 1.9 12% |
Points positifs
Points négatifs
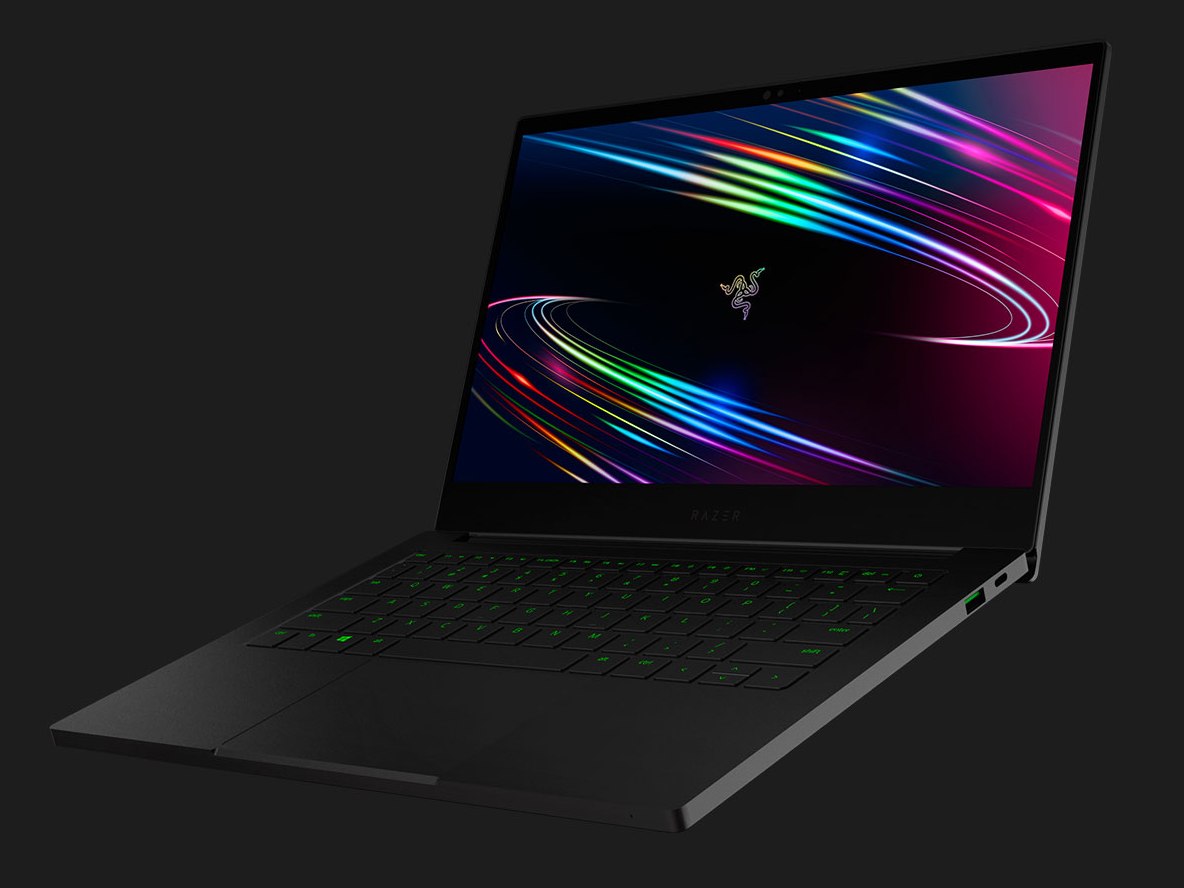
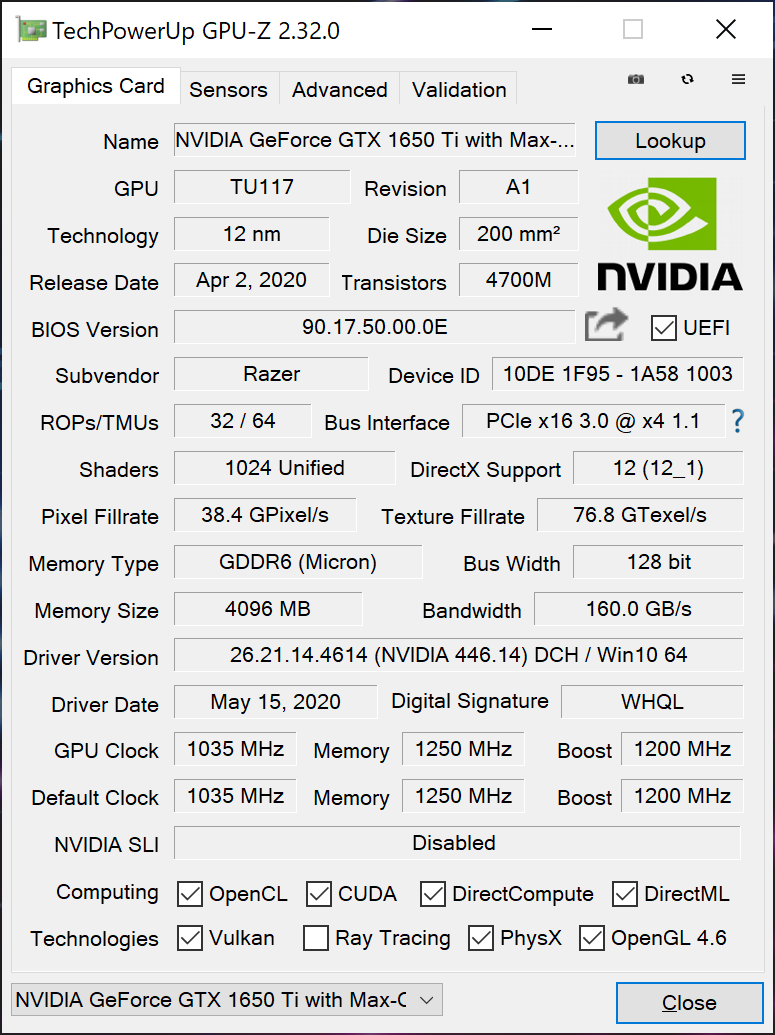
Nous n'avions pas particulièrement apprécié la version 2019 du Blade Stealth, surtout en ce qui concernait les performances, mais la version 2020 corrige nos reproches dans ce qui est le Blade Stealth le plus puissant jamais produit. Le fossé est encore plus large si on compare cette version 2020 à la version 2018 équipée d'une MX150. Certains ultrabooks peuvent avoir des processeurs plus puissants comme ceux équipés des Core i7-10710U ou Zen 2 hexacoeur, mais aucun n'atteint le potentiel de jeu du Blade Stealth. La GTX 1650 Ti Max-Q rend l'appareil unique pour sa gamme de 13 pouces.
Ceux qui voudraient jouer devraient choisir la version 1080p 120 Hz moins chère, plutôt que cette version 4K 60 Hz. Le ghosting est trop visible, et beaucoup de titres ne tourneront pas au mieux avec une telle résolution native. La GTX 1650 Ti Max-Q se couplera mieux avec une dalle 1080p 120 Hz. En revanche ceux qui font beaucoup de tableur ou de CAO pourront apprécier la version 4K.
Avec cela à l'esprit, nous ne pouvons nous empêcher de penser que le Blade Stealth 2020 est une claque pour ceux qui ont acheté la version 2019 10 W Core i7. Razer aurait tout simplement dû ne jamais proposer cette dernière version, et proposer l'appareil 25 testé aujourd'hui l'an dernier. Une telle approche aurait également simplifié la ligne Blade Stealth. Il est très complexe de choisir le bon modèle, avec toutes ces versions 10 / 25 W, Core i7 et graphismes Max-Q...
Il n'y a pas d'alternative directe au Blade Stealth pour l'instant. C'est l'ultrabook de 13,3 pouces le plus puissant pour jouer, à condition d'accepter le niveau sonore et la chauffe très élevée que cela entraîne.
L’intégralité de cette critique est disponible en anglais en suivant ce lien.
Razer Blade Stealth Core i7 GTX 1650 Ti Max-Q 4K
- 06/15/2020 v7 (old)
Allen Ngo
Price comparison
