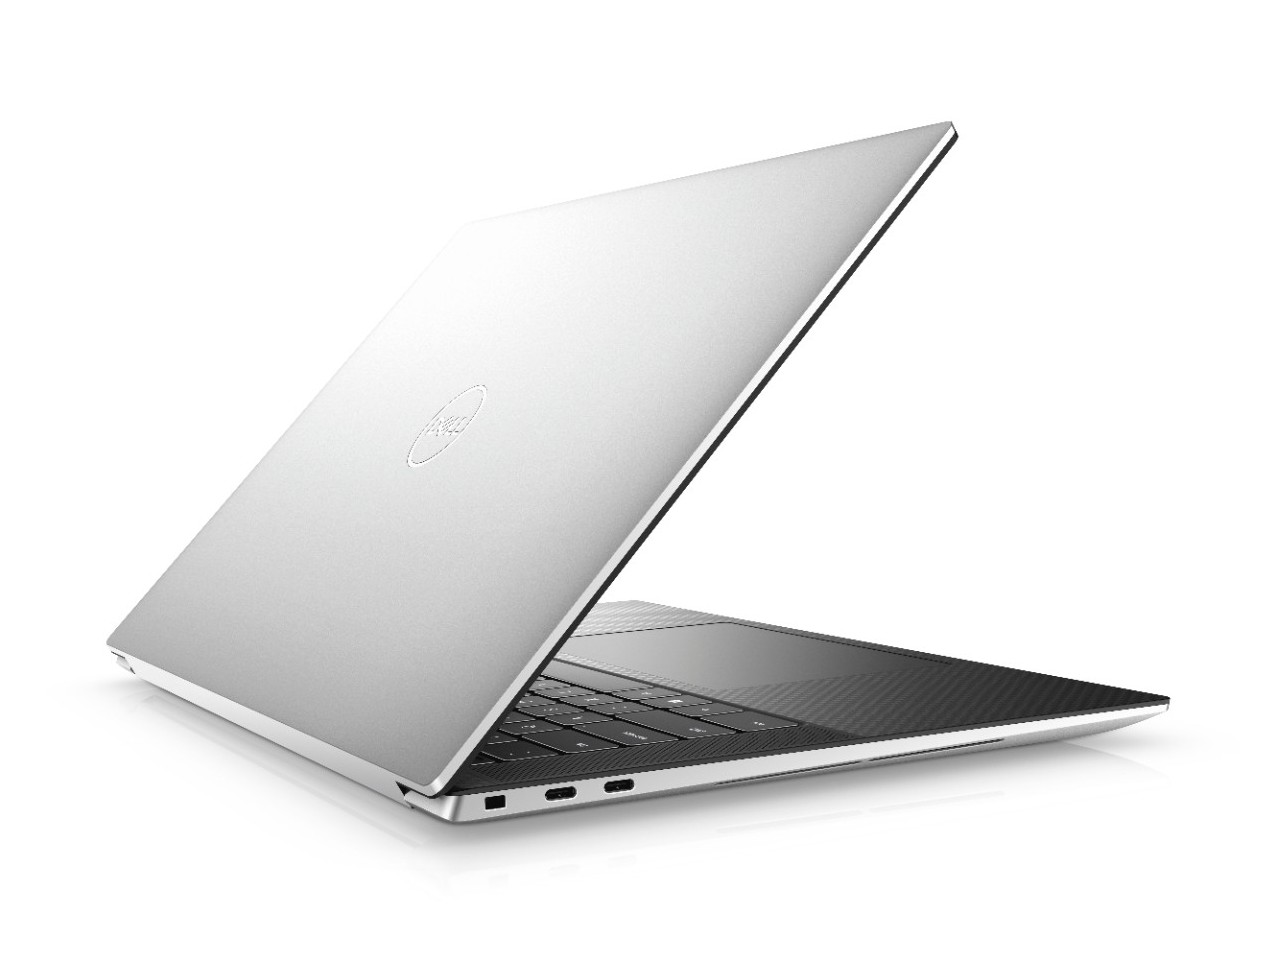
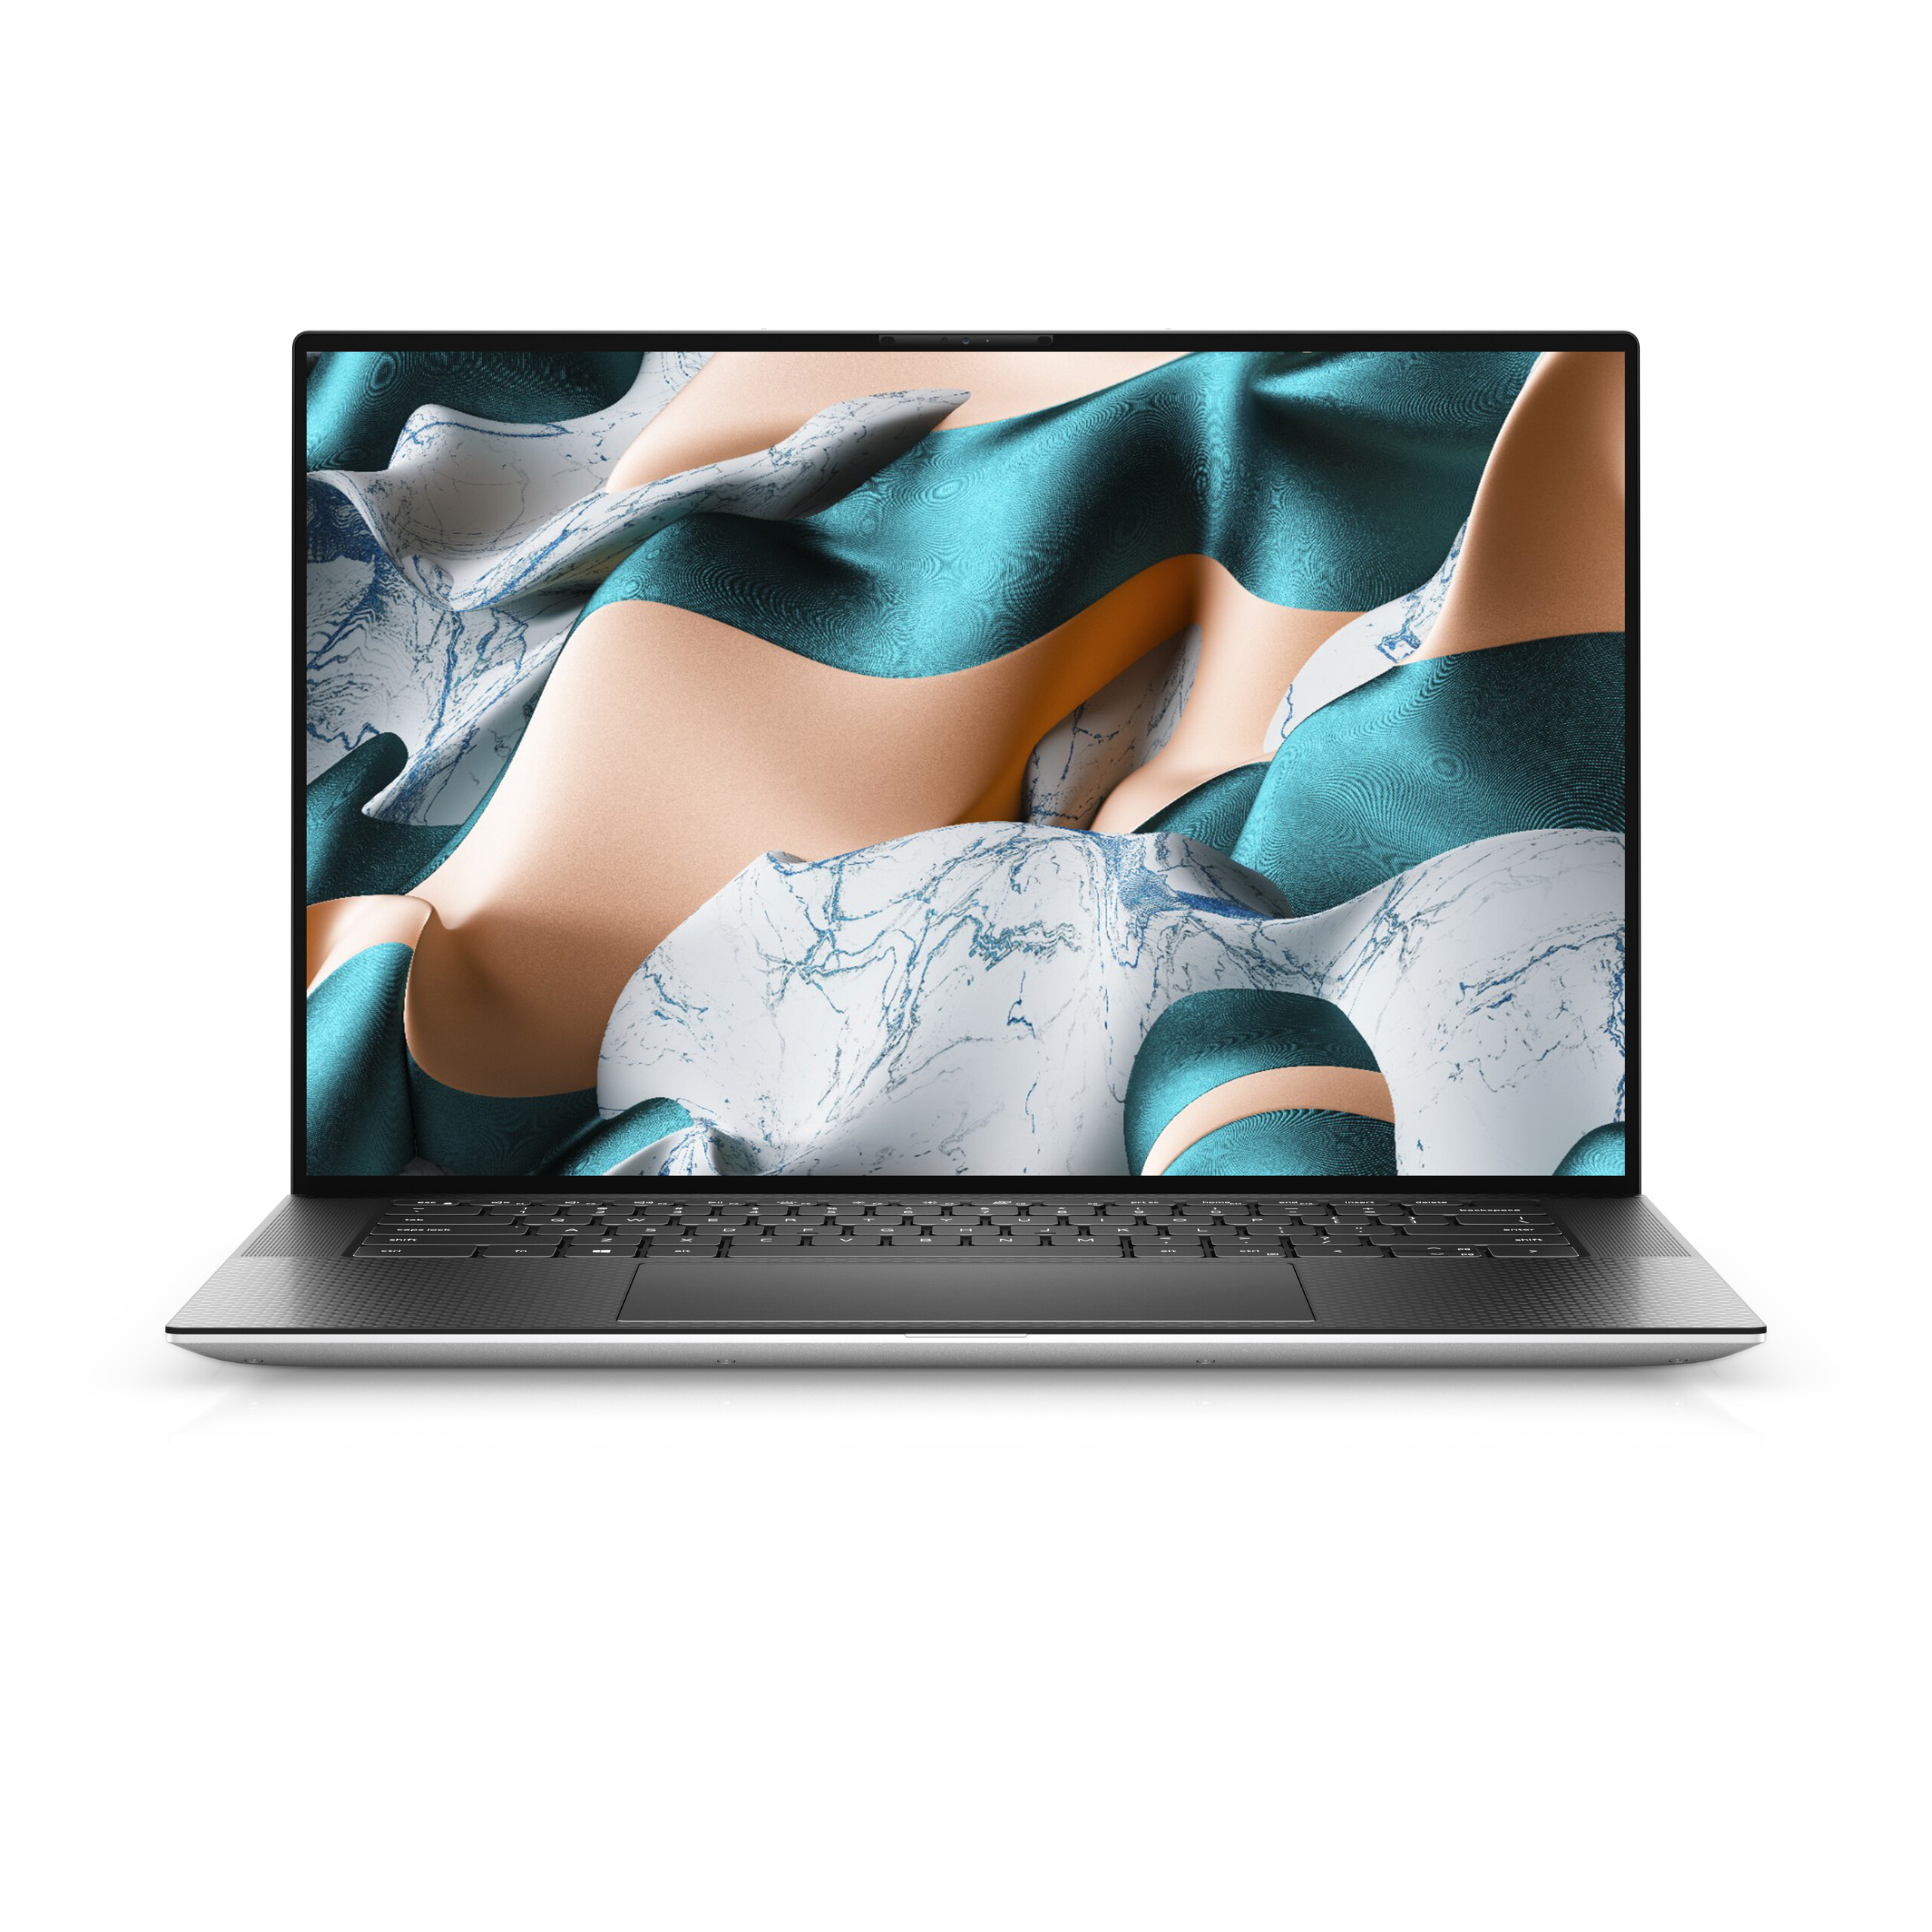
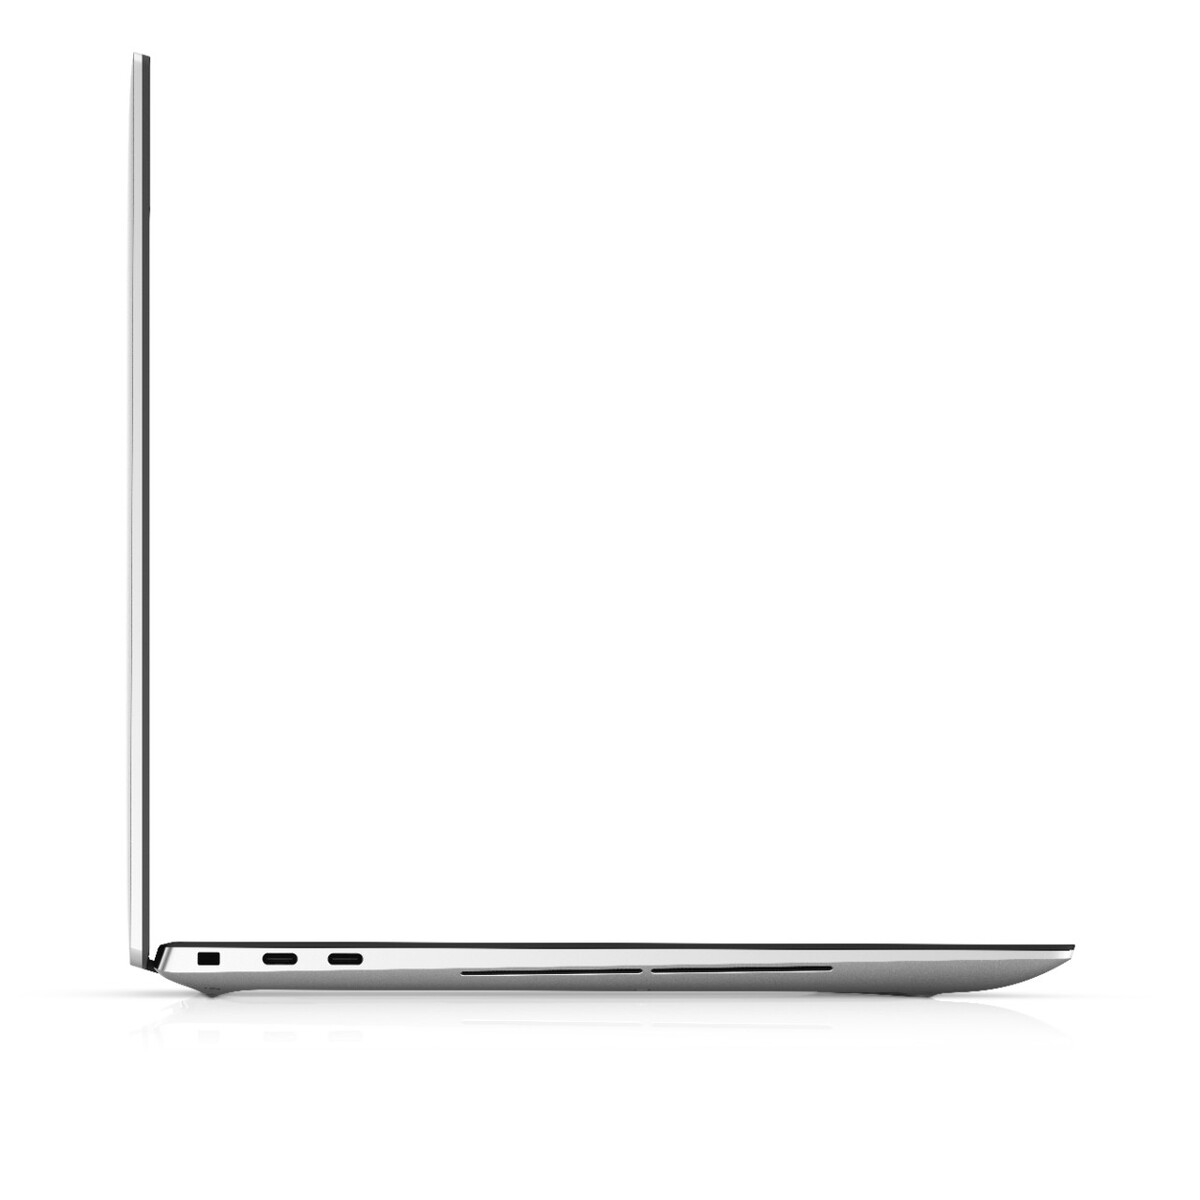
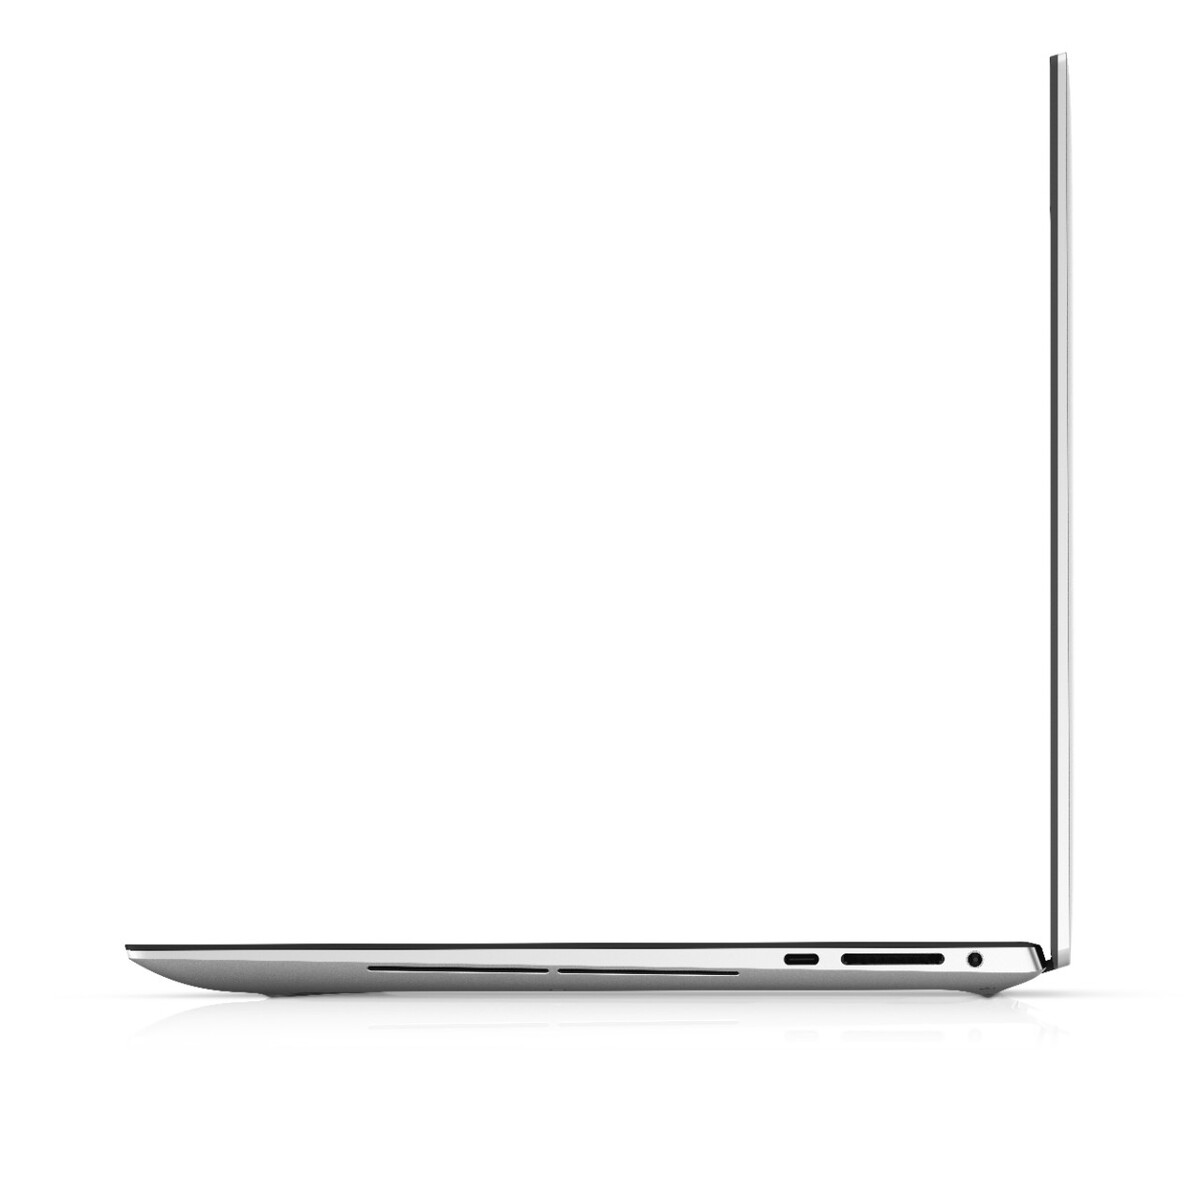
Test du Dell XPS 15 9500 (i7-10875H, GTX 1650 Ti, 4K UHD) : pas de Core i9 absurde
Note | Date | Modèle | Poids | Épaisseur | Taille | Résolution | Prix |
|---|---|---|---|---|---|---|---|
| 90.1 % v7 (old) | 07/20 | Dell XPS 15 9500 Core i7 4K UHD i7-10875H, GeForce GTX 1650 Ti Mobile | 2 kg | 18 mm | 15.60" | 3840x2400 | |
| 86 % v7 (old) | 12/19 | Lenovo Yoga C940-15IRH i7-9750H, GeForce GTX 1650 Max-Q | 2 kg | 19.7 mm | 15.60" | 1920x1080 | |
| 85.2 % v7 (old) | 04/20 | Asus ZenBook 15 UX534FTC-A8190T i7-10510U, GeForce GTX 1650 Max-Q | 1.6 kg | 18.9 mm | 15.60" | 1920x1080 | |
| 85.2 % v7 (old) | 11/19 | MSI Prestige 15 A10SC i7-10710U, GeForce GTX 1650 Max-Q | 1.7 kg | 16 mm | 15.60" | 3840x2160 | |
| 86.8 % v7 (old) | 07/20 | Dell XPS 15 9500 Core i5 i5-10300H, UHD Graphics 630 | 1.8 kg | 18 mm | 15.60" | 1920x1200 | |
| 89.7 % v7 (old) | 04/20 | Apple MacBook Pro 16 2019 i9 5500M i9-9880H, Radeon Pro 5500M | 2 kg | 16.2 mm | 16.00" | 3072x1920 |
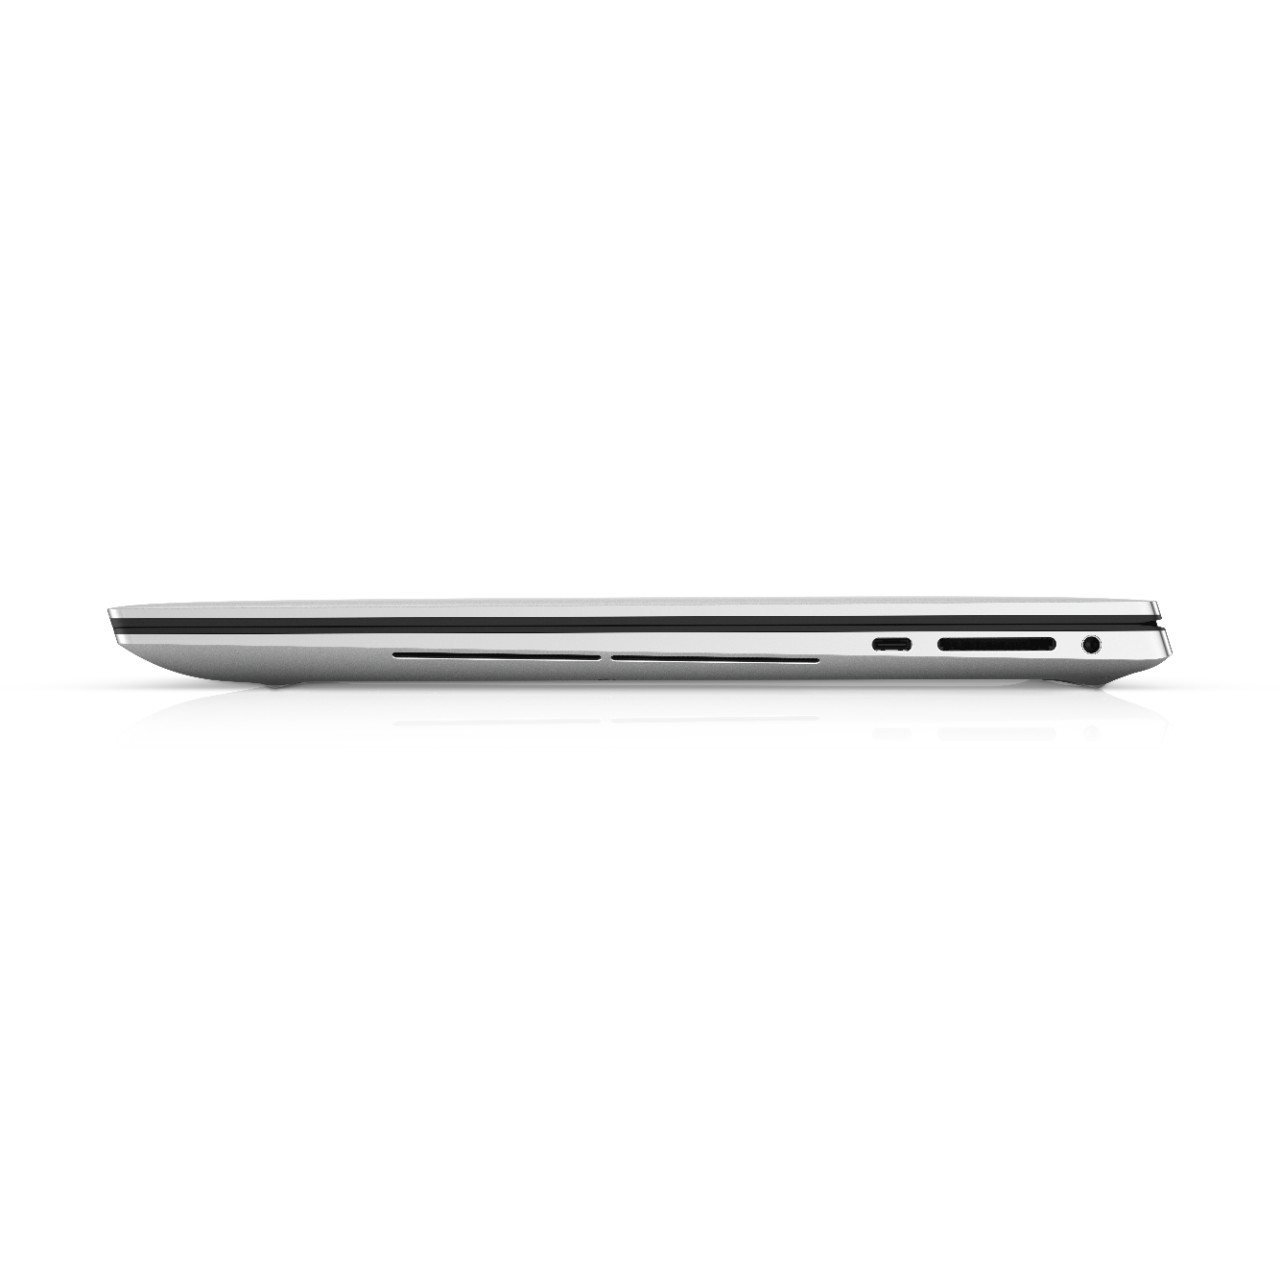
| SD Card Reader | |
| average JPG Copy Test (av. of 3 runs) | |
| Dell XPS 15 9500 Core i7 4K UHD (Toshiba Exceria Pro SDXC 64 GB UHS-II) | |
| Dell XPS 15 7590 9980HK GTX 1650 (Toshiba Exceria Pro SDXC 64 GB UHS-II) | |
| MSI Prestige 15 A10SC (Toshiba Exceria Pro M501 UHS-II) | |
| Dell XPS 15 9575 i5-8305G (Toshiba Exceria Pro M501 UHS-II) | |
| maximum AS SSD Seq Read Test (1GB) | |
| Dell XPS 15 9575 i5-8305G (Toshiba Exceria Pro M501 UHS-II) | |
| Dell XPS 15 9500 Core i7 4K UHD (Toshiba Exceria Pro SDXC 64 GB UHS-II) | |
| MSI Prestige 15 A10SC (Toshiba Exceria Pro M501 UHS-II) | |
| Dell XPS 15 7590 9980HK GTX 1650 (Toshiba Exceria Pro SDXC 64 GB UHS-II) | |


| |||||||||||||||||||||||||
Homogénéité de la luminosité: 91 %
Valeur mesurée au centre, sur batterie: 557.9 cd/m²
Contraste: 1431:1 (Valeurs des noirs: 0.39 cd/m²)
ΔE ColorChecker Calman: 4.54 | ∀{0.5-29.43 Ø4.73}
calibrated: 3.82
ΔE Greyscale Calman: 3.2 | ∀{0.09-98 Ø4.97}
100% sRGB (Argyll 1.6.3 3D)
89.5% AdobeRGB 1998 (Argyll 1.6.3 3D)
99.8% AdobeRGB 1998 (Argyll 3D)
100% sRGB (Argyll 3D)
89.7% Display P3 (Argyll 3D)
Gamma: 1.99
CCT: 6451 K
| Dell XPS 15 9500 Core i7 4K UHD Sharp LQ156R1, IPS, 15.6", 3840x2400 | Dell XPS 15 9500 Core i5 Sharp LQ156N1, IPS, 15.6", 1920x1200 | Lenovo Yoga C940-15IRH LG Philips LP156WFC-SPU1, IPS, 15.6", 1920x1080 | Asus ZenBook 15 UX534FTC-A8190T BOE CQ NV156FHM-N63, IPS, 15.6", 1920x1080 | MSI Prestige 15 A10SC Sharp LQ156D1JW42, IPS, 15.6", 3840x2160 | Apple MacBook Pro 16 2019 i9 5500M APPA044, IPS, 16", 3072x1920 | |
|---|---|---|---|---|---|---|
| Display | -10% | -25% | -26% | -5% | ||
| Display P3 Coverage (%) | 89.7 | 81.5 -9% | 61.5 -31% | 65 -28% | 82 -9% | |
| sRGB Coverage (%) | 100 | 100 0% | 92.7 -7% | 86.2 -14% | 98.3 -2% | |
| AdobeRGB 1998 Coverage (%) | 99.8 | 79.6 -20% | 63.6 -36% | 62.9 -37% | 96.2 -4% | |
| Response Times | 18% | 0% | 11% | -18% | -1% | |
| Response Time Grey 50% / Grey 80% * (ms) | 54 ? | 42 ? 22% | 48.4 ? 10% | 45 ? 17% | 60 ? -11% | 52.4 ? 3% |
| Response Time Black / White * (ms) | 33.2 ? | 28.8 ? 13% | 36.4 ? -10% | 32 ? 4% | 41.2 ? -24% | 34.9 ? -5% |
| PWM Frequency (Hz) | 26040 ? | 131700 | ||||
| Screen | 4% | -2% | -13% | 0% | 17% | |
| Brightness middle (cd/m²) | 557.9 | 592 6% | 484.8 -13% | 299 -46% | 464.5 -17% | 519 -7% |
| Brightness (cd/m²) | 541 | 565 4% | 463 -14% | 280 -48% | 451 -17% | 477 -12% |
| Brightness Distribution (%) | 91 | 85 -7% | 82 -10% | 89 -2% | 92 1% | 86 -5% |
| Black Level * (cd/m²) | 0.39 | 0.46 -18% | 0.26 33% | 0.21 46% | 0.5 -28% | 0.39 -0% |
| Contrast (:1) | 1431 | 1287 -10% | 1865 30% | 1424 0% | 929 -35% | 1331 -7% |
| Colorchecker dE 2000 * | 4.54 | 3.19 30% | 4.5 1% | 4.76 -5% | 3.36 26% | 2.28 50% |
| Colorchecker dE 2000 max. * | 7.92 | 5.45 31% | 7.55 5% | 9 -14% | 7.06 11% | 6.54 17% |
| Colorchecker dE 2000 calibrated * | 3.82 | 2.03 47% | 1.19 69% | 3.42 10% | 0.86 77% | |
| Greyscale dE 2000 * | 3.2 | 3.9 -22% | 5.7 -78% | 3.53 -10% | 1.3 59% | 0.9 72% |
| Gamma | 1.99 111% | 2.25 98% | 2.45 90% | 2.3 96% | 2.14 103% | 2145 0% |
| CCT | 6451 101% | 6522 100% | 6101 107% | 7228 90% | 6596 99% | 6572 99% |
| Color Space (Percent of AdobeRGB 1998) (%) | 89.5 | 71.6 -20% | 58.7 -34% | 56 -37% | 84.8 -5% | 78 -13% |
| Color Space (Percent of sRGB) (%) | 100 | 100 0% | 92.8 -7% | 86 -14% | 98.3 -2% | |
| Moyenne finale (programmes/paramètres) | 4% /
3% | -9% /
-6% | -9% /
-13% | -8% /
-3% | 8% /
14% |
* ... Moindre est la valeur, meilleures sont les performances
Temps de réponse de l'écran
| ↔ Temps de réponse noir à blanc | ||
|---|---|---|
| 33.2 ms ... hausse ↗ et chute ↘ combinées | ↗ 19.2 ms hausse | 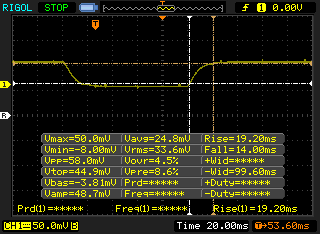 |
| ↘ 14 ms chute | ||
| L'écran souffre de latences très élevées, à éviter pour le jeu. En comparaison, tous les appareils testés affichent entre 0.1 (minimum) et 240 (maximum) ms. » 90 % des appareils testés affichent de meilleures performances. Cela signifie que les latences relevées sont moins bonnes que la moyenne (19.9 ms) de tous les appareils testés. | ||
| ↔ Temps de réponse gris 50% à gris 80% | ||
| 54 ms ... hausse ↗ et chute ↘ combinées | ↗ 26.4 ms hausse | 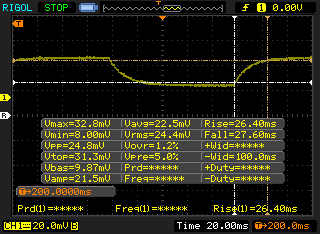 |
| ↘ 27.6 ms chute | ||
| L'écran souffre de latences très élevées, à éviter pour le jeu. En comparaison, tous les appareils testés affichent entre 0.165 (minimum) et 636 (maximum) ms. » 91 % des appareils testés affichent de meilleures performances. Cela signifie que les latences relevées sont moins bonnes que la moyenne (31.1 ms) de tous les appareils testés. | ||
Scintillement / MLI (Modulation de largeur d'impulsion)
| Scintillement / MLI (Modulation de largeur d'impulsion) non décelé | 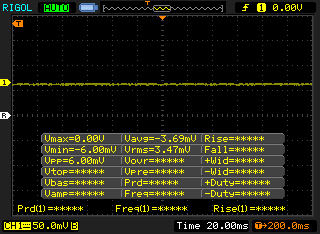 | ||
En comparaison, 52 % des appareils testés n'emploient pas MDI pour assombrir leur écran. Nous avons relevé une moyenne à 7798 (minimum : 5 - maximum : 343500) Hz dans le cas où une MDI était active. | |||
Cinebench R15: CPU Multi 64Bit | CPU Single 64Bit
Blender: v2.79 BMW27 CPU
7-Zip 18.03: 7z b 4 -mmt1 | 7z b 4
Geekbench 5.5: Single-Core | Multi-Core
HWBOT x265 Benchmark v2.2: 4k Preset
LibreOffice : 20 Documents To PDF
R Benchmark 2.5: Overall mean
| Cinebench R20 / CPU (Multi Core) | |
| Eluktronics RP-15 | |
| MSI GS66 Stealth 10SFS | |
| Moyenne Intel Core i7-10875H (1986 - 4176, n=32) | |
| Dell XPS 15 7590 9980HK GTX 1650 | |
| Dell XPS 15 9500 Core i7 4K UHD | |
| Apple MacBook Pro 15 2019 i9 Vega 16 | |
| Medion Erazer X15805 | |
| Razer Blade 15 RZ09-0328 | |
| Lenovo IdeaPad S740-15IRH | |
| Schenker Work 15 | |
| Dell XPS 15 9500 Core i5 | |
| MSI Alpha 15 A3DDK-034 | |
| Cinebench R20 / CPU (Single Core) | |
| Medion Erazer X15805 | |
| Dell XPS 15 9500 Core i7 4K UHD | |
| Eluktronics RP-15 | |
| Moyenne Intel Core i7-10875H (430 - 524, n=32) | |
| MSI GS66 Stealth 10SFS | |
| Razer Blade 15 RZ09-0328 | |
| Apple MacBook Pro 15 2019 i9 Vega 16 | |
| Lenovo IdeaPad S740-15IRH | |
| Dell XPS 15 7590 9980HK GTX 1650 | |
| Dell XPS 15 9500 Core i5 | |
| Schenker Work 15 | |
| MSI Alpha 15 A3DDK-034 | |
| Cinebench R15 / CPU Multi 64Bit | |
| Eluktronics RP-15 | |
| MSI GS66 Stealth 10SFS | |
| Dell XPS 15 7590 9980HK GTX 1650 | |
| Moyenne Intel Core i7-10875H (1003 - 1833, n=38) | |
| Dell XPS 15 9500 Core i7 4K UHD | |
| Apple MacBook Pro 15 2019 i9 Vega 16 | |
| Medion Erazer X15805 | |
| Razer Blade 15 RZ09-0328 | |
| Lenovo IdeaPad S740-15IRH | |
| Schenker Work 15 | |
| Dell XPS 15 9500 Core i5 | |
| MSI Alpha 15 A3DDK-034 | |
| Cinebench R15 / CPU Single 64Bit | |
| Dell XPS 15 9500 Core i7 4K UHD | |
| Moyenne Intel Core i7-10875H (190 - 220, n=37) | |
| Medion Erazer X15805 | |
| Dell XPS 15 7590 9980HK GTX 1650 | |
| MSI GS66 Stealth 10SFS | |
| Razer Blade 15 RZ09-0328 | |
| Lenovo IdeaPad S740-15IRH | |
| Eluktronics RP-15 | |
| Dell XPS 15 9500 Core i5 | |
| Apple MacBook Pro 15 2019 i9 Vega 16 | |
| Schenker Work 15 | |
| MSI Alpha 15 A3DDK-034 | |
| Blender / v2.79 BMW27 CPU | |
| Dell XPS 15 9500 Core i5 | |
| Schenker Work 15 | |
| Schenker Work 15 | |
| Razer Blade 15 RZ09-0328 | |
| Apple MacBook Pro 15 2019 i9 Vega 16 | |
| Dell XPS 15 9500 Core i7 4K UHD | |
| Moyenne Intel Core i7-10875H (259 - 535, n=30) | |
| MSI GS66 Stealth 10SFS | |
| Eluktronics RP-15 | |
| 7-Zip 18.03 / 7z b 4 -mmt1 | |
| Moyenne Intel Core i7-10875H (5071 - 5780, n=31) | |
| Dell XPS 15 9500 Core i7 4K UHD | |
| MSI GS66 Stealth 10SFS | |
| Razer Blade 15 RZ09-0328 | |
| Dell XPS 15 9500 Core i5 | |
| Eluktronics RP-15 | |
| Schenker Work 15 | |
| Schenker Work 15 | |
| 7-Zip 18.03 / 7z b 4 | |
| Eluktronics RP-15 | |
| MSI GS66 Stealth 10SFS | |
| Moyenne Intel Core i7-10875H (29844 - 49562, n=31) | |
| Dell XPS 15 9500 Core i7 4K UHD | |
| Razer Blade 15 RZ09-0328 | |
| Schenker Work 15 | |
| Schenker Work 15 | |
| Dell XPS 15 9500 Core i5 | |
| Geekbench 5.5 / Single-Core | |
| Dell XPS 15 9500 Core i7 4K UHD | |
| Moyenne Intel Core i7-10875H (1233 - 1371, n=29) | |
| MSI GS66 Stealth 10SFS | |
| Eluktronics RP-15 | |
| Dell XPS 15 9500 Core i5 | |
| Razer Blade 15 RZ09-0328 | |
| MSI Alpha 15 A3DDK-034 | |
| Geekbench 5.5 / Multi-Core | |
| Eluktronics RP-15 | |
| Dell XPS 15 9500 Core i7 4K UHD | |
| Moyenne Intel Core i7-10875H (5715 - 8620, n=29) | |
| MSI GS66 Stealth 10SFS | |
| Razer Blade 15 RZ09-0328 | |
| Dell XPS 15 9500 Core i5 | |
| MSI Alpha 15 A3DDK-034 | |
| HWBOT x265 Benchmark v2.2 / 4k Preset | |
| Eluktronics RP-15 | |
| MSI GS66 Stealth 10SFS | |
| Moyenne Intel Core i7-10875H (7.27 - 14.1, n=27) | |
| Dell XPS 15 9500 Core i7 4K UHD | |
| Razer Blade 15 RZ09-0328 | |
| Schenker Work 15 | |
| Schenker Work 15 | |
| Dell XPS 15 9500 Core i5 | |
| LibreOffice / 20 Documents To PDF | |
| Dell XPS 15 9500 Core i5 | |
| Eluktronics RP-15 | |
| Razer Blade 15 RZ09-0328 | |
| Dell XPS 15 9500 Core i7 4K UHD | |
| MSI GS66 Stealth 10SFS | |
| Moyenne Intel Core i7-10875H (30.2 - 84.3, n=30) | |
| R Benchmark 2.5 / Overall mean | |
| Dell XPS 15 9500 Core i5 | |
| MSI GS66 Stealth 10SFS | |
| Dell XPS 15 9500 Core i7 4K UHD | |
| Moyenne Intel Core i7-10875H (0.546 - 0.662, n=29) | |
| Eluktronics RP-15 | |
* ... Moindre est la valeur, meilleures sont les performances
| PCMark 8 Home Score Accelerated v2 | 3731 points | |
| PCMark 8 Work Score Accelerated v2 | 4540 points | |
| PCMark 10 Score | 5125 points | |
Aide | ||
| DPC Latencies / LatencyMon - interrupt to process latency (max), Web, Youtube, Prime95 | |
| Dell XPS 15 9500 Core i7 4K UHD | |
| MSI GS66 Stealth 10SFS | |
| Dell XPS 15 9500 Core i5 | |
| Eluktronics RP-15 | |
* ... Moindre est la valeur, meilleures sont les performances
| Dell XPS 15 9500 Core i7 4K UHD SK Hynix PC611 512GB | Dell XPS 15 7590 9980HK GTX 1650 Toshiba XG6 KXG60ZNV1T02 | Lenovo Yoga C940-15IRH Intel Optane Memory H10 with Solid State Storage 32GB + 512GB HBRPEKNX0202A(L/H) | Asus ZenBook 15 UX534FTC-A8190T Samsung SSD PM981 MZVLB1T0HALR | MSI Prestige 15 A10SC Samsung SSD PM981 MZVLB1T0HALR | Dell XPS 15 9500 Core i5 Toshiba KBG40ZNS256G NVMe | |
|---|---|---|---|---|---|---|
| AS SSD | 32% | -25% | 27% | 30% | -69% | |
| Seq Read (MB/s) | 2072 | 1723 -17% | 769 -63% | 2643 28% | 1274 -39% | 1423 -31% |
| Seq Write (MB/s) | 1486 | 1386 -7% | 351.1 -76% | 1533 3% | 1395 -6% | 766 -48% |
| 4K Read (MB/s) | 47.41 | 43.25 -9% | 69.1 46% | 49.12 4% | 50.3 6% | 42.21 -11% |
| 4K Write (MB/s) | 117.6 | 98.3 -16% | 100.9 -14% | 134.7 15% | 119.8 2% | 74.8 -36% |
| 4K-64 Read (MB/s) | 967 | 1078 11% | 472 -51% | 1028 6% | 1599 65% | 973 1% |
| 4K-64 Write (MB/s) | 715 | 1456 104% | 948 33% | 1353 89% | 1455 103% | 218.8 -69% |
| Access Time Read * (ms) | 0.057 | 0.05 12% | 0.071 -25% | 0.033 42% | 0.044 23% | 0.125 -119% |
| Access Time Write * (ms) | 0.096 | 0.039 59% | 0.137 -43% | 0.028 71% | 0.092 4% | 0.552 -475% |
| Score Read (Points) | 1222 | 1294 6% | 618 -49% | 1342 10% | 1777 45% | 1157 -5% |
| Score Write (Points) | 981 | 1693 73% | 1084 10% | 1641 67% | 1714 75% | 370 -62% |
| Score Total (Points) | 2809 | 3638 30% | 2024 -28% | 3622 29% | 4411 57% | 2094 -25% |
| Copy ISO MB/s (MB/s) | 1999 | 3182 59% | 839 -58% | 2226 11% | 2830 42% | 1151 -42% |
| Copy Program MB/s (MB/s) | 627 | 984 57% | 455.8 -27% | 506 -19% | 609 -3% | 499.4 -20% |
| Copy Game MB/s (MB/s) | 1001 | 1824 82% | 969 -3% | 1230 23% | 1424 42% | 733 -27% |
| CrystalDiskMark 5.2 / 6 | 1% | 2% | 8% | -13% | -23% | |
| Write 4K (MB/s) | 123.3 | 104.3 -15% | 102.2 -17% | 138.1 12% | 150.8 22% | 93.3 -24% |
| Read 4K (MB/s) | 41.85 | 45.23 8% | 114.3 173% | 45.89 10% | 47.3 13% | 45.9 10% |
| Write Seq (MB/s) | 2054 | 1729 -16% | 468.3 -77% | 2147 5% | 981 -52% | 1211 -41% |
| Read Seq (MB/s) | 1617 | 1861 15% | 1236 -24% | 2188 35% | 976 -40% | 1633 1% |
| Write 4K Q32T1 (MB/s) | 413 | 509 23% | 556 35% | 427.8 4% | 442.7 7% | 273.1 -34% |
| Read 4K Q32T1 (MB/s) | 377.5 | 388.5 3% | 421.6 12% | 404 7% | 499.7 32% | 356 -6% |
| Write Seq Q32T1 (MB/s) | 2705 | 2813 4% | 1264 -53% | 2396 -11% | 1706 -37% | 1198 -56% |
| Read Seq Q32T1 (MB/s) | 3442 | 2906 -16% | 2239 -35% | 3454 0% | 1758 -49% | 2269 -34% |
| Moyenne finale (programmes/paramètres) | 17% /
20% | -12% /
-15% | 18% /
20% | 9% /
14% | -46% /
-52% |
* ... Moindre est la valeur, meilleures sont les performances

Disk Throttling: DiskSpd Read Loop, Queue Depth 8
| 3DMark | |
| 1920x1080 Fire Strike Graphics | |
| Eluktronics RP-15 | |
| Maingear Vector 15 | |
| MSI P65 8RF-451 - Creator | |
| Asus Zephyrus S GX531GM | |
| Dell XPS 15 9500 Core i7 4K UHD | |
| Gainward GeForce GTX 1650 4 GB | |
| Dell XPS 15 7590 9980HK GTX 1650 | |
| Lenovo IdeaPad S740-15IRH | |
| Dell XPS 15 9570 i7 UHD | |
| Dell XPS 15 9500 Core i5 | |
| 2560x1440 Time Spy Graphics | |
| Eluktronics RP-15 | |
| Maingear Vector 15 | |
| MSI P65 8RF-451 - Creator | |
| Asus Zephyrus S GX531GM | |
| Dell XPS 15 9500 Core i7 4K UHD | |
| Gainward GeForce GTX 1650 4 GB | |
| Dell XPS 15 7590 9980HK GTX 1650 | |
| Lenovo IdeaPad S740-15IRH | |
| Dell XPS 15 9570 i7 UHD | |
| Dell XPS 15 9500 Core i5 | |
| 2560x1440 Time Spy Score | |
| Eluktronics RP-15 | |
| Maingear Vector 15 | |
| MSI P65 8RF-451 - Creator | |
| Gainward GeForce GTX 1650 4 GB | |
| Asus Zephyrus S GX531GM | |
| Dell XPS 15 9500 Core i7 4K UHD | |
| Dell XPS 15 7590 9980HK GTX 1650 | |
| Lenovo IdeaPad S740-15IRH | |
| Dell XPS 15 9570 i7 UHD | |
| Dell XPS 15 9500 Core i5 | |
| 3DMark 11 | |
| 1280x720 Performance GPU | |
| Eluktronics RP-15 | |
| Maingear Vector 15 | |
| MSI P65 8RF-451 - Creator | |
| Gainward GeForce GTX 1650 4 GB | |
| Dell XPS 15 9500 Core i7 4K UHD | |
| Asus Zephyrus S GX531GM | |
| Dell XPS 15 7590 9980HK GTX 1650 | |
| Lenovo IdeaPad S740-15IRH | |
| Dell XPS 15 9570 i7 UHD | |
| Dell XPS 15 9500 Core i5 | |
| 1280x720 Performance Combined | |
| Eluktronics RP-15 | |
| Dell XPS 15 9500 Core i7 4K UHD | |
| Maingear Vector 15 | |
| Gainward GeForce GTX 1650 4 GB | |
| Lenovo IdeaPad S740-15IRH | |
| Dell XPS 15 9570 i7 UHD | |
| MSI P65 8RF-451 - Creator | |
| Dell XPS 15 7590 9980HK GTX 1650 | |
| Asus Zephyrus S GX531GM | |
| Dell XPS 15 9500 Core i5 | |
| 3DMark 06 Standard Score | 39720 points | |
| 3DMark Vantage P Result | 43517 points | |
| 3DMark 11 Performance | 13331 points | |
| 3DMark Cloud Gate Standard Score | 20269 points | |
| 3DMark Fire Strike Score | 9222 points | |
| 3DMark Time Spy Score | 3774 points | |
Aide | ||
| Bas | Moyen | Élevé | Ultra | 4K | |
|---|---|---|---|---|---|
| The Witcher 3 (2015) | 209.9 | 100.8 | 65.6 | 38.1 | |
| Dota 2 Reborn (2015) | 150 | 139 | 130 | 120 | 51.8 |
| X-Plane 11.11 (2018) | 109 | 78.2 | 63.3 | 45.8 | |
| Shadow of the Tomb Raider (2018) | 139 | 62 | 57 | 48 | |
| Assassin´s Creed Odyssey (2018) | 86 | 60 | 42 | 25 | |
| Apex Legends (2019) | 144 | 91 | 84 | 74 | |
| Far Cry New Dawn (2019) | 73 | 57 | 58 | 51 | |
| Metro Exodus (2019) | 91.6 | 48.7 | 35.9 | 27.9 | |
| Dirt Rally 2.0 (2019) | 247.3 | 92.7 | 74.6 | 44.8 | |
| The Division 2 (2019) | 115 | 56 | 47 | 35 | |
| Anno 1800 (2019) | 68.4 | 64.5 | 49.1 | 27.6 | |
| Total War: Three Kingdoms (2019) | 190.2 | 59.1 | 40.8 | 27.2 | |
| F1 2019 (2019) | 206 | 105 | 89 | 76 | |
| Borderlands 3 (2019) | 128.3 | 59.9 | 38.5 | 29.3 | |
| Ghost Recon Breakpoint (2019) | 72 | 53 | 47 | 31 | |
| GRID 2019 (2019) | 103.8 | 70.7 | 64.1 | 27.3 | |
| Need for Speed Heat (2019) | 60.4 | 43.3 | 39 | 37.3 | |
| Star Wars Jedi Fallen Order (2019) | 44.1 | 41.5 | 40.7 | ||
| Escape from Tarkov (2020) | 120.5 | 89.7 | 60.4 | 73 | |
| Hunt Showdown (2020) | 150 | 58.5 | 47.5 | ||
| Doom Eternal (2020) | 149.5 | 90.7 | 66.6 |
| Dell XPS 15 9500 Core i7 4K UHD GeForce GTX 1650 Ti Mobile, i7-10875H, SK Hynix PC611 512GB | Dell XPS 15 7590 9980HK GTX 1650 GeForce GTX 1650 Mobile, i9-9980HK, Toshiba XG6 KXG60ZNV1T02 | Lenovo Yoga C940-15IRH GeForce GTX 1650 Max-Q, i7-9750H, Intel Optane Memory H10 with Solid State Storage 32GB + 512GB HBRPEKNX0202A(L/H) | Asus ZenBook 15 UX534FTC-A8190T GeForce GTX 1650 Max-Q, i7-10510U, Samsung SSD PM981 MZVLB1T0HALR | MSI Prestige 15 A10SC GeForce GTX 1650 Max-Q, i7-10710U, Samsung SSD PM981 MZVLB1T0HALR | Dell XPS 15 9500 Core i5 UHD Graphics 630, i5-10300H, Toshiba KBG40ZNS256G NVMe | |
|---|---|---|---|---|---|---|
| Noise | -2% | -0% | 4% | 3% | 9% | |
| arrêt / environnement * (dB) | 28.4 | 28.2 1% | 28.7 -1% | 30.3 -7% | 29.3 -3% | 28 1% |
| Idle Minimum * (dB) | 28.4 | 28.2 1% | 28.7 -1% | 30.3 -7% | 30.1 -6% | 28 1% |
| Idle Average * (dB) | 28.4 | 28.2 1% | 28.8 -1% | 30.3 -7% | 30.2 -6% | 28 1% |
| Idle Maximum * (dB) | 28.4 | 30.4 -7% | 28.8 -1% | 30.9 -9% | 30.2 -6% | 28 1% |
| Load Average * (dB) | 46 | 43.8 5% | 45 2% | 31.3 32% | 31.5 32% | 28 39% |
| Witcher 3 ultra * (dB) | 42 | 47.2 -12% | 44.7 -6% | 38.1 9% | 37 12% | |
| Load Maximum * (dB) | 47.1 | 47.2 -0% | 44.7 5% | 38.2 19% | 47 -0% | 41.9 11% |
* ... Moindre est la valeur, meilleures sont les performances
Degré de la nuisance sonore
| Au repos |
| 28.4 / 28.4 / 28.4 dB(A) |
| Fortement sollicité |
| 46 / 47.1 dB(A) |
 | ||
30 dB silencieux 40 dB(A) audible 50 dB(A) bruyant |
||
min: | ||
(±) La température maximale du côté supérieur est de 44 °C / 111 F, par rapport à la moyenne de 36.8 °C / 98 F, allant de 21 à 71 °C pour la classe Multimedia.
(-) Le fond chauffe jusqu'à un maximum de 48.8 °C / 120 F, contre une moyenne de 39.1 °C / 102 F
(+) En utilisation inactive, la température moyenne du côté supérieur est de 30.5 °C / 87 F, par rapport à la moyenne du dispositif de 31.3 °C / 88 F.
(-) En jouant à The Witcher 3, la température moyenne du côté supérieur est de 38.9 °C / 102 F, alors que la moyenne de l'appareil est de 31.3 °C / 88 F.
(+) Les repose-poignets et le pavé tactile atteignent la température maximale de la peau (34.4 °C / 93.9 F) et ne sont donc pas chauds.
(-) La température moyenne de la zone de l'appui-paume de dispositifs similaires était de 28.7 °C / 83.7 F (-5.7 °C / #-10.2 F).
| Éteint/en veille | |
| Au repos | |
| Fortement sollicité |
|
Légende:
min: | |
| Dell XPS 15 9500 Core i7 4K UHD i7-10875H, GeForce GTX 1650 Ti Mobile, SK Hynix PC611 512GB, IPS, 3840x2400, 15.6" | Dell XPS 15 7590 9980HK GTX 1650 i9-9980HK, GeForce GTX 1650 Mobile, Toshiba XG6 KXG60ZNV1T02, OLED, 3840x2160, 15.6" | Lenovo Yoga C940-15IRH i7-9750H, GeForce GTX 1650 Max-Q, Intel Optane Memory H10 with Solid State Storage 32GB + 512GB HBRPEKNX0202A(L/H), IPS, 1920x1080, 15.6" | Asus ZenBook 15 UX534FTC-A8190T i7-10510U, GeForce GTX 1650 Max-Q, Samsung SSD PM981 MZVLB1T0HALR, IPS, 1920x1080, 15.6" | MSI Prestige 15 A10SC i7-10710U, GeForce GTX 1650 Max-Q, Samsung SSD PM981 MZVLB1T0HALR, IPS, 3840x2160, 15.6" | Dell XPS 15 9500 Core i5 i5-10300H, UHD Graphics 630, Toshiba KBG40ZNS256G NVMe, IPS, 1920x1200, 15.6" | |
|---|---|---|---|---|---|---|
| Power Consumption | 4% | 6% | 41% | 14% | 49% | |
| Idle Minimum * (Watt) | 5.7 | 6.2 -9% | 5.2 9% | 2.8 51% | 6.1 -7% | 2.9 49% |
| Idle Average * (Watt) | 13.5 | 9.6 29% | 10.7 21% | 7.7 43% | 13.2 2% | 7.6 44% |
| Idle Maximum * (Watt) | 19.6 | 21.2 -8% | 24.3 -24% | 9.4 52% | 19.2 2% | 8 59% |
| Load Average * (Watt) | 114.1 | 104.3 9% | 84.4 26% | 57 50% | 75 34% | 41.7 63% |
| Witcher 3 ultra * (Watt) | 93 | 91.7 1% | 83.9 10% | 62 33% | 74 20% | |
| Load Maximum * (Watt) | 135.2 | 135.3 -0% | 142.8 -6% | 116 14% | 89.7 34% | 94.8 30% |
* ... Moindre est la valeur, meilleures sont les performances
| Dell XPS 15 9500 Core i7 4K UHD i7-10875H, GeForce GTX 1650 Ti Mobile, 86 Wh | Dell XPS 15 7590 9980HK GTX 1650 i9-9980HK, GeForce GTX 1650 Mobile, 97 Wh | Lenovo Yoga C940-15IRH i7-9750H, GeForce GTX 1650 Max-Q, 69 Wh | Asus ZenBook 15 UX534FTC-A8190T i7-10510U, GeForce GTX 1650 Max-Q, 71 Wh | MSI Prestige 15 A10SC i7-10710U, GeForce GTX 1650 Max-Q, 82 Wh | Dell XPS 15 9575 i5-8305G i5-8305G, Vega M GL / 870, 75 Wh | Dell XPS 15 9500 Core i5 i5-10300H, UHD Graphics 630, 56 Wh | |
|---|---|---|---|---|---|---|---|
| Autonomie de la batterie | 6% | -21% | 25% | -9% | -28% | -1% | |
| Reader / Idle (h) | 23 | 15.2 -34% | 18.2 -21% | 27.2 18% | 19.1 -17% | 11.1 -52% | 26.4 15% |
| WiFi v1.3 (h) | 9.1 | 7.8 -14% | 9.7 7% | 12.4 36% | 7.6 -16% | 9.4 3% | 9.3 2% |
| Load (h) | 2 | 3.3 65% | 1 -50% | 2.4 20% | 2.1 5% | 1.3 -35% | 1.6 -20% |
Points positifs
Points négatifs
Le XPS 15 9500 avec Core i7-10875 et GTX 1650 Ti remplace directement le XPS 15 de l'an dernier, avec Core i9-9980HK et GTX 1650. Du point de vu des performances, le nouveau modèle est légèrement plus puissant, sans chauffer plus ni être plus bruyant. Ceux qui espéraient une expérience plus discrète ou plus fraîche devront revoir leurs attentes, la consommation et le niveau sonore restant les mêmes d'une génération à l'autre.
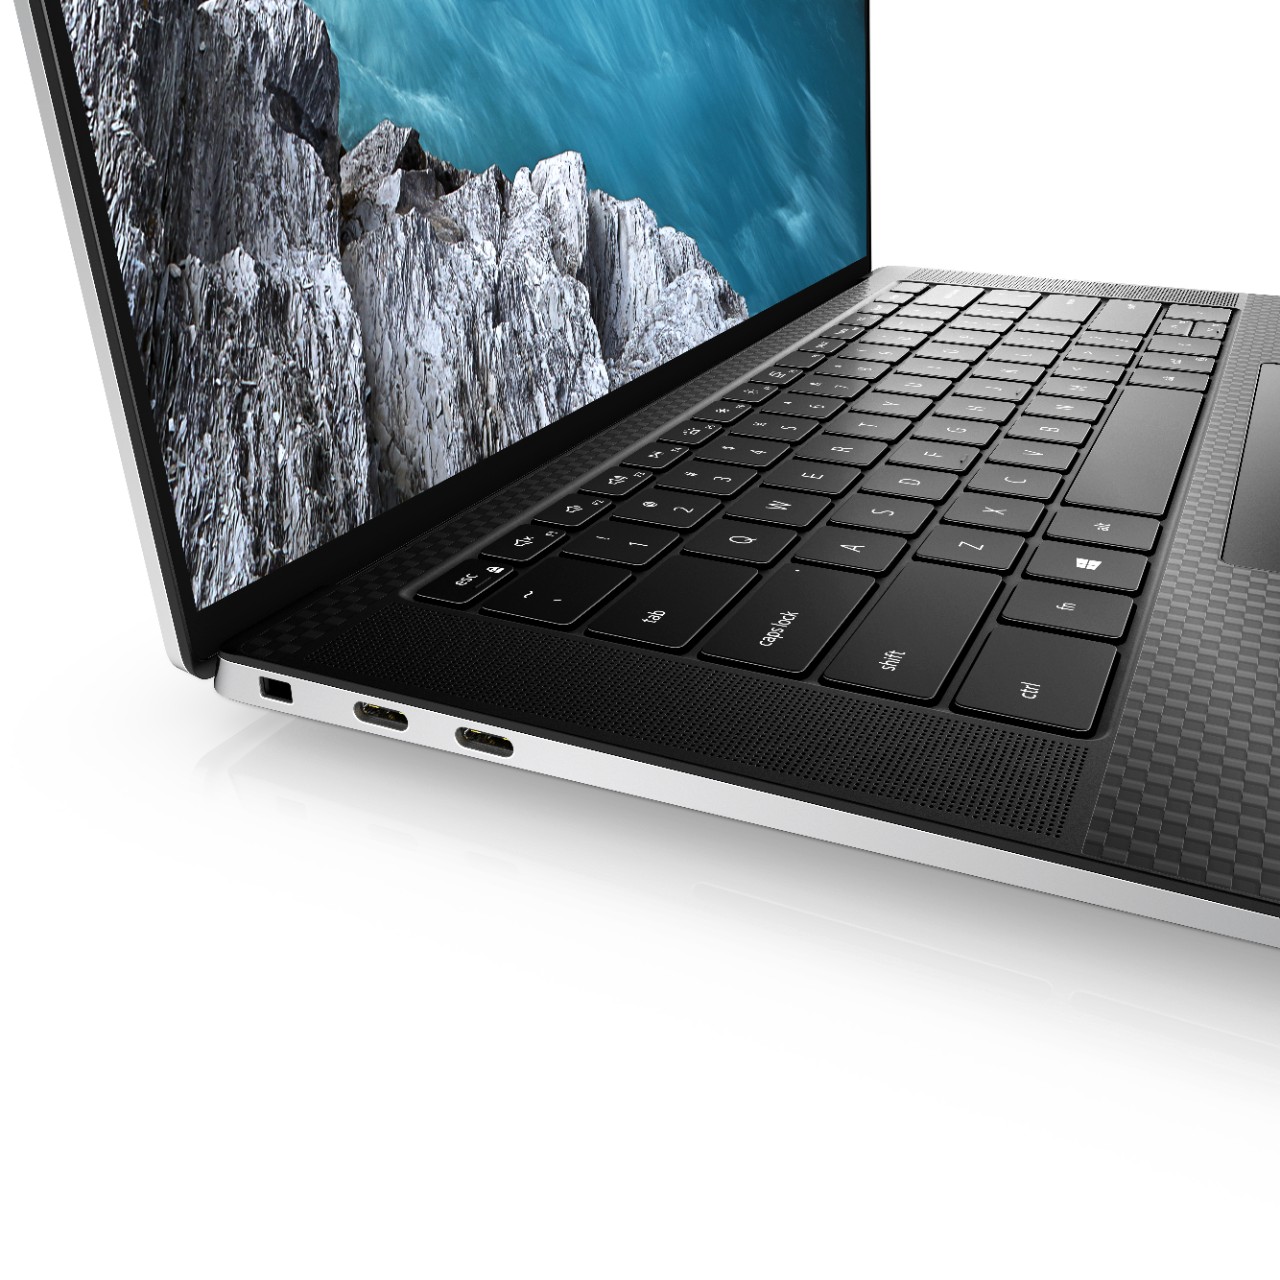
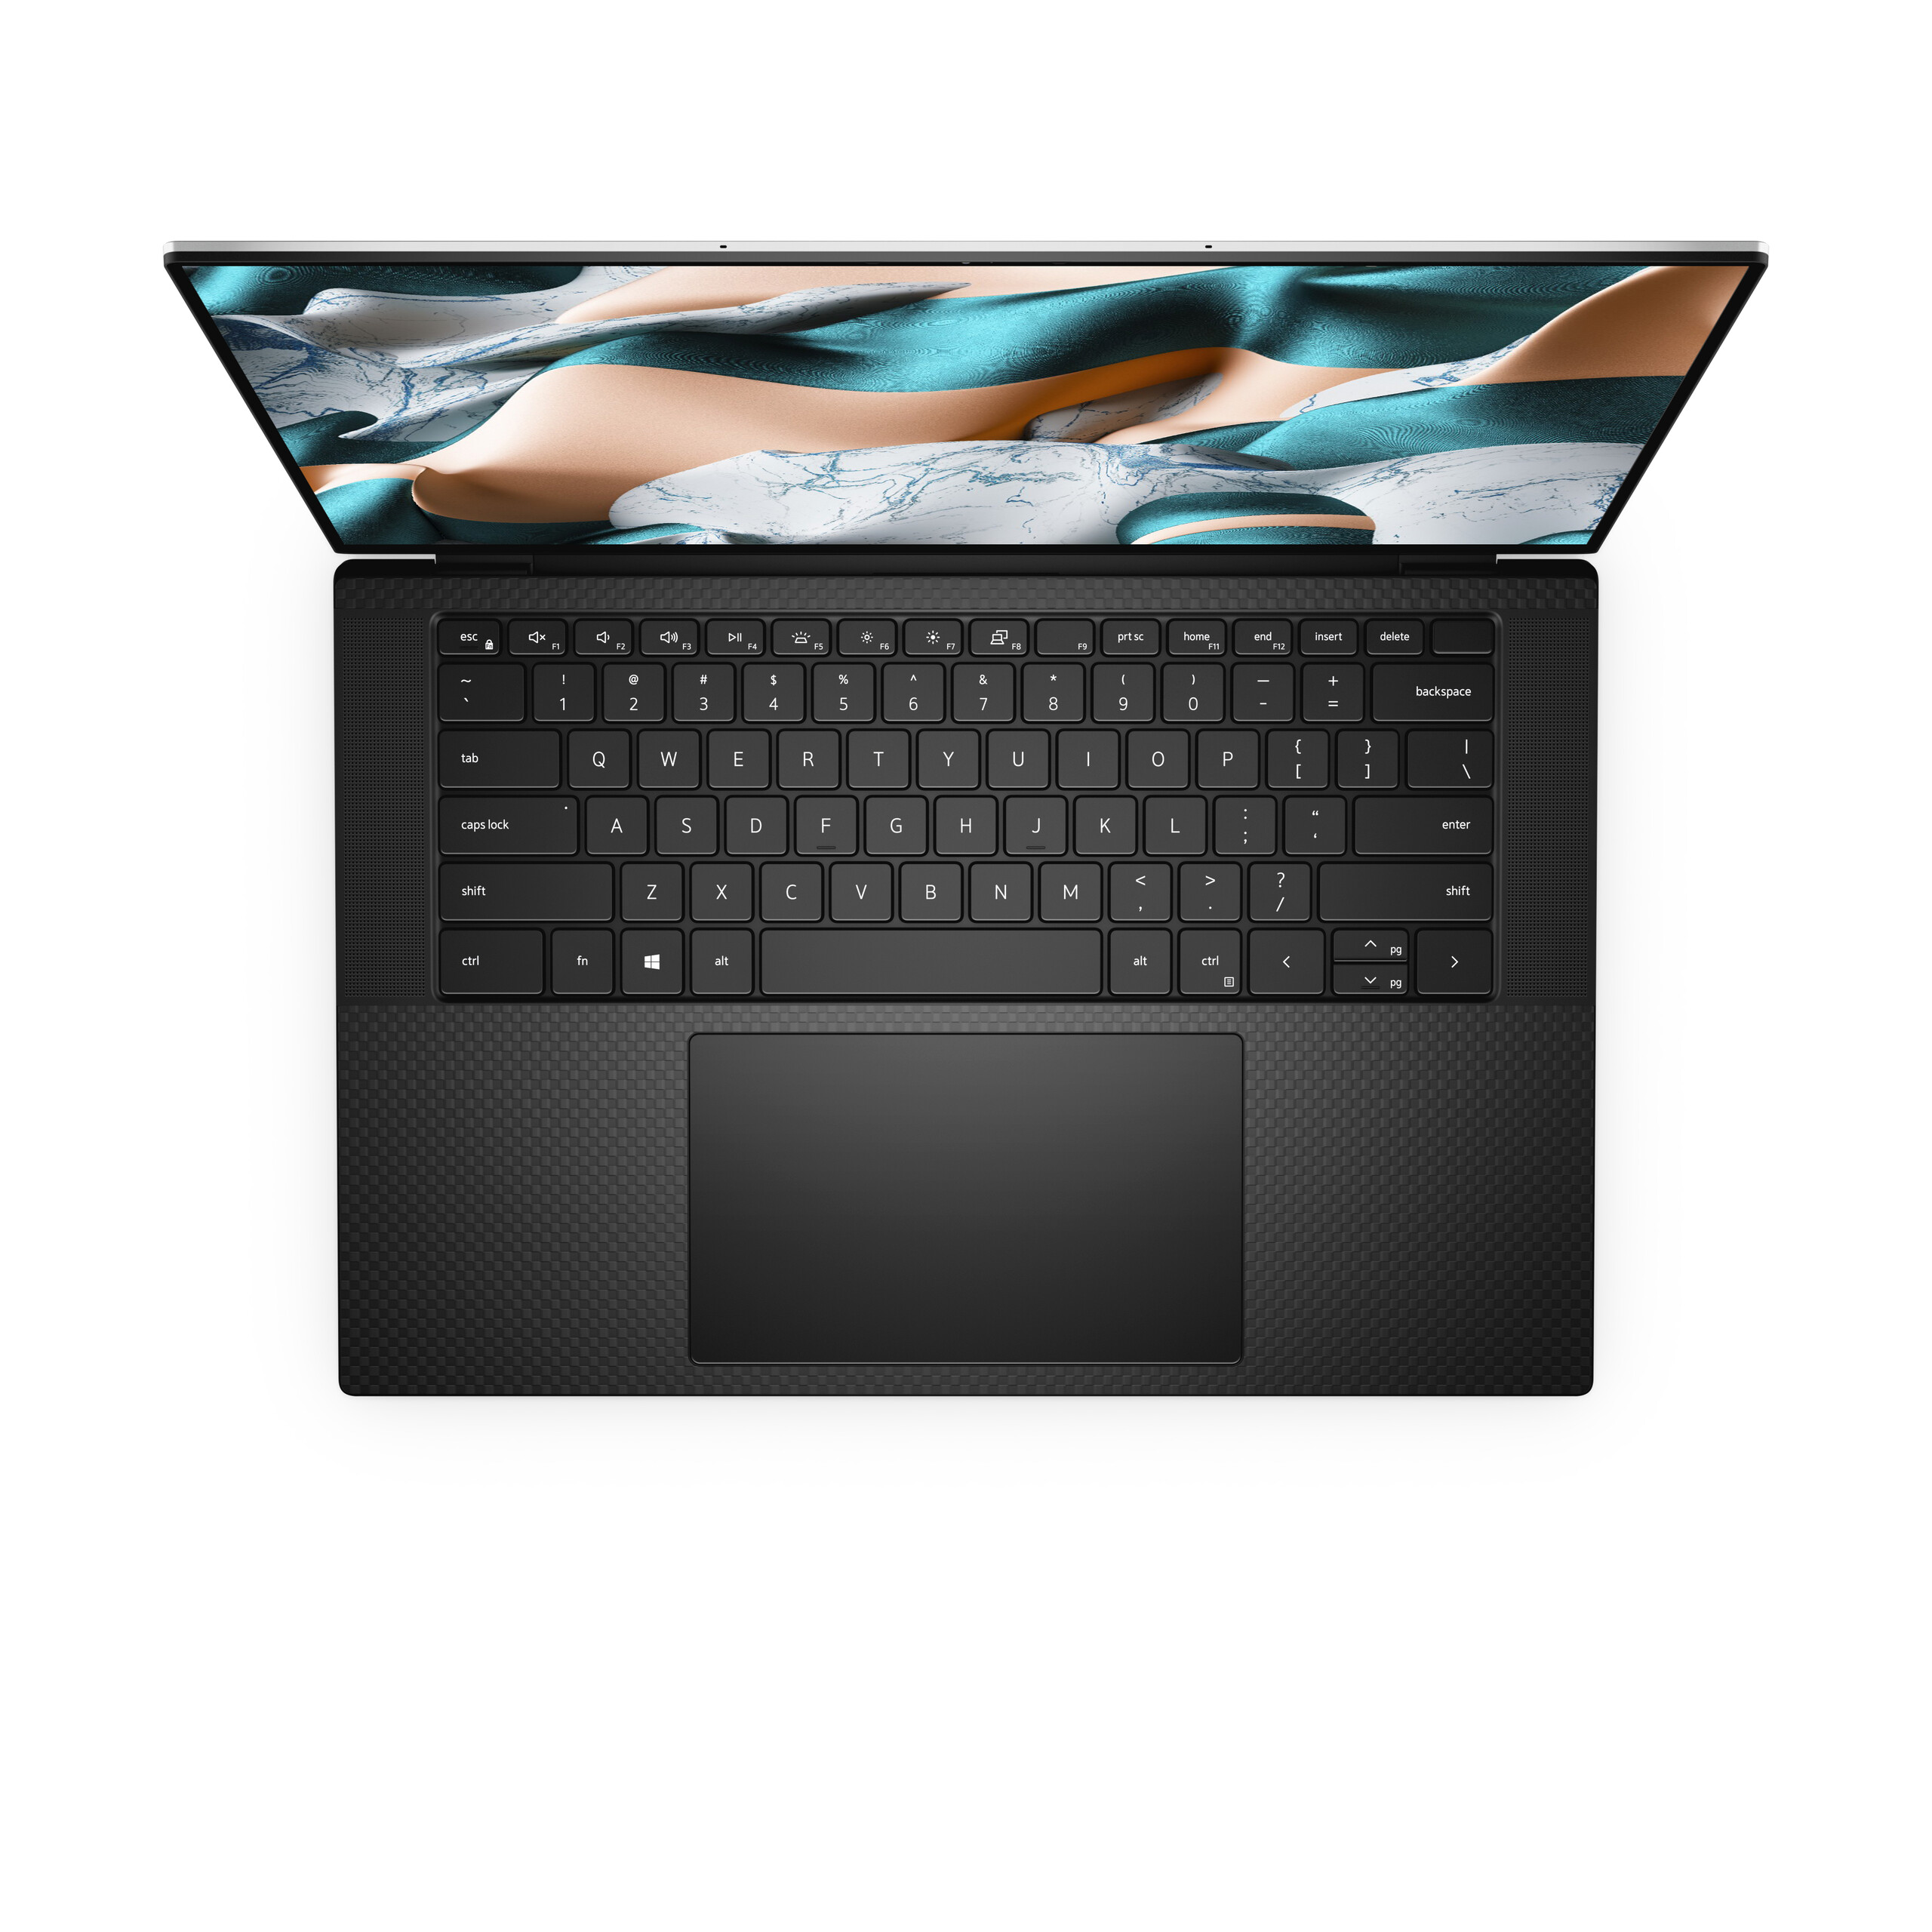
La meilleure raison de choisir le XPS 15 9500 sur l'ancien XPS 15 7590 reste l'écran 16:10, ce changement étant tout de suite visible et bénéfique pour l'utilisateur final, en plus des gains mineurs de performances du processeur et de la carte graphique. Les autres évolutions physiques, comme les dimensions légèrement réduites, le plus grand clickpad, l'audio amélioré, et le meilleur retour des touches du clavier, participent à faire progresser l'appareil. Nos principales critiques restent avant tout la dépendance à l’USBC C et la stabilité des performances de la carte graphique en jeu. Heureusement le premier problème peut être corrigé par des adaptateurs, et ceux qui seraient gênés par le deuxième peuvent se tourner vers des appareils Alienware ou MSI, avec des performances graphiques plus stables et souvent plus élevées.
Le XPS 15 2016 était à l’avant-garde des ultrabooks aux bordures étroites, et il en sera certainement de même pour le XPS 15 2020 avec les écrans 16:10. Cela seulement suffit à différencier le XPS 15 9500 des autres ultrabooks Core H, bien plus que n’importe quelle différence de processeur…
L’intégralité de cette critique est disponible en anglais en suivant ce lien.
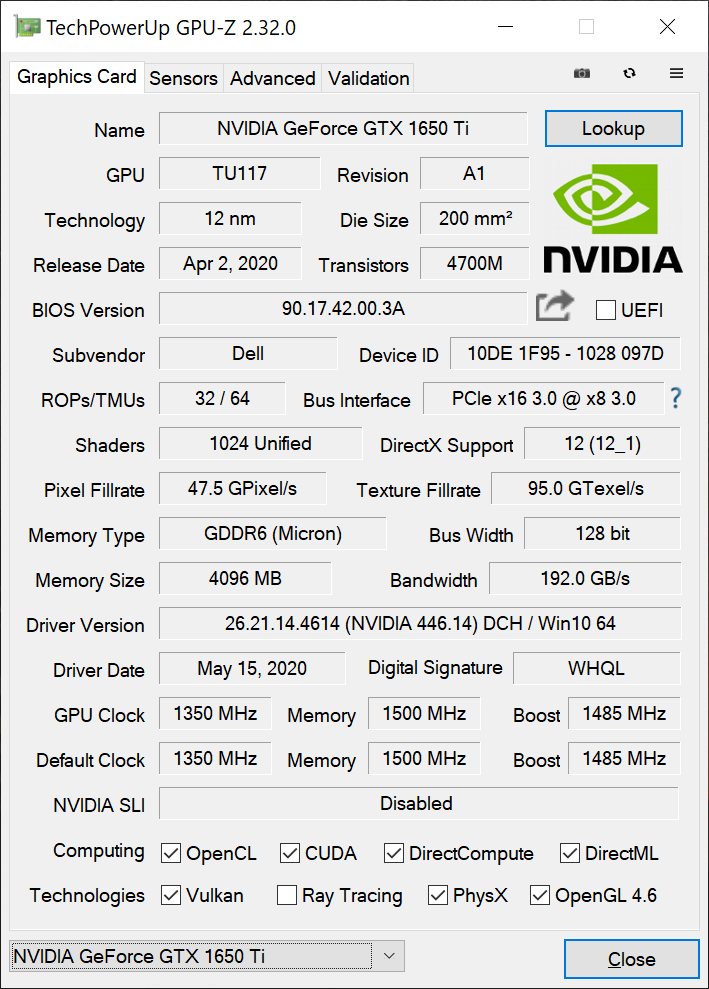
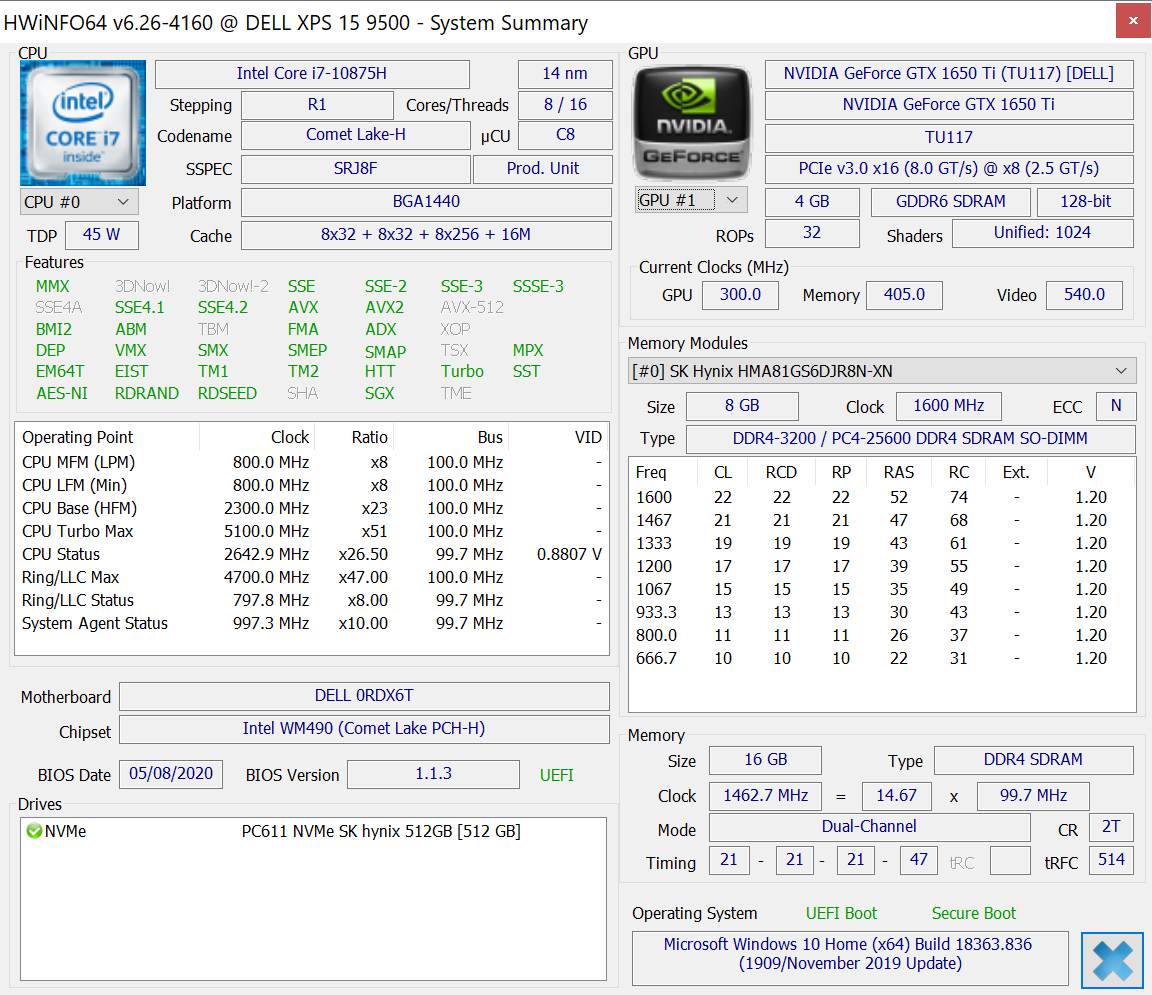
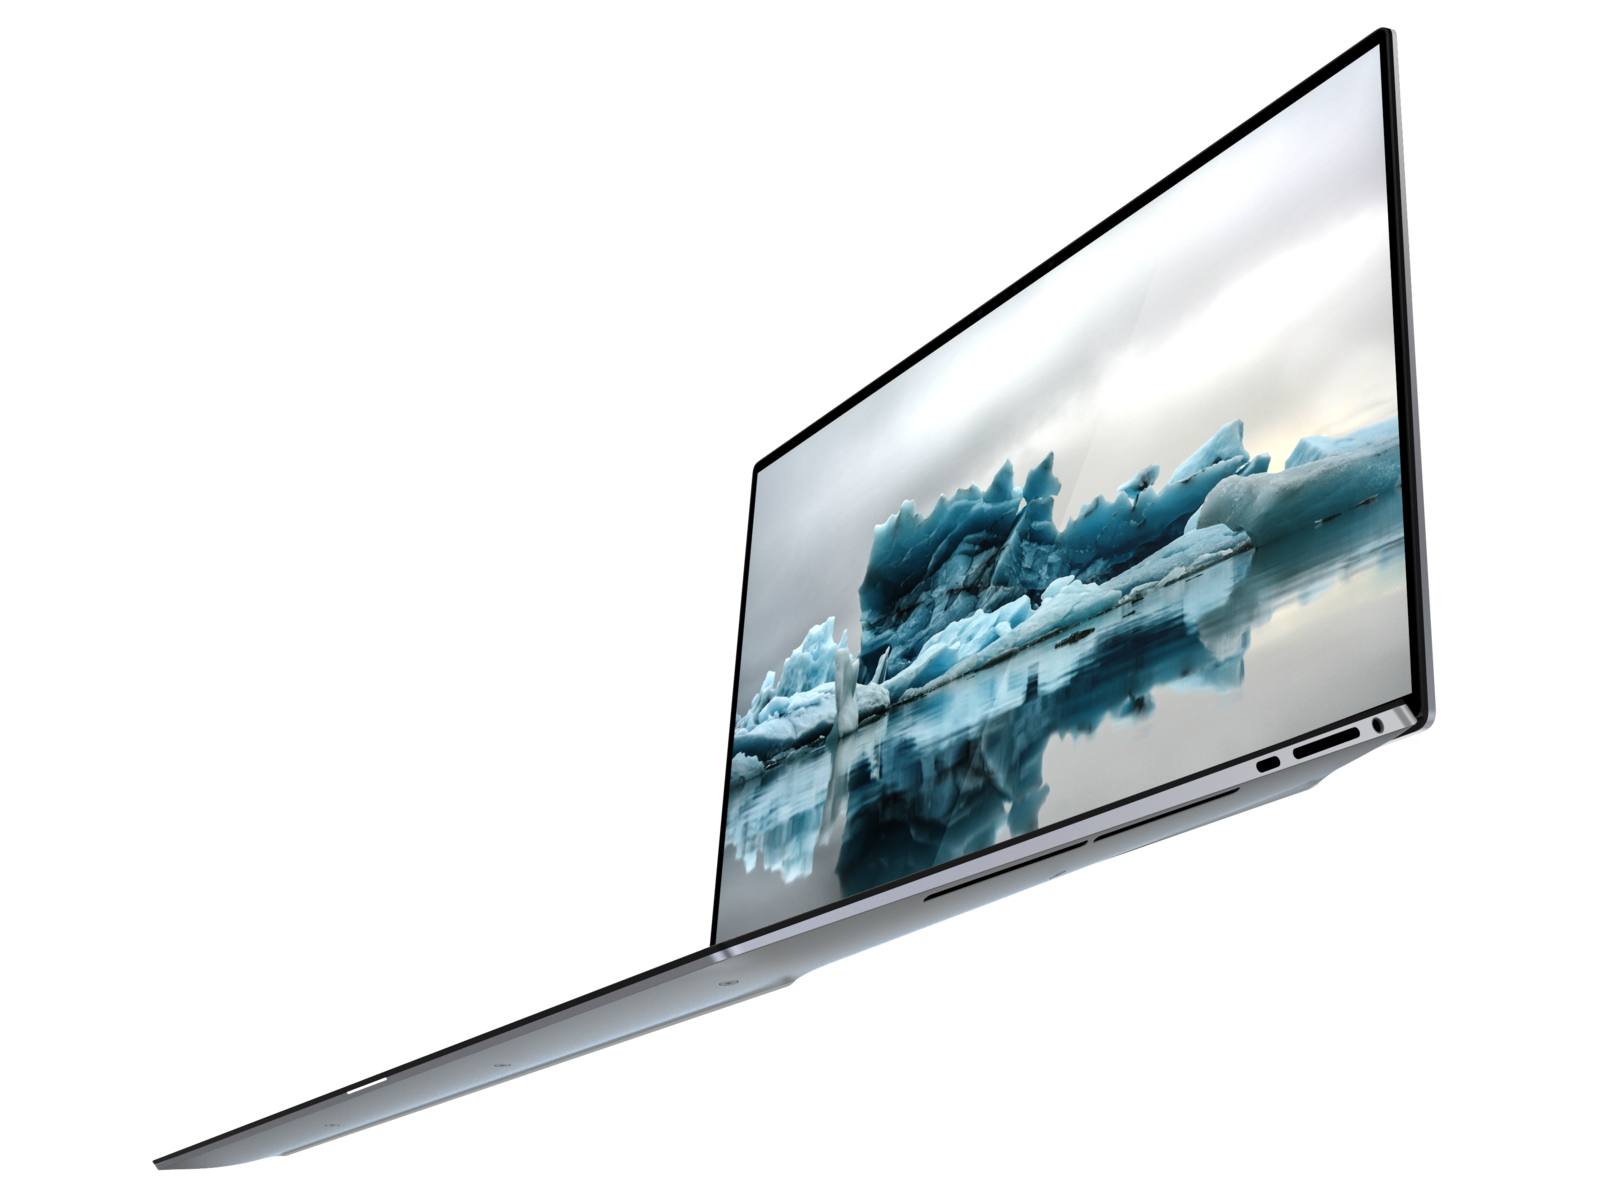
Dell XPS 15 9500 Core i7 4K UHD
- 06/09/2020 v7 (old)
Allen Ngo
Price comparison
