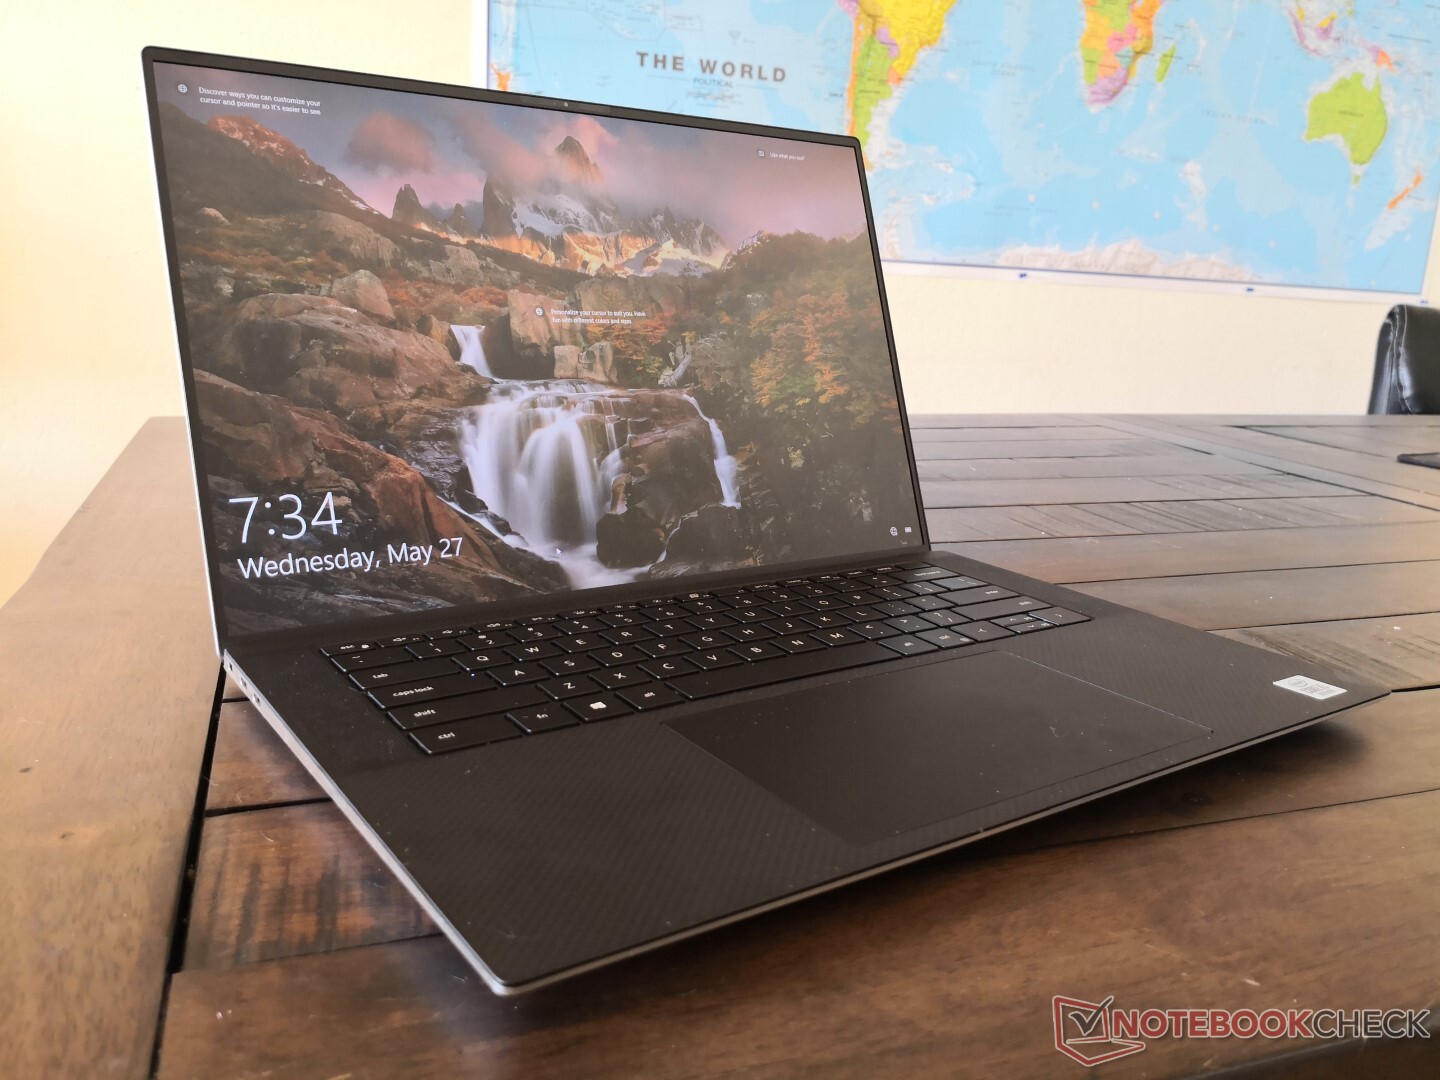
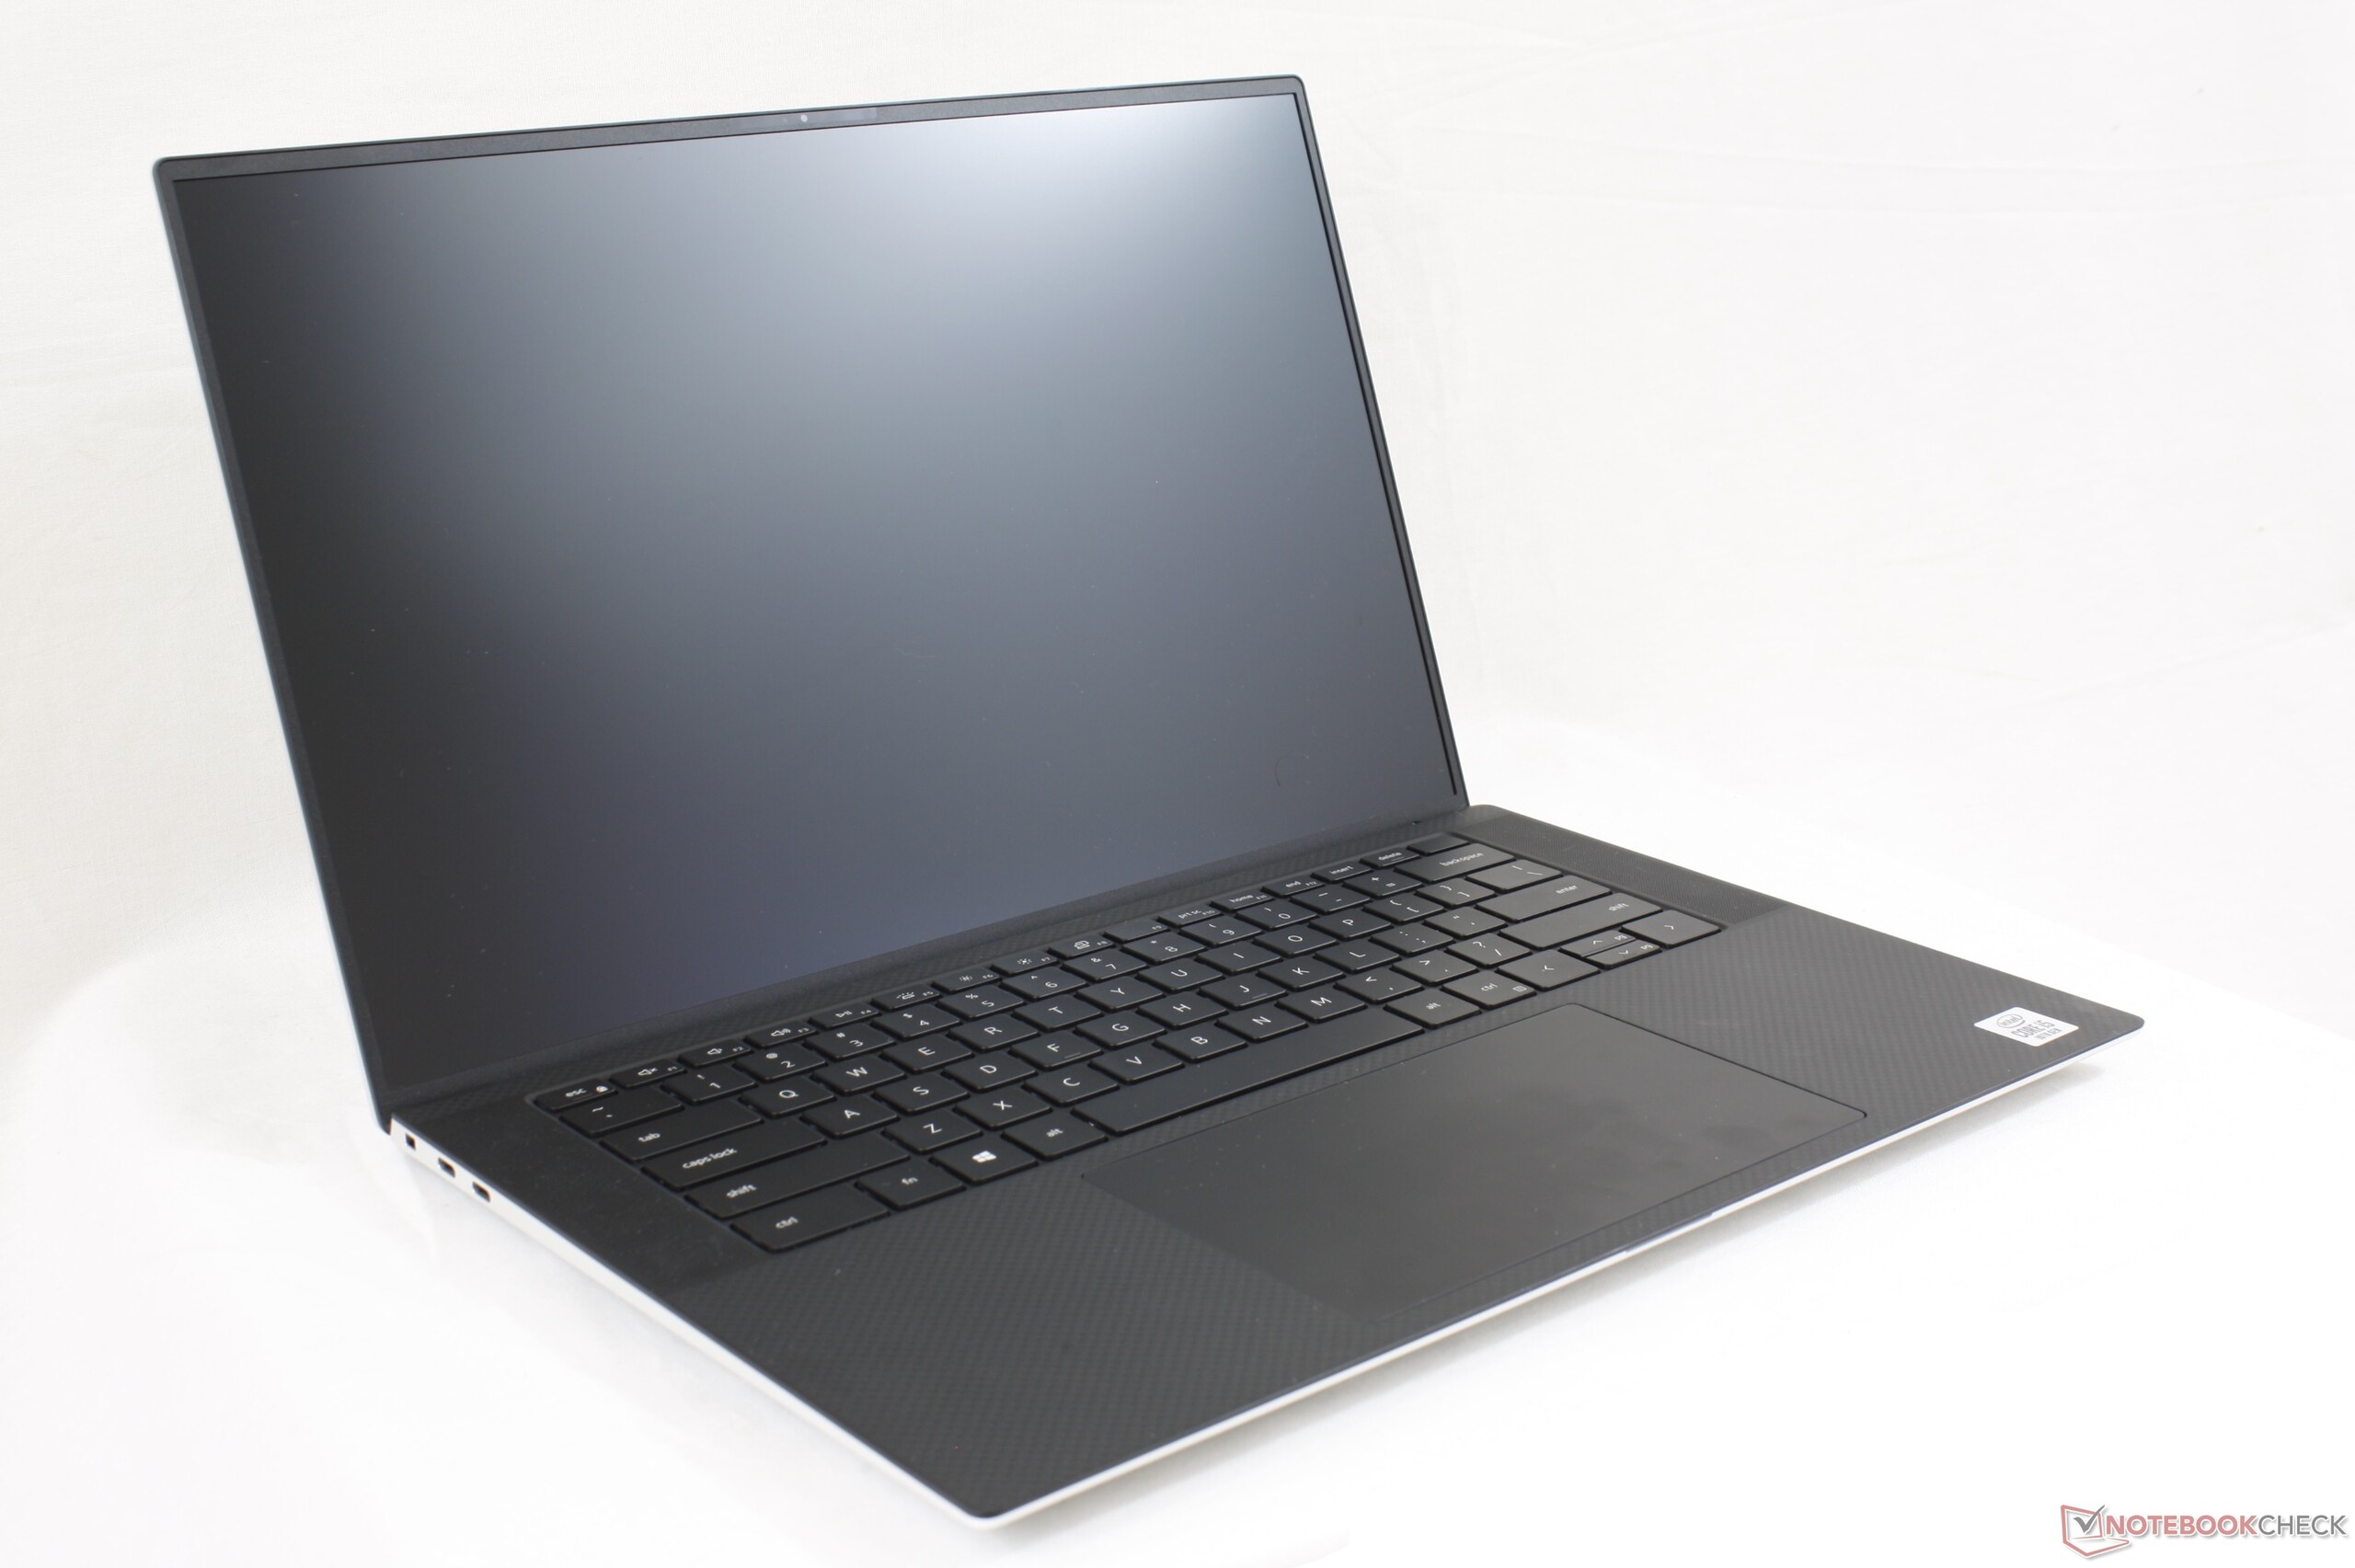
Test du Dell XPS 15 9500 (i5-10300H, UHD 630, FHD) : encore plus proche du MacBook Pro
Note | Date | Modèle | Poids | Épaisseur | Taille | Résolution | Prix |
|---|---|---|---|---|---|---|---|
| 86.8 % v7 (old) | 07/20 | Dell XPS 15 9500 Core i5 i5-10300H, UHD Graphics 630 | 1.8 kg | 18 mm | 15.60" | 1920x1200 | |
| 85.2 % v7 (old) | 04/20 | Asus ZenBook 15 UX534FTC-A8190T i7-10510U, GeForce GTX 1650 Max-Q | 1.6 kg | 18.9 mm | 15.60" | 1920x1080 | |
| 86 % v7 (old) | 12/19 | Lenovo Yoga C940-15IRH i7-9750H, GeForce GTX 1650 Max-Q | 2 kg | 19.7 mm | 15.60" | 1920x1080 | |
| 85 % v7 (old) | 01/20 | HP Spectre X360 15-5ZV31AV i7-10510U, GeForce MX250 | 2.1 kg | 19.3 mm | 15.60" | 3840x2160 | |
| 89.7 % v7 (old) | 04/20 | Apple MacBook Pro 16 2019 i9 5500M i9-9880H, Radeon Pro 5500M | 2 kg | 16.2 mm | 16.00" | 3072x1920 |
| SD Card Reader | |
| average JPG Copy Test (av. of 3 runs) | |
| Dell XPS 15 9500 Core i5 (Toshiba Exceria Pro SDXC 64 GB UHS-II) | |
| Razer Blade Pro 17 4K UHD 120 Hz (Toshiba Exceria Pro SDXC 64 GB UHS-II) | |
| Dell XPS 15 7590 i5 iGPU FHD (Toshiba Exceria Pro SDXC 64 GB UHS-II) | |
| HP Spectre X360 15-5ZV31AV (Toshiba Exceria Pro M501 UHS-II) | |
| maximum AS SSD Seq Read Test (1GB) | |
| Dell XPS 15 9500 Core i5 (Toshiba Exceria Pro SDXC 64 GB UHS-II) | |
| Razer Blade Pro 17 4K UHD 120 Hz (Toshiba Exceria Pro SDXC 64 GB UHS-II) | |
| Dell XPS 15 7590 i5 iGPU FHD (Toshiba Exceria Pro SDXC 64 GB UHS-II) | |
| HP Spectre X360 15-5ZV31AV (Toshiba Exceria Pro M501 UHS-II) | |


| |||||||||||||||||||||||||
Homogénéité de la luminosité: 85 %
Valeur mesurée au centre, sur batterie: 592 cd/m²
Contraste: 1287:1 (Valeurs des noirs: 0.46 cd/m²)
ΔE ColorChecker Calman: 3.19 | ∀{0.5-29.43 Ø4.73}
calibrated: 2.03
ΔE Greyscale Calman: 3.9 | ∀{0.09-98 Ø4.97}
100% sRGB (Argyll 1.6.3 3D)
71.6% AdobeRGB 1998 (Argyll 1.6.3 3D)
79.6% AdobeRGB 1998 (Argyll 3D)
100% sRGB (Argyll 3D)
81.5% Display P3 (Argyll 3D)
Gamma: 2.25
CCT: 6522 K
| Dell XPS 15 9500 Core i5 Sharp LQ156N1, IPS, 15.6", 1920x1200 | Dell XPS 15 7590 i5 iGPU FHD LQ156M1, IPS, 15.6", 1920x1080 | Asus ZenBook 15 UX534FTC-A8190T BOE CQ NV156FHM-N63, IPS, 15.6", 1920x1080 | Lenovo Yoga C940-15IRH LG Philips LP156WFC-SPU1, IPS, 15.6", 1920x1080 | HP Spectre X360 15-5ZV31AV AU Optronics AUO30EB, IPS, 15.6", 3840x2160 | Apple MacBook Pro 16 2019 i9 5500M APPA044, IPS, 16", 3072x1920 | |
|---|---|---|---|---|---|---|
| Display | -11% | -18% | -17% | -12% | ||
| Display P3 Coverage (%) | 81.5 | 66.5 -18% | 65 -20% | 61.5 -25% | 68.3 -16% | |
| sRGB Coverage (%) | 100 | 98 -2% | 86.2 -14% | 92.7 -7% | 94.3 -6% | |
| AdobeRGB 1998 Coverage (%) | 79.6 | 68.4 -14% | 62.9 -21% | 63.6 -20% | 68.4 -14% | |
| Response Times | -19% | -9% | -21% | -39% | -23% | |
| Response Time Grey 50% / Grey 80% * (ms) | 42 ? | 52.8 ? -26% | 45 ? -7% | 48.4 ? -15% | 56.8 ? -35% | 52.4 ? -25% |
| Response Time Black / White * (ms) | 28.8 ? | 32 ? -11% | 32 ? -11% | 36.4 ? -26% | 40.8 ? -42% | 34.9 ? -21% |
| PWM Frequency (Hz) | 1020 ? | 131700 | ||||
| Screen | 7% | -17% | -6% | -12% | 14% | |
| Brightness middle (cd/m²) | 592 | 588 -1% | 299 -49% | 484.8 -18% | 284.6 -52% | 519 -12% |
| Brightness (cd/m²) | 565 | 555 -2% | 280 -50% | 463 -18% | 285 -50% | 477 -16% |
| Brightness Distribution (%) | 85 | 89 5% | 89 5% | 82 -4% | 85 0% | 86 1% |
| Black Level * (cd/m²) | 0.46 | 0.4 13% | 0.21 54% | 0.26 43% | 0.25 46% | 0.39 15% |
| Contrast (:1) | 1287 | 1470 14% | 1424 11% | 1865 45% | 1138 -12% | 1331 3% |
| Colorchecker dE 2000 * | 3.19 | 2.5 22% | 4.76 -49% | 4.5 -41% | 3.52 -10% | 2.28 29% |
| Colorchecker dE 2000 max. * | 5.45 | 6.3 -16% | 9 -65% | 7.55 -39% | 5.56 -2% | 6.54 -20% |
| Colorchecker dE 2000 calibrated * | 2.03 | 0.6 70% | 1.19 41% | 3 -48% | 0.86 58% | |
| Greyscale dE 2000 * | 3.9 | 4.5 -15% | 3.53 9% | 5.7 -46% | 3.2 18% | 0.9 77% |
| Gamma | 2.25 98% | 2.2 100% | 2.3 96% | 2.45 90% | 2.28 96% | 2145 0% |
| CCT | 6522 100% | 6836 95% | 7228 90% | 6101 107% | 7070 92% | 6572 99% |
| Color Space (Percent of AdobeRGB 1998) (%) | 71.6 | 63.2 -12% | 56 -22% | 58.7 -18% | 61.1 -15% | 78 9% |
| Color Space (Percent of sRGB) (%) | 100 | 98 -2% | 86 -14% | 92.8 -7% | 93.8 -6% | |
| Moyenne finale (programmes/paramètres) | -8% /
0% | -15% /
-16% | -15% /
-10% | -21% /
-15% | -5% /
8% |
* ... Moindre est la valeur, meilleures sont les performances
Temps de réponse de l'écran
| ↔ Temps de réponse noir à blanc | ||
|---|---|---|
| 28.8 ms ... hausse ↗ et chute ↘ combinées | ↗ 15.2 ms hausse | 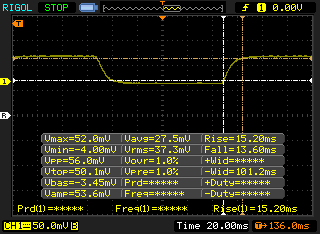 |
| ↘ 13.6 ms chute | ||
| L'écran souffre de latences relativement élevées, insuffisant pour le jeu. En comparaison, tous les appareils testés affichent entre 0.1 (minimum) et 240 (maximum) ms. » 76 % des appareils testés affichent de meilleures performances. Cela signifie que les latences relevées sont moins bonnes que la moyenne (19.9 ms) de tous les appareils testés. | ||
| ↔ Temps de réponse gris 50% à gris 80% | ||
| 42 ms ... hausse ↗ et chute ↘ combinées | ↗ 20 ms hausse | 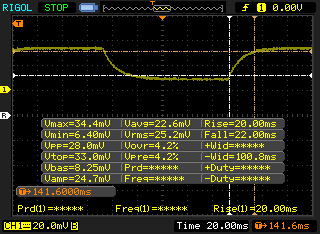 |
| ↘ 22 ms chute | ||
| L'écran souffre de latences très élevées, à éviter pour le jeu. En comparaison, tous les appareils testés affichent entre 0.165 (minimum) et 636 (maximum) ms. » 67 % des appareils testés affichent de meilleures performances. Cela signifie que les latences relevées sont moins bonnes que la moyenne (31.1 ms) de tous les appareils testés. | ||
Scintillement / MLI (Modulation de largeur d'impulsion)
| Scintillement / MLI (Modulation de largeur d'impulsion) non décelé | 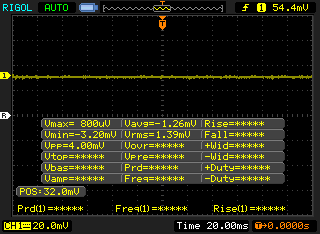 | ||
En comparaison, 52 % des appareils testés n'emploient pas MDI pour assombrir leur écran. Nous avons relevé une moyenne à 7797 (minimum : 5 - maximum : 343500) Hz dans le cas où une MDI était active. | |||
Cinebench R15: CPU Multi 64Bit | CPU Single 64Bit
Blender: v2.79 BMW27 CPU
7-Zip 18.03: 7z b 4 -mmt1 | 7z b 4
Geekbench 5.5: Single-Core | Multi-Core
HWBOT x265 Benchmark v2.2: 4k Preset
LibreOffice : 20 Documents To PDF
R Benchmark 2.5: Overall mean
| Cinebench R20 / CPU (Multi Core) | |
| Eluktronics RP-15 | |
| Gigabyte Aero 15 OLED XB-8DE51B0SP | |
| Dell XPS 15 7590 9980HK GTX 1650 | |
| Acer Predator Triton 500 PT515-52-70N3 | |
| Dell G5 15 5590 | |
| Lenovo IdeaPad S740-15IRH | |
| Gigabyte Aero 15-Y9 | |
| Dell XPS 15 9500 Core i5 | |
| Moyenne Intel Core i5-10300H (1397 - 2240, n=15) | |
| Dell G5 15 5590-PCNJJ | |
| Asus TUF FX505DT-EB73 | |
| HP Pavilion Gaming 15-ec0002ng | |
| Cinebench R20 / CPU (Single Core) | |
| Gigabyte Aero 15 OLED XB-8DE51B0SP | |
| Eluktronics RP-15 | |
| Acer Predator Triton 500 PT515-52-70N3 | |
| Lenovo IdeaPad S740-15IRH | |
| Dell XPS 15 7590 9980HK GTX 1650 | |
| Dell XPS 15 9500 Core i5 | |
| Moyenne Intel Core i5-10300H (312 - 470, n=15) | |
| Dell G5 15 5590-PCNJJ | |
| Dell G5 15 5590 | |
| Gigabyte Aero 15-Y9 | |
| Asus TUF FX505DT-EB73 | |
| HP Pavilion Gaming 15-ec0002ng | |
| Cinebench R15 / CPU Multi 64Bit | |
| Eluktronics RP-15 | |
| Gigabyte Aero 15 OLED XB-8DE51B0SP | |
| Dell XPS 15 7590 9980HK GTX 1650 | |
| Acer Predator Triton 500 PT515-52-70N3 | |
| Gigabyte Aero 15-Y9 | |
| Dell G5 15 5590 | |
| Lenovo IdeaPad S740-15IRH | |
| Dell XPS 15 9500 Core i5 | |
| Moyenne Intel Core i5-10300H (536 - 921, n=17) | |
| Dell G5 15 5590-PCNJJ | |
| Asus TUF FX505DT-EB73 | |
| HP Pavilion Gaming 15-ec0002ng | |
| Lenovo IdeaPad 330-15ICH | |
| Cinebench R15 / CPU Single 64Bit | |
| Gigabyte Aero 15 OLED XB-8DE51B0SP | |
| Dell XPS 15 7590 9980HK GTX 1650 | |
| Gigabyte Aero 15-Y9 | |
| Acer Predator Triton 500 PT515-52-70N3 | |
| Lenovo IdeaPad S740-15IRH | |
| Eluktronics RP-15 | |
| Dell XPS 15 9500 Core i5 | |
| Moyenne Intel Core i5-10300H (108 - 194, n=17) | |
| Lenovo IdeaPad 330-15ICH | |
| Dell G5 15 5590-PCNJJ | |
| Dell G5 15 5590 | |
| Asus TUF FX505DT-EB73 | |
| HP Pavilion Gaming 15-ec0002ng | |
| Blender / v2.79 BMW27 CPU | |
| Moyenne Intel Core i5-10300H (479 - 555, n=14) | |
| Dell XPS 15 9500 Core i5 | |
| Acer Predator Triton 500 PT515-52-70N3 | |
| Gigabyte Aero 15 OLED XB-8DE51B0SP | |
| Eluktronics RP-15 | |
| 7-Zip 18.03 / 7z b 4 -mmt1 | |
| Gigabyte Aero 15 OLED XB-8DE51B0SP | |
| Acer Predator Triton 500 PT515-52-70N3 | |
| Dell XPS 15 9500 Core i5 | |
| Eluktronics RP-15 | |
| Moyenne Intel Core i5-10300H (2945 - 4956, n=14) | |
| 7-Zip 18.03 / 7z b 4 | |
| Eluktronics RP-15 | |
| Gigabyte Aero 15 OLED XB-8DE51B0SP | |
| Acer Predator Triton 500 PT515-52-70N3 | |
| Dell XPS 15 9500 Core i5 | |
| Moyenne Intel Core i5-10300H (15146 - 24841, n=14) | |
| Geekbench 5.5 / Single-Core | |
| Gigabyte Aero 15 OLED XB-8DE51B0SP | |
| Acer Predator Triton 500 PT515-52-70N3 | |
| Eluktronics RP-15 | |
| Dell XPS 15 9500 Core i5 | |
| Moyenne Intel Core i5-10300H (703 - 1241, n=16) | |
| HP Pavilion Gaming 15-ec0002ng | |
| Geekbench 5.5 / Multi-Core | |
| Eluktronics RP-15 | |
| Gigabyte Aero 15 OLED XB-8DE51B0SP | |
| Acer Predator Triton 500 PT515-52-70N3 | |
| Dell XPS 15 9500 Core i5 | |
| Moyenne Intel Core i5-10300H (2783 - 4728, n=16) | |
| HP Pavilion Gaming 15-ec0002ng | |
| HWBOT x265 Benchmark v2.2 / 4k Preset | |
| Eluktronics RP-15 | |
| Gigabyte Aero 15 OLED XB-8DE51B0SP | |
| Acer Predator Triton 500 PT515-52-70N3 | |
| Dell XPS 15 9500 Core i5 | |
| Moyenne Intel Core i5-10300H (6.13 - 7.78, n=14) | |
| LibreOffice / 20 Documents To PDF | |
| Dell XPS 15 9500 Core i5 | |
| Eluktronics RP-15 | |
| Moyenne Intel Core i5-10300H (23.9 - 94, n=14) | |
| Gigabyte Aero 15 OLED XB-8DE51B0SP | |
| Acer Predator Triton 500 PT515-52-70N3 | |
| R Benchmark 2.5 / Overall mean | |
| Moyenne Intel Core i5-10300H (0.625 - 1.088, n=14) | |
| Dell XPS 15 9500 Core i5 | |
| Acer Predator Triton 500 PT515-52-70N3 | |
| Eluktronics RP-15 | |
| Gigabyte Aero 15 OLED XB-8DE51B0SP | |
Cinebench R15: CPU Multi 64Bit | CPU Single 64Bit
Blender: v2.79 BMW27 CPU
7-Zip 18.03: 7z b 4 -mmt1 | 7z b 4
Geekbench 5.5: Single-Core | Multi-Core
HWBOT x265 Benchmark v2.2: 4k Preset
LibreOffice : 20 Documents To PDF
R Benchmark 2.5: Overall mean
* ... Moindre est la valeur, meilleures sont les performances
| PCMark 8 Home Score Accelerated v2 | 3842 points | |
| PCMark 8 Work Score Accelerated v2 | 5271 points | |
| PCMark 10 Score | 4329 points | |
Aide | ||
| DPC Latencies / LatencyMon - interrupt to process latency (max), Web, Youtube, Prime95 | |
| HP ProBook 430 G7-8VU53EA | |
| Dell XPS 15 9500 Core i5 | |
| Razer Blade 15 RZ09-0328 | |
| Asus ZenBook Flip 14 UX463FA-AI039T | |
* ... Moindre est la valeur, meilleures sont les performances
| Dell XPS 15 9500 Core i5 Toshiba KBG40ZNS256G NVMe | Dell XPS 15 7590 i5 iGPU FHD Toshiba XG6 KXG60ZNV512G | Asus ZenBook 15 UX534FTC-A8190T Samsung SSD PM981 MZVLB1T0HALR | Lenovo Yoga C940-15IRH Intel Optane Memory H10 with Solid State Storage 32GB + 512GB HBRPEKNX0202A(L/H) | HP Spectre X360 15-5ZV31AV Intel SSD 660p 2TB SSDPEKNW020T8 | Apple MacBook Pro 16 2019 i9 5500M Apple SSD AP1024 7171 | |
|---|---|---|---|---|---|---|
| AS SSD | 109% | 112% | 38% | 62% | 122% | |
| Seq Read (MB/s) | 1423 | 2357 66% | 2643 86% | 769 -46% | 1220 -14% | 2531 78% |
| Seq Write (MB/s) | 766 | 1235 61% | 1533 100% | 351.1 -54% | 1152 50% | 2289 199% |
| 4K Read (MB/s) | 42.21 | 43.29 3% | 49.12 16% | 69.1 64% | 52.3 24% | 15.85 -62% |
| 4K Write (MB/s) | 74.8 | 99.7 33% | 134.7 80% | 100.9 35% | 146.6 96% | 39.88 -47% |
| 4K-64 Read (MB/s) | 973 | 1020 5% | 1028 6% | 472 -51% | 652 -33% | 1267 30% |
| 4K-64 Write (MB/s) | 218.8 | 1502 586% | 1353 518% | 948 333% | 847 287% | 1749 699% |
| Access Time Read * (ms) | 0.125 | 0.07 44% | 0.033 74% | 0.071 43% | 0.077 38% | 0.122 2% |
| Access Time Write * (ms) | 0.552 | 0.039 93% | 0.028 95% | 0.137 75% | 0.106 81% | 0.095 83% |
| Score Read (Points) | 1157 | 1299 12% | 1342 16% | 618 -47% | 826 -29% | 1536 33% |
| Score Write (Points) | 370 | 1726 366% | 1641 344% | 1084 193% | 1109 200% | 2018 445% |
| Score Total (Points) | 2094 | 3640 74% | 3622 73% | 2024 -3% | 2371 13% | 4317 106% |
| Copy ISO MB/s (MB/s) | 1151 | 2145 86% | 2226 93% | 839 -27% | 2070 80% | 1995 73% |
| Copy Program MB/s (MB/s) | 499.4 | 565 13% | 506 1% | 455.8 -9% | 571 14% | 584 17% |
| Copy Game MB/s (MB/s) | 733 | 1320 80% | 1230 68% | 969 32% | 1219 66% | 1135 55% |
| CrystalDiskMark 5.2 / 6 | 32% | 48% | 25% | 25% | 33% | |
| Write 4K (MB/s) | 93.3 | 93.6 0% | 138.1 48% | 102.2 10% | 151.5 62% | 55.5 -41% |
| Read 4K (MB/s) | 45.9 | 41.87 -9% | 45.89 0% | 114.3 149% | 59.3 29% | 16.21 -65% |
| Write Seq (MB/s) | 1211 | 1698 40% | 2147 77% | 468.3 -61% | 1424 18% | 1959 62% |
| Read Seq (MB/s) | 1633 | 1978 21% | 2188 34% | 1236 -24% | 1609 -1% | 1763 8% |
| Write 4K Q32T1 (MB/s) | 273.1 | 383.1 40% | 427.8 57% | 556 104% | 393.6 44% | 398.5 46% |
| Read 4K Q32T1 (MB/s) | 356 | 326.9 -8% | 404 13% | 421.6 18% | 369.4 4% | 648 82% |
| Write Seq Q32T1 (MB/s) | 1198 | 2778 132% | 2396 100% | 1264 6% | 1946 62% | 2727 128% |
| Read Seq Q32T1 (MB/s) | 2269 | 3119 37% | 3454 52% | 2239 -1% | 1934 -15% | 3242 43% |
| Moyenne finale (programmes/paramètres) | 71% /
81% | 80% /
89% | 32% /
34% | 44% /
49% | 78% /
90% |
* ... Moindre est la valeur, meilleures sont les performances

Disk Throttling: DiskSpd Read Loop, Queue Depth 8
| 3DMark 11 Performance | 1985 points | |
| 3DMark Cloud Gate Standard Score | 9619 points | |
| 3DMark Fire Strike Score | 1095 points | |
| 3DMark Time Spy Score | 441 points | |
Aide | ||
| Bas | Moyen | Élevé | Ultra | |
|---|---|---|---|---|
| The Witcher 3 (2015) | 17.3 | 10.8 | ||
| Dota 2 Reborn (2015) | 79 | 50 | 19.7 | 17.4 |
| X-Plane 11.11 (2018) | 22.4 | 14.3 | 12.8 |
| Dell XPS 15 9500 Core i5 UHD Graphics 630, i5-10300H, Toshiba KBG40ZNS256G NVMe | Dell XPS 15 7590 i5 iGPU FHD UHD Graphics 630, i5-9300H, Toshiba XG6 KXG60ZNV512G | Asus ZenBook 15 UX534FTC-A8190T GeForce GTX 1650 Max-Q, i7-10510U, Samsung SSD PM981 MZVLB1T0HALR | Lenovo Yoga C940-15IRH GeForce GTX 1650 Max-Q, i7-9750H, Intel Optane Memory H10 with Solid State Storage 32GB + 512GB HBRPEKNX0202A(L/H) | HP Spectre X360 15-5ZV31AV GeForce MX250, i7-10510U, Intel SSD 660p 2TB SSDPEKNW020T8 | Apple MacBook Pro 16 2019 i9 5500M Radeon Pro 5500M, i9-9880H, Apple SSD AP1024 7171 | |
|---|---|---|---|---|---|---|
| Noise | -4% | -6% | -13% | -7% | -15% | |
| arrêt / environnement * (dB) | 28 | 29.3 -5% | 30.3 -8% | 28.7 -2% | 30.1 -8% | 29.8 -6% |
| Idle Minimum * (dB) | 28 | 29.3 -5% | 30.3 -8% | 28.7 -2% | 30.1 -8% | 29.9 -7% |
| Idle Average * (dB) | 28 | 29.3 -5% | 30.3 -8% | 28.8 -3% | 30.1 -8% | 29.9 -7% |
| Idle Maximum * (dB) | 28 | 29.8 -6% | 30.9 -10% | 28.8 -3% | 30.1 -8% | 29.9 -7% |
| Load Average * (dB) | 28 | 32.4 -16% | 31.3 -12% | 45 -61% | 30.1 -8% | 43 -54% |
| Load Maximum * (dB) | 41.9 | 37.2 11% | 38.2 9% | 44.7 -7% | 42 -0% | 46.1 -10% |
| Witcher 3 ultra * (dB) | 38.1 | 44.7 | 39.7 | 45.4 |
* ... Moindre est la valeur, meilleures sont les performances
Degré de la nuisance sonore
| Au repos |
| 28 / 28 / 28 dB(A) |
| Fortement sollicité |
| 28 / 41.9 dB(A) |
 | ||
30 dB silencieux 40 dB(A) audible 50 dB(A) bruyant |
||
min: | ||
(±) La température maximale du côté supérieur est de 42.4 °C / 108 F, par rapport à la moyenne de 36.8 °C / 98 F, allant de 21 à 71 °C pour la classe Multimedia.
(+) Le fond chauffe jusqu'à un maximum de 39.6 °C / 103 F, contre une moyenne de 39.1 °C / 102 F
(+) En utilisation inactive, la température moyenne du côté supérieur est de 23.2 °C / 74 F, par rapport à la moyenne du dispositif de 31.3 °C / 88 F.
(+) Les repose-poignets et le pavé tactile sont plus froids que la température de la peau avec un maximum de 28.4 °C / 83.1 F et sont donc froids au toucher.
(±) La température moyenne de la zone de l'appui-paume de dispositifs similaires était de 28.7 °C / 83.7 F (+0.3 °C / #0.6 F).
Dell XPS 15 9500 Core i5 analyse audio
(+) | les haut-parleurs peuvent jouer relativement fort (84.2# dB)
Basses 100 - 315 Hz
(+) | bonne basse - seulement 4.6% loin de la médiane
(±) | la linéarité des basses est moyenne (10% delta à la fréquence précédente)
Médiums 400 - 2000 Hz
(+) | médiane équilibrée - seulement 3.3% de la médiane
(+) | les médiums sont linéaires (4.5% delta à la fréquence précédente)
Aiguës 2 - 16 kHz
(+) | des sommets équilibrés - à seulement 2.4% de la médiane
(+) | les aigus sont linéaires (4.3% delta à la fréquence précédente)
Globalement 100 - 16 000 Hz
(+) | le son global est linéaire (7.7% différence à la médiane)
Par rapport à la même classe
» 6% de tous les appareils testés de cette catégorie étaient meilleurs, 2% similaires, 91% pires
» Le meilleur avait un delta de 5%, la moyenne était de 17%, le pire était de 45%.
Par rapport à tous les appareils testés
» 1% de tous les appareils testés étaient meilleurs, 0% similaires, 98% pires
» Le meilleur avait un delta de 4%, la moyenne était de 24%, le pire était de 134%.
Apple MacBook 12 (Early 2016) 1.1 GHz analyse audio
(+) | les haut-parleurs peuvent jouer relativement fort (83.6# dB)
Basses 100 - 315 Hz
(±) | basse réduite - en moyenne 11.3% inférieure à la médiane
(±) | la linéarité des basses est moyenne (14.2% delta à la fréquence précédente)
Médiums 400 - 2000 Hz
(+) | médiane équilibrée - seulement 2.4% de la médiane
(+) | les médiums sont linéaires (5.5% delta à la fréquence précédente)
Aiguës 2 - 16 kHz
(+) | des sommets équilibrés - à seulement 2% de la médiane
(+) | les aigus sont linéaires (4.5% delta à la fréquence précédente)
Globalement 100 - 16 000 Hz
(+) | le son global est linéaire (10.2% différence à la médiane)
Par rapport à la même classe
» 7% de tous les appareils testés de cette catégorie étaient meilleurs, 2% similaires, 91% pires
» Le meilleur avait un delta de 5%, la moyenne était de 18%, le pire était de 53%.
Par rapport à tous les appareils testés
» 5% de tous les appareils testés étaient meilleurs, 1% similaires, 94% pires
» Le meilleur avait un delta de 4%, la moyenne était de 24%, le pire était de 134%.
| Éteint/en veille | |
| Au repos | |
| Fortement sollicité |
|
Légende:
min: | |
| Dell XPS 15 9500 Core i5 i5-10300H, UHD Graphics 630, Toshiba KBG40ZNS256G NVMe, IPS, 1920x1200, 15.6" | Dell XPS 15 7590 i5 iGPU FHD i5-9300H, UHD Graphics 630, Toshiba XG6 KXG60ZNV512G, IPS, 1920x1080, 15.6" | Asus ZenBook 15 UX534FTC-A8190T i7-10510U, GeForce GTX 1650 Max-Q, Samsung SSD PM981 MZVLB1T0HALR, IPS, 1920x1080, 15.6" | Lenovo Yoga C940-15IRH i7-9750H, GeForce GTX 1650 Max-Q, Intel Optane Memory H10 with Solid State Storage 32GB + 512GB HBRPEKNX0202A(L/H), IPS, 1920x1080, 15.6" | HP Spectre X360 15-5ZV31AV i7-10510U, GeForce MX250, Intel SSD 660p 2TB SSDPEKNW020T8, IPS, 3840x2160, 15.6" | Apple MacBook Pro 16 2019 i9 5500M i9-9880H, Radeon Pro 5500M, Apple SSD AP1024 7171, IPS, 3072x1920, 16" | |
|---|---|---|---|---|---|---|
| Power Consumption | -20% | -15% | -95% | -31% | -65% | |
| Idle Minimum * (Watt) | 2.9 | 3.79 -31% | 2.8 3% | 5.2 -79% | 5.2 -79% | 3.7 -28% |
| Idle Average * (Watt) | 7.6 | 6.9 9% | 7.7 -1% | 10.7 -41% | 8.5 -12% | 12.1 -59% |
| Idle Maximum * (Watt) | 8 | 9.2 -15% | 9.4 -18% | 24.3 -204% | 8.7 -9% | 17 -113% |
| Load Average * (Watt) | 41.7 | 62 -49% | 57 -37% | 84.4 -102% | 65.6 -57% | 91.5 -119% |
| Load Maximum * (Watt) | 94.8 | 108 -14% | 116 -22% | 142.8 -51% | 92.4 3% | 102.3 -8% |
| Witcher 3 ultra * (Watt) | 62 | 83.9 | 56.5 | 103 |
* ... Moindre est la valeur, meilleures sont les performances
| Dell XPS 15 9500 Core i5 i5-10300H, UHD Graphics 630, 56 Wh | Dell XPS 15 7590 i5 iGPU FHD i5-9300H, UHD Graphics 630, 97 Wh | Asus ZenBook 15 UX534FTC-A8190T i7-10510U, GeForce GTX 1650 Max-Q, 71 Wh | Lenovo Yoga C940-15IRH i7-9750H, GeForce GTX 1650 Max-Q, 69 Wh | HP Spectre X360 15-5ZV31AV i7-10510U, GeForce MX250, 84 Wh | Apple MacBook Pro 16 2019 i9 5500M i9-9880H, Radeon Pro 5500M, 99.8 Wh | |
|---|---|---|---|---|---|---|
| Autonomie de la batterie | 29% | 29% | -21% | 28% | -4% | |
| Reader / Idle (h) | 26.4 | 27.2 3% | 18.2 -31% | 22.6 -14% | ||
| WiFi v1.3 (h) | 9.3 | 14.1 52% | 12.4 33% | 9.7 4% | 10.8 16% | 12 29% |
| Load (h) | 1.6 | 1.7 6% | 2.4 50% | 1 -37% | 2.9 81% | 1 -37% |
| Witcher 3 ultra (h) | 0.9 |
Points positifs
Points négatifs
Verdict
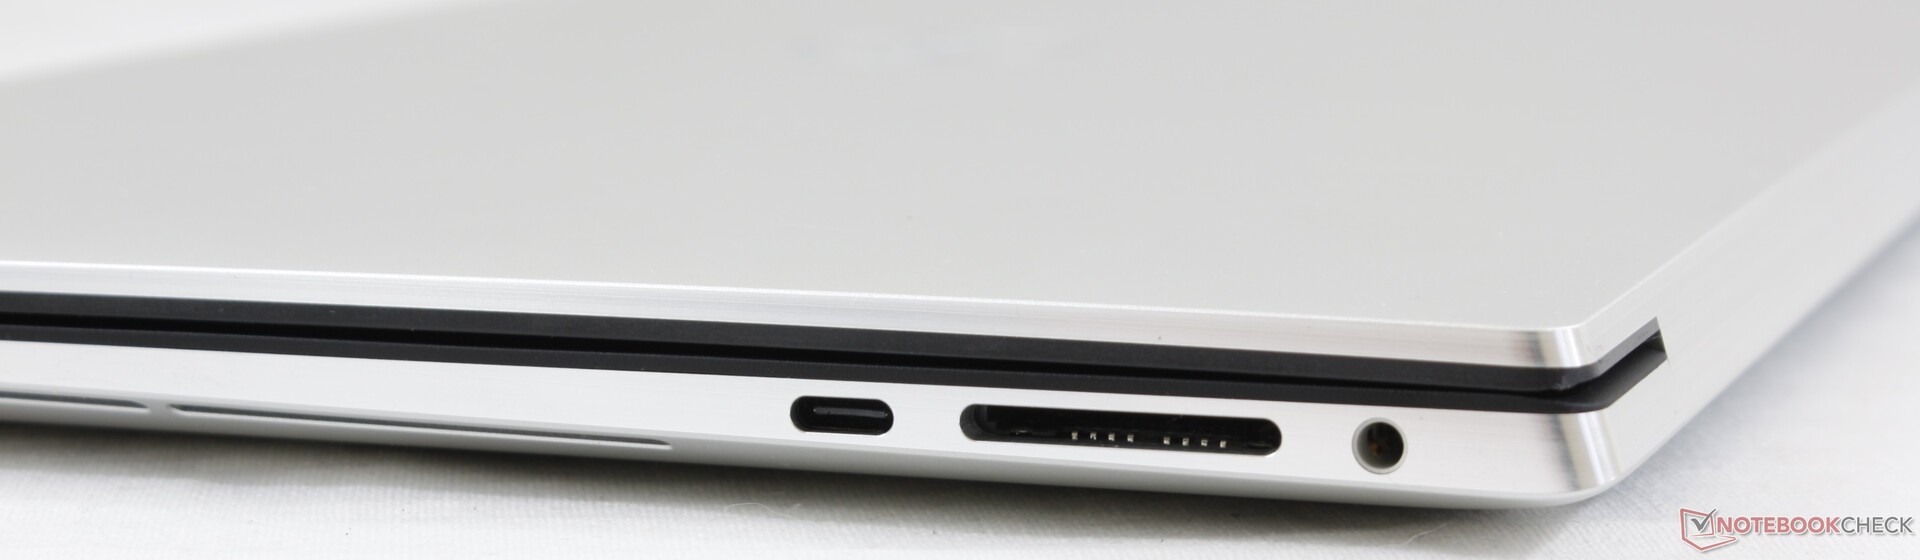
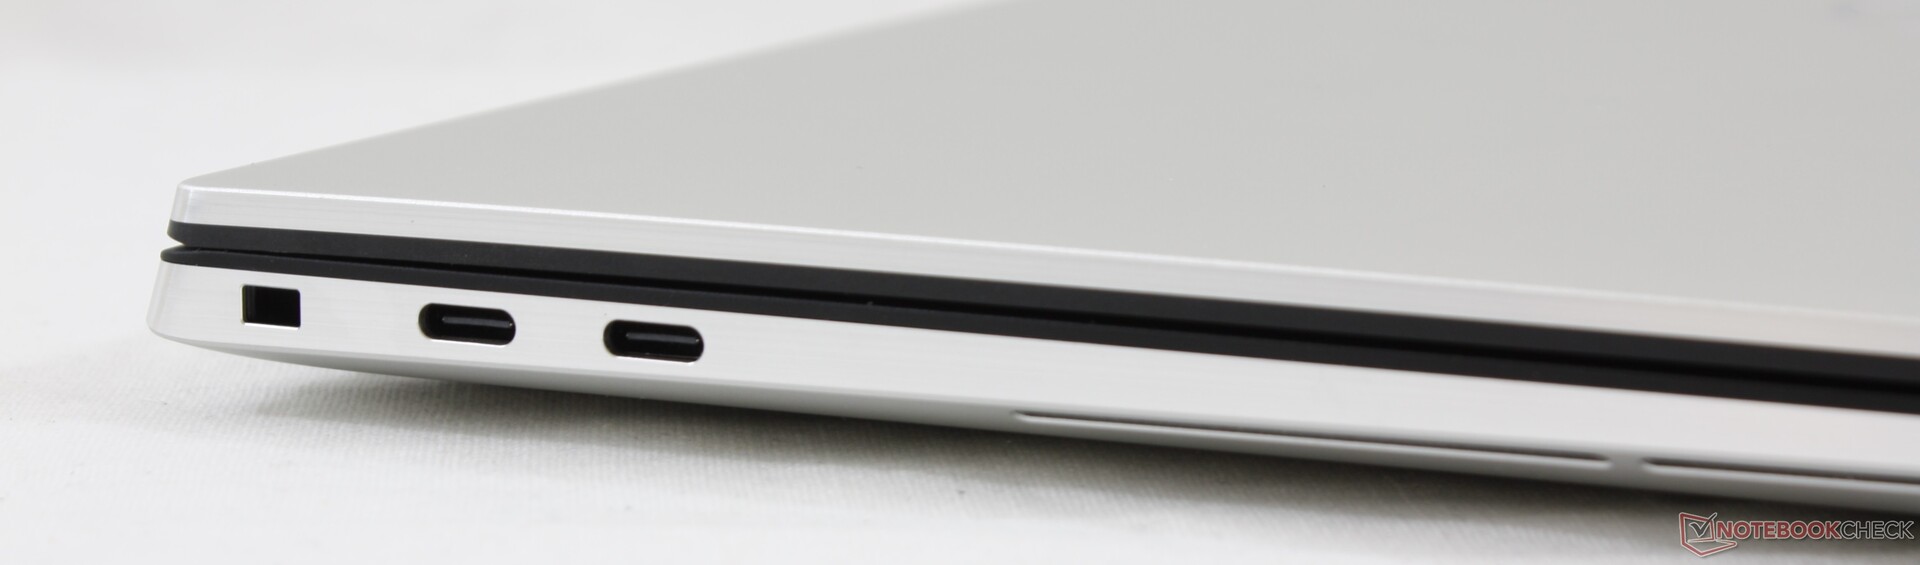
From the point of view of an average consumer, the refreshed XPS 15 checks almost all the right boxes. The bright 16:10 display, improved keyboard feedback, roomy clickpad, expanded audio system, long battery life, quiet fans, upgradeable RAM, and new secondary M.2 slot all help to make the system a joy to use. If you've been holding out on upgrading to an XPS 15, then now would be the time to reconsider because this latest revision improves upon the older design in significant ways. The omission of both HDMI and USB Type-A will inevitably be an annoyance, but at least adapters are included in every box which is more than what we can say for the MacBook Pro.
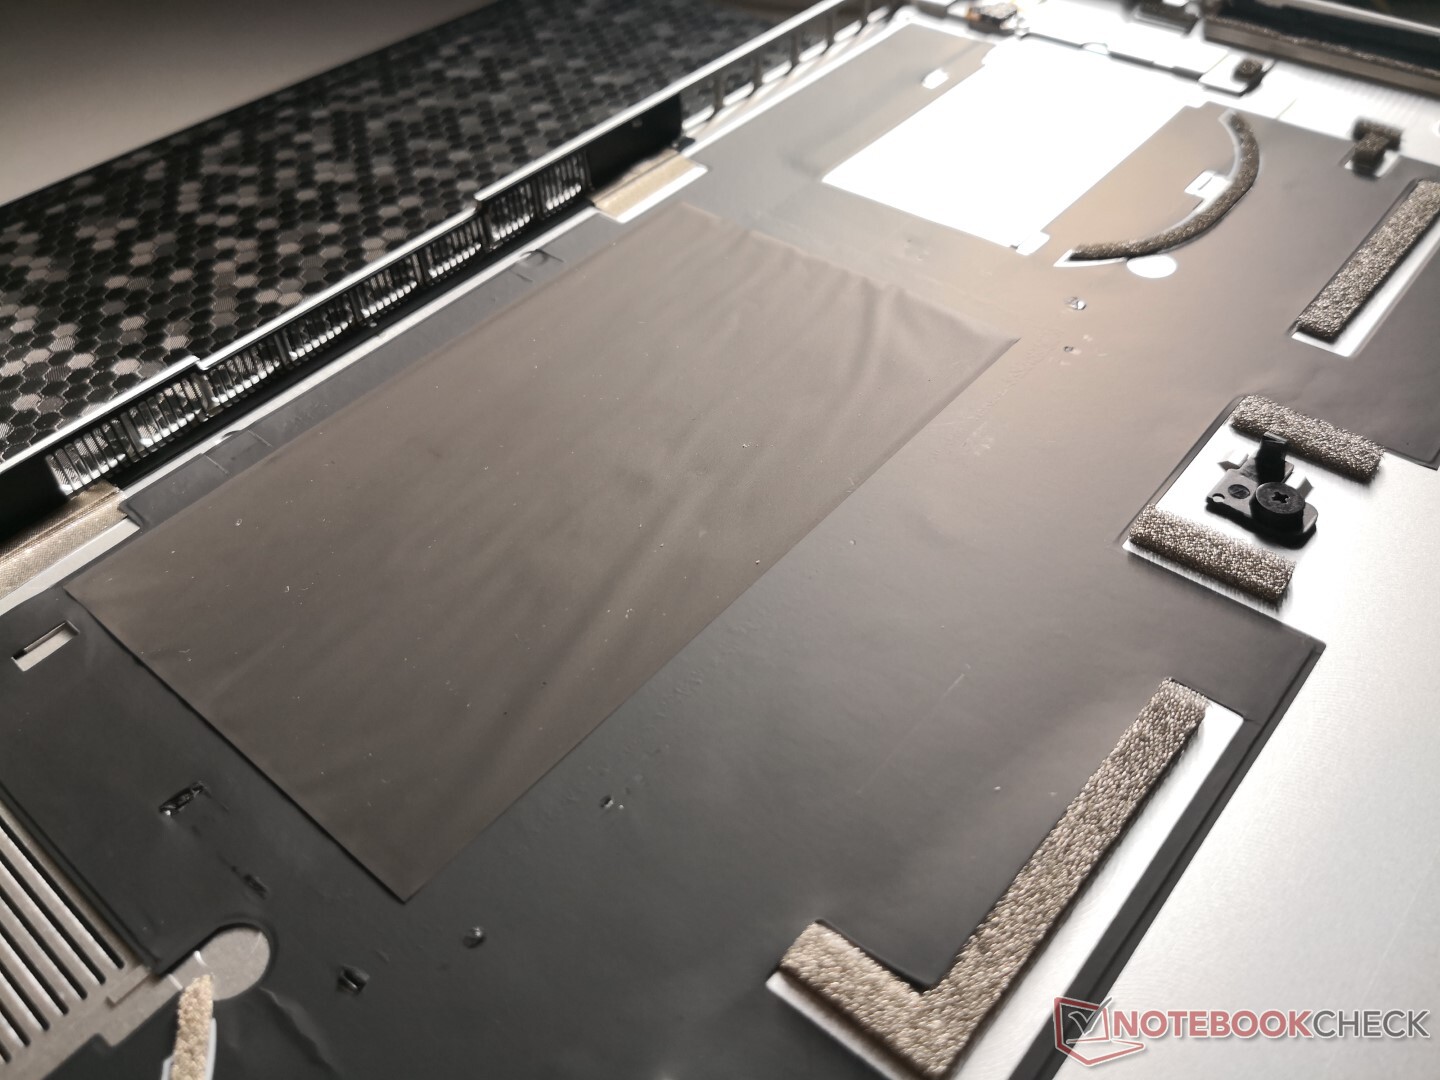
Du point de vue de l'utilisateur moyen, la mise à jour du XPS 15 coche toutes les bonnes cases. L'écran 16:10 lumineux, le retour des touches amélioré, le grand clickpad, le système audio, l'autonomie, les ventilateurs silencieux, la RAM amovible et le nouvel emplacement secondaire M.2 rendent l'appareil plus agréable à utiliser. C'est sans doute le moment de passer au XPS 15 si vous vous posiez la question, parce que cette version améliore la machine à bien des égards. L'absence de HDMI et d'USB A seront inévitablement un problème, mais au moins les adaptateur sont inclus - ce que l'on ne peut dire du MacBook Pro.
Cependant pour les inconditionnels, il s'avère que le refroidissement n'a pas été vraiment amélioré. Les températures internes atteignent 90 °C avec la configuration de base Core i5, ce que signifie que la version Core i7 octocoeur et GeForce GTX chauffera encore plus, et sera plus bruyante. Ceux qui n'étaient pas ravis du refroidissement sans relief de la génération précédente ne changeront pas d'avis avec ce modèle. De plus le module WLAN et le clavier sont maintenant plus difficile à atteindre qu'avant, étant plus intégrés à la carte-mère.
Nous testerons bientôt le XPS 15 9500 dans d'autres configurations, pour avoir une meilleure vue d'ensemble de l'appareil. Mais pour un prix de base de 1 300 $, le fleuron de Dell évolue dans la bonne direction, et laisse une excellente première impression.
L’intégralité de cette critique est disponible en anglais en suivant ce lien.
Dell XPS 15 9500 Core i5
- 06/09/2020 v7 (old)
Allen Ngo
Price comparison
