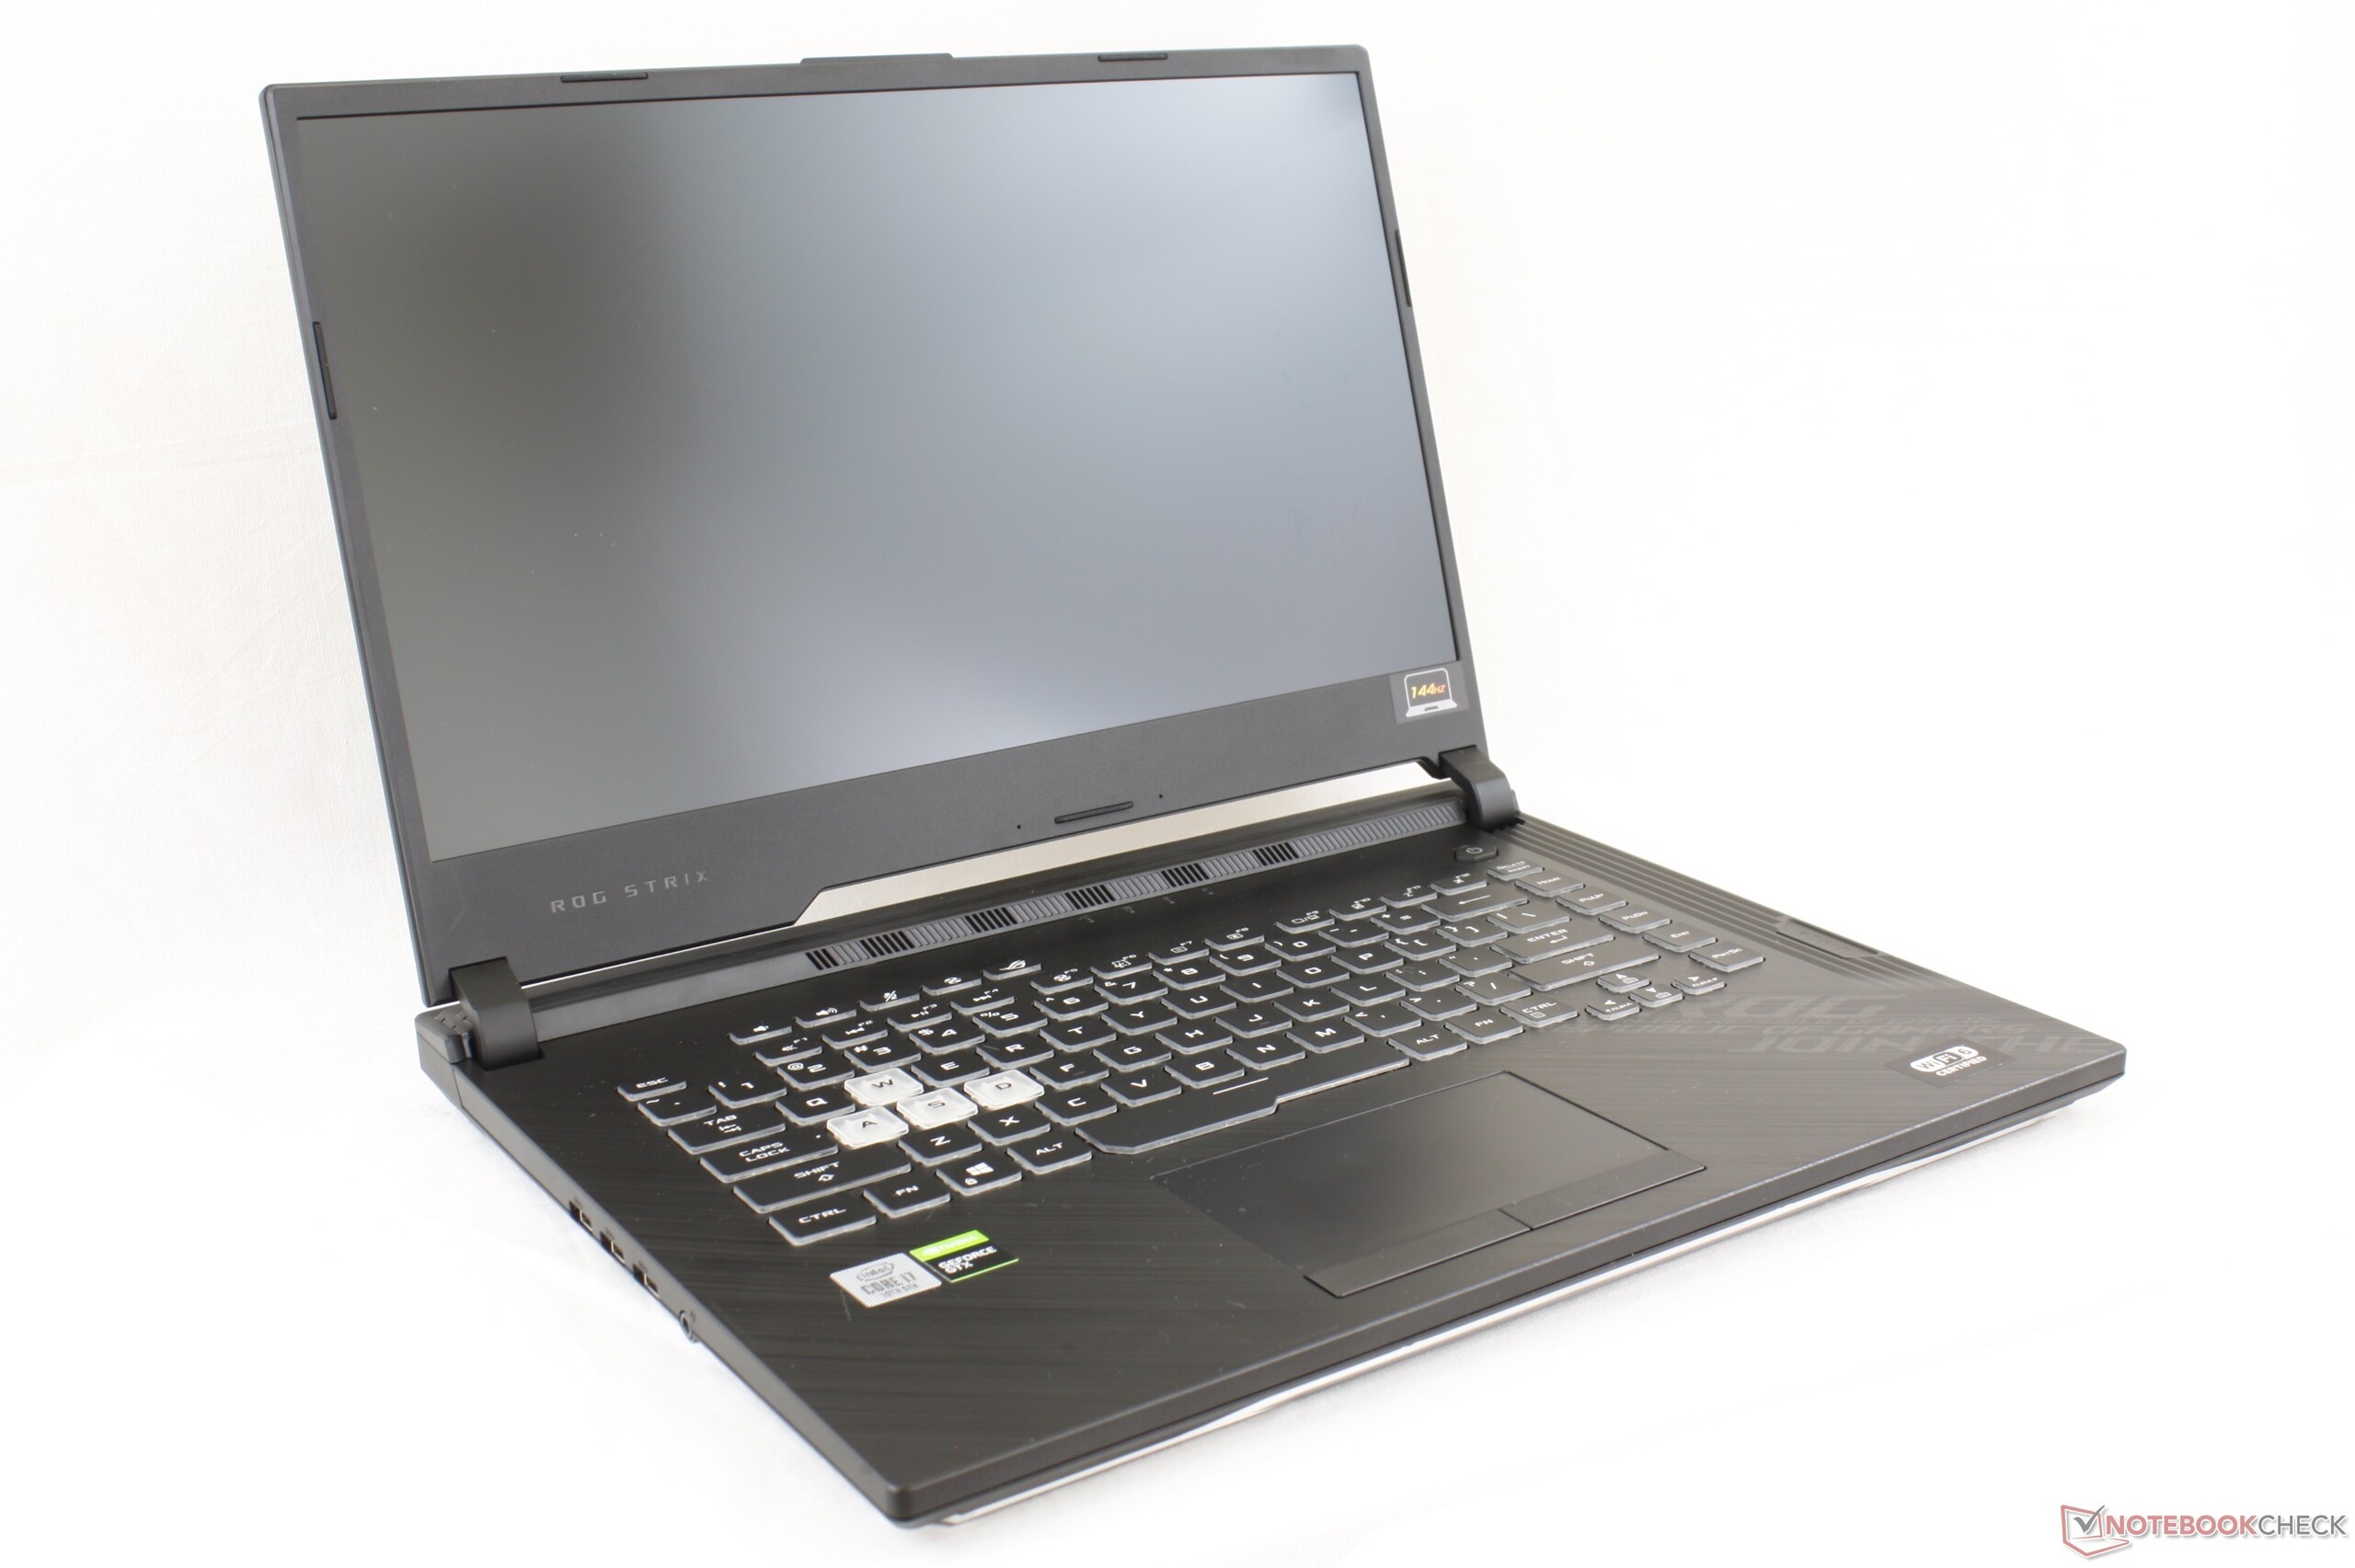
Test de l'Asus ROG Strix G15 G512LI (i7-10750H, GTX 1650 Ti, FHD, 144 Hz) : trop cher pour une GTX 1650 Ti
Note | Date | Modèle | Poids | Épaisseur | Taille | Résolution | Prix |
|---|---|---|---|---|---|---|---|
| 80.8 % v7 (old) | 08/20 | Asus ROG Strix G15 G512LI i7-10750H, GeForce GTX 1650 Ti Mobile | 2.3 kg | 25.8 mm | 15.60" | 1920x1080 | |
| 82.7 % v7 (old) | Asus TUF Gaming A15 FA506IV-HN172 R7 4800H, GeForce RTX 2060 Mobile | 2.2 kg | 24.9 mm | 15.60" | 1920x1080 | ||
| 82.1 % v7 (old) | 10/19 | Asus Strix Scar III G531GW-AZ062T i7-9750H, GeForce RTX 2070 Mobile | 2.4 kg | 25 mm | 15.60" | 1920x1080 | |
| 83.2 % v7 (old) | 06/20 | MSI GP65 10SFK-047US i7-10750H, GeForce RTX 2070 Mobile | 2.3 kg | 27.5 mm | 15.60" | 1920x1080 | |
| 83.7 % v7 (old) | 08/20 | Dell G5 15 SE 5505 P89F R7 4800H, Radeon RX 5600M | 2.4 kg | 21.6 mm | 15.60" | 1920x1080 | |
| 81.5 % v7 (old) | 07/19 | HP Omen 15-dc1020ng i5-9300H, GeForce GTX 1650 Mobile | 2.3 kg | 25 mm | 15.60" | 1920x1080 |
| Networking | |
| iperf3 transmit AX12 | |
| Asus ROG Strix G15 G512LI | |
| MSI GP65 10SFK-047US | |
| Dell G5 15 SE 5505 P89F | |
| Asus TUF Gaming A15 FA506IV-HN172 | |
| iperf3 receive AX12 | |
| Dell G5 15 SE 5505 P89F | |
| MSI GP65 10SFK-047US | |
| Asus ROG Strix G15 G512LI | |
| Asus TUF Gaming A15 FA506IV-HN172 | |
| |||||||||||||||||||||||||
Homogénéité de la luminosité: 79 %
Valeur mesurée au centre, sur batterie: 271.2 cd/m²
Contraste: 512:1 (Valeurs des noirs: 0.53 cd/m²)
ΔE ColorChecker Calman: 5.04 | ∀{0.5-29.43 Ø4.73}
calibrated: 4.26
ΔE Greyscale Calman: 3.4 | ∀{0.09-98 Ø4.97}
59.5% sRGB (Argyll 1.6.3 3D)
37.8% AdobeRGB 1998 (Argyll 1.6.3 3D)
41.06% AdobeRGB 1998 (Argyll 3D)
59.8% sRGB (Argyll 3D)
39.73% Display P3 (Argyll 3D)
Gamma: 2.09
CCT: 7079 K
| Asus ROG Strix G15 G512LI Panda LM156LF-2F01, IPS, 15.6", 1920x1080 | Asus TUF Gaming A15 FA506IV-HN172 LM156LF-2F01, IPS, 15.6", 1920x1080 | Asus Strix Scar III G531GW-AZ062T Sharp LQ156M1JW09 (SHP14D3), IPS, 15.6", 1920x1080 | MSI GP65 10SFK-047US LG Philips LP156WFG-SPB3, IPS, 15.6", 1920x1080 | Dell G5 15 SE 5505 P89F BOE NV156FH, WVA, 15.6", 1920x1080 | HP Omen 15-dc1020ng LGD05CE, IPS, 15.6", 1920x1080 | |
|---|---|---|---|---|---|---|
| Display | -2% | 65% | 59% | 55% | -3% | |
| Display P3 Coverage (%) | 39.73 | 38.92 -2% | 66.2 67% | 63.5 60% | 63 59% | 38.37 -3% |
| sRGB Coverage (%) | 59.8 | 58.5 -2% | 97.1 62% | 94.4 58% | 90.1 51% | 57.6 -4% |
| AdobeRGB 1998 Coverage (%) | 41.06 | 40.22 -2% | 67.6 65% | 65.1 59% | 64.1 56% | 39.69 -3% |
| Response Times | 6% | 61% | 63% | 50% | -13% | |
| Response Time Grey 50% / Grey 80% * (ms) | 33.6 ? | 34 ? -1% | 15 ? 55% | 10.4 ? 69% | 20.4 ? 39% | 40 ? -19% |
| Response Time Black / White * (ms) | 27.6 ? | 24 ? 13% | 9 ? 67% | 12 ? 57% | 10.8 ? 61% | 29.6 ? -7% |
| PWM Frequency (Hz) | 250 ? | 198.4 ? | ||||
| Screen | 25% | 29% | 36% | 36% | 14% | |
| Brightness middle (cd/m²) | 271.2 | 280 3% | 309 14% | 384.9 42% | 292 8% | 251 -7% |
| Brightness (cd/m²) | 252 | 254 1% | 284 13% | 358 42% | 290 15% | 232 -8% |
| Brightness Distribution (%) | 79 | 88 11% | 88 11% | 87 10% | 77 -3% | 76 -4% |
| Black Level * (cd/m²) | 0.53 | 0.15 72% | 0.42 21% | 0.67 -26% | 0.27 49% | 0.17 68% |
| Contrast (:1) | 512 | 1867 265% | 736 44% | 574 12% | 1081 111% | 1476 188% |
| Colorchecker dE 2000 * | 5.04 | 5.89 -17% | 3.99 21% | 2.43 52% | 3.99 21% | 6.2 -23% |
| Colorchecker dE 2000 max. * | 16.07 | 19 -18% | 8.3 48% | 4.58 71% | 6.11 62% | 18.6 -16% |
| Colorchecker dE 2000 calibrated * | 4.26 | 4.79 -12% | 1.12 74% | 2.03 52% | 3.02 29% | 4.8 -13% |
| Greyscale dE 2000 * | 3.4 | 4.08 -20% | 5.43 -60% | 2.6 24% | 3.3 3% | 4.2 -24% |
| Gamma | 2.09 105% | 2.33 94% | 2.57 86% | 2.2 100% | 2.25 98% | 2.32 95% |
| CCT | 7079 92% | 7303 89% | 7767 84% | 6981 93% | 7047 92% | 7454 87% |
| Color Space (Percent of AdobeRGB 1998) (%) | 37.8 | 37 -2% | 63 67% | 59.7 58% | 58.1 54% | 36.5 -3% |
| Color Space (Percent of sRGB) (%) | 59.5 | 58 -3% | 97 63% | 93.9 58% | 89.7 51% | 57.4 -4% |
| Moyenne finale (programmes/paramètres) | 10% /
18% | 52% /
40% | 53% /
44% | 47% /
42% | -1% /
7% |
* ... Moindre est la valeur, meilleures sont les performances
Temps de réponse de l'écran
| ↔ Temps de réponse noir à blanc | ||
|---|---|---|
| 27.6 ms ... hausse ↗ et chute ↘ combinées | ↗ 15.6 ms hausse | 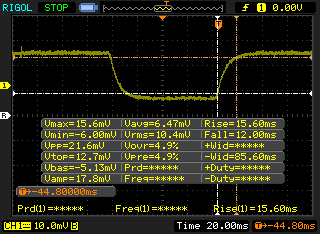 |
| ↘ 12 ms chute | ||
| L'écran souffre de latences relativement élevées, insuffisant pour le jeu. En comparaison, tous les appareils testés affichent entre 0.1 (minimum) et 240 (maximum) ms. » 70 % des appareils testés affichent de meilleures performances. Cela signifie que les latences relevées sont moins bonnes que la moyenne (19.9 ms) de tous les appareils testés. | ||
| ↔ Temps de réponse gris 50% à gris 80% | ||
| 33.6 ms ... hausse ↗ et chute ↘ combinées | ↗ 18.4 ms hausse | 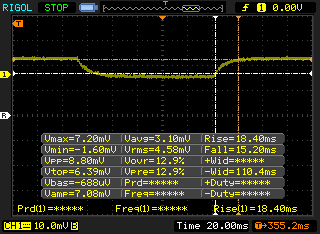 |
| ↘ 15.2 ms chute | ||
| L'écran souffre de latences très élevées, à éviter pour le jeu. En comparaison, tous les appareils testés affichent entre 0.165 (minimum) et 636 (maximum) ms. » 46 % des appareils testés affichent de meilleures performances. Cela signifie que les latences relevées sont similaires à la moyenne (31.1 ms) de tous les appareils testés. | ||
Scintillement / MLI (Modulation de largeur d'impulsion)
| Scintillement / MLI (Modulation de largeur d'impulsion) non décelé |  | ||
En comparaison, 52 % des appareils testés n'emploient pas MDI pour assombrir leur écran. Nous avons relevé une moyenne à 7791 (minimum : 5 - maximum : 343500) Hz dans le cas où une MDI était active. | |||
Cinebench R15: CPU Multi 64Bit | CPU Single 64Bit
Blender: v2.79 BMW27 CPU
7-Zip 18.03: 7z b 4 -mmt1 | 7z b 4
Geekbench 5.5: Single-Core | Multi-Core
HWBOT x265 Benchmark v2.2: 4k Preset
LibreOffice : 20 Documents To PDF
R Benchmark 2.5: Overall mean
| Geekbench 5.5 / Single-Core | |
| MSI GE66 Raider 10SFS | |
| Gigabyte Aero 15 OLED XB-8DE51B0SP | |
| Moyenne Intel Core i7-10750H (1114 - 1333, n=43) | |
| Lenovo Legion 5 15IMH05H | |
| Asus Zephyrus G14 GA401IV | |
| Dell G5 15 SE 5505 P89F | |
| Schenker XMG Pro 15 | |
| Asus ROG Strix G15 G512LI | |
| Acer Nitro 5 AN515-44-R5FT | |
| Geekbench 5.5 / Multi-Core | |
| MSI GE66 Raider 10SFS | |
| Gigabyte Aero 15 OLED XB-8DE51B0SP | |
| Dell G5 15 SE 5505 P89F | |
| Asus Zephyrus G14 GA401IV | |
| Asus ROG Strix G15 G512LI | |
| Moyenne Intel Core i7-10750H (4443 - 6674, n=43) | |
| Schenker XMG Pro 15 | |
| Acer Nitro 5 AN515-44-R5FT | |
| Lenovo Legion 5 15IMH05H | |
| HWBOT x265 Benchmark v2.2 / 4k Preset | |
| Gigabyte Aero 15 OLED XB-8DE51B0SP | |
| MSI GE66 Raider 10SFS | |
| Dell G5 15 SE 5505 P89F | |
| Asus Zephyrus G14 GA401IV | |
| Asus ROG Strix G15 G512LI | |
| Moyenne Intel Core i7-10750H (5.54 - 11.6, n=43) | |
| Acer Nitro 5 AN515-44-R5FT | |
| Schenker XMG Pro 15 | |
| Lenovo Legion 5 15IMH05H | |
| Asus ROG Zephyrus G15 GA502DU | |
| LibreOffice / 20 Documents To PDF | |
| Dell G5 15 SE 5505 P89F | |
| Acer Nitro 5 AN515-44-R5FT | |
| MSI GE66 Raider 10SFS | |
| Moyenne Intel Core i7-10750H (43.1 - 99.2, n=43) | |
| Lenovo Legion 5 15IMH05H | |
| Gigabyte Aero 15 OLED XB-8DE51B0SP | |
| Asus ROG Strix G15 G512LI | |
| R Benchmark 2.5 / Overall mean | |
| Schenker XMG Pro 15 | |
| Lenovo Legion 5 15IMH05H | |
| Acer Nitro 5 AN515-44-R5FT | |
| Asus ROG Strix G15 G512LI | |
| Moyenne Intel Core i7-10750H (0.578 - 0.708, n=42) | |
| Dell G5 15 SE 5505 P89F | |
| MSI GE66 Raider 10SFS | |
| Gigabyte Aero 15 OLED XB-8DE51B0SP | |
* ... Moindre est la valeur, meilleures sont les performances
| PCMark 10 | |
| Score | |
| MSI GP65 10SFK-047US | |
| Dell G5 15 SE 5505 P89F | |
| Asus Strix Scar III G531GW-AZ062T | |
| Asus ROG Strix G15 G512LI | |
| Asus TUF Gaming A15 FA506IV-HN172 | |
| HP Omen 15-dc1020ng | |
| Essentials | |
| MSI GP65 10SFK-047US | |
| Dell G5 15 SE 5505 P89F | |
| Asus ROG Strix G15 G512LI | |
| Asus Strix Scar III G531GW-AZ062T | |
| Asus TUF Gaming A15 FA506IV-HN172 | |
| HP Omen 15-dc1020ng | |
| Productivity | |
| MSI GP65 10SFK-047US | |
| Asus ROG Strix G15 G512LI | |
| Asus Strix Scar III G531GW-AZ062T | |
| Dell G5 15 SE 5505 P89F | |
| HP Omen 15-dc1020ng | |
| Asus TUF Gaming A15 FA506IV-HN172 | |
| Digital Content Creation | |
| Dell G5 15 SE 5505 P89F | |
| MSI GP65 10SFK-047US | |
| Asus Strix Scar III G531GW-AZ062T | |
| Asus ROG Strix G15 G512LI | |
| Asus TUF Gaming A15 FA506IV-HN172 | |
| HP Omen 15-dc1020ng | |
| PCMark 8 | |
| Home Score Accelerated v2 | |
| Dell G5 15 SE 5505 P89F | |
| Asus Strix Scar III G531GW-AZ062T | |
| Asus TUF Gaming A15 FA506IV-HN172 | |
| MSI GP65 10SFK-047US | |
| Asus ROG Strix G15 G512LI | |
| HP Omen 15-dc1020ng | |
| Work Score Accelerated v2 | |
| MSI GP65 10SFK-047US | |
| Asus TUF Gaming A15 FA506IV-HN172 | |
| Asus Strix Scar III G531GW-AZ062T | |
| Asus ROG Strix G15 G512LI | |
| Dell G5 15 SE 5505 P89F | |
| HP Omen 15-dc1020ng | |
| PCMark 8 Home Score Accelerated v2 | 4420 points | |
| PCMark 8 Work Score Accelerated v2 | 5587 points | |
| PCMark 10 Score | 5466 points | |
Aide | ||
| DPC Latencies / LatencyMon - interrupt to process latency (max), Web, Youtube, Prime95 | |
| Dell G5 15 SE 5505 P89F | |
| Gigabyte Aero 15 OLED XB-8DE51B0SP | |
| MSI Bravo 15 A4DCR | |
| Asus ROG Strix G15 G512LI | |
| Acer Nitro 5 AN515-44-R5FT | |
| MSI GE66 Raider 10SFS | |
| Razer Blade 15 RZ09-0328 | |
| Asus TUF Gaming A15 FA506IV-HN172 | |
| Lenovo Legion 5 15IMH05H | |
| Eluktronics RP-15 | |
* ... Moindre est la valeur, meilleures sont les performances
| Asus ROG Strix G15 G512LI Intel SSD 660p SSDPEKNW512G8 | Asus TUF Gaming A15 FA506IV-HN172 Kingston OM8PCP3512F-AB | Asus Strix Scar III G531GW-AZ062T Intel SSD 660p SSDPEKNW512G8 | MSI GP65 10SFK-047US Samsung SSD PM981 MZVLB1T0HALR | Dell G5 15 SE 5505 P89F Samsung PM991 MZ9LQ512HALU | HP Omen 15-dc1020ng WDC PC SN720 SDAQNTW-512G | |
|---|---|---|---|---|---|---|
| AS SSD | 17% | -18% | 150% | 32% | 99% | |
| Seq Read (MB/s) | 1157 | 1682 45% | 1163 1% | 2066 79% | 1386 20% | 2955 155% |
| Seq Write (MB/s) | 675 | 904 34% | 919 36% | 2418 258% | 1234 83% | 2440 261% |
| 4K Read (MB/s) | 49.99 | 60.2 20% | 48.88 -2% | 54.2 8% | 41.32 -17% | 40.56 -19% |
| 4K Write (MB/s) | 114 | 164.8 45% | 90.1 -21% | 129 13% | 128 12% | 118.6 4% |
| 4K-64 Read (MB/s) | 322.2 | 472.5 47% | 323.8 0% | 1865 479% | 854 165% | 1283 298% |
| 4K-64 Write (MB/s) | 759 | 845 11% | 403.8 -47% | 1878 147% | 721 -5% | 1538 103% |
| Access Time Read * (ms) | 0.07 | 0.087 -24% | 0.24 -243% | 0.042 40% | 0.098 -40% | 0.084 -20% |
| Access Time Write * (ms) | 0.137 | 0.02 85% | 0.046 66% | 0.091 34% | 0.095 31% | 0.032 77% |
| Score Read (Points) | 488 | 701 44% | 489 0% | 2126 336% | 1034 112% | 1619 232% |
| Score Write (Points) | 940 | 1101 17% | 586 -38% | 2249 139% | 973 4% | 1901 102% |
| Score Total (Points) | 1673 | 2143 28% | 1332 -20% | 5482 228% | 2536 52% | 4323 158% |
| Copy ISO MB/s (MB/s) | 939 | 675 -28% | 1269 35% | 2927 212% | 1284 37% | 1418 51% |
| Copy Program MB/s (MB/s) | 489.9 | 248.4 -49% | 452.8 -8% | 728 49% | 401.9 -18% | 392.5 -20% |
| Copy Game MB/s (MB/s) | 895 | 535 -40% | 755 -16% | 1614 80% | 1013 13% | 907 1% |
| CrystalDiskMark 5.2 / 6 | 19% | -2% | 69% | 22% | 51% | |
| Write 4K (MB/s) | 125.4 | 219.8 75% | 133.3 6% | 145 16% | 142.1 13% | 112.1 -11% |
| Read 4K (MB/s) | 52.7 | 50.2 -5% | 55.3 5% | 46.84 -11% | 46.43 -12% | 42.01 -20% |
| Write Seq (MB/s) | 943 | 979 4% | 980 4% | 2377 152% | 1108 17% | 1964 108% |
| Read Seq (MB/s) | 1383 | 1990 44% | 1406 2% | 2185 58% | 1622 17% | 2065 49% |
| Write 4K Q32T1 (MB/s) | 437.9 | 516 18% | 286.3 -35% | 463.5 6% | 467 7% | 318.2 -27% |
| Read 4K Q32T1 (MB/s) | 334.9 | 298.3 -11% | 331.5 -1% | 527 57% | 525 57% | 406.7 21% |
| Write Seq Q32T1 (MB/s) | 960 | 982 2% | 976 2% | 2395 149% | 1203 25% | 2534 164% |
| Read Seq Q32T1 (MB/s) | 1530 | 1907 25% | 1520 -1% | 3470 127% | 2288 50% | 3438 125% |
| Write 4K Q8T8 (MB/s) | 981 | 748 | ||||
| Read 4K Q8T8 (MB/s) | 300.9 | 344.6 | ||||
| Moyenne finale (programmes/paramètres) | 18% /
18% | -10% /
-13% | 110% /
121% | 27% /
28% | 75% /
81% |
* ... Moindre est la valeur, meilleures sont les performances

Disk Throttling: DiskSpd Read Loop, Queue Depth 8
| 3DMark 11 Performance | 14000 points | |
| 3DMark Cloud Gate Standard Score | 33407 points | |
| 3DMark Fire Strike Score | 9710 points | |
| 3DMark Time Spy Score | 4131 points | |
Aide | ||
| Bas | Moyen | Élevé | Ultra | |
|---|---|---|---|---|
| The Witcher 3 (2015) | 223.5 | 135.5 | 76.1 | 40.1 |
| Dota 2 Reborn (2015) | 148 | 132 | 122 | 115 |
| X-Plane 11.11 (2018) | 98.9 | 82.7 | 71.8 |
| Asus ROG Strix G15 G512LI GeForce GTX 1650 Ti Mobile, i7-10750H, Intel SSD 660p SSDPEKNW512G8 | Asus TUF Gaming A15 FA506IV-HN172 GeForce RTX 2060 Mobile, R7 4800H, Kingston OM8PCP3512F-AB | Asus Strix Scar III G531GW-AZ062T GeForce RTX 2070 Mobile, i7-9750H, Intel SSD 660p SSDPEKNW512G8 | MSI GP65 10SFK-047US GeForce RTX 2070 Mobile, i7-10750H, Samsung SSD PM981 MZVLB1T0HALR | Dell G5 15 SE 5505 P89F Radeon RX 5600M, R7 4800H, Samsung PM991 MZ9LQ512HALU | HP Omen 15-dc1020ng GeForce GTX 1650 Mobile, i5-9300H, WDC PC SN720 SDAQNTW-512G | |
|---|---|---|---|---|---|---|
| Noise | 6% | 4% | -2% | 13% | 16% | |
| arrêt / environnement * (dB) | 27.7 | 30.2 -9% | 30 -8% | 29.3 -6% | 28 -1% | 28.8 -4% |
| Idle Minimum * (dB) | 34.2 | 30.2 12% | 30.6 11% | 31.9 7% | 28 18% | 28.8 16% |
| Idle Average * (dB) | 36 | 30.2 16% | 30.6 15% | 31.9 11% | 28 22% | 29.5 18% |
| Idle Maximum * (dB) | 36.6 | 30.2 17% | 37.7 -3% | 33.5 8% | 28 23% | 31.1 15% |
| Load Average * (dB) | 44.3 | 40 10% | 36.5 18% | 47 -6% | 28 37% | 35.2 21% |
| Witcher 3 ultra * (dB) | 47.9 | 49 -2% | 52.1 -9% | 53.8 -12% | 50.6 -6% | 35.2 27% |
| Load Maximum * (dB) | 49.3 | 49 1% | 48.1 2% | 56.7 -15% | 50.6 -3% | 41 17% |
* ... Moindre est la valeur, meilleures sont les performances
Degré de la nuisance sonore
| Au repos |
| 34.2 / 36 / 36.6 dB(A) |
| Fortement sollicité |
| 44.3 / 49.3 dB(A) |
 | ||
30 dB silencieux 40 dB(A) audible 50 dB(A) bruyant |
||
min: | ||
(-) La température maximale du côté supérieur est de 46.2 °C / 115 F, par rapport à la moyenne de 40.4 °C / 105 F, allant de 21.2 à 68.8 °C pour la classe Gaming.
(-) Le fond chauffe jusqu'à un maximum de 53.6 °C / 128 F, contre une moyenne de 43.2 °C / 110 F
(+) En utilisation inactive, la température moyenne du côté supérieur est de 26 °C / 79 F, par rapport à la moyenne du dispositif de 33.9 °C / 93 F.
(+) En jouant à The Witcher 3, la température moyenne du côté supérieur est de 31.8 °C / 89 F, alors que la moyenne de l'appareil est de 33.9 °C / 93 F.
(+) Les repose-poignets et le pavé tactile sont plus froids que la température de la peau avec un maximum de 25.8 °C / 78.4 F et sont donc froids au toucher.
(+) La température moyenne de la zone de l'appui-paume de dispositifs similaires était de 28.8 °C / 83.8 F (+3 °C / #5.4 F).
Asus ROG Strix G15 G512LI analyse audio
(+) | les haut-parleurs peuvent jouer relativement fort (85.8# dB)
Basses 100 - 315 Hz
(±) | basse réduite - en moyenne 14.3% inférieure à la médiane
(±) | la linéarité des basses est moyenne (12.3% delta à la fréquence précédente)
Médiums 400 - 2000 Hz
(±) | médiane supérieure - en moyenne 8.2% supérieure à la médiane
(+) | les médiums sont linéaires (5.1% delta à la fréquence précédente)
Aiguës 2 - 16 kHz
(+) | des sommets équilibrés - à seulement 3.4% de la médiane
(±) | la linéarité des aigus est moyenne (9.5% delta à la fréquence précédente)
Globalement 100 - 16 000 Hz
(±) | la linéarité du son global est moyenne (18.9% de différence avec la médiane)
Par rapport à la même classe
» 63% de tous les appareils testés de cette catégorie étaient meilleurs, 8% similaires, 29% pires
» Le meilleur avait un delta de 6%, la moyenne était de 18%, le pire était de 132%.
Par rapport à tous les appareils testés
» 44% de tous les appareils testés étaient meilleurs, 8% similaires, 48% pires
» Le meilleur avait un delta de 4%, la moyenne était de 24%, le pire était de 134%.
Apple MacBook 12 (Early 2016) 1.1 GHz analyse audio
(+) | les haut-parleurs peuvent jouer relativement fort (83.6# dB)
Basses 100 - 315 Hz
(±) | basse réduite - en moyenne 11.3% inférieure à la médiane
(±) | la linéarité des basses est moyenne (14.2% delta à la fréquence précédente)
Médiums 400 - 2000 Hz
(+) | médiane équilibrée - seulement 2.4% de la médiane
(+) | les médiums sont linéaires (5.5% delta à la fréquence précédente)
Aiguës 2 - 16 kHz
(+) | des sommets équilibrés - à seulement 2% de la médiane
(+) | les aigus sont linéaires (4.5% delta à la fréquence précédente)
Globalement 100 - 16 000 Hz
(+) | le son global est linéaire (10.2% différence à la médiane)
Par rapport à la même classe
» 7% de tous les appareils testés de cette catégorie étaient meilleurs, 2% similaires, 91% pires
» Le meilleur avait un delta de 5%, la moyenne était de 18%, le pire était de 53%.
Par rapport à tous les appareils testés
» 5% de tous les appareils testés étaient meilleurs, 1% similaires, 94% pires
» Le meilleur avait un delta de 4%, la moyenne était de 24%, le pire était de 134%.
| Éteint/en veille | |
| Au repos | |
| Fortement sollicité |
|
Légende:
min: | |
| Asus ROG Strix G15 G512LI i7-10750H, GeForce GTX 1650 Ti Mobile, Intel SSD 660p SSDPEKNW512G8, IPS, 1920x1080, 15.6" | Asus TUF Gaming A15 FA506IV-HN172 R7 4800H, GeForce RTX 2060 Mobile, Kingston OM8PCP3512F-AB, IPS, 1920x1080, 15.6" | MSI GP65 10SFK-047US i7-10750H, GeForce RTX 2070 Mobile, Samsung SSD PM981 MZVLB1T0HALR, IPS, 1920x1080, 15.6" | Dell G5 15 SE 5505 P89F R7 4800H, Radeon RX 5600M, Samsung PM991 MZ9LQ512HALU, WVA, 1920x1080, 15.6" | HP Omen 15-dc1020ng i5-9300H, GeForce GTX 1650 Mobile, WDC PC SN720 SDAQNTW-512G, IPS, 1920x1080, 15.6" | HP Pavilion Gaming 15-cx0003ng i7-8750H, GeForce GTX 1050 Ti Mobile, Intel Optane 16 GB MEMPEK1J016GAH + HGST HTS721010A9E630 1 TB HDD, IPS, 1920x1080, 15.6" | |
|---|---|---|---|---|---|---|
| Power Consumption | -4% | -66% | -6% | 22% | 14% | |
| Idle Minimum * (Watt) | 5.7 | 5.4 5% | 14.2 -149% | 6.5 -14% | 4.04 29% | 5.5 4% |
| Idle Average * (Watt) | 9.3 | 10 -8% | 18.8 -102% | 10.6 -14% | 7.2 23% | 8.5 9% |
| Idle Maximum * (Watt) | 20.9 | 10.5 50% | 23.9 -14% | 11 47% | 11.4 45% | 11.9 43% |
| Load Average * (Watt) | 105.1 | 135 -28% | 96.9 8% | 84.1 20% | 80.8 23% | 94 11% |
| Witcher 3 ultra * (Watt) | 94.5 | 144 -52% | 185 -96% | 152.9 -62% | 93.6 1% | 86 9% |
| Load Maximum * (Watt) | 160.8 | 147 9% | 233.4 -45% | 180.4 -12% | 144.5 10% | 144 10% |
* ... Moindre est la valeur, meilleures sont les performances
| Asus ROG Strix G15 G512LI i7-10750H, GeForce GTX 1650 Ti Mobile, 48 Wh | Asus TUF Gaming A15 FA506IV-HN172 R7 4800H, GeForce RTX 2060 Mobile, 48 Wh | Asus Strix Scar III G531GW-AZ062T i7-9750H, GeForce RTX 2070 Mobile, 66 Wh | MSI GP65 10SFK-047US i7-10750H, GeForce RTX 2070 Mobile, 51 Wh | Dell G5 15 SE 5505 P89F R7 4800H, Radeon RX 5600M, 51 Wh | HP Omen 15-dc1020ng i5-9300H, GeForce GTX 1650 Mobile, 52.5 Wh | |
|---|---|---|---|---|---|---|
| Autonomie de la batterie | 16% | 24% | -18% | 10% | 16% | |
| Reader / Idle (h) | 13.3 | 9.8 -26% | 11.2 -16% | 15.9 20% | ||
| WiFi v1.3 (h) | 4.5 | 6.2 38% | 5.6 24% | 3.7 -18% | 6.2 38% | 6.4 42% |
| Load (h) | 1.4 | 1.9 36% | 1.5 7% | 1.2 -14% | ||
| Witcher 3 ultra (h) | 1 |
Points positifs
Points négatifs
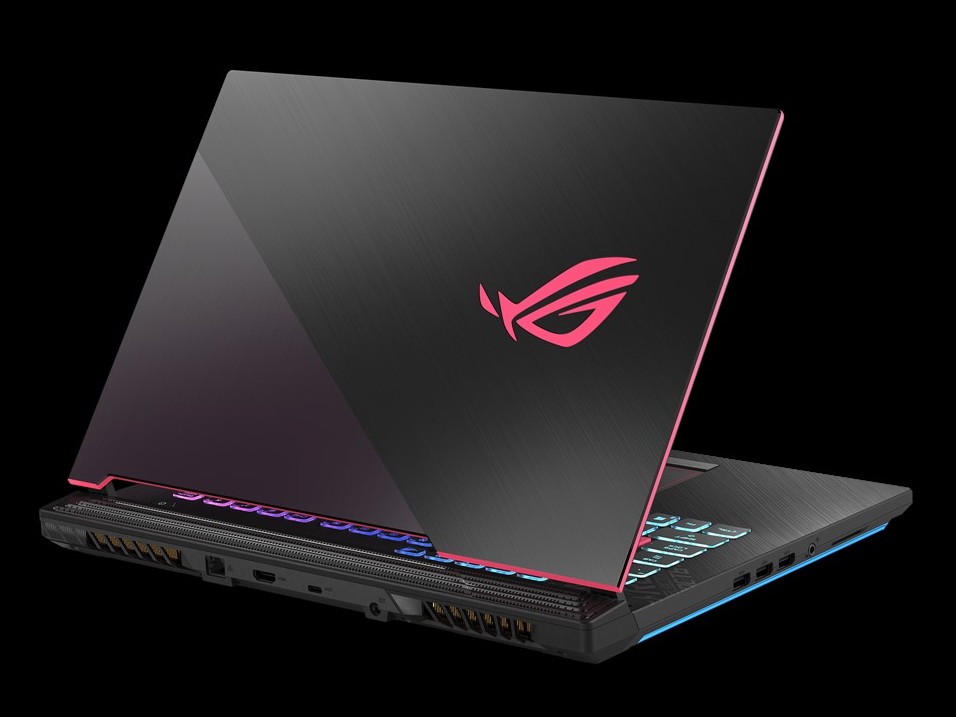
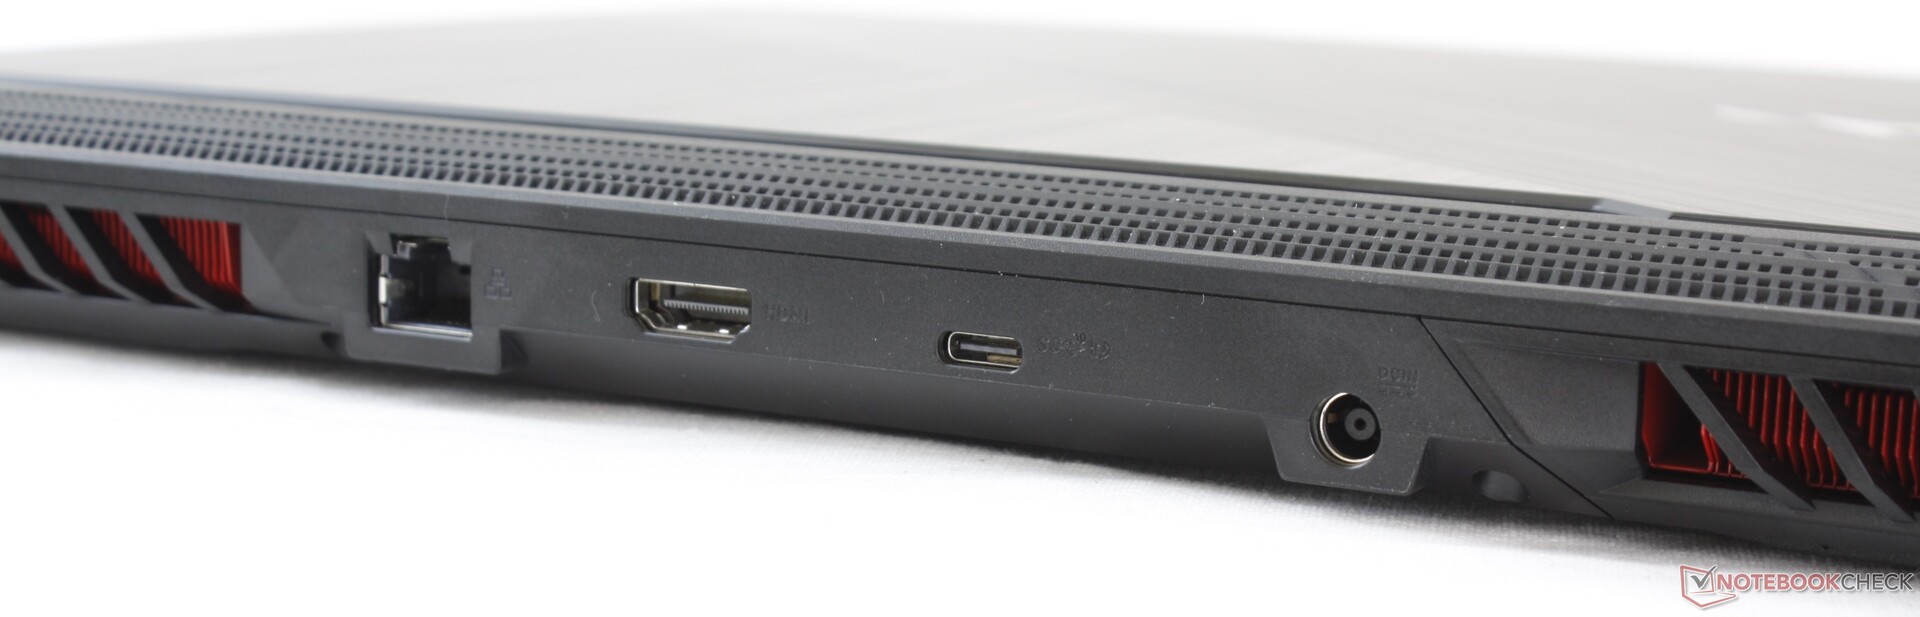
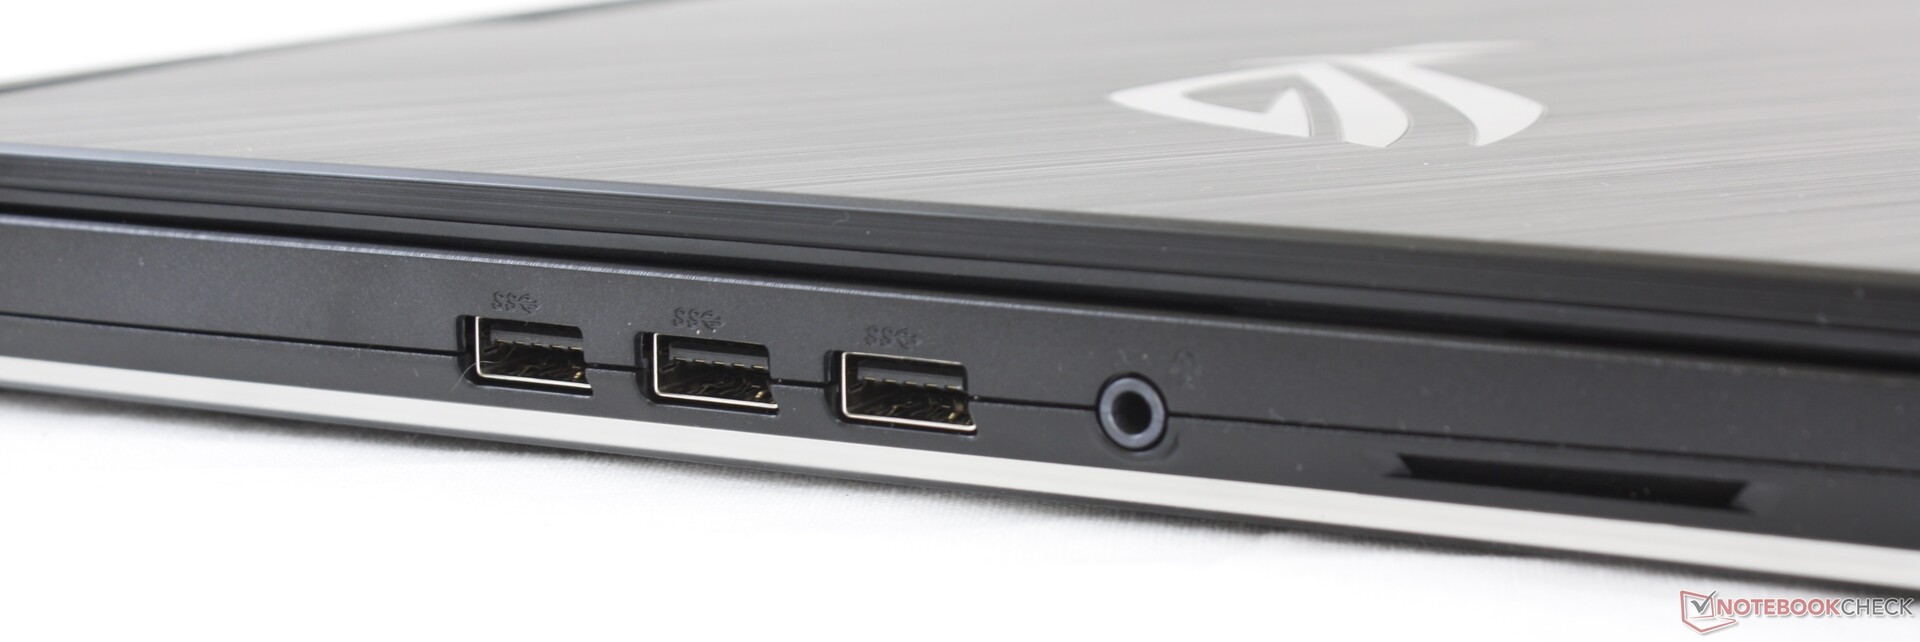
Les fonctionnalités qui font se démarquer l'appareil sont la présence de 3 emplacements SSD M.2 2280, l'écran 144 Hz, et la barre LED sur les bords inférieurs du châssis. La plupart des autres portables de cette classe n'intègrent que 2 emplacements de stockage. Mais les performances sont un peu décevantes pour un PC de jeu à 1000 €, puisque l'on peut avoir le même niveau de performances graphiques avec un PC portable GTX 1060 plus ancien et moins cher, ou même presque 50 % de puissance supplémentaires avec des machines équipées de GTX 1660 Ti, pour seulement 100 ou 200 € de plus.
L'écran 144 Hz peut sembler bon sur le papier, mais cette dalle Panda possède de gros défauts, comme son espace colorimétrique réduit, son ghosting visible, et son faible contraste. L'expérience de jeu n'est de ce fait pas très bonne, à moins d'être prêt à payer plus cher pour la version avec écran 240 Hz.
Pour 1000 €, l'Asus ROG Strix G15 G512LI ne possède pas une carte graphique assez bonne pour qu'il vaille le coup, d'autant que les PC portables de jeu AMD arrivent. Les joueurs seront mieux satisfaits avec les performances d'un modèle Asus TUF ou avec une GTX 1660 Ti pour un prix similaire.
L’intégralité de cette critique est disponible en anglais en suivant ce lien.
Asus ROG Strix G15 G512LI
- 11/04/2020 v7 (old)
Allen Ngo
Price comparison
