Critiques du AMD Ryzen 7 4800H processeur
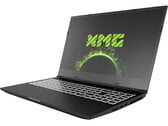
Test du Schenker XMG Core 15 (Tongfang GM5NG0O) : un WQHD performant et rapide
Le Schenker Core 15 apporte tous les jeux informatiques modernes en douceur sur l'écran réactif (WQHD, IPS, 165 Hz). De plus, il dispose d'un SSD NVMe, de 16 Go de RAM (mode double canal) et d'une batterie d'une durée de fonctionnement décente. Le nouveau centre de contrôle offre un contrôle étendu sur les performances des APU et GPU.
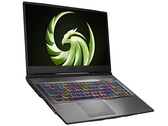
AMD Ryzen 7 4800H, NVIDIA GeForce RTX 3060 Laptop GPU, 15.6", 2 kgTest du MSI Alpha 17 : PC portable de jeu avec Ryzen 7 et Radeon RX 5600M
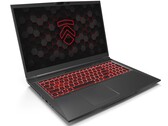
Avec le 17 pouces Alpha 17, MSI offre aux joueurs un ordinateur portable de jeu qui n'est pas alimenté par la technologie Intel. Le processeur et la carte graphique proviennent tous deux d'AMD et devront montrer ce dont ils sont capables dans notre test.
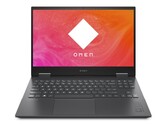
AMD Ryzen 7 4800H, Radeon RX 5600M, 17.3", 2.6 kgTest du HP Omen 15 : le processeur AMD puissant fait trembler Intel
La version AMD du HP Omen 15 marque des points avec des composants puissants à un prix équitable sur le papier. Dans la configuration du test, le GeForce RTX 2060 est accompagné d'un Ryzen 7 4800H. Découvrez ici si le système de refroidissement joue le jeu et quelles sont les forces et les faiblesses du 15 pouces par ailleurs.
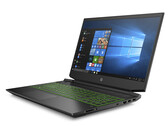
AMD Ryzen 7 4800H, NVIDIA GeForce RTX 2060 Mobile, 15.6", 2.2 kgTest du HP Pavilion Gaming 15 (Ryzen 7 4800H, GTX 1660 Ti Max-Q, FHD, 144 Hz) : PC de jeu à petit prix mais puissant
Les composants du Pavilion (Ryzen 7 4800H, GeForce GTX 1660 Ti Max-Q) permettent de jouer fluidement à n'importe quel jeu récent, sur l'écran mat de 15,6 pouces (IPS, Full HD, 144 Hz). Ce dernier marque des points avec ses temps de réponse et ses couleurs fidèles. Le tout est accompagné par un SSD NVMe et 16 Go de RAM (mode double canal).
AMD Ryzen 7 4800H, NVIDIA GeForce GTX 1660 Ti Max-Q, 15.6", 2 kgTest de l'Eluktronics Matrix RP-17 (Ryzen 7 4800H, RTX 2060, FHD, 144 Hz) : des performances Core i9 sans le prix
Pour environ 1100 $, l'Eluktronics RP-17 est à peu près au même prix que la plupart des appareils Intel équipés de la même GeForce RTX 2060, mais le Ryzen 7 4800H est plus puissant que n'importe quel Core i7 actuellement existant.
AMD Ryzen 7 4800H, NVIDIA GeForce RTX 2060 Mobile, 17.3", 2.6 kgMSI Bravo 15 A4DCR: AMD Radeon RX 5300M, 15.60", 2 kg
Critique » Test du MSI Bravo 15 A4DCR (Ryzen 7 4800H, RX 5300M, FHD 144 Hz) : pour les chasseurs d'aubaines
MSI Bravo 17 A4DDR: AMD Radeon RX 5500M, 17.30", 2.2 kg
Critique » Test du MSI Bravo 17 (Ryzen 7 4800H, RX 5500M, FHD, 120 Hz) : PC portable de jeu tout AMD
Dell G5 15 SE 5505 P89F: AMD Radeon RX 5600M, 15.60", 2.4 kg
Critique » Test du Dell G5 15 Edition Spéciale (Ryzen 7 4800H, RX 5600M, FHD) : tout AMD
Asus TUF A17 FA706IU-AS76: NVIDIA GeForce GTX 1660 Ti Mobile, 17.30", 2.6 kg
Critique » Test de l'Asus TUF A17 FA706IU Ryzen 7 (Ryzen 7 4800H, GTX 1660 Ti, FHD, 120 Hz) : des performances de Core i9 pour 1100 €
Asus ROG Strix G15 G513IM-HN161: NVIDIA GeForce RTX 3060 Laptop GPU, 15.60", 2.3 kg
Autres tests » Asus ROG Strix G15 G513IM-HN161
Asus Vivobook 15X M1503, R7 4800H: AMD Radeon RX Vega 7, 15.60", 1.7 kg
Autres tests » Asus Vivobook 15X M1503, R7 4800H
Asus ROG Strix G15 G513IM-HN008: NVIDIA GeForce RTX 3060 Laptop GPU, 15.60", 2.3 kg
Autres tests » Asus ROG Strix G15 G513IM-HN008
Asus ROG Strix G15 G513IC-HN100W: NVIDIA GeForce RTX 3050 4GB Laptop GPU, 15.60", 2.1 kg
Autres tests » Asus ROG Strix G15 G513IC-HN100W
Asus ROG Strix G17 G713IC-HX011: NVIDIA GeForce RTX 3050 Ti Laptop GPU, 17.30", 2.4 kg
Autres tests » Asus ROG Strix G17 G713IC-HX011
Asus ROG Strix G17 G713IE-HX011: NVIDIA GeForce RTX 3050 Ti Laptop GPU, 17.30", 2.7 kg
Autres tests » Asus ROG Strix G17 G713IE-HX011
Asus ROG Strix G15 G513IE-HN004W: NVIDIA GeForce RTX 3050 Ti Laptop GPU, 15.60", 2.3 kg
Autres tests » Asus ROG Strix G15 G513IE-HN004W
BTO Notebooks X-Book 15X1187-AMD: NVIDIA GeForce RTX 2060 Mobile, 15.60"
Autres tests » BTO Notebooks X-Book 15X1187-AMD
Asus ROG Strix G513IC-HN004: NVIDIA GeForce GTX 1650 Mobile, 15.60", 2.3 kg
Autres tests » Asus ROG Strix G513IC-HN004
Huawei MateBook 14 2020 AMD: AMD Radeon RX Vega 7, 14.00", 1.6 kg
Autres tests » Huawei MateBook 14 2020 AMD
HP Omen 15-en825no: NVIDIA GeForce RTX 2060 Mobile, 15.60", 2.5 kg
Autres tests » HP Omen 15-en825no
HP Pavilion Gaming 15-ec1028ns: NVIDIA GeForce GTX 1650 Ti Mobile, 15.60", 2 kg
Autres tests » HP Pavilion Gaming 15-ec1028ns
HP Pavilion Gaming 15-ec1013ns: NVIDIA GeForce GTX 1650 Ti Mobile, 15.60", 2 kg
Autres tests » HP Pavilion Gaming 15-ec1013ns
Asus ROG Strix G15 G513IH-HN008: NVIDIA GeForce GTX 1650 Mobile, 15.60", 2.1 kg
Autres tests » Asus ROG Strix G15 G513IH-HN008
Lenovo IdeaPad Gaming 3 15ARH05-82EY00RESP: NVIDIA GeForce GTX 1650 Mobile, 15.60", 2.2 kg
Autres tests » Lenovo IdeaPad Gaming 3 15ARH05-82EY00RESP
Asus TUF Gaming A15 FA506IV-AS76: NVIDIA GeForce RTX 2060 Mobile, 15.60", 2.3 kg
Autres tests » Asus TUF Gaming A15 FA506IV-AS76
HP Omen 15-en0016ns: NVIDIA GeForce RTX 2060 Mobile, 15.60", 2.4 kg
Autres tests » HP Omen 15-en0016ns
HP Omen 15-en0006na: NVIDIA GeForce GTX 1660 Ti Mobile, 15.60", 2.4 kg
Autres tests » HP Omen 15-en0006na
Lenovo IdeaPad Gaming 3 15ARH05-82EY00CQSP: NVIDIA GeForce GTX 1650 Mobile, 15.60", 2.2 kg
Autres tests » Lenovo IdeaPad Gaming 3 15ARH05-82EY00CQSP
HP Omen 15-en0017ns: NVIDIA GeForce RTX 2060 Mobile, 15.60", 2.5 kg
Autres tests » HP Omen 15-en0017ns
Lenovo IdeaPad 3 15ARH05-82EY00CNSP: NVIDIA GeForce GTX 1650 Mobile, 15.60", 2.2 kg
Autres tests » Lenovo IdeaPad 3 15ARH05-82EY00CNSP
HP Omen 15-en0009ns: NVIDIA GeForce RTX 2060 Mobile, 15.60", 2.5 kg
Autres tests » HP Omen 15-en0009ns
HP Omen 15-en0004ns: NVIDIA GeForce RTX 2060 Mobile, 15.60", 2.5 kg
Autres tests » HP Omen 15-en0004ns
Lenovo IdeaPad 3 15ARH05-82EY00BSMH: NVIDIA GeForce GTX 1650 Mobile, 15.60", 2.2 kg
Autres tests » Lenovo IdeaPad 3 15ARH05-82EY00BSMH
Lenovo Legion 5 15ARH05H-82B1000AUS: NVIDIA GeForce GTX 1660 Ti Mobile, 15.60", 2.5 kg
Autres tests » Lenovo Legion 5 15ARH05H-82B1000AUS
Asus TUF Gaming A15 FA506II-BQ029: NVIDIA GeForce GTX 1650 Ti Mobile, 15.60", 2.3 kg
Autres tests » Asus TUF A15 FA506II-BQ029
MSI Alpha 15 A4DEK-006XES: AMD Radeon RX 5600M, 15.60", 2.4 kg
Autres tests » MSI Alpha 15 A4DEK-006XES
Asus TUF A17 FA706II-AU741: NVIDIA GeForce GTX 1650 Ti Mobile, 17.30", 2.6 kg
Autres tests » Asus TUF A17 FA706II-AU741
HP Omen 15-en0046nf: NVIDIA GeForce RTX 2060 Mobile, 15.60", 2.4 kg
Autres tests » HP Omen 15-en0046nf
HP Pavilion Gaming 15-ec1076ax: NVIDIA GeForce GTX 1660 Ti Mobile, 15.60", 2.2 kg
Autres tests » HP Pavilion Gaming 15-ec1076ax
Lenovo Legion 5 15ARH05H-82B1003EMH: NVIDIA GeForce RTX 2060 Mobile, 15.60", 2.5 kg
Autres tests » Lenovo Legion 5 15ARH05H-82B1003EMH
Asus TUF A17 FX706IU-H7081T: NVIDIA GeForce GTX 1660 Ti Mobile, 17.30", 2.6 kg
Autres tests » Asus TUF A17 FX706IU-H7081T
Lenovo Legion 5 15ARH05H-82B1008ASP: NVIDIA GeForce RTX 2060 Mobile, 15.60", 2.5 kg
Autres tests » Lenovo Legion 5 15ARH05H-82B1008ASP
Asus TUF A15 FA566IU-HN244T: NVIDIA GeForce GTX 1660 Ti Mobile, 15.60", 2.3 kg
Autres tests » Asus TUF A15 FA566IU-HN244T
HP Omen 15-en0029nr: NVIDIA GeForce GTX 1660 Ti Mobile, 15.60", 2.5 kg
Autres tests » HP Omen 15-en0029nr
Asus TUF Gaming A15 FA506IH-BQ027T: NVIDIA GeForce GTX 1650 Mobile, 15.60", 2.3 kg
Autres tests » Asus TUF Gaming A15 FA506IH-BQ027T
Asus TUF A17 FX706: NVIDIA GeForce GTX 1660 Ti Mobile, 17.30", 2.6 kg
Autres tests » Asus TUF A17 FX706
Asus TUF Gaming A15 FA506IU-HN278: NVIDIA GeForce GTX 1660 Ti Mobile, 15.60"
Autres tests » Asus TUF A15 FA506IU-HN278
MSI Bravo 15 A4DDR-217XES: AMD Radeon RX 5500M, 15.60", 2 kg
Autres tests » MSI Bravo 15 A4DDR-217XES
Huawei MateBook 14 2020 AMD KLVL-WFE9: AMD Radeon RX Vega 7, 14.00", 1.5 kg
Autres tests » Huawei MateBook 14 2020 AMD KLVL-WFE9
HP Omen 15-en0013ax: NVIDIA GeForce RTX 2060 Mobile, 15.60", 2.4 kg
Autres tests » HP Omen 15-en0013ax
Huawei MateBook 14 2020 AMD 4800H: AMD Radeon RX Vega 7, 14.00", 1.5 kg
Autres tests » Huawei MateBook 14 2020 AMD 4800H
HP Omen 15-en0261ng: NVIDIA GeForce GTX 1650 Ti Mobile, 15.60", 2.4 kg
Autres tests » HP Omen 15-en0261ng
HP Omen 15-en0001ns: NVIDIA GeForce GTX 1650 Ti Mobile, 15.60", 2.4 kg
Autres tests » HP Omen 15-en0001ns
MSI Bravo 17 A4DDK-002XES: AMD Radeon RX 5500M, 17.30", 2.2 kg
Autres tests » MSI Bravo 17 A4DDK-002XES
Acer Nitro 5 AN515-44-R4P7: NVIDIA GeForce GTX 1650 Mobile, 15.60", 2.4 kg
Autres tests » Acer Nitro 5 AN515-44-R4P7
Asus TUF Gaming A15 FA506IV-HN337: NVIDIA GeForce RTX 2060 Mobile, 15.60", 2.3 kg
Autres tests » Asus TUF Gaming A15 FA506IV-HN337
Lenovo Legion 5 15ARH05-82B500D3SP: NVIDIA GeForce GTX 1650 Mobile, 15.60", 2.3 kg
Autres tests » Lenovo Legion 5 15ARH05-82B500D3SP
Schenker XMG Core 15-M20hdw: NVIDIA GeForce GTX 1650 Ti Mobile, 15.60", 1.9 kg
Autres tests » Schenker XMG Core 15-M20hdw
Asus TUF Gaming F15 FX506IV-BQ123T: NVIDIA GeForce RTX 2060 Mobile, 15.60", 2.3 kg
Autres tests » Asus TUF Gaming A15 FX506IV-BQ123T
Asus TUF Gaming A15 FA506II-BQ150: NVIDIA GeForce GTX 1650 Ti Mobile, 15.60", 2.3 kg
Autres tests » Asus TUF Gaming A15 FA506II-BQ150
MSI Bravo 17 A4DDR: AMD Radeon RX 5500M, 17.30", 2.2 kg
Autres tests » MSI Bravo 17 A4DDR
HP Omen 15-en0263ng: NVIDIA GeForce GTX 1660 Ti Mobile, 15.60", 2.4 kg
Autres tests » HP Omen 15-en0263ng
HP Pavilion Gaming 15-ec1012ns: NVIDIA GeForce GTX 1650 Ti Mobile, 15.60", 2 kg
Autres tests » HP Pavilion Gaming 15-ec1012ns
MSI Bravo 15 A4DDR-023: AMD Radeon RX 5500M, 15.60", 1.9 kg
Autres tests » MSI Bravo 15 A4DDR-023
MSI Bravo 17 A4DDR-021: AMD Radeon RX 5500M, 17.30", 2.2 kg
Autres tests » MSI Bravo 17 A4DDR-021
Dell G5 15 SE 5505 P89F: AMD Radeon RX 5600M, 15.60", 2.4 kg
Autres tests » Dell G5 15 SE 5505 P89F
Lenovo Legion 5 15ARH05-82B5007CMH: NVIDIA GeForce GTX 1650 Ti Mobile, 15.60", 2.3 kg
Autres tests » Lenovo Legion 5 15ARH05-82B5007CMH
Asus TUF Gaming A15 566IV-AL155T: NVIDIA GeForce RTX 2060 Mobile, 15.60", 2.1 kg
Autres tests » Asus TUF Gaming A15 566IV-AL155T
Acer Aspire Nitro 5 AN515-44: NVIDIA GeForce GTX 1650 Ti Mobile, 15.60", 2.4 kg
Autres tests » Acer Aspire Nitro 5 AN515-44
Asus TUF A17 FA706IU-AS76: NVIDIA GeForce GTX 1660 Ti Mobile, 17.30", 2.6 kg
Autres tests » Asus TUF A17 FA706IU-AS76
Asus TUF Gaming A15 FA506IV-AL064T: NVIDIA GeForce RTX 2060 Mobile, 15.60", 2.3 kg
Autres tests » Asus TUF Gaming A15 FA506IV-AL064T
Asus TUF Gaming F15 FX506IV: NVIDIA GeForce RTX 2060 Mobile, 15.60", 2.3 kg
Autres tests » Asus TUF Gaming A15 FX506IV
Lenovo Legion 5 15ARH05-82B500CFGE: NVIDIA GeForce GTX 1650 Mobile, 15.60", 2.3 kg
Autres tests » Lenovo Legion 5 15ARH05-82B500CFGE
MSI Bravo 15 A4DDR-007XES: AMD Radeon RX 5500M, 15.60", 2 kg
Autres tests » MSI Bravo 15 A4DDR-007XES
Asus TUF Gaming F15 FX506II-R75TB6B: NVIDIA GeForce GTX 1650 Ti Mobile, 15.60", 2.3 kg
Autres tests » Asus TUF Gaming A15 FX506II-R75TB6B
Asus TUF Gaming F15 FX506IU-AL109T: NVIDIA GeForce GTX 1660 Ti Mobile, 15.60", 2.3 kg
Autres tests » Asus TUF Gaming A15 FX506IU-AL109T
Asus TUF Gaming A15 FA506II-BQ027T: NVIDIA GeForce GTX 1650 Ti Mobile, 15.60", 2.3 kg
Autres tests » Asus TUF Gaming A15 FA506II-BQ027T
Asus TUF Gaming F15 FX506IU-BQ225: NVIDIA GeForce GTX 1660 Ti Mobile, 15.60", 2.3 kg
Autres tests » Asus TUF Gaming A15 FX506IU-BQ225
MSI Bravo 15 A4DDR-016: AMD Radeon RX 5500M, 15.60", 1.9 kg
Autres tests » MSI Bravo 15 A4DDR-016
Dell G5 15 SE 5505: AMD Radeon RX 5600M, 15.60", 2.5 kg
Autres tests » Dell G5 15 SE 5505
Asus TUF Gaming A17 FA706II-H7356: NVIDIA GeForce GTX 1650 Ti Mobile, 17.30", 2.6 kg
Autres tests » Asus TUF Gaming A17 FA706II-H7356
Asus TUF Gaming A17 FA706II-AU077T: NVIDIA GeForce GTX 1650 Ti Mobile, 17.30", 2.6 kg
Autres tests » Asus TUF Gaming A17 FA706II-AU077T
Asus TUF Gaming A15 FA506IV-AL029T: NVIDIA GeForce RTX 2060 Mobile, 15.60", 1.7 kg
Autres tests » Asus TUF Gaming A15 FA506IV-AL029T
MSI Bravo 17 A4DDR-009: AMD Radeon RX 5500M, 17.30", 2.3 kg
Autres tests » MSI Bravo 17 A4DDR-009
Asus TUF Gaming A15 FA506IV-AL032T: NVIDIA GeForce RTX 2060 Mobile, 15.60", 2.3 kg
Autres tests » Asus TUF Gaming A15 FA506IV-AL032T
Asus TUF Gaming A15 FA506UI: NVIDIA GeForce GTX 1660 Ti Mobile, 15.60", 2.3 kg
Autres tests » Asus TUF Gaming A15 FA506UI
Dell G5 15 SE 5505 P89F: AMD Radeon RX 5600M, 15.60", 2.4 kg
» L'un des seuls ordinateurs portables de jeu AMD que vous pouvez acheter est en vente en ce moment au prix de 900 USD
Schenker XMG Core 15 GK5NR0O: NVIDIA GeForce RTX 2060 Mobile, 15.60", 2 kg
» Le Ryzen 7 dans le Schenker XMG Core 15 budget gamer apporte les moments de satisfaction
MSI Bravo 17 A4DDR: AMD Radeon RX 5500M, 17.30", 2.2 kg
» MSI Bravo 17 : AMD contre Intel et Nvidia