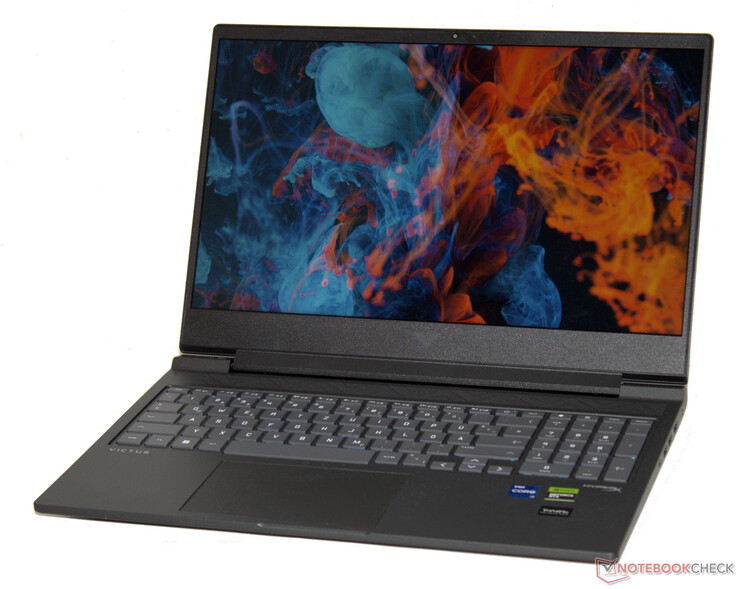
Test du HP Victus 16 (2024) : la puissance de la RTX 4060 associée à une bonne autonomie
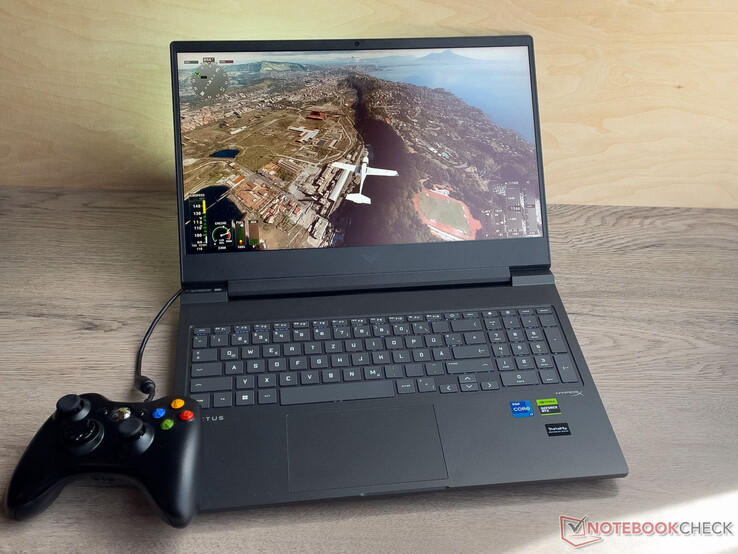
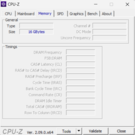
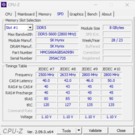
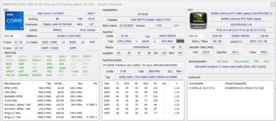
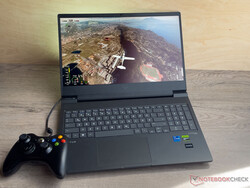
La série Victus de HP se compose d'ordinateurs portables de jeu d'entrée et de milieu de gamme - le présent appareil de test peut être classé dans cette dernière catégorie : Un processeur Raptor Lake, GeForce RTX 4060un processeur Raptor Lake, une RTX 4060, 16 Go de RAM et un disque dur SSD de 512 Go contribuent à un prix total d'environ 1 600 dollars. Parmi les concurrents, on trouve des appareils tels que le Gigabyte G6X 9KG (2024), Dell G16, Asus TUF Gaming A16 FA617XS et le Lenovo Legion 5 16IRX G9.
La version 2024 du Victus 16 est construite à l'identique du modèle 2023. Nous avons déjà testé deux versions de ce dernier (RTX 4050 et RTX 4070).
Comparaison avec les concurrents potentiels
Note | Date | Modèle | Poids | Épaisseur | Taille | Résolution | Prix |
|---|---|---|---|---|---|---|---|
| 84.3 % v7 (old) | 05/24 | HP Victus 16 (2024) i7-14700HX, GeForce RTX 4060 Laptop GPU | 2.4 kg | 23.9 mm | 16.10" | 1920x1080 | |
| 83.2 % v7 (old) | 03/24 | Gigabyte G6X 9KG (2024) i7-13650HX, GeForce RTX 4060 Laptop GPU | 2.6 kg | 25.1 mm | 16.00" | 1920x1200 | |
| 85.5 % v7 (old) | 02/24 | Dell G16, i7-13650HX, RTX 4060 i7-13650HX, GeForce RTX 4060 Laptop GPU | 2.8 kg | 25.65 mm | 16.00" | 2560x1600 | |
| 89.1 % v7 (old) | 02/24 | Lenovo Legion 5 16IRX G9 i7-14650HX, GeForce RTX 4060 Laptop GPU | 2.4 kg | 25.2 mm | 16.00" | 2560x1600 | |
| 86.9 % v7 (old) | 06/23 | Asus TUF Gaming A16 FA617XS R9 7940HS, Radeon RX 7600S | 2.2 kg | 22.1 mm | 16.00" | 1920x1200 |
Top 10
» Le Top 10 des PC portables multimédia
» Le Top 10 des PC portables de jeu
» Le Top 10 des PC portables de jeu légers
» Le Top 10 des ordinateurs portables bureautiques
» Le Top 10 des PC portables bureautiques premium/professionnels
» Le Top 10 des Stations de travail mobiles
» Le Top 10 des Ultraportables
» Le Top 10 des Ultrabooks
» Le Top 10 des Convertibles
» Le Top 10 des Tablettes
» Le Top 10 des Tablettes Windows
» Le Top 10 des Smartphones
» Le Top 10 des PC Portables á moins de 300 euros
» Le Top 10 des PC Portables á moins de 500 euros
» Le Top 25 des meilleurs écrans d'ordinateurs
Boîtier et connectivité - Le HP Victus est doté de la fonction Power Delivery
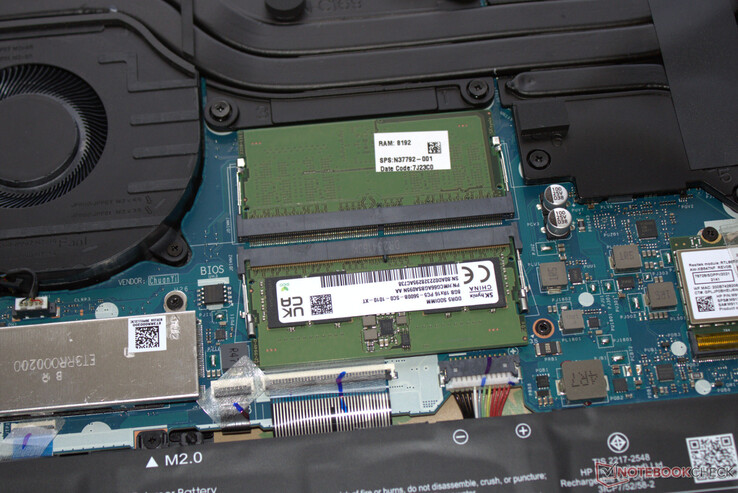
Vous ne pouvez pas vous attendre à des matériaux de haute qualité : L'ensemble du boîtier de l'ordinateur portable est en plastique mat dans le coloris "Mica Silver" - un noir anthracite gris foncé. Le couvercle et l'unité de base peuvent être tordus. Aucun élément LED n'est utilisé sur le boîtier dépouillé et l'accessoire le plus accrocheur est le logo Victus au dos du couvercle de l'appareil. La batterie (vissée et non collée) ainsi que le reste du matériel sont accessibles après avoir retiré la partie inférieure du boîtier.
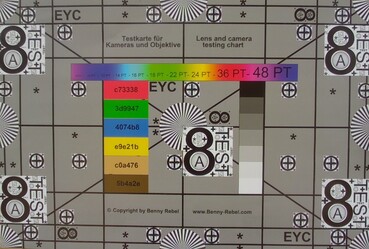
Vous chercherez en vain Thunderbolt et USB 4 : Les quatre ports USB (3x USB-A, 1x USB-C) respectent la norme USB 3.2 Gen 1. Le port USB-C prend en charge Power Delivery et peut émettre un signal DisplayPort. Au total, l'ordinateur portable dispose de deux sorties vidéo (1 HDMI, 1 DP). Sa webcam (2,1 MP, avec cache) offre des résultats moyens. Il n'est pas équipé d'un lecteur de carte SD.
Le Victus est équipé d'une puce Realtek WiFi 6 (RTL8852BE) qui ne peut rivaliser avec les puces Intel de ses concurrents : Les débits WiFi que nous avons mesurés sont corrects, mais en deçà des possibilités actuelles.
Périphériques d'entrée - L'ordinateur portable HP avec de petites touches fléchées
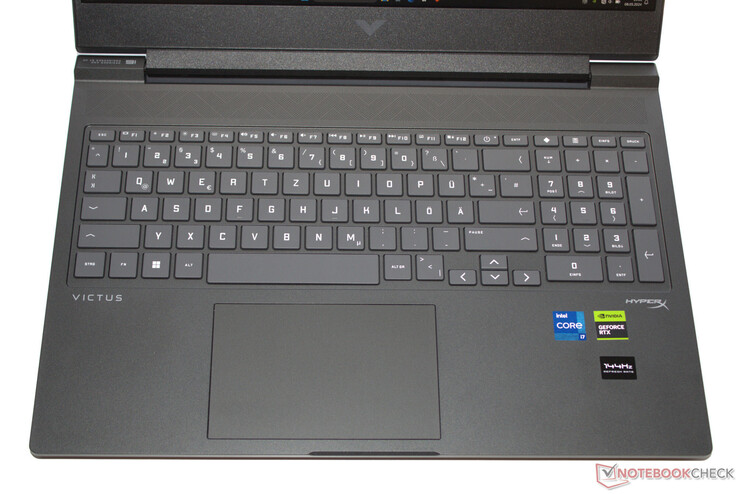
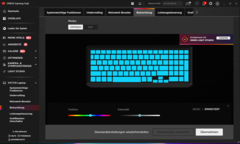
Les touches lisses du clavier chiclet (éclairage RVB, pavé numérique) se caractérisent par une levée courte et un point de pression clair. Leur résistance gagnerait à être un peu plus nette. Le clavier rebondit légèrement lors de la frappe. Points négatifs : Les touches fléchées et la touche Entrée sont relativement petites. Un pavé tactile (12,5 x 7,5 cm) à faible hauteur et à point de pression net remplace la souris.
Écran - Panneau IPS avec une faible précision des couleurs
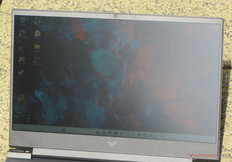
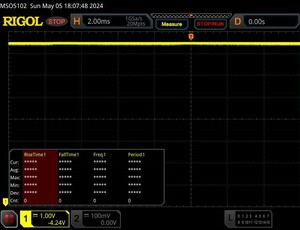
HP a équipé le Victus d'un écran 144 Hz (FHD, IPS) stable dans l'angle de vision, avec un rapport d'aspect de 16:9. Il ne présente aucun scintillement PWM à tous les niveaux de luminosité. La luminosité et le contraste de l'écran de 16,1 pouces sont conçus pour une utilisation en intérieur - la valeur cible (> 300 cd/m²) n'a pas été tout à fait atteinte. Vous pouvez lire sur l'écran à l'extérieur tant que le soleil ne brille pas trop fort.
| |||||||||||||||||||||||||
Homogénéité de la luminosité: 86 %
Valeur mesurée au centre, sur batterie: 287 cd/m²
Contraste: 1511:1 (Valeurs des noirs: 0.19 cd/m²)
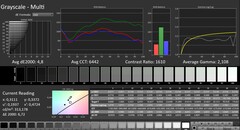
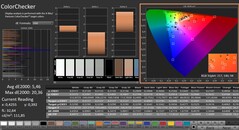
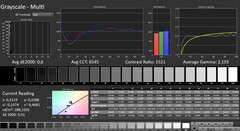
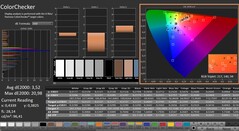
ΔE ColorChecker Calman: 5.46 | ∀{0.5-29.43 Ø4.76}
calibrated: 3.52
ΔE Greyscale Calman: 4.8 | ∀{0.09-98 Ø5}
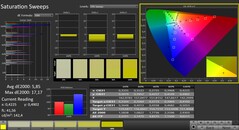
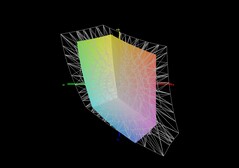
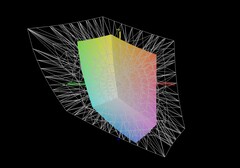
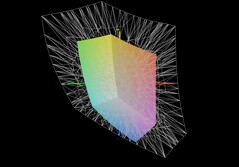
42.7% AdobeRGB 1998 (Argyll 3D)
61.7% sRGB (Argyll 3D)
41.3% Display P3 (Argyll 3D)
Gamma: 2.108
CCT: 6442 K
| HP Victus 16 (2024) Chi Mei CMN163E, IPS, 1920x1080, 16.1" | Gigabyte G6X 9KG (2024) BOE NE160WUM-NX6, IPS, 1920x1200, 16" | Dell G16, i7-13650HX, RTX 4060 Chi Mei CMN161D (160GME), IPS, 2560x1600, 16" | Lenovo Legion 5 16IRX G9 NE160QDM-NZ3, IPS, 2560x1600, 16" | Asus TUF Gaming A16 FA617XS BOE NE160WUM-NX2, IPS, 1920x1200, 16" | |
|---|---|---|---|---|---|
| Display | 1% | 62% | 70% | 64% | |
| Display P3 Coverage (%) | 41.3 | 41.8 1% | 67.5 63% | 72.4 75% | 69.3 68% |
| sRGB Coverage (%) | 61.7 | 62.4 1% | 98.5 60% | 100 62% | 97.3 58% |
| AdobeRGB 1998 Coverage (%) | 42.7 | 43.3 1% | 69.3 62% | 74.1 74% | 70.7 66% |
| Response Times | -29% | 59% | 55% | 46% | |
| Response Time Grey 50% / Grey 80% * (ms) | 28.6 ? | 40.5 ? -42% | 7.6 ? 73% | 12.5 ? 56% | 15.6 ? 45% |
| Response Time Black / White * (ms) | 18.7 ? | 21.6 ? -16% | 10.4 ? 44% | 8.7 ? 53% | 10 ? 47% |
| PWM Frequency (Hz) | |||||
| Screen | 6% | 21% | 45% | 29% | |
| Brightness middle (cd/m²) | 287 | 353 23% | 369 29% | 526 83% | 301 5% |
| Brightness (cd/m²) | 288 | 318 10% | 344 19% | 500 74% | 294 2% |
| Brightness Distribution (%) | 86 | 81 -6% | 89 3% | 87 1% | 94 9% |
| Black Level * (cd/m²) | 0.19 | 0.21 -11% | 0.26 -37% | 0.33 -74% | 0.21 -11% |
| Contrast (:1) | 1511 | 1681 11% | 1419 -6% | 1594 5% | 1433 -5% |
| Colorchecker dE 2000 * | 5.46 | 5.21 5% | 3.04 44% | 1.2 78% | 1.79 67% |
| Colorchecker dE 2000 max. * | 20.36 | 19.95 2% | 5.56 73% | 2.1 90% | 3.48 83% |
| Colorchecker dE 2000 calibrated * | 3.52 | 3.61 -3% | 2.35 33% | 1 72% | 1.2 66% |
| Greyscale dE 2000 * | 4.8 | 3.6 25% | 3.38 30% | 1.3 73% | 2.5 48% |
| Gamma | 2.108 104% | 2.367 93% | 2.47 89% | 2.23 99% | 2.265 97% |
| CCT | 6442 101% | 7138 91% | 6040 108% | 6391 102% | 6157 106% |
| Moyenne finale (programmes/paramètres) | -7% /
0% | 47% /
35% | 57% /
52% | 46% /
39% |
* ... Moindre est la valeur, meilleures sont les performances
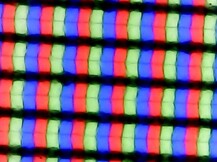
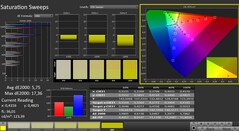
L'écran ne peut pas reproduire les espaces colorimétriques courants (AdobeRGB, sRGB, DCI-P3). À cet égard, les écrans de certains concurrents offrent davantage. Sa reproduction des couleurs n'est pas non plus la meilleure : Son écart d'usine est de 5,5 et un étalonnage réduit la valeur à environ 3,5 - dans tous les cas, l'objectif (DeltaE < 3) n'a pas été atteint.
Temps de réponse de l'écran
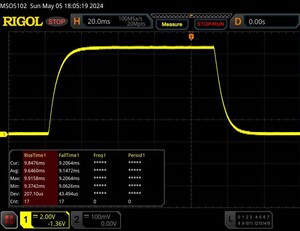
| ↔ Temps de réponse noir à blanc | ||
|---|---|---|
| 18.7 ms ... hausse ↗ et chute ↘ combinées | ↗ 9.6 ms hausse | |
| ↘ 9.1 ms chute | ||
| L'écran montre de bons temps de réponse, mais insuffisant pour du jeu compétitif. En comparaison, tous les appareils testés affichent entre 0.1 (minimum) et 240 (maximum) ms. » 41 % des appareils testés affichent de meilleures performances. Cela signifie que les latences relevées sont similaires à la moyenne (20.1 ms) de tous les appareils testés. | ||
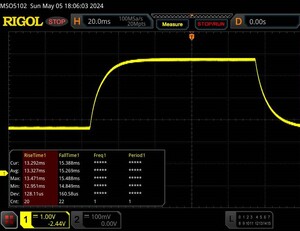
| ↔ Temps de réponse gris 50% à gris 80% | ||
| 28.6 ms ... hausse ↗ et chute ↘ combinées | ↗ 13.3 ms hausse | |
| ↘ 15.3 ms chute | ||
| L'écran souffre de latences relativement élevées, insuffisant pour le jeu. En comparaison, tous les appareils testés affichent entre 0.165 (minimum) et 636 (maximum) ms. » 37 % des appareils testés affichent de meilleures performances. Cela signifie que les latences relevées sont similaires à la moyenne (31.5 ms) de tous les appareils testés. | ||
Scintillement / MLI (Modulation de largeur d'impulsion)
| Scintillement / MLI (Modulation de largeur d'impulsion) non décelé | |||
En comparaison, 53 % des appareils testés n'emploient pas MDI pour assombrir leur écran. Nous avons relevé une moyenne à 8036 (minimum : 5 - maximum : 343500) Hz dans le cas où une MDI était active. | |||
Performance - Raptor Lake et Ada Lovelace fournissent de la vapeur
HP propose plusieurs variantes de configuration du Victus 16. La version la moins chère de la série Victus 16 r1000 se trouve actuellement aux alentours de 1 300 dollars (Core i5-14500HX, GeForce RTX 4050, 16 Go de RAM, 512 Go de SSD, pas de Windows). Pour l'appareil de test actuel, il vous faudra débourser environ 1 600 dollars.
Conditions d'essai
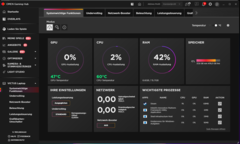
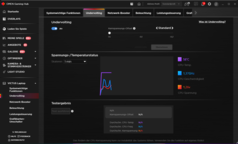
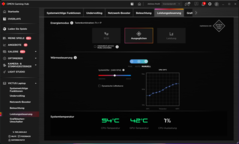
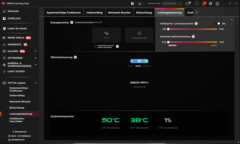
Les utilisateurs ont le choix entre trois modes système spécifiques à HP (voir tableau). Les modes "Balanced" (benchmarks) et "ECO" (tests de batterie) ont été utilisés lors de notre test. Une combinaison de touches (Fn + P) permet de changer rapidement de mode. Le "Omen Gaming Hub" (centre de contrôle de l'ordinateur portable) vous permet également de sélectionner le mode. Il permet également de sous-volter le CPU et de régler une courbe de ventilateur individuelle, entre autres choses.
| Équilibré | Performance | Eco | |
|---|---|---|---|
| Limite de puissance 1 (HWInfo) | 130 watts | 130 watts | 130 watts |
| Limite de puissance 2 (HWInfo) | 130 watts | 130 watts | 130 watts |
| Performances (Witcher 3) | 98 fps | 100 fps | 60 fps (verrouillé) |
| Bruit (Witcher 3) | 43 dB(A) | 52 dB(A) | 38 dB(A) |
Processeur
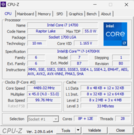
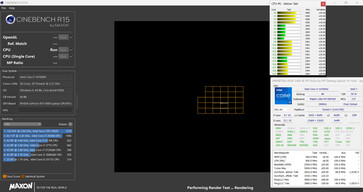
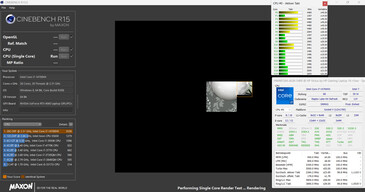
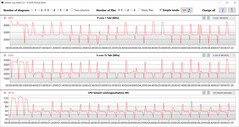
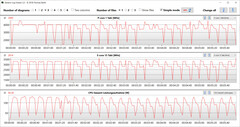
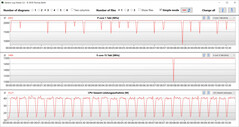
Le Core i7-14700HX(Raptor Lake) (8P + 12E = 28 threads) atteignent des fréquences maximales de 5,5 GHz (P) et 3,9 GHz (E). La charge multithread permanente (boucle CB15) fait chuter la fréquence d'horloge de la première à la quatrième exécution ("Balanced"). Ensuite, elle se maintient à un niveau constant. l'option "Performance" se traduit par une fréquence d'horloge plus élevée en permanence.
Les résultats du benchmark sont un peu décevants : Malgré quatre cœurs supplémentaires et une fréquence d'horloge plus élevée, le processeur n'a pas pu se démarquer du Legion 5 16IRX G9's Core i7-14650HX. Ses performances multithread sont pratiquement les mêmes, tandis que le 14650HX l'emporte nettement en ce qui concerne les performances single-thread.
Cinebench R15 Multi continuous test
| CPU Performance rating - Percent | |
| Moyenne de la classe Gaming | |
| Lenovo Legion 5 16IRX G9 | |
| Moyenne Intel Core i7-14700HX | |
| HP Victus 16 (2024) | |
| HP Victus 16 (2024) | |
| Dell G16, i7-13650HX, RTX 4060 | |
| Gigabyte G6X 9KG (2024) | |
| Asus TUF Gaming A16 FA617XS -2! | |
| Cinebench R20 | |
| CPU (Multi Core) | |
| Moyenne de la classe Gaming (2179 - 16108, n=135, 2 dernières années) | |
| Lenovo Legion 5 16IRX G9 | |
| HP Victus 16 (2024) | |
| Moyenne Intel Core i7-14700HX (7988 - 10540, n=9) | |
| HP Victus 16 (2024) (Leistung) | |
| Dell G16, i7-13650HX, RTX 4060 | |
| Gigabyte G6X 9KG (2024) | |
| Asus TUF Gaming A16 FA617XS | |
| CPU (Single Core) | |
| Moyenne Intel Core i7-14700HX (651 - 821, n=9) | |
| Moyenne de la classe Gaming (439 - 870, n=135, 2 dernières années) | |
| Lenovo Legion 5 16IRX G9 | |
| Dell G16, i7-13650HX, RTX 4060 | |
| Asus TUF Gaming A16 FA617XS | |
| Gigabyte G6X 9KG (2024) | |
| HP Victus 16 (2024) (Leistung) | |
| HP Victus 16 (2024) | |
| Cinebench R15 | |
| CPU Multi 64Bit | |
| Moyenne de la classe Gaming (1537 - 6271, n=135, 2 dernières années) | |
| HP Victus 16 (2024) | |
| Moyenne Intel Core i7-14700HX (3328 - 4248, n=9) | |
| Lenovo Legion 5 16IRX G9 | |
| HP Victus 16 (2024) (Leistung) | |
| Dell G16, i7-13650HX, RTX 4060 | |
| Gigabyte G6X 9KG (2024) | |
| Asus TUF Gaming A16 FA617XS | |
| CPU Single 64Bit | |
| Moyenne de la classe Gaming (188.8 - 343, n=134, 2 dernières années) | |
| Lenovo Legion 5 16IRX G9 | |
| Moyenne Intel Core i7-14700HX (238 - 304, n=9) | |
| Asus TUF Gaming A16 FA617XS | |
| Dell G16, i7-13650HX, RTX 4060 | |
| Gigabyte G6X 9KG (2024) | |
| HP Victus 16 (2024) (Leistung) | |
| HP Victus 16 (2024) | |
| Blender - v2.79 BMW27 CPU | |
| Gigabyte G6X 9KG (2024) | |
| Asus TUF Gaming A16 FA617XS | |
| HP Victus 16 (2024) | |
| Dell G16, i7-13650HX, RTX 4060 | |
| Moyenne de la classe Gaming (80 - 517, n=131, 2 dernières années) | |
| Moyenne Intel Core i7-14700HX (126 - 212, n=9) | |
| Lenovo Legion 5 16IRX G9 | |
| HP Victus 16 (2024) (Leistung) | |
| Geekbench 6.5 | |
| Multi-Core | |
| Lenovo Legion 5 16IRX G9 (6.2.1) | |
| Moyenne Intel Core i7-14700HX (14163 - 17562, n=9) | |
| Moyenne de la classe Gaming (5340 - 22104, n=134, 2 dernières années) | |
| HP Victus 16 (2024) (6.2.1, Leistung) | |
| HP Victus 16 (2024) (6.2.1) | |
| Dell G16, i7-13650HX, RTX 4060 (6.2.1) | |
| Gigabyte G6X 9KG (2024) (6.2.1) | |
| Single-Core | |
| Moyenne Intel Core i7-14700HX (2378 - 2975, n=9) | |
| Moyenne de la classe Gaming (1490 - 3259, n=134, 2 dernières années) | |
| Lenovo Legion 5 16IRX G9 (6.2.1) | |
| Dell G16, i7-13650HX, RTX 4060 (6.2.1) | |
| Gigabyte G6X 9KG (2024) (6.2.1) | |
| HP Victus 16 (2024) (6.2.1, Leistung) | |
| HP Victus 16 (2024) (6.2.1) | |
| HWBOT x265 Benchmark v2.2 - 4k Preset | |
| Moyenne de la classe Gaming (7.7 - 44.3, n=133, 2 dernières années) | |
| HP Victus 16 (2024) (Leistung) | |
| Lenovo Legion 5 16IRX G9 | |
| Moyenne Intel Core i7-14700HX (19.5 - 27.4, n=9) | |
| HP Victus 16 (2024) | |
| Asus TUF Gaming A16 FA617XS | |
| Dell G16, i7-13650HX, RTX 4060 | |
| Gigabyte G6X 9KG (2024) | |
| LibreOffice - 20 Documents To PDF | |
| HP Victus 16 (2024) (6.3.4.2) | |
| Dell G16, i7-13650HX, RTX 4060 (6.3.4.2) | |
| Moyenne de la classe Gaming (19 - 88.8, n=133, 2 dernières années) | |
| Moyenne Intel Core i7-14700HX (41.9 - 55.3, n=9) | |
| Lenovo Legion 5 16IRX G9 (6.3.4.2) | |
| HP Victus 16 (2024) (6.3.4.2. Leistung) | |
| Asus TUF Gaming A16 FA617XS | |
| Gigabyte G6X 9KG (2024) (6.3.4.2) | |
* ... Moindre est la valeur, meilleures sont les performances
AIDA64: FP32 Ray-Trace | FPU Julia | CPU SHA3 | CPU Queen | FPU SinJulia | FPU Mandel | CPU AES | CPU ZLib | FP64 Ray-Trace | CPU PhotoWorxx
| Performance rating | |
| Moyenne de la classe Gaming | |
| HP Victus 16 (2024) | |
| Asus TUF Gaming A16 FA617XS | |
| Moyenne Intel Core i7-14700HX | |
| Lenovo Legion 5 16IRX G9 | |
| Dell G16, i7-13650HX, RTX 4060 | |
| HP Victus 16 (2024) | |
| Gigabyte G6X 9KG (2024) | |
| AIDA64 / FP32 Ray-Trace | |
| Moyenne de la classe Gaming (7192 - 85542, n=133, 2 dernières années) | |
| Asus TUF Gaming A16 FA617XS (v6.75.6100) | |
| HP Victus 16 (2024) (v6.92.6600, Leistung) | |
| Moyenne Intel Core i7-14700HX (14147 - 23676, n=9) | |
| Lenovo Legion 5 16IRX G9 (v6.92.6600) | |
| Dell G16, i7-13650HX, RTX 4060 (v6.92.6600) | |
| HP Victus 16 (2024) (v6.92.6600) | |
| Gigabyte G6X 9KG (2024) (v6.92.6600) | |
| AIDA64 / FPU Julia | |
| Moyenne de la classe Gaming (35040 - 238426, n=133, 2 dernières années) | |
| Asus TUF Gaming A16 FA617XS (v6.75.6100) | |
| HP Victus 16 (2024) (v6.92.6600, Leistung) | |
| Moyenne Intel Core i7-14700HX (71875 - 116556, n=9) | |
| Lenovo Legion 5 16IRX G9 (v6.92.6600) | |
| Dell G16, i7-13650HX, RTX 4060 (v6.92.6600) | |
| HP Victus 16 (2024) (v6.92.6600) | |
| Gigabyte G6X 9KG (2024) (v6.92.6600) | |
| AIDA64 / CPU SHA3 | |
| Moyenne de la classe Gaming (1728 - 9817, n=133, 2 dernières années) | |
| HP Victus 16 (2024) (v6.92.6600, Leistung) | |
| Moyenne Intel Core i7-14700HX (3388 - 5567, n=9) | |
| Asus TUF Gaming A16 FA617XS (v6.75.6100) | |
| Dell G16, i7-13650HX, RTX 4060 (v6.92.6600) | |
| Lenovo Legion 5 16IRX G9 (v6.92.6600) | |
| HP Victus 16 (2024) (v6.92.6600) | |
| Gigabyte G6X 9KG (2024) (v6.92.6600) | |
| AIDA64 / CPU Queen | |
| Moyenne Intel Core i7-14700HX (129134 - 152200, n=9) | |
| HP Victus 16 (2024) (v6.92.6600, Leistung) | |
| HP Victus 16 (2024) (v6.92.6600) | |
| Asus TUF Gaming A16 FA617XS (v6.75.6100) | |
| Moyenne de la classe Gaming (49785 - 173351, n=133, 2 dernières années) | |
| Gigabyte G6X 9KG (2024) (v6.92.6600) | |
| Dell G16, i7-13650HX, RTX 4060 (v6.92.6600) | |
| Lenovo Legion 5 16IRX G9 (v6.92.6600) | |
| AIDA64 / FPU SinJulia | |
| Asus TUF Gaming A16 FA617XS (v6.75.6100) | |
| Moyenne de la classe Gaming (4424 - 33636, n=133, 2 dernières années) | |
| HP Victus 16 (2024) (v6.92.6600, Leistung) | |
| Moyenne Intel Core i7-14700HX (10266 - 14434, n=9) | |
| Lenovo Legion 5 16IRX G9 (v6.92.6600) | |
| HP Victus 16 (2024) (v6.92.6600) | |
| Dell G16, i7-13650HX, RTX 4060 (v6.92.6600) | |
| Gigabyte G6X 9KG (2024) (v6.92.6600) | |
| AIDA64 / FPU Mandel | |
| Moyenne de la classe Gaming (17585 - 128721, n=133, 2 dernières années) | |
| Asus TUF Gaming A16 FA617XS (v6.75.6100) | |
| HP Victus 16 (2024) (v6.92.6600, Leistung) | |
| Moyenne Intel Core i7-14700HX (35155 - 58380, n=9) | |
| Lenovo Legion 5 16IRX G9 (v6.92.6600) | |
| Dell G16, i7-13650HX, RTX 4060 (v6.92.6600) | |
| HP Victus 16 (2024) (v6.92.6600) | |
| Gigabyte G6X 9KG (2024) (v6.92.6600) | |
| AIDA64 / CPU AES | |
| Moyenne de la classe Gaming (19065 - 247074, n=133, 2 dernières années) | |
| HP Victus 16 (2024) (v6.92.6600, Leistung) | |
| Moyenne Intel Core i7-14700HX (68616 - 113157, n=9) | |
| Lenovo Legion 5 16IRX G9 (v6.92.6600) | |
| Asus TUF Gaming A16 FA617XS (v6.75.6100) | |
| Dell G16, i7-13650HX, RTX 4060 (v6.92.6600) | |
| HP Victus 16 (2024) (v6.92.6600) | |
| Gigabyte G6X 9KG (2024) (v6.92.6600) | |
| AIDA64 / CPU ZLib | |
| HP Victus 16 (2024) (v6.92.6600, Leistung) | |
| Moyenne de la classe Gaming (373 - 2531, n=133, 2 dernières années) | |
| Moyenne Intel Core i7-14700HX (1003 - 1682, n=9) | |
| Lenovo Legion 5 16IRX G9 (v6.92.6600) | |
| Dell G16, i7-13650HX, RTX 4060 (v6.92.6600) | |
| HP Victus 16 (2024) (v6.92.6600) | |
| Gigabyte G6X 9KG (2024) (v6.92.6600) | |
| Asus TUF Gaming A16 FA617XS (v6.75.6100) | |
| AIDA64 / FP64 Ray-Trace | |
| Moyenne de la classe Gaming (3856 - 45446, n=133, 2 dernières années) | |
| Asus TUF Gaming A16 FA617XS (v6.75.6100) | |
| HP Victus 16 (2024) (v6.92.6600, Leistung) | |
| Moyenne Intel Core i7-14700HX (7585 - 12928, n=9) | |
| Dell G16, i7-13650HX, RTX 4060 (v6.92.6600) | |
| Lenovo Legion 5 16IRX G9 (v6.92.6600) | |
| HP Victus 16 (2024) (v6.92.6600) | |
| Gigabyte G6X 9KG (2024) (v6.92.6600) | |
| AIDA64 / CPU PhotoWorxx | |
| Moyenne de la classe Gaming (10805 - 62916, n=133, 2 dernières années) | |
| Moyenne Intel Core i7-14700HX (24276 - 49671, n=9) | |
| HP Victus 16 (2024) (v6.92.6600) | |
| HP Victus 16 (2024) (v6.92.6600, Leistung) | |
| Gigabyte G6X 9KG (2024) (v6.92.6600) | |
| Dell G16, i7-13650HX, RTX 4060 (v6.92.6600) | |
| Lenovo Legion 5 16IRX G9 (v6.92.6600) | |
| Asus TUF Gaming A16 FA617XS (v6.75.6100) | |
Performance du système
CrossMark: Overall | Productivity | Creativity | Responsiveness
WebXPRT 3: Overall
WebXPRT 4: Overall
Mozilla Kraken 1.1: Total
| PCMark 10 / Score | |
| Moyenne de la classe Gaming (5776 - 10060, n=112, 2 dernières années) | |
| Asus TUF Gaming A16 FA617XS | |
| Moyenne Intel Core i7-14700HX, NVIDIA GeForce RTX 4060 Laptop GPU (7528 - 8278, n=2) | |
| Lenovo Legion 5 16IRX G9 | |
| Gigabyte G6X 9KG (2024) | |
| HP Victus 16 (2024) | |
| Dell G16, i7-13650HX, RTX 4060 | |
| PCMark 10 / Essentials | |
| Moyenne Intel Core i7-14700HX, NVIDIA GeForce RTX 4060 Laptop GPU (10778 - 11087, n=2) | |
| Asus TUF Gaming A16 FA617XS | |
| Lenovo Legion 5 16IRX G9 | |
| HP Victus 16 (2024) | |
| Moyenne de la classe Gaming (8810 - 12600, n=116, 2 dernières années) | |
| Gigabyte G6X 9KG (2024) | |
| Dell G16, i7-13650HX, RTX 4060 | |
| PCMark 10 / Productivity | |
| Asus TUF Gaming A16 FA617XS | |
| Gigabyte G6X 9KG (2024) | |
| Dell G16, i7-13650HX, RTX 4060 | |
| Moyenne de la classe Gaming (6662 - 16716, n=114, 2 dernières années) | |
| HP Victus 16 (2024) | |
| Moyenne Intel Core i7-14700HX, NVIDIA GeForce RTX 4060 Laptop GPU (9823 - 9910, n=2) | |
| Lenovo Legion 5 16IRX G9 | |
| PCMark 10 / Digital Content Creation | |
| Moyenne de la classe Gaming (7440 - 19351, n=114, 2 dernières années) | |
| Moyenne Intel Core i7-14700HX, NVIDIA GeForce RTX 4060 Laptop GPU (10841 - 14135, n=2) | |
| Lenovo Legion 5 16IRX G9 | |
| Asus TUF Gaming A16 FA617XS | |
| Dell G16, i7-13650HX, RTX 4060 | |
| Gigabyte G6X 9KG (2024) | |
| HP Victus 16 (2024) | |
| CrossMark / Overall | |
| Lenovo Legion 5 16IRX G9 | |
| Moyenne Intel Core i7-14700HX, NVIDIA GeForce RTX 4060 Laptop GPU (1923 - 2132, n=2) | |
| Moyenne de la classe Gaming (1247 - 2344, n=112, 2 dernières années) | |
| Gigabyte G6X 9KG (2024) | |
| HP Victus 16 (2024) | |
| Dell G16, i7-13650HX, RTX 4060 | |
| Asus TUF Gaming A16 FA617XS | |
| CrossMark / Productivity | |
| Lenovo Legion 5 16IRX G9 | |
| Moyenne Intel Core i7-14700HX, NVIDIA GeForce RTX 4060 Laptop GPU (1782 - 1973, n=2) | |
| Gigabyte G6X 9KG (2024) | |
| Moyenne de la classe Gaming (1299 - 2211, n=112, 2 dernières années) | |
| HP Victus 16 (2024) | |
| Dell G16, i7-13650HX, RTX 4060 | |
| Asus TUF Gaming A16 FA617XS | |
| CrossMark / Creativity | |
| Lenovo Legion 5 16IRX G9 | |
| Moyenne Intel Core i7-14700HX, NVIDIA GeForce RTX 4060 Laptop GPU (2107 - 2399, n=2) | |
| Moyenne de la classe Gaming (1275 - 2729, n=112, 2 dernières années) | |
| HP Victus 16 (2024) | |
| Gigabyte G6X 9KG (2024) | |
| Dell G16, i7-13650HX, RTX 4060 | |
| Asus TUF Gaming A16 FA617XS | |
| CrossMark / Responsiveness | |
| Gigabyte G6X 9KG (2024) | |
| Lenovo Legion 5 16IRX G9 | |
| Moyenne Intel Core i7-14700HX, NVIDIA GeForce RTX 4060 Laptop GPU (1835 - 1885, n=2) | |
| HP Victus 16 (2024) | |
| Moyenne de la classe Gaming (1030 - 2330, n=112, 2 dernières années) | |
| Dell G16, i7-13650HX, RTX 4060 | |
| Asus TUF Gaming A16 FA617XS | |
| WebXPRT 3 / Overall | |
| Moyenne de la classe Gaming (237 - 532, n=115, 2 dernières années) | |
| Lenovo Legion 5 16IRX G9 | |
| Gigabyte G6X 9KG (2024) | |
| Moyenne Intel Core i7-14700HX, NVIDIA GeForce RTX 4060 Laptop GPU (276 - 301, n=2) | |
| HP Victus 16 (2024) | |
| Dell G16, i7-13650HX, RTX 4060 | |
| WebXPRT 4 / Overall | |
| Lenovo Legion 5 16IRX G9 | |
| Moyenne de la classe Gaming (176.4 - 345, n=112, 2 dernières années) | |
| Asus TUF Gaming A16 FA617XS | |
| Moyenne Intel Core i7-14700HX, NVIDIA GeForce RTX 4060 Laptop GPU (251 - 273, n=2) | |
| Gigabyte G6X 9KG (2024) | |
| HP Victus 16 (2024) | |
| Mozilla Kraken 1.1 / Total | |
| HP Victus 16 (2024) | |
| Gigabyte G6X 9KG (2024) | |
| Dell G16, i7-13650HX, RTX 4060 | |
| Moyenne Intel Core i7-14700HX, NVIDIA GeForce RTX 4060 Laptop GPU (467 - 542, n=2) | |
| Asus TUF Gaming A16 FA617XS | |
| Lenovo Legion 5 16IRX G9 | |
| Moyenne de la classe Gaming (397 - 674, n=124, 2 dernières années) | |
* ... Moindre est la valeur, meilleures sont les performances
| PCMark 10 Score | 7528 points | |
Aide | ||
| AIDA64 / Memory Copy | |
| Moyenne de la classe Gaming (21750 - 108104, n=133, 2 dernières années) | |
| Moyenne Intel Core i7-14700HX (41617 - 78742, n=9) | |
| HP Victus 16 (2024) | |
| Gigabyte G6X 9KG (2024) | |
| Lenovo Legion 5 16IRX G9 | |
| Asus TUF Gaming A16 FA617XS | |
| Dell G16, i7-13650HX, RTX 4060 | |
| AIDA64 / Memory Read | |
| HP Victus 16 (2024) | |
| Moyenne Intel Core i7-14700HX (46627 - 86175, n=9) | |
| Moyenne de la classe Gaming (22956 - 104349, n=133, 2 dernières années) | |
| Lenovo Legion 5 16IRX G9 | |
| Gigabyte G6X 9KG (2024) | |
| Dell G16, i7-13650HX, RTX 4060 | |
| Asus TUF Gaming A16 FA617XS | |
| AIDA64 / Memory Write | |
| Moyenne de la classe Gaming (22297 - 133486, n=133, 2 dernières années) | |
| Asus TUF Gaming A16 FA617XS | |
| Moyenne Intel Core i7-14700HX (39155 - 76976, n=9) | |
| HP Victus 16 (2024) | |
| Gigabyte G6X 9KG (2024) | |
| Dell G16, i7-13650HX, RTX 4060 | |
| Lenovo Legion 5 16IRX G9 | |
| AIDA64 / Memory Latency | |
| Moyenne de la classe Gaming (59.5 - 259, n=133, 2 dernières années) | |
| HP Victus 16 (2024) | |
| Dell G16, i7-13650HX, RTX 4060 | |
| Asus TUF Gaming A16 FA617XS | |
| Gigabyte G6X 9KG (2024) | |
| Lenovo Legion 5 16IRX G9 | |
| Moyenne Intel Core i7-14700HX (82.7 - 96.4, n=9) | |
* ... Moindre est la valeur, meilleures sont les performances
Latences DPC
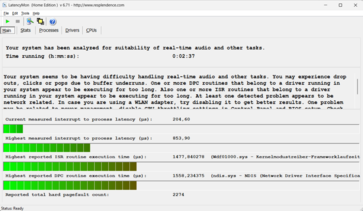
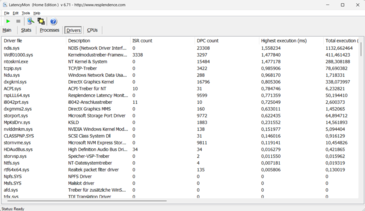
La vérification des temps de latence de l'ordinateur portable (surf sur le web, lecture de vidéos 4k, charge élevée de Prime95) a révélé quelques anomalies. La combinaison actuelle matériel-logiciel ne semble pas convenir à l'édition vidéo et audio en temps réel. De futures mises à jour logicielles pourraient apporter des changements.
| DPC Latencies / LatencyMon - interrupt to process latency (max), Web, Youtube, Prime95 | |
| Gigabyte G6X 9KG (2024) | |
| Lenovo Legion 5 16IRX G9 | |
| Asus TUF Gaming A16 FA617XS | |
| Dell G16, i7-13650HX, RTX 4060 | |
| HP Victus 16 (2024) | |
* ... Moindre est la valeur, meilleures sont les performances
Dispositifs de stockage
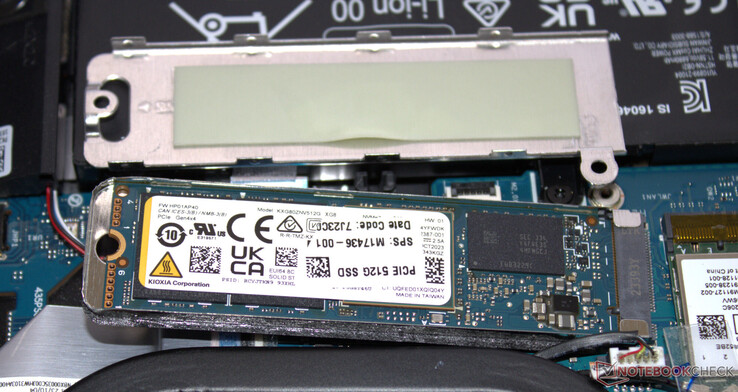
Le SSD PCIe 4 (M.2-2280) de Kioxia a une capacité de 512 Go et offre de bons taux de transfert. Au cours de la boucle DiskSpd, ses débits de données ont baissé progressivement jusqu'à un niveau inférieur en raison d'un étranglement thermique. L'ordinateur portable dispose d'un espace pour un second SSD.
* ... Moindre est la valeur, meilleures sont les performances
Reading continuous performance: DiskSpd Read Loop, Queue Depth 8
Carte graphique
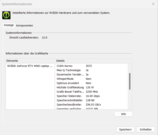
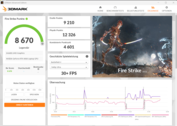
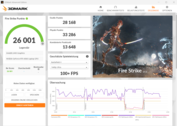
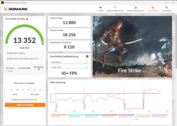
Le modèle de milieu de gamme GeForce RTX 4060 (3 072 shaders, bus 128 bits, 8 Go GDDR6, 120 watts) permet de jouer en FHD avec des paramètres élevés à maximum. Ses valeurs de référence et ses taux de rafraîchissement sont légèrement supérieurs à la moyenne de la RTX 4060 ("Balanced"). Le profil "Performance" a donné un léger avantage. Advanced Optimus n'est pas pris en charge. Cela signifie que le passage du dGPU à l'Optimus nécessite un redémarrage.
| 3DMark Performance rating - Percent | |
| Moyenne de la classe Gaming | |
| Lenovo Legion 5 16IRX G9 | |
| HP Victus 16 (2024) | |
| Dell G16, i7-13650HX, RTX 4060 | |
| Gigabyte G6X 9KG (2024) | |
| HP Victus 16 (2024) | |
| Moyenne NVIDIA GeForce RTX 4060 Laptop GPU | |
| Asus TUF Gaming A16 FA617XS | |
| 3DMark 11 - 1280x720 Performance GPU | |
| Moyenne de la classe Gaming (16033 - 80022, n=128, 2 dernières années) | |
| Lenovo Legion 5 16IRX G9 | |
| HP Victus 16 (2024) (Leistung) | |
| Dell G16, i7-13650HX, RTX 4060 | |
| Gigabyte G6X 9KG (2024) | |
| HP Victus 16 (2024) | |
| Moyenne NVIDIA GeForce RTX 4060 Laptop GPU (28136 - 38912, n=57) | |
| Asus TUF Gaming A16 FA617XS | |
| 3DMark | |
| 1920x1080 Fire Strike Graphics | |
| Moyenne de la classe Gaming (12242 - 62849, n=140, 2 dernières années) | |
| HP Victus 16 (2024) (Leistung) | |
| Lenovo Legion 5 16IRX G9 | |
| Gigabyte G6X 9KG (2024) | |
| Dell G16, i7-13650HX, RTX 4060 | |
| HP Victus 16 (2024) | |
| Asus TUF Gaming A16 FA617XS | |
| Moyenne NVIDIA GeForce RTX 4060 Laptop GPU (20533 - 29656, n=54) | |
| 2560x1440 Time Spy Graphics | |
| Moyenne de la classe Gaming (4310 - 25984, n=137, 2 dernières années) | |
| Lenovo Legion 5 16IRX G9 | |
| HP Victus 16 (2024) (Leistung) | |
| Dell G16, i7-13650HX, RTX 4060 | |
| Moyenne NVIDIA GeForce RTX 4060 Laptop GPU (7484 - 11451, n=56) | |
| HP Victus 16 (2024) | |
| Gigabyte G6X 9KG (2024) | |
| Asus TUF Gaming A16 FA617XS | |
| 3DMark 11 Performance | 30439 points | |
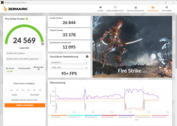
| 3DMark Fire Strike Score | 24569 points | |
| 3DMark Time Spy Score | 10542 points | |
Aide | ||
| Blender | |
| v3.3 Classroom OPTIX/RTX | |
| Dell G16, i7-13650HX, RTX 4060 (3.3.3) | |
| Lenovo Legion 5 16IRX G9 (3.3.3) | |
| Moyenne NVIDIA GeForce RTX 4060 Laptop GPU (19 - 28, n=53) | |
| HP Victus 16 (2024) (3.3.3) | |
| HP Victus 16 (2024) (3.3.3, Leistung) | |
| Gigabyte G6X 9KG (2024) (3.3.3) | |
| Moyenne de la classe Gaming (9 - 95, n=130, 2 dernières années) | |
| v3.3 Classroom CUDA | |
| Dell G16, i7-13650HX, RTX 4060 (3.3.3) | |
| Moyenne NVIDIA GeForce RTX 4060 Laptop GPU (39 - 53, n=53) | |
| Lenovo Legion 5 16IRX G9 (3.3.3) | |
| HP Victus 16 (2024) (3.3.3) | |
| HP Victus 16 (2024) (3.3.3, Leistung) | |
| Gigabyte G6X 9KG (2024) (3.3.3) | |
| Moyenne de la classe Gaming (15 - 228, n=135, 2 dernières années) | |
| v3.3 Classroom CPU | |
| Gigabyte G6X 9KG (2024) (3.3.3) | |
| HP Victus 16 (2024) (3.3.3) | |
| Moyenne NVIDIA GeForce RTX 4060 Laptop GPU (189 - 452, n=53) | |
| Asus TUF Gaming A16 FA617XS (3.3.3) | |
| Dell G16, i7-13650HX, RTX 4060 (3.3.3) | |
| Moyenne de la classe Gaming (122 - 962, n=130, 2 dernières années) | |
| Lenovo Legion 5 16IRX G9 (3.3.3) | |
| HP Victus 16 (2024) (3.3.3, Leistung) | |
| Geekbench 5.5 | |
| OpenCL Score | |
| Moyenne de la classe Gaming (45715 - 277970, n=130, 2 dernières années) | |
| HP Victus 16 (2024) (Leistung) | |
| Gigabyte G6X 9KG (2024) | |
| Dell G16, i7-13650HX, RTX 4060 | |
| HP Victus 16 (2024) | |
| Moyenne NVIDIA GeForce RTX 4060 Laptop GPU (5039 - 112238, n=53) | |
| Asus TUF Gaming A16 FA617XS | |
| Lenovo Legion 5 16IRX G9 | |
| Vulkan Score 5.5 | |
| Moyenne de la classe Gaming (9296 - 203514, n=106, 2 dernières années) | |
| HP Victus 16 (2024) (Leistung) | |
| Moyenne NVIDIA GeForce RTX 4060 Laptop GPU (46347 - 87612, n=30) | |
| HP Victus 16 (2024) | |
| Gigabyte G6X 9KG (2024) | |
| Asus TUF Gaming A16 FA617XS | |
| Geekbench 6.5 | |
| GPU OpenCL | |
| Moyenne de la classe Gaming (42333 - 253130, n=130, 2 dernières années) | |
| Gigabyte G6X 9KG (2024) (6.2.1) | |
| HP Victus 16 (2024) (6.2.1) | |
| Dell G16, i7-13650HX, RTX 4060 (6.2.1) | |
| Moyenne NVIDIA GeForce RTX 4060 Laptop GPU (76525 - 100831, n=39) | |
| HP Victus 16 (2024) (6.2.1, Leistung) | |
| GPU Vulkan | |
| Moyenne de la classe Gaming (7531 - 231659, n=96, 2 dernières années) | |
| Gigabyte G6X 9KG (2024) (6.2.1) | |
| HP Victus 16 (2024) (6.2.1, Leistung) | |
| HP Victus 16 (2024) (6.2.1) | |
| Moyenne NVIDIA GeForce RTX 4060 Laptop GPU (15985 - 101001, n=32) | |
| V-Ray 5 Benchmark | |
| GPU RTX | |
| Moyenne de la classe Gaming (556 - 4077, n=55, 2 dernières années) | |
| Gigabyte G6X 9KG (2024) (5.0.1) | |
| HP Victus 16 (2024) (5.0.1) | |
| HP Victus 16 (2024) (5.0.1, Leistung) | |
| Dell G16, i7-13650HX, RTX 4060 (5.0.1) | |
| Moyenne NVIDIA GeForce RTX 4060 Laptop GPU (1387 - 1817, n=28) | |
| GPU CUDA | |
| Moyenne de la classe Gaming (425 - 3288, n=56, 2 dernières années) | |
| Gigabyte G6X 9KG (2024) (5.0.1) | |
| HP Victus 16 (2024) (5.0.1) | |
| HP Victus 16 (2024) (5.0.1, Leistung) | |
| Moyenne NVIDIA GeForce RTX 4060 Laptop GPU (957 - 1294, n=29) | |
| Dell G16, i7-13650HX, RTX 4060 (5.0.1) | |
| Asus TUF Gaming A16 FA617XS (5.0.1) | |
| CPU | |
| HP Victus 16 (2024) (5.0.1) | |
| Moyenne de la classe Gaming (4081 - 30302, n=57, 2 dernières années) | |
| HP Victus 16 (2024) (5.0.1) | |
| Moyenne NVIDIA GeForce RTX 4060 Laptop GPU (8364 - 21065, n=28) | |
| Asus TUF Gaming A16 FA617XS (5.0.1) | |
| Gigabyte G6X 9KG (2024) (5.0.1) | |
| Dell G16, i7-13650HX, RTX 4060 (5.0.1) | |
| V-Ray Benchmark Next 4.10 | |
| GPU | |
| Moyenne de la classe Gaming (54 - 1333, n=124, 2 dernières années) | |
| Lenovo Legion 5 16IRX G9 (v4.10.07 ) | |
| Gigabyte G6X 9KG (2024) (v4.10.07 ) | |
| HP Victus 16 (2024) (v4.10.07, Leistung) | |
| Moyenne NVIDIA GeForce RTX 4060 Laptop GPU (483 - 715, n=46) | |
| HP Victus 16 (2024) (v4.10.07 ) | |
| Asus TUF Gaming A16 FA617XS (v4.10.07 ) | |
| CPU | |
| HP Victus 16 (2024) (v4.10.07, Leistung) | |
| Moyenne de la classe Gaming (6122 - 45327, n=124, 2 dernières années) | |
| Lenovo Legion 5 16IRX G9 (v4.10.07 ) | |
| HP Victus 16 (2024) (v4.10.07 ) | |
| Moyenne NVIDIA GeForce RTX 4060 Laptop GPU (12680 - 32360, n=46) | |
| Gigabyte G6X 9KG (2024) (v4.10.07 ) | |
| Asus TUF Gaming A16 FA617XS (v4.10.07 ) | |
* ... Moindre est la valeur, meilleures sont les performances
| Performance rating - Percent | |
| Moyenne de la classe Gaming | |
| Lenovo Legion 5 16IRX G9 | |
| HP Victus 16 (2024) | |
| Dell G16, i7-13650HX, RTX 4060 | |
| Gigabyte G6X 9KG (2024) | |
| HP Victus 16 (2024) | |
| Moyenne NVIDIA GeForce RTX 4060 Laptop GPU | |
| Asus TUF Gaming A16 FA617XS | |
| The Witcher 3 - 1920x1080 Ultra Graphics & Postprocessing (HBAO+) | |
| Moyenne de la classe Gaming (80.2 - 240, n=37, 2 dernières années) | |
| Dell G16, i7-13650HX, RTX 4060 | |
| HP Victus 16 (2024) | |
| Moyenne NVIDIA GeForce RTX 4060 Laptop GPU (77 - 159.7, n=42) | |
| Gigabyte G6X 9KG (2024) | |
| HP Victus 16 (2024) | |
| Asus TUF Gaming A16 FA617XS | |
| Lenovo Legion 5 16IRX G9 | |
| GTA V - 1920x1080 Highest AA:4xMSAA + FX AF:16x | |
| Moyenne de la classe Gaming (47.9 - 186.9, n=118, 2 dernières années) | |
| Lenovo Legion 5 16IRX G9 | |
| Dell G16, i7-13650HX, RTX 4060 | |
| HP Victus 16 (2024) | |
| Gigabyte G6X 9KG (2024) | |
| HP Victus 16 (2024) | |
| Moyenne NVIDIA GeForce RTX 4060 Laptop GPU (76.9 - 126.3, n=48) | |
| Asus TUF Gaming A16 FA617XS | |
| Final Fantasy XV Benchmark - 1920x1080 High Quality | |
| Moyenne de la classe Gaming (37.9 - 215, n=127, 2 dernières années) | |
| Lenovo Legion 5 16IRX G9 | |
| HP Victus 16 (2024) | |
| Dell G16, i7-13650HX, RTX 4060 | |
| Gigabyte G6X 9KG (2024) | |
| HP Victus 16 (2024) | |
| Moyenne NVIDIA GeForce RTX 4060 Laptop GPU (75.1 - 109.8, n=51) | |
| Asus TUF Gaming A16 FA617XS | |
| Strange Brigade - 1920x1080 ultra AA:ultra AF:16 | |
| Moyenne de la classe Gaming (76.3 - 456, n=117, 2 dernières années) | |
| Lenovo Legion 5 16IRX G9 | |
| Dell G16, i7-13650HX, RTX 4060 | |
| HP Victus 16 (2024) | |
| Gigabyte G6X 9KG (2024) | |
| Moyenne NVIDIA GeForce RTX 4060 Laptop GPU (135.3 - 210, n=50) | |
| HP Victus 16 (2024) | |
| Asus TUF Gaming A16 FA617XS | |
| Dota 2 Reborn - 1920x1080 ultra (3/3) best looking | |
| Lenovo Legion 5 16IRX G9 | |
| HP Victus 16 (2024) | |
| Moyenne de la classe Gaming (65.1 - 248, n=133, 2 dernières années) | |
| HP Victus 16 (2024) | |
| Dell G16, i7-13650HX, RTX 4060 | |
| Moyenne NVIDIA GeForce RTX 4060 Laptop GPU (115 - 183.8, n=53) | |
| Gigabyte G6X 9KG (2024) | |
| Asus TUF Gaming A16 FA617XS | |
| X-Plane 11.11 - 1920x1080 high (fps_test=3) | |
| Lenovo Legion 5 16IRX G9 | |
| HP Victus 16 (2024) | |
| Dell G16, i7-13650HX, RTX 4060 | |
| Gigabyte G6X 9KG (2024) | |
| Moyenne de la classe Gaming (33.4 - 150.2, n=136, 2 dernières années) | |
| Moyenne NVIDIA GeForce RTX 4060 Laptop GPU (60.7 - 141.1, n=54) | |
| HP Victus 16 (2024) | |
| Asus TUF Gaming A16 FA617XS | |
| Cyberpunk 2077 | |
| 1920x1080 Ultra Preset (FSR off) | |
| Moyenne de la classe Gaming (17.7 - 169.9, n=138, 2 dernières années) | |
| Lenovo Legion 5 16IRX G9 (2.02) | |
| HP Victus 16 (2024) (2.02, Leistung) | |
| Moyenne NVIDIA GeForce RTX 4060 Laptop GPU (56.4 - 93.1, n=31) | |
| Dell G16, i7-13650HX, RTX 4060 (2.11) | |
| Gigabyte G6X 9KG (2024) (2.02) | |
| HP Victus 16 (2024) (2.02) | |
| 2560x1440 Ultra Preset (FSR off) | |
| Moyenne de la classe Gaming (24.8 - 122.8, n=111, 2 dernières années) | |
| Lenovo Legion 5 16IRX G9 (2.02) | |
| Dell G16, i7-13650HX, RTX 4060 (2.11) | |
| Moyenne NVIDIA GeForce RTX 4060 Laptop GPU (32.9 - 51.8, n=19) | |
| 1920x1080 Ray Tracing Ultra Preset (DLSS off) | |
| Moyenne de la classe Gaming (11.9 - 84.9, n=62, 2 dernières années) | |
| HP Victus 16 (2024) (2.02, Leistung) | |
| Moyenne NVIDIA GeForce RTX 4060 Laptop GPU (23.6 - 37.4, n=21) | |
| Gigabyte G6X 9KG (2024) (2.02) | |
| HP Victus 16 (2024) (2.02) | |
| Dragon's Dogma 2 - 1920x1080 High Preset | |
| Moyenne de la classe Gaming (49.5 - 99.3, n=12, 2 dernières années) | |
| HP Victus 16 (2024) | |
| Moyenne NVIDIA GeForce RTX 4060 Laptop GPU (57.2 - 67.7, n=5) | |
| Razer Blade 14 Mid 23 | |
| Palworld - 1920x1080 Epic Preset AA:TSR | |
| Razer Blade 14 Mid 23 | |
| Moyenne NVIDIA GeForce RTX 4060 Laptop GPU (83.9 - 87.8, n=2) | |
| HP Victus 16 (2024) | |
| Moyenne de la classe Gaming (20.9 - 96.6, n=6, 2 dernières années) | |
| The Finals | |
| 1920x1080 Epic Preset | |
| Razer Blade 14 Mid 23 | |
| Moyenne NVIDIA GeForce RTX 4060 Laptop GPU (122.3 - 126, n=2) | |
| HP Victus 16 (2024) | |
| Moyenne de la classe Gaming (24.8 - 130.2, n=8, 2 dernières années) | |
| 1920x1080 Epic Preset + Epic RTX Global Illumination | |
| Razer Blade 14 Mid 23 | |
| Moyenne NVIDIA GeForce RTX 4060 Laptop GPU (116.8 - 121.1, n=2) | |
| HP Victus 16 (2024) | |
| Moyenne de la classe Gaming (51.1 - 116.8, n=4, 2 dernières années) | |
| EA Sports WRC - 1920x1080 Ultra Preset AA:Epic AF:16x | |
| HP Victus 16 (2024) | |
| Moyenne NVIDIA GeForce RTX 4060 Laptop GPU (78.4 - 79.6, n=2) | |
| Razer Blade 14 Mid 23 | |
| Moyenne de la classe Gaming (15.4 - 115.1, n=5, 2 dernières années) | |
| Enshrouded - 1920x1080 Max. Quality AA:FX | |
| HP Victus 16 (2024) | |
| Moyenne NVIDIA GeForce RTX 4060 Laptop GPU (43 - 51.1, n=2) | |
| Razer Blade 14 Mid 23 | |
| Moyenne de la classe Gaming (9.48 - 56.5, n=7, 2 dernières années) | |
Witcher 3 FPS diagram
| Bas | Moyen | Élevé | Ultra | |
|---|---|---|---|---|
| GTA V (2015) | 185.8 | 181.2 | 176.1 | 110.2 |
| The Witcher 3 (2015) | 448.6 | 297.7 | 181.9 | 99.9 |
| Dota 2 Reborn (2015) | 198.1 | 177.8 | 168.4 | 149.7 |
| Final Fantasy XV Benchmark (2018) | 208 | 135.3 | 98.1 | |
| X-Plane 11.11 (2018) | 154.4 | 129.2 | 100.3 | |
| Strange Brigade (2018) | 406 | 253 | 205 | 179 |
| Cyberpunk 2077 (2023) | 113.6 | 90 | 76.9 | 67.1 |
| EA Sports WRC (2023) | 129.3 | 93.7 | 85.2 | 79.6 |
| The Finals (2023) | 196.7 | 161.7 | 155.9 | 122.3 |
| Palworld (2024) | 139.2 | 116.3 | 91.8 | 83.9 |
| Enshrouded (2024) | 85.5 | 71.2 | 59.7 | 51.1 |
| Dragon's Dogma 2 (2024) | 67.1 | 63.3 |
Émissions et puissance - L'ordinateur portable de jeu à l'autonomie impressionnante
Émissions sonores
Les ventilateurs sont généralement maintenus aussi bas que possible et ne tournent plus vite que lorsqu'il n'y a pas d'autre option. Néanmoins, les émissions sonores de l'appareil atteignent jusqu'à 48 dB(A) à pleine charge ("Balanced"). en mode "Performance", les valeurs sont encore plus élevées. Le mode "Eco" permet d'obtenir une utilisation nettement plus silencieuse.
En mode inactif ou à faible charge, il est possible que les ventilateurs restent complètement immobiles. Pour cela, il faut désactiver l'option HP bios "fan always on" (qui est active par défaut). Sinon, elle garantit que les ventilateurs fonctionnent en permanence.
Degré de la nuisance sonore
| Au repos |
| 28 / 29 / 33 dB(A) |
| Fortement sollicité |
| 45 / 48 dB(A) |
 | ||
30 dB silencieux 40 dB(A) audible 50 dB(A) bruyant |
||
min: | ||
| HP Victus 16 (2024) GeForce RTX 4060 Laptop GPU, i7-14700HX, Kioxia XG8 KXG80ZNV512G | Gigabyte G6X 9KG (2024) GeForce RTX 4060 Laptop GPU, i7-13650HX, Gigabyte AG450E1024-SI | Dell G16, i7-13650HX, RTX 4060 GeForce RTX 4060 Laptop GPU, i7-13650HX, WD PC SN740 SDDPNQD-1T00 | Lenovo Legion 5 16IRX G9 GeForce RTX 4060 Laptop GPU, i7-14650HX, Samsung PM9A1 MZVL21T0HCLR | Asus TUF Gaming A16 FA617XS Radeon RX 7600S, R9 7940HS, Micron 2400 MTFDKBA512QFM | |
|---|---|---|---|---|---|
| Noise | -10% | 13% | -3% | 2% | |
| arrêt / environnement * (dB) | 25 | 26 -4% | 23 8% | 24 4% | 25 -0% |
| Idle Minimum * (dB) | 28 | 30 -7% | 23 18% | 24 14% | 25 11% |
| Idle Average * (dB) | 29 | 32 -10% | 23 21% | 28.8 1% | 26 10% |
| Idle Maximum * (dB) | 33 | 35 -6% | 27.96 15% | 32 3% | 28 15% |
| Load Average * (dB) | 45 | 51 -13% | 27.96 38% | 45.5 -1% | 43 4% |
| Witcher 3 ultra * (dB) | 43 | 51 -19% | 47.89 -11% | 53.1 -23% | 51 -19% |
| Load Maximum * (dB) | 48 | 54 -13% | 47.89 -0% | 55.7 -16% | 53 -10% |
* ... Moindre est la valeur, meilleures sont les performances
Température
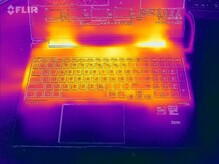
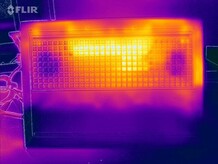
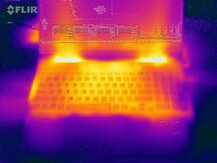
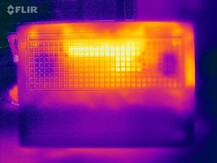
Les tests de stress et Witcher 3 provoquent un échauffement notable de l'ordinateur portable. Des températures de 50 °C ont été atteintes à certains moments des tests. En utilisation quotidienne (bureau, internet), les valeurs restent généralement dans le vert.
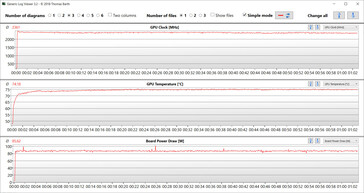
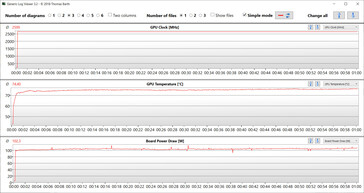
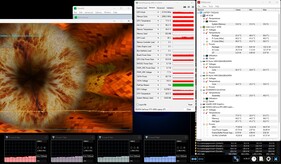
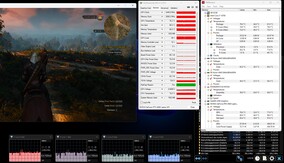
Le scénario du test de stress extrême (Prime95 et Furmark en fonctionnement continu) vérifie la stabilité du système à pleine charge. L'horloge du CPU a fluctué au début, puis s'est stabilisée à un faible niveau par la suite. Le GPU a fonctionné presque à pleine puissance.
(-) La température maximale du côté supérieur est de 50 °C / 122 F, par rapport à la moyenne de 40.4 °C / 105 F, allant de 21.2 à 68.8 °C pour la classe Gaming.
(-) Le fond chauffe jusqu'à un maximum de 50 °C / 122 F, contre une moyenne de 43.3 °C / 110 F
(+) En utilisation inactive, la température moyenne du côté supérieur est de 24.7 °C / 76 F, par rapport à la moyenne du dispositif de 33.9 °C / 93 F.
(-) En jouant à The Witcher 3, la température moyenne du côté supérieur est de 38.3 °C / 101 F, alors que la moyenne de l'appareil est de 33.9 °C / 93 F.
(+) Les repose-poignets et le pavé tactile sont plus froids que la température de la peau avec un maximum de 31 °C / 87.8 F et sont donc froids au toucher.
(-) La température moyenne de la zone de l'appui-paume de dispositifs similaires était de 28.8 °C / 83.8 F (-2.2 °C / #-4 F).
| HP Victus 16 (2024) Intel Core i7-14700HX, NVIDIA GeForce RTX 4060 Laptop GPU | Gigabyte G6X 9KG (2024) Intel Core i7-13650HX, NVIDIA GeForce RTX 4060 Laptop GPU | Dell G16, i7-13650HX, RTX 4060 Intel Core i7-13650HX, NVIDIA GeForce RTX 4060 Laptop GPU | Lenovo Legion 5 16IRX G9 Intel Core i7-14650HX, NVIDIA GeForce RTX 4060 Laptop GPU | Asus TUF Gaming A16 FA617XS AMD Ryzen 9 7940HS, AMD Radeon RX 7600S | |
|---|---|---|---|---|---|
| Heat | -10% | -22% | -7% | -9% | |
| Maximum Upper Side * (°C) | 50 | 41 18% | 49 2% | 40.4 19% | 53 -6% |
| Maximum Bottom * (°C) | 50 | 43 14% | 58 -16% | 43.8 12% | 48 4% |
| Idle Upper Side * (°C) | 25 | 32 -28% | 35 -40% | 30.3 -21% | 30 -20% |
| Idle Bottom * (°C) | 26 | 37 -42% | 35 -35% | 35.3 -36% | 30 -15% |
* ... Moindre est la valeur, meilleures sont les performances
Intervenants
Les haut-parleurs stéréo de l'ordinateur portable produisent un son décent dans l'ensemble, même s'ils mériteraient d'avoir plus de basses.
HP Victus 16 (2024) analyse audio
(+) | les haut-parleurs peuvent jouer relativement fort (82# dB)
Basses 100 - 315 Hz
(-) | presque aucune basse - en moyenne 20.3% plus bas que la médiane
(±) | la linéarité des basses est moyenne (13.3% delta à la fréquence précédente)
Médiums 400 - 2000 Hz
(+) | médiane équilibrée - seulement 1.6% de la médiane
(+) | les médiums sont linéaires (3.3% delta à la fréquence précédente)
Aiguës 2 - 16 kHz
(+) | des sommets équilibrés - à seulement 3.1% de la médiane
(+) | les aigus sont linéaires (4.7% delta à la fréquence précédente)
Globalement 100 - 16 000 Hz
(+) | le son global est linéaire (14% différence à la médiane)
Par rapport à la même classe
» 22% de tous les appareils testés de cette catégorie étaient meilleurs, 7% similaires, 70% pires
» Le meilleur avait un delta de 6%, la moyenne était de 18%, le pire était de 132%.
Par rapport à tous les appareils testés
» 16% de tous les appareils testés étaient meilleurs, 4% similaires, 80% pires
» Le meilleur avait un delta de 4%, la moyenne était de 24%, le pire était de 134%.
Gigabyte G6X 9KG (2024) analyse audio
(+) | les haut-parleurs peuvent jouer relativement fort (82# dB)
Basses 100 - 315 Hz
(-) | presque aucune basse - en moyenne 24.9% plus bas que la médiane
(±) | la linéarité des basses est moyenne (13.7% delta à la fréquence précédente)
Médiums 400 - 2000 Hz
(+) | médiane équilibrée - seulement 4.1% de la médiane
(+) | les médiums sont linéaires (5.4% delta à la fréquence précédente)
Aiguës 2 - 16 kHz
(+) | des sommets équilibrés - à seulement 2.2% de la médiane
(±) | la linéarité des aigus est moyenne (7.4% delta à la fréquence précédente)
Globalement 100 - 16 000 Hz
(±) | la linéarité du son global est moyenne (17.2% de différence avec la médiane)
Par rapport à la même classe
» 46% de tous les appareils testés de cette catégorie étaient meilleurs, 11% similaires, 42% pires
» Le meilleur avait un delta de 6%, la moyenne était de 18%, le pire était de 132%.
Par rapport à tous les appareils testés
» 31% de tous les appareils testés étaient meilleurs, 8% similaires, 61% pires
» Le meilleur avait un delta de 4%, la moyenne était de 24%, le pire était de 134%.
Consommation électrique
Sa consommation d'énergie est tout à fait normale pour le matériel installé. Alors que le Witcher 3 le test s'est déroulé avec une consommation constante, mais la demande de l'ordinateur portable a fluctué au début du test de stress. Le bloc d'alimentation (230 watts) est suffisamment puissant.
| Éteint/en veille | |
| Au repos | |
| Fortement sollicité |
|
Légende:
min: | |
Power consumption Witcher 3 / stress test
Power consumption with external monitor
Délais d'exécution
L'appareil de 16,1 pouces a atteint une durée d'utilisation de 8:31 heures lors de notre test pratique WLAN (illustrant la charge lors de l'accès à des sites web à l'aide d'un script) - une très bonne valeur. Dans le domaine de la comparaison, seul l Asus TUF Gaming A16 a fait mieux.
Points positifs
Points négatifs
Verdict - Un solide ordinateur portable de jeu de milieu de gamme
Le Victus permet de jouer en FHD avec des paramètres élevés à maximum. La puissance nécessaire est fournie par le Core i7-14700HX et la GeForce RTX 4060. Dommage : Les performances du processeur à cœur unique sont légèrement inférieures à ce qu'il serait possible d'obtenir. Comme c'est le cas dans cette catégorie, les émissions peuvent être ramenées à des valeurs modérées en renonçant à certaines performances. Un point positif : En dessous de la charge maximale, les émissions sonores de l'ordinateur portable sont acceptables.
L'avidité du stockage chez HP : Un ordinateur portable de jeu à 1 600 dollars doit offrir plus d'espace de stockage.
HP n'a pas pris le train du 16:10 - au lieu de cela, il est resté fidèle au rapport d'aspect 16:9 : L'écran de 16,1 pouces (FHD, 144 Hz) est parfait, mais si l'on tient compte du prix de l'appareil, qui est d'environ 1 600 dollars, il devrait vraiment offrir une meilleure couverture de l'espace colorimétrique. Son espace de stockage de 512 Go n'est pas énorme pour un ordinateur portable de jeu. On s'attendrait à plus pour le prix dans ce domaine aussi.
HP n'a pas doté cet ordinateur portable de connexions modernes telles que Thunderbolt 4/USB 4, mais n'a pas pour autant oublié des fonctions utiles telles que Power Delivery - la batterie peut être rechargée via une alimentation USB-C (100 watts). Positif : La batterie entièrement chargée est suffisante pour une autonomie en WiFi d'environ 8,5 heures - une valeur que beaucoup d'autres ordinateurs portables de jeu ne peuvent que rêver d'atteindre.
Une alternative viable pourrait être le Gigabyte G6X 9KG (2024). Cet ordinateur portable offre une puissance de calcul comparable et des durées d'utilisation similaires, mais au lieu d'un écran 16:9, il dispose d'un écran 16:10.
Prix et disponibilité
Le HP Victus 16 (2024) peut actuellement être acheté sur Amazon pour environ US$1,333. Il s'agit de la variante avec le Core i7-13700HX, NVIDIA GeForce RTX 4060, 64 Go de RAM DDR5 et un SSD de 2 To.
Vous pouvez également configurer une variante personnalisée sur le site web de HP.
HP Victus 16 (2024)
- 05/14/2024 v7 (old)
Sascha Mölck
Transparency
La sélection des appareils à examiner est effectuée par notre équipe éditoriale. L'échantillon de test a été prêté à l'auteur par le fabricant ou le détaillant pour les besoins de cet examen. Le prêteur n'a pas eu d'influence sur cette évaluation et le fabricant n'a pas reçu de copie de cette évaluation avant sa publication. Il n'y avait aucune obligation de publier cet article. En tant que média indépendant, Notebookcheck n'est pas soumis à l'autorité des fabricants, des détaillants ou des éditeurs.
Voici comment Notebookcheck teste
Chaque année, Notebookcheck examine de manière indépendante des centaines d'ordinateurs portables et de smartphones en utilisant des procédures standardisées afin de garantir que tous les résultats sont comparables. Nous avons continuellement développé nos méthodes de test depuis environ 20 ans et avons établi des normes industrielles dans le processus. Dans nos laboratoires de test, des équipements de mesure de haute qualité sont utilisés par des techniciens et des rédacteurs expérimentés. Ces tests impliquent un processus de validation en plusieurs étapes. Notre système d'évaluation complexe repose sur des centaines de mesures et de points de référence bien fondés, ce qui garantit l'objectivité.

