Test du Dell G16 (2024) : une alternative Alienware abordable du même fabricant ?
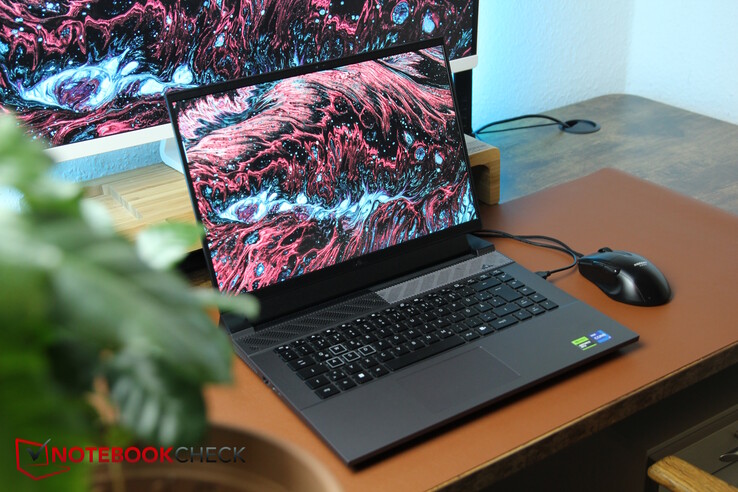
Fin 2022, nous avons examiné pour la dernière fois (et, par coïncidence, pour la première fois) le modèle 16 pouces de la relativement nouvelle série G, les ordinateurs portables Dell pour le jeu de milieu de gamme. À l'époque, le Dell G16 était équipé d'un processeur Intel Gen-12 et d'une carte graphique RTX 3060. Avec le modèle 2024, le fabricant passe à l'Intel Gen 13 et à la RTX 4060 (d'autres options de GPU sont disponibles). L'écran a reçu une variante légèrement plus puissante en option.
Nous verrons également si Dell a réussi à affiner le boîtier relativement épais de l'ordinateur portable. En outre, le G16 doit bien sûr rivaliser avec d'autres ordinateurs de jeu de milieu et de budget, tels que le MSI Raider GE68 HX 13VFle Lenovo Legion Slim 5 16APH8 et le Lenovo LOQ 16-Plus, nous le comparerons naturellement à son prédécesseur ainsi qu'au modèle un peu plus onéreux Alienware m16 R1.
Comparaison avec les concurrents potentiels
Note | Date | Modèle | Poids | Épaisseur | Taille | Résolution | Prix |
|---|---|---|---|---|---|---|---|
| 85.5 % v7 (old) | 02/24 | Dell G16, i7-13650HX, RTX 4060 i7-13650HX, GeForce RTX 4060 Laptop GPU | 2.8 kg | 25.65 mm | 16.00" | 2560x1600 | |
| 86.1 % v7 (old) | 10/22 | Dell G16 7620 i7-12700H, GeForce RTX 3060 Laptop GPU | 2.6 kg | 26.9 mm | 16.00" | 2560x1600 | |
| 86.9 % v7 (old) | 10/23 | MSI Raider GE68HX 13VF i9-13950HX, GeForce RTX 4060 Laptop GPU | 2.7 kg | 27.9 mm | 16.00" | 1900x1200 | |
| 87.7 % v7 (old) | 08/23 | Lenovo Legion Slim 5 16APH8 R7 7840HS, GeForce RTX 4060 Laptop GPU | 2.4 kg | 25.2 mm | 16.00" | 2560x1600 | |
| 88.3 % v7 (old) | 09/23 | Alienware m16 R1 Intel i7-13700HX, GeForce RTX 4060 Laptop GPU | 3 kg | 25.4 mm | 16.00" | 2560x1600 | |
| 87.3 % v7 (old) | 09/23 | Lenovo LOQ 16IRH8 i7-13620H, GeForce RTX 4060 Laptop GPU | 2.7 kg | 25.9 mm | 16.00" | 2560x1600 |
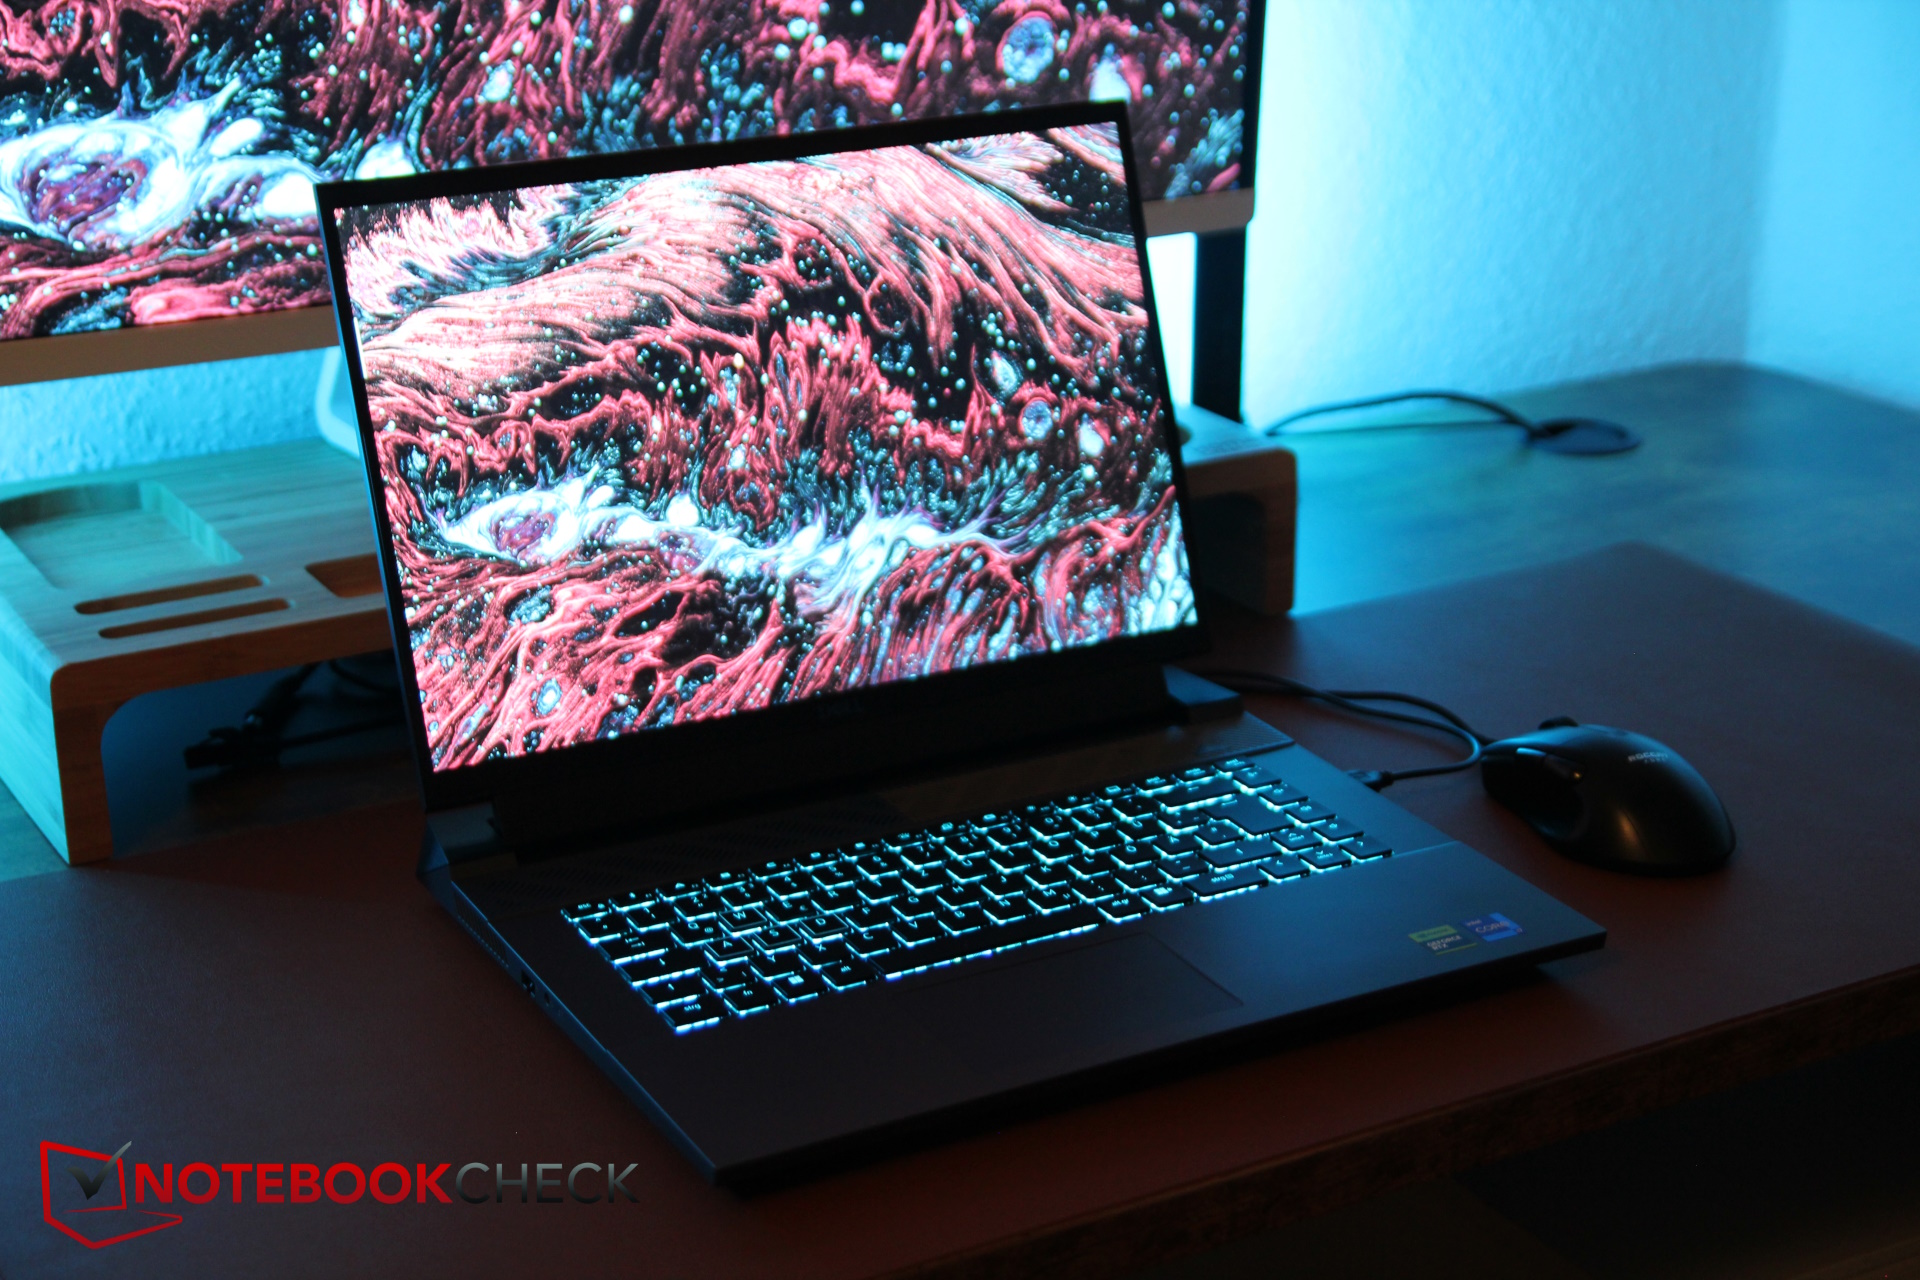
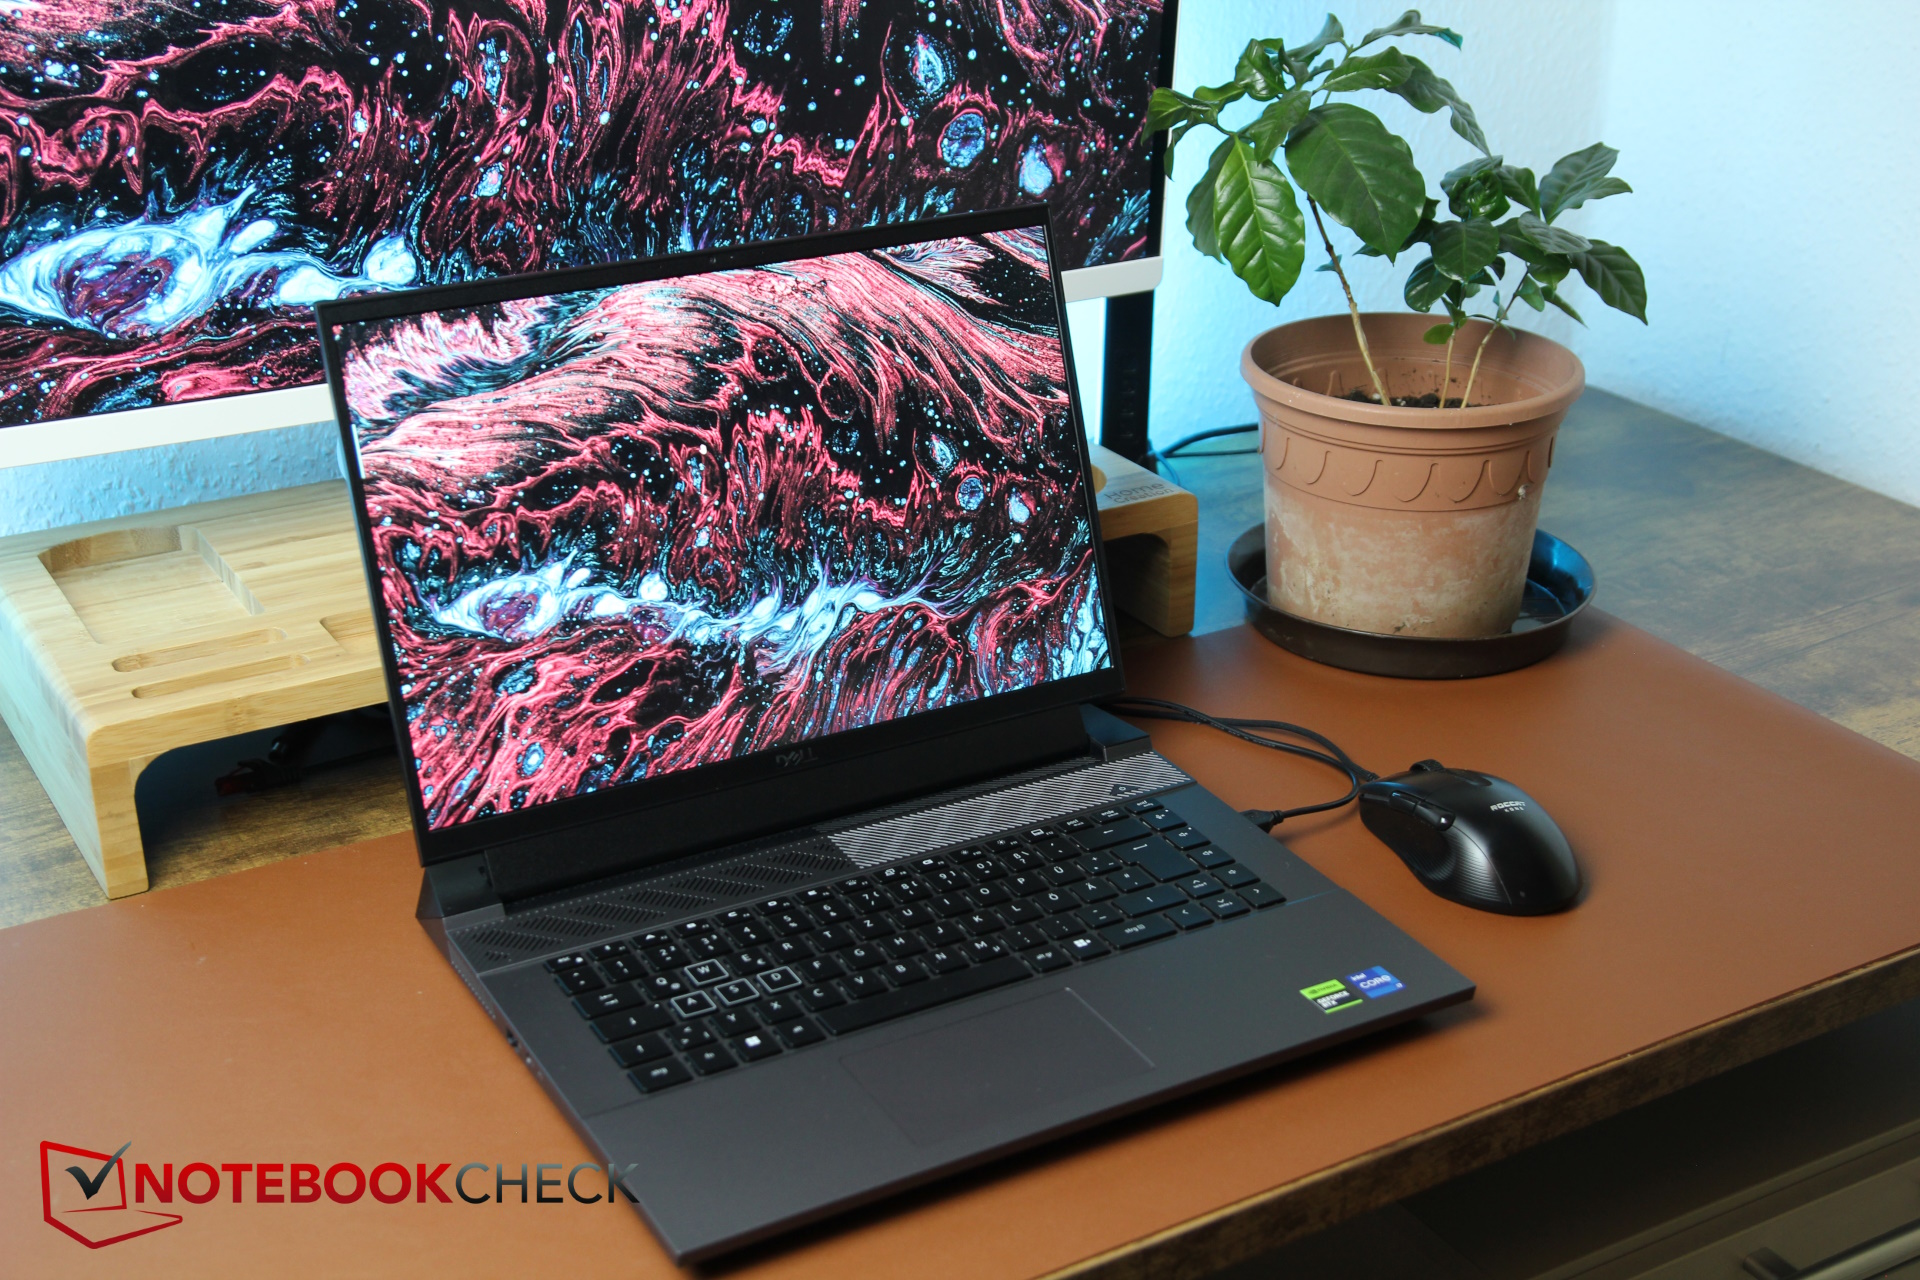
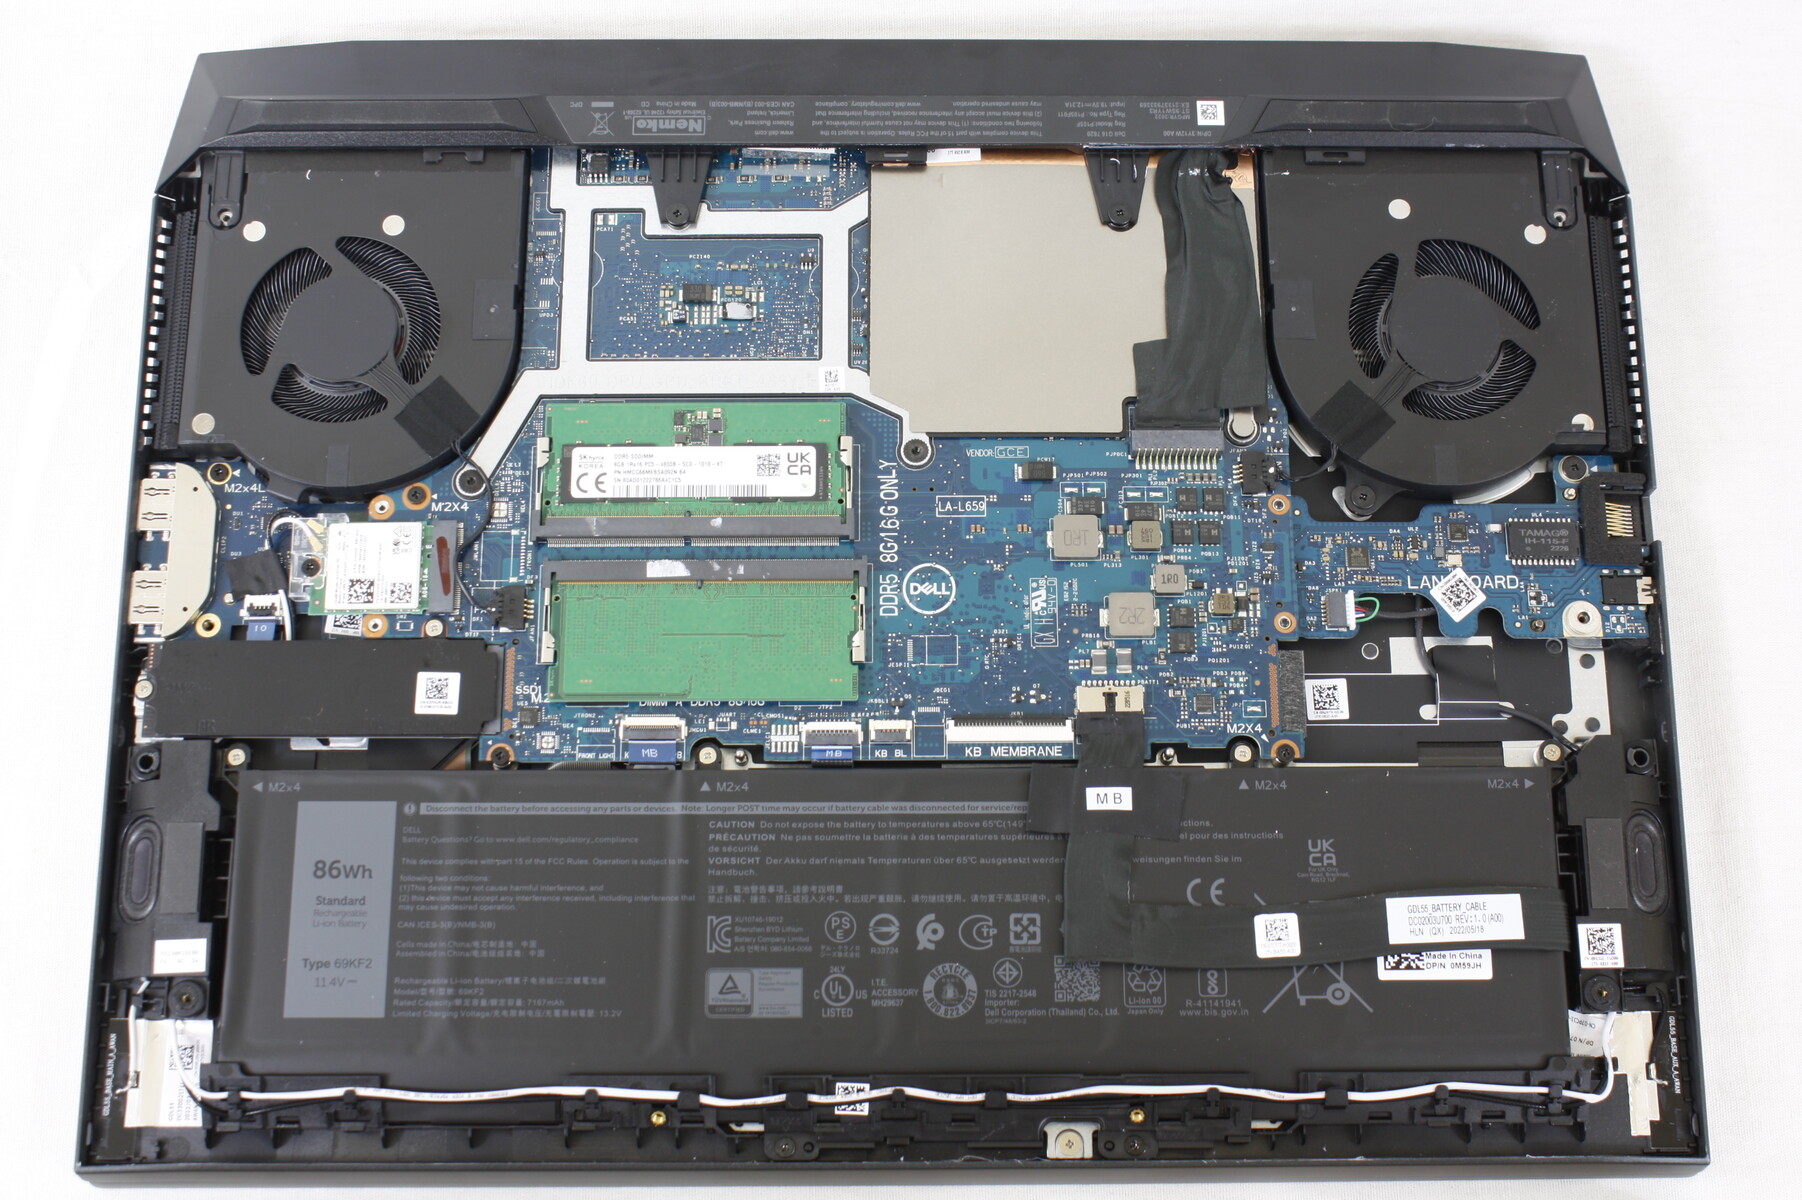
Boîtier - Couvercle en aluminium et le reste en plastique gris
Le boîtier de l'ordinateur portable, qui diffère de celui de son prédécesseur, est principalement constitué de plastique gris - seul le couvercle utilise de l'aluminium, ce qui lui confère une bonne stabilité. L'unité de base est également stable et peut à peine être tordue. La longue charnière maintient bien l'écran en place, mais nous avons noté de légers bruits de frottement et des grincements lors de l'ouverture et de la fermeture de la charnière. Espérons que cela n'affectera pas la longévité de l'appareil. La construction est décente, mais elle ne donne pas l'impression d'être d'aussi bonne qualité que les modèles Dell et Alienware plus onéreux.
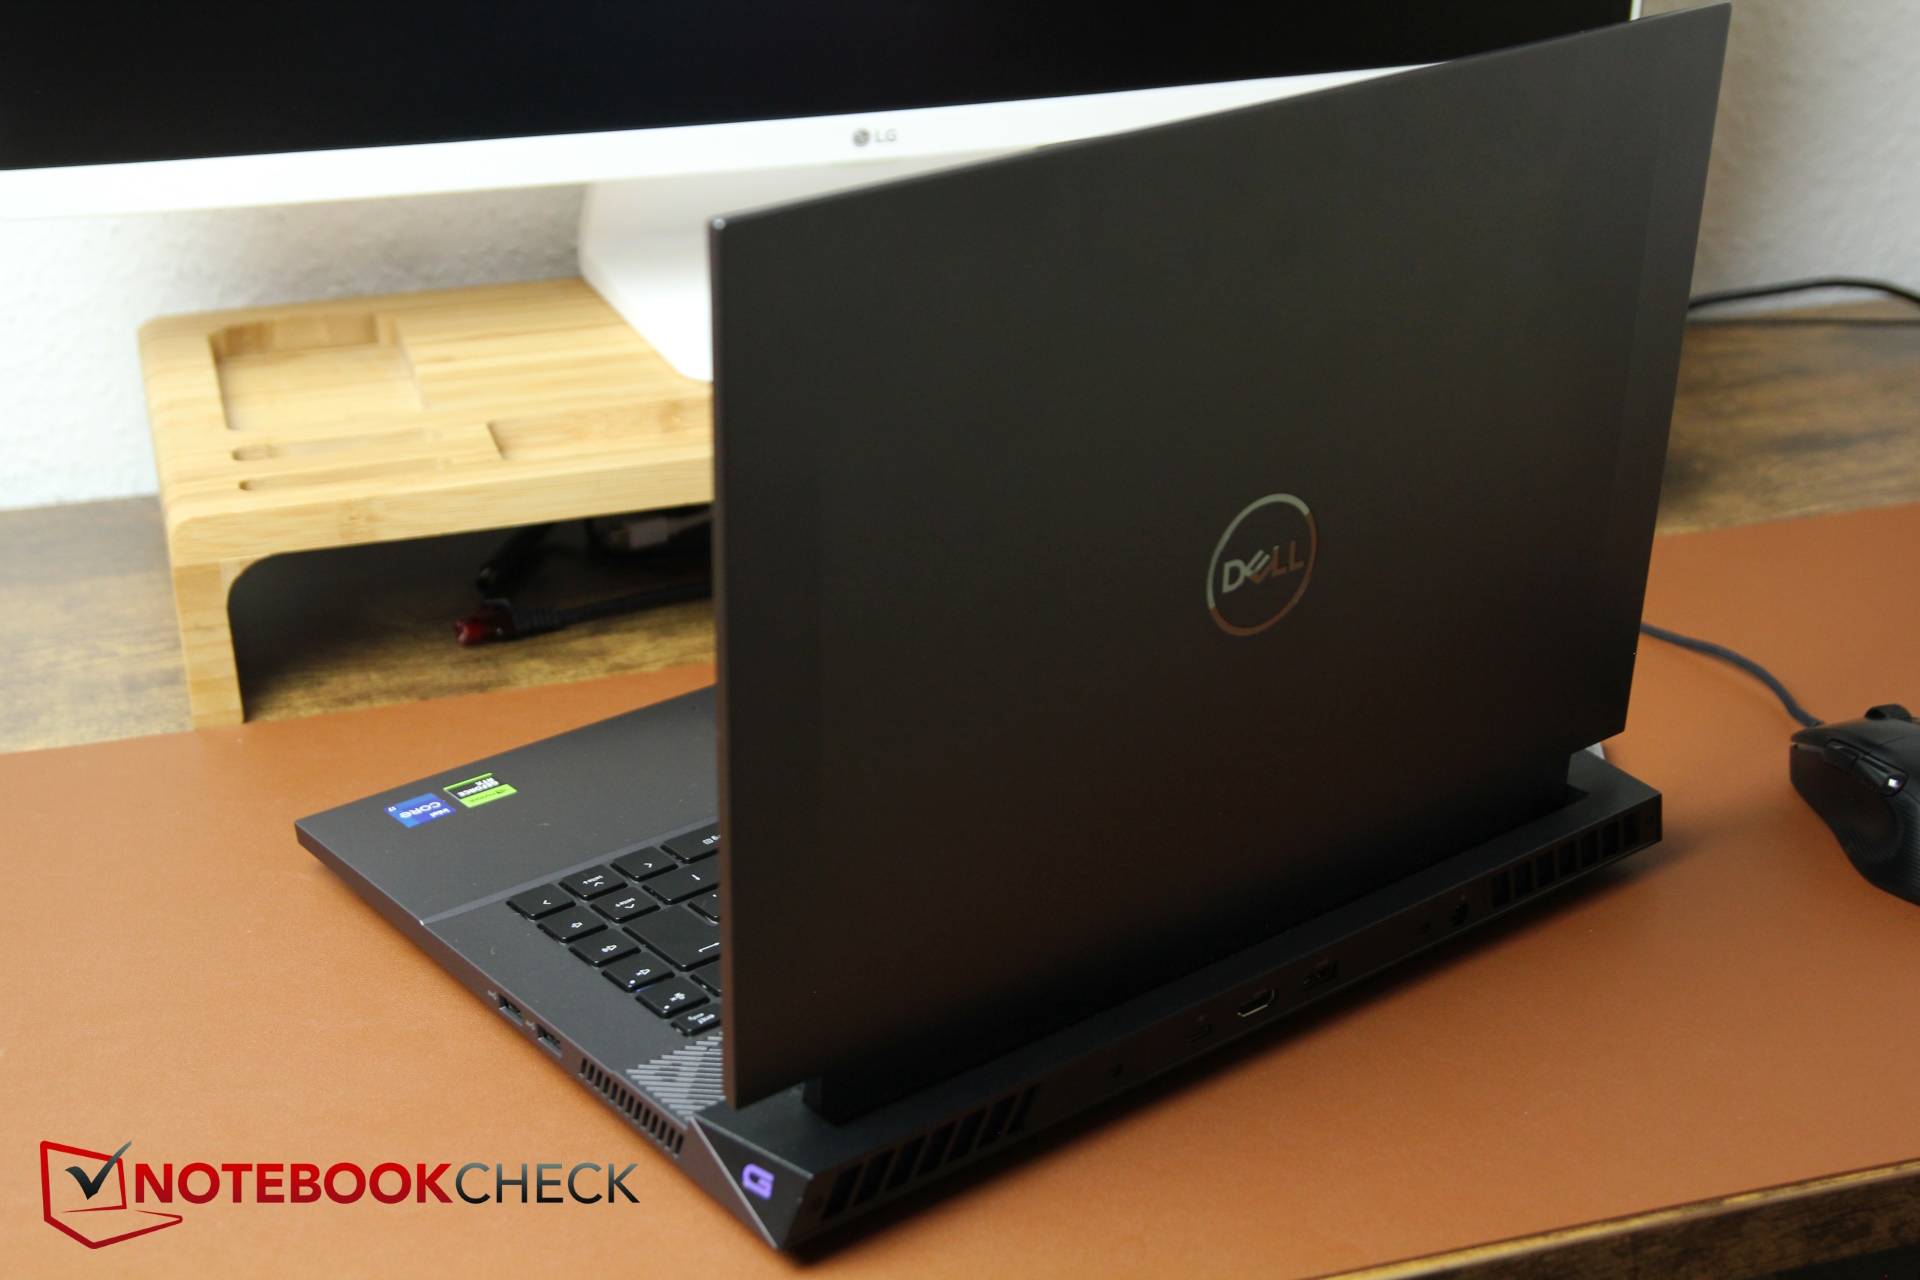
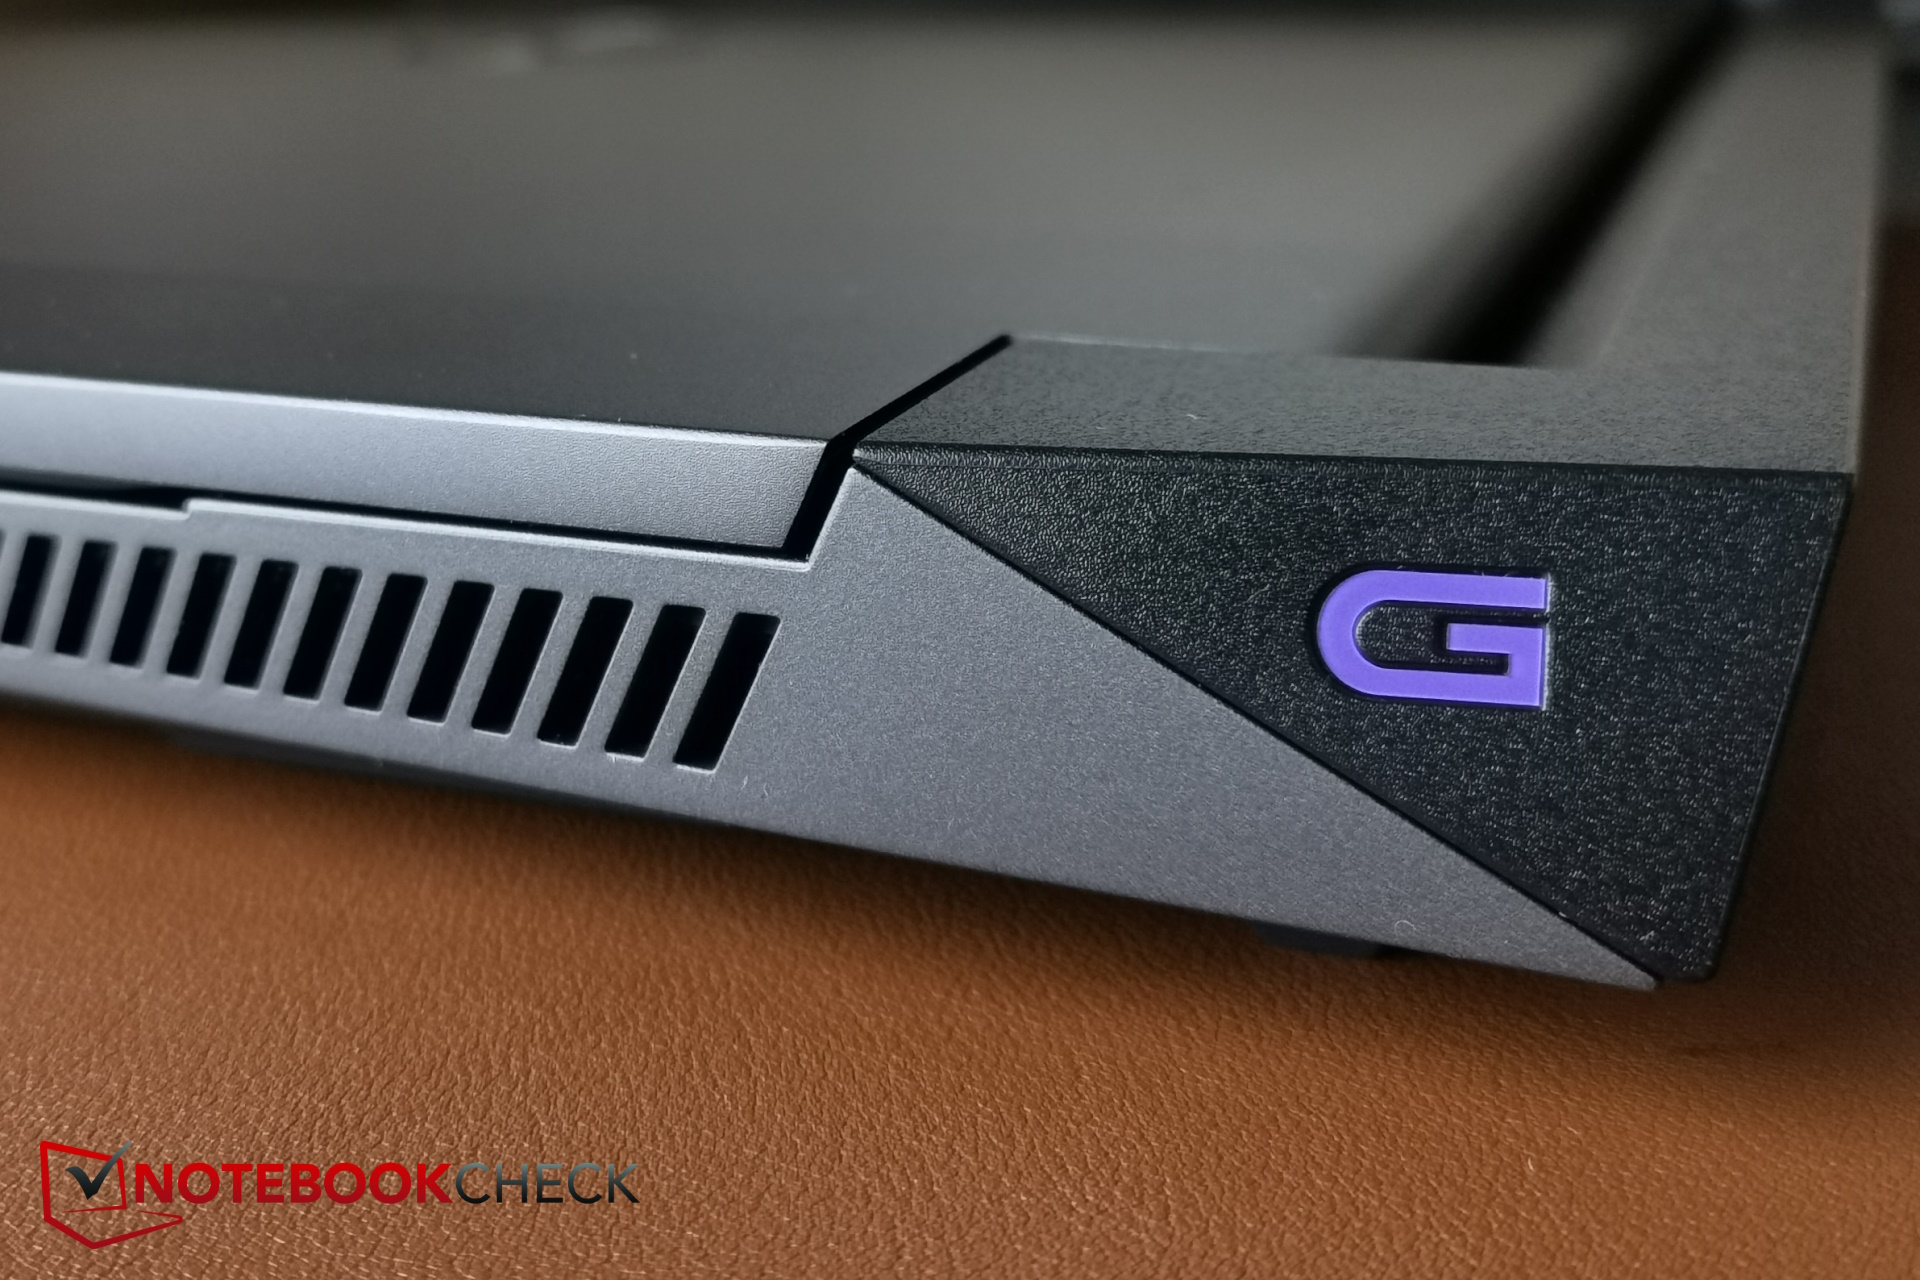
Le logo Dell se détache sur le dessus de l'ordinateur portable et à part cela, il n'y a pas d'autres accents de couleur. Le G16 n'est pas non plus très élégant, notamment à cause de l'unité de refroidissement qui dépasse à l'arrière. Dans l'ensemble, le G16 n'est pas très élégant, mais plutôt lourd et encombrant.
Le plus cher Alienware m16 R1 est en fait un peu plus large que notre G16 et d'une épaisseur similaire. Le MSI Raider GE68HX est encore un peu plus épais, alors que le reste de leurs dimensions est presque identique. Même le Lenovo Legion Slim 5 n'est pas beaucoup plus mince, bien que le G16 semble assez épais, mais le premier est légèrement plus petit.
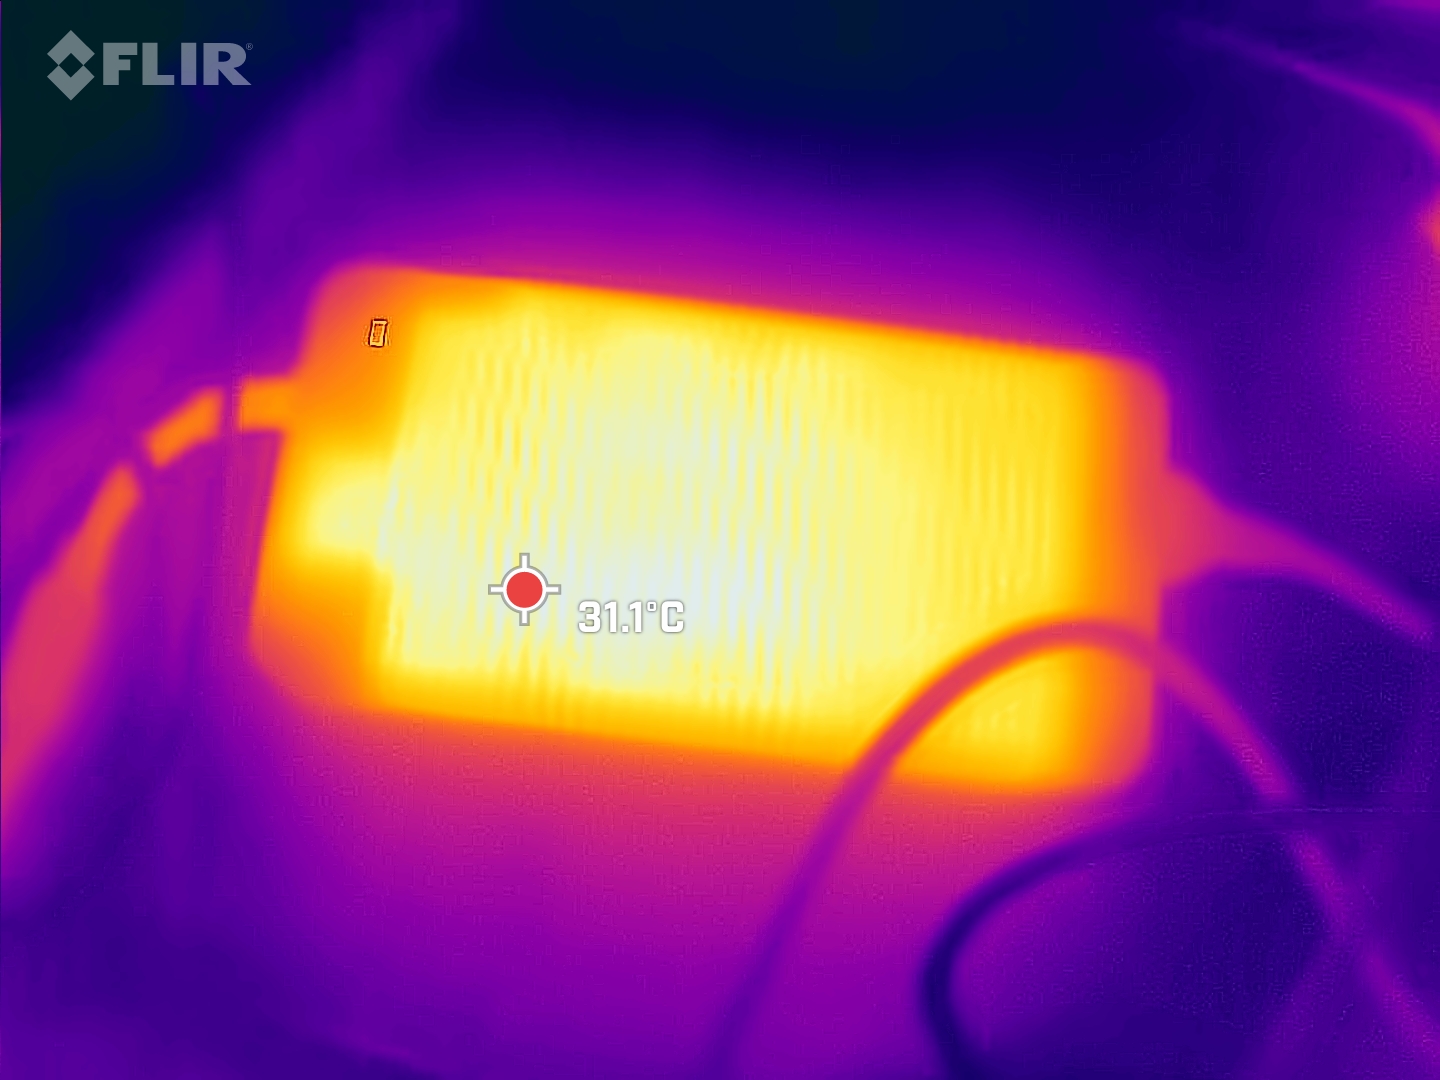
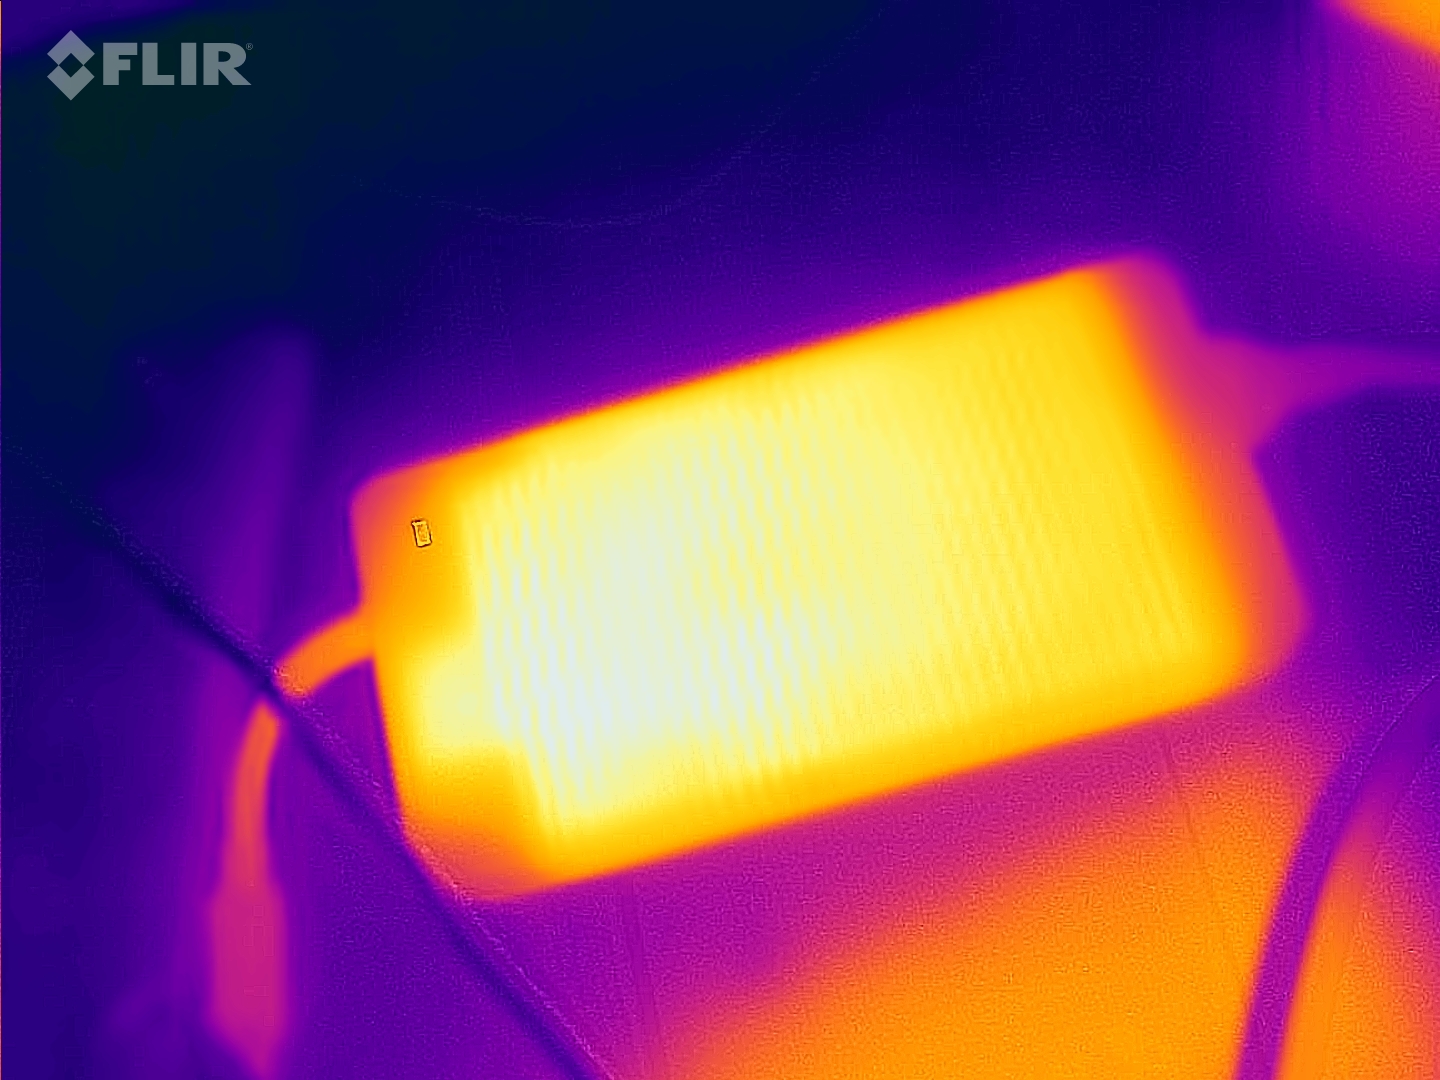
Par rapport à son prédécesseur, ce modèle est en fait légèrement plus mince, mais il est aussi plus profond. Il est également plus lourd (+ 200 g), ce qui fait du G16 le deuxième gamer 16 pouces le plus lourd équipé d'une RTX 4060, après l'Alienware du même fabricant. En outre, Dell livre même la version avec une RTX 4060 avec un énorme et lourd bloc d'alimentation de 330 watts - qui pèse à lui seul plus de 1,5 kg.
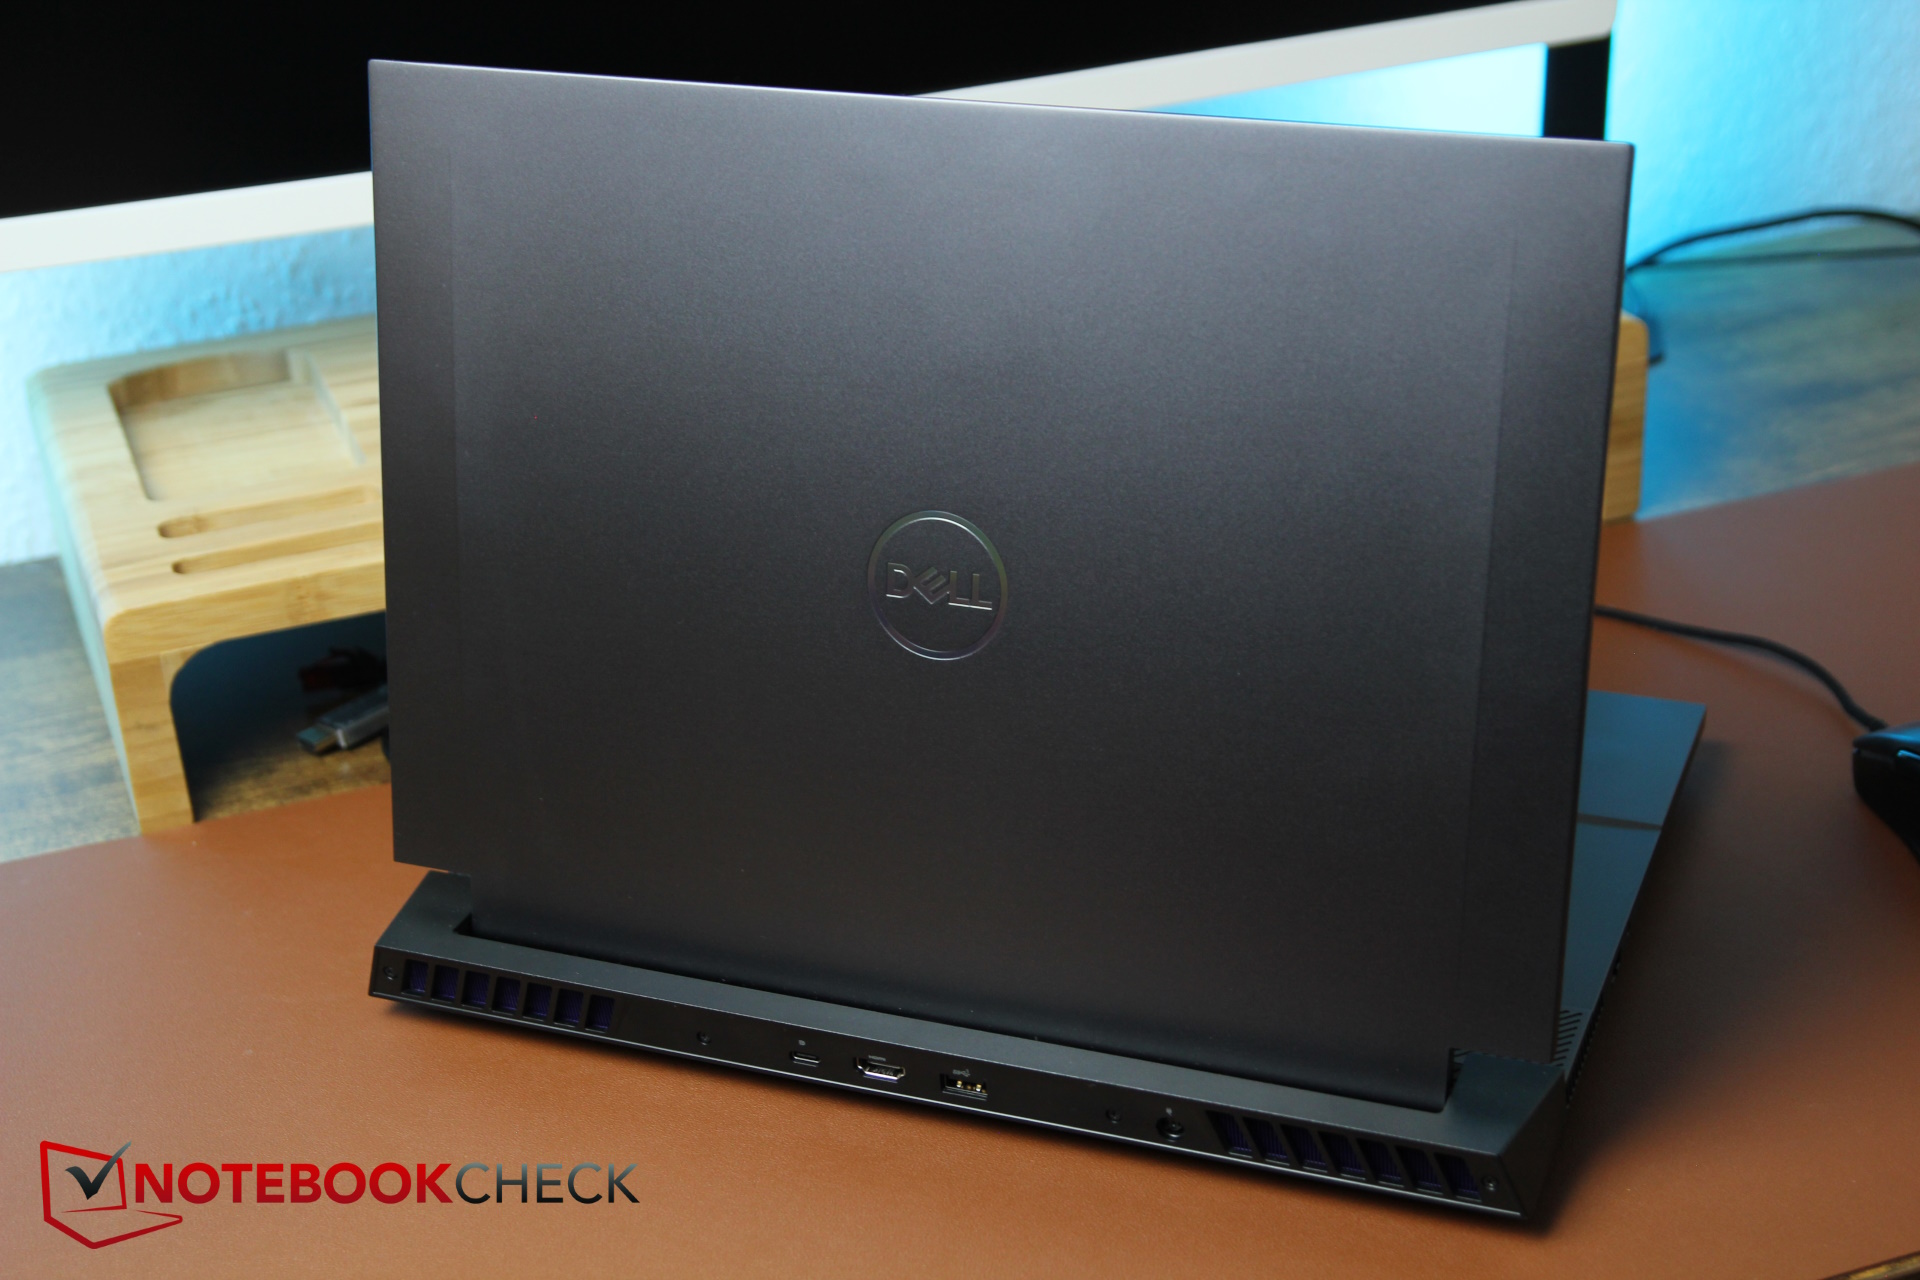
Connectivité - Thunderbolt n'est pas disponible sur tous les modèles G16
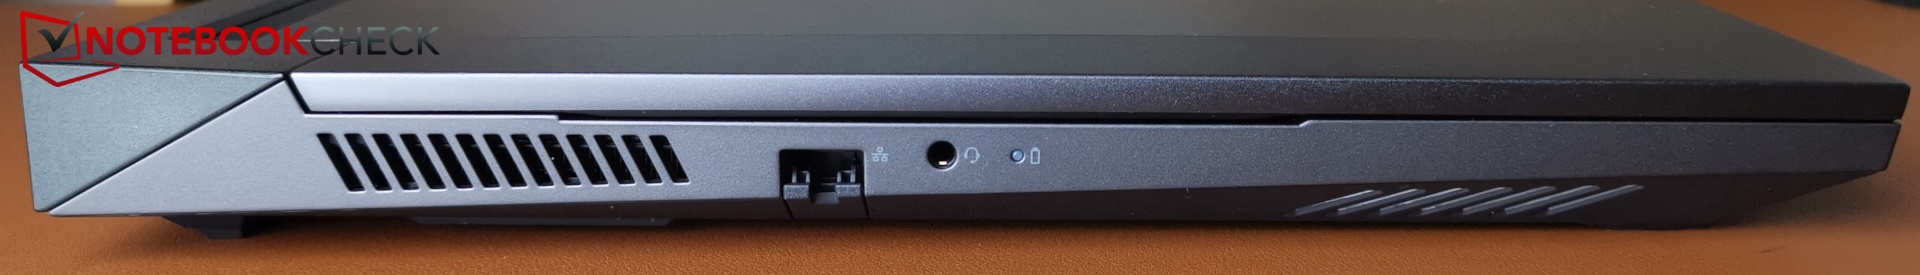
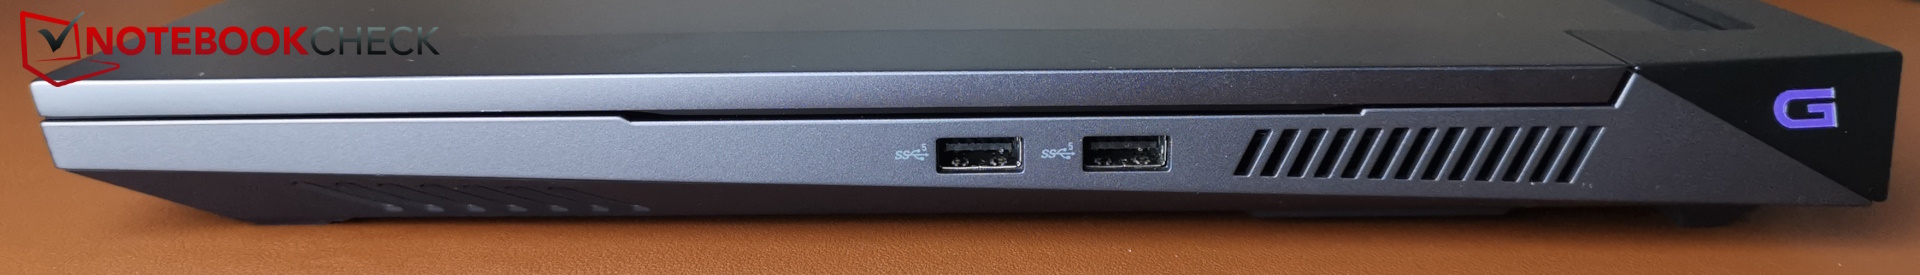
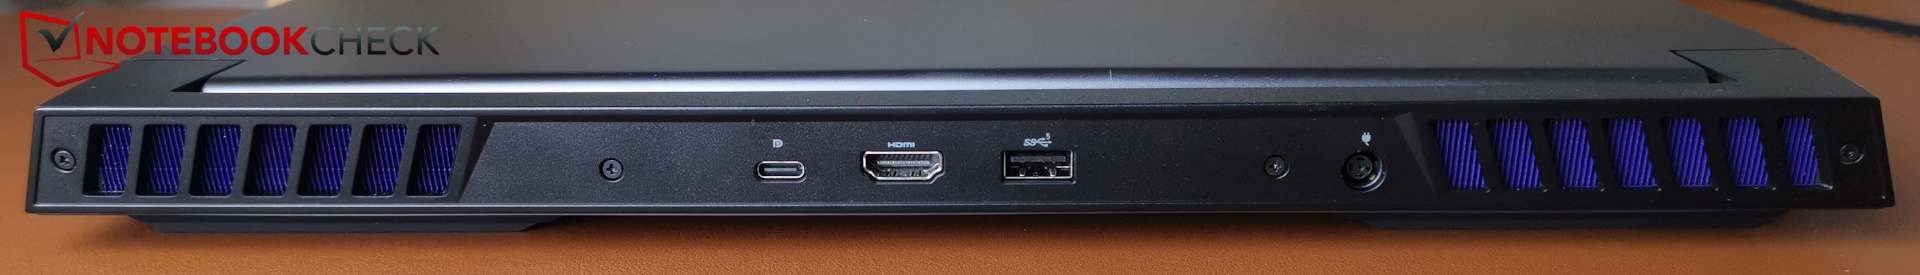
La disposition des ports de l'ordinateur portable est restée la même, à une exception près : À l'arrière, les connexions ont été légèrement déplacées. Alors que le port HDMI disposait de beaucoup d'espace sur le modèle précédent, il se trouve désormais juste entre le port USB-A et le port USB-C. Le premier pourrait entraîner des problèmes d'espace lorsqu'il est utilisé avec des prises de plus grande taille. Cette décision de Dell est plutôt discutable.
Attention : La prise d'alimentation n'est pas très stable et lorsqu'on déplace l'ordinateur portable, elle glisse facilement. Le bloc d'alimentation lourd contribue également à ce problème.
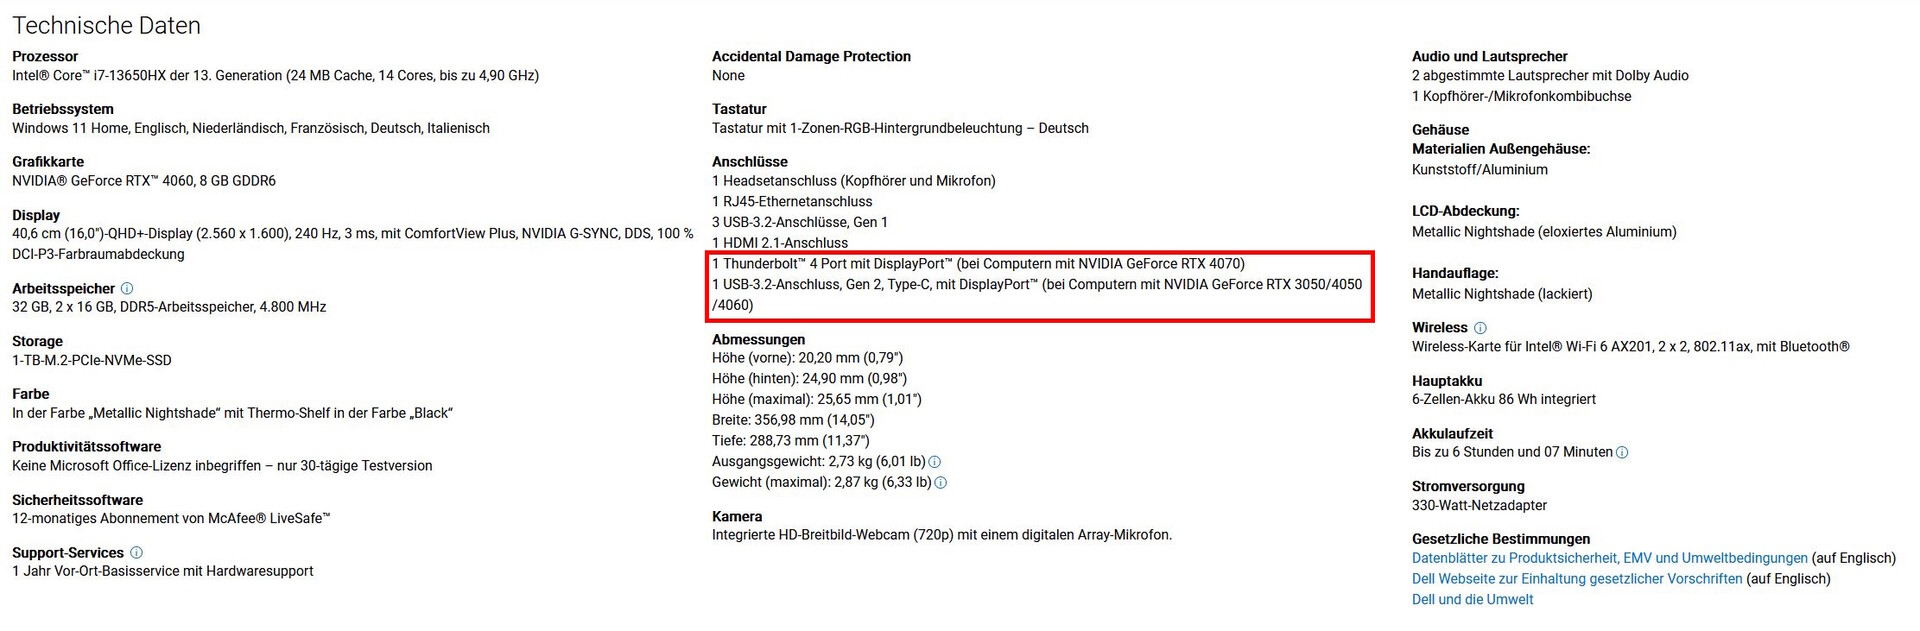
La prise en charge du Thunderbolt (4), qui était incluse dans son prédécesseur, est tout aussi discutable. Aujourd'hui, elle dépend apparemment de la carte graphique installée. Selon Dell, Thunderbolt n'est pas pris en charge sur les modèles utilisant jusqu'à une RTX 4060, alors qu'une RTX 4070 ou plus la prend en charge. C'est inhabituel et frustrant pour les clients qui achètent des configurations plus petites. Le port ne prend pas en charge PowerDelivery.
Communication
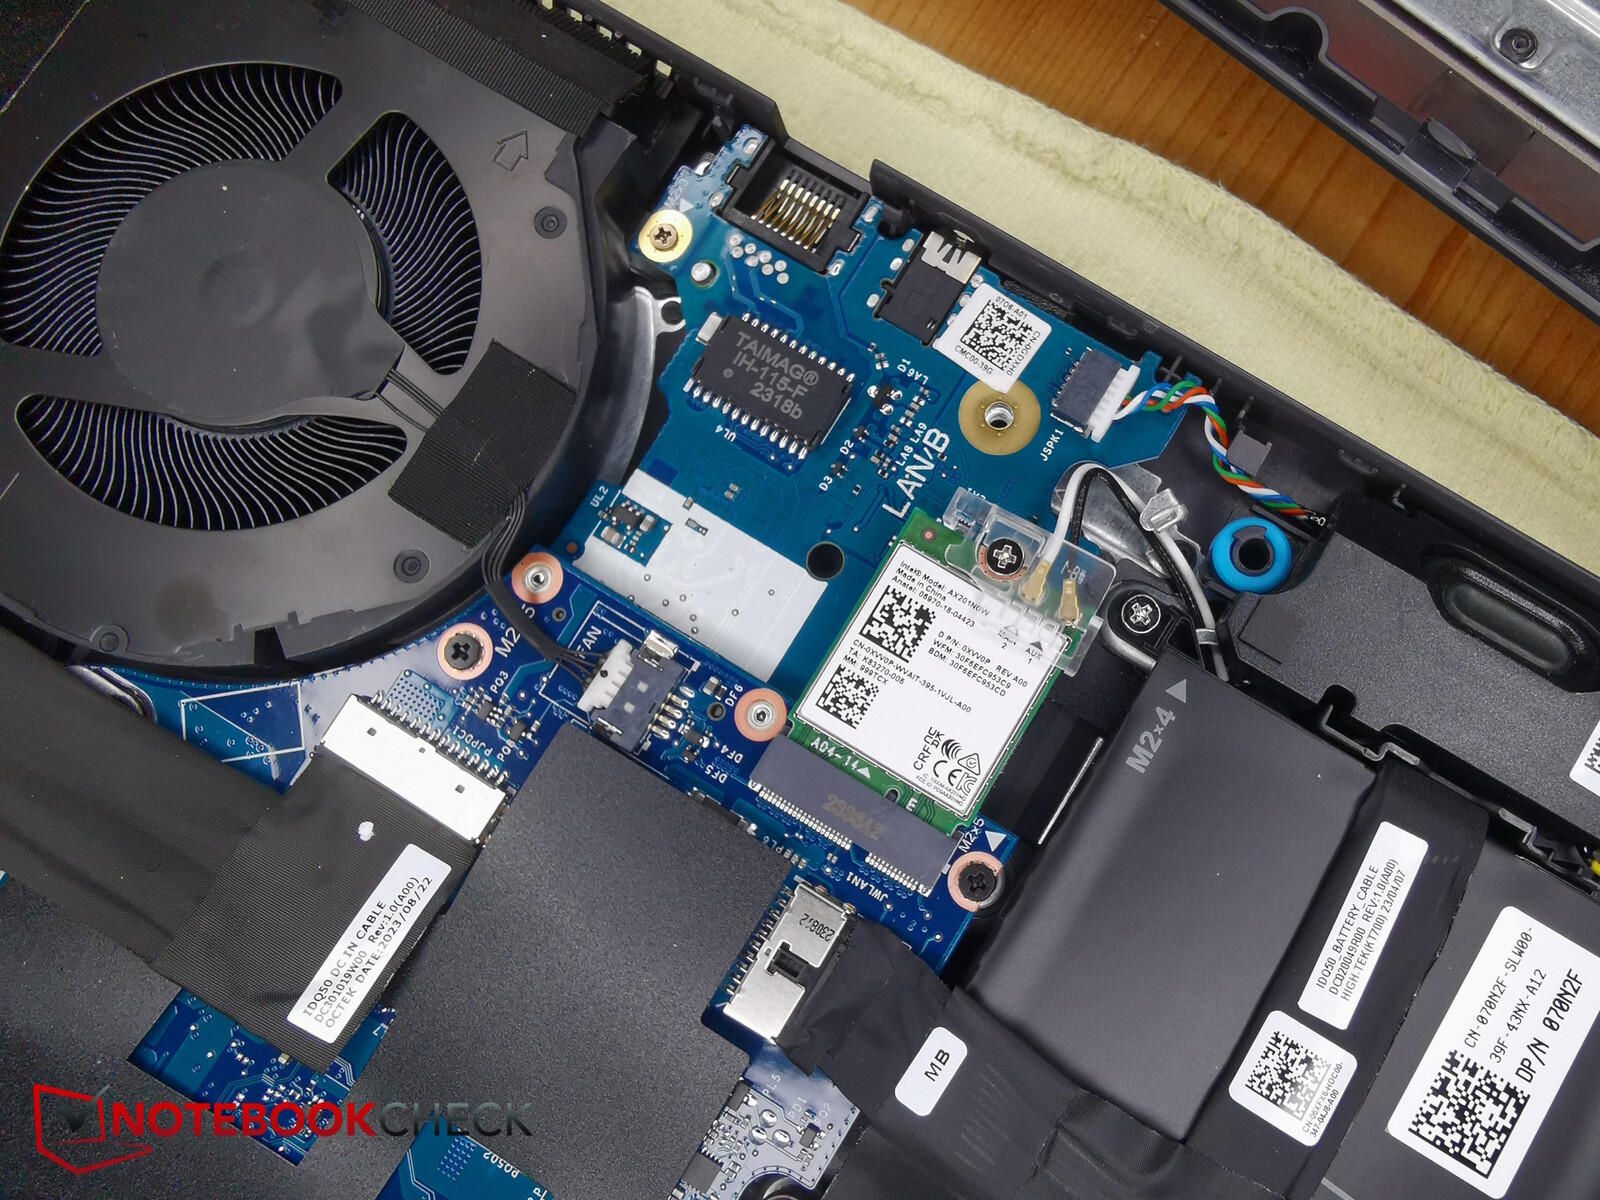
Le module WiFi Intel AX201 supporte le WiFi 6 mais pas encore le WiFi 6E.
Ses taux de transfert dans la bande 5 GHz sont exceptionnels, alors que ses taux de 210 Mb/s dans la bande 2,4 GHz sont décevants.
Webcam
Au plus tard, sa maigre webcam 720p montre où Dell a fait des économies. De nombreux concurrents disposent déjà d'une caméra Full-HD, voire plus. Il existe également de meilleurs modèles en ce qui concerne les écarts de couleur et la netteté de l'image.


Sécurité
Le G16 ne dispose pas vraiment de fonctions de sécurité physique, puisqu'il n'est pas équipé d'un capteur d'empreintes digitales ni d'un verrou Kensington. Le TPM est, bien entendu, intégré au processeur.
Accessoires et garantie
L'emballage ne contient pas d'accessoires. Dell offre à cet appareil une garantie standard de 12 mois avec un service de base sur site et une assistance matérielle, et les conditions spéciales peuvent être consultées dans la capture d'écran suivante.

Maintenance
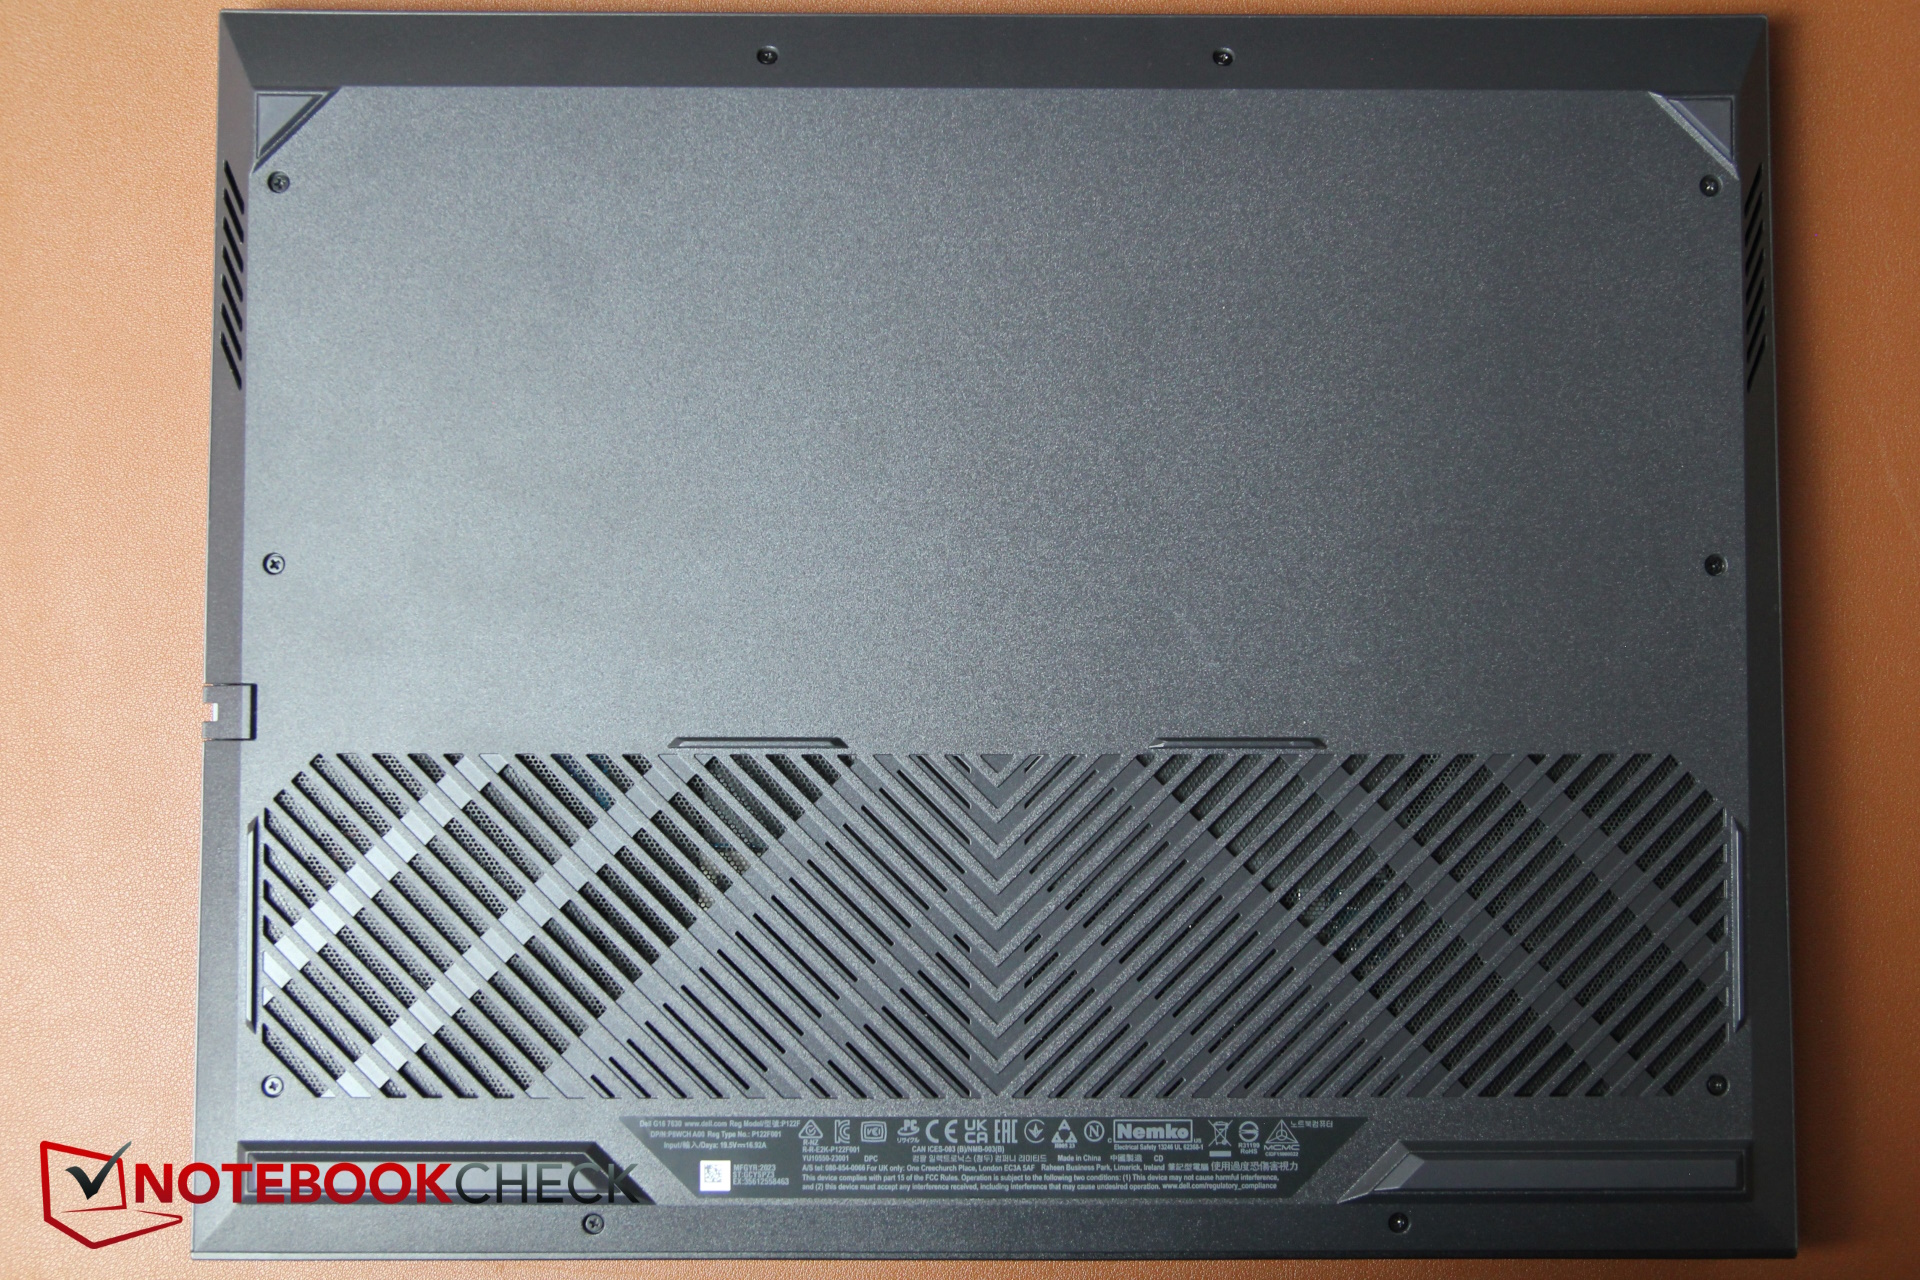
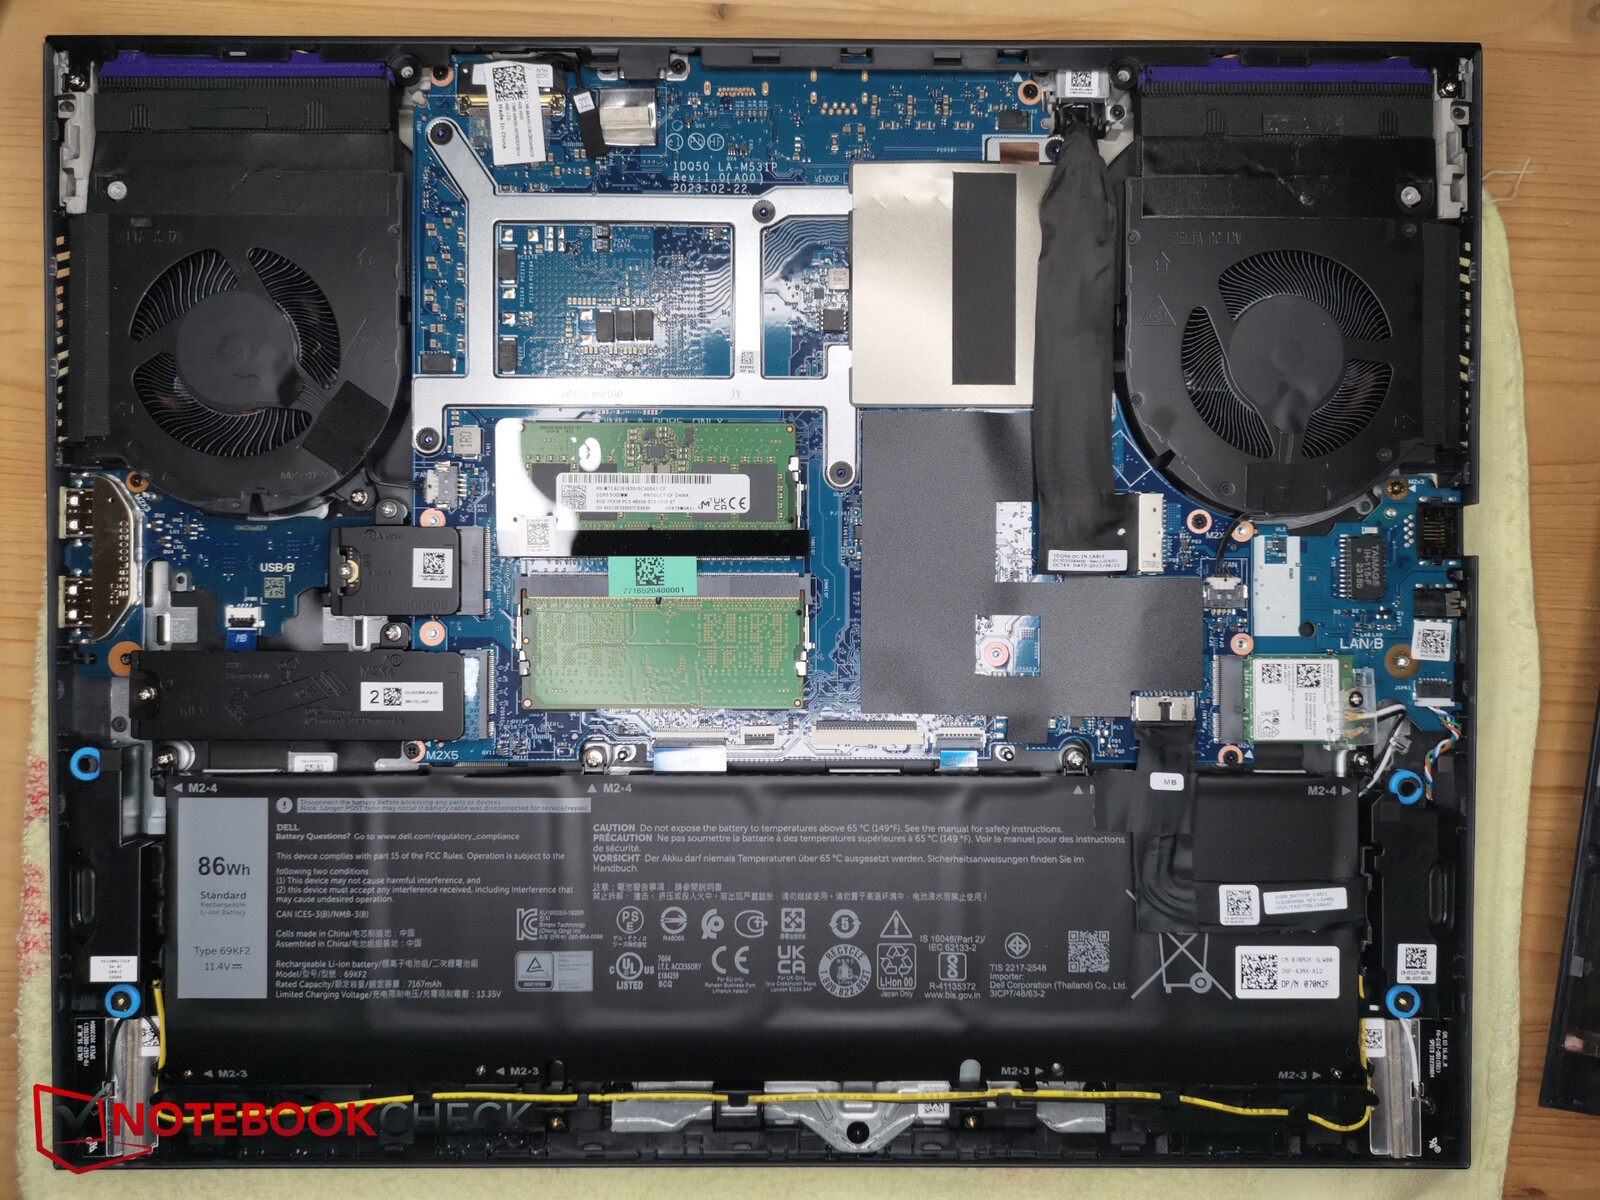
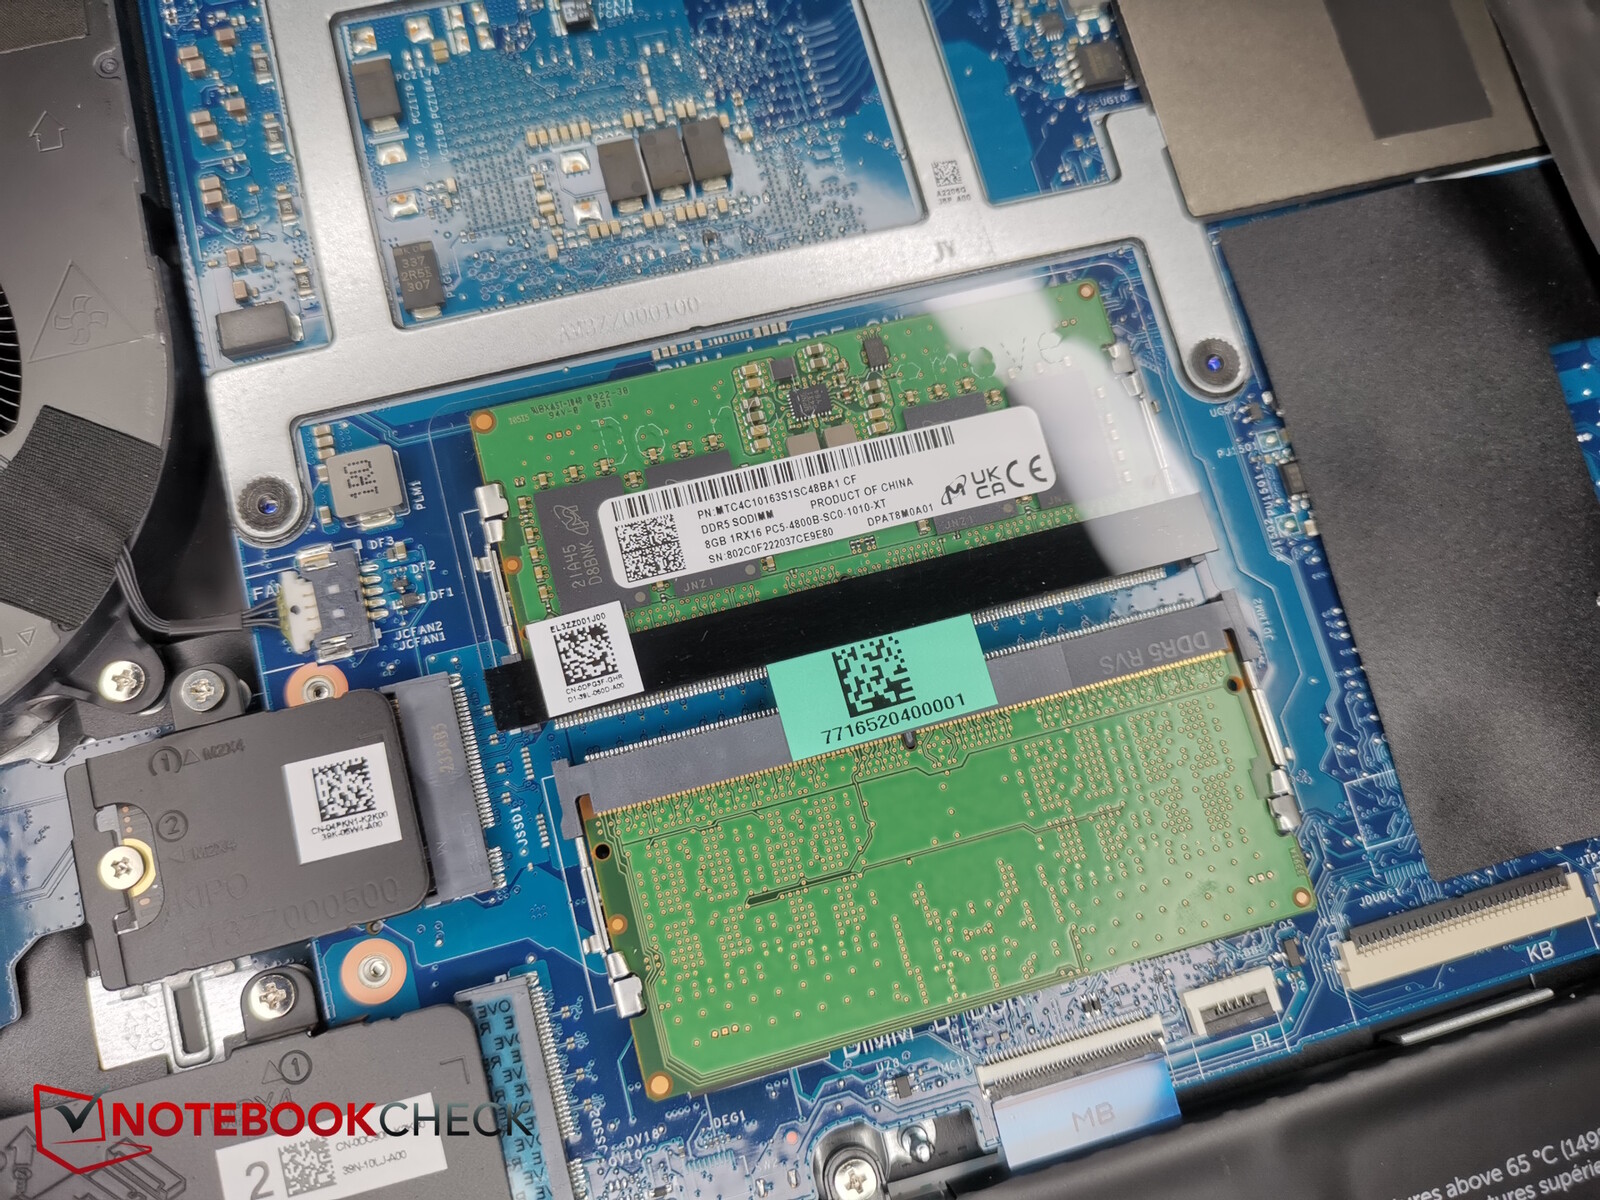
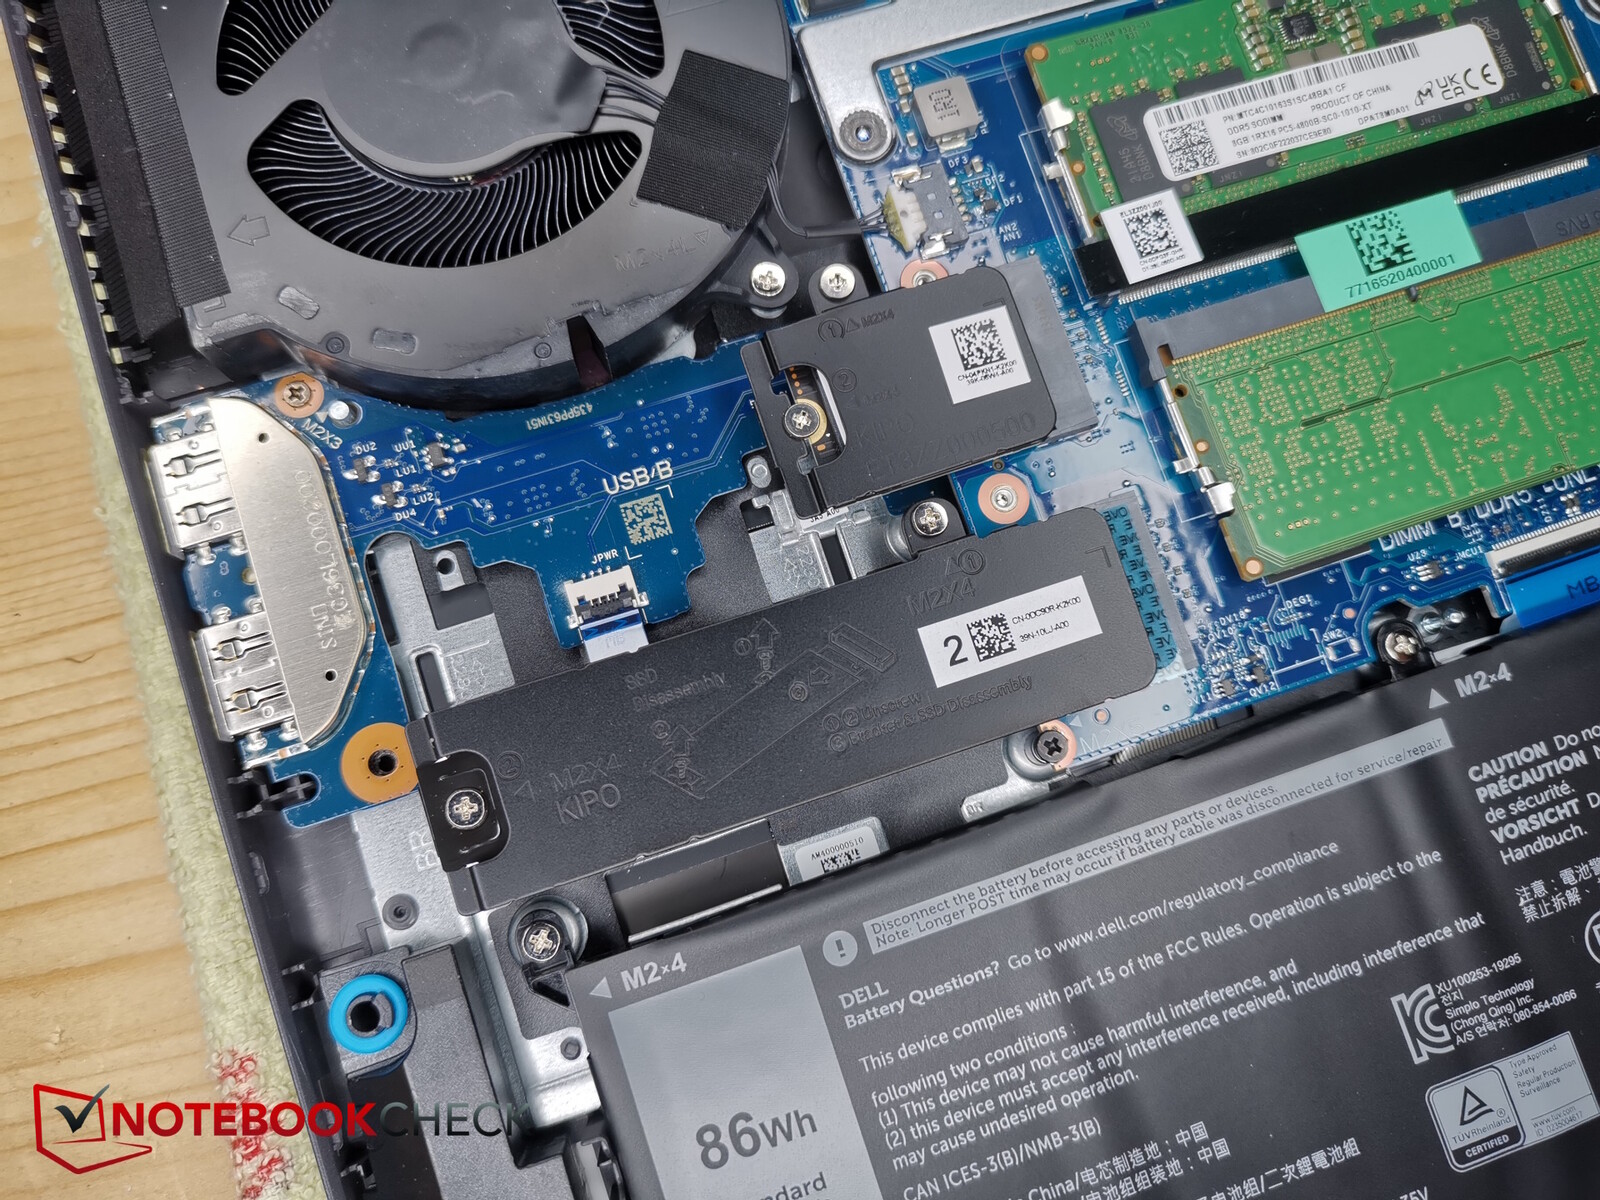
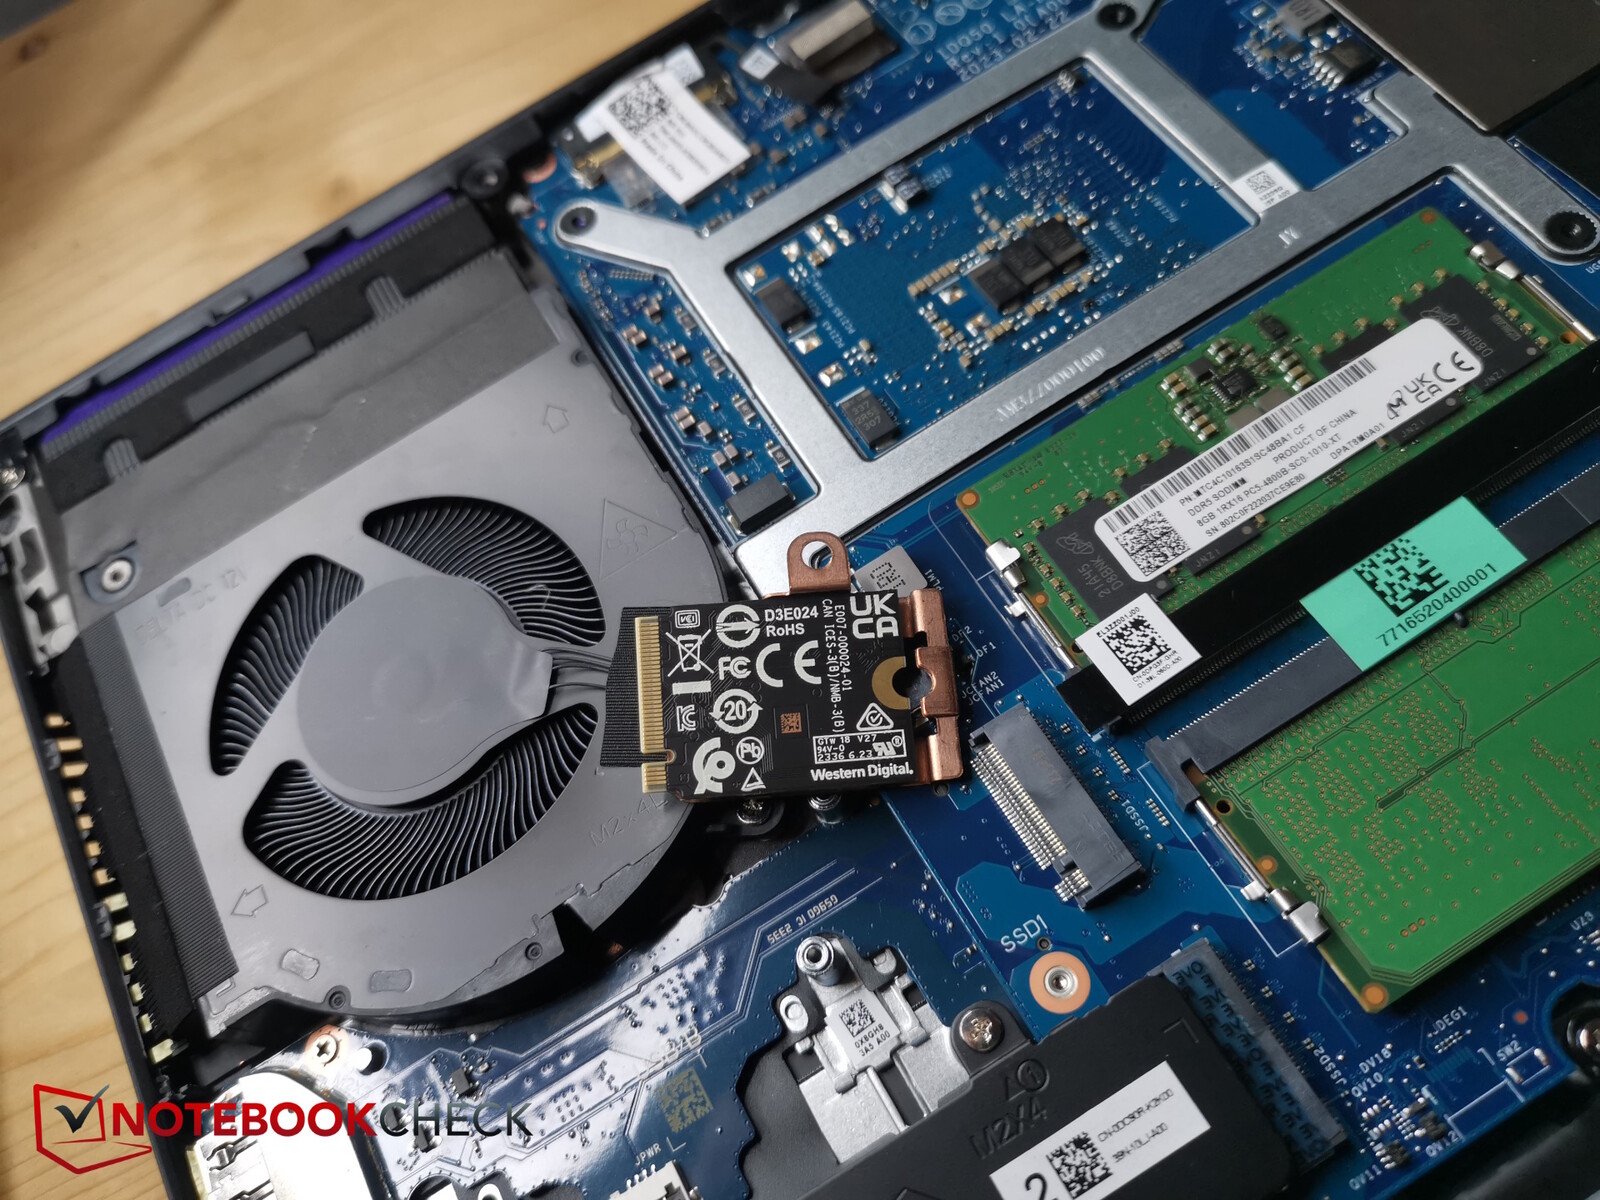
10 vis à tête cruciforme maintiennent la plaque inférieure en place. Quatre d'entre elles sont plus longues que les autres, mais elles ne sortent pas de leurs trous, de sorte qu'il n'y a pas lieu de craindre qu'elles se mélangent. Si vous retirez les vis, la partie inférieure du boîtier se détache presque toute seule, vous n'aurez donc pas besoin d'outils supplémentaires.
A l'intérieur, il n'y a pas de caloducs en cuivre apparents comme on peut le voir sur la plupart des concurrents. Vous pouvez accéder aux ventilateurs, aux deux slots de RAM, au module WiFi, à la batterie et aux deux slots M.2-SSD dont seul le plus petit format 2230 est occupé.

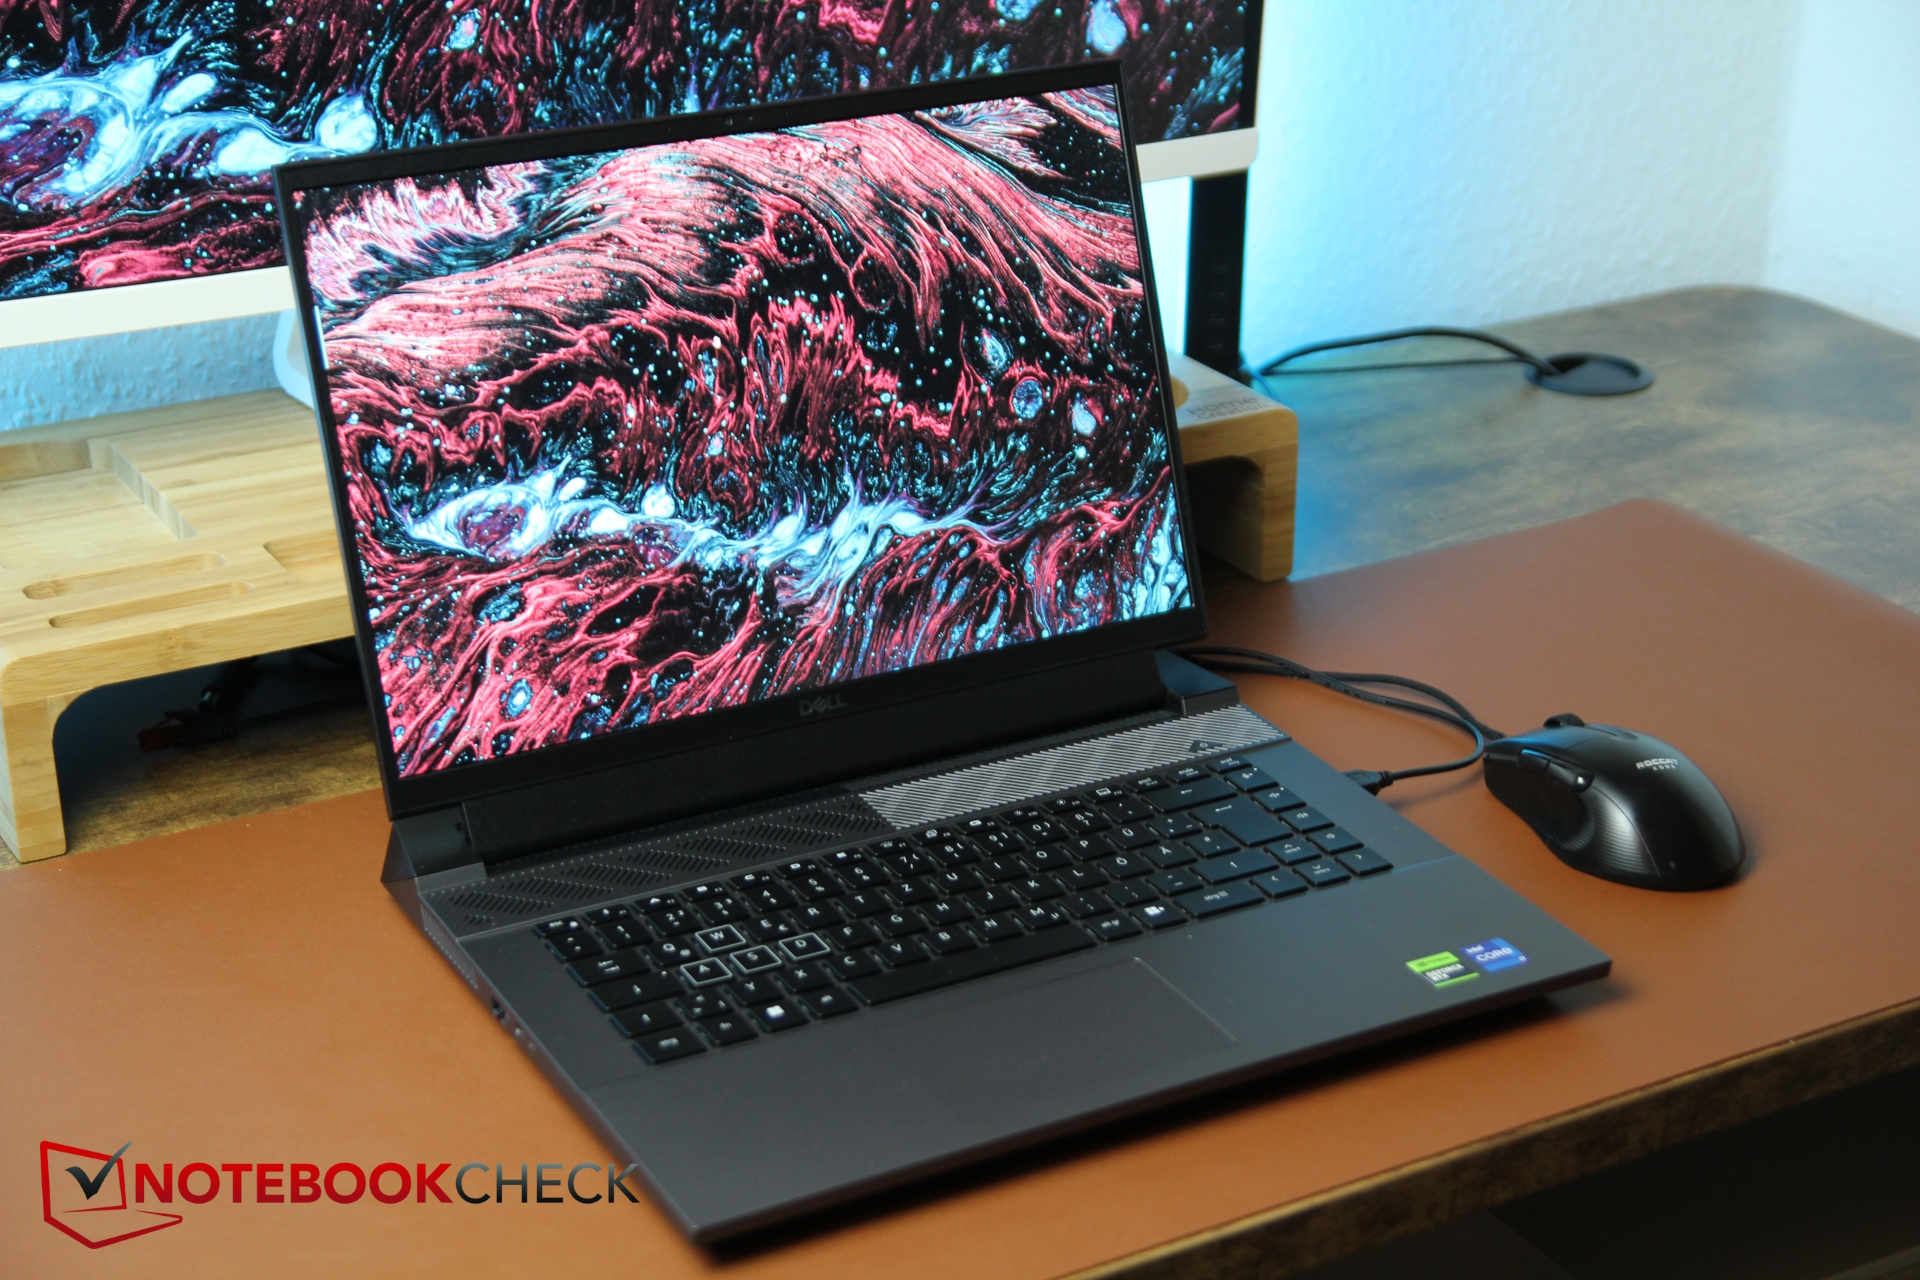
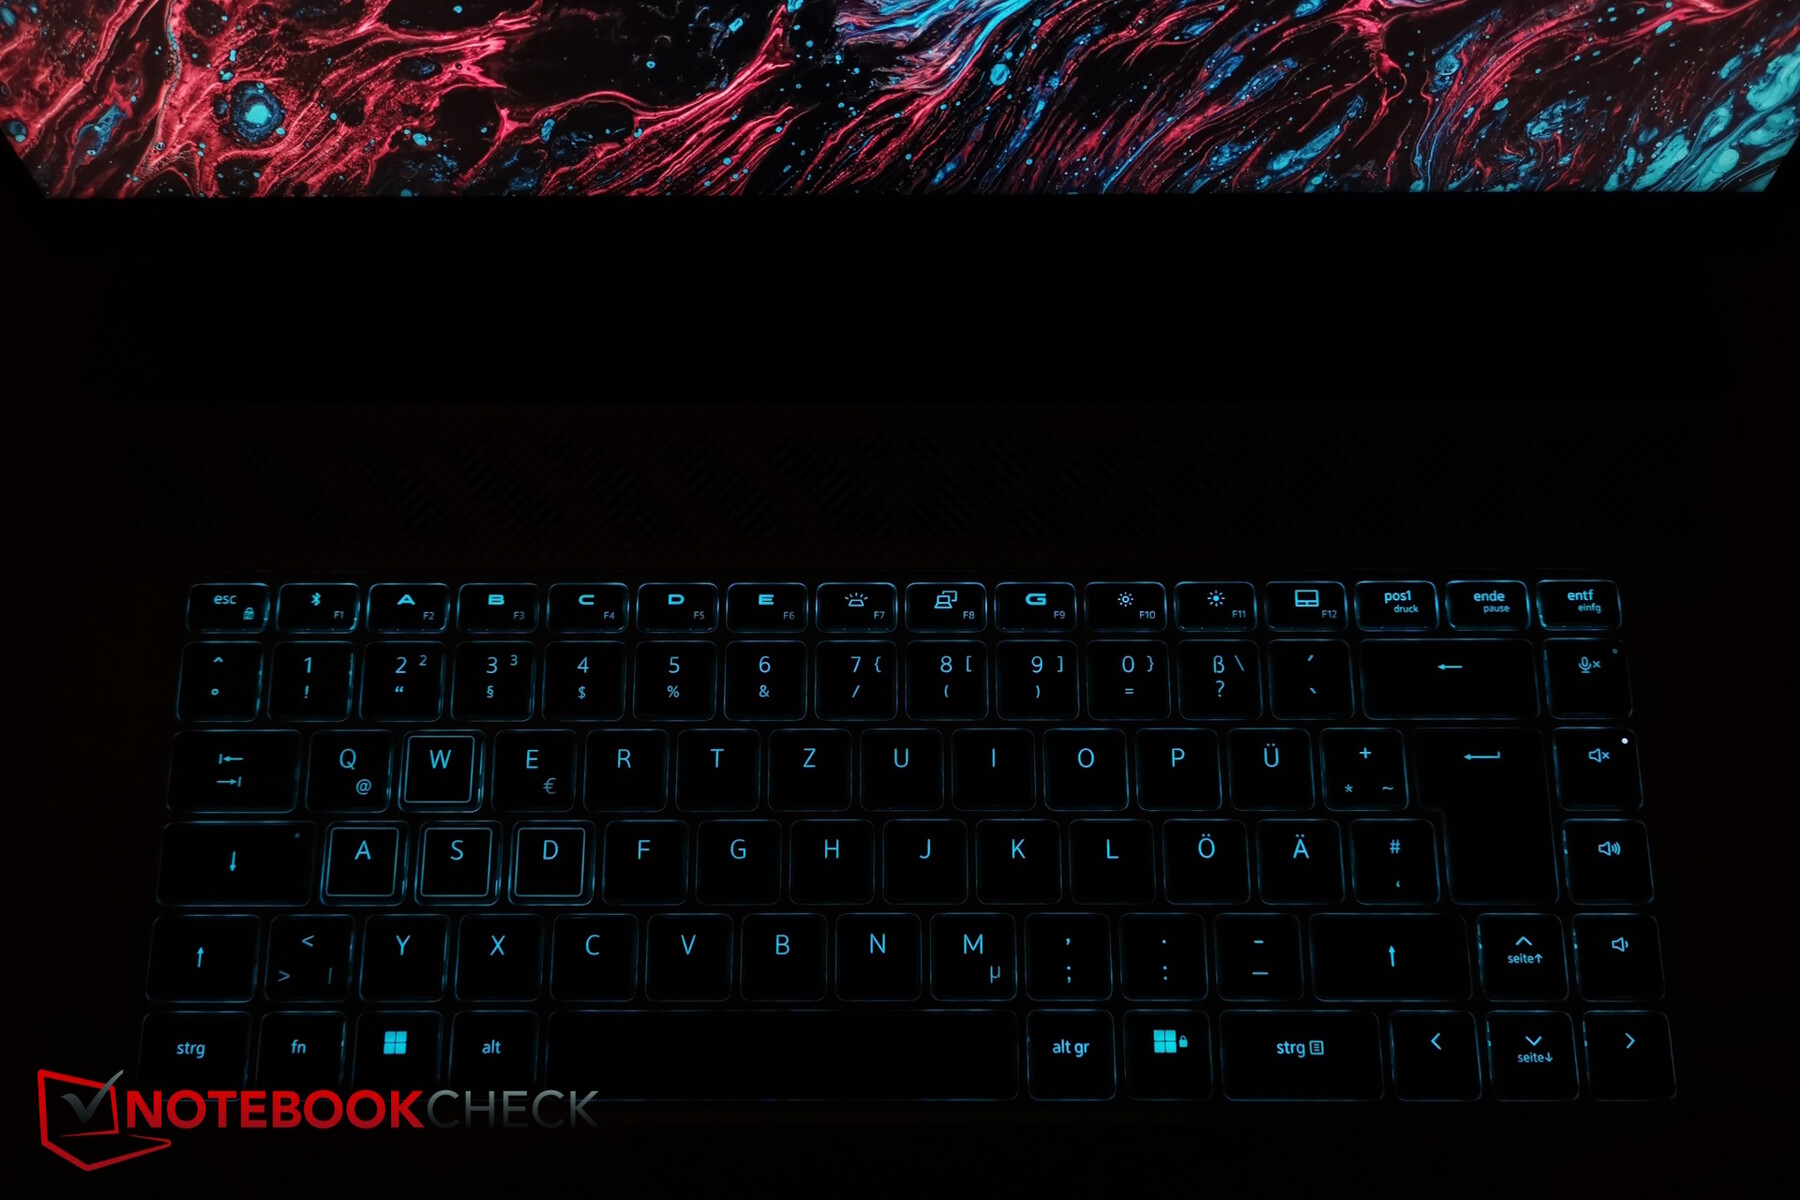
Dispositifs de saisie - 5 touches spéciales configurables
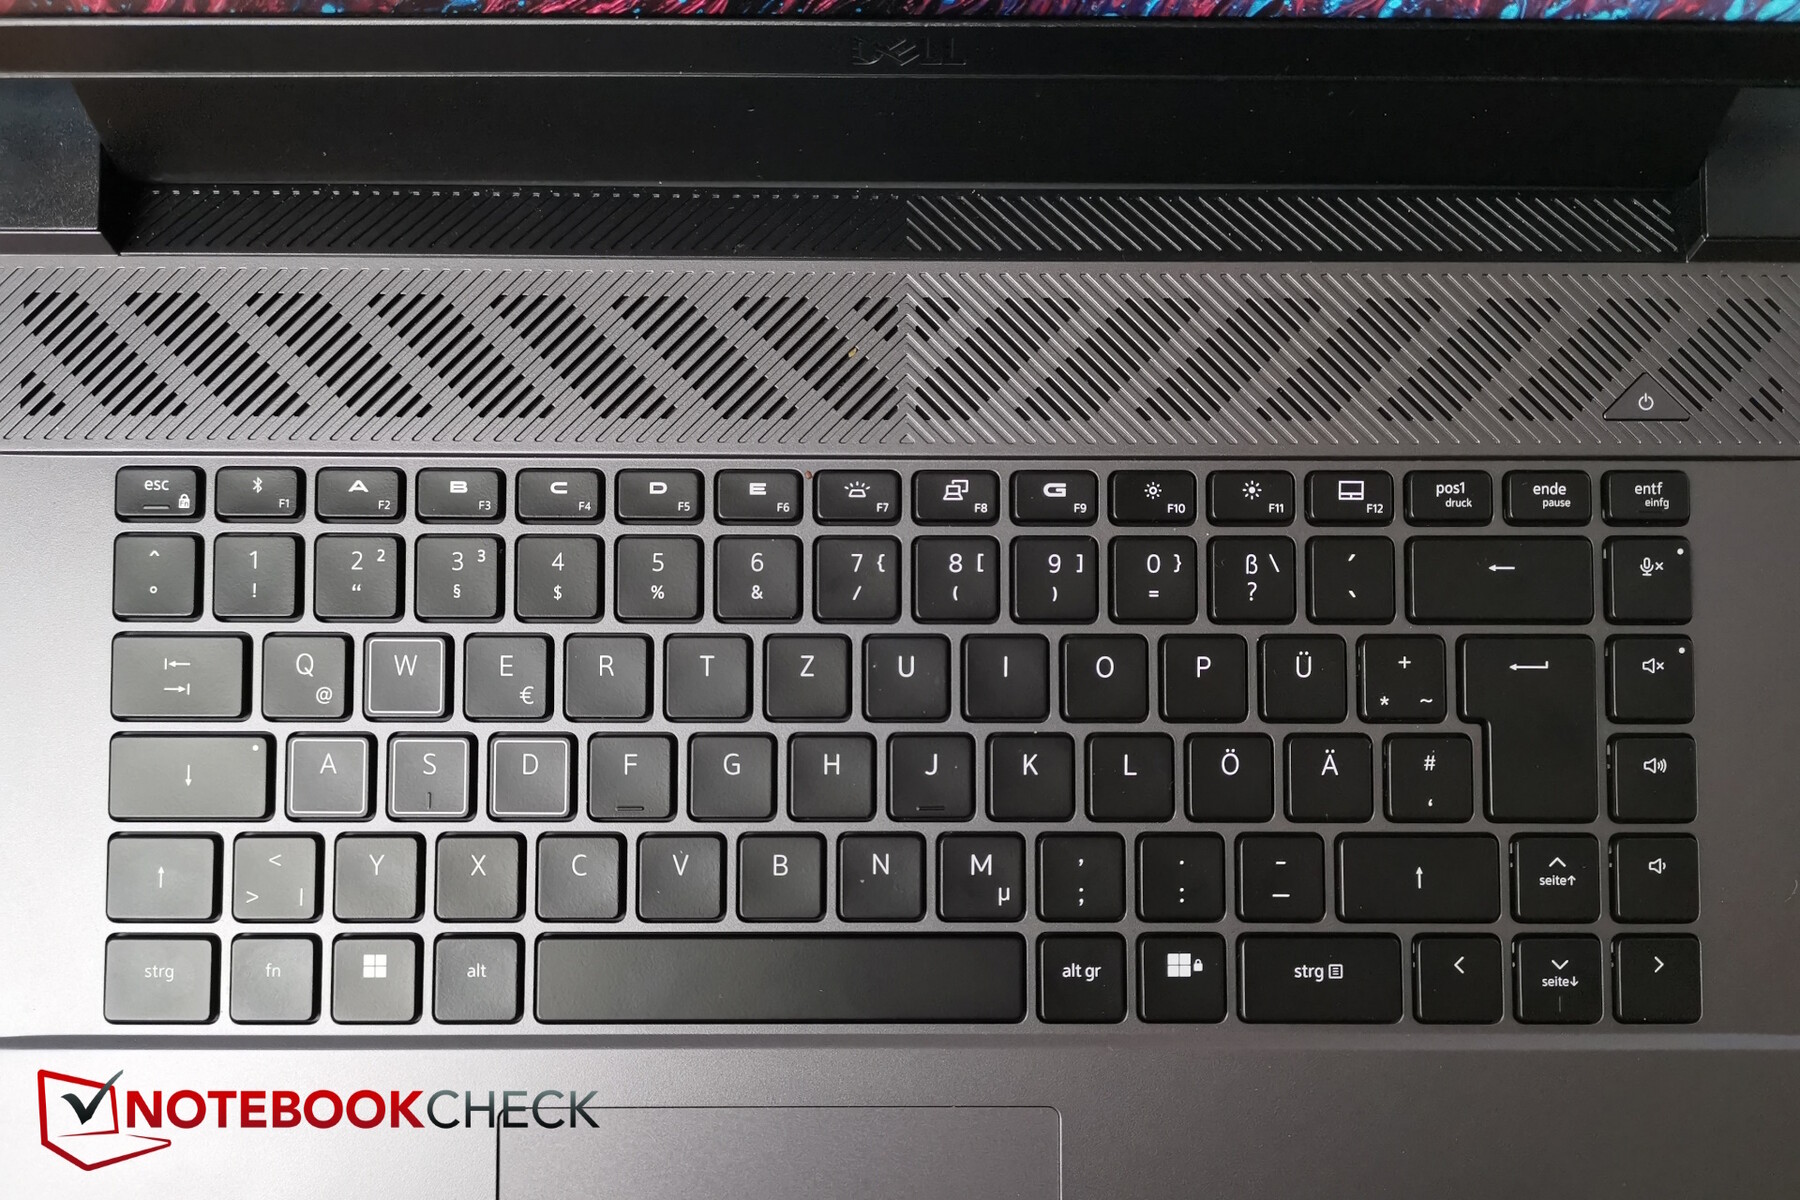
Clavier
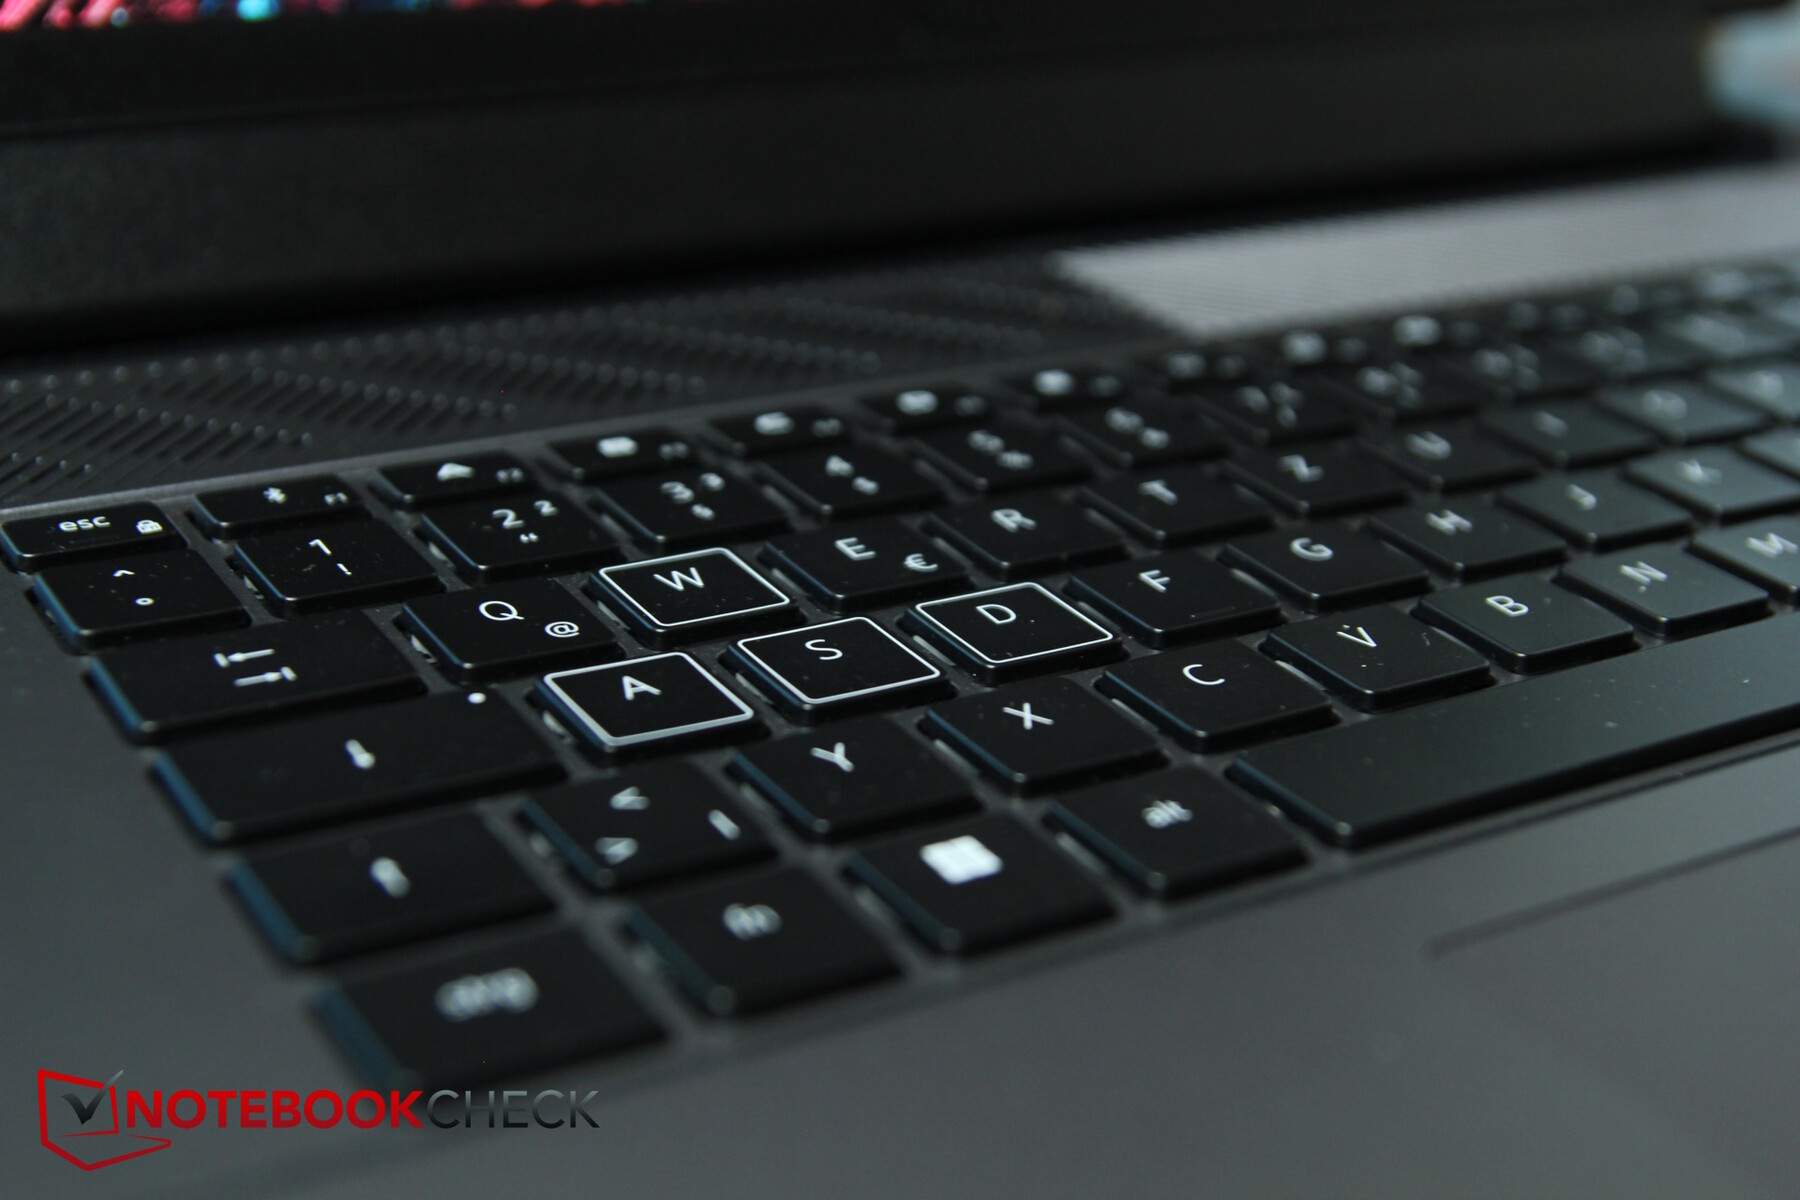
Le G16 n'est pas doté d'un pavé numérique, ce qui signifie que toutes les touches ont suffisamment d'espace, y compris les touches fléchées de taille normale. Sur le côté droit, on trouve quelques touches spéciales (volume, bouton de coupure du microphone). Les touches normales mesurent environ 1,6 x 1,6 cm et les touches F sont deux fois moins hautes. Les touches WASD ont un contour blanc.
Comme certaines touches spéciales sont situées à droite, les touches F2 à F6 peuvent être configurées manuellement, par exemple à l'aide de macros.
La portance des touches n'est pas très élevée, mais leur rétroaction est bonne et vous pouvez taper confortablement et rapidement dessus. Les bruits qui en résultent sont très modérés. La touche fléchée gauche de notre appareil de test émet un son un peu différent de celui des autres touches (fléchées) - légèrement creux, comme si quelque chose résonnait à l'intérieur. Il pourrait s'agir d'une erreur de production qui, espérons-le, n'affecte que notre appareil.
Le clavier est doté d'un rétroéclairage à deux niveaux d'intensité. Il n'y a qu'une seule zone, mais vous pouvez sélectionner une série d'effets RVB via le Command Center (goutte de pluie, pulsation, etc.).

Pavé tactile
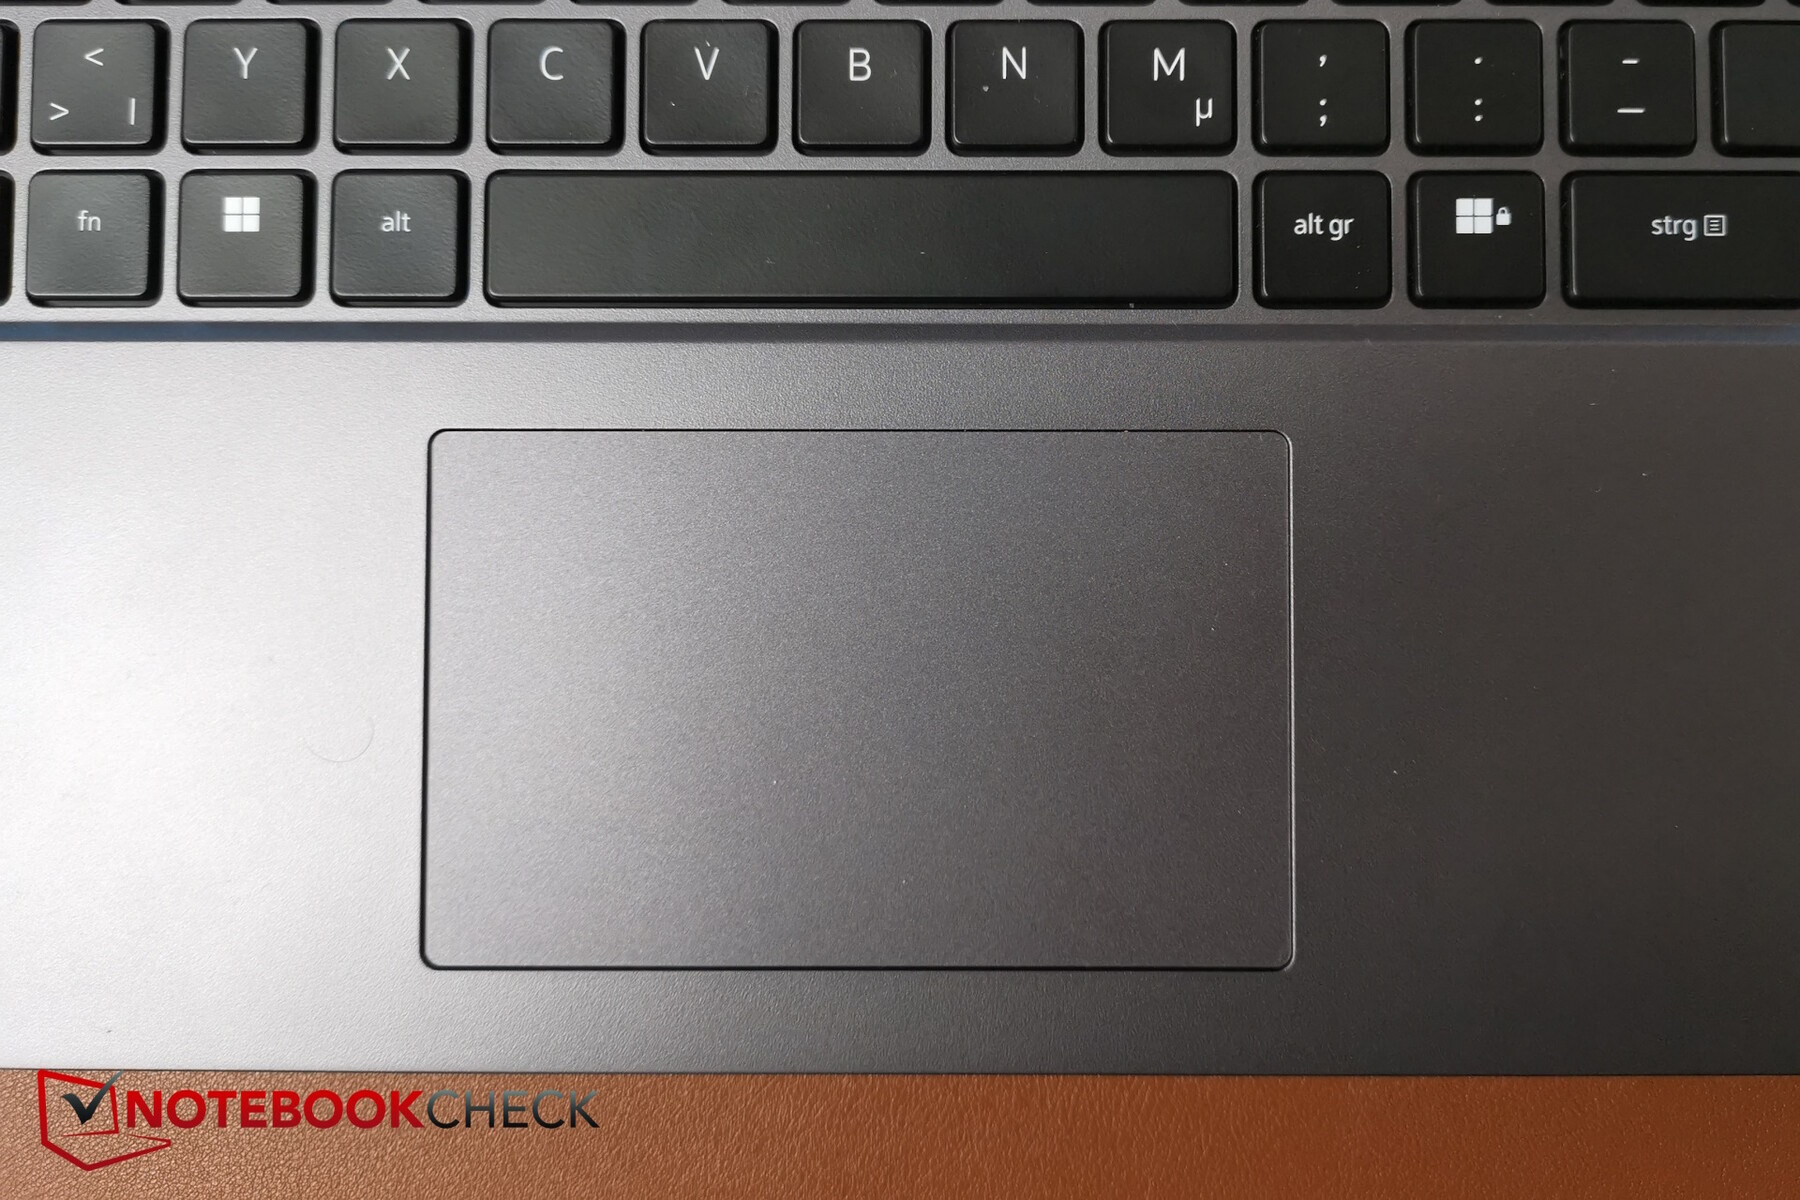
Le pavé tactile est un peu petit (environ 10,5 x 6,5 cm), mais la plupart des joueurs utiliseront probablement une souris, suppose Dell. Sa surface est agréable et lisse, mais lors de mouvements très lents ou si vos doigts sont humides, il risque de coller un peu.
Les boutons intégrés se déclenchent de manière fiable - le bruit de clic est légèrement plus fort que celui des boutons, mais il n'est en aucun cas gênant.
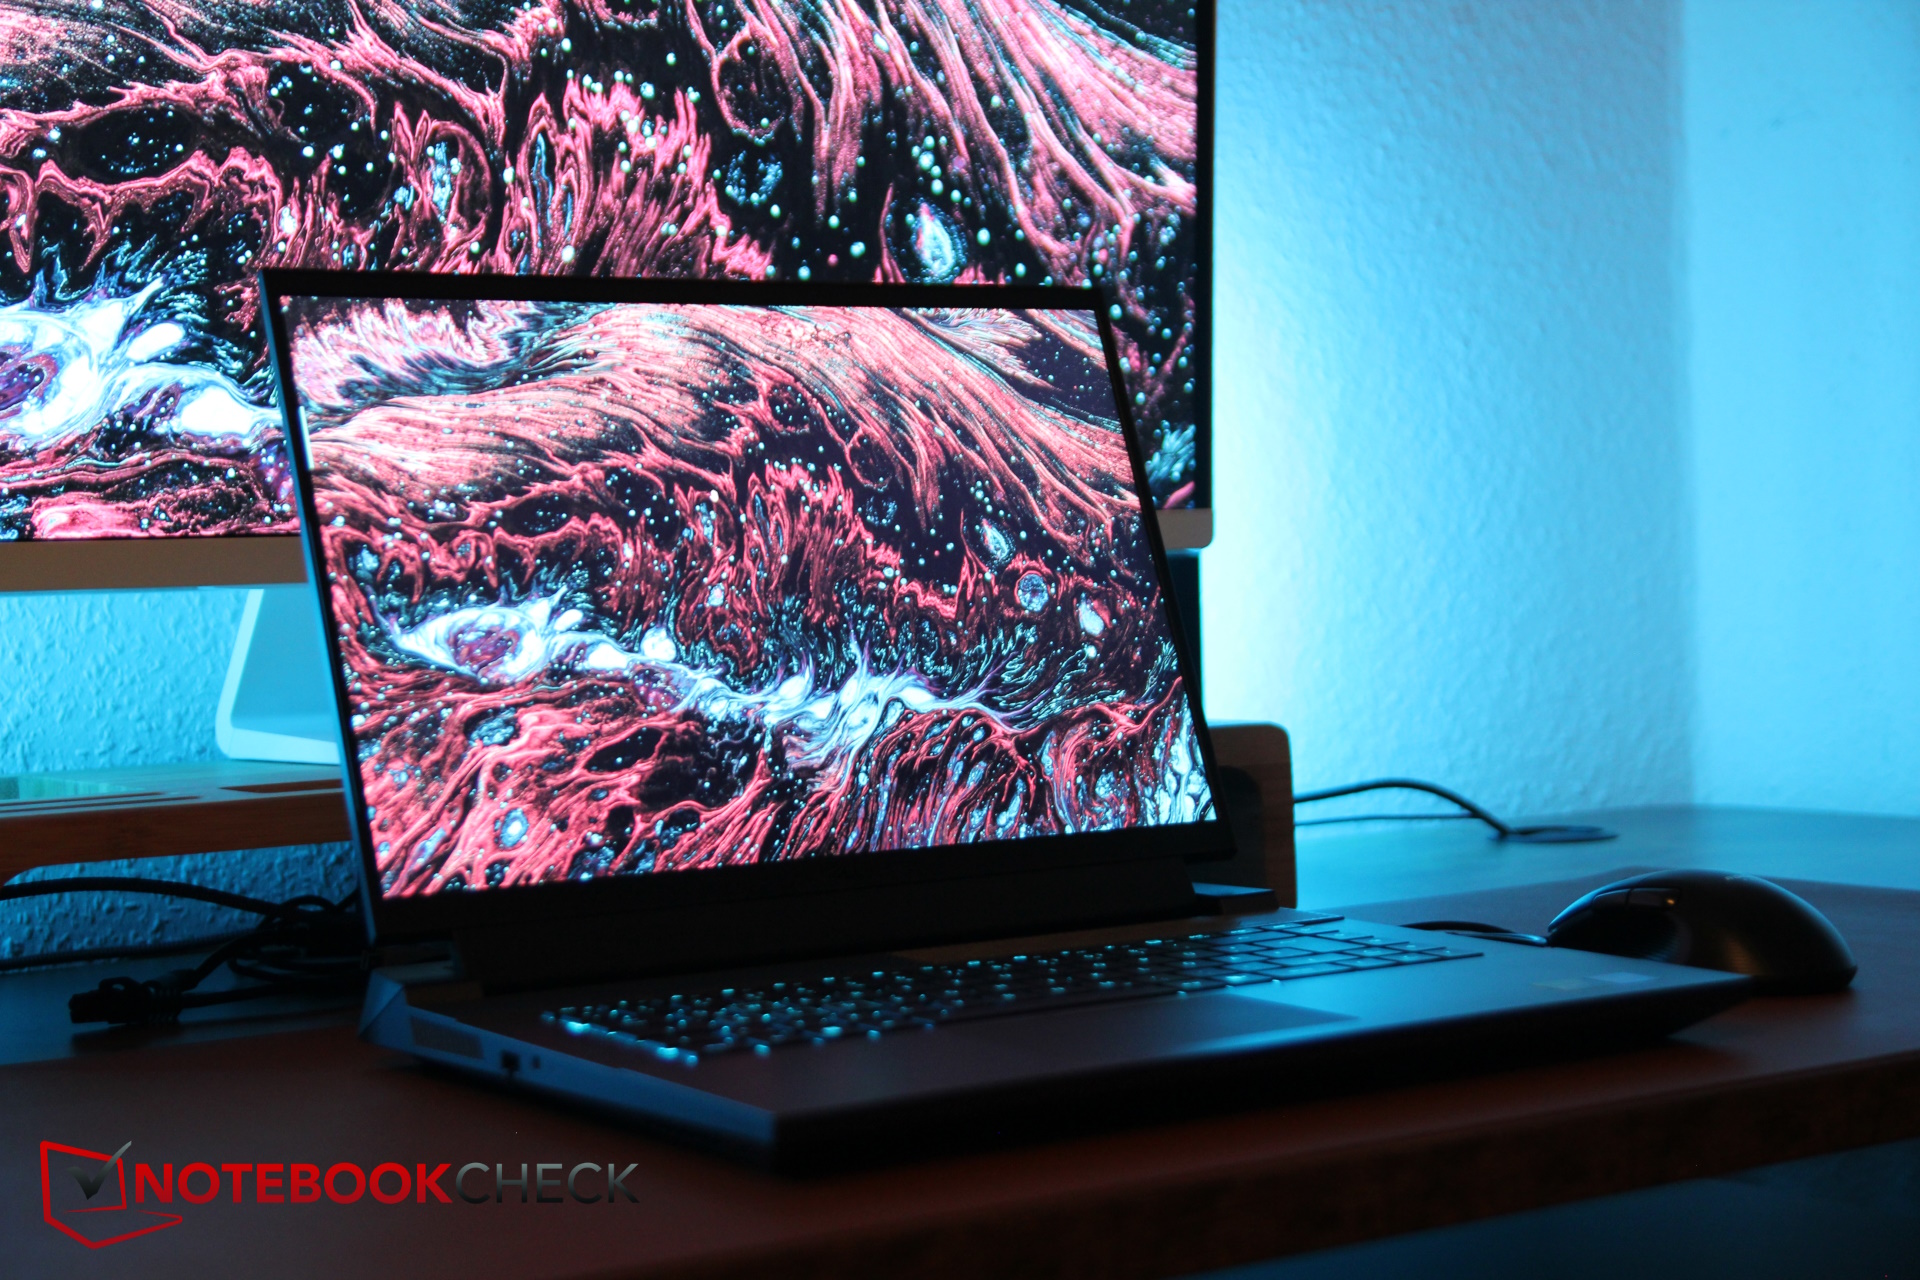
Affichage - DCI-P3 ou simplement sRGB ?
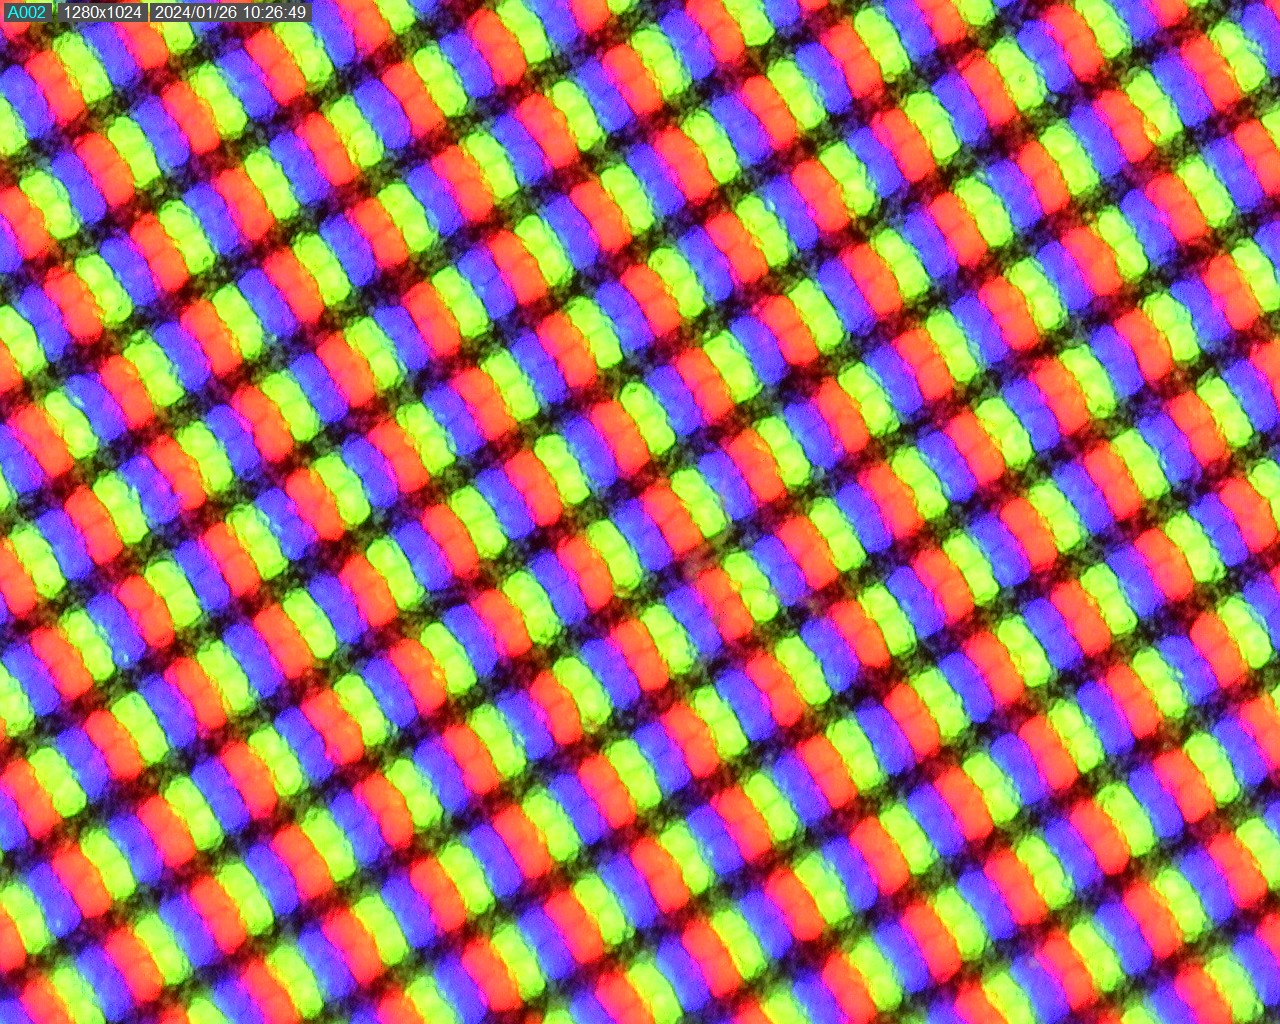
Bien qu'il présente la même résolution, Dell est passé de BOE à Chi Mei. L'écran IPS mat a une résolution de 2 560 x 1 600 pixels. Mais attention : Bien que le site Web ne propose actuellement qu'un seul écran pour le G16 - à savoir l'écran QHD+ (2 560 x 1 600) avec un taux de rafraîchissement de 240 Hz, 3 ms, NVIDIA G-SYNC et 100 % de couverture DCI-P3 - notre échantillon de test est équipé d'un panneau avec la même résolution mais un taux de rafraîchissement de "seulement" 165 Hz et, plus important encore, seulement une couverture sRGB et non DCI-P3 ! Vous devez consulter le manuel de l'appareil ( ) pour découvrir les deux variantes pour découvrir les deux variantes.
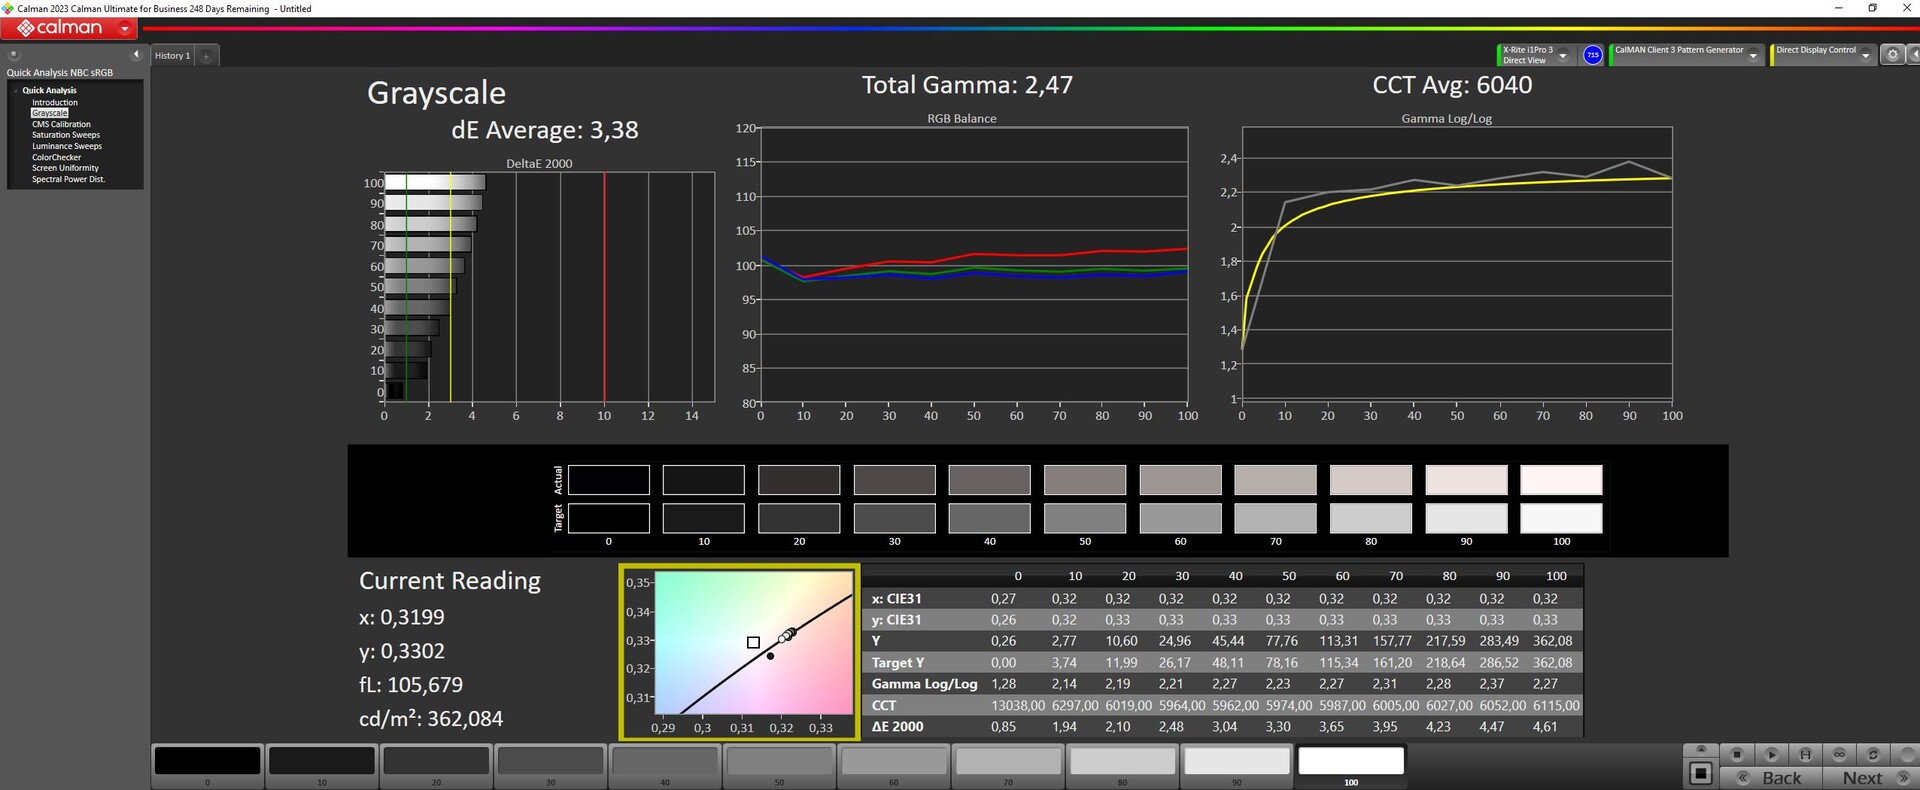
Nous avons mesuré une luminosité moyenne de 344 nits avec un bon 89 % d'illumination. Cependant, lors de la représentation de scènes sombres, nous avons noté une subtile perte de rétroéclairage sur pratiquement tous les bords.
Bien qu'il ait la même luminosité, l'écran présente une valeur de noir améliorée qui profite également au contraste. Dans l'ensemble, il s'agit d'un bon écran sRGB et ses temps de réponse sont assez rapides.
| |||||||||||||||||||||||||
Homogénéité de la luminosité: 89 %
Valeur mesurée au centre, sur batterie: 369 cd/m²
Contraste: 1419:1 (Valeurs des noirs: 0.26 cd/m²)
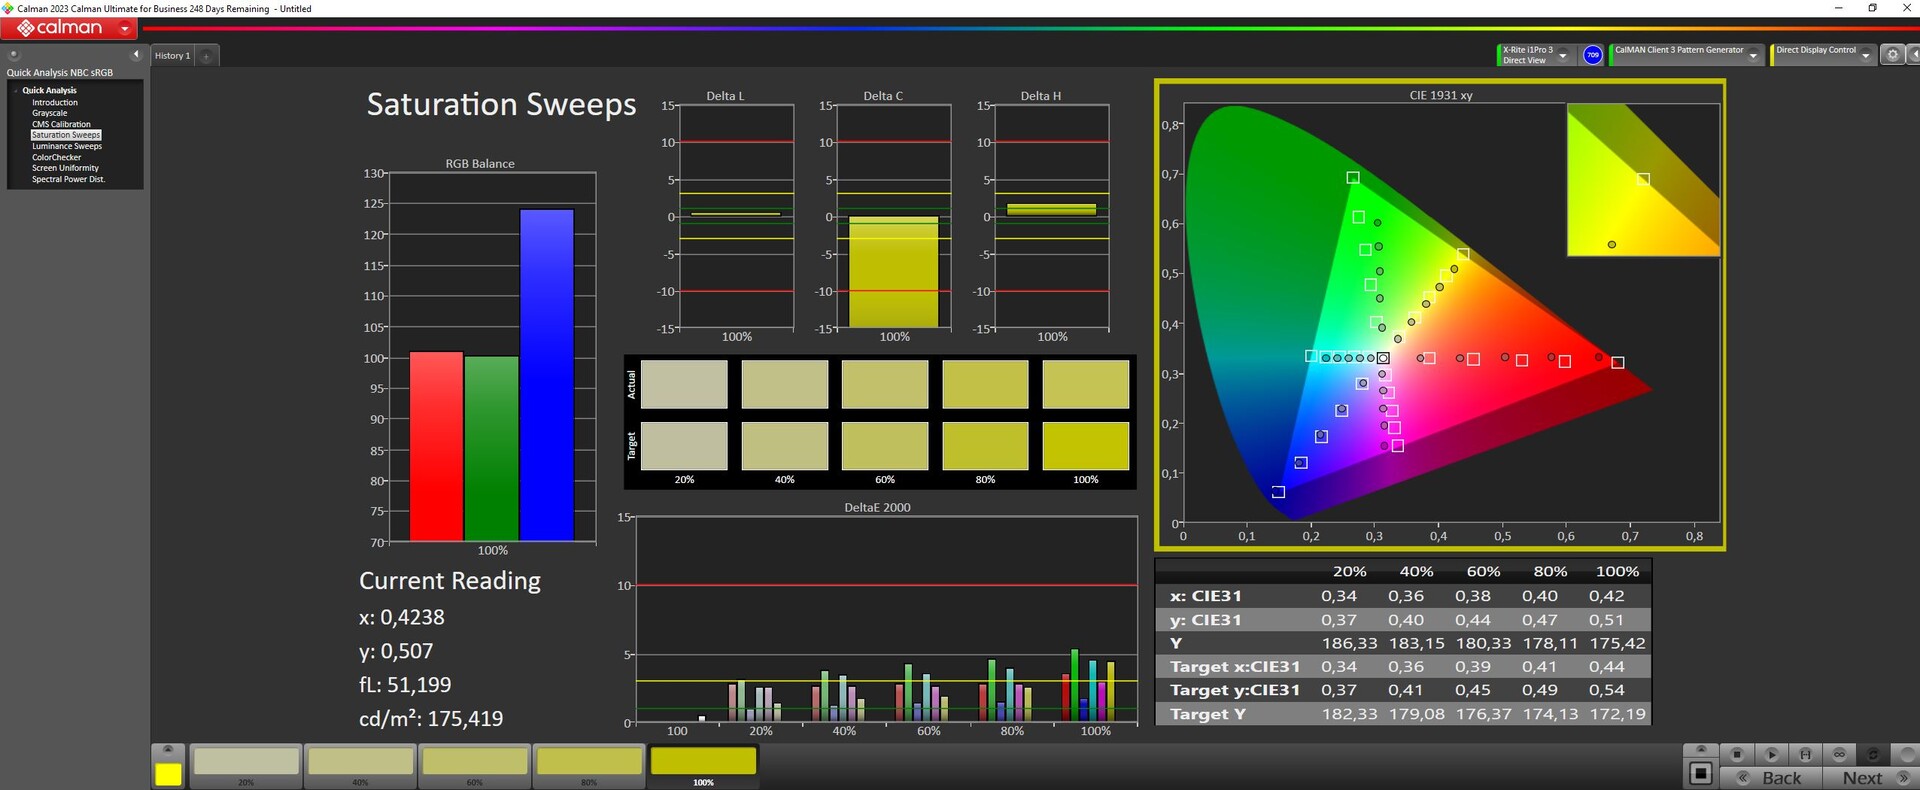
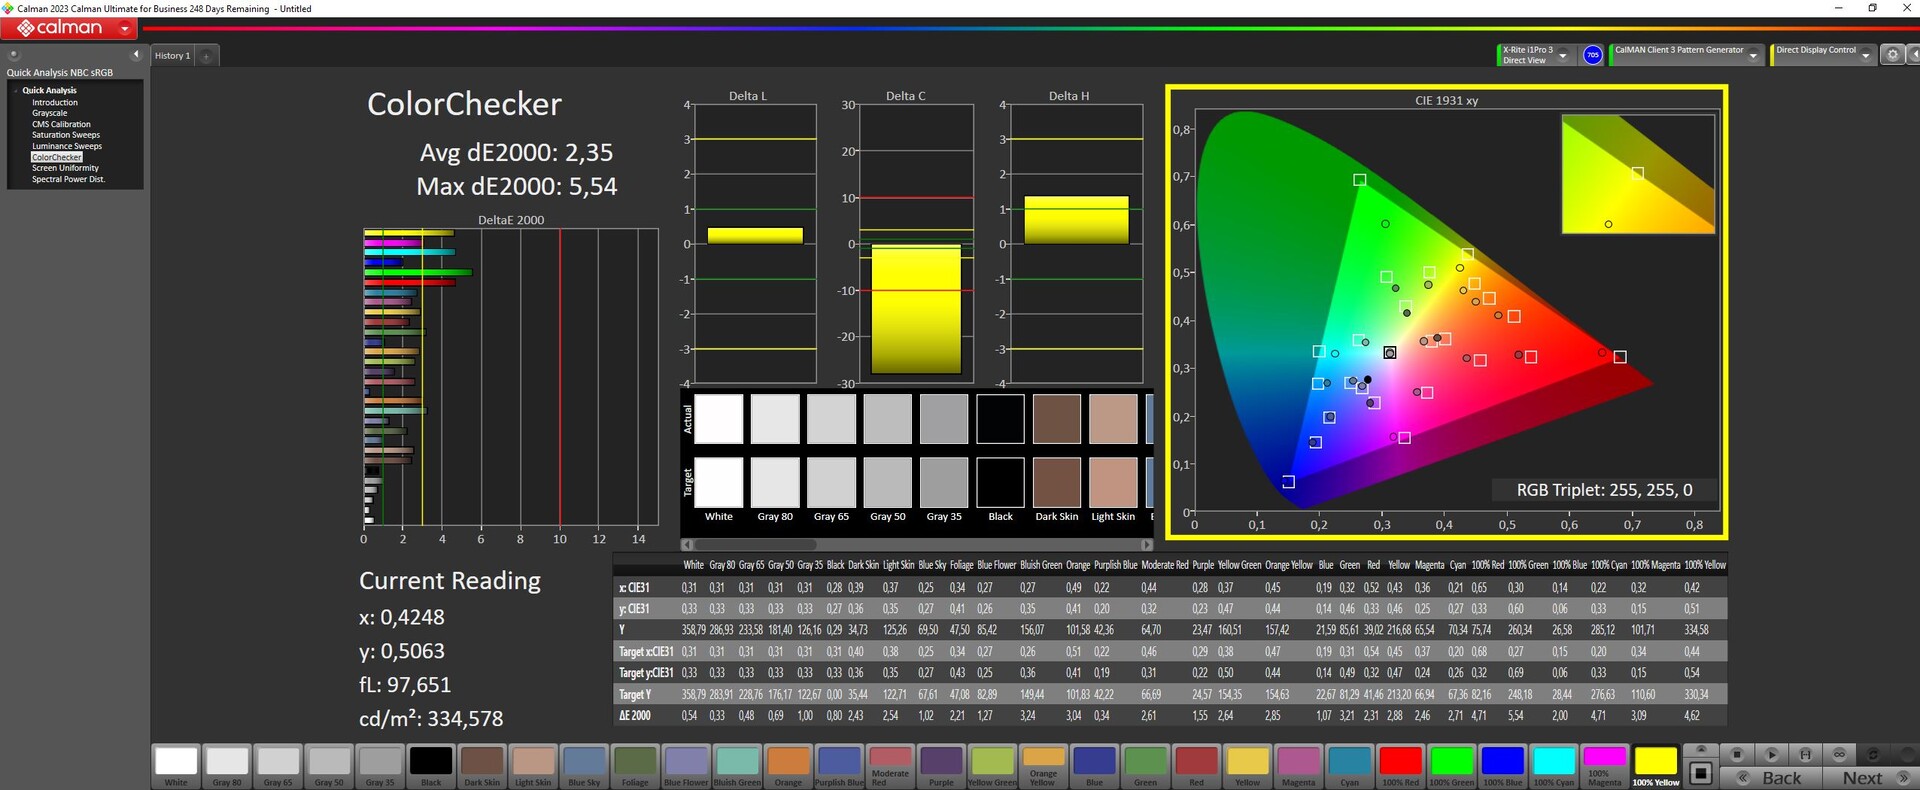
ΔE ColorChecker Calman: 3.04 | ∀{0.5-29.43 Ø4.73}
calibrated: 2.35
ΔE Greyscale Calman: 3.38 | ∀{0.09-98 Ø4.97}
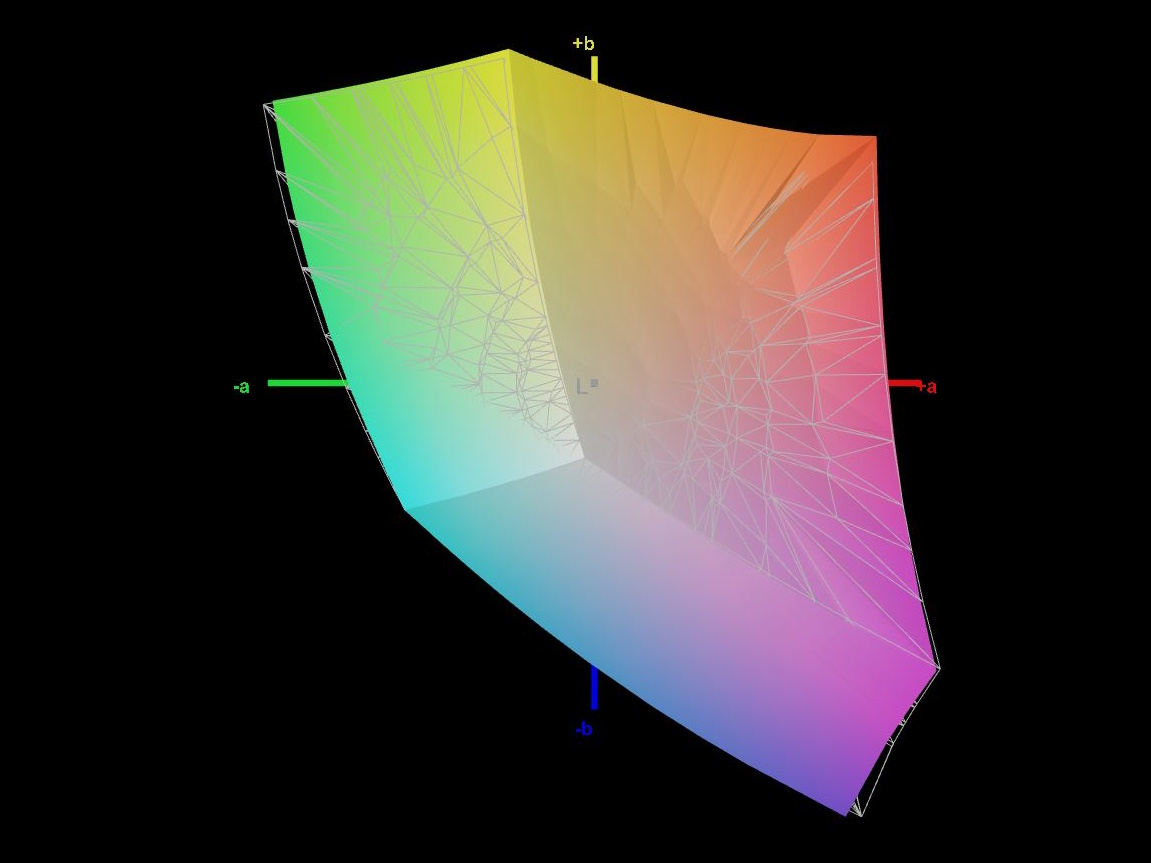
69.3% AdobeRGB 1998 (Argyll 3D)
98.5% sRGB (Argyll 3D)
67.5% Display P3 (Argyll 3D)
Gamma: 2.47
CCT: 6040 K
| Dell G16, i7-13650HX, RTX 4060 Chi Mei CMN161D (160GME), IPS, 2560x1600, 16" | Dell G16 7620 BOE NE16QDM, IPS, 2560x1600, 16" | MSI Raider GE68HX 13VF Chi Mei N160JME-GTK, IPS, 1900x1200, 16" | Lenovo Legion Slim 5 16APH8 BOE NJ NE160QDM-NYC, IPS, 2560x1600, 16" | Alienware m16 R1 Intel BOE NE16NYB, IPS, 2560x1600, 16" | Lenovo LOQ 16IRH8 AUOC1A5 (B160QAN03.L), IPS, 2560x1600, 16" | |
|---|---|---|---|---|---|---|
| Display | 1% | -38% | 2% | 0% | 3% | |
| Display P3 Coverage (%) | 67.5 | 68.3 1% | 41.6 -38% | 69.3 3% | 67.7 0% | 70.5 4% |
| sRGB Coverage (%) | 98.5 | 98 -1% | 62.2 -37% | 100 2% | 97.2 -1% | 98.9 0% |
| AdobeRGB 1998 Coverage (%) | 69.3 | 70.5 2% | 43 -38% | 70 1% | 70 1% | 72.6 5% |
| Response Times | -7% | -131% | -8% | 39% | 17% | |
| Response Time Grey 50% / Grey 80% * (ms) | 7.6 ? | 8.6 ? -13% | 17.3 ? -128% | 10.7 ? -41% | 4 ? 47% | 7.2 ? 5% |
| Response Time Black / White * (ms) | 10.4 ? | 10.4 ? -0% | 24.2 ? -133% | 7.8 ? 25% | 7.3 ? 30% | 7.4 ? 29% |
| PWM Frequency (Hz) | ||||||
| Screen | 7% | -37% | 15% | 4% | 13% | |
| Brightness middle (cd/m²) | 369 | 369.4 0% | 300.9 -18% | 371.6 1% | 306 -17% | 407 10% |
| Brightness (cd/m²) | 344 | 348 1% | 302 -12% | 343 0% | 302 -12% | 369 7% |
| Brightness Distribution (%) | 89 | 83 -7% | 93 4% | 84 -6% | 89 0% | 85 -4% |
| Black Level * (cd/m²) | 0.26 | 0.32 -23% | 0.31 -19% | 0.44 -69% | 0.3 -15% | 0.45 -73% |
| Contrast (:1) | 1419 | 1154 -19% | 971 -32% | 845 -40% | 1020 -28% | 904 -36% |
| Colorchecker dE 2000 * | 3.04 | 1.78 41% | 4.6 -51% | 1.52 50% | 2.57 15% | 1.43 53% |
| Colorchecker dE 2000 max. * | 5.56 | 4.41 21% | 17.6 -217% | 2.68 52% | 4.26 23% | 3.58 36% |
| Colorchecker dE 2000 calibrated * | 2.35 | 1.22 48% | 2.04 13% | 0.33 86% | 0.85 64% | 1.07 54% |
| Greyscale dE 2000 * | 3.38 | 3.2 5% | 3.3 2% | 1.2 64% | 3.3 2% | 1.13 67% |
| Gamma | 2.47 89% | 2.2 100% | 2.09 105% | 2.1 105% | 1.997 110% | 2.5 88% |
| CCT | 6040 108% | 6750 96% | 7151 91% | 6503 100% | 6895 94% | 6526 100% |
| Moyenne finale (programmes/paramètres) | 0% /
4% | -69% /
-50% | 3% /
9% | 14% /
8% | 11% /
11% |
* ... Moindre est la valeur, meilleures sont les performances
Nous avons mesuré une couverture d'environ 70 % pour DisplayP3 et AdobeRGB, tandis que sRGB est presque entièrement couvert. L'ancien écran atteignait des valeurs similaires ; la version proposée sur le site web est censée couvrir 100 % de DCI-P3.
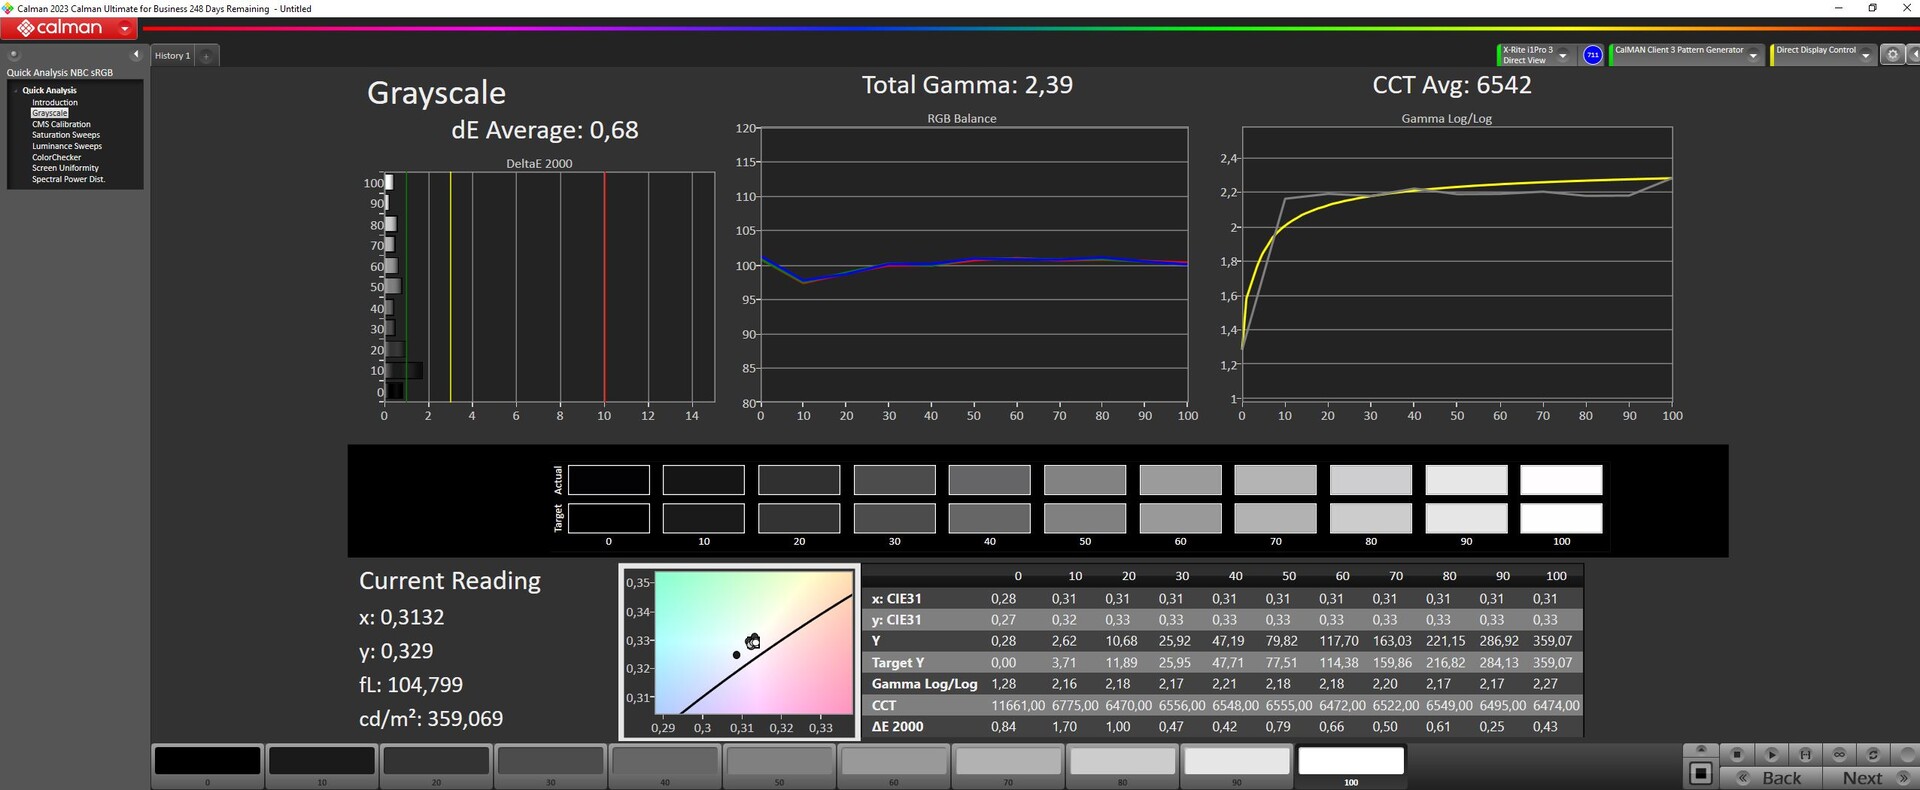
Dès sa sortie de l'emballage, l'écran n'est pas calibré de manière optimale. Notre étalonnage à l'aide d'un appareil de mesure X-Rite et du logiciel Calman a permis d'améliorer considérablement les écarts de niveaux de gris, mais les couleurs n'ont pas été aussi bien améliorées.
Temps de réponse de l'écran
| ↔ Temps de réponse noir à blanc | ||
|---|---|---|
| 10.4 ms ... hausse ↗ et chute ↘ combinées | ↗ 5.8 ms hausse | 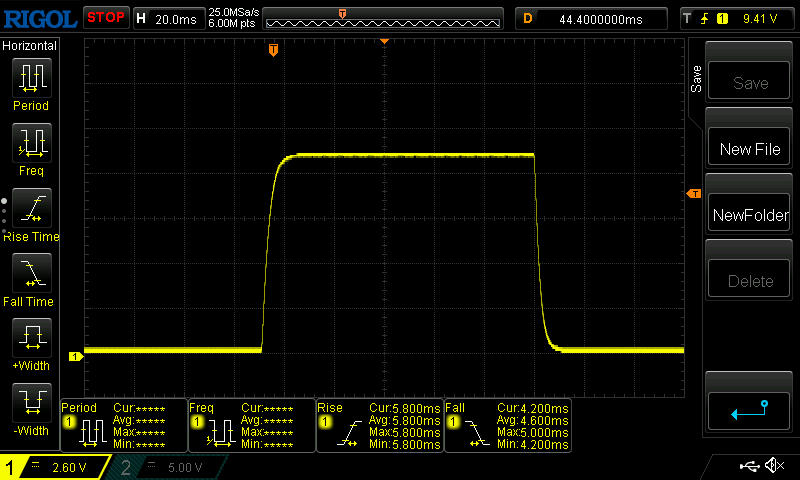 |
| ↘ 4.6 ms chute | ||
| L'écran montre de bons temps de réponse, mais insuffisant pour du jeu compétitif. En comparaison, tous les appareils testés affichent entre 0.1 (minimum) et 240 (maximum) ms. » 28 % des appareils testés affichent de meilleures performances. Cela signifie que les latences relevées sont meilleures que la moyenne (19.9 ms) de tous les appareils testés. | ||
| ↔ Temps de réponse gris 50% à gris 80% | ||
| 7.6 ms ... hausse ↗ et chute ↘ combinées | ↗ 3.8 ms hausse | 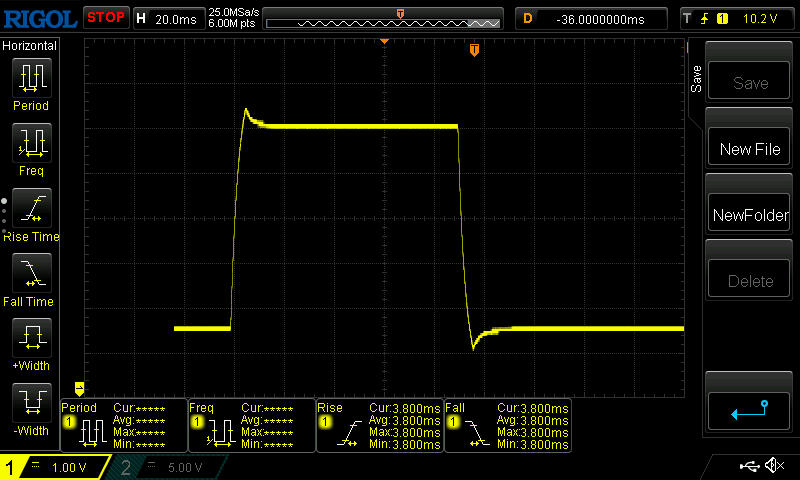 |
| ↘ 3.8 ms chute | ||
| L'écran montre de très faibles temps de réponse, parfait pour le jeu. En comparaison, tous les appareils testés affichent entre 0.165 (minimum) et 636 (maximum) ms. » 20 % des appareils testés affichent de meilleures performances. Cela signifie que les latences relevées sont meilleures que la moyenne (31.1 ms) de tous les appareils testés. | ||
Scintillement / MLI (Modulation de largeur d'impulsion)
| Scintillement / MLI (Modulation de largeur d'impulsion) non décelé |  | ||
En comparaison, 52 % des appareils testés n'emploient pas MDI pour assombrir leur écran. Nous avons relevé une moyenne à 7784 (minimum : 5 - maximum : 343500) Hz dans le cas où une MDI était active. | |||
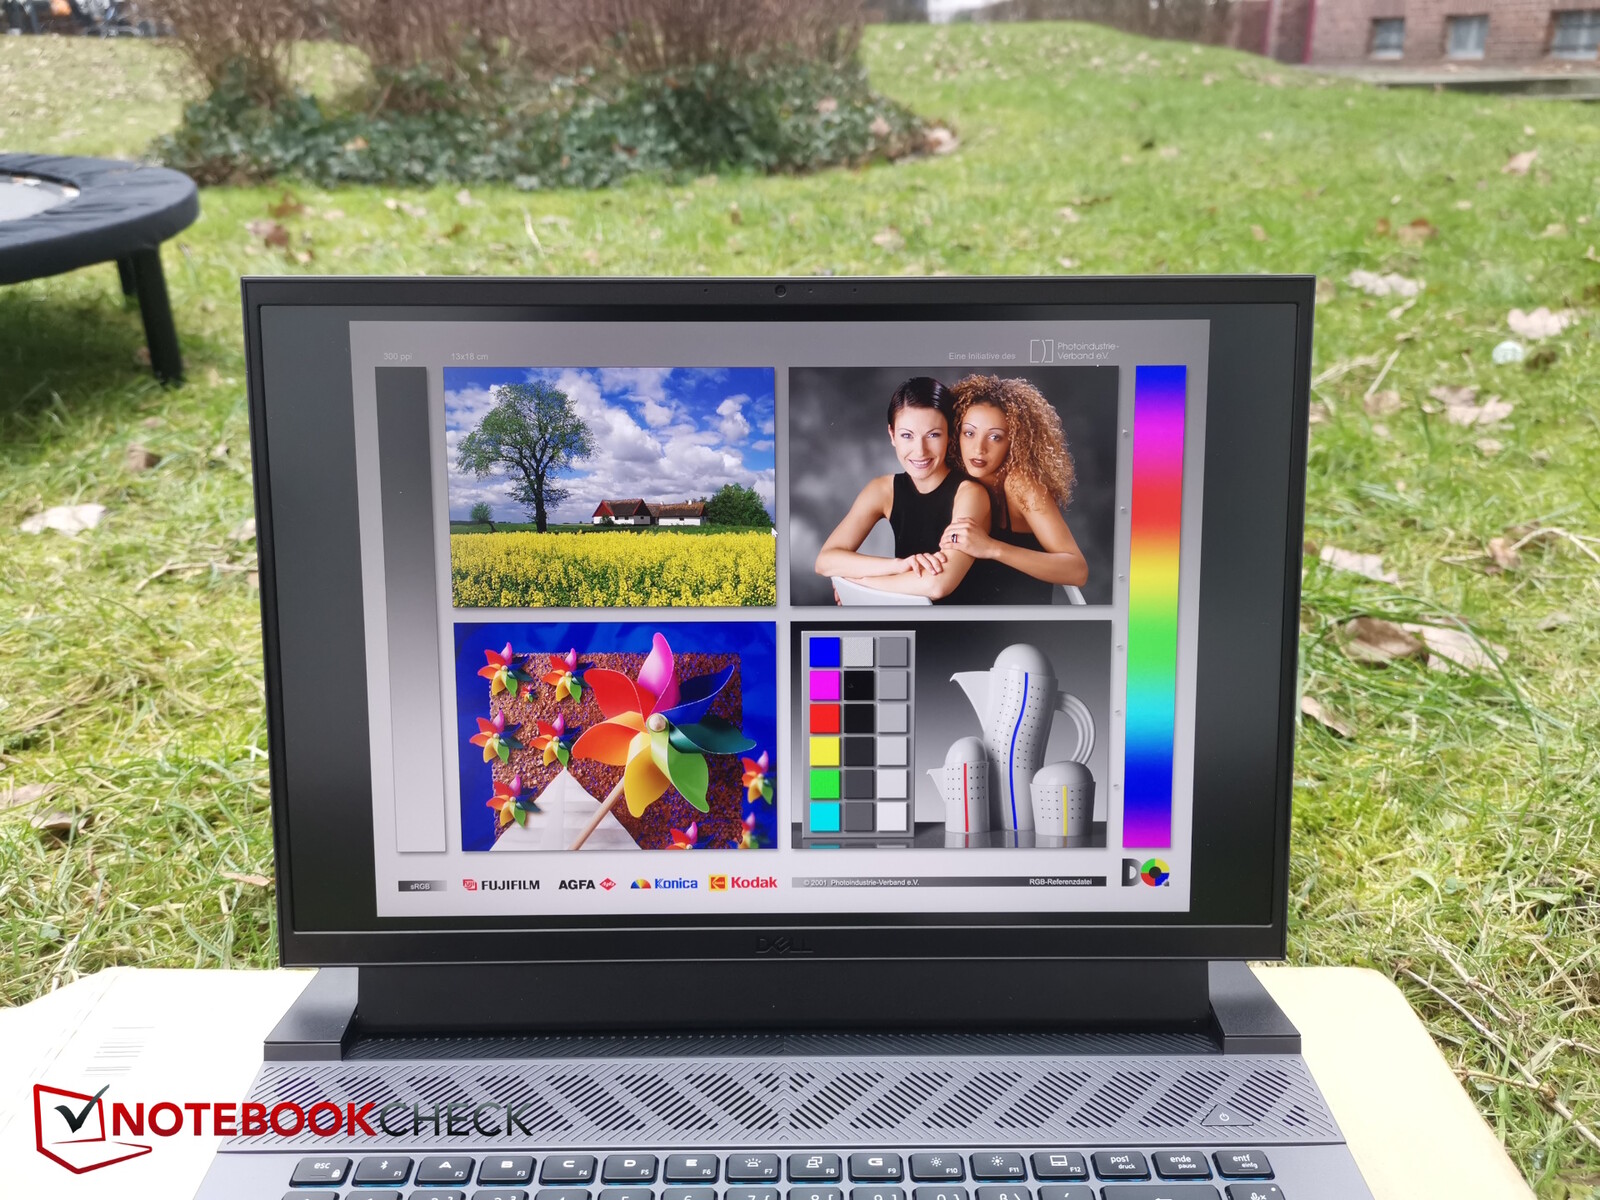
L'écran est suffisamment lumineux pour être utilisé à l'extérieur, du moins dans un environnement ombragé, et sa surface mate élimine la plupart des reflets importants.


Performance - Le G16 est conforme aux attentes
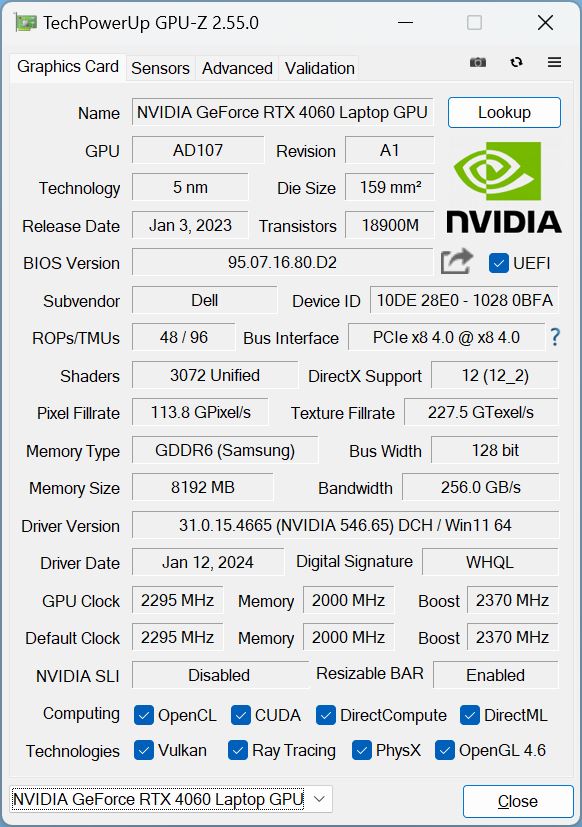
Le Dell G16 est un ordinateur portable de jeu typique, de budget à milieu de gamme. Son processeur est le Intel Core i7-13650HX ( ) et il est équipé d'une carte RTX 4060 à 140 watts, 16 Go de RAM et un SSD NVMe de 1 To. Par conséquent, la plupart des jeux actuels devraient être jouables en Full HD. L'écran 16:10 de bonne qualité complète la configuration matérielle de l'ordinateur portable.
Conditions d'essai
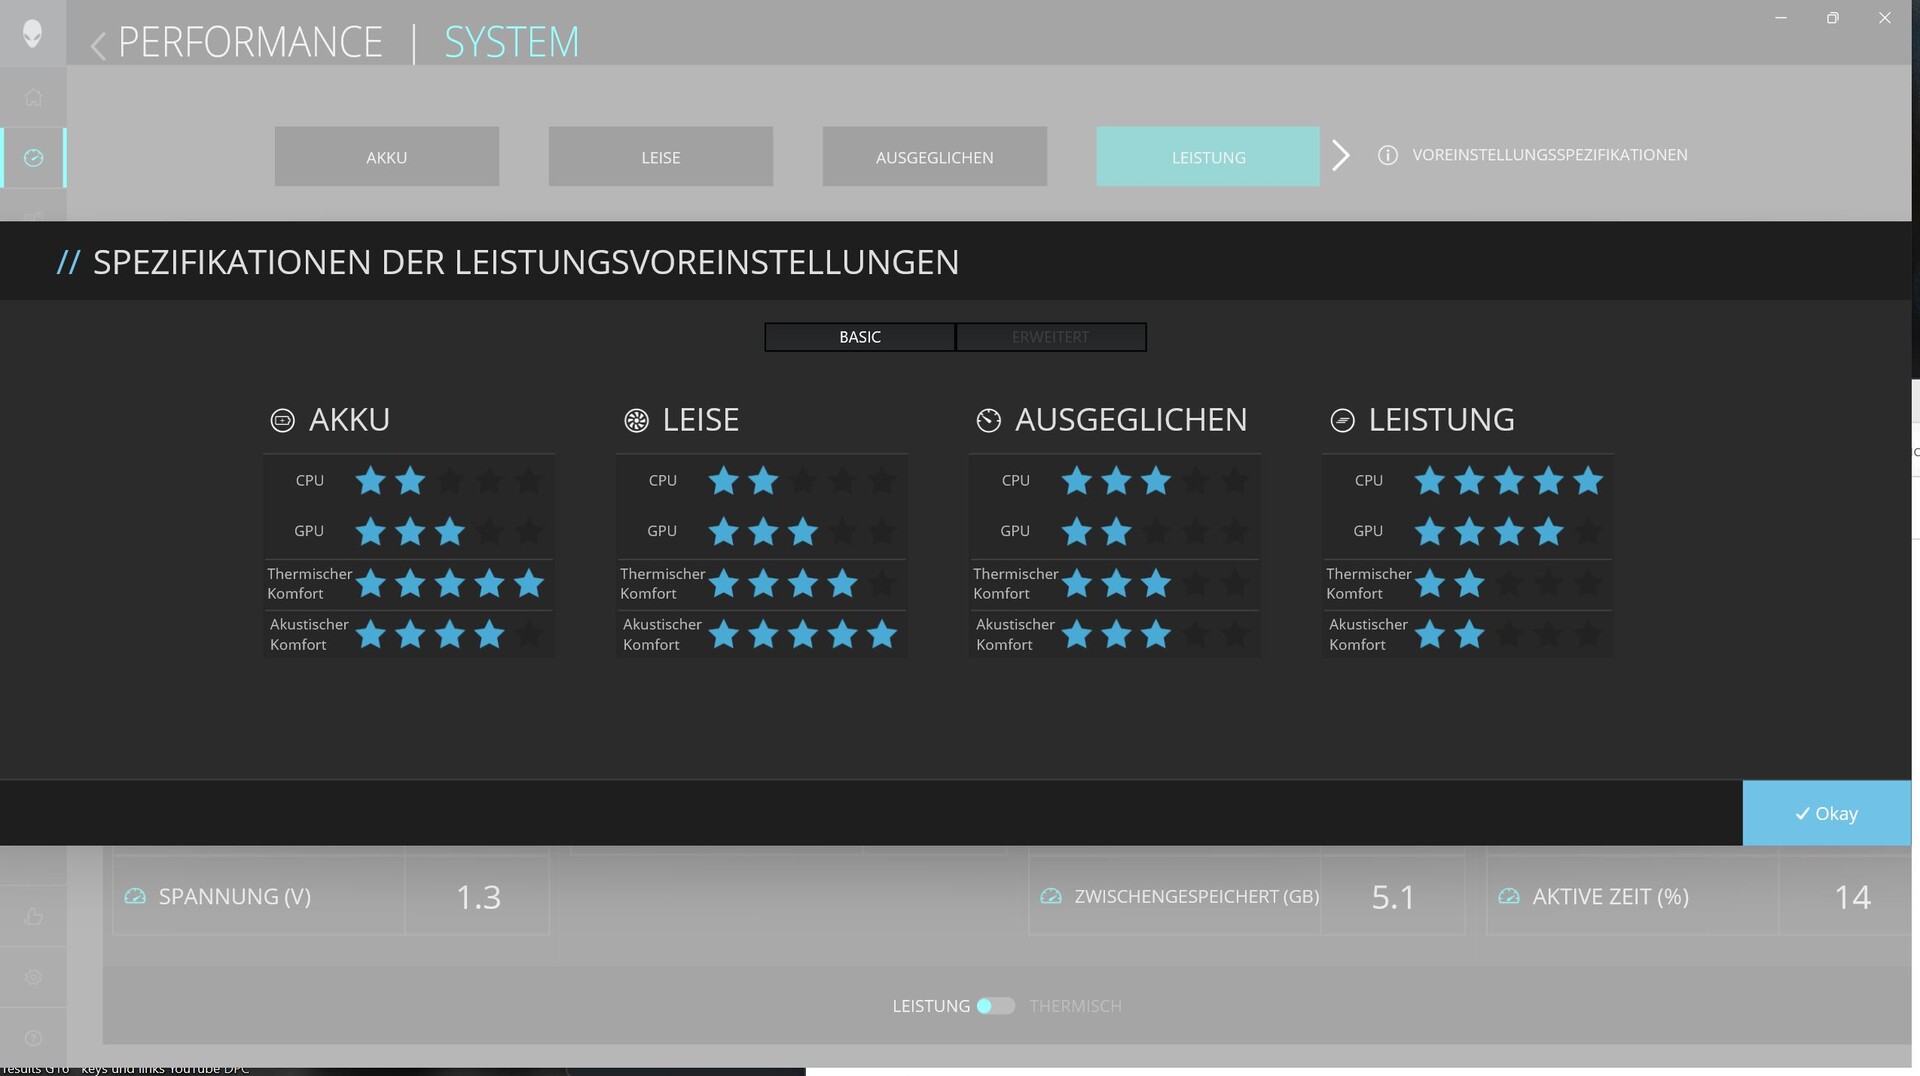
Dell a préinstallé au moins deux applications (voir McAffee) sur le G16. L'une est My Dell, qui est également préinstallée sur les modèles non destinés aux jeux, et l'autre est Alienware Command Center sur les modèles Alienware. My Dell comprend les services, les mises à jour, etc., tandis que le Command Center vous permet de définir différents modes de performance(batterie, silencieux, équilibré, performance, manuel), l'éclairage des touches et d'autres options.
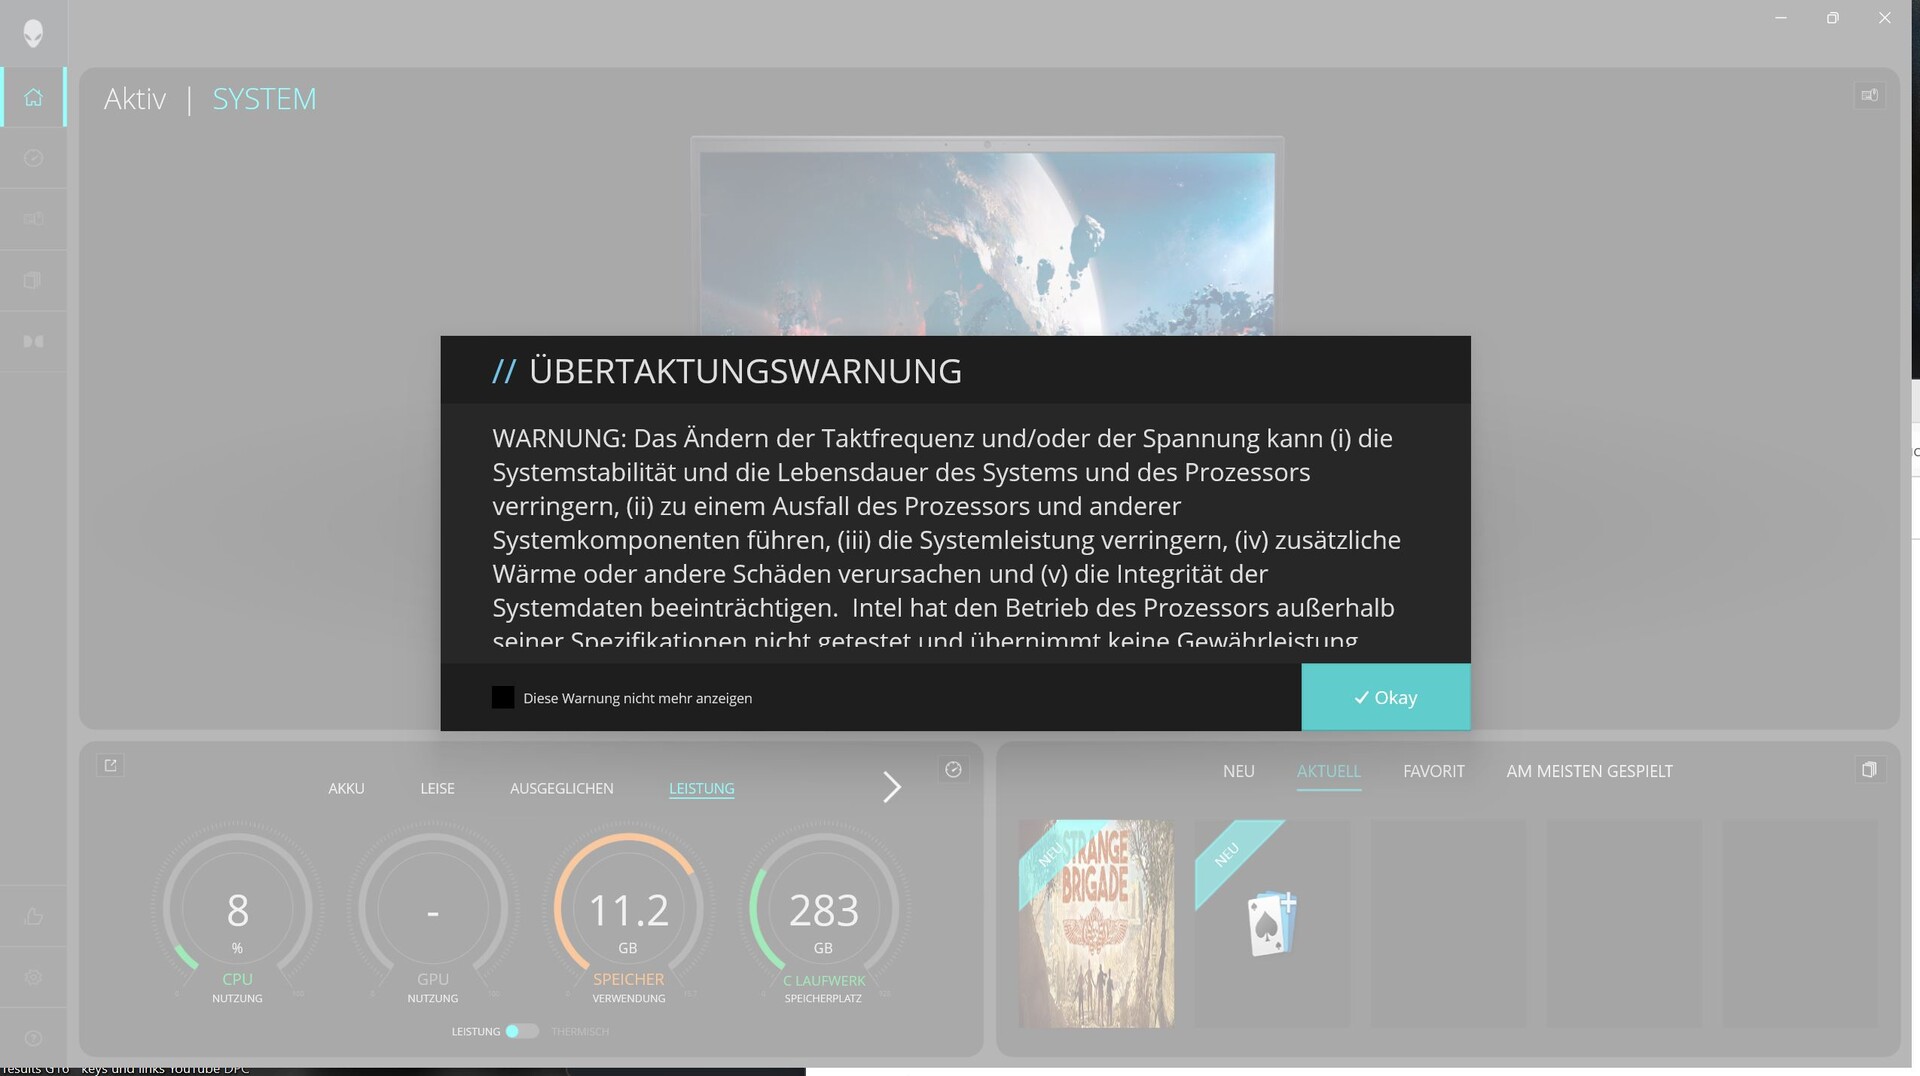
Malgré de nombreuses années de développement, le Command Center n'est pas encore tout à fait au point. Par exemple, la fenêtre ne peut pas être maximisée correctement ; vous pouvez toujours voir le bureau en bas.
Un autre bogue probable est que nous recevons un avertissement dès que nous passons en mode performance. C'est très inquiétant, car cela suggère que la garantie pourrait être annulée si le matériel est utilisé en dehors des spécifications recommandées. Cependant, nous soupçonnons que l'avertissement se réfère au mode manuel, et non au mode performance spécifié par Dell lui-même - très déroutant !
Ce qui est ennuyeux, c'est que McAffee est non seulement préinstallé, mais que Dell nous envoie régulièrement un message nous demandant d'utiliser ce service (nous l'avons désinstallé) et que ce message revient tous les jours au plus tard.


Processeur
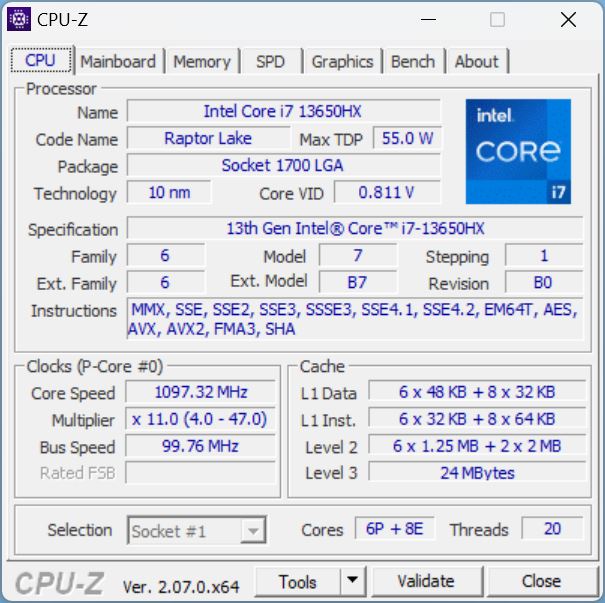
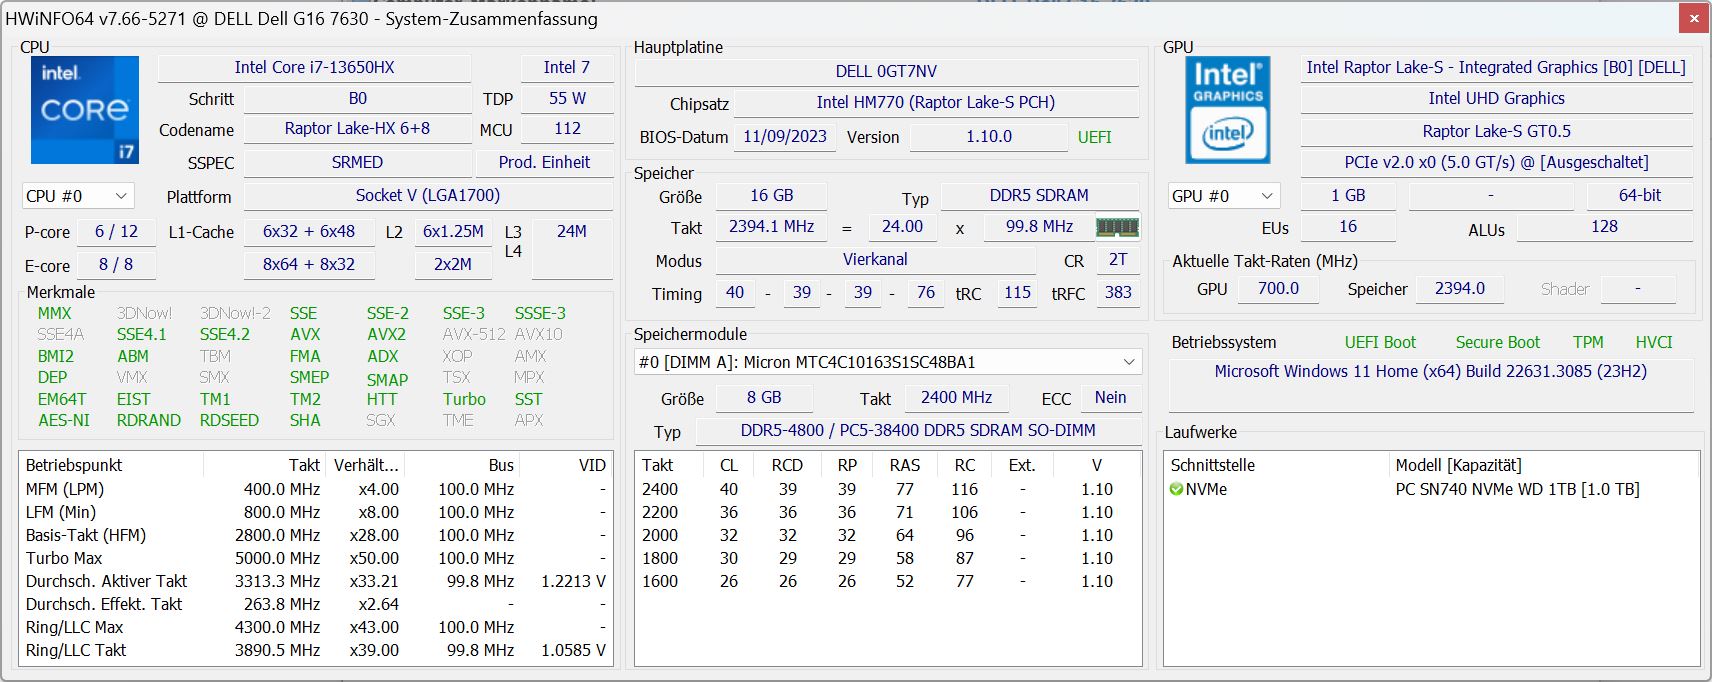
L'ordinateur portable Dell est équipé d'un processeur Raptor-Lake, le Intel Core i7-13650HX avec 14 cœurs (6 P, 8 E) et 20 threads. Les cœurs P peuvent atteindre individuellement une fréquence de 4,9 GHz et les cœurs d'efficacité une fréquence de base de 1,9 GHz. Vous ne pouvez obtenir que le plus puissant des processeurs i9-13900HX en combinaison avec la RTX 4070qui coûte un peu plus cher.
Pendant la boucle Cinebench-R15, le G16 a fonctionné à des niveaux de performance élevés et constants sans souffrir d'aucune perte de performance après les premières exécutions.
Dans tous nos benchmarks CPU, l'i7-13650HX a atteint le niveau attendu et a été 15 à 19 % plus rapide que l'i7-12700HX i7-12700H du prédécesseur de l'appareil.
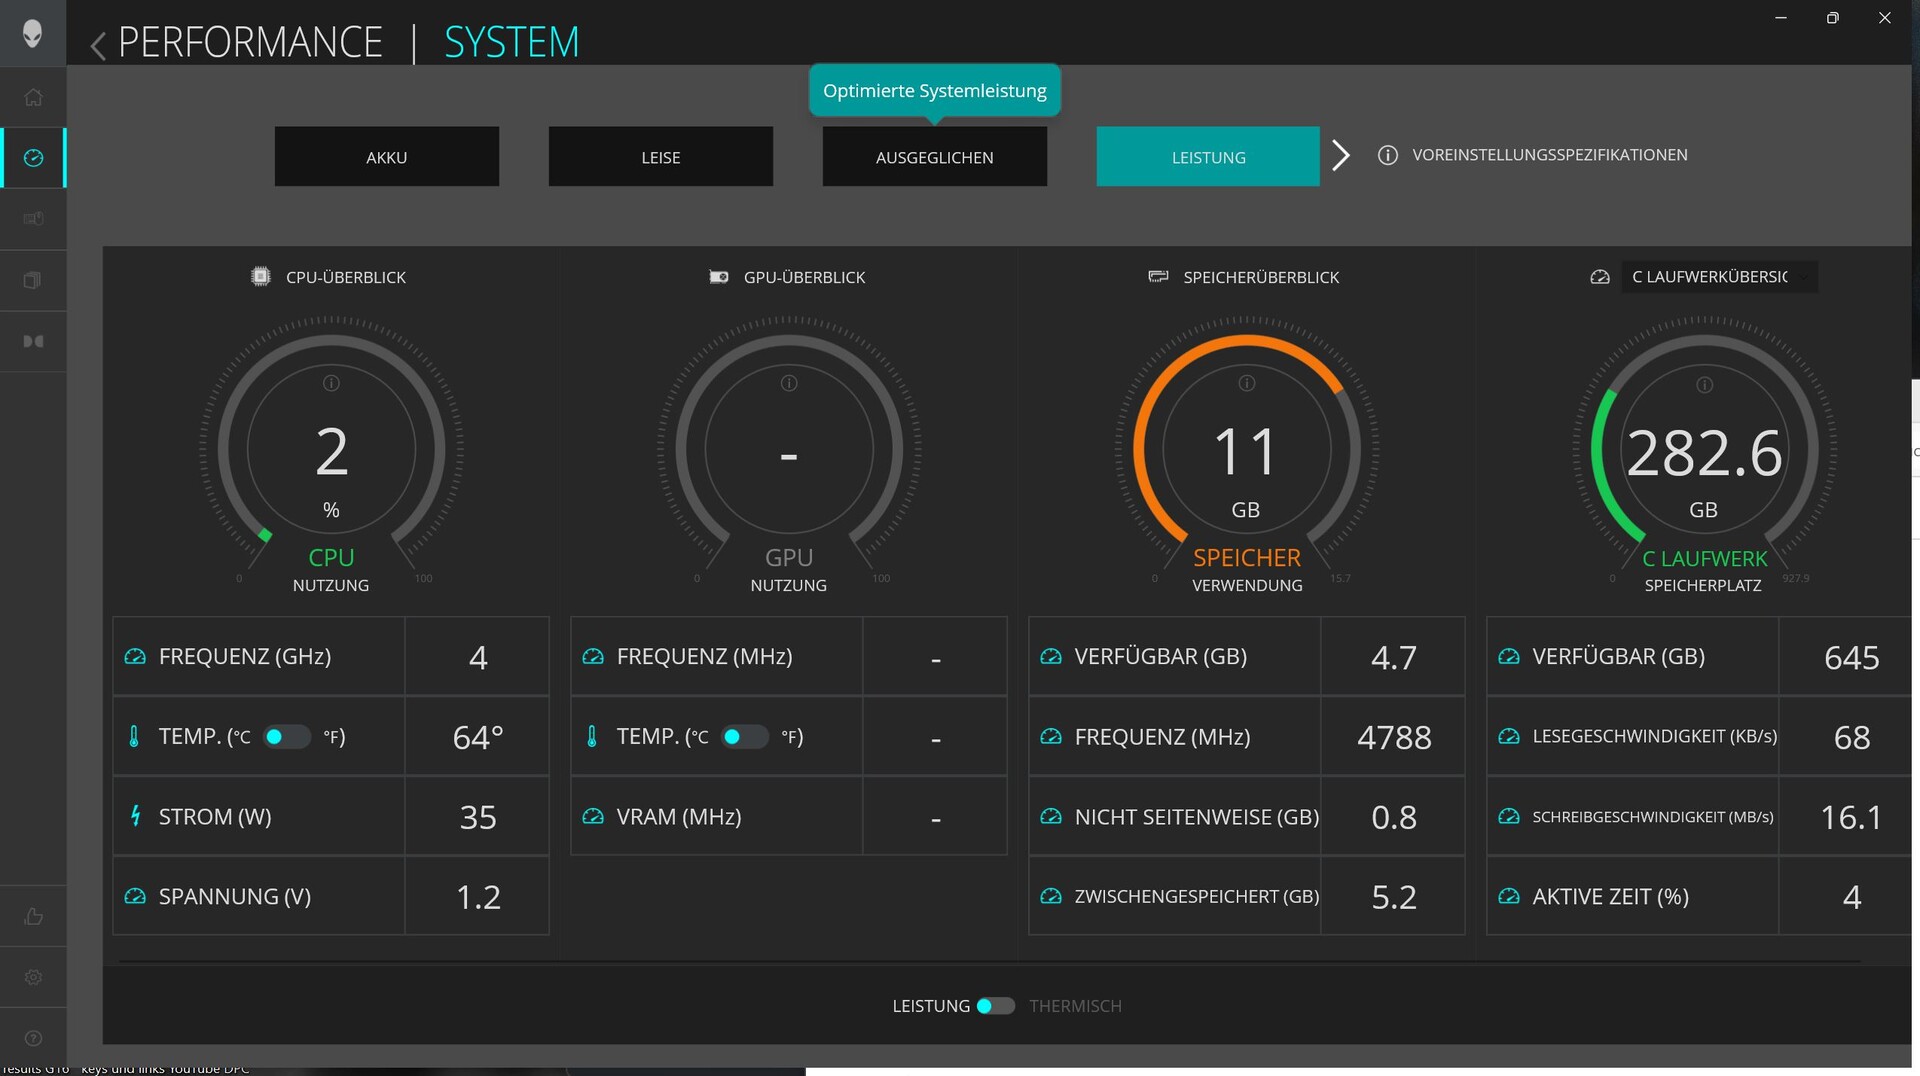
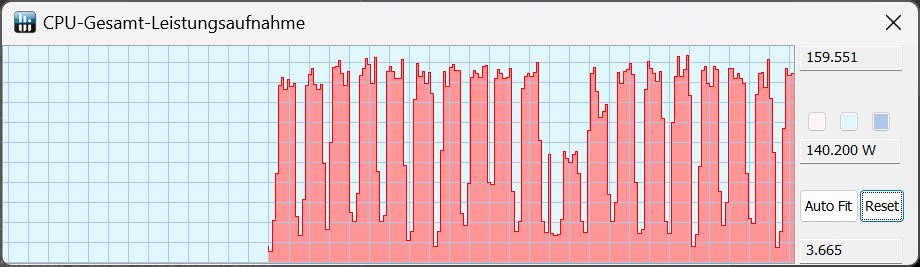
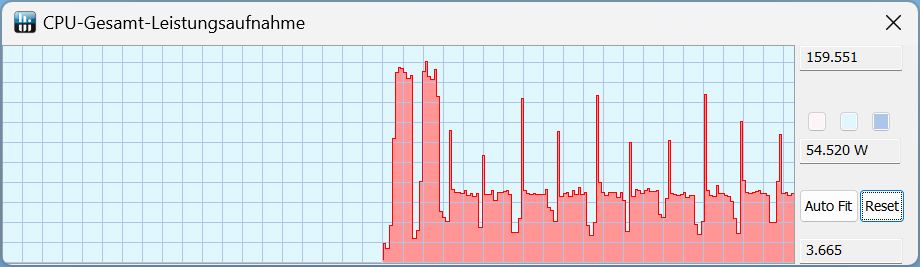
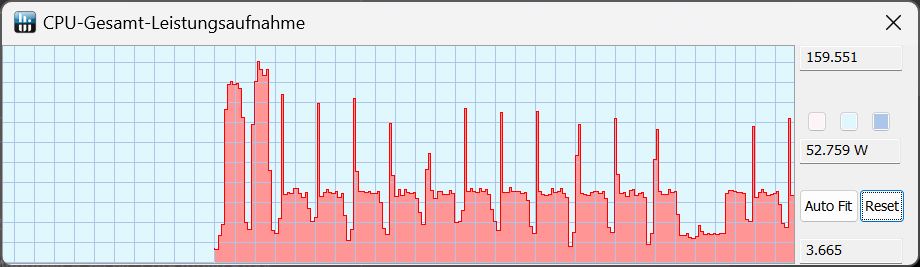
En utilisant les modes performance, équilibré et silencieux, l'ordinateur portable a atteint des valeurs de consommation d'énergie de 159 watts au début d'une exécution Cinebench, résultant en un score identique en utilisant tous les modes lorsqu'ils sont mesurés une seule fois. Au cours de la suite de la course, ce TDP n'est resté constant qu'en utilisant le mode performance. Dans tous les autres modes, le TDP a chuté à environ 50 watts à partir de la deuxième exécution.
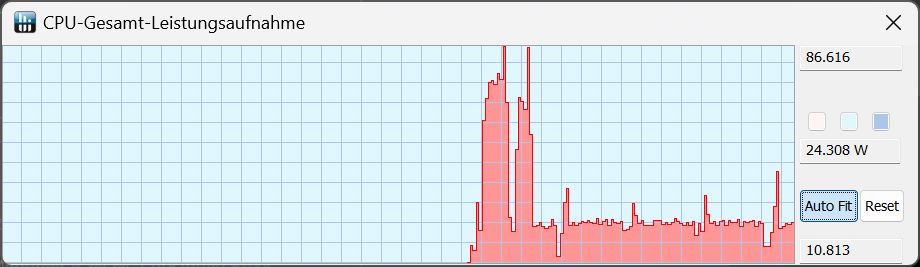
Si vous débranchez l'ordinateur portable, le système passe automatiquement en mode batterie. Il n'a atteint qu'un TDP de 86 watts pendant Cinebench R15 Multi, et après le premier essai, le TDP a chuté à seulement 24 watts.
Cinebench R15 Multi continuous test
Cinebench R23: Multi Core | Single Core
Cinebench R20: CPU (Multi Core) | CPU (Single Core)
Cinebench R15: CPU Multi 64Bit | CPU Single 64Bit
Blender: v2.79 BMW27 CPU
7-Zip 18.03: 7z b 4 | 7z b 4 -mmt1
Geekbench 6.7: Multi-Core | Single-Core
Geekbench 5.5: Multi-Core | Single-Core
HWBOT x265 Benchmark v2.2: 4k Preset
LibreOffice : 20 Documents To PDF
R Benchmark 2.5: Overall mean
| CPU Performance rating | |
| MSI Raider GE68HX 13VF | |
| Moyenne de la classe Gaming | |
| Alienware m16 R1 Intel | |
| Moyenne Intel Core i7-13650HX | |
| Dell G16, i7-13650HX, RTX 4060 | |
| Lenovo Legion Slim 5 16APH8 -2! | |
| Lenovo LOQ 16IRH8 | |
| Dell G16 7620 -2! | |
| Cinebench R23 / Multi Core | |
| MSI Raider GE68HX 13VF | |
| Moyenne de la classe Gaming (10488 - 40970, n=110, 2 dernières années) | |
| Alienware m16 R1 Intel | |
| Dell G16, i7-13650HX, RTX 4060 | |
| Moyenne Intel Core i7-13650HX (18744 - 21006, n=6) | |
| Dell G16 7620 | |
| Lenovo Legion Slim 5 16APH8 | |
| Lenovo LOQ 16IRH8 | |
| Cinebench R23 / Single Core | |
| MSI Raider GE68HX 13VF | |
| Moyenne de la classe Gaming (1166 - 2356, n=110, 2 dernières années) | |
| Alienware m16 R1 Intel | |
| Dell G16, i7-13650HX, RTX 4060 | |
| Lenovo LOQ 16IRH8 | |
| Moyenne Intel Core i7-13650HX (1693 - 1903, n=6) | |
| Lenovo Legion Slim 5 16APH8 | |
| Dell G16 7620 | |
| Cinebench R20 / CPU (Multi Core) | |
| MSI Raider GE68HX 13VF | |
| Moyenne de la classe Gaming (4029 - 16108, n=109, 2 dernières années) | |
| Alienware m16 R1 Intel | |
| Dell G16, i7-13650HX, RTX 4060 | |
| Moyenne Intel Core i7-13650HX (7197 - 8021, n=5) | |
| Lenovo Legion Slim 5 16APH8 | |
| Dell G16 7620 | |
| Lenovo LOQ 16IRH8 | |
| Cinebench R20 / CPU (Single Core) | |
| MSI Raider GE68HX 13VF | |
| Moyenne de la classe Gaming (442 - 895, n=109, 2 dernières années) | |
| Alienware m16 R1 Intel | |
| Dell G16, i7-13650HX, RTX 4060 | |
| Moyenne Intel Core i7-13650HX (700 - 728, n=5) | |
| Lenovo LOQ 16IRH8 | |
| Lenovo Legion Slim 5 16APH8 | |
| Dell G16 7620 | |
| Cinebench R15 / CPU Multi 64Bit | |
| MSI Raider GE68HX 13VF | |
| Moyenne de la classe Gaming (1578 - 6271, n=109, 2 dernières années) | |
| Alienware m16 R1 Intel | |
| Moyenne Intel Core i7-13650HX (2864 - 3147, n=5) | |
| Dell G16, i7-13650HX, RTX 4060 | |
| Lenovo Legion Slim 5 16APH8 | |
| Dell G16 7620 | |
| Lenovo LOQ 16IRH8 | |
| Cinebench R15 / CPU Single 64Bit | |
| MSI Raider GE68HX 13VF | |
| Moyenne de la classe Gaming (188.8 - 343, n=109, 2 dernières années) | |
| Lenovo Legion Slim 5 16APH8 | |
| Alienware m16 R1 Intel | |
| Dell G16, i7-13650HX, RTX 4060 | |
| Moyenne Intel Core i7-13650HX (256 - 275, n=5) | |
| Lenovo LOQ 16IRH8 | |
| Dell G16 7620 | |
| Blender / v2.79 BMW27 CPU | |
| Lenovo LOQ 16IRH8 | |
| Lenovo Legion Slim 5 16APH8 | |
| Dell G16 7620 | |
| Moyenne Intel Core i7-13650HX (158 - 226, n=5) | |
| Dell G16, i7-13650HX, RTX 4060 | |
| Alienware m16 R1 Intel | |
| Moyenne de la classe Gaming (80 - 330, n=107, 2 dernières années) | |
| MSI Raider GE68HX 13VF | |
| 7-Zip 18.03 / 7z b 4 | |
| MSI Raider GE68HX 13VF | |
| Moyenne de la classe Gaming (33491 - 148086, n=108, 2 dernières années) | |
| Alienware m16 R1 Intel | |
| Moyenne Intel Core i7-13650HX (73927 - 80057, n=5) | |
| Dell G16, i7-13650HX, RTX 4060 | |
| Lenovo Legion Slim 5 16APH8 | |
| Dell G16 7620 | |
| Lenovo LOQ 16IRH8 | |
| 7-Zip 18.03 / 7z b 4 -mmt1 | |
| MSI Raider GE68HX 13VF | |
| Lenovo Legion Slim 5 16APH8 | |
| Alienware m16 R1 Intel | |
| Moyenne de la classe Gaming (4199 - 7436, n=108, 2 dernières années) | |
| Moyenne Intel Core i7-13650HX (5828 - 6125, n=5) | |
| Dell G16, i7-13650HX, RTX 4060 | |
| Lenovo LOQ 16IRH8 | |
| Dell G16 7620 | |
| Geekbench 6.7 / Multi-Core | |
| MSI Raider GE68HX 13VF | |
| Moyenne de la classe Gaming (6625 - 22104, n=109, 2 dernières années) | |
| Alienware m16 R1 Intel | |
| Moyenne Intel Core i7-13650HX (13554 - 14378, n=3) | |
| Dell G16, i7-13650HX, RTX 4060 | |
| Lenovo LOQ 16IRH8 | |
| Geekbench 6.7 / Single-Core | |
| MSI Raider GE68HX 13VF | |
| Moyenne de la classe Gaming (1490 - 3259, n=109, 2 dernières années) | |
| Alienware m16 R1 Intel | |
| Lenovo LOQ 16IRH8 | |
| Dell G16, i7-13650HX, RTX 4060 | |
| Moyenne Intel Core i7-13650HX (2505 - 2595, n=3) | |
| Geekbench 5.5 / Multi-Core | |
| MSI Raider GE68HX 13VF | |
| Moyenne de la classe Gaming (6460 - 27010, n=108, 2 dernières années) | |
| Alienware m16 R1 Intel | |
| Moyenne Intel Core i7-13650HX (12509 - 14778, n=5) | |
| Dell G16, i7-13650HX, RTX 4060 | |
| Lenovo LOQ 16IRH8 | |
| Dell G16 7620 | |
| Lenovo Legion Slim 5 16APH8 | |
| Geekbench 5.5 / Single-Core | |
| MSI Raider GE68HX 13VF | |
| Moyenne de la classe Gaming (986 - 2474, n=108, 2 dernières années) | |
| Lenovo Legion Slim 5 16APH8 | |
| Dell G16, i7-13650HX, RTX 4060 | |
| Alienware m16 R1 Intel | |
| Moyenne Intel Core i7-13650HX (1810 - 1866, n=5) | |
| Lenovo LOQ 16IRH8 | |
| Dell G16 7620 | |
| HWBOT x265 Benchmark v2.2 / 4k Preset | |
| MSI Raider GE68HX 13VF | |
| Moyenne de la classe Gaming (11.5 - 44.3, n=108, 2 dernières années) | |
| Alienware m16 R1 Intel | |
| Lenovo Legion Slim 5 16APH8 | |
| Moyenne Intel Core i7-13650HX (18.9 - 23.6, n=5) | |
| Dell G16, i7-13650HX, RTX 4060 | |
| Dell G16 7620 | |
| Lenovo LOQ 16IRH8 | |
| LibreOffice / 20 Documents To PDF | |
| Dell G16 7620 | |
| Dell G16, i7-13650HX, RTX 4060 | |
| Moyenne de la classe Gaming (19 - 88.8, n=108, 2 dernières années) | |
| Moyenne Intel Core i7-13650HX (38.9 - 58.8, n=5) | |
| Lenovo LOQ 16IRH8 | |
| Alienware m16 R1 Intel | |
| Lenovo Legion Slim 5 16APH8 | |
| MSI Raider GE68HX 13VF | |
| R Benchmark 2.5 / Overall mean | |
| Dell G16 7620 | |
| Lenovo LOQ 16IRH8 | |
| Alienware m16 R1 Intel | |
| Lenovo Legion Slim 5 16APH8 | |
| Moyenne Intel Core i7-13650HX (0.4217 - 0.4461, n=6) | |
| Moyenne de la classe Gaming (0.3439 - 0.759, n=109, 2 dernières années) | |
| Dell G16, i7-13650HX, RTX 4060 | |
| Dell G16, i7-13650HX, RTX 4060 | |
| MSI Raider GE68HX 13VF | |
* ... Moindre est la valeur, meilleures sont les performances
AIDA64: FP32 Ray-Trace | FPU Julia | CPU SHA3 | CPU Queen | FPU SinJulia | FPU Mandel | CPU AES | CPU ZLib | FP64 Ray-Trace | CPU PhotoWorxx
| Performance rating | |
| MSI Raider GE68HX 13VF | |
| Moyenne de la classe Gaming | |
| Lenovo Legion Slim 5 16APH8 | |
| Alienware m16 R1 Intel | |
| Dell G16, i7-13650HX, RTX 4060 | |
| Moyenne Intel Core i7-13650HX | |
| Dell G16 7620 | |
| Lenovo LOQ 16IRH8 | |
| AIDA64 / FP32 Ray-Trace | |
| Moyenne de la classe Gaming (10227 - 85542, n=107, 2 dernières années) | |
| Lenovo Legion Slim 5 16APH8 | |
| MSI Raider GE68HX 13VF | |
| Alienware m16 R1 Intel | |
| Dell G16, i7-13650HX, RTX 4060 | |
| Moyenne Intel Core i7-13650HX (13404 - 20012, n=5) | |
| Dell G16 7620 | |
| Lenovo LOQ 16IRH8 | |
| AIDA64 / FPU Julia | |
| MSI Raider GE68HX 13VF | |
| Moyenne de la classe Gaming (51376 - 238426, n=107, 2 dernières années) | |
| Lenovo Legion Slim 5 16APH8 | |
| Alienware m16 R1 Intel | |
| Dell G16, i7-13650HX, RTX 4060 | |
| Moyenne Intel Core i7-13650HX (68241 - 97317, n=5) | |
| Dell G16 7620 | |
| Lenovo LOQ 16IRH8 | |
| AIDA64 / CPU SHA3 | |
| MSI Raider GE68HX 13VF | |
| Moyenne de la classe Gaming (2180 - 9817, n=107, 2 dernières années) | |
| Lenovo Legion Slim 5 16APH8 | |
| Alienware m16 R1 Intel | |
| Dell G16, i7-13650HX, RTX 4060 | |
| Moyenne Intel Core i7-13650HX (3127 - 4487, n=5) | |
| Dell G16 7620 | |
| Lenovo LOQ 16IRH8 | |
| AIDA64 / CPU Queen | |
| MSI Raider GE68HX 13VF | |
| Lenovo Legion Slim 5 16APH8 | |
| Moyenne de la classe Gaming (49785 - 173351, n=98, 2 dernières années) | |
| Alienware m16 R1 Intel | |
| Moyenne Intel Core i7-13650HX (108627 - 110589, n=5) | |
| Dell G16, i7-13650HX, RTX 4060 | |
| Dell G16 7620 | |
| Lenovo LOQ 16IRH8 | |
| AIDA64 / FPU SinJulia | |
| MSI Raider GE68HX 13VF | |
| Lenovo Legion Slim 5 16APH8 | |
| Moyenne de la classe Gaming (4424 - 33636, n=107, 2 dernières années) | |
| Alienware m16 R1 Intel | |
| Dell G16, i7-13650HX, RTX 4060 | |
| Moyenne Intel Core i7-13650HX (9134 - 10887, n=5) | |
| Dell G16 7620 | |
| Lenovo LOQ 16IRH8 | |
| AIDA64 / FPU Mandel | |
| Moyenne de la classe Gaming (25115 - 128721, n=107, 2 dernières années) | |
| MSI Raider GE68HX 13VF | |
| Lenovo Legion Slim 5 16APH8 | |
| Alienware m16 R1 Intel | |
| Dell G16, i7-13650HX, RTX 4060 | |
| Moyenne Intel Core i7-13650HX (33391 - 48323, n=5) | |
| Dell G16 7620 | |
| Lenovo LOQ 16IRH8 | |
| AIDA64 / CPU AES | |
| Alienware m16 R1 Intel | |
| MSI Raider GE68HX 13VF | |
| Moyenne de la classe Gaming (39258 - 247074, n=107, 2 dernières années) | |
| Dell G16, i7-13650HX, RTX 4060 | |
| Moyenne Intel Core i7-13650HX (64436 - 85343, n=5) | |
| Dell G16 7620 | |
| Lenovo Legion Slim 5 16APH8 | |
| Lenovo LOQ 16IRH8 | |
| AIDA64 / CPU ZLib | |
| MSI Raider GE68HX 13VF | |
| Moyenne de la classe Gaming (574 - 2531, n=107, 2 dernières années) | |
| Alienware m16 R1 Intel | |
| Dell G16, i7-13650HX, RTX 4060 | |
| Moyenne Intel Core i7-13650HX (1136 - 1285, n=5) | |
| Lenovo Legion Slim 5 16APH8 | |
| Dell G16 7620 | |
| Lenovo LOQ 16IRH8 | |
| AIDA64 / FP64 Ray-Trace | |
| Moyenne de la classe Gaming (5509 - 45446, n=107, 2 dernières années) | |
| Lenovo Legion Slim 5 16APH8 | |
| MSI Raider GE68HX 13VF | |
| Alienware m16 R1 Intel | |
| Dell G16, i7-13650HX, RTX 4060 | |
| Moyenne Intel Core i7-13650HX (7270 - 10900, n=5) | |
| Dell G16 7620 | |
| Lenovo LOQ 16IRH8 | |
| AIDA64 / CPU PhotoWorxx | |
| MSI Raider GE68HX 13VF | |
| Moyenne de la classe Gaming (12271 - 89891, n=107, 2 dernières années) | |
| Moyenne Intel Core i7-13650HX (36170 - 43289, n=5) | |
| Dell G16, i7-13650HX, RTX 4060 | |
| Alienware m16 R1 Intel | |
| Dell G16 7620 | |
| Lenovo LOQ 16IRH8 | |
| Lenovo Legion Slim 5 16APH8 | |
Performance du système
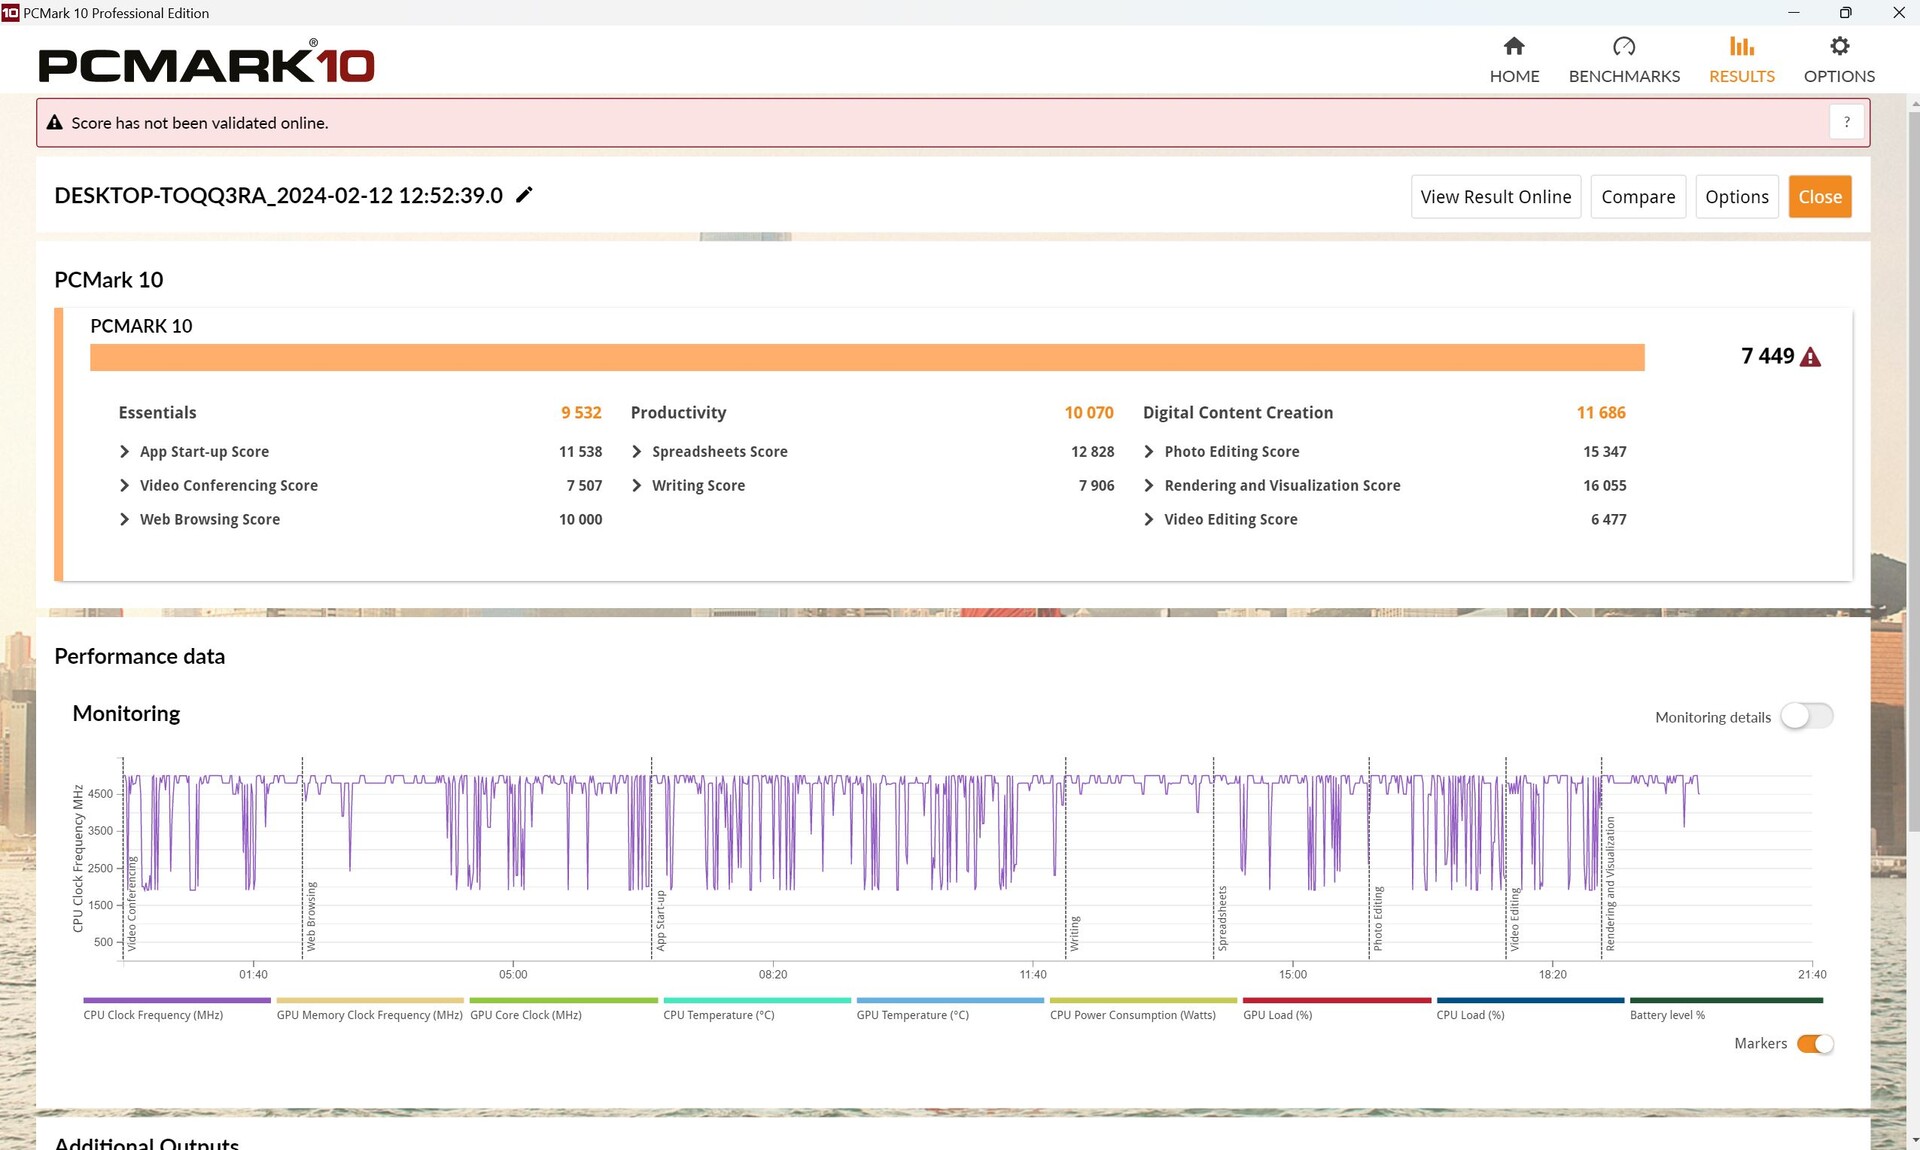
Le G16 s'est généralement bien comporté dans PCMark 10, mais il a montré quelques faiblesses dans le sous-test Essentials. Il en va de même pour le test de productivité de CrossMark. Dans tous les tests, notre modèle de test a réussi à se placer légèrement au-dessus de tous les ordinateurs portables de notre base de données qui présentent la même configuration CPU/GPU, de sorte que ces valeurs aberrantes ne sont pas trop significatives.
CrossMark: Overall | Productivity | Creativity | Responsiveness
WebXPRT 3: Overall
WebXPRT 4: Overall
Mozilla Kraken 1.1: Total
| PCMark 10 / Score | |
| Moyenne de la classe Gaming (5828 - 11574, n=94, 2 dernières années) | |
| MSI Raider GE68HX 13VF | |
| Lenovo Legion Slim 5 16APH8 | |
| Dell G16, i7-13650HX, RTX 4060 | |
| Moyenne Intel Core i7-13650HX, NVIDIA GeForce RTX 4060 Laptop GPU (6984 - 7613, n=3) | |
| Alienware m16 R1 Intel | |
| Dell G16 7620 | |
| Lenovo LOQ 16IRH8 | |
| PCMark 10 / Essentials | |
| MSI Raider GE68HX 13VF | |
| Lenovo Legion Slim 5 16APH8 | |
| Alienware m16 R1 Intel | |
| Moyenne de la classe Gaming (8810 - 12600, n=98, 2 dernières années) | |
| Moyenne Intel Core i7-13650HX, NVIDIA GeForce RTX 4060 Laptop GPU (9532 - 11151, n=3) | |
| Dell G16 7620 | |
| Lenovo LOQ 16IRH8 | |
| Dell G16, i7-13650HX, RTX 4060 | |
| PCMark 10 / Productivity | |
| Moyenne de la classe Gaming (6845 - 18766, n=96, 2 dernières années) | |
| Lenovo Legion Slim 5 16APH8 | |
| Moyenne Intel Core i7-13650HX, NVIDIA GeForce RTX 4060 Laptop GPU (9961 - 10204, n=3) | |
| Dell G16, i7-13650HX, RTX 4060 | |
| MSI Raider GE68HX 13VF | |
| Alienware m16 R1 Intel | |
| Dell G16 7620 | |
| Lenovo LOQ 16IRH8 | |
| PCMark 10 / Digital Content Creation | |
| Moyenne de la classe Gaming (7602 - 19657, n=96, 2 dernières années) | |
| MSI Raider GE68HX 13VF | |
| Lenovo Legion Slim 5 16APH8 | |
| Dell G16, i7-13650HX, RTX 4060 | |
| Dell G16 7620 | |
| Moyenne Intel Core i7-13650HX, NVIDIA GeForce RTX 4060 Laptop GPU (8323 - 11686, n=3) | |
| Alienware m16 R1 Intel | |
| Lenovo LOQ 16IRH8 | |
| CrossMark / Overall | |
| Alienware m16 R1 Intel | |
| Moyenne de la classe Gaming (1366 - 2409, n=96, 2 dernières années) | |
| MSI Raider GE68HX 13VF | |
| Lenovo LOQ 16IRH8 | |
| Moyenne Intel Core i7-13650HX, NVIDIA GeForce RTX 4060 Laptop GPU (1839 - 1951, n=3) | |
| Dell G16, i7-13650HX, RTX 4060 | |
| Lenovo Legion Slim 5 16APH8 | |
| Dell G16 7620 | |
| CrossMark / Productivity | |
| Alienware m16 R1 Intel | |
| Lenovo LOQ 16IRH8 | |
| Moyenne de la classe Gaming (1386 - 2254, n=96, 2 dernières années) | |
| MSI Raider GE68HX 13VF | |
| Moyenne Intel Core i7-13650HX, NVIDIA GeForce RTX 4060 Laptop GPU (1730 - 1864, n=3) | |
| Lenovo Legion Slim 5 16APH8 | |
| Dell G16, i7-13650HX, RTX 4060 | |
| Dell G16 7620 | |
| CrossMark / Creativity | |
| MSI Raider GE68HX 13VF | |
| Alienware m16 R1 Intel | |
| Moyenne de la classe Gaming (1343 - 2729, n=96, 2 dernières années) | |
| Moyenne Intel Core i7-13650HX, NVIDIA GeForce RTX 4060 Laptop GPU (2020 - 2063, n=3) | |
| Lenovo LOQ 16IRH8 | |
| Dell G16, i7-13650HX, RTX 4060 | |
| Lenovo Legion Slim 5 16APH8 | |
| Dell G16 7620 | |
| CrossMark / Responsiveness | |
| Alienware m16 R1 Intel | |
| Lenovo LOQ 16IRH8 | |
| Moyenne Intel Core i7-13650HX, NVIDIA GeForce RTX 4060 Laptop GPU (1544 - 1907, n=3) | |
| Moyenne de la classe Gaming (1226 - 2334, n=96, 2 dernières années) | |
| Dell G16, i7-13650HX, RTX 4060 | |
| MSI Raider GE68HX 13VF | |
| Dell G16 7620 | |
| Lenovo Legion Slim 5 16APH8 | |
| WebXPRT 3 / Overall | |
| MSI Raider GE68HX 13VF | |
| Lenovo Legion Slim 5 16APH8 | |
| Lenovo LOQ 16IRH8 | |
| Lenovo LOQ 16IRH8 | |
| Moyenne de la classe Gaming (242 - 532, n=99, 2 dernières années) | |
| Alienware m16 R1 Intel | |
| Moyenne Intel Core i7-13650HX, NVIDIA GeForce RTX 4060 Laptop GPU (268 - 302, n=3) | |
| Dell G16 7620 | |
| Dell G16, i7-13650HX, RTX 4060 | |
| WebXPRT 4 / Overall | |
| MSI Raider GE68HX 13VF | |
| Moyenne de la classe Gaming (176.4 - 354, n=99, 2 dernières années) | |
| Alienware m16 R1 Intel | |
| Moyenne Intel Core i7-13650HX, NVIDIA GeForce RTX 4060 Laptop GPU (260 - 276, n=2) | |
| Lenovo Legion Slim 5 16APH8 | |
| Dell G16 7620 | |
| Mozilla Kraken 1.1 / Total | |
| Dell G16 7620 | |
| Moyenne Intel Core i7-13650HX, NVIDIA GeForce RTX 4060 Laptop GPU (507 - 511, n=3) | |
| Lenovo LOQ 16IRH8 | |
| Lenovo LOQ 16IRH8 | |
| Dell G16, i7-13650HX, RTX 4060 | |
| Alienware m16 R1 Intel | |
| Lenovo Legion Slim 5 16APH8 | |
| Moyenne de la classe Gaming (391 - 590, n=104, 2 dernières années) | |
| MSI Raider GE68HX 13VF | |
* ... Moindre est la valeur, meilleures sont les performances
| PCMark 10 Score | 7449 points | |
Aide | ||
| AIDA64 / Memory Copy | |
| MSI Raider GE68HX 13VF | |
| Moyenne de la classe Gaming (21750 - 129946, n=107, 2 dernières années) | |
| Lenovo Legion Slim 5 16APH8 | |
| Moyenne Intel Core i7-13650HX (59266 - 66372, n=5) | |
| Dell G16, i7-13650HX, RTX 4060 | |
| Alienware m16 R1 Intel | |
| Dell G16 7620 | |
| Lenovo LOQ 16IRH8 | |
| AIDA64 / Memory Read | |
| MSI Raider GE68HX 13VF | |
| Moyenne de la classe Gaming (22956 - 118858, n=107, 2 dernières années) | |
| Moyenne Intel Core i7-13650HX (67305 - 71022, n=5) | |
| Alienware m16 R1 Intel | |
| Dell G16, i7-13650HX, RTX 4060 | |
| Dell G16 7620 | |
| Lenovo LOQ 16IRH8 | |
| Lenovo Legion Slim 5 16APH8 | |
| AIDA64 / Memory Write | |
| Lenovo Legion Slim 5 16APH8 | |
| MSI Raider GE68HX 13VF | |
| Moyenne de la classe Gaming (22297 - 135096, n=107, 2 dernières années) | |
| Moyenne Intel Core i7-13650HX (58028 - 68225, n=5) | |
| Alienware m16 R1 Intel | |
| Dell G16, i7-13650HX, RTX 4060 | |
| Dell G16 7620 | |
| Lenovo LOQ 16IRH8 | |
| AIDA64 / Memory Latency | |
| Lenovo LOQ 16IRH8 | |
| Moyenne de la classe Gaming (75.3 - 259, n=107, 2 dernières années) | |
| Dell G16 7620 | |
| Lenovo Legion Slim 5 16APH8 | |
| Dell G16, i7-13650HX, RTX 4060 | |
| Moyenne Intel Core i7-13650HX (83.7 - 90.8, n=5) | |
| Alienware m16 R1 Intel | |
| MSI Raider GE68HX 13VF | |
* ... Moindre est la valeur, meilleures sont les performances
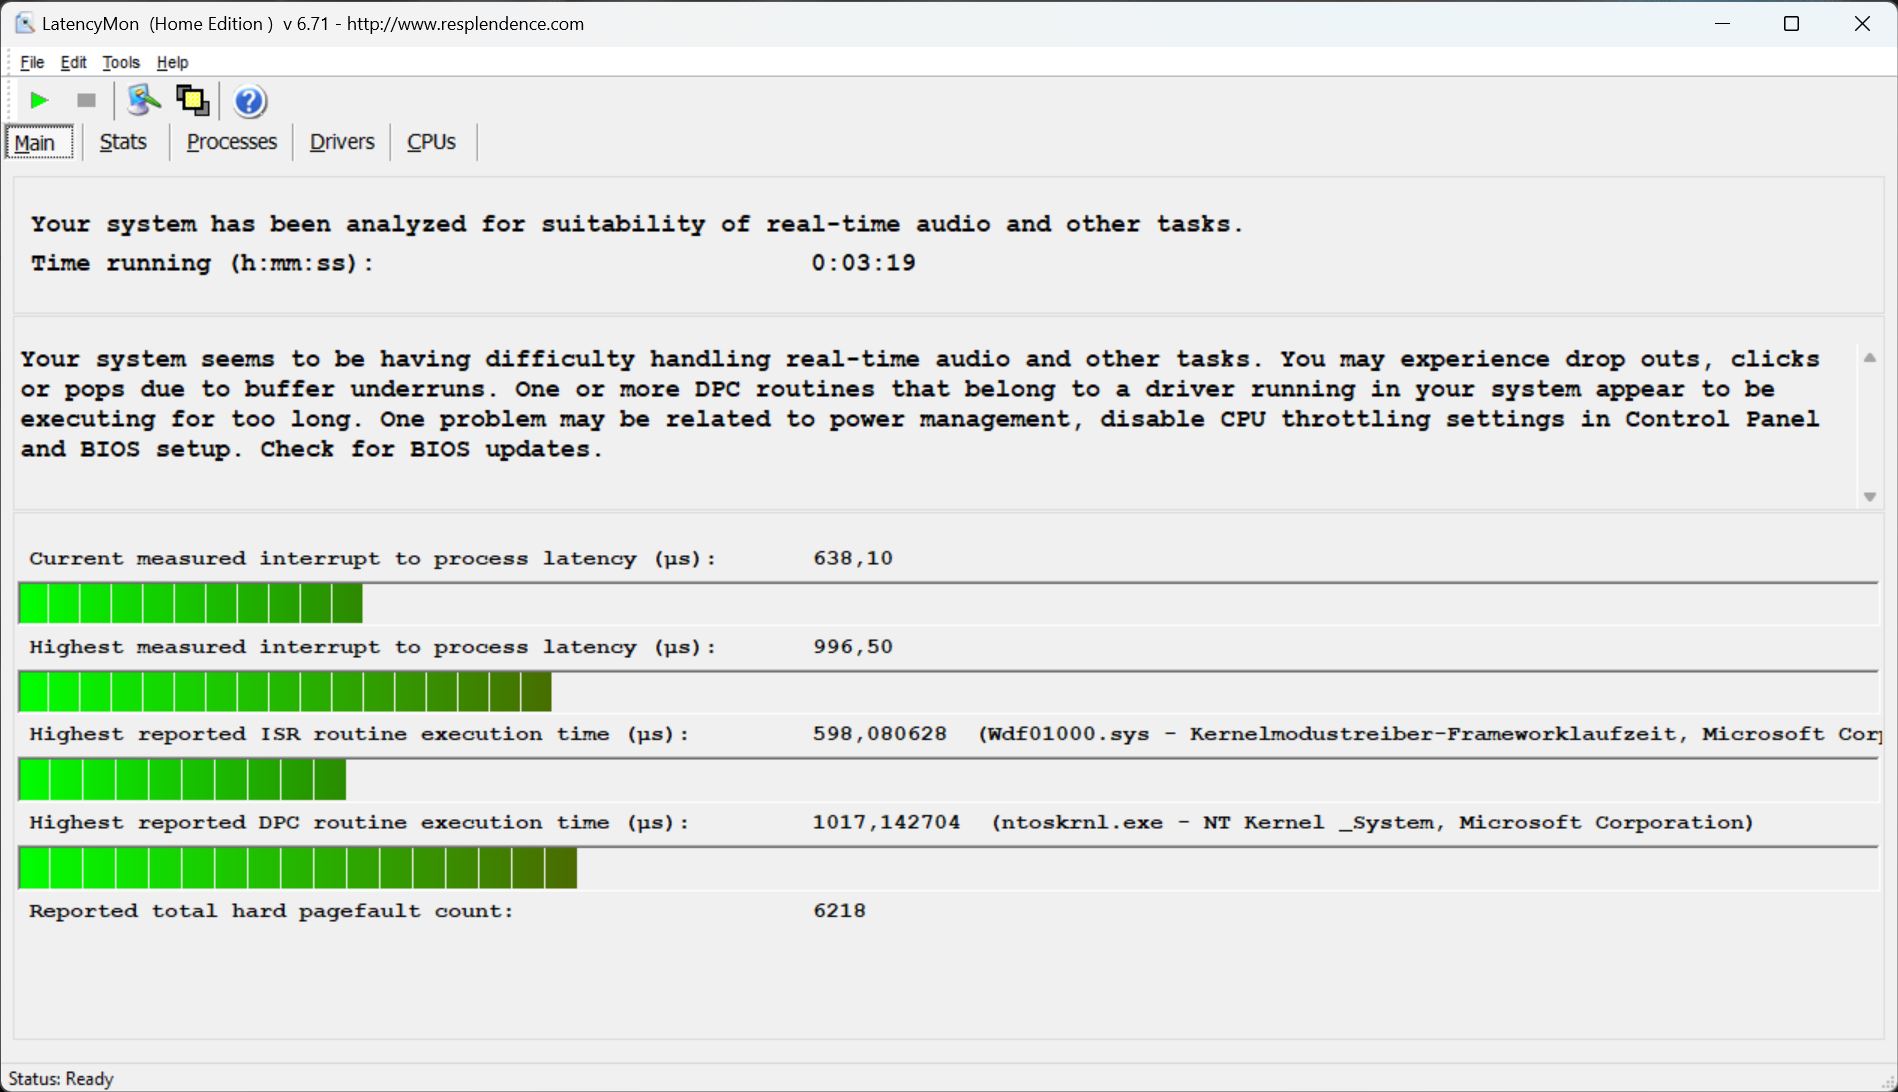
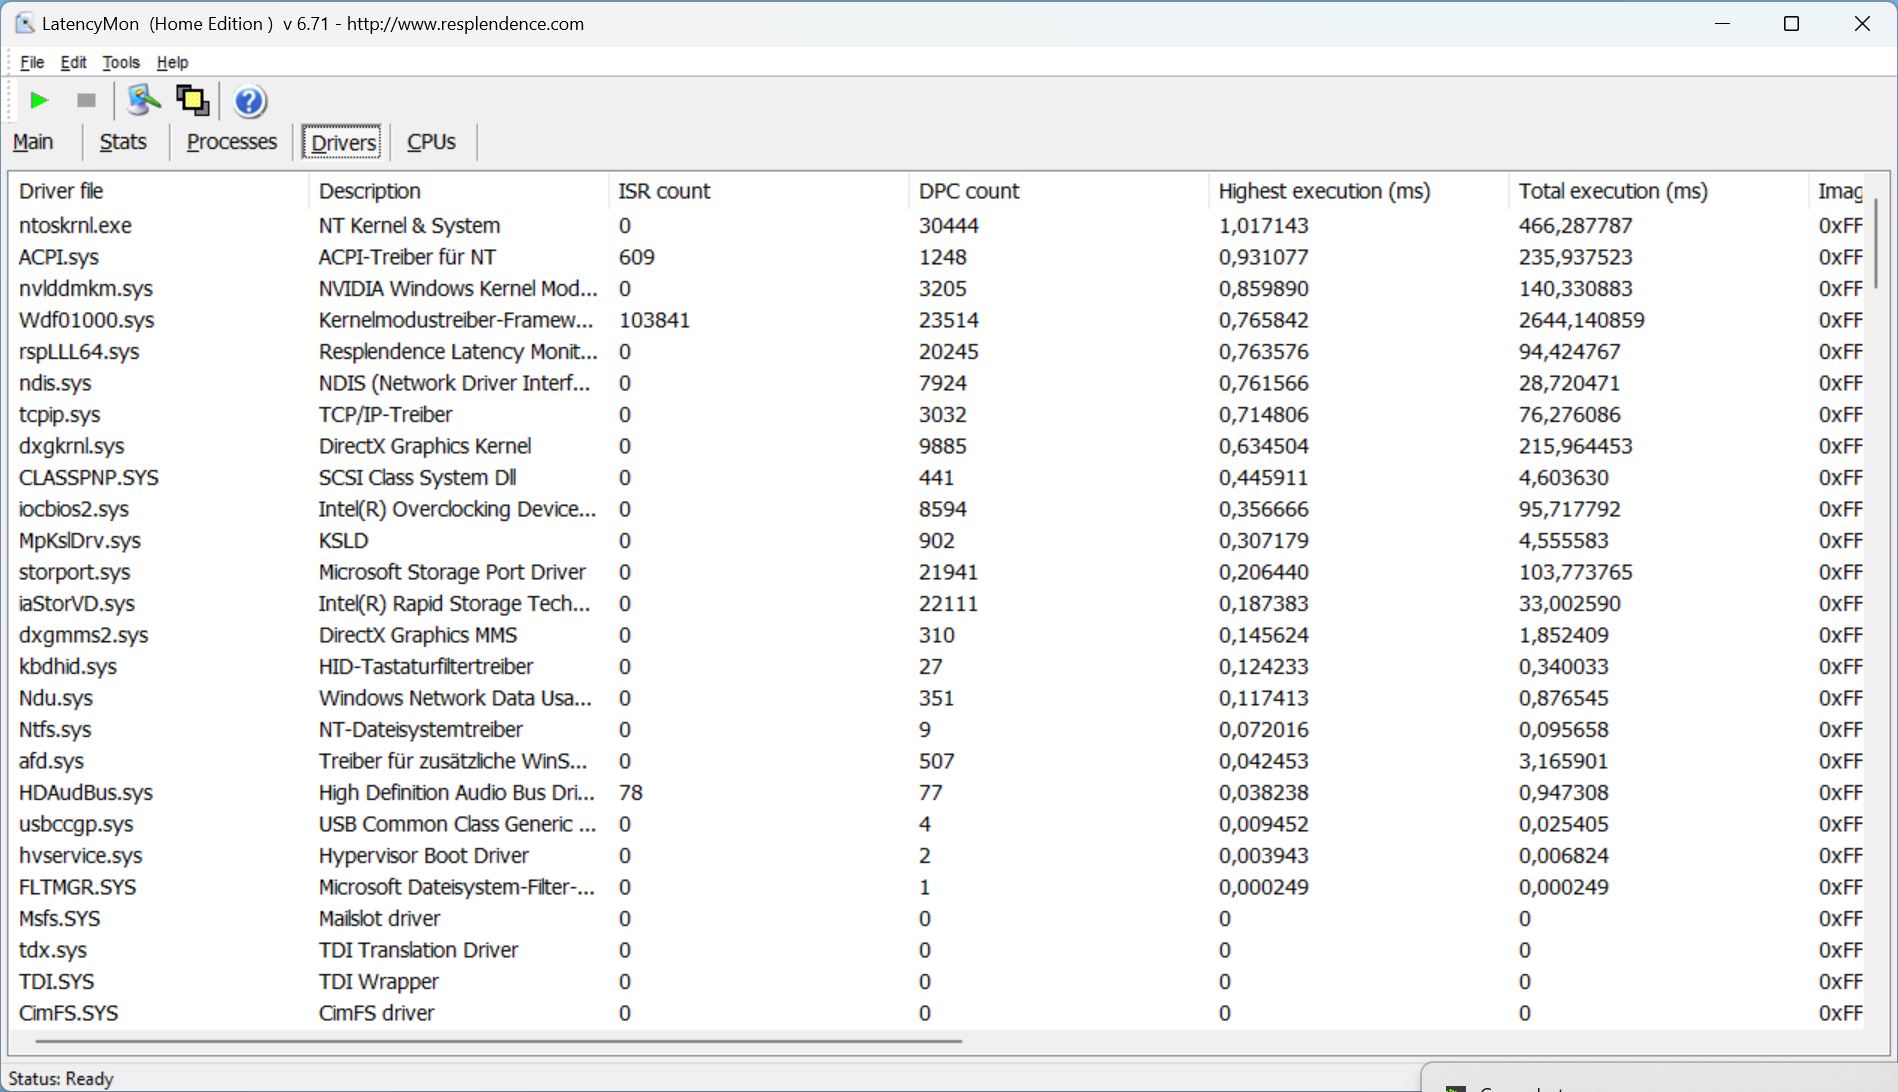
Latence DPC
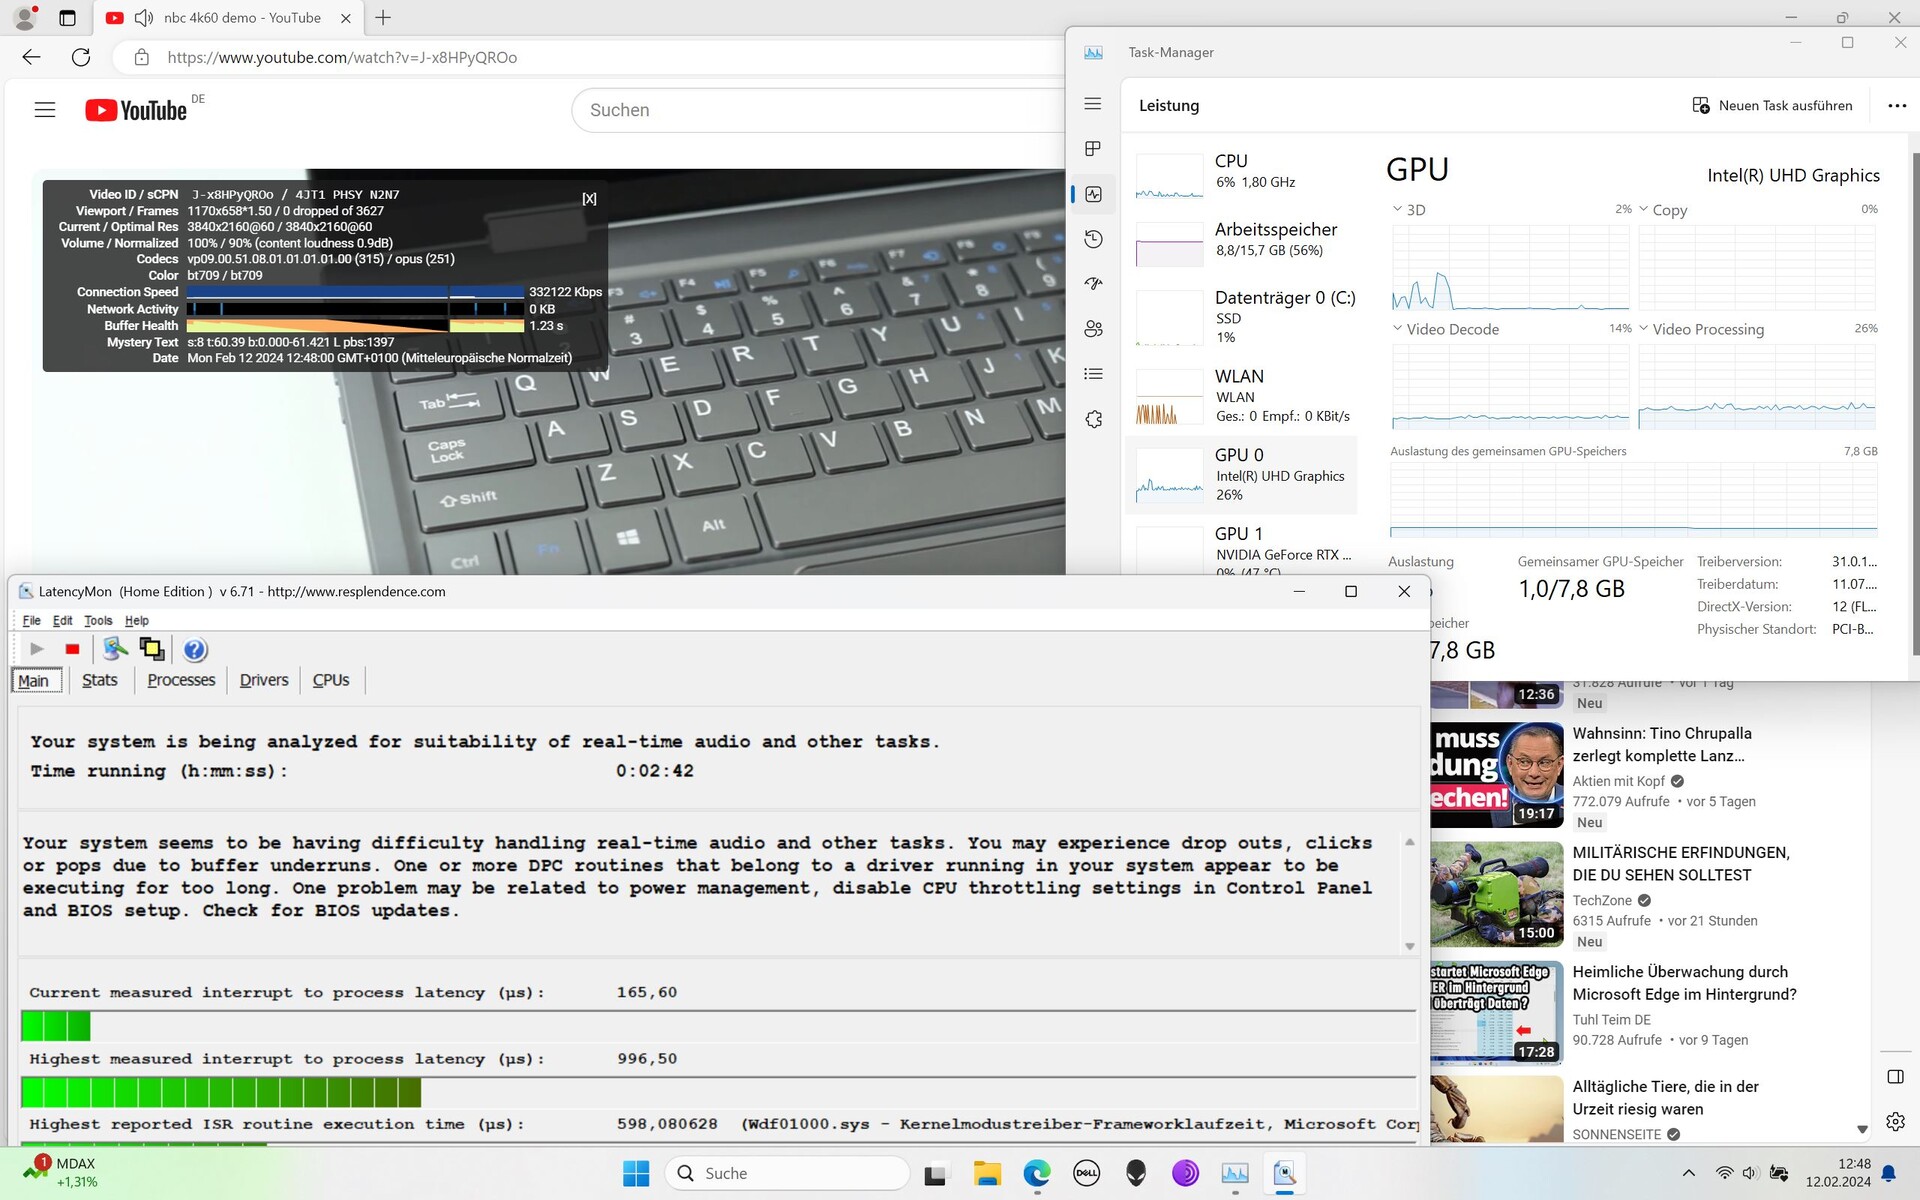
Lors de l'ouverture de notre site web, l'ordinateur portable présentait de légères latences, mais le logiciel LatencyMon ne les considérait pas comme critiques. Cela n'a pas changé lors de l'ouverture de plusieurs onglets. Les latences ont légèrement augmenté lors de la lecture de notre vidéo YouTube en 4K/60 images/seconde, ce qui a amené notre outil de mesure à signaler des problèmes. En comparaison, toutefois, ces latences sont assez faibles et la vidéo de test a été lue sans aucune perte d'images.
| DPC Latencies / LatencyMon - interrupt to process latency (max), Web, Youtube, Prime95 | |
| Alienware m16 R1 Intel | |
| MSI Raider GE68HX 13VF | |
| Lenovo LOQ 16IRH8 | |
| Lenovo Legion Slim 5 16APH8 | |
| Dell G16, i7-13650HX, RTX 4060 | |
| Dell G16 7620 | |
* ... Moindre est la valeur, meilleures sont les performances
Dispositifs de stockage
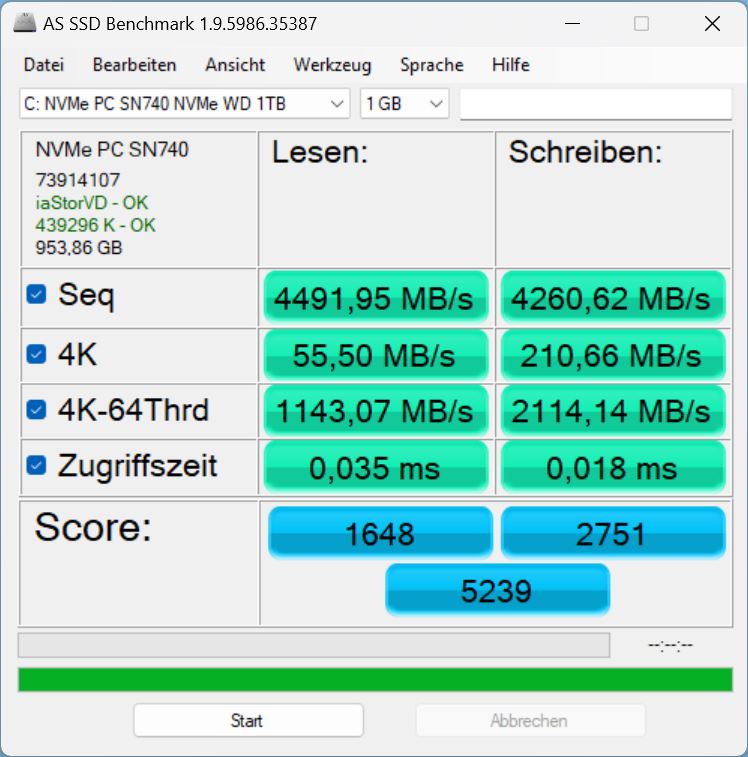
Dell a installé un SN740 de Western Digital doté du petit format M.2 2230. Un second emplacement M.2-2280, plus grand, est également libre. Le PCIe-4-NVMe occupe la position 142 dans notre Liste des meilleurs SSD. Ses performances de sortie sont en fait meilleures que celles des SSD du MSI Raider ou du Lenovo LOQ 16. Contrairement à ces derniers et aux autres concurrents, le support de stockage du G16 est thermiquement étranglé après un court laps de temps.
Ses taux de transfert chutent alors de plus de la moitié. Son prédécesseur disposait d'un modèle plus rapide, même s'il était également affecté par des problèmes d'étranglement. Ceux-ci ont toutefois commencé bien plus tard.

* ... Moindre est la valeur, meilleures sont les performances
Reading continuous performance: DiskSpd Read Loop, Queue Depth 8
Carte graphique
Dell a doté le G16 d'une RTX 4060 de 140 watts. Les modes Whisper, Max-Q, Dynamic Boost et même Advanced Optimus sont supportés. Cependant, ce dernier est régulièrement ennuyeux, car le processus de commutation graphique prend quelques secondes lors de chaque application 3D (démarrage et fermeture), pendant lesquelles l'écran se fige.
Néanmoins, ses performances lors des tests synthétiques 3DMarks étaient conformes à nos attentes, voire légèrement supérieures. Son avance sur le prédécesseur de l'ordinateur portable avec la RTX 3060 et le i7-12700H est d'environ 22 %.
Déconnectées de l'alimentation, ses performances 3D ont chuté moins radicalement que prévu. Sur un autre site Fire Strike, nous avons mesuré une baisse d'environ 20 %.
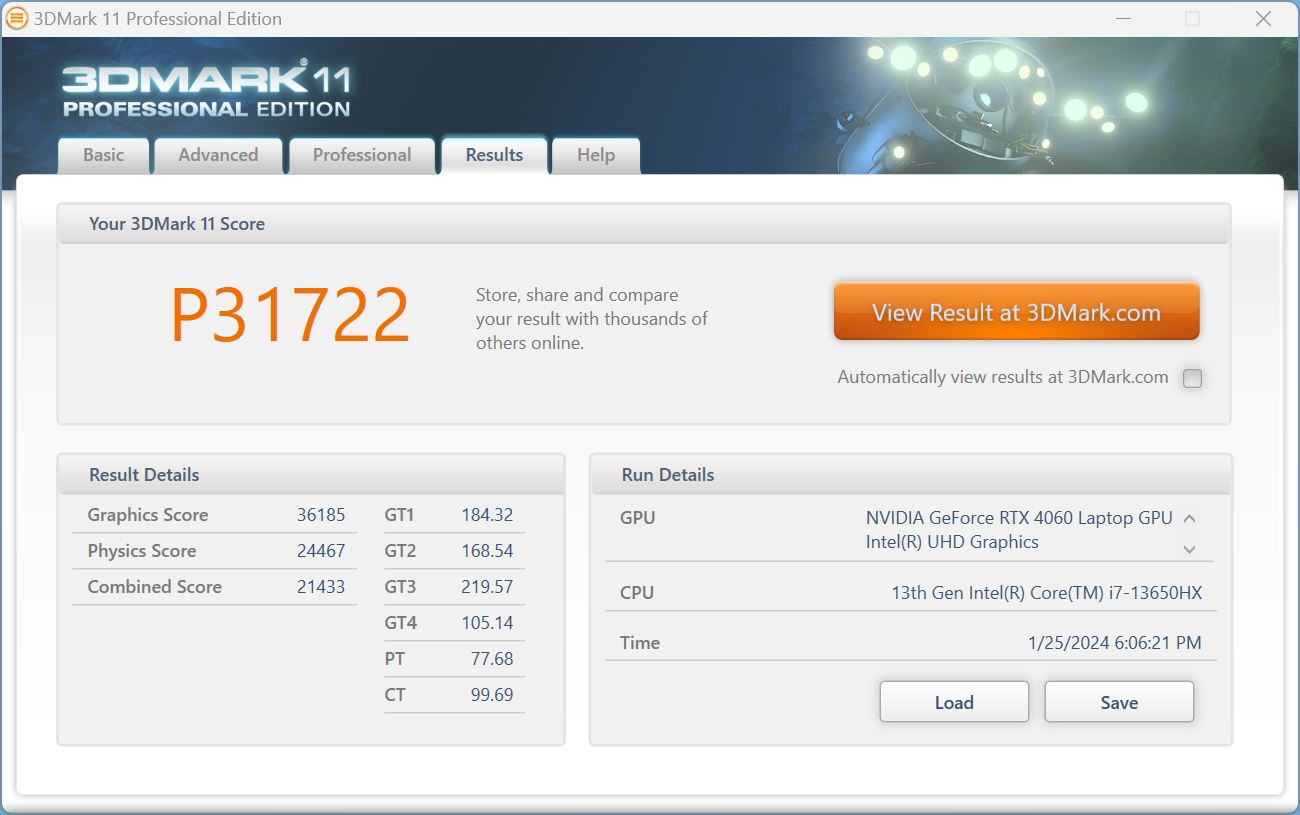
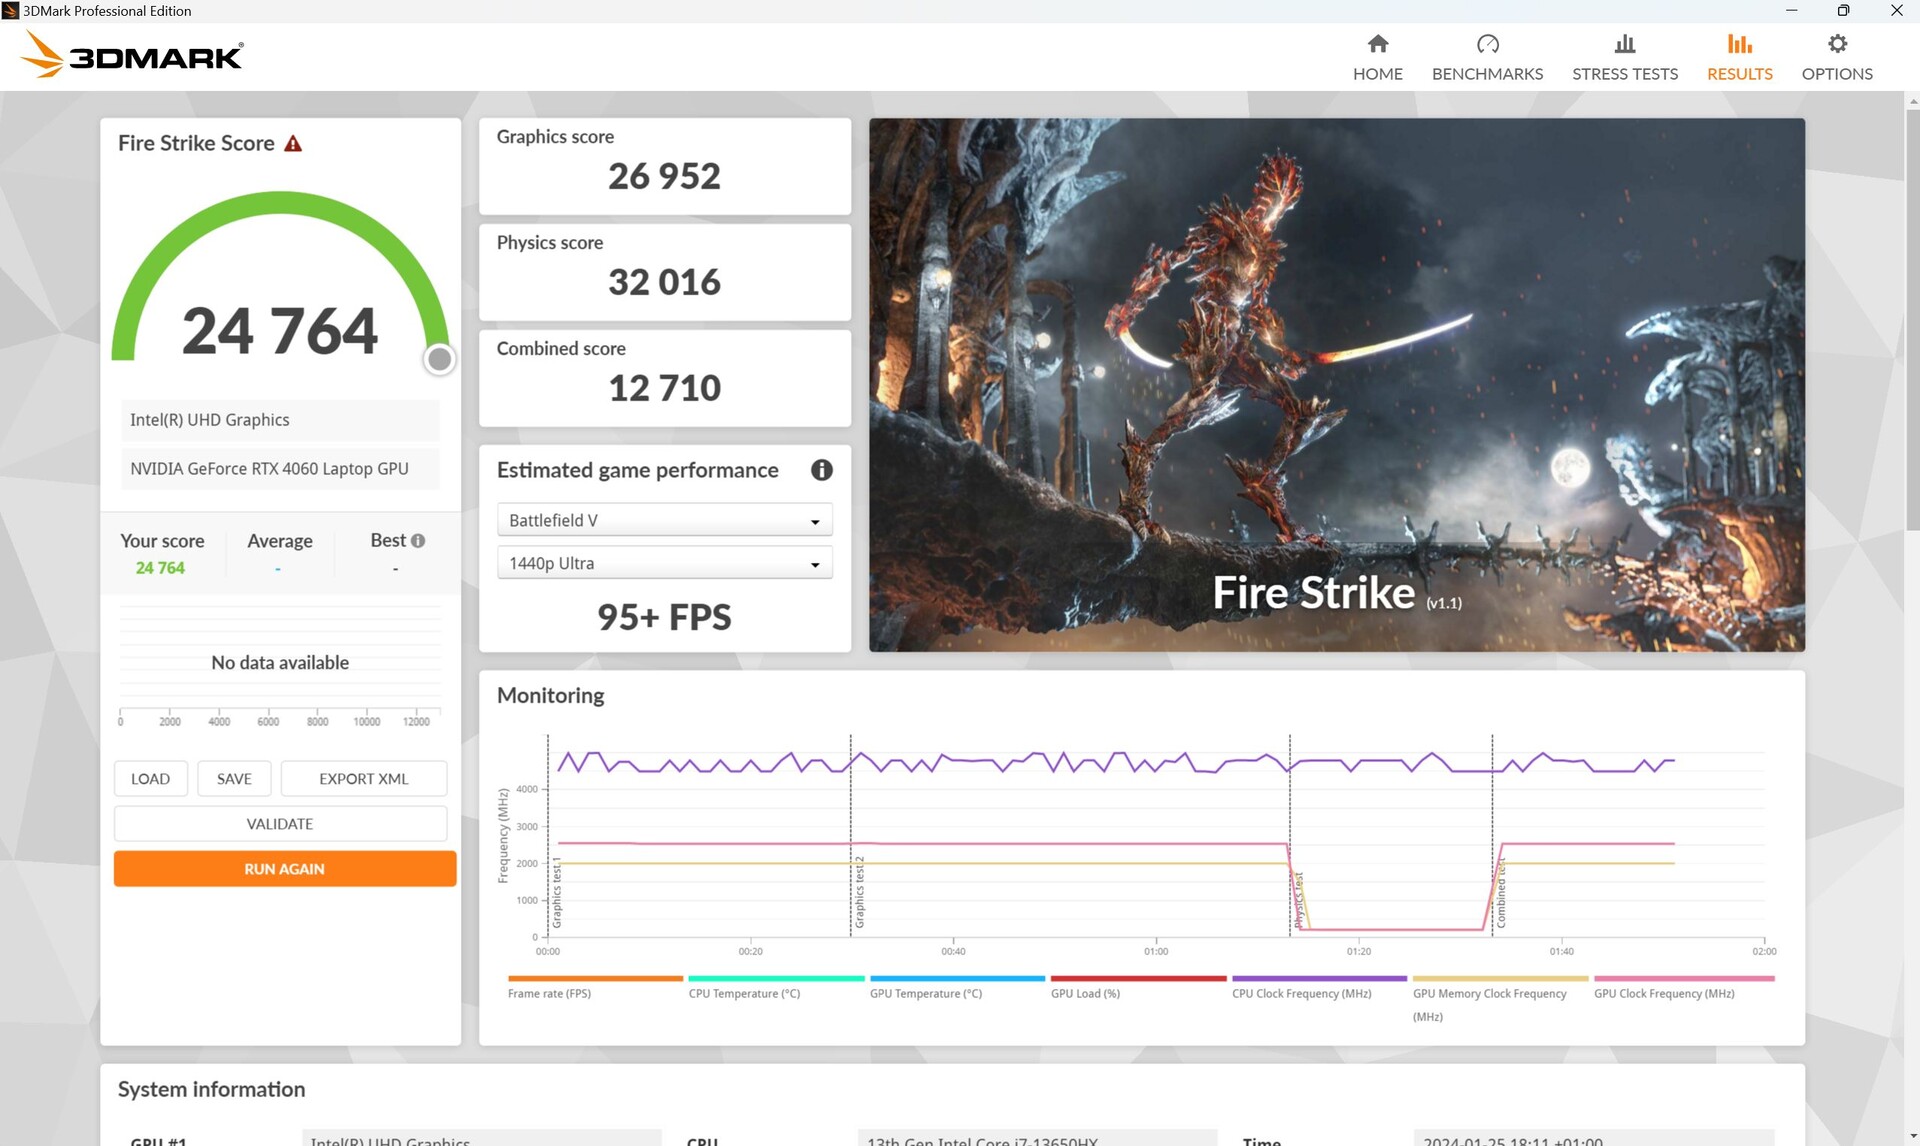
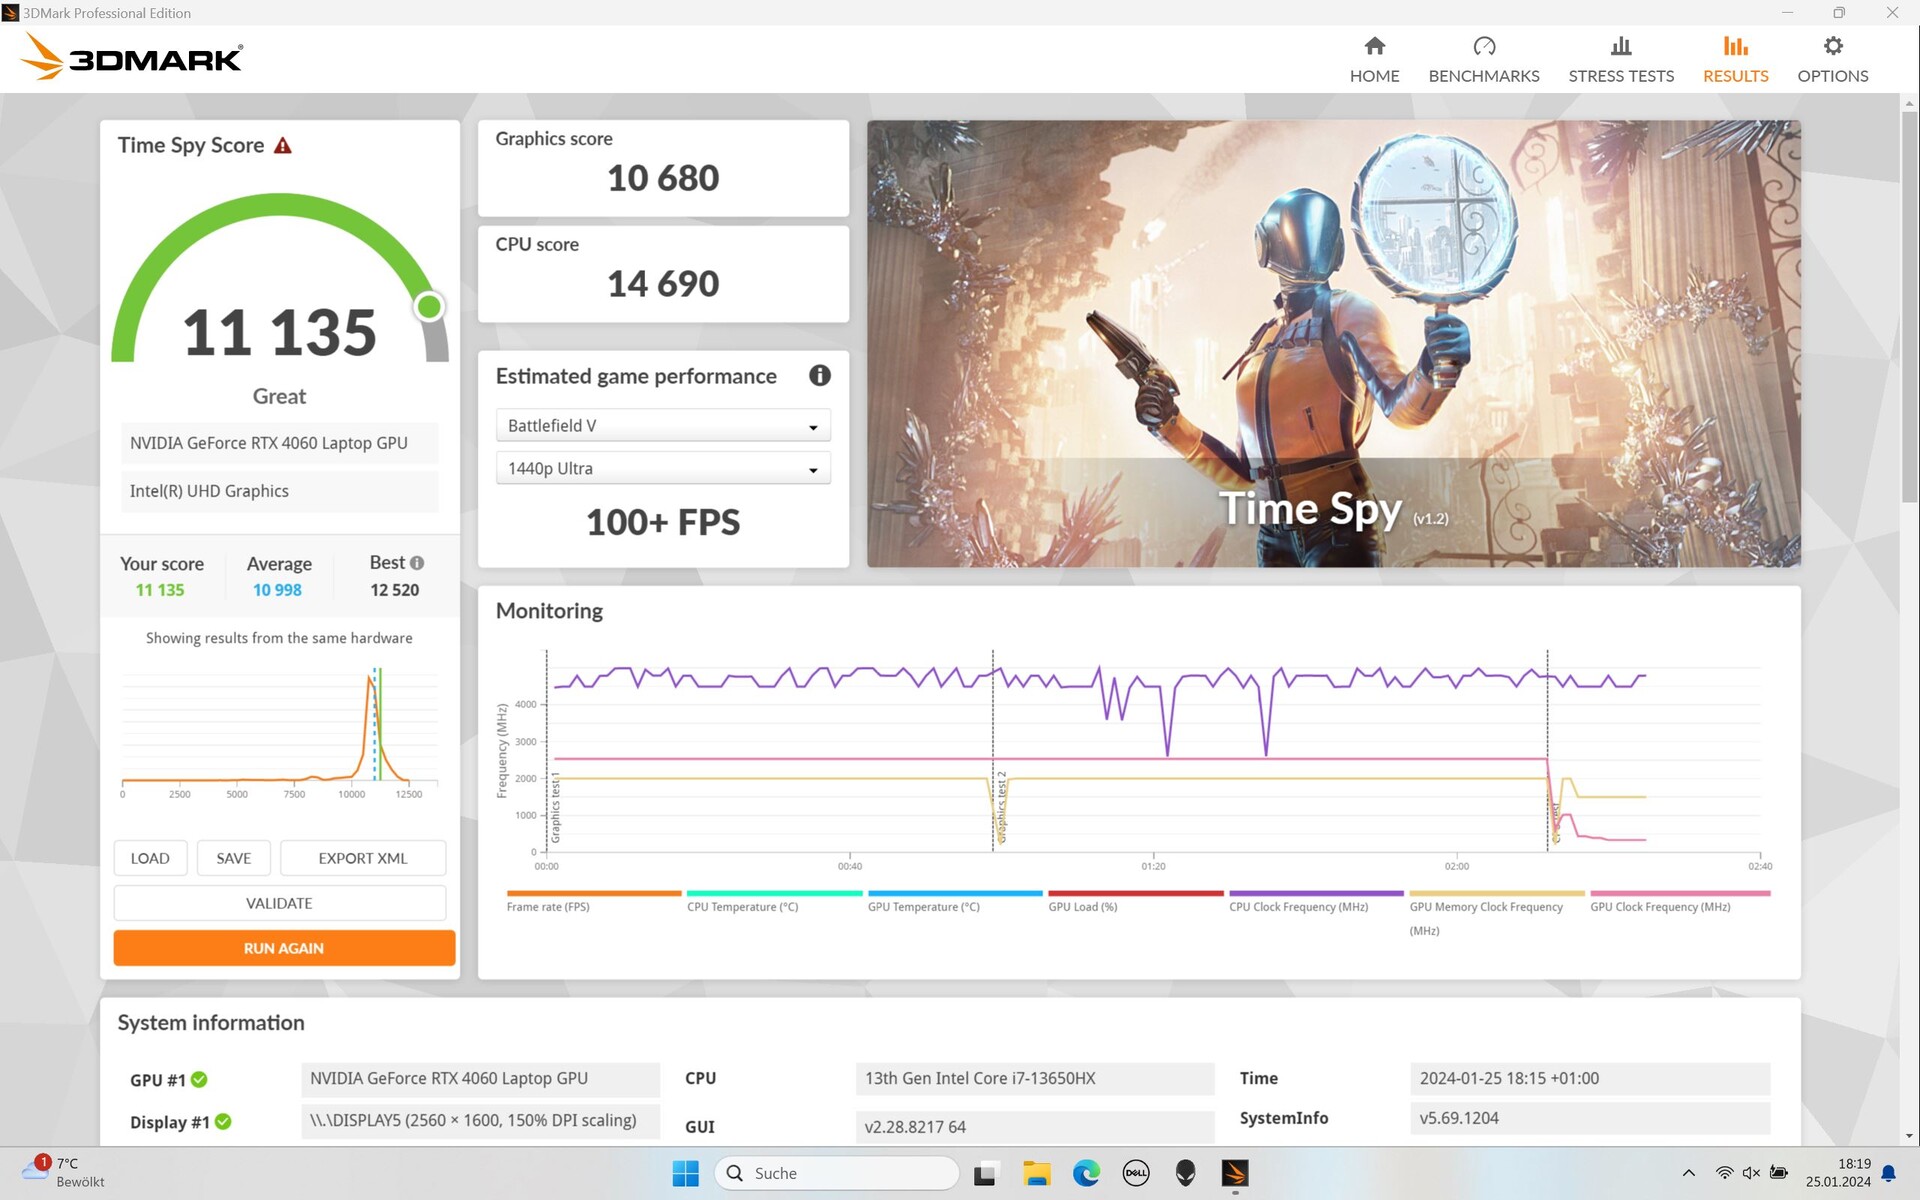
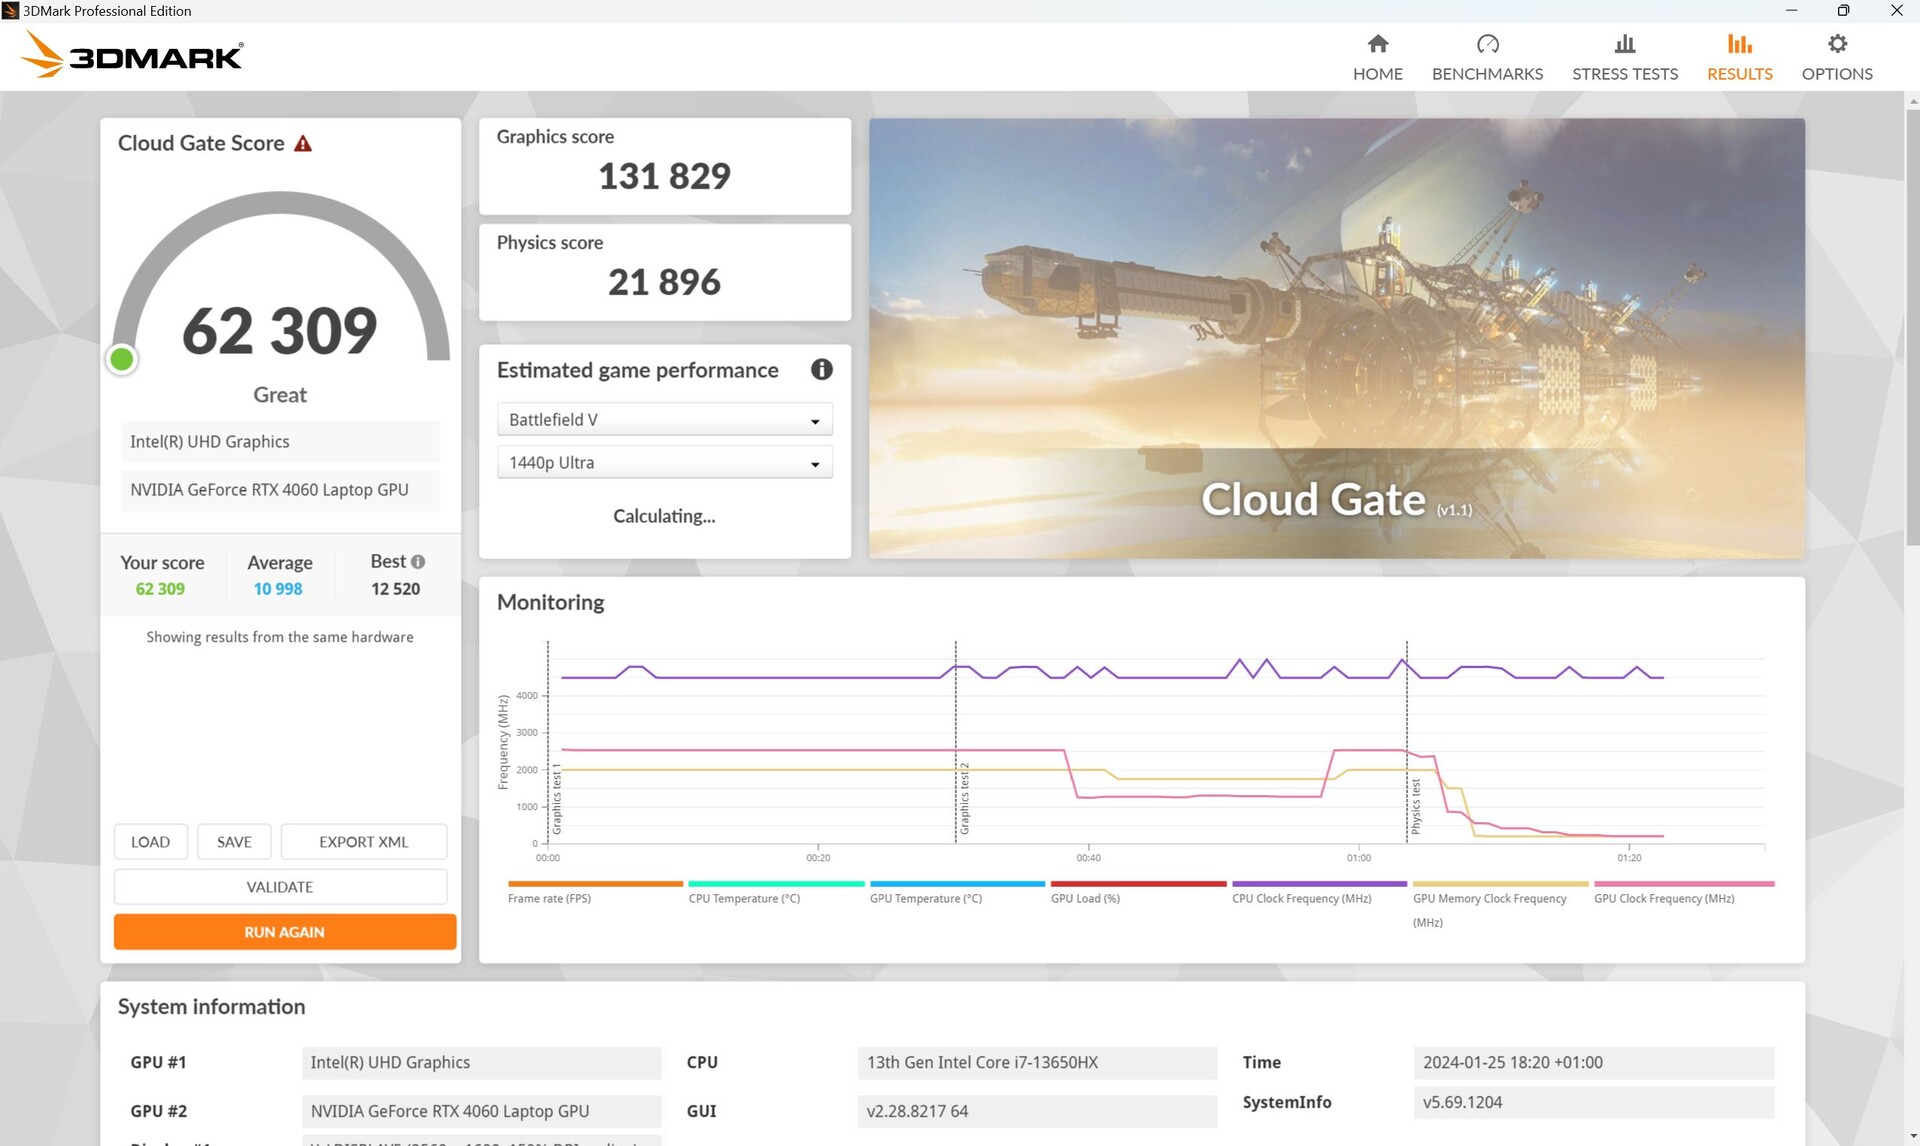
| 3DMark 11 Performance | 31722 points | |
| 3DMark Cloud Gate Standard Score | 62309 points | |
| 3DMark Fire Strike Score | 24764 points | |
| 3DMark Time Spy Score | 11135 points | |
Aide | ||
* ... Moindre est la valeur, meilleures sont les performances
Performances des jeux
Lorsque nous avons activé le mode Nvidia-GPU uniquement pour nos tests de jeu via le panneau de configuration, nous avons remarqué que certains paramètres (par exemple, Full HD Ultra, Strange Brigade QHD) entraînaient des taux de rafraîchissement nettement inférieurs à ceux obtenus en mode Optimus ou automatique. Witcher 3 Full HD Ultra, Strange Brigade QHD) entraînaient des taux de rafraîchissement nettement inférieurs à ceux obtenus en mode Optimus ou automatique. C'est plutôt inhabituel et cela peut entraîner une certaine frustration.
Sinon, nous ne pouvons pas nous plaindre des performances de jeu de cet ordinateur portable. En comparaison, notre G16 est cinq pour cent derrière le MSI Raider équipé d'un processeur i9-13950HX et une RTX 4060mais le Alienware et Lenovo LOQ ont suivi de peu.
En fin de compte, tous les jeux actuels peuvent être joués en FHD avec les paramètres Ultra à plus de 60 images par seconde. En utilisant la résolution native de 1 600p, vous ne pourrez souvent pas atteindre plus de 60 images par seconde, mais les jeux se déroulent toujours de manière fluide à plus de 40 images par seconde.
| Performance rating - Percent | |
| Moyenne de la classe Gaming | |
| MSI Raider GE68HX 13VF -1! | |
| Dell G16, i7-13650HX, RTX 4060 | |
| Lenovo LOQ 16IRH8 | |
| Alienware m16 R1 Intel -1! | |
| Dell G16 7620 | |
| Lenovo Legion Slim 5 16APH8 | |
| The Witcher 3 - 1920x1080 Ultra Graphics & Postprocessing (HBAO+) | |
| Moyenne de la classe Gaming (95 - 240, n=8, 2 dernières années) | |
| Dell G16, i7-13650HX, RTX 4060 | |
| Alienware m16 R1 Intel | |
| Lenovo LOQ 16IRH8 | |
| MSI Raider GE68HX 13VF | |
| Lenovo Legion Slim 5 16APH8 | |
| Dell G16 7620 | |
| GTA V - 1920x1080 Highest AA:4xMSAA + FX AF:16x | |
| Moyenne de la classe Gaming (48.3 - 186.9, n=100, 2 dernières années) | |
| Dell G16, i7-13650HX, RTX 4060 | |
| Lenovo LOQ 16IRH8 | |
| Dell G16 7620 | |
| Lenovo Legion Slim 5 16APH8 | |
| Final Fantasy XV Benchmark - 1920x1080 High Quality | |
| Moyenne de la classe Gaming (41 - 215, n=101, 2 dernières années) | |
| Alienware m16 R1 Intel | |
| Dell G16, i7-13650HX, RTX 4060 | |
| MSI Raider GE68HX 13VF | |
| Lenovo LOQ 16IRH8 | |
| Lenovo Legion Slim 5 16APH8 | |
| Dell G16 7620 | |
| Strange Brigade - 1920x1080 ultra AA:ultra AF:16 | |
| Moyenne de la classe Gaming (76.3 - 456, n=91, 2 dernières années) | |
| Dell G16, i7-13650HX, RTX 4060 | |
| MSI Raider GE68HX 13VF | |
| Alienware m16 R1 Intel | |
| Lenovo LOQ 16IRH8 | |
| Lenovo Legion Slim 5 16APH8 | |
| Dell G16 7620 | |
| Dota 2 Reborn - 1920x1080 ultra (3/3) best looking | |
| MSI Raider GE68HX 13VF | |
| Alienware m16 R1 Intel | |
| Lenovo LOQ 16IRH8 | |
| Moyenne de la classe Gaming (84.8 - 248, n=110, 2 dernières années) | |
| Dell G16, i7-13650HX, RTX 4060 | |
| Dell G16 7620 | |
| Lenovo Legion Slim 5 16APH8 | |
Sur Witcher 3 Ultra, notre G16 a délivré ses meilleures performances et a surpassé les taux d'images de la concurrence, de légèrement (Alienware) à considérablement (Legion Slim 5, GPU automatique).
Le tableau suivant répertorie les valeurs fps de Witcher 3 (FHD Ultra) ainsi que nos mesures d'émission de bruit et de consommation en fonction des trois modes de performance.
| Performance mode/valeur | fps début | fps moyenne | émissions sonores | consommation |
|---|---|---|---|---|
| Performance | 108 | 105,6 | 47,89 dB | 185 watts |
| Équilibré | 100 | 97,6 | 39 - 43 dB | 178 watts |
| Silencieux | 99 | 97,6 | 35,52 dB | 168 watts |
Witcher 3 FPS diagram
| Bas | Moyen | Élevé | Ultra | QHD | 4K | |
|---|---|---|---|---|---|---|
| GTA V (2015) | 185.8 | 183.2 | 176.2 | 117.4 | 50.8 | |
| The Witcher 3 (2015) | 340.4 | 193.1 | 110 | 108 | 42.4 | |
| Dota 2 Reborn (2015) | 177 | 168.7 | 160.8 | 149 | 126.2 | |
| Final Fantasy XV Benchmark (2018) | 219 | 150.1 | 103.7 | 75.9 | ||
| X-Plane 11.11 (2018) | 160.4 | 144.6 | 114.9 | 119.6 | ||
| Far Cry 5 (2018) | 176 | 148 | 141 | 135 | 105 | |
| Strange Brigade (2018) | 478 | 291 | 228 | 194.9 | 129 | |
| Cyberpunk 2077 (2023) | 131.1 | 75.6 | 69.8 | 45.6 |
Émissions - Très silencieux, même pendant les jeux
Émissions sonores
En mode veille, les ventilateurs sont éteints dans tous les modes, à l'exception du mode performance. Dans 3DMark06, notre scénario de charge moyenne, l'ordinateur portable émet le même bruit qu'en mode inactif( modeperformance, environ 28 dB), et les ventilateurs ne tournent donc pas plus vite.
Même en mode jeu et à pleine charge, le Dell G16 reste nettement plus silencieux que ses concurrents, avec un niveau sonore bien inférieur à 50 dB, ce qui semble être le point positif de son système de refroidissement massif.
Degré de la nuisance sonore
| Au repos |
| 23 / 23 / 27.96 dB(A) |
| Fortement sollicité |
| 27.96 / 47.89 dB(A) |
 | ||
30 dB silencieux 40 dB(A) audible 50 dB(A) bruyant |
||
min: | ||
| Dell G16, i7-13650HX, RTX 4060 GeForce RTX 4060 Laptop GPU, i7-13650HX, WD PC SN740 SDDPNQD-1T00 | Dell G16 7620 GeForce RTX 3060 Laptop GPU, i7-12700H, WDC PC SN810 512GB | MSI Raider GE68HX 13VF GeForce RTX 4060 Laptop GPU, i9-13950HX, Samsung PM9B1 1024GB MZVL41T0HBLB | Lenovo Legion Slim 5 16APH8 GeForce RTX 4060 Laptop GPU, R7 7840HS, SK hynix PC801 HFS512GEJ9X115N | Alienware m16 R1 Intel GeForce RTX 4060 Laptop GPU, i7-13700HX, Kioxia KXG70ZNV512G | Lenovo LOQ 16IRH8 GeForce RTX 4060 Laptop GPU, i7-13620H, Solidigm SSDPFINW512GZL | |
|---|---|---|---|---|---|---|
| Noise | -10% | -26% | -6% | -19% | -16% | |
| arrêt / environnement * (dB) | 23 | 23.2 -1% | 23.3 -1% | 22.9 -0% | 25 -9% | 23 -0% |
| Idle Minimum * (dB) | 23 | 28.3 -23% | 25 -9% | 23.1 -0% | 25 -9% | 23 -0% |
| Idle Average * (dB) | 23 | 28.8 -25% | 31.3 -36% | 23.1 -0% | 26 -13% | 23 -0% |
| Idle Maximum * (dB) | 27.96 | 28.9 -3% | 37.5 -34% | 27.7 1% | 27 3% | 27.66 1% |
| Load Average * (dB) | 27.96 | 32.4 -16% | 44 -57% | 33.3 -19% | 52 -86% | 53.62 -92% |
| Witcher 3 ultra * (dB) | 47.89 | 48.3 -1% | 57 -19% | 54 -13% | 51 -6% | 53.5 -12% |
| Load Maximum * (dB) | 47.89 | 48.1 -0% | 60.1 -25% | 54 -13% | 53 -11% | 53.5 -12% |
* ... Moindre est la valeur, meilleures sont les performances
Température
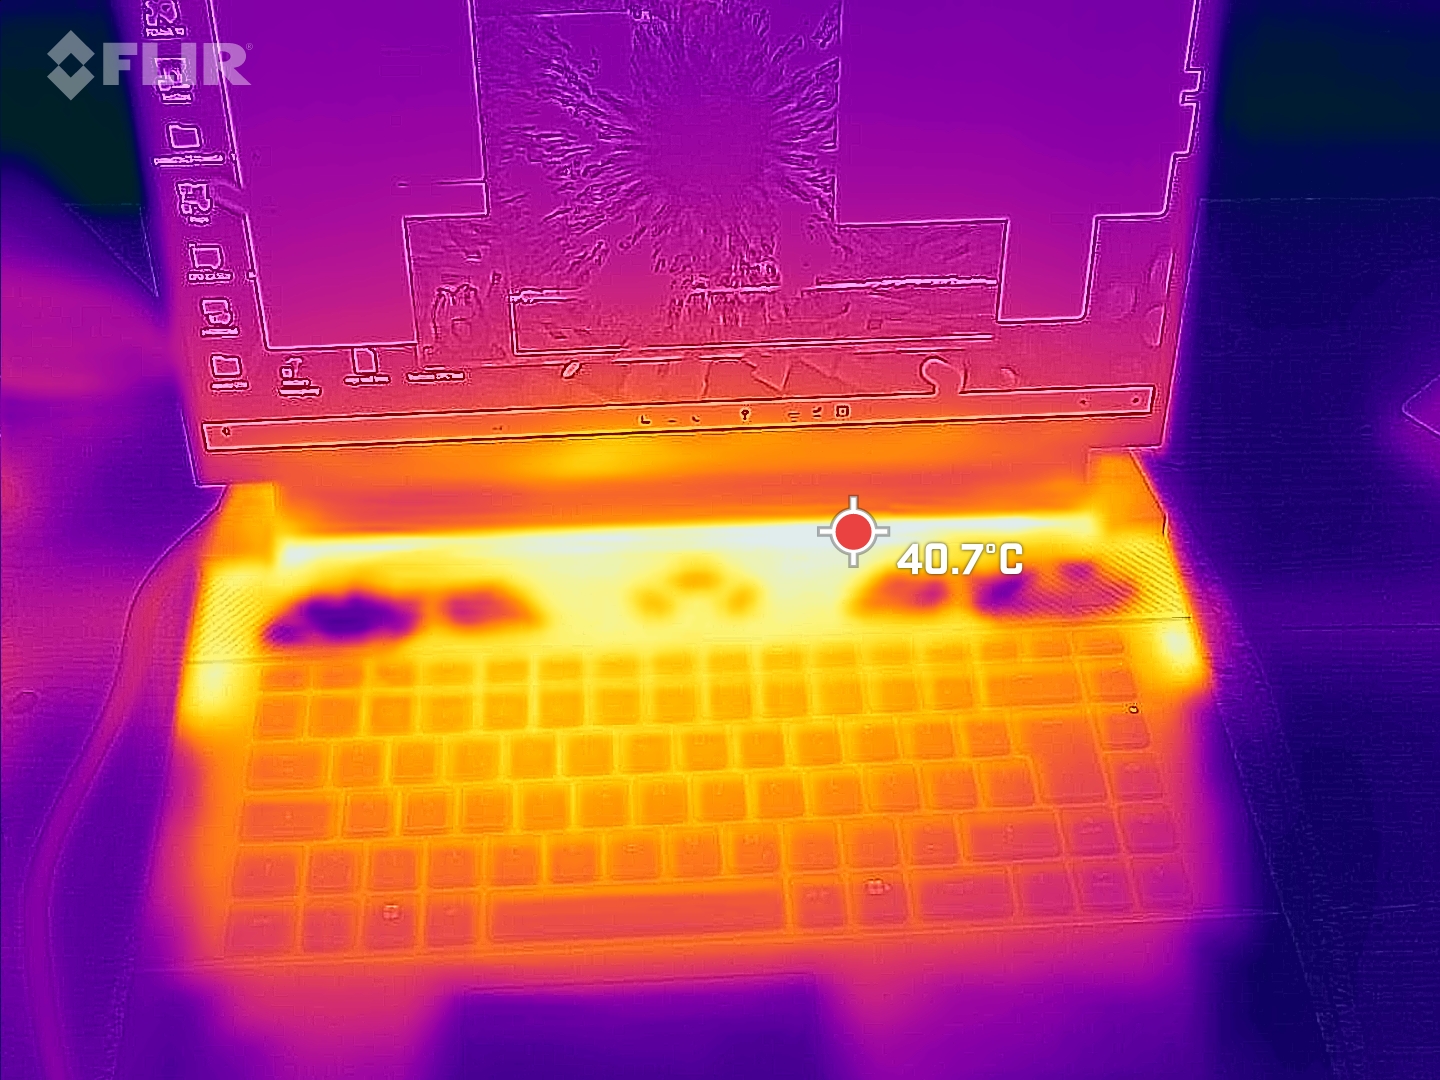
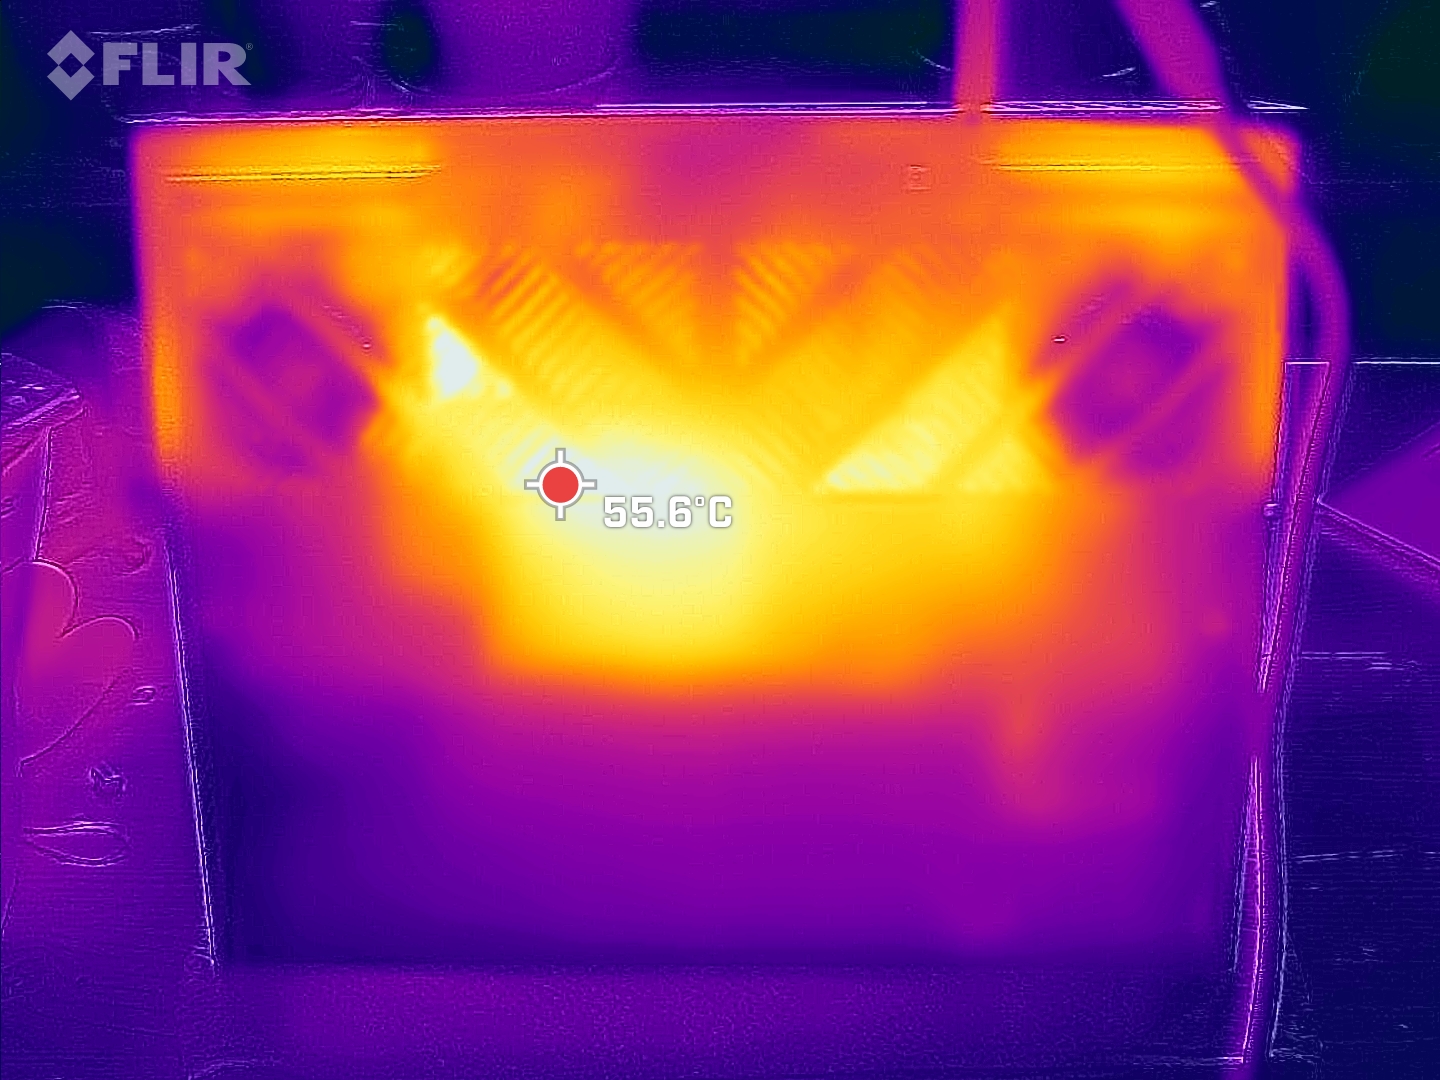
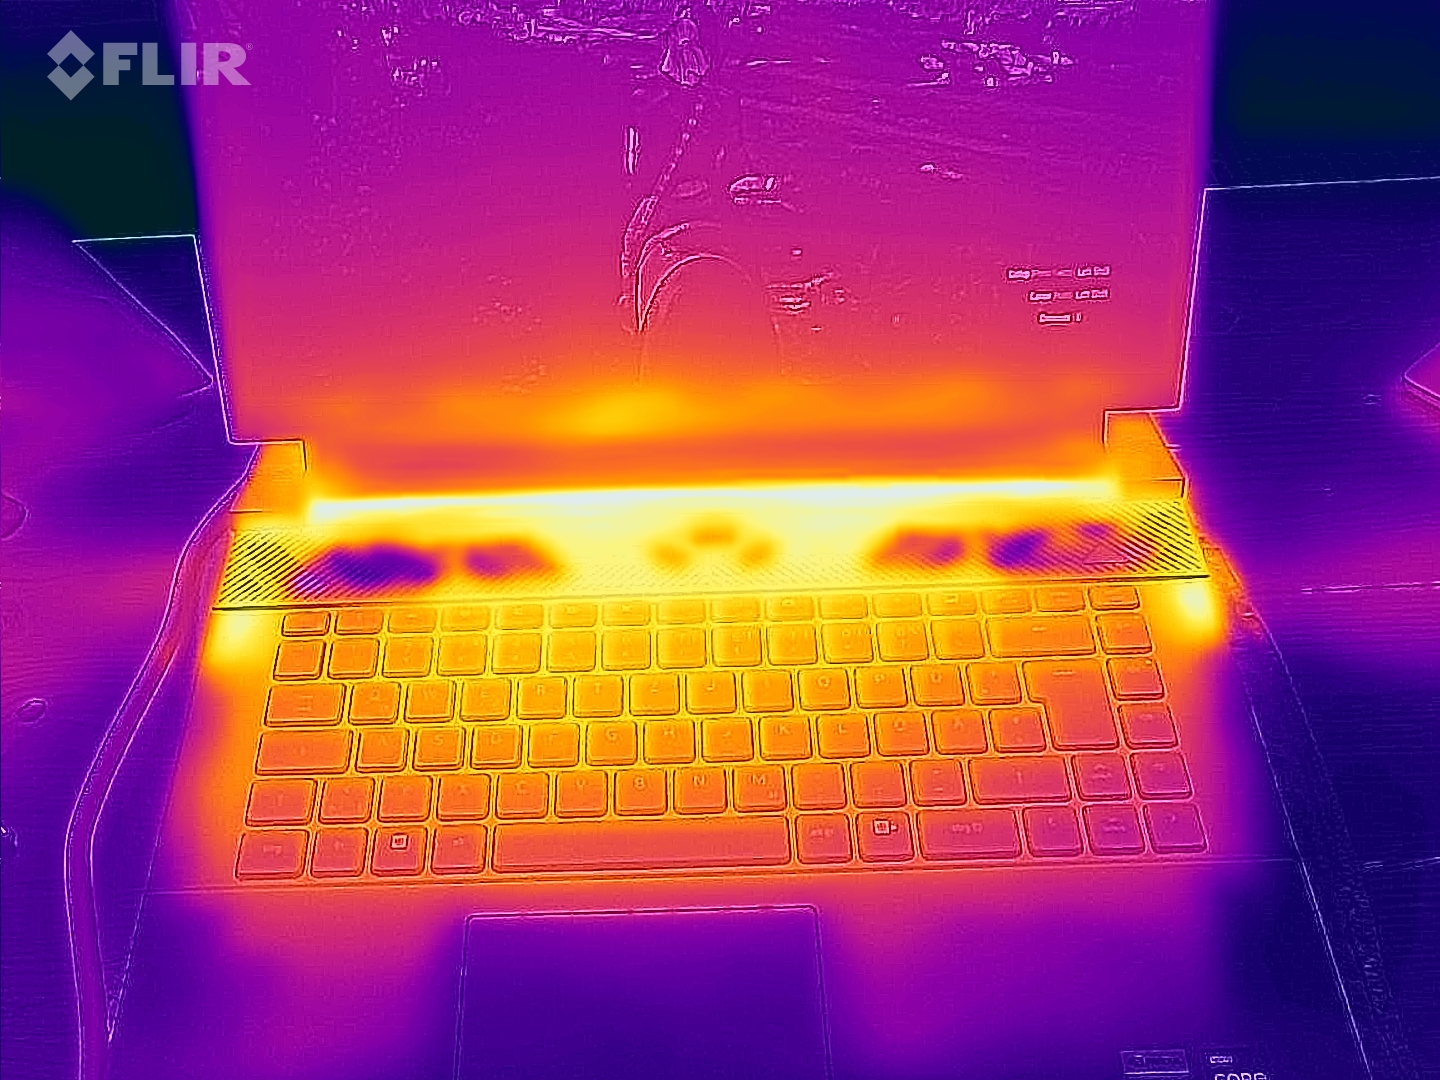
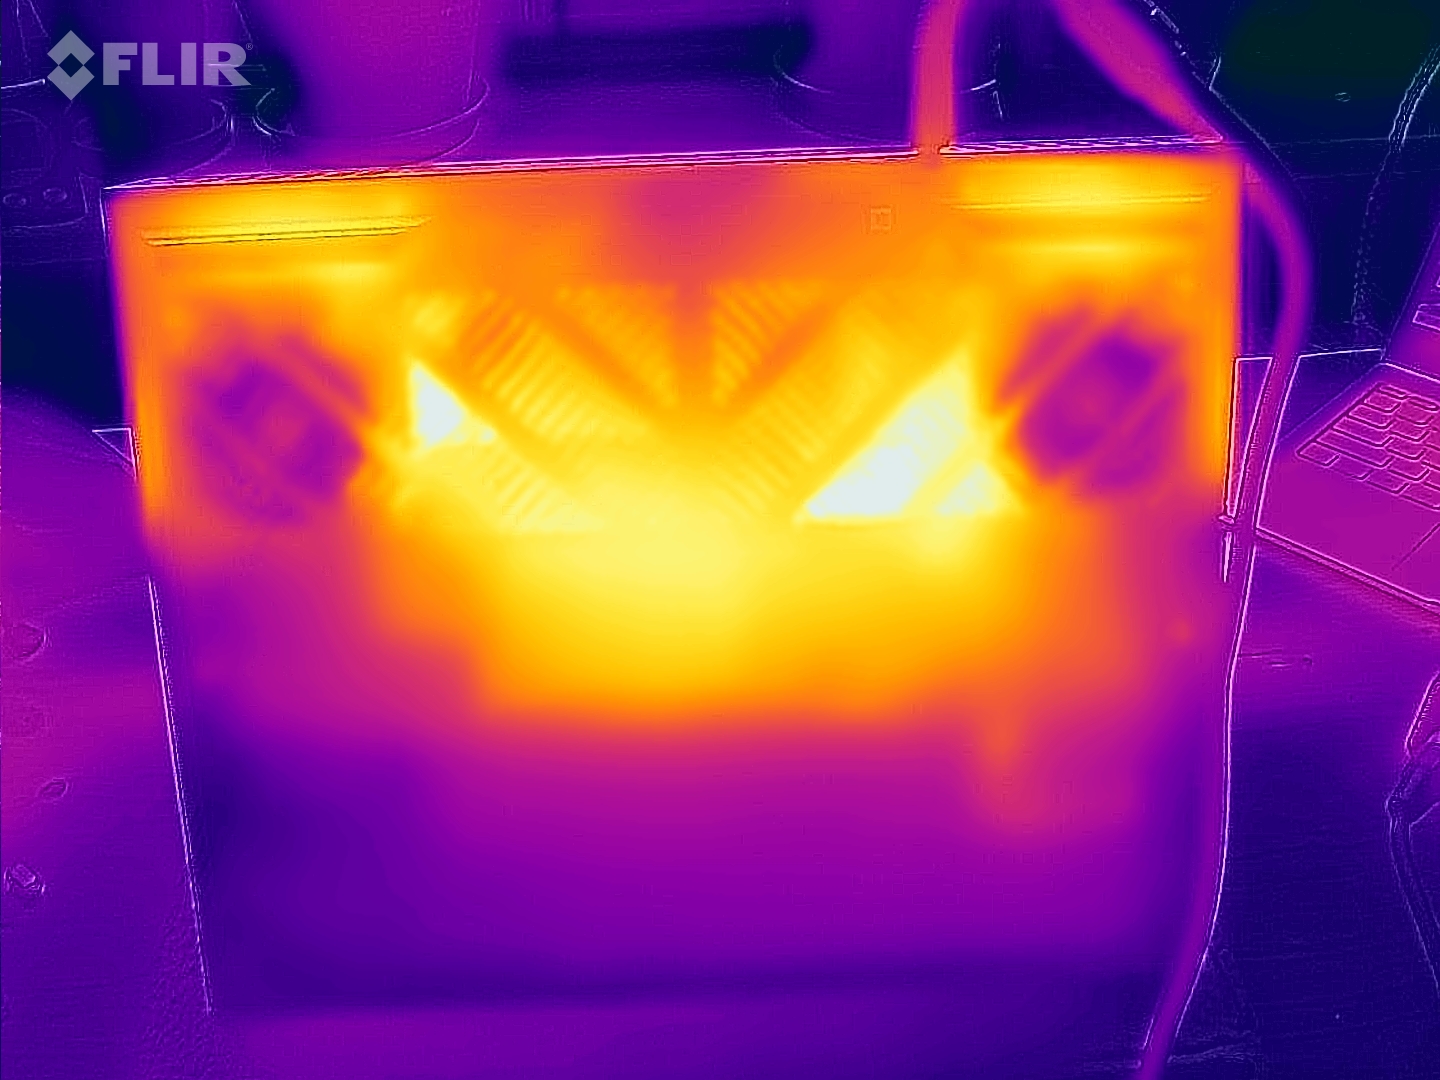
Cependant, les émissions sonores relativement faibles de l'appareil présentent également quelques légers inconvénients. La surface du G16 a tendance à chauffer plus que celle de ses concurrents. Nous avons mesuré des points chauds allant jusqu'à 58 °C sur la face inférieure en charge maximale ! Seul le Lenovo LOQ 16 et le prédécesseur du G16 atteignent une température similaire, tandis que les autres appareils de comparaison se maintiennent juste en dessous de 50 °C. Au moins, les repose-paumes sont toujours froids et la zone entourant les touches WASD reste également dans une fourchette acceptable.
(-) La température maximale du côté supérieur est de 49 °C / 120 F, par rapport à la moyenne de 40.4 °C / 105 F, allant de 21.2 à 68.8 °C pour la classe Gaming.
(-) Le fond chauffe jusqu'à un maximum de 58 °C / 136 F, contre une moyenne de 43.2 °C / 110 F
(+) En utilisation inactive, la température moyenne du côté supérieur est de 30 °C / 86 F, par rapport à la moyenne du dispositif de 33.9 °C / 93 F.
(±) En jouant à The Witcher 3, la température moyenne du côté supérieur est de 34.4 °C / 94 F, alors que la moyenne de l'appareil est de 33.9 °C / 93 F.
(+) Les repose-poignets et le pavé tactile sont plus froids que la température de la peau avec un maximum de 25 °C / 77 F et sont donc froids au toucher.
(+) La température moyenne de la zone de l'appui-paume de dispositifs similaires était de 28.8 °C / 83.8 F (+3.8 °C / #6.8 F).
| Dell G16, i7-13650HX, RTX 4060 Intel Core i7-13650HX, NVIDIA GeForce RTX 4060 Laptop GPU | Dell G16 7620 Intel Core i7-12700H, NVIDIA GeForce RTX 3060 Laptop GPU | MSI Raider GE68HX 13VF Intel Core i9-13950HX, NVIDIA GeForce RTX 4060 Laptop GPU | Lenovo Legion Slim 5 16APH8 AMD Ryzen 7 7840HS, NVIDIA GeForce RTX 4060 Laptop GPU | Alienware m16 R1 Intel Intel Core i7-13700HX, NVIDIA GeForce RTX 4060 Laptop GPU | Lenovo LOQ 16IRH8 Intel Core i7-13620H, NVIDIA GeForce RTX 4060 Laptop GPU | |
|---|---|---|---|---|---|---|
| Heat | 19% | 16% | 23% | -2% | 10% | |
| Maximum Upper Side * (°C) | 49 | 47.6 3% | 41.4 16% | 40.6 17% | 49 -0% | 48 2% |
| Maximum Bottom * (°C) | 58 | 54 7% | 45.4 22% | 42 28% | 48 17% | 59 -2% |
| Idle Upper Side * (°C) | 35 | 23 34% | 29.8 15% | 27.8 21% | 40 -14% | 28 20% |
| Idle Bottom * (°C) | 35 | 24.6 30% | 31.4 10% | 26.6 24% | 39 -11% | 28 20% |
* ... Moindre est la valeur, meilleures sont les performances
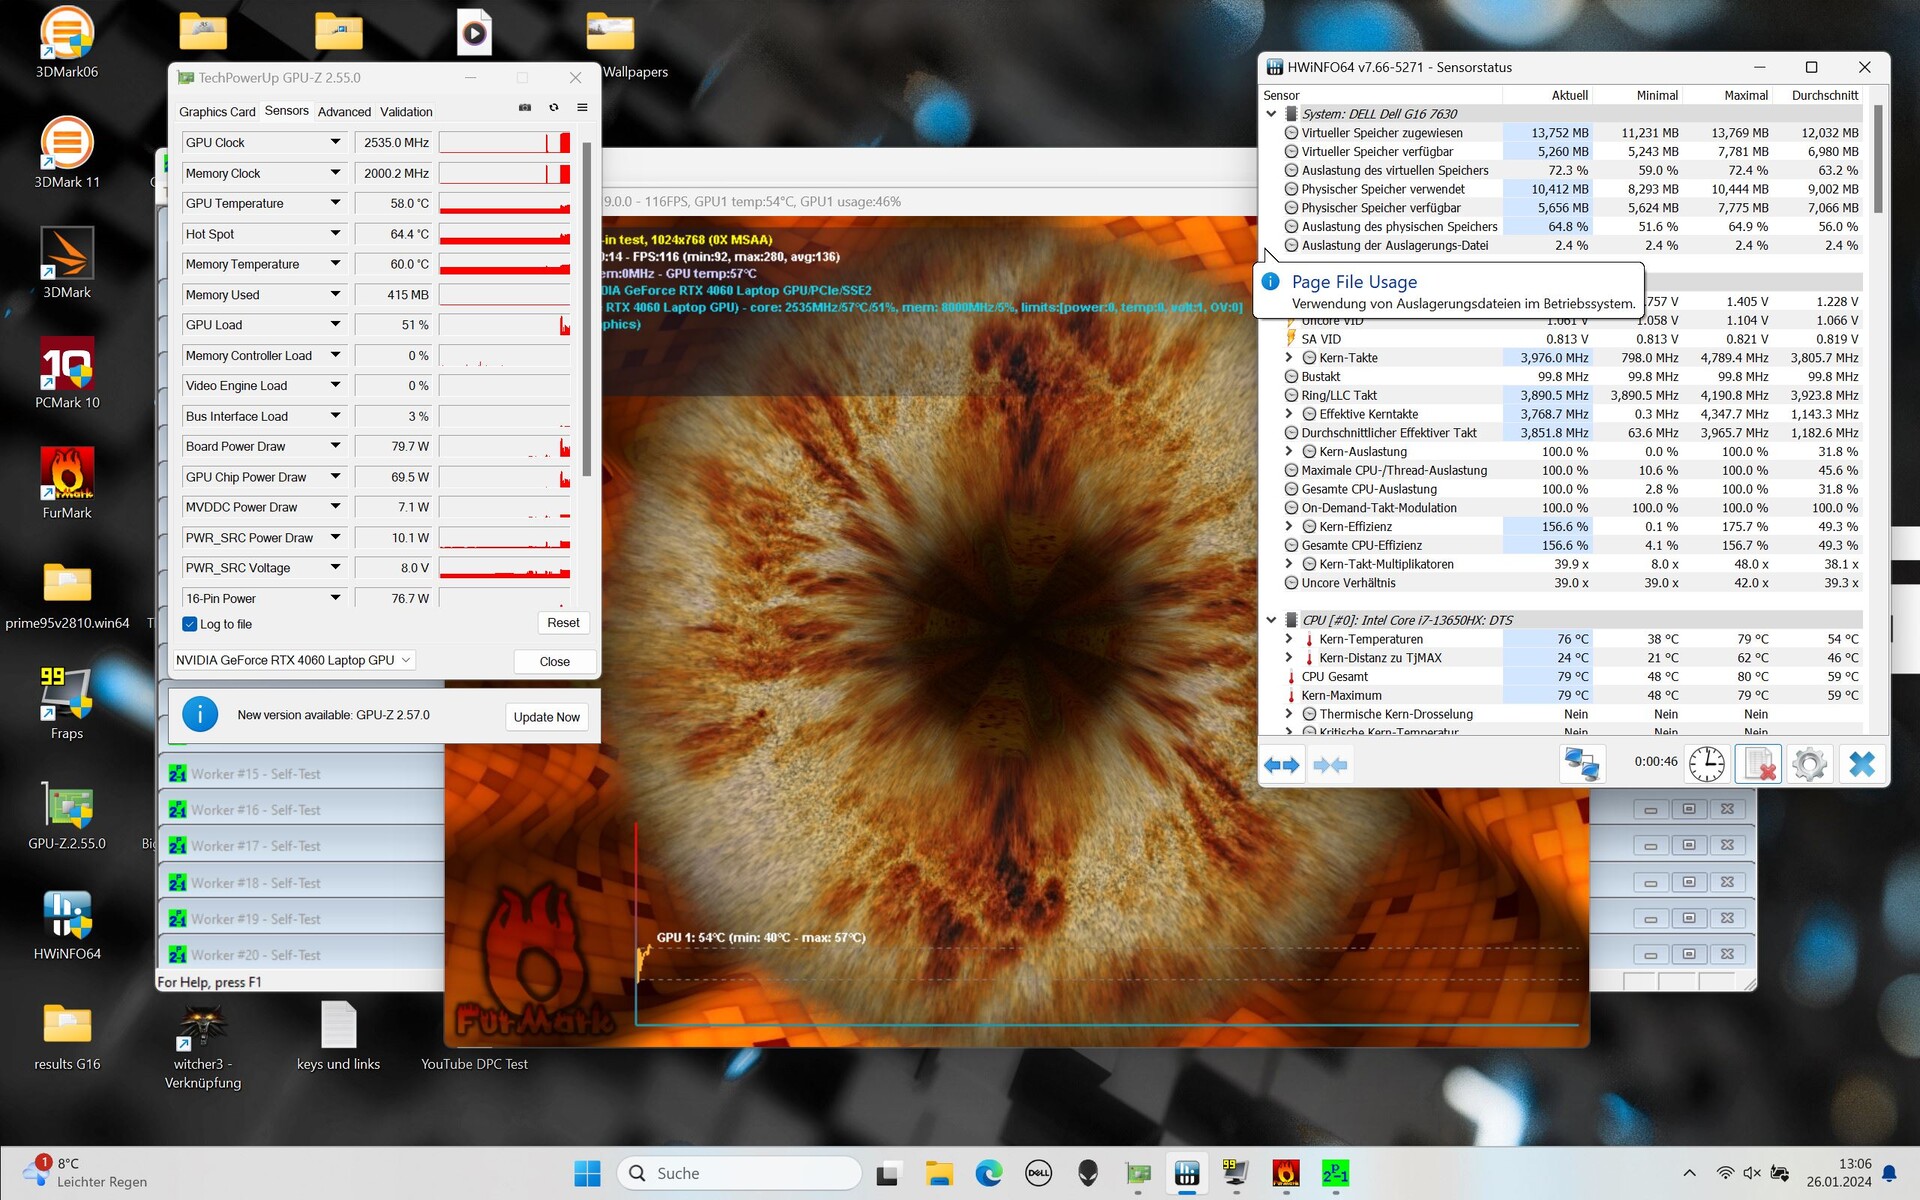
Épreuve d'effort
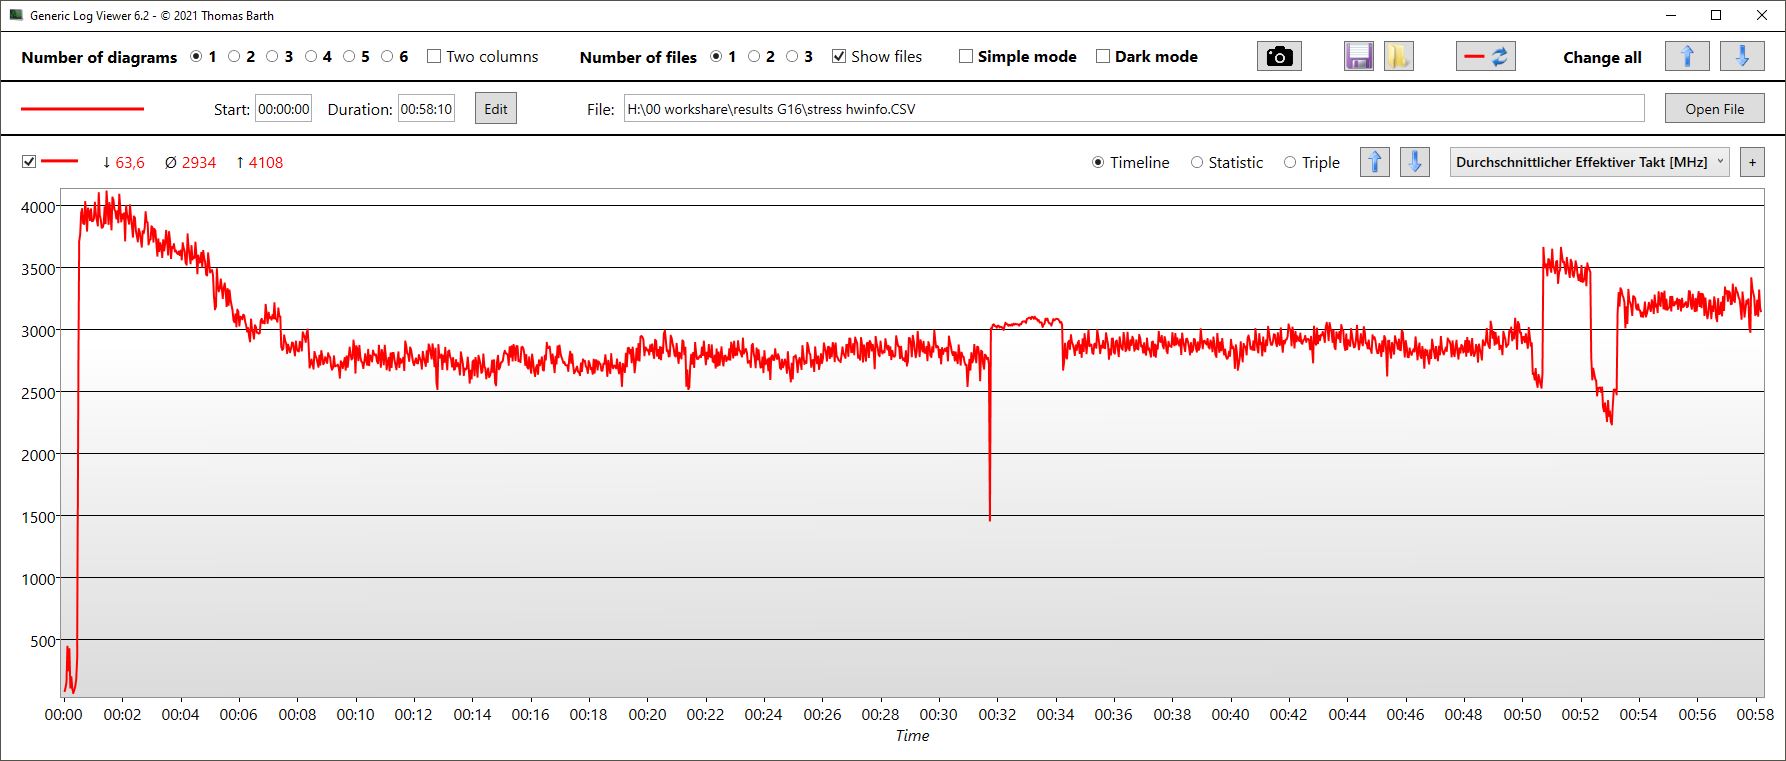
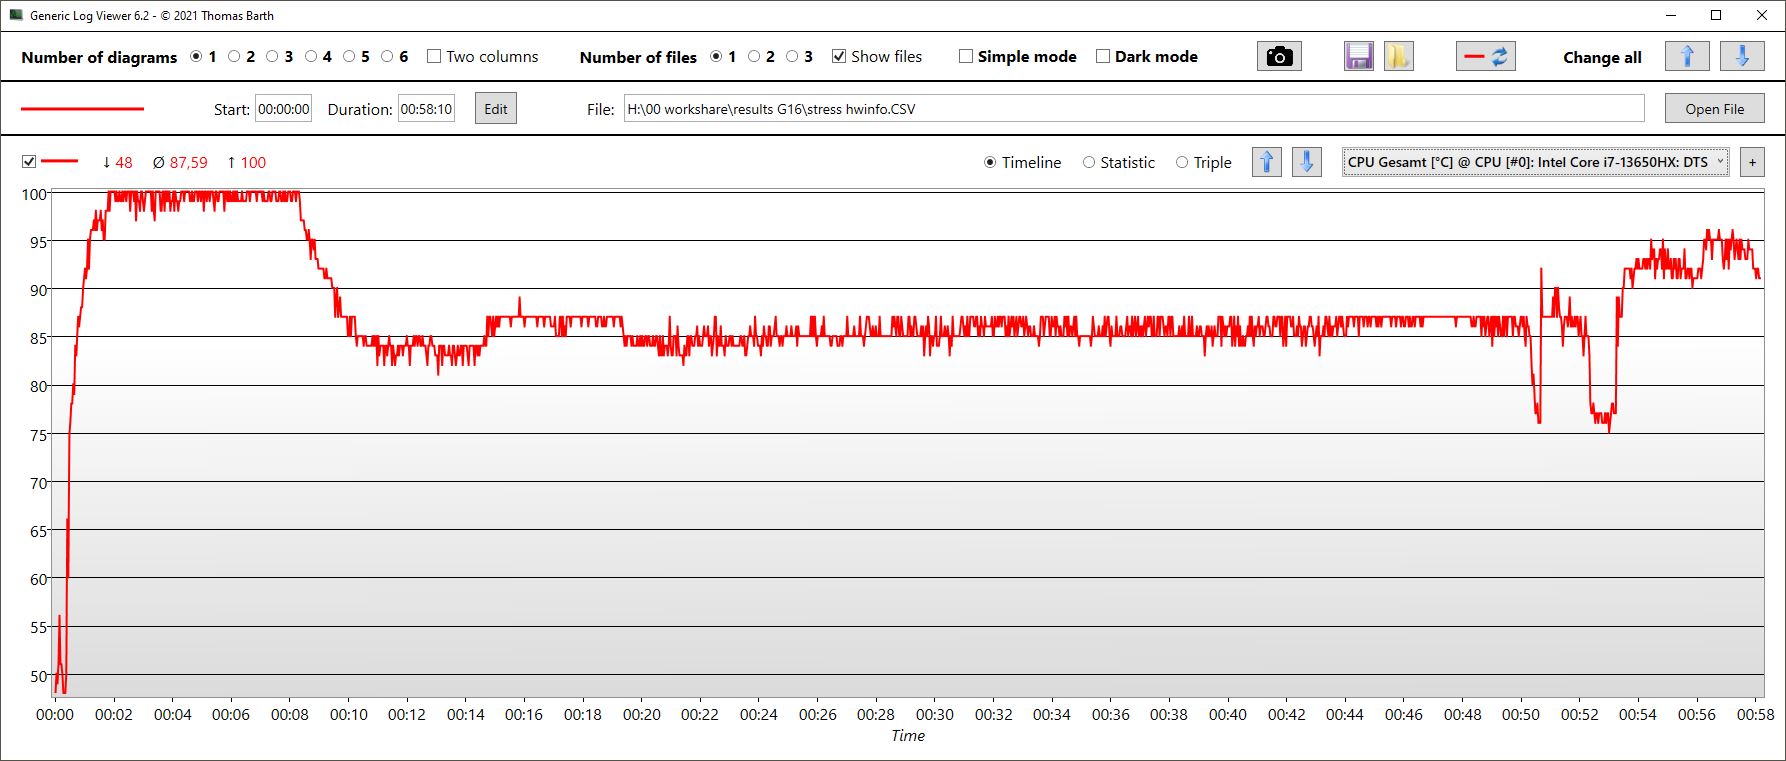
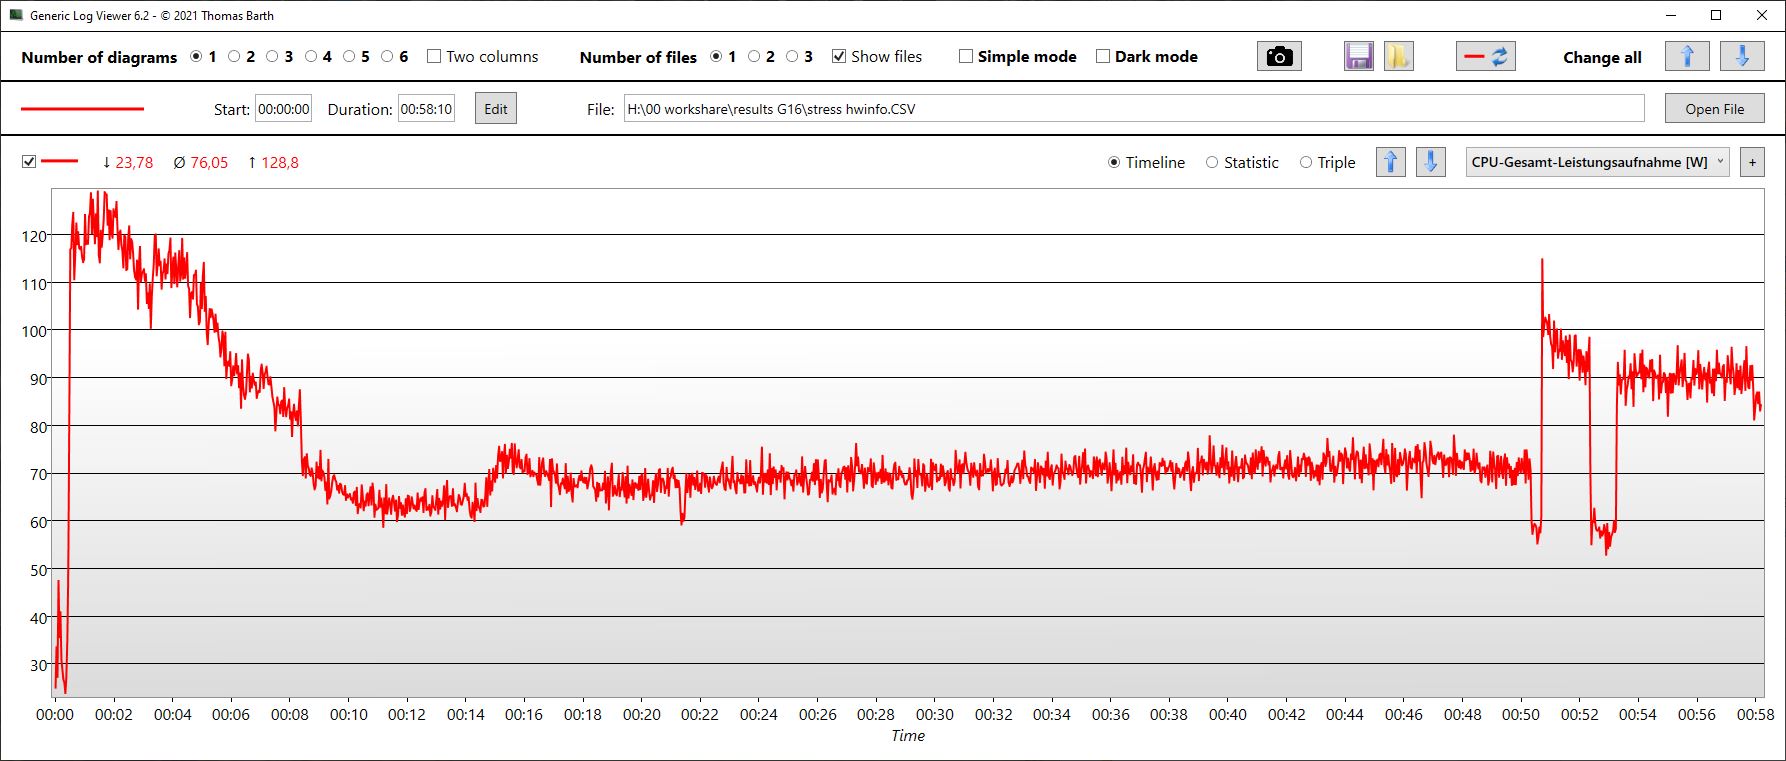
Pendant le test de stress, les cœurs ont brièvement été cadencés à 4,1 GHz. Malheureusement, cela a provoqué un échauffement du processeur jusqu'à 100 °C, après quoi la consommation d'énergie de l'appareil a chuté de ses 128 watts initiaux pour se stabiliser à environ 70 watts. La fréquence d'horloge du CPU s'est stabilisée à environ 2,9 GHz et les températures à environ 85 °C.
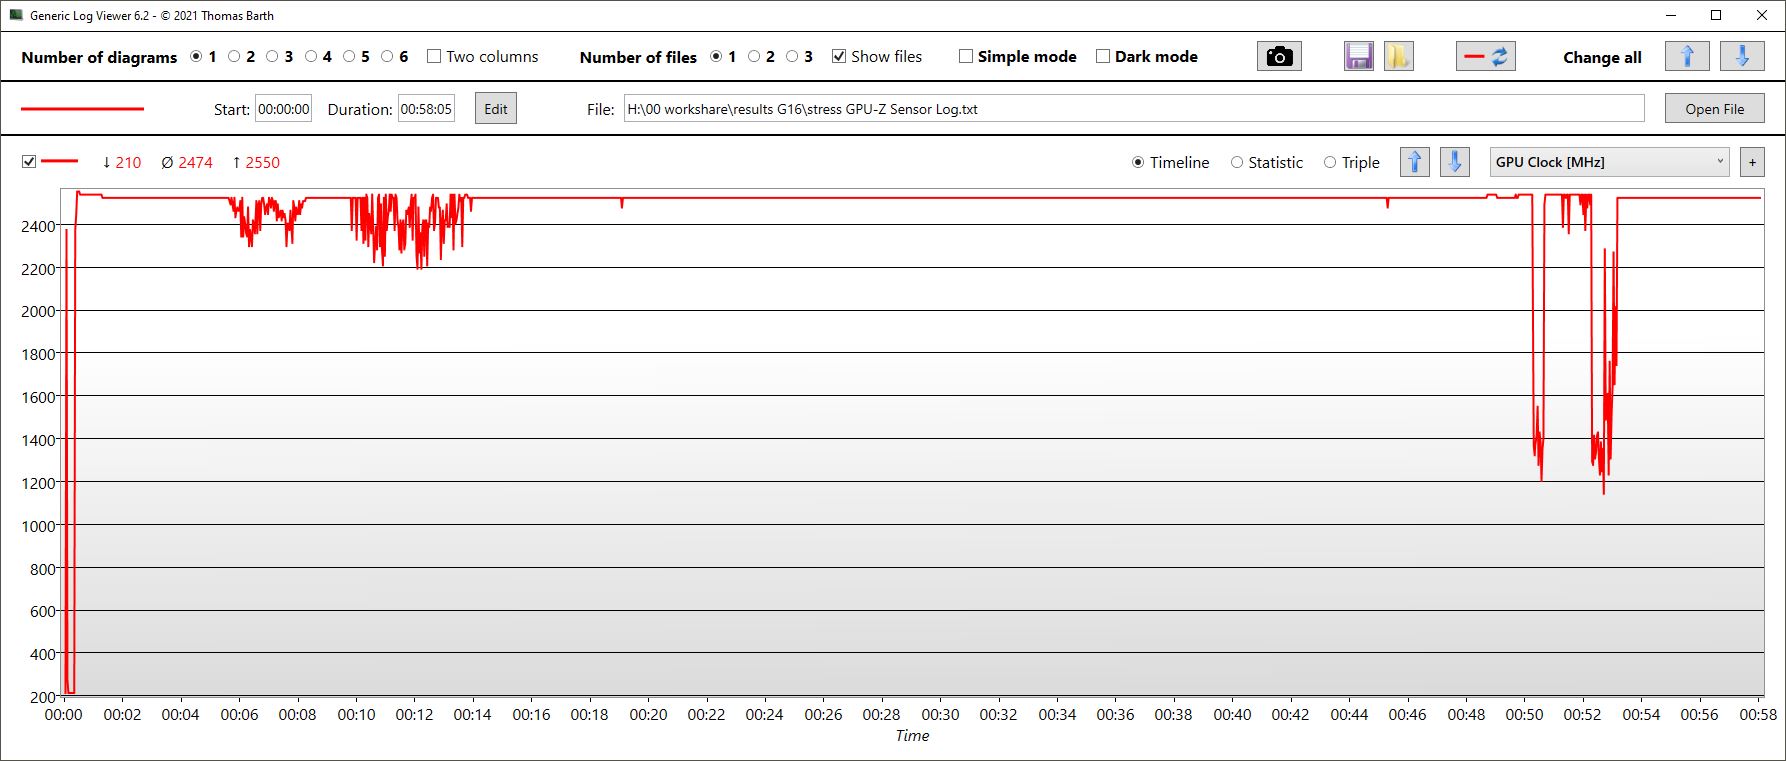
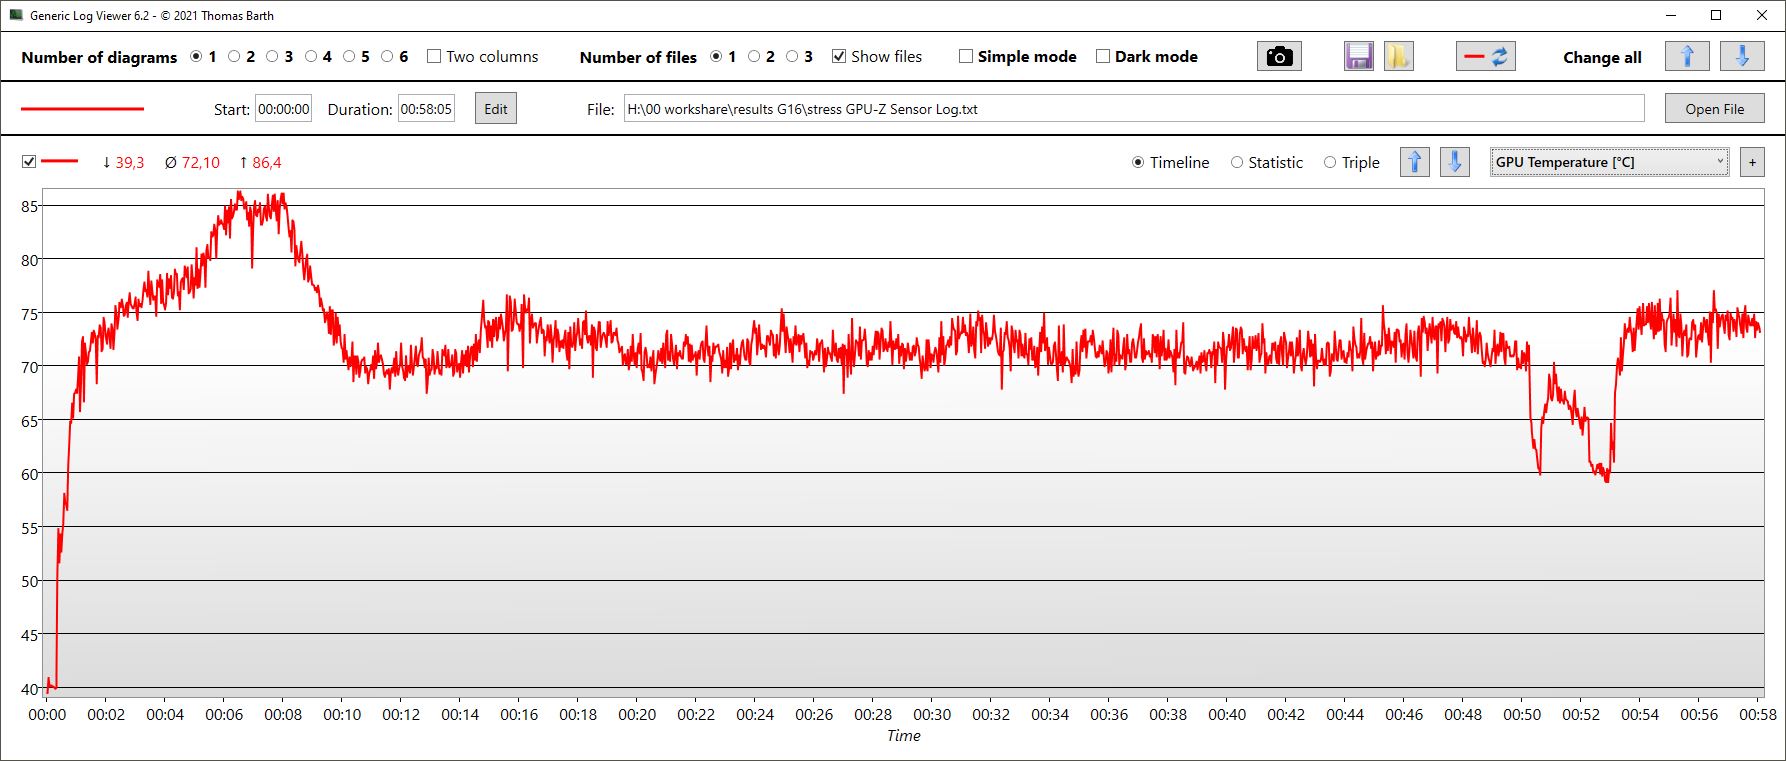
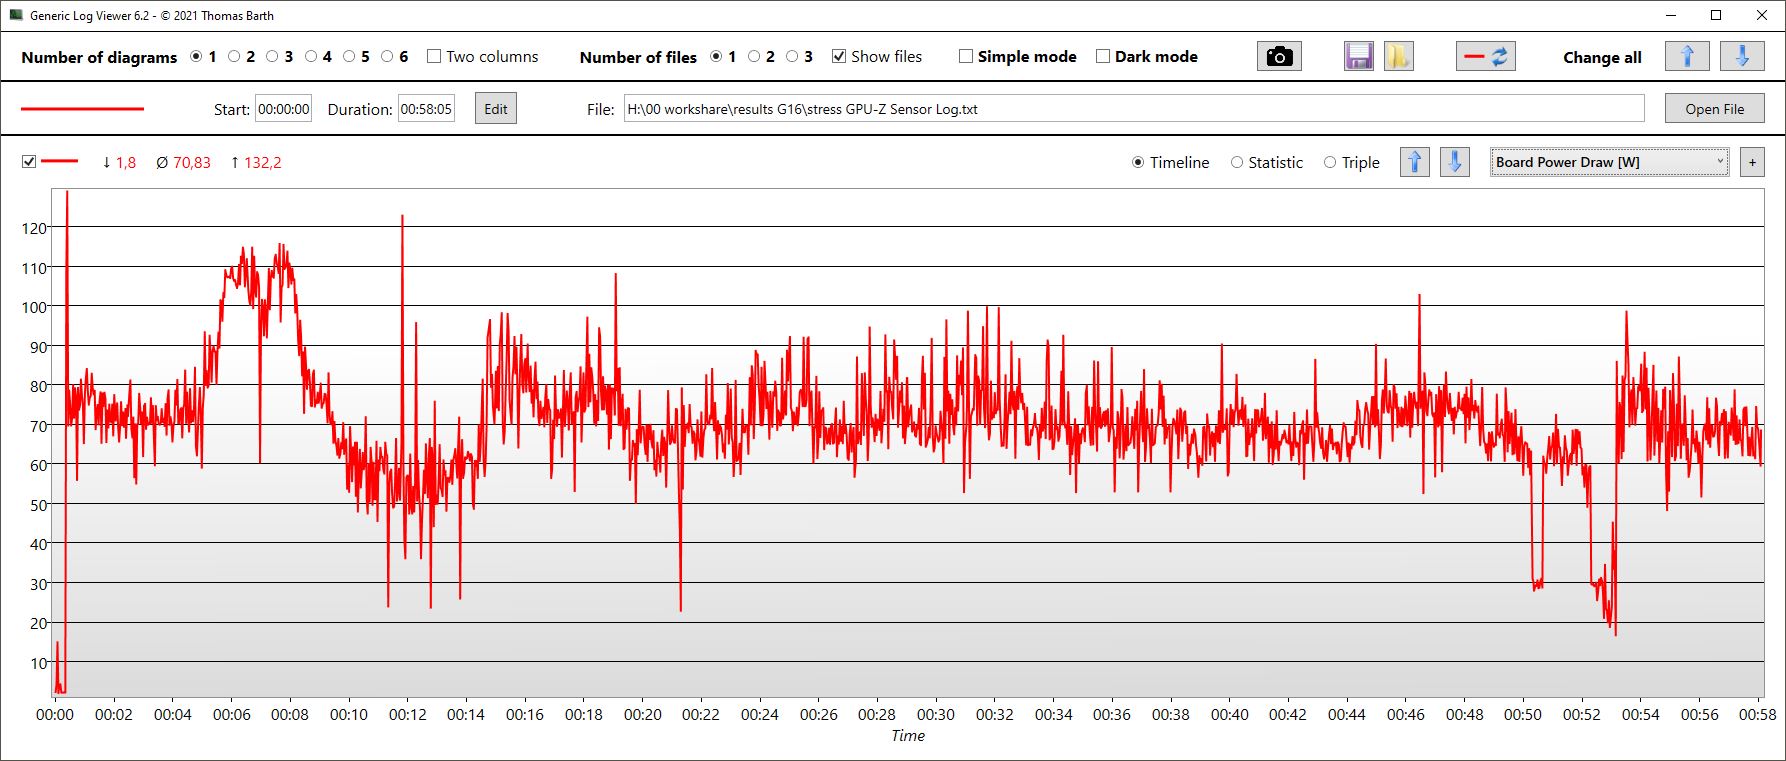
En revanche, la fréquence d'horloge du GPU est restée assez stable, entre 2,4 et 2,5 GHz, pendant toute la durée d'utilisation. Il en va de même pour l'horloge de la mémoire (2 GHz). La température de la puce s'est stabilisée autour de 72 °C et la consommation moyenne a été de 71 watts.
| Horloge du CPU (GHz) | Horloge du GPU (MHz) | Température moyenne du CPU (°C) | Température moyenne du GPU (°C) | |
| Prime95 + FurMark Stress | 2.9 | 2,490 | 85 | 72 |
| Witcher 3 Stress | 0,538 | 2 500 | 81 | 73 |
Haut-parleurs
Les haut-parleurs stéréo de l'ordinateur portable ne sont pas les meilleurs : Il n'y a pratiquement pas de basses, elles ont tendance à être trop silencieuses et même les médiums et les aigus ne sont pas très équilibrés ou linéaires. Seule une connexion pour casque d'écoute de 3,5 mm est disponible en tant que connexion audio analogique.
Dell G16, i7-13650HX, RTX 4060 analyse audio
(±) | le niveau sonore du haut-parleur est moyen mais bon (80.55# dB)
Basses 100 - 315 Hz
(-) | presque aucune basse - en moyenne 25.1% plus bas que la médiane
(-) | les basses ne sont pas linéaires (18.9% delta à la fréquence précédente)
Médiums 400 - 2000 Hz
(±) | médiane supérieure - en moyenne 8% supérieure à la médiane
(+) | les médiums sont linéaires (5.9% delta à la fréquence précédente)
Aiguës 2 - 16 kHz
(+) | des sommets équilibrés - à seulement 3.5% de la médiane
(±) | la linéarité des aigus est moyenne (8.6% delta à la fréquence précédente)
Globalement 100 - 16 000 Hz
(±) | la linéarité du son global est moyenne (23.4% de différence avec la médiane)
Par rapport à la même classe
» 85% de tous les appareils testés de cette catégorie étaient meilleurs, 5% similaires, 11% pires
» Le meilleur avait un delta de 6%, la moyenne était de 18%, le pire était de 132%.
Par rapport à tous les appareils testés
» 70% de tous les appareils testés étaient meilleurs, 6% similaires, 24% pires
» Le meilleur avait un delta de 4%, la moyenne était de 24%, le pire était de 134%.
Apple MacBook Pro 16 2021 M1 Pro analyse audio
(+) | les haut-parleurs peuvent jouer relativement fort (84.7# dB)
Basses 100 - 315 Hz
(+) | bonne basse - seulement 3.8% loin de la médiane
(+) | les basses sont linéaires (5.2% delta à la fréquence précédente)
Médiums 400 - 2000 Hz
(+) | médiane équilibrée - seulement 1.3% de la médiane
(+) | les médiums sont linéaires (2.1% delta à la fréquence précédente)
Aiguës 2 - 16 kHz
(+) | des sommets équilibrés - à seulement 1.9% de la médiane
(+) | les aigus sont linéaires (2.7% delta à la fréquence précédente)
Globalement 100 - 16 000 Hz
(+) | le son global est linéaire (4.6% différence à la médiane)
Par rapport à la même classe
» 0% de tous les appareils testés de cette catégorie étaient meilleurs, 0% similaires, 100% pires
» Le meilleur avait un delta de 5%, la moyenne était de 17%, le pire était de 45%.
Par rapport à tous les appareils testés
» 0% de tous les appareils testés étaient meilleurs, 0% similaires, 100% pires
» Le meilleur avait un delta de 4%, la moyenne était de 24%, le pire était de 134%.
Gestion de l'alimentation - Le Dell G16 obtient des résultats dans la moyenne de sa catégorie
Consommation électrique
Par rapport à ses performances, la consommation du G16 est plus que correcte. Dans l'ensemble, l'appareil est même devenu plus efficace. Il consomme désormais moins que son prédécesseur, surtout en mode veille. Dans les jeux, il ne consomme qu'environ 5 % de plus, avec une augmentation simultanée des performances d'environ 14 %.
Dans les jeux, les Alienware et MSI Raider, aussi rapides, consomment presque autant, à savoir 185 watts en moyenne pour The Witcher 3. Sa consommation maximale à court terme est de 255 watts.
Dans ce contexte, il est très surprenant que Dell ait inclus un énorme, encombrant et lourd bloc d'alimentation de 330 watts avec le G16 équipé d'une RTX 4060. C'est complètement surdimensionné pour le matériel installé. On peut supposer que Dell a simplement livré le même bloc d'alimentation avec toutes les configurations afin qu'il soit également équipé pour le i9-13900HX et la RTX 4070. Un bloc d'alimentation plus petit et plus léger aurait été plus pratique pour les clients qui achètent ce modèle.
| Éteint/en veille | |
| Au repos | |
| Fortement sollicité |
|
Légende:
min: | |
| Dell G16, i7-13650HX, RTX 4060 i7-13650HX, GeForce RTX 4060 Laptop GPU, WD PC SN740 SDDPNQD-1T00, IPS, 2560x1600, 16" | Dell G16 7620 i7-12700H, GeForce RTX 3060 Laptop GPU, WDC PC SN810 512GB, IPS, 2560x1600, 16" | MSI Raider GE68HX 13VF i9-13950HX, GeForce RTX 4060 Laptop GPU, Samsung PM9B1 1024GB MZVL41T0HBLB, IPS, 1900x1200, 16" | Lenovo Legion Slim 5 16APH8 R7 7840HS, GeForce RTX 4060 Laptop GPU, SK hynix PC801 HFS512GEJ9X115N, IPS, 2560x1600, 16" | Alienware m16 R1 Intel i7-13700HX, GeForce RTX 4060 Laptop GPU, Kioxia KXG70ZNV512G, IPS, 2560x1600, 16" | Lenovo LOQ 16IRH8 i7-13620H, GeForce RTX 4060 Laptop GPU, Solidigm SSDPFINW512GZL, IPS, 2560x1600, 16" | Moyenne NVIDIA GeForce RTX 4060 Laptop GPU | Moyenne de la classe Gaming | |
|---|---|---|---|---|---|---|---|---|
| Power Consumption | -21% | -32% | 9% | -9% | -12% | -1% | -19% | |
| Idle Minimum * (Watt) | 11 | 14.4 -31% | 15.8 -44% | 9.4 15% | 10 9% | 17.2 -56% | 11.5 ? -5% | 13.2 ? -20% |
| Idle Average * (Watt) | 14.8 | 17.8 -20% | 19.4 -31% | 15.5 -5% | 14 5% | 19.3 -30% | 16 ? -8% | 18.9 ? -28% |
| Idle Maximum * (Watt) | 16.8 | 31.5 -88% | 27.3 -63% | 24.4 -45% | 21 -25% | 21.2 -26% | 20.3 ? -21% | 24.3 ? -45% |
| Load Average * (Watt) | 103.7 | 101.2 2% | 114.7 -11% | 74.1 29% | 119 -15% | 90 13% | 92.9 ? 10% | 108.3 ? -4% |
| Witcher 3 ultra * (Watt) | 185 | 176.9 4% | 185.5 -0% | 112.9 39% | 186.7 -1% | 168 9% | ||
| Load Maximum * (Watt) | 255 | 242.9 5% | 364.2 -43% | 206.5 19% | 323 -27% | 211 17% | 210 ? 18% | 254 ? -0% |
* ... Moindre est la valeur, meilleures sont les performances
Power consumption Witcher 3 / stress test
Power consumption with external monitor
Délais d'exécution
Dell a intégré une batterie de 86 Wh dans l'ordinateur portable. La concurrence est équipée de la même manière. Cela suffit au G16 pour atteindre des durées d'autonomie d'environ 5,5 heures (luminosité maximale) à près de 6,5 heures (150 nits) lorsque vous surfez sur le web ou regardez des vidéos. Le gamer Dell se situe donc dans la moyenne de sa catégorie.
| Dell G16, i7-13650HX, RTX 4060 i7-13650HX, GeForce RTX 4060 Laptop GPU, 86 Wh | Dell G16 7620 i7-12700H, GeForce RTX 3060 Laptop GPU, 84 Wh | MSI Raider GE68HX 13VF i9-13950HX, GeForce RTX 4060 Laptop GPU, 99.9 Wh | Lenovo Legion Slim 5 16APH8 R7 7840HS, GeForce RTX 4060 Laptop GPU, 80 Wh | Alienware m16 R1 Intel i7-13700HX, GeForce RTX 4060 Laptop GPU, 86 Wh | Lenovo LOQ 16IRH8 i7-13620H, GeForce RTX 4060 Laptop GPU, 80 Wh | Moyenne de la classe Gaming | |
|---|---|---|---|---|---|---|---|
| Autonomie de la batterie | -34% | 23% | 3% | -20% | 5% | 18% | |
| H.264 (h) | 6.4 | 5.6 -13% | 6.4 0% | 8.26 ? 29% | |||
| WiFi v1.3 (h) | 6.3 | 5 -21% | 6.8 8% | 7.1 13% | 4.8 -24% | 6.3 0% | 7.04 ? 12% |
| Load (h) | 1.3 | 0.7 -46% | 1.8 38% | 1.2 -8% | 1 -23% | 1.5 15% | 1.47 ? 13% |
| Reader / Idle (h) | 7.1 | 8.8 | 11.7 | 6.4 | 8.71 ? |
Points positifs
Points négatifs
Verdict - Une alternative Alienware abordable avec quelques petits problèmes
Le Dell G16 7630 semble légèrement plus élégant et plus abordable que la série Alienware de Dell. Ses performances restent bonnes et l'un des aspects très positifs est que le gamer reste silencieux pendant les jeux par rapport à de nombreux concurrents.
Dell a fait quelques économies au niveau de la webcam et de la construction en particulier, ce qui est probablement supportable pour les clients ayant un budget serré, mais qui est tout de même ennuyeux par moments : Par exemple, la connexion électrique du portable qui glisse petit à petit lorsque l'appareil bouge, le bloc d'alimentation lourd et encombrant ou le fait que seule la version équipée d'un processeur i9-13900HX et une RTX 4070 supporte Thunderbolt. Notre échantillon de test avec un i7-13650H et une RTX 4060ne l'est pas et ce dernier manque tout autant de transparence pour les clients que les deux différents types d'affichage qui ne sont listés que dans le manuel et ne diffèrent que par les espaces colorimétriques et les taux de rafraîchissement.
Le Dell G16 7630 est un ordinateur portable de jeu de milieu de gamme assez grand et lourd qui bénéficie de bonnes performances et d'un fonctionnement silencieux. En ce qui concerne la connectivité et la construction, Dell pourrait se montrer plus généreux.
Si vous aimez les choses encore plus élégantes et plus efficaces, alors il peut être intéressant de jeter un coup d'œil au modèle un peu plus faible Dell Inspiron 16 Plus 7630. Vous pouvez également opter pour le Lenovo Legion Slim 5 et, si votre budget est moins serré, le Legion Pro 5 16.
Prix et disponibilité
Le Dell G16 7630 est actuellement proposé sur Amazon au prix de 1 401,84 dollars. Cette version est équipée d'un Intel Core i9-13900HX, d'une RTX 4070, de 16 Go de RAM et d'un SSD de 1 To.
Dell G16, i7-13650HX, RTX 4060
- 02/13/2024 v7 (old)
Christian Hintze
Transparency
La sélection des appareils à examiner est effectuée par notre équipe éditoriale. L'échantillon de test a été prêté à l'auteur par le fabricant ou le détaillant pour les besoins de cet examen. Le prêteur n'a pas eu d'influence sur cette évaluation et le fabricant n'a pas reçu de copie de cette évaluation avant sa publication. Il n'y avait aucune obligation de publier cet article. En tant que média indépendant, Notebookcheck n'est pas soumis à l'autorité des fabricants, des détaillants ou des éditeurs.
Voici comment Notebookcheck teste
Chaque année, Notebookcheck examine de manière indépendante des centaines d'ordinateurs portables et de smartphones en utilisant des procédures standardisées afin de garantir que tous les résultats sont comparables. Nous avons continuellement développé nos méthodes de test depuis environ 20 ans et avons établi des normes industrielles dans le processus. Dans nos laboratoires de test, des équipements de mesure de haute qualité sont utilisés par des techniciens et des rédacteurs expérimentés. Ces tests impliquent un processus de validation en plusieurs étapes. Notre système d'évaluation complexe repose sur des centaines de mesures et de points de référence bien fondés, ce qui garantit l'objectivité.Price comparison

