Test du Lenovo Legion 5i 16 G9 : PC portable de jeu puissant (Raptor Lake-HX, moteur d'IA)
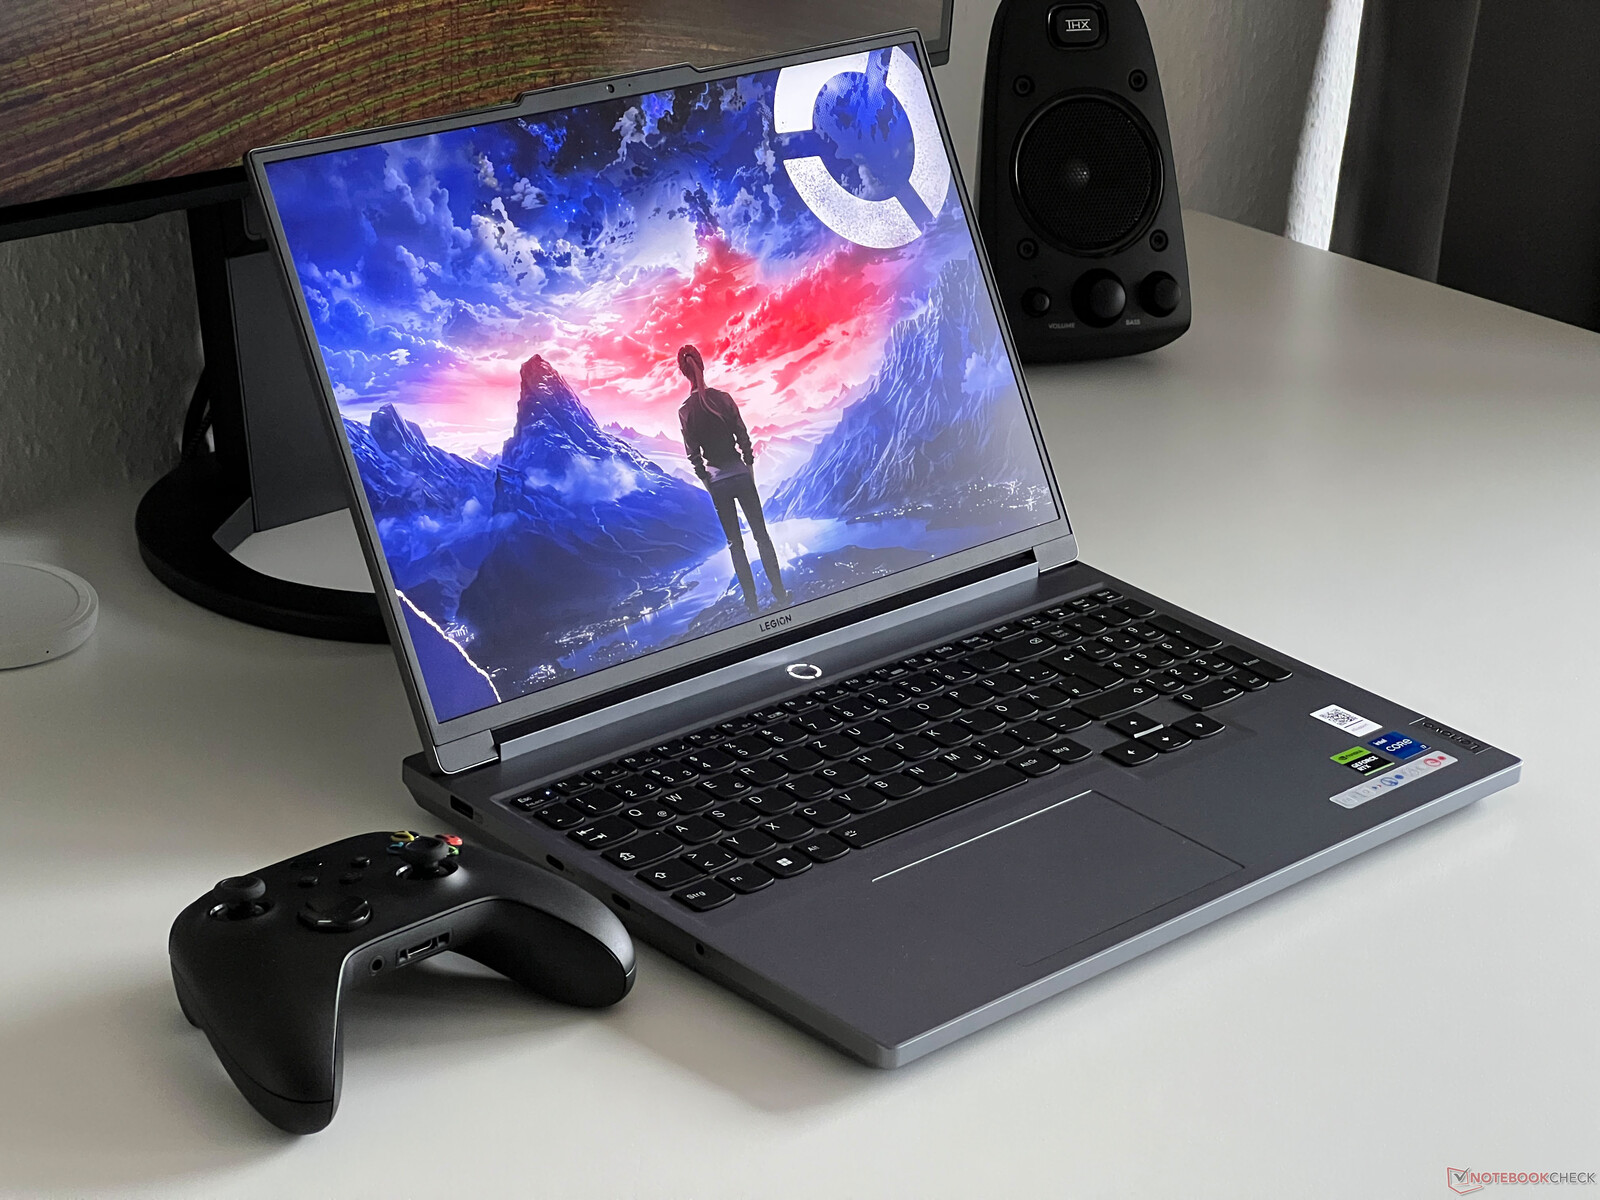
Lenovo vient à peine de dévoiler son nouvel ordinateur de jeu, le Legion 5i 16 G9, au CES de cette année, que nous avons déjà eu l'occasion de le tester. L'ordinateur portable de jeu de milieu de gamme de Lenovo se situe juste entre la série LOQ, moins chère, et l'ordinateur plus onéreux Legion 5 Pro. Avec son nouveau processeur Raptor-Lake-HX, le Core i7-14650HXune version de 115 watts du processeur RTX 4060 Laptop (y compris Advanced Optimus) et un écran WQXGA rapide de 240 Hz, le nouveau Legion 5i 16 se concentre entièrement sur la performance, laissant de côté des éléments tels que l'éclairage étendu du boîtier. De plus, le fabricant utilise une puce d'intelligence artificielle spéciale - supposée être l'AI Engine+ de Lenovo - pour améliorer l'expérience de jeu des utilisateurs.
Nous avons testé la version du Legion 5i 16IRX G9 avec un processeur Core-i7, un ordinateur portable RTX 4060, un écran 240 Hz, 16 Go de RAM ainsi qu'un SSD PCIe de 1 To pour 1 610 dollars.
Comparaison avec les concurrents potentiels
Note | Date | Modèle | Poids | Épaisseur | Taille | Résolution | Prix |
|---|---|---|---|---|---|---|---|
| 89.1 % v7 (old) | 02/24 | Lenovo Legion 5 16IRX G9 i7-14650HX, GeForce RTX 4060 Laptop GPU | 2.4 kg | 25.2 mm | 16.00" | 2560x1600 | |
| 89.2 % v7 (old) | 10/23 | Schenker XMG CORE 16 (L23) R7 7840HS, GeForce RTX 4070 Laptop GPU | 2.4 kg | 26.1 mm | 16.00" | 2560x1600 | |
| 85.1 % v7 (old) | 09/23 | HP Victus 16-r0077ng i7-13700H, GeForce RTX 4070 Laptop GPU | 2.4 kg | 24 mm | 16.10" | 1920x1080 | |
| 87.3 % v7 (old) | 09/23 | Lenovo LOQ 16IRH8 i7-13620H, GeForce RTX 4060 Laptop GPU | 2.7 kg | 25.9 mm | 16.00" | 2560x1600 | |
| 87.7 % v7 (old) | 08/23 | Lenovo Legion Slim 5 16APH8 R7 7840HS, GeForce RTX 4060 Laptop GPU | 2.4 kg | 25.2 mm | 16.00" | 2560x1600 | |
| 85.6 % v7 (old) | 09/23 | HP Victus 16-r0076TX i5-13500HX, GeForce RTX 4050 Laptop GPU | 2.3 kg | 22.9 mm | 16.10" | 1920x1080 | |
| 88.3 % v7 (old) | 09/23 | Alienware m16 R1 Intel i7-13700HX, GeForce RTX 4060 Laptop GPU | 3 kg | 25.4 mm | 16.00" | 2560x1600 | |
| 87.9 % v7 (old) | 05/23 | Lenovo Legion Pro 5 16IRX8 i7-13700HX, GeForce RTX 4060 Laptop GPU | 2.5 kg | 26.8 mm | 16.00" | 2560x1600 |
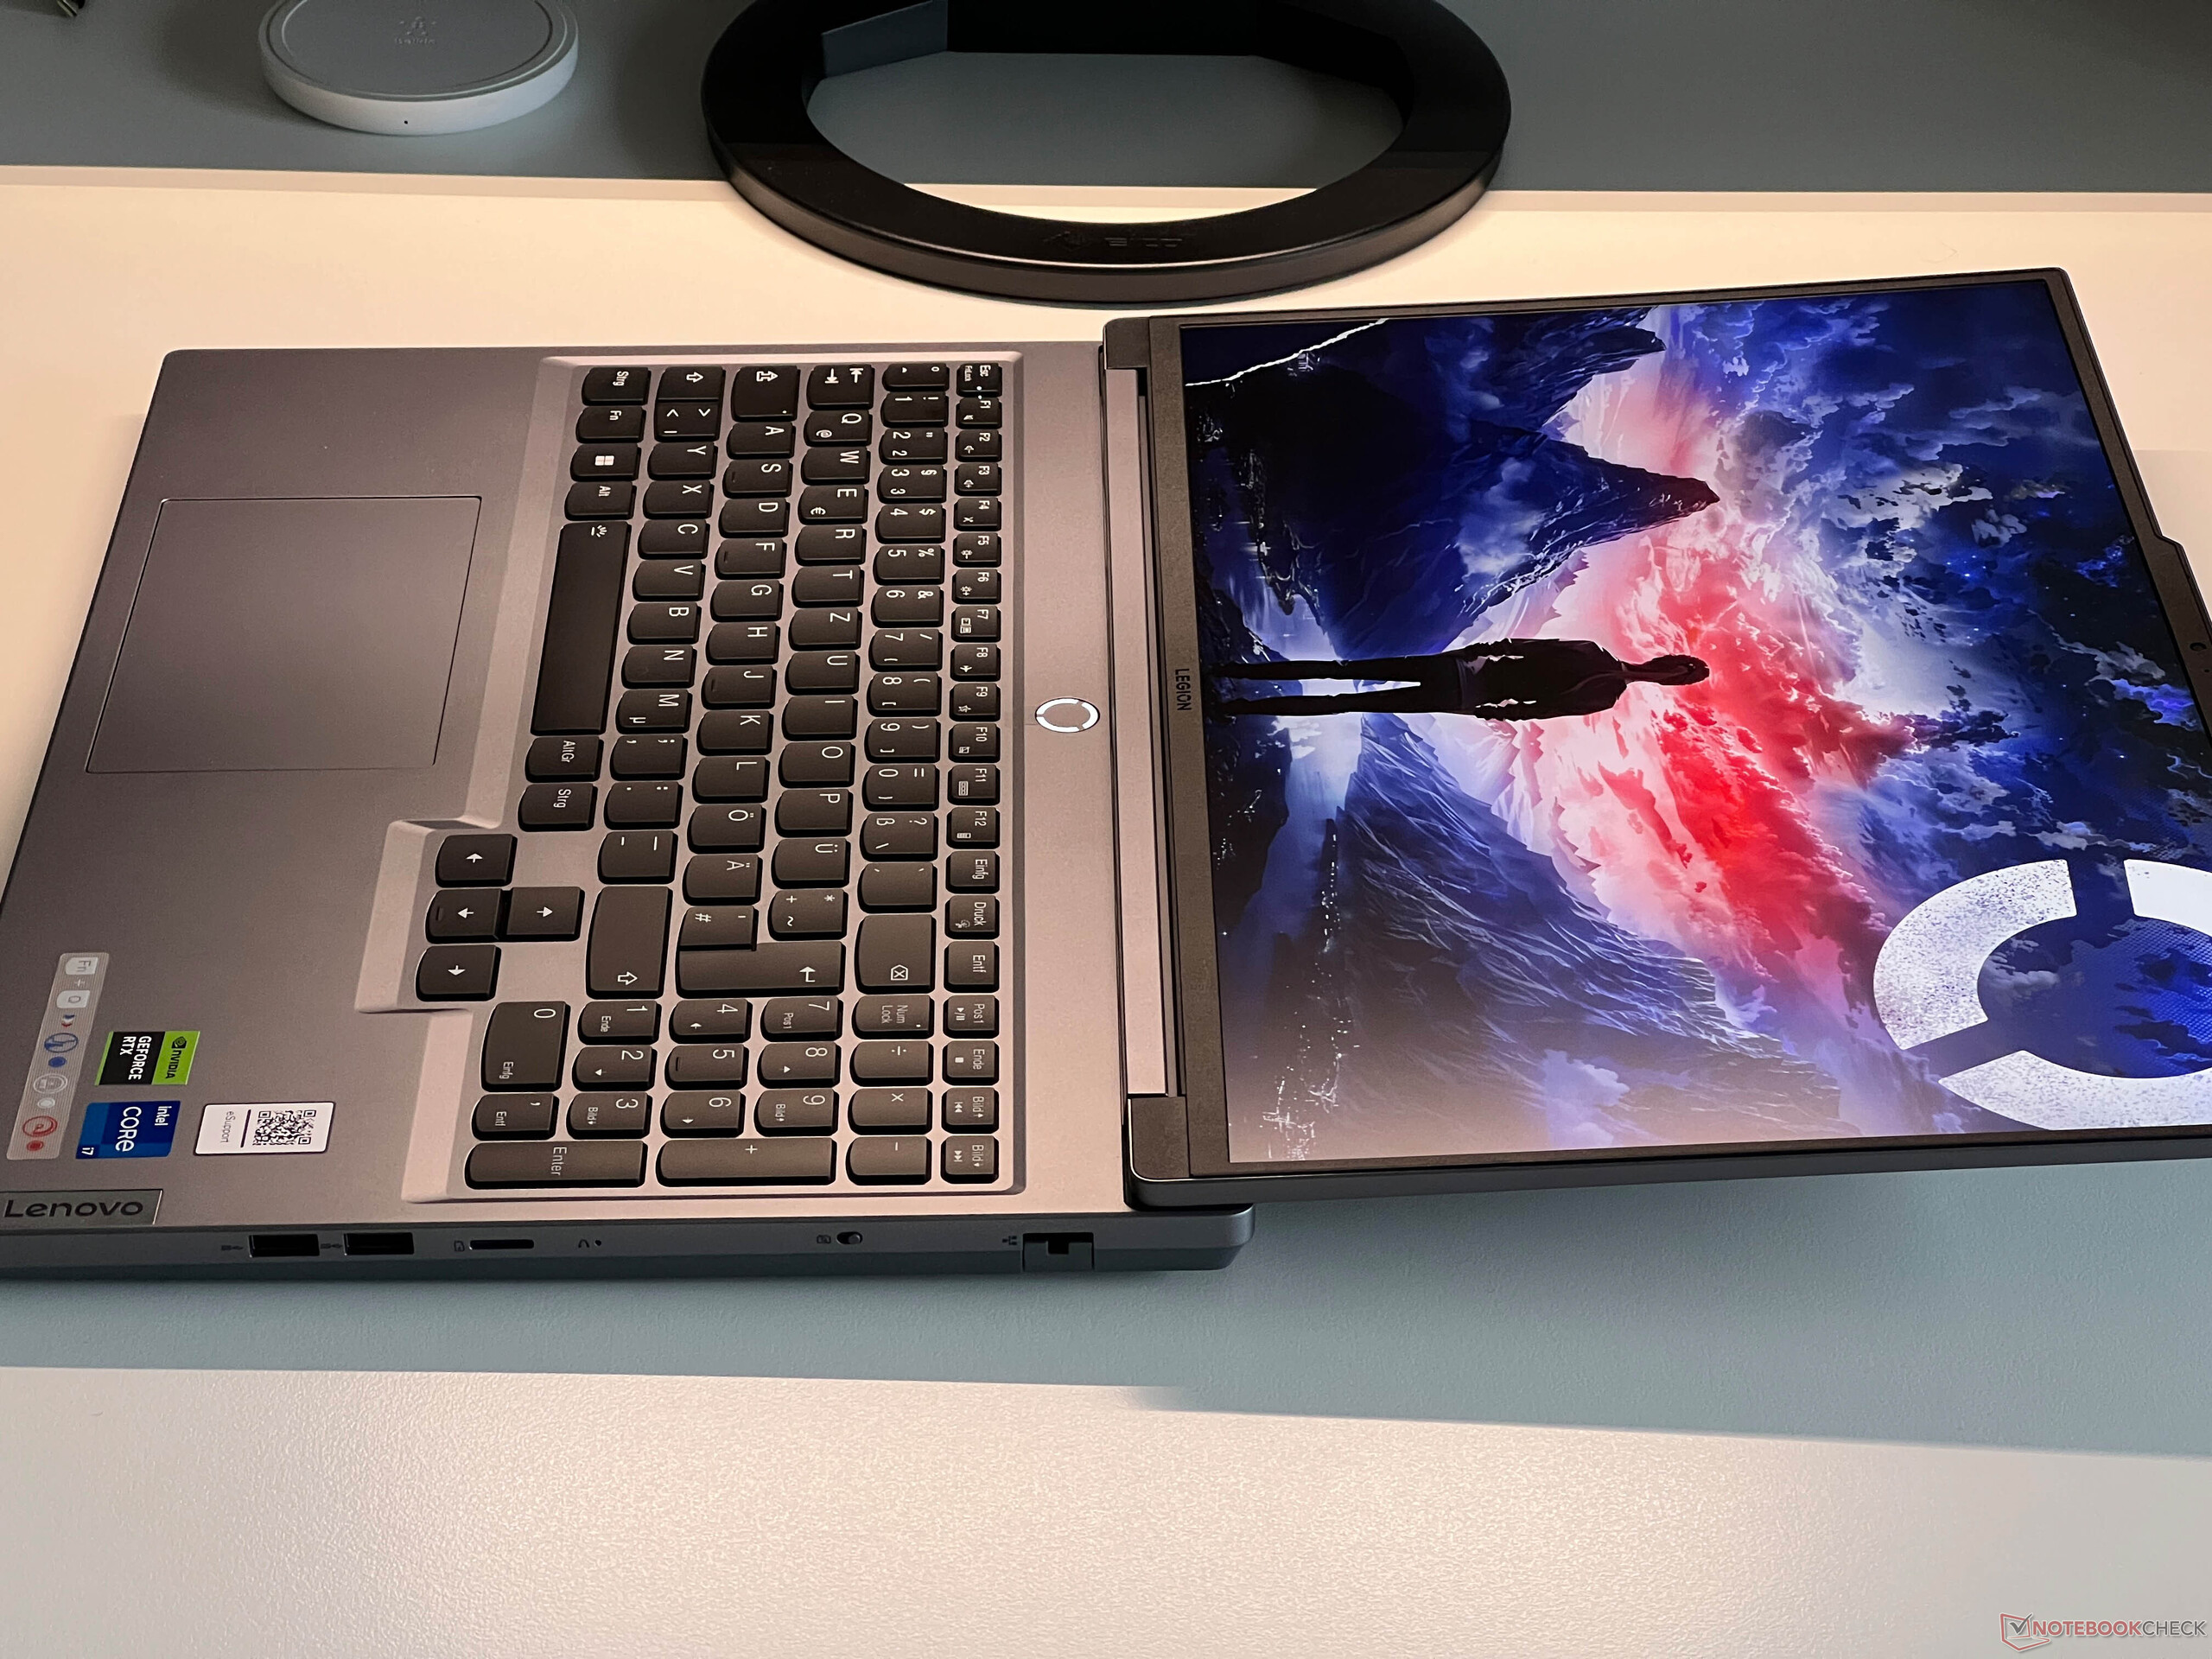
Boîtier - Le site Legion est en partie en aluminium
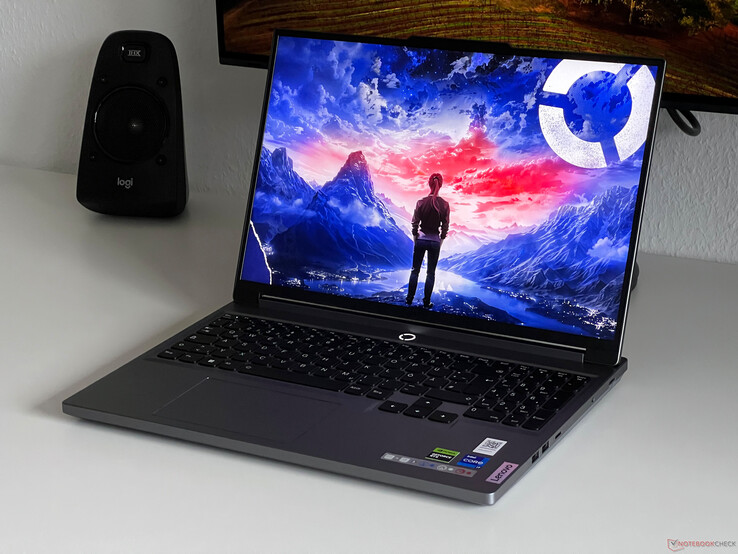
Le boîtier de l'appareil est très élégant pour un ordinateur portable de jeu et si vous préférez que les choses soient plus accrocheuses, alors le Legion 5i pourrait bien vous décevoir. A part le clavier et les bords noirs, il n'y a pas d'autres contrastes de couleurs et Lenovo a décidé de ne pas installer d'éclairage dans le boîtier. Seule la LED d'état entourant le bouton d'alimentation s'allume en quatre couleurs qui dépendent du profil énergétique utilisé. Au moins, cela signifie que vous pouvez également utiliser l'ordinateur portable dans des environnements plus professionnels, comme à l'université.
En termes de qualité, le boîtier donne une impression de haut de gamme, même si seul le couvercle est en aluminium. L'unité de base est entièrement en plastique, mais la partie supérieure reste très agréable au toucher. Seul le fond de l'étui est un peu plus rugueux, ce qui lui donne un aspect un peu moins cher. L'un des avantages de l'étui est qu'il attire peu la saleté et les traces de doigts. Sa stabilité est bonne dans l'ensemble, mais ce n'est pas une surprise compte tenu de l'épaisseur de l'unité de base (2 cm au maximum à l'arrière). Les charnières de l'écran sont bien réglées et permettent d'ouvrir le portable d'une seule main ; l'angle d'ouverture maximal est de 180 degrés.
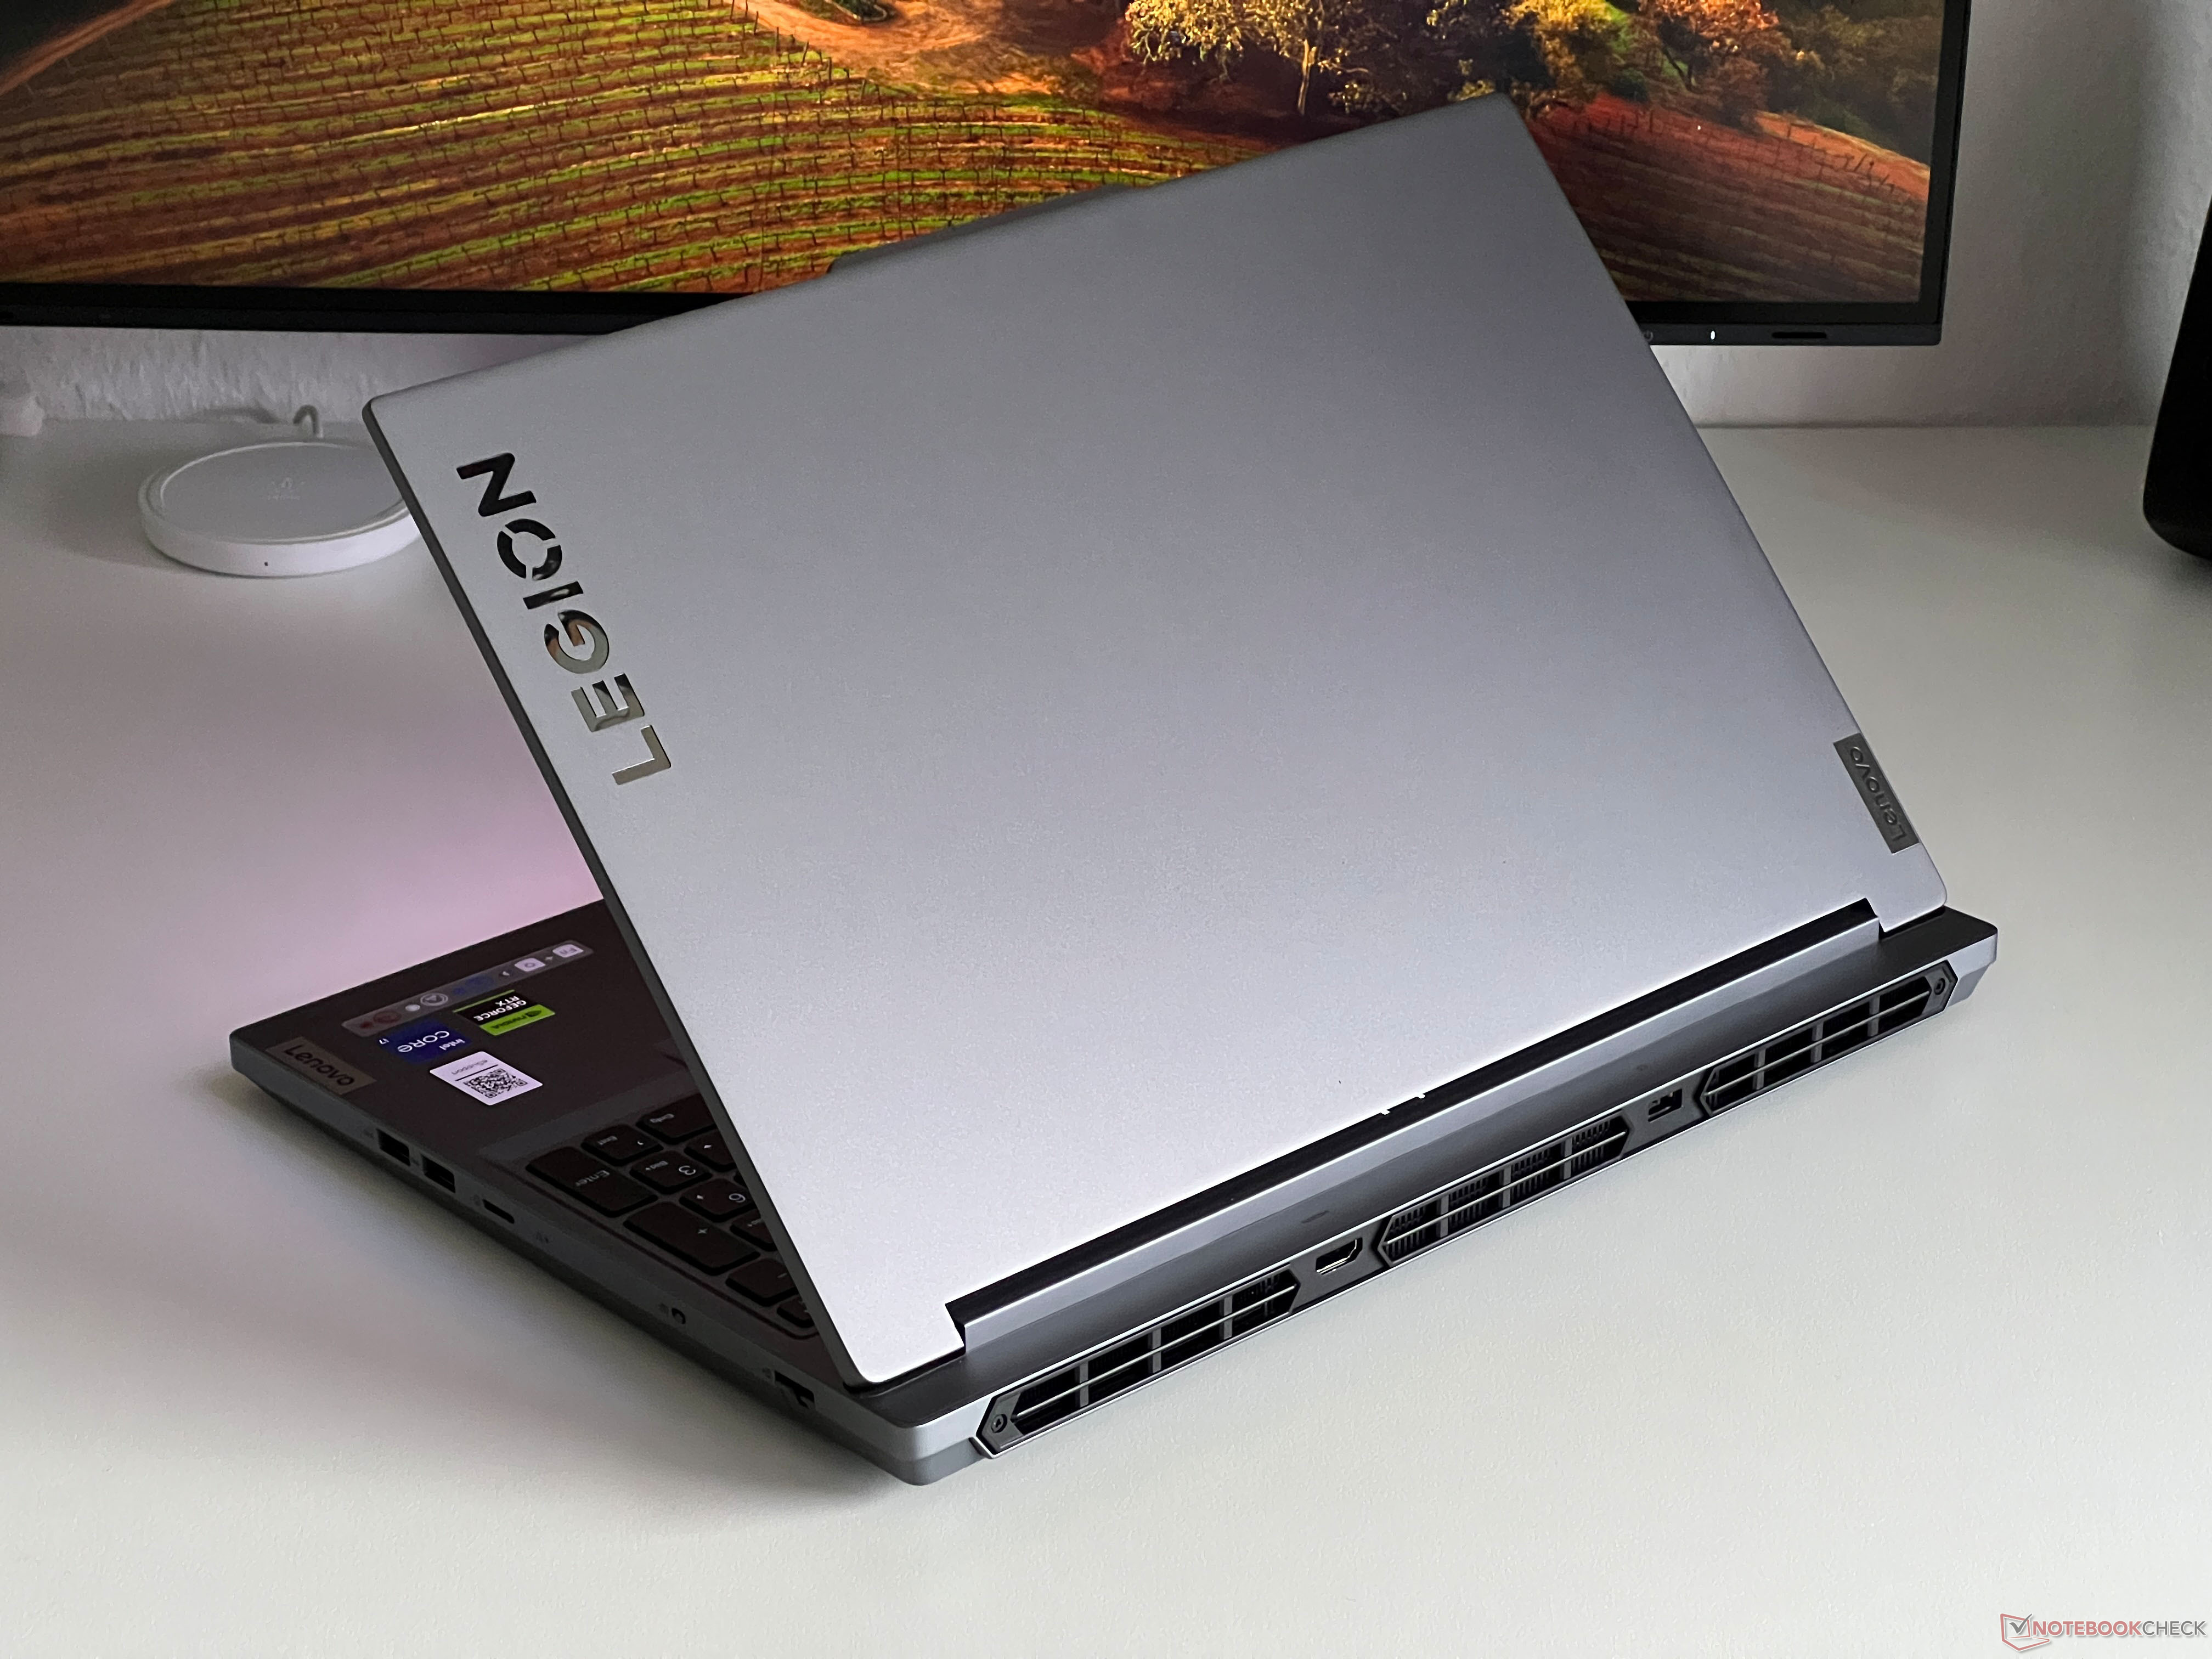
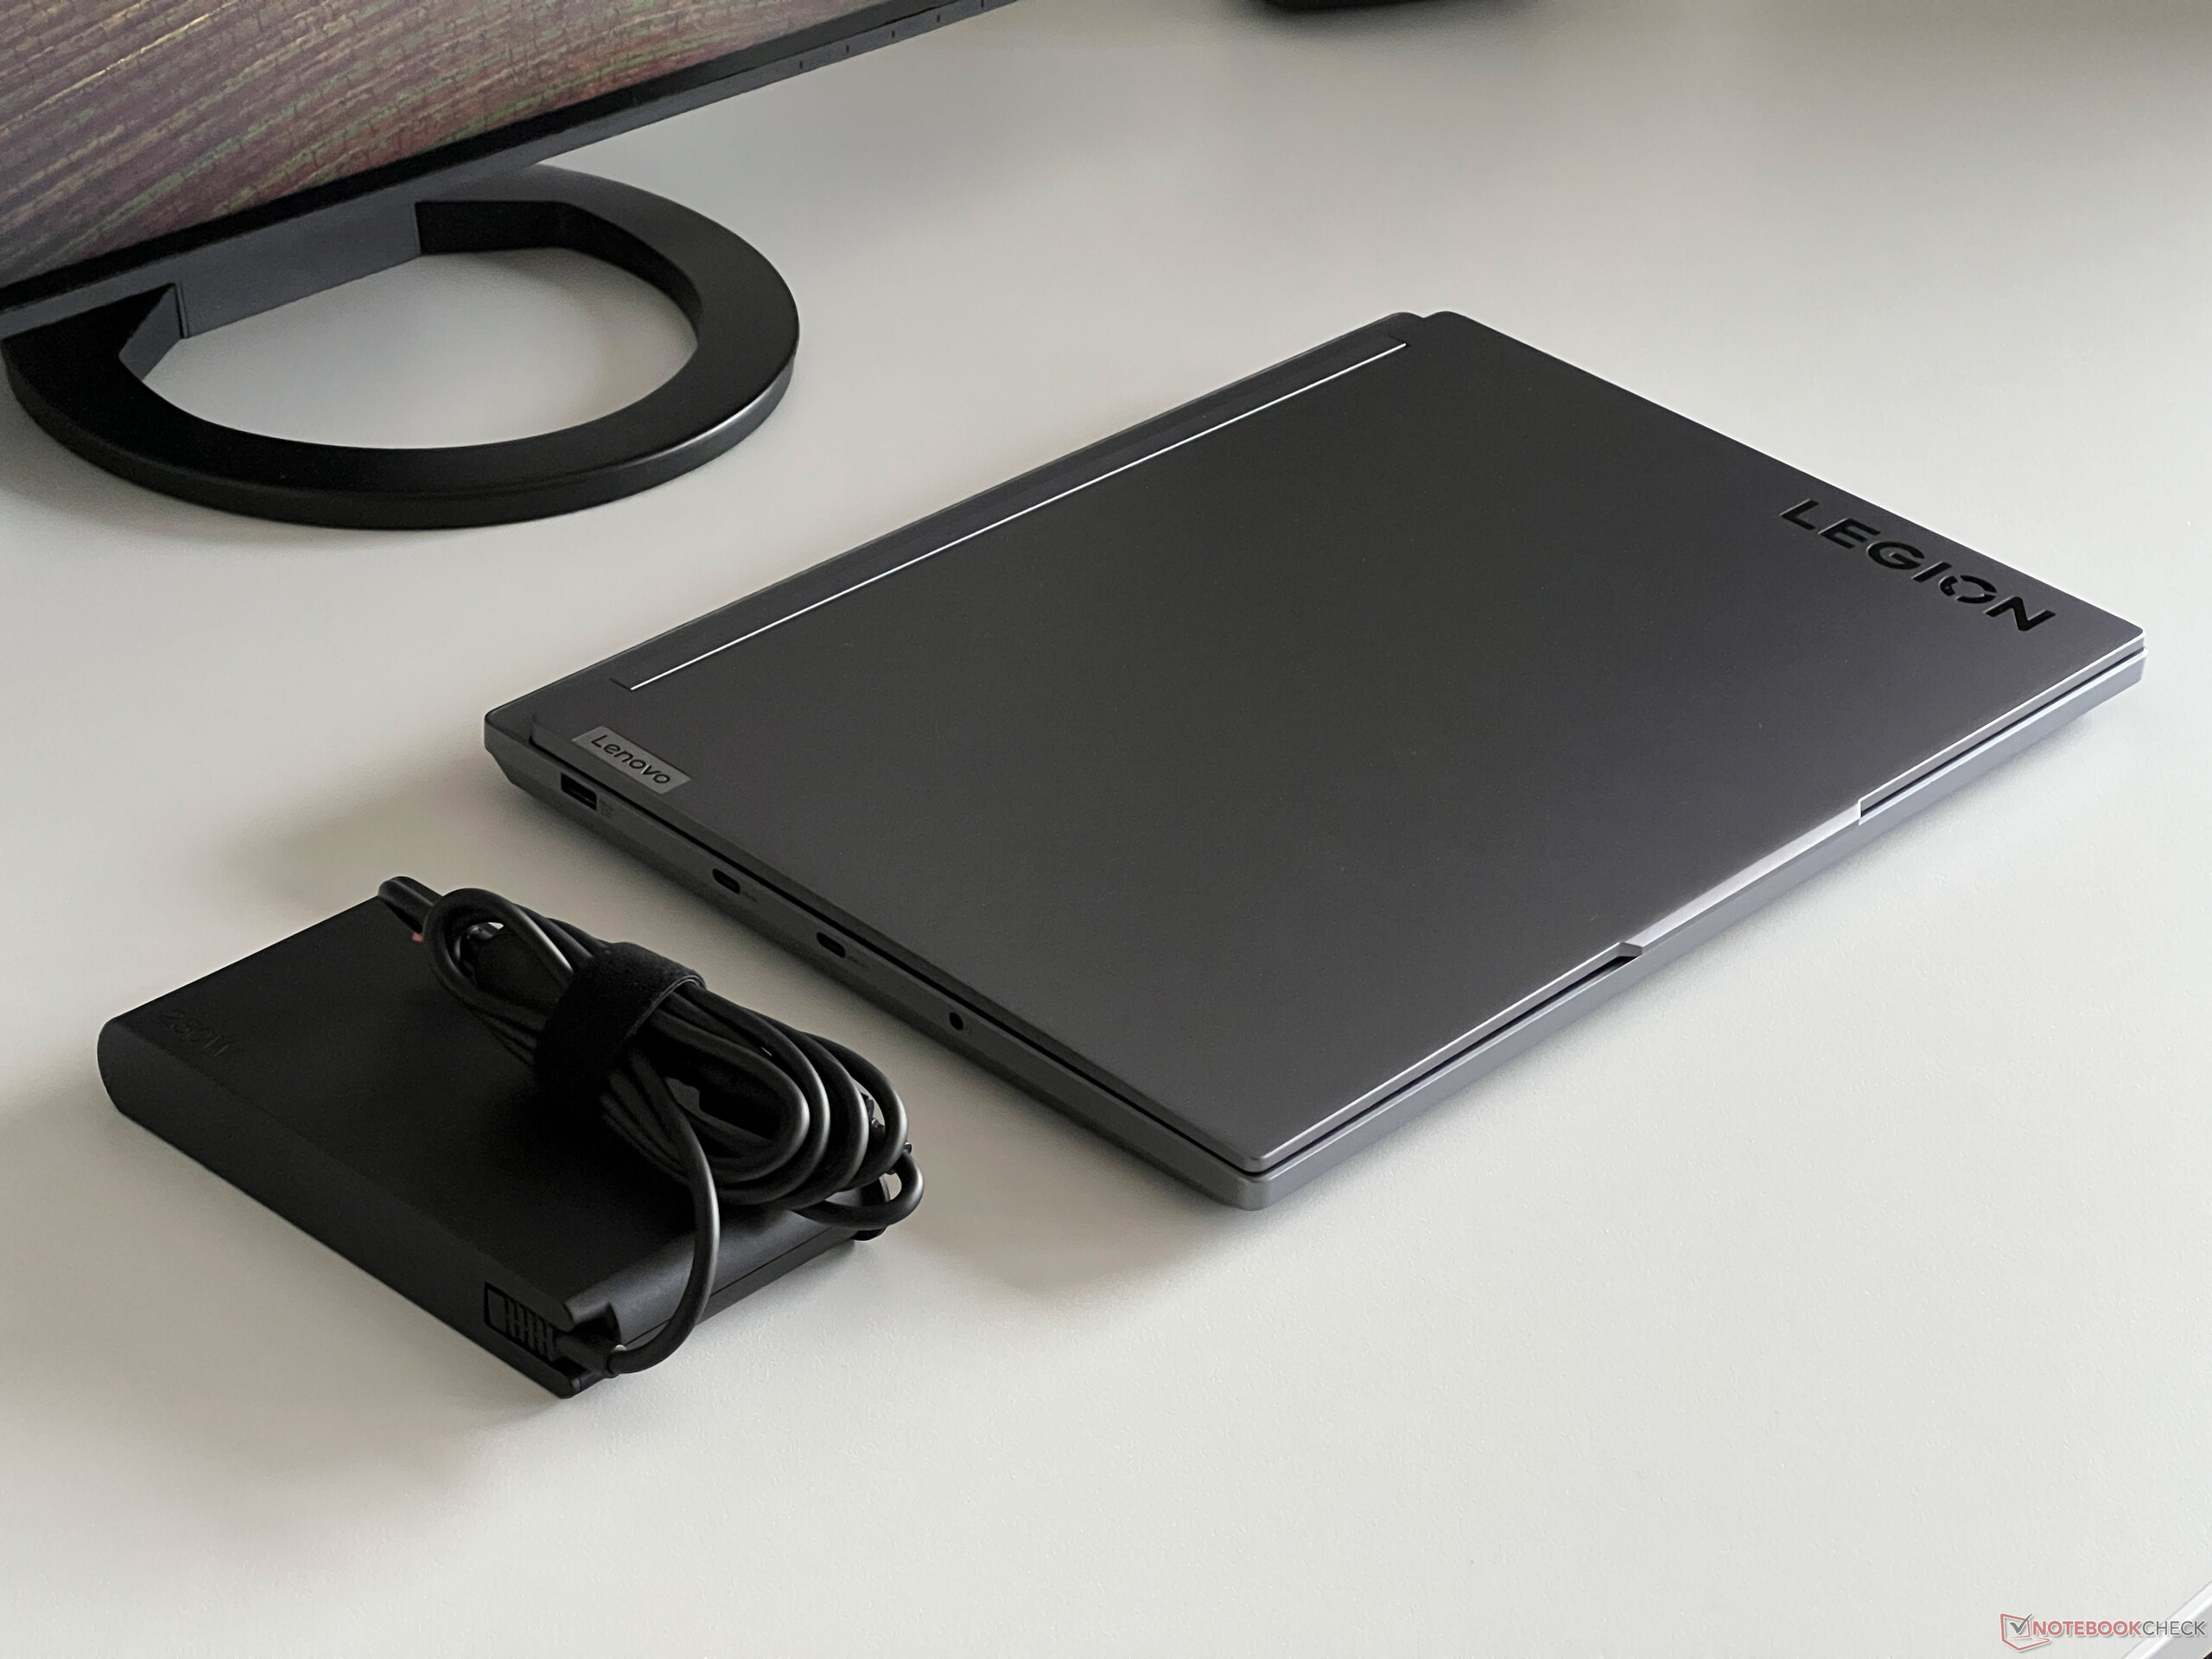
Avec un poids de 2,4 kg, il n'est pas aussi léger qu'une plume, mais dans le domaine de la comparaison, notre échantillon d'essai se comporte bien. Son encombrement en fait également l'un des modèles les plus compacts. Vous devrez prévoir 869 grammes supplémentaires pour le bloc d'alimentation de 230 watts.
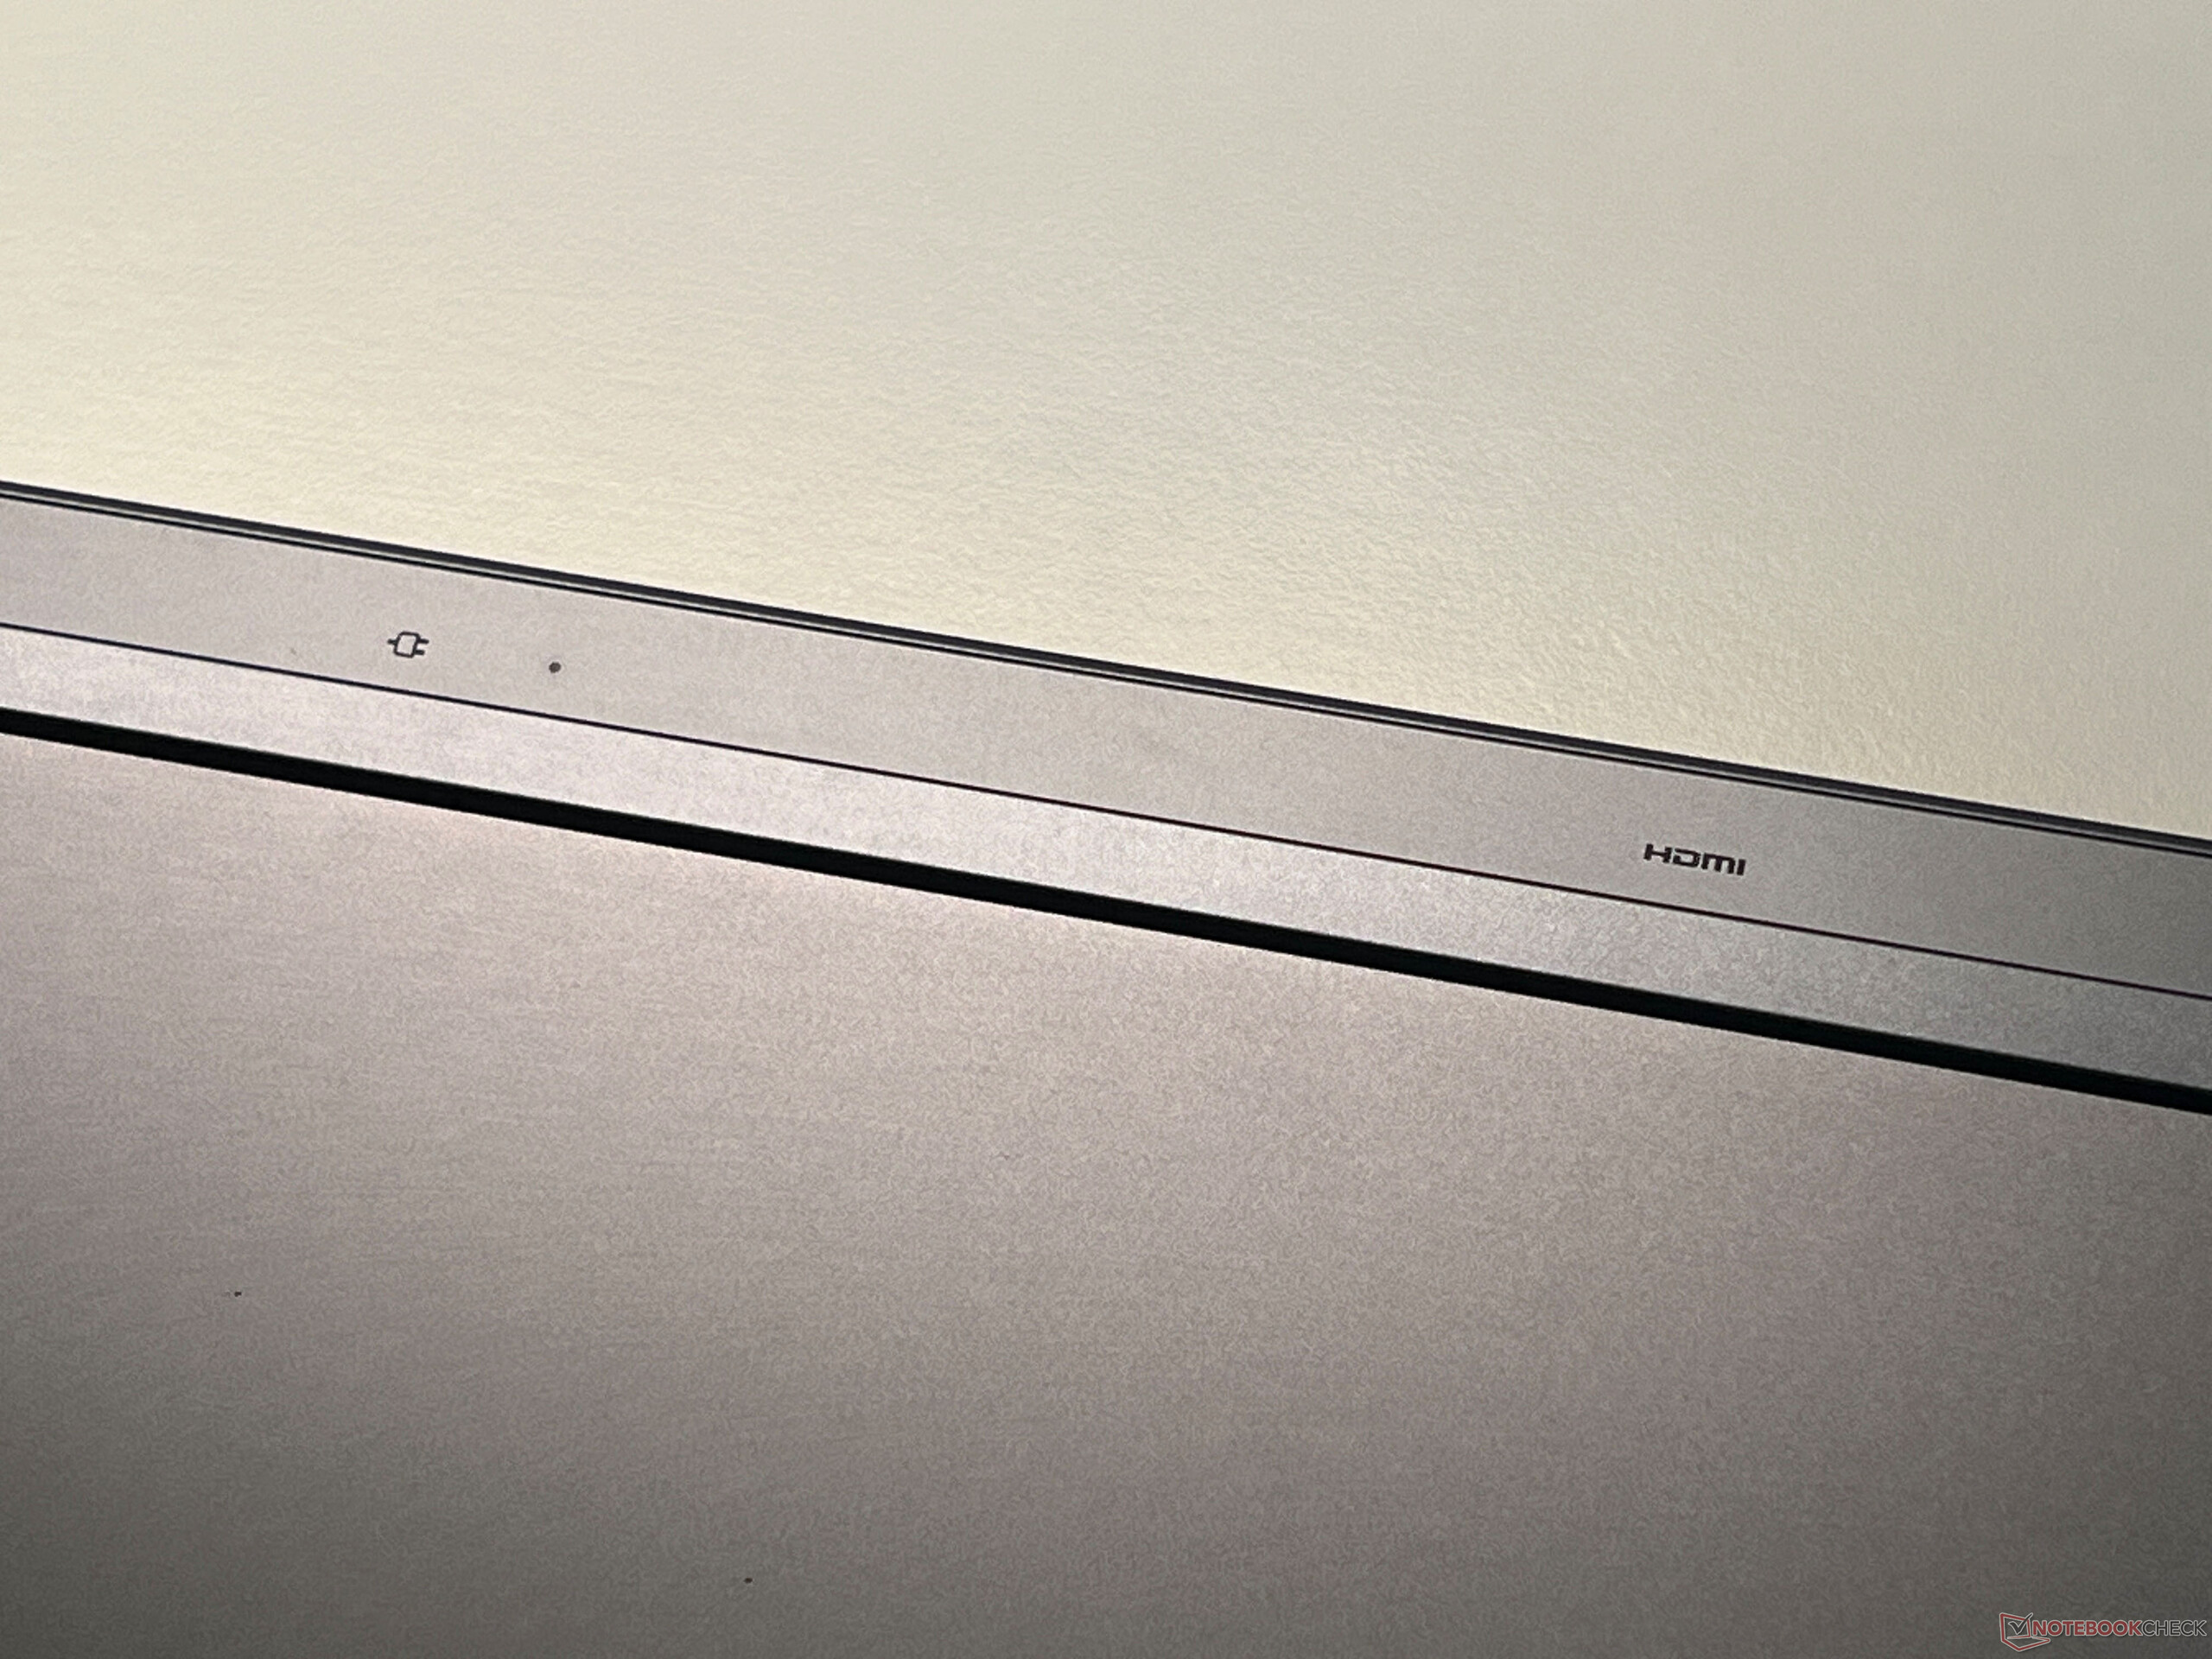
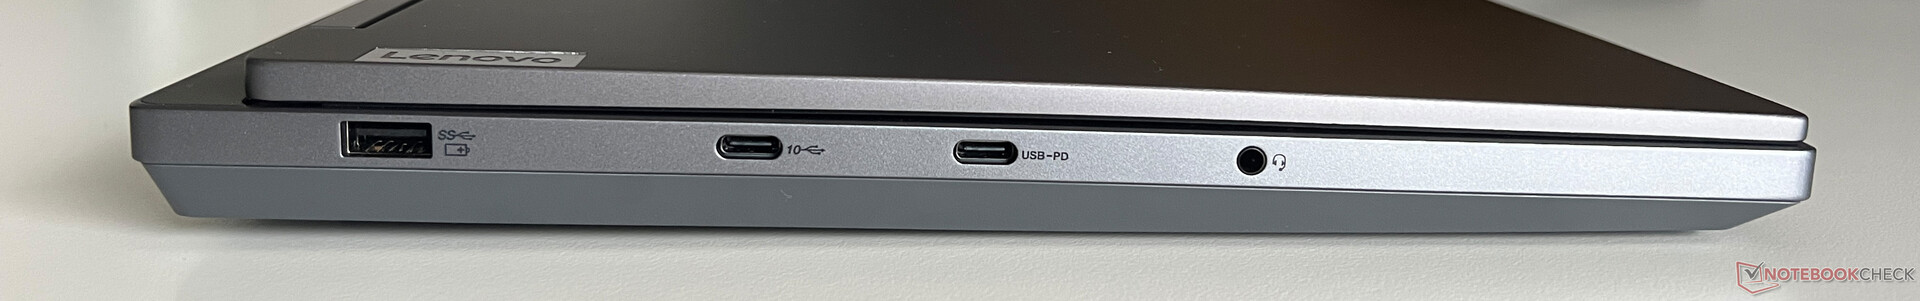
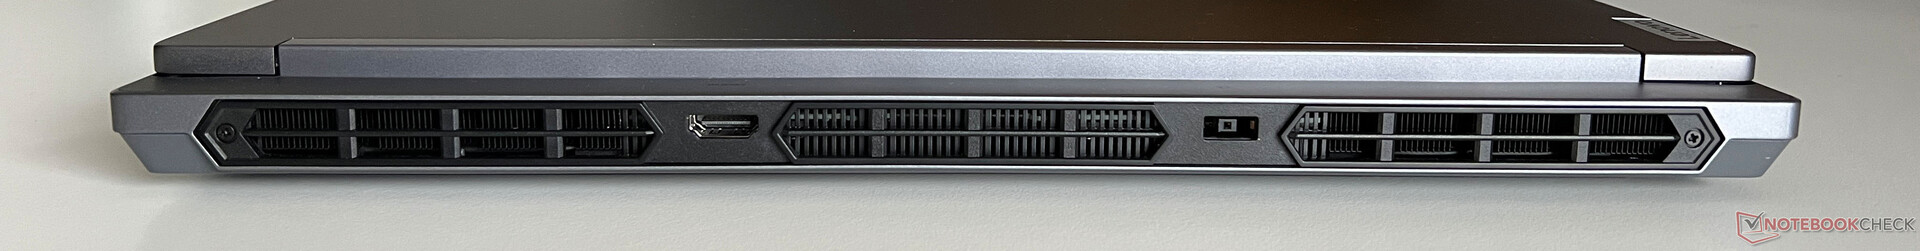
Connectivité - Lenovo a renoncé à Thunderbolt
Sur le Legion 5i 16 (ainsi que sur le Legion Pro 5i), Lenovo a décidé de ne pas installer Thunderbolt 4, mais il dispose d'une bonne sélection de ports répartis sur les trois côtés. L'arrière abrite la connexion d'alimentation et le port HDMI, la gauche comporte trois ports USB et il y a deux autres connexions USB sur le côté droit. Toutes les sorties vidéo sont connectées via le dGPU, ce qui signifie que le GPU Nvidia est toujours actif lorsqu'un moniteur externe est connecté.
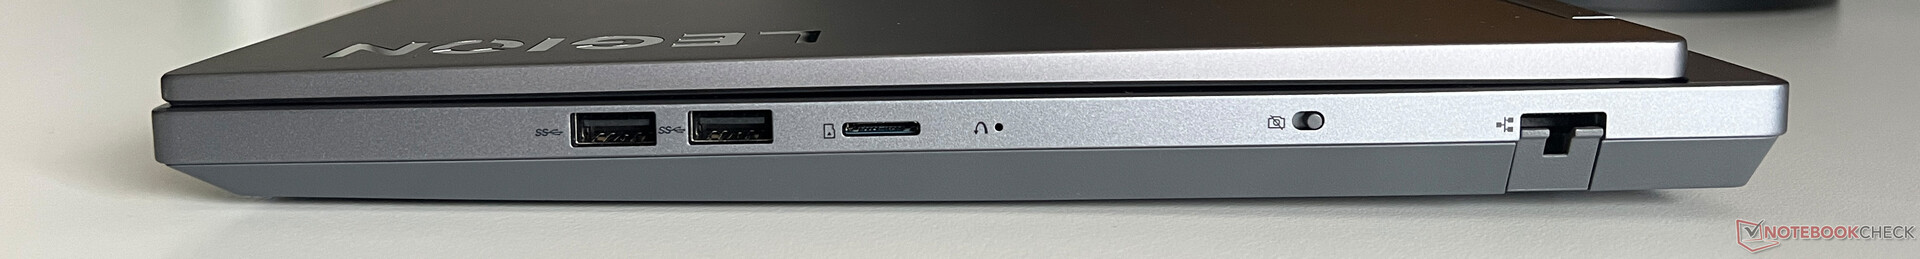
Lecteur de carte SD
Le lecteur de cartes microSD situé sur le côté droit de l'appareil n'accepte pas toutes les cartes et n'est pas particulièrement rapide. En combinaison avec notre carte de référence (Angelibird AV Pro V60), nous avons mesuré des taux de transfert faibles d'environ 30 MB/s.
| SD Card Reader | |
| average JPG Copy Test (av. of 3 runs) | |
| Alienware m16 R1 Intel (AV PRO microSD 128 GB V60) | |
| Moyenne de la classe Gaming (20.9 - 210, n=54, 2 dernières années) | |
| Lenovo Legion Slim 5 16APH8 (PNY EliteX-Pro60 V60 256 GB) | |
| Schenker XMG CORE 16 (L23) | |
| Lenovo Legion 5 16IRX G9 | |
| maximum AS SSD Seq Read Test (1GB) | |
| Alienware m16 R1 Intel (AV PRO microSD 128 GB V60) | |
| Moyenne de la classe Gaming (25.5 - 261, n=51, 2 dernières années) | |
| Lenovo Legion Slim 5 16APH8 (PNY EliteX-Pro60 V60 256 GB) | |
| Schenker XMG CORE 16 (L23) | |
| Lenovo Legion 5 16IRX G9 | |
Communication
Lenovo a équipé le Legion du module WLAN AX211 d'Intel qui, outre le Bluetooth 5.3, maîtrise également la norme actuelle Wi-Fi-6E pour les réseaux à 6 GHz. En combinaison avec notre routeur de référence Asus, les taux de transfert étaient excellents, même si la concurrence était parfois plus rapide. Cependant, vous ne devriez pas vraiment pouvoir le remarquer dans une utilisation pratique et pendant notre test, nous n'avons jamais eu de problèmes avec la qualité du signal. En outre, l'ordinateur portable dispose d'un port Gigabit-Ethernet pour les connexions filaires.
| Networking | |
| Lenovo Legion 5 16IRX G9 | |
| iperf3 transmit AXE11000 | |
| iperf3 receive AXE11000 | |
| Schenker XMG CORE 16 (L23) | |
| iperf3 transmit AXE11000 | |
| iperf3 receive AXE11000 | |
| HP Victus 16-r0077ng | |
| iperf3 transmit AXE11000 | |
| iperf3 receive AXE11000 | |
| Lenovo LOQ 16IRH8 | |
| iperf3 transmit AXE11000 | |
| iperf3 receive AXE11000 | |
| Lenovo Legion Slim 5 16APH8 | |
| iperf3 transmit AXE11000 | |
| iperf3 receive AXE11000 | |
| iperf3 transmit AXE11000 6GHz | |
| iperf3 receive AXE11000 6GHz | |
| HP Victus 16-r0076TX | |
| iperf3 transmit AXE11000 | |
| iperf3 receive AXE11000 | |
| iperf3 transmit AXE11000 6GHz | |
| iperf3 receive AXE11000 6GHz | |
| Alienware m16 R1 Intel | |
| iperf3 transmit AXE11000 | |
| iperf3 receive AXE11000 | |
| Lenovo Legion Pro 5 16IRX8 | |
| iperf3 transmit AXE11000 | |
| iperf3 receive AXE11000 | |
| iperf3 transmit AXE11000 6GHz | |
| iperf3 receive AXE11000 6GHz | |
Webcam
La webcam 1080p du Legion 5i remplit son rôle et prend des photos correctes dans de bonnes conditions d'éclairage. En revanche, elle ne prend en charge aucun effet de studio supplémentaire et ne dispose pas d'un capteur IR pour la reconnaissance faciale via Windows Hello. Un interrupteur situé sur le côté droit permet de désactiver la webcam.


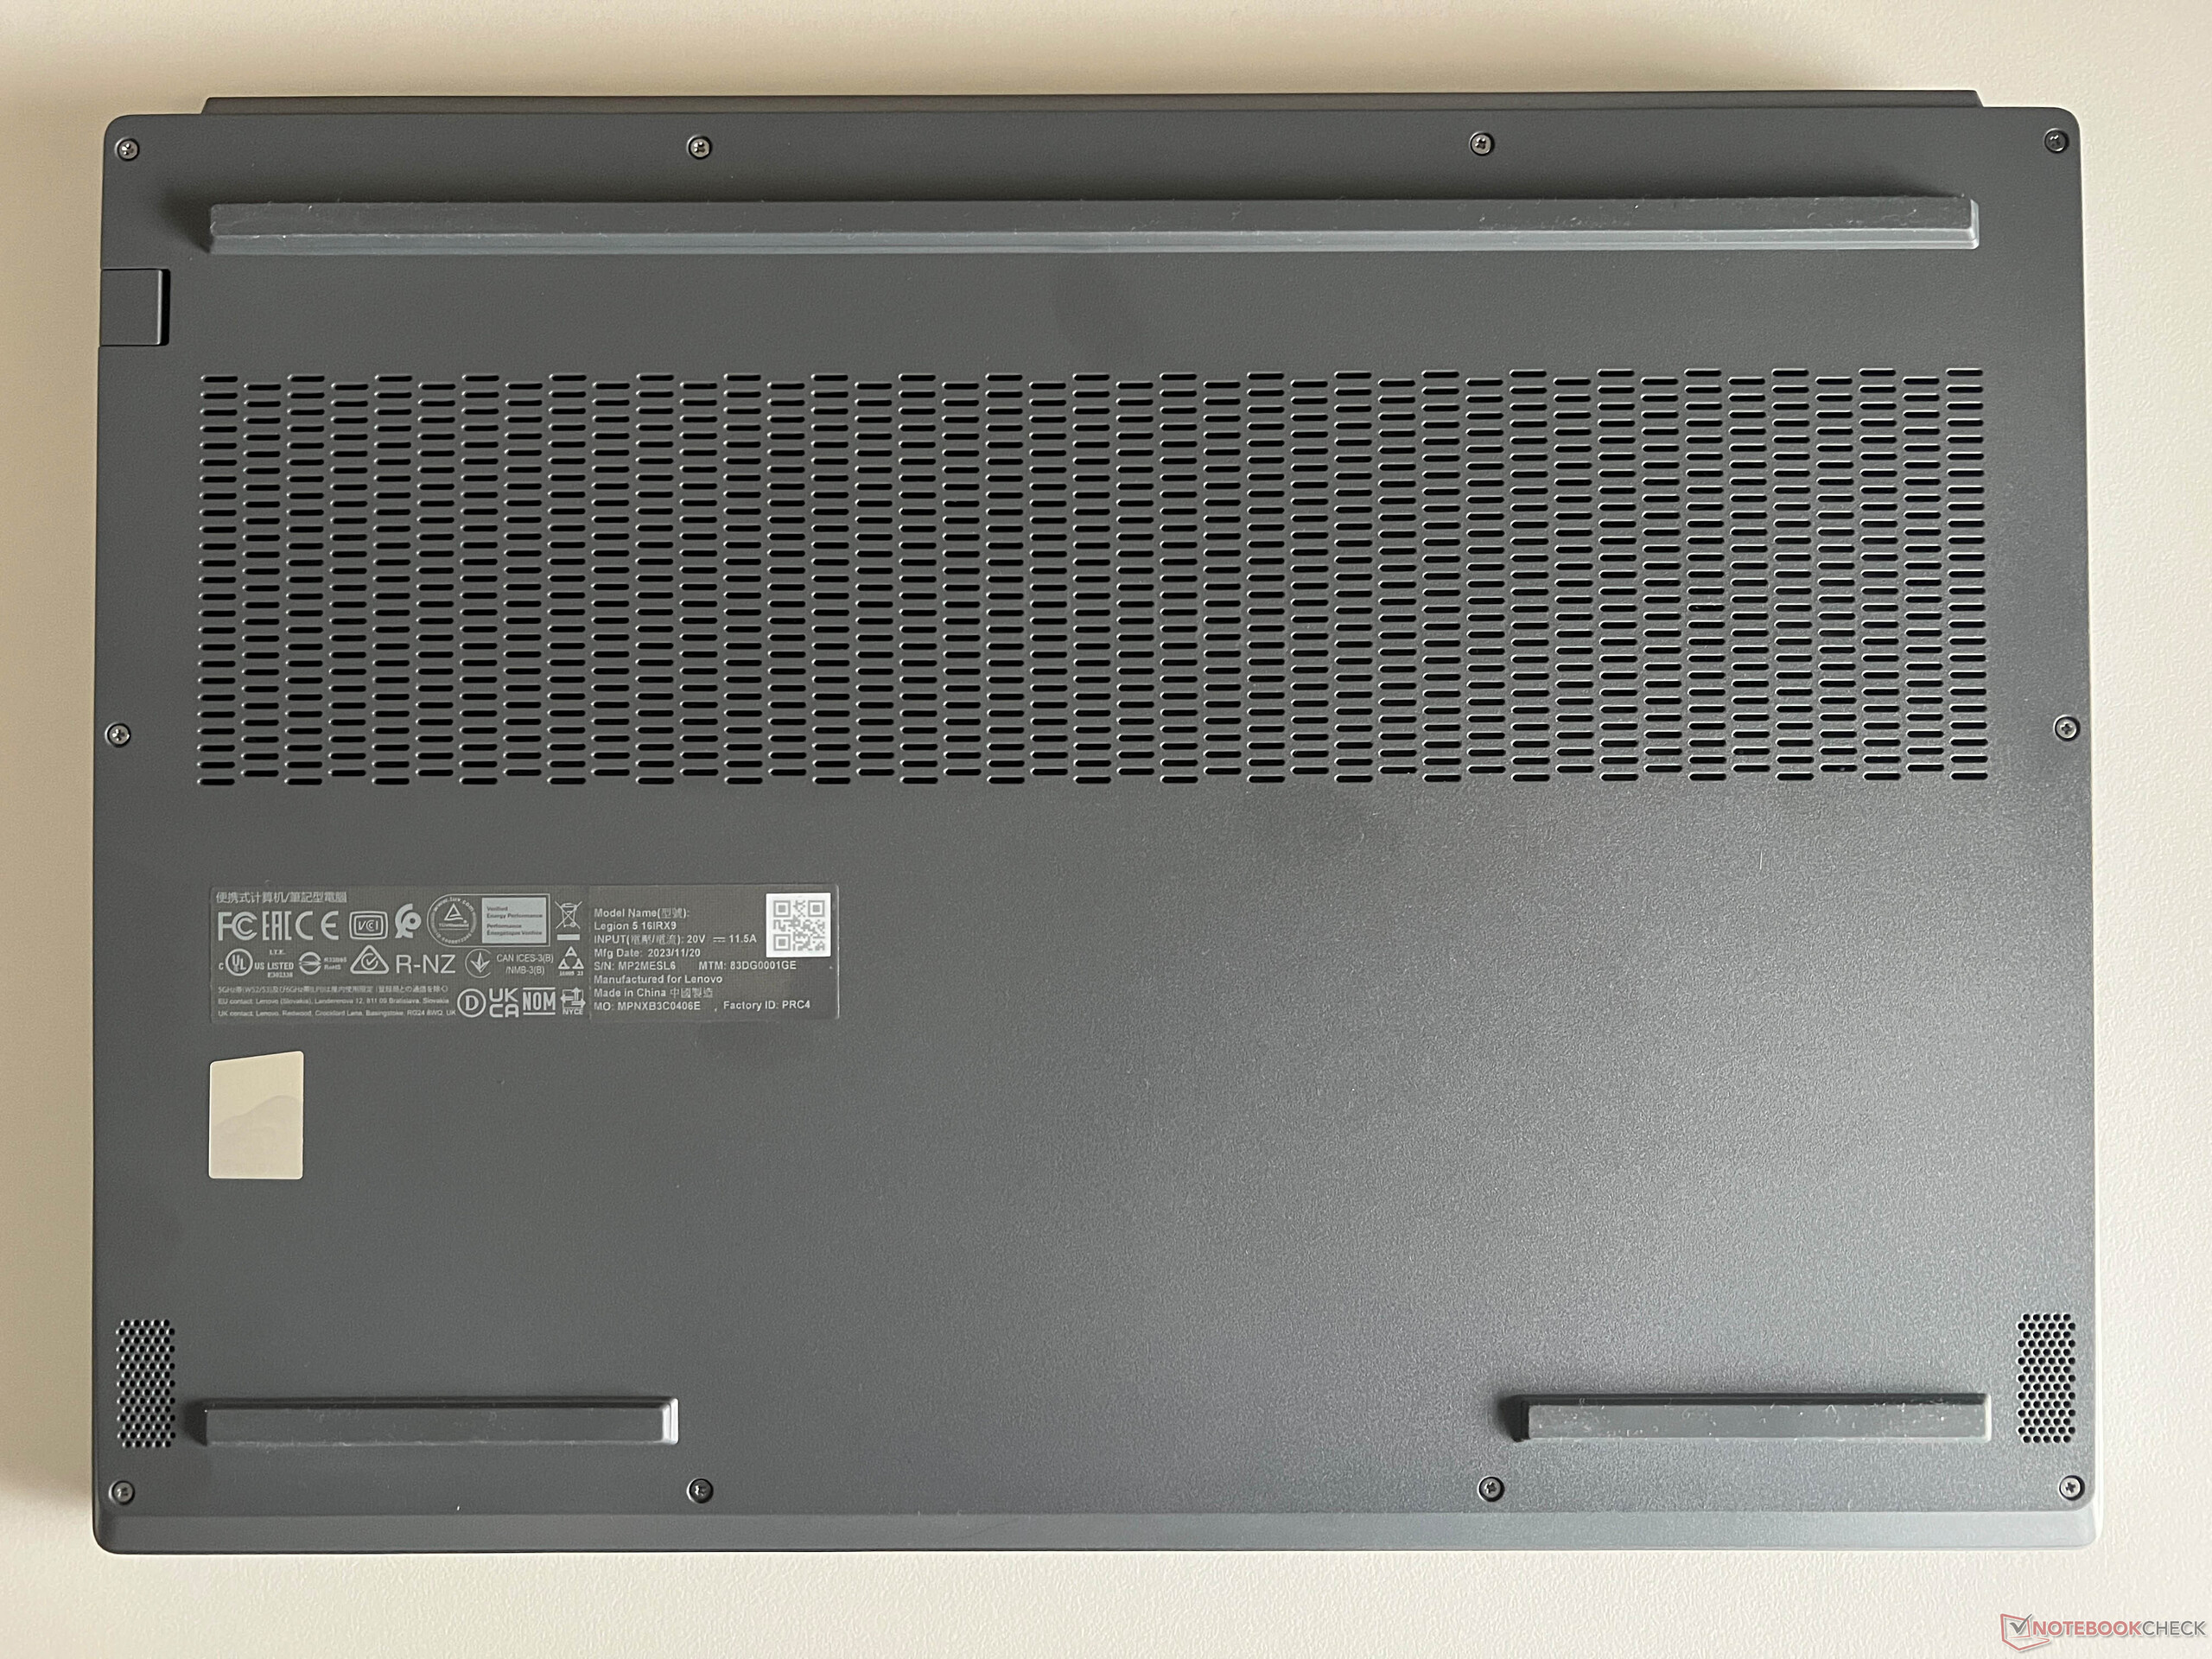
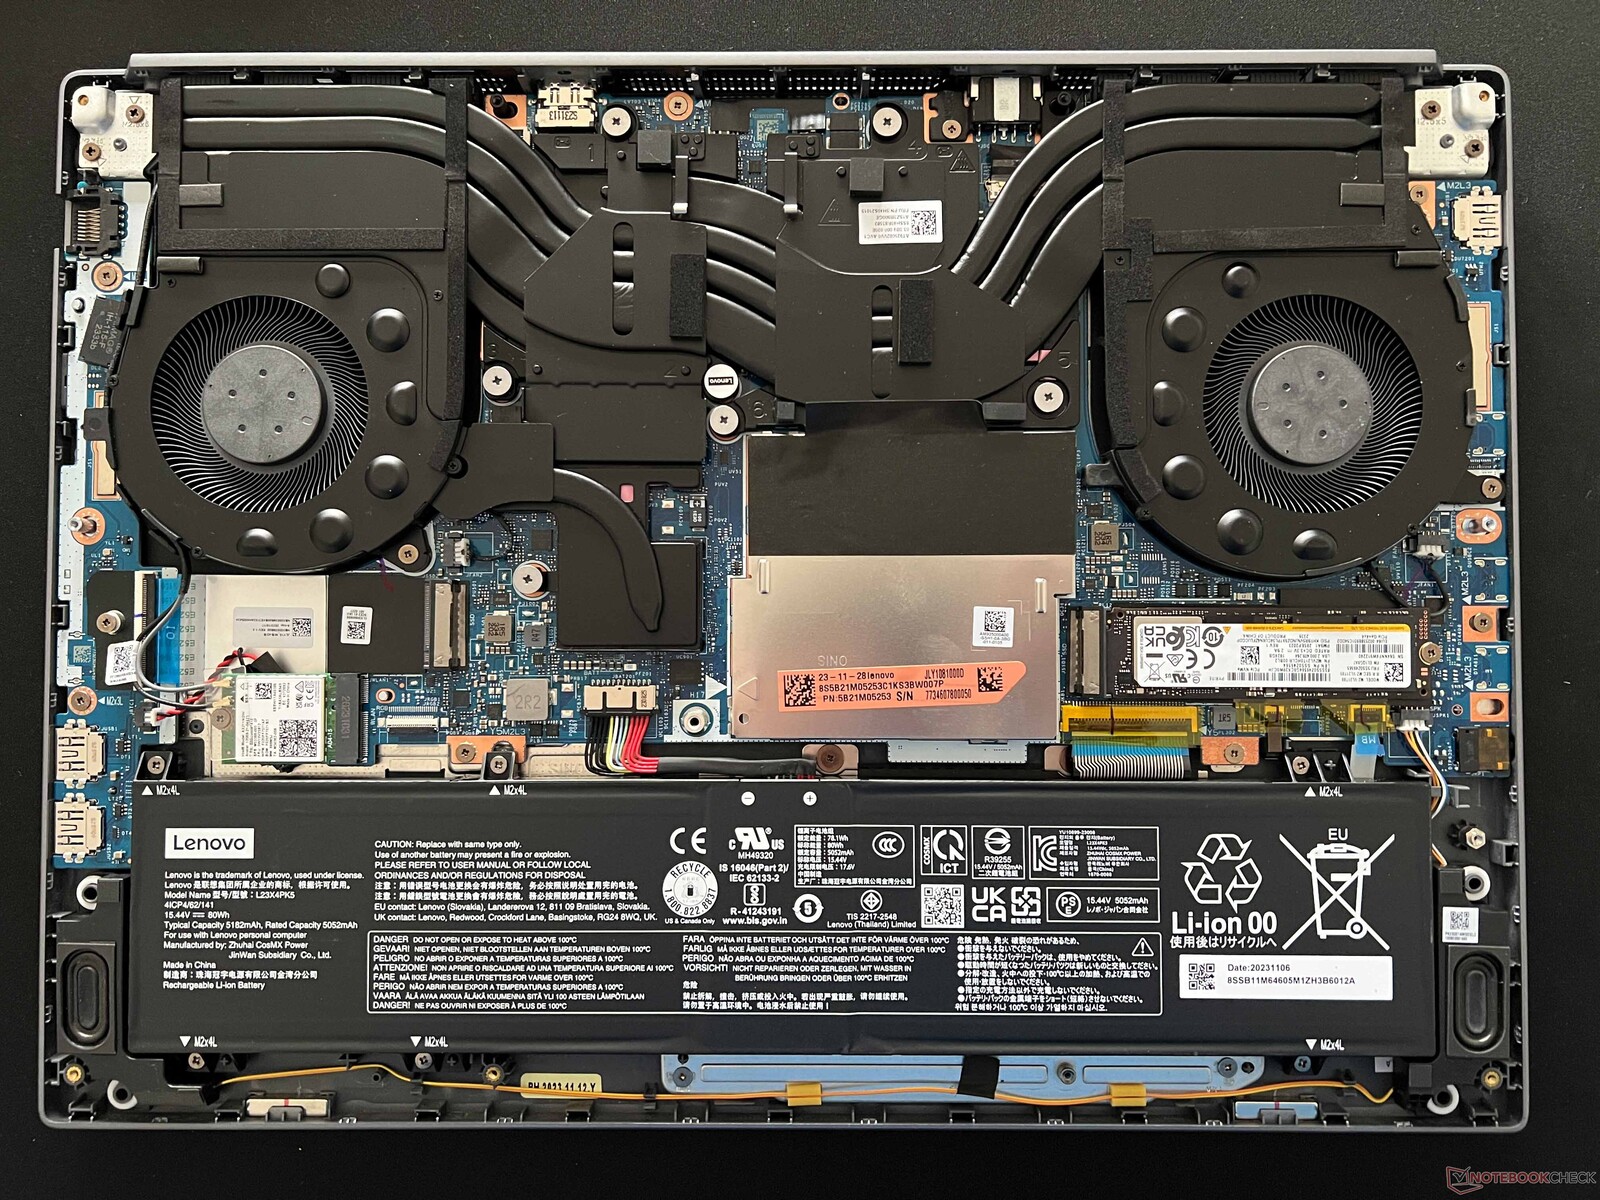
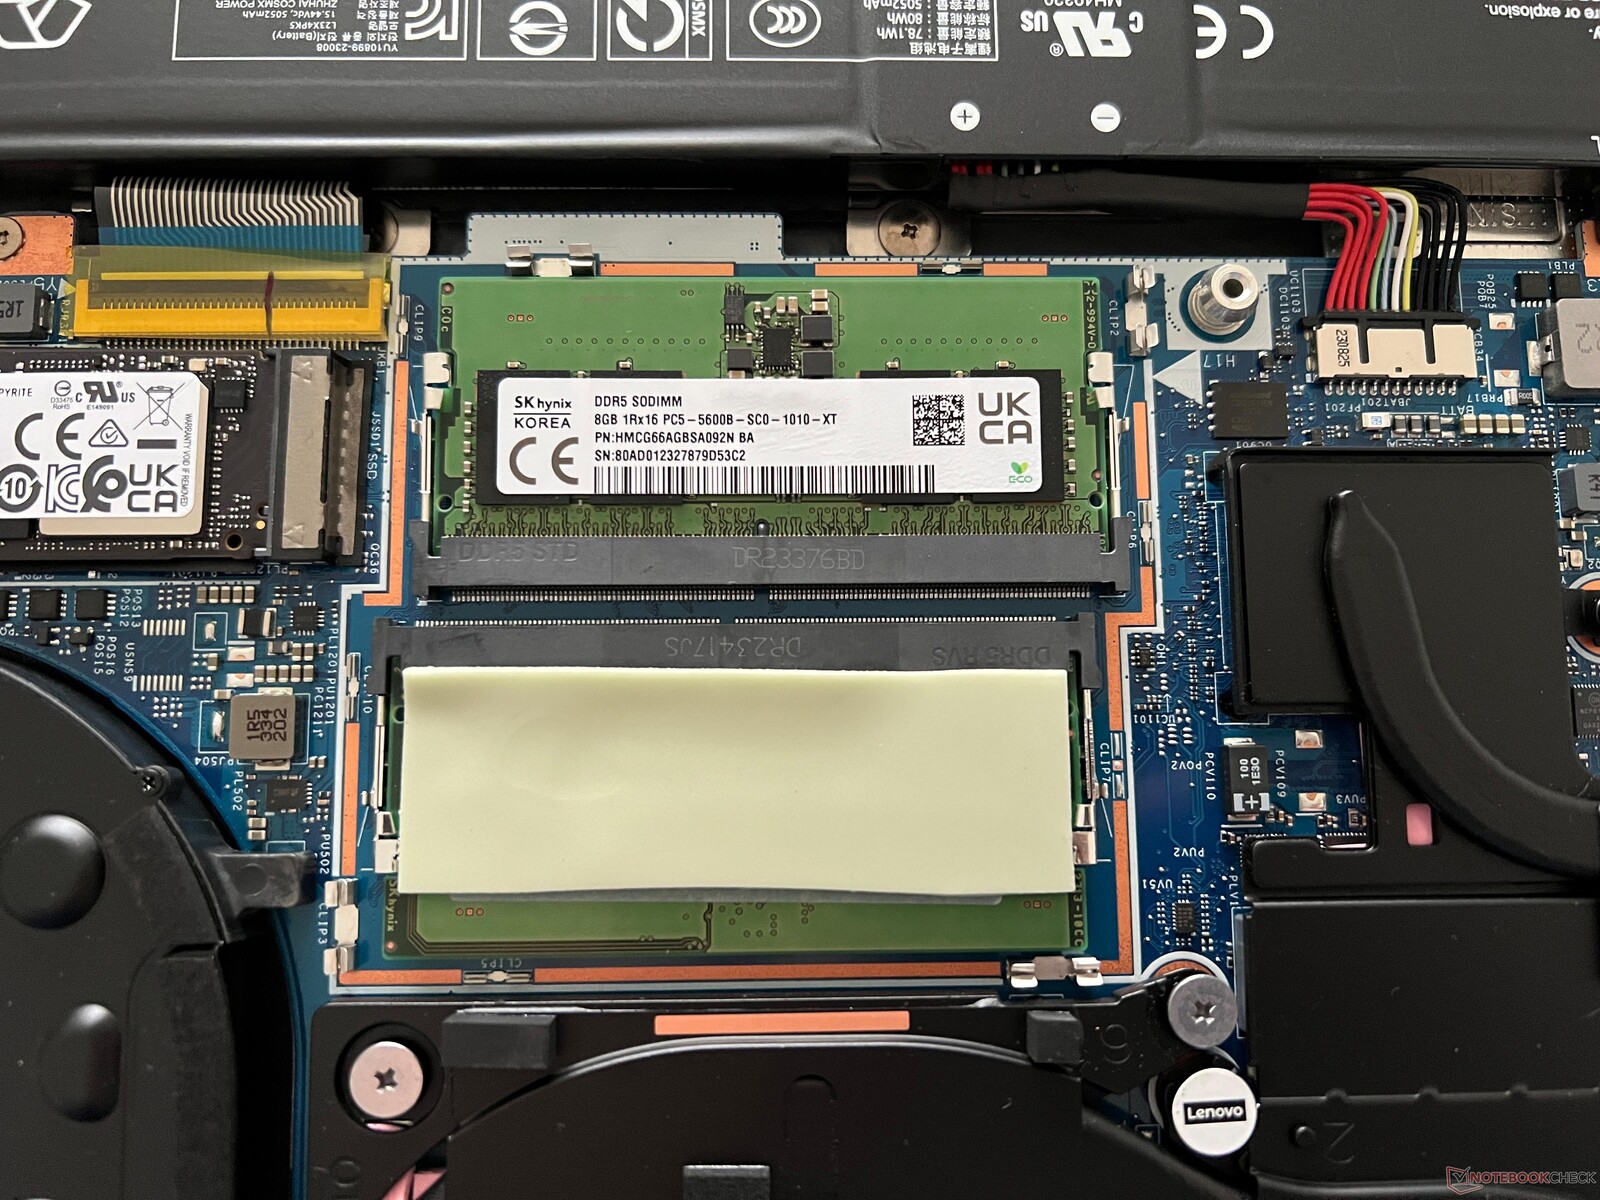
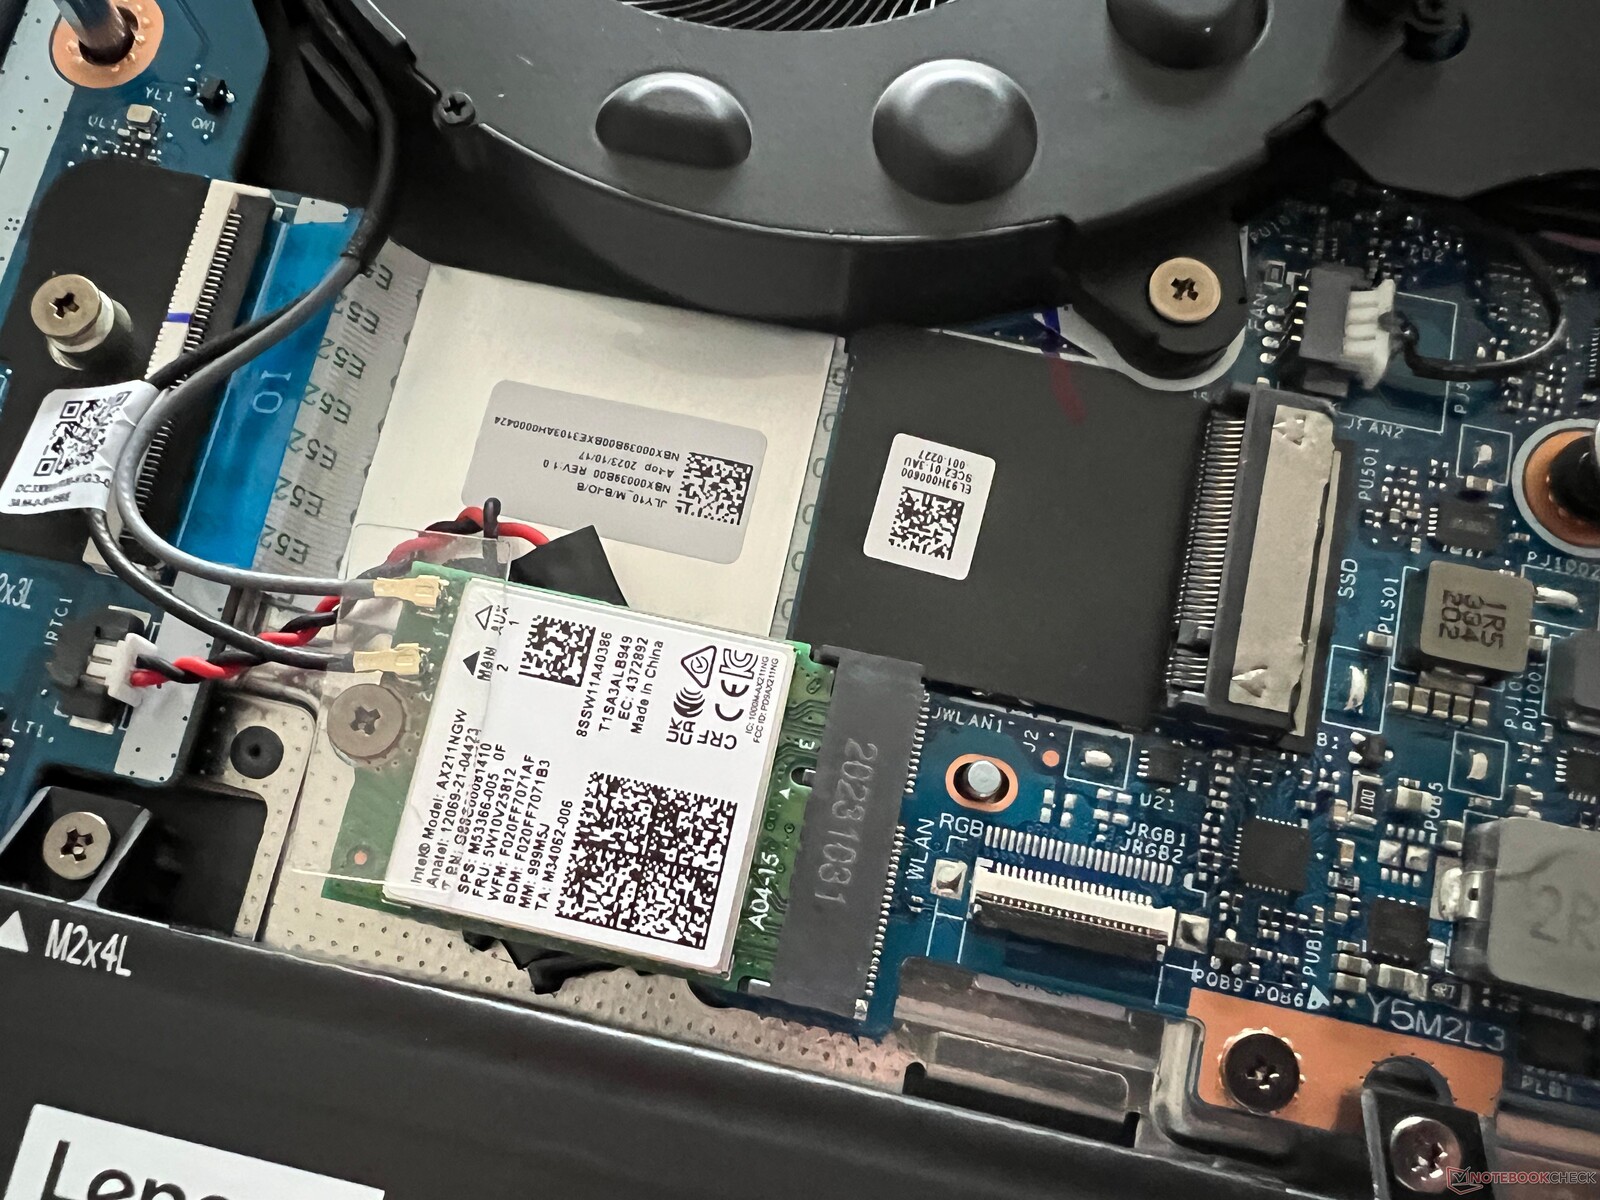
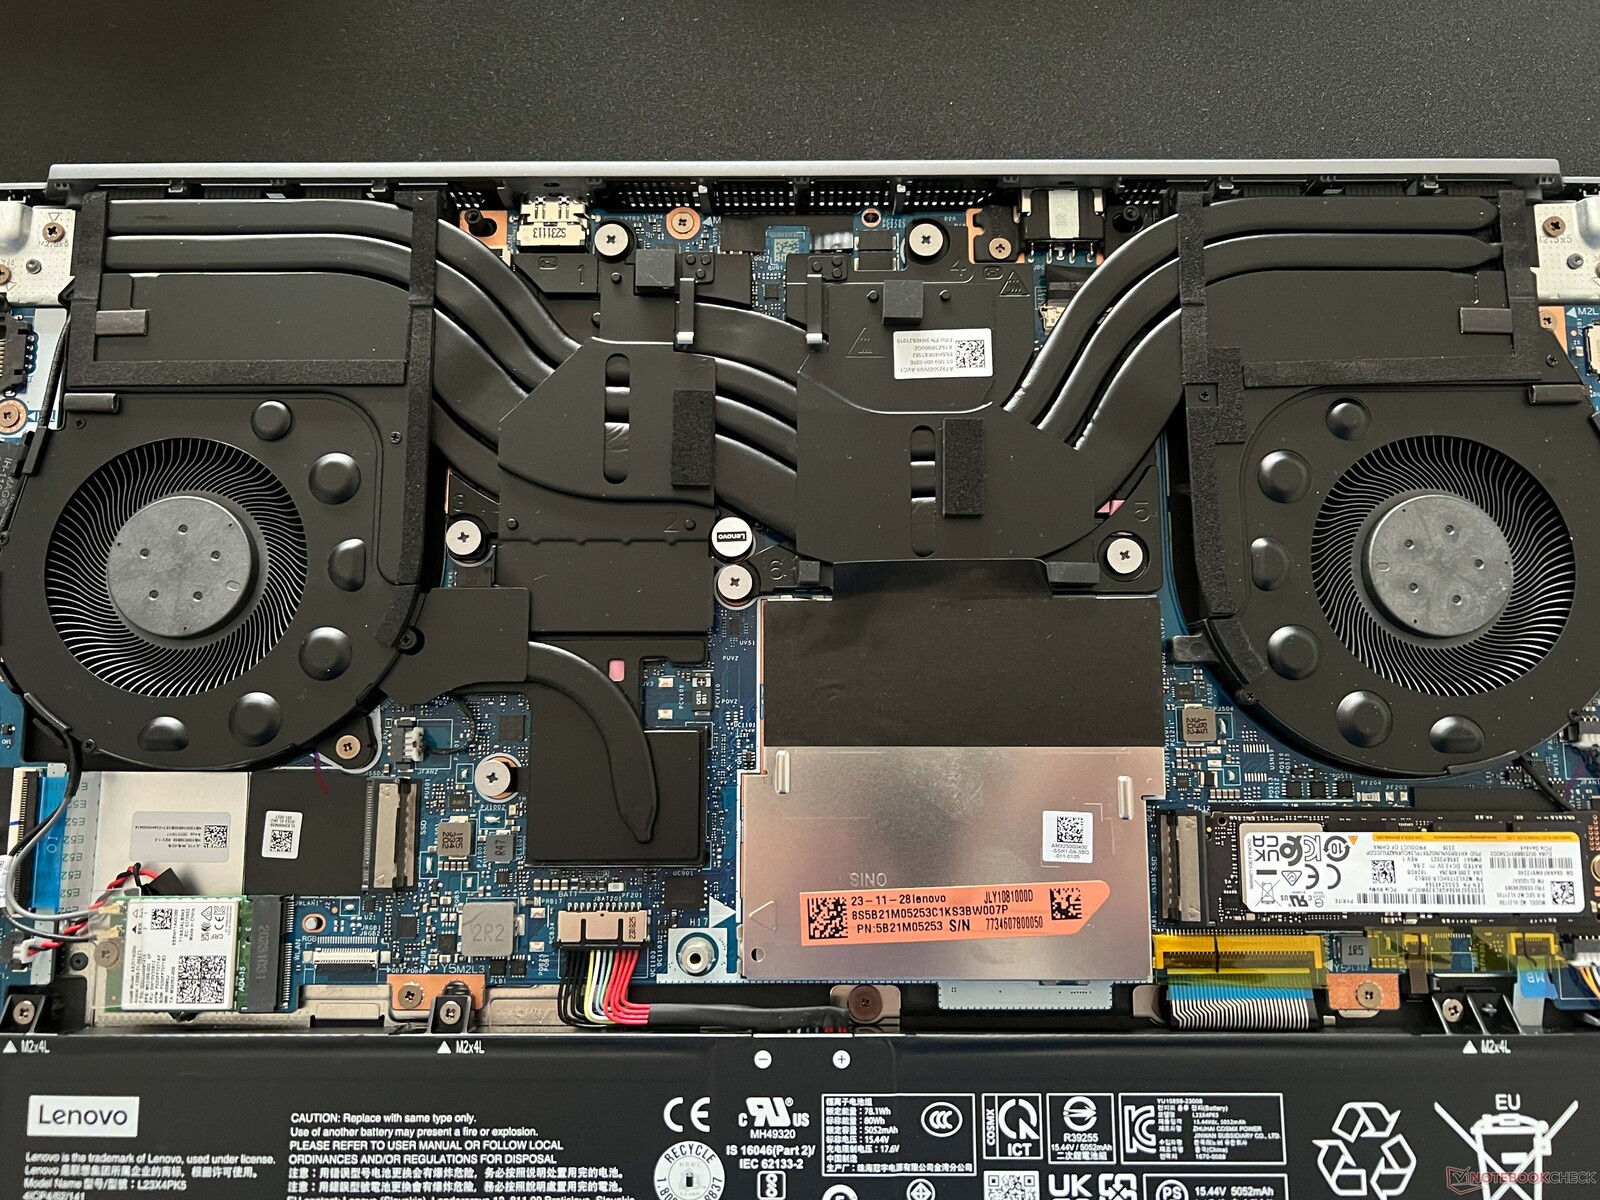
Maintenance
La partie inférieure du boîtier est fixée à l'aide de vis à tête cruciforme normales, mais elle reste bien en place lorsque celles-ci sont retirées. Vous devez utiliser un outil approprié pour l'ouvrir. À l'intérieur, les options de maintenance de l'ordinateur portable sont bonnes, car outre les deux emplacements pour la RAM, il dispose également de deux emplacements pour les disques durs SSD M.2-2280. Le module WLAN et la batterie (vissée) peuvent également être remplacés.
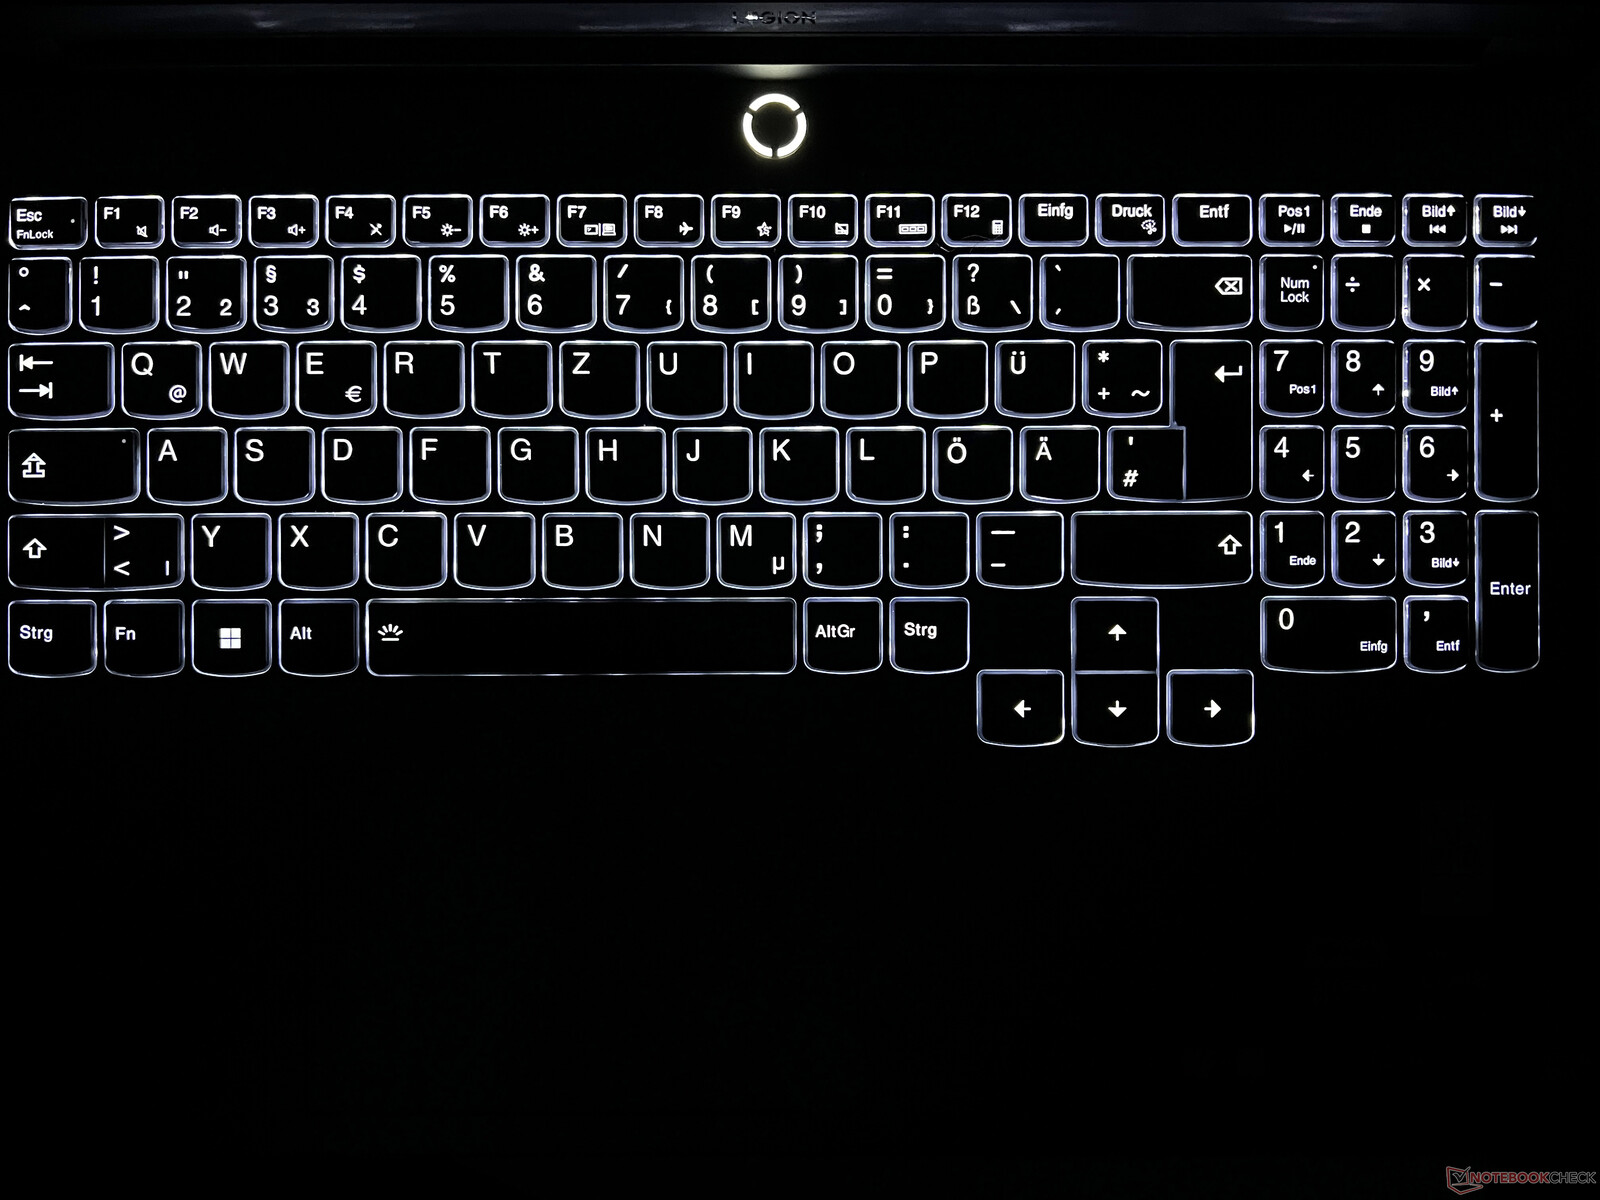
Dispositifs d'entrée - ascenseur de 1,5 mm sans éclairage RGB
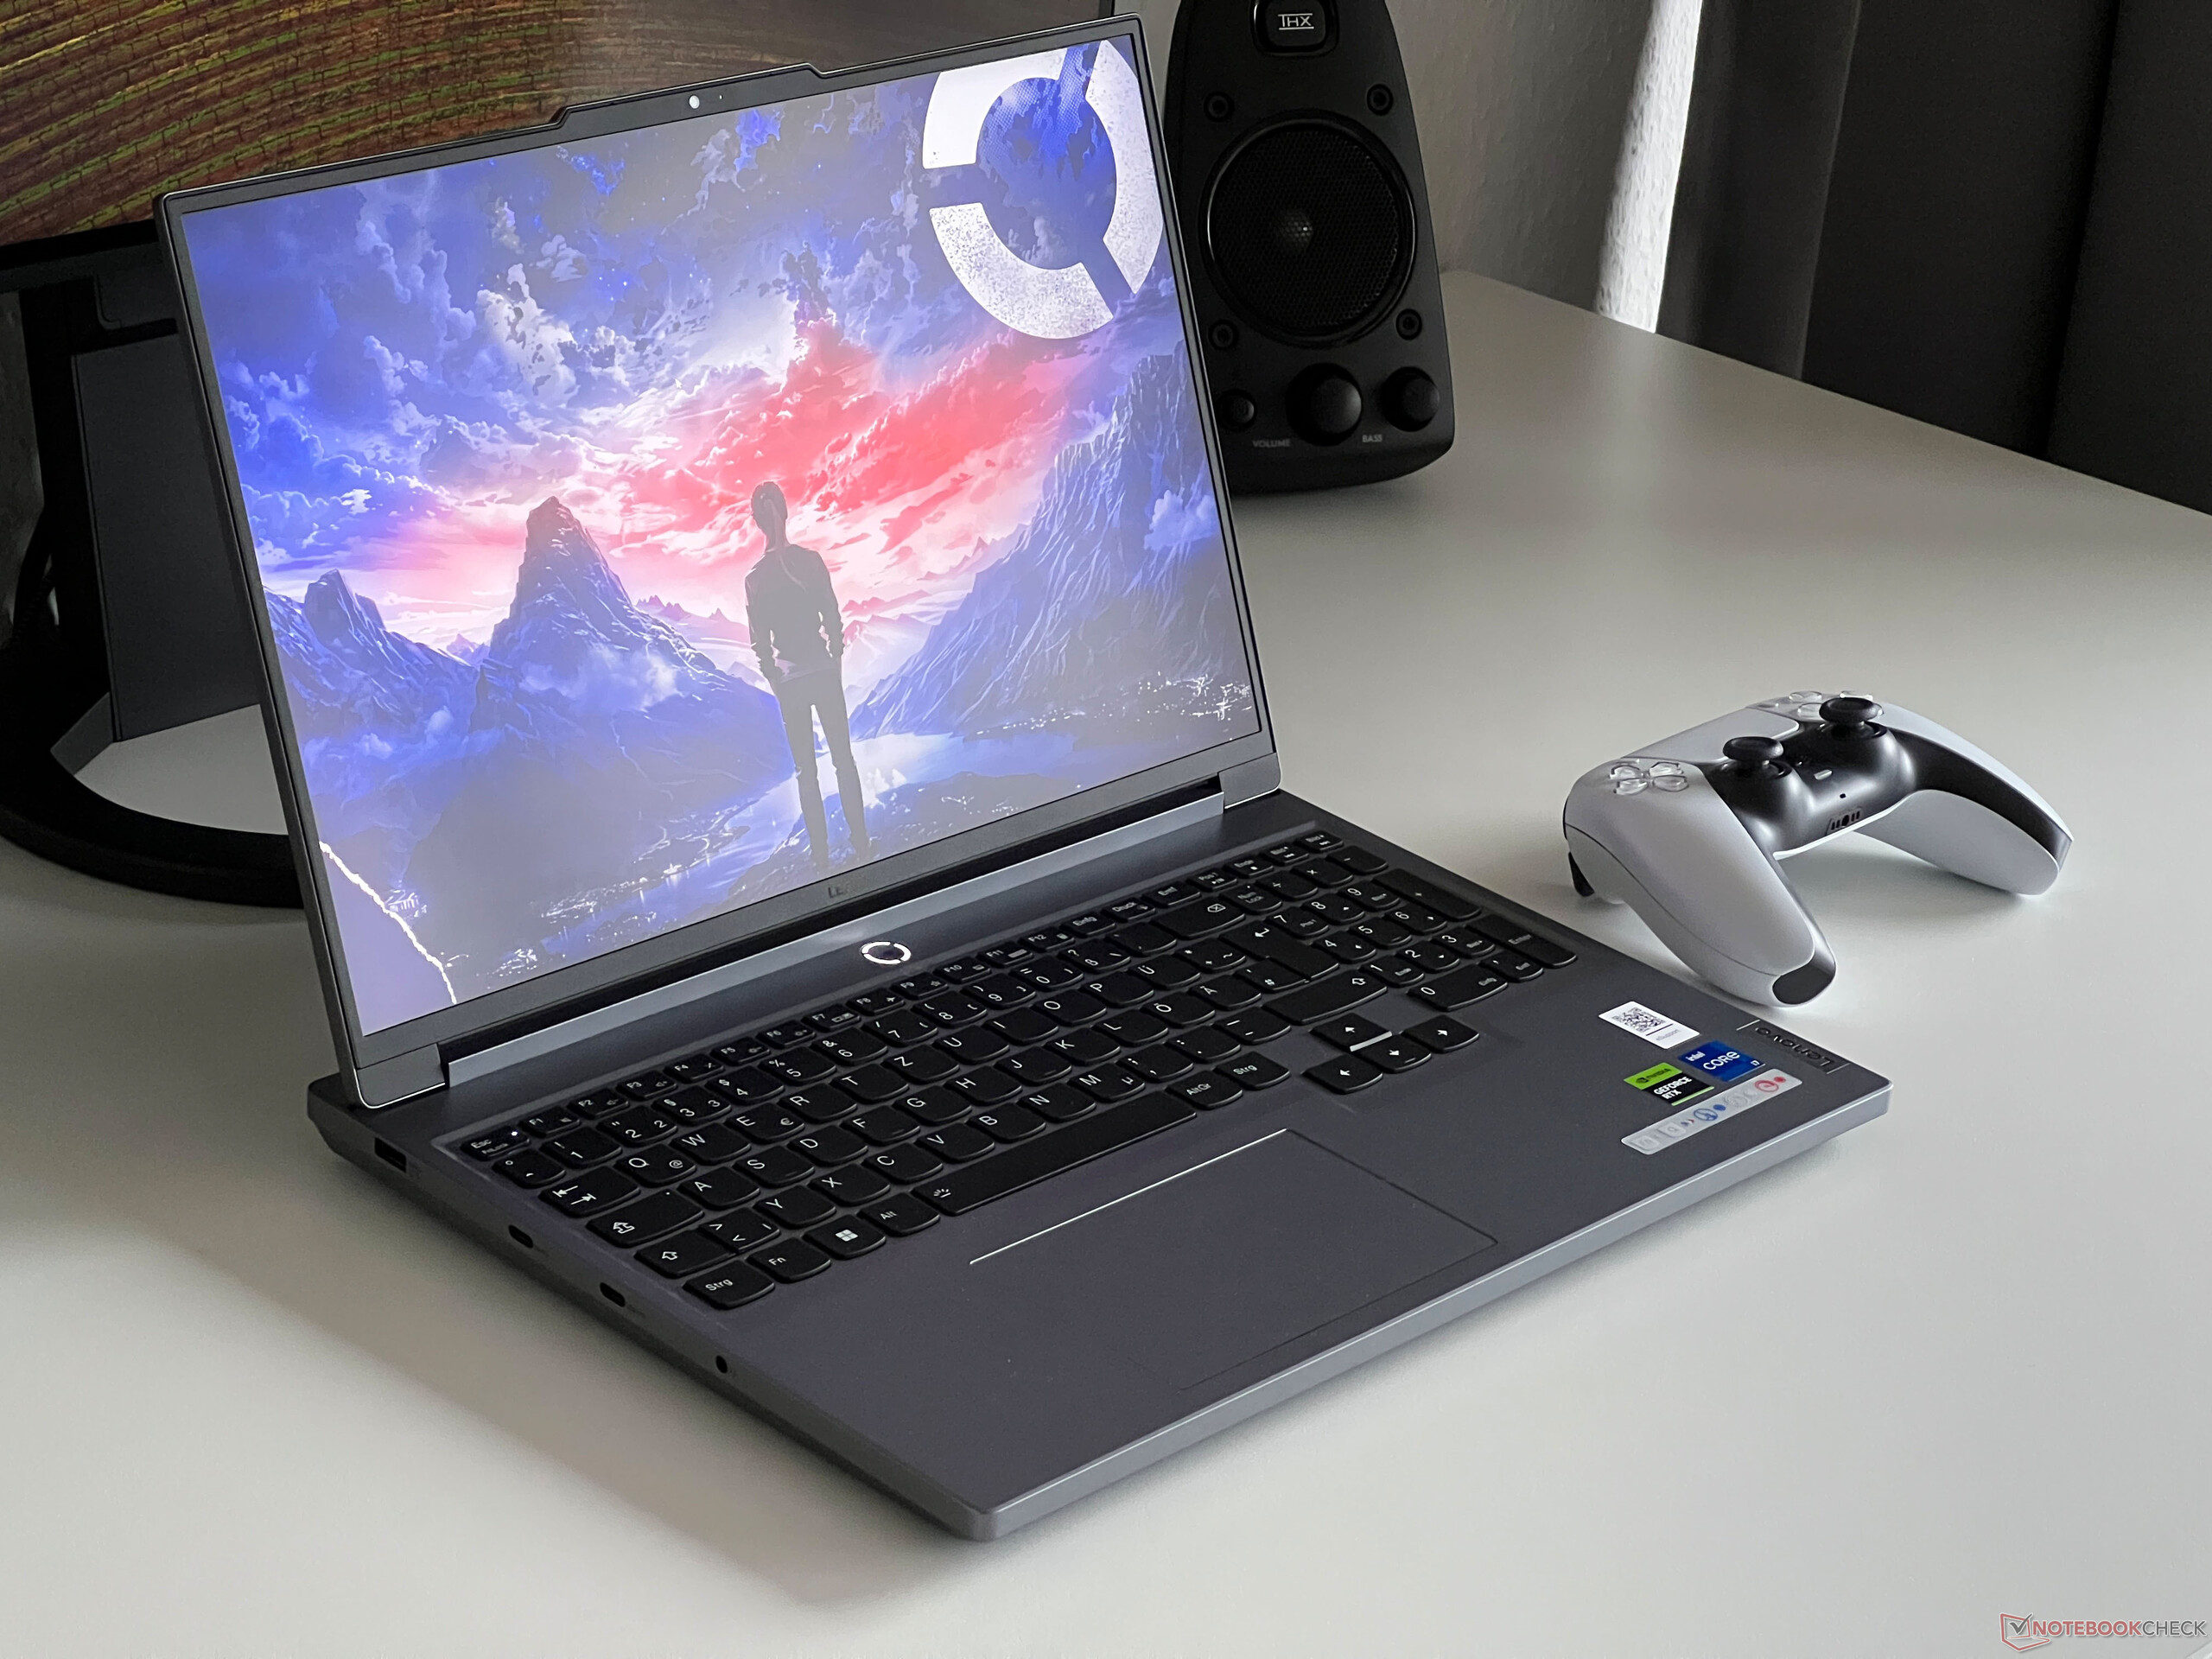
Le clavier noir - comprenant un pavé numérique dédié et des touches fléchées décalées - est un clavier que nous connaissons déjà sur d'autres modèles Legion. Ses touches ont une levée de 1,5 mm et, dans l'ensemble, il est confortable de taper dessus. Outre le jeu, il n'y a aucun problème pour taper des textes longs sur ce clavier. Notre configuration de test est équipée d'un clavier rétroéclairé avec deux niveaux de luminosité ; vous pouvez également opter pour un clavier avec rétroéclairage coloré à 4 zones.
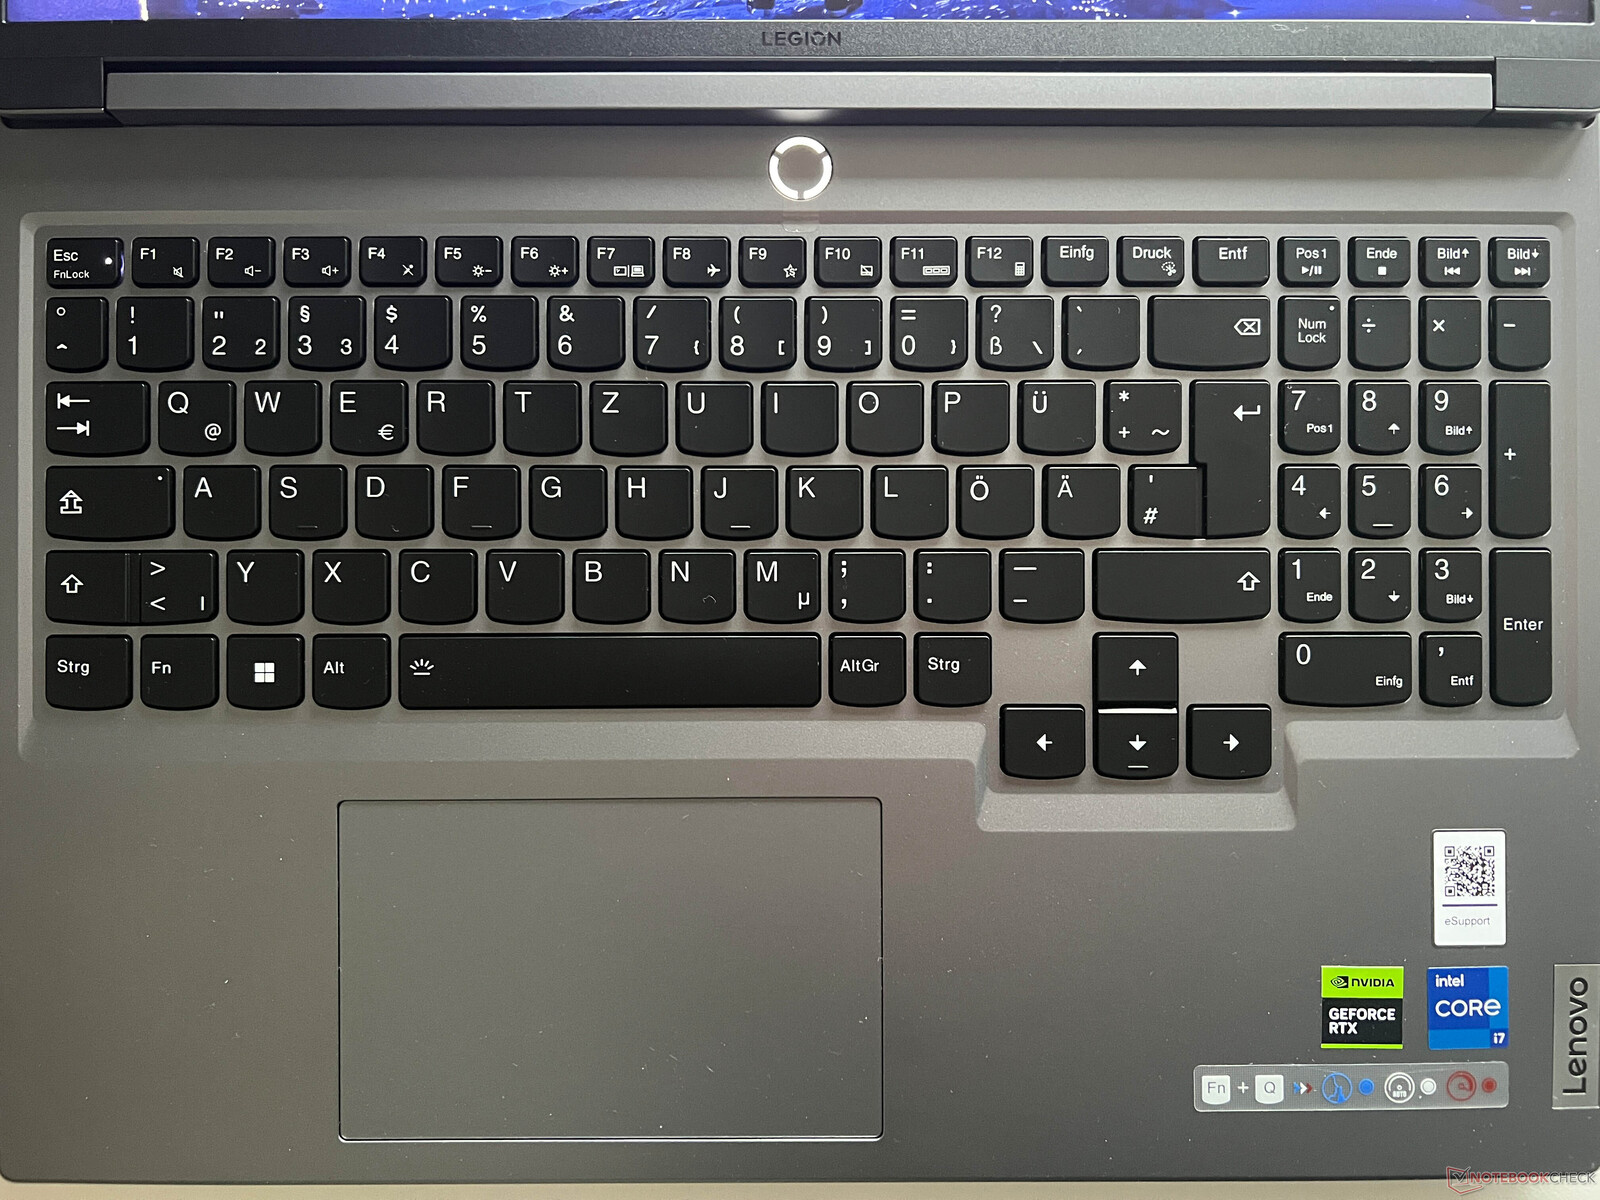
Le pavé tactile est positionné légèrement à gauche et ses dimensions (12 x 7,5 cm) sont parfaites pour une utilisation normale du pointeur, qui fonctionne également très bien. Il est possible d'appuyer sur la partie inférieure du pavé, ce qui, malheureusement, produit un bruit fort. Dans les jeux, la plupart des utilisateurs se serviront de toute façon d'une manette de jeu ou d'une souris. Ceux-ci peuvent être connectés des deux côtés de l'appareil.
Écran - 240-Hz IPS

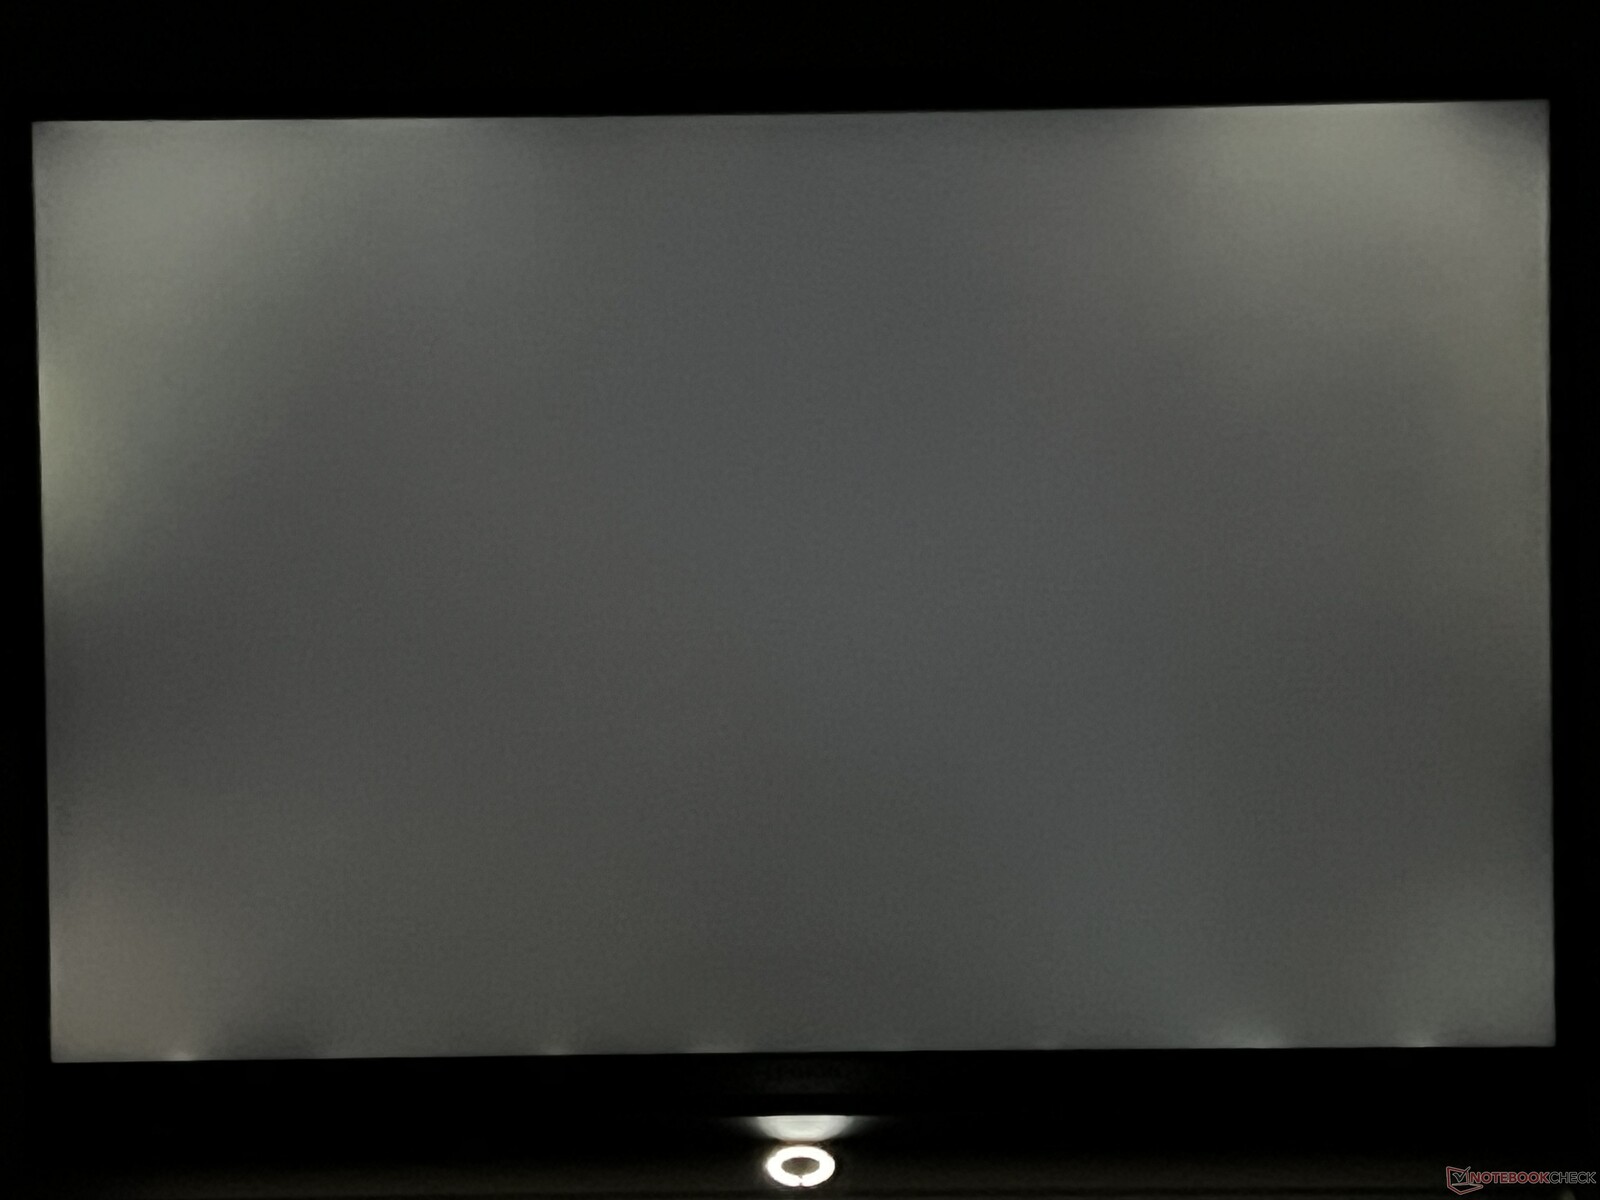
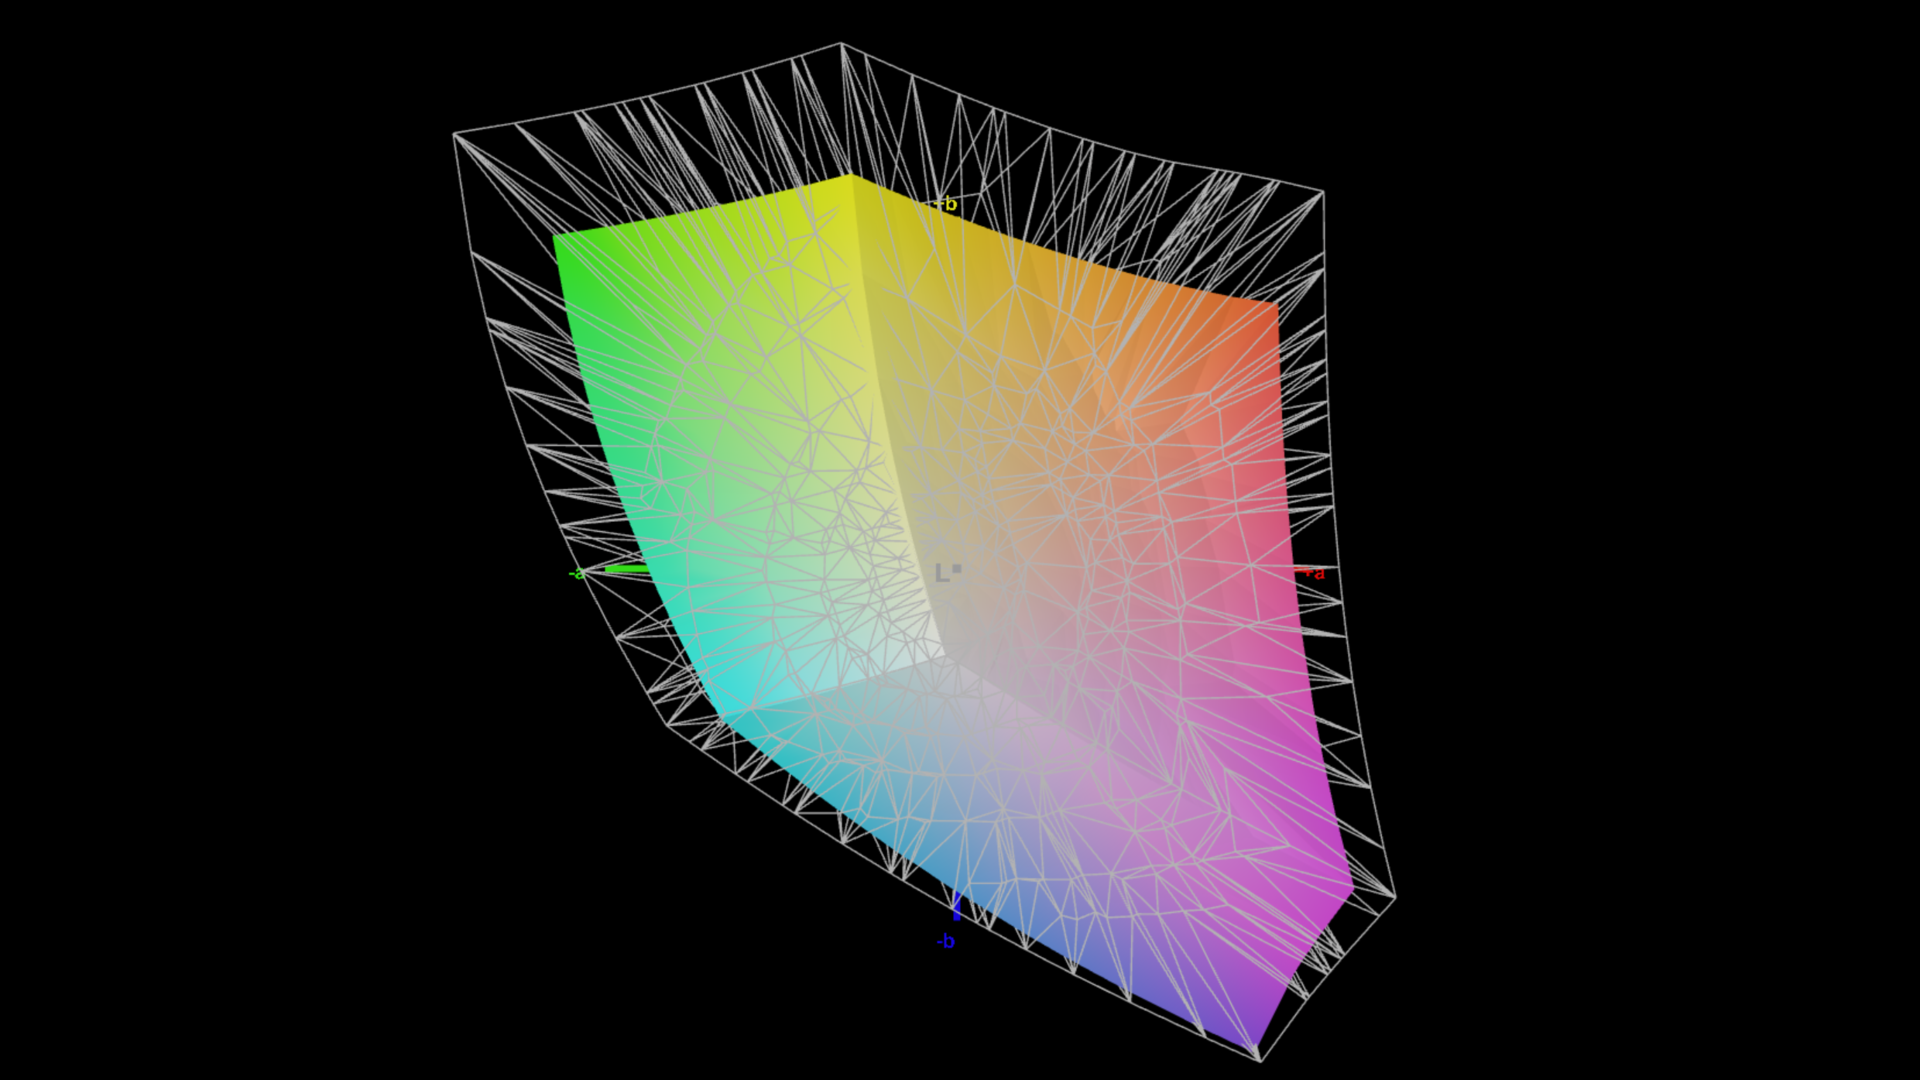
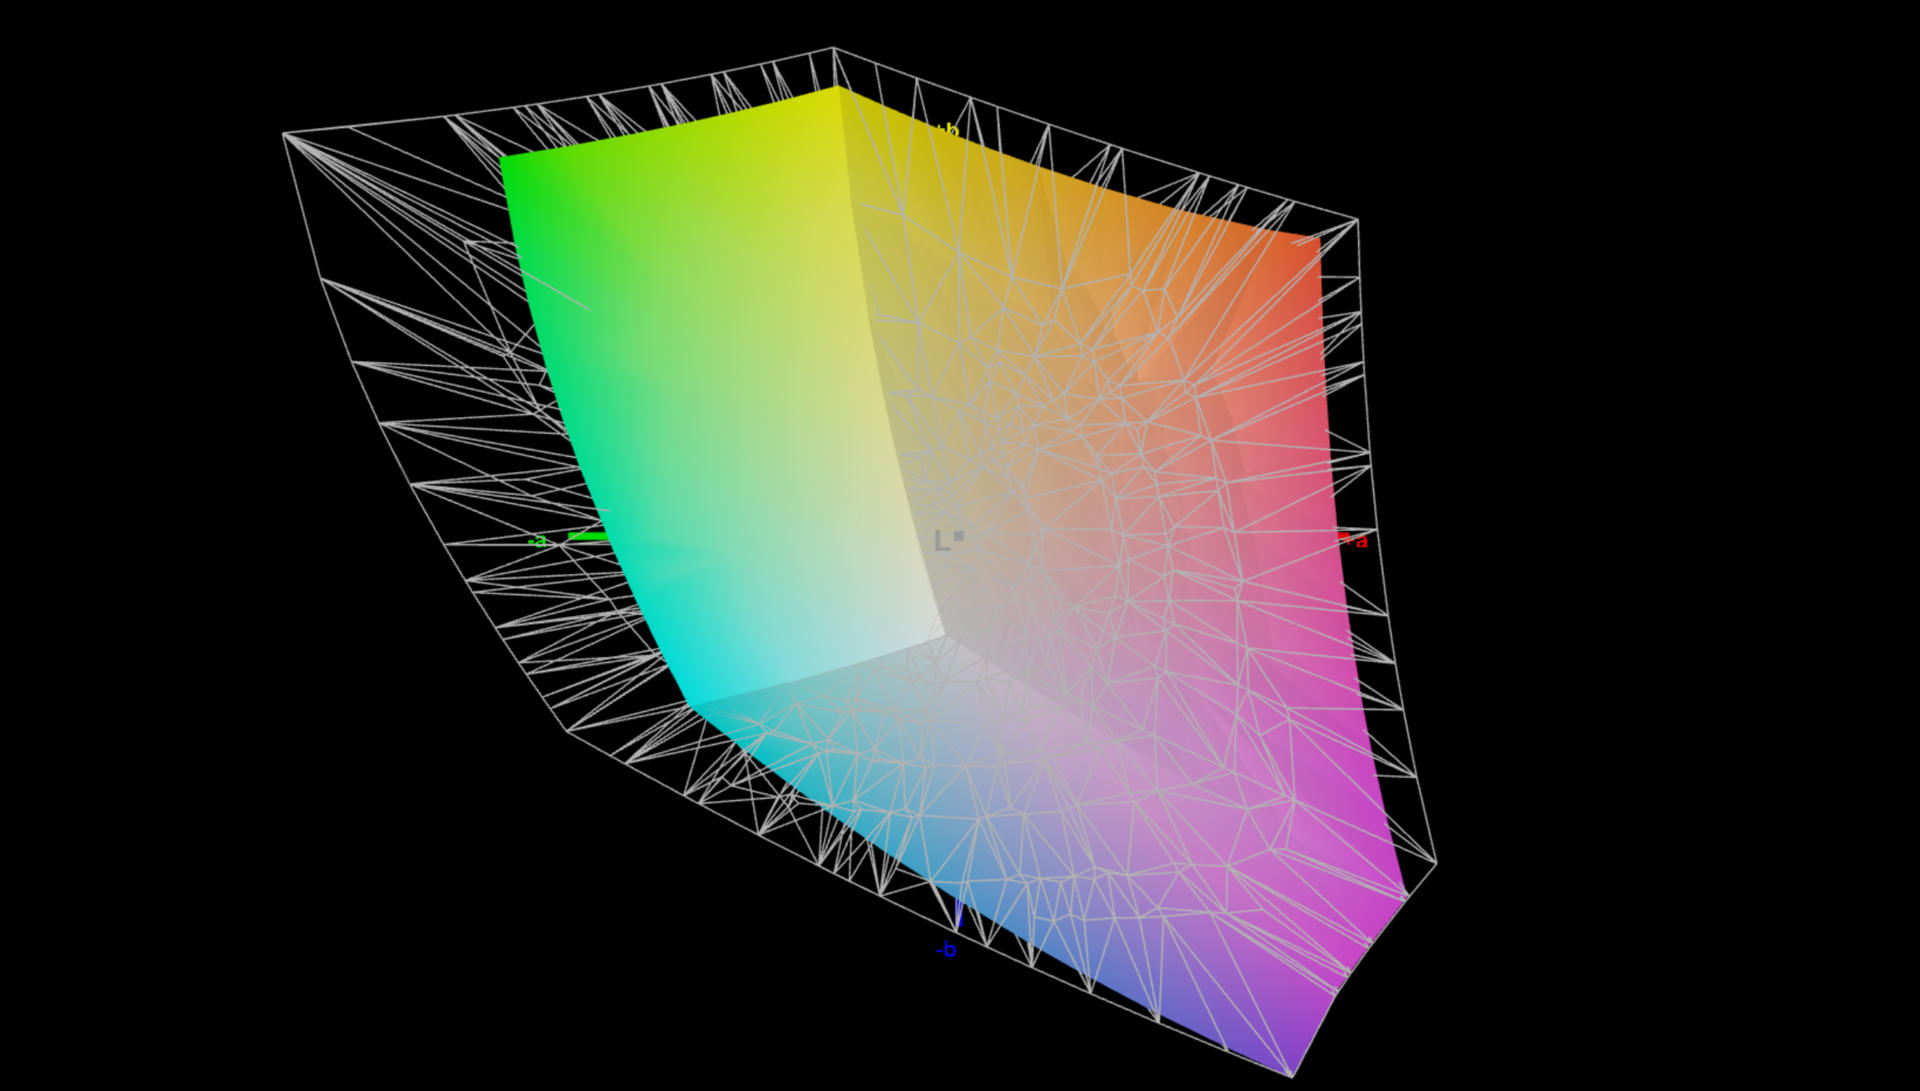
Lenovo propose deux écrans WQXGA mats différents avec une résolution de 2 560 x 1 600 pixels. Outre une version avec un taux de rafraîchissement de 165 Hz et une luminosité de 300 lumens, vous pouvez également choisir une variante plus lumineuse de 500 lumens avec un taux de rafraîchissement de 240 Hz. Cette dernière prend également en charge le HDR et c'est celle qui a été installée sur notre appareil de test. D'un point de vue subjectif, l'écran est superbe : les contenus sont très nets, les couleurs sont vives et même les zones plus claires n'ont pas l'air granuleuses. Cependant, vous pouvez remarquer quelques halos clairs lorsque vous regardez des images sombres en augmentant la luminosité.
Notre écran a atteint un maximum de 528 cd/m² et une moyenne de 500 cd/m², ce qui signifie que son objectif a été atteint. Sa valeur de noir de 0,33 est correcte et son rapport de contraste maximal est supérieur à 1 500:1. Les vitesses de réaction de l'écran sont rapides et au même niveau que les autres écrans IPS concurrents. Dans l'ensemble, l'écran est bien adapté aux jeux et ses valeurs sont meilleures que celles de la concurrence. Le contenu HDR est également pris en charge (mais le HDR doit être activé manuellement via les paramètres Windows).
| |||||||||||||||||||||||||
Homogénéité de la luminosité: 87 %
Valeur mesurée au centre, sur batterie: 519 cd/m²
Contraste: 1594:1 (Valeurs des noirs: 0.33 cd/m²)
ΔE ColorChecker Calman: 1.2 | ∀{0.5-29.43 Ø4.73}
calibrated: 1
ΔE Greyscale Calman: 1.3 | ∀{0.09-98 Ø4.97}
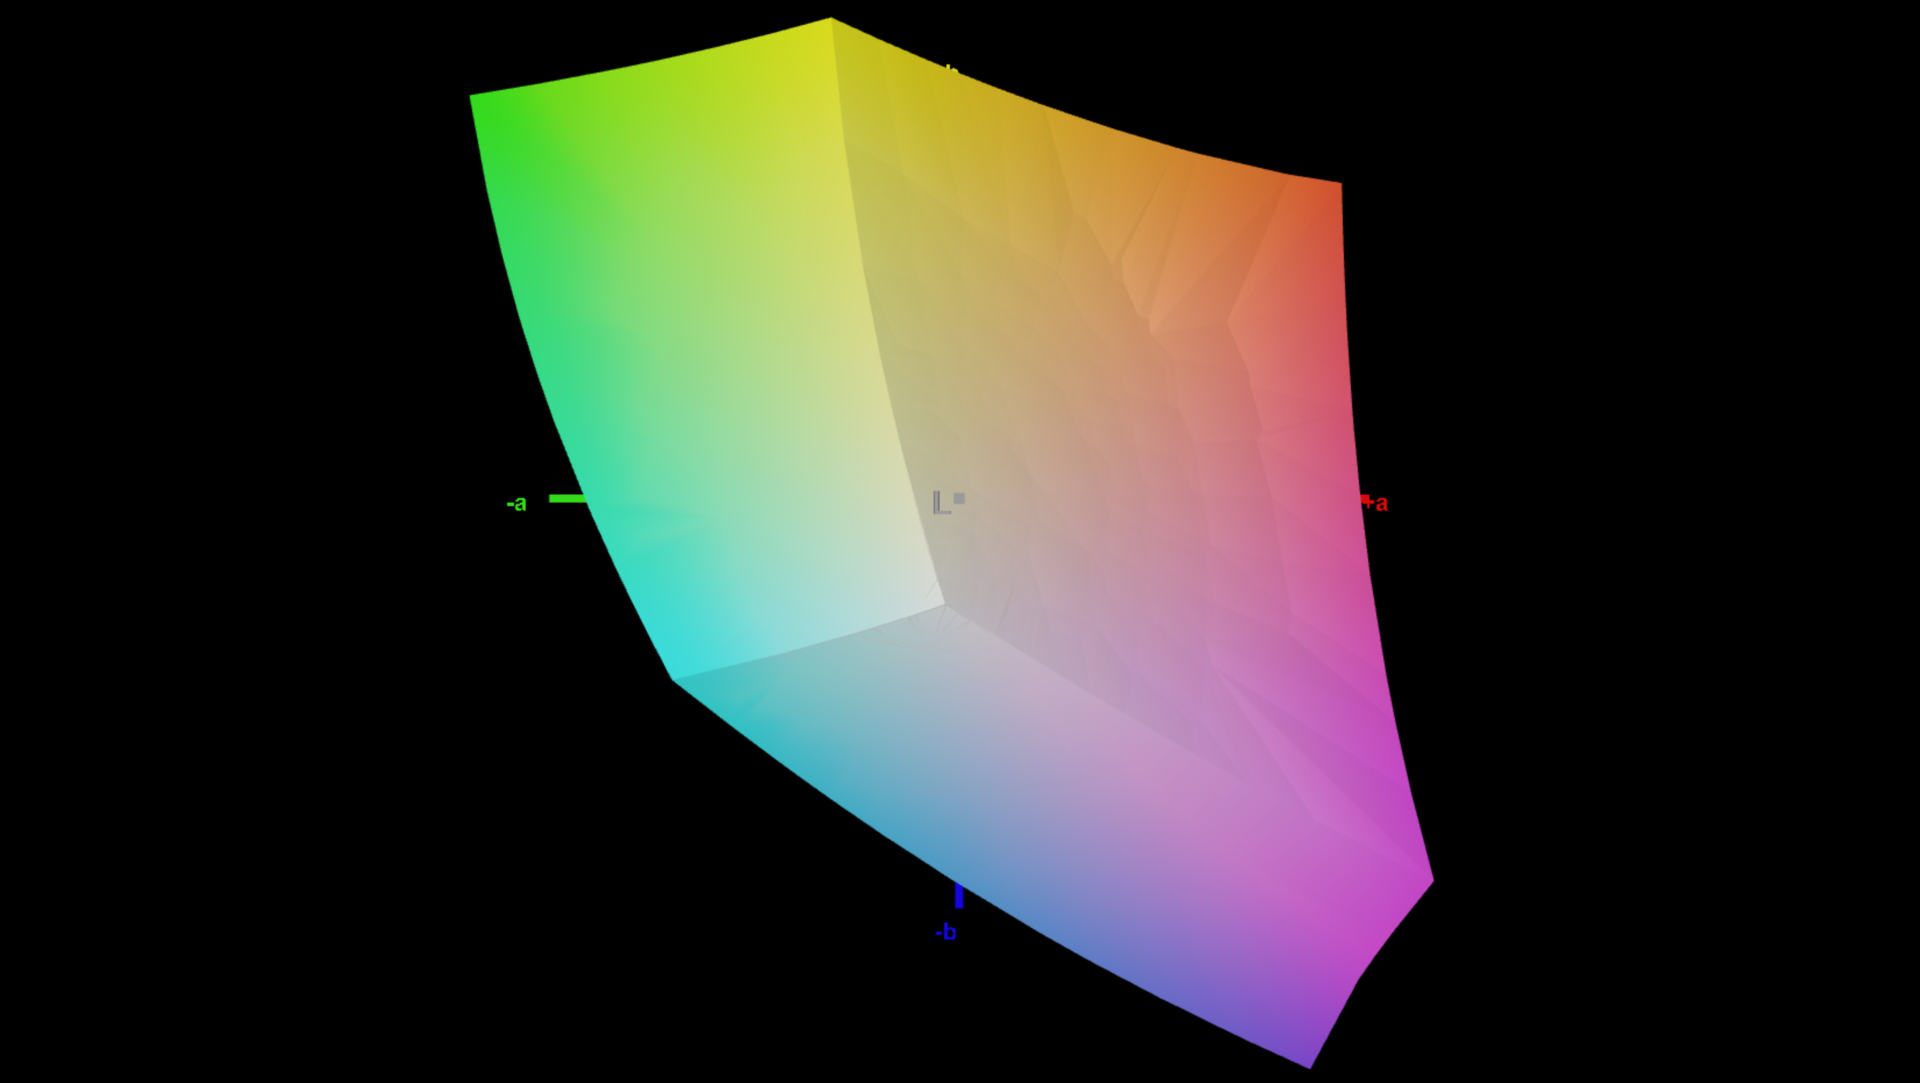
74.1% AdobeRGB 1998 (Argyll 3D)
100% sRGB (Argyll 3D)
72.4% Display P3 (Argyll 3D)
Gamma: 2.23
CCT: 6391 K
| Lenovo Legion 5 16IRX G9 NE160QDM-NZ3, IPS, 2560x1600, 16" | Schenker XMG CORE 16 (L23) BOE0AF0 (), IPS, 2560x1600, 16" | HP Victus 16-r0077ng CMN162D, IPS, 1920x1080, 16.1" | Lenovo LOQ 16IRH8 AUOC1A5 (B160QAN03.L), IPS, 2560x1600, 16" | Lenovo Legion Slim 5 16APH8 BOE NJ NE160QDM-NYC, IPS, 2560x1600, 16" | HP Victus 16-r0076TX Chi Mei CMN1629, IPS, 1920x1080, 16.1" | Alienware m16 R1 Intel BOE NE16NYB, IPS, 2560x1600, 16" | Lenovo Legion Pro 5 16IRX8 AU Optronics B160QAN03.1, IPS, 2560x1600, 16" | |
|---|---|---|---|---|---|---|---|---|
| Display | -4% | -6% | -2% | -3% | -5% | -5% | -1% | |
| Display P3 Coverage (%) | 72.4 | 68.3 -6% | 66.7 -8% | 70.5 -3% | 69.3 -4% | 67.5 -7% | 67.7 -6% | 71.2 -2% |
| sRGB Coverage (%) | 100 | 98.6 -1% | 98 -2% | 98.9 -1% | 100 0% | 97.5 -2% | 97.2 -3% | 98.8 -1% |
| AdobeRGB 1998 Coverage (%) | 74.1 | 69.6 -6% | 69 -7% | 72.6 -2% | 70 -6% | 69.7 -6% | 70 -6% | 73.3 -1% |
| Response Times | 9% | 0% | 29% | 12% | 32% | 42% | -18% | |
| Response Time Grey 50% / Grey 80% * (ms) | 12.5 ? | 13.2 ? -6% | 13.3 ? -6% | 7.2 ? 42% | 10.7 ? 14% | 6.18 ? 51% | 4 ? 68% | 14.5 ? -16% |
| Response Time Black / White * (ms) | 8.7 ? | 6.6 ? 24% | 8.2 ? 6% | 7.4 ? 15% | 7.8 ? 10% | 7.62 ? 12% | 7.3 ? 16% | 10.4 ? -20% |
| PWM Frequency (Hz) | ||||||||
| Screen | -67% | -16% | -24% | -14% | -21% | -51% | -20% | |
| Brightness middle (cd/m²) | 526 | 376 -29% | 308 -41% | 407 -23% | 371.6 -29% | 290 -45% | 306 -42% | 405.7 -23% |
| Brightness (cd/m²) | 500 | 358 -28% | 285 -43% | 369 -26% | 343 -31% | 275 -45% | 302 -40% | 368 -26% |
| Brightness Distribution (%) | 87 | 88 1% | 85 -2% | 85 -2% | 84 -3% | 82 -6% | 89 2% | 87 0% |
| Black Level * (cd/m²) | 0.33 | 0.33 -0% | 0.25 24% | 0.45 -36% | 0.44 -33% | 0.21 36% | 0.3 9% | 0.38 -15% |
| Contrast (:1) | 1594 | 1139 -29% | 1232 -23% | 904 -43% | 845 -47% | 1381 -13% | 1020 -36% | 1068 -33% |
| Colorchecker dE 2000 * | 1.2 | 2.74 -128% | 1.3 -8% | 1.43 -19% | 1.52 -27% | 1.7 -42% | 2.57 -114% | 1.65 -38% |
| Colorchecker dE 2000 max. * | 2.1 | 6.78 -223% | 2.76 -31% | 3.58 -70% | 2.68 -28% | 3.57 -70% | 4.26 -103% | 4.2 -100% |
| Colorchecker dE 2000 calibrated * | 1 | 0.88 12% | 0.92 8% | 1.07 -7% | 0.33 67% | 0.93 7% | 0.85 15% | 0.53 47% |
| Greyscale dE 2000 * | 1.3 | 3.57 -175% | 1.7 -31% | 1.13 13% | 1.2 8% | 1.5 -15% | 3.3 -154% | 1.2 8% |
| Gamma | 2.23 99% | 2.4 92% | 2.167 102% | 2.5 88% | 2.1 105% | 2.1 105% | 1.997 110% | 2.3 96% |
| CCT | 6391 102% | 7246 90% | 6767 96% | 6526 100% | 6503 100% | 6538 99% | 6895 94% | 6453 101% |
| Moyenne finale (programmes/paramètres) | -21% /
-42% | -7% /
-12% | 1% /
-12% | -2% /
-8% | 2% /
-10% | -5% /
-28% | -13% /
-16% |
* ... Moindre est la valeur, meilleures sont les performances
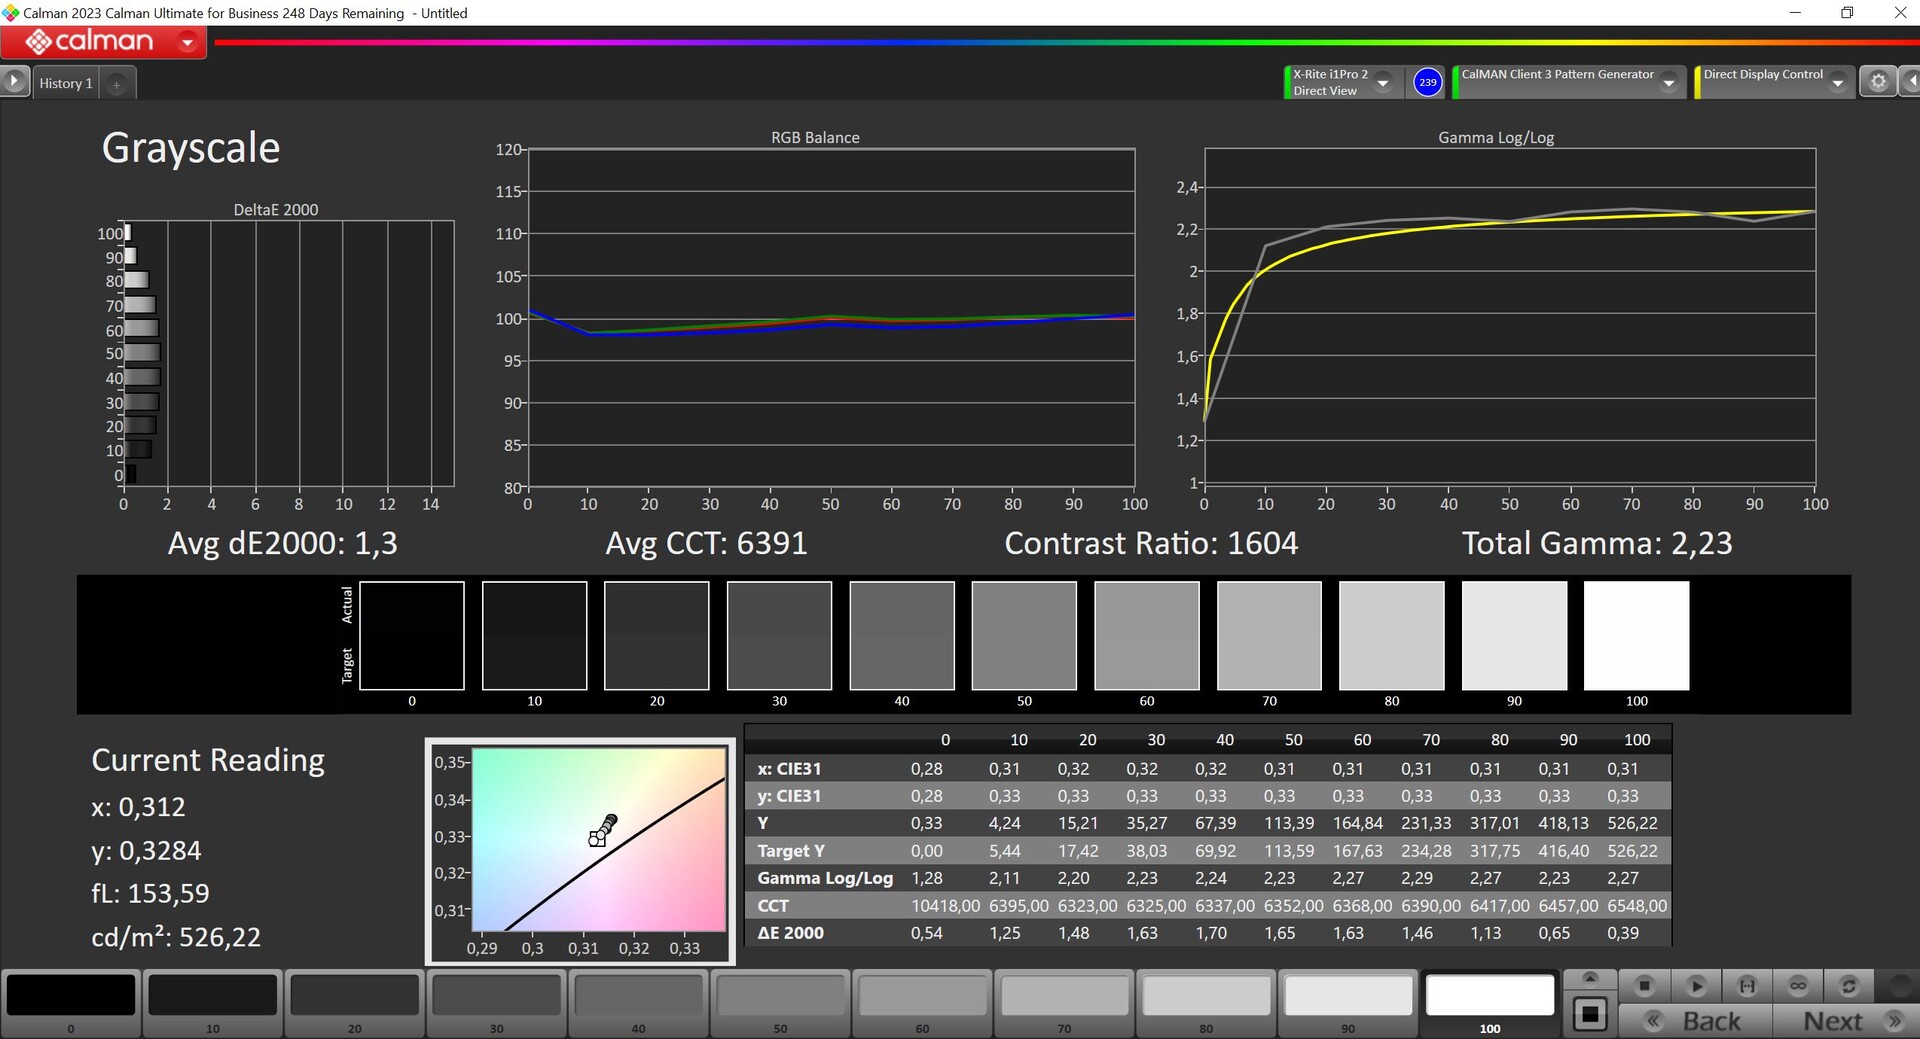
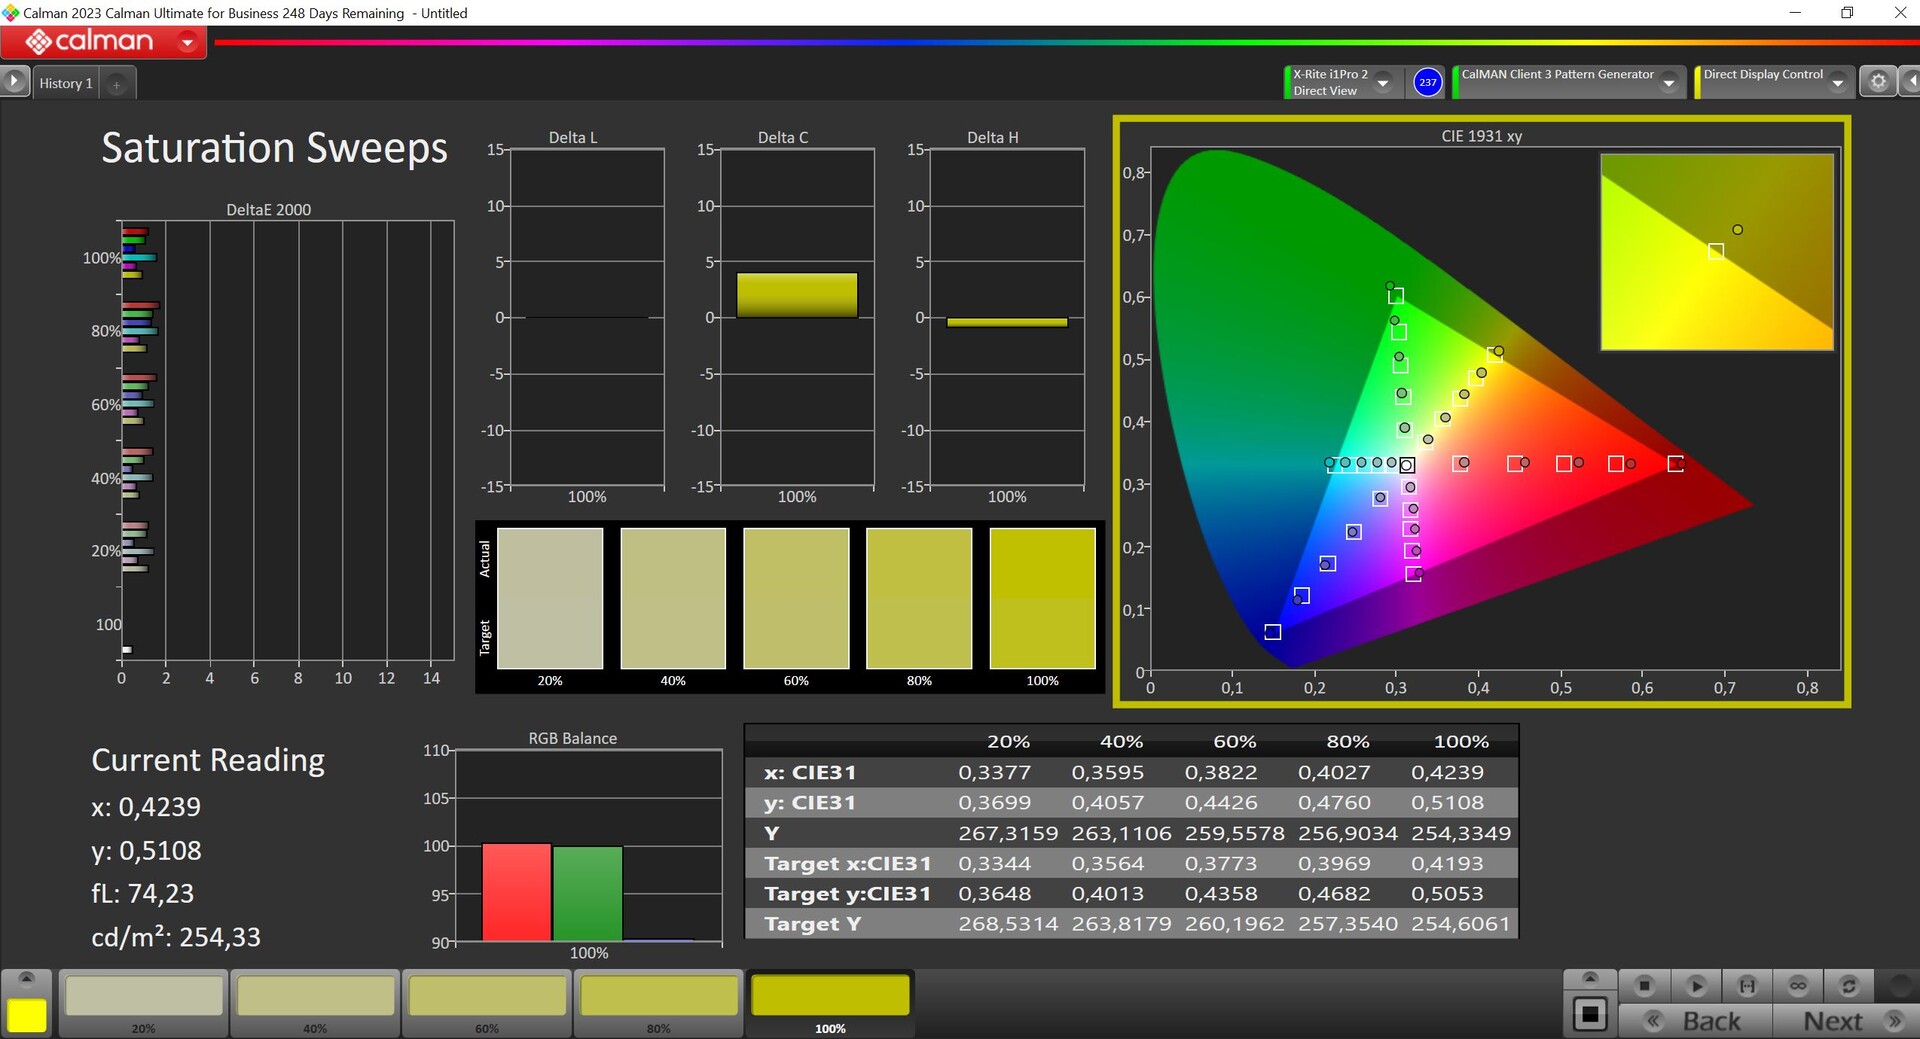
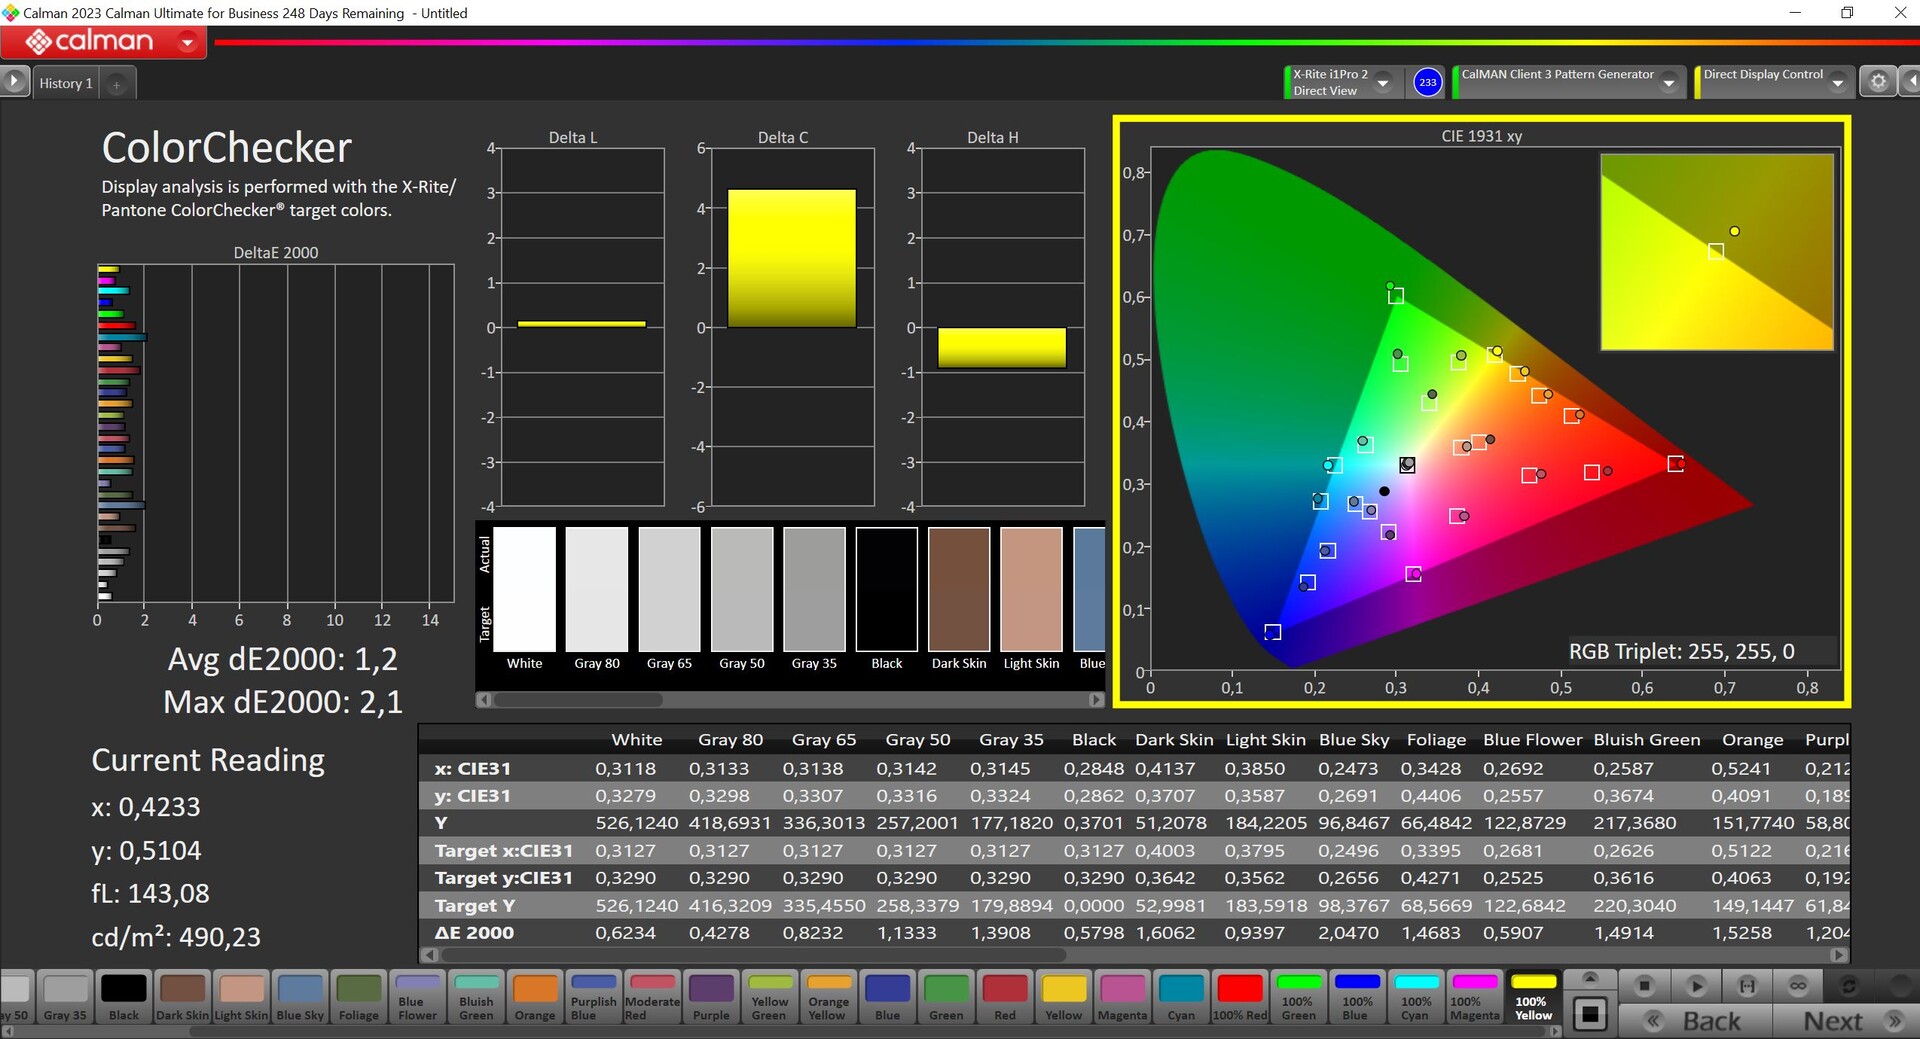


Ex fonctionne, l'écran du Legion 5i est pré-calibré et il y a quelques profils de couleurs disponibles. Nous l'avons analysé à l'aide du logiciel professionnel CalMAN (X-Rite i1 Pro2) en utilisant le profil "natif". Sa représentation est déjà superbe, car ni les niveaux de gris ni les couleurs ne présentent d'écarts DeltaE-2000 supérieurs à 3. De plus, nous n'avons pas noté de teinte de couleur et un étalonnage par l'utilisateur pourrait même être superflu. Nous avons peut-être pu améliorer la qualité de la représentation grâce à notre propre étalonnage (téléchargeable gratuitement plus haut), mais cela n'est que mesurable, pas visible. Avec sa couverture sRGB complète, l'écran peut être utilisé en toute confiance pour éditer des photos ou des vidéos.
Temps de réponse de l'écran
| ↔ Temps de réponse noir à blanc | ||
|---|---|---|
| 8.7 ms ... hausse ↗ et chute ↘ combinées | ↗ 4.6 ms hausse | 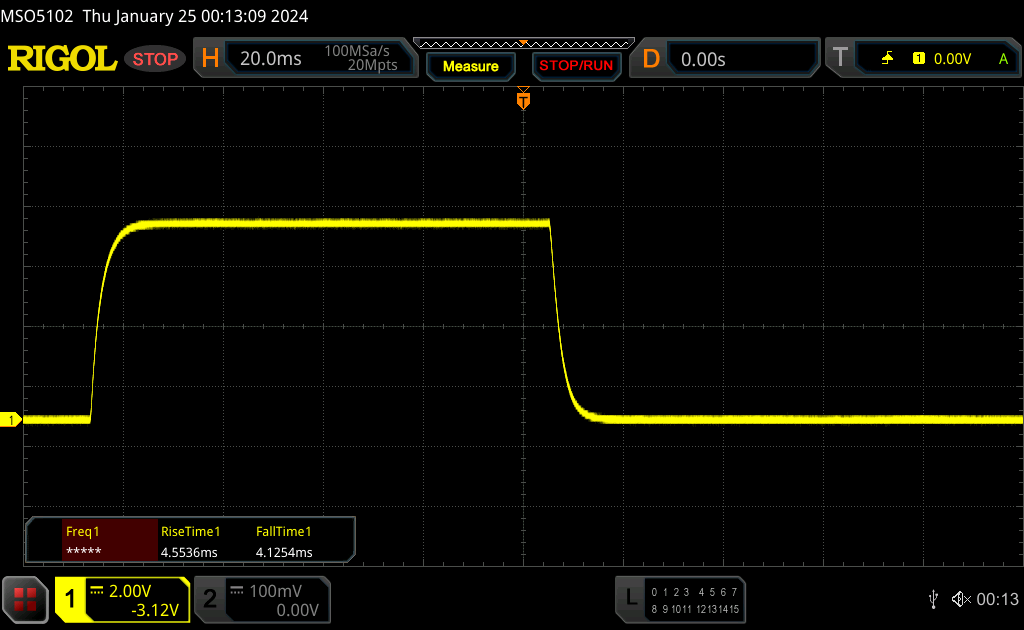 |
| ↘ 4.1 ms chute | ||
| L'écran montre de faibles temps de réponse, un bon écran pour jouer. En comparaison, tous les appareils testés affichent entre 0.1 (minimum) et 240 (maximum) ms. » 24 % des appareils testés affichent de meilleures performances. Cela signifie que les latences relevées sont meilleures que la moyenne (19.9 ms) de tous les appareils testés. | ||
| ↔ Temps de réponse gris 50% à gris 80% | ||
| 12.5 ms ... hausse ↗ et chute ↘ combinées | ↗ 6.1 ms hausse | 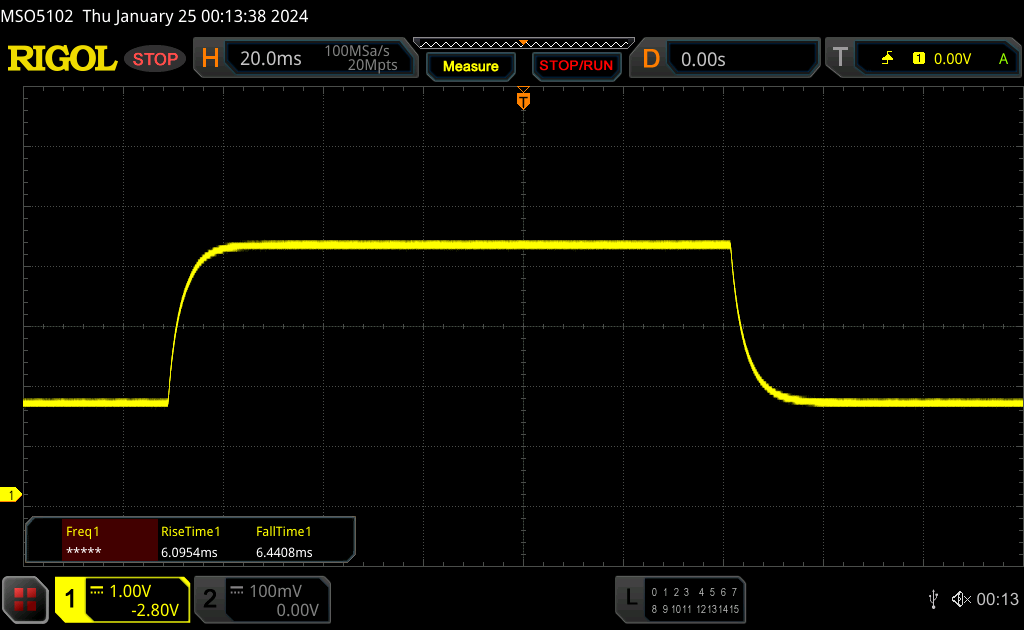 |
| ↘ 6.4 ms chute | ||
| L'écran montre de bons temps de réponse, mais insuffisant pour du jeu compétitif. En comparaison, tous les appareils testés affichent entre 0.165 (minimum) et 636 (maximum) ms. » 26 % des appareils testés affichent de meilleures performances. Cela signifie que les latences relevées sont meilleures que la moyenne (31.1 ms) de tous les appareils testés. | ||
Scintillement / MLI (Modulation de largeur d'impulsion)
| Scintillement / MLI (Modulation de largeur d'impulsion) non décelé | 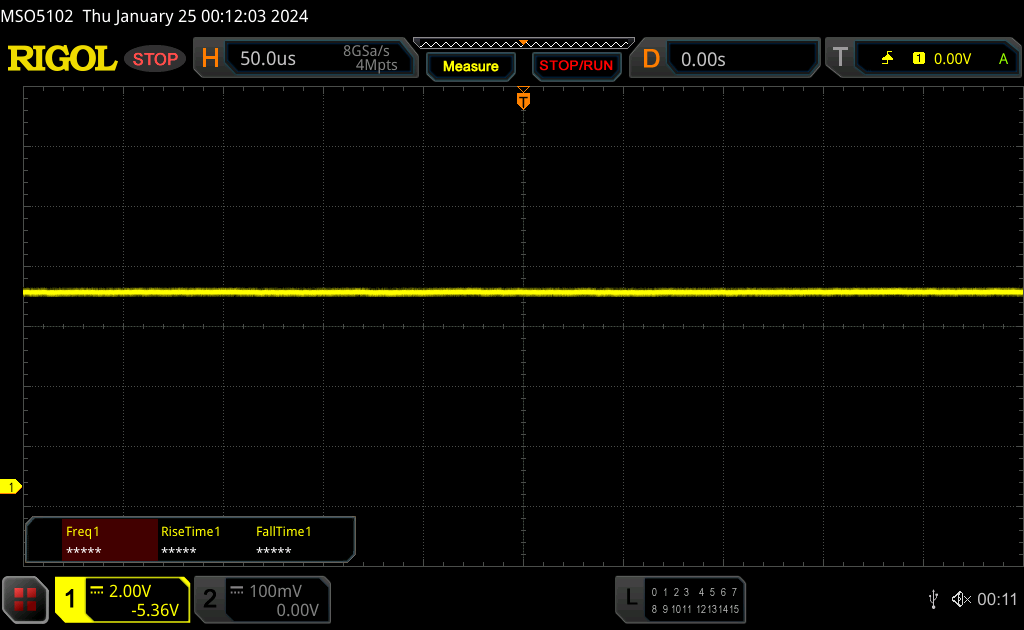 | ||
En comparaison, 52 % des appareils testés n'emploient pas MDI pour assombrir leur écran. Nous avons relevé une moyenne à 7794 (minimum : 5 - maximum : 343500) Hz dans le cas où une MDI était active. | |||

Grâce à la luminosité élevée et à la surface mate de l'écran, le Legion 5i 16 peut être utilisé sans problème à l'extérieur ou dans un environnement lumineux. La stabilité de l'angle de vision de l'écran IPS est bonne, mais si vous le regardez en diagonale, l'image s'éclaircit quelque peu.

Performance - Raptor Lake-HX Refresh & Ada Lovelace
Lenovo propose le Legion 5i 16 G9 avec cinq processeurs HX différents d'Intel, bien que les deux variantes les plus faibles appartiennent toujours à la 13e génération de l'année dernière. Le modèle phare peut être équipé au mieux d'un Core i9-14900HX, et notre échantillon de test est équipé d'un Core i7-14650HX. Les cartes graphiques disponibles sont les modèles Nvidia actuels GeForce RTX 4050 Laptop, 4060 Laptop et 4070 Laptop avec un TGP maximum de 115 watts et un commutateur MUX pour la commutation graphique Advanced Optimus.
Conditions d'essai
Lenovo propose trois modes de performance différents dans l'application Vantage préinstallée, ainsi qu'un mode personnalisé que l'utilisateur peut ajuster en profondeur (limites de puissance du CPU/GPU, limites de température du CPU/GPU, boost dynamique du CPU/GPU). Vous pouvez donc jouer avec ces paramètres autant que vous le souhaitez. Nous avons répertorié les paramètres respectifs des trois réglages prédéfinis dans le tableau ci-dessous(mode silencieux, mode équilibré et mode performance).
| Profil énergétique | Charge CPU | CB R23 Multi | Charge GPU | Time Spy graphiques | Cyberpunk 2077 QHD Ultra | émissions max. du ventilateur |
|---|---|---|---|---|---|---|
| Mode silencieux | 65->55 watts | 16 720 points | 65 watts | 8 443 points | 35,4 fps | 34,6 dB(A) |
| Mode équilibré | 120->70 watts | 19,897 points | 80 watts | 9,749 points | 43,4 fps | 49,8 dB(A) |
| Mode performance | 140->100 watts | 24 455 points | 125 watts | 11 267 points | 49,7 fps | 55,7 dB(A) |
Nous avons effectué les tests et mesures suivants en utilisant le mode performance, car les performances de jeu de l'appareil, en particulier, sont bien meilleures dans ce mode. Bien sûr, les ventilateurs sont également plus bruyants, mais même en mode équilibré, les ventilateurs peuvent être très bruyants pendant le jeu et vous aurez probablement besoin d'un casque de toute façon, alors vous pouvez utiliser le mode performance. Les profils peuvent être sélectionnés via la combinaison de touches Fn+Q, tandis que la LED d'état colorée sur le bouton d'alimentation indique le mode actuellement utilisé (rouge : performance, blanc : équilibré, bleu : silencieux, violet : ajusté). Pendant les tâches quotidiennes simples, vous pouvez facilement utiliser le mode silencieux tout en profitant souvent d'un appareil complètement silencieux. En utilisation sur batterie, vous ne pouvez pas utiliser le mode performance.
Lenovo a doté l'AI Engine+ du Legion 5i 16 de sa propre puce LA1 AI, qui peut être activée en conjonction avec le mode équilibré. Elle est censée reconnaître automatiquement les jeux et optimiser les performances de l'ordinateur portable, ce qui peut entraîner une augmentation de la température et du bruit des ventilateurs. En général, il ne s'agit pas d'une nouveauté et une fonction similaire était déjà présente sur les modèles précédents, où les jeux déclenchaient un passage automatique en mode performance. En revanche, nous n'avons pas remarqué de différence par rapport au mode équilibré lors de l'utilisation de ce nouveau AI Engine+, et les performances de l'appareil étaient souvent les mêmes, voire pires qu'en mode performance.
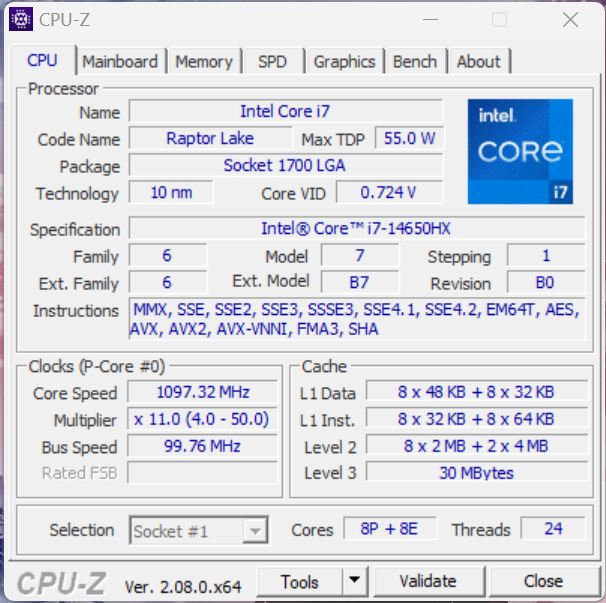
Processeur - Core i7-14650HX
Le nouveau Core i7-14650HX est le successeur de l'ancien Core i7-13700HXoffrant la même configuration de cœurs (8x performance + 8x efficacité) avec des fréquences d'horloge légèrement plus élevées (jusqu'à 5,2 GHz) - mais en termes d'architecture générale, rien n'a changé. Sur le site Legion 5i 16, le nouveau processeur HX consomme 140 watts pendant une courte période, avant de s'équilibrer à 100 watts. Les performances qui en résultent sont excellentes, avec un avantage de 10 % par rapport à l'ancien 13700HX. Les modèles AMD ont également fait nettement moins bien. Lors des tests à cœur unique, le Legion s'est également imposé. En utilisation sur batterie, sa consommation d'énergie est limitée à 50 watts, ce qui explique que ses performances multicœurs aient chuté d'environ 40 % (CB R23 Multi : 14 202 points).
Vous trouverez d'autres analyses comparatives de processeurs dans notre section technique Processeurs mobiles - indice de référence .
Cinebench R15 Multi continuous test
Cinebench R23: Multi Core | Single Core
Cinebench R20: CPU (Multi Core) | CPU (Single Core)
Cinebench R15: CPU Multi 64Bit | CPU Single 64Bit
Blender: v2.79 BMW27 CPU
7-Zip 18.03: 7z b 4 | 7z b 4 -mmt1
Geekbench 6.7: Multi-Core | Single-Core
Geekbench 5.5: Multi-Core | Single-Core
HWBOT x265 Benchmark v2.2: 4k Preset
LibreOffice : 20 Documents To PDF
R Benchmark 2.5: Overall mean
| CPU Performance rating | |
| Moyenne de la classe Gaming | |
| Lenovo Legion 5 16IRX G9 | |
| Alienware m16 R1 Intel | |
| Moyenne Intel Core i7-14650HX | |
| Lenovo Legion Pro 5 16IRX8 -2! | |
| Lenovo Legion Slim 5 16APH8 -2! | |
| Schenker XMG CORE 16 (L23) | |
| HP Victus 16-r0076TX -3! | |
| Lenovo LOQ 16IRH8 | |
| HP Victus 16-r0077ng | |
| Cinebench R23 / Multi Core | |
| Moyenne de la classe Gaming (10488 - 40970, n=112, 2 dernières années) | |
| Lenovo Legion 5 16IRX G9 | |
| Alienware m16 R1 Intel | |
| Moyenne Intel Core i7-14650HX (16453 - 24455, n=2) | |
| Lenovo Legion Pro 5 16IRX8 | |
| HP Victus 16-r0076TX | |
| Schenker XMG CORE 16 (L23) | |
| Lenovo Legion Slim 5 16APH8 | |
| HP Victus 16-r0077ng | |
| Lenovo LOQ 16IRH8 | |
| Cinebench R23 / Single Core | |
| Moyenne de la classe Gaming (1166 - 2356, n=112, 2 dernières années) | |
| Moyenne Intel Core i7-14650HX (1963 - 1975, n=2) | |
| Lenovo Legion 5 16IRX G9 | |
| Alienware m16 R1 Intel | |
| Lenovo LOQ 16IRH8 | |
| Lenovo Legion Slim 5 16APH8 | |
| Schenker XMG CORE 16 (L23) | |
| HP Victus 16-r0076TX | |
| HP Victus 16-r0077ng | |
| Lenovo Legion Pro 5 16IRX8 | |
| Cinebench R20 / CPU (Multi Core) | |
| Moyenne de la classe Gaming (4029 - 16108, n=111, 2 dernières années) | |
| Lenovo Legion 5 16IRX G9 | |
| Alienware m16 R1 Intel | |
| Moyenne Intel Core i7-14650HX (6236 - 9349, n=2) | |
| HP Victus 16-r0076TX | |
| Lenovo Legion Pro 5 16IRX8 | |
| Lenovo Legion Slim 5 16APH8 | |
| Schenker XMG CORE 16 (L23) | |
| HP Victus 16-r0077ng | |
| Lenovo LOQ 16IRH8 | |
| Cinebench R20 / CPU (Single Core) | |
| Moyenne de la classe Gaming (442 - 895, n=111, 2 dernières années) | |
| Moyenne Intel Core i7-14650HX (754 - 762, n=2) | |
| Lenovo Legion 5 16IRX G9 | |
| Alienware m16 R1 Intel | |
| Lenovo LOQ 16IRH8 | |
| Lenovo Legion Slim 5 16APH8 | |
| Schenker XMG CORE 16 (L23) | |
| Lenovo Legion Pro 5 16IRX8 | |
| HP Victus 16-r0077ng | |
| HP Victus 16-r0076TX | |
| Cinebench R15 / CPU Multi 64Bit | |
| Moyenne de la classe Gaming (1578 - 6271, n=111, 2 dernières années) | |
| Lenovo Legion 5 16IRX G9 | |
| Moyenne Intel Core i7-14650HX (3142 - 3799, n=2) | |
| Lenovo Legion Pro 5 16IRX8 | |
| Alienware m16 R1 Intel | |
| HP Victus 16-r0076TX | |
| Lenovo Legion Slim 5 16APH8 | |
| Schenker XMG CORE 16 (L23) | |
| Lenovo LOQ 16IRH8 | |
| HP Victus 16-r0077ng | |
| Cinebench R15 / CPU Single 64Bit | |
| Moyenne de la classe Gaming (188.8 - 343, n=111, 2 dernières années) | |
| Lenovo Legion 5 16IRX G9 | |
| Moyenne Intel Core i7-14650HX (284 - 287, n=2) | |
| Lenovo Legion Slim 5 16APH8 | |
| Alienware m16 R1 Intel | |
| Schenker XMG CORE 16 (L23) | |
| Lenovo Legion Pro 5 16IRX8 | |
| Lenovo LOQ 16IRH8 | |
| HP Victus 16-r0077ng | |
| HP Victus 16-r0076TX | |
| Blender / v2.79 BMW27 CPU | |
| Lenovo LOQ 16IRH8 | |
| HP Victus 16-r0077ng | |
| HP Victus 16-r0076TX | |
| Schenker XMG CORE 16 (L23) | |
| Lenovo Legion Slim 5 16APH8 | |
| Moyenne Intel Core i7-14650HX (141 - 206, n=2) | |
| Alienware m16 R1 Intel | |
| Moyenne de la classe Gaming (80 - 330, n=109, 2 dernières années) | |
| Lenovo Legion Pro 5 16IRX8 | |
| Lenovo Legion 5 16IRX G9 | |
| 7-Zip 18.03 / 7z b 4 | |
| Lenovo Legion 5 16IRX G9 | |
| Moyenne de la classe Gaming (33491 - 148086, n=110, 2 dernières années) | |
| Alienware m16 R1 Intel | |
| Moyenne Intel Core i7-14650HX (68711 - 93686, n=2) | |
| Lenovo Legion Pro 5 16IRX8 | |
| Schenker XMG CORE 16 (L23) | |
| HP Victus 16-r0076TX | |
| Lenovo Legion Slim 5 16APH8 | |
| HP Victus 16-r0077ng | |
| Lenovo LOQ 16IRH8 | |
| 7-Zip 18.03 / 7z b 4 -mmt1 | |
| Lenovo Legion 5 16IRX G9 | |
| Schenker XMG CORE 16 (L23) | |
| Moyenne Intel Core i7-14650HX (6364 - 6695, n=2) | |
| Lenovo Legion Slim 5 16APH8 | |
| Alienware m16 R1 Intel | |
| Moyenne de la classe Gaming (4199 - 7436, n=110, 2 dernières années) | |
| Lenovo LOQ 16IRH8 | |
| Lenovo Legion Pro 5 16IRX8 | |
| HP Victus 16-r0077ng | |
| HP Victus 16-r0076TX | |
| Geekbench 6.7 / Multi-Core | |
| Lenovo Legion 5 16IRX G9 | |
| Moyenne de la classe Gaming (6625 - 22104, n=111, 2 dernières années) | |
| Moyenne Intel Core i7-14650HX (12892 - 16010, n=2) | |
| Alienware m16 R1 Intel | |
| Schenker XMG CORE 16 (L23) | |
| Lenovo LOQ 16IRH8 | |
| HP Victus 16-r0077ng | |
| Geekbench 6.7 / Single-Core | |
| Moyenne de la classe Gaming (1490 - 3259, n=111, 2 dernières années) | |
| Lenovo Legion 5 16IRX G9 | |
| Moyenne Intel Core i7-14650HX (2744 - 2761, n=2) | |
| Schenker XMG CORE 16 (L23) | |
| Alienware m16 R1 Intel | |
| Lenovo LOQ 16IRH8 | |
| HP Victus 16-r0077ng | |
| Geekbench 5.5 / Multi-Core | |
| Moyenne de la classe Gaming (6460 - 27010, n=110, 2 dernières années) | |
| Lenovo Legion 5 16IRX G9 | |
| Moyenne Intel Core i7-14650HX (12584 - 16810, n=2) | |
| Alienware m16 R1 Intel | |
| Lenovo Legion Pro 5 16IRX8 | |
| HP Victus 16-r0076TX | |
| Lenovo LOQ 16IRH8 | |
| Schenker XMG CORE 16 (L23) | |
| Lenovo Legion Slim 5 16APH8 | |
| HP Victus 16-r0077ng | |
| Geekbench 5.5 / Single-Core | |
| Moyenne de la classe Gaming (986 - 2474, n=110, 2 dernières années) | |
| Lenovo Legion Slim 5 16APH8 | |
| Schenker XMG CORE 16 (L23) | |
| Moyenne Intel Core i7-14650HX (1933 - 1940, n=2) | |
| Lenovo Legion 5 16IRX G9 | |
| Alienware m16 R1 Intel | |
| Lenovo LOQ 16IRH8 | |
| Lenovo Legion Pro 5 16IRX8 | |
| HP Victus 16-r0076TX | |
| HP Victus 16-r0077ng | |
| HWBOT x265 Benchmark v2.2 / 4k Preset | |
| Moyenne de la classe Gaming (11.5 - 44.3, n=110, 2 dernières années) | |
| Lenovo Legion 5 16IRX G9 | |
| Lenovo Legion Pro 5 16IRX8 | |
| Alienware m16 R1 Intel | |
| Lenovo Legion Slim 5 16APH8 | |
| Schenker XMG CORE 16 (L23) | |
| HP Victus 16-r0076TX | |
| Moyenne Intel Core i7-14650HX (12.6 - 25.6, n=2) | |
| Lenovo LOQ 16IRH8 | |
| HP Victus 16-r0077ng | |
| LibreOffice / 20 Documents To PDF | |
| Schenker XMG CORE 16 (L23) | |
| HP Victus 16-r0077ng | |
| Moyenne Intel Core i7-14650HX (43.8 - 55.6, n=2) | |
| Moyenne de la classe Gaming (19 - 88.8, n=110, 2 dernières années) | |
| Lenovo LOQ 16IRH8 | |
| Alienware m16 R1 Intel | |
| Lenovo Legion 5 16IRX G9 | |
| Lenovo Legion Slim 5 16APH8 | |
| Lenovo Legion Pro 5 16IRX8 | |
| R Benchmark 2.5 / Overall mean | |
| HP Victus 16-r0077ng | |
| HP Victus 16-r0076TX | |
| Lenovo Legion Pro 5 16IRX8 | |
| Lenovo LOQ 16IRH8 | |
| Alienware m16 R1 Intel | |
| Schenker XMG CORE 16 (L23) | |
| Lenovo Legion Slim 5 16APH8 | |
| Moyenne de la classe Gaming (0.3439 - 0.759, n=111, 2 dernières années) | |
| Moyenne Intel Core i7-14650HX (0.4195 - 0.4244, n=2) | |
| Lenovo Legion 5 16IRX G9 | |
* ... Moindre est la valeur, meilleures sont les performances
AIDA64: FP32 Ray-Trace | FPU Julia | CPU SHA3 | CPU Queen | FPU SinJulia | FPU Mandel | CPU AES | CPU ZLib | FP64 Ray-Trace | CPU PhotoWorxx
| Performance rating | |
| Moyenne de la classe Gaming | |
| Schenker XMG CORE 16 (L23) | |
| Lenovo Legion Slim 5 16APH8 | |
| Alienware m16 R1 Intel | |
| Lenovo Legion Pro 5 16IRX8 | |
| Lenovo Legion 5 16IRX G9 | |
| HP Victus 16-r0076TX | |
| Moyenne Intel Core i7-14650HX | |
| HP Victus 16-r0077ng | |
| Lenovo LOQ 16IRH8 | |
| AIDA64 / FP32 Ray-Trace | |
| Moyenne de la classe Gaming (10227 - 85542, n=109, 2 dernières années) | |
| Lenovo Legion Slim 5 16APH8 | |
| Schenker XMG CORE 16 (L23) | |
| Lenovo Legion Pro 5 16IRX8 | |
| Alienware m16 R1 Intel | |
| Lenovo Legion 5 16IRX G9 | |
| Moyenne Intel Core i7-14650HX (13096 - 19044, n=2) | |
| HP Victus 16-r0076TX | |
| HP Victus 16-r0077ng | |
| Lenovo LOQ 16IRH8 | |
| AIDA64 / FPU Julia | |
| Moyenne de la classe Gaming (51376 - 238426, n=109, 2 dernières années) | |
| Lenovo Legion Slim 5 16APH8 | |
| Schenker XMG CORE 16 (L23) | |
| Lenovo Legion Pro 5 16IRX8 | |
| Alienware m16 R1 Intel | |
| Lenovo Legion 5 16IRX G9 | |
| HP Victus 16-r0076TX | |
| Moyenne Intel Core i7-14650HX (67335 - 95271, n=2) | |
| HP Victus 16-r0077ng | |
| Lenovo LOQ 16IRH8 | |
| AIDA64 / CPU SHA3 | |
| Moyenne de la classe Gaming (2180 - 9817, n=109, 2 dernières années) | |
| Schenker XMG CORE 16 (L23) | |
| Lenovo Legion Slim 5 16APH8 | |
| Alienware m16 R1 Intel | |
| Lenovo Legion Pro 5 16IRX8 | |
| Lenovo Legion 5 16IRX G9 | |
| HP Victus 16-r0076TX | |
| Moyenne Intel Core i7-14650HX (3109 - 4214, n=2) | |
| HP Victus 16-r0077ng | |
| Lenovo LOQ 16IRH8 | |
| AIDA64 / CPU Queen | |
| Lenovo Legion Slim 5 16APH8 | |
| Moyenne de la classe Gaming (49785 - 173351, n=100, 2 dernières années) | |
| Alienware m16 R1 Intel | |
| Lenovo Legion Pro 5 16IRX8 | |
| HP Victus 16-r0076TX | |
| Schenker XMG CORE 16 (L23) | |
| Lenovo Legion 5 16IRX G9 | |
| Moyenne Intel Core i7-14650HX (89907 - 101500, n=2) | |
| HP Victus 16-r0077ng | |
| Lenovo LOQ 16IRH8 | |
| AIDA64 / FPU SinJulia | |
| Schenker XMG CORE 16 (L23) | |
| Lenovo Legion Slim 5 16APH8 | |
| Moyenne de la classe Gaming (4424 - 33636, n=109, 2 dernières années) | |
| Alienware m16 R1 Intel | |
| Lenovo Legion Pro 5 16IRX8 | |
| Lenovo Legion 5 16IRX G9 | |
| Moyenne Intel Core i7-14650HX (9159 - 11913, n=2) | |
| HP Victus 16-r0076TX | |
| HP Victus 16-r0077ng | |
| Lenovo LOQ 16IRH8 | |
| AIDA64 / FPU Mandel | |
| Moyenne de la classe Gaming (25115 - 128721, n=109, 2 dernières années) | |
| Lenovo Legion Slim 5 16APH8 | |
| Schenker XMG CORE 16 (L23) | |
| Lenovo Legion Pro 5 16IRX8 | |
| Alienware m16 R1 Intel | |
| Lenovo Legion 5 16IRX G9 | |
| Moyenne Intel Core i7-14650HX (32747 - 47097, n=2) | |
| HP Victus 16-r0076TX | |
| HP Victus 16-r0077ng | |
| Lenovo LOQ 16IRH8 | |
| AIDA64 / CPU AES | |
| Alienware m16 R1 Intel | |
| Moyenne de la classe Gaming (39258 - 247074, n=109, 2 dernières années) | |
| Lenovo Legion Pro 5 16IRX8 | |
| Schenker XMG CORE 16 (L23) | |
| Lenovo Legion 5 16IRX G9 | |
| HP Victus 16-r0076TX | |
| Moyenne Intel Core i7-14650HX (63627 - 86485, n=2) | |
| Lenovo Legion Slim 5 16APH8 | |
| HP Victus 16-r0077ng | |
| Lenovo LOQ 16IRH8 | |
| AIDA64 / CPU ZLib | |
| Moyenne de la classe Gaming (574 - 2531, n=109, 2 dernières années) | |
| Alienware m16 R1 Intel | |
| Lenovo Legion Pro 5 16IRX8 | |
| Lenovo Legion 5 16IRX G9 | |
| Moyenne Intel Core i7-14650HX (924 - 1289, n=2) | |
| Lenovo Legion Slim 5 16APH8 | |
| HP Victus 16-r0076TX | |
| Schenker XMG CORE 16 (L23) | |
| HP Victus 16-r0077ng | |
| Lenovo LOQ 16IRH8 | |
| AIDA64 / FP64 Ray-Trace | |
| Moyenne de la classe Gaming (5509 - 45446, n=109, 2 dernières années) | |
| Lenovo Legion Slim 5 16APH8 | |
| Schenker XMG CORE 16 (L23) | |
| Lenovo Legion Pro 5 16IRX8 | |
| Alienware m16 R1 Intel | |
| Lenovo Legion 5 16IRX G9 | |
| Moyenne Intel Core i7-14650HX (7064 - 10316, n=2) | |
| HP Victus 16-r0076TX | |
| HP Victus 16-r0077ng | |
| Lenovo LOQ 16IRH8 | |
| AIDA64 / CPU PhotoWorxx | |
| Moyenne de la classe Gaming (12271 - 89891, n=109, 2 dernières années) | |
| Schenker XMG CORE 16 (L23) | |
| HP Victus 16-r0077ng | |
| HP Victus 16-r0076TX | |
| Lenovo Legion Pro 5 16IRX8 | |
| Alienware m16 R1 Intel | |
| Moyenne Intel Core i7-14650HX (33763 - 34470, n=2) | |
| Lenovo Legion 5 16IRX G9 | |
| Lenovo LOQ 16IRH8 | |
| Lenovo Legion Slim 5 16APH8 | |
Performance du système
Sans surprise, le nouveau Legion 5i 16 est un appareil très réactif et toutes les entrées sont mises en œuvre sans hésitation. Le système se bloque brièvement lors du démarrage des jeux, mais cela est dû à la commutation graphique Advanced Optimus. Vous pouvez éviter ce problème en activant la commutation Optimus normale, mais vous n'obtiendrez alors pas les meilleures performances. Pendant le test, nous n'avons jamais eu de problèmes avec notre appareil de test (plantages, etc.).
CrossMark: Overall | Productivity | Creativity | Responsiveness
WebXPRT 3: Overall
WebXPRT 4: Overall
Mozilla Kraken 1.1: Total
| PCMark 10 / Score | |
| Moyenne de la classe Gaming (5828 - 11574, n=95, 2 dernières années) | |
| Schenker XMG CORE 16 (L23) | |
| Lenovo Legion Slim 5 16APH8 | |
| Lenovo Legion Pro 5 16IRX8 | |
| Lenovo Legion 5 16IRX G9 | |
| Moyenne Intel Core i7-14650HX, NVIDIA GeForce RTX 4060 Laptop GPU (n=1) | |
| Alienware m16 R1 Intel | |
| HP Victus 16-r0077ng | |
| Lenovo LOQ 16IRH8 | |
| HP Victus 16-r0076TX | |
| PCMark 10 / Essentials | |
| Lenovo Legion Slim 5 16APH8 | |
| Schenker XMG CORE 16 (L23) | |
| Lenovo Legion Pro 5 16IRX8 | |
| Lenovo Legion 5 16IRX G9 | |
| Moyenne Intel Core i7-14650HX, NVIDIA GeForce RTX 4060 Laptop GPU (n=1) | |
| Alienware m16 R1 Intel | |
| HP Victus 16-r0077ng | |
| Moyenne de la classe Gaming (8810 - 12600, n=99, 2 dernières années) | |
| Lenovo LOQ 16IRH8 | |
| HP Victus 16-r0076TX | |
| PCMark 10 / Productivity | |
| Moyenne de la classe Gaming (6845 - 18766, n=97, 2 dernières années) | |
| Schenker XMG CORE 16 (L23) | |
| Lenovo Legion Slim 5 16APH8 | |
| Alienware m16 R1 Intel | |
| Lenovo Legion 5 16IRX G9 | |
| Moyenne Intel Core i7-14650HX, NVIDIA GeForce RTX 4060 Laptop GPU (n=1) | |
| Lenovo Legion Pro 5 16IRX8 | |
| HP Victus 16-r0077ng | |
| Lenovo LOQ 16IRH8 | |
| HP Victus 16-r0076TX | |
| PCMark 10 / Digital Content Creation | |
| Moyenne de la classe Gaming (7602 - 19657, n=97, 2 dernières années) | |
| Schenker XMG CORE 16 (L23) | |
| Lenovo Legion Pro 5 16IRX8 | |
| Lenovo Legion 5 16IRX G9 | |
| Moyenne Intel Core i7-14650HX, NVIDIA GeForce RTX 4060 Laptop GPU (n=1) | |
| Lenovo Legion Slim 5 16APH8 | |
| HP Victus 16-r0077ng | |
| Alienware m16 R1 Intel | |
| Lenovo LOQ 16IRH8 | |
| HP Victus 16-r0076TX | |
| CrossMark / Overall | |
| Lenovo Legion 5 16IRX G9 | |
| Moyenne Intel Core i7-14650HX, NVIDIA GeForce RTX 4060 Laptop GPU (n=1) | |
| Alienware m16 R1 Intel | |
| Moyenne de la classe Gaming (1366 - 2409, n=97, 2 dernières années) | |
| Lenovo LOQ 16IRH8 | |
| Lenovo Legion Slim 5 16APH8 | |
| HP Victus 16-r0076TX | |
| Schenker XMG CORE 16 (L23) | |
| Lenovo Legion Pro 5 16IRX8 | |
| CrossMark / Productivity | |
| Alienware m16 R1 Intel | |
| Lenovo Legion 5 16IRX G9 | |
| Moyenne Intel Core i7-14650HX, NVIDIA GeForce RTX 4060 Laptop GPU (n=1) | |
| Lenovo LOQ 16IRH8 | |
| Moyenne de la classe Gaming (1386 - 2254, n=97, 2 dernières années) | |
| Lenovo Legion Slim 5 16APH8 | |
| Schenker XMG CORE 16 (L23) | |
| Lenovo Legion Pro 5 16IRX8 | |
| HP Victus 16-r0076TX | |
| CrossMark / Creativity | |
| Lenovo Legion 5 16IRX G9 | |
| Moyenne Intel Core i7-14650HX, NVIDIA GeForce RTX 4060 Laptop GPU (n=1) | |
| Alienware m16 R1 Intel | |
| Moyenne de la classe Gaming (1343 - 2729, n=97, 2 dernières années) | |
| Lenovo LOQ 16IRH8 | |
| Lenovo Legion Slim 5 16APH8 | |
| HP Victus 16-r0076TX | |
| Schenker XMG CORE 16 (L23) | |
| Lenovo Legion Pro 5 16IRX8 | |
| CrossMark / Responsiveness | |
| Lenovo Legion 5 16IRX G9 | |
| Moyenne Intel Core i7-14650HX, NVIDIA GeForce RTX 4060 Laptop GPU (n=1) | |
| Alienware m16 R1 Intel | |
| Lenovo LOQ 16IRH8 | |
| Moyenne de la classe Gaming (1226 - 2334, n=97, 2 dernières années) | |
| Lenovo Legion Pro 5 16IRX8 | |
| Lenovo Legion Slim 5 16APH8 | |
| HP Victus 16-r0076TX | |
| Schenker XMG CORE 16 (L23) | |
| WebXPRT 3 / Overall | |
| Lenovo Legion Slim 5 16APH8 | |
| Lenovo LOQ 16IRH8 | |
| Lenovo LOQ 16IRH8 | |
| Moyenne de la classe Gaming (242 - 532, n=100, 2 dernières années) | |
| Lenovo Legion 5 16IRX G9 | |
| Moyenne Intel Core i7-14650HX, NVIDIA GeForce RTX 4060 Laptop GPU (n=1) | |
| Alienware m16 R1 Intel | |
| Schenker XMG CORE 16 (L23) | |
| HP Victus 16-r0077ng | |
| HP Victus 16-r0077ng | |
| HP Victus 16-r0076TX | |
| Lenovo Legion Pro 5 16IRX8 | |
| WebXPRT 4 / Overall | |
| Moyenne de la classe Gaming (176.4 - 354, n=100, 2 dernières années) | |
| Lenovo Legion 5 16IRX G9 | |
| Moyenne Intel Core i7-14650HX, NVIDIA GeForce RTX 4060 Laptop GPU (n=1) | |
| Alienware m16 R1 Intel | |
| Lenovo Legion Slim 5 16APH8 | |
| Lenovo Legion Pro 5 16IRX8 | |
| HP Victus 16-r0077ng | |
| HP Victus 16-r0077ng | |
| HP Victus 16-r0076TX | |
| Mozilla Kraken 1.1 / Total | |
| HP Victus 16-r0076TX | |
| HP Victus 16-r0077ng | |
| HP Victus 16-r0077ng | |
| Lenovo Legion Pro 5 16IRX8 | |
| Schenker XMG CORE 16 (L23) | |
| Lenovo LOQ 16IRH8 | |
| Lenovo LOQ 16IRH8 | |
| Alienware m16 R1 Intel | |
| Lenovo Legion Slim 5 16APH8 | |
| Lenovo Legion 5 16IRX G9 | |
| Moyenne Intel Core i7-14650HX, NVIDIA GeForce RTX 4060 Laptop GPU (n=1) | |
| Moyenne de la classe Gaming (391 - 590, n=105, 2 dernières années) | |
* ... Moindre est la valeur, meilleures sont les performances
| PCMark 10 Score | 7645 points | |
Aide | ||
| AIDA64 / Memory Copy | |
| Moyenne de la classe Gaming (21750 - 129946, n=109, 2 dernières années) | |
| Schenker XMG CORE 16 (L23) | |
| Lenovo Legion Slim 5 16APH8 | |
| HP Victus 16-r0077ng | |
| Lenovo Legion 5 16IRX G9 | |
| Moyenne Intel Core i7-14650HX (58978 - 59727, n=2) | |
| Lenovo Legion Pro 5 16IRX8 | |
| Alienware m16 R1 Intel | |
| HP Victus 16-r0076TX | |
| Lenovo LOQ 16IRH8 | |
| AIDA64 / Memory Read | |
| Moyenne de la classe Gaming (22956 - 118858, n=109, 2 dernières années) | |
| Lenovo Legion 5 16IRX G9 | |
| Moyenne Intel Core i7-14650HX (70720 - 71455, n=2) | |
| HP Victus 16-r0077ng | |
| Lenovo Legion Pro 5 16IRX8 | |
| Alienware m16 R1 Intel | |
| HP Victus 16-r0076TX | |
| Lenovo LOQ 16IRH8 | |
| Lenovo Legion Slim 5 16APH8 | |
| Schenker XMG CORE 16 (L23) | |
| AIDA64 / Memory Write | |
| Schenker XMG CORE 16 (L23) | |
| Lenovo Legion Slim 5 16APH8 | |
| Moyenne de la classe Gaming (22297 - 135096, n=109, 2 dernières années) | |
| Lenovo Legion Pro 5 16IRX8 | |
| HP Victus 16-r0077ng | |
| Alienware m16 R1 Intel | |
| HP Victus 16-r0076TX | |
| Moyenne Intel Core i7-14650HX (51138 - 56811, n=2) | |
| Lenovo LOQ 16IRH8 | |
| Lenovo Legion 5 16IRX G9 | |
| AIDA64 / Memory Latency | |
| Lenovo LOQ 16IRH8 | |
| Moyenne de la classe Gaming (75.3 - 259, n=109, 2 dernières années) | |
| HP Victus 16-r0076TX | |
| HP Victus 16-r0077ng | |
| Lenovo Legion Slim 5 16APH8 | |
| Moyenne Intel Core i7-14650HX (89.8 - 95.2, n=2) | |
| Lenovo Legion 5 16IRX G9 | |
| Alienware m16 R1 Intel | |
| Schenker XMG CORE 16 (L23) | |
| Lenovo Legion Pro 5 16IRX8 | |
* ... Moindre est la valeur, meilleures sont les performances
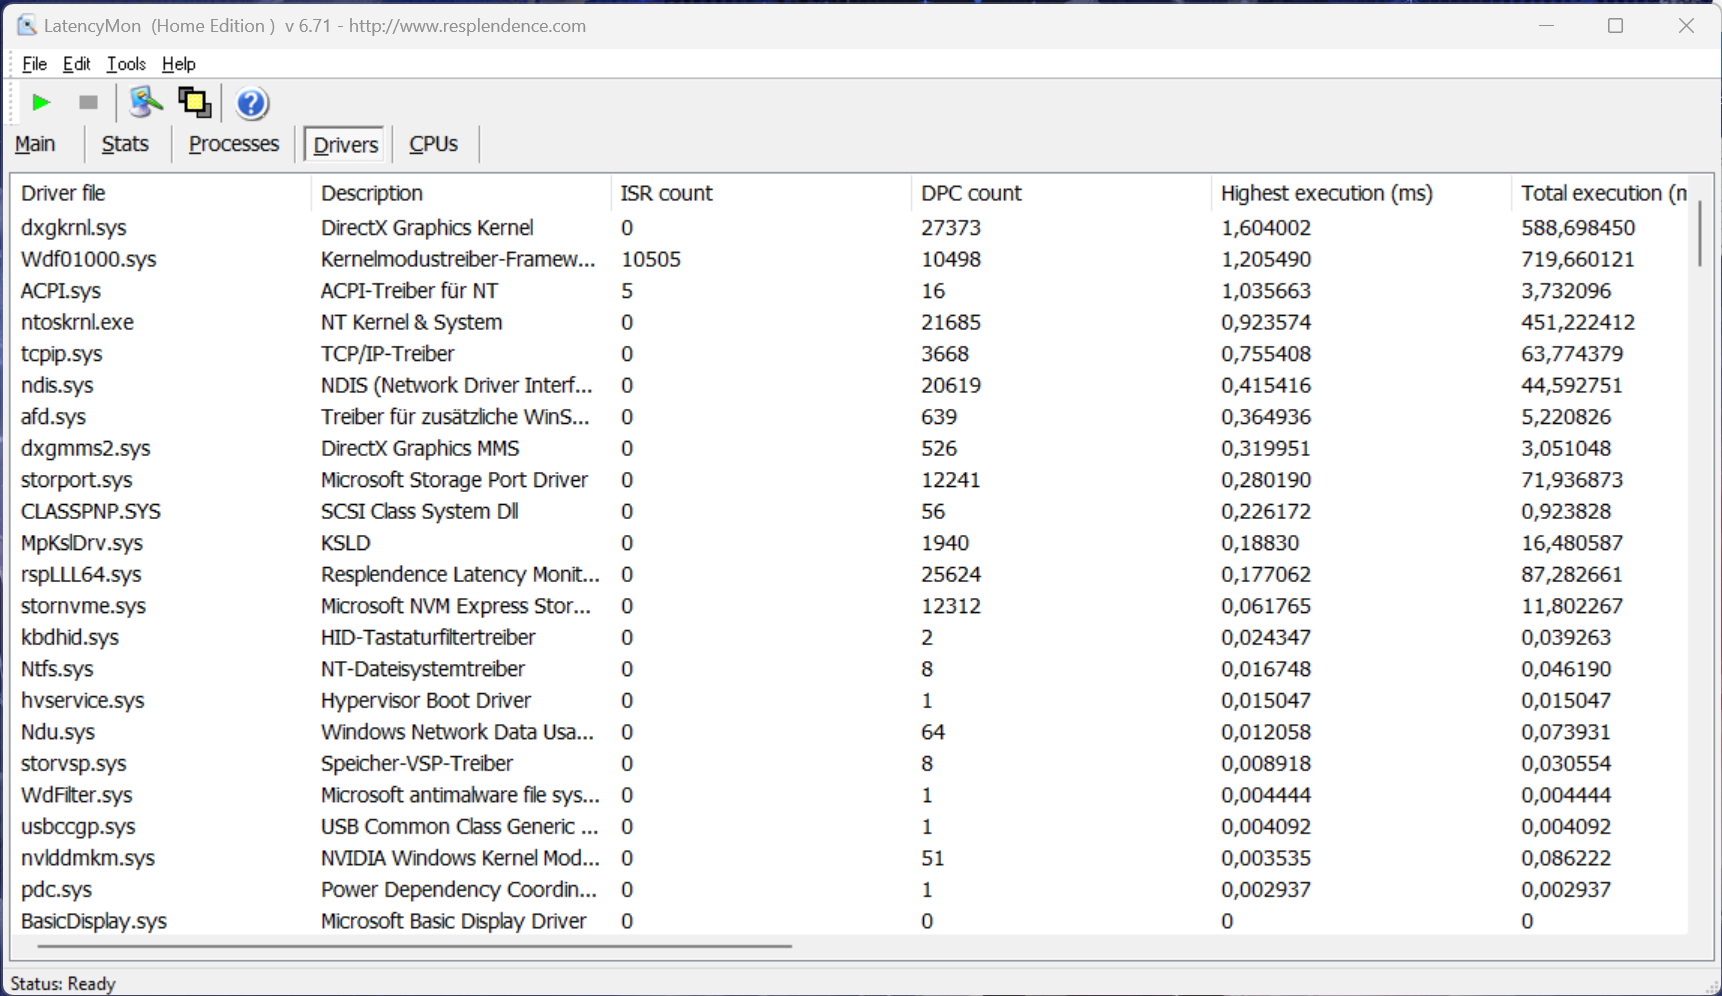
Latence DPC
Lors de notre test de latence standardisé (surf sur le web, lecture YouTube en 4K, charge du CPU), l'appareil de test avec la version actuelle du BIOS a montré quelques limites lors de l'utilisation d'applications audio en temps réel.
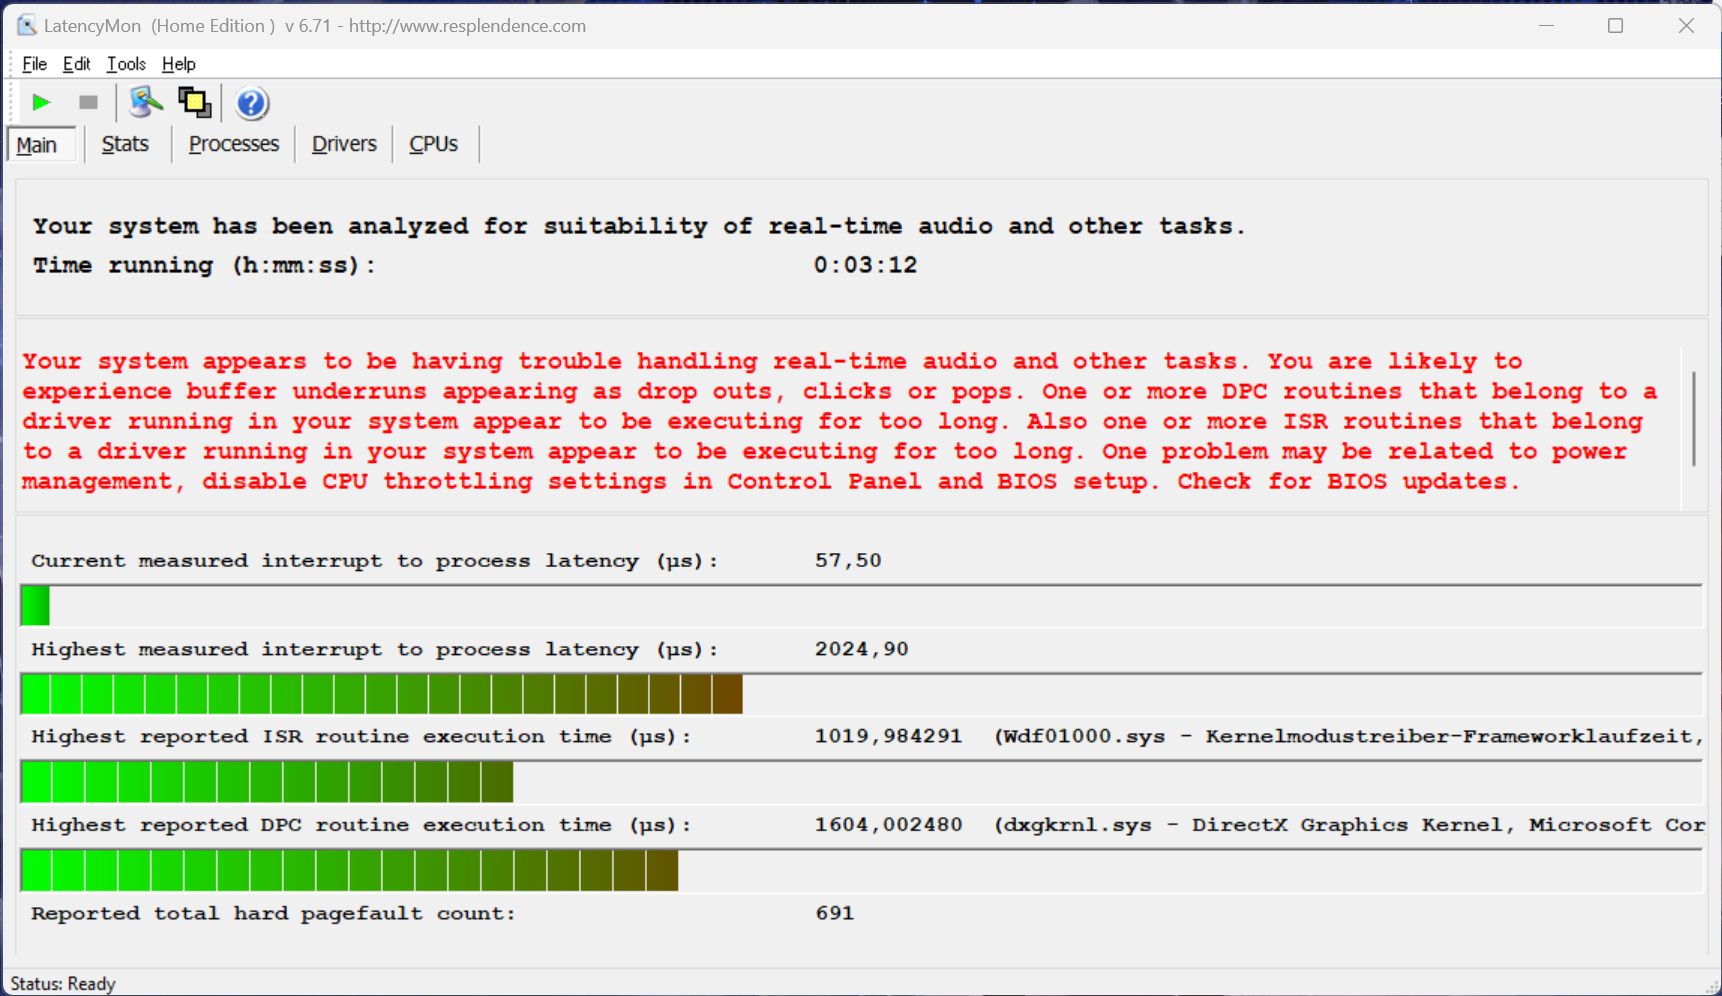
| DPC Latencies / LatencyMon - interrupt to process latency (max), Web, Youtube, Prime95 | |
| Alienware m16 R1 Intel | |
| Lenovo Legion 5 16IRX G9 | |
| HP Victus 16-r0076TX | |
| HP Victus 16-r0077ng | |
| Lenovo LOQ 16IRH8 | |
| Lenovo Legion Slim 5 16APH8 | |
| Lenovo Legion Pro 5 16IRX8 | |
| Schenker XMG CORE 16 (L23) | |
* ... Moindre est la valeur, meilleures sont les performances
Dispositifs de stockage
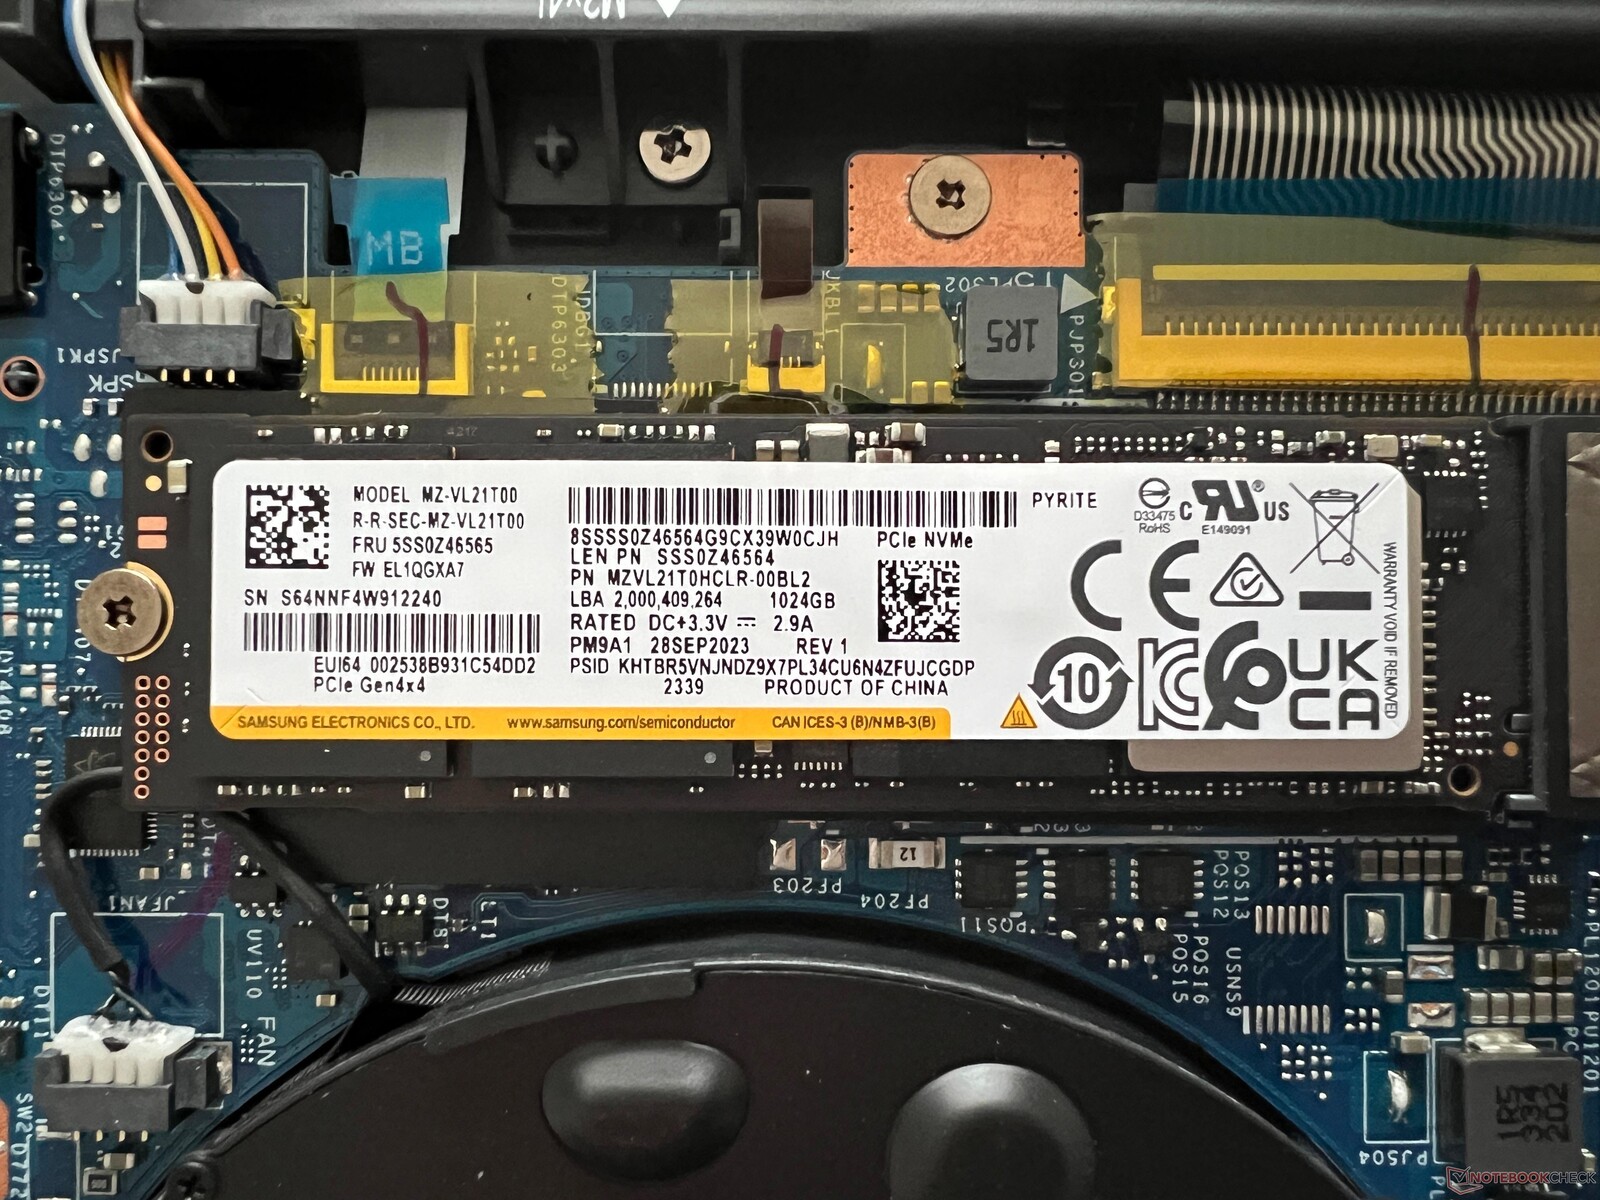
Comme nous l'avons déjà mentionné, le site Legion dispose de deux emplacements pour SSD et notre appareil de test est équipé de la version 1 To du Samsung PM9A1 (version OEM du 980 Pro), ce qui laisse 888 Go à la disposition des utilisateurs après le premier démarrage de l'ordinateur portable. Les performances du SSD PCIe-4.0 sont excellentes en général, mais sous charge permanente, elles ne restent pas stables. Dans une utilisation quotidienne, cela ne devrait pas poser de problème, mais un refroidisseur supplémentaire (ou un dissipateur de chaleur) aurait pu résoudre ce problème. Vous trouverez d'autres tests de performance de SSD ici.

* ... Moindre est la valeur, meilleures sont les performances
Reading continuous performance: DiskSpd Read Loop, Queue Depth 8
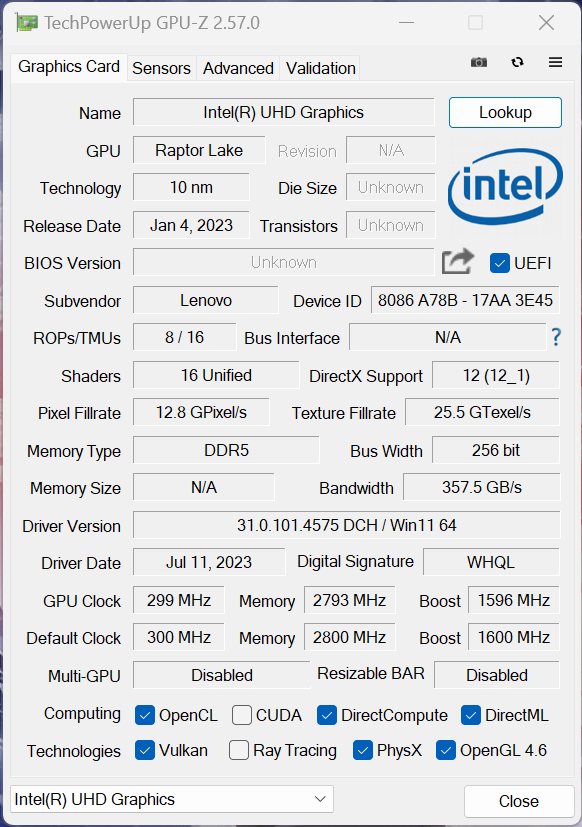
Carte graphique
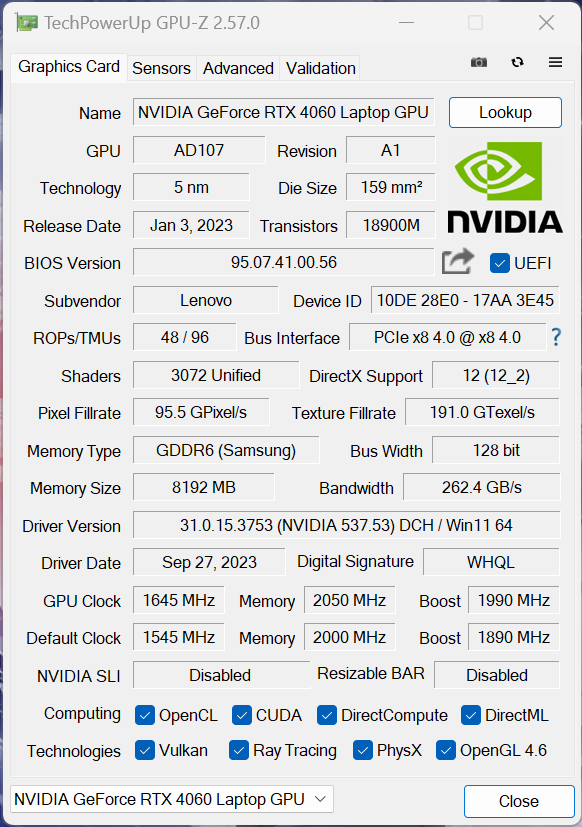
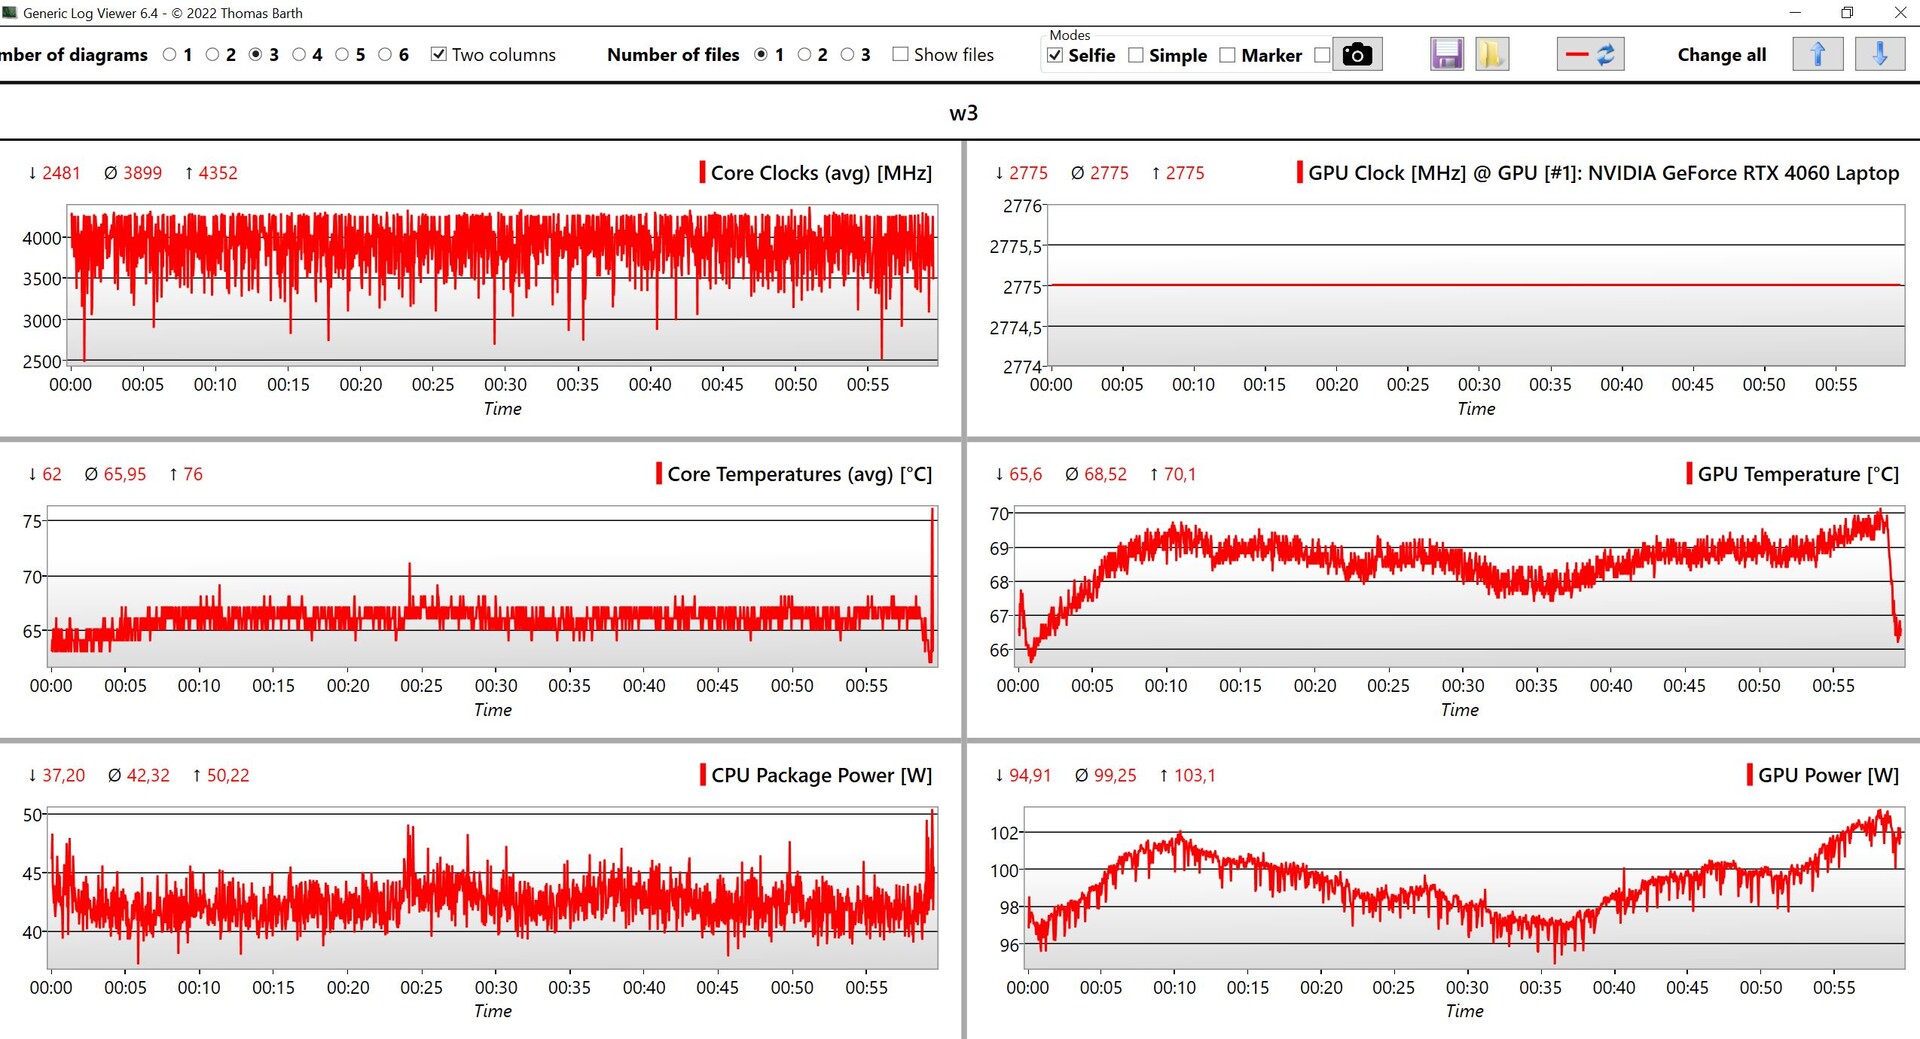
Dans le dispositif de test, Lenovo a installé la version actuelle de l'ordinateur portable RTX 4060 de Nvidia Ordinateur portable Nvidia GeForce RTX 4060 actuel avec un TGP de 115 watts - vous pouvez même overclocker le GPU via l'application Vantage. Lors de notre test, sa fréquence d'horloge maximale était de 2 430 MHz. L'Optimus avancé via un commutateur MUX est pris en charge et a fonctionné de manière fiable pendant notre test, mais vous pouvez également désactiver complètement l'iGPU du processeur.
Le portable RTX 4060 s'est très bien comporté dans les benchmarks, ne perdant que les deux modèles RTX-4070 NVIDIA NVIDIA GeForce RTX 4070 Laptop GPU - bien que la différence avec le HP Victus Test du HP Victus 16 : jouer en Full HD avec une RTX 4070 ne soit pas grande du tout. Les performances du GPU restent totalement stables en charge permanente, mais en utilisation sur batterie, le GPU n'est autorisé à consommer que 50 watts. Cela entraîne une perte de performance d'un peu plus de 30 %. Vous trouverez d'autres benchmarks GPU sur ici.
| 3DMark 11 Performance | 32891 points | |
| 3DMark Fire Strike Score | 25376 points | |
| 3DMark Time Spy Score | 11731 points | |
Aide | ||
| Blender / v3.3 Classroom OPTIX/RTX | |
| HP Victus 16-r0076TX | |
| Alienware m16 R1 Intel | |
| HP Victus 16-r0077ng | |
| Lenovo Legion 5 16IRX G9 | |
| Moyenne NVIDIA GeForce RTX 4060 Laptop GPU (19 - 28, n=53) | |
| Lenovo Legion Slim 5 16APH8 | |
| Lenovo LOQ 16IRH8 | |
| Lenovo Legion Pro 5 16IRX8 | |
| Schenker XMG CORE 16 (L23) | |
| Moyenne de la classe Gaming (9 - 32, n=111, 2 dernières années) | |
| Blender / v3.3 Classroom CUDA | |
| HP Victus 16-r0076TX | |
| Lenovo Legion Slim 5 16APH8 | |
| Moyenne NVIDIA GeForce RTX 4060 Laptop GPU (39 - 53, n=53) | |
| Lenovo LOQ 16IRH8 | |
| Lenovo Legion 5 16IRX G9 | |
| Lenovo Legion Pro 5 16IRX8 | |
| Alienware m16 R1 Intel | |
| HP Victus 16-r0077ng | |
| Moyenne de la classe Gaming (15 - 228, n=111, 2 dernières années) | |
| Schenker XMG CORE 16 (L23) | |
| Blender / v3.3 Classroom CPU | |
| Lenovo LOQ 16IRH8 | |
| HP Victus 16-r0077ng | |
| HP Victus 16-r0076TX | |
| Moyenne NVIDIA GeForce RTX 4060 Laptop GPU (189 - 452, n=53) | |
| Lenovo Legion Slim 5 16APH8 | |
| Schenker XMG CORE 16 (L23) | |
| Lenovo Legion Pro 5 16IRX8 | |
| Alienware m16 R1 Intel | |
| Moyenne de la classe Gaming (122 - 565, n=107, 2 dernières années) | |
| Lenovo Legion 5 16IRX G9 | |
* ... Moindre est la valeur, meilleures sont les performances
Performances des jeux
Au total, les performances de jeu de l'ordinateur portable sont excellentes et se situent dans le haut de la fourchette pour un ordinateur portable RTX 4060. Tous les jeux actuels peuvent être exécutés sans problème en QHD et avec un maximum de détails, même les jeux exigeants comme Cyberpunk 2077 ou Modern Warfare 3. Seul le raytracing peut entraîner quelques problèmes et il serait judicieux d'utiliser une technologie d'upscaling comme DLSS. En outre, ses performances de jeu restent tout à fait stables, même lors de sessions prolongées. Vous trouverez d'autres tests de performance pour les jeux ici.
| The Witcher 3 - 1920x1080 Ultra Graphics & Postprocessing (HBAO+) | |
| Moyenne de la classe Gaming (95 - 240, n=8, 2 dernières années) | |
| Schenker XMG CORE 16 (L23) | |
| HP Victus 16-r0077ng | |
| Lenovo Legion Pro 5 16IRX8 | |
| Alienware m16 R1 Intel | |
| Lenovo LOQ 16IRH8 | |
| Lenovo Legion 5 16IRX G9 | |
| HP Victus 16-r0076TX | |
| Lenovo Legion Slim 5 16APH8 | |
Witcher 3 FPS diagram
| Bas | Moyen | Élevé | Ultra | QHD | |
|---|---|---|---|---|---|
| GTA V (2015) | 186 | 182.8 | 120.2 | 89 | |
| The Witcher 3 (2015) | 229 | 97.2 | 83 | ||
| Dota 2 Reborn (2015) | 209 | 189.7 | 179.9 | 168.7 | |
| Final Fantasy XV Benchmark (2018) | 154.2 | 106.3 | 77.5 | ||
| X-Plane 11.11 (2018) | 180.8 | 171 | 130.9 | ||
| Far Cry 5 (2018) | 161 | 155 | 147 | 111 | |
| Strange Brigade (2018) | 243 | 210 | 130 | ||
| F1 2021 (2021) | 464 | 380 | 292 | 146.7 | 104.6 |
| F1 22 (2022) | 296 | 287 | 217 | 71.4 | 45.2 |
| F1 23 (2023) | 306 | 292 | 207 | 63.7 | 39.4 |
| Cyberpunk 2077 (2023) | 133.1 | 110.4 | 95.3 | 81.8 | 49.7 |
| Assassin's Creed Mirage (2023) | 93 | 72 | |||
| Call of Duty Modern Warfare 3 2023 (2023) | 134 | 121 | 92 | 86 | 58 |
Émissions - Fortes mais froides
Émissions sonores
Les deux ventilateurs du Legion 5i 16 ont beaucoup de travail à faire et si vous n'utilisez pas le mode silencieux, ils tourneront souvent pendant des tâches simples. A forte charge, l'appareil devient très bruyant avec 55 dB(A) mais pour être honnête, les presque 50 dB(A) que nous avons mesurés en utilisant le mode équilibré sont tout simplement trop forts pour jouer correctement à des jeux sans un casque. Ainsi, selon le jeu, il peut être judicieux de vérifier les performances en mode silencieux, car ses 35 dB(A) sont beaucoup plus confortables. Nous n'avons pas noté d'autres bruits électroniques provenant de notre appareil de test.
| Profil énergétique | 3DMark 06 | Witcher 3 | Cyberpunk 2077 Phantom Liberty | Stress test |
|---|---|---|---|---|
| Mode silencieux | 34,6 dB(A) | 34,6 dB(A) | 30,4 dB(A) | 34,6 dB(A) |
| Mode équilibré | 34,6 dB(A) | 49,8 dB(A) | 49,8 dB(A) | 49,8 dB(A) |
| Mode performance | 45,5 dB(A) | 55,7 dB(A) | 53,1 dB(A) | 55,7 dB(A) |
Degré de la nuisance sonore
| Au repos |
| 24 / 28.8 / 32 dB(A) |
| Fortement sollicité |
| 45.5 / 55.7 dB(A) |
 | ||
30 dB silencieux 40 dB(A) audible 50 dB(A) bruyant |
||
min: | ||
| Lenovo Legion 5 16IRX G9 GeForce RTX 4060 Laptop GPU, i7-14650HX, Samsung PM9A1 MZVL21T0HCLR | Schenker XMG CORE 16 (L23) GeForce RTX 4070 Laptop GPU, R7 7840HS, Samsung 990 Pro 1 TB | HP Victus 16-r0077ng GeForce RTX 4070 Laptop GPU, i7-13700H, Kioxia XG8 KXG80ZNV1T02 | Lenovo LOQ 16IRH8 GeForce RTX 4060 Laptop GPU, i7-13620H, Solidigm SSDPFINW512GZL | Lenovo Legion Slim 5 16APH8 GeForce RTX 4060 Laptop GPU, R7 7840HS, SK hynix PC801 HFS512GEJ9X115N | HP Victus 16-r0076TX GeForce RTX 4050 Laptop GPU, i5-13500HX, SK hynix PC801 HFS512GEJ9X101N BF | Alienware m16 R1 Intel GeForce RTX 4060 Laptop GPU, i7-13700HX, Kioxia KXG70ZNV512G | Lenovo Legion Pro 5 16IRX8 GeForce RTX 4060 Laptop GPU, i7-13700HX, SK hynix PC801 HFS512GEJ9X115N | |
|---|---|---|---|---|---|---|---|---|
| Noise | 8% | 2% | 4% | 10% | 9% | 2% | 12% | |
| arrêt / environnement * (dB) | 24 | 23 4% | 25 -4% | 23 4% | 22.9 5% | 21.57 10% | 25 -4% | 23 4% |
| Idle Minimum * (dB) | 24 | 23 4% | 28 -17% | 23 4% | 23.1 4% | 23.68 1% | 25 -4% | 23.1 4% |
| Idle Average * (dB) | 28.8 | 28.48 1% | 29 -1% | 23 20% | 23.1 20% | 23.68 18% | 26 10% | 23.1 20% |
| Idle Maximum * (dB) | 32 | 28.48 11% | 30 6% | 27.66 14% | 27.7 13% | 23.68 26% | 27 16% | 26.6 17% |
| Load Average * (dB) | 45.5 | 30 34% | 43 5% | 53.62 -18% | 33.3 27% | 39.44 13% | 52 -14% | 34.7 24% |
| Witcher 3 ultra * (dB) | 53.1 | 54.12 -2% | 46 13% | 53.5 -1% | 54 -2% | 55.4 -4% | 51 4% | 47.6 10% |
| Load Maximum * (dB) | 55.7 | 54.12 3% | 48 14% | 53.5 4% | 54 3% | 55.37 1% | 53 5% | 54.8 2% |
* ... Moindre est la valeur, meilleures sont les performances
Température
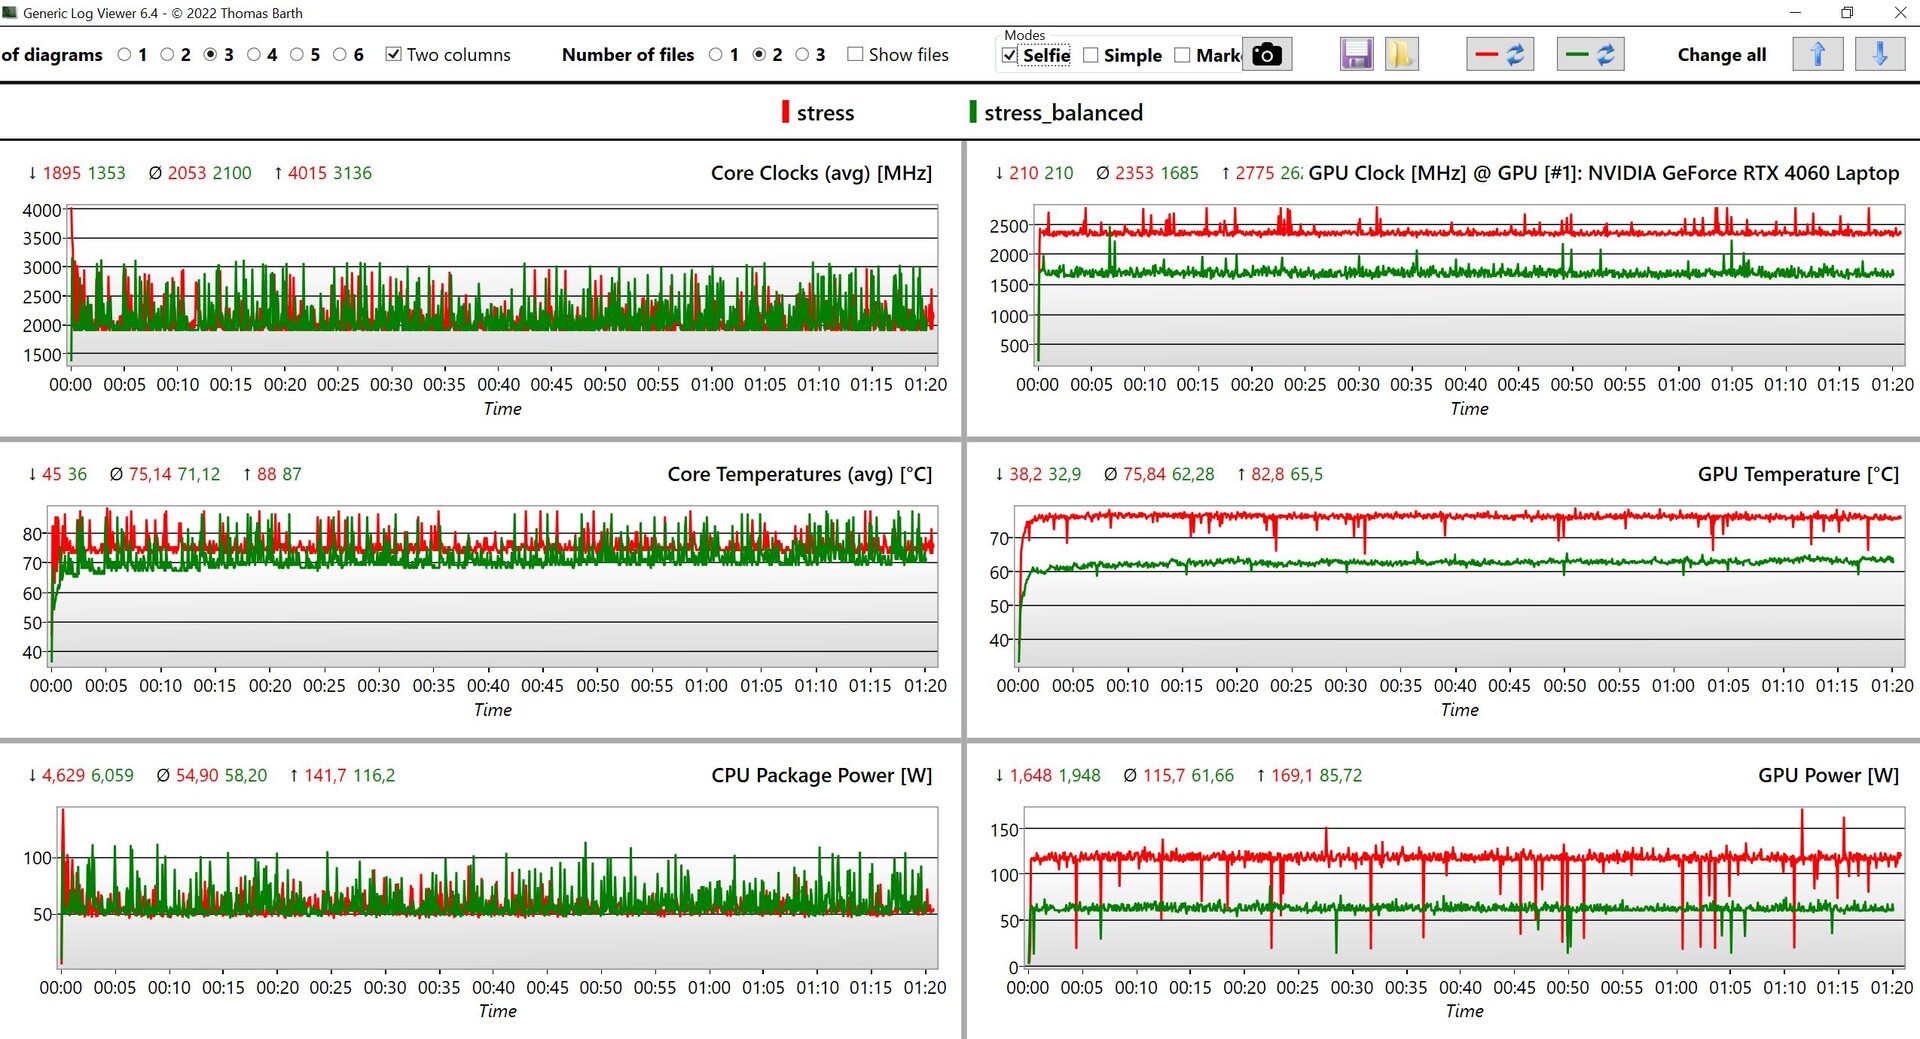
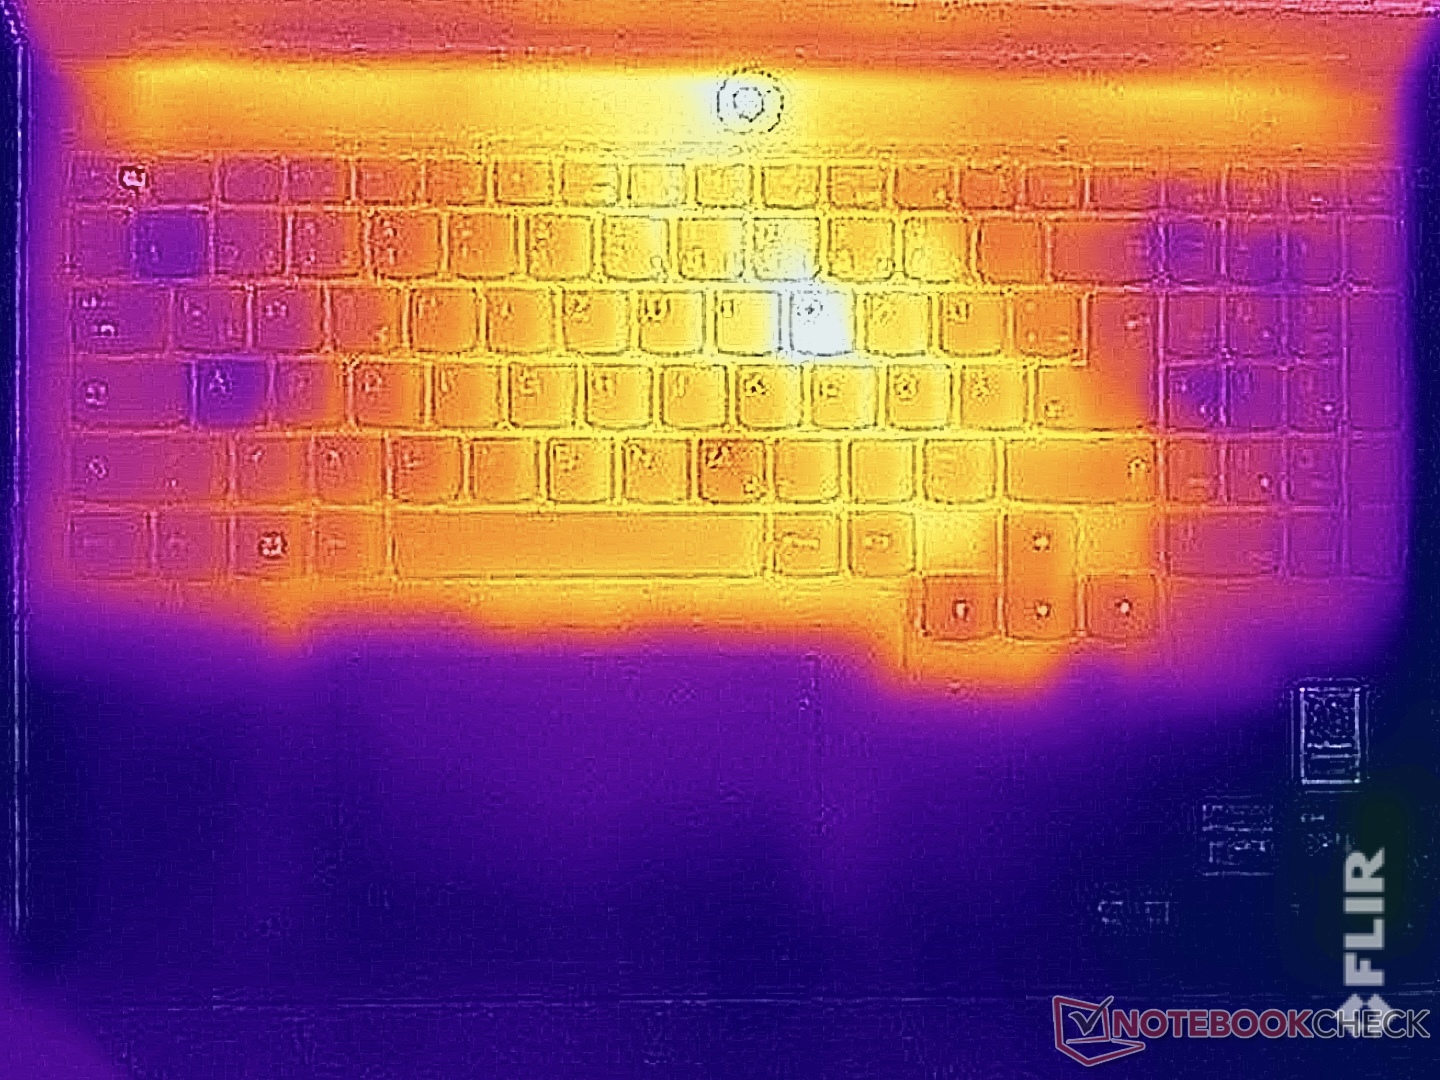
Quelques points du site Legion chauffent déjà sensiblement en mode veille, mais les faibles températures de surface en charge nous ont surpris. Même pendant le test de stress, nous n'avons mesuré qu'un peu plus de 40 °C sur la partie supérieure et un peu plus de 43 °C sur la partie inférieure de l'unité de base. Ce sont des résultats superbes et il n'y a pas de restrictions lorsqu'il s'agit de manipuler l'appareil.
En plus du mode performance, nous avons également effectué le test de stress en mode équilibré et avons rassemblé les résultats dans le diagramme suivant. Dans les deux profils, vous pouvez voir à quel point la consommation du processeur fluctue, mais le GPU reste constant et c'est là que l'on peut voir une nette différence entre les deux profils. En mode performance, le GPU fonctionne à 115 watts et en mode équilibré, nous avons mesuré un peu plus de 60 watts.
(±) La température maximale du côté supérieur est de 40.4 °C / 105 F, par rapport à la moyenne de 40.4 °C / 105 F, allant de 21.2 à 68.8 °C pour la classe Gaming.
(±) Le fond chauffe jusqu'à un maximum de 43.8 °C / 111 F, contre une moyenne de 43.2 °C / 110 F
(+) En utilisation inactive, la température moyenne du côté supérieur est de 28 °C / 82 F, par rapport à la moyenne du dispositif de 33.9 °C / 93 F.
(±) En jouant à The Witcher 3, la température moyenne du côté supérieur est de 33.2 °C / 92 F, alors que la moyenne de l'appareil est de 33.9 °C / 93 F.
(+) Les repose-poignets et le pavé tactile sont plus froids que la température de la peau avec un maximum de 26.9 °C / 80.4 F et sont donc froids au toucher.
(±) La température moyenne de la zone de l'appui-paume de dispositifs similaires était de 28.8 °C / 83.8 F (+1.9 °C / #3.4 F).

| Lenovo Legion 5 16IRX G9 Intel Core i7-14650HX, NVIDIA GeForce RTX 4060 Laptop GPU | Schenker XMG CORE 16 (L23) AMD Ryzen 7 7840HS, NVIDIA GeForce RTX 4070 Laptop GPU | HP Victus 16-r0077ng Intel Core i7-13700H, NVIDIA GeForce RTX 4070 Laptop GPU | Lenovo LOQ 16IRH8 Intel Core i7-13620H, NVIDIA GeForce RTX 4060 Laptop GPU | Lenovo Legion Slim 5 16APH8 AMD Ryzen 7 7840HS, NVIDIA GeForce RTX 4060 Laptop GPU | HP Victus 16-r0076TX Intel Core i5-13500HX, NVIDIA GeForce RTX 4050 Laptop GPU | Alienware m16 R1 Intel Intel Core i7-13700HX, NVIDIA GeForce RTX 4060 Laptop GPU | Lenovo Legion Pro 5 16IRX8 Intel Core i7-13700HX, NVIDIA GeForce RTX 4060 Laptop GPU | |
|---|---|---|---|---|---|---|---|---|
| Heat | -3% | -13% | -6% | 9% | -3% | -18% | -4% | |
| Maximum Upper Side * (°C) | 40.4 | 46 -14% | 51 -26% | 48 -19% | 40.6 -0% | 48 -19% | 49 -21% | 42.8 -6% |
| Maximum Bottom * (°C) | 43.8 | 44 -0% | 54 -23% | 59 -35% | 42 4% | 48 -10% | 48 -10% | 50 -14% |
| Idle Upper Side * (°C) | 30.3 | 32 -6% | 37 -22% | 28 8% | 27.8 8% | 29.6 2% | 40 -32% | 29.6 2% |
| Idle Bottom * (°C) | 35.3 | 33 7% | 29 18% | 28 21% | 26.6 25% | 30.2 14% | 39 -10% | 34 4% |
* ... Moindre est la valeur, meilleures sont les performances
Intervenants
Les deux haut-parleurs stéréo (2 watts chacun) ne délivrent qu'un son moyen, suffisant pour quelques vidéos et de la musique de fond. Cependant, vous ne profiterez pas des haut-parleurs lorsque vous jouerez, car les ventilateurs sont trop bruyants.
Lenovo Legion 5 16IRX G9 analyse audio
(+) | les haut-parleurs peuvent jouer relativement fort (84.4# dB)
Basses 100 - 315 Hz
(-) | presque aucune basse - en moyenne 25.7% plus bas que la médiane
(±) | la linéarité des basses est moyenne (8.3% delta à la fréquence précédente)
Médiums 400 - 2000 Hz
(+) | médiane équilibrée - seulement 4.3% de la médiane
(+) | les médiums sont linéaires (5.2% delta à la fréquence précédente)
Aiguës 2 - 16 kHz
(+) | des sommets équilibrés - à seulement 1.9% de la médiane
(+) | les aigus sont linéaires (2.1% delta à la fréquence précédente)
Globalement 100 - 16 000 Hz
(±) | la linéarité du son global est moyenne (16.1% de différence avec la médiane)
Par rapport à la même classe
» 39% de tous les appareils testés de cette catégorie étaient meilleurs, 6% similaires, 54% pires
» Le meilleur avait un delta de 6%, la moyenne était de 18%, le pire était de 132%.
Par rapport à tous les appareils testés
» 26% de tous les appareils testés étaient meilleurs, 5% similaires, 69% pires
» Le meilleur avait un delta de 4%, la moyenne était de 24%, le pire était de 134%.
Schenker XMG CORE 16 (L23) analyse audio
(±) | le niveau sonore du haut-parleur est moyen mais bon (79.4# dB)
Basses 100 - 315 Hz
(-) | presque aucune basse - en moyenne 21.6% plus bas que la médiane
(±) | la linéarité des basses est moyenne (11.4% delta à la fréquence précédente)
Médiums 400 - 2000 Hz
(±) | médiane supérieure - en moyenne 5.4% supérieure à la médiane
(+) | les médiums sont linéaires (6.7% delta à la fréquence précédente)
Aiguës 2 - 16 kHz
(+) | des sommets équilibrés - à seulement 2.3% de la médiane
(+) | les aigus sont linéaires (6.6% delta à la fréquence précédente)
Globalement 100 - 16 000 Hz
(±) | la linéarité du son global est moyenne (17.1% de différence avec la médiane)
Par rapport à la même classe
» 46% de tous les appareils testés de cette catégorie étaient meilleurs, 12% similaires, 43% pires
» Le meilleur avait un delta de 6%, la moyenne était de 18%, le pire était de 132%.
Par rapport à tous les appareils testés
» 31% de tous les appareils testés étaient meilleurs, 8% similaires, 61% pires
» Le meilleur avait un delta de 4%, la moyenne était de 24%, le pire était de 134%.
Alienware m16 R1 Intel analyse audio
(+) | les haut-parleurs peuvent jouer relativement fort (87# dB)
Basses 100 - 315 Hz
(-) | presque aucune basse - en moyenne 24% plus bas que la médiane
(±) | la linéarité des basses est moyenne (13.5% delta à la fréquence précédente)
Médiums 400 - 2000 Hz
(+) | médiane équilibrée - seulement 1.4% de la médiane
(+) | les médiums sont linéaires (3.3% delta à la fréquence précédente)
Aiguës 2 - 16 kHz
(+) | des sommets équilibrés - à seulement 3.5% de la médiane
(+) | les aigus sont linéaires (4.6% delta à la fréquence précédente)
Globalement 100 - 16 000 Hz
(+) | le son global est linéaire (13.4% différence à la médiane)
Par rapport à la même classe
» 19% de tous les appareils testés de cette catégorie étaient meilleurs, 7% similaires, 74% pires
» Le meilleur avait un delta de 6%, la moyenne était de 18%, le pire était de 132%.
Par rapport à tous les appareils testés
» 14% de tous les appareils testés étaient meilleurs, 4% similaires, 83% pires
» Le meilleur avait un delta de 4%, la moyenne était de 24%, le pire était de 134%.
Gestion de l'énergie
Consommation électrique
La consommation de l'appareil est sans surprise, avec un maximum d'environ 20 watts en mode veille, ce qui est acceptable compte tenu de la taille de l'écran et de sa luminosité. Lors du test de stress, la consommation maximale a été brièvement de ~247 watts, mais elle s'est immédiatement stabilisée à 230 watts. Par conséquent, l'alimentation de 230 watts sera à sa limite si vous utilisez le mode performance. En mode équilibré, la consommation de l'ordinateur portable s'est stabilisée à environ 180 watts.
| Éteint/en veille | |
| Au repos | |
| Fortement sollicité |
|
Légende:
min: | |
| Lenovo Legion 5 16IRX G9 i7-14650HX, GeForce RTX 4060 Laptop GPU, Samsung PM9A1 MZVL21T0HCLR, IPS, 2560x1600, 16" | Schenker XMG CORE 16 (L23) R7 7840HS, GeForce RTX 4070 Laptop GPU, Samsung 990 Pro 1 TB, IPS, 2560x1600, 16" | HP Victus 16-r0077ng i7-13700H, GeForce RTX 4070 Laptop GPU, Kioxia XG8 KXG80ZNV1T02, IPS, 1920x1080, 16.1" | Lenovo LOQ 16IRH8 i7-13620H, GeForce RTX 4060 Laptop GPU, Solidigm SSDPFINW512GZL, IPS, 2560x1600, 16" | Lenovo Legion Slim 5 16APH8 R7 7840HS, GeForce RTX 4060 Laptop GPU, SK hynix PC801 HFS512GEJ9X115N, IPS, 2560x1600, 16" | HP Victus 16-r0076TX i5-13500HX, GeForce RTX 4050 Laptop GPU, SK hynix PC801 HFS512GEJ9X101N BF, IPS, 1920x1080, 16.1" | Alienware m16 R1 Intel i7-13700HX, GeForce RTX 4060 Laptop GPU, Kioxia KXG70ZNV512G, IPS, 2560x1600, 16" | Lenovo Legion Pro 5 16IRX8 i7-13700HX, GeForce RTX 4060 Laptop GPU, SK hynix PC801 HFS512GEJ9X115N, IPS, 2560x1600, 16" | Moyenne NVIDIA GeForce RTX 4060 Laptop GPU | Moyenne de la classe Gaming | |
|---|---|---|---|---|---|---|---|---|---|---|
| Power Consumption | 18% | 21% | 4% | 21% | 2% | 3% | -27% | 14% | -1% | |
| Idle Minimum * (Watt) | 15.4 | 11 29% | 8 48% | 17.2 -12% | 9.4 39% | 16.12 -5% | 10 35% | 24.5 -59% | 11.5 ? 25% | 13.2 ? 14% |
| Idle Average * (Watt) | 19.7 | 15.2 23% | 13 34% | 19.3 2% | 15.5 21% | 20.47 -4% | 14 29% | 29.2 -48% | 16 ? 19% | 18.9 ? 4% |
| Idle Maximum * (Watt) | 20.7 | 16 23% | 22 -6% | 21.2 -2% | 24.4 -18% | 22.11 -7% | 21 -1% | 34.3 -66% | 20.3 ? 2% | 24.3 ? -17% |
| Load Average * (Watt) | 102.6 | 64 38% | 86 16% | 90 12% | 74.1 28% | 94.8 8% | 119 -16% | 98.7 4% | 92.9 ? 9% | 108 ? -5% |
| Witcher 3 ultra * (Watt) | 191.3 | 179 6% | 141.8 26% | 168 12% | 112.9 41% | 166.9 13% | 186.7 2% | 178.6 7% | ||
| Load Maximum * (Watt) | 246.6 | 280 -14% | 233 6% | 211 14% | 206.5 16% | 237 4% | 323 -31% | 249.6 -1% | 210 ? 15% | 254 ? -3% |
* ... Moindre est la valeur, meilleures sont les performances
Power consumption Witcher 3 / stress test
Power consumption with external monitor
Délais d'exécution
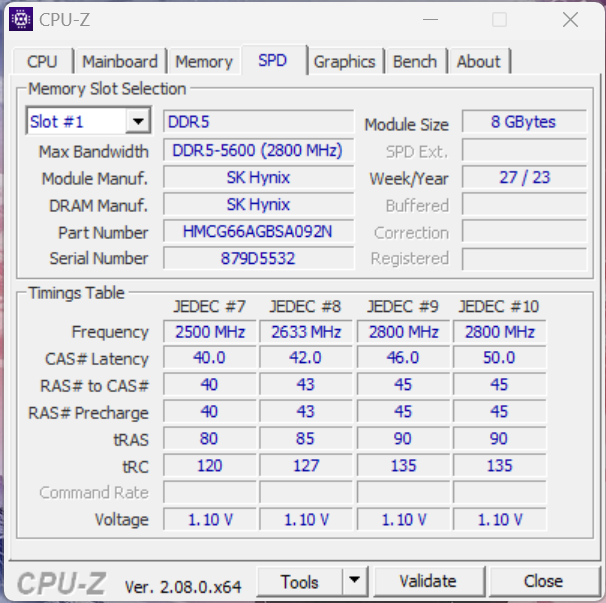
Le Legion 5i 16 a une batterie de 80 Wh, ce qui est la plus petite capacité dans notre domaine de comparaison. A 150 cd/m² (61 % de la luminosité maximale de notre appareil de test), une vidéo a duré environ 9,5 heures et notre test WLAN a duré environ 7,5 heures (~5,5 heures à la luminosité maximale). Sous charge, l'ordinateur portable s'épuise déjà après 46 minutes et une vidéo HDR n'a été lue que pendant 2:14 heures à la luminosité maximale. Avec 240 Hz, nos tests WLAN ont duré 5:27 heures (150 cd/m²) et 4:33 heures (luminosité maximale).
Une charge complète prend 106 minutes lorsque l'appareil est allumé, tandis que 80 % sont atteints après environ 60 minutes. Dans l'application Vantage, vous disposez également d'une option appelée "charge express" qui permet de charger plus rapidement les premiers 60 %. Une charge complète ne prend que 69 minutes avec ce mode (80 % après 31 minutes).
| Lenovo Legion 5 16IRX G9 i7-14650HX, GeForce RTX 4060 Laptop GPU, 80 Wh | Schenker XMG CORE 16 (L23) R7 7840HS, GeForce RTX 4070 Laptop GPU, 99 Wh | HP Victus 16-r0077ng i7-13700H, GeForce RTX 4070 Laptop GPU, 83 Wh | Lenovo LOQ 16IRH8 i7-13620H, GeForce RTX 4060 Laptop GPU, 80 Wh | Lenovo Legion Slim 5 16APH8 R7 7840HS, GeForce RTX 4060 Laptop GPU, 80 Wh | HP Victus 16-r0076TX i5-13500HX, GeForce RTX 4050 Laptop GPU, 83 Wh | Alienware m16 R1 Intel i7-13700HX, GeForce RTX 4060 Laptop GPU, 86 Wh | Lenovo Legion Pro 5 16IRX8 i7-13700HX, GeForce RTX 4060 Laptop GPU, 80 Wh | Moyenne de la classe Gaming | |
|---|---|---|---|---|---|---|---|---|---|
| Autonomie de la batterie | 73% | -4% | 13% | 23% | 17% | -17% | -34% | 22% | |
| H.264 (h) | 9.6 | 10.2 6% | 6.4 -33% | 7.7 -20% | 5.6 -42% | 8.26 ? -14% | |||
| WiFi v1.3 (h) | 7.4 | 8.4 14% | 7.1 -4% | 6.3 -15% | 7.1 -4% | 8.9 20% | 4.8 -35% | 3.4 -54% | 7.02 ? -5% |
| Load (h) | 0.8 | 2.4 200% | 1.5 88% | 1.2 50% | 1.2 50% | 1 25% | 0.7 -13% | 1.47 ? 84% | |
| Witcher 3 ultra (h) | 1.5 |
Points positifs
Points négatifs
Verdict - Le Legion 5i 16 est un modèle de performance

Dans l'ensemble, le nouveau Lenovo Legion 5i 16 a fait une très bonne impression lors de notre test. Lenovo s'est concentré sur les caractéristiques les plus importantes, offrant des composants rapides en combinaison avec un excellent écran IPS 240-Hz qui représente déjà les couleurs avec précision dès la sortie de la boîte et se passe de PWM. Les performances de jeu sont excellentes et vous pouvez faire tourner les jeux actuels aux résolutions et paramètres les plus élevés - vous ne pourrez pas contourner l'upscaling DLSS lorsqu'il s'agit de ray tracing. Le nouveau processeur Raptor-Lake-HX n'est pas un miracle d'efficacité, mais ses performances sont bonnes.
En même temps, l'unité de refroidissement de l'ordinateur portable garantit que ses performances peuvent être exploitées à tout moment. En outre, nous avons apprécié la répartition des différents profils énergétiques, et Lenovo offre aux utilisateurs de nombreuses options de personnalisation en ce qui concerne les paramètres du CPU et du GPU. Pendant les jeux, l'appareil reste étonnamment froid, mais les deux ventilateurs sont assez bruyants, ce qui signifie qu'un casque est un peu indispensable pour les sessions de jeu.
D'excellentes performances et un écran impressionnant de 240 Hz : Le Lenovo Legion 5i 16 est un gamer rapide de milieu de gamme qui met les performances au premier plan. Cependant, ses fonctions d'intelligence artificielle ne sont pour l'instant qu'un gadget.
Le nouveau Lenovo AI Engine+, censé améliorer les performances de jeu à l'aide d'une puce d'intelligence artificielle, n'a pas fonctionné lors de notre test. Il est possible qu'il soit amélioré par une mise à jour, mais pour l'instant, vous devriez activer le mode de performance manuel. Il y a quelques points qui montrent clairement que Lenovo a économisé de l'argent, car l'ordinateur portable ne dispose pas de Thunderbolt ou d'un port Ethernet 2.5-GBit/s.
À 1 610 dollars, le nouveau Legion 5i 16 n'est pas une bonne affaire et pour ce prix, vous pouvez déjà obtenir des modèles équipés de la RTX 4070 Laptop (en particulier les ordinateurs portables à partir de 2023), mais même dans ce cas, vous ne pouvez pas éviter de faire certains compromis en matière d'affichage.
Prix et disponibilité
Le nouveau Lenovo Legion 5i 16IRX G9 peut être acheté directement sur le site Web de Lenovo au prix de 1 609,99 $US.
Lenovo Legion 5 16IRX G9
- 01/29/2024 v7 (old)
Andreas Osthoff
Transparency
La sélection des appareils à examiner est effectuée par notre équipe éditoriale. L'échantillon de test a été prêté à l'auteur par le fabricant ou le détaillant pour les besoins de cet examen. Le prêteur n'a pas eu d'influence sur cette évaluation et le fabricant n'a pas reçu de copie de cette évaluation avant sa publication. Il n'y avait aucune obligation de publier cet article. En tant que média indépendant, Notebookcheck n'est pas soumis à l'autorité des fabricants, des détaillants ou des éditeurs.
Voici comment Notebookcheck teste
Chaque année, Notebookcheck examine de manière indépendante des centaines d'ordinateurs portables et de smartphones en utilisant des procédures standardisées afin de garantir que tous les résultats sont comparables. Nous avons continuellement développé nos méthodes de test depuis environ 20 ans et avons établi des normes industrielles dans le processus. Dans nos laboratoires de test, des équipements de mesure de haute qualité sont utilisés par des techniciens et des rédacteurs expérimentés. Ces tests impliquent un processus de validation en plusieurs étapes. Notre système d'évaluation complexe repose sur des centaines de mesures et de points de référence bien fondés, ce qui garantit l'objectivité.Price comparison

