Critiques du Intel Core i7-14700HX processeur
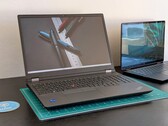
Test du Tulpar T6 V3.5 : PC portable de jeu abordable avec RTX 5060
Le Tulpar T6 V3.5 a pour objectif de s'attaquer à des acteurs majeurs tels qu'Acer, Gigabyte et HP. Découvrez si cet ordinateur portable de jeu de 16 pouces réussit à s'imposer dans notre test.
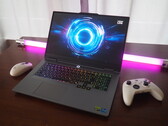
Intel Core i7-14700HX, NVIDIA GeForce RTX 5060 Laptop, 16", 2.4 kgTest du Lenovo LOQ 17 RTX 5070 : plus vite, plus haut, plus loin grâce à l'OC
Après avoir passé en revue la série LOQ de Lenovo dans plusieurs versions de 15 et 16 pouces, il est temps de passer à un modèle encore plus grand, le LOQ 17. Comment cet ordinateur portable de jeu se positionne-t-il sur le marché concurrentiel du milieu de gamme ?
Intel Core i7-14700HX, NVIDIA GeForce RTX 5070 Laptop, 17.3", 2.9 kgTest du Lenovo ThinkPad P16 Gen 2 : station de travail lourde aux graphiques boostés
L'option graphique TGP 130 W en fait l'une des stations de travail 16 pouces les plus rapides de la gamme Lenovo. Cependant, la température et le bruit du ventilateur sont respectivement plus chauds et plus bruyants que la moyenne, en raison de l'exigence du GPU.
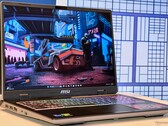
Intel Core i7-14700HX, NVIDIA RTX 4000 Ada Generation Laptop, 16", 3.1 kgTest du MSI Sword 16 HX : une puissance de jeu gâchée par un écran peu impressionnant
Le MSI Sword 16 HX possède toutes les caractéristiques d'un ordinateur portable de jeu moderne, avec un Intel Core i7-14700HX, une Nvidia GeForce RTX 4070 de 115 Watts, 16 Go de RAM DDR5, 1 TB SSD et un écran WUXGA (1 920 x 1 200) de 16 pouces à 144 Hz. Dans cet article, nous déterminons comment le Sword 16 HX se situe par rapport à d'autres ordinateurs dotés d'un matériel similaire et nous examinons certains de ses points forts et de ses compromis.
Intel Core i7-14700HX, NVIDIA GeForce RTX 4070 Laptop GPU, 16", 2.3 kgTest du Lenovo Legion Pro 5i : i7-14700HX surpuissant et RTX 4060 performante
Tous les regards étaient tournés vers le Lenovo Legion Pro 5 16IRX9 lors de notre test, grâce à la puissance de son processeur et à ses performances de jeu. Notre analyse révélera les points forts, mais aussi les points faibles, de cet ordinateur de jeu.
Intel Core i7-14700HX, NVIDIA GeForce RTX 4060 Laptop GPU, 16", 2.5 kgHP Victus 16 (2024): NVIDIA GeForce RTX 4060 Laptop GPU, 16.10", 2.4 kg
Critique » Test du HP Victus 16 (2024) : la puissance de la RTX 4060 associée à une bonne autonomie
Acer Predator Helios Neo 16 (2024): NVIDIA GeForce RTX 4070 Laptop GPU, 16.00", 2.6 kg
Critique » Test de l'Acer Predator Helios Neo 16 (2024) : PC portable de jeu RTX 4070 et écran DCI-P3
Lenovo LOQ 15IRX10, i7-14700HX: NVIDIA GeForce RTX 5060 Laptop, 15.60", 2.4 kg
Autres tests » Lenovo LOQ 15IRX10, i7-14700HX
Lenovo LOQ 17IRX10: NVIDIA GeForce RTX 5070 Laptop, 17.30", 2.9 kg
Autres tests » Lenovo LOQ 17IRX10
Lenovo Legion 5 15IRX10: NVIDIA GeForce RTX 5070 Laptop, 15.10", 1.9 kg
Autres tests » Lenovo Legion 5 15IRX10
Lenovo LOQ 17IRX10, RTX 5060: NVIDIA GeForce RTX 5060 Laptop, 17.30", 2.9 kg
Autres tests » Lenovo LOQ 17IRX10, RTX 5060
Lenovo Legion 5 15IRX10, i7-14700HX RTX 5060: NVIDIA GeForce RTX 5060 Laptop, 15.10", 1.9 kg
Autres tests » Lenovo Legion 5 15IRX10, i7-14700HX RTX 5060
Lenovo Legion 5 16IRX9, i7-14700HX: NVIDIA GeForce RTX 4070 Laptop GPU, 6.00", 2.5 kg
Autres tests » Lenovo Legion 5 16IRX9, i7-14700HX
Lenovo ThinkPad P16 Gen 2: NVIDIA RTX 4000 Ada Generation Laptop, 16.00", 3.1 kg
Autres tests » Lenovo ThinkPad P16 Gen 2
MSI Sword 16 HX B14VFKG, i7-14700HX: NVIDIA GeForce RTX 4060 Laptop GPU, 16.00", 2.3 kg
Autres tests » MSI Sword 16 HX B14VFKG, i7-14700HX
Acer Nitro 16 AN16-73, i7-14700HX: NVIDIA GeForce RTX 4060 Laptop GPU, 16.00", 2.5 kg
Autres tests » Acer Nitro 16 AN16-73, i7-14700HX
MSI Crosshair 16 HX D14VFKG: NVIDIA GeForce RTX 4060 Laptop GPU, 16.00", 2.5 kg
Autres tests » MSI Crosshair 16 HX D14VFKG
Lenovo Legion 7 16IRX9, i7-14700HX: NVIDIA GeForce RTX 4070 Laptop GPU, 16.00", 2.2 kg
Autres tests » Lenovo Legion 7 16IRX9, i7-14700HX
HP Victus 16-r1000: NVIDIA GeForce RTX 4070 Laptop GPU, 16.10", 2.3 kg
Autres tests » HP Victus 16-r1000
MSI Sword 16 HX B14VGKG: NVIDIA GeForce RTX 4070 Laptop GPU, 16.00", 2.3 kg
Autres tests » MSI Sword 16 HX B14VGKG
MSI Sword 17 HX B14VGKG: NVIDIA GeForce RTX 4070 Laptop GPU, 17.00", 2.6 kg
Autres tests » MSI Sword 17 HX B14VGKG
HP Omen Transcend 16-u1000ng: NVIDIA GeForce RTX 4060 Laptop GPU, 16.00", 2.2 kg
Autres tests » HP Omen Transcend 16-u1000ng
HP Omen 16-wf1000: NVIDIA GeForce RTX 4060 Laptop GPU, 16.10", 2.4 kg
Autres tests » HP Omen 16-wf1000
MSI Raider GE68 HX 14VFG: NVIDIA GeForce RTX 4060 Laptop GPU, 16.00", 2.8 kg
Autres tests » MSI Raider GE68 HX 14VFG
Lenovo Legion Pro 5 16IRX9, i7-14700HX: NVIDIA GeForce RTX 4070 Laptop GPU, 16.00", 2.5 kg
Autres tests » Lenovo Legion Pro 5 16IRX9, i7-14700HX
Lenovo LOQ 15IRX9, i7-14700HX: NVIDIA GeForce RTX 4060 Laptop GPU, 16.00", 2.3 kg
Autres tests » Lenovo LOQ 15IRX9
Acer Nitro 17 AN17-72: NVIDIA GeForce RTX 4060 Laptop GPU, 17.30", 3.2 kg
Autres tests » Acer Nitro 17 AN17-72
Acer Predator Helios Neo 16 (2024): NVIDIA GeForce RTX 4070 Laptop GPU, 16.00", 2.6 kg
Autres tests » Acer Predator Helios Neo 16 PHN16-72