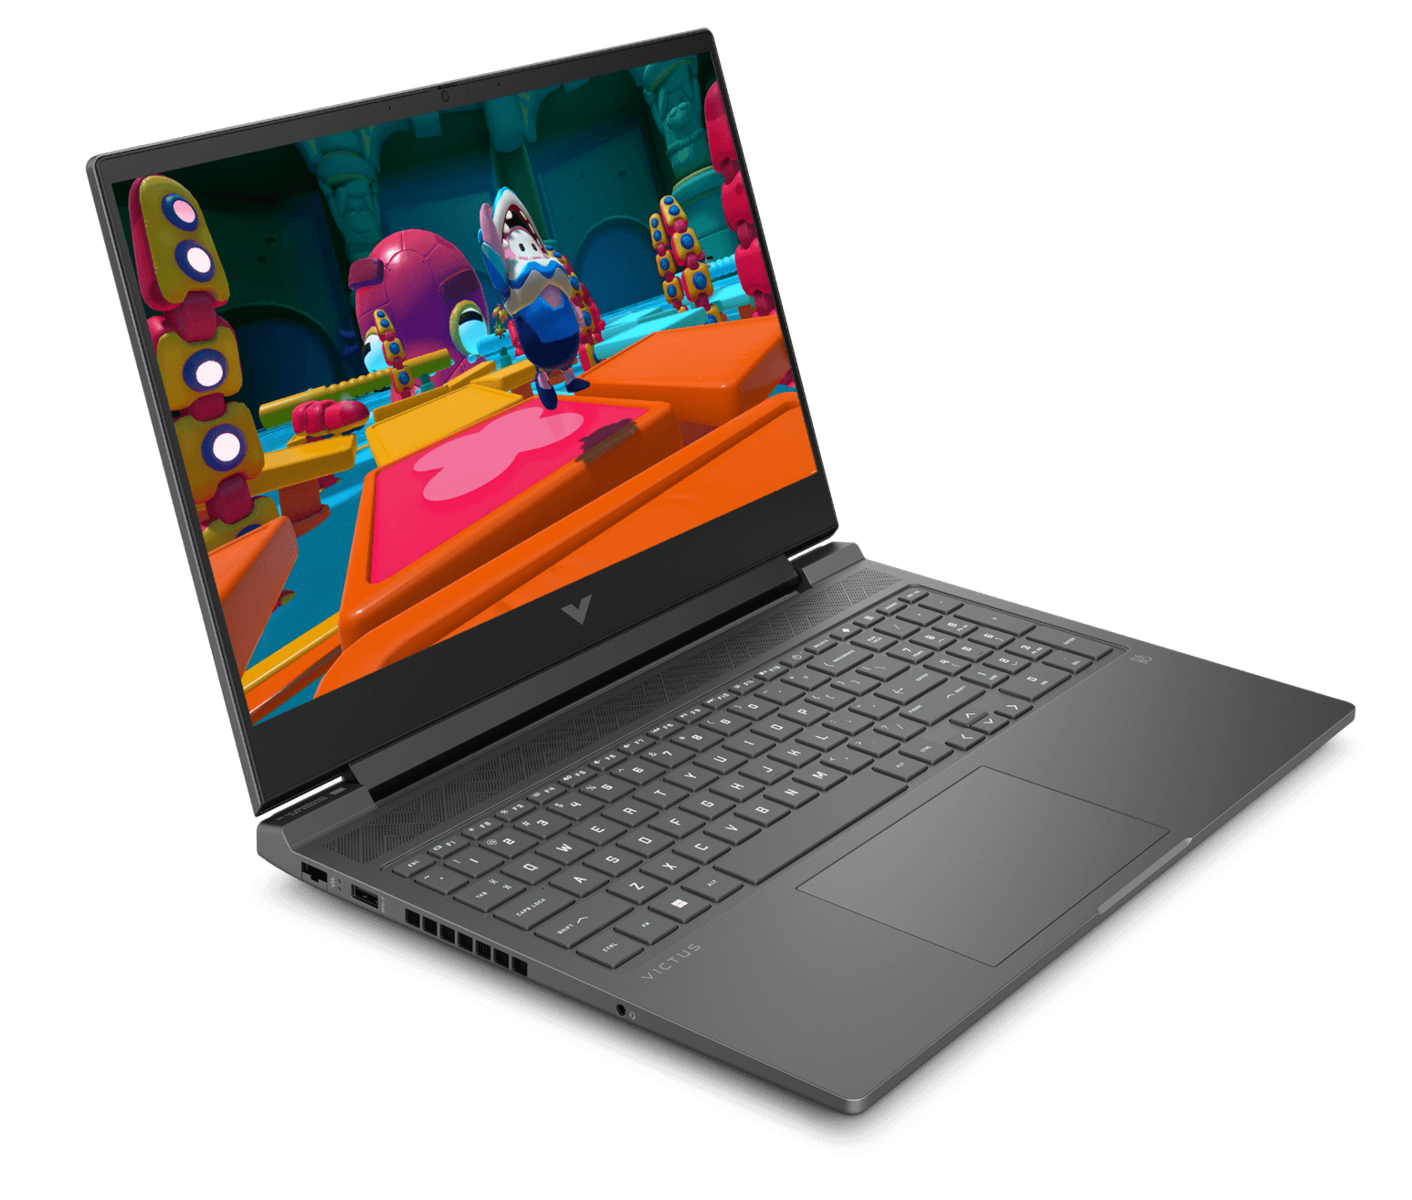
Test du HP Victus 16 : une puissance de jeu 1080p avec peu de compromis

La gamme d'ordinateurs portables Victus de HP s'adresse à un public à petit budget à la recherche de solutions de jeu. Cependant, il fonctionne toujours avec le logiciel Omen, cimentant ainsi sa position dans le répertoire des ordinateurs portables de jeu de HP.
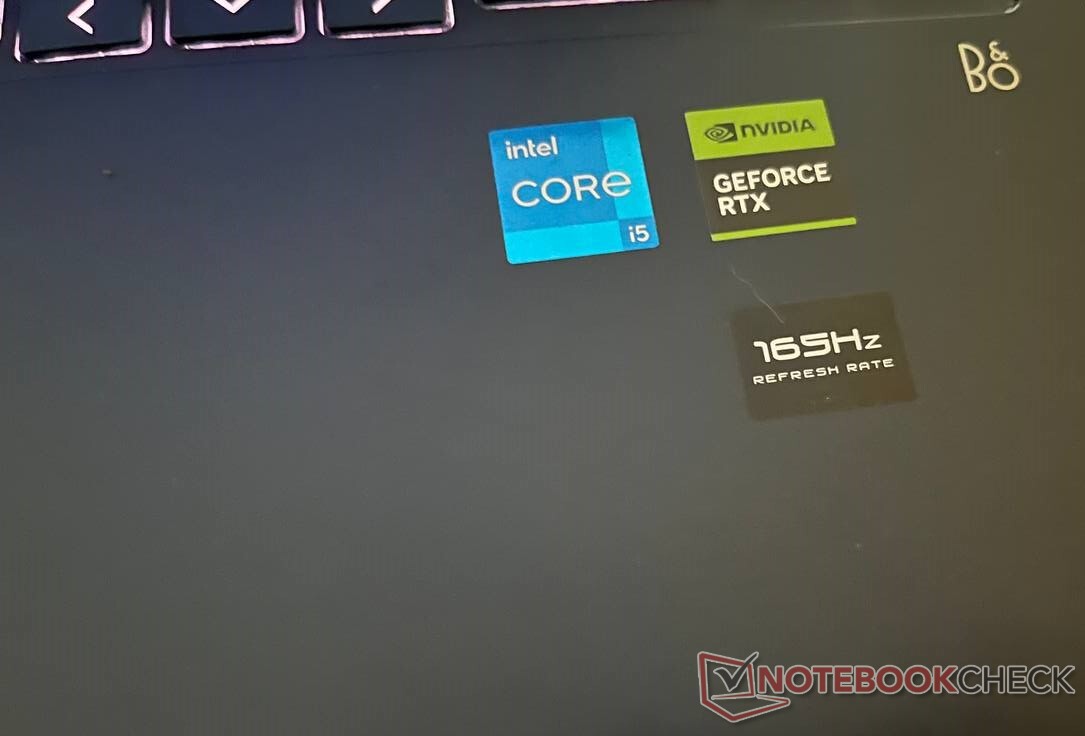
Le HP Victus 16-r0076TX offre un mélange intéressant de matériel de milieu de gamme Intel Core i5-13500HXraptor Lake-HX et une carte graphique Nvidia GeForce RTX 4050 (Ada Lovelace).
Il s'agit d'une amélioration significative par rapport à sa dernière itération, le HP Victus 16-e0145ngqui utilisait un AMD Ryzen 5 5600H et une carte graphique Nvidia Nvidia GeForce RTX 3050 Ti. Cependant, la mise à niveau des spécifications s'accompagne d'une augmentation correspondante du coût.
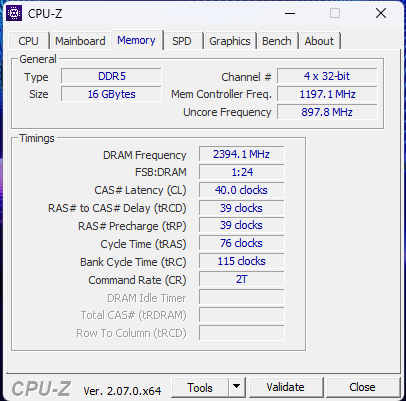
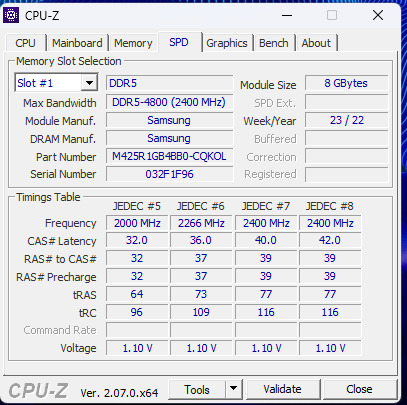
Les autres spécifications comprennent un écran IPS FHD (1 920 x 1 080) de 16 pouces cadencé à 165 Hz, un SSD NVMe de 512 Go et 16 Go de RAM DDR5 (4 800 MT/s). Il s'agit d'une machine intéressante qui peut satisfaire la plupart des joueurs.
Comparaison avec les concurrents potentiels
Note | Date | Modèle | Poids | Épaisseur | Taille | Résolution | Prix |
|---|---|---|---|---|---|---|---|
| 85.6 % v7 (old) | 09/23 | HP Victus 16-r0076TX i5-13500HX, GeForce RTX 4050 Laptop GPU | 2.3 kg | 22.9 mm | 16.10" | 1920x1080 | |
| 86.7 % v7 (old) | 08/23 | Acer Nitro 16 AN16-41-R7YE R5 7535HS, GeForce RTX 4050 Laptop GPU | 2.6 kg | 27.9 mm | 16.00" | 1920x1200 | |
| 87.3 % v7 (old) | 07/23 | Acer Predator Triton 14 PT14-51 i7-13700H, GeForce RTX 4050 Laptop GPU | 1.7 kg | 19.81 mm | 14.00" | 2560x1600 | |
| 88.3 % v7 (old) | 09/23 | Alienware m16 R1 Intel i7-13700HX, GeForce RTX 4060 Laptop GPU | 3 kg | 25.4 mm | 16.00" | 2560x1600 | |
| 89.5 % v7 (old) | 07/23 | Acer Predator Helios 16 PH16-71-731Q i7-13700HX, GeForce RTX 4060 Laptop GPU | 2.6 kg | 26.9 mm | 16.00" | 2560x1600 | |
| 84.2 % v7 (old) | 06/23 | Dell G15 5530 i7-13650HX, GeForce RTX 4060 Laptop GPU | 3 kg | 26.95 mm | 15.60" | 1920x1080 | |
| 89 % v7 (old) | 08/23 | Lenovo Legion Pro 5 16ARX8 (R5 7645HX, RTX 4050) R5 7645HX, GeForce RTX 4050 Laptop GPU | 2.5 kg | 27.3 mm | 16.00" | 2560x1600 | |
| 85.7 % v7 (old) | 07/23 | Lenovo LOQ 15APH8 R7 7840HS, GeForce RTX 4050 Laptop GPU | 2.5 kg | 25.2 mm | 15.60" | 1920x1080 |
Boîtier : Boîtier en plastique robuste avec un écran fragile
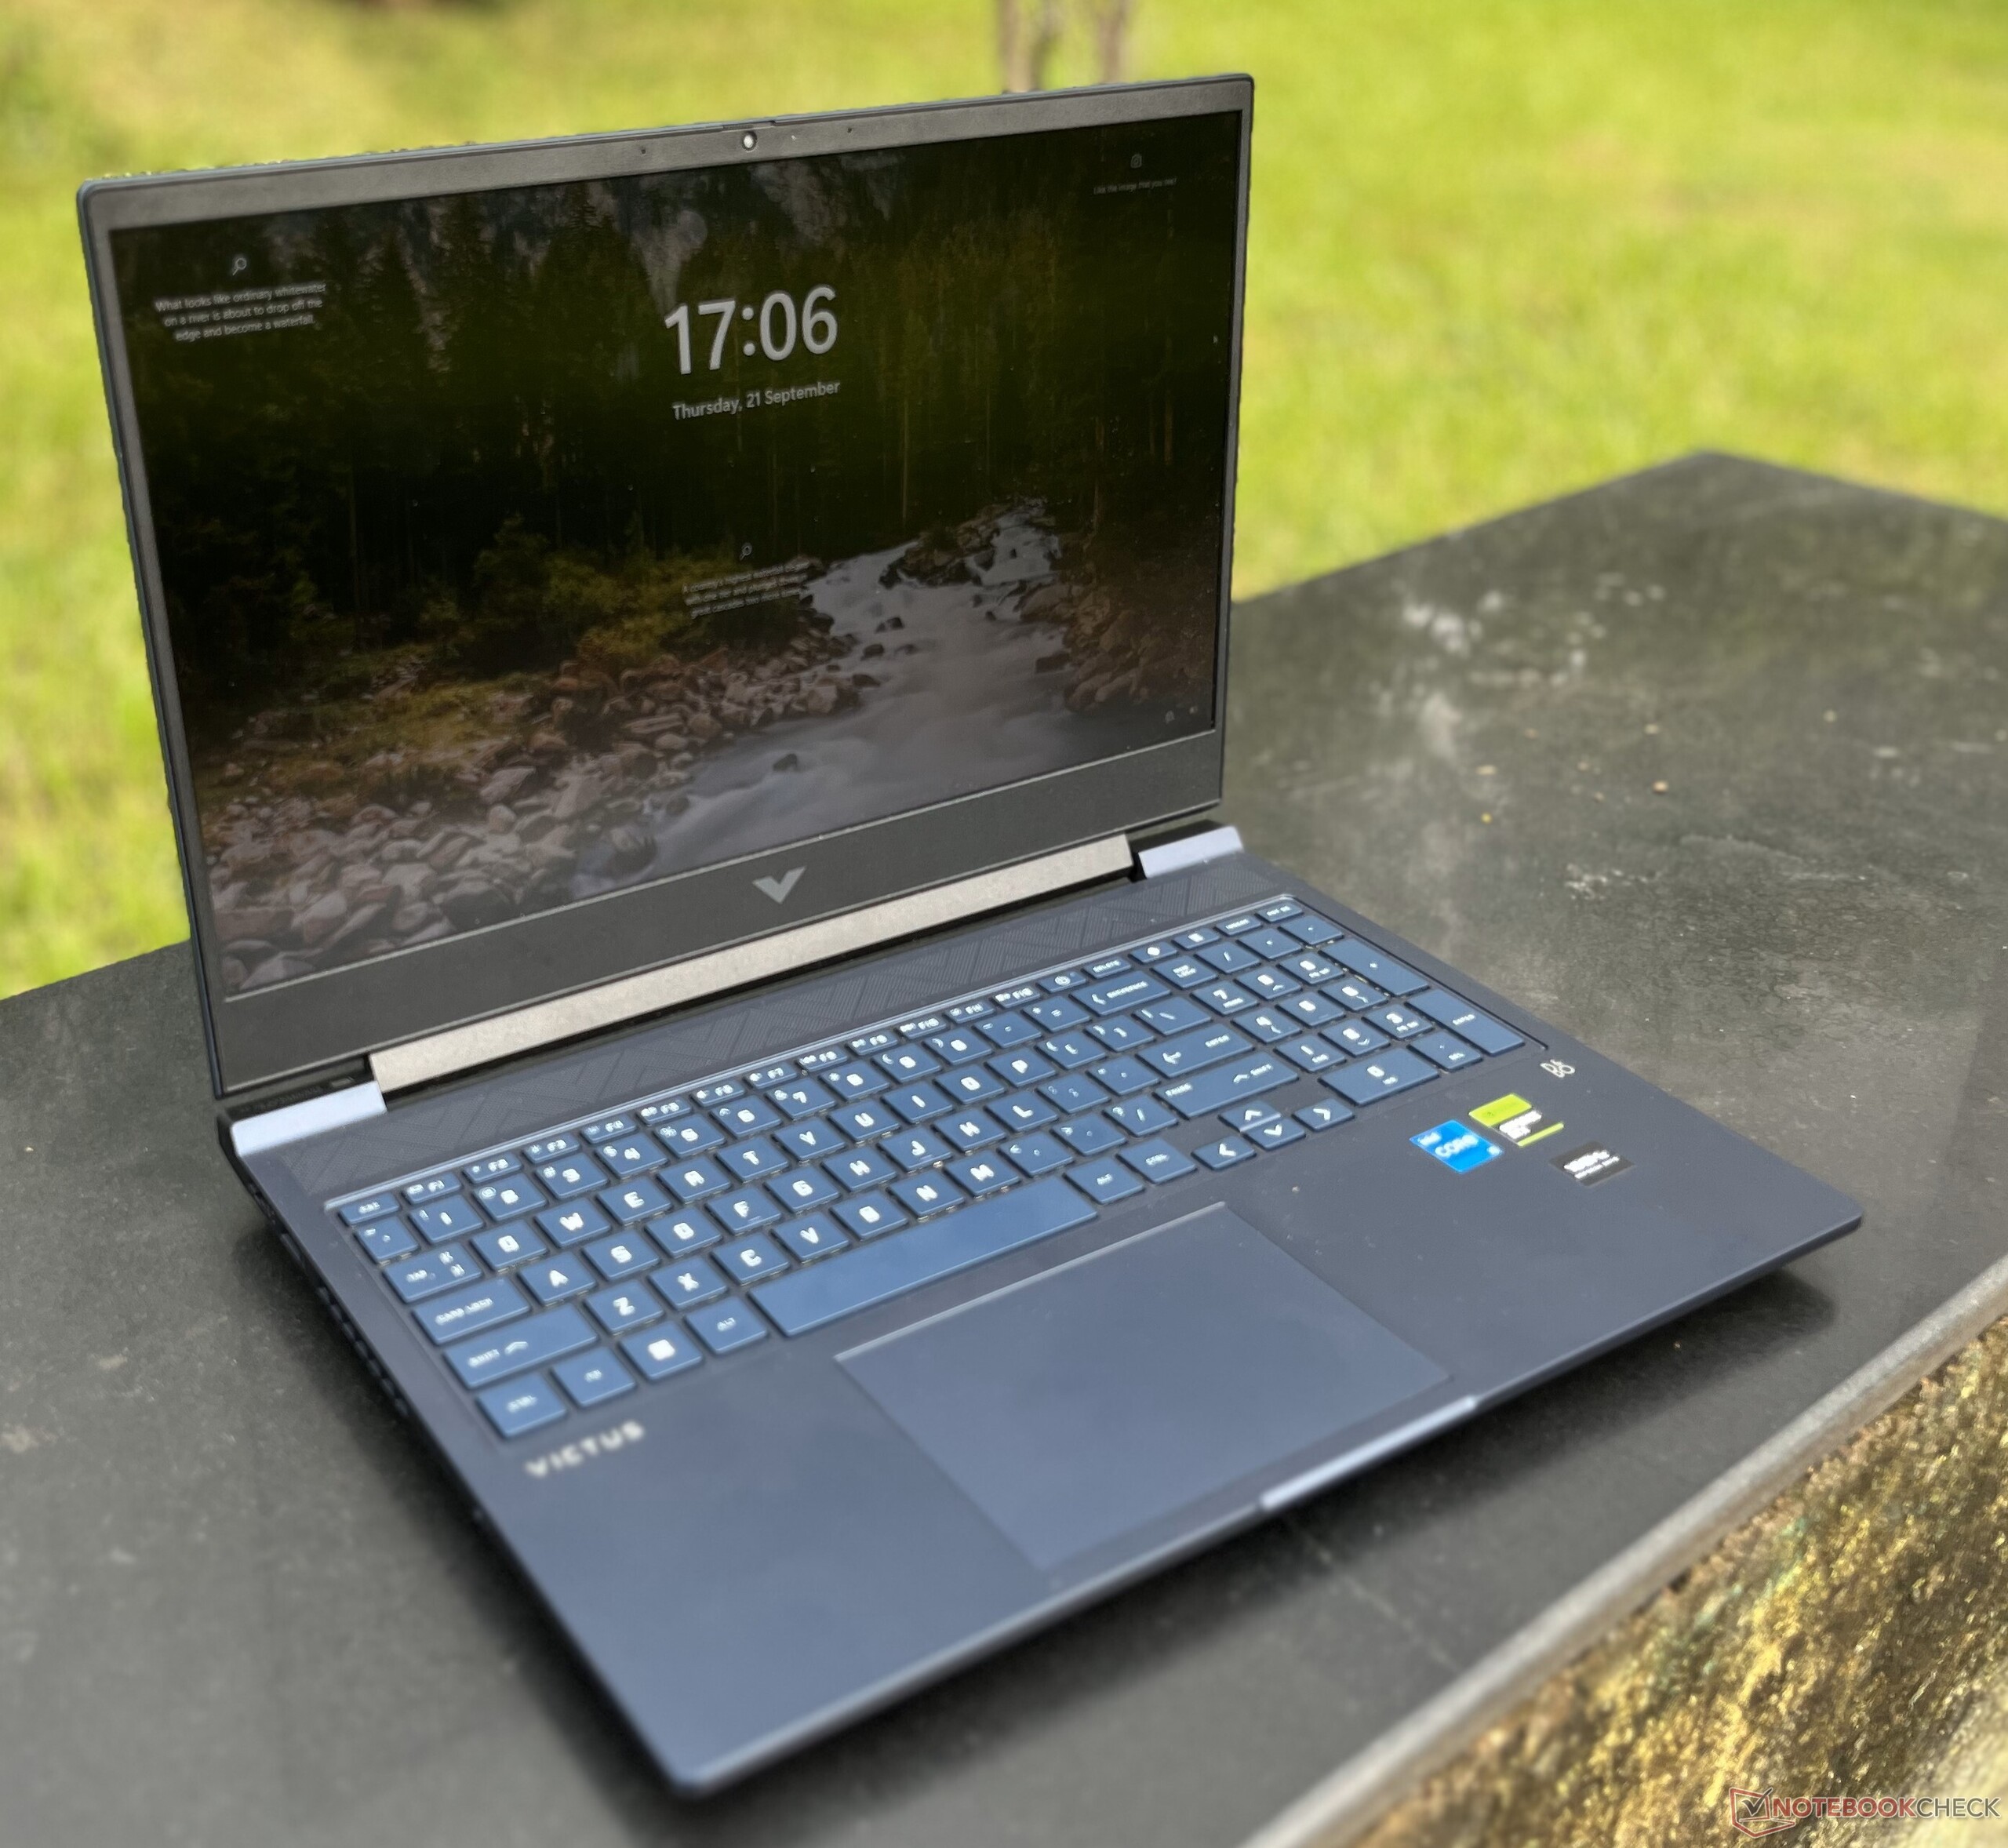
Dès sa sortie de la boîte, il est évident que le HP Victus 16 n'est pas très portable. Cependant, les ordinateurs portables de jeu sont rarement légers, et avec 2,3 kg, l'ordinateur portable se situe en fait à l'extrémité la plus légère du spectre.
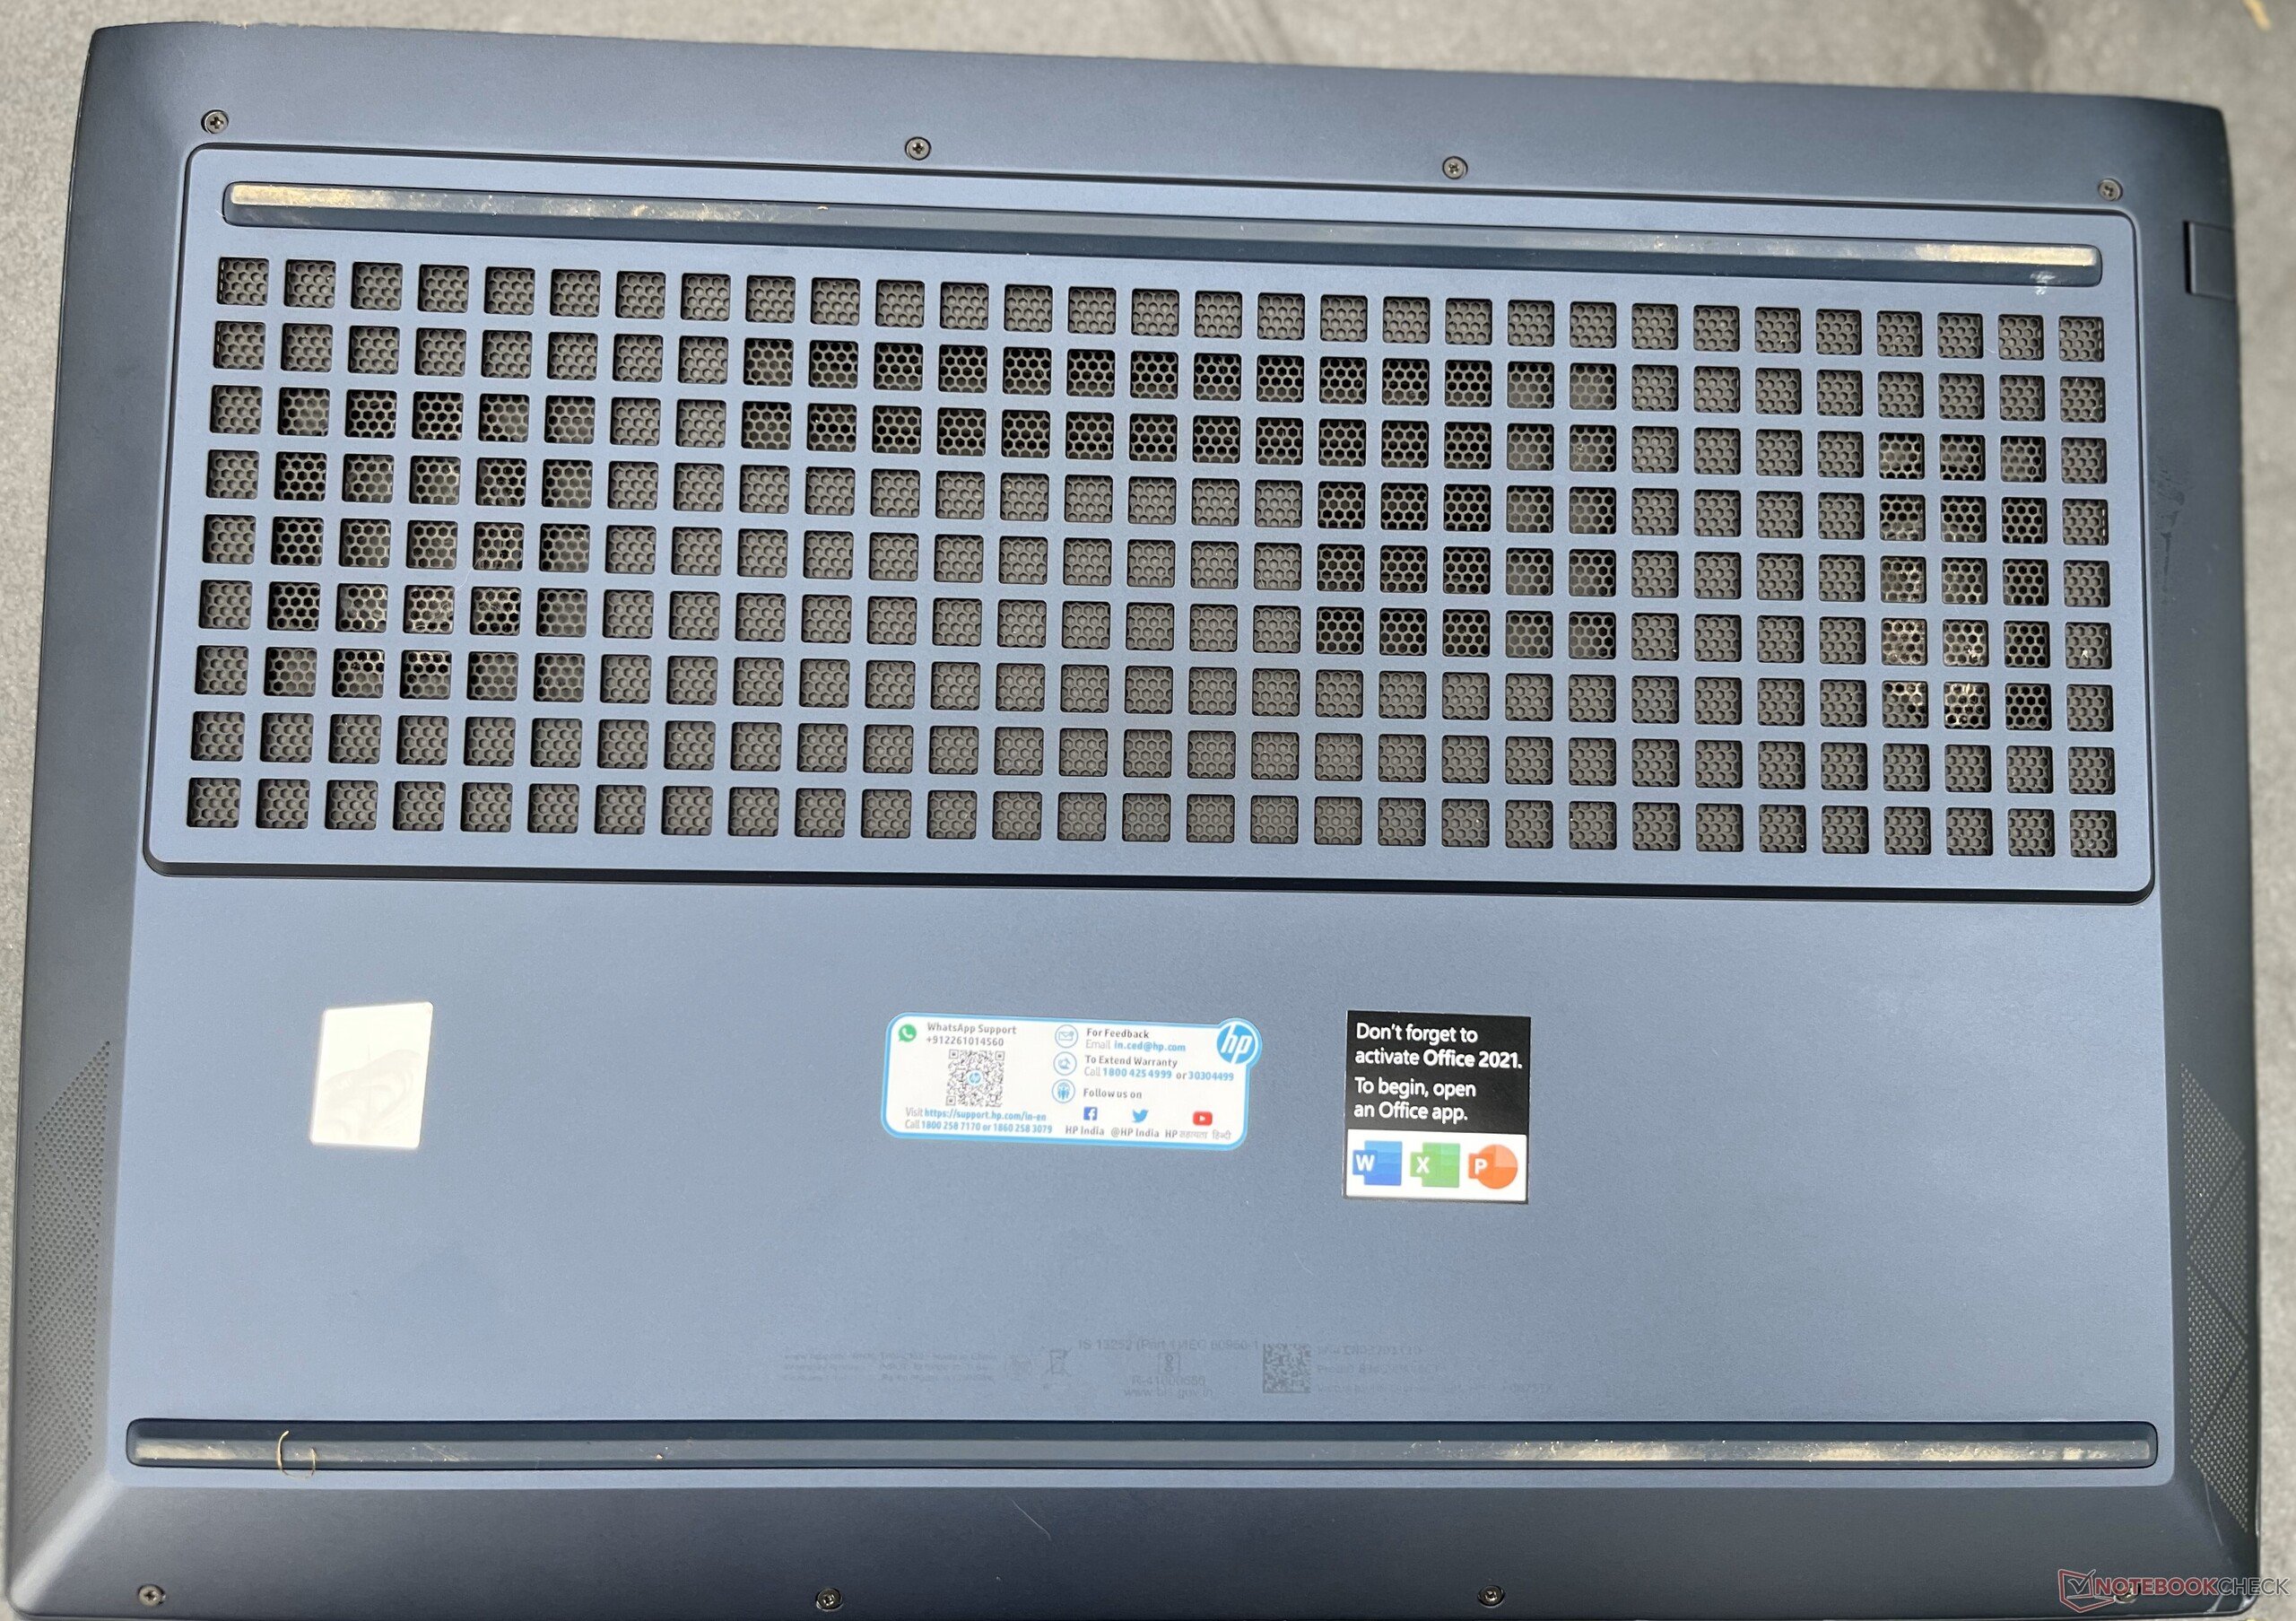
Le châssis noir ne comporte pas beaucoup de marques, à l'exception d'un "V" à l'arrière et d'une série d'autocollants à l'avant. HP s'efforce de garder le portable propre en incluant un filtre à poussière sur tous les orifices d'aération.
L'écran de 16 pouces permet à HP d'intégrer un clavier complet (numpad inclus) dans le Victus 16. L'écran fléchit un peu trop et il serait bon que HP le révise dans les versions suivantes.
Connectivité : Il aurait pu y avoir plus d'E/S
Les entrées/sorties sur le HP Victus 16 sont étonnamment légères pour un ordinateur portable de jeu. Sur la droite, on trouve un port USB-C, deux ports USB-A (tous trois évalués à 5 Gbps) et un port HDMI 2.1 à une extrémité. À côté, on trouve un connecteur à broches en barillet pour le chargeur. Les ports USB et HDMI sont un peu trop proches pour être confortables, en particulier près du port HDMI.
De l'autre côté, il n'y a qu'une prise Ethernet RJ-45, un port USB Type-A et une prise audio de 3,5 mm. Quelques entrées/sorties supplémentaires à l'arrière auraient été appréciables. Le port USB-C semble presque avoir été pensé après coup, compte tenu de sa vitesse médiocre.


Communication
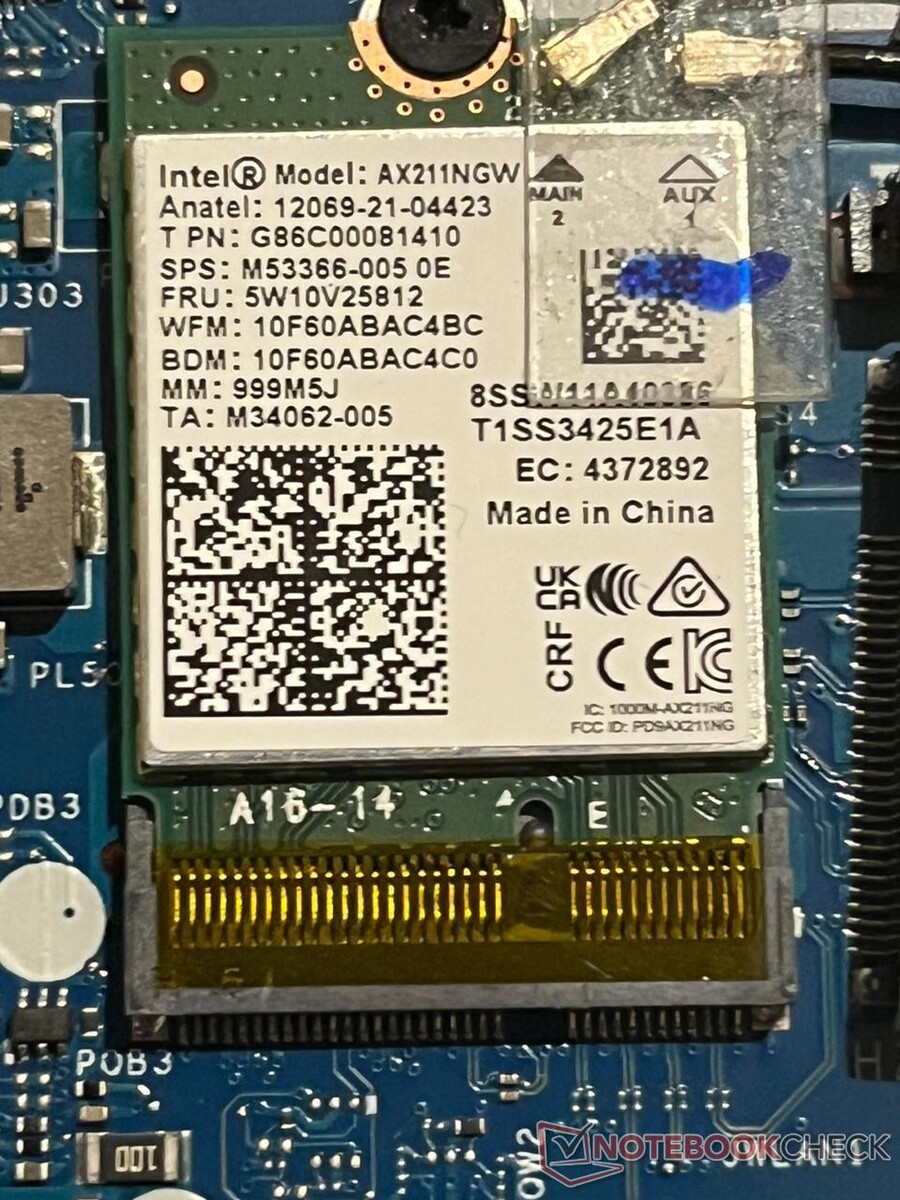
Pour un ordinateur portable d'entrée de gamme, le HP Victus 16 offre un bon choix d'options de mise en réseau. Vous disposez du Wi-Fi 6E et d'un port Ethernet, qui vous permettent tous deux de transférer des fichiers à grande vitesse.
Dans iPerf3, le modem Wi-Fi 6E d'Intel a pu recevoir des données à 1 646 Mbps avec notre routeur Asus ROG Rapture AXE11000. C'est beaucoup plus rapide que ses concurrents, qui ne disposent souvent pas de la fonctionnalité Wi-Fi 6.
| Networking / iperf3 transmit AXE11000 | |
| Lenovo Legion Pro 5 16ARX8 (R5 7645HX, RTX 4050) | |
| Dell G15 5530 | |
| HP Victus 16-r0076TX | |
| Acer Predator Triton 14 PT14-51 | |
| Acer Nitro 16 AN16-41-R7YE | |
| Acer Predator Helios 16 PH16-71-731Q | |
| Alienware m16 R1 Intel | |
| Moyenne de la classe Gaming (560 - 1862, n=88, 2 dernières années) | |
| Moyenne Intel Wi-Fi 6E AX211 (64 - 1921, n=276) | |
| Lenovo LOQ 15APH8 | |
| Networking / iperf3 receive AXE11000 | |
| Acer Predator Triton 14 PT14-51 | |
| Acer Nitro 16 AN16-41-R7YE | |
| Alienware m16 R1 Intel | |
| Lenovo Legion Pro 5 16ARX8 (R5 7645HX, RTX 4050) | |
| Dell G15 5530 | |
| HP Victus 16-r0076TX | |
| Moyenne de la classe Gaming (680 - 1745, n=88, 2 dernières années) | |
| Acer Predator Helios 16 PH16-71-731Q | |
| Moyenne Intel Wi-Fi 6E AX211 (582 - 1890, n=276) | |
| Lenovo LOQ 15APH8 | |
| Networking / iperf3 transmit AXE11000 6GHz | |
| Lenovo Legion Pro 5 16ARX8 (R5 7645HX, RTX 4050) | |
| Acer Predator Helios 16 PH16-71-731Q | |
| HP Victus 16-r0076TX | |
| Moyenne de la classe Gaming (723 - 1868, n=36, 2 dernières années) | |
| Moyenne Intel Wi-Fi 6E AX211 (385 - 1851, n=226) | |
| Networking / iperf3 receive AXE11000 6GHz | |
| Lenovo Legion Pro 5 16ARX8 (R5 7645HX, RTX 4050) | |
| HP Victus 16-r0076TX | |
| Moyenne de la classe Gaming (975 - 1775, n=35, 2 dernières années) | |
| Moyenne Intel Wi-Fi 6E AX211 (700 - 1857, n=226) | |
| Acer Predator Helios 16 PH16-71-731Q | |
Webcam
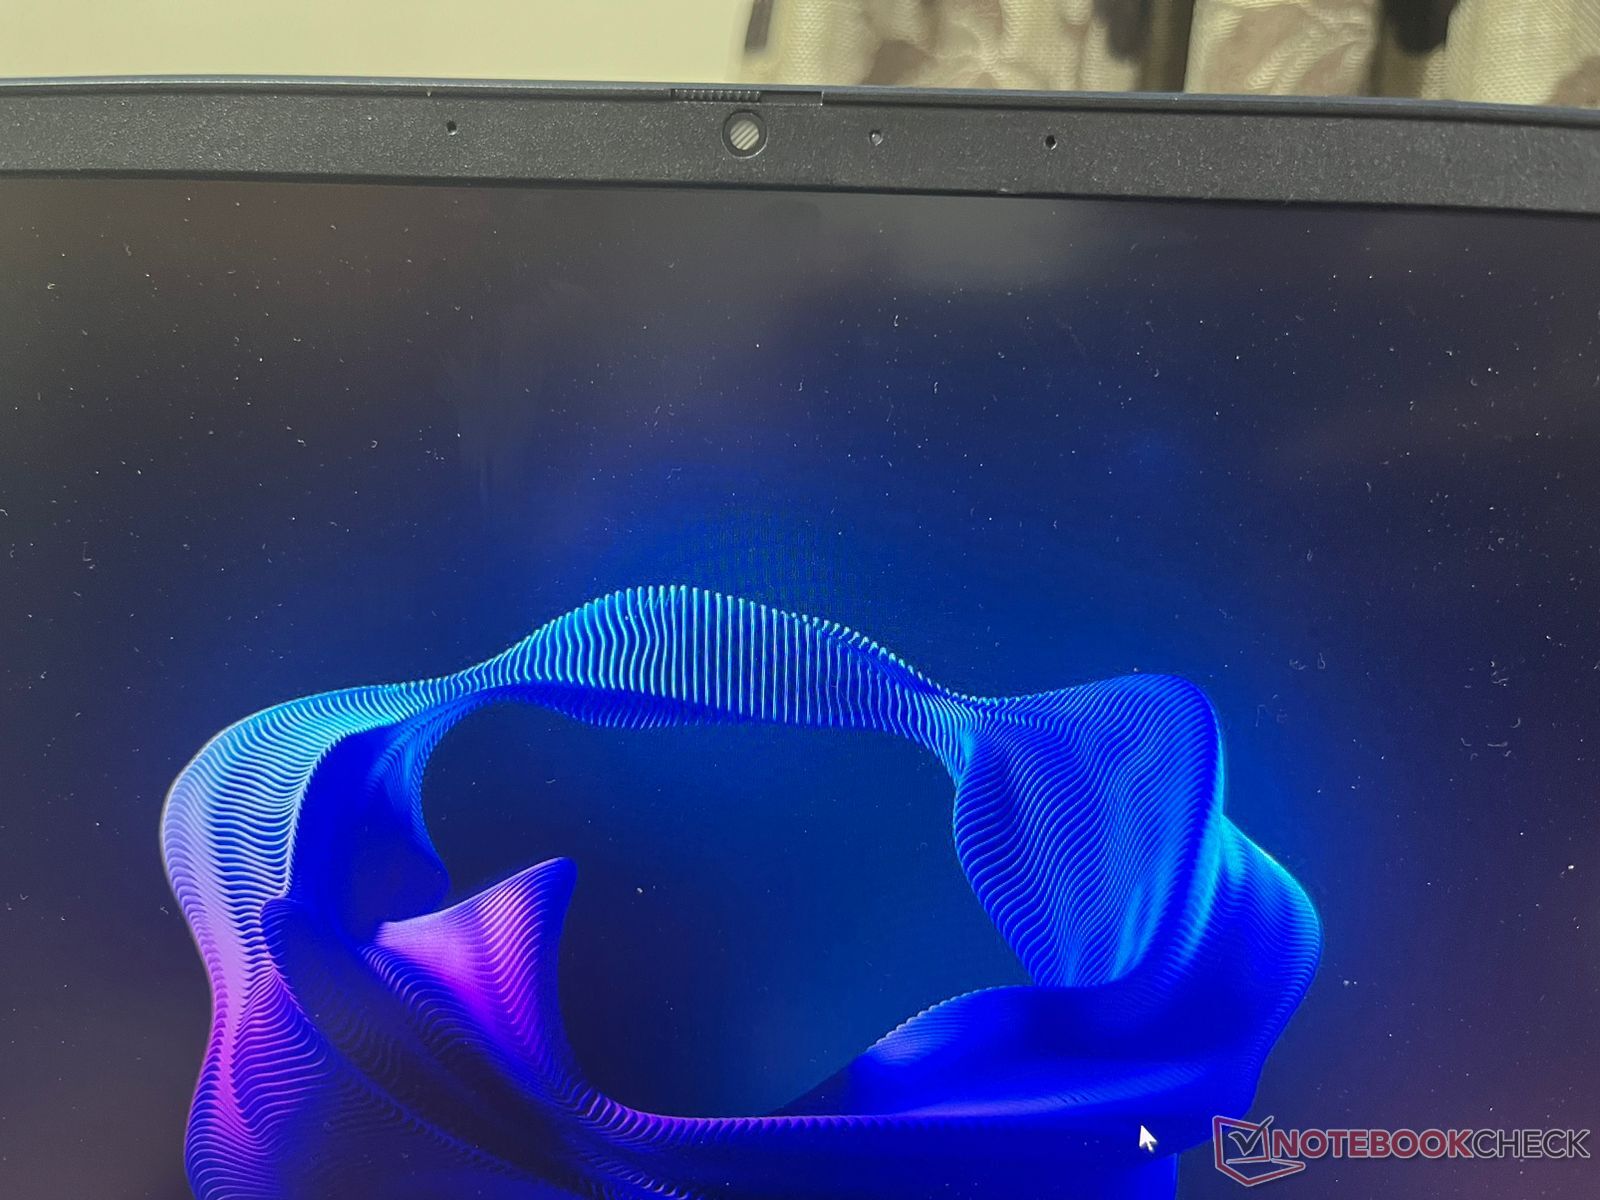
Les webcams sont rares sur les ordinateurs portables de jeu, et le fait que le HP Victus 16 comprenne un module 1080p (~2 MP) n'est rien de moins qu'un bonus. Elle n'est pas très précise au niveau des couleurs, mais elle devrait couvrir les tâches de base telles que les vidéoconférences et les appels.
Il existe même un obturateur physique (difficile à trouver) qui coupe entièrement l'appareil photo. De plus, il existe une section dédiée dans l'Omen Gaming Hub pour l'amélioration de la caméra et du micro à l'aide de Nvidia Broadcast.


Sécurité
Les fonctions de sécurité sont totalement absentes du HP Victus 16, à l'exception d'un module TPM, nécessaire pour Windows 11. Il n'y a aucun signe de capteur d'empreintes digitales, de Windows Hello ou même de fente de verrouillage Kensington.
Accessoires et garantie
Il n'y a pas grand-chose à dire sur l'emballage du HP Victus 16. Il est essentiellement composé de l'ordinateur portable et d'une brique d'alimentation. Cependant, cette dernière est remarquablement grande, comme c'est le cas pour la plupart des ordinateurs portables de jeu.
HP India offre une garantie limitée d'un an avec le Victus 16. Un supplément de 2 999 euros permet de bénéficier de deux années supplémentaires de garantie et d'un plan antivirus pendant trois ans. Cette offre est toutefois valable pour une durée limitée.
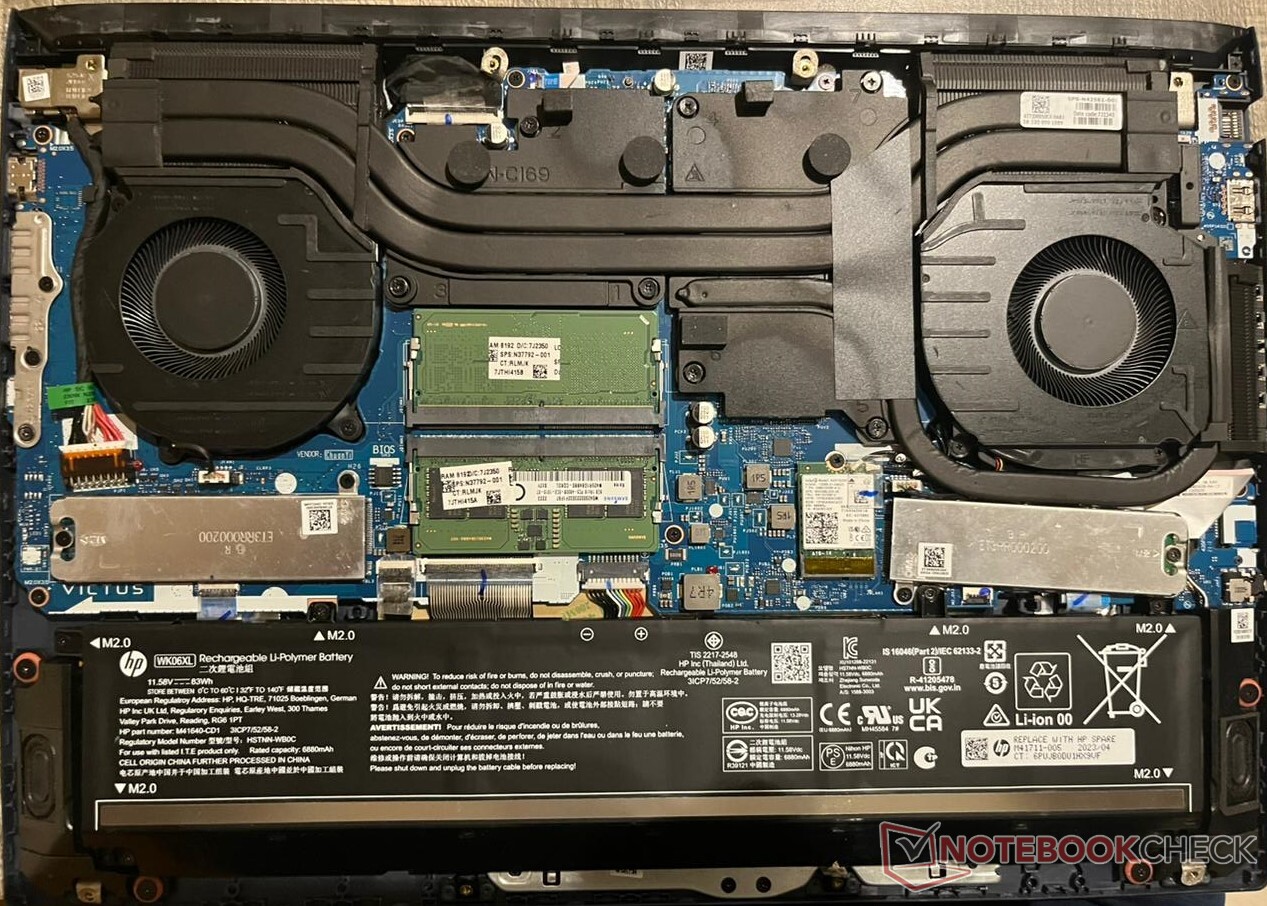
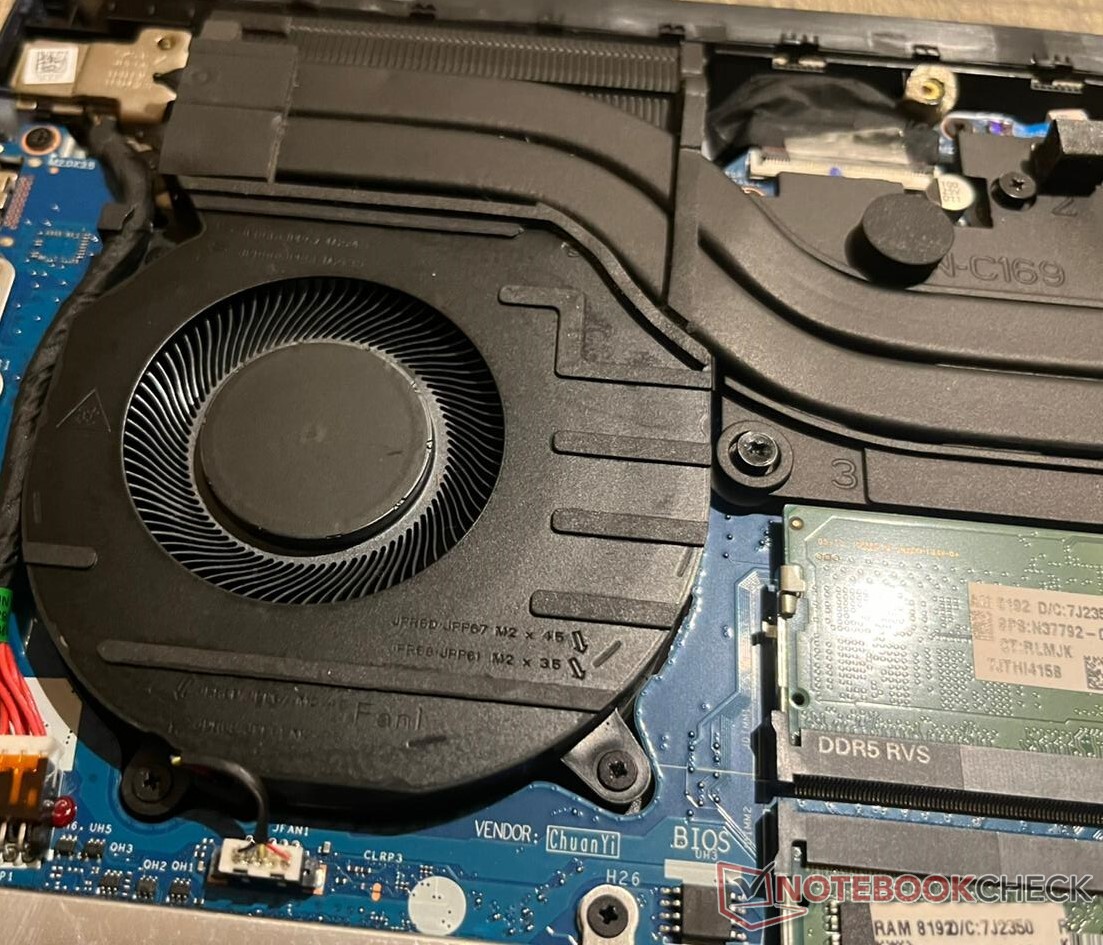
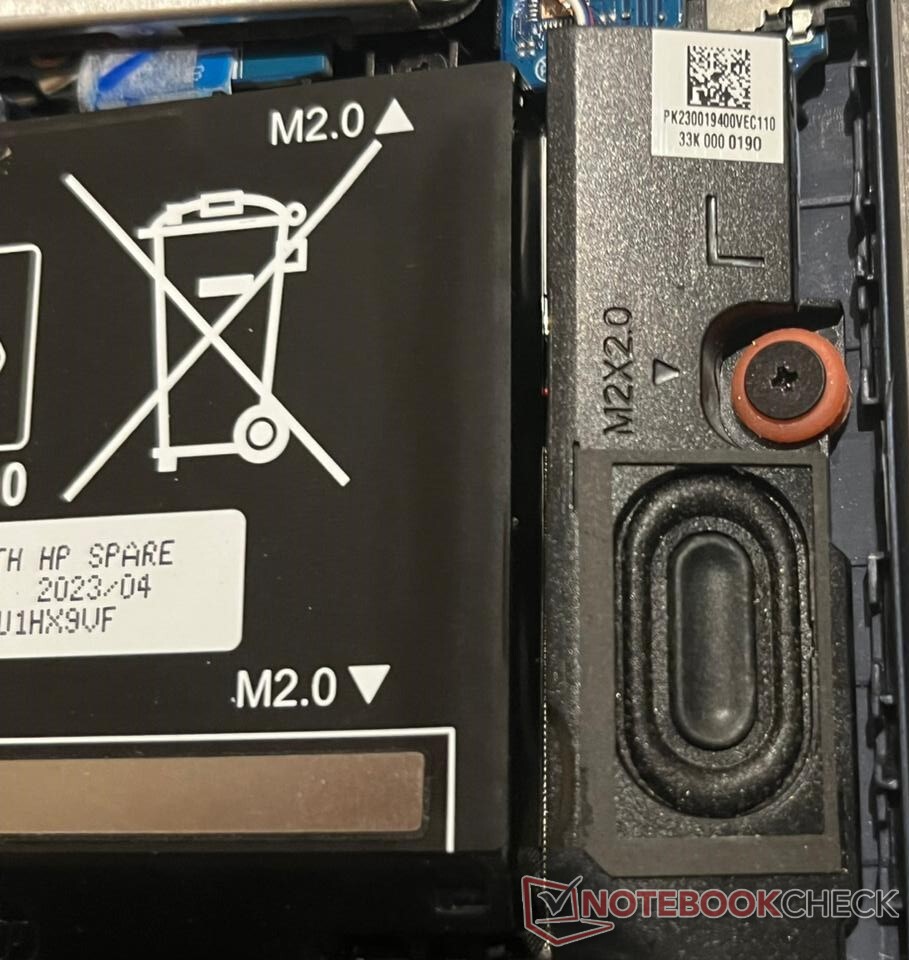
Maintenance
L'accès au HP Victus 16 est très facile. Il suffit d'un tournevis à tête Philips, de défaire huit vis à l'arrière et d'ouvrir la plaque de recouvrement. La carte WLAN, la RAM DDR5 et le SSD NVMe peuvent tous être remplacés. La batterie peut être dévissée et remplacée si nécessaire.
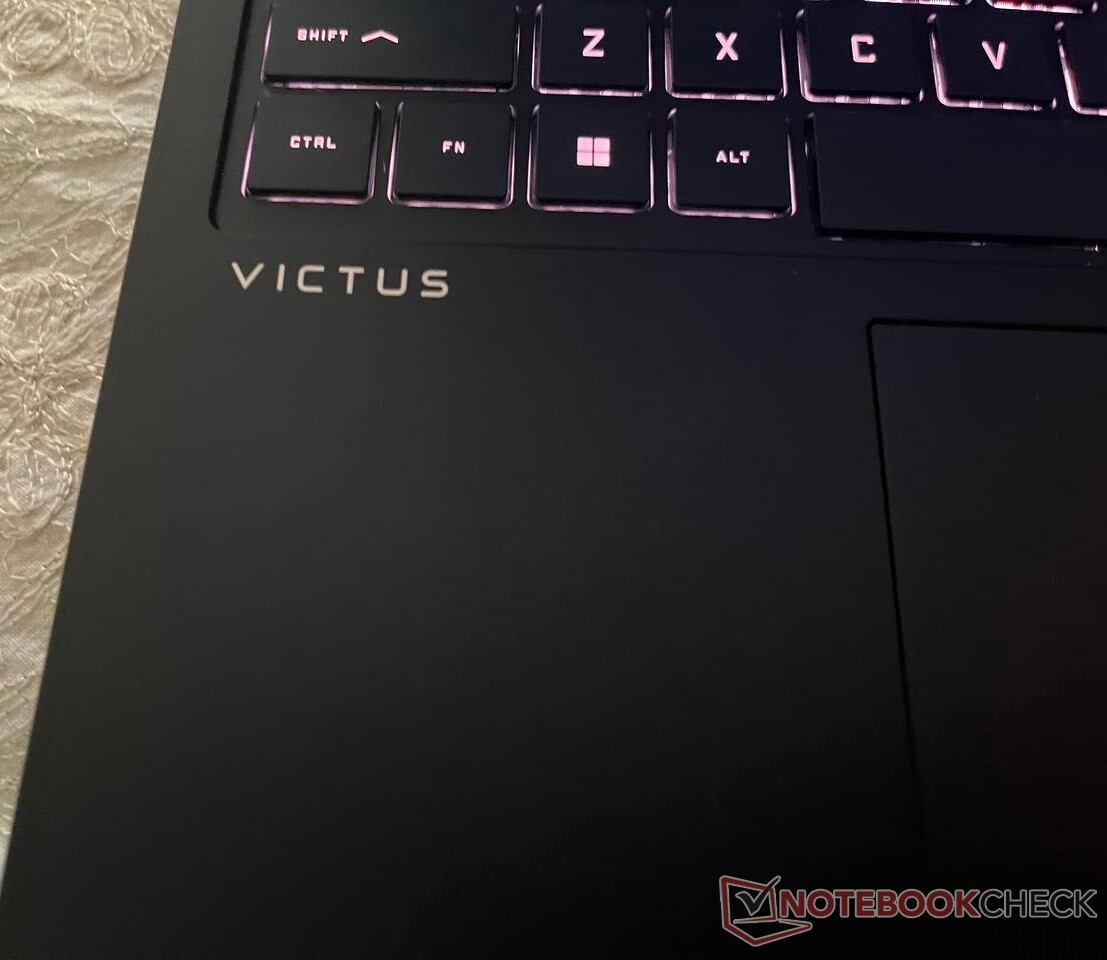
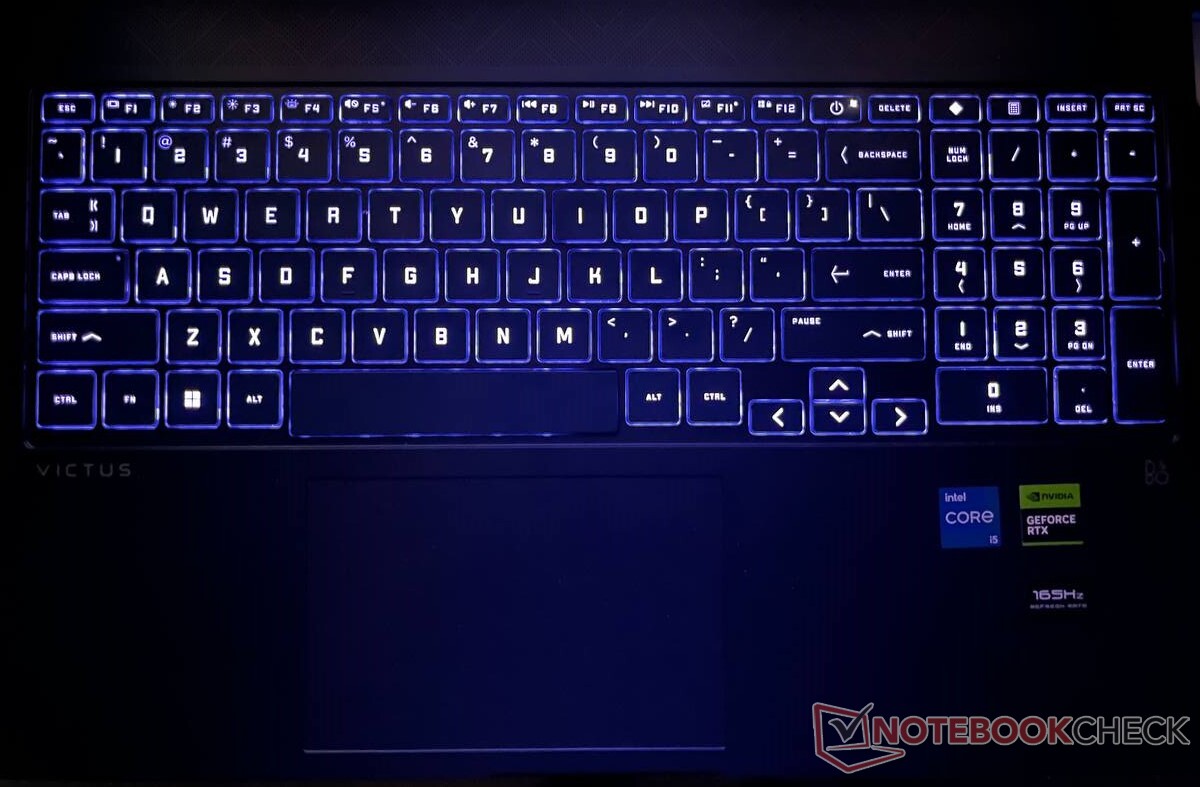
Périphériques d'entrée : Clavier décent avec éclairage RGB
Le HP Victus 16 est équipé d'un clavier complet et d'un trackpad suffisamment grand. Les touches sont larges et les utilisateurs d'ordinateurs de bureau ne devraient pas mettre longtemps à reprogrammer leur mémoire musculaire pour travailler avec l'ordinateur portable. Le pavé numérique est un ajout bienvenu, mais HP a choisi de placer le bouton d'alimentation au pire endroit possible, à côté de la touche d'effacement. Il nous a fallu une minute pour trouver le bouton d'alimentation la première fois, et nous sommes convaincus que nous ne serons pas les seuls.
Clavier
Les touches sont un peu molles, mais elles ne sont pas trop gênantes pour l'immersion. Ceux qui souhaitent personnaliser l'éclairage du clavier peuvent le faire via l'application Omen Lighting.
Il y a un bouton dédié pour ouvrir l'application Omen Gaming Hub et un autre pour la calculatrice.
Malgré son châssis en plastique, le clavier est assez robuste et ne fléchit pas beaucoup sous la pression.
Pavé tactile
Le pavé tactile couvre tous les gestes de Windows Precision. Cependant, l'ensemble du pavé tactile n'est pas cliquable, une partie de la partie supérieure étant rigide.
La fonction de rejet de la paume de la main est également efficace et ne tient pas compte des glissements et des clics accidentels lors de la saisie. Le suivi et les gestes sur les bords fonctionnent sans problème.
Écran : Un écran de 165 Hz avec une luminosité médiocre
Notre modèle HP Victus 16 est équipé d'un écran LCD IPS de 16,1 pouces FHD (1 920 x 1 080) de Chi Mei. HP propose deux autres choix d'écran avec les SKU Victus 16, 144 Hz FHD et 240 Hz QHD (2,550 x 1,440).
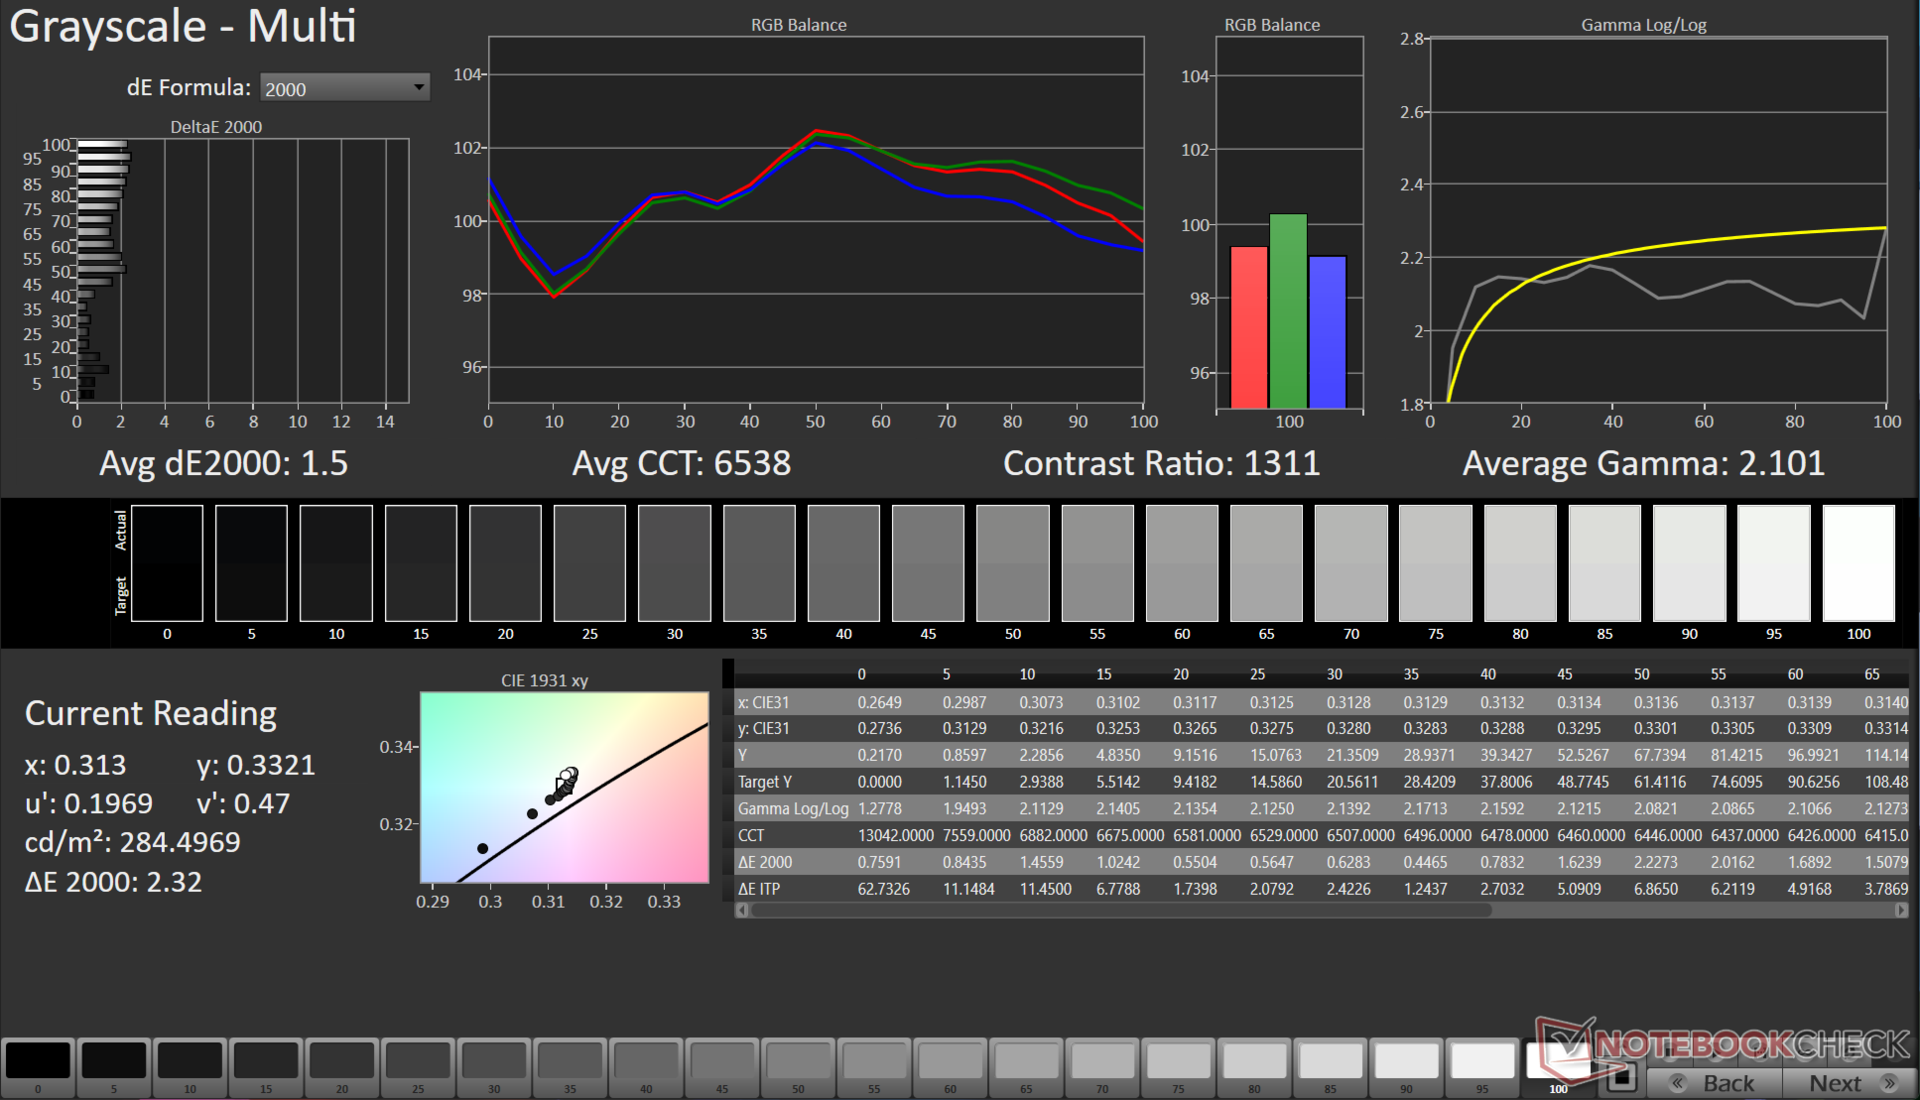
Le site Web de HP indique que cet écran a une luminosité maximale de 300 nits. Nos tests confirment ce chiffre, mais la distribution est plus faible (82%). Elle est également un peu déséquilibrée, surtout vers le milieu à droite.
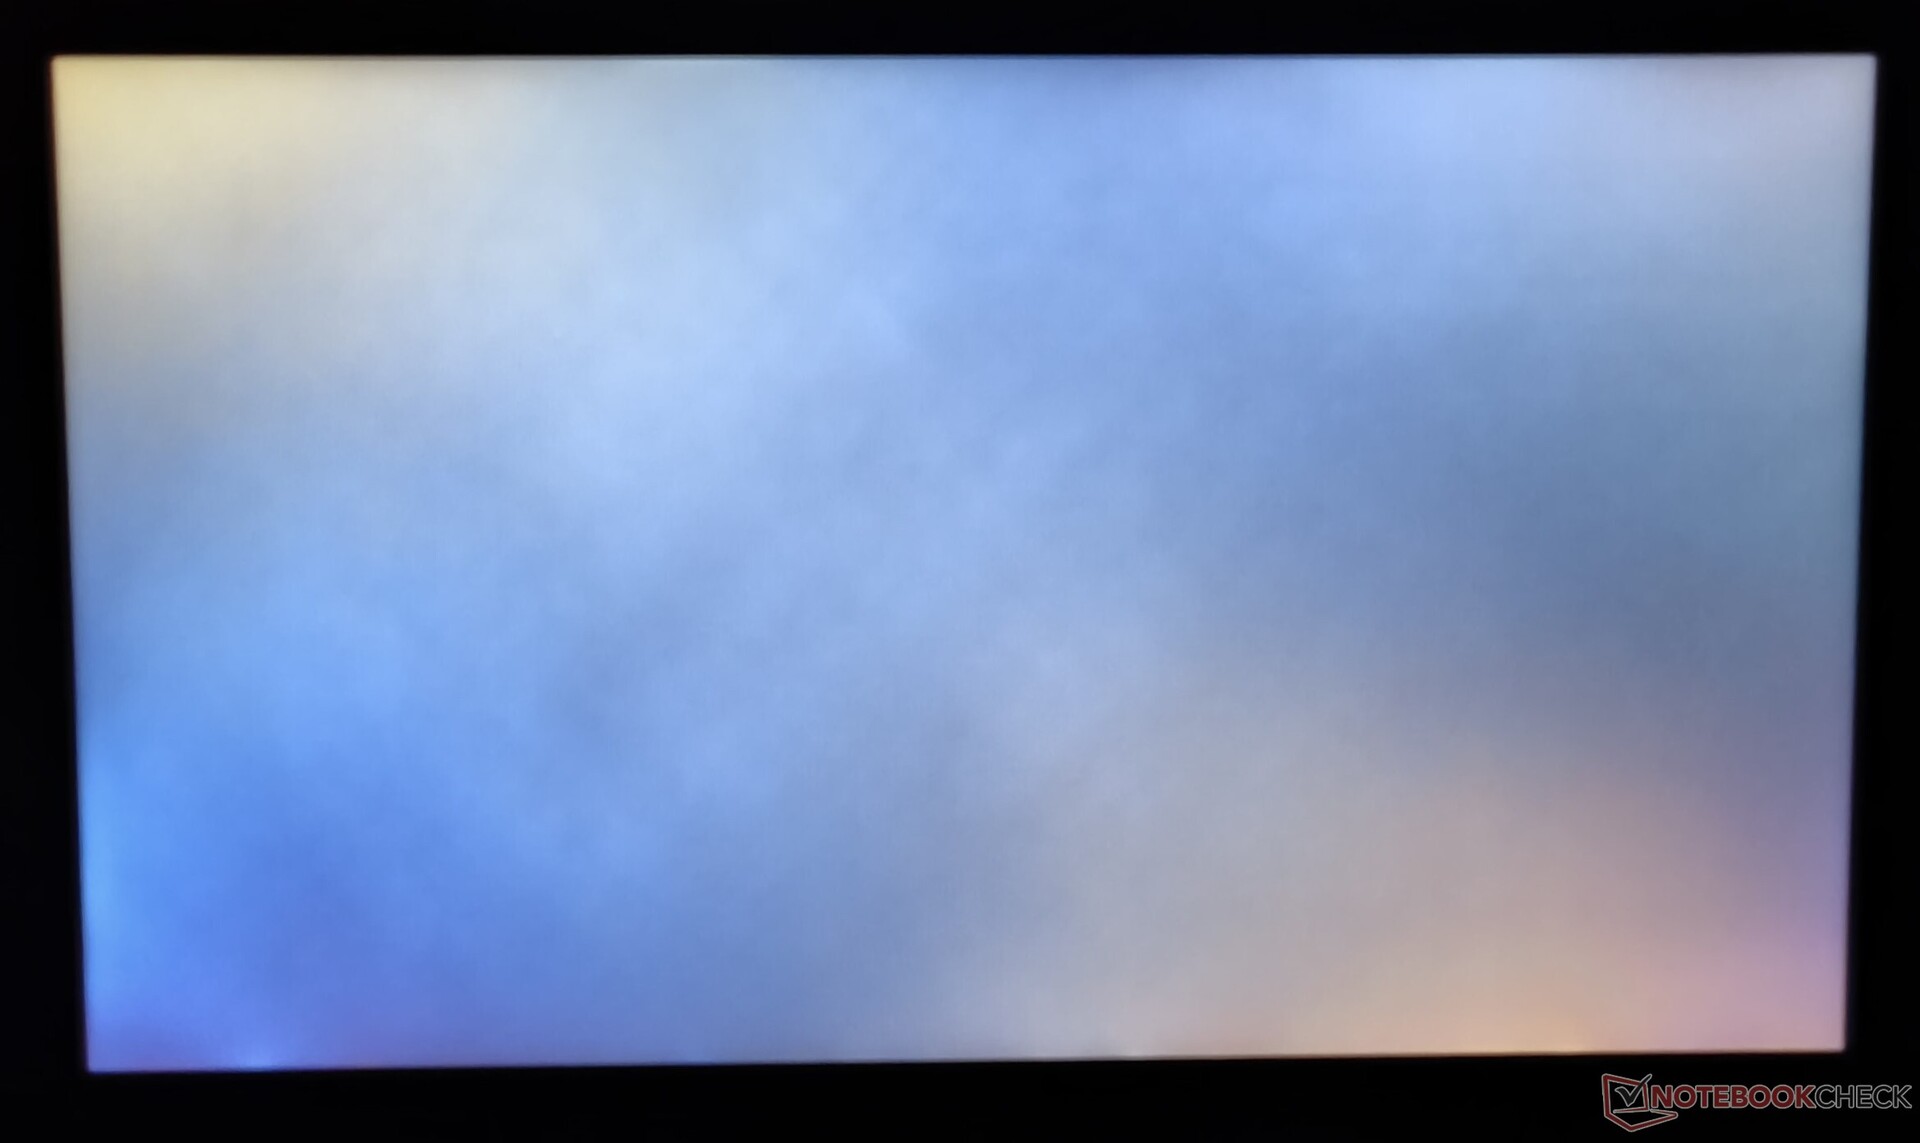
Enfin, le taux de contraste de 1 381:1 se situe dans une fourchette acceptable. Cependant, le panneau est affligé d'un mauvais cas de rétro-éclairage, ce qui est un problème récurrent avec les écrans IPS en général.

| |||||||||||||||||||||||||
Homogénéité de la luminosité: 82 %
Valeur mesurée au centre, sur batterie: 287 cd/m²
Contraste: 1381:1 (Valeurs des noirs: 0.21 cd/m²)
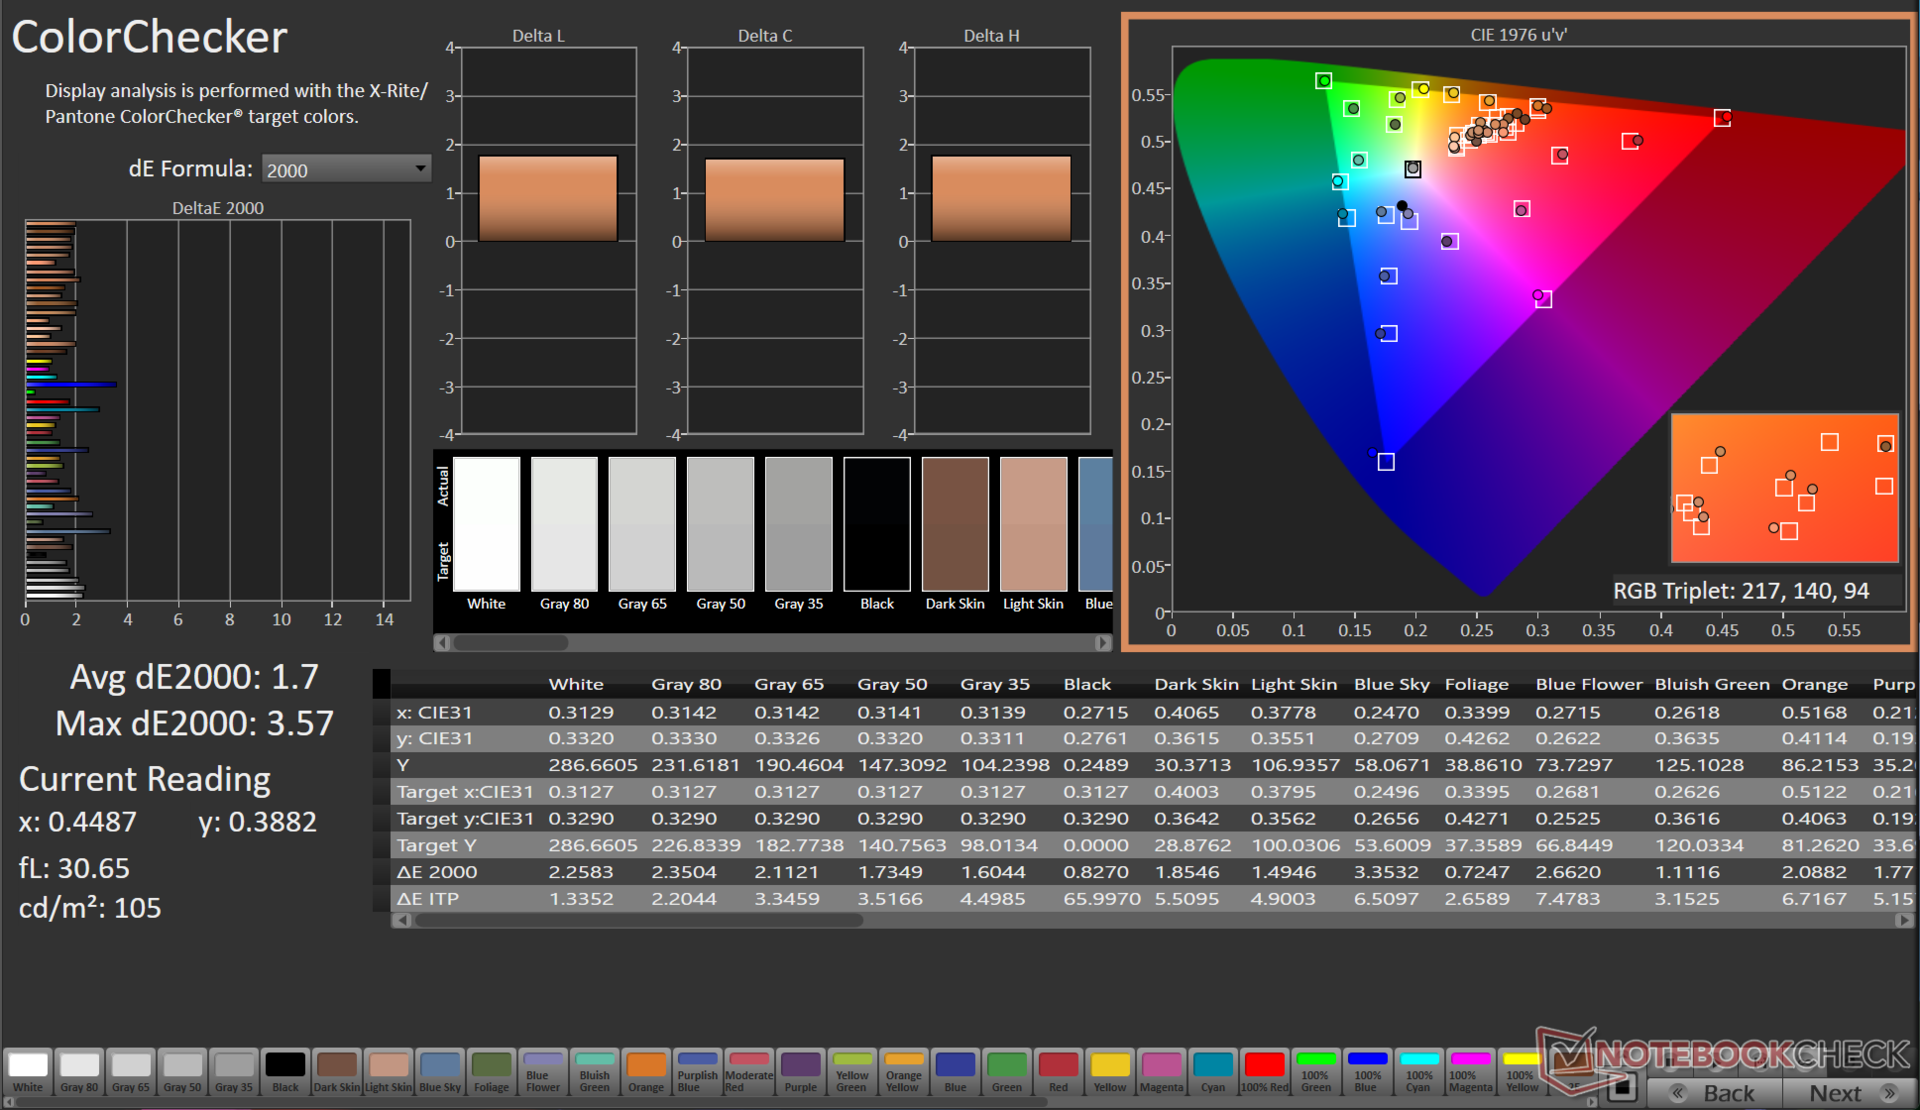
ΔE ColorChecker Calman: 1.7 | ∀{0.5-29.43 Ø4.71}
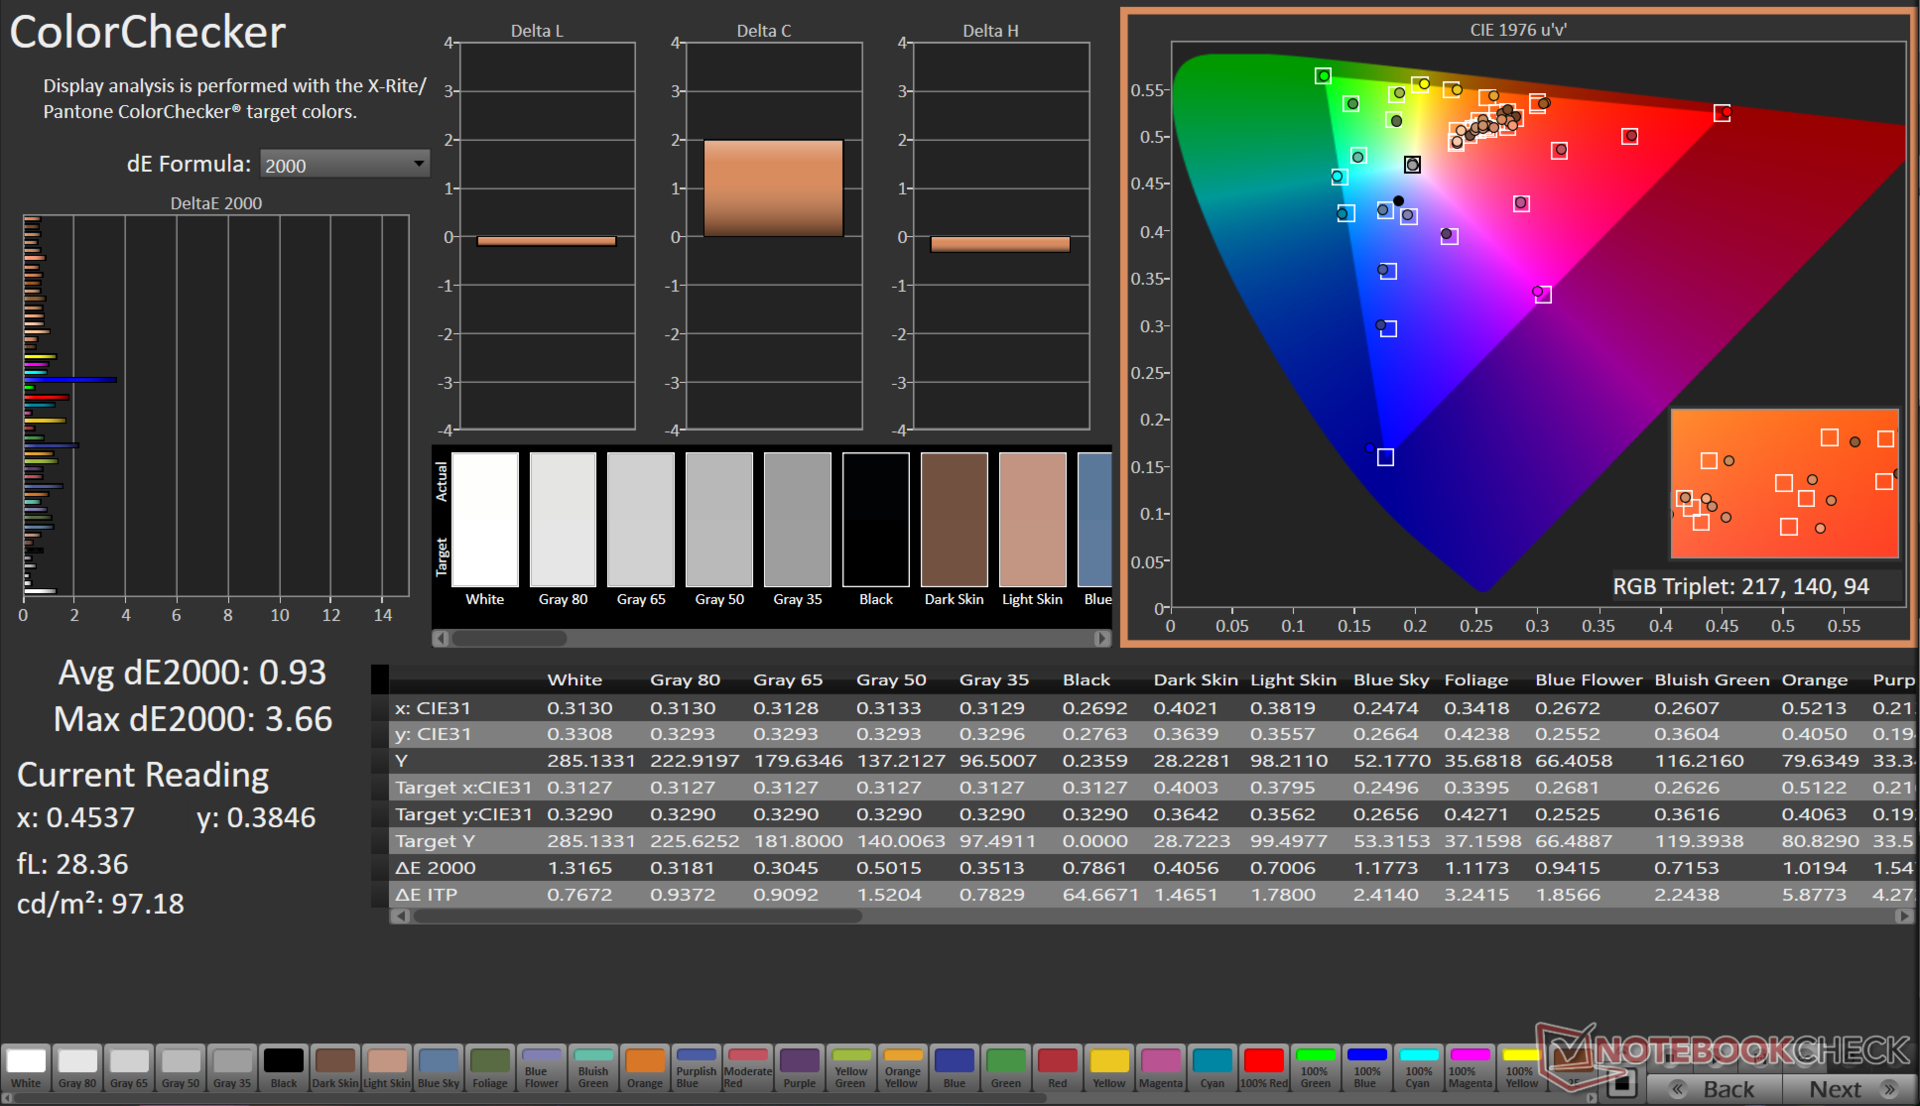
calibrated: 0.93
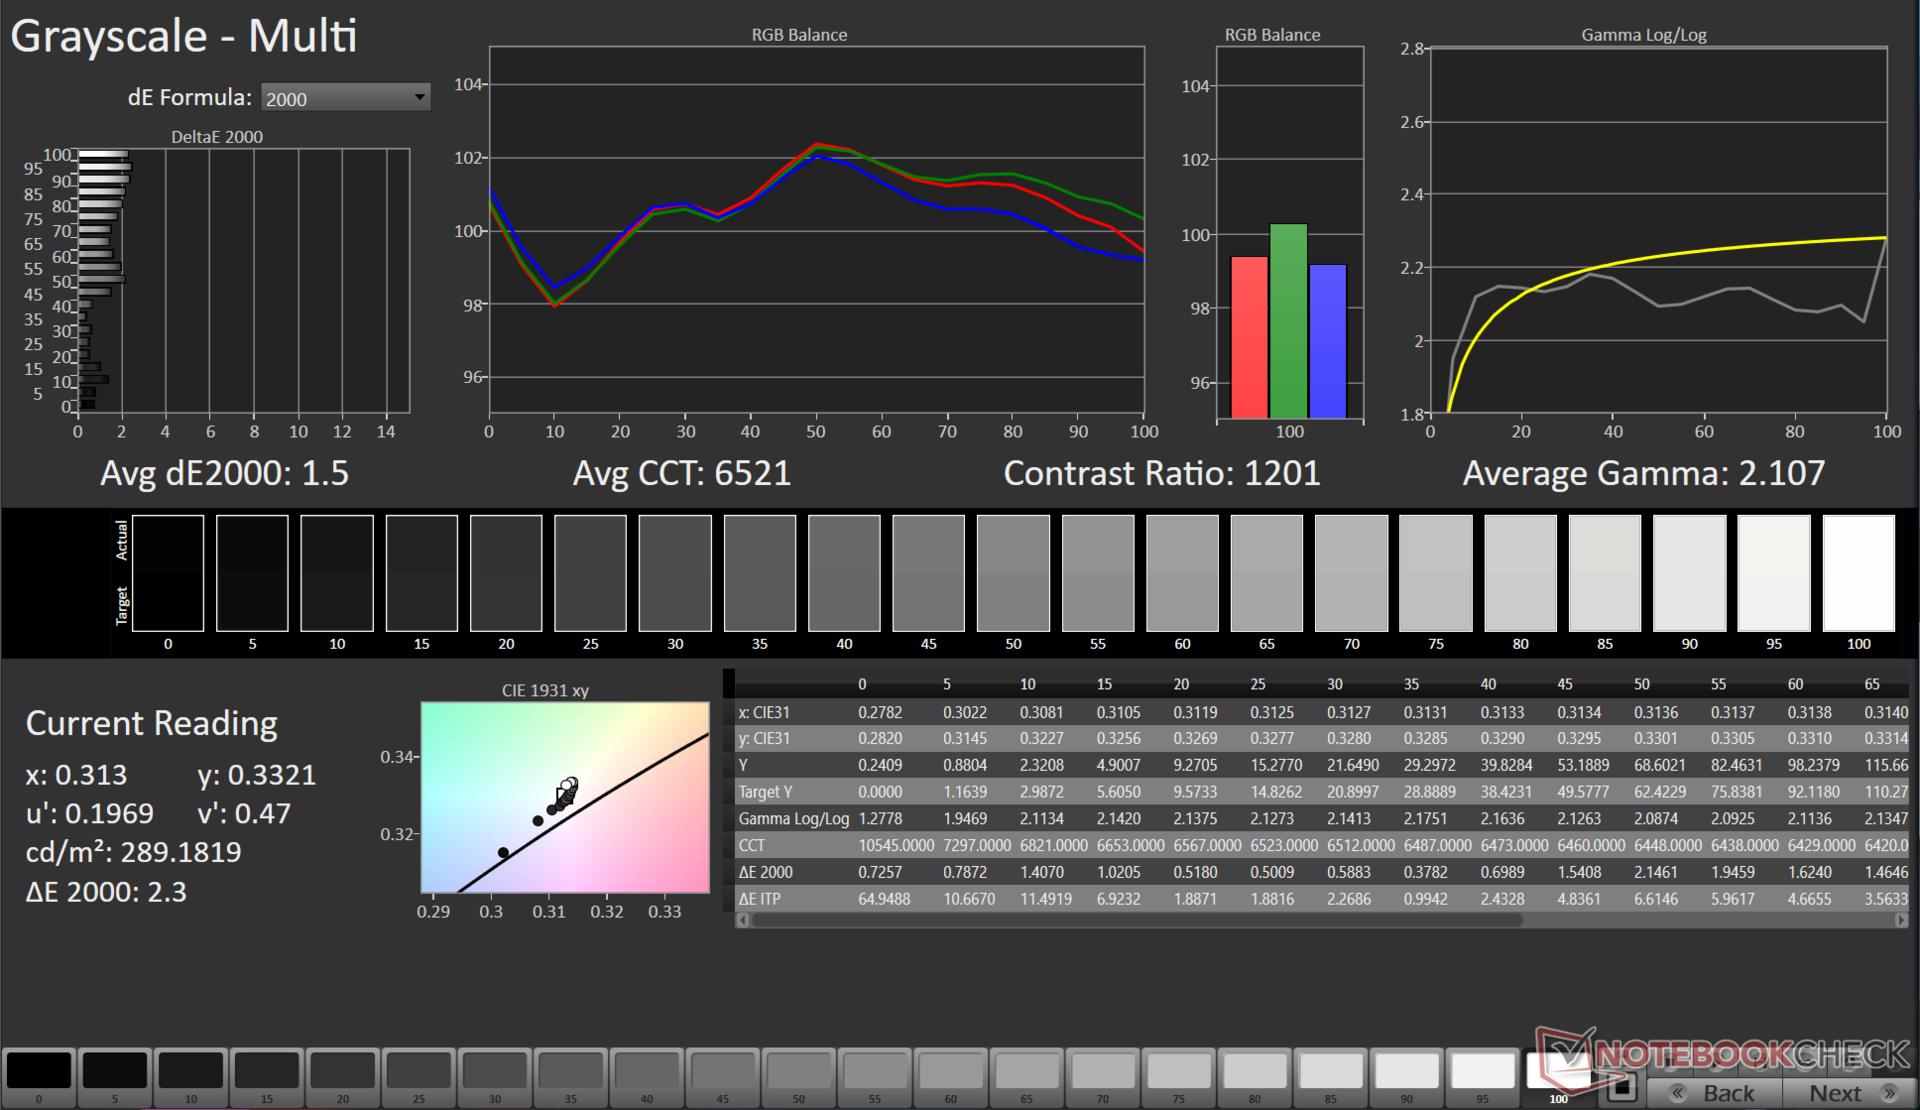
ΔE Greyscale Calman: 1.5 | ∀{0.09-98 Ø4.96}
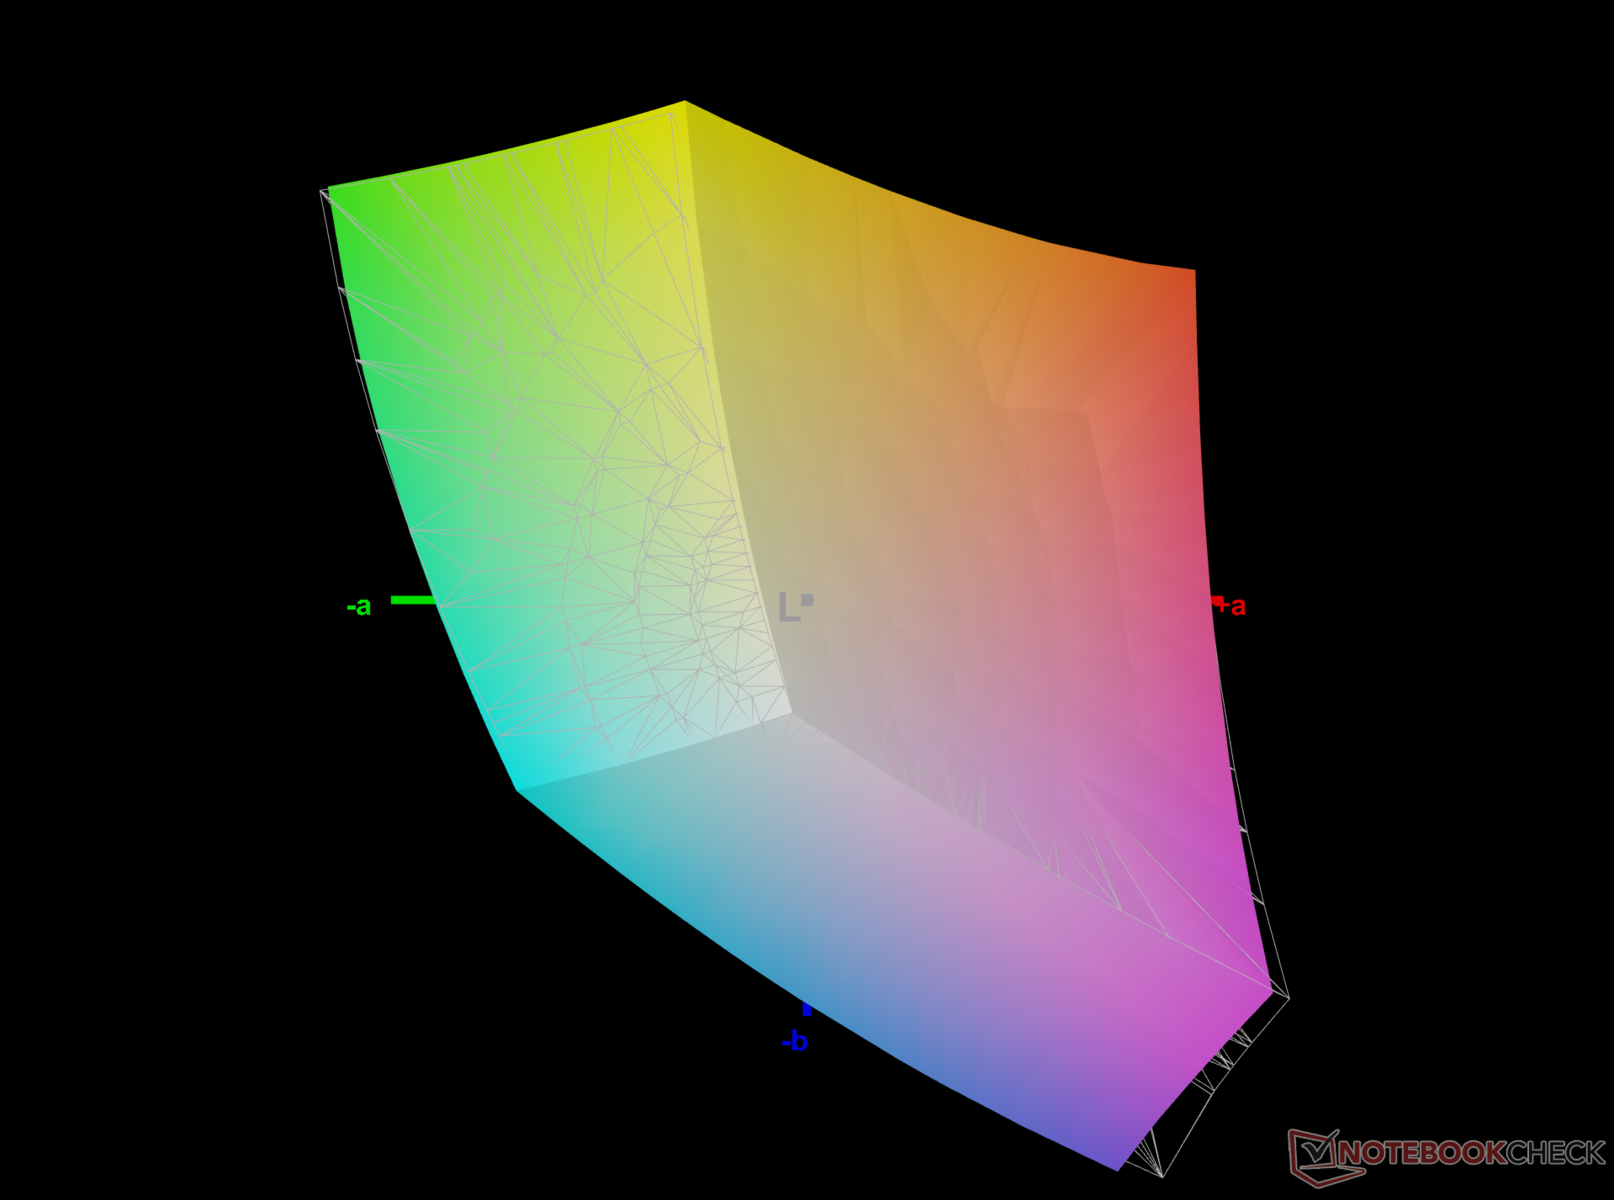
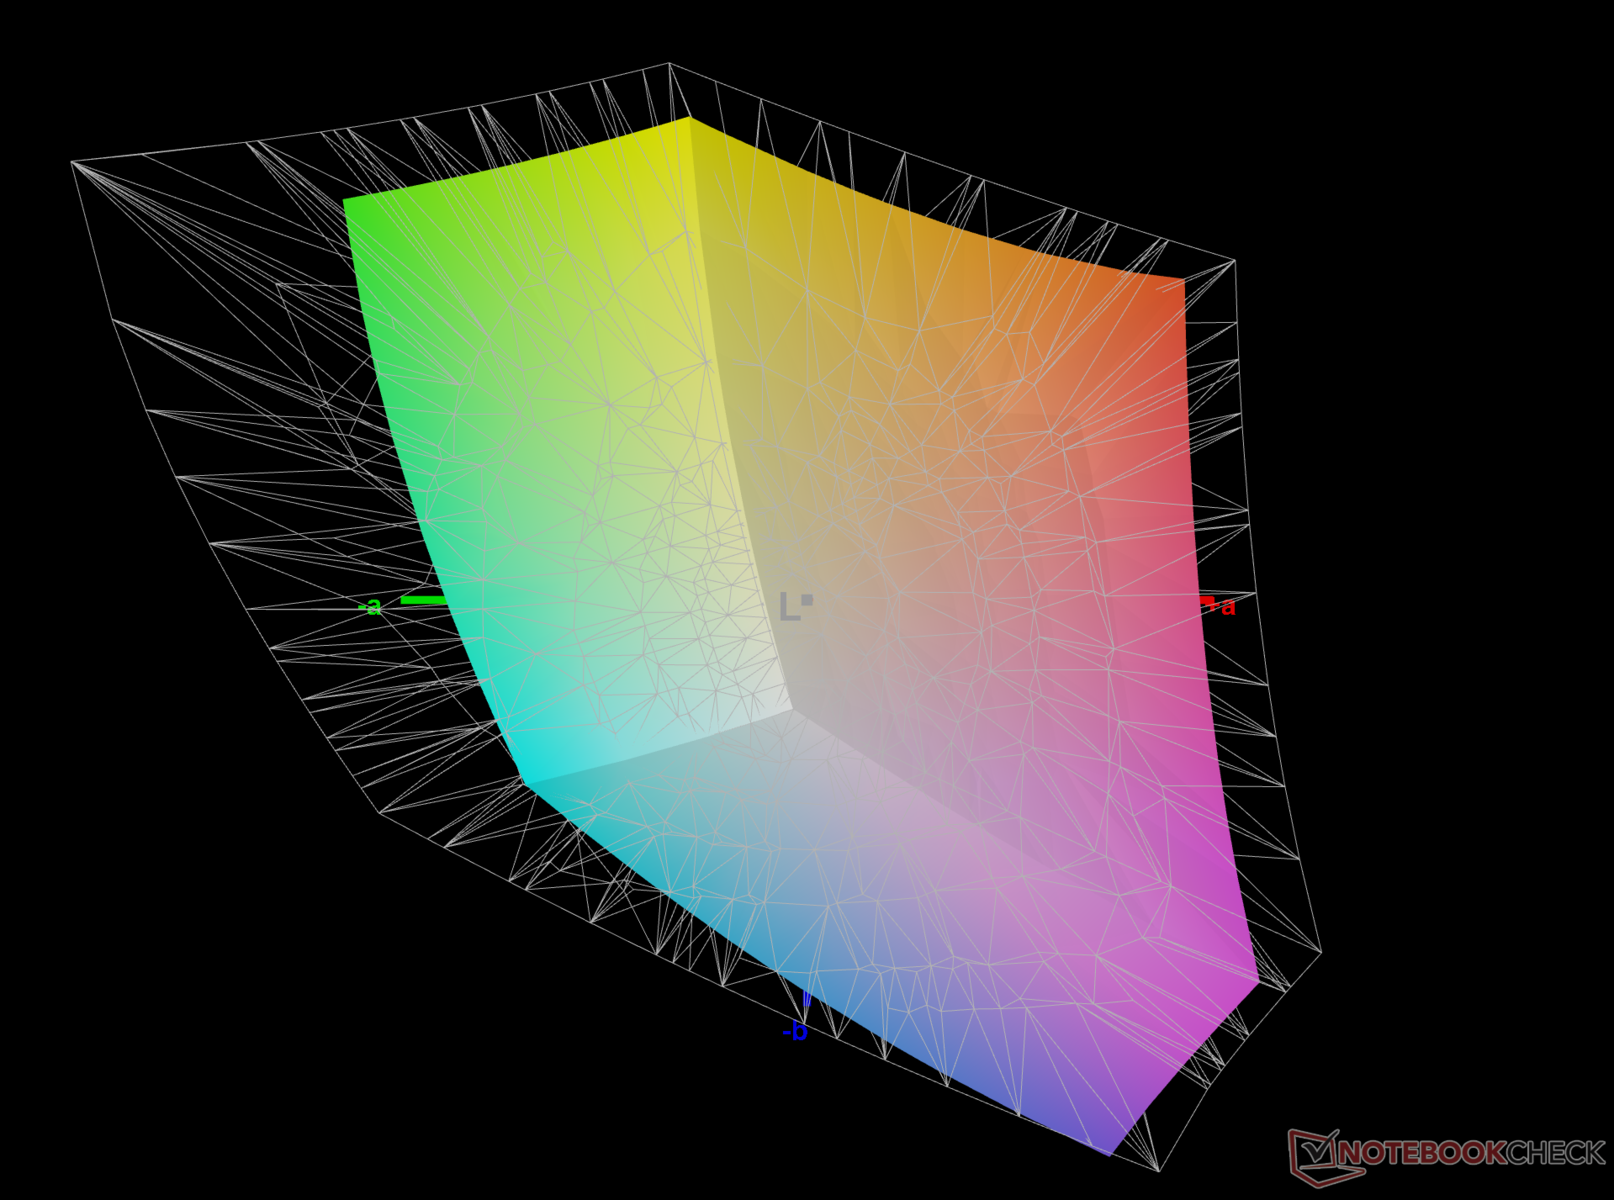
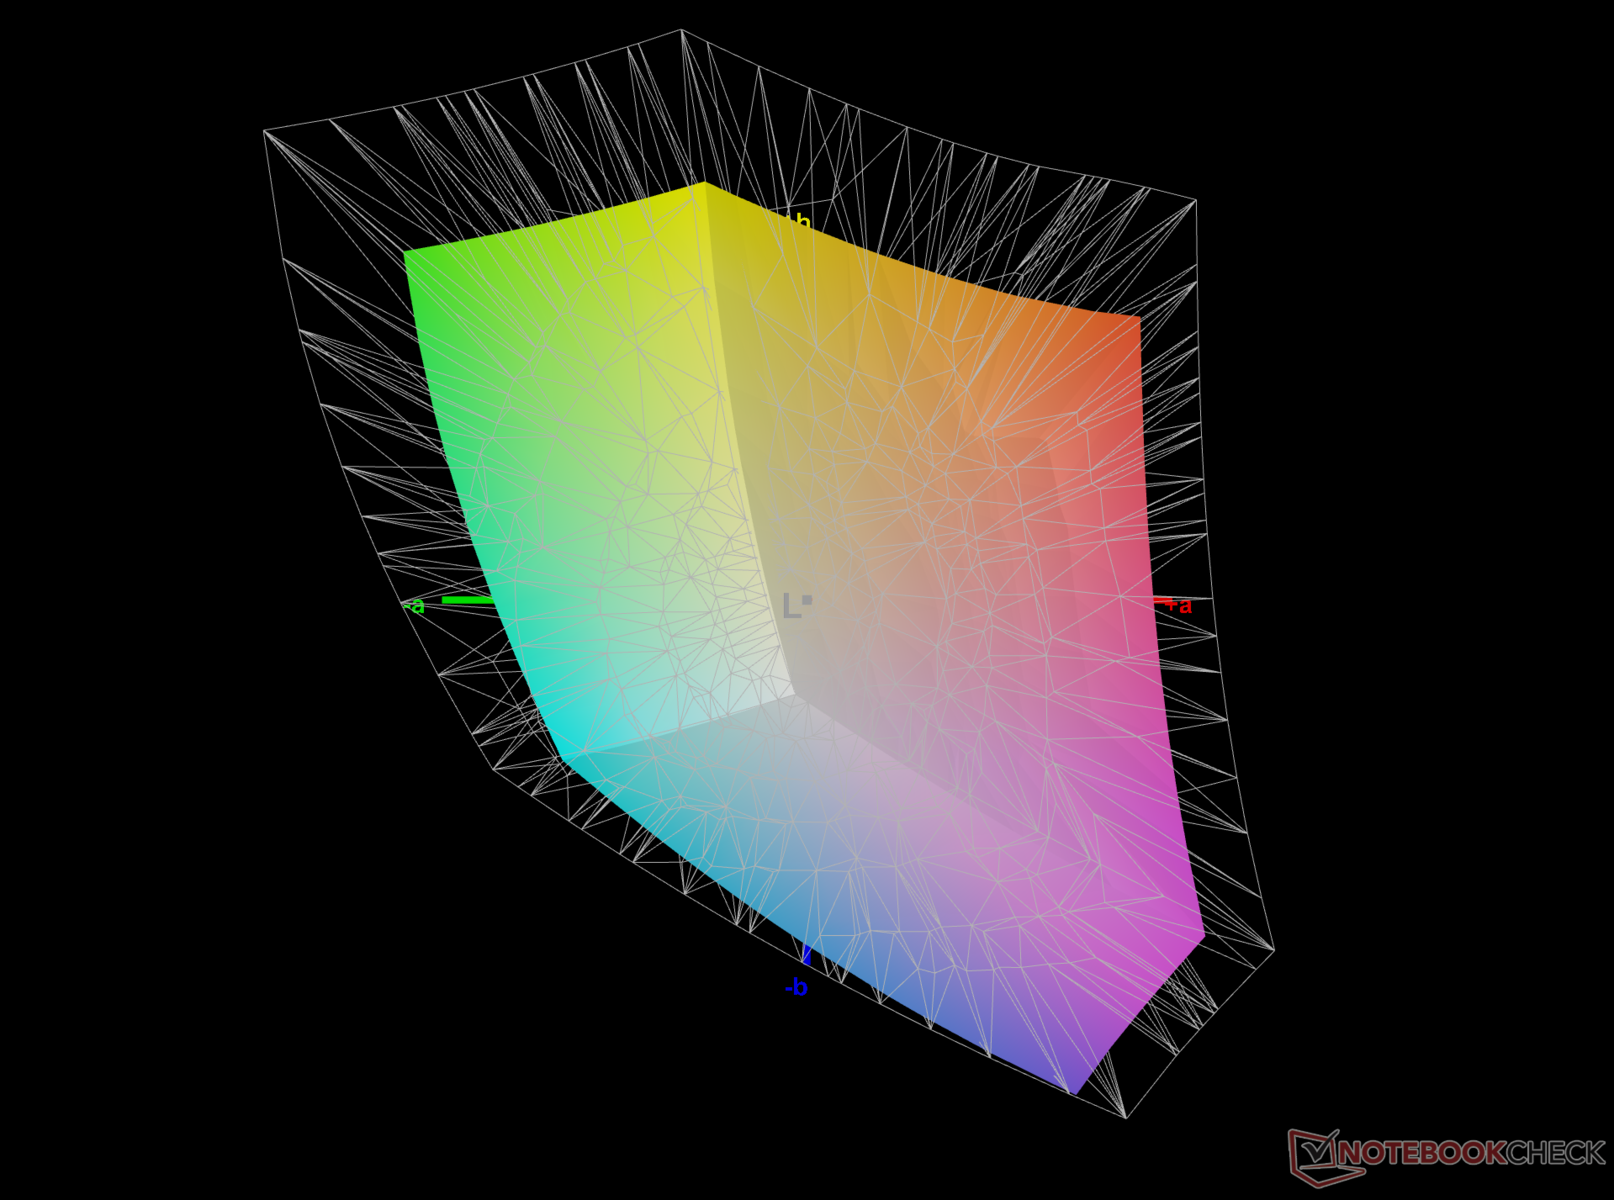
69.7% AdobeRGB 1998 (Argyll 3D)
97.5% sRGB (Argyll 3D)
67.5% Display P3 (Argyll 3D)
Gamma: 2.1
CCT: 6538 K
| HP Victus 16-r0076TX Chi Mei CMN1629, IPS, 1920x1080, 16.1" | Acer Nitro 16 AN16-41-R7YE AU Optronics B160UAN01.Q, IPS, 1920x1200, 16" | Dell G15 5530 AUO B156HAN, IPS, 1920x1080, 15.6" | Lenovo Legion Pro 5 16ARX8 (R5 7645HX, RTX 4050) CSOT T3 MNG007DA2-2, IPS, 2560x1600, 16" | Lenovo LOQ 15APH8 BOE NJ NE156FHM-NX3, IPS, 1920x1080, 15.6" | |
|---|---|---|---|---|---|
| Display | 11% | 5% | 4% | -39% | |
| Display P3 Coverage (%) | 67.5 | 80 19% | 73.1 8% | 71.6 6% | 40.2 -40% |
| sRGB Coverage (%) | 97.5 | 99.4 2% | 98.4 1% | 99.8 2% | 60.2 -38% |
| AdobeRGB 1998 Coverage (%) | 69.7 | 77.4 11% | 74.4 7% | 72.9 5% | 41.5 -40% |
| Response Times | -25% | 38% | -31% | -407% | |
| Response Time Grey 50% / Grey 80% * (ms) | 6.18 ? | 11.2 ? -81% | 3.39 ? 45% | 12 ? -94% | 42.7 ? -591% |
| Response Time Black / White * (ms) | 7.62 ? | 5.2 ? 32% | 5.35 ? 30% | 5.2 ? 32% | 24.5 ? -222% |
| PWM Frequency (Hz) | 21620 ? | ||||
| Screen | -67% | -74% | -1% | -85% | |
| Brightness middle (cd/m²) | 290 | 415 43% | 320 10% | 543 87% | 346.2 19% |
| Brightness (cd/m²) | 275 | 380 38% | 316 15% | 516 88% | 329 20% |
| Brightness Distribution (%) | 82 | 84 2% | 94 15% | 87 6% | 81 -1% |
| Black Level * (cd/m²) | 0.21 | 0.36 -71% | 0.21 -0% | 0.58 -176% | 0.31 -48% |
| Contrast (:1) | 1381 | 1153 -17% | 1524 10% | 936 -32% | 1117 -19% |
| Colorchecker dE 2000 * | 1.7 | 4.71 -177% | 4.55 -168% | 1.35 21% | 4.19 -146% |
| Colorchecker dE 2000 max. * | 3.57 | 6.98 -96% | 9.83 -175% | 3.22 10% | 19.19 -438% |
| Colorchecker dE 2000 calibrated * | 0.93 | 2.68 -188% | 1.51 -62% | 1.31 -41% | 1.66 -78% |
| Greyscale dE 2000 * | 1.5 | 3.6 -140% | 6.2 -313% | 1.03 31% | 2.6 -73% |
| Gamma | 2.1 105% | 2.182 101% | 2.07 106% | 2.38 92% | 2.19 100% |
| CCT | 6538 99% | 7153 91% | 6479 100% | 6452 101% | 6749 96% |
| Moyenne finale (programmes/paramètres) | -27% /
-45% | -10% /
-41% | -9% /
-4% | -177% /
-121% |
* ... Moindre est la valeur, meilleures sont les performances
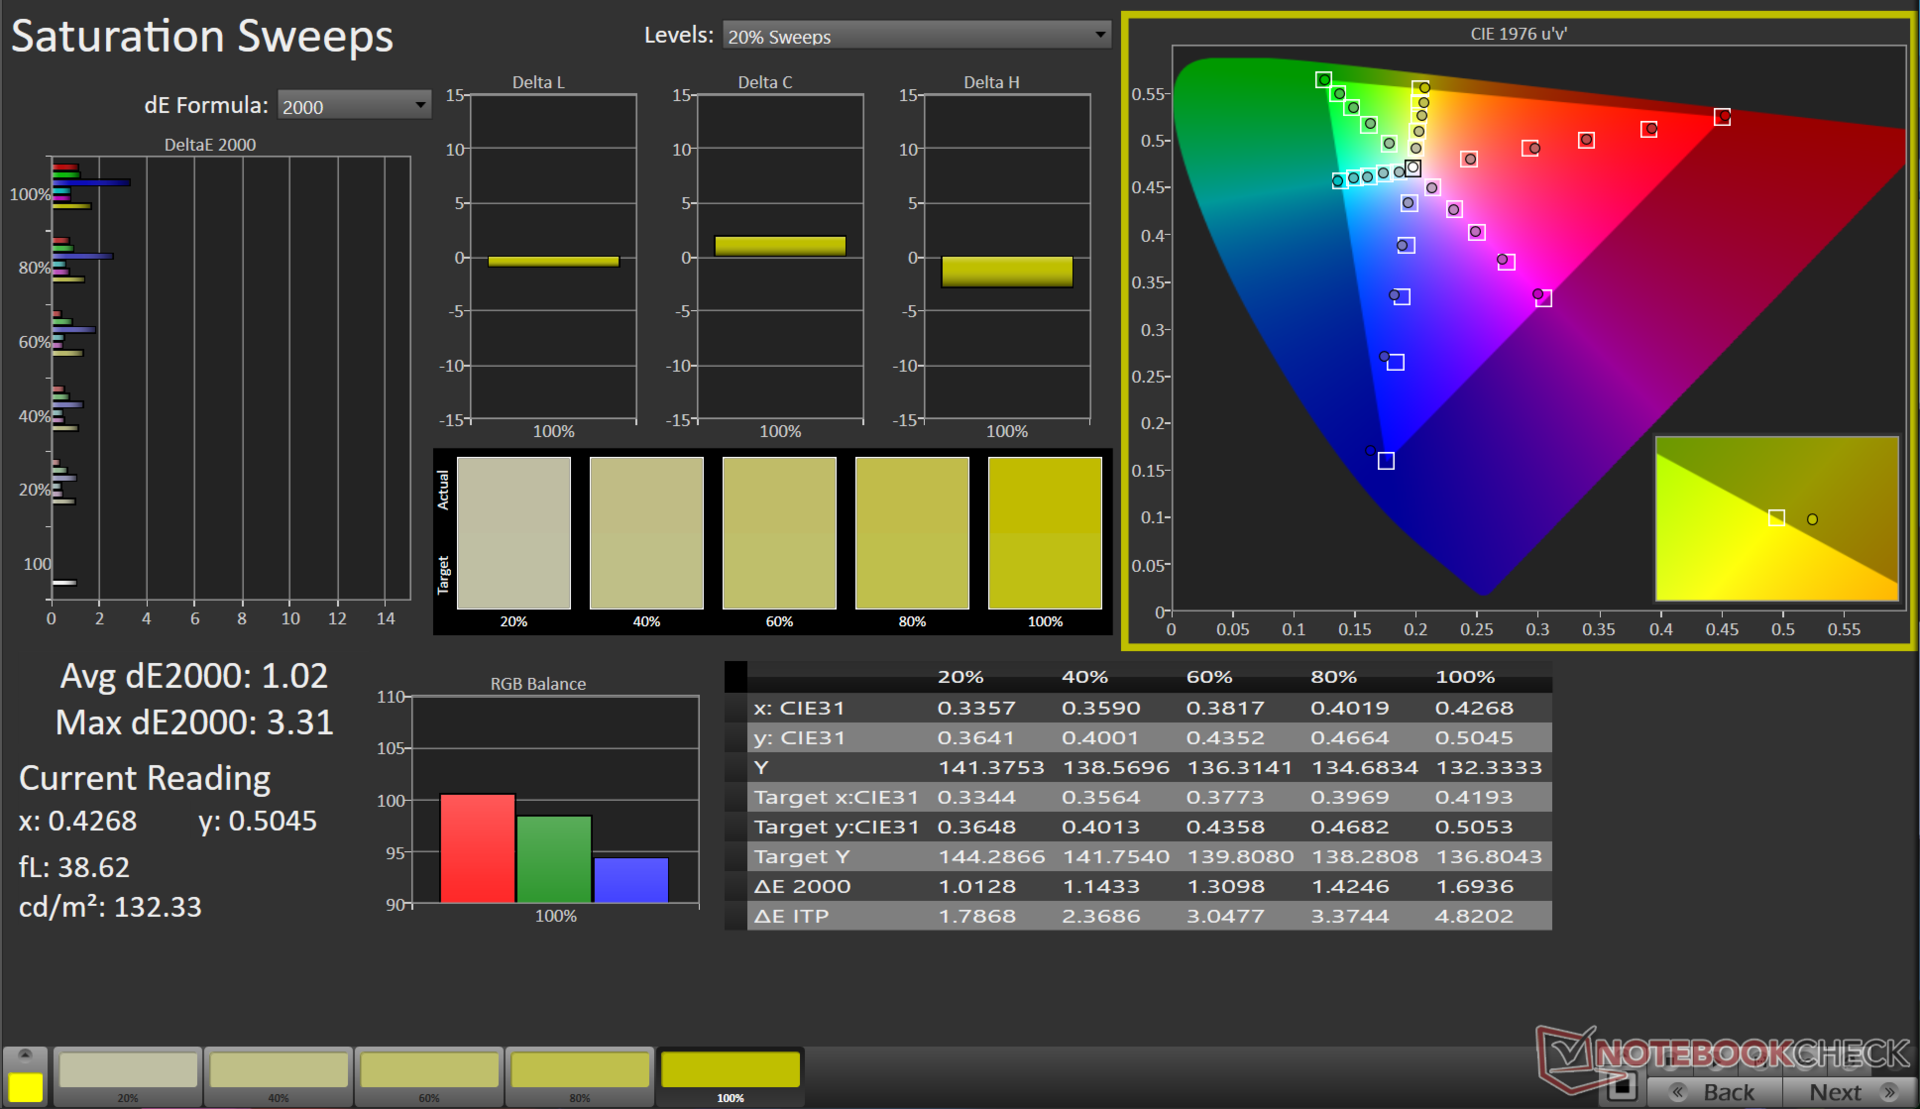
Le HP Victus 16 fait l'impasse sur la précision des couleurs pour offrir un taux de rafraîchissement plus élevé. Il couvre 97,5 % de la gamme de couleurs sRGB, 69,7 % de la gamme Adobe RGB et 67,5 % de la gamme DCI-P3. Comme beaucoup d'écrans, il a du mal à reproduire les différentes nuances de bleu.
Temps de réponse de l'écran
| ↔ Temps de réponse noir à blanc | ||
|---|---|---|
| 7.62 ms ... hausse ↗ et chute ↘ combinées | ↗ 4.07 ms hausse | 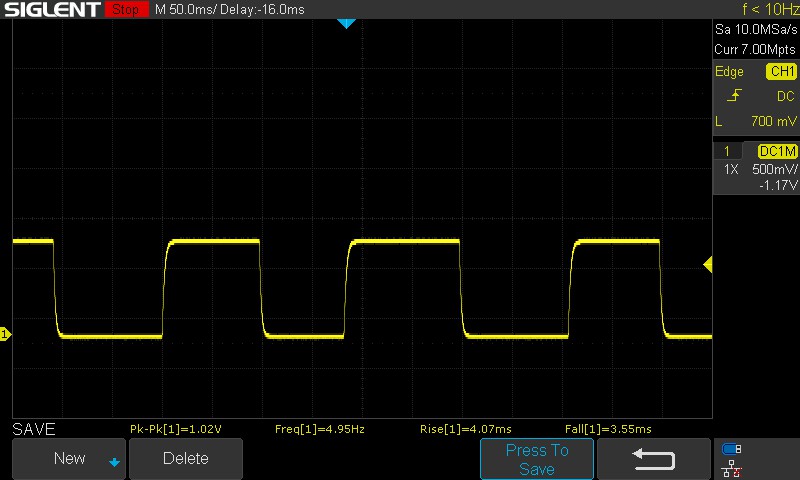 |
| ↘ 3.55 ms chute | ||
| L'écran montre de très faibles temps de réponse, parfait pour le jeu. En comparaison, tous les appareils testés affichent entre 0.1 (minimum) et 240 (maximum) ms. » 22 % des appareils testés affichent de meilleures performances. Cela signifie que les latences relevées sont meilleures que la moyenne (19.8 ms) de tous les appareils testés. | ||
| ↔ Temps de réponse gris 50% à gris 80% | ||
| 6.18 ms ... hausse ↗ et chute ↘ combinées | ↗ 3.01 ms hausse | 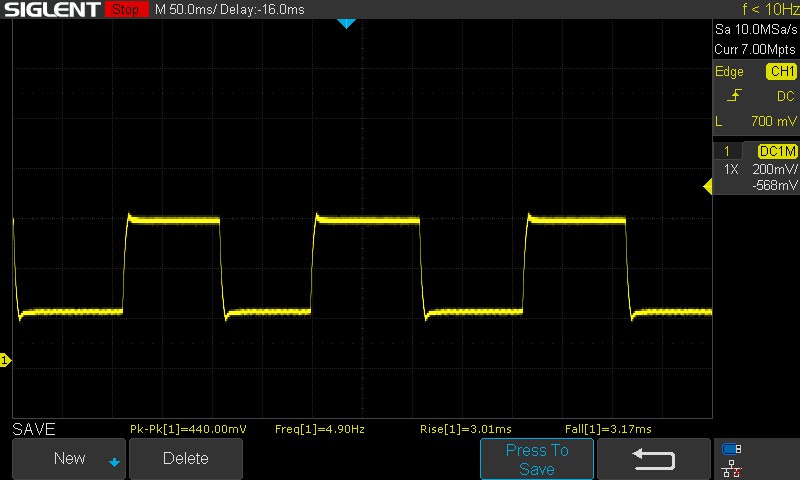 |
| ↘ 3.17 ms chute | ||
| L'écran montre de très faibles temps de réponse, parfait pour le jeu. En comparaison, tous les appareils testés affichent entre 0.165 (minimum) et 636 (maximum) ms. » 19 % des appareils testés affichent de meilleures performances. Cela signifie que les latences relevées sont meilleures que la moyenne (30.9 ms) de tous les appareils testés. | ||
Scintillement / MLI (Modulation de largeur d'impulsion)
| Scintillement / MLI (Modulation de largeur d'impulsion) non décelé | ≤ 100 Niveau de luminosité | 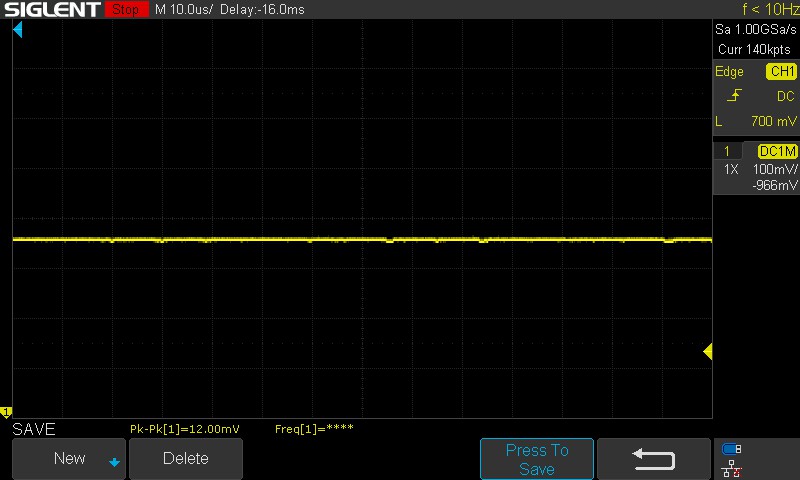 | |
En comparaison, 52 % des appareils testés n'emploient pas MDI pour assombrir leur écran. Nous avons relevé une moyenne à 7748 (minimum : 5 - maximum : 343500) Hz dans le cas où une MDI était active. | |||
Le temps de réponse annoncé par HP (de gris à gris) est de 7 ms, ce qui est confirmé par nos tests, qui ont révélé une valeur de 6,18 ms. De même, les temps de réponse du noir au blanc étaient de 7,62 ms, ce qui est respectable.
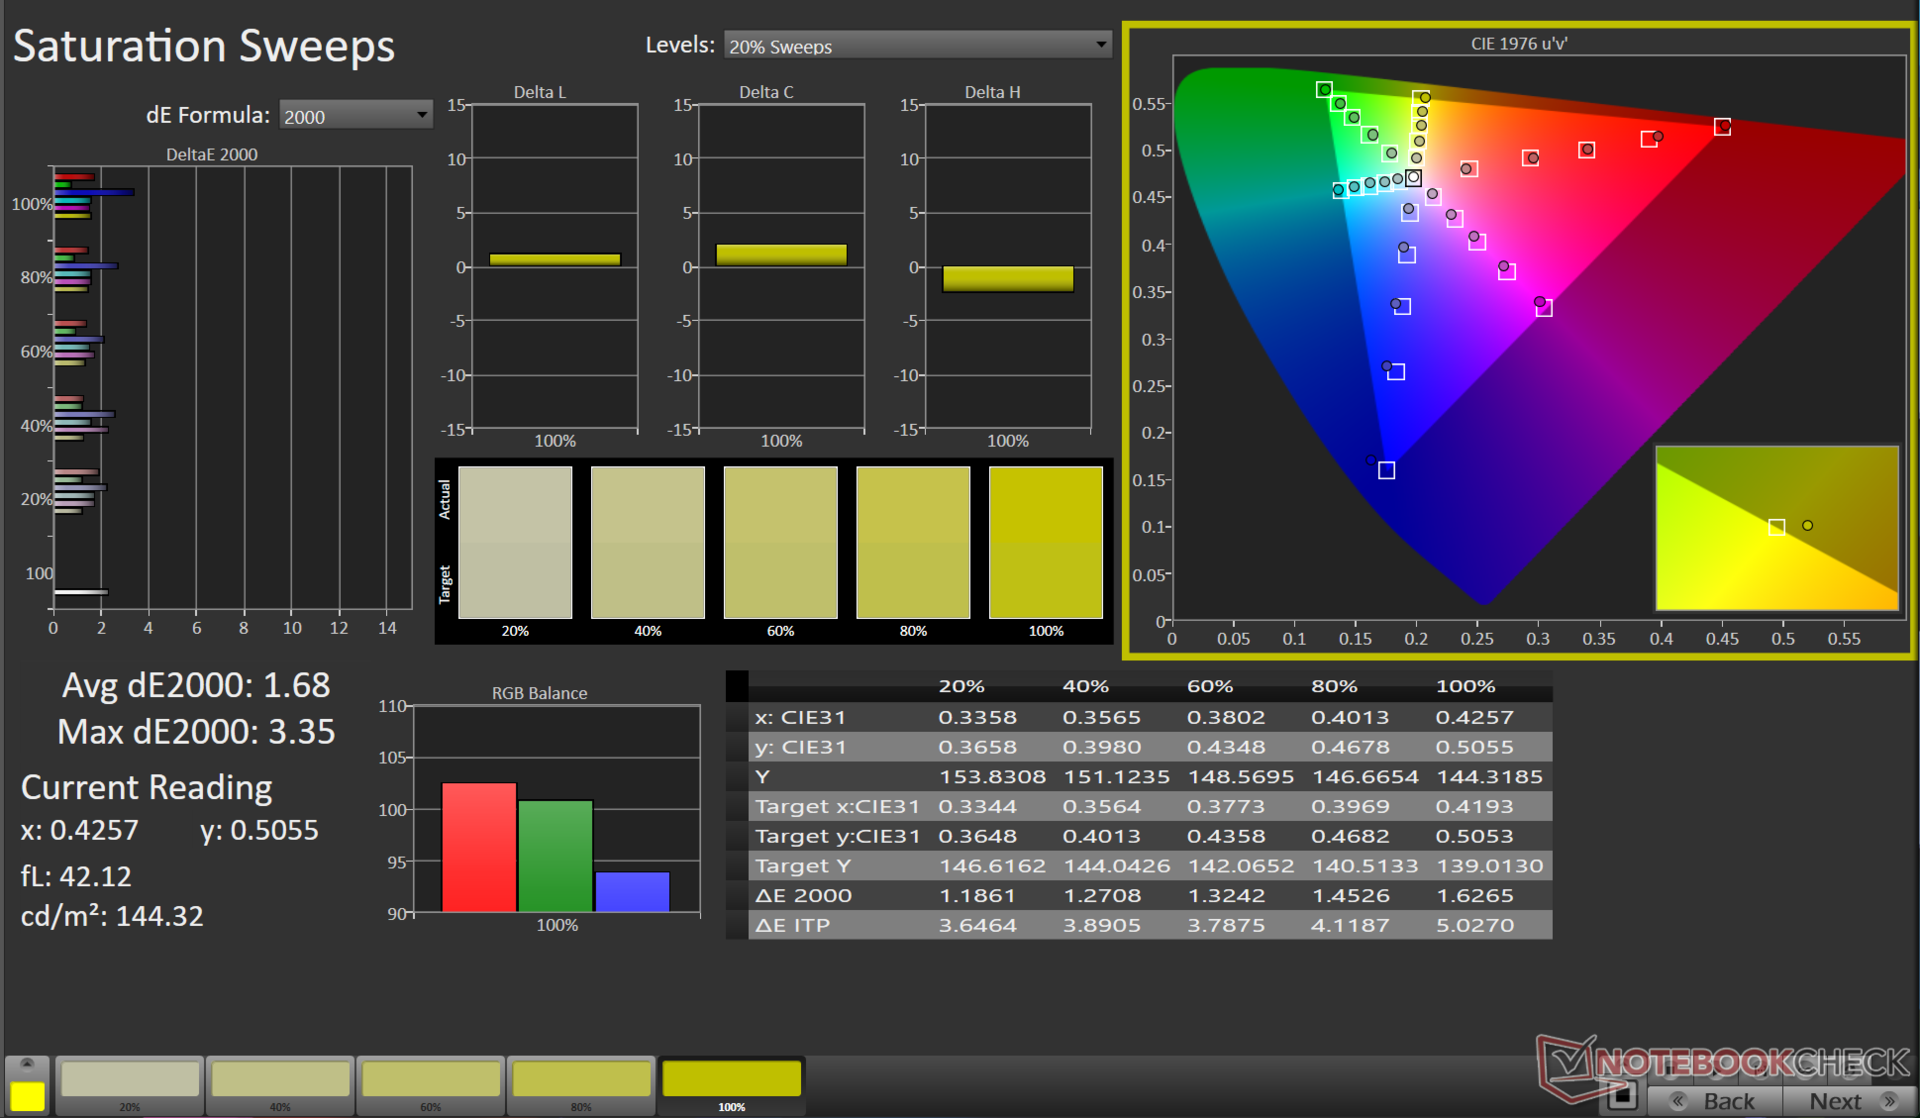
Un travail avec un spectrophotomètre X-rite i1Basic Pro 3 et le logiciel d'étalonnage Calman de Portrait Displays n'a donné que des résultats légèrement meilleurs, les valeurs de déviation des niveaux de gris, de ColourChecker et de Saturation Sweep Delta E ne s'améliorant que de façon marginale.
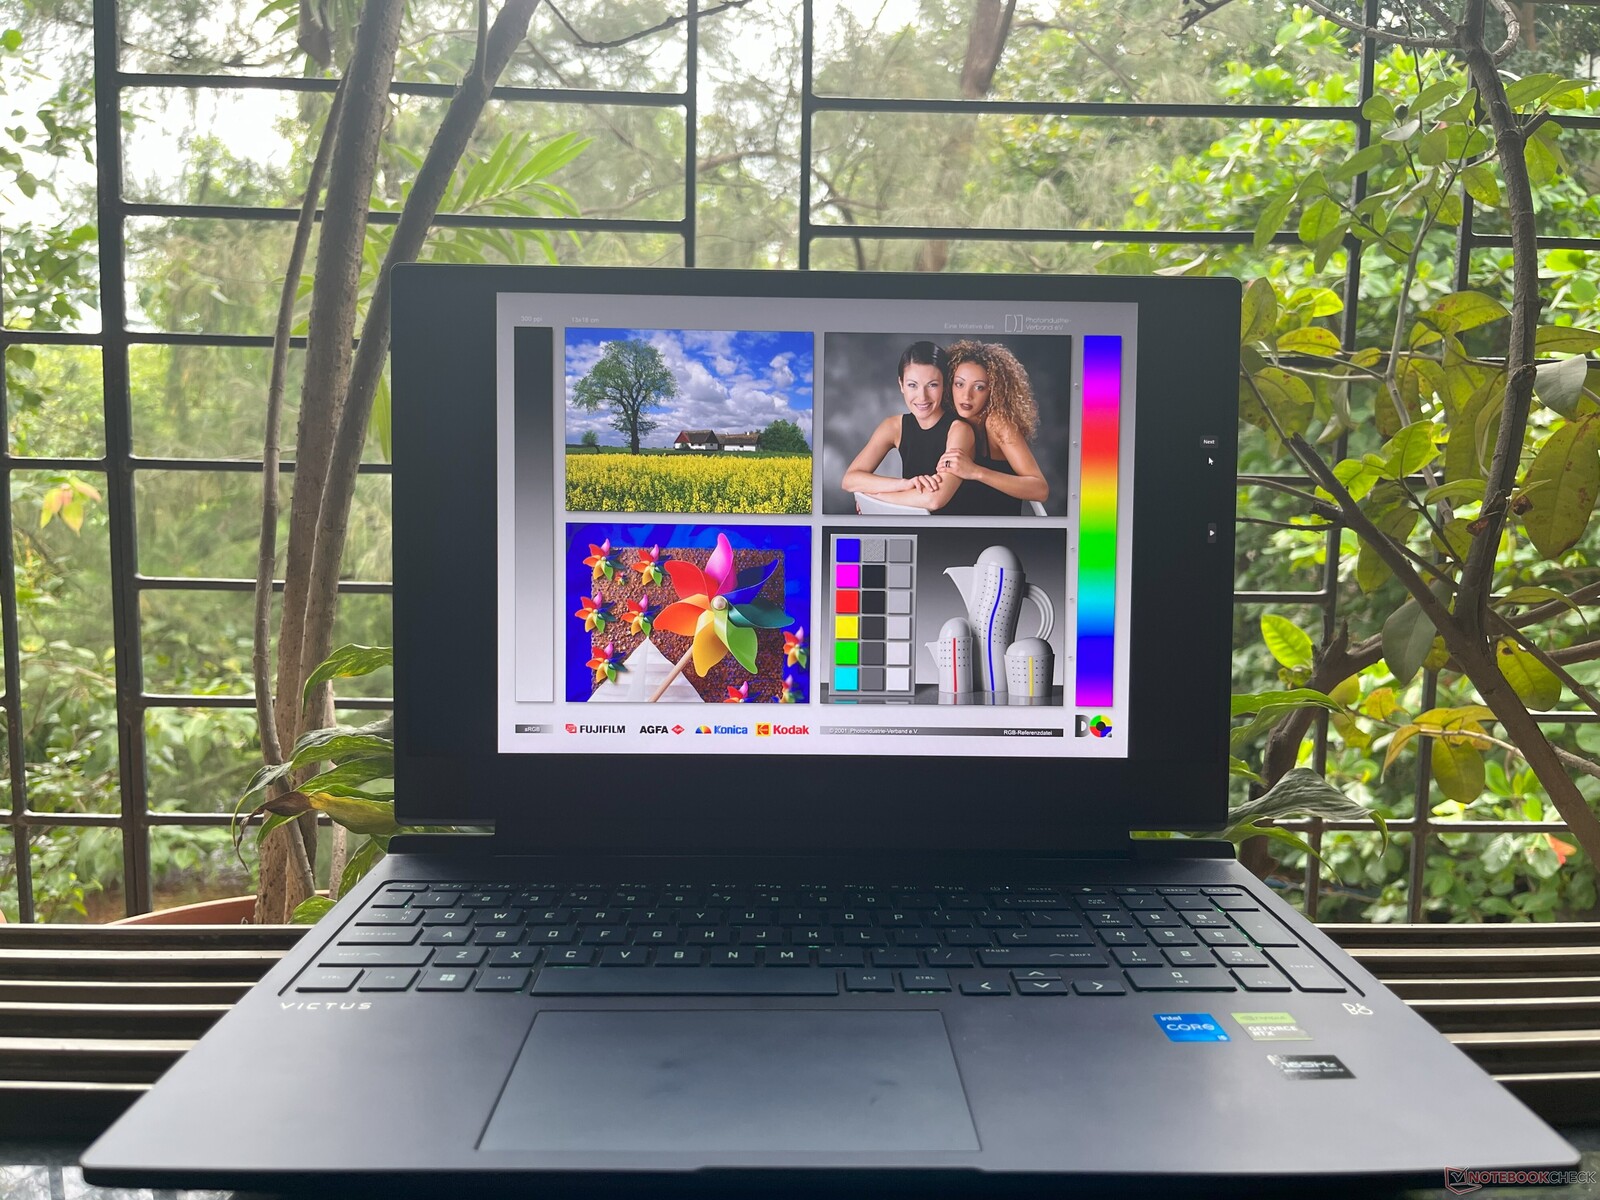
Un écran IPS garantit généralement des angles de vision corrects. Cependant, ce n'est pas le cas avec la dalle Chi Mei du HP Omen 16. Il y a une perte remarquable de détails lorsque l'on regarde l'écran sous des angles extrêmes.
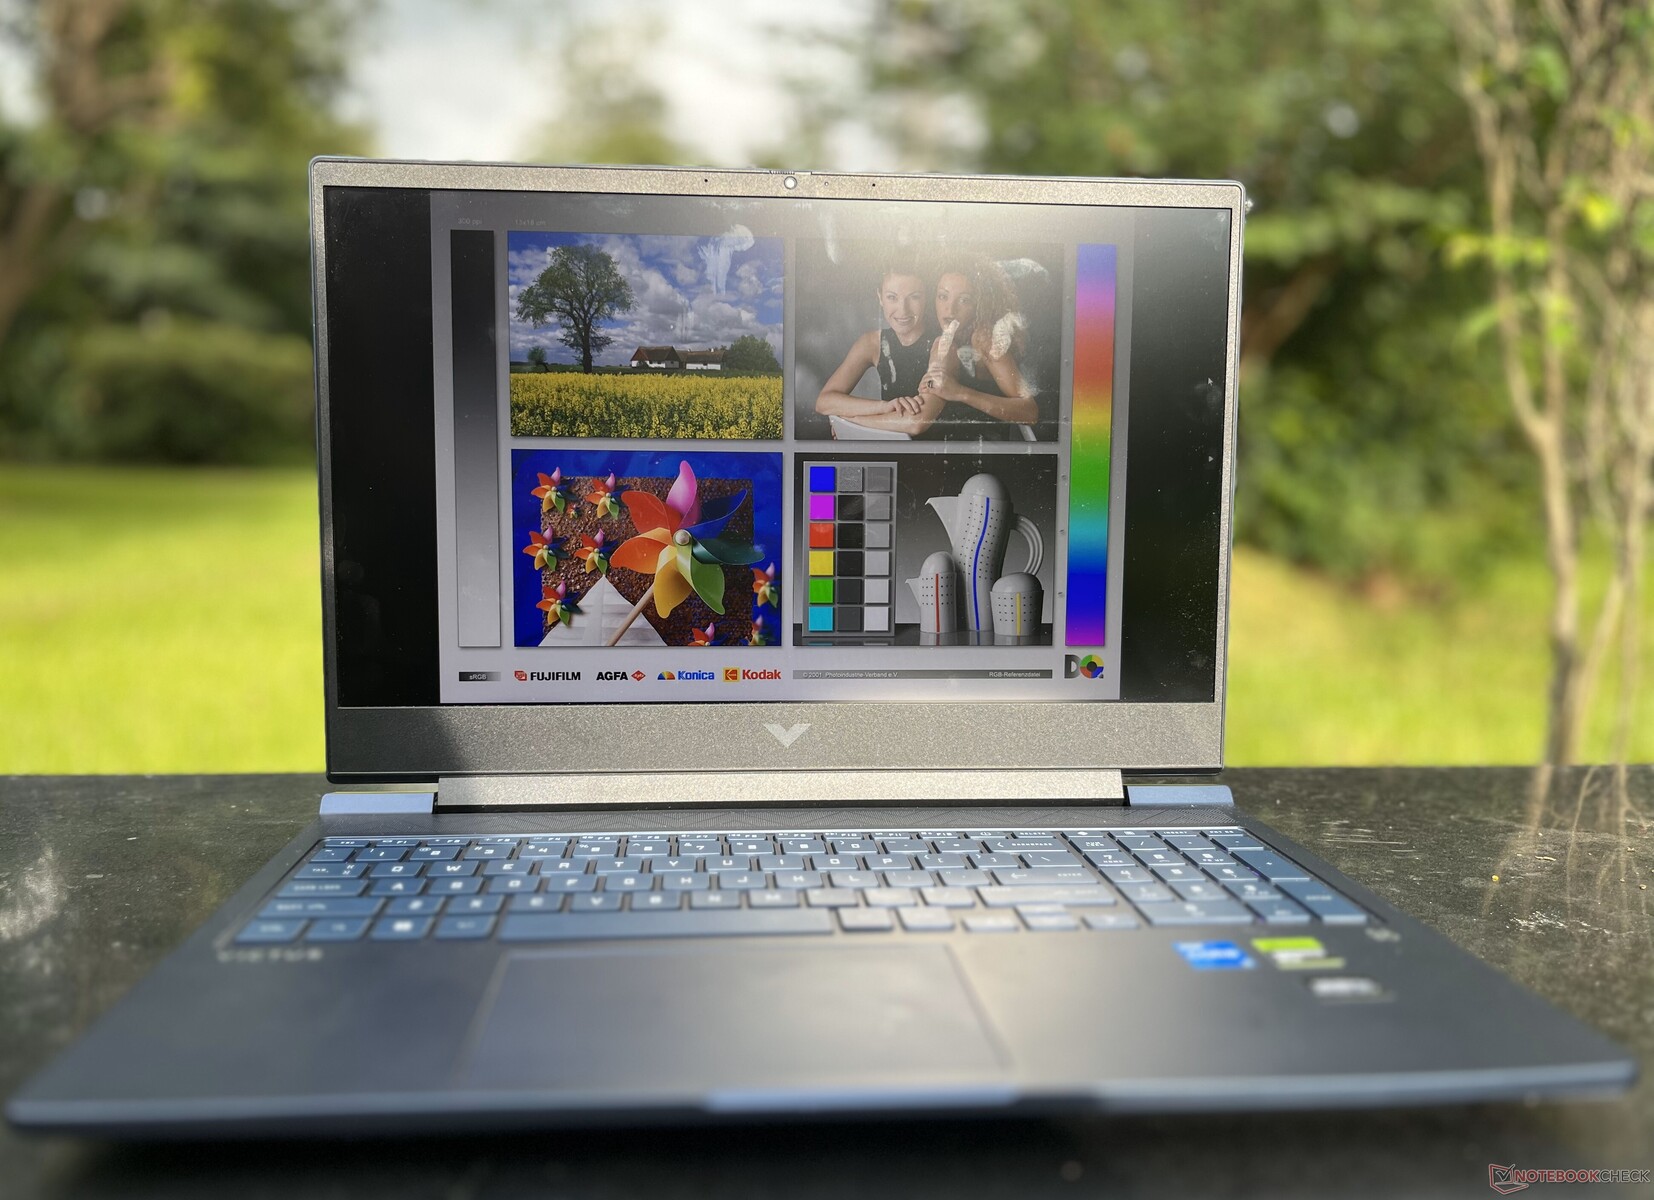
L'affichage en extérieur est supérieur à la moyenne, surtout pour un appareil avec seulement 300 nits de luminosité. La perte de détails est minime à l'ombre et en plein soleil. Cependant, nous recommandons de garder l'ordinateur portable à l'intérieur, car il n'est pas vraiment portable.

Performance : Raptor Lake et Ada Lovelace se font remarquer
Le HP Victus 16 est disponible en plusieurs configurations. La nôtre est la variante de base avec un Intel Core i5-13500HX et un GPU GPU pour ordinateur portable Nvidia GeForce RTX 4050. Il est possible d'opter pour un GPU GeForce RTX 4060 et RTX 4070 si nécessaire.
Ceux qui recherchent un processeur plus puissant peuvent opter pour le Core i7-13700HX qui ne peut être associé qu'à une RTX 4070 ( GeForce ). Les utilisateurs à la recherche de mémoire supplémentaire peuvent également opter pour une version avec 32 Go de RAM et 1 To d'espace de stockage.
Conditions d'essai
Nous avons choisi le plan "Performance" pour pousser le matériel à ses limites. Certains tests ont été effectués sur la batterie en mode "Eco" pour vérifier la dégradation des performances. HWInfo n'étant pas en mesure d'afficher les informations PL1 et PL2 correctes pour les différents profils, nous avons obtenu ces valeurs lors du test en boucle Cinebench R15.
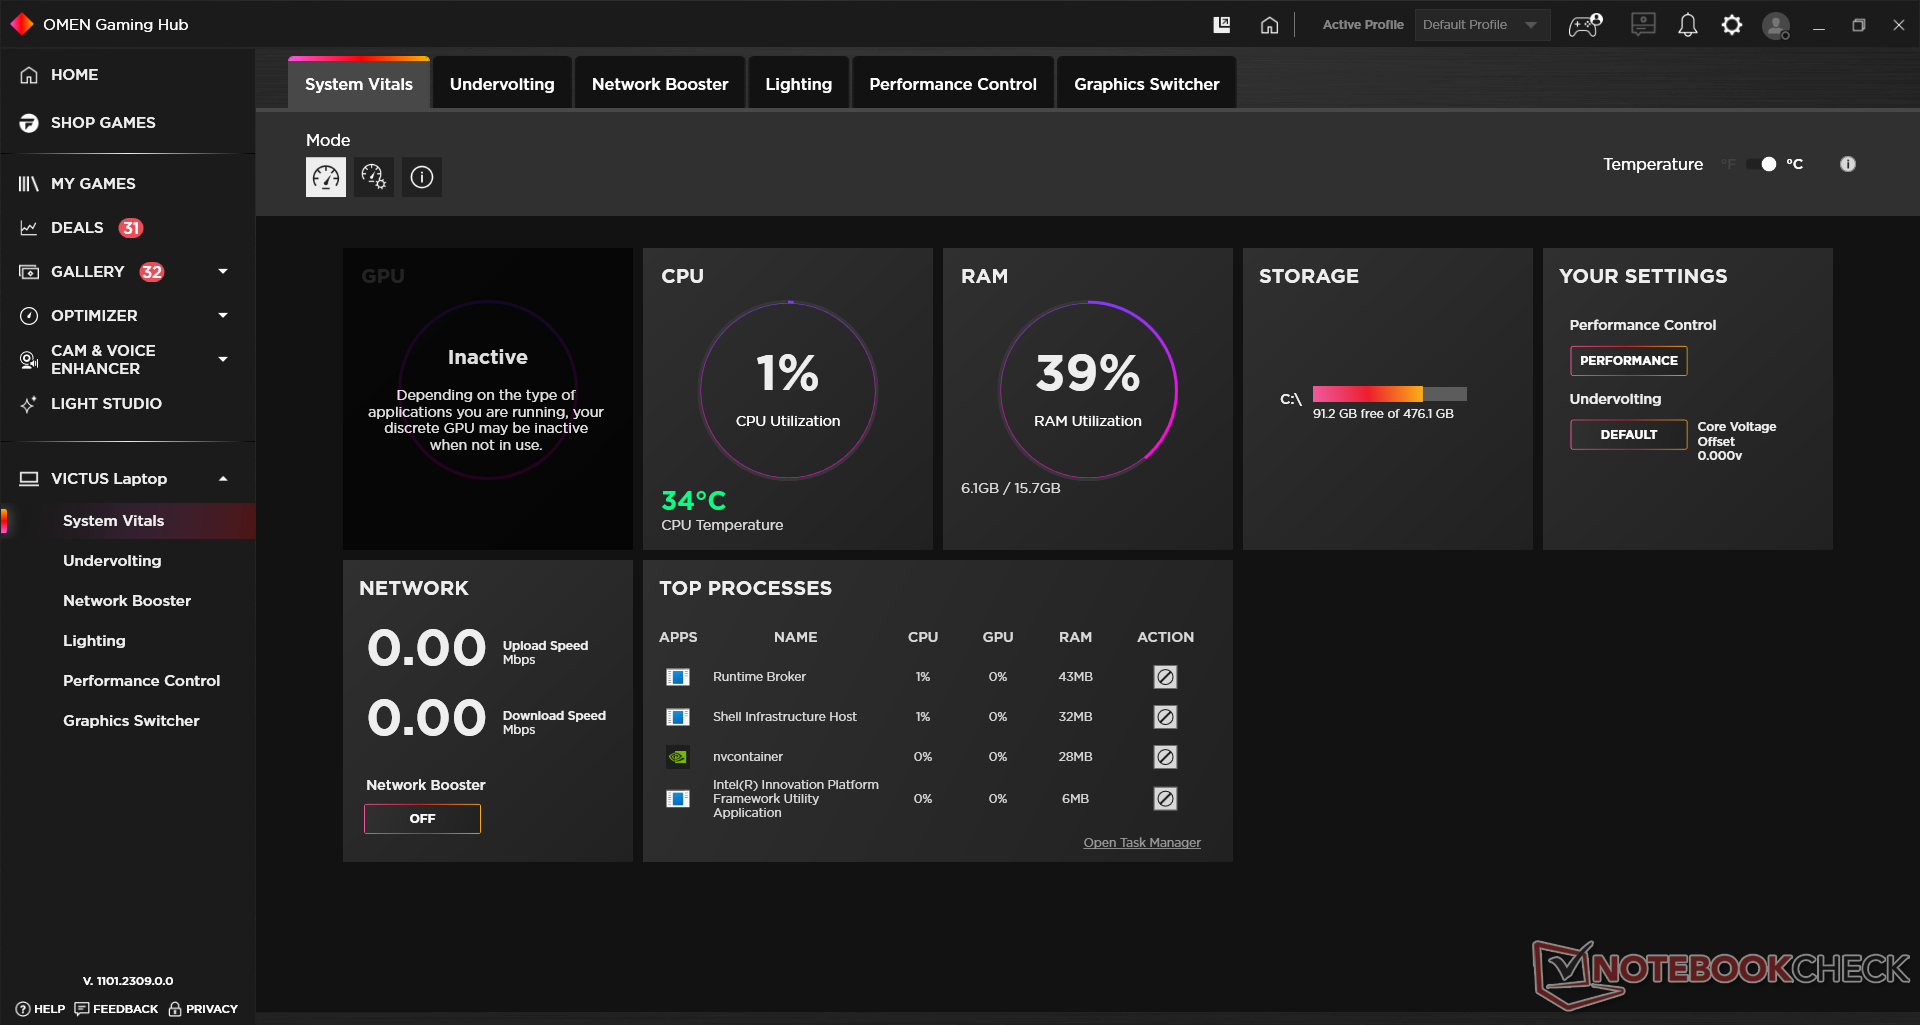
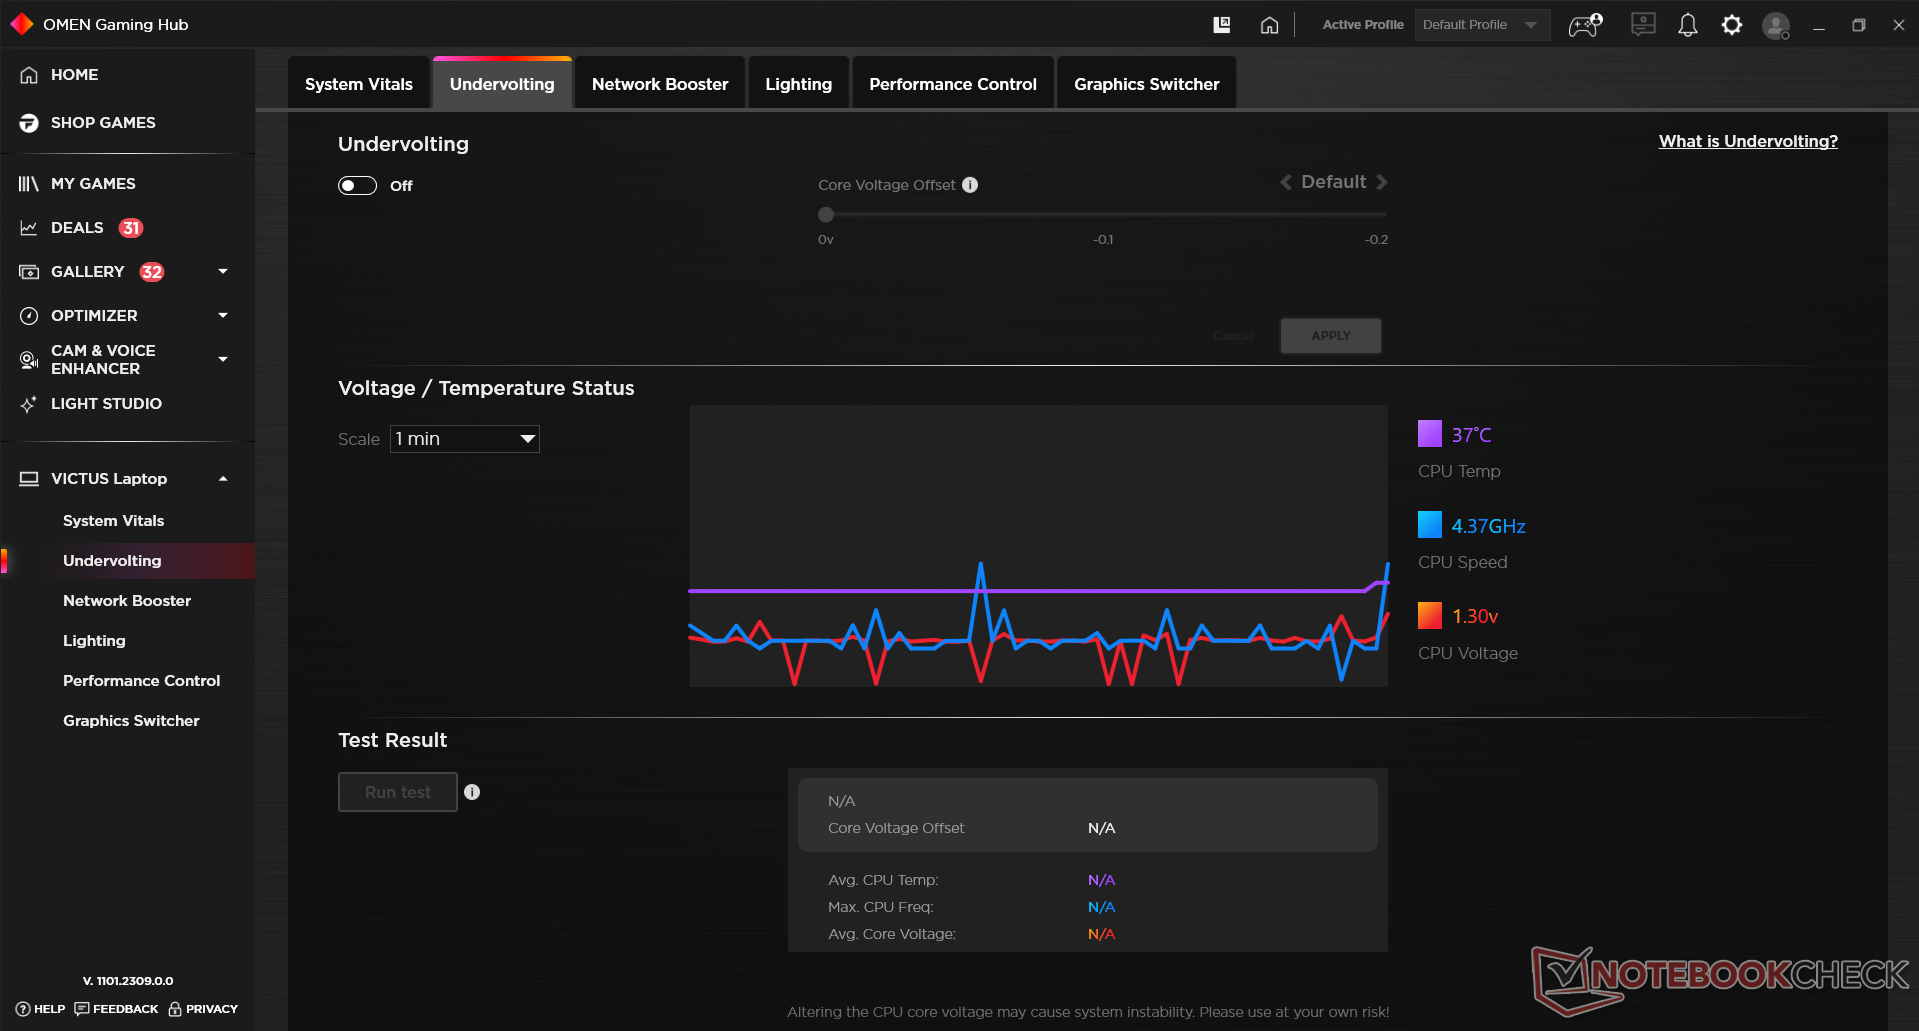
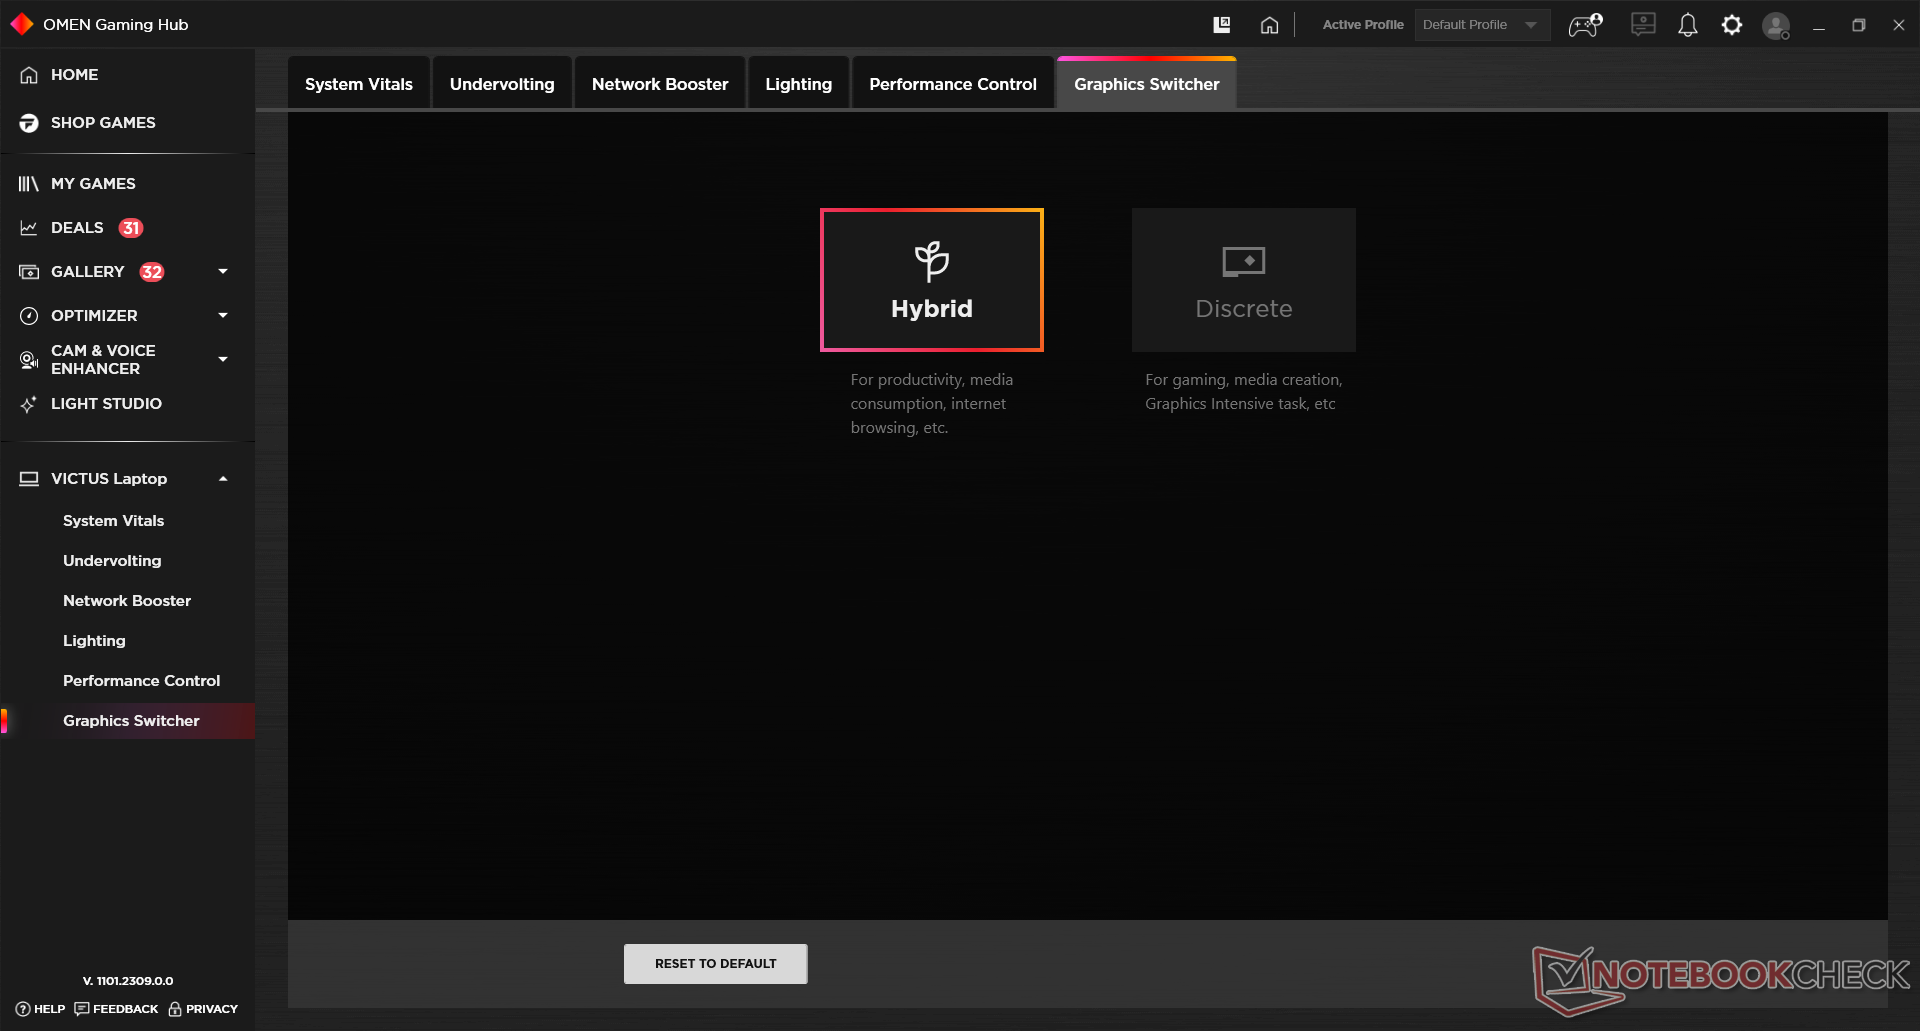
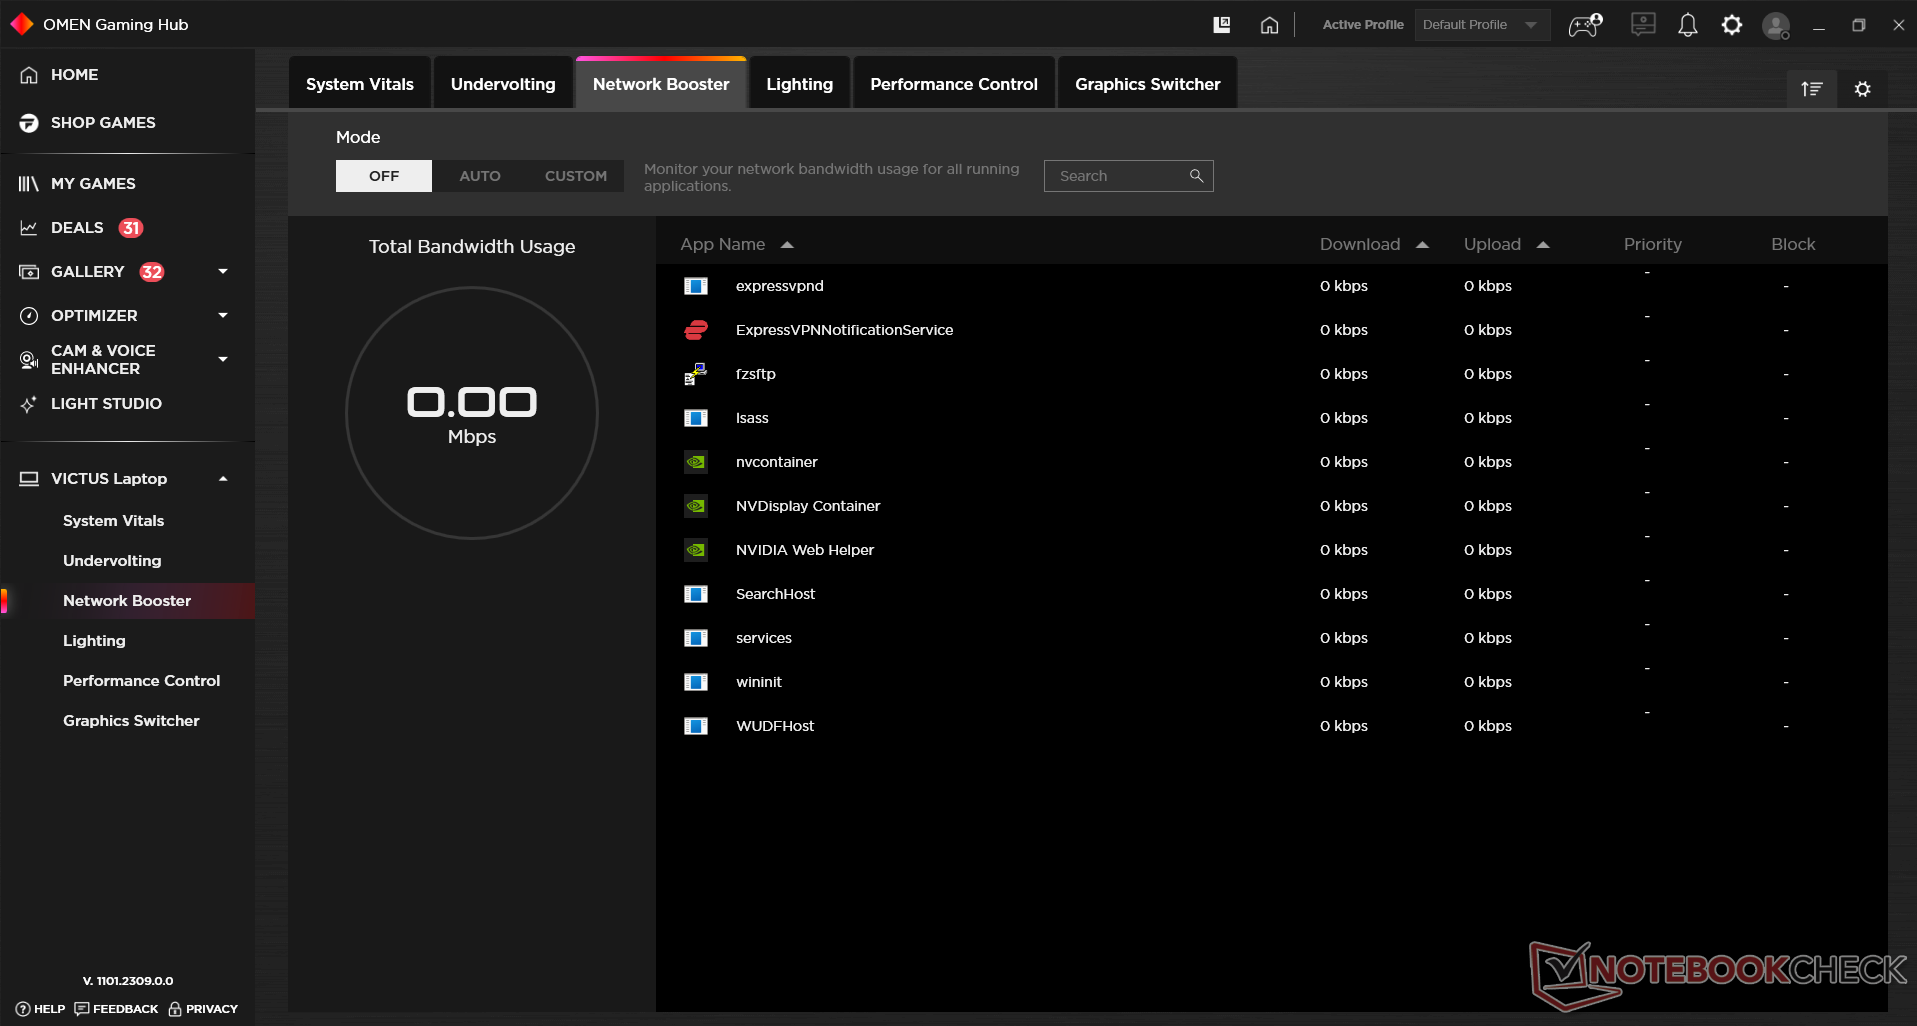
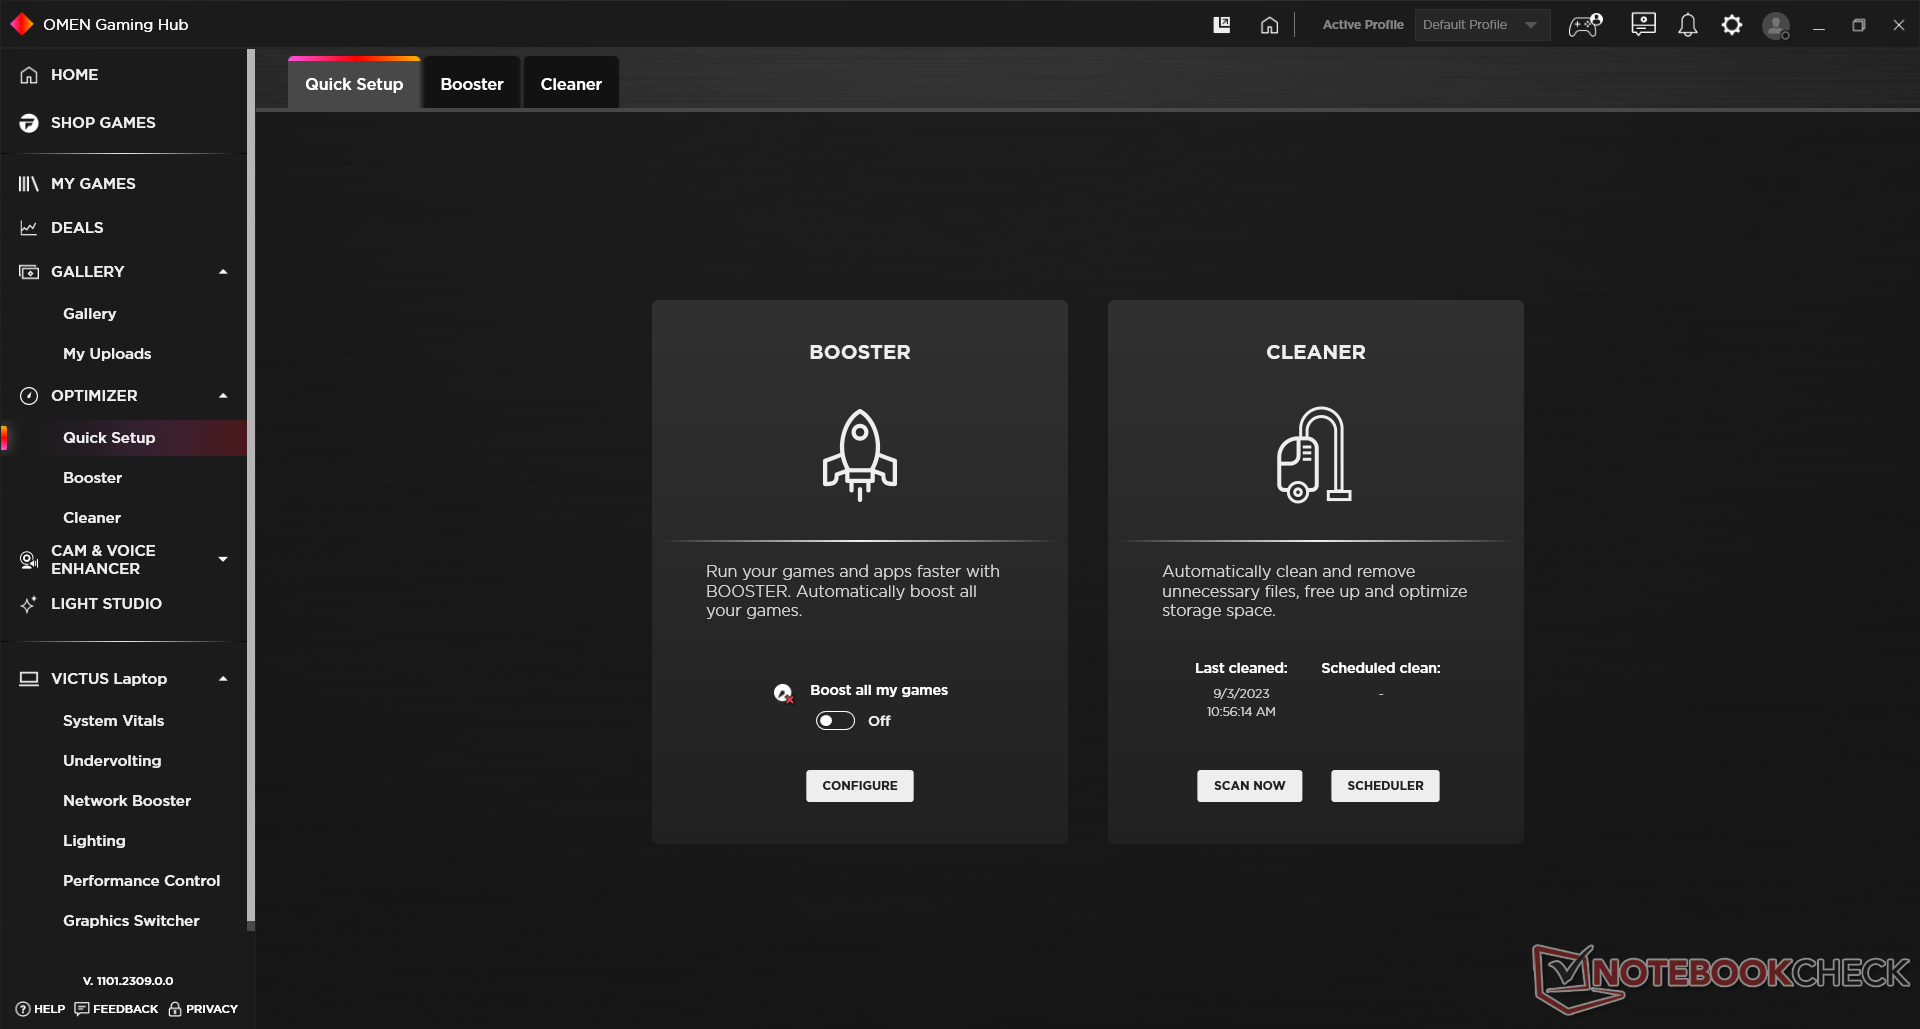
Si vous souhaitez bricoler avec votre ordinateur portable, vous passerez beaucoup de temps dans l'Omen Gaming Hub. Il offre une vue d'ensemble de tout ce qui concerne la température, l'horloge et la tension du processeur. Il permet même aux passionnés de sous-volter leur ordinateur portable sans avoir à naviguer dans le BIOS.
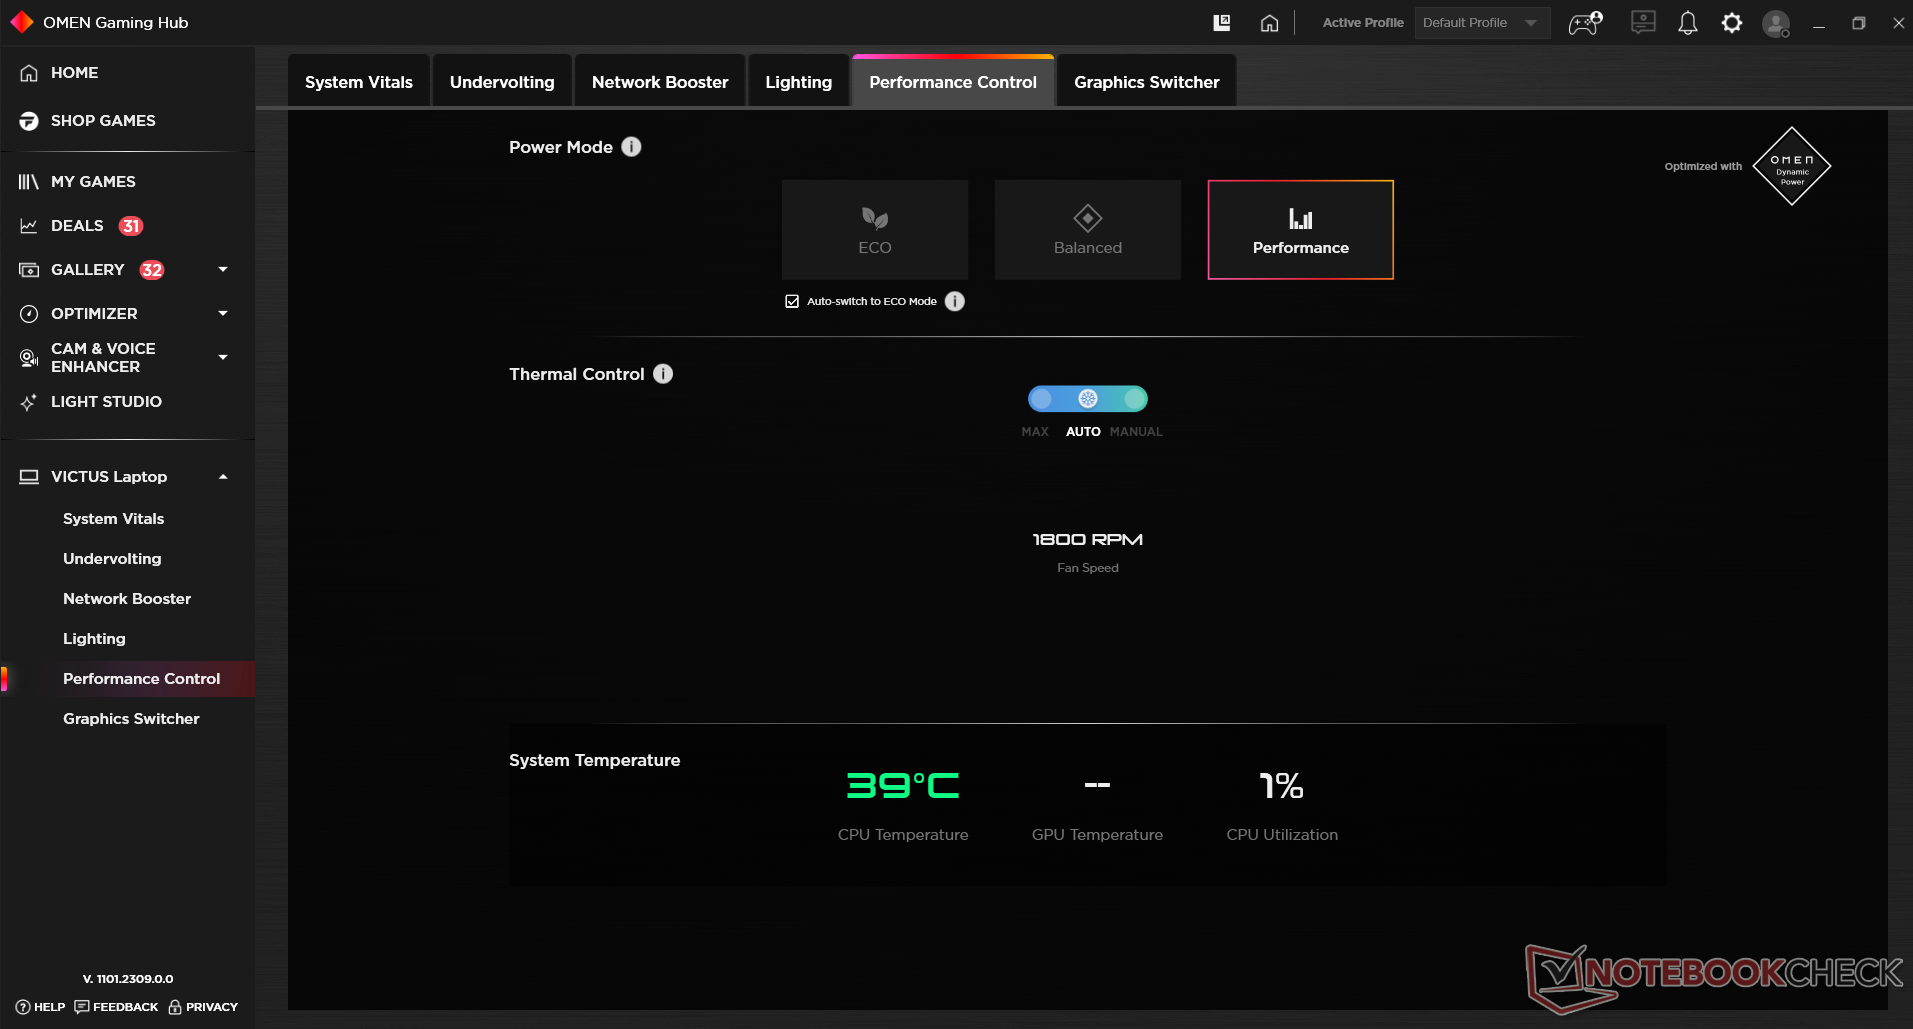
Il y a ensuite un onglet "booster de réseau" qui donne la priorité au trafic vers les tâches en cours et une section "contrôle des performances" qui vous donne accès aux plans d'alimentation mentionnés ci-dessus. Elle vous permet également de définir des courbes de ventilation personnalisées ou de laisser le ventilateur fonctionner à plein régime en permanence.
| Profil | PL1 | PL2 | PL4 |
|---|---|---|---|
| Eco | 35 W | 46 W | 200 W |
| Équilibré | 51 W | 130 W | 200 W |
| Performance | 78 W | 130 W | 200 W |
Processeur
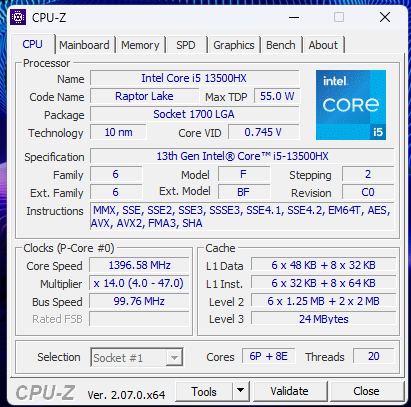
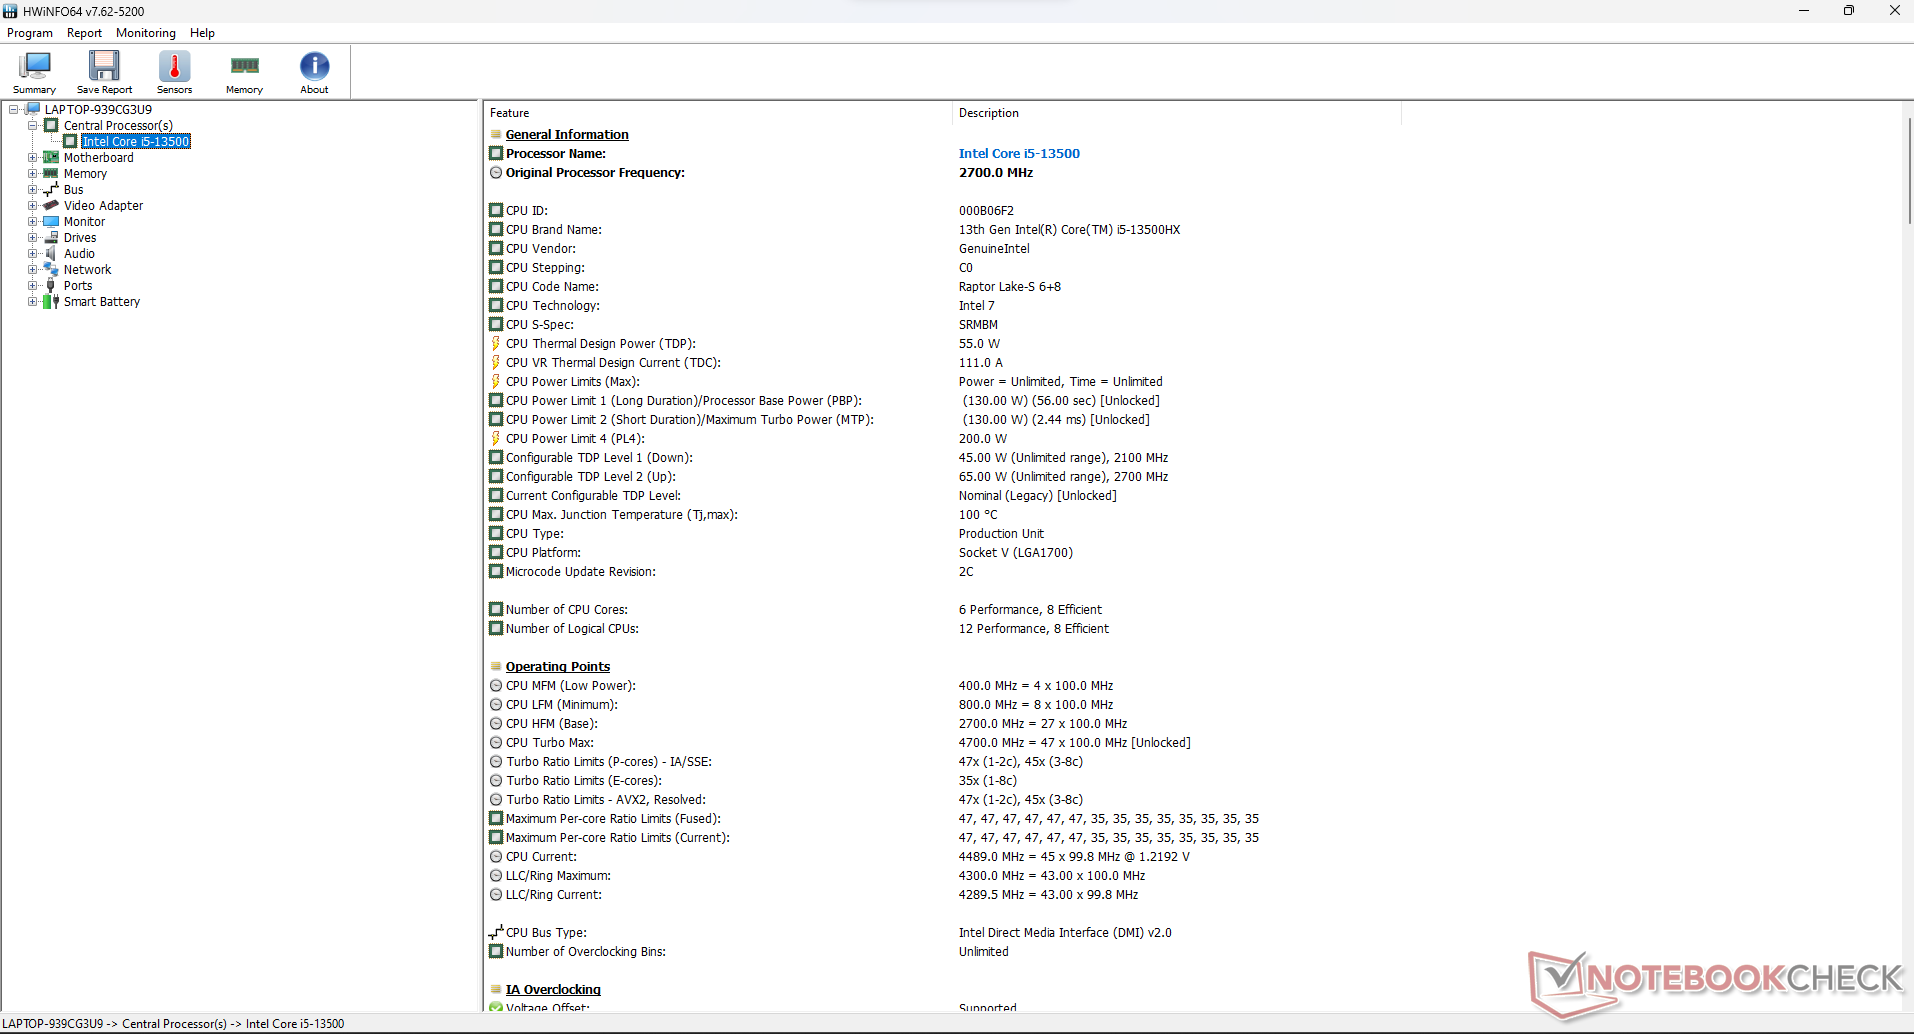
L'Intel Core i5-13500HX qui équipe notre HP Victus 16 est un CPU Raptor Lake à 14 cœurs (6 de performance plus 8 d'efficacité) et 20 threads. Il a été lancé dans le cadre de la série de puces Raptor Lake-HX qui a augmenté le TDP de base (55 Watts) par rapport à leurs homologues de marque H. En plus de la marge TDP supplémentaire, il augmente également le nombre de cœurs de performance.
Bien qu'il s'agisse du composant Raptor Lake-HX le plus bas de gamme, le Core i5-13500HX est bien au-dessus de sa catégorie. Dans son état PL2, le processeur peut consommer jusqu'à 131 watts d'énergie. Toutefois, ce chiffre se stabilise à 83 watts en charge soutenue.
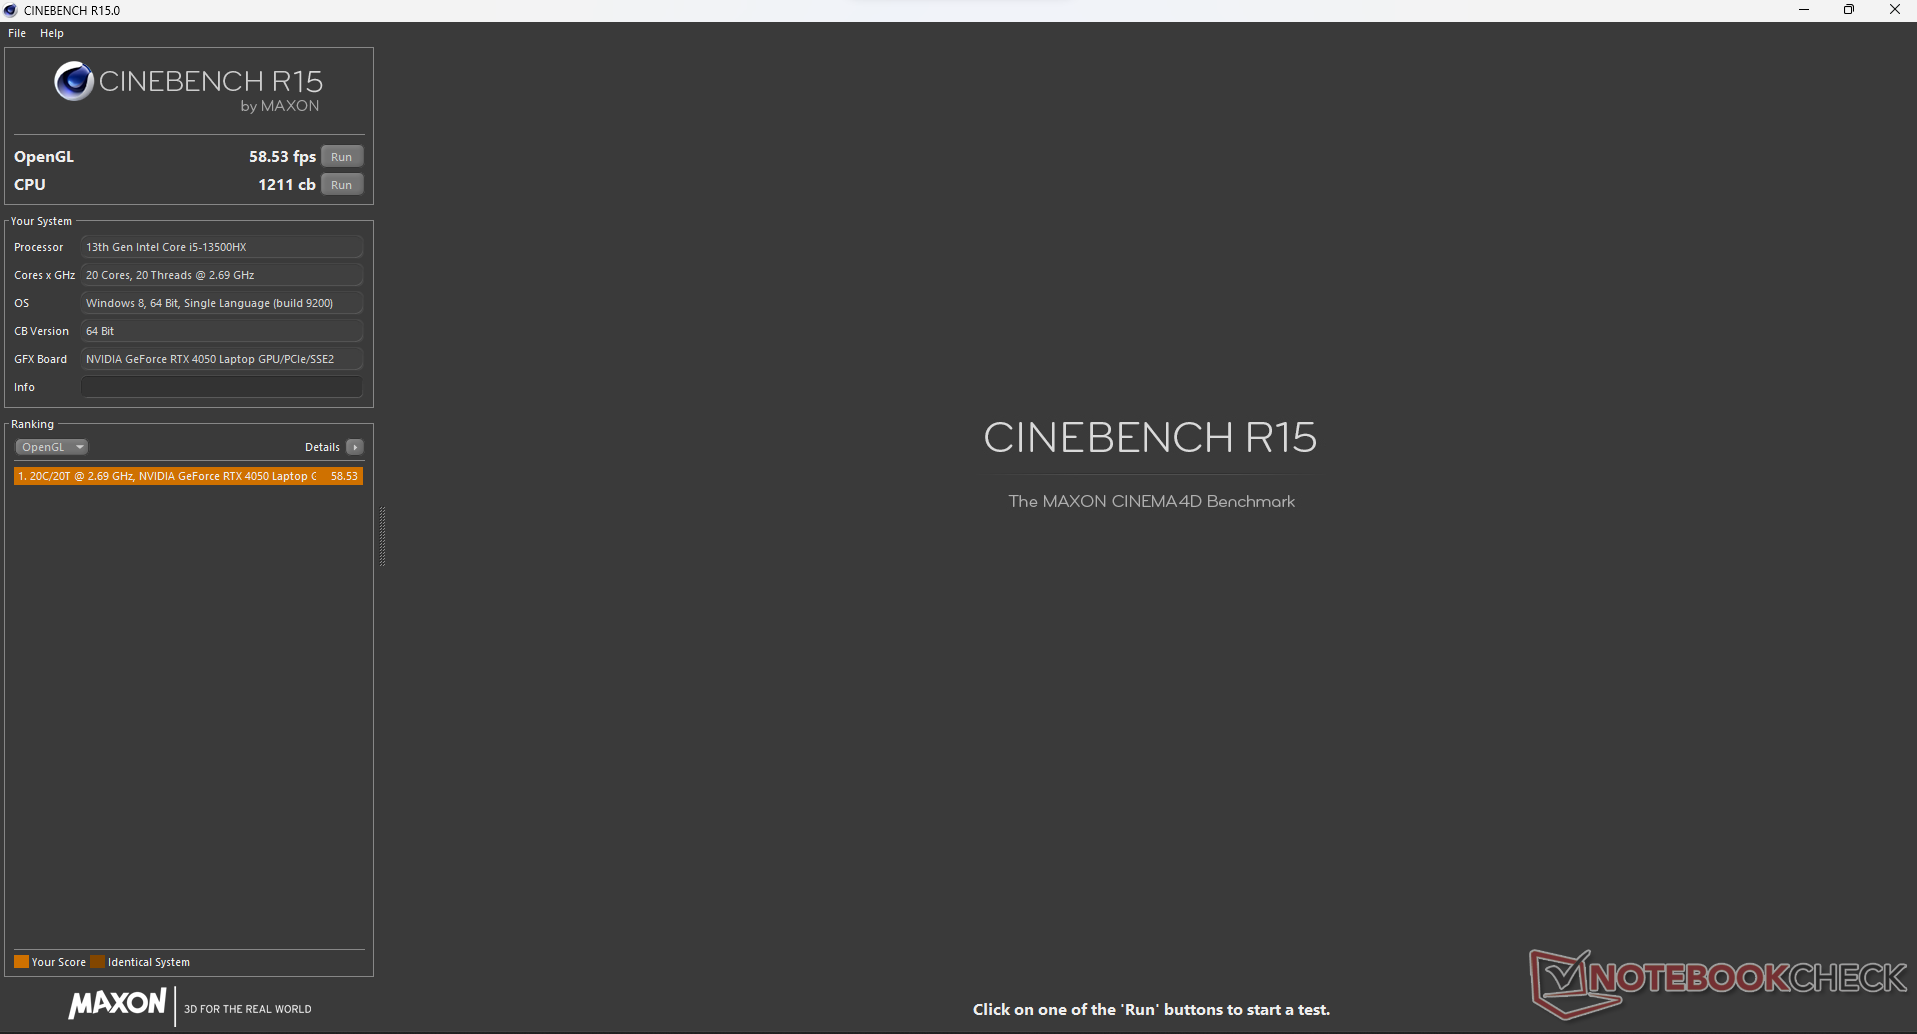
Les ordinateurs portables de jeu sont connus pour perdre beaucoup de performances sur batterie, et le HP Victus 16 n'est pas différent. Par exemple, son score Cinebench R15 chute de 58 %, passant de 2 863 à 1 211 points lorsque l'alimentation secteur est déconnectée.
Cinebench R15 Multi Loop
Cinebench R23: Multi Core | Single Core
Cinebench R20: CPU (Multi Core) | CPU (Single Core)
Cinebench R15: CPU Multi 64Bit | CPU Single 64Bit
Blender: v2.79 BMW27 CPU
7-Zip 18.03: 7z b 4 | 7z b 4 -mmt1
Geekbench 5.5: Multi-Core | Single-Core
HWBOT x265 Benchmark v2.2: 4k Preset
LibreOffice : 20 Documents To PDF
R Benchmark 2.5: Overall mean
| CPU Performance rating | |
| Moyenne de la classe Gaming | |
| Acer Predator Helios 16 PH16-71-731Q | |
| Alienware m16 R1 Intel | |
| HP Victus 16-r0076TX -1! | |
| Moyenne Intel Core i5-13500HX | |
| Acer Predator Triton 14 PT14-51 | |
| Aorus 15 BSF | |
| MSI Katana 15 B12VEK | |
| Asus TUF A15 FA507 | |
| Acer Nitro 16 AN16-41-R7YE | |
| Cinebench R23 / Multi Core | |
| Moyenne de la classe Gaming (10488 - 42661, n=108, 2 dernières années) | |
| Acer Predator Helios 16 PH16-71-731Q | |
| Alienware m16 R1 Intel | |
| Acer Predator Triton 14 PT14-51 | |
| Moyenne Intel Core i5-13500HX (18235 - 19176, n=3) | |
| HP Victus 16-r0076TX | |
| Aorus 15 BSF | |
| MSI Katana 15 B12VEK | |
| Asus TUF A15 FA507 | |
| Acer Nitro 16 AN16-41-R7YE | |
| Cinebench R23 / Single Core | |
| Moyenne de la classe Gaming (1166 - 2415, n=108, 2 dernières années) | |
| Alienware m16 R1 Intel | |
| Aorus 15 BSF | |
| Acer Predator Helios 16 PH16-71-731Q | |
| Moyenne Intel Core i5-13500HX (1689 - 1772, n=2) | |
| MSI Katana 15 B12VEK | |
| HP Victus 16-r0076TX | |
| Acer Predator Triton 14 PT14-51 | |
| Asus TUF A15 FA507 | |
| Acer Nitro 16 AN16-41-R7YE | |
| Cinebench R20 / CPU (Multi Core) | |
| Moyenne de la classe Gaming (4029 - 16433, n=107, 2 dernières années) | |
| Acer Predator Helios 16 PH16-71-731Q | |
| Alienware m16 R1 Intel | |
| Acer Predator Triton 14 PT14-51 | |
| Moyenne Intel Core i5-13500HX (6978 - 7371, n=3) | |
| HP Victus 16-r0076TX | |
| Aorus 15 BSF | |
| MSI Katana 15 B12VEK | |
| Asus TUF A15 FA507 | |
| Acer Nitro 16 AN16-41-R7YE | |
| Cinebench R20 / CPU (Single Core) | |
| Moyenne de la classe Gaming (442 - 913, n=107, 2 dernières années) | |
| Alienware m16 R1 Intel | |
| Aorus 15 BSF | |
| Acer Predator Helios 16 PH16-71-731Q | |
| Moyenne Intel Core i5-13500HX (648 - 695, n=3) | |
| MSI Katana 15 B12VEK | |
| Acer Predator Triton 14 PT14-51 | |
| HP Victus 16-r0076TX | |
| Asus TUF A15 FA507 | |
| Acer Nitro 16 AN16-41-R7YE | |
| Cinebench R15 / CPU Multi 64Bit | |
| Moyenne de la classe Gaming (1578 - 6330, n=106, 2 dernières années) | |
| Acer Predator Helios 16 PH16-71-731Q | |
| Acer Predator Helios 16 PH16-71-731Q | |
| Alienware m16 R1 Intel | |
| Acer Predator Triton 14 PT14-51 | |
| Moyenne Intel Core i5-13500HX (2856 - 2964, n=3) | |
| HP Victus 16-r0076TX | |
| Aorus 15 BSF | |
| Asus TUF A15 FA507 | |
| MSI Katana 15 B12VEK | |
| Acer Nitro 16 AN16-41-R7YE | |
| Cinebench R15 / CPU Single 64Bit | |
| Moyenne de la classe Gaming (188.8 - 350, n=107, 2 dernières années) | |
| Alienware m16 R1 Intel | |
| Acer Predator Helios 16 PH16-71-731Q | |
| Aorus 15 BSF | |
| Moyenne Intel Core i5-13500HX (242 - 263, n=3) | |
| Asus TUF A15 FA507 | |
| MSI Katana 15 B12VEK | |
| Acer Predator Triton 14 PT14-51 | |
| HP Victus 16-r0076TX | |
| Acer Nitro 16 AN16-41-R7YE | |
| Blender / v2.79 BMW27 CPU | |
| Acer Nitro 16 AN16-41-R7YE | |
| MSI Katana 15 B12VEK | |
| Asus TUF A15 FA507 | |
| Aorus 15 BSF | |
| HP Victus 16-r0076TX | |
| Moyenne Intel Core i5-13500HX (178 - 193, n=3) | |
| Acer Predator Triton 14 PT14-51 | |
| Acer Predator Helios 16 PH16-71-731Q | |
| Alienware m16 R1 Intel | |
| Moyenne de la classe Gaming (79 - 330, n=105, 2 dernières années) | |
| 7-Zip 18.03 / 7z b 4 | |
| Moyenne de la classe Gaming (33491 - 148086, n=106, 2 dernières années) | |
| Alienware m16 R1 Intel | |
| Acer Predator Helios 16 PH16-71-731Q | |
| Acer Predator Triton 14 PT14-51 | |
| Moyenne Intel Core i5-13500HX (68923 - 73701, n=3) | |
| HP Victus 16-r0076TX | |
| Aorus 15 BSF | |
| Asus TUF A15 FA507 | |
| MSI Katana 15 B12VEK | |
| Acer Nitro 16 AN16-41-R7YE | |
| 7-Zip 18.03 / 7z b 4 -mmt1 | |
| Moyenne de la classe Gaming (4199 - 7436, n=106, 2 dernières années) | |
| Alienware m16 R1 Intel | |
| Acer Predator Helios 16 PH16-71-731Q | |
| Aorus 15 BSF | |
| Asus TUF A15 FA507 | |
| Acer Nitro 16 AN16-41-R7YE | |
| Moyenne Intel Core i5-13500HX (5377 - 5850, n=3) | |
| MSI Katana 15 B12VEK | |
| Acer Predator Triton 14 PT14-51 | |
| HP Victus 16-r0076TX | |
| Geekbench 5.5 / Multi-Core | |
| Moyenne de la classe Gaming (6460 - 28263, n=106, 2 dernières années) | |
| Acer Predator Helios 16 PH16-71-731Q | |
| Alienware m16 R1 Intel | |
| Acer Predator Triton 14 PT14-51 | |
| Aorus 15 BSF | |
| Moyenne Intel Core i5-13500HX (12683 - 13767, n=3) | |
| HP Victus 16-r0076TX | |
| MSI Katana 15 B12VEK | |
| Asus TUF A15 FA507 | |
| Acer Nitro 16 AN16-41-R7YE | |
| Geekbench 5.5 / Single-Core | |
| Moyenne de la classe Gaming (986 - 2474, n=106, 2 dernières années) | |
| Acer Predator Helios 16 PH16-71-731Q | |
| Aorus 15 BSF | |
| Alienware m16 R1 Intel | |
| Moyenne Intel Core i5-13500HX (1688 - 1779, n=3) | |
| Acer Predator Triton 14 PT14-51 | |
| HP Victus 16-r0076TX | |
| MSI Katana 15 B12VEK | |
| Asus TUF A15 FA507 | |
| Acer Nitro 16 AN16-41-R7YE | |
| HWBOT x265 Benchmark v2.2 / 4k Preset | |
| Moyenne de la classe Gaming (11.5 - 44.4, n=106, 2 dernières années) | |
| Acer Predator Helios 16 PH16-71-731Q | |
| Alienware m16 R1 Intel | |
| Acer Predator Triton 14 PT14-51 | |
| Moyenne Intel Core i5-13500HX (20.3 - 20.9, n=3) | |
| HP Victus 16-r0076TX | |
| MSI Katana 15 B12VEK | |
| Asus TUF A15 FA507 | |
| Aorus 15 BSF | |
| Acer Nitro 16 AN16-41-R7YE | |
| LibreOffice / 20 Documents To PDF | |
| Asus TUF A15 FA507 | |
| Moyenne de la classe Gaming (33.2 - 88.8, n=106, 2 dernières années) | |
| Acer Predator Triton 14 PT14-51 | |
| Aorus 15 BSF | |
| MSI Katana 15 B12VEK | |
| Acer Nitro 16 AN16-41-R7YE | |
| Alienware m16 R1 Intel | |
| Moyenne Intel Core i5-13500HX (42.5 - 45, n=2) | |
| Acer Predator Helios 16 PH16-71-731Q | |
| R Benchmark 2.5 / Overall mean | |
| Acer Nitro 16 AN16-41-R7YE | |
| Asus TUF A15 FA507 | |
| MSI Katana 15 B12VEK | |
| HP Victus 16-r0076TX | |
| Acer Predator Triton 14 PT14-51 | |
| Moyenne Intel Core i5-13500HX (0.4512 - 0.4891, n=3) | |
| Alienware m16 R1 Intel | |
| Aorus 15 BSF | |
| Moyenne de la classe Gaming (0.3439 - 0.759, n=107, 2 dernières années) | |
| Acer Predator Helios 16 PH16-71-731Q | |
* ... Moindre est la valeur, meilleures sont les performances
AIDA64: FP32 Ray-Trace | FPU Julia | CPU SHA3 | CPU Queen | FPU SinJulia | FPU Mandel | CPU AES | CPU ZLib | FP64 Ray-Trace | CPU PhotoWorxx
| Performance rating | |
| Moyenne de la classe Gaming | |
| Alienware m16 R1 Intel | |
| Acer Predator Helios 16 PH16-71-731Q | |
| Acer Predator Triton 14 PT14-51 | |
| Moyenne Intel Core i5-13500HX | |
| HP Victus 16-r0076TX | |
| Asus TUF A15 FA507 | |
| Aorus 15 BSF | |
| MSI Katana 15 B12VEK | |
| Acer Nitro 16 AN16-41-R7YE | |
| AIDA64 / FP32 Ray-Trace | |
| Moyenne de la classe Gaming (10227 - 85542, n=106, 2 dernières années) | |
| Alienware m16 R1 Intel | |
| Acer Predator Helios 16 PH16-71-731Q | |
| Asus TUF A15 FA507 | |
| Moyenne Intel Core i5-13500HX (15888 - 16544, n=3) | |
| Acer Predator Triton 14 PT14-51 | |
| HP Victus 16-r0076TX | |
| MSI Katana 15 B12VEK | |
| Aorus 15 BSF | |
| Acer Nitro 16 AN16-41-R7YE | |
| AIDA64 / FPU Julia | |
| Moyenne de la classe Gaming (51376 - 372155, n=106, 2 dernières années) | |
| Alienware m16 R1 Intel | |
| Asus TUF A15 FA507 | |
| Acer Predator Helios 16 PH16-71-731Q | |
| Acer Predator Triton 14 PT14-51 | |
| HP Victus 16-r0076TX | |
| Moyenne Intel Core i5-13500HX (80761 - 85623, n=3) | |
| Acer Nitro 16 AN16-41-R7YE | |
| MSI Katana 15 B12VEK | |
| Aorus 15 BSF | |
| AIDA64 / CPU SHA3 | |
| Moyenne de la classe Gaming (2180 - 10115, n=106, 2 dernières années) | |
| Alienware m16 R1 Intel | |
| Acer Predator Helios 16 PH16-71-731Q | |
| Acer Predator Triton 14 PT14-51 | |
| Moyenne Intel Core i5-13500HX (3868 - 4017, n=3) | |
| HP Victus 16-r0076TX | |
| Asus TUF A15 FA507 | |
| MSI Katana 15 B12VEK | |
| Aorus 15 BSF | |
| Acer Nitro 16 AN16-41-R7YE | |
| AIDA64 / CPU Queen | |
| Moyenne de la classe Gaming (49785 - 173351, n=90, 2 dernières années) | |
| Alienware m16 R1 Intel | |
| Acer Predator Helios 16 PH16-71-731Q | |
| Moyenne Intel Core i5-13500HX (105168 - 107075, n=3) | |
| Aorus 15 BSF | |
| HP Victus 16-r0076TX | |
| Asus TUF A15 FA507 | |
| Acer Predator Triton 14 PT14-51 | |
| MSI Katana 15 B12VEK | |
| Acer Nitro 16 AN16-41-R7YE | |
| AIDA64 / FPU SinJulia | |
| Moyenne de la classe Gaming (4424 - 33636, n=106, 2 dernières années) | |
| Alienware m16 R1 Intel | |
| Acer Predator Helios 16 PH16-71-731Q | |
| Asus TUF A15 FA507 | |
| Moyenne Intel Core i5-13500HX (10334 - 10793, n=3) | |
| Acer Predator Triton 14 PT14-51 | |
| HP Victus 16-r0076TX | |
| Acer Nitro 16 AN16-41-R7YE | |
| Aorus 15 BSF | |
| MSI Katana 15 B12VEK | |
| AIDA64 / FPU Mandel | |
| Moyenne de la classe Gaming (25115 - 196829, n=106, 2 dernières années) | |
| Asus TUF A15 FA507 | |
| Alienware m16 R1 Intel | |
| Acer Predator Helios 16 PH16-71-731Q | |
| Acer Nitro 16 AN16-41-R7YE | |
| Moyenne Intel Core i5-13500HX (39805 - 41418, n=3) | |
| HP Victus 16-r0076TX | |
| Acer Predator Triton 14 PT14-51 | |
| MSI Katana 15 B12VEK | |
| Aorus 15 BSF | |
| AIDA64 / CPU AES | |
| Alienware m16 R1 Intel | |
| Acer Predator Helios 16 PH16-71-731Q | |
| Acer Predator Triton 14 PT14-51 | |
| Aorus 15 BSF | |
| Moyenne de la classe Gaming (39258 - 247074, n=106, 2 dernières années) | |
| Moyenne Intel Core i5-13500HX (79903 - 154368, n=3) | |
| Acer Nitro 16 AN16-41-R7YE | |
| HP Victus 16-r0076TX | |
| MSI Katana 15 B12VEK | |
| Asus TUF A15 FA507 | |
| AIDA64 / CPU ZLib | |
| Moyenne de la classe Gaming (574 - 2531, n=106, 2 dernières années) | |
| Acer Predator Helios 16 PH16-71-731Q | |
| Alienware m16 R1 Intel | |
| Acer Predator Triton 14 PT14-51 | |
| Moyenne Intel Core i5-13500HX (1104 - 1233, n=3) | |
| HP Victus 16-r0076TX | |
| Aorus 15 BSF | |
| MSI Katana 15 B12VEK | |
| Acer Nitro 16 AN16-41-R7YE | |
| Asus TUF A15 FA507 | |
| AIDA64 / FP64 Ray-Trace | |
| Moyenne de la classe Gaming (5509 - 45446, n=106, 2 dernières années) | |
| Alienware m16 R1 Intel | |
| Acer Predator Helios 16 PH16-71-731Q | |
| Moyenne Intel Core i5-13500HX (8587 - 9008, n=3) | |
| Acer Predator Triton 14 PT14-51 | |
| HP Victus 16-r0076TX | |
| Asus TUF A15 FA507 | |
| MSI Katana 15 B12VEK | |
| Aorus 15 BSF | |
| Acer Nitro 16 AN16-41-R7YE | |
| AIDA64 / CPU PhotoWorxx | |
| Acer Predator Triton 14 PT14-51 | |
| Moyenne de la classe Gaming (12271 - 89891, n=106, 2 dernières années) | |
| Moyenne Intel Core i5-13500HX (36861 - 42683, n=3) | |
| Aorus 15 BSF | |
| MSI Katana 15 B12VEK | |
| HP Victus 16-r0076TX | |
| Alienware m16 R1 Intel | |
| Acer Predator Helios 16 PH16-71-731Q | |
| Acer Nitro 16 AN16-41-R7YE | |
| Asus TUF A15 FA507 | |
découvrez notre Core i5-13500HX pour plus d'informations et de comparaisons
Performance du système
Alors que le HP Victus 16 fera l'affaire en tant que conducteur quotidien, il est à la traîne par rapport à la concurrence dans PCMark 10, où il n'a obtenu que 6 125 points.
Son score CrossMark de 1 701 le place devant le Lenovo LOQ 15 et le Acer Nitro 16.
La situation est plus ou moins la même dans AIDA64, où le processeur Raptor Lake-HX reste toujours devant ses homologues AMD.
CrossMark: Overall | Productivity | Creativity | Responsiveness
AIDA64: Memory Copy | Memory Read | Memory Write | Memory Latency
| PCMark 10 / Score | |
| Moyenne de la classe Gaming (5828 - 12414, n=94, 2 dernières années) | |
| Lenovo Legion Pro 5 16ARX8 (R5 7645HX, RTX 4050) | |
| Acer Predator Helios 16 PH16-71-731Q | |
| Lenovo LOQ 15APH8 | |
| Acer Predator Triton 14 PT14-51 | |
| Alienware m16 R1 Intel | |
| Dell G15 5530 | |
| Acer Nitro 16 AN16-41-R7YE | |
| Moyenne Intel Core i5-13500HX, NVIDIA GeForce RTX 4050 Laptop GPU (6125 - 6565, n=2) | |
| HP Victus 16-r0076TX | |
| PCMark 10 / Essentials | |
| Lenovo Legion Pro 5 16ARX8 (R5 7645HX, RTX 4050) | |
| Acer Predator Helios 16 PH16-71-731Q | |
| Dell G15 5530 | |
| Alienware m16 R1 Intel | |
| Moyenne de la classe Gaming (8810 - 11935, n=98, 2 dernières années) | |
| Lenovo LOQ 15APH8 | |
| Acer Predator Triton 14 PT14-51 | |
| Moyenne Intel Core i5-13500HX, NVIDIA GeForce RTX 4050 Laptop GPU (9625 - 10618, n=2) | |
| Acer Nitro 16 AN16-41-R7YE | |
| HP Victus 16-r0076TX | |
| PCMark 10 / Productivity | |
| Moyenne de la classe Gaming (6845 - 25323, n=96, 2 dernières années) | |
| Lenovo Legion Pro 5 16ARX8 (R5 7645HX, RTX 4050) | |
| Acer Predator Helios 16 PH16-71-731Q | |
| Dell G15 5530 | |
| Lenovo LOQ 15APH8 | |
| Acer Predator Triton 14 PT14-51 | |
| Alienware m16 R1 Intel | |
| Moyenne Intel Core i5-13500HX, NVIDIA GeForce RTX 4050 Laptop GPU (8471 - 9005, n=2) | |
| HP Victus 16-r0076TX | |
| Acer Nitro 16 AN16-41-R7YE | |
| PCMark 10 / Digital Content Creation | |
| Moyenne de la classe Gaming (7602 - 19954, n=96, 2 dernières années) | |
| Lenovo LOQ 15APH8 | |
| Lenovo Legion Pro 5 16ARX8 (R5 7645HX, RTX 4050) | |
| Acer Predator Triton 14 PT14-51 | |
| Acer Nitro 16 AN16-41-R7YE | |
| Acer Predator Helios 16 PH16-71-731Q | |
| Alienware m16 R1 Intel | |
| Dell G15 5530 | |
| Moyenne Intel Core i5-13500HX, NVIDIA GeForce RTX 4050 Laptop GPU (7649 - 8031, n=2) | |
| HP Victus 16-r0076TX | |
| CrossMark / Overall | |
| Acer Predator Helios 16 PH16-71-731Q | |
| Alienware m16 R1 Intel | |
| Moyenne de la classe Gaming (1366 - 2409, n=95, 2 dernières années) | |
| Lenovo Legion Pro 5 16ARX8 (R5 7645HX, RTX 4050) | |
| Acer Predator Triton 14 PT14-51 | |
| Dell G15 5530 | |
| Moyenne Intel Core i5-13500HX, NVIDIA GeForce RTX 4050 Laptop GPU (1701 - 1964, n=2) | |
| HP Victus 16-r0076TX | |
| Lenovo LOQ 15APH8 | |
| Acer Nitro 16 AN16-41-R7YE | |
| CrossMark / Productivity | |
| Acer Predator Helios 16 PH16-71-731Q | |
| Alienware m16 R1 Intel | |
| Lenovo Legion Pro 5 16ARX8 (R5 7645HX, RTX 4050) | |
| Moyenne de la classe Gaming (1386 - 2254, n=95, 2 dernières années) | |
| Acer Predator Triton 14 PT14-51 | |
| Dell G15 5530 | |
| Moyenne Intel Core i5-13500HX, NVIDIA GeForce RTX 4050 Laptop GPU (1585 - 1878, n=2) | |
| Lenovo LOQ 15APH8 | |
| HP Victus 16-r0076TX | |
| Acer Nitro 16 AN16-41-R7YE | |
| CrossMark / Creativity | |
| Acer Predator Helios 16 PH16-71-731Q | |
| Moyenne de la classe Gaming (1343 - 2786, n=95, 2 dernières années) | |
| Alienware m16 R1 Intel | |
| Dell G15 5530 | |
| Lenovo Legion Pro 5 16ARX8 (R5 7645HX, RTX 4050) | |
| Acer Predator Triton 14 PT14-51 | |
| Moyenne Intel Core i5-13500HX, NVIDIA GeForce RTX 4050 Laptop GPU (1912 - 2022, n=2) | |
| HP Victus 16-r0076TX | |
| Lenovo LOQ 15APH8 | |
| Acer Nitro 16 AN16-41-R7YE | |
| CrossMark / Responsiveness | |
| Acer Predator Helios 16 PH16-71-731Q | |
| Alienware m16 R1 Intel | |
| Lenovo Legion Pro 5 16ARX8 (R5 7645HX, RTX 4050) | |
| Moyenne Intel Core i5-13500HX, NVIDIA GeForce RTX 4050 Laptop GPU (1478 - 2053, n=2) | |
| Acer Predator Triton 14 PT14-51 | |
| Moyenne de la classe Gaming (1226 - 2334, n=95, 2 dernières années) | |
| Dell G15 5530 | |
| HP Victus 16-r0076TX | |
| Lenovo LOQ 15APH8 | |
| Acer Nitro 16 AN16-41-R7YE | |
| AIDA64 / Memory Copy | |
| Acer Predator Triton 14 PT14-51 | |
| Moyenne de la classe Gaming (21750 - 129946, n=106, 2 dernières années) | |
| Dell G15 5530 | |
| Moyenne Intel Core i5-13500HX, NVIDIA GeForce RTX 4050 Laptop GPU (56320 - 62153, n=3) | |
| Alienware m16 R1 Intel | |
| Acer Predator Helios 16 PH16-71-731Q | |
| HP Victus 16-r0076TX | |
| Acer Nitro 16 AN16-41-R7YE | |
| Lenovo Legion Pro 5 16ARX8 (R5 7645HX, RTX 4050) | |
| Lenovo LOQ 15APH8 | |
| AIDA64 / Memory Read | |
| Moyenne de la classe Gaming (22956 - 118858, n=106, 2 dernières années) | |
| Dell G15 5530 | |
| Alienware m16 R1 Intel | |
| Acer Predator Helios 16 PH16-71-731Q | |
| Acer Predator Triton 14 PT14-51 | |
| Moyenne Intel Core i5-13500HX, NVIDIA GeForce RTX 4050 Laptop GPU (66057 - 66667, n=3) | |
| HP Victus 16-r0076TX | |
| Acer Nitro 16 AN16-41-R7YE | |
| Lenovo Legion Pro 5 16ARX8 (R5 7645HX, RTX 4050) | |
| Lenovo LOQ 15APH8 | |
| AIDA64 / Memory Write | |
| Acer Predator Helios 16 PH16-71-731Q | |
| Acer Predator Triton 14 PT14-51 | |
| Moyenne de la classe Gaming (22297 - 135096, n=106, 2 dernières années) | |
| Moyenne Intel Core i5-13500HX, NVIDIA GeForce RTX 4050 Laptop GPU (56956 - 66135, n=3) | |
| Dell G15 5530 | |
| Alienware m16 R1 Intel | |
| HP Victus 16-r0076TX | |
| Acer Nitro 16 AN16-41-R7YE | |
| Lenovo Legion Pro 5 16ARX8 (R5 7645HX, RTX 4050) | |
| Lenovo LOQ 15APH8 | |
| AIDA64 / Memory Latency | |
| Moyenne de la classe Gaming (75.3 - 259, n=106, 2 dernières années) | |
| Acer Predator Triton 14 PT14-51 | |
| HP Victus 16-r0076TX | |
| Lenovo LOQ 15APH8 | |
| Moyenne Intel Core i5-13500HX, NVIDIA GeForce RTX 4050 Laptop GPU (87.1 - 96.8, n=3) | |
| Dell G15 5530 | |
| Alienware m16 R1 Intel | |
| Acer Nitro 16 AN16-41-R7YE | |
| Acer Predator Helios 16 PH16-71-731Q | |
| Lenovo Legion Pro 5 16ARX8 (R5 7645HX, RTX 4050) | |
* ... Moindre est la valeur, meilleures sont les performances
| PCMark 8 Home Score Accelerated | 4602 points | |
| PCMark 8 Work Score Accelerated | 6227 points | |
| PCMark 10 Score | 6125 points | |
Aide | ||
Latence DPC
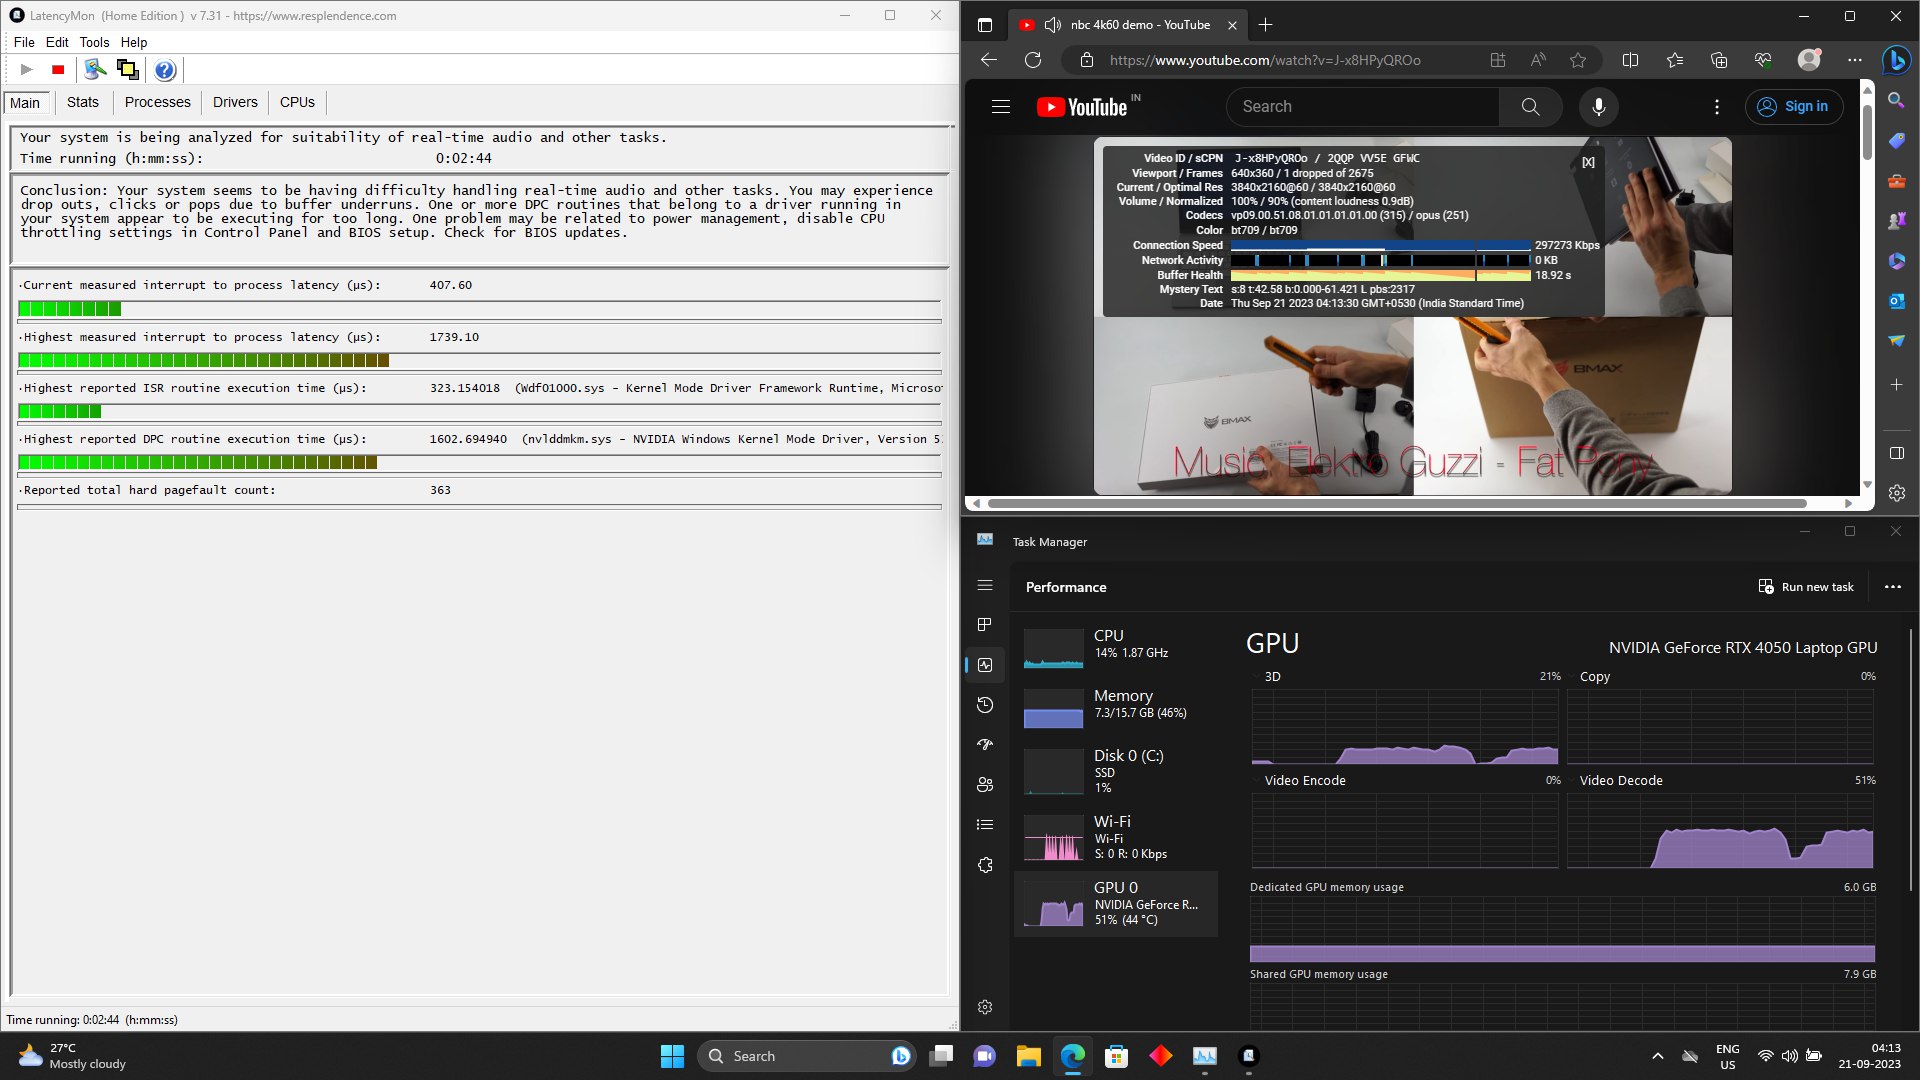
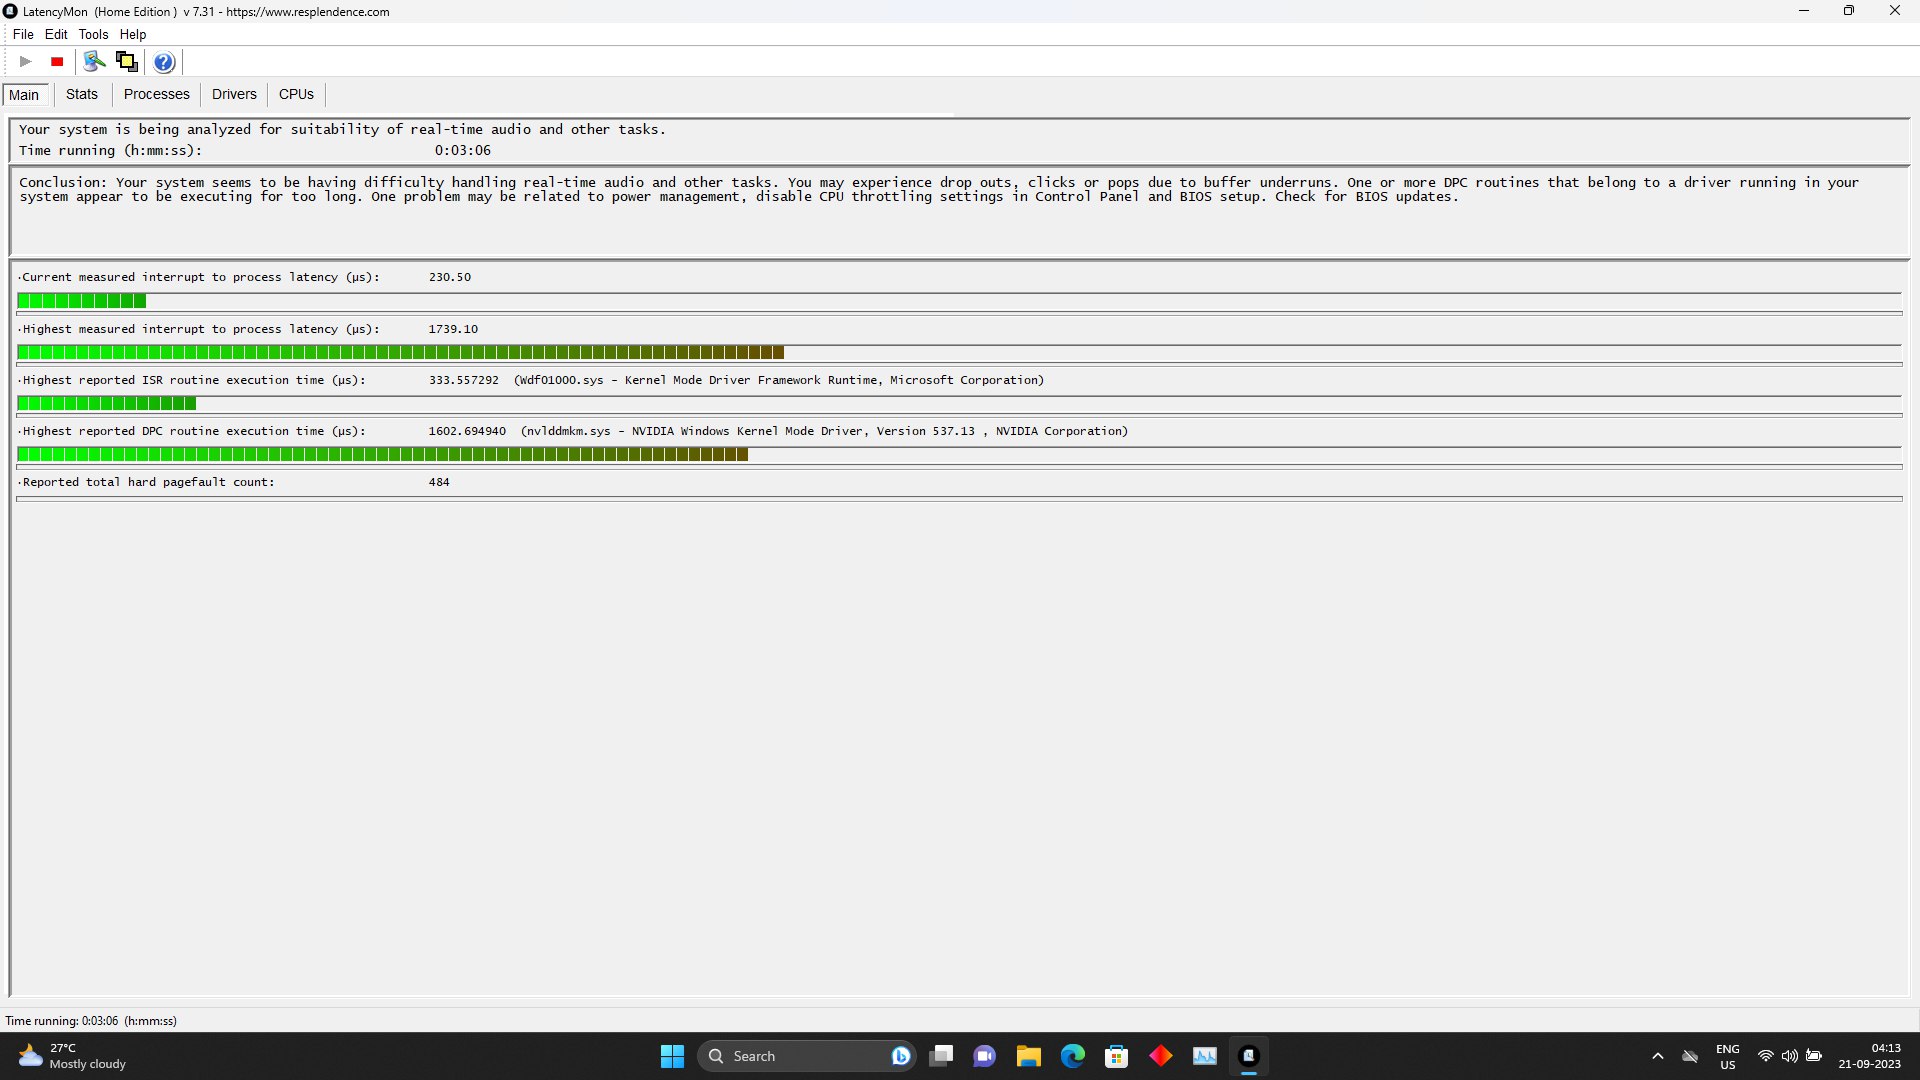
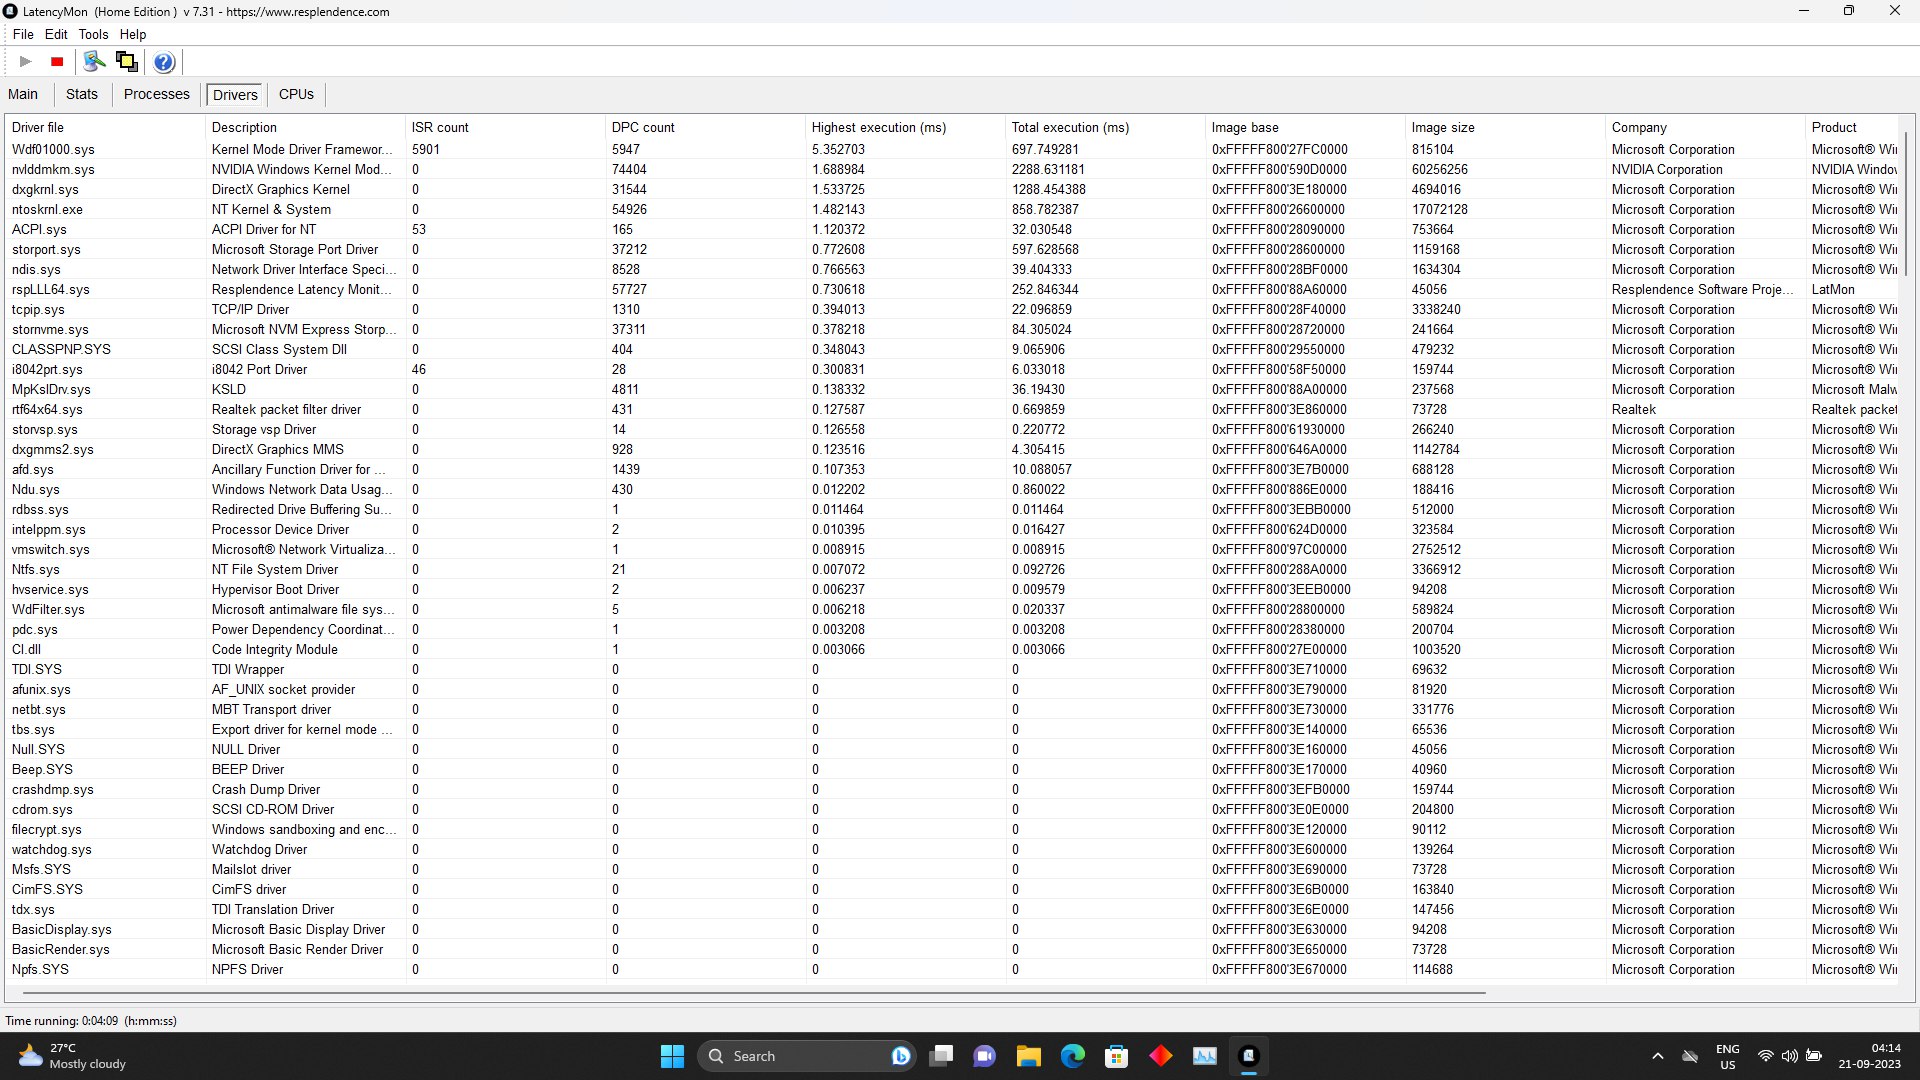
La latence élevée du DPC est un problème récurrent sur les cartes graphiques Ada Lovelace de bureau depuis leur lancement. Le problème semble s'être étendu à ses variantes pour ordinateurs portables. Un rapide coup d'œil à LatencyMon indique que le coupable est "Wdf0100.sys" (Windows Driver Framework) et "Nvlddmkm.sys" (Nvidia Windows Kernel Module), ce qui indique qu'une mise à jour logicielle pourrait résoudre le problème ultérieurement.
Consulter Page de classement des temps de latence pour plus de résultats.
| DPC Latencies / LatencyMon - interrupt to process latency (max), Web, Youtube, Prime95 | |
| Dell G15 5530 | |
| Alienware m16 R1 Intel | |
| HP Victus 16-r0076TX | |
| Acer Predator Helios 16 PH16-71-731Q | |
| Acer Predator Triton 14 PT14-51 | |
| Lenovo LOQ 15APH8 | |
| Acer Nitro 16 AN16-41-R7YE | |
| Lenovo Legion Pro 5 16ARX8 (R5 7645HX, RTX 4050) | |
* ... Moindre est la valeur, meilleures sont les performances
Dispositifs de stockage
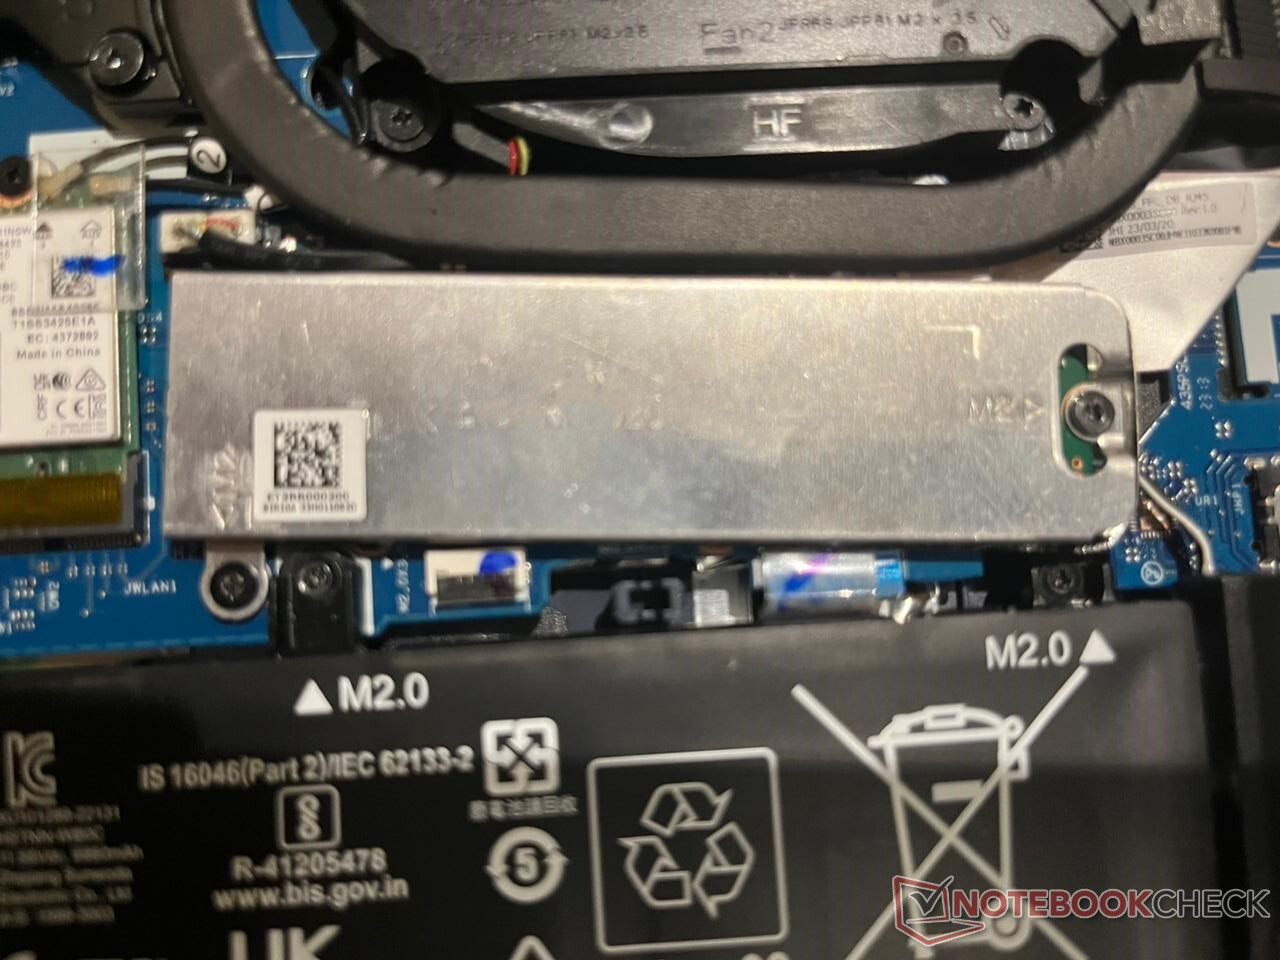
Le SSD NVMe SK Hynix PC801 du HP Victus 16 offre des vitesses de transfert décentes sur une variété de charges de travail. Nos tests ont déterminé qu'il ne s'étrangle pas, même après une utilisation prolongée, grâce à son épais blindage métallique.
Cependant, 512 Go, c'est pitoyablement peu en 2023, surtout avec les tailles de jeux gonflées qui deviennent la norme. Heureusement, HP permet aux utilisateurs d'installer un disque supplémentaire assez facilement.

* ... Moindre est la valeur, meilleures sont les performances
Disk Throttling: DiskSpd Read Loop, Queue Depth 8
En savoir plus sur nos HDD et SSD et SSD.
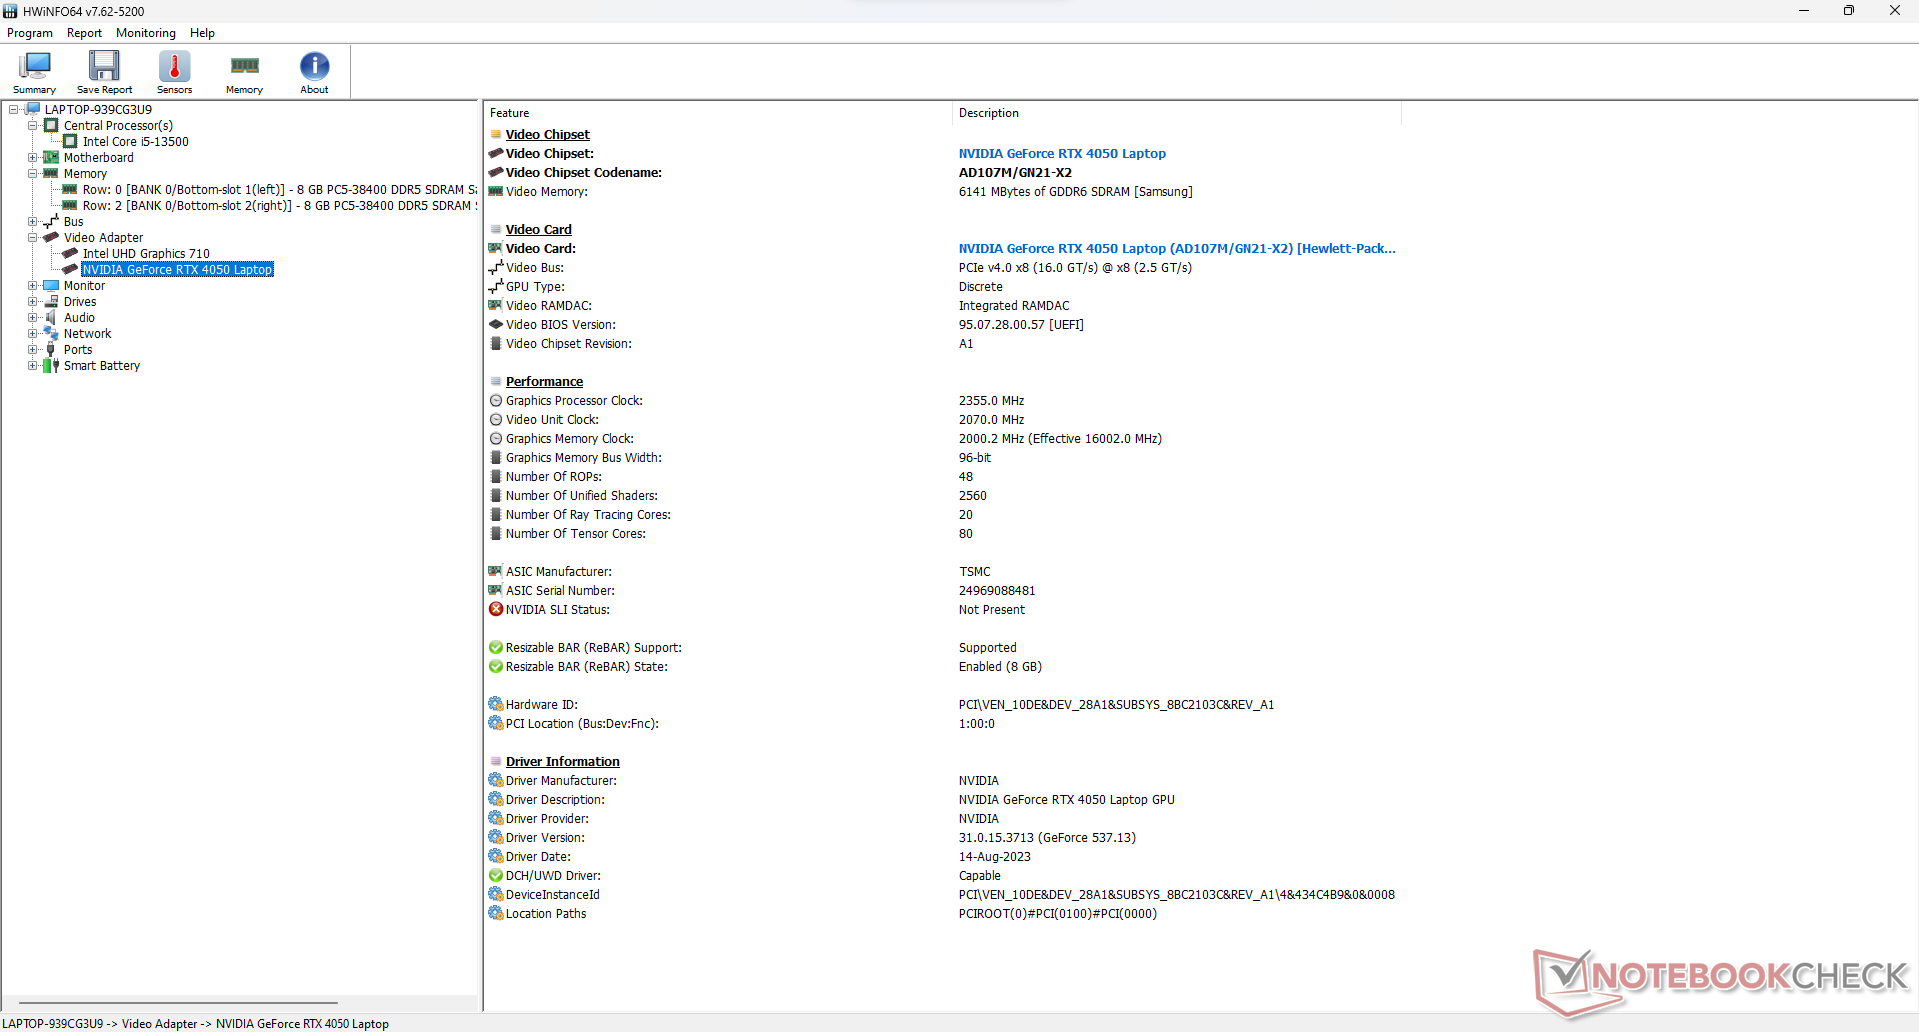
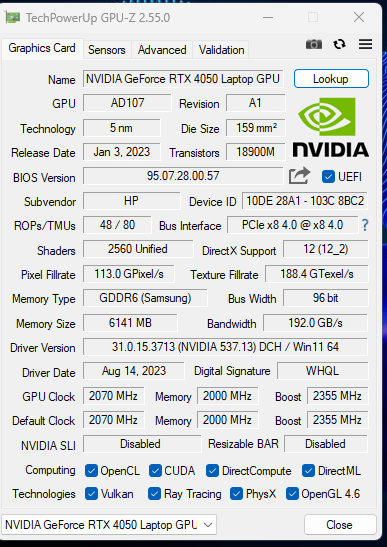
Performance du GPU
À première vue, le Nvidia GeForce RTX 4050 ne semble pas être le GPU le plus puissant du marché. Elle dispose de 6 Go de VRAM GDDR6 sur un bus de 96 bits, de 2 560 cœurs CUDA et d'une valeur TGP comprise entre 35 et 115 watts.
Quelques recherches dans le panneau de configuration de Nvidia ont révélé que son TGP maximum plafonne à environ 100 watts, ce qui est respectable. Il est intéressant de noter que la GeForce RTX 4050 peut "emprunter" jusqu'à 20 Watts de puissance au CPU.
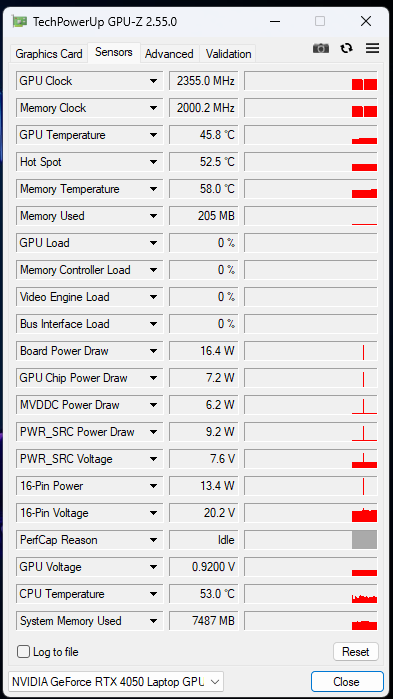
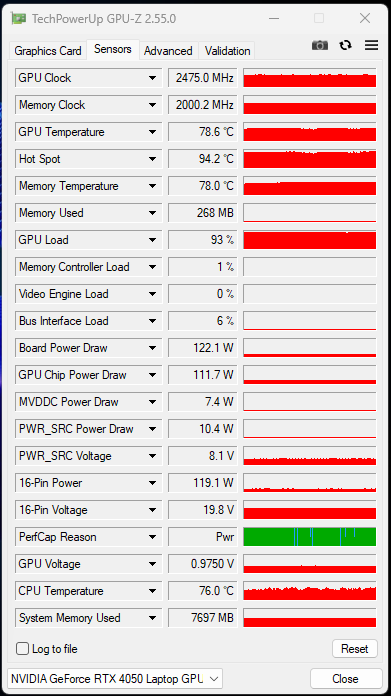
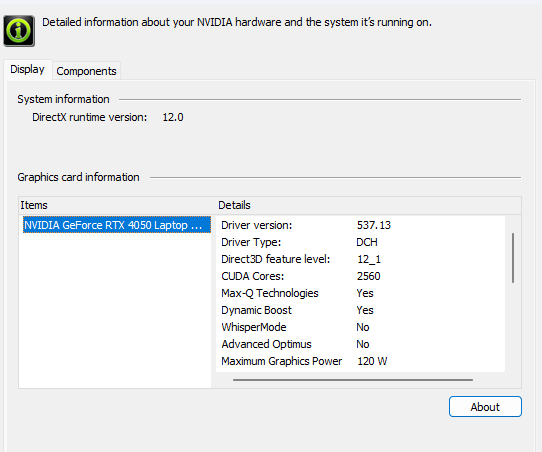
Cela se reflète dans FurMark, où la puissance maximale de la carte grimpe à 122,1 Watts en charge. Cependant, elle ne peut pas rester longtemps dans cet état et se stabilise à un niveau plus bas après un certain temps.
La HP Victus 16 est légèrement plus performante que les autres ordinateurs portables RTX 4050 dans 3DMark 11, avec un score de 31 571 points. La différence est moins évidente dans les tests 3DMark plus anciens, tels que Ice Storm, Fire Strike et Time Spy.
En conclusion, la GeForce RTX 4050, en dépit d'une fiche technique décevante, reste à la hauteur de la concurrence et constitue une carte graphique d'entrée de gamme impeccable.
| 3DMark 06 Standard Score | 46228 points | |
| 3DMark 11 Performance | 28214 points | |
| 3DMark Ice Storm Standard Score | 198276 points | |
| 3DMark Cloud Gate Standard Score | 61259 points | |
| 3DMark Fire Strike Score | 21070 points | |
| 3DMark Fire Strike Extreme Score | 10180 points | |
| 3DMark Time Spy Score | 9069 points | |
Aide | ||
| Blender / v3.3 Classroom OPTIX/RTX | |
| Moyenne NVIDIA GeForce RTX 4050 Laptop GPU (25 - 37, n=40) | |
| HP Victus 16-r0076TX | |
| MSI Katana 15 B12VEK | |
| Asus TUF A15 FA507 | |
| Asus TUF A15 FA507 | |
| Acer Predator Triton 14 PT14-51 | |
| Acer Nitro 16 AN16-41-R7YE | |
| Alienware m16 R1 Intel | |
| Aorus 15 BSF | |
| Acer Predator Helios 16 PH16-71-731Q | |
| Moyenne de la classe Gaming (9 - 32, n=107, 2 dernières années) | |
| Blender / v3.3 Classroom CUDA | |
| Moyenne NVIDIA GeForce RTX 4050 Laptop GPU (47 - 68, n=39) | |
| MSI Katana 15 B12VEK | |
| Acer Predator Triton 14 PT14-51 | |
| Asus TUF A15 FA507 | |
| Asus TUF A15 FA507 | |
| Acer Nitro 16 AN16-41-R7YE | |
| HP Victus 16-r0076TX | |
| Acer Predator Helios 16 PH16-71-731Q | |
| Alienware m16 R1 Intel | |
| Aorus 15 BSF | |
| Moyenne de la classe Gaming (15 - 228, n=107, 2 dernières années) | |
| Blender / v3.3 Classroom CPU | |
| Acer Nitro 16 AN16-41-R7YE | |
| MSI Katana 15 B12VEK | |
| Moyenne NVIDIA GeForce RTX 4050 Laptop GPU (243 - 907, n=40) | |
| Aorus 15 BSF | |
| Asus TUF A15 FA507 | |
| Asus TUF A15 FA507 | |
| HP Victus 16-r0076TX | |
| Acer Predator Triton 14 PT14-51 | |
| Acer Predator Helios 16 PH16-71-731Q | |
| Alienware m16 R1 Intel | |
| Moyenne de la classe Gaming (122 - 565, n=103, 2 dernières années) | |
* ... Moindre est la valeur, meilleures sont les performances
Consultez notre Nvidia GeForce RTX 4050 pour plus d'informations et de comparaisons.
Performance des jeux
La GeForce RTX 4050 est étonnamment compétente pour les jeux, même avec seulement 6 Go de VRAM. Elle a pu faire tourner tous les jeux que nous lui avons proposés à 1080p 60 FPS, avec tous les paramètres au maximum.
Les performances exceptionnelles de Cyberpunk 2077 s'expliquent par l'optimisation poussée du jeu par Nvidia. Les jeux d'e-sport tels que DOTA 2 fonctionnent également très bien sur l'ordinateur portable.
Les améliorations architecturales apportées par Ada Lovelace donnent à la RTX 4050 une chance décente en tant que machine de jeu 1080p. Cependant, nous ne recommandons pas d'activer le raytracing sans DLSS, car il est notoirement gourmand en VRAM.
| The Witcher 3 - 1920x1080 Ultra Graphics & Postprocessing (HBAO+) | |
| Moyenne de la classe Gaming (104.7 - 240, n=7, 2 dernières années) | |
| Alienware m16 R1 Intel | |
| Dell G15 5530 | |
| Acer Predator Helios 16 PH16-71-731Q | |
| HP Victus 16-r0076TX | |
| Lenovo Legion Pro 5 16ARX8 (R5 7645HX, RTX 4050) | |
| Acer Nitro 16 AN16-41-R7YE | |
| Lenovo LOQ 15APH8 | |
| Acer Predator Triton 14 PT14-51 | |
Lors de nos tests soutenus, The Witcher 3 a été en mesure de fonctionner assez bien à un minimum de 90 images par seconde à tout moment. Bien que le taux de rafraîchissement ait oscillé autour de 100 images par seconde dans certains cas, il est retombé en raison de l'étranglement thermique. En résumé, l'ordinateur portable peut faire un travail correct pour jouer à des jeux exigeants avec un taux de rafraîchissement assez constant.
Witcher 3 FPS Chart
| Bas | Moyen | Élevé | Ultra | |
|---|---|---|---|---|
| The Witcher 3 (2015) | 365 | 282 | 160.2 | 94.7 |
| Dota 2 Reborn (2015) | 181.5 | 163.4 | 159 | 145 |
| Final Fantasy XV Benchmark (2018) | 190.5 | 120.3 | 84.8 | |
| X-Plane 11.11 (2018) | 157.2 | 138.8 | 106.5 | |
| Far Cry 5 (2018) | 155 | 122 | 110 | 109 |
| Strange Brigade (2018) | 355 | 213 | 171.8 | 149.3 |
| Cyberpunk 2077 1.6 (2022) | 111.2 | 85.3 | 65.5 | 71.8 |
| F1 22 (2022) | 214 | 207 | 154.4 | 54.1 |
| F1 23 (2023) | 217 | 210 | 156.2 | 60.8 |
Émissions : Fonctionnement un peu trop bruyant et chaud
Bruit du système
Même si HP a fait tout son possible pour refroidir le Victus 16, il a du mal à garder son matériel sous contrôle. L'une des premières choses que vous remarquerez est le niveau sonore de l'ordinateur portable à la moindre sollicitation, le bruit devenant de plus en plus fort lorsque vous jouez.
Nos tests ont déterminé que le niveau sonore maximum était de 55 dB(A). Bien qu'il se situe bien en dessous du seuil de ce qui peut être considéré comme bruyant, ce n'est pas quelque chose qui peut se fondre dans le décor, pas sans une paire d'écouteurs.
Degré de la nuisance sonore
| Au repos |
| 23.68 / 23.68 / 23.68 dB(A) |
| Fortement sollicité |
| 39.44 / 55.37 dB(A) |
 | ||
30 dB silencieux 40 dB(A) audible 50 dB(A) bruyant |
||
min: | ||
| Mode de performance | Ralenti dB(A) | Charge moyenne dB(A) | Charge maximale dB(A) | Le Witcher 3 1080p Ultra dB(A) |
|---|---|---|---|---|
| Eco | 23,67 | 32,50 | 40,80 | 41,03 / 84 fps |
| Équilibré | 23.87 | 35.06 | 44.72 | 44.78 / 86 fps |
| Performance | 23.68 | 39.44 | 55.37 | 55.42 / 87 fps |
| HP Victus 16-r0076TX i5-13500HX, GeForce RTX 4050 Laptop GPU | Acer Nitro 16 AN16-41-R7YE R5 7535HS, GeForce RTX 4050 Laptop GPU | Acer Predator Triton 14 PT14-51 i7-13700H, GeForce RTX 4050 Laptop GPU | Alienware m16 R1 Intel i7-13700HX, GeForce RTX 4060 Laptop GPU | Acer Predator Helios 16 PH16-71-731Q i7-13700HX, GeForce RTX 4060 Laptop GPU | Dell G15 5530 i7-13650HX, GeForce RTX 4060 Laptop GPU | Lenovo Legion Pro 5 16ARX8 (R5 7645HX, RTX 4050) R5 7645HX, GeForce RTX 4050 Laptop GPU | Lenovo LOQ 15APH8 R7 7840HS, GeForce RTX 4050 Laptop GPU | |
|---|---|---|---|---|---|---|---|---|
| Noise | -1% | -7% | -9% | -3% | 3% | 5% | 0% | |
| arrêt / environnement * (dB) | 21.57 | 24 -11% | 25 -16% | 25 -16% | 24 -11% | 20.41 5% | 23 -7% | 23.1 -7% |
| Idle Minimum * (dB) | 23.68 | 25 -6% | 27 -14% | 25 -6% | 24 -1% | 26.85 -13% | 23 3% | 23.1 2% |
| Idle Average * (dB) | 23.68 | 26 -10% | 29 -22% | 26 -10% | 24 -1% | 26.85 -13% | 23 3% | 23.1 2% |
| Idle Maximum * (dB) | 23.68 | 27 -14% | 31 -31% | 27 -14% | 32.32 -36% | 26.85 -13% | 24.42 -3% | 25.2 -6% |
| Load Average * (dB) | 39.44 | 42 -6% | 42 -6% | 52 -32% | 36.66 7% | 27.65 30% | 34.94 11% | 44.3 -12% |
| Witcher 3 ultra * (dB) | 55.4 | 43 22% | 43 22% | 51 8% | 49.06 11% | 47.9 14% | 43.79 21% | 45.8 17% |
| Load Maximum * (dB) | 55.37 | 45 19% | 45 19% | 53 4% | 49.49 11% | 47.86 14% | 50 10% | 52 6% |
* ... Moindre est la valeur, meilleures sont les performances
Température
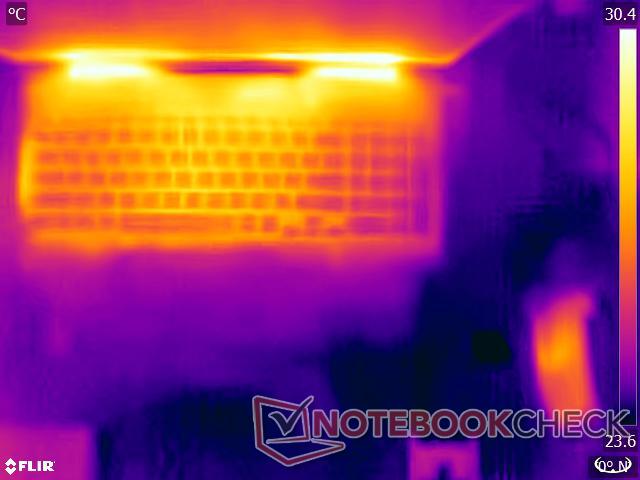
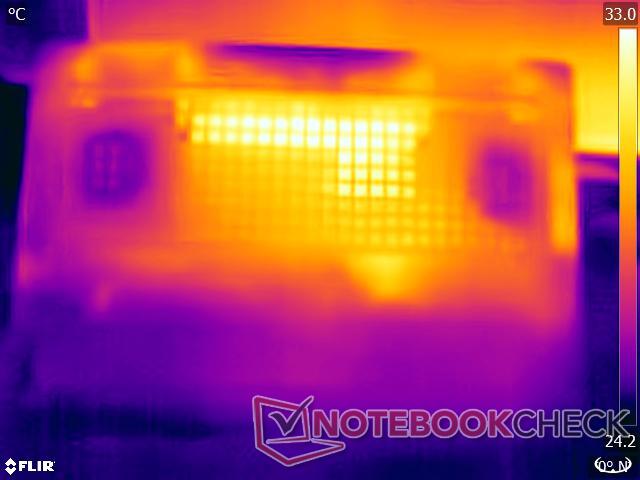
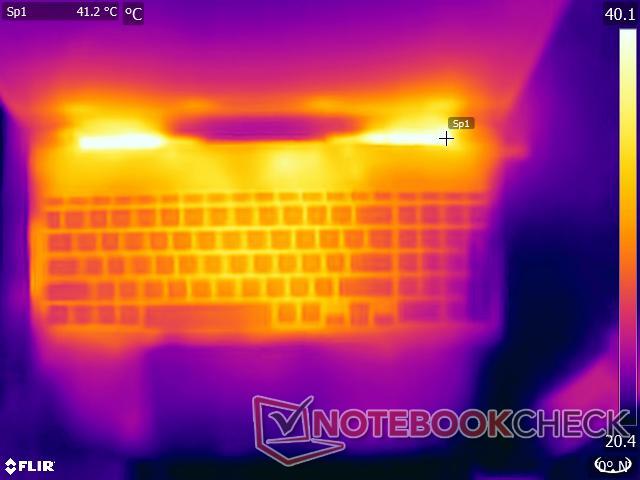
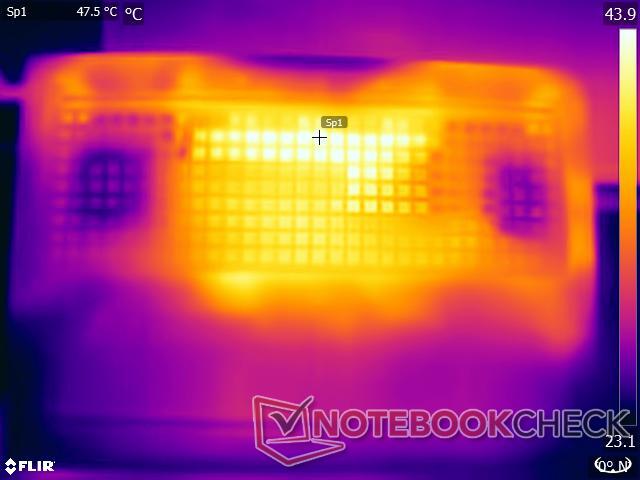
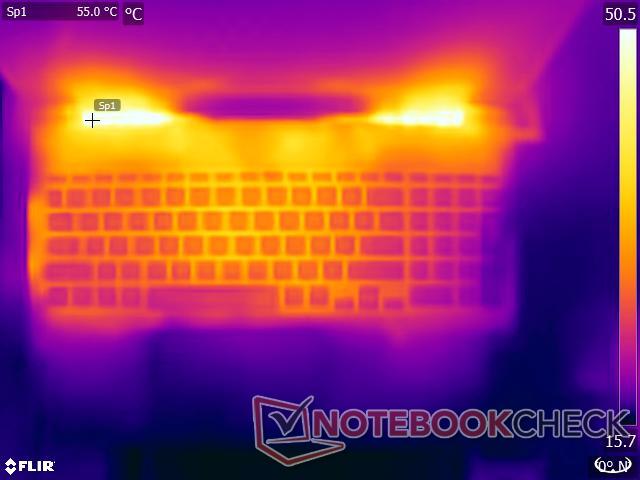
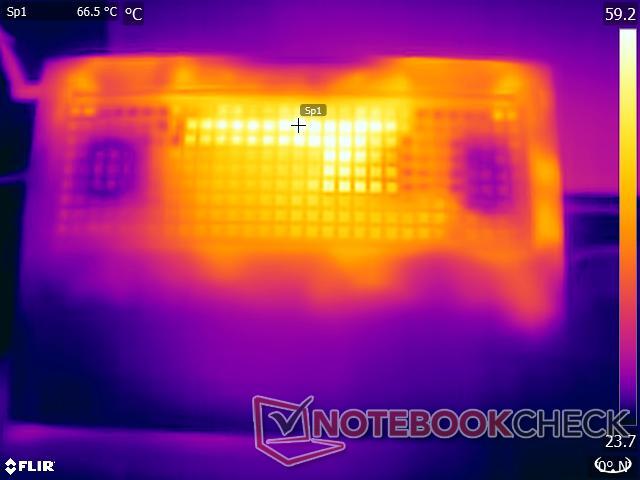
Dès le départ, le HP Victus 16 devient chaud au toucher après un certain temps de jeu. Son châssis en plastique n'isole pas bien la chaleur générée par ses composants gourmands en énergie. Le clavier, en particulier, devient sensiblement plus chaud après quelques minutes de jeu.
Les choix de conception de HP font qu'une partie de la chaleur est rejetée dans toutes les directions. Nos tests ont déterminé que la zone directement adjacente à l'évent pouvait atteindre une température de 48° C sous charge. C'est la température la plus élevée que l'ordinateur portable atteint, les zones environnantes oscillant entre 44° C et 45,8 °C.
(-) La température maximale du côté supérieur est de 48 °C / 118 F, par rapport à la moyenne de 40.4 °C / 105 F, allant de 21.2 à 68.8 °C pour la classe Gaming.
(-) Le fond chauffe jusqu'à un maximum de 48 °C / 118 F, contre une moyenne de 43.2 °C / 110 F
(+) En utilisation inactive, la température moyenne du côté supérieur est de 28 °C / 82 F, par rapport à la moyenne du dispositif de 33.9 °C / 93 F.
(-) En jouant à The Witcher 3, la température moyenne du côté supérieur est de 38.7 °C / 102 F, alors que la moyenne de l'appareil est de 33.9 °C / 93 F.
(+) Les repose-poignets et le pavé tactile sont plus froids que la température de la peau avec un maximum de 31.2 °C / 88.2 F et sont donc froids au toucher.
(-) La température moyenne de la zone de l'appui-paume de dispositifs similaires était de 28.8 °C / 83.8 F (-2.4 °C / #-4.4 F).
| HP Victus 16-r0076TX Intel Core i5-13500HX, NVIDIA GeForce RTX 4050 Laptop GPU | Acer Nitro 16 AN16-41-R7YE AMD Ryzen 5 7535HS, NVIDIA GeForce RTX 4050 Laptop GPU | Acer Predator Triton 14 PT14-51 Intel Core i7-13700H, NVIDIA GeForce RTX 4050 Laptop GPU | Alienware m16 R1 Intel Intel Core i7-13700HX, NVIDIA GeForce RTX 4060 Laptop GPU | Acer Predator Helios 16 PH16-71-731Q Intel Core i7-13700HX, NVIDIA GeForce RTX 4060 Laptop GPU | Dell G15 5530 Intel Core i7-13650HX, NVIDIA GeForce RTX 4060 Laptop GPU | Lenovo Legion Pro 5 16ARX8 (R5 7645HX, RTX 4050) AMD Ryzen 5 7645HX, NVIDIA GeForce RTX 4050 Laptop GPU | Lenovo LOQ 15APH8 AMD Ryzen 7 7840HS, NVIDIA GeForce RTX 4050 Laptop GPU | |
|---|---|---|---|---|---|---|---|---|
| Heat | -15% | -10% | -17% | -17% | -17% | -14% | 2% | |
| Maximum Upper Side * (°C) | 48 | 51 -6% | 54 -13% | 49 -2% | 41 15% | 54 -13% | 45 6% | 44.4 7% |
| Maximum Bottom * (°C) | 48 | 63 -31% | 56 -17% | 48 -0% | 66 -38% | 62.2 -30% | 54 -13% | 52 -8% |
| Idle Upper Side * (°C) | 29.6 | 34 -15% | 31 -5% | 40 -35% | 36 -22% | 33.4 -13% | 36 -22% | 28 5% |
| Idle Bottom * (°C) | 30.2 | 32 -6% | 31 -3% | 39 -29% | 37 -23% | 33.4 -11% | 38 -26% | 29.6 2% |
* ... Moindre est la valeur, meilleures sont les performances
Test de stress
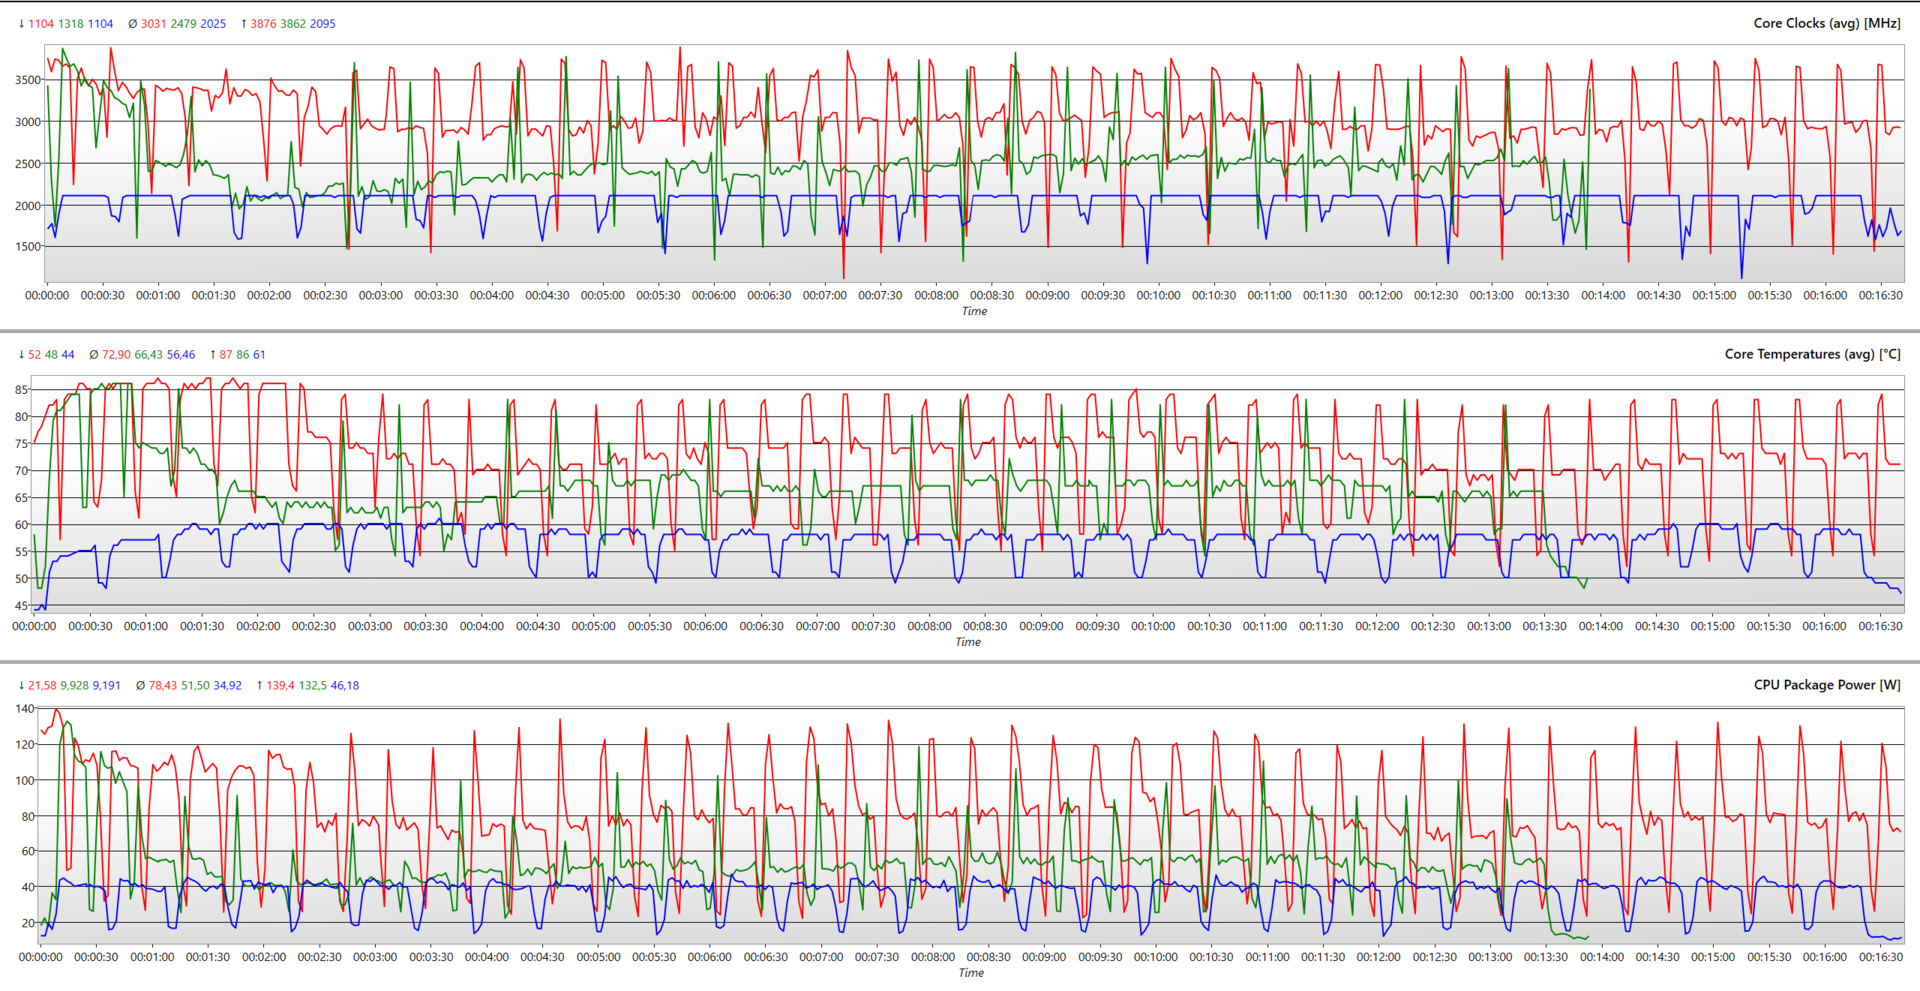
Sous des charges soutenues, le CPU et le GPU du HP Victus 16 subissent une baisse notable de leur vitesse d'horloge. Le processeur Core i5-13500HX peut atteindre 2,8 GHz pendant un certain temps avant de se stabiliser à environ 1,69 GHz. Sa température oscille autour de 77°C.
De même, la carte GeForce RTX 4050 tente de maintenir ses horloges à 2 580 MHz, mais se stabilise finalement à 2 420 MHz, ce qui correspond aux horloges de boost annoncées par Nvidia. Il chauffe un peu plus que le CPU, avec une température moyenne de 82,5°C, grâce aux deux ventilateurs puissants et aux caloducs qui évacuent la chaleur par des évents.
Le cœur P peut atteindre 4,4 GHz pendant une courte période, soit un peu moins que les 4,7 GHz annoncés par Intel. De même, le cœur E atteint 3,49 GHz, soit un peu moins que les 3,50 GHz annoncés. En moyenne, l'horloge globale peut atteindre 3,8 GHz. Au bout d'un certain temps, elle se stabilise autour de 2,53 GHz.
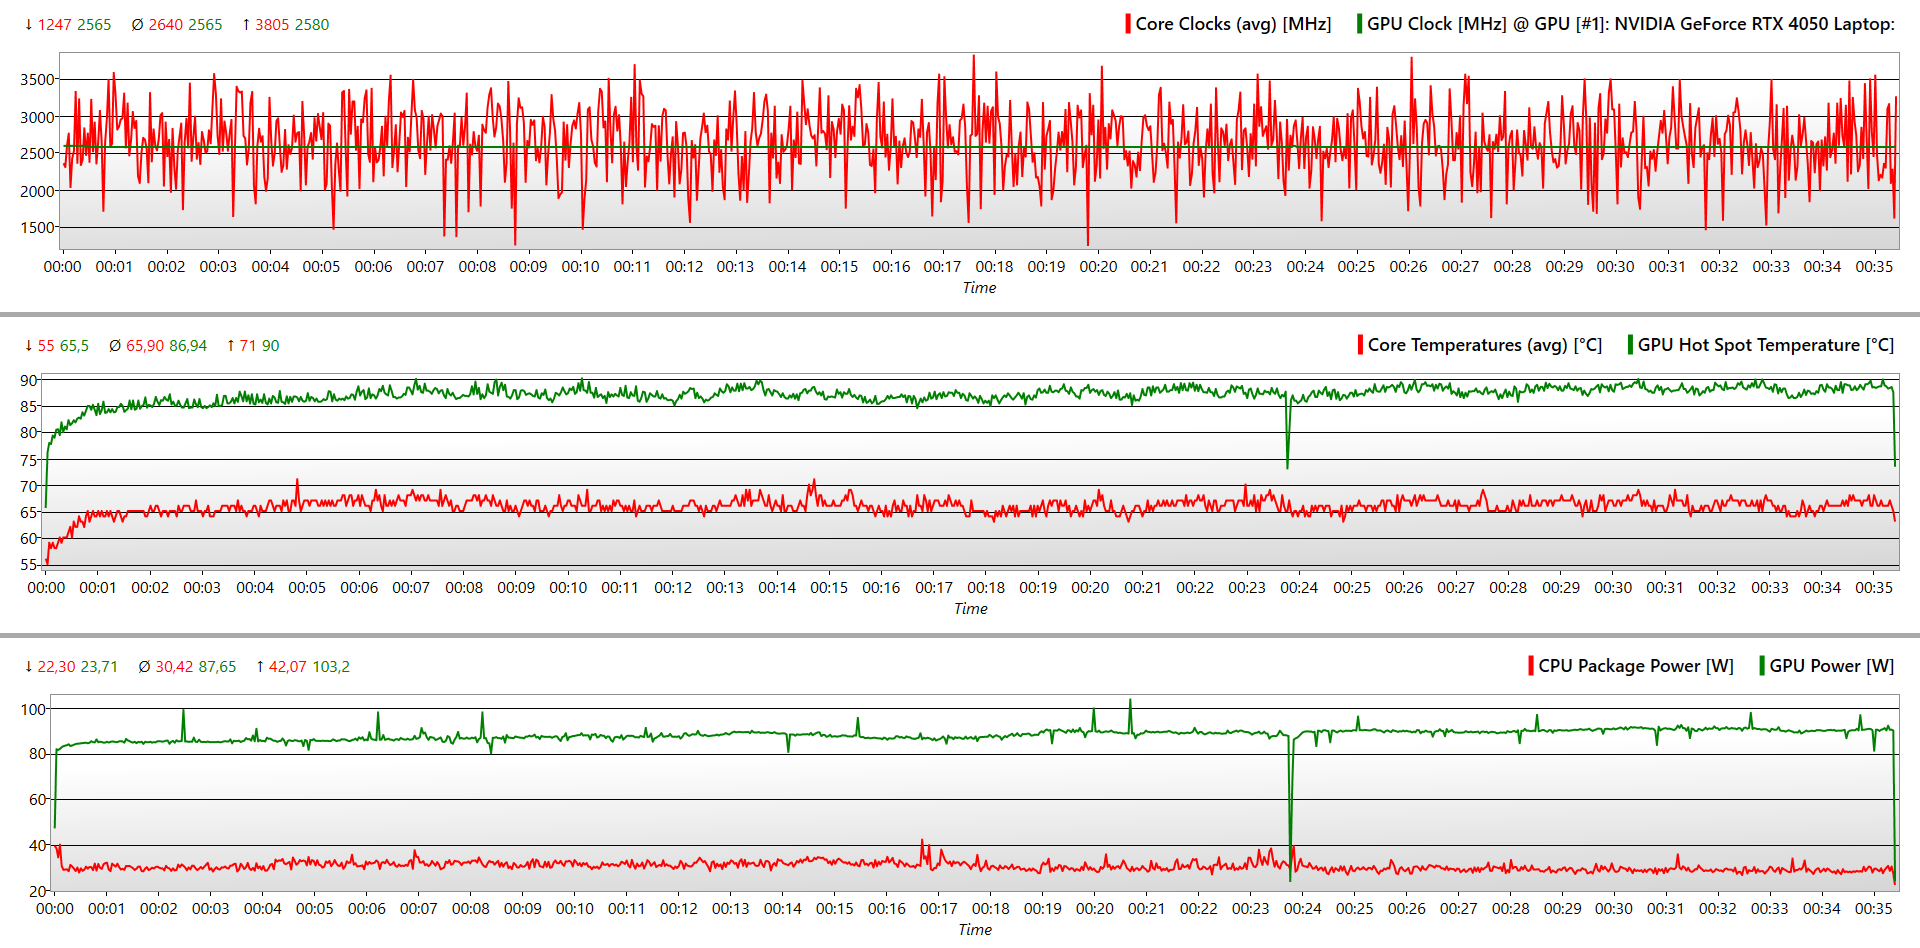
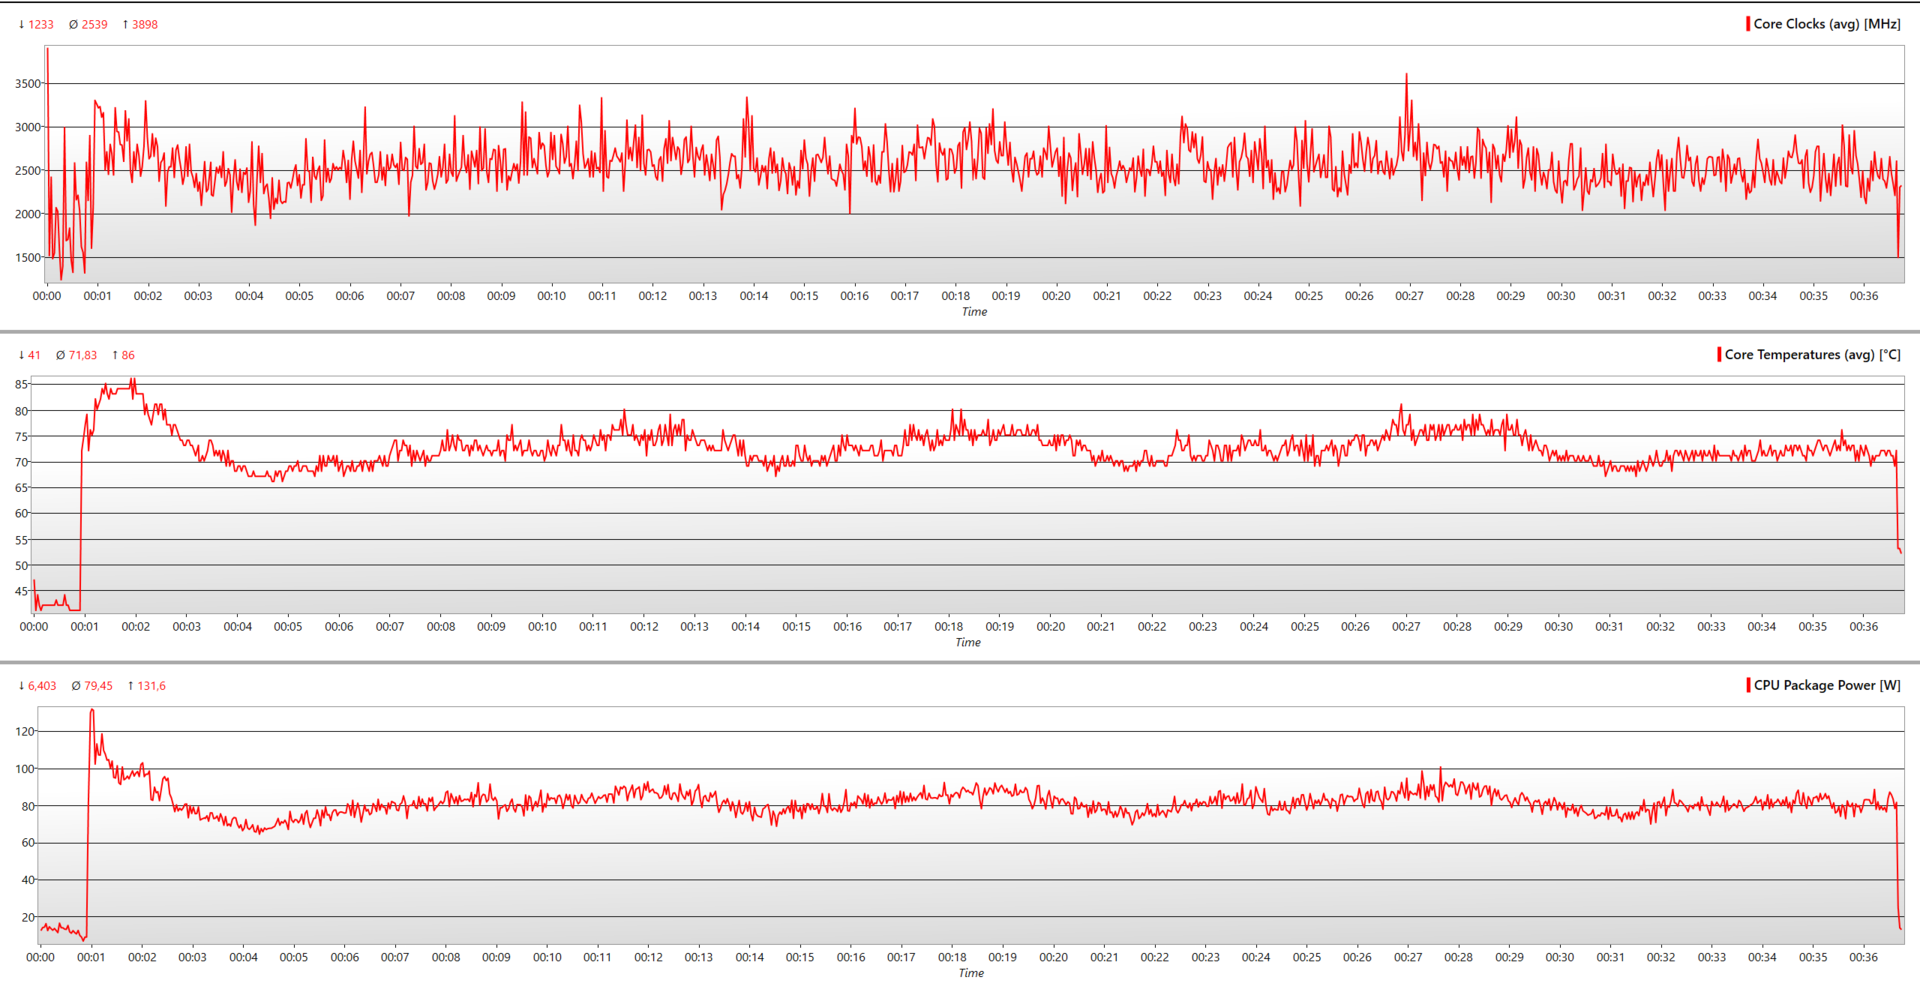
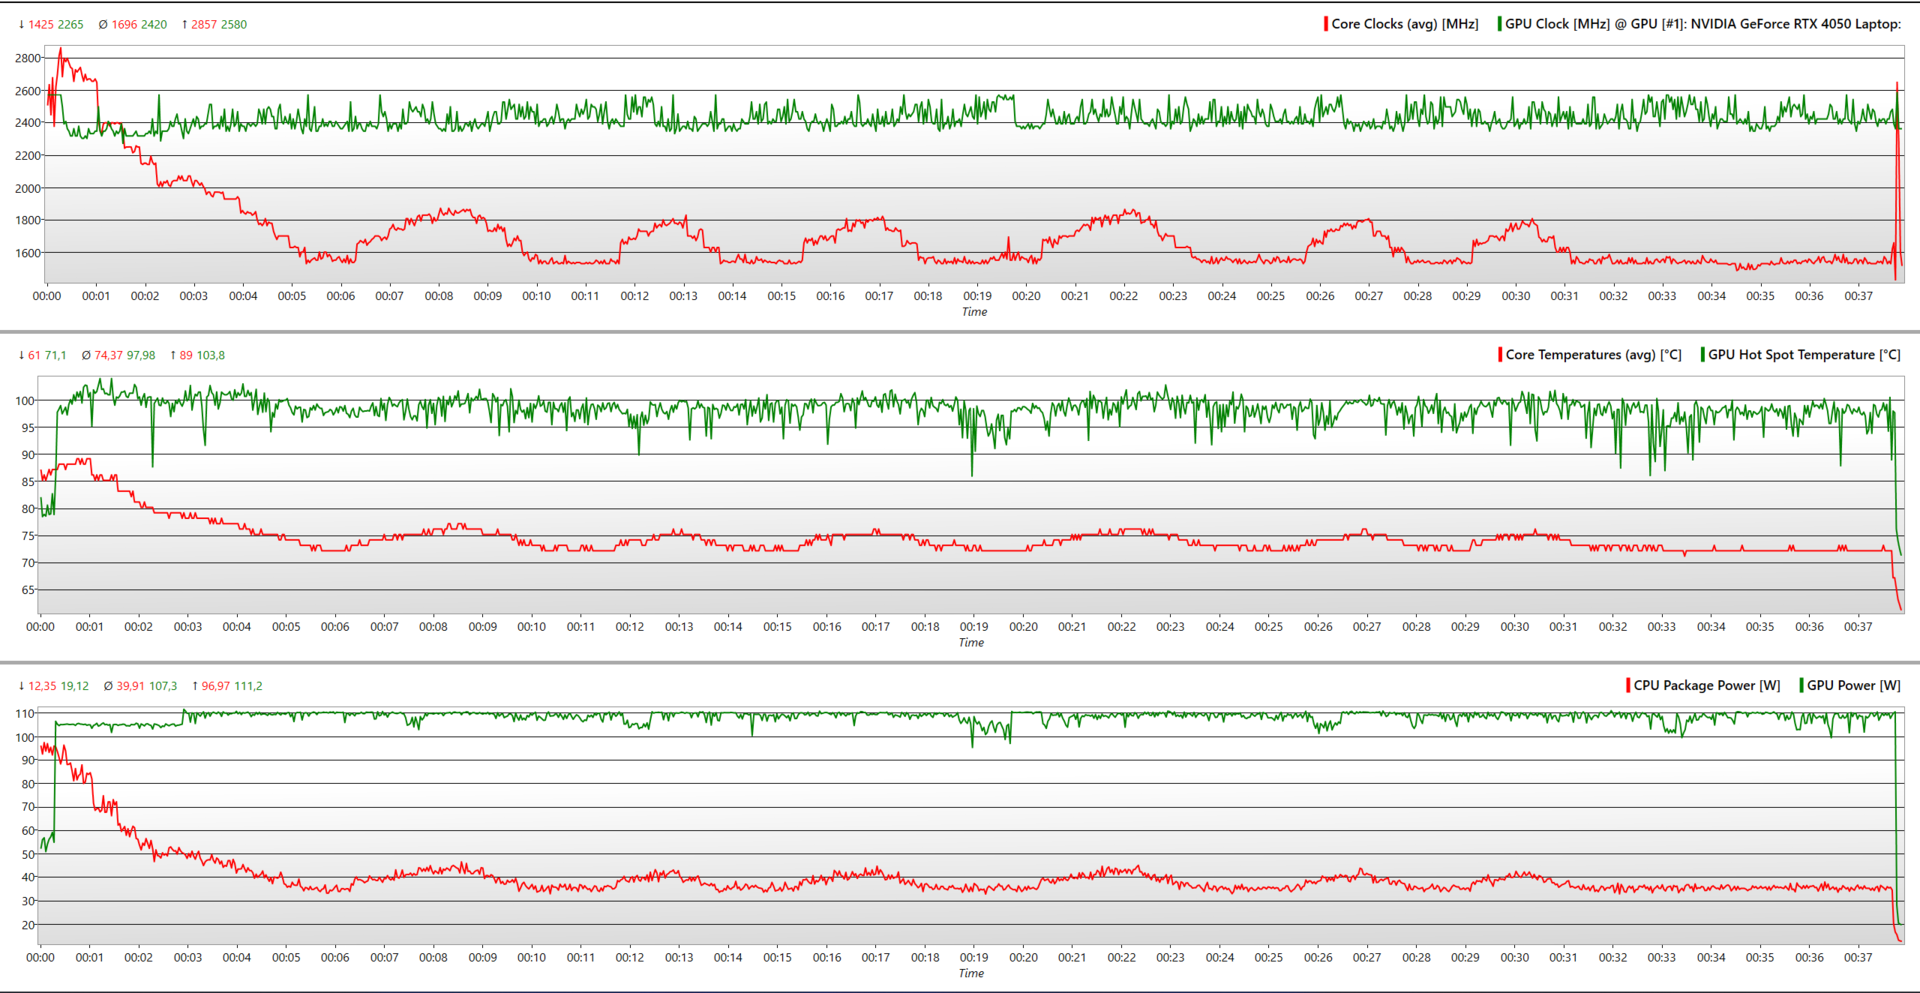
| Stress | Horloge du CPU (GHz) | Horloge du GPU (MHz) | Température moyenne du CPU (°C) | Température moyenne du GPU (°C) |
| Système au repos | 1.755 | 700 | 41 | 45 |
| Prime95 | 2.539 | 500 | 82.5 | 63.1 |
| Prime95 + FurMark | 1.696 | 2,420 | 77.2 | 82.5 |
| The Witcher 3 1080p Ultra | 3.047 | 2,565 | 80 | 74 |
Intervenants
Avec un volume maximal de 70,7 dB(A), ils sont à peine plus bruyants que le ventilateur dans des conditions de stress. Les haut-parleurs eux-mêmes sont minuscules et n'ont rien d'extraordinaire.
Cela dit, HP a fait quelques efforts et a inclus un réglage B&O (Bang and Olufsen). Il en résulte des médiums et des aigus respectables, mais on ne peut pas en dire autant des graves. C'est parfait pour la consommation de vidéos, mais la qualité audio risque d'être compromise si les ventilateurs décident de monter en puissance.
Vous pouvez également connecter un casque/des haut-parleurs via la prise audio de 3,5 mm ou opter pour une connexion sans fil avec le Bluetooth 5.3.
HP Victus 16-r0076TX analyse audio
(-) | haut-parleurs pas très forts (70.7 dB)
Basses 100 - 315 Hz
(±) | basse réduite - en moyenne 9.7% inférieure à la médiane
(±) | la linéarité des basses est moyenne (7.6% delta à la fréquence précédente)
Médiums 400 - 2000 Hz
(+) | médiane équilibrée - seulement 3.2% de la médiane
(+) | les médiums sont linéaires (2.5% delta à la fréquence précédente)
Aiguës 2 - 16 kHz
(+) | des sommets équilibrés - à seulement 4% de la médiane
(+) | les aigus sont linéaires (5.7% delta à la fréquence précédente)
Globalement 100 - 16 000 Hz
(±) | la linéarité du son global est moyenne (15.4% de différence avec la médiane)
Par rapport à la même classe
» 34% de tous les appareils testés de cette catégorie étaient meilleurs, 7% similaires, 59% pires
» Le meilleur avait un delta de 6%, la moyenne était de 18%, le pire était de 132%.
Par rapport à tous les appareils testés
» 23% de tous les appareils testés étaient meilleurs, 4% similaires, 73% pires
» Le meilleur avait un delta de 4%, la moyenne était de 23%, le pire était de 134%.
Apple MacBook Pro 16 2021 M1 Pro analyse audio
(+) | les haut-parleurs peuvent jouer relativement fort (84.7# dB)
Basses 100 - 315 Hz
(+) | bonne basse - seulement 3.8% loin de la médiane
(+) | les basses sont linéaires (5.2% delta à la fréquence précédente)
Médiums 400 - 2000 Hz
(+) | médiane équilibrée - seulement 1.3% de la médiane
(+) | les médiums sont linéaires (2.1% delta à la fréquence précédente)
Aiguës 2 - 16 kHz
(+) | des sommets équilibrés - à seulement 1.9% de la médiane
(+) | les aigus sont linéaires (2.7% delta à la fréquence précédente)
Globalement 100 - 16 000 Hz
(+) | le son global est linéaire (4.6% différence à la médiane)
Par rapport à la même classe
» 0% de tous les appareils testés de cette catégorie étaient meilleurs, 0% similaires, 100% pires
» Le meilleur avait un delta de 5%, la moyenne était de 17%, le pire était de 45%.
Par rapport à tous les appareils testés
» 0% de tous les appareils testés étaient meilleurs, 0% similaires, 100% pires
» Le meilleur avait un delta de 4%, la moyenne était de 23%, le pire était de 134%.
Gestion de l'énergie : L'autonomie de la batterie aurait pu être meilleure
Consommation électrique
Le processeur Raptor Lake-HX et le GPU Ada Lovelace du HP Victus 16 ne font qu'une bouchée de la brique d'alimentation de 230 watts fournie en consommant jusqu'à 237 watts. Cependant, la situation est bien meilleure au ralenti, avec une consommation maximale de 22,1 watts.
Cette valeur ne change pas beaucoup avec les processeurs HX d'AMD que l'on trouve chez ses concurrents. Il est intéressant de noter que le Dell G5 15's Core i7-13700HX est un peu plus efficace au ralenti, avec une consommation moyenne de 14,98 Watts.
| Éteint/en veille | |
| Au repos | |
| Fortement sollicité |
|
Légende:
min: | |
| HP Victus 16-r0076TX i5-13500HX, GeForce RTX 4050 Laptop GPU, SK hynix PC801 HFS512GEJ9X101N BF, IPS, 1920x1080, 16.1" | Acer Nitro 16 AN16-41-R7YE R5 7535HS, GeForce RTX 4050 Laptop GPU, SK hynix HFS512GEJ9X125N, IPS, 1920x1200, 16" | Acer Predator Helios 16 PH16-71-731Q i7-13700HX, GeForce RTX 4060 Laptop GPU, Micron 3400 1TB MTFDKBA1T0TFH, IPS-LED, 2560x1600, 16" | Dell G15 5530 i7-13650HX, GeForce RTX 4060 Laptop GPU, SSTC CL4-3D512-Q11, IPS, 1920x1080, 15.6" | Lenovo Legion Pro 5 16ARX8 (R5 7645HX, RTX 4050) R5 7645HX, GeForce RTX 4050 Laptop GPU, SK hynix PC801 HFS512GEJ9X115N, IPS, 2560x1600, 16" | Lenovo LOQ 15APH8 R7 7840HS, GeForce RTX 4050 Laptop GPU, Micron 2450 512GB MTFDKCD512TFK, IPS, 1920x1080, 15.6" | Moyenne NVIDIA GeForce RTX 4050 Laptop GPU | Moyenne de la classe Gaming | |
|---|---|---|---|---|---|---|---|---|
| Power Consumption | 7% | -5% | 13% | 12% | 15% | 21% | -2% | |
| Idle Minimum * (Watt) | 16.12 | 19 -18% | 15.9 1% | 8.4 48% | 13 19% | 15 7% | 9.95 ? 38% | 13 ? 19% |
| Idle Average * (Watt) | 20.47 | 20 2% | 20.5 -0% | 14.98 27% | 17.4 15% | 17.7 14% | 15.8 ? 23% | 19 ? 7% |
| Idle Maximum * (Watt) | 22.11 | 23 -4% | 20.9 5% | 15.56 30% | 21.8 1% | 21.5 3% | 20.1 ? 9% | 24.5 ? -11% |
| Load Average * (Watt) | 94.8 | 80 16% | 106 -12% | 96.8 -2% | 96.4 -2% | 73.5 22% | 88 ? 7% | 111.1 ? -17% |
| Witcher 3 ultra * (Watt) | 166.9 | 125.8 25% | 175 -5% | 186 -11% | 125 25% | 138.6 17% | ||
| Load Maximum * (Watt) | 237 | 184 22% | 276 -16% | 271.42 -15% | 204 14% | 176.5 26% | 176.3 ? 26% | 260 ? -10% |
* ... Moindre est la valeur, meilleures sont les performances
Power Consumption: The Witcher 3 / Stress test
Power Consumption: External monitor
Autonomie de la batterie
Le HP Victus 16 est doté d'une batterie respectable de 83 Wh. Une batterie de 99 Wh aurait été idéale, mais elle est réservée aux modèles haut de gamme.
Lors de notre test de navigation en Wi-Fi avec une luminosité de 150 nits, nous avons obtenu une autonomie d'environ 8 heures et 51 minutes. En augmentant la luminosité au maximum, ce chiffre a été ramené à 8 heures et 10 minutes.
Il est intéressant de noter que l'ordinateur portable s'est moins bien comporté dans le test Big Buck Bunny FHD H.264 avec une luminosité de 150 nits et toutes les radios (Wi-Fi, Bluetooth) désactivées. Il n'a tenu que 7 heures et 39 minutes. Dans un scénario idéal, ce chiffre aurait dû être plus élevé.
Enfin, il a rendu l'âme après seulement 1 heure et 31 minutes dans notre test The Witcher 3 avec une luminosité de 150 nits et le jeu fonctionnant en réglages "Ultra". Ce chiffre est passé à 1 heure et 11 minutes avec une charge combinée de Prime95 et FurMark.
| HP Victus 16-r0076TX i5-13500HX, GeForce RTX 4050 Laptop GPU, 83 Wh | Alienware m16 R1 Intel i7-13700HX, GeForce RTX 4060 Laptop GPU, 86 Wh | Acer Predator Helios 16 PH16-71-731Q i7-13700HX, GeForce RTX 4060 Laptop GPU, 90 Wh | Dell G15 5530 i7-13650HX, GeForce RTX 4060 Laptop GPU, 86 Wh | Lenovo Legion Pro 5 16ARX8 (R5 7645HX, RTX 4050) R5 7645HX, GeForce RTX 4050 Laptop GPU, 80 Wh | Lenovo LOQ 15APH8 R7 7840HS, GeForce RTX 4050 Laptop GPU, 60 Wh | Moyenne de la classe Gaming | |
|---|---|---|---|---|---|---|---|
| Autonomie de la batterie | -30% | -13% | -30% | -38% | -13% | 4% | |
| H.264 (h) | 7.7 | 5.6 -27% | 4.8 -38% | 6.8 -12% | 5.4 -30% | 8.32 ? 8% | |
| WiFi v1.3 (h) | 8.9 | 4.8 -46% | 5.6 -37% | 6.5 -27% | 5.6 -37% | 7.4 -17% | 7.11 ? -20% |
| Witcher 3 ultra (h) | 1.5 | 1.5 0% | 0.8 -47% | 0.8 -47% | |||
| Load (h) | 1.2 | 1 -17% | 1.5 25% | 0.8 -33% | 1.1 -8% | 1.502 ? 25% | |
| Reader / Idle (h) | 6.4 | 9.8 | 8.27 ? |
Points positifs
Points négatifs
Verdict : Un ordinateur portable de jeu 1080p décent pour ceux qui disposent d'un budget limité
Le HP Victus 16 est un ordinateur portable de jeu décent, mais pas sans défauts. Malgré les efforts de l'entreprise pour contrôler les températures avec ses deux ventilateurs et un labyrinthe de dissipateurs thermiques, nous constatons toujours des émissions thermiques élevées.
D'emblée, le processeur Raptor Lake-HX se montre à la hauteur, permettant à l'ordinateur portable de surpasser des concurrents mieux équipés comme le Lenovo Legion Pro 5 16ARX8 avec le processeur Ryzen 5 7645HX et le même GPU.
Ensuite, il y a le problème des bloatwares. Nous aimons tous un bon service VPN, mais cela devient ennuyeux quand des popups ExpressVPN apparaissent toutes les quelques minutes. Et non, l'ordinateur portable n'est pas livré avec un plan ExpressVPN.
Le HP Victus 16 est une machine de jeu 1080p idéale pour les amateurs d'e-sport à petit budget grâce à son puissant processeur et à son écran 165 Hz, si vous pouvez supporter son bruit et ses températures.
Actuellement, il y a très peu d'ordinateurs portables sur le marché avec des processeurs Raptor Lake-HX d'entrée de gamme. Rien que pour cela, le HP Victus 16 a une longueur d'avance sur le Nitro 16 d'Acer Acer Nitro 16 AN16-41 et le Lenovo LOQ 15.
Prix et disponibilité
Le HP Victus 16 peut être acheté sur le site de HP India au prix de ȉ12990 euros au prix de 129 990 euros. Une variante moins chère avec les mêmes spécifications (Core i5-13500HX, GeForce RTX 4050, 16 Go RAM) et un écran bas de gamme de 144 Hz peut être obtenue pour 124 990 ₹124,990 ₹. Alternativement, sa version de dernière génération peut être achetée sur Amazon India pour ₹68,400. Sur Amazon US, une version mieux équipée avec un écran QHD (2.560 x 1.440), un processeur AMD Ryzen 7 7840HS et une carte de crédit AMD Ryzen 7 7840HSet une carte RTX 4060 ( GeForce ) au prix de 1 279 USD.
HP Victus 16-r0076TX
- 09/25/2023 v7 (old)
Anil Ganti
Transparency
La sélection des appareils à examiner est effectuée par notre équipe éditoriale. L'échantillon de test a été prêté à l'auteur par le fabricant ou le détaillant pour les besoins de cet examen. Le prêteur n'a pas eu d'influence sur cette évaluation et le fabricant n'a pas reçu de copie de cette évaluation avant sa publication. Il n'y avait aucune obligation de publier cet article. En tant que média indépendant, Notebookcheck n'est pas soumis à l'autorité des fabricants, des détaillants ou des éditeurs.
Voici comment Notebookcheck teste
Chaque année, Notebookcheck examine de manière indépendante des centaines d'ordinateurs portables et de smartphones en utilisant des procédures standardisées afin de garantir que tous les résultats sont comparables. Nous avons continuellement développé nos méthodes de test depuis environ 20 ans et avons établi des normes industrielles dans le processus. Dans nos laboratoires de test, des équipements de mesure de haute qualité sont utilisés par des techniciens et des rédacteurs expérimentés. Ces tests impliquent un processus de validation en plusieurs étapes. Notre système d'évaluation complexe repose sur des centaines de mesures et de points de référence bien fondés, ce qui garantit l'objectivité.Price comparison

