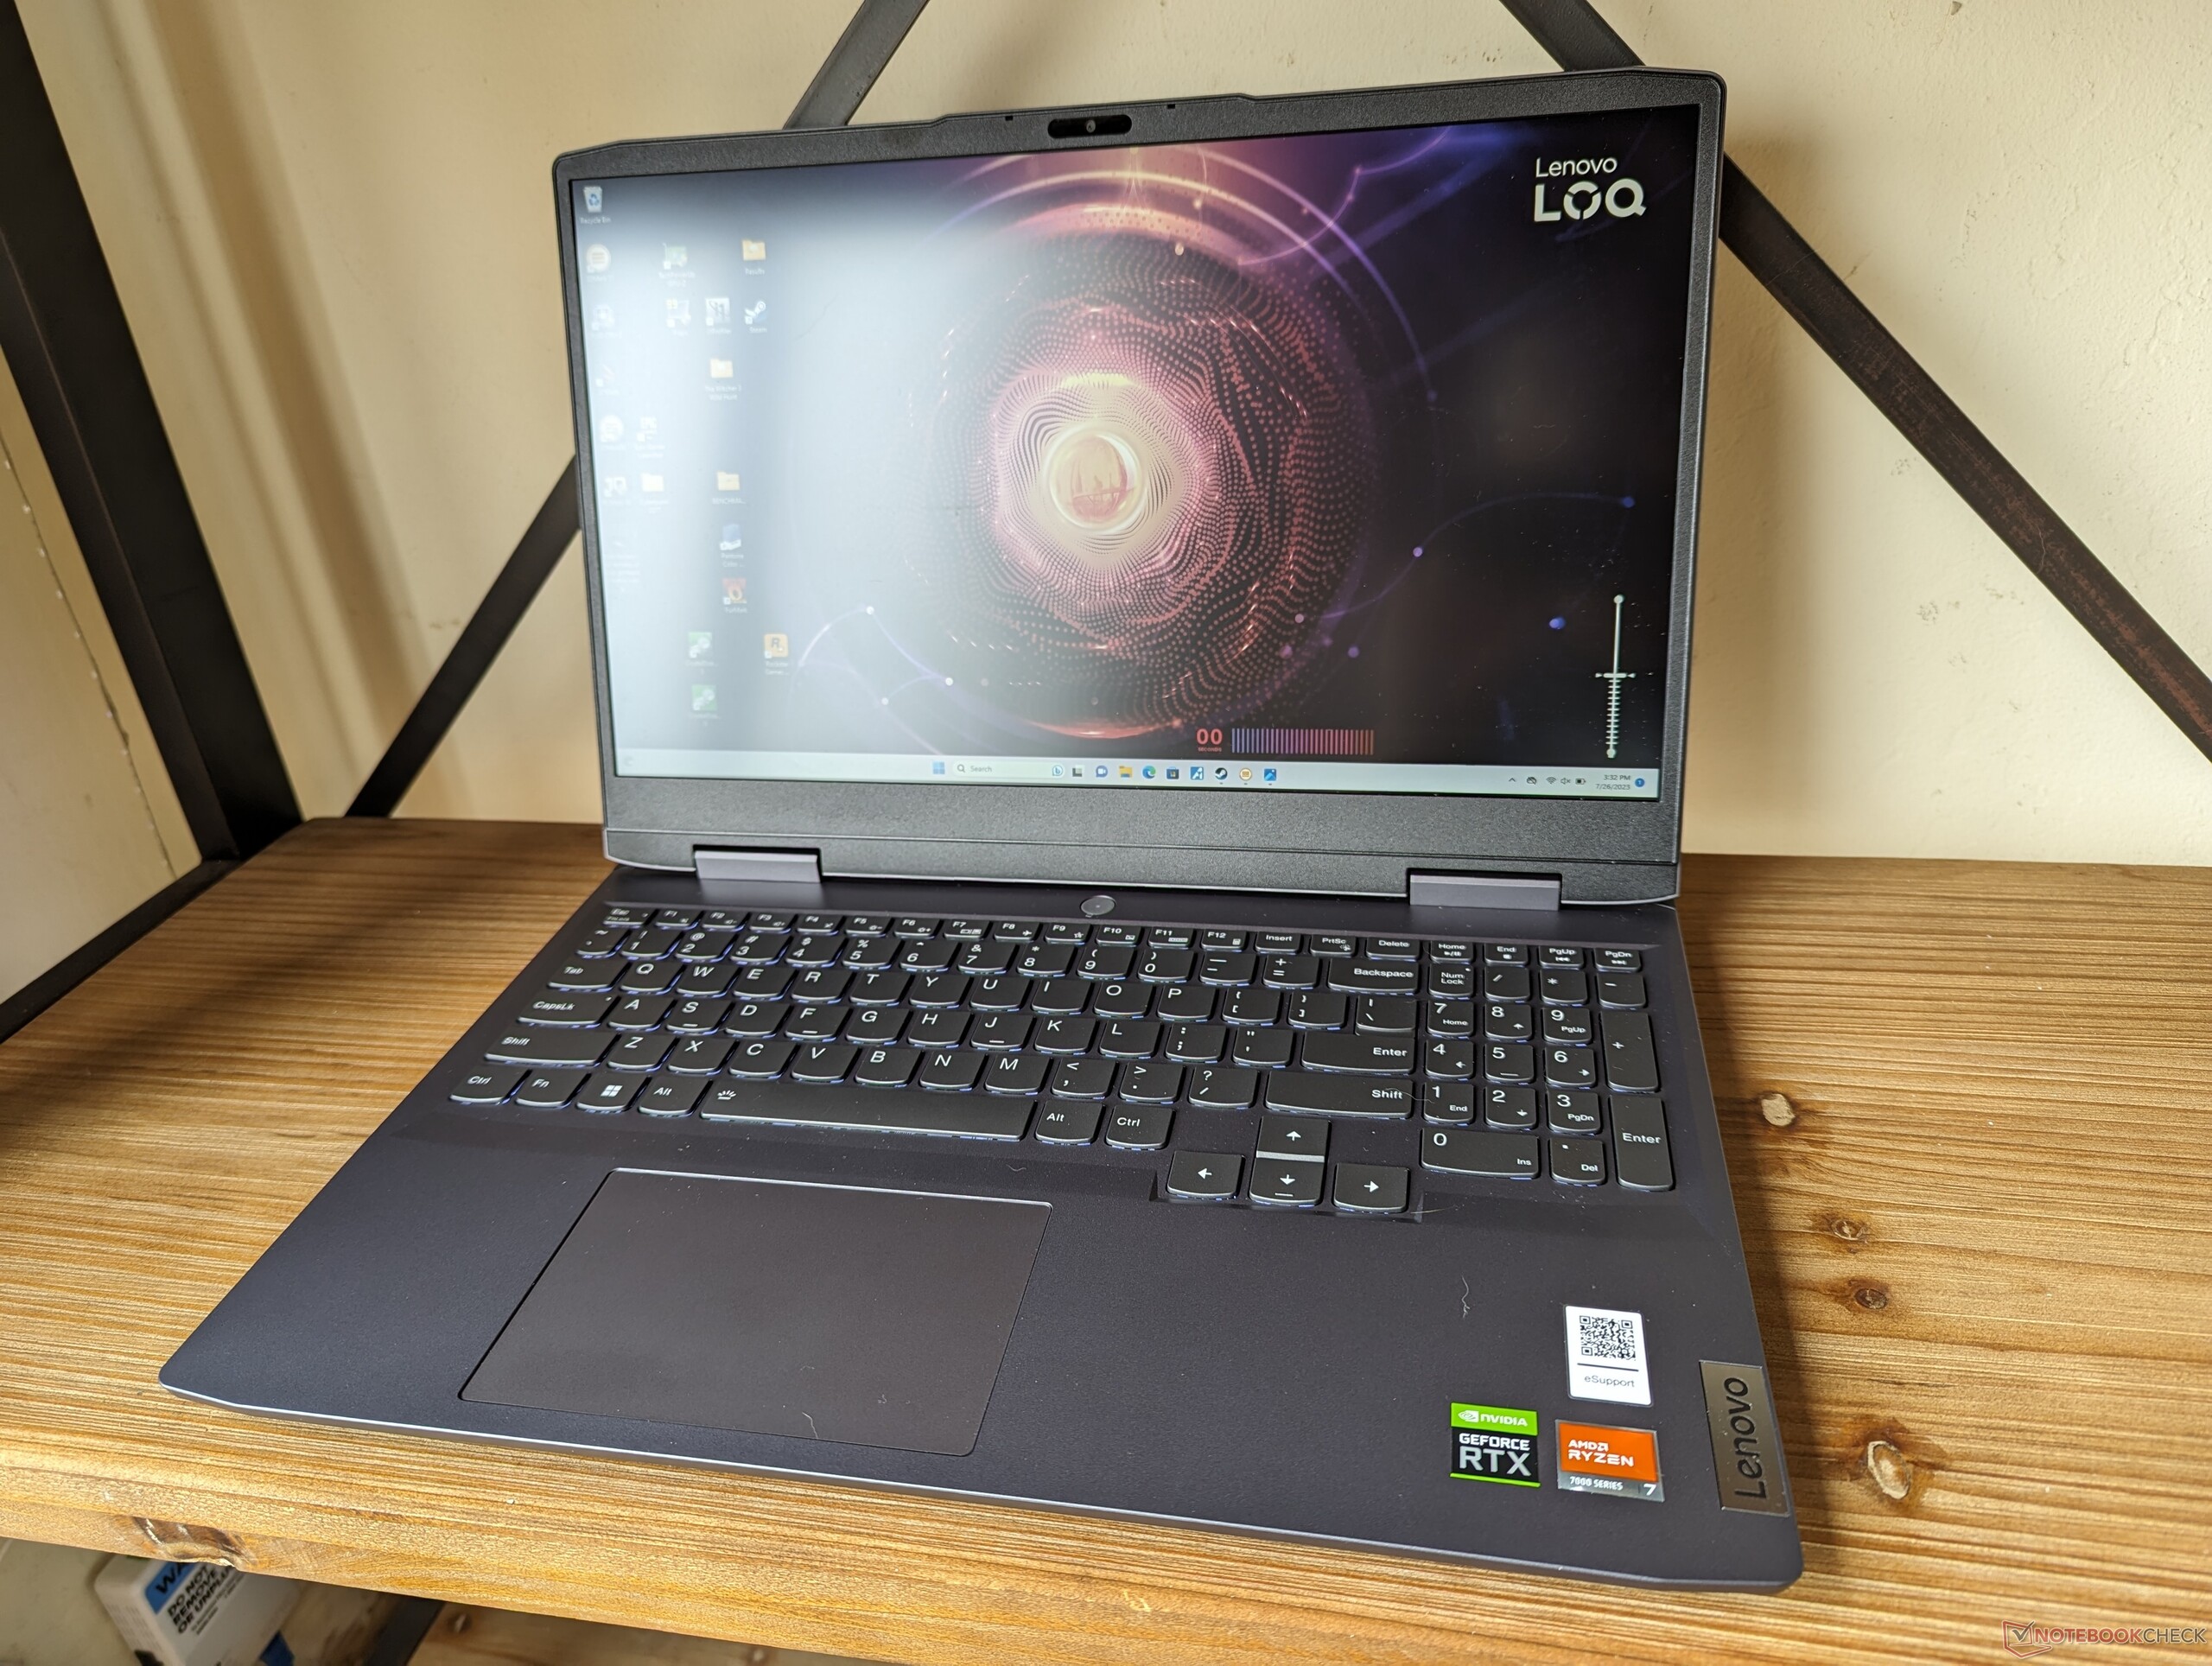
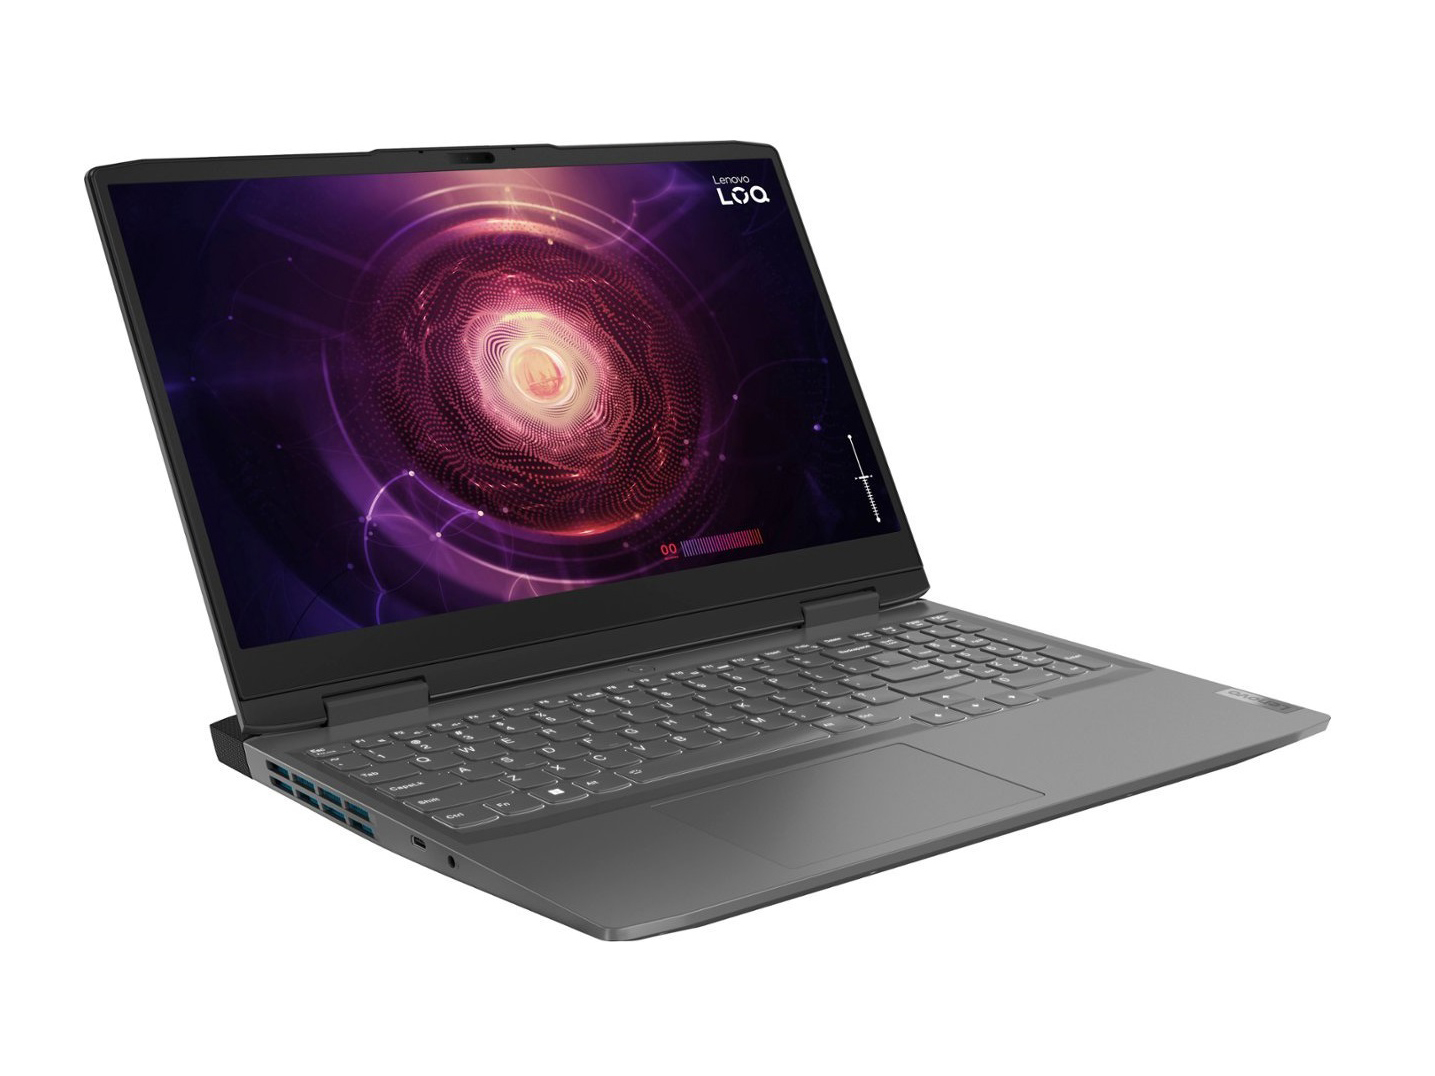
Test du Lenovo LOQ 15 Ryzen 7 7840HS : ordinateur portable Legion qui a de l'allure

La famille LOQ est constituée d'ordinateurs portables de jeu Lenovo à petit budget, conçus pour remplacer les anciens modèles de la série IdeaPad Gaming 3 IdeaPad Gaming 3. Le nouveau nom LOQ permet de créer une distance entre les produits gaming économiques et la série Ideapad, plus orientée vers le bureau à domicile ou les étudiants. Il ne s'agit pas non plus d'un produit Legion, Lenovo souhaitant positionner le nom Legion comme une série "phare" avec des machines de jeu haut de gamme uniquement.
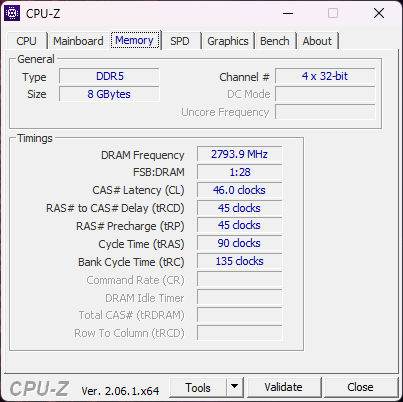
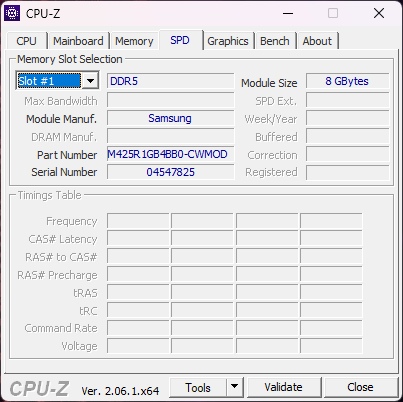
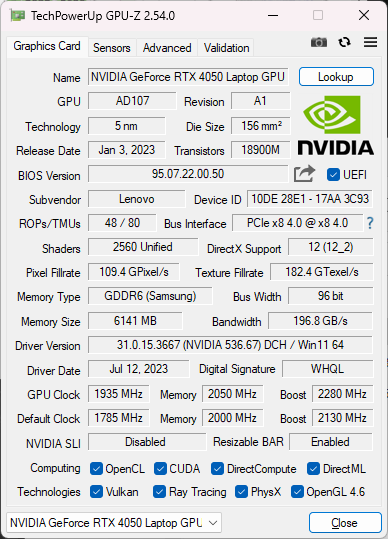
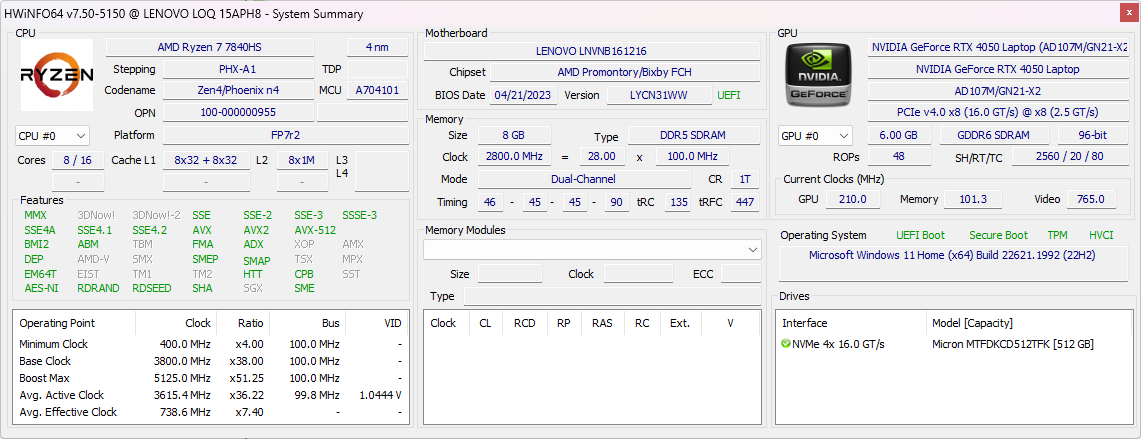
Notre modèle est une version AMD de milieu de gamme (15APH8) avec le processeur Zen 4 Ryzen 7 7840HS, le GPU GeForce RTX 4050 et un écran IPS 1080p 144 Hz, vendu au détail pour environ 1000 USD. Il n'est livré qu'avec 8 Go de mémoire vive, mais celle-ci est heureusement extensible par l'utilisateur. Il existe des SKU moins chers et plus chers avec le Ryzen 5 7640HS, RTX 3050 ou 4060, et un écran 1080p 60 Hz à 1440p 165 Hz allant de moins de $800 USD à plus de $1100 USD. Les versions Intel du LOQ 15 (15IRH8) sont également disponibles dans les tailles d'écran 15 pouces et 16 pouces (LOQ 16).
Parmi les concurrents, on trouve d'autres ordinateurs portables de jeu de 15 pouces à prix modique, comme le Dell G15 5530,Asus TUF A15 FA507,MSI Cyborg 15ou HP Victus 15.
Plus de commentaires sur Lenovo :
Comparaison avec les concurrents potentiels
Note | Date | Modèle | Poids | Épaisseur | Taille | Résolution | Prix |
|---|---|---|---|---|---|---|---|
| 85.7 % v7 (old) | 07/23 | Lenovo LOQ 15APH8 R7 7840HS, GeForce RTX 4050 Laptop GPU | 2.5 kg | 25.2 mm | 15.60" | 1920x1080 | |
| 87.5 % v7 (old) | 11/22 | Lenovo Legion 5 15IAH7H 82RB i7-12700H, GeForce RTX 3060 Laptop GPU | 2.4 kg | 19.99 mm | 15.60" | 1920x1080 | |
| 84.2 % v7 (old) | 06/23 | Dell G15 5530 i7-13650HX, GeForce RTX 4060 Laptop GPU | 3 kg | 26.95 mm | 15.60" | 1920x1080 | |
| 86.3 % v7 (old) | 06/23 | Asus TUF A15 FA507 R7 7735HS, GeForce RTX 4050 Laptop GPU | 2.2 kg | 24.9 mm | 15.60" | 1920x1080 | |
| 82.4 % v7 (old) | 04/23 | MSI Cyborg 15 A12VF i7-12650H, GeForce RTX 4060 Laptop GPU | 2 kg | 22.9 mm | 15.60" | 1920x1080 | |
| 81 % v7 (old) | 01/23 | HP Victus 15 fa0020nr i7-12700H, GeForce RTX 3050 Ti Laptop GPU | 2.3 kg | 23.6 mm | 15.60" | 1920x1080 |
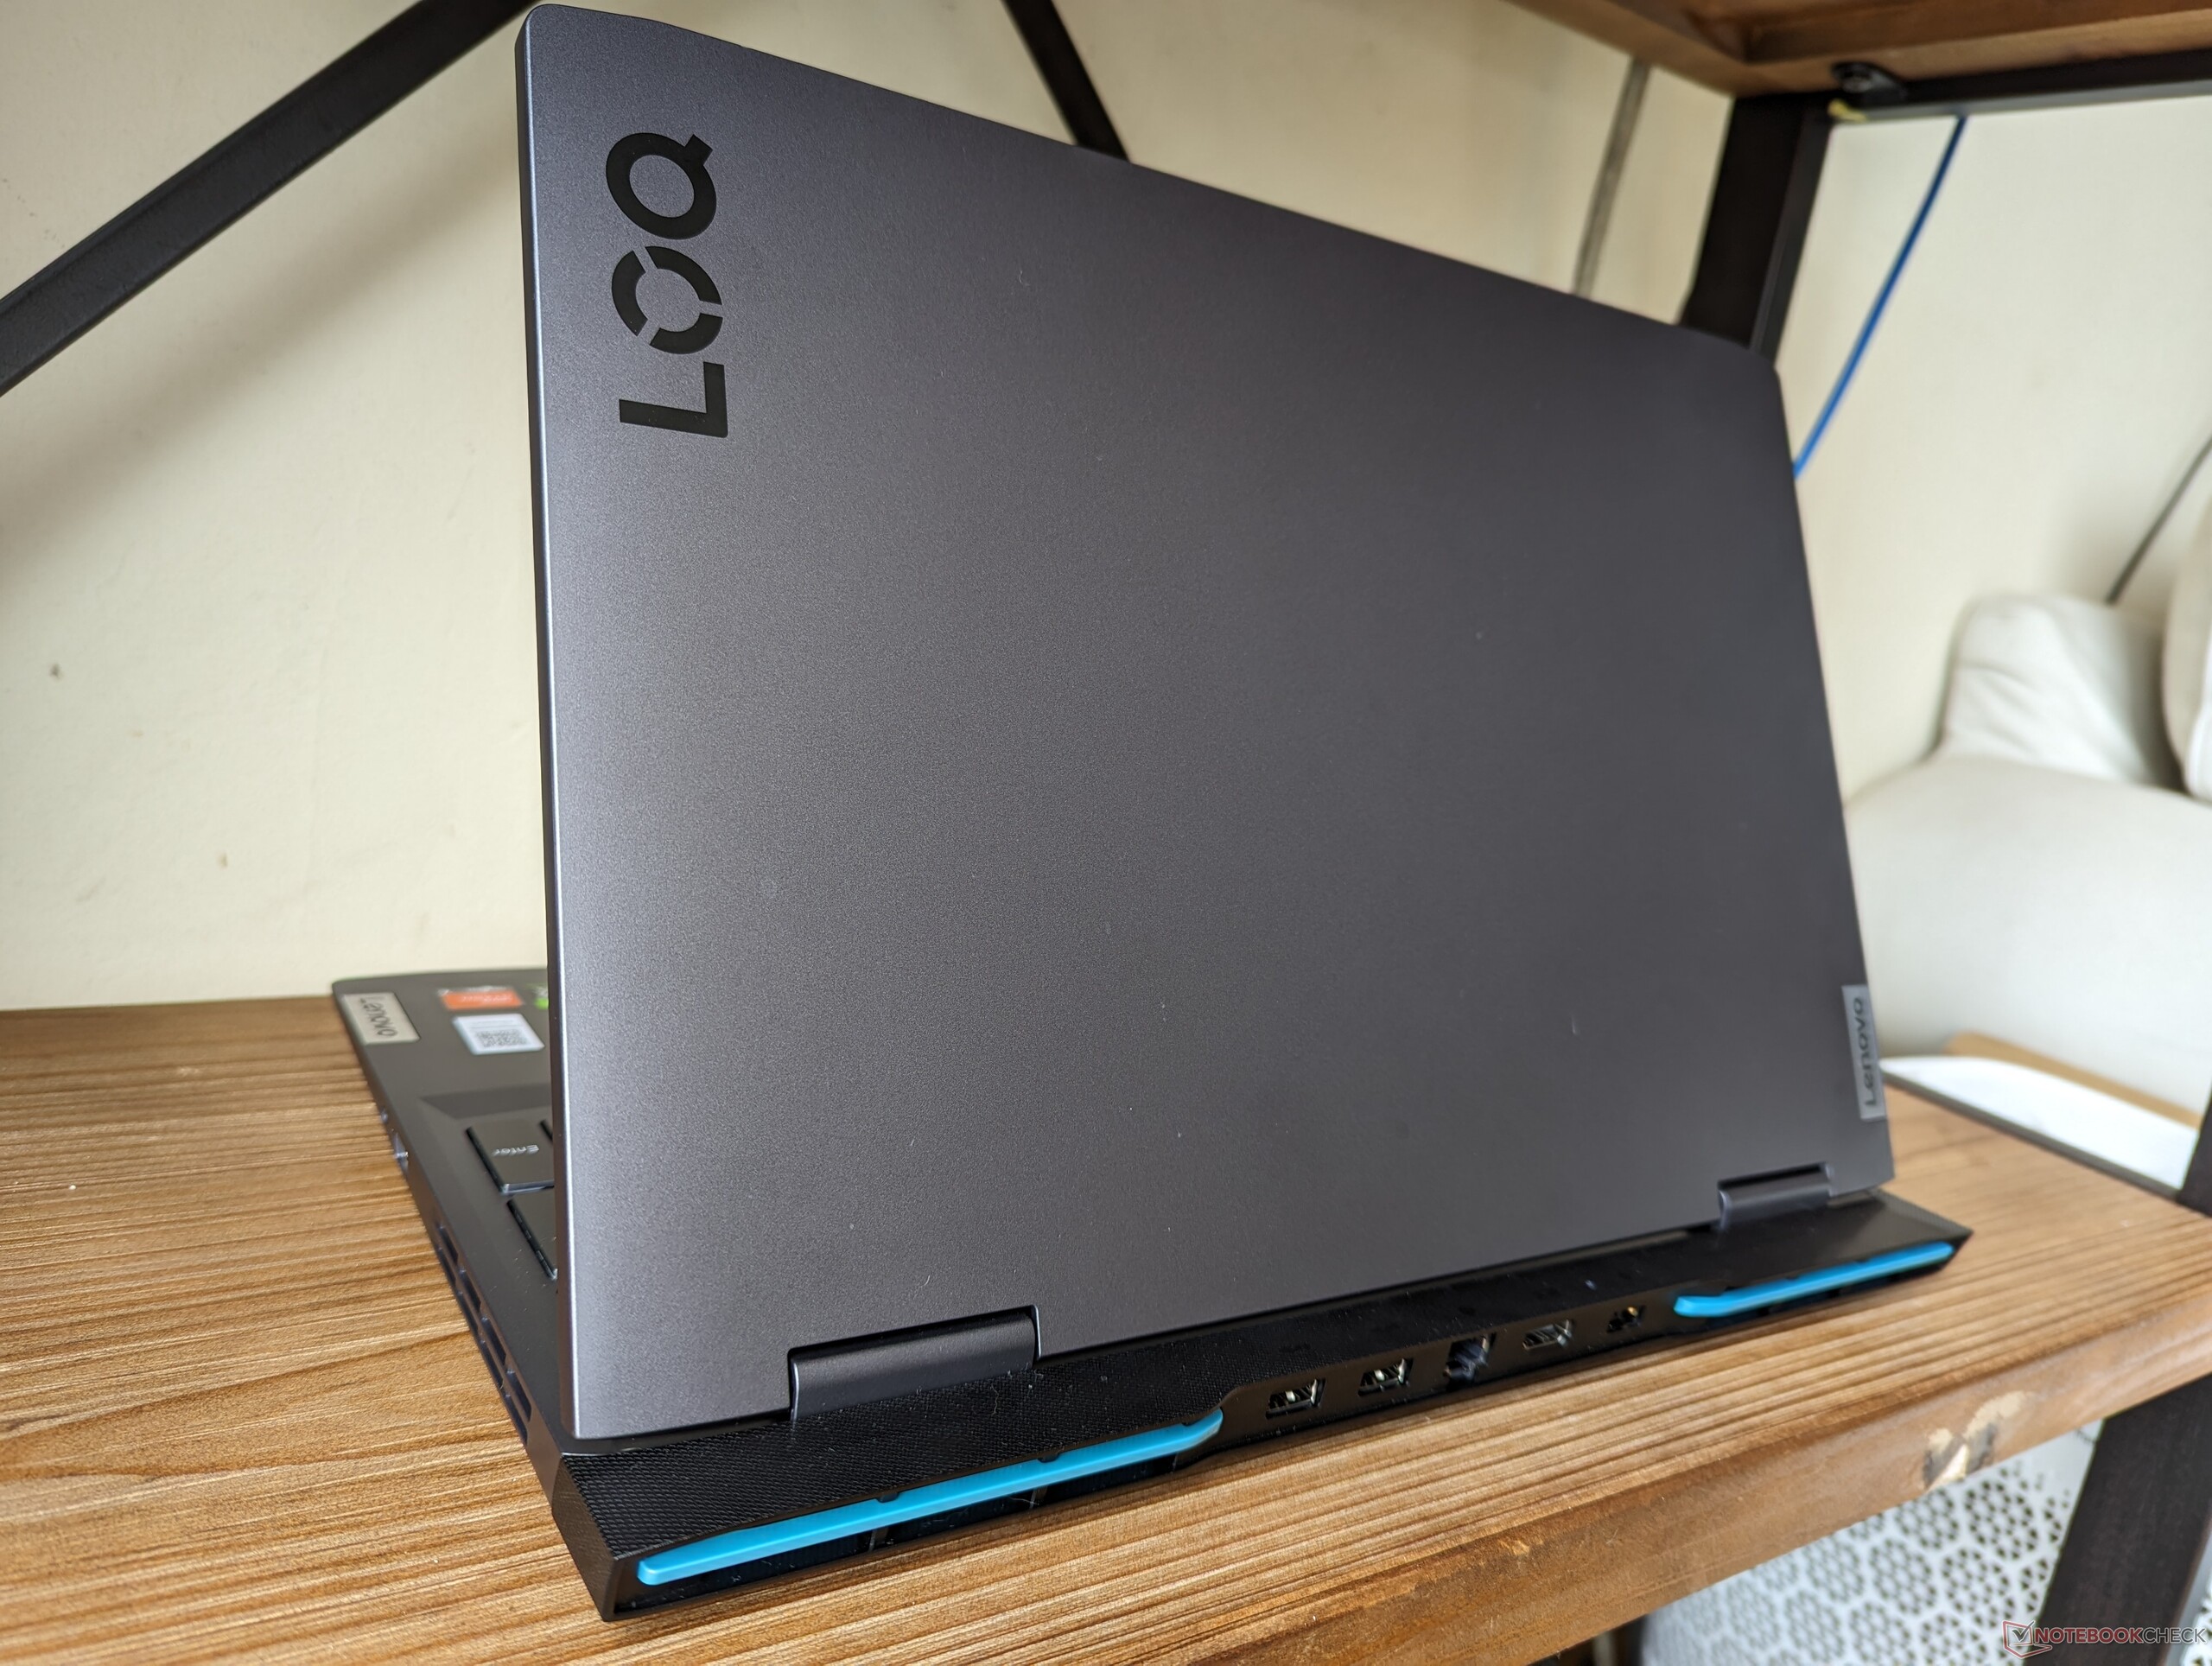
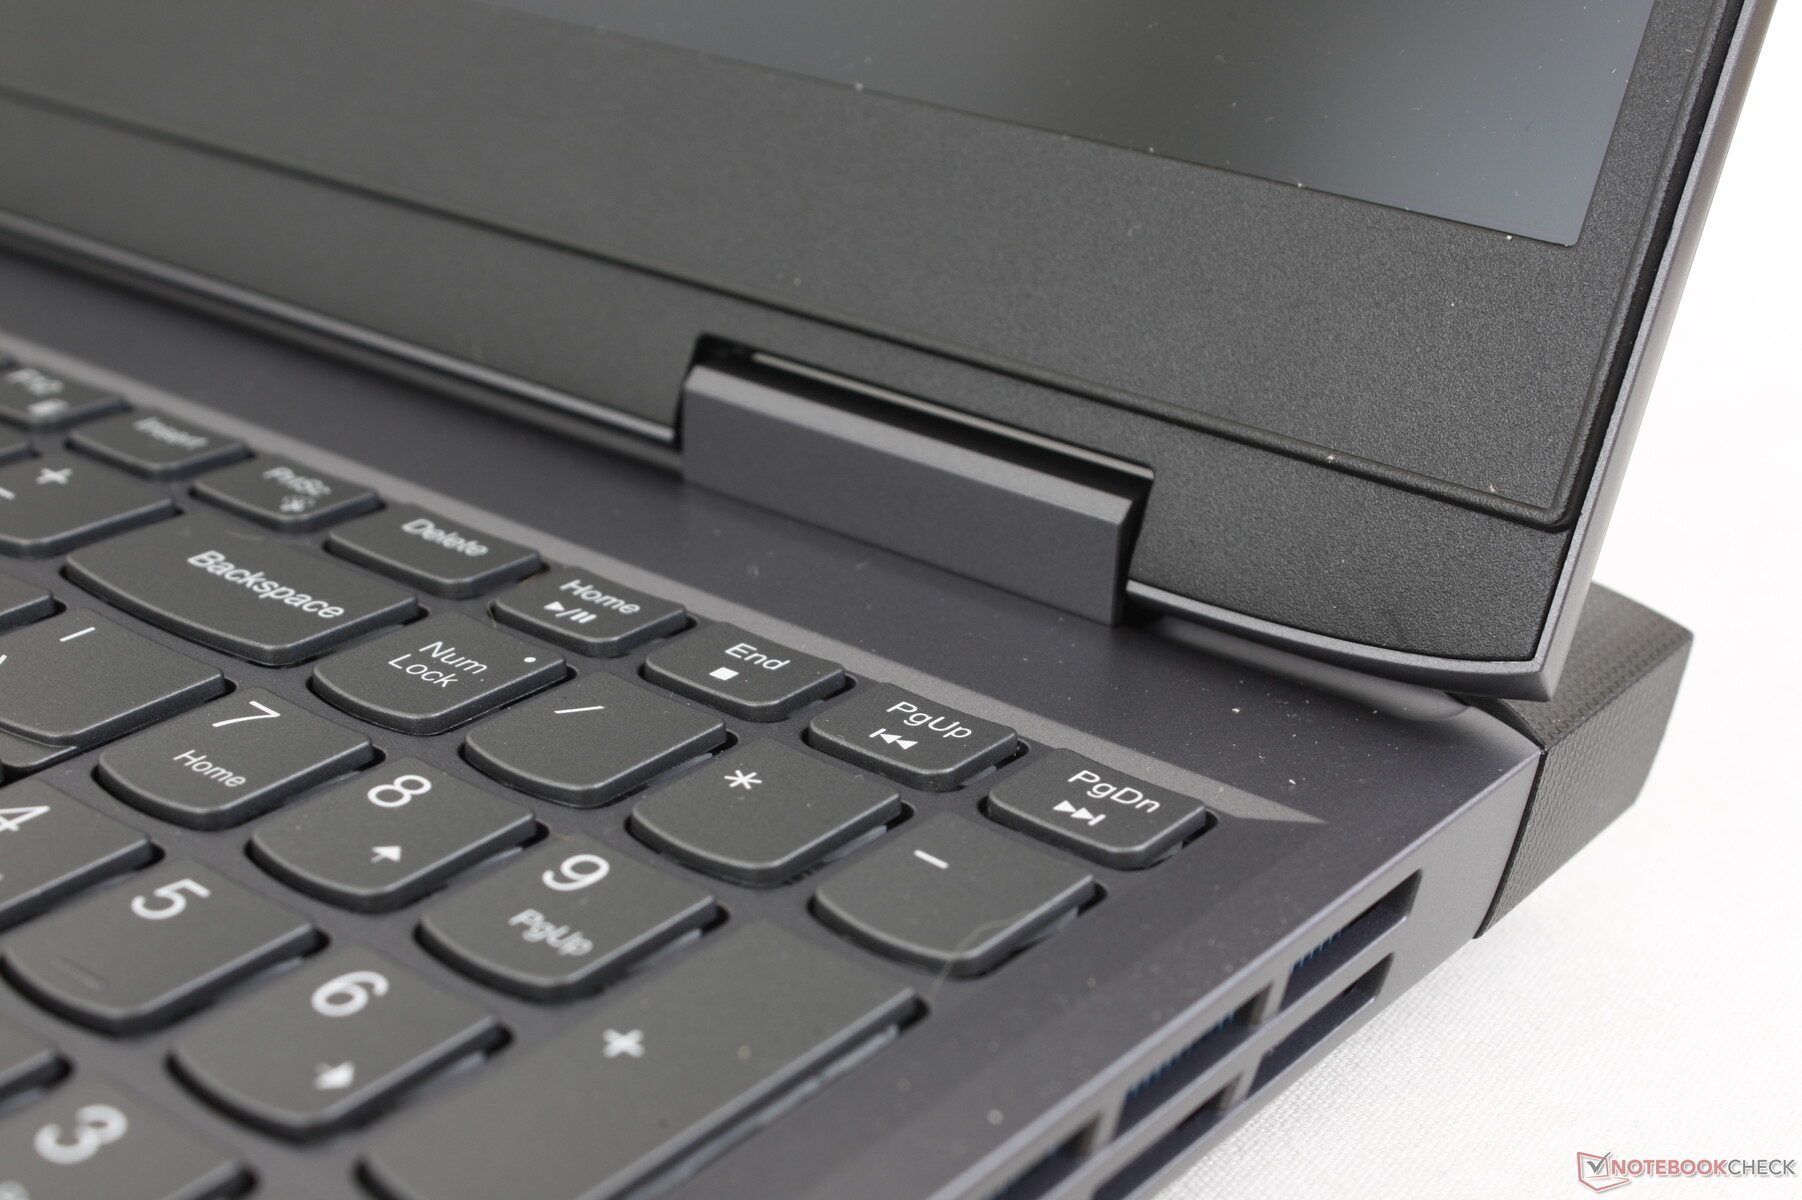
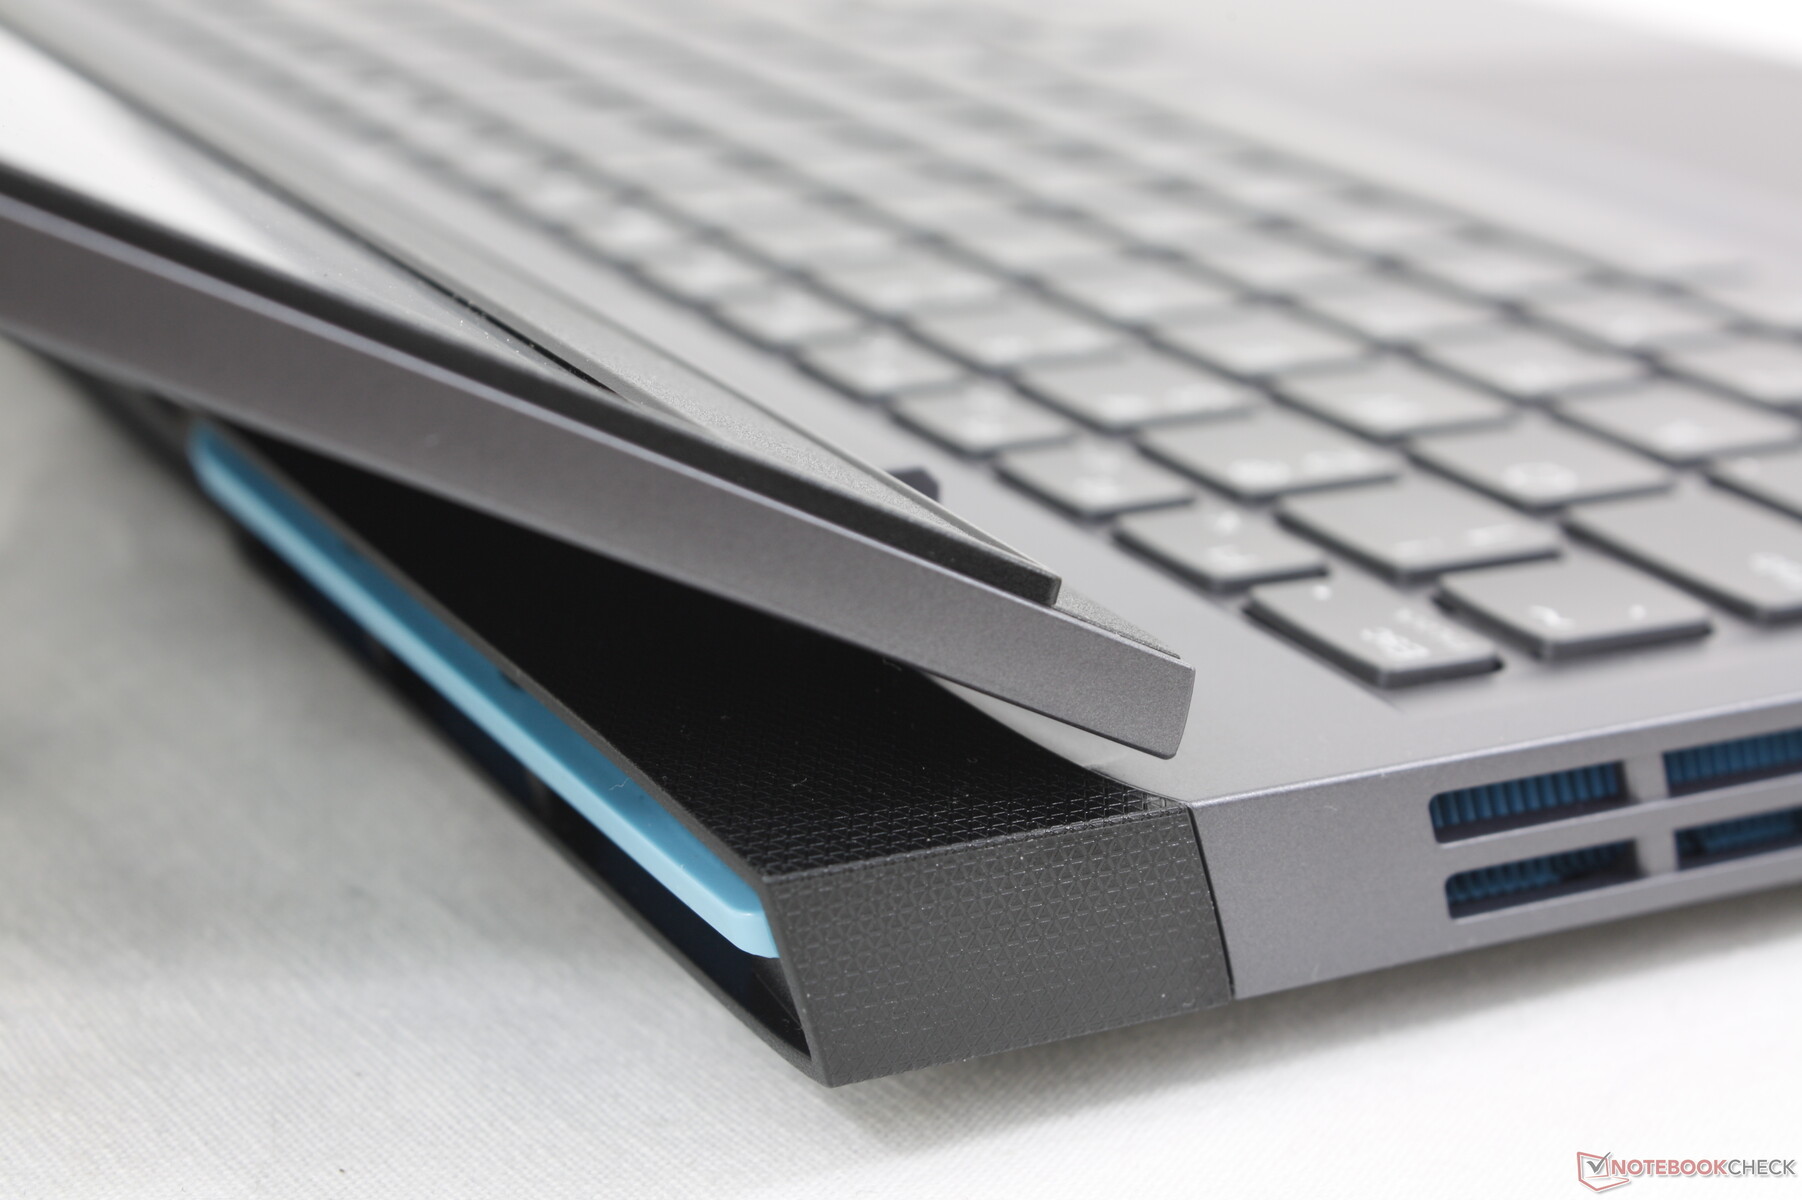
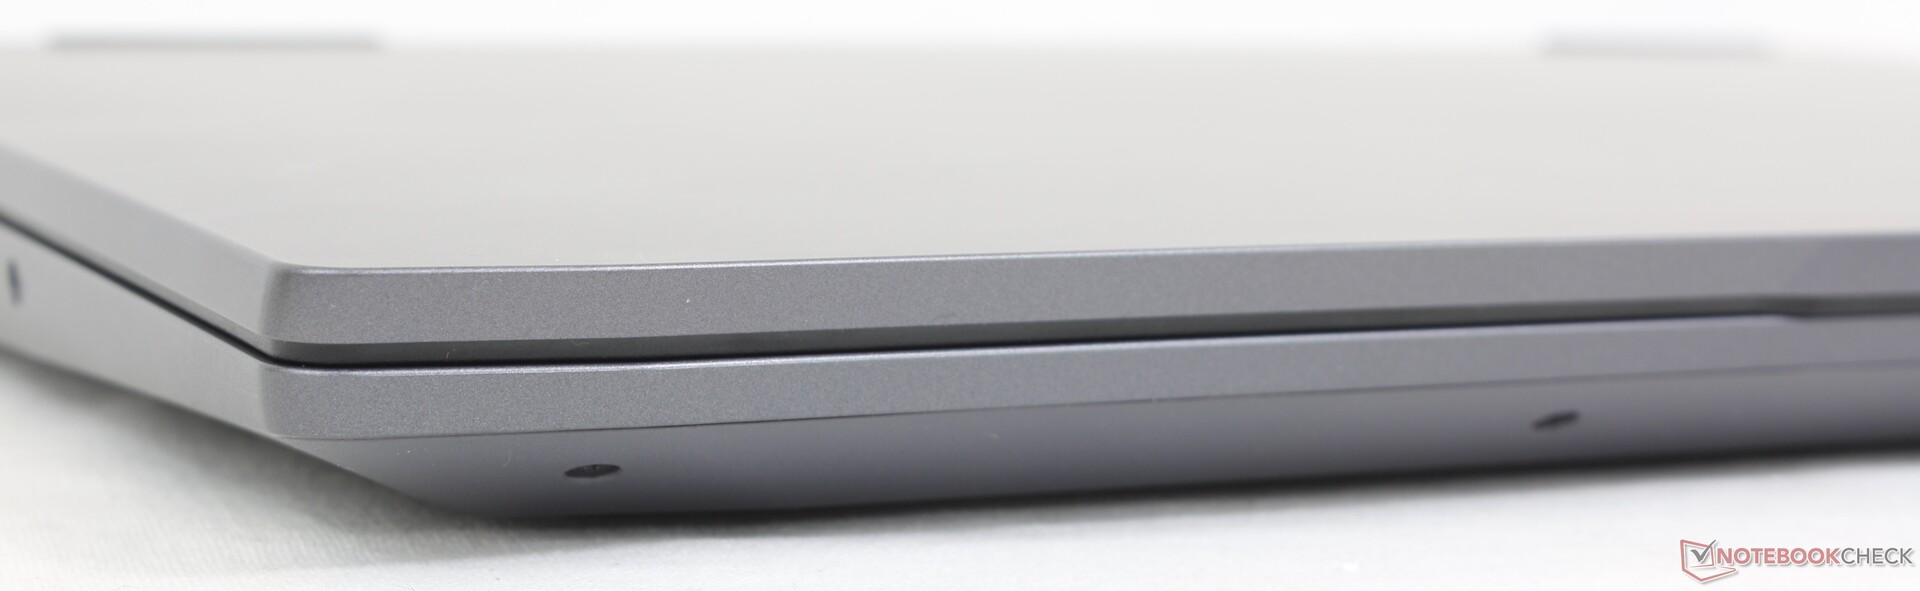
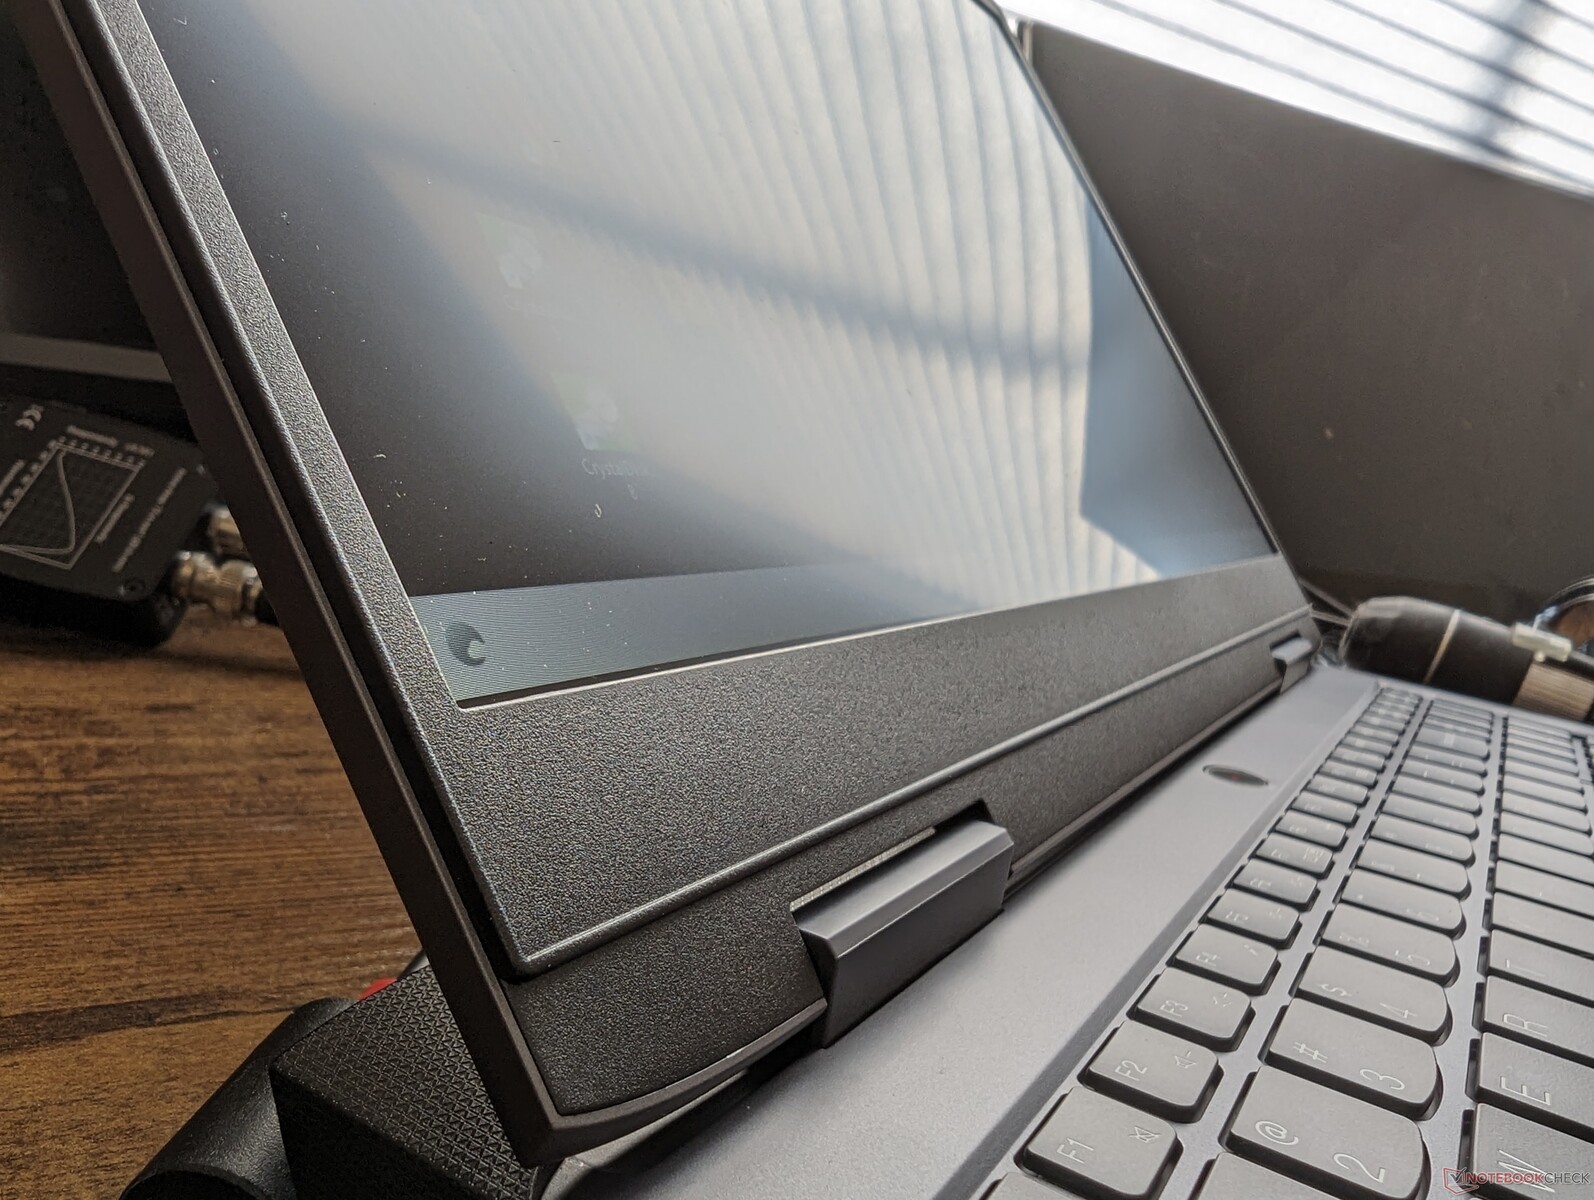
Boîtier - Essentiellement une matière plastique Legion
Ce n'est pas parce qu'il ne s'agit pas d'un produit Legion qu'il ne peut pas s'inspirer du design Legion. Le châssis LOQ 15 peut être décrit comme une version édulcorée du châssis LOQ Legion 5 15 car tous les matériaux du squelette métallique du Legion ont été remplacés par du plastique ABS sur le couvercle et le dessous. Il semble moins cher en raison de ces changements, mais c'est normal quand on le compare à d'autres ordinateurs portables de jeu à bas prix comme le MSI Cyborg 15 ou le HP Victus 15 qui sont eux aussi principalement en plastique.
La rigidité du châssis est la plus faible au niveau des repose-poignets et du centre du clavier. L'application d'une pression sur ces zones déforme la surface un peu plus que sur la plupart des autres ordinateurs portables de jeu, y compris les moins chers comme le HP Victus 15. Ce n'est heureusement pas une cause d'inquiétude et le reste de l'ordinateur est solide pour le prix.
Le LOQ 15 est légèrement plus épais et plus lourd que la plupart des autres ordinateurs portables de jeu à bas prix, y compris le Asus TUF A15,HP Victus 15ou MSI Cyborg 15, en partie à cause de sa grande partie arrière. L'exception notable est l'encombrant Dell G15 5530 qui est encore plus lourd et plus grand.
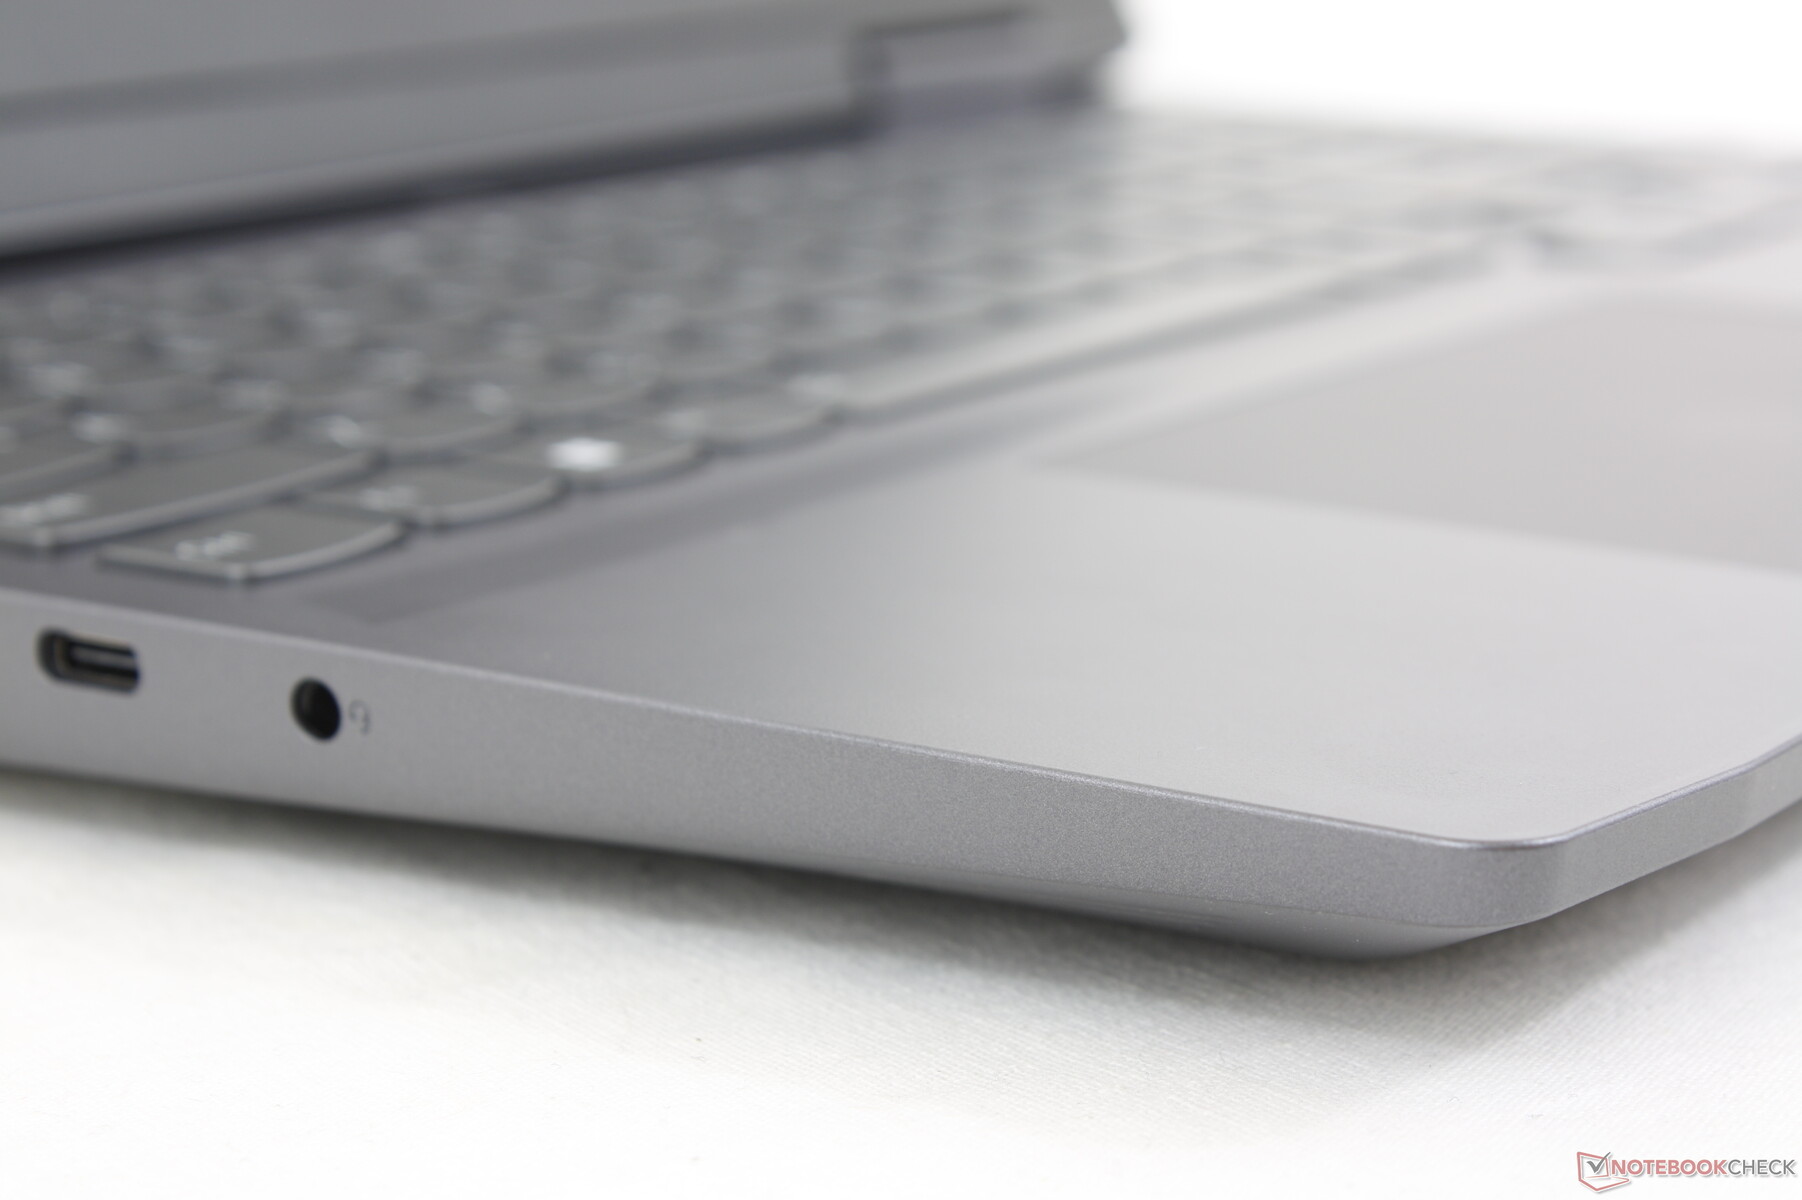
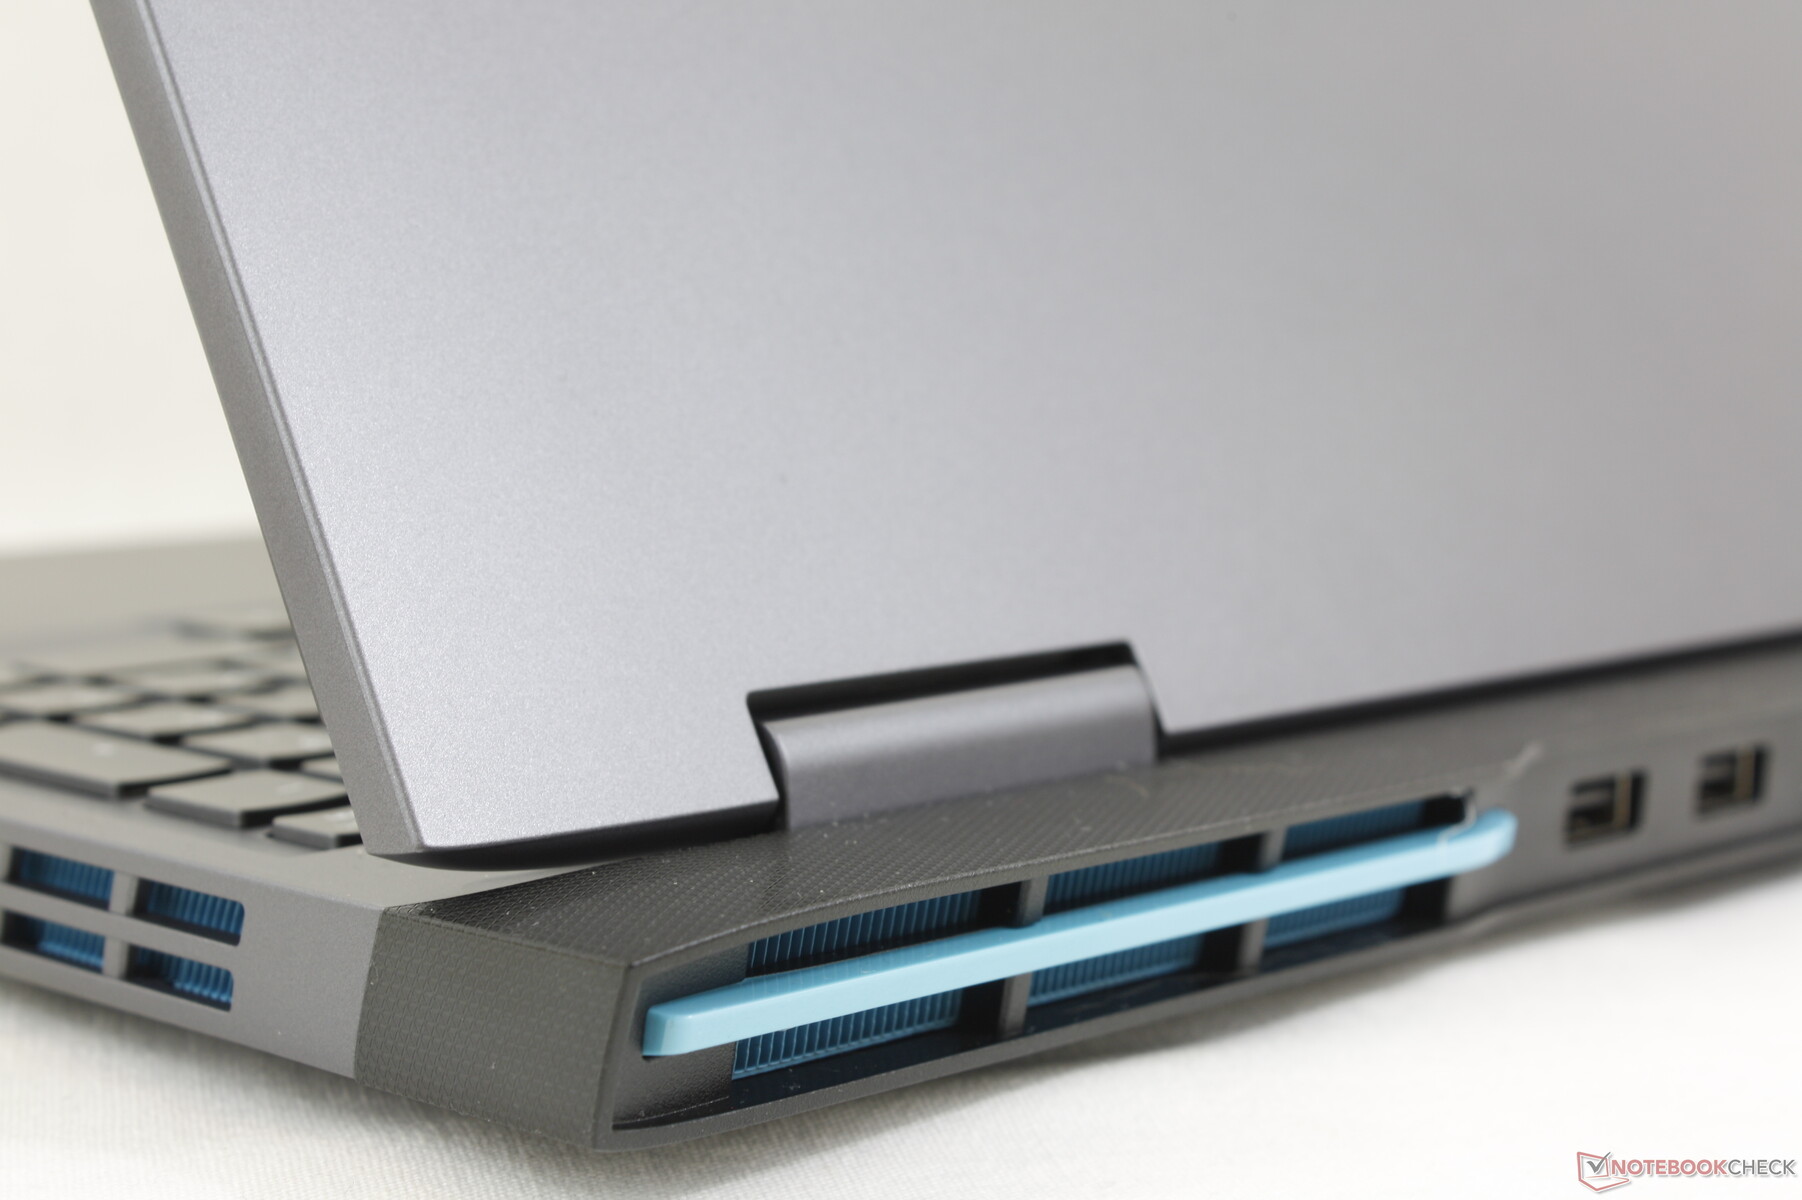
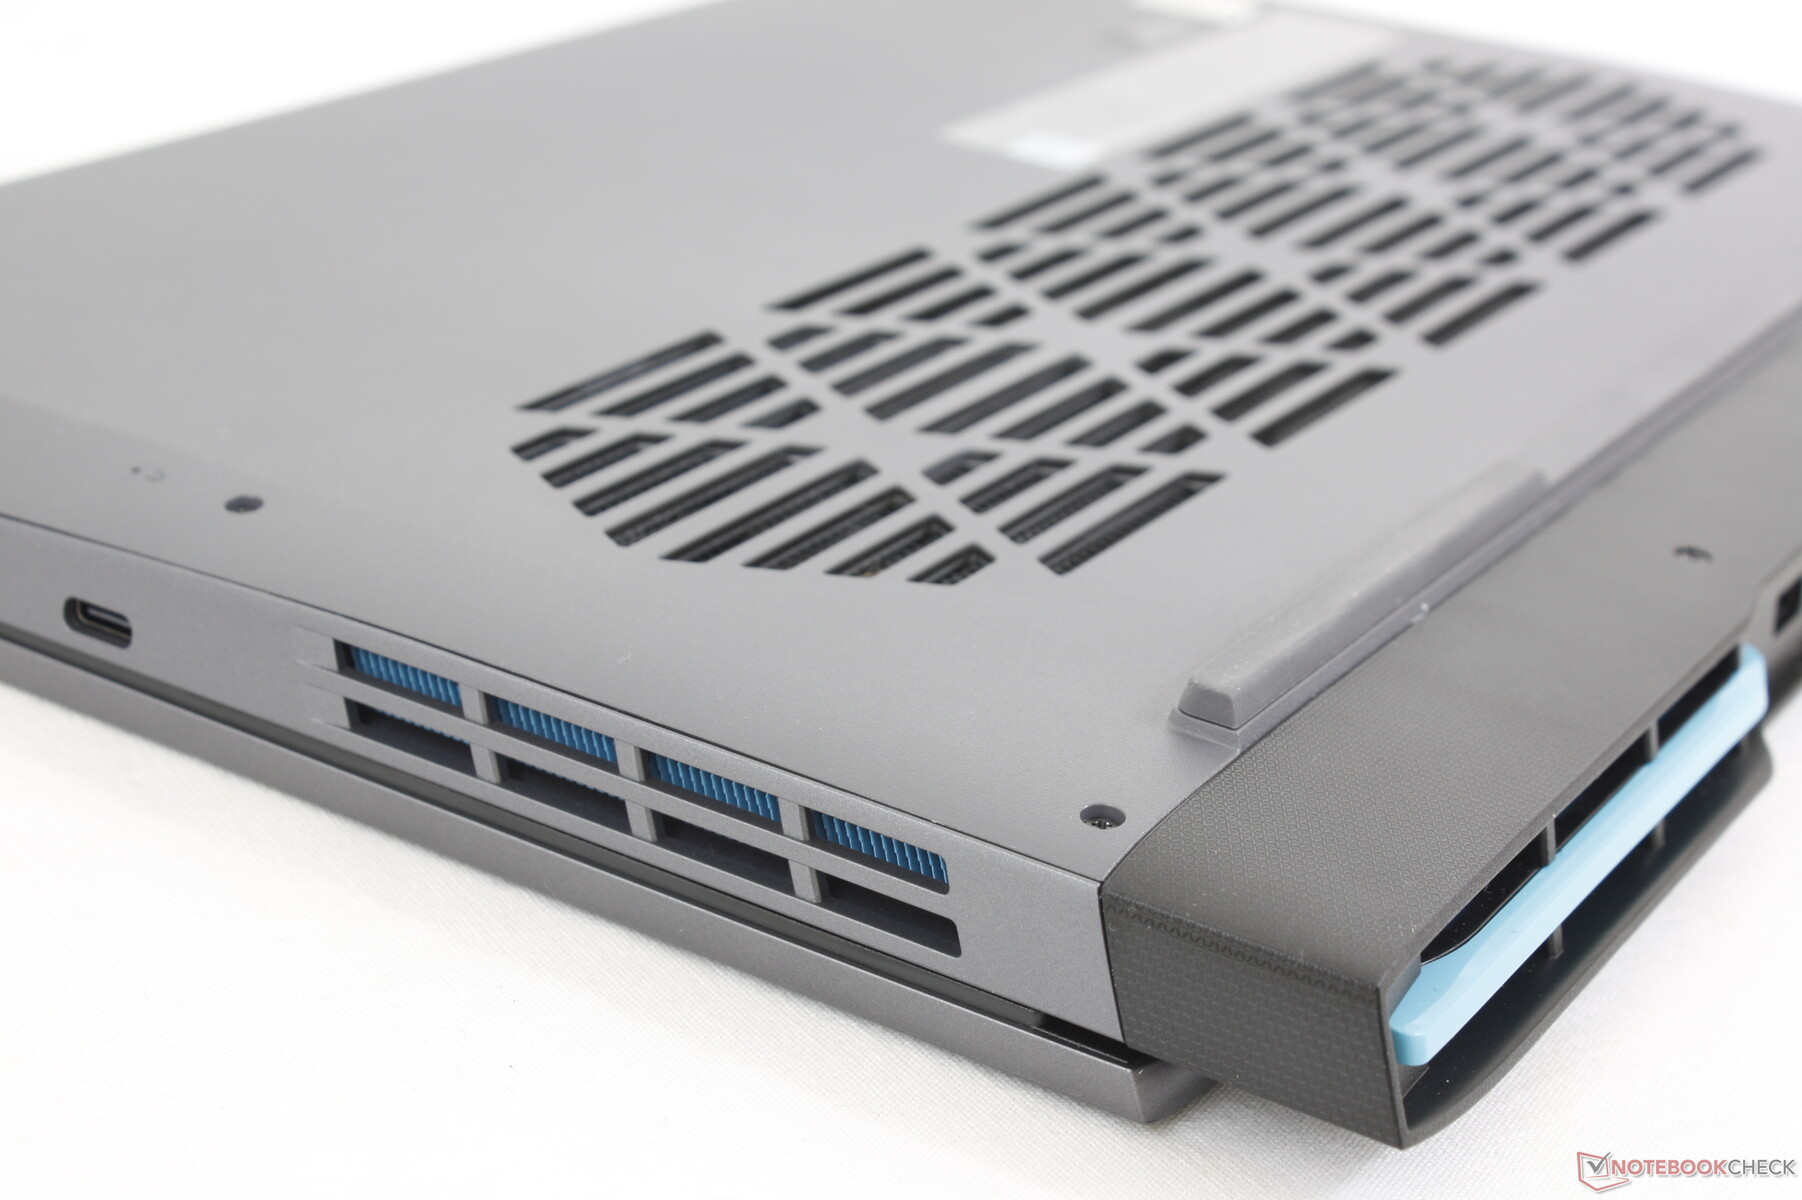
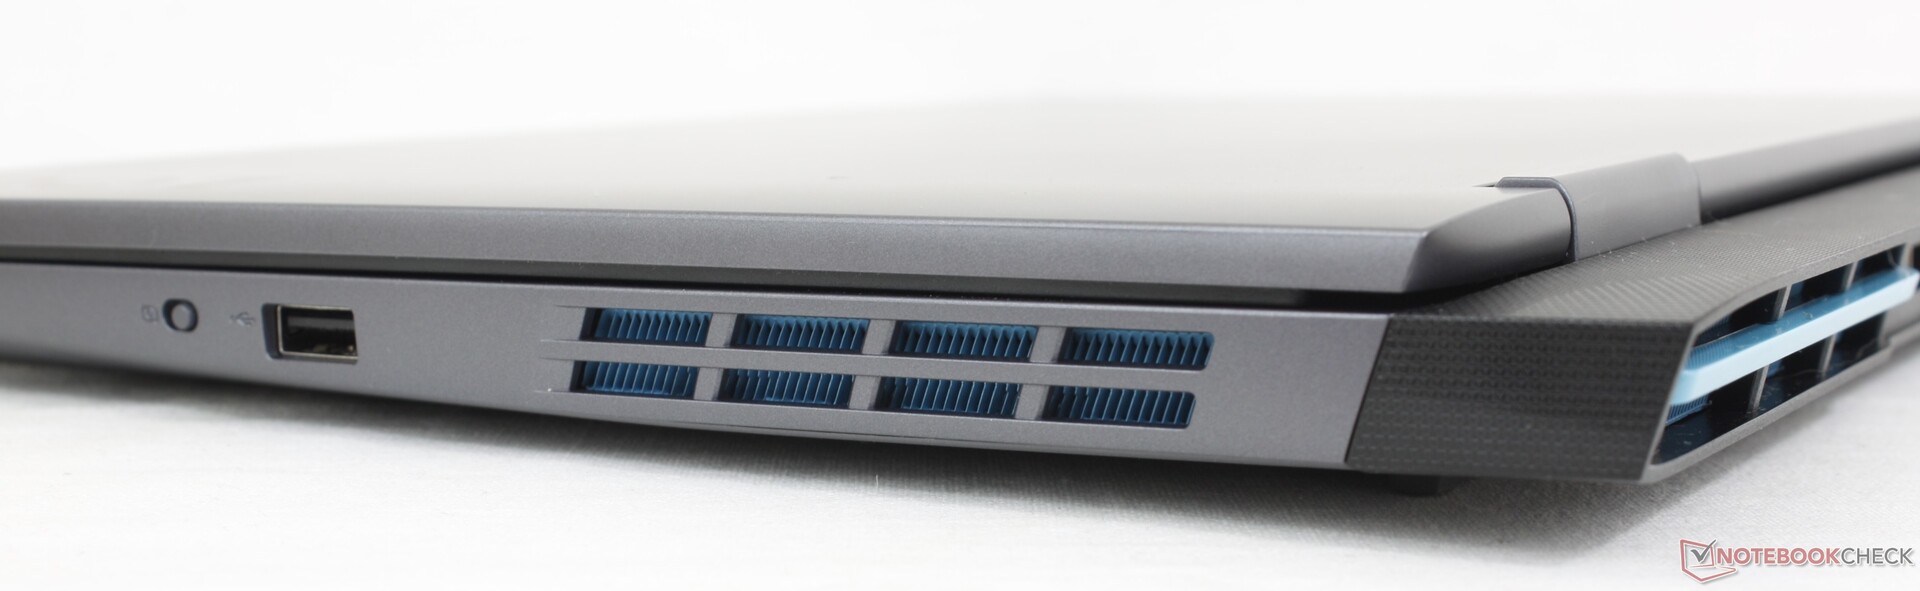
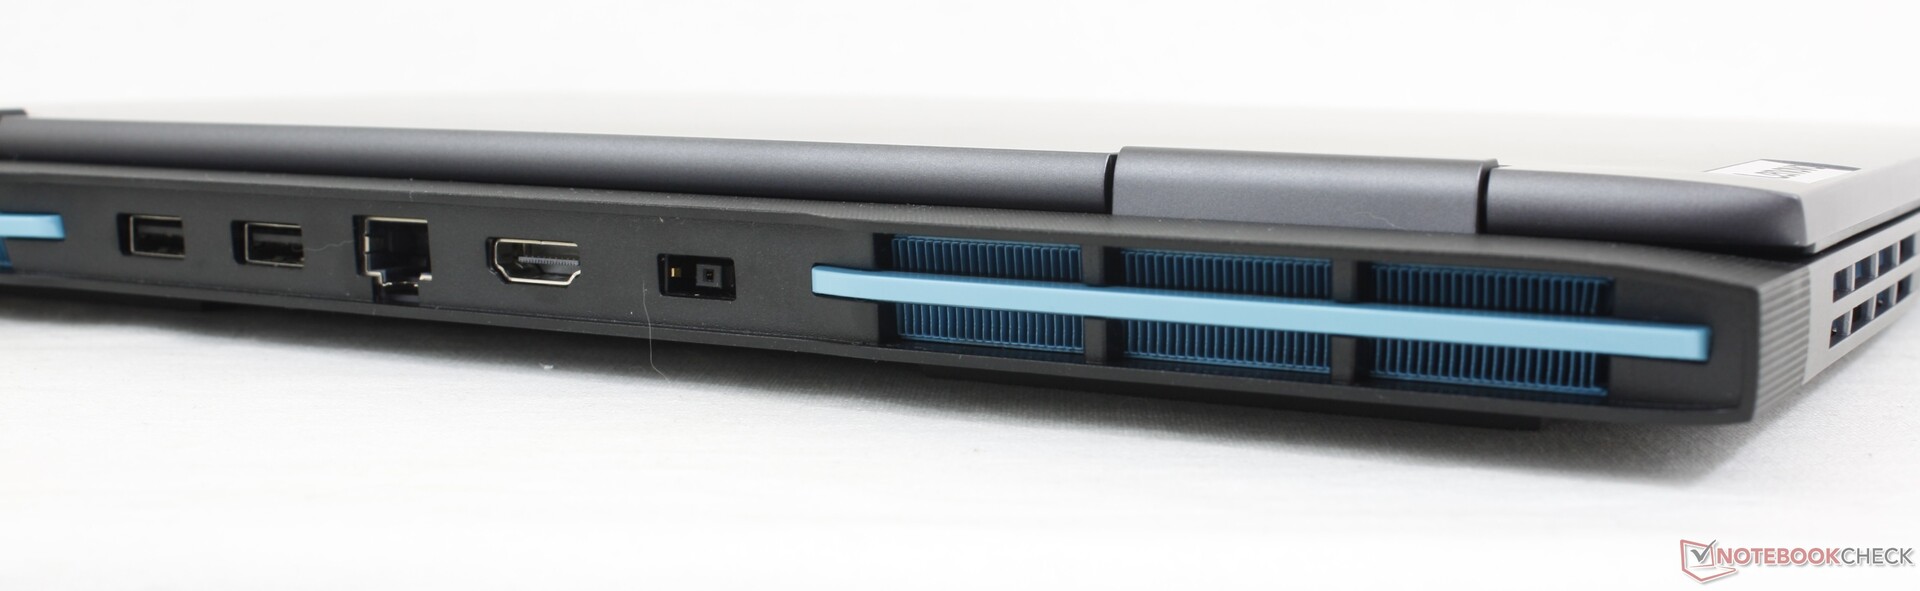
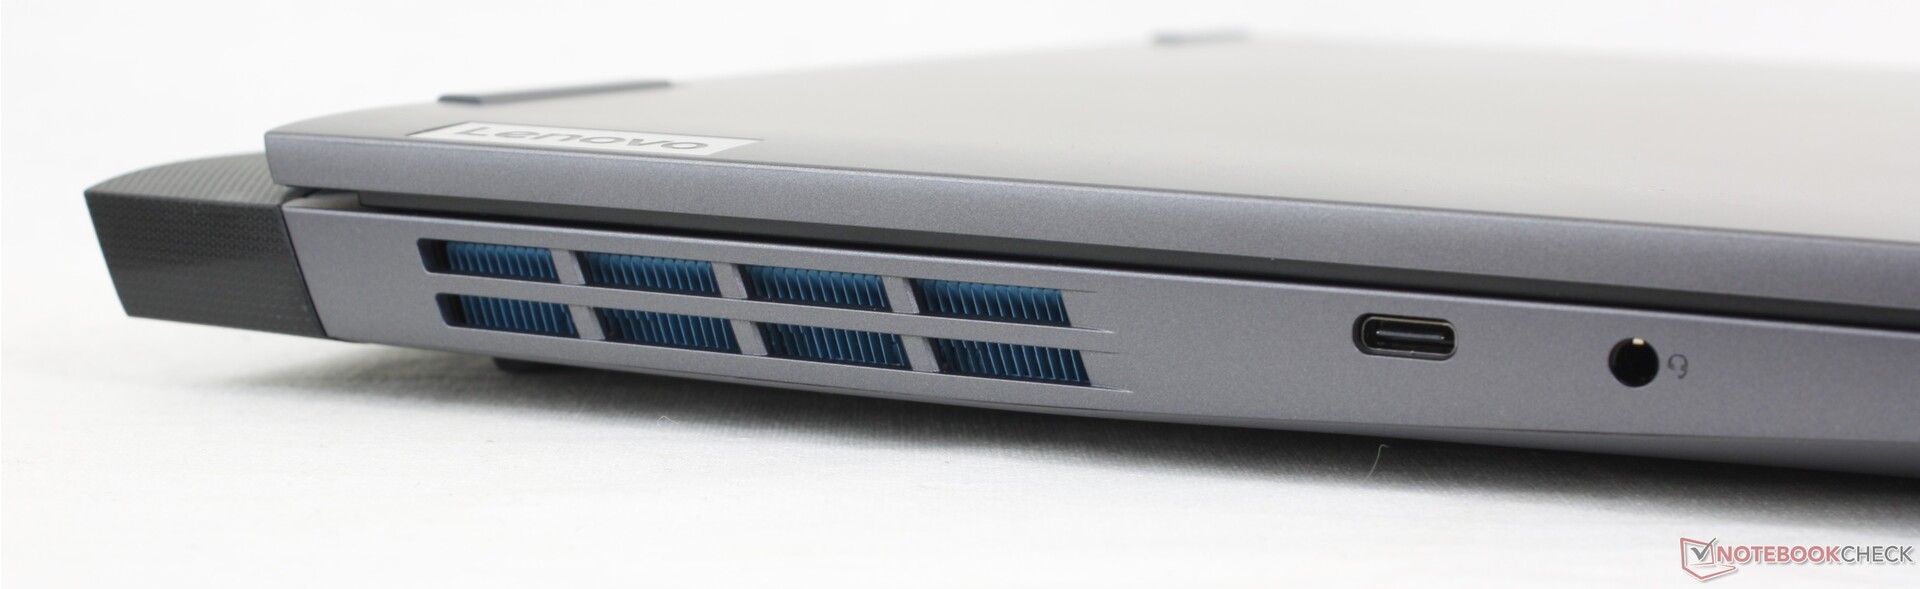
Connectivité - Pas d'USB4 ni de Thunderbolt
Les options de port reprennent tout ce qui existait sur l'IdeaPad Gaming 3 15 de l'année dernière, plus un port USB-A supplémentaire. La plupart des ports se trouvent à l'arrière, mais l'unique port USB-C a été déplacé sur le bord gauche cette fois-ci pour être plus facilement accessible.
Communication
Le Realtek RTL8852BE offre une connectivité Wi-Fi 6 et Bluetooth 5.1, mais ne prend pas en charge le Wi-Fi 6E ou 6 GHz, probablement pour réduire les coûts. Les taux de transfert sont néanmoins stables et fiables lorsqu'elle est associée à notre routeur de test Asus AXE11000.
| Networking | |
| iperf3 transmit AXE11000 | |
| MSI Cyborg 15 A12VF | |
| Dell G15 5530 | |
| Lenovo Legion 5 15IAH7H 82RB | |
| Asus TUF A15 FA507 | |
| Lenovo LOQ 15APH8 | |
| HP Victus 15 fa0020nr | |
| iperf3 receive AXE11000 | |
| MSI Cyborg 15 A12VF | |
| Dell G15 5530 | |
| Lenovo Legion 5 15IAH7H 82RB | |
| Asus TUF A15 FA507 | |
| HP Victus 15 fa0020nr | |
| Lenovo LOQ 15APH8 | |
| iperf3 transmit AXE11000 6GHz | |
| Lenovo Legion 5 15IAH7H 82RB | |
| iperf3 receive AXE11000 6GHz | |
| Lenovo Legion 5 15IAH7H 82RB | |
Webcam
La webcam de 2 mégapixels est une amélioration par rapport aux webcams de 1 mégapixel des anciennes séries Legion 5 15 ou IdeaPad Gaming 15. Un interrupteur de désactivation de la caméra est inclus, mais l'infrarouge est introuvable.


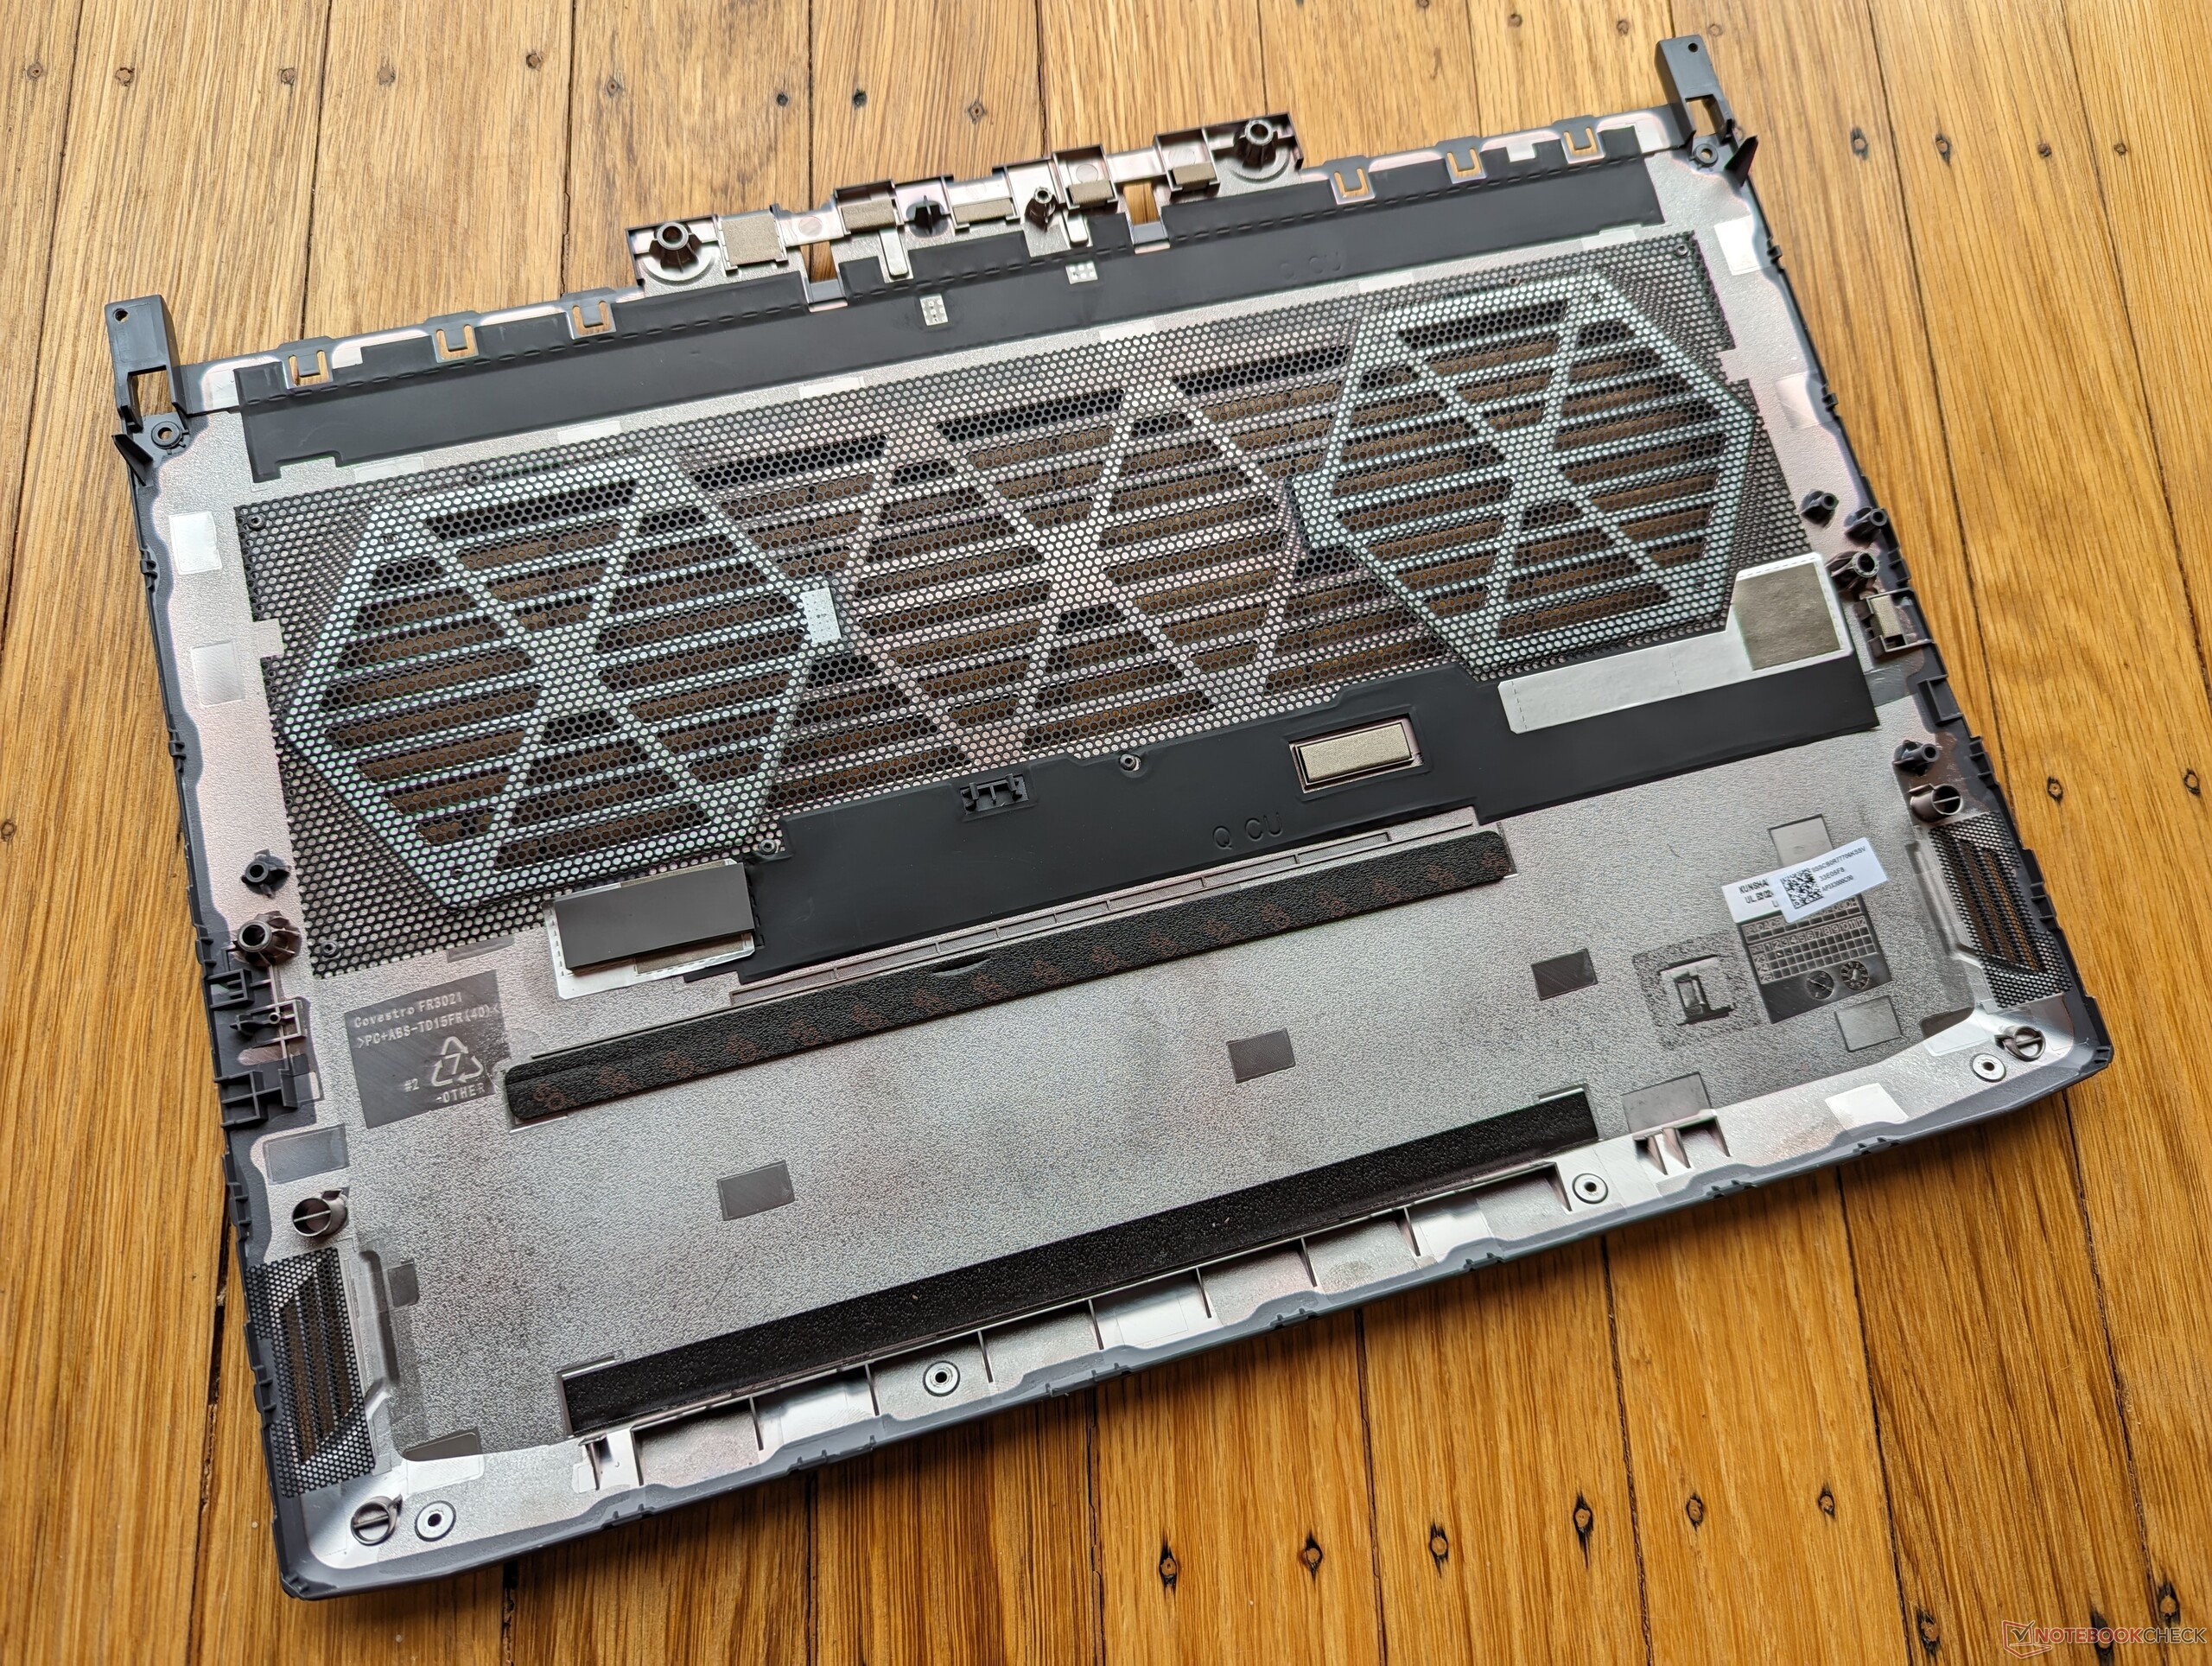
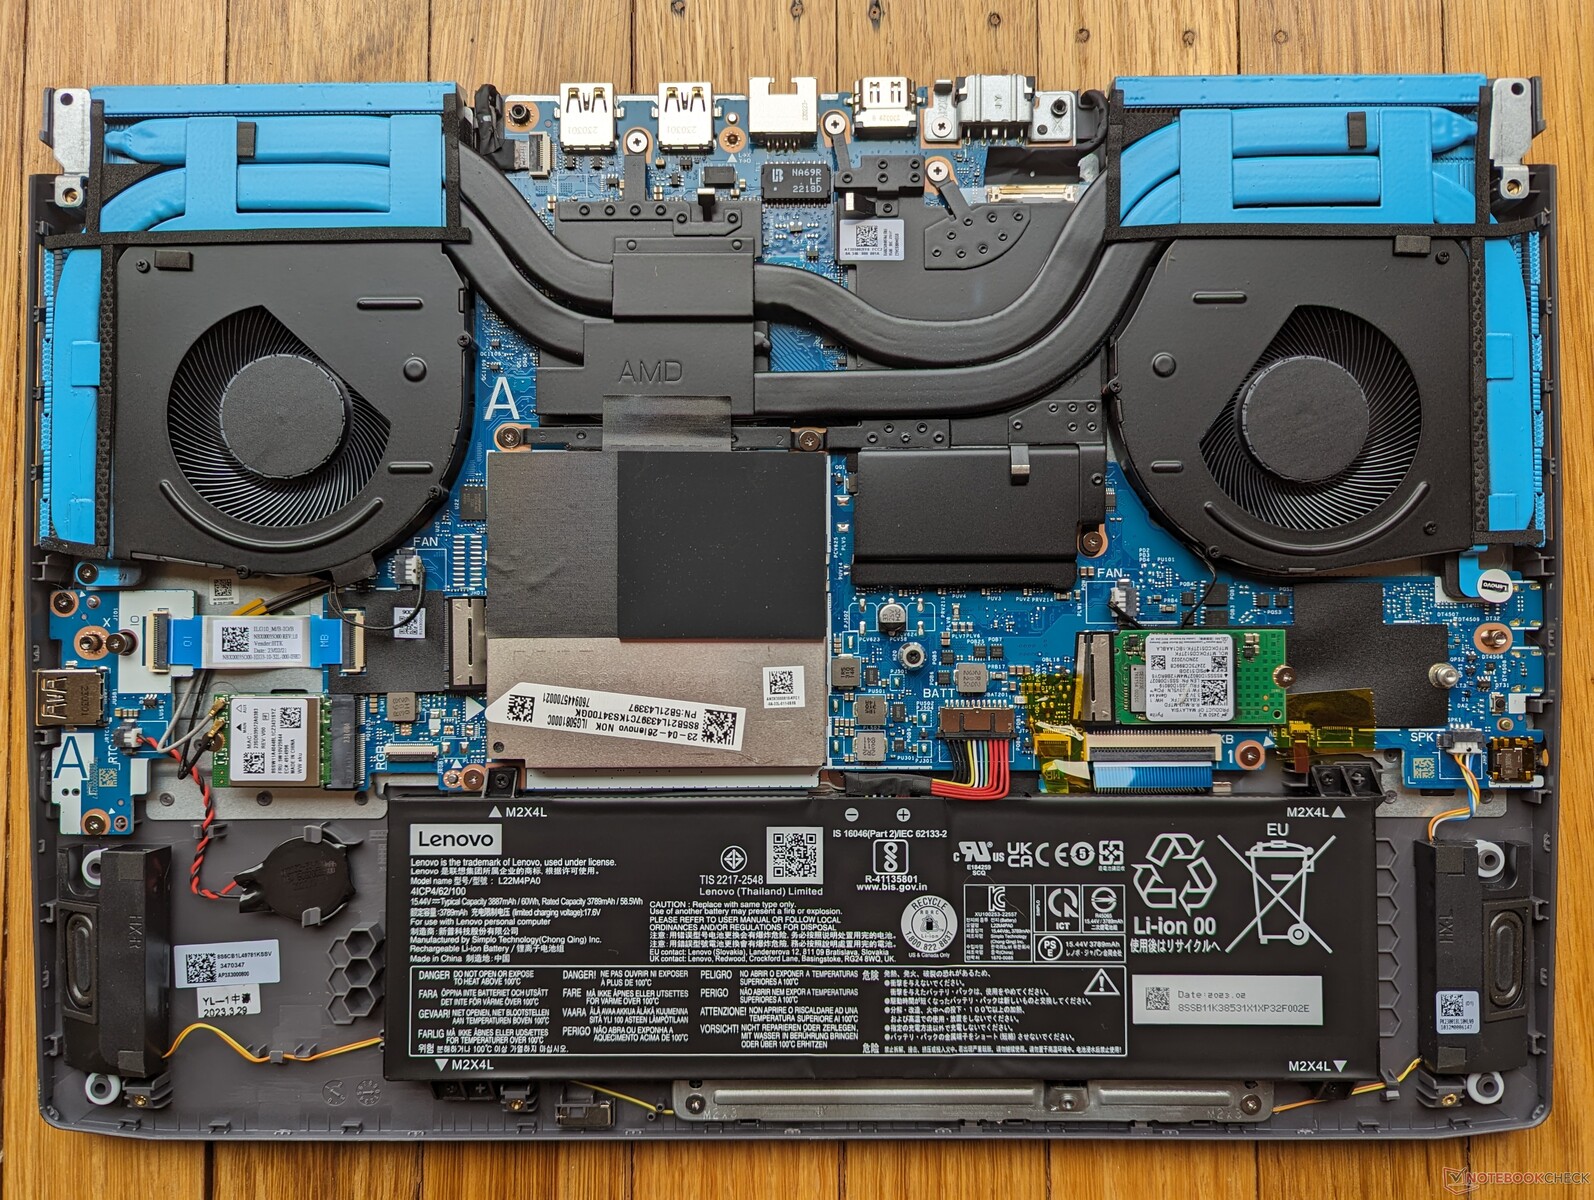
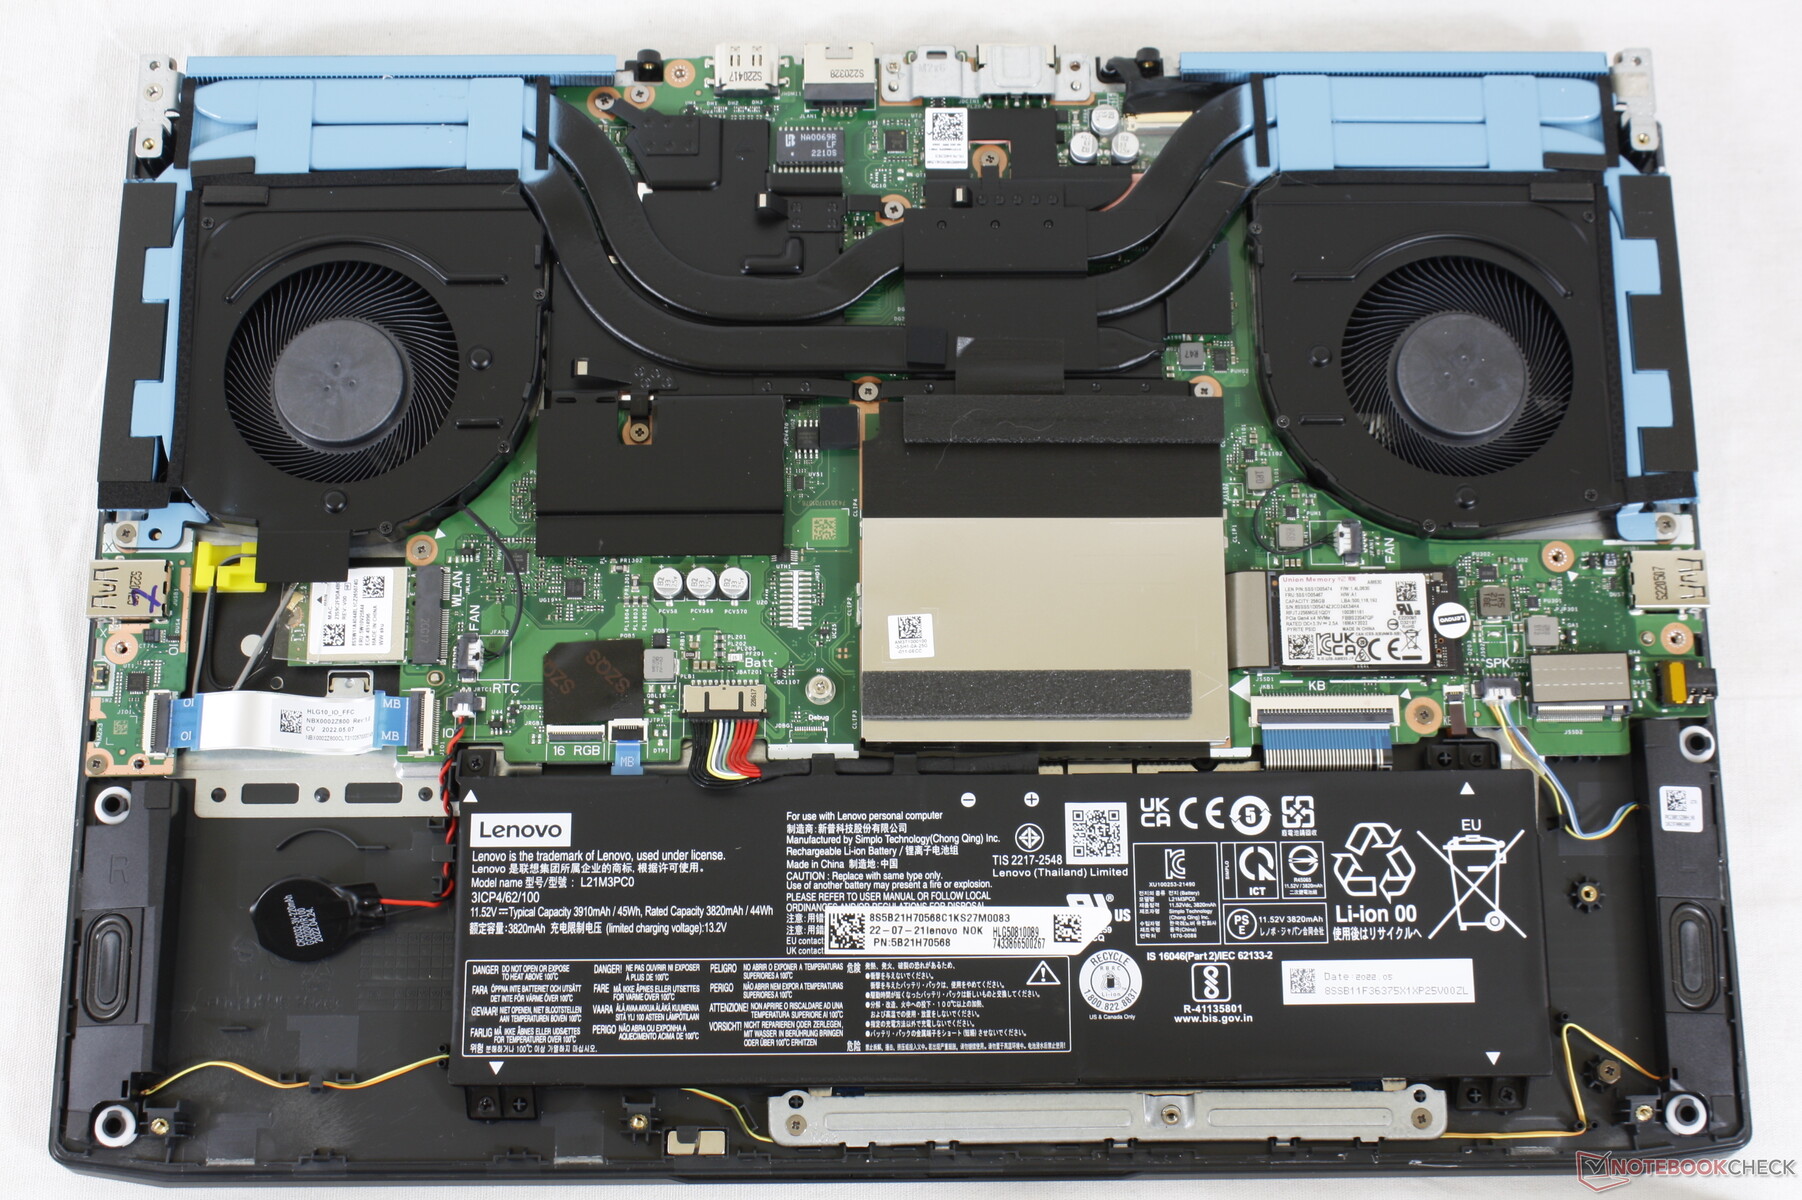
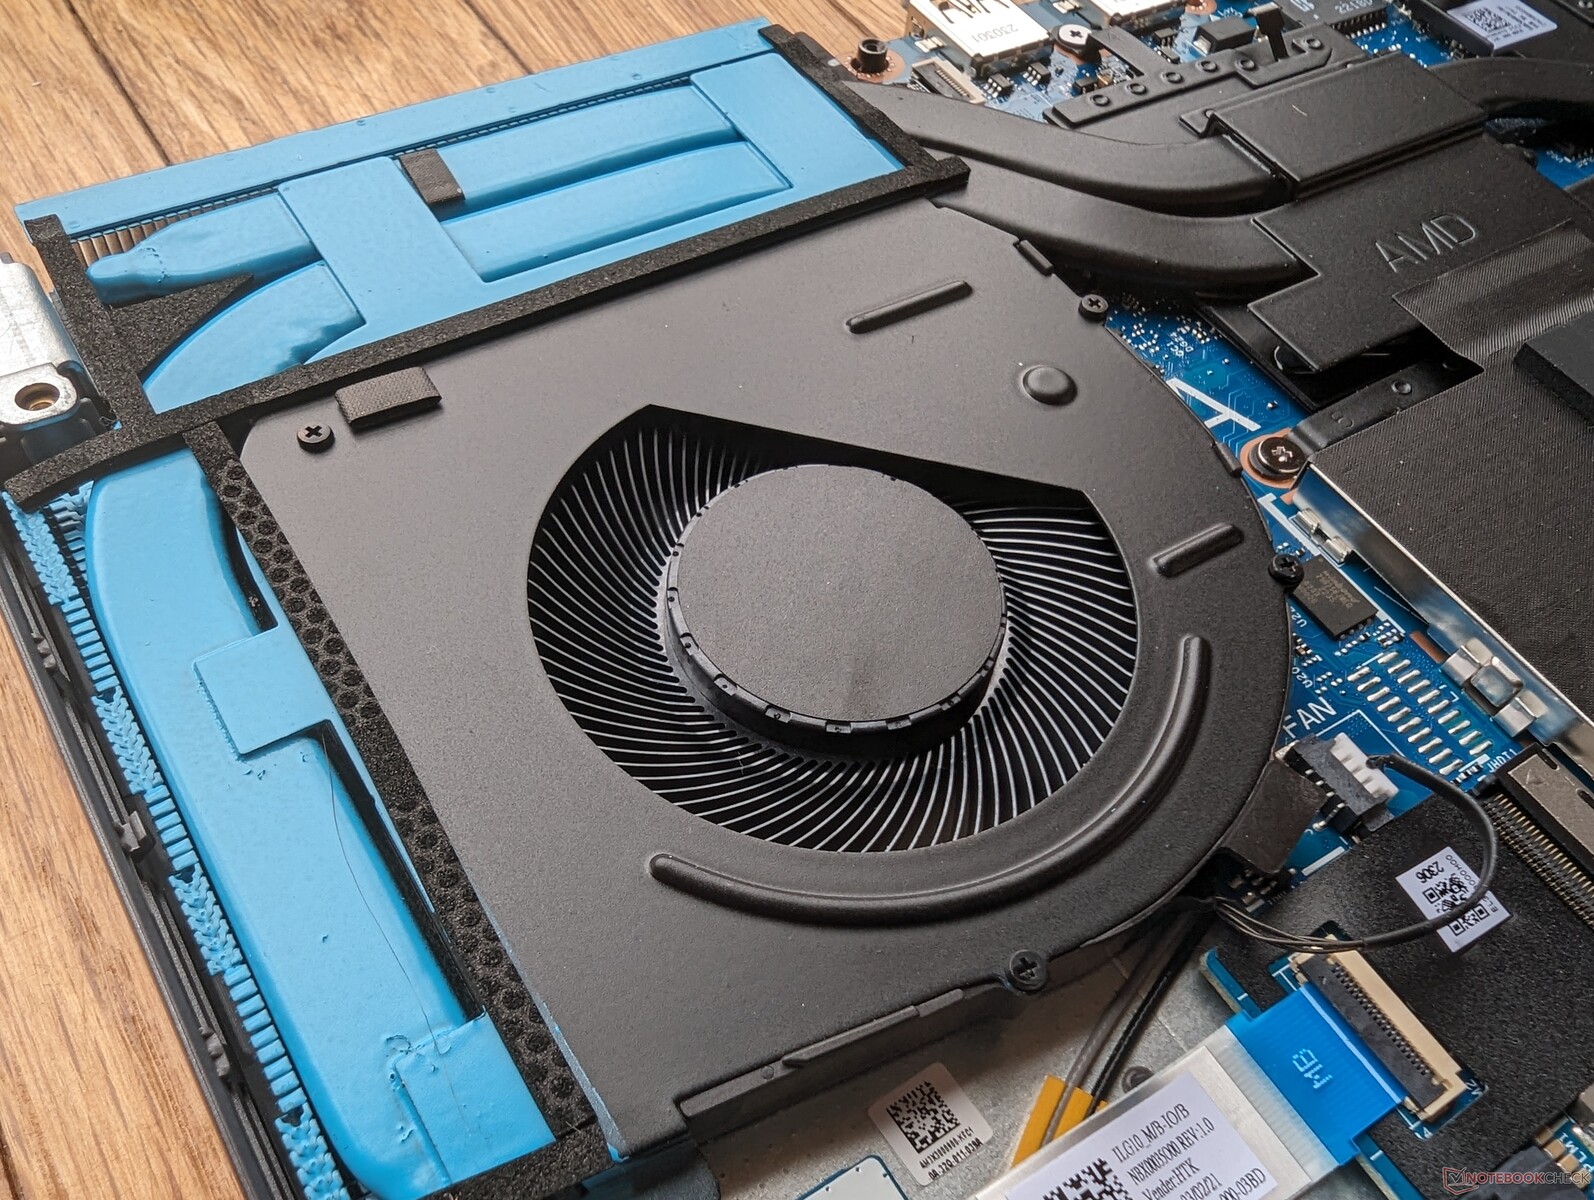
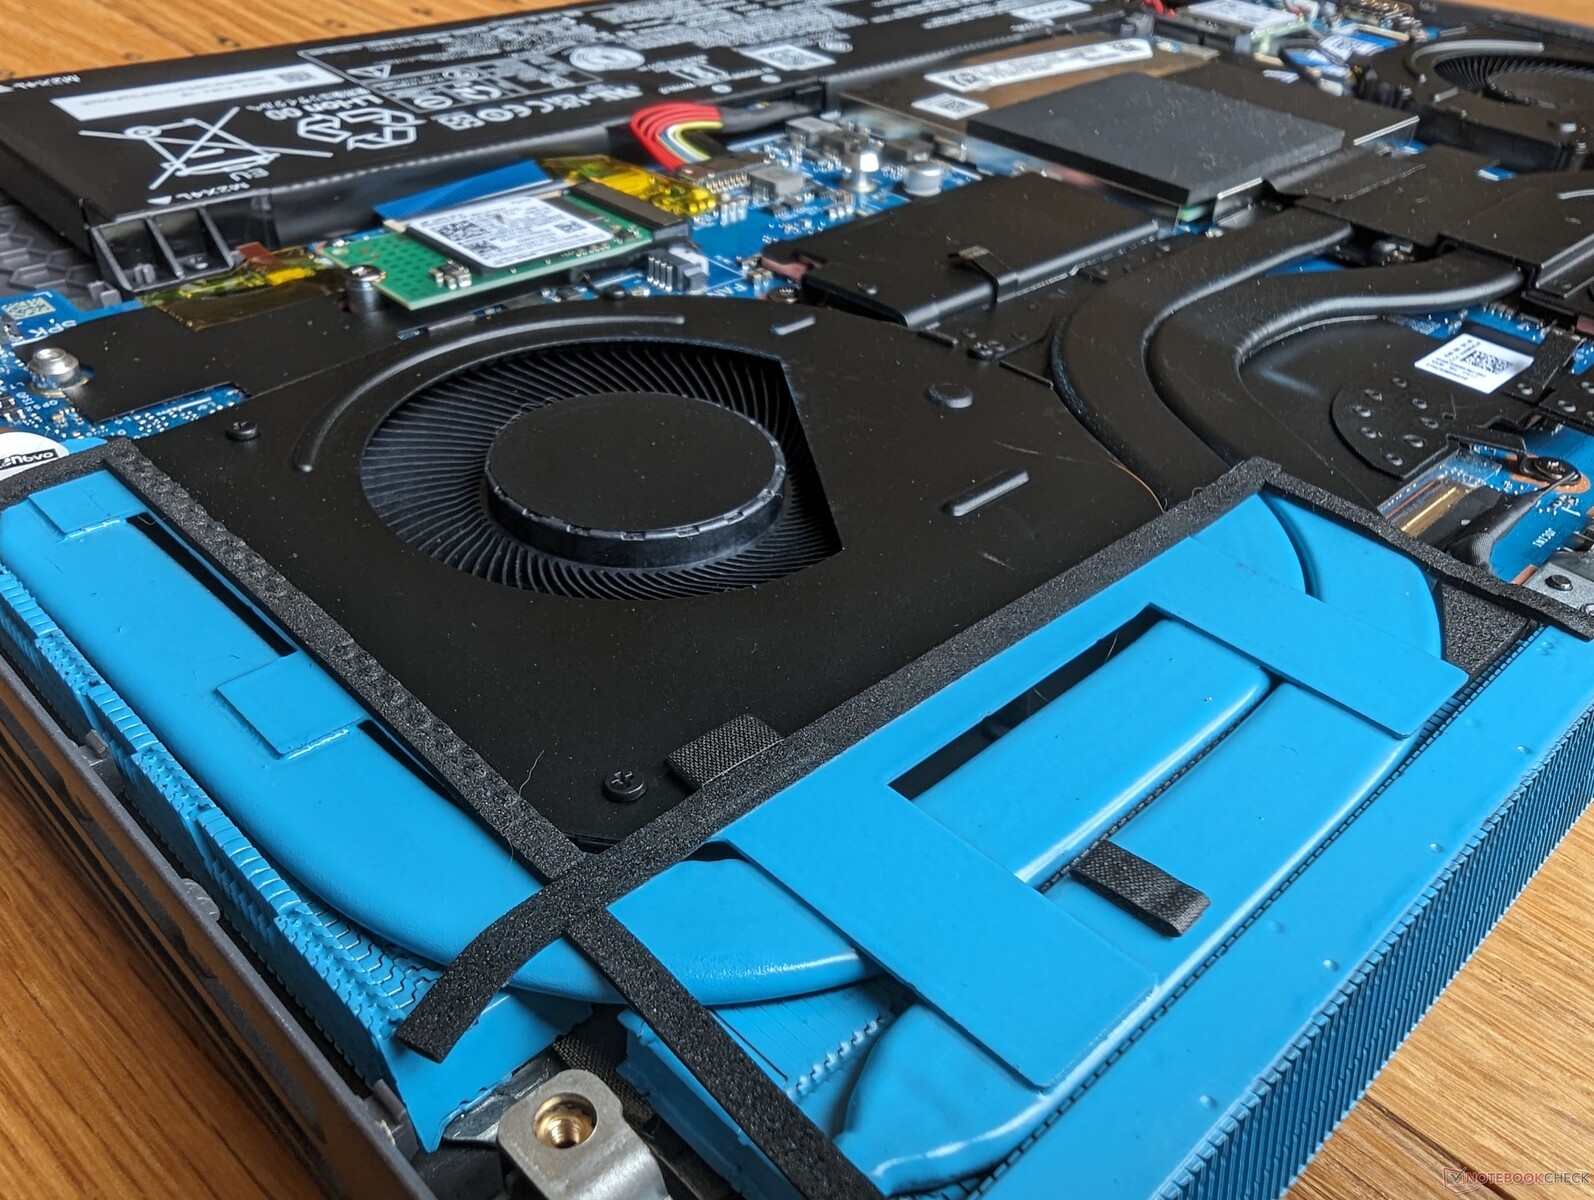
Maintenance
Les mises à jour pour les utilisateurs finaux demandent un peu plus d'efforts que sur la plupart des autres ordinateurs portables de jeu, car la partie arrière du châssis doit d'abord être retirée avant que le panneau inférieur ne puisse être enlevé. Au total, 13 vis Phillips fixent les parties inférieure et arrière.
Accessoires et garantie
La boîte ne contient pas d'autres éléments que l'adaptateur secteur et la documentation. La garantie limitée standard d'un an du fabricant s'applique si l'appareil est acheté aux États-Unis.
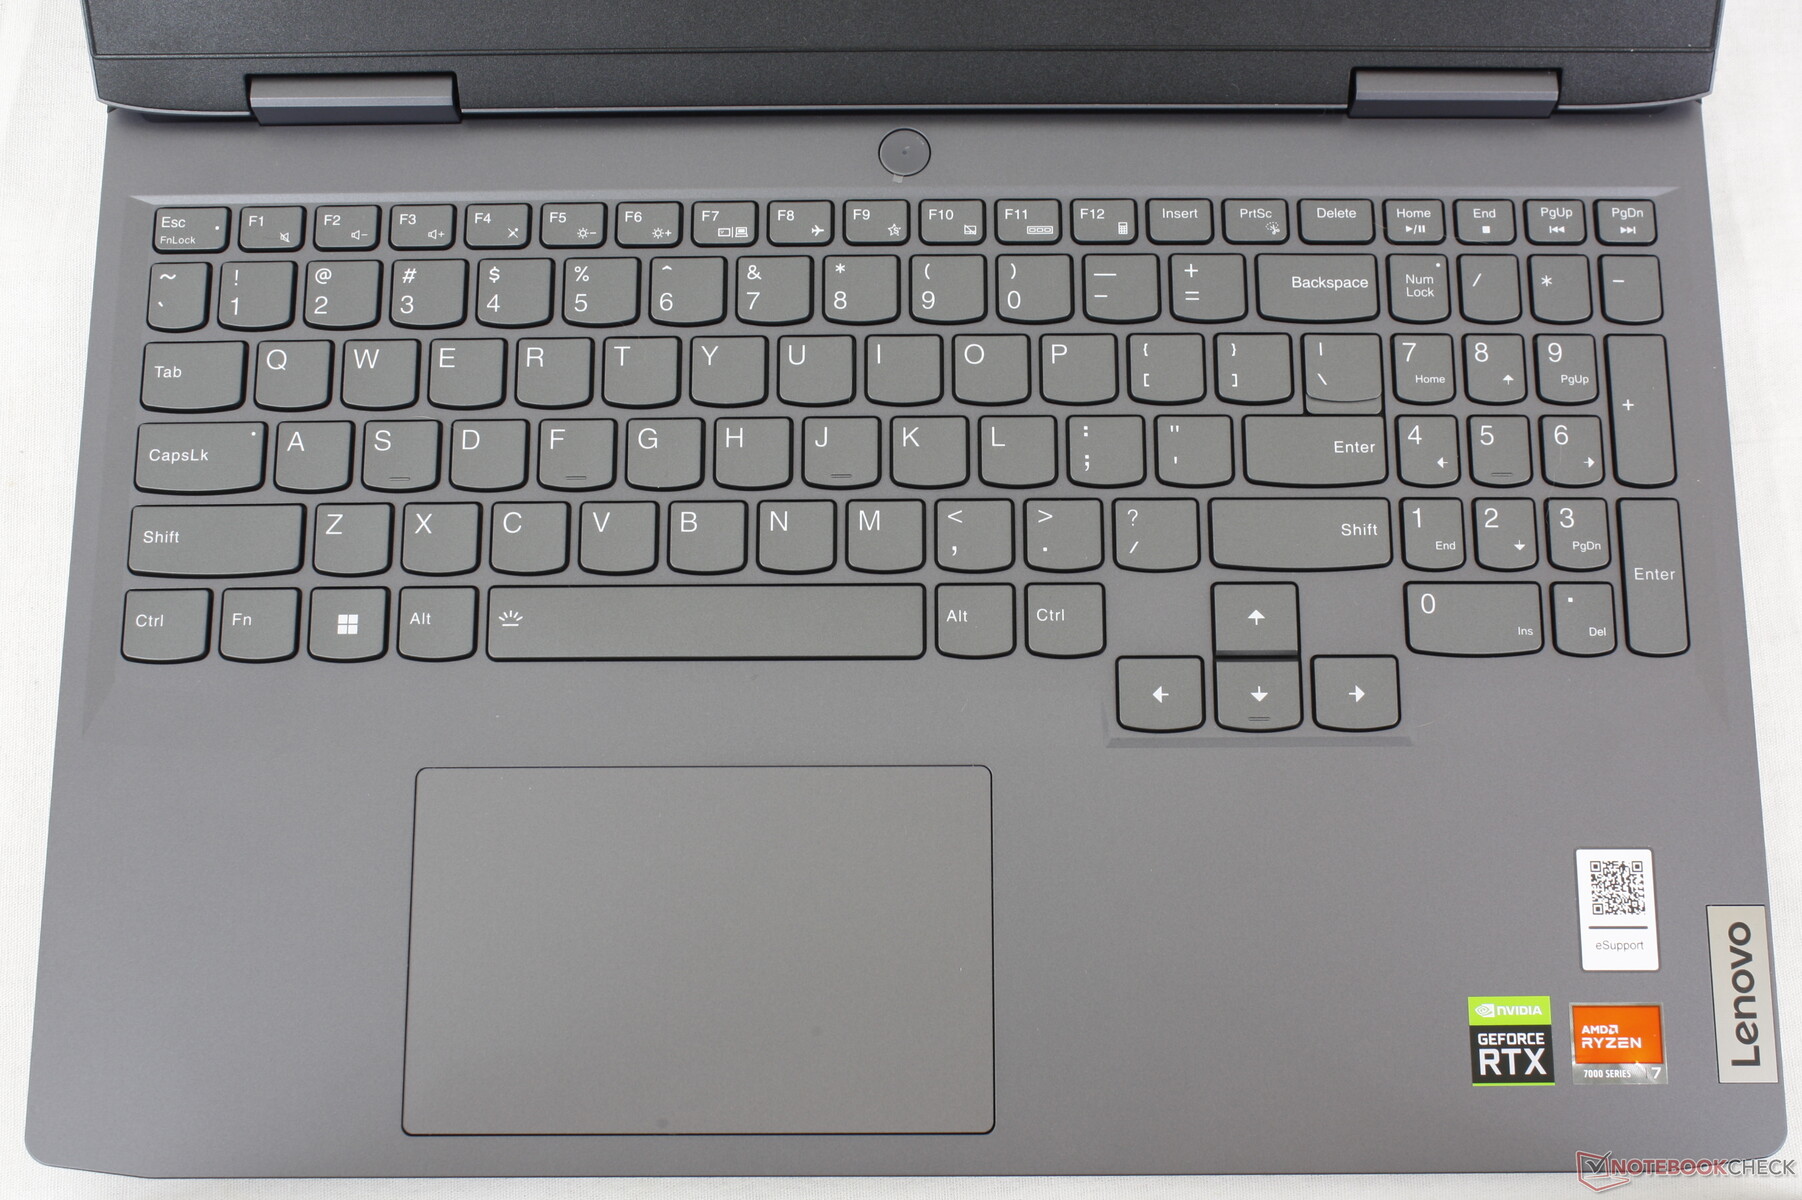
Périphériques d'entrée - Un peu comme un IdeaPad
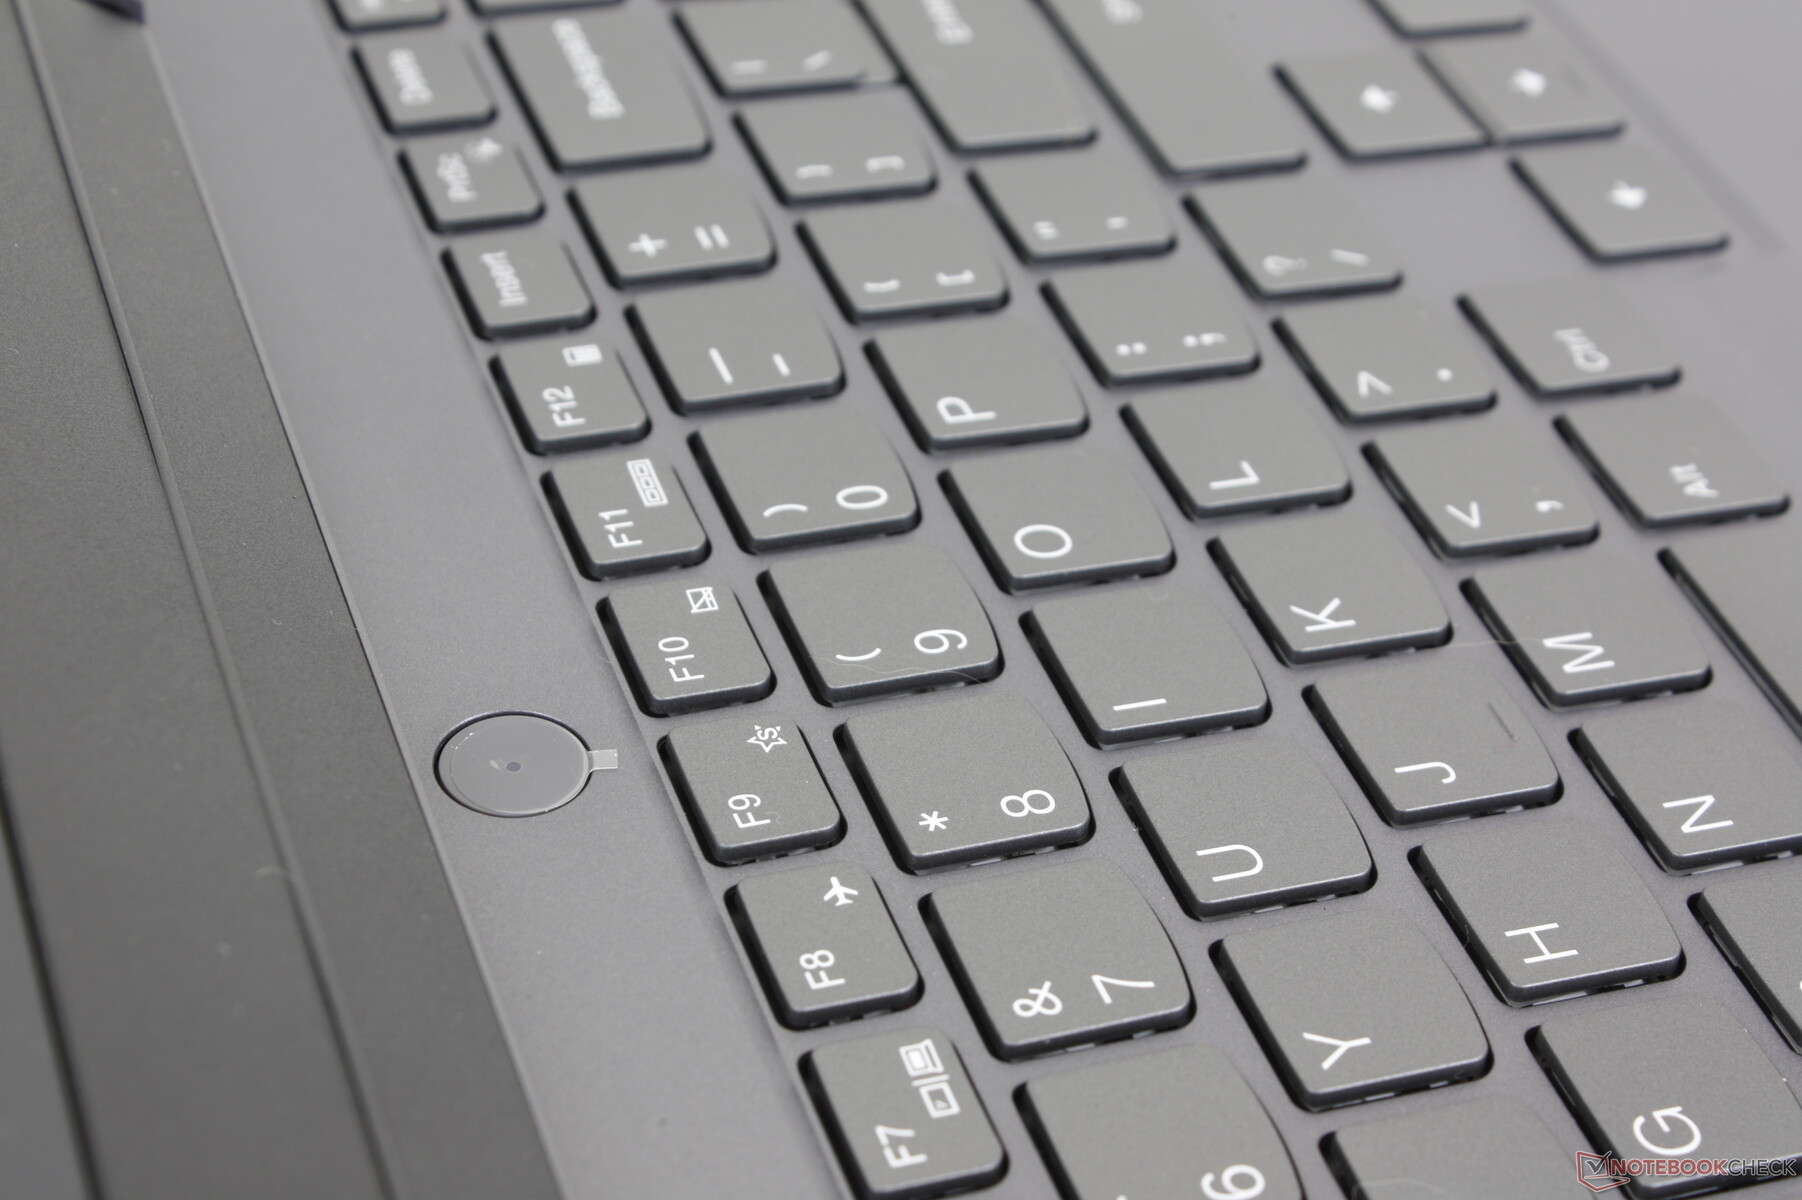
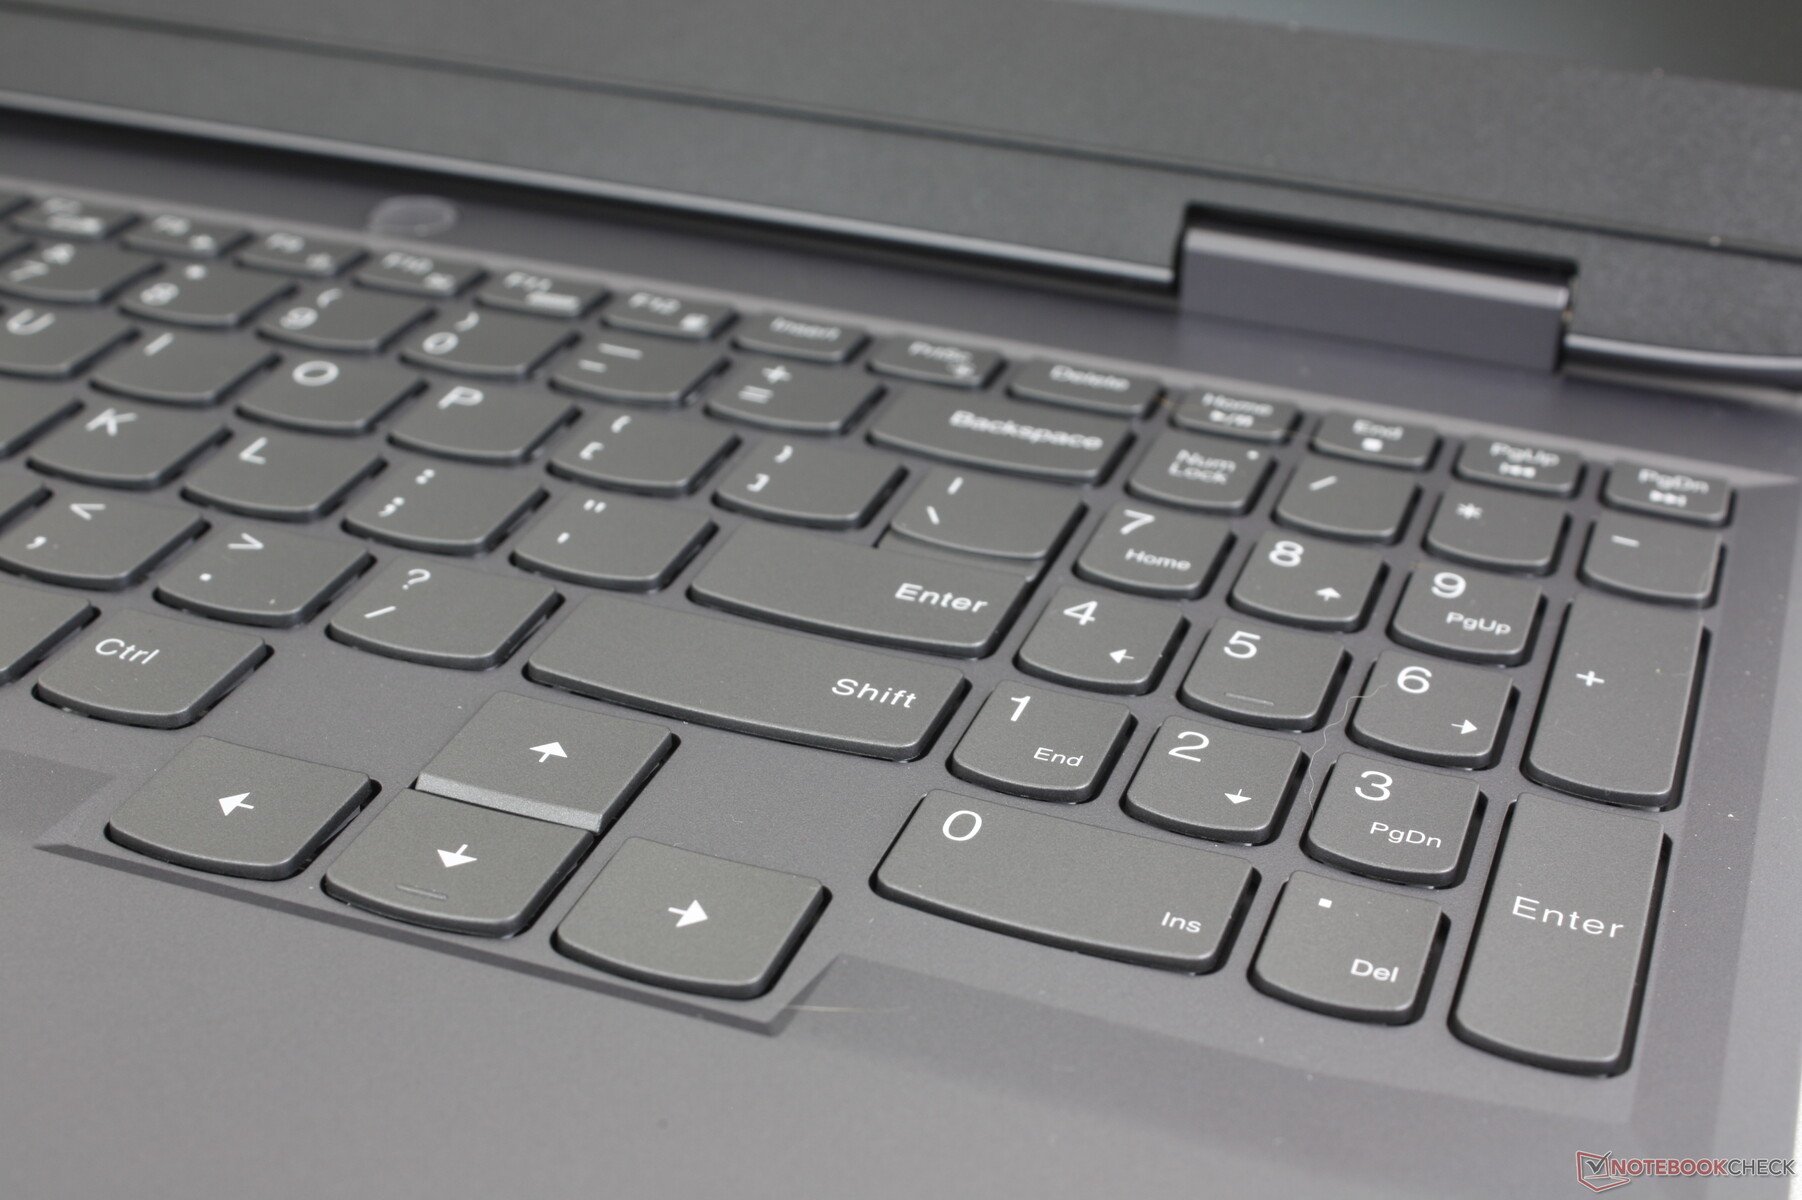
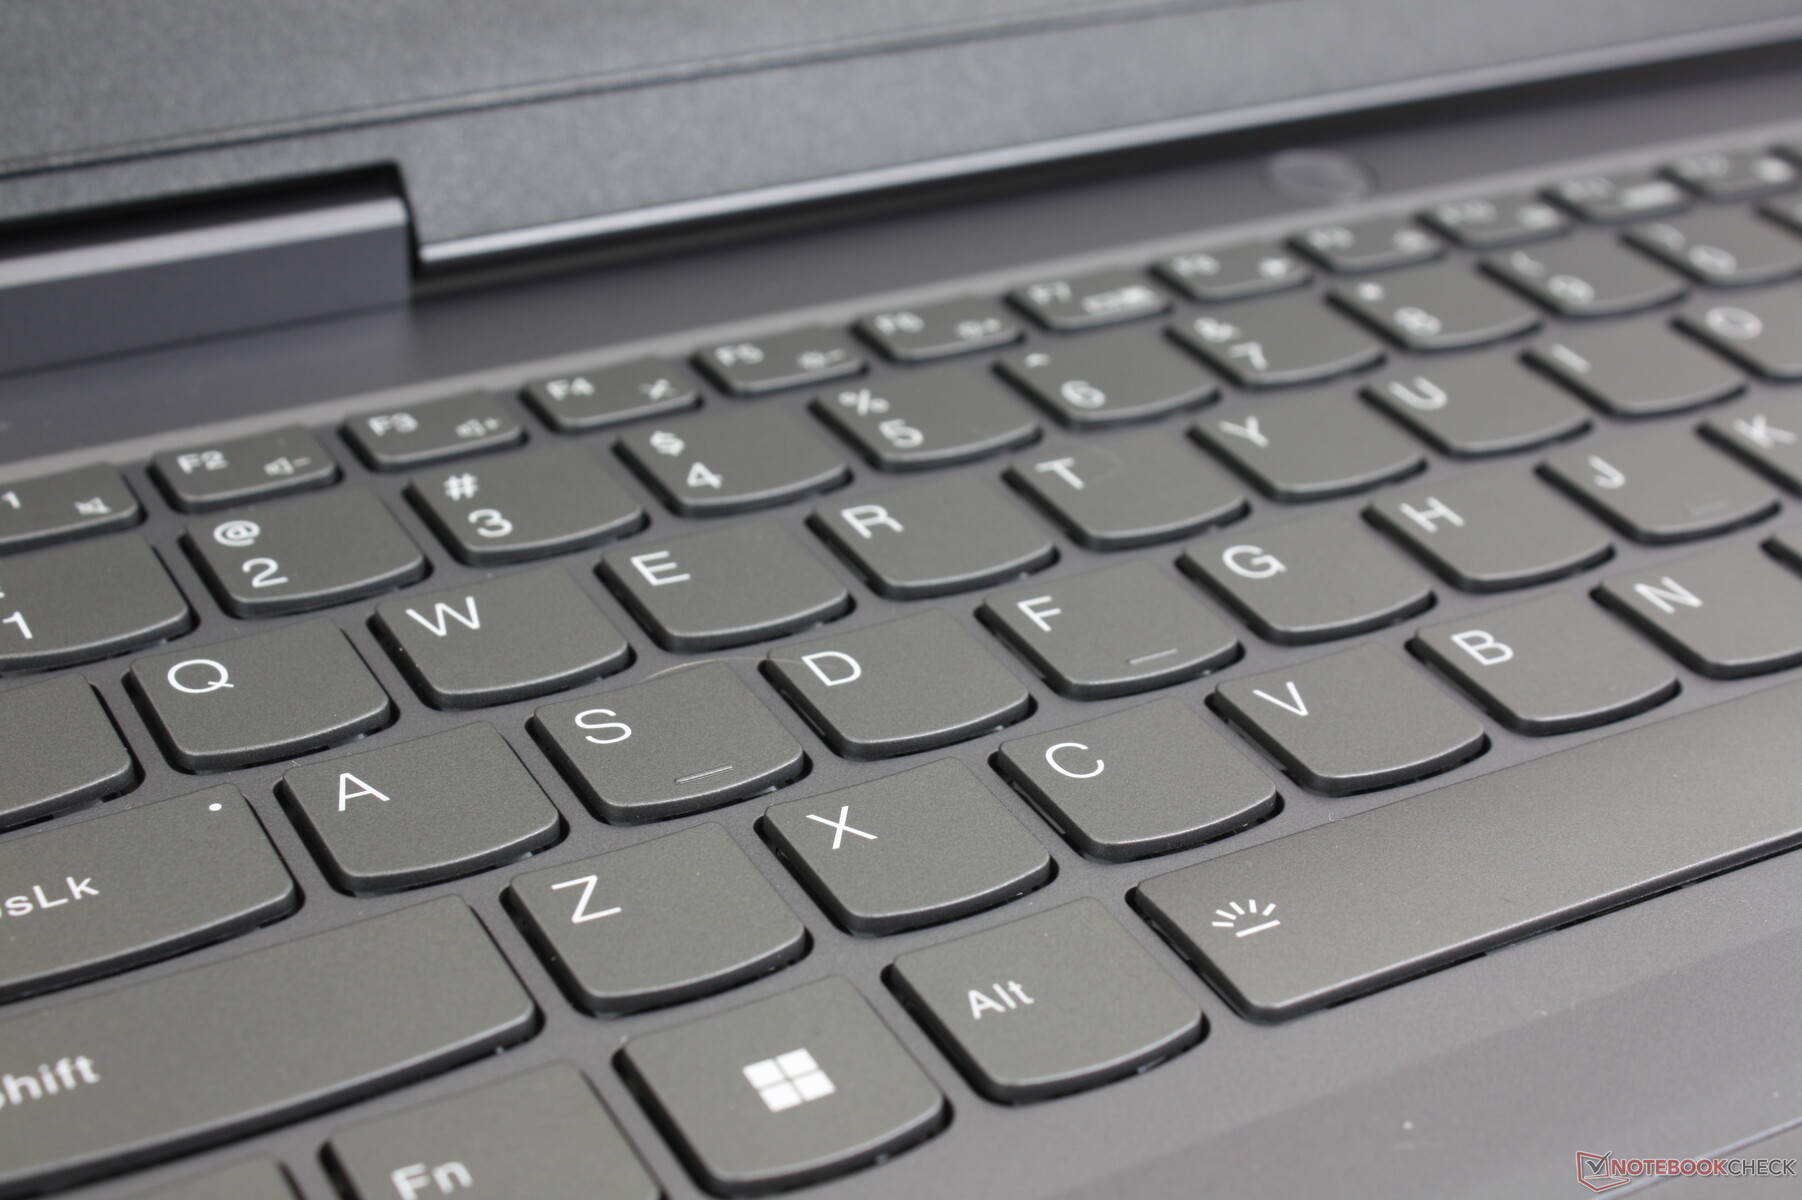
Clavier
Le clavier reste identique à celui de l'IdeaPad Gaming 3 IdeaPad Gaming 3 15 malgré le changement de nom. Si vous avez déjà tapé sur un IdeaPad ou un Yoga, le clavier du LOQ 15 vous semblera immédiatement familier. D'un point de vue subjectif, les touches du LOQ 15 sont un peu plus fermes et cliquantes que d'habitude, ce qui offre une meilleure expérience de frappe qu'un Asus VivoBook ou HP Pavilion 15.
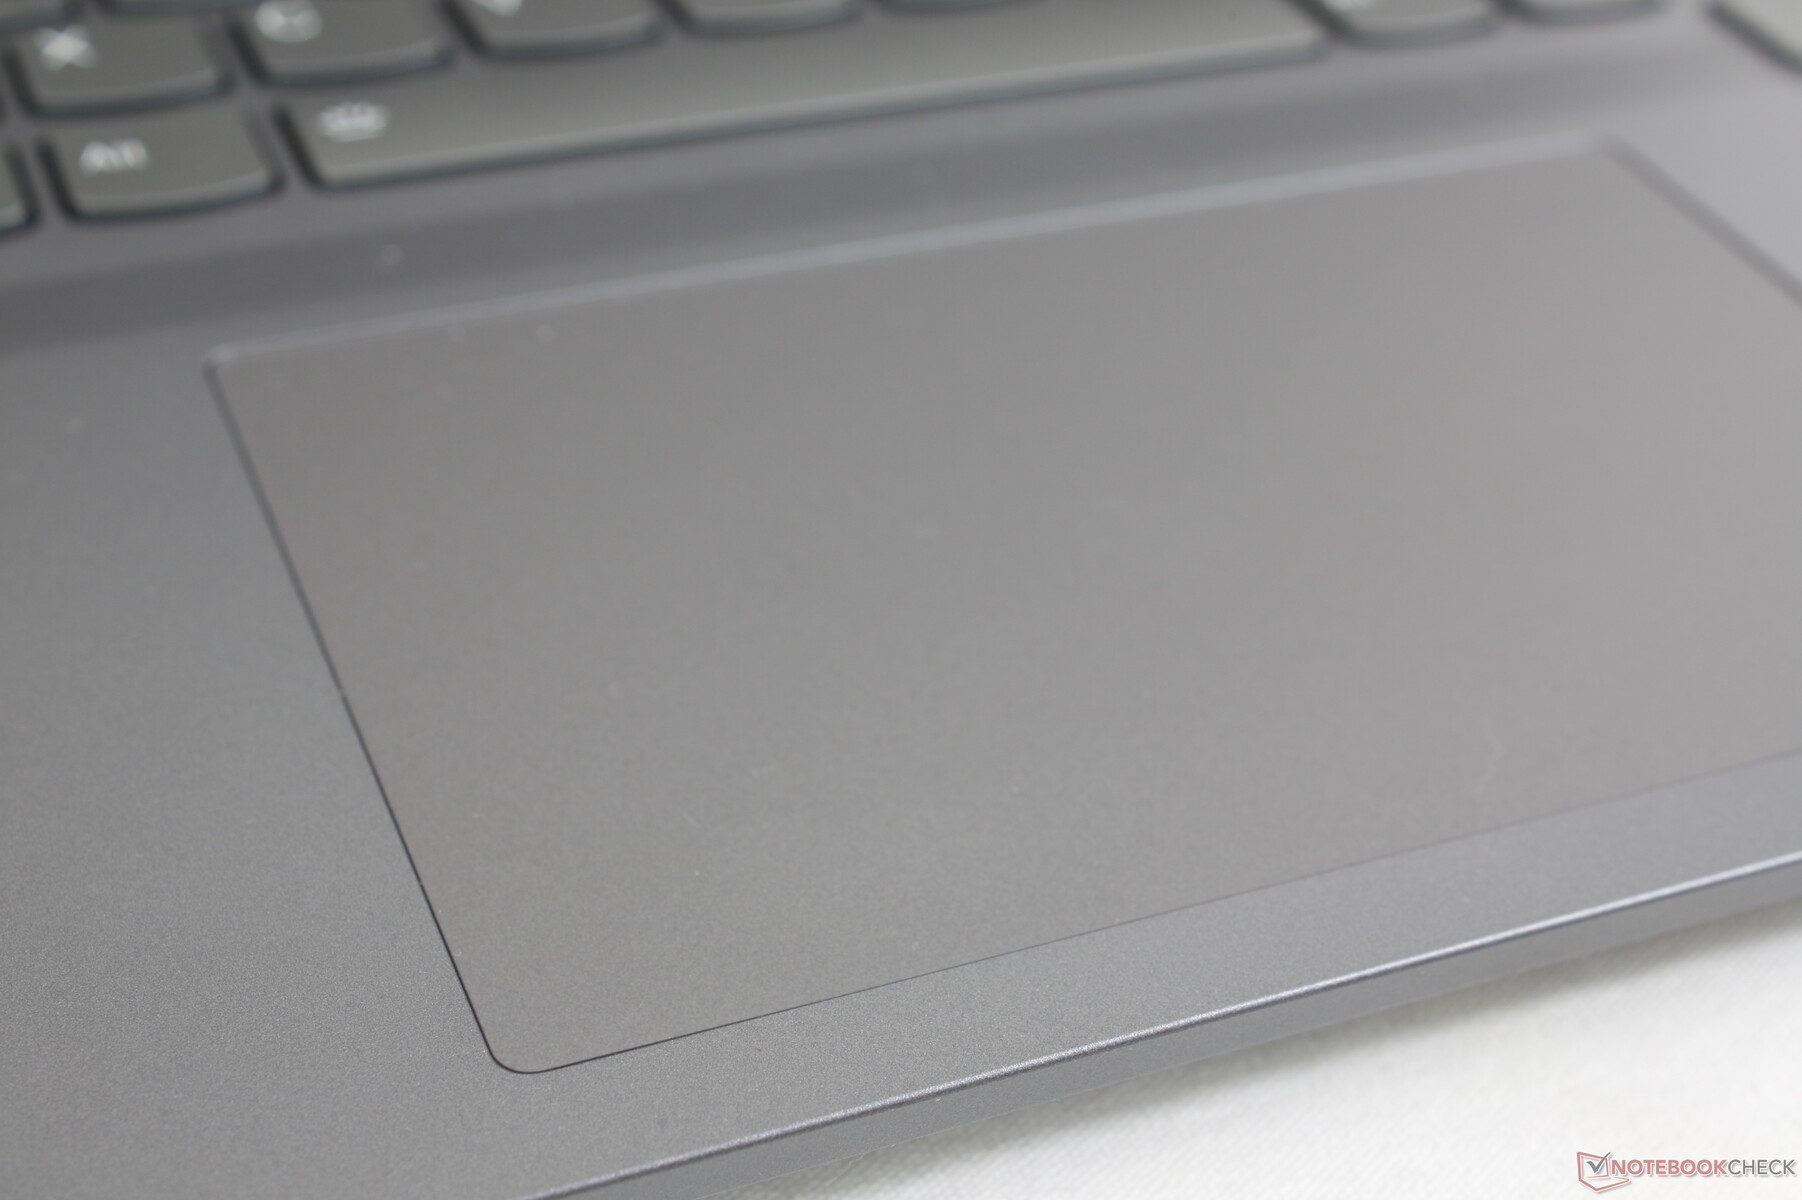
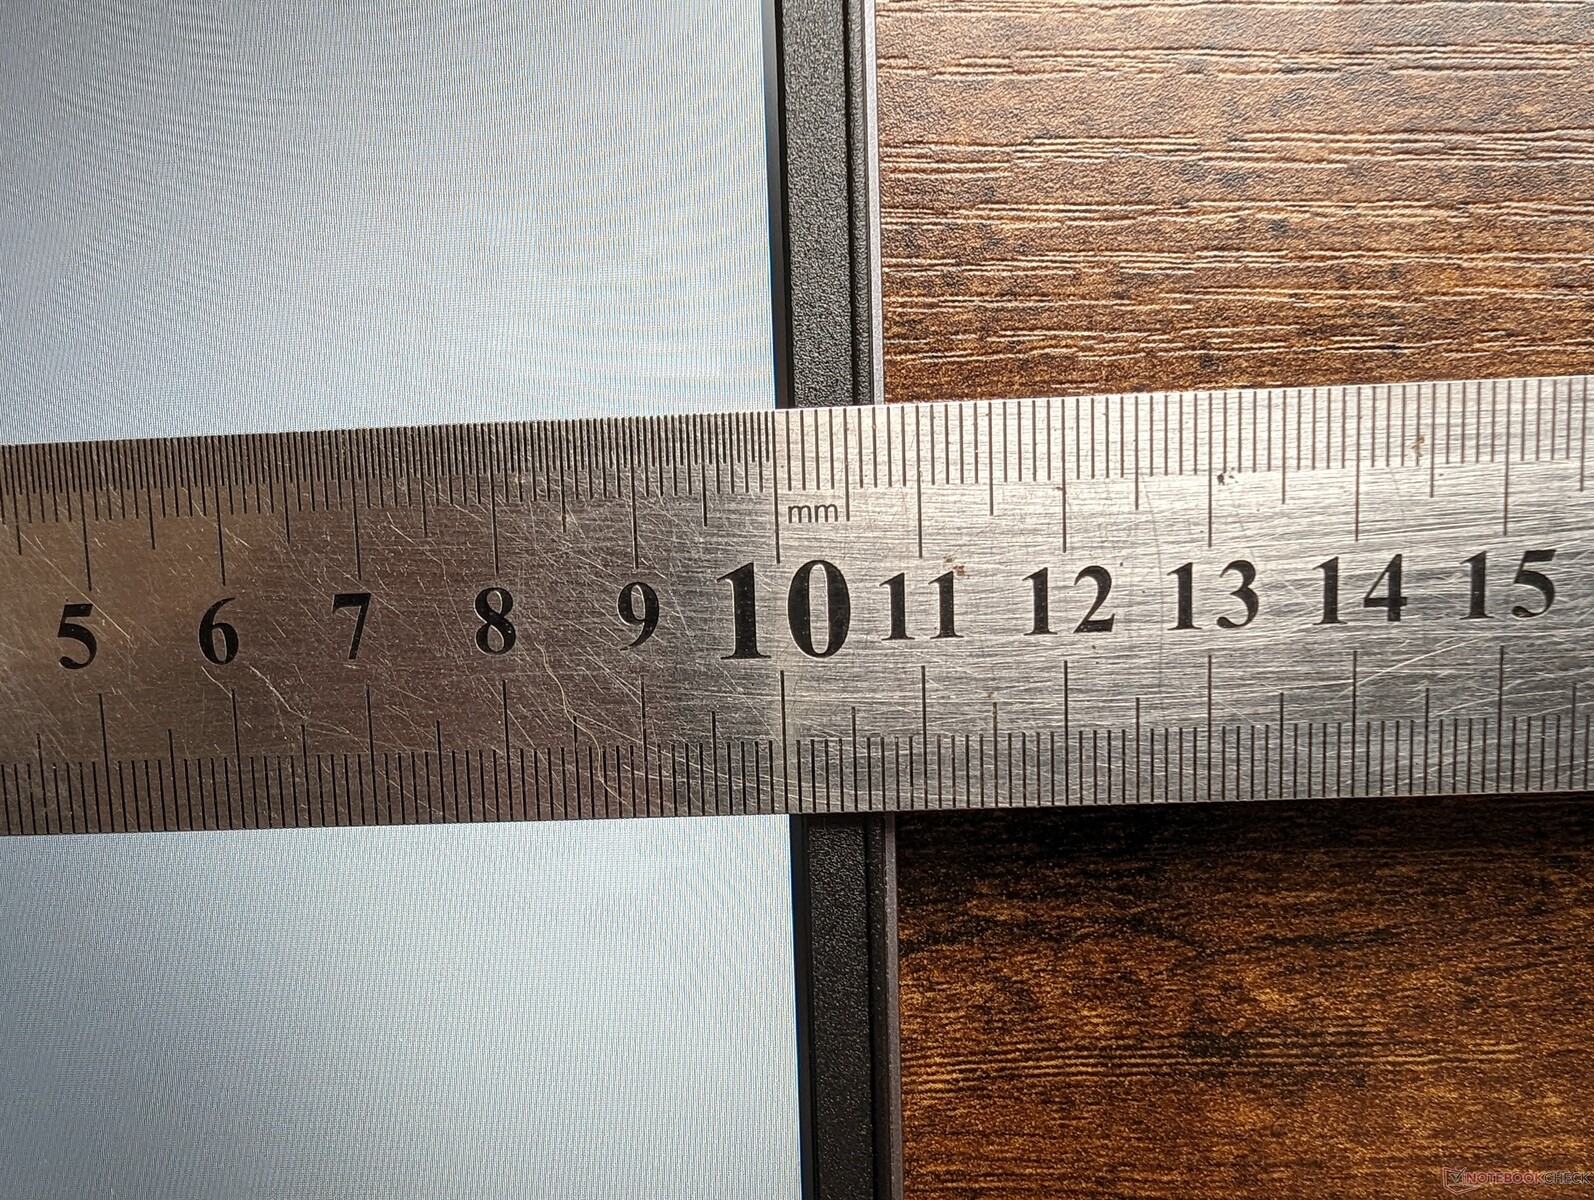
Pavé tactile
Le clavier est légèrement plus petit que celui de l'IdeaPad Gaming 3 15 de l'année dernière (12 x 7,5 cm contre 12,5 x 7,5 cm). Toutefois, le pavé tactile du LOQ 15 est plus ferme et plus agréable à utiliser que celui de l'IdeaPad. Le claquement est nettement plus fort en raison du retour d'information plus net.
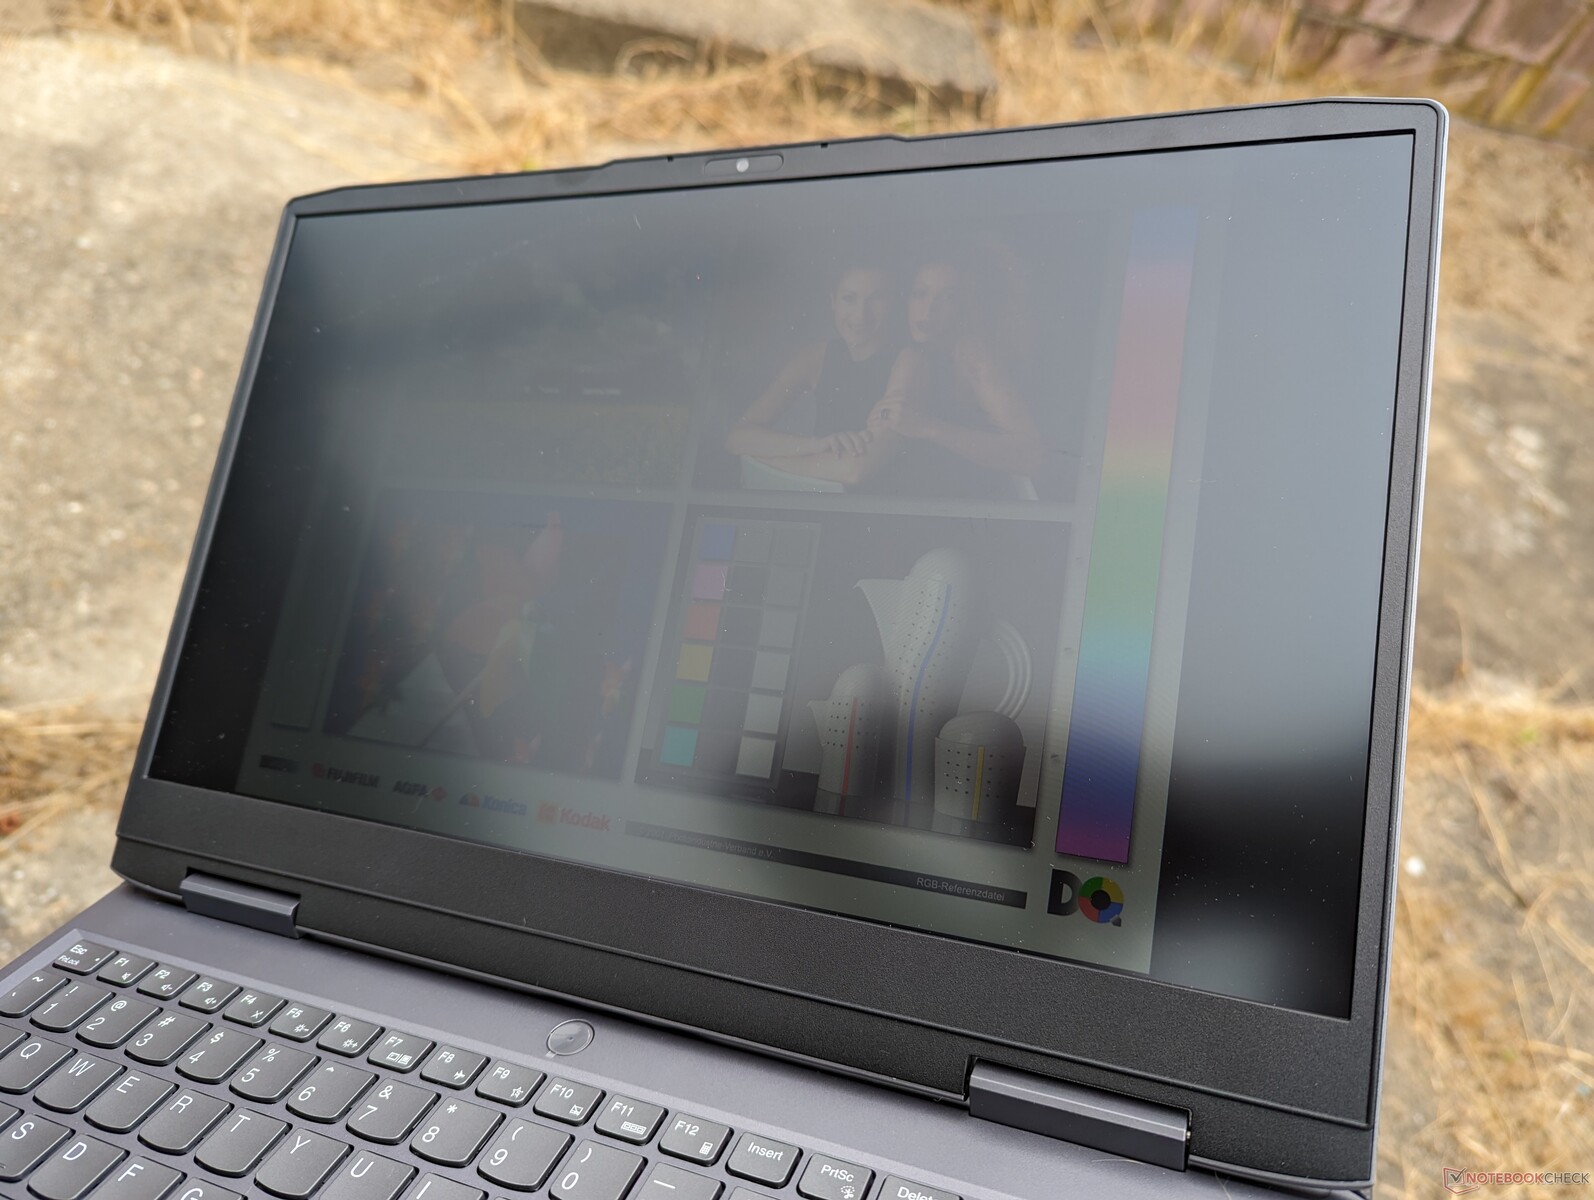
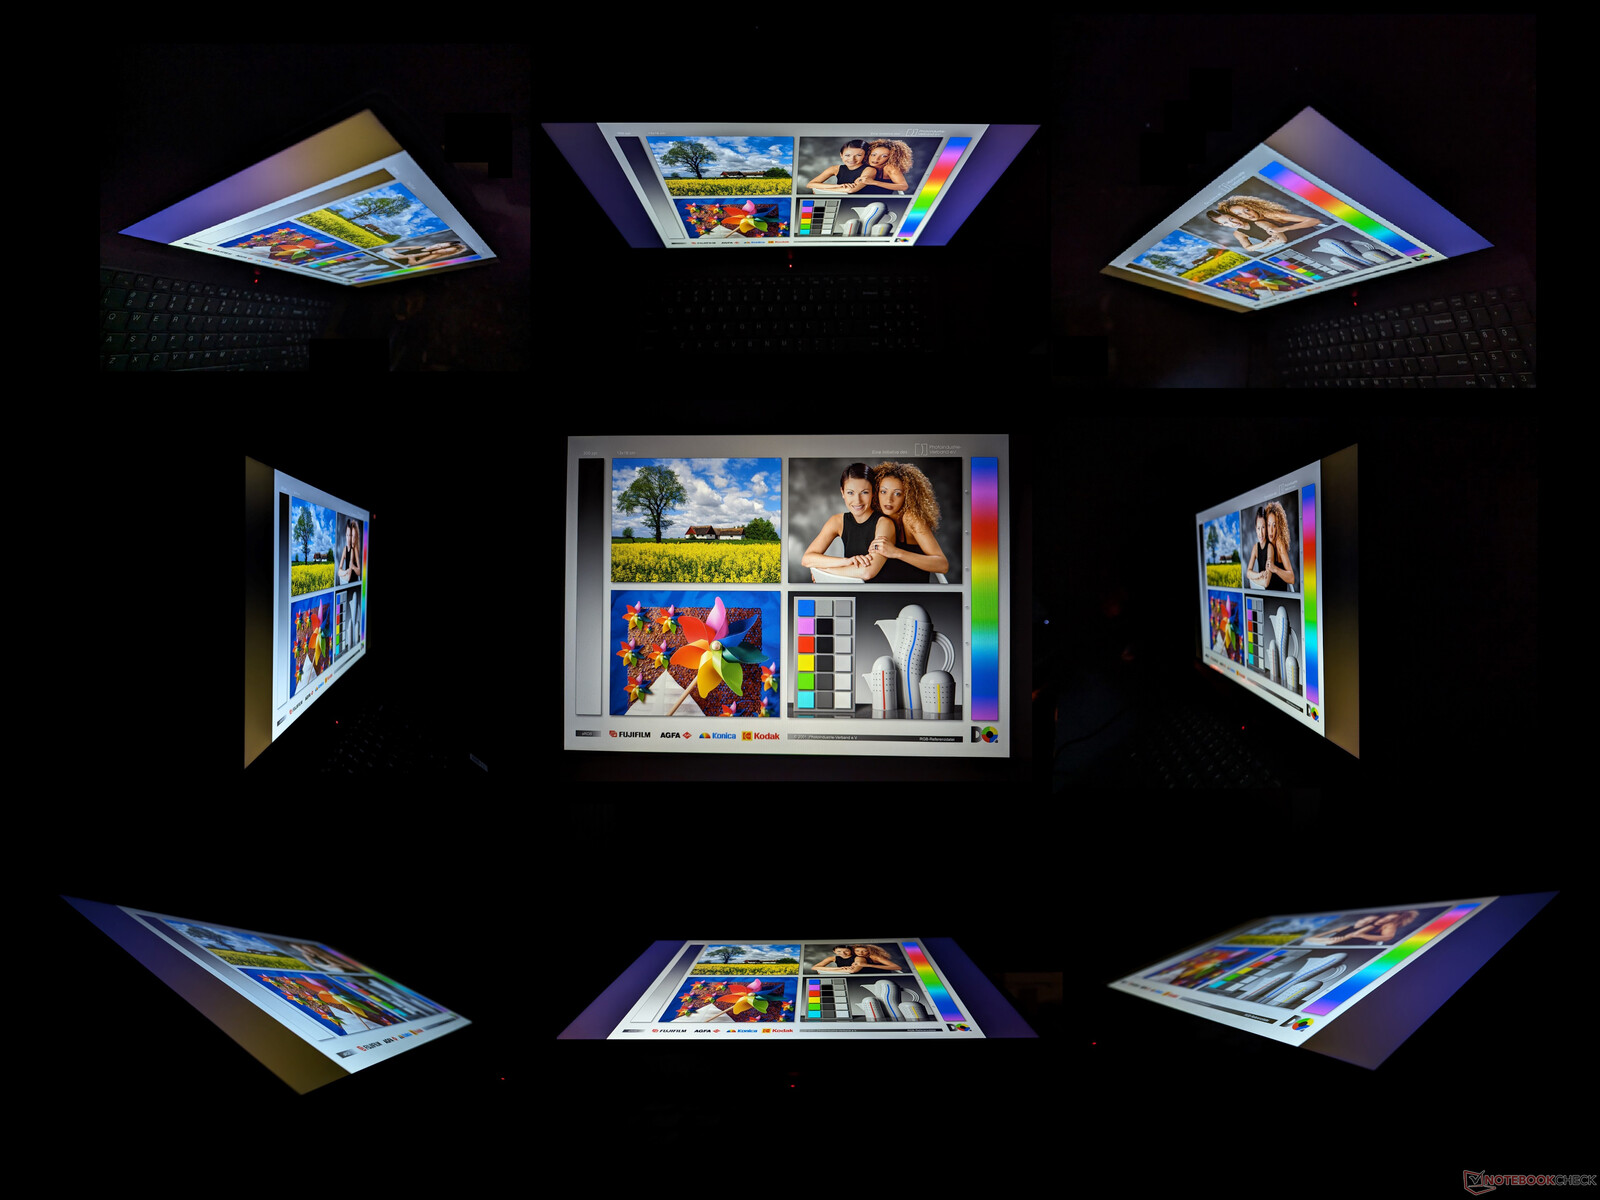
Affichage - Le 1080p se marie bien avec la GeForce RTX 4050
Trois configurations d'affichage sont disponibles, toutes avec des panneaux IPS :
- 1080p, 300 nits, 60% sRGB, 60 Hz
- 1080p, 350 nits, 60% sRGB, 144 Hz, Advanced Optimus, G-Sync
- 1440p, 350 nits, 100% sRGB, 165 Hz, Advanced Optimus, G-Sync
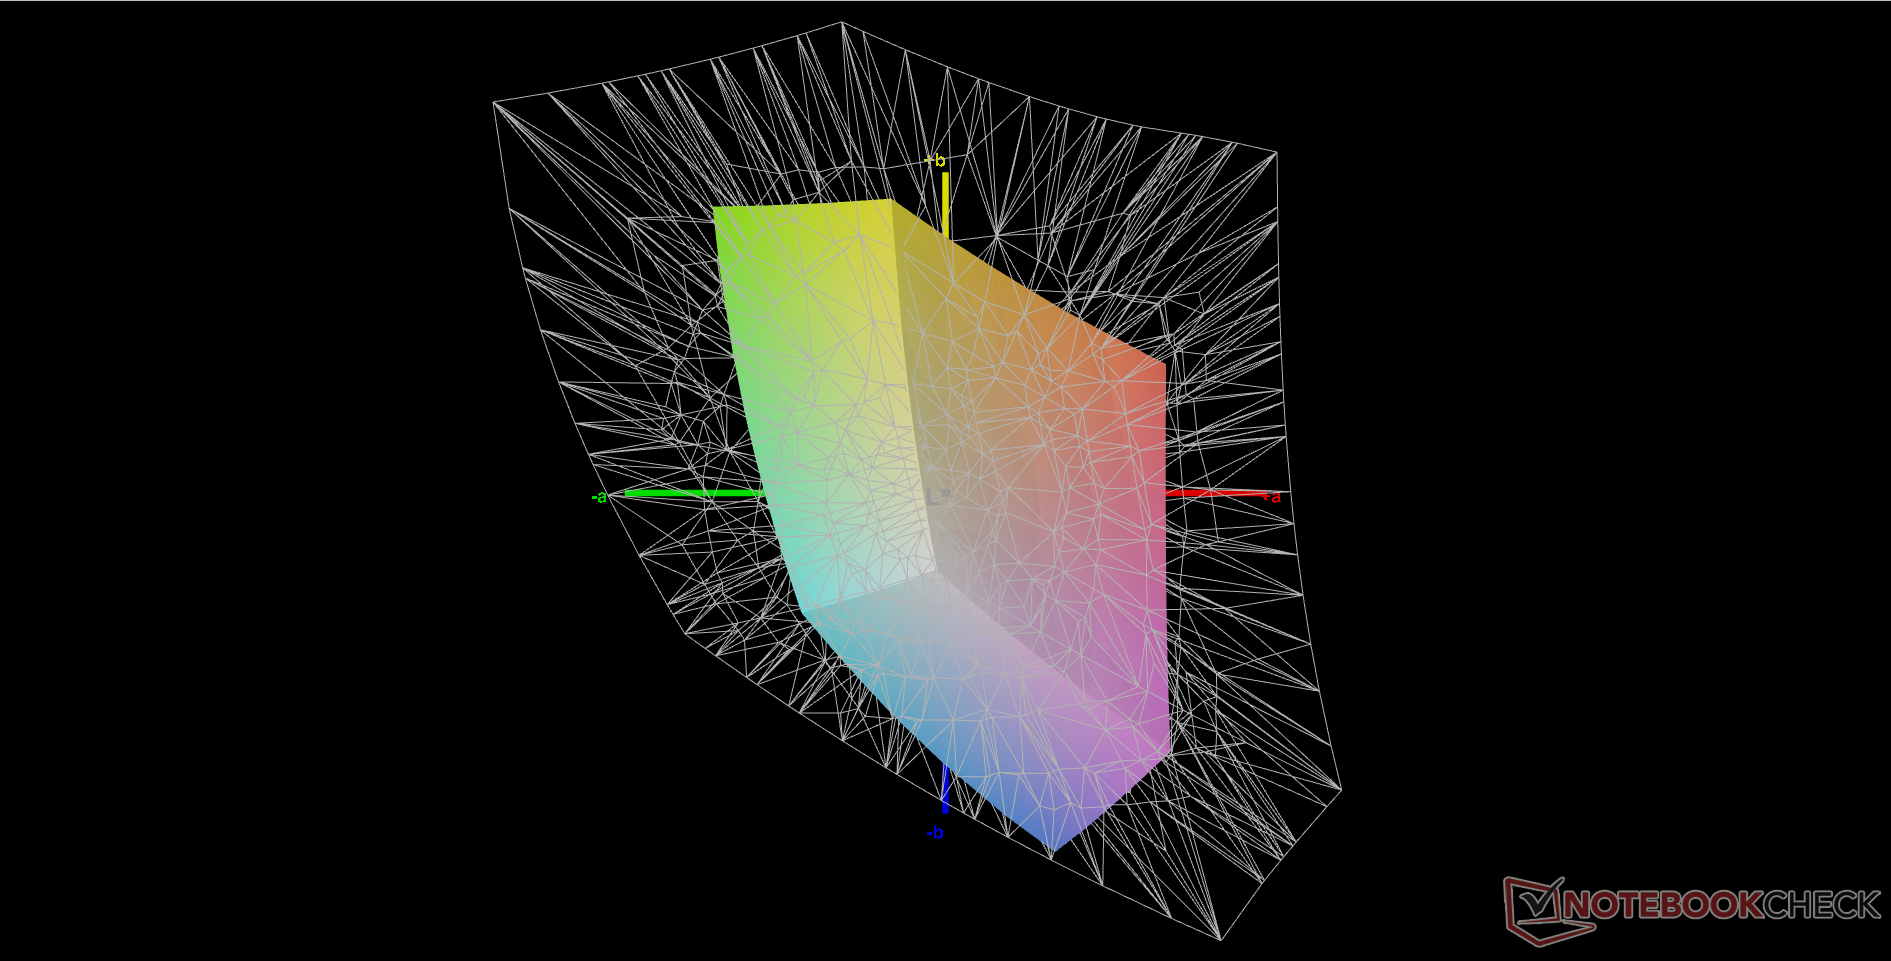
Notre configuration et nos mesures ne tiennent compte que de l'option en gras ci-dessus. Bien que le 1080p soit suffisant pour une machine de jeu bon marché, la couverture limitée des couleurs et les temps de réponse relativement lents se remarquent immédiatement par des couleurs moins intenses et des images fantômes, respectivement. Si vous aimez l'édition graphique ou les jeux de tir à la première personne, il est recommandé de connecter un moniteur externe avec de meilleures couleurs et des temps de réponse plus rapides ou de choisir l'option de panneau 1440p de meilleure qualité. Les concurrentsAsus TUF A15 offre une dalle 1080p avec une couverture sRGB complète, ce qui n'est pas le cas de notre Lenovo.

| |||||||||||||||||||||||||
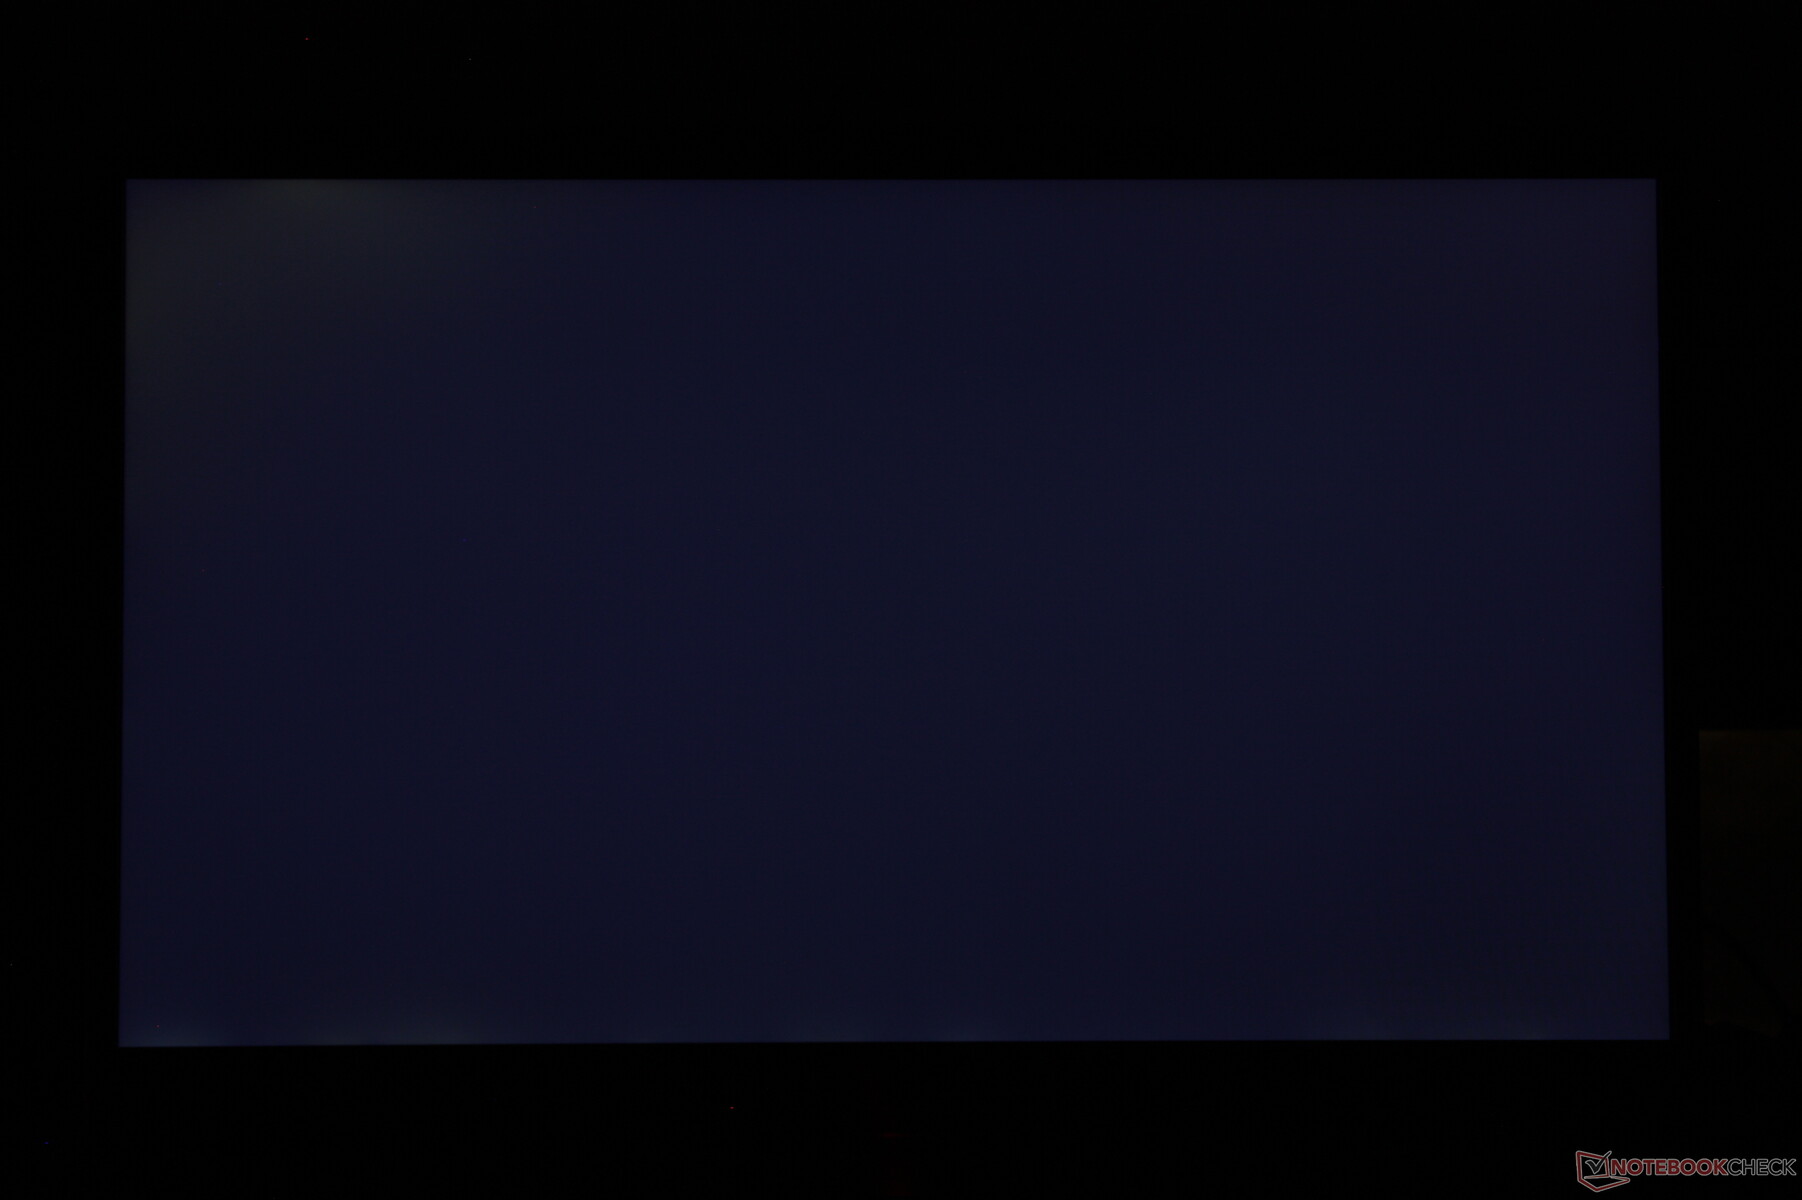
Homogénéité de la luminosité: 81 %
Valeur mesurée au centre, sur batterie: 346.2 cd/m²
Contraste: 1117:1 (Valeurs des noirs: 0.31 cd/m²)
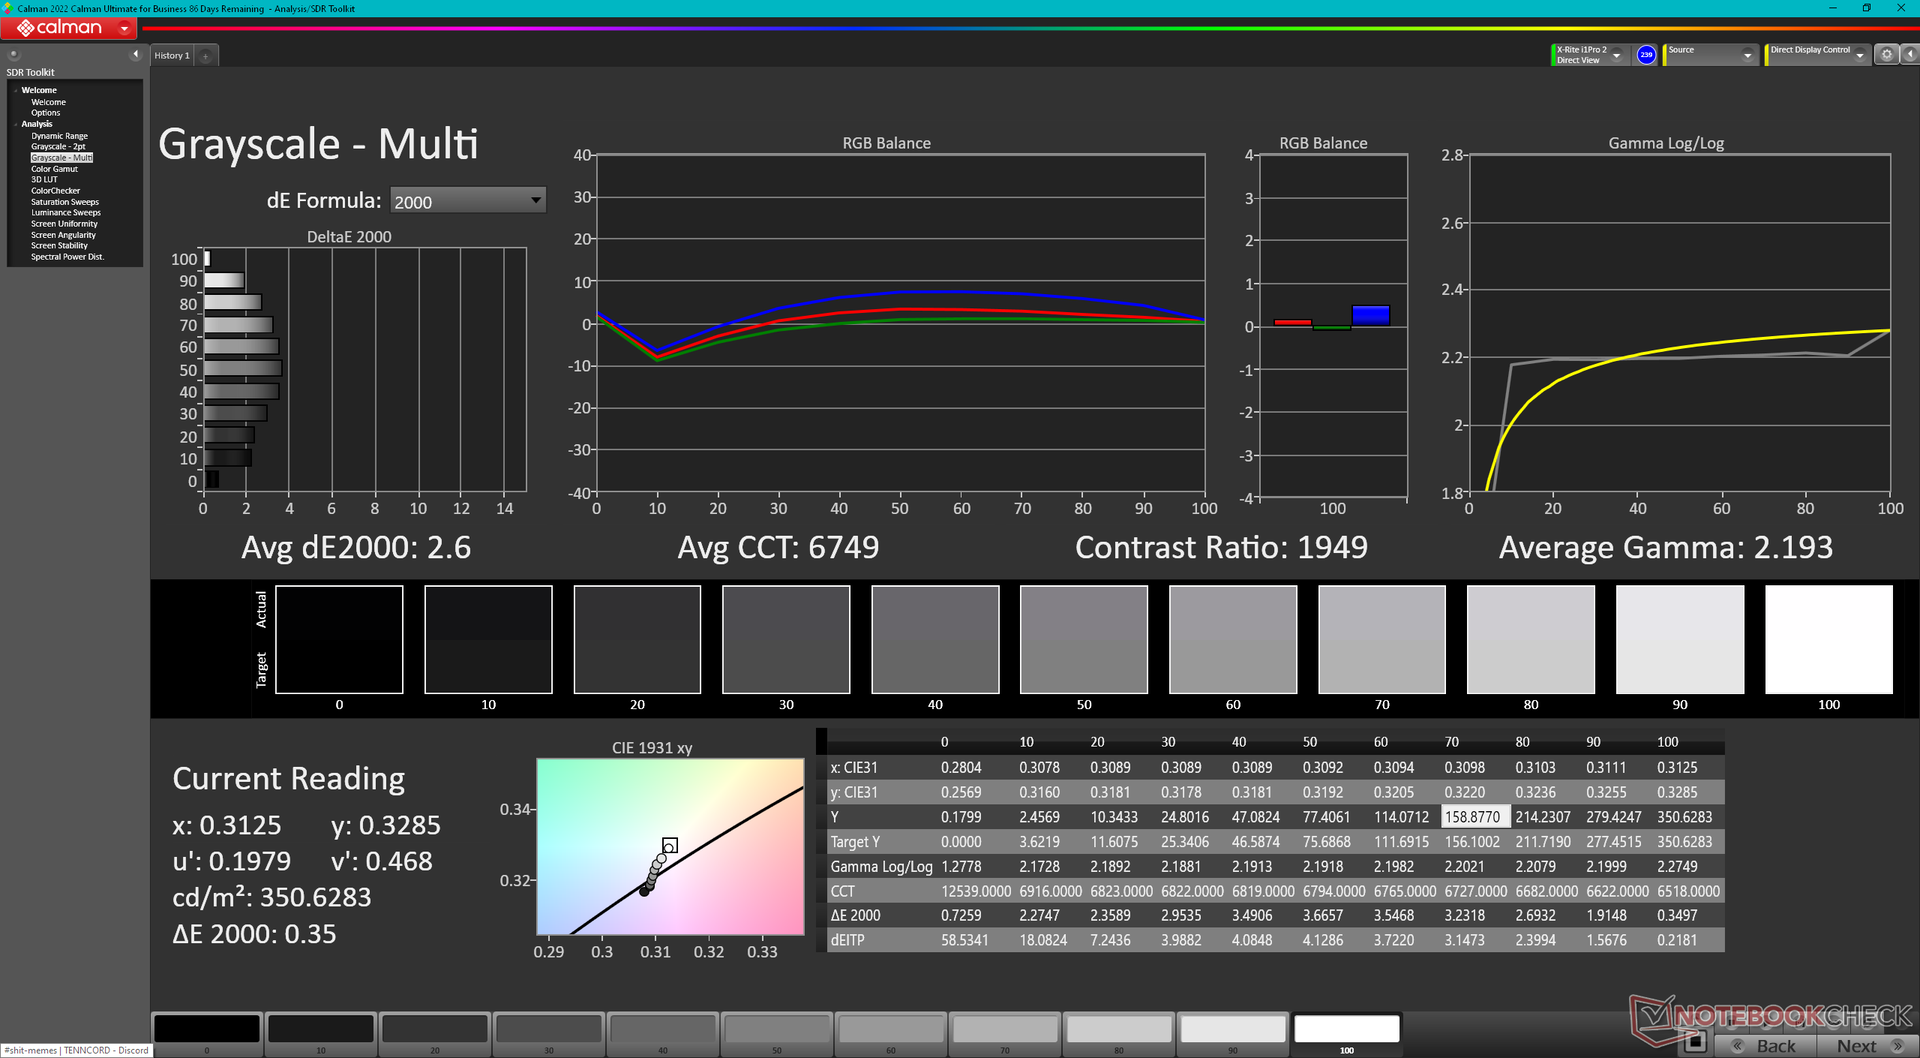
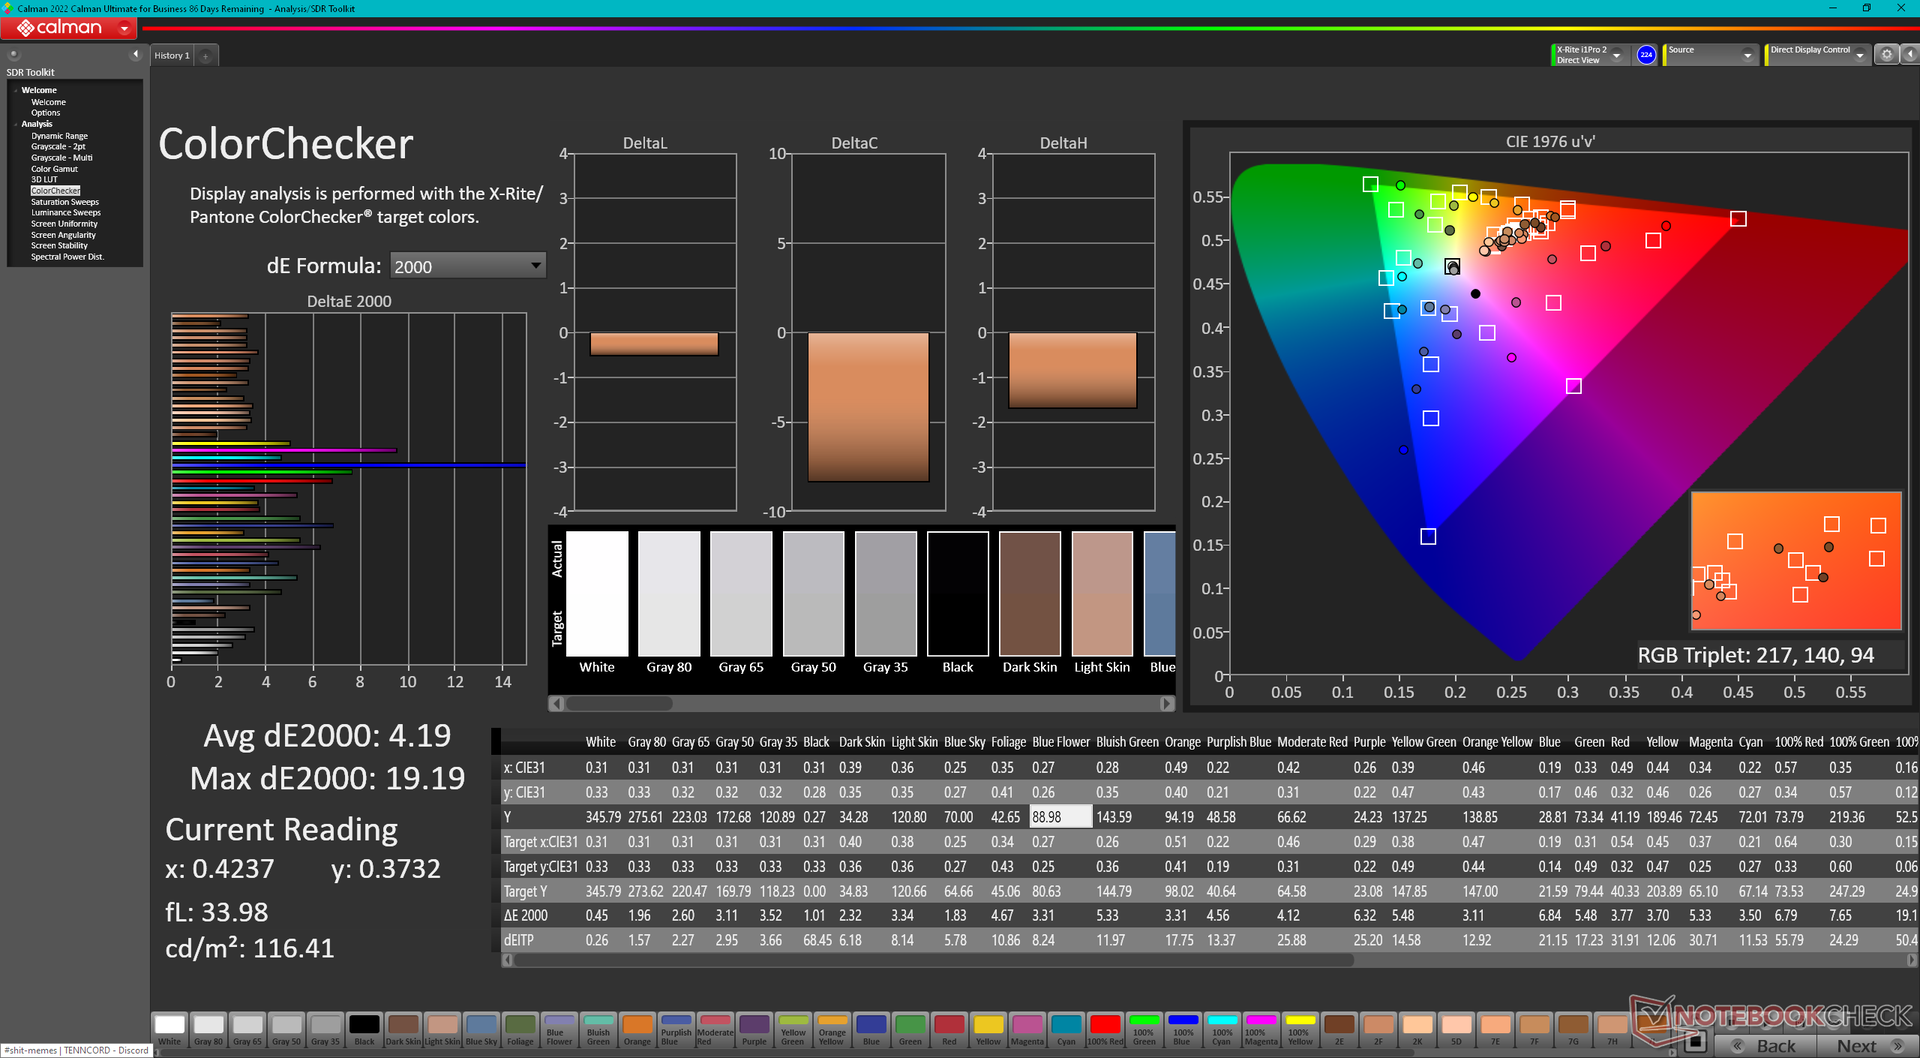
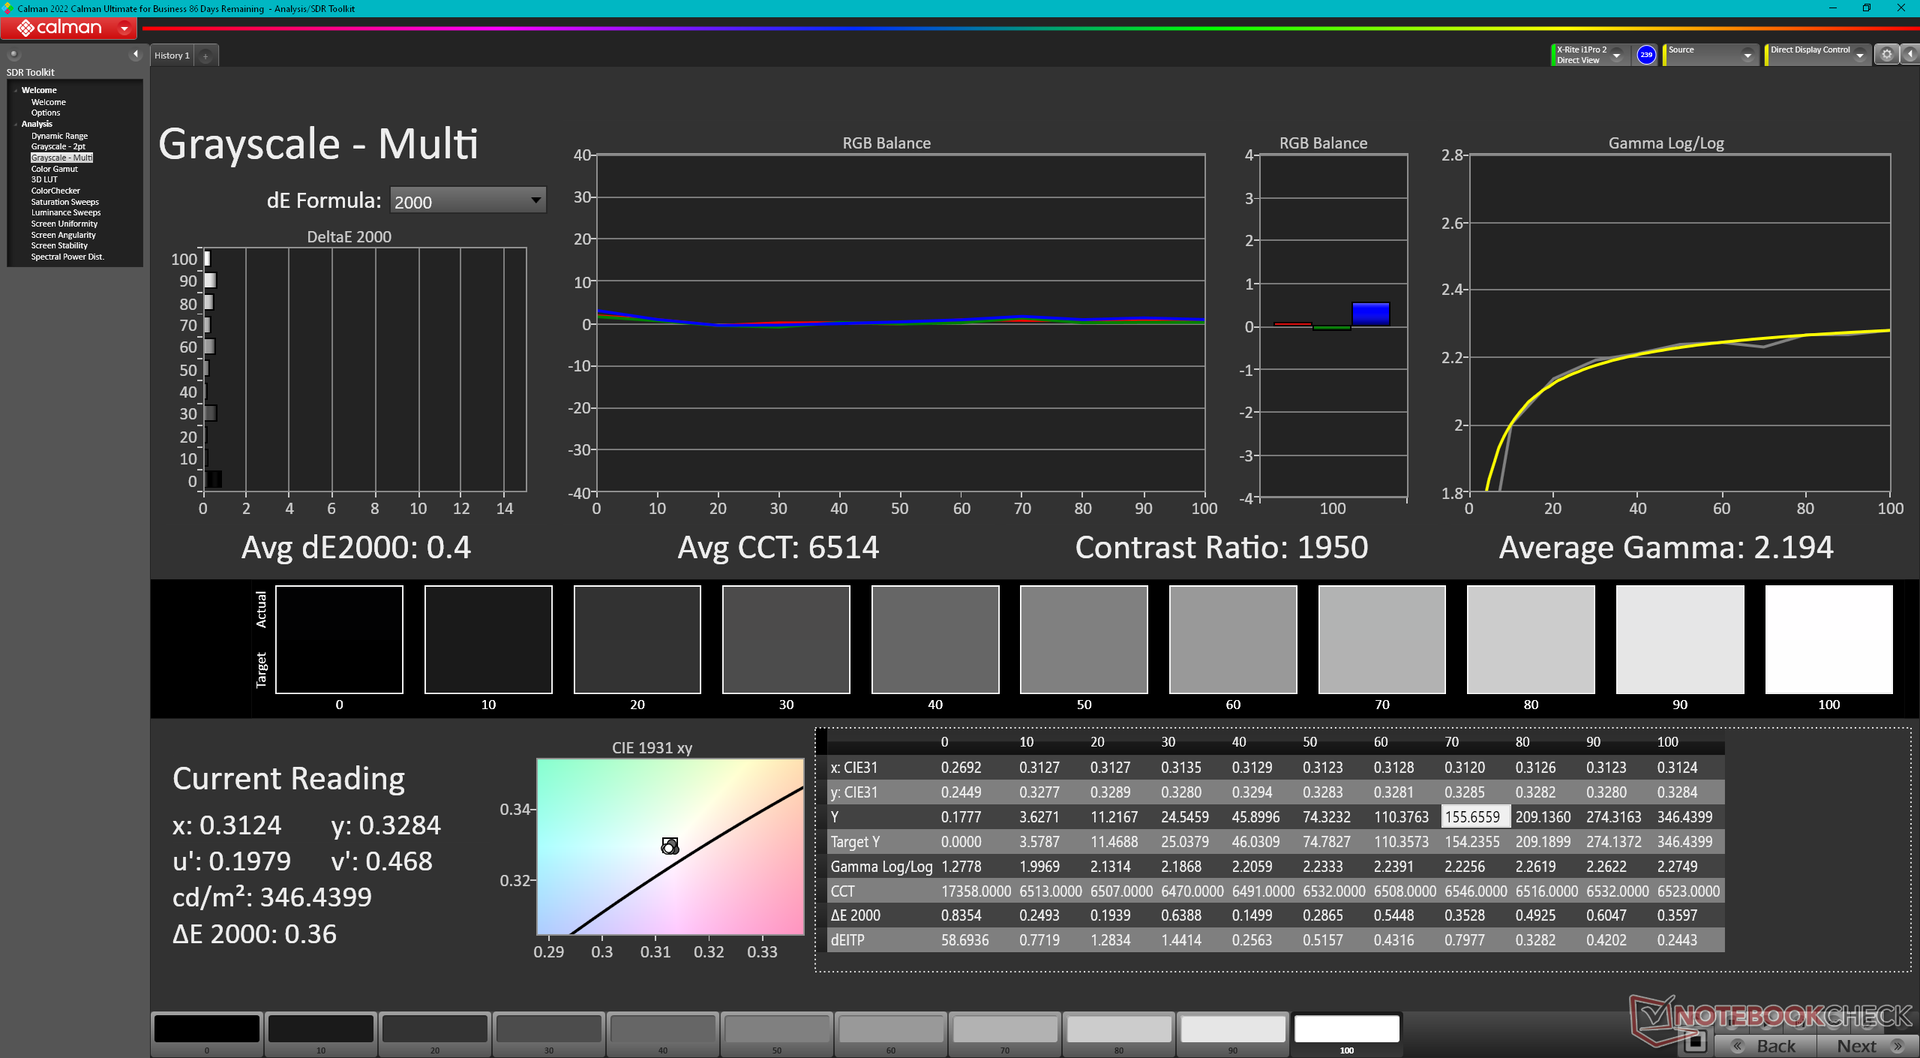
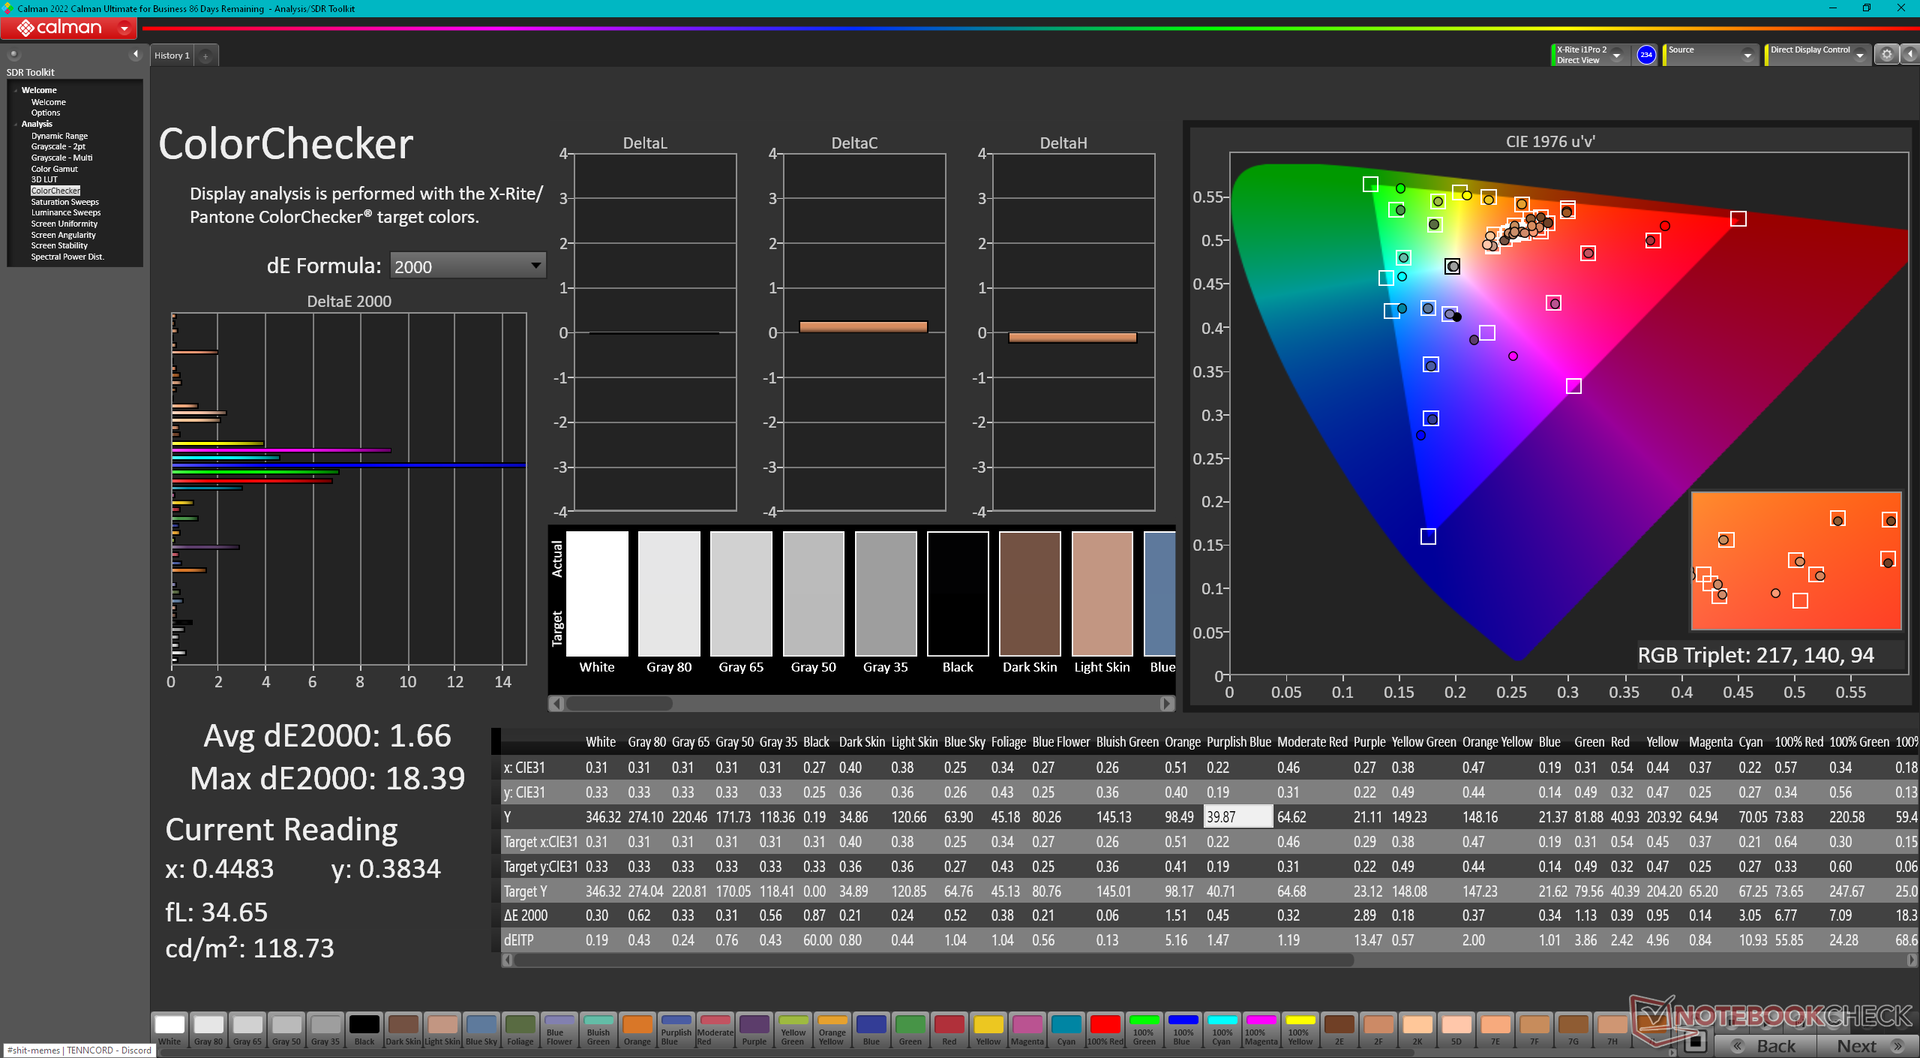
ΔE ColorChecker Calman: 4.19 | ∀{0.5-29.43 Ø4.71}
calibrated: 1.66
ΔE Greyscale Calman: 2.6 | ∀{0.09-98 Ø4.96}
41.5% AdobeRGB 1998 (Argyll 3D)
60.2% sRGB (Argyll 3D)
40.2% Display P3 (Argyll 3D)
Gamma: 2.19
CCT: 6749 K
| Lenovo LOQ 15APH8 BOE NJ NE156FHM-NX3, IPS, 1920x1080, 15.6" | Lenovo Legion 5 15IAH7H 82RB CSOT MNF601CA1-3, IPS, 1920x1080, 15.6" | Dell G15 5530 AUO B156HAN, IPS, 1920x1080, 15.6" | Asus TUF A15 FA507 N156HMA-GA1, IPS, 1920x1080, 15.6" | MSI Cyborg 15 A12VF AU Optronics B156HAN15.1, IPS, 1920x1080, 15.6" | HP Victus 15 fa0020nr CMN1521, IPS, 1920x1080, 15.6" | |
|---|---|---|---|---|---|---|
| Display | 69% | 75% | 60% | 5% | 4% | |
| Display P3 Coverage (%) | 40.2 | 69.1 72% | 73.1 82% | 64.9 61% | 42.3 5% | 42 4% |
| sRGB Coverage (%) | 60.2 | 99.5 65% | 98.4 63% | 96.5 60% | 62.6 4% | 62.7 4% |
| AdobeRGB 1998 Coverage (%) | 41.5 | 70 69% | 74.4 79% | 66.6 60% | 43.7 5% | 43.4 5% |
| Response Times | 58% | 85% | 22% | 46% | 4% | |
| Response Time Grey 50% / Grey 80% * (ms) | 42.7 ? | 14.8 ? 65% | 3.39 ? 92% | 30.4 ? 29% | 22 ? 48% | 35.2 ? 18% |
| Response Time Black / White * (ms) | 24.5 ? | 12 ? 51% | 5.35 ? 78% | 20.8 ? 15% | 14 ? 43% | 27.2 ? -11% |
| PWM Frequency (Hz) | 21620 ? | |||||
| Screen | -4% | -2% | 28% | -9% | 1% | |
| Brightness middle (cd/m²) | 346.2 | 363.5 5% | 320 -8% | 288 -17% | 247 -29% | 284.3 -18% |
| Brightness (cd/m²) | 329 | 350 6% | 316 -4% | 271 -18% | 234 -29% | 262 -20% |
| Brightness Distribution (%) | 81 | 89 10% | 94 16% | 91 12% | 89 10% | 87 7% |
| Black Level * (cd/m²) | 0.31 | 0.39 -26% | 0.21 32% | 0.17 45% | 0.25 19% | 0.17 45% |
| Contrast (:1) | 1117 | 932 -17% | 1524 36% | 1694 52% | 988 -12% | 1672 50% |
| Colorchecker dE 2000 * | 4.19 | 3.68 12% | 4.55 -9% | 1.9 55% | 3.78 10% | 4.52 -8% |
| Colorchecker dE 2000 max. * | 19.19 | 8.92 54% | 9.83 49% | 3.3 83% | 6.42 67% | 18.67 3% |
| Colorchecker dE 2000 calibrated * | 1.66 | 0.53 68% | 1.51 9% | 0.9 46% | 3.94 -137% | 1.55 7% |
| Greyscale dE 2000 * | 2.6 | 6.5 -150% | 6.2 -138% | 2.7 -4% | 2.16 17% | 4.1 -58% |
| Gamma | 2.19 100% | 2.2 100% | 2.07 106% | 2.32 95% | 2.33 94% | 2.3 96% |
| CCT | 6749 96% | 5995 108% | 6479 100% | 6535 99% | 6906 94% | 6529 100% |
| Moyenne finale (programmes/paramètres) | 41% /
20% | 53% /
27% | 37% /
34% | 14% /
2% | 3% /
2% |
* ... Moindre est la valeur, meilleures sont les performances
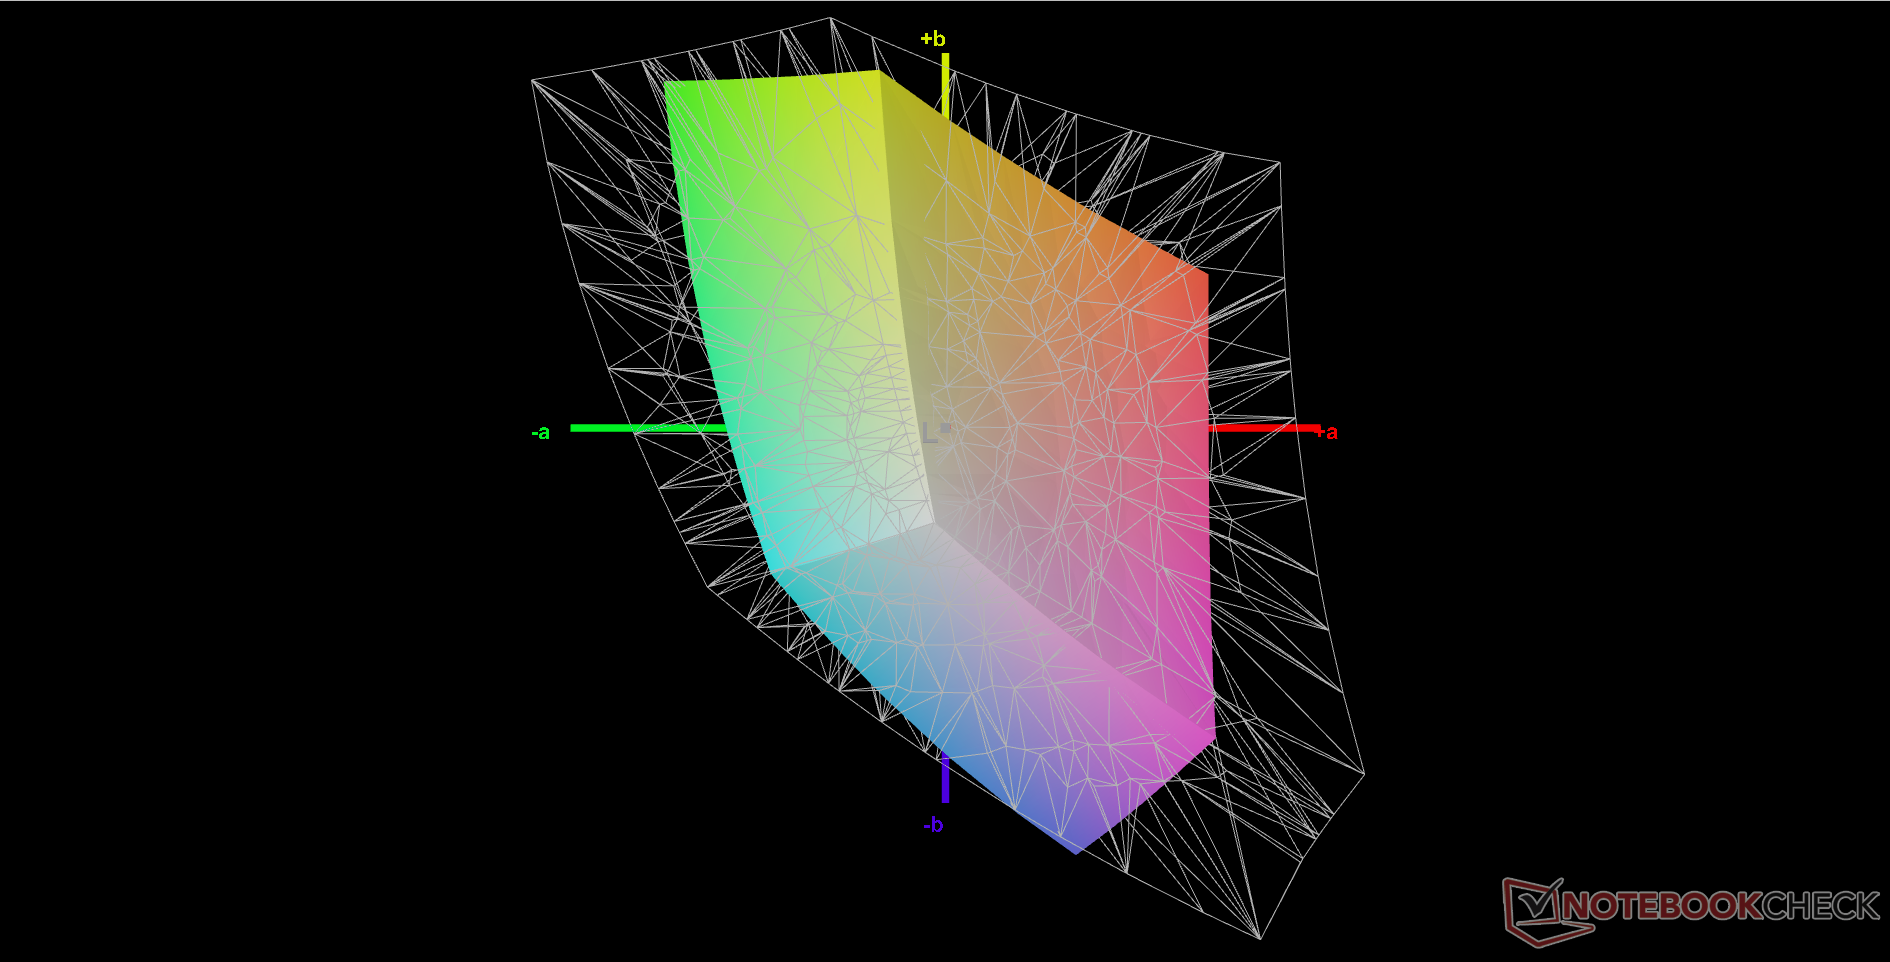
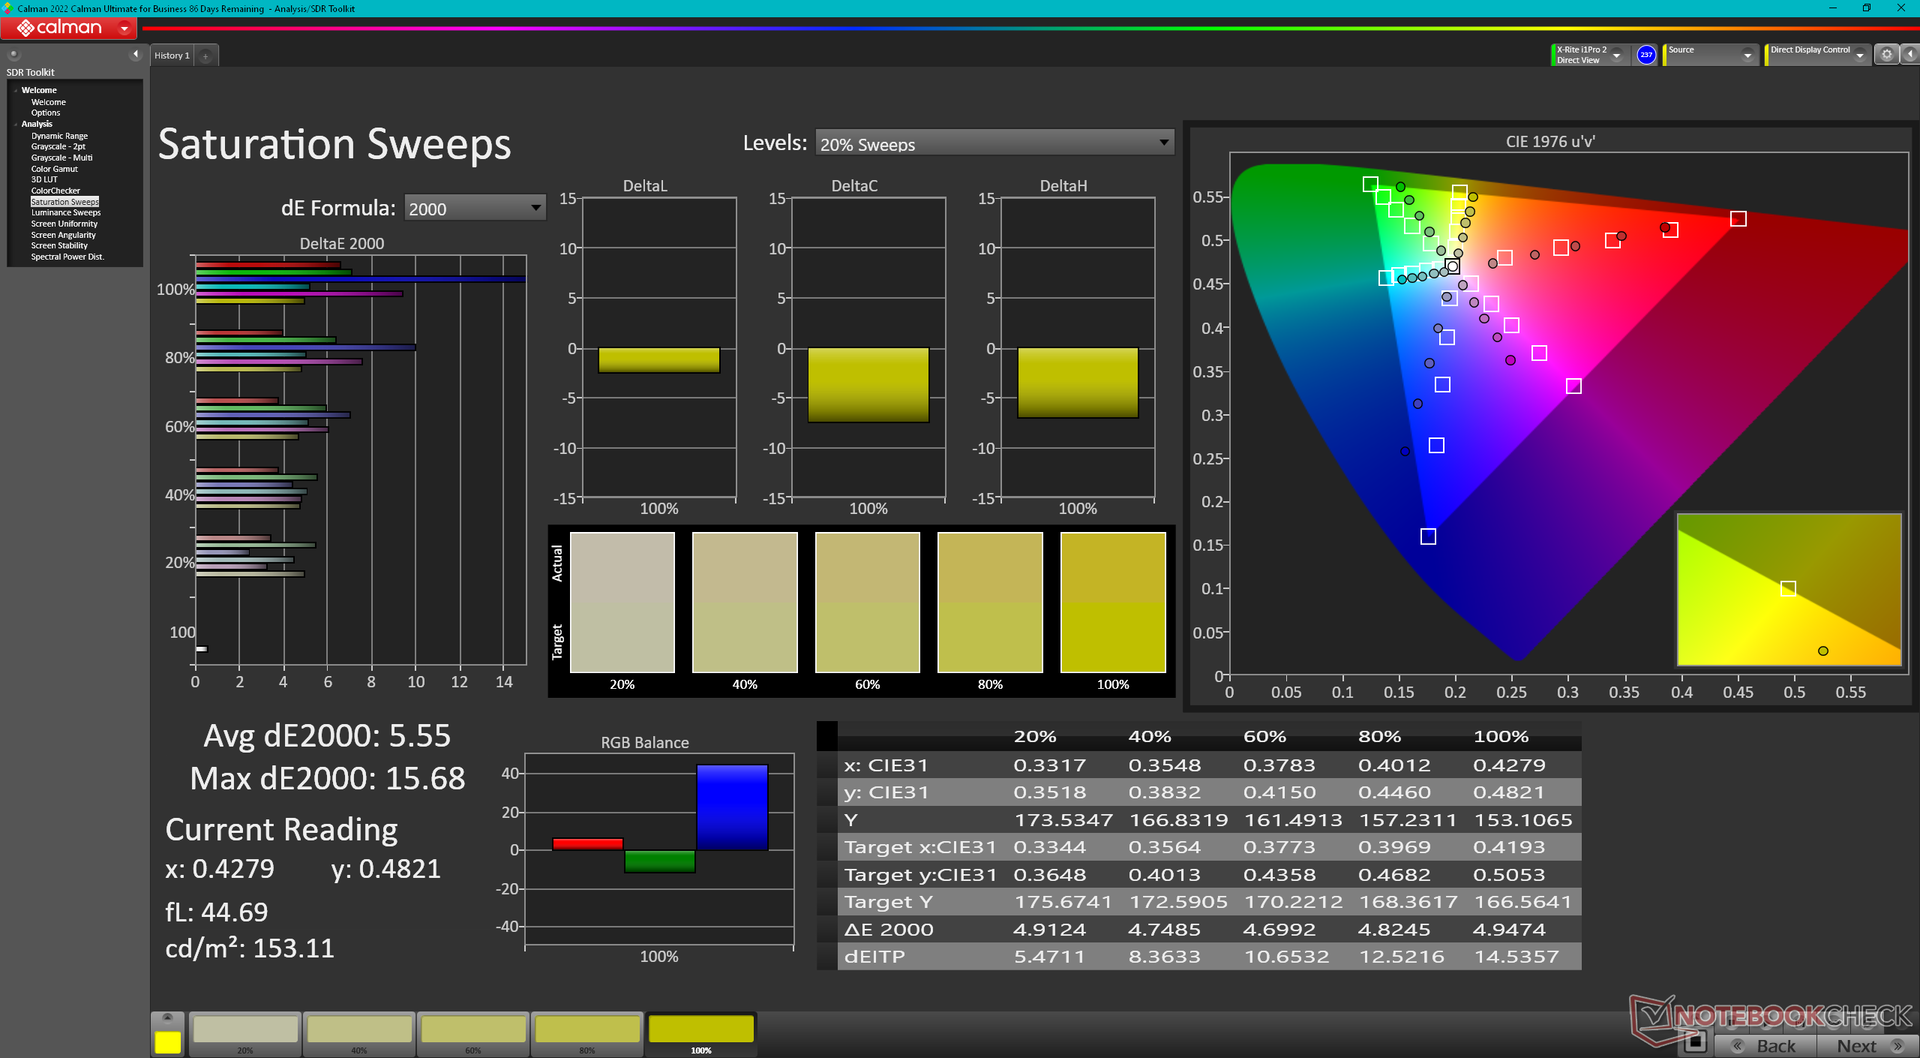
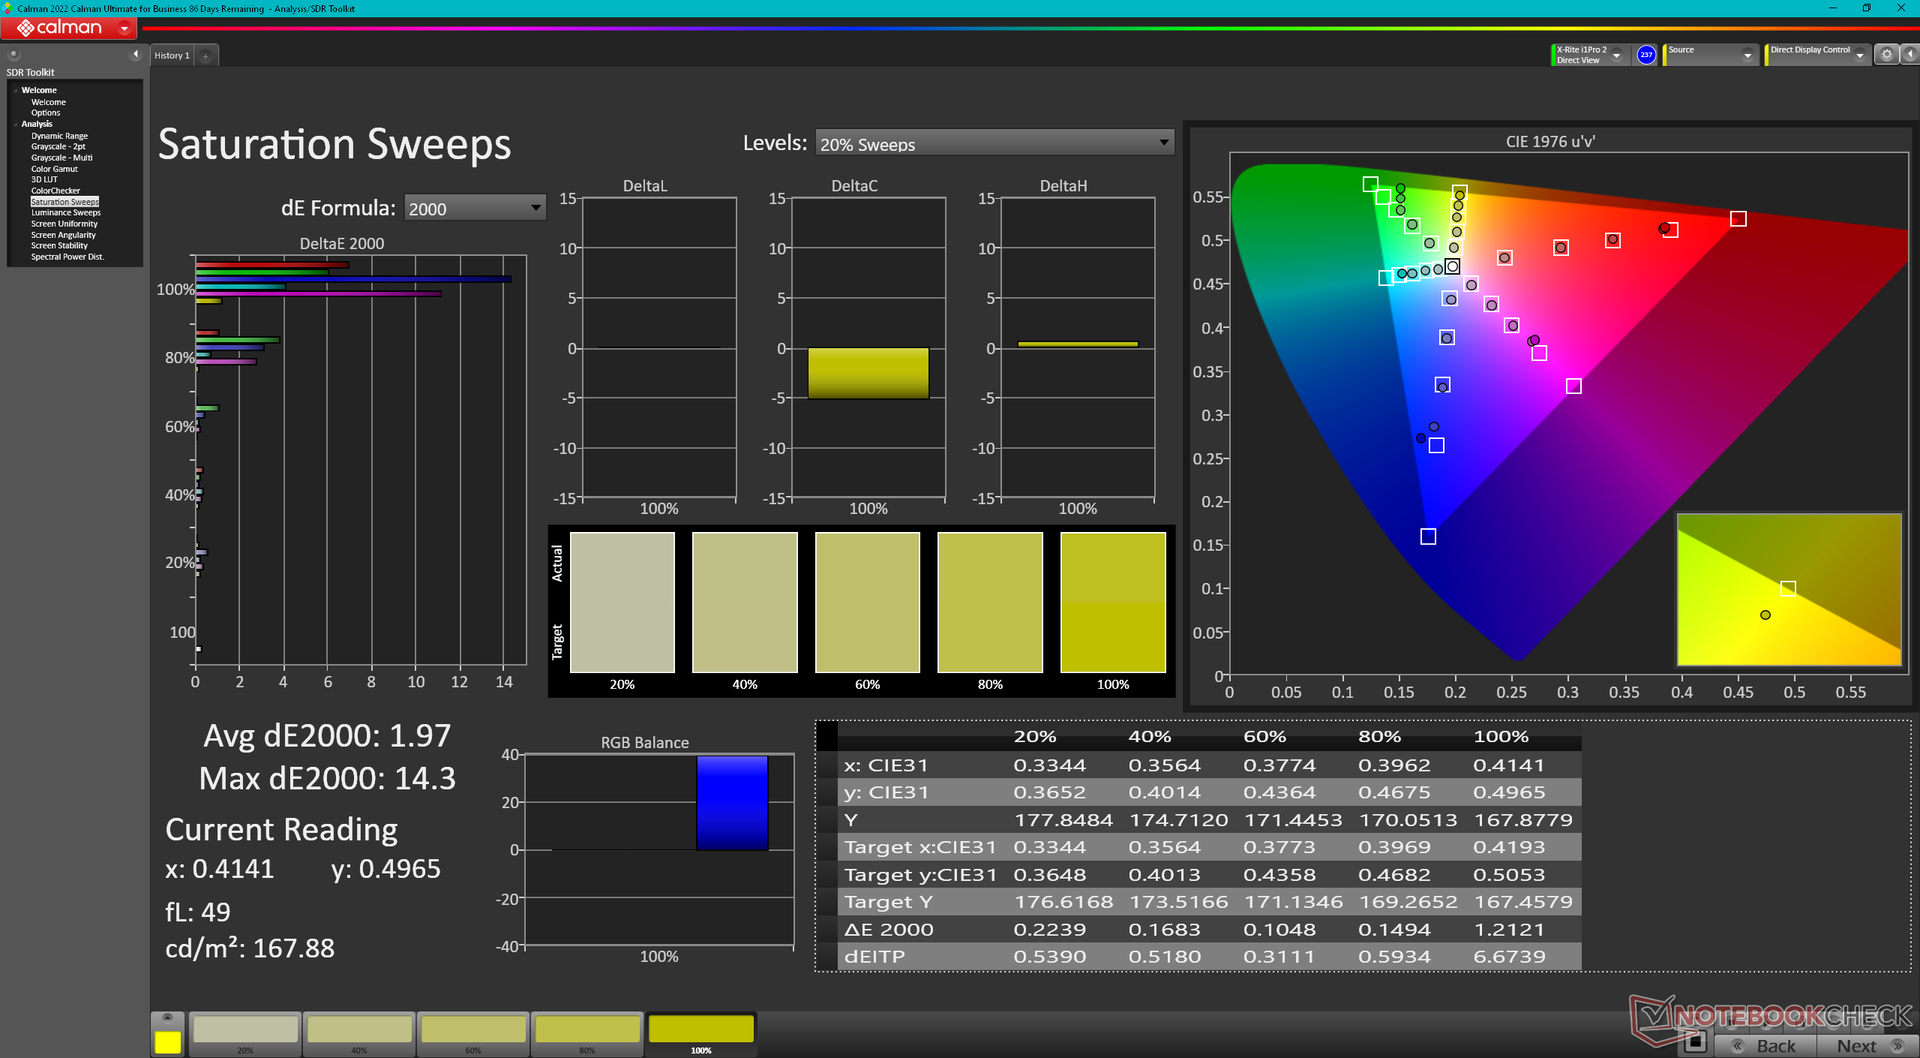
Les valeurs moyennes d'échelle de gris et de couleur deltaE ne sont pas terribles pour un ordinateur portable de jeu économique, avec respectivement 2,6 et 4,19. Nous avons pu réduire ces valeurs à 0,4 et 1,66 après un étalonnage correct avec notre colorimètre X-Rite. Cependant, n'oubliez pas que les couleurs deviennent de plus en plus imprécises à des niveaux de saturation plus élevés en raison de la gamme de couleurs étroite mentionnée ci-dessus.
Notre profil ICM calibré est disponible gratuitement ci-dessus.
Temps de réponse de l'écran
| ↔ Temps de réponse noir à blanc | ||
|---|---|---|
| 24.5 ms ... hausse ↗ et chute ↘ combinées | ↗ 12.2 ms hausse | 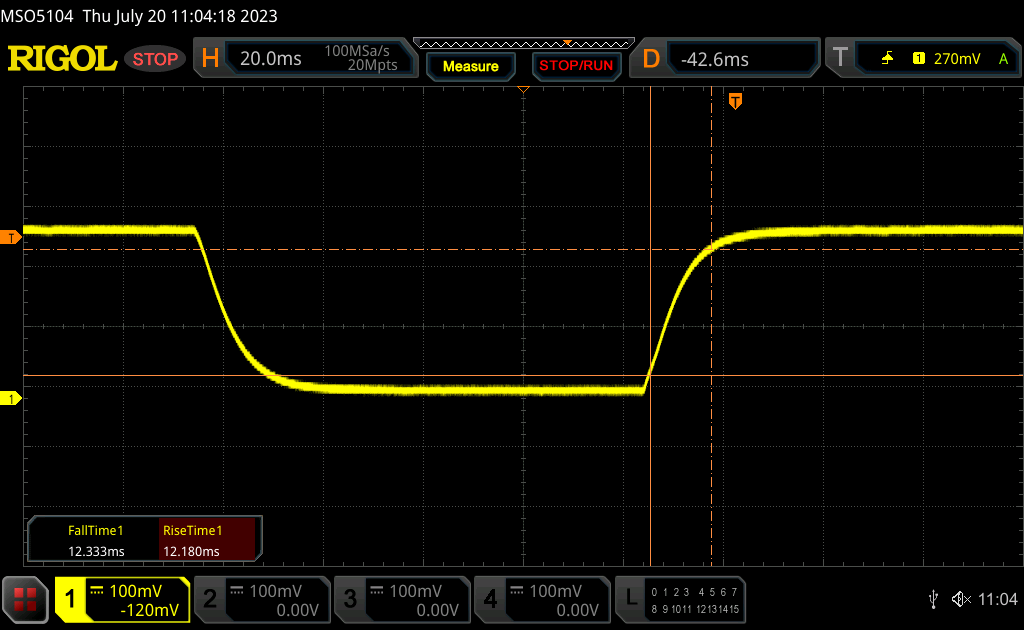 |
| ↘ 12.3 ms chute | ||
| L'écran montre de bons temps de réponse, mais insuffisant pour du jeu compétitif. En comparaison, tous les appareils testés affichent entre 0.1 (minimum) et 240 (maximum) ms. » 58 % des appareils testés affichent de meilleures performances. Cela signifie que les latences relevées sont moins bonnes que la moyenne (19.8 ms) de tous les appareils testés. | ||
| ↔ Temps de réponse gris 50% à gris 80% | ||
| 42.7 ms ... hausse ↗ et chute ↘ combinées | ↗ 19.2 ms hausse | 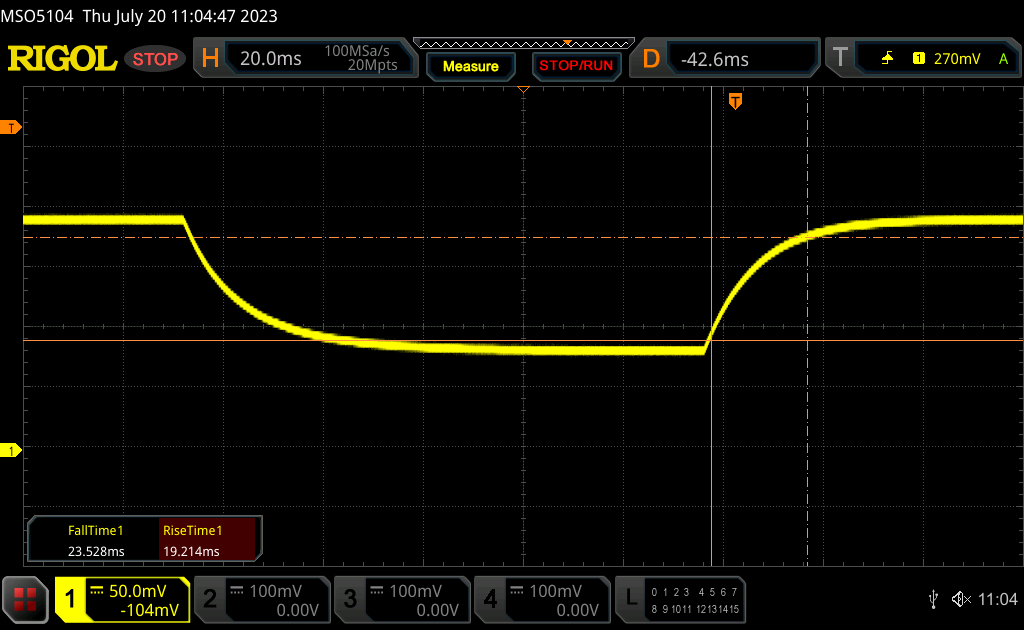 |
| ↘ 23.5 ms chute | ||
| L'écran souffre de latences très élevées, à éviter pour le jeu. En comparaison, tous les appareils testés affichent entre 0.165 (minimum) et 636 (maximum) ms. » 70 % des appareils testés affichent de meilleures performances. Cela signifie que les latences relevées sont moins bonnes que la moyenne (31 ms) de tous les appareils testés. | ||
Scintillement / MLI (Modulation de largeur d'impulsion)
| Scintillement / MLI (Modulation de largeur d'impulsion) non décelé | 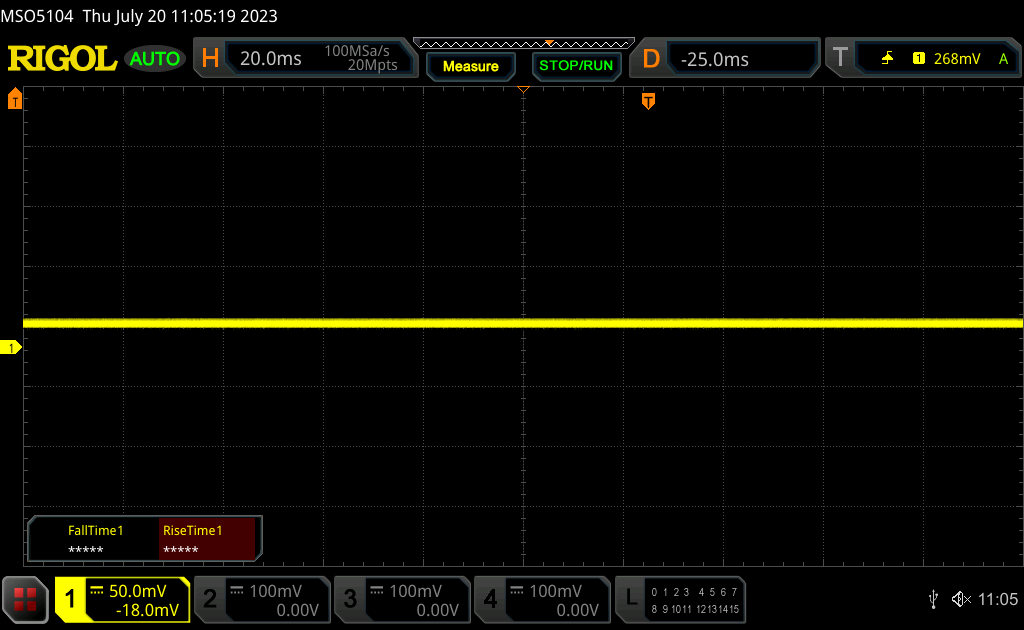 | ||
En comparaison, 52 % des appareils testés n'emploient pas MDI pour assombrir leur écran. Nous avons relevé une moyenne à 7747 (minimum : 5 - maximum : 343500) Hz dans le cas où une MDI était active. | |||
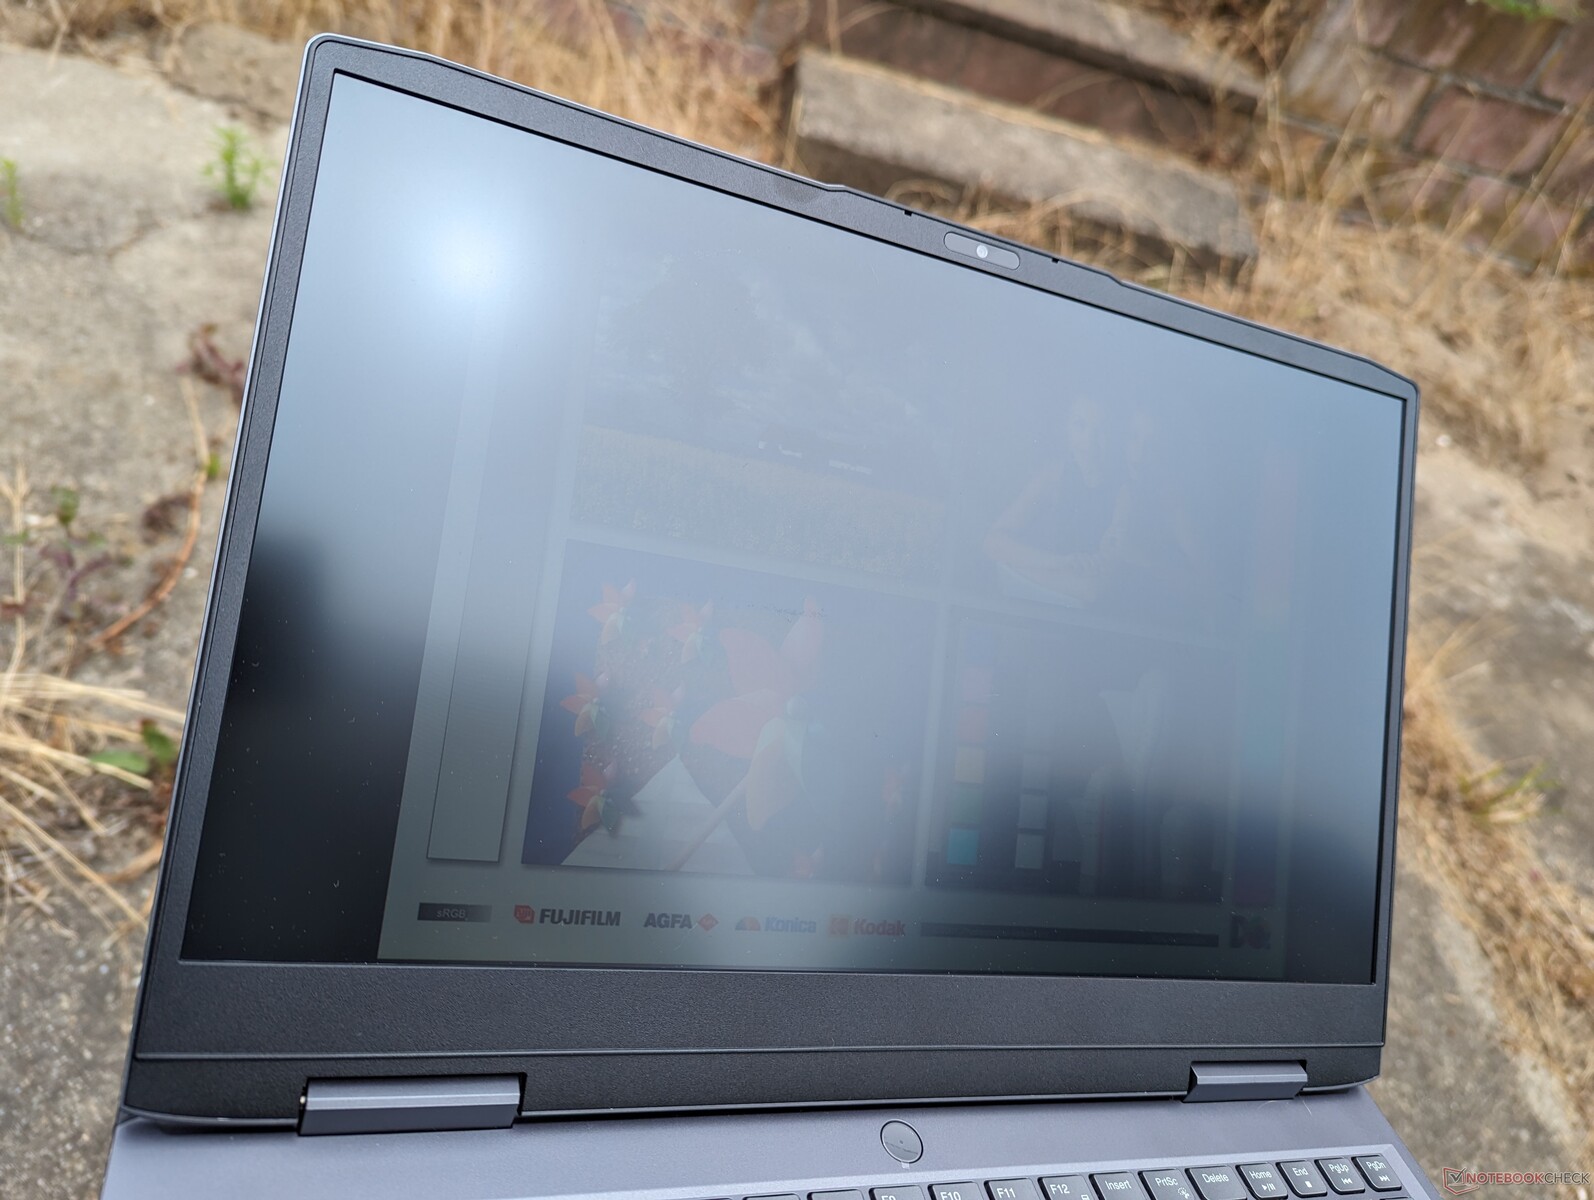
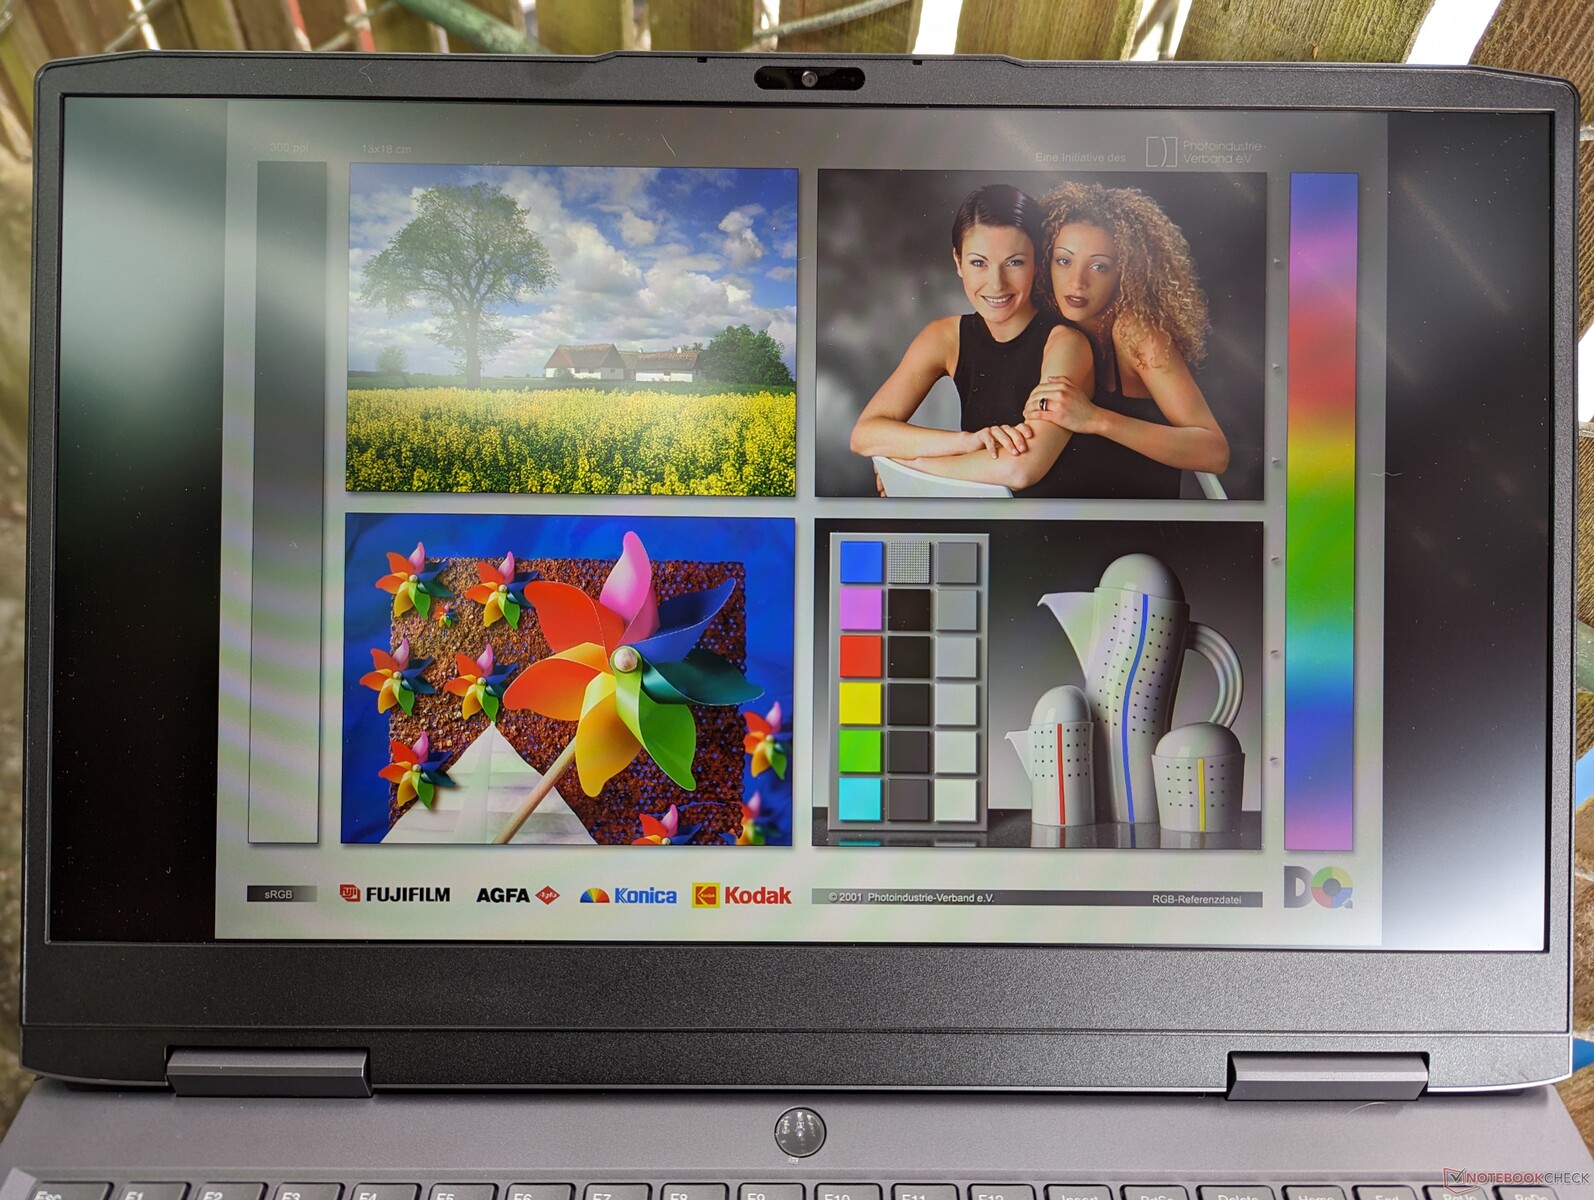
La plupart des ordinateurs portables de jeu dotés de panneaux IPS ont tendance à se situer dans la plage de luminosité de 300 nits et le LOQ 15 ne fait pas exception à la règle. La visibilité en extérieur est donc moyenne pour la catégorie, sans rien de particulier. Toute luminosité supérieure à celle d'un endroit ombragé provoquera d'immenses éblouissements et altérera les couleurs de l'écran.
Performance - milieu de gamme AMD Zen 4
Conditions d'essai
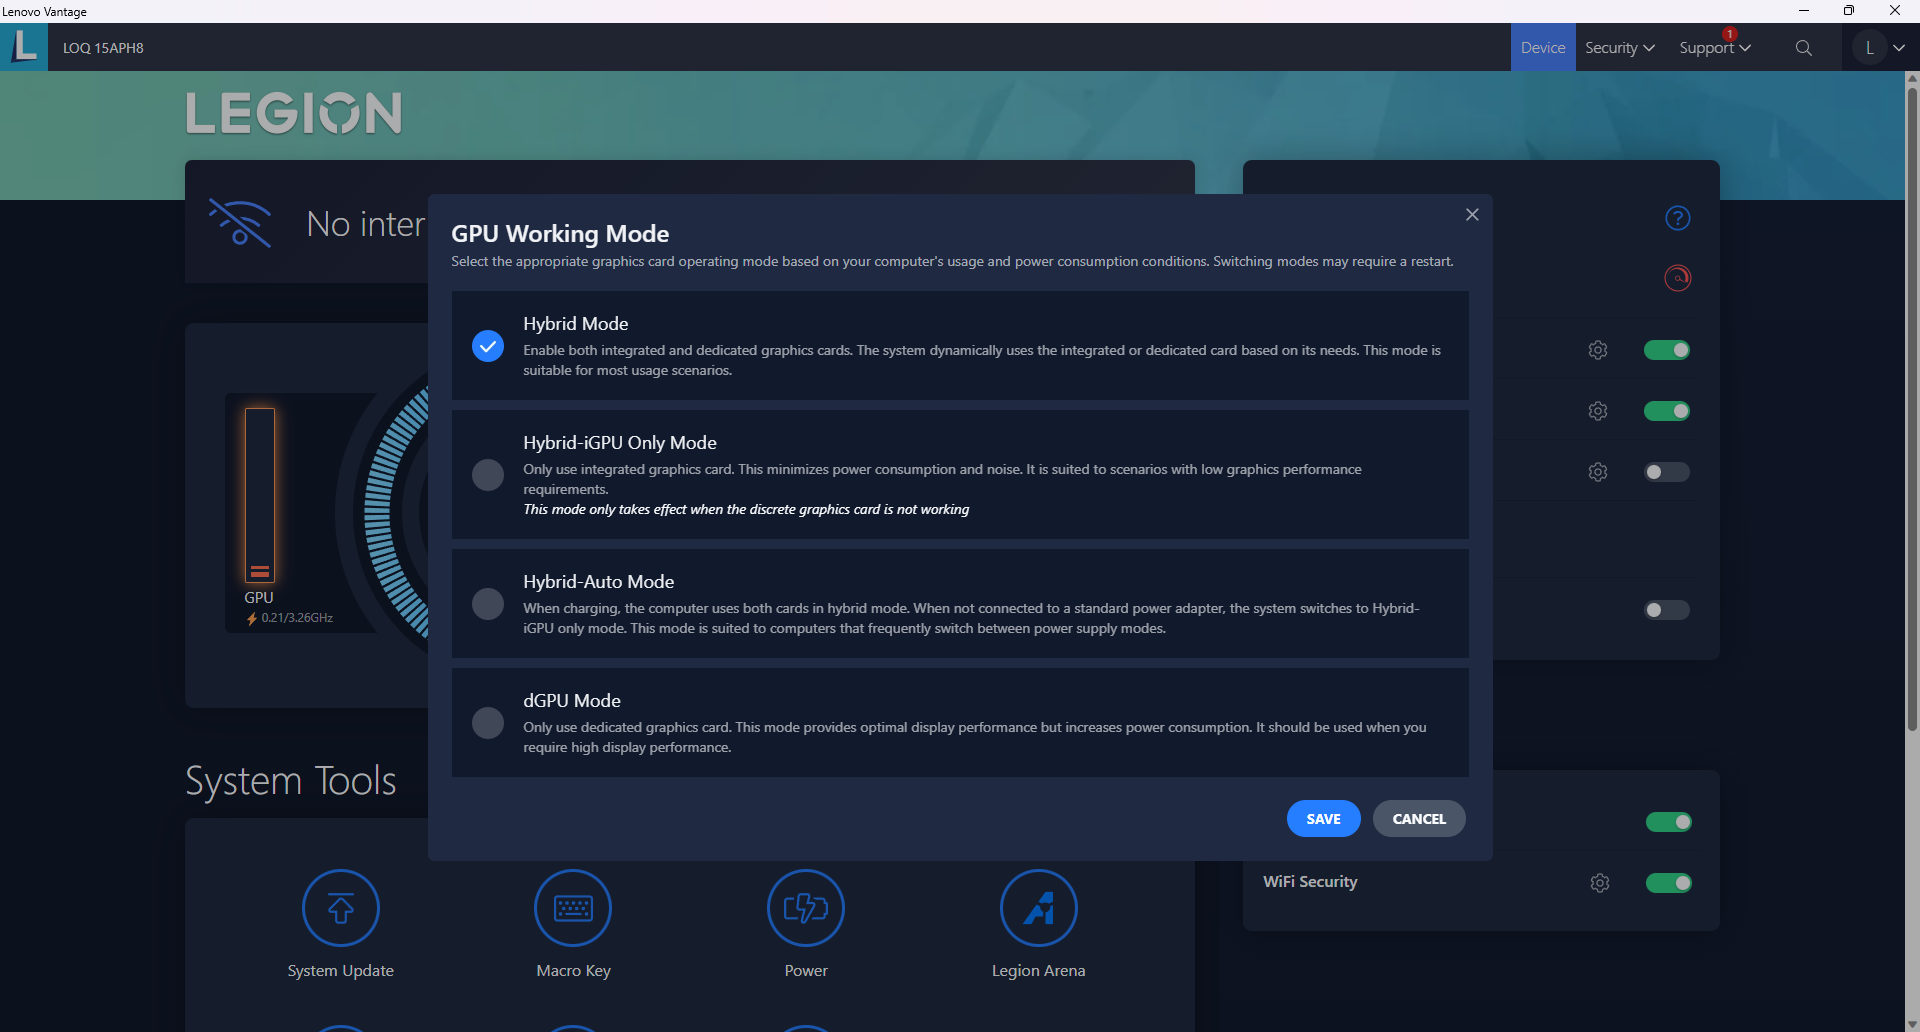
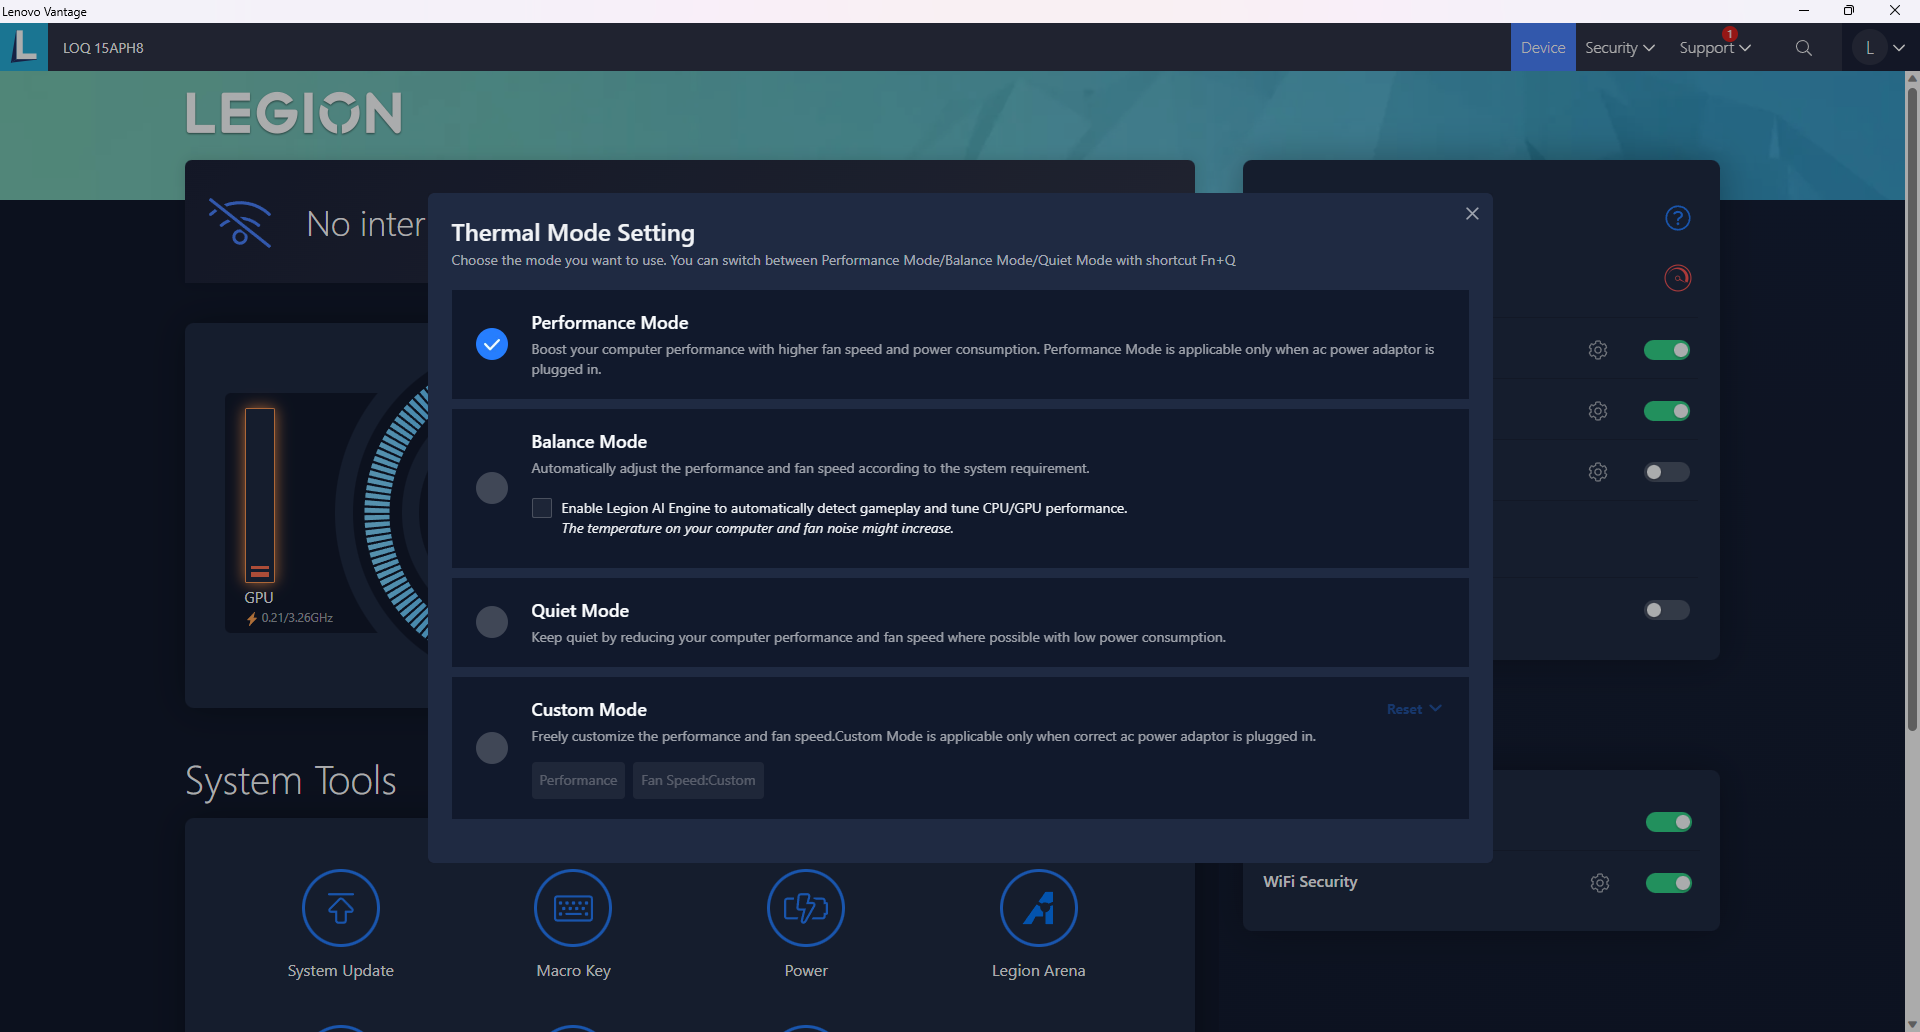
Nous avons réglé notre unité en mode Performance via Windows et Lenovo Vantage avant d'effectuer les tests ci-dessous. Nous avons également veillé à régler le système en mode dGPU, car Advanced Optimus est pris en charge. Il est recommandé aux utilisateurs de se familiariser avec le logiciel Vantage, car il s'agit du centre de mise à jour du BIOS de Lenovo, des paramètres d'alimentation, des informations sur la garantie et d'autres fonctions spécifiques au modèle.
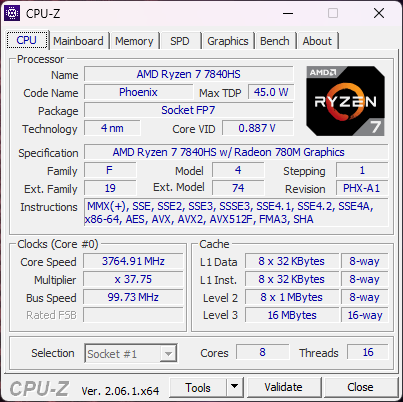
Processeur
LeRyzen 7 7840HS est un peu moins performant que le modèle haut de gamme Ryzen 7 7745HX avec un déficit de performance de seulement 5 %. Les performances globales sont donc comparables à celles du Core i7-12700H de 12e génération qui équipait la plupart des ordinateurs portables de jeu de 2022. Nous sommes soulagés que la série LOQ soit livrée avec des CPU Zen 4 au lieu d'options Zen 3 rebaptisées comme le Ryzen 7 7735HS qui est nettement plus lent et beaucoup moins impressionnant.
En passant à la version Intel du LOQ 15 avec le Core i7-13700H devrait augmenter les performances du processeur d'environ 20 %, d'après ce que nous avons pu constater avec le récent Aorus 15X.
Cinebench R15 Multi Loop
Cinebench R23: Multi Core | Single Core
Cinebench R20: CPU (Multi Core) | CPU (Single Core)
Cinebench R15: CPU Multi 64Bit | CPU Single 64Bit
Blender: v2.79 BMW27 CPU
7-Zip 18.03: 7z b 4 | 7z b 4 -mmt1
Geekbench 5.5: Multi-Core | Single-Core
HWBOT x265 Benchmark v2.2: 4k Preset
LibreOffice : 20 Documents To PDF
R Benchmark 2.5: Overall mean
* ... Moindre est la valeur, meilleures sont les performances
AIDA64: FP32 Ray-Trace | FPU Julia | CPU SHA3 | CPU Queen | FPU SinJulia | FPU Mandel | CPU AES | CPU ZLib | FP64 Ray-Trace | CPU PhotoWorxx
| Performance rating | |
| Moyenne AMD Ryzen 7 7840HS | |
| Lenovo LOQ 15APH8 | |
| Lenovo Legion 5 15IAH7H 82RB | |
| Dell G15 5530 | |
| Asus TUF A15 FA507 | |
| MSI Cyborg 15 A12VF | |
| HP Victus 15 fa0020nr | |
| AIDA64 / FP32 Ray-Trace | |
| Lenovo LOQ 15APH8 | |
| Moyenne AMD Ryzen 7 7840HS (22845 - 28921, n=21) | |
| Dell G15 5530 | |
| Lenovo Legion 5 15IAH7H 82RB | |
| Asus TUF A15 FA507 | |
| HP Victus 15 fa0020nr | |
| MSI Cyborg 15 A12VF | |
| AIDA64 / FPU Julia | |
| Lenovo LOQ 15APH8 | |
| Moyenne AMD Ryzen 7 7840HS (97164 - 123167, n=21) | |
| Asus TUF A15 FA507 | |
| Dell G15 5530 | |
| Lenovo Legion 5 15IAH7H 82RB | |
| MSI Cyborg 15 A12VF | |
| HP Victus 15 fa0020nr | |
| AIDA64 / CPU SHA3 | |
| Lenovo LOQ 15APH8 | |
| Moyenne AMD Ryzen 7 7840HS (4293 - 5155, n=21) | |
| Dell G15 5530 | |
| Lenovo Legion 5 15IAH7H 82RB | |
| Asus TUF A15 FA507 | |
| MSI Cyborg 15 A12VF | |
| HP Victus 15 fa0020nr | |
| AIDA64 / CPU Queen | |
| Lenovo LOQ 15APH8 | |
| Moyenne AMD Ryzen 7 7840HS (102271 - 125820, n=21) | |
| Dell G15 5530 | |
| Asus TUF A15 FA507 | |
| Lenovo Legion 5 15IAH7H 82RB | |
| HP Victus 15 fa0020nr | |
| MSI Cyborg 15 A12VF | |
| AIDA64 / FPU SinJulia | |
| Lenovo LOQ 15APH8 | |
| Moyenne AMD Ryzen 7 7840HS (13767 - 15525, n=21) | |
| Asus TUF A15 FA507 | |
| Dell G15 5530 | |
| Lenovo Legion 5 15IAH7H 82RB | |
| MSI Cyborg 15 A12VF | |
| HP Victus 15 fa0020nr | |
| AIDA64 / FPU Mandel | |
| Lenovo LOQ 15APH8 | |
| Moyenne AMD Ryzen 7 7840HS (52084 - 65812, n=21) | |
| Asus TUF A15 FA507 | |
| Dell G15 5530 | |
| Lenovo Legion 5 15IAH7H 82RB | |
| HP Victus 15 fa0020nr | |
| MSI Cyborg 15 A12VF | |
| AIDA64 / CPU AES | |
| Lenovo Legion 5 15IAH7H 82RB | |
| Moyenne AMD Ryzen 7 7840HS (67389 - 177158, n=21) | |
| Dell G15 5530 | |
| Lenovo LOQ 15APH8 | |
| Asus TUF A15 FA507 | |
| MSI Cyborg 15 A12VF | |
| HP Victus 15 fa0020nr | |
| AIDA64 / CPU ZLib | |
| Dell G15 5530 | |
| Lenovo Legion 5 15IAH7H 82RB | |
| Lenovo LOQ 15APH8 | |
| Moyenne AMD Ryzen 7 7840HS (944 - 1123, n=21) | |
| MSI Cyborg 15 A12VF | |
| HP Victus 15 fa0020nr | |
| Asus TUF A15 FA507 | |
| AIDA64 / FP64 Ray-Trace | |
| Lenovo LOQ 15APH8 | |
| Moyenne AMD Ryzen 7 7840HS (12248 - 15599, n=21) | |
| Dell G15 5530 | |
| Lenovo Legion 5 15IAH7H 82RB | |
| Asus TUF A15 FA507 | |
| HP Victus 15 fa0020nr | |
| MSI Cyborg 15 A12VF | |
| AIDA64 / CPU PhotoWorxx | |
| Moyenne AMD Ryzen 7 7840HS (17615 - 41516, n=21) | |
| Dell G15 5530 | |
| MSI Cyborg 15 A12VF | |
| Lenovo Legion 5 15IAH7H 82RB | |
| Asus TUF A15 FA507 | |
| HP Victus 15 fa0020nr | |
| Lenovo LOQ 15APH8 | |
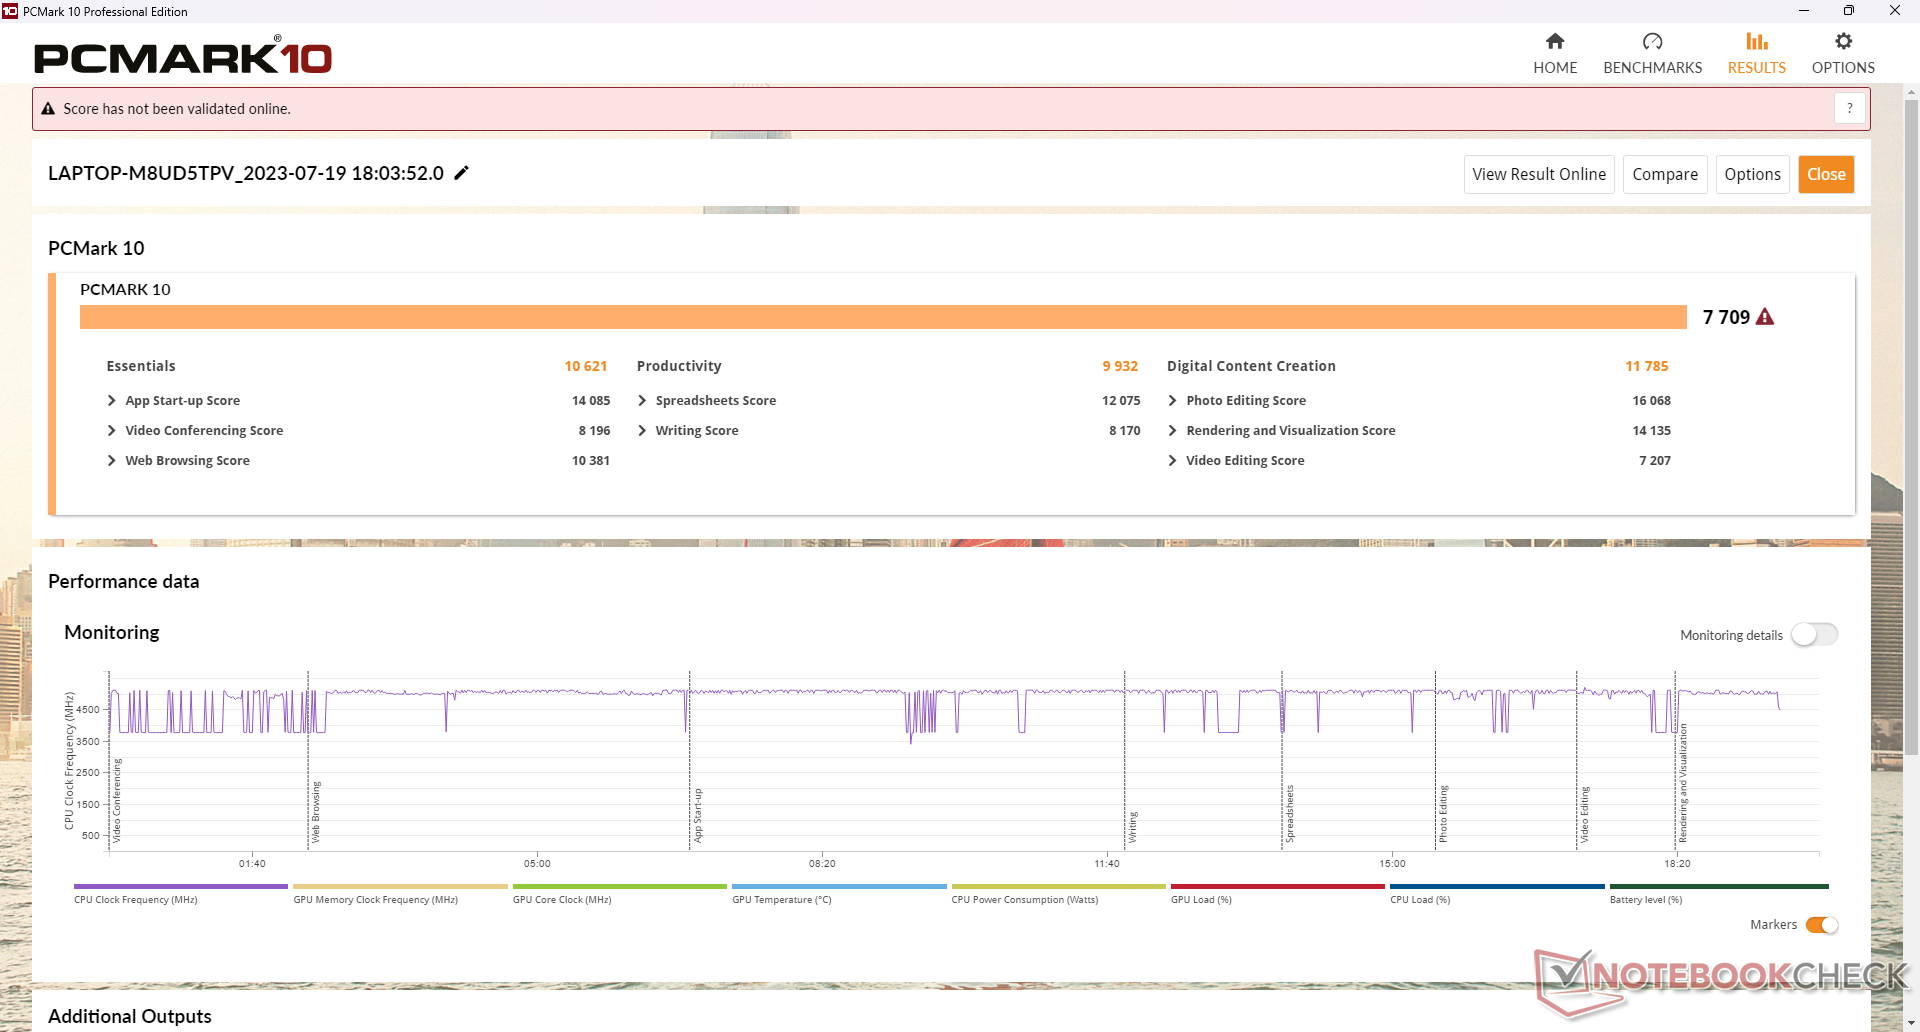
Performance du système
Les résultats de PCMark 10 sont comparables à ceux de modèles concurrents comme le Dell G15 5530 et même un peu moins que l'ancien 2022 Lenovo Legion 5 15. Cependant, les tests de mémoire AIDA64 sont deux fois moins rapides sur notre LOQ 15 en raison de ses 8 Go de mémoire vive à canal unique. Nous recommandons d'ajouter un deuxième module de RAM pour un total de 16 Go lorsque c'est possible.
CrossMark: Overall | Productivity | Creativity | Responsiveness
| PCMark 10 / Score | |
| Lenovo Legion 5 15IAH7H 82RB | |
| Lenovo LOQ 15APH8 | |
| Moyenne AMD Ryzen 7 7840HS, NVIDIA GeForce RTX 4050 Laptop GPU (7683 - 7709, n=2) | |
| Asus TUF A15 FA507 | |
| MSI Cyborg 15 A12VF | |
| Dell G15 5530 | |
| HP Victus 15 fa0020nr | |
| PCMark 10 / Essentials | |
| Lenovo Legion 5 15IAH7H 82RB | |
| Dell G15 5530 | |
| Moyenne AMD Ryzen 7 7840HS, NVIDIA GeForce RTX 4050 Laptop GPU (10621 - 10755, n=2) | |
| MSI Cyborg 15 A12VF | |
| Lenovo LOQ 15APH8 | |
| Asus TUF A15 FA507 | |
| HP Victus 15 fa0020nr | |
| PCMark 10 / Productivity | |
| Lenovo Legion 5 15IAH7H 82RB | |
| Dell G15 5530 | |
| Moyenne AMD Ryzen 7 7840HS, NVIDIA GeForce RTX 4050 Laptop GPU (9932 - 9980, n=2) | |
| Lenovo LOQ 15APH8 | |
| MSI Cyborg 15 A12VF | |
| Asus TUF A15 FA507 | |
| HP Victus 15 fa0020nr | |
| PCMark 10 / Digital Content Creation | |
| Lenovo Legion 5 15IAH7H 82RB | |
| Lenovo LOQ 15APH8 | |
| Moyenne AMD Ryzen 7 7840HS, NVIDIA GeForce RTX 4050 Laptop GPU (11467 - 11785, n=2) | |
| Asus TUF A15 FA507 | |
| HP Victus 15 fa0020nr | |
| MSI Cyborg 15 A12VF | |
| Dell G15 5530 | |
| CrossMark / Overall | |
| Lenovo Legion 5 15IAH7H 82RB | |
| Dell G15 5530 | |
| MSI Cyborg 15 A12VF | |
| Moyenne AMD Ryzen 7 7840HS, NVIDIA GeForce RTX 4050 Laptop GPU (1586 - 1749, n=2) | |
| HP Victus 15 fa0020nr | |
| Lenovo LOQ 15APH8 | |
| Asus TUF A15 FA507 | |
| CrossMark / Productivity | |
| Lenovo Legion 5 15IAH7H 82RB | |
| Dell G15 5530 | |
| MSI Cyborg 15 A12VF | |
| Moyenne AMD Ryzen 7 7840HS, NVIDIA GeForce RTX 4050 Laptop GPU (1625 - 1677, n=2) | |
| Lenovo LOQ 15APH8 | |
| HP Victus 15 fa0020nr | |
| Asus TUF A15 FA507 | |
| CrossMark / Creativity | |
| Dell G15 5530 | |
| Lenovo Legion 5 15IAH7H 82RB | |
| MSI Cyborg 15 A12VF | |
| HP Victus 15 fa0020nr | |
| Moyenne AMD Ryzen 7 7840HS, NVIDIA GeForce RTX 4050 Laptop GPU (1628 - 1930, n=2) | |
| Asus TUF A15 FA507 | |
| Lenovo LOQ 15APH8 | |
| CrossMark / Responsiveness | |
| Lenovo Legion 5 15IAH7H 82RB | |
| MSI Cyborg 15 A12VF | |
| Dell G15 5530 | |
| Moyenne AMD Ryzen 7 7840HS, NVIDIA GeForce RTX 4050 Laptop GPU (1364 - 1480, n=2) | |
| HP Victus 15 fa0020nr | |
| Lenovo LOQ 15APH8 | |
| Asus TUF A15 FA507 | |
| PCMark 10 Score | 7709 points | |
Aide | ||
| AIDA64 / Memory Copy | |
| Moyenne AMD Ryzen 7 7840HS (30937 - 72158, n=21) | |
| Dell G15 5530 | |
| MSI Cyborg 15 A12VF | |
| Lenovo Legion 5 15IAH7H 82RB | |
| Asus TUF A15 FA507 | |
| HP Victus 15 fa0020nr | |
| Lenovo LOQ 15APH8 | |
| AIDA64 / Memory Read | |
| Dell G15 5530 | |
| MSI Cyborg 15 A12VF | |
| Lenovo Legion 5 15IAH7H 82RB | |
| Moyenne AMD Ryzen 7 7840HS (30497 - 62147, n=21) | |
| Asus TUF A15 FA507 | |
| HP Victus 15 fa0020nr | |
| Lenovo LOQ 15APH8 | |
| AIDA64 / Memory Write | |
| Moyenne AMD Ryzen 7 7840HS (34590 - 93323, n=21) | |
| Dell G15 5530 | |
| Lenovo Legion 5 15IAH7H 82RB | |
| MSI Cyborg 15 A12VF | |
| Asus TUF A15 FA507 | |
| HP Victus 15 fa0020nr | |
| Lenovo LOQ 15APH8 | |
| AIDA64 / Memory Latency | |
| Lenovo Legion 5 15IAH7H 82RB | |
| Lenovo LOQ 15APH8 | |
| Moyenne AMD Ryzen 7 7840HS (85.1 - 112, n=21) | |
| MSI Cyborg 15 A12VF | |
| Dell G15 5530 | |
| Asus TUF A15 FA507 | |
| HP Victus 15 fa0020nr | |
* ... Moindre est la valeur, meilleures sont les performances
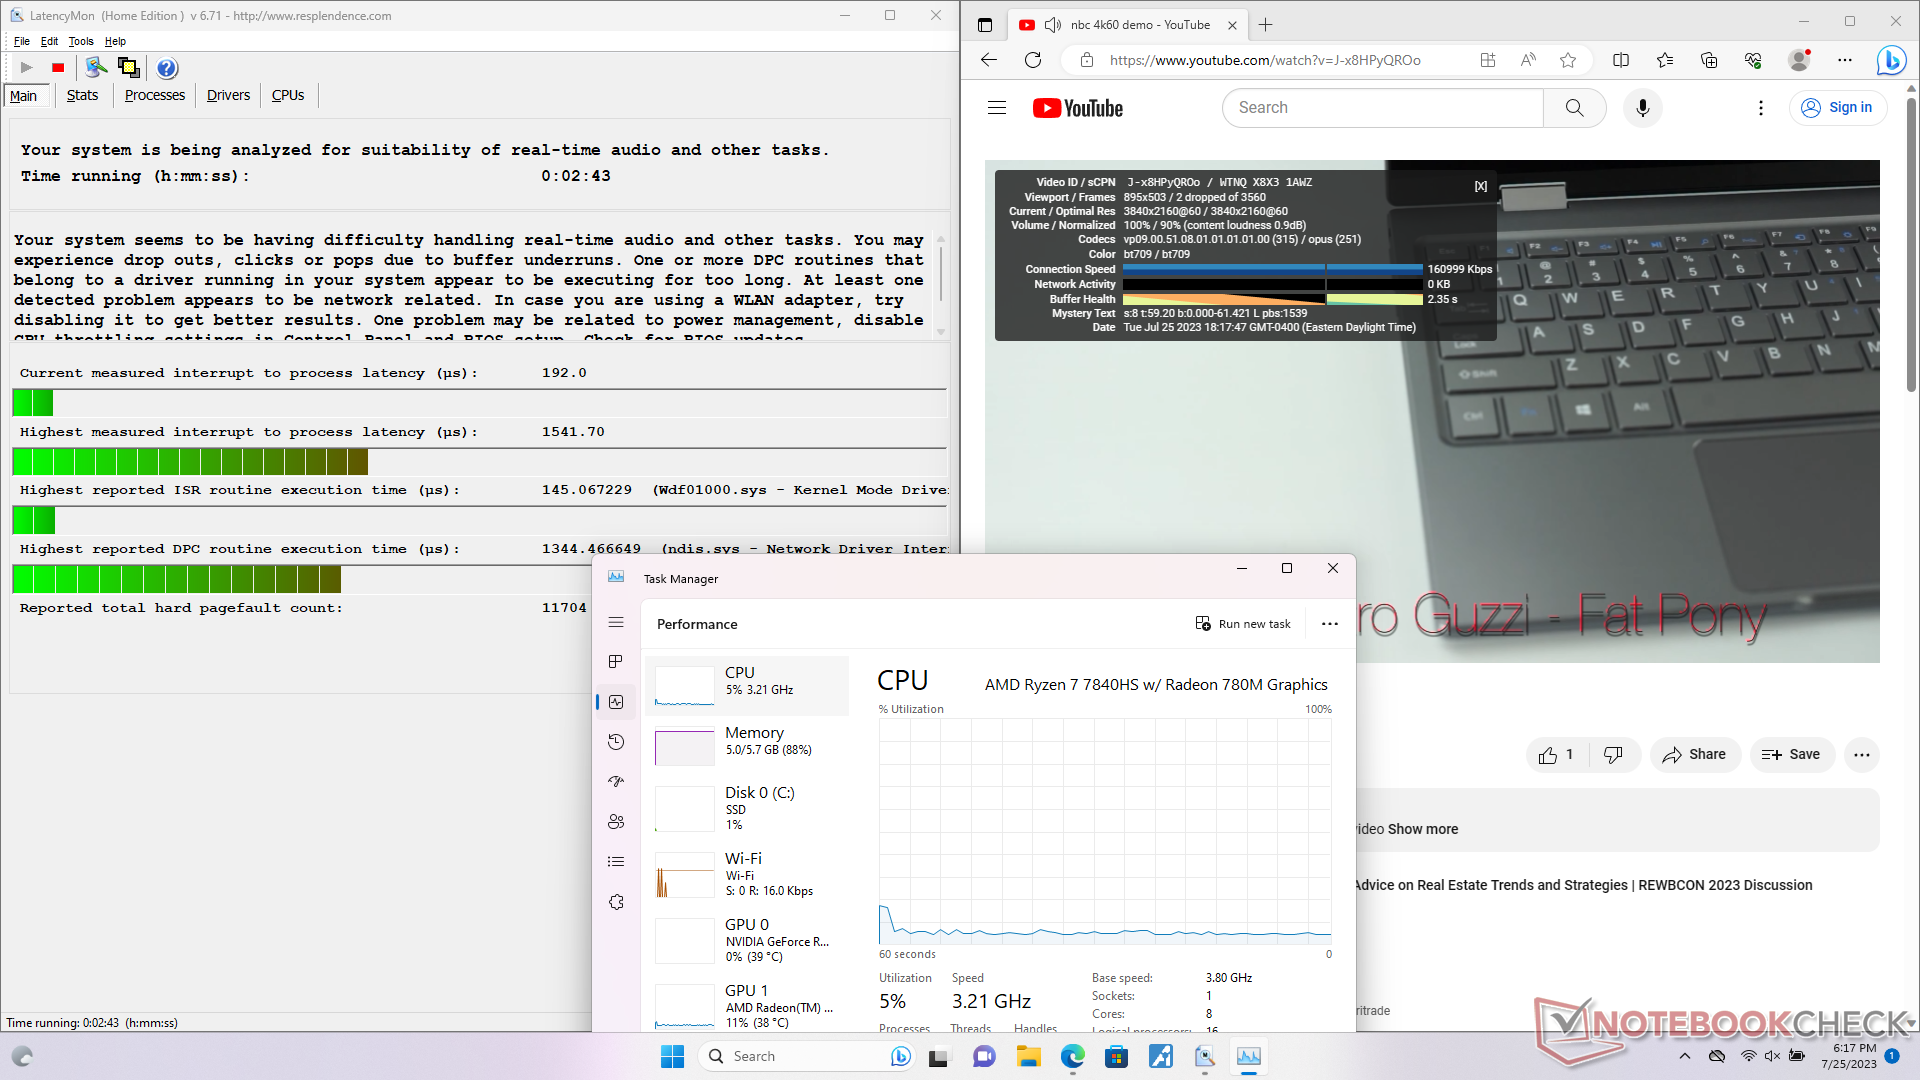
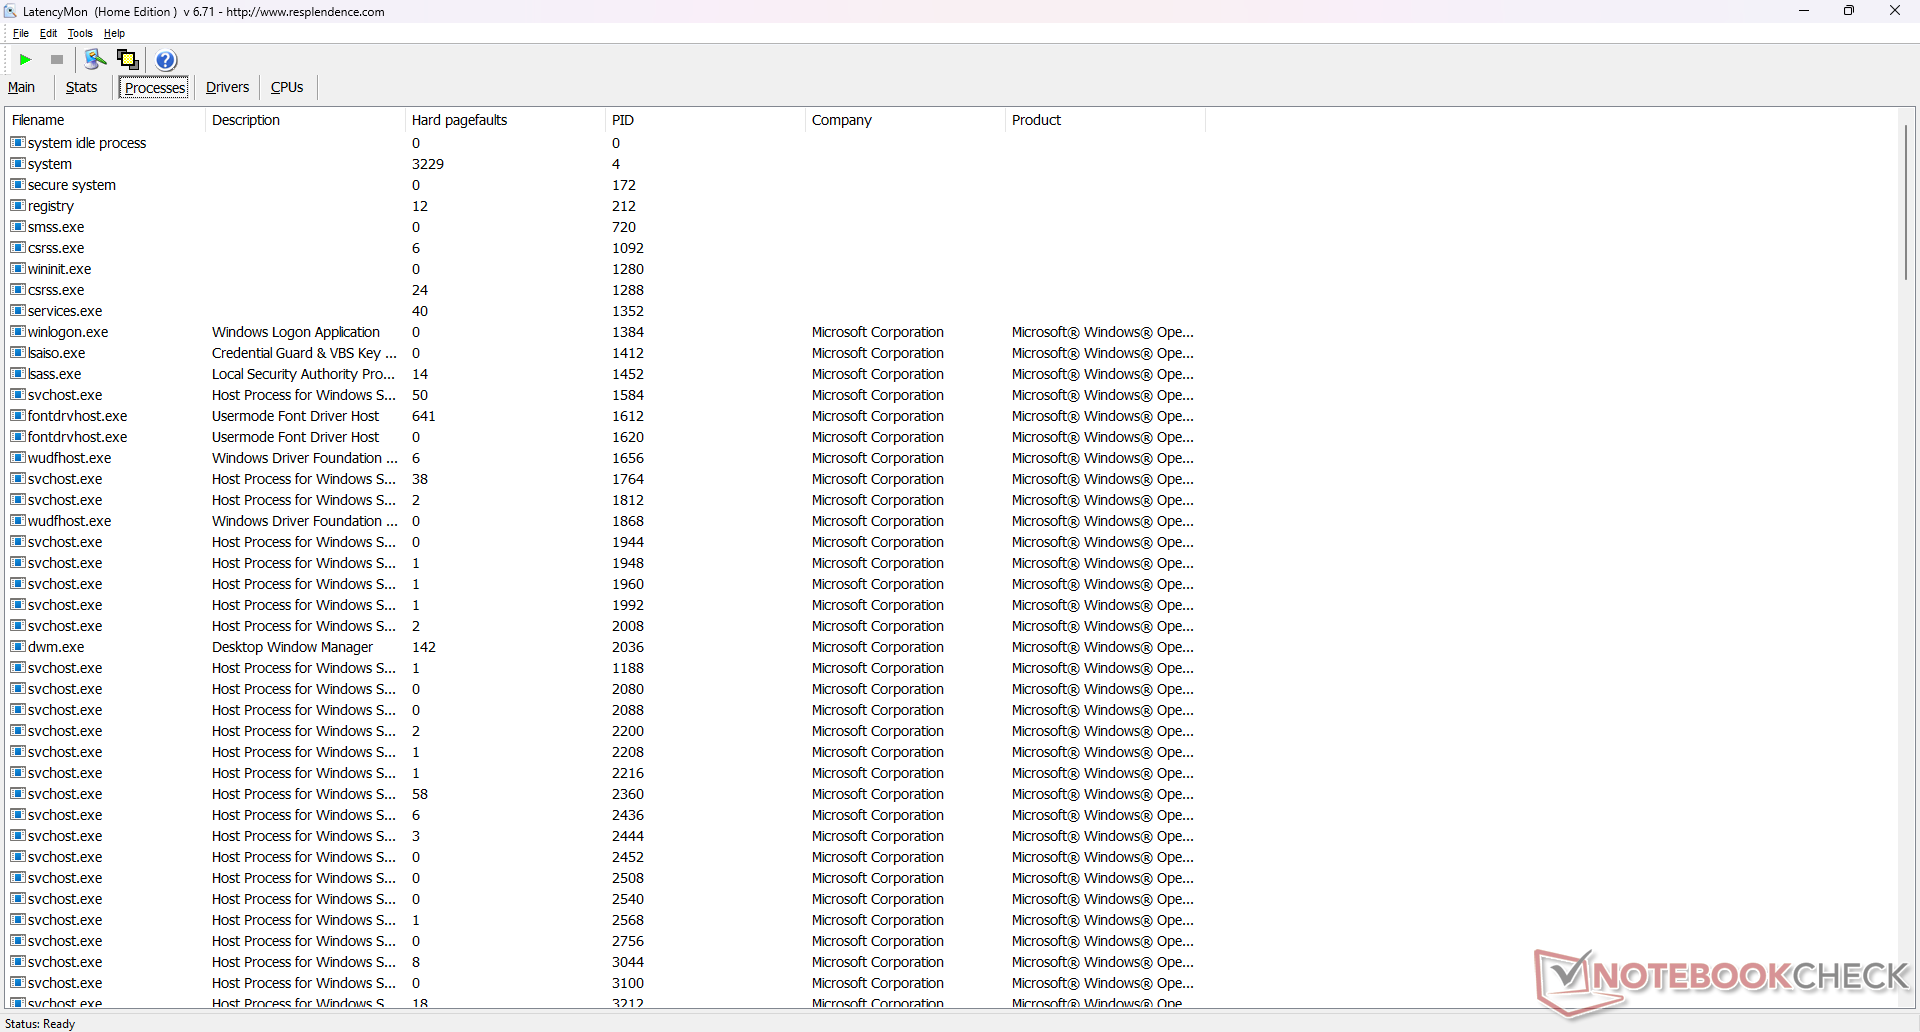
Latence DPC
LatencyMon révèle des problèmes mineurs de DPC lors de l'ouverture de plusieurs onglets de notre page d'accueil. la lecture de vidéos 4K à 60 FPS est presque parfaite, avec seulement 2 images perdues sur une période d'une minute.
| DPC Latencies / LatencyMon - interrupt to process latency (max), Web, Youtube, Prime95 | |
| Dell G15 5530 | |
| HP Victus 15 fa0020nr | |
| Lenovo LOQ 15APH8 | |
| MSI Cyborg 15 A12VF | |
| Lenovo Legion 5 15IAH7H 82RB | |
* ... Moindre est la valeur, meilleures sont les performances
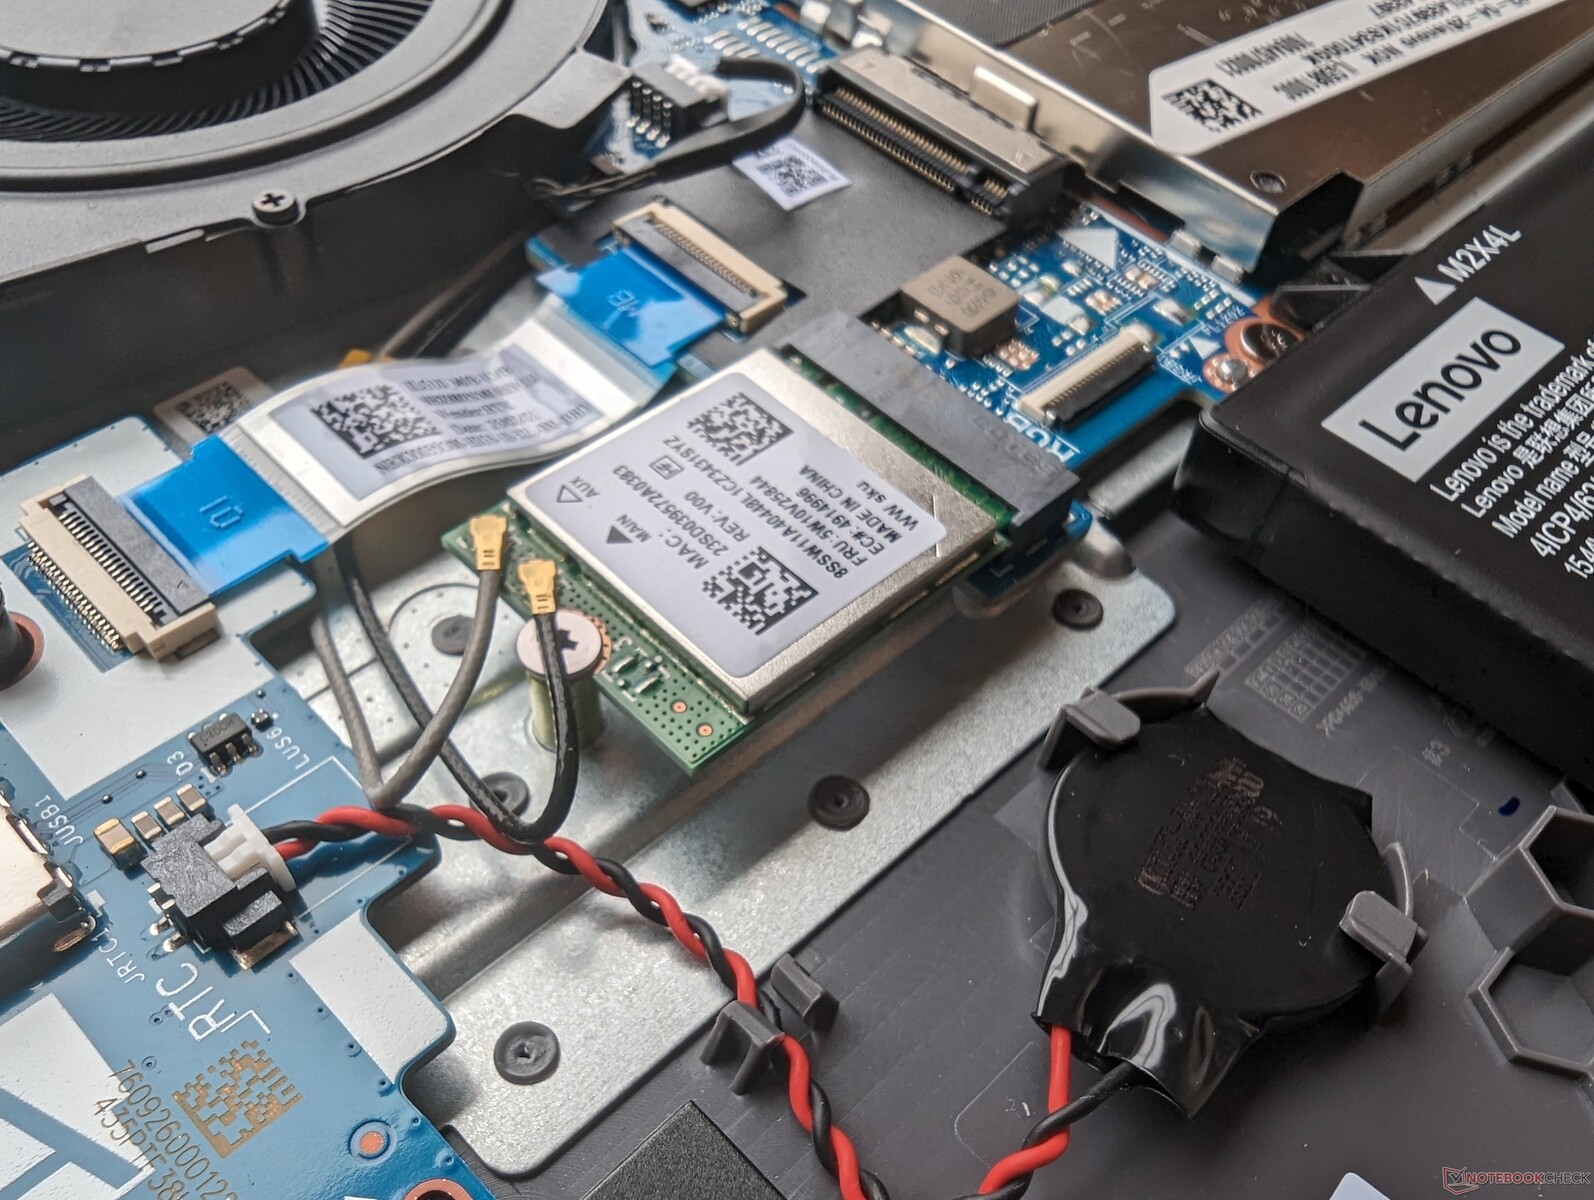
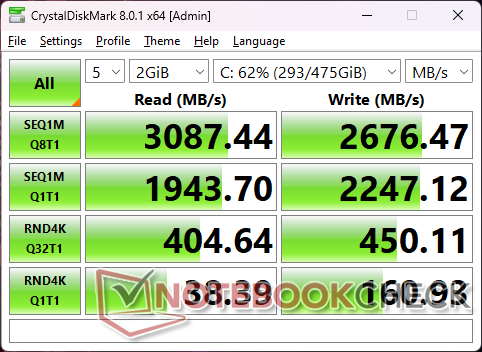
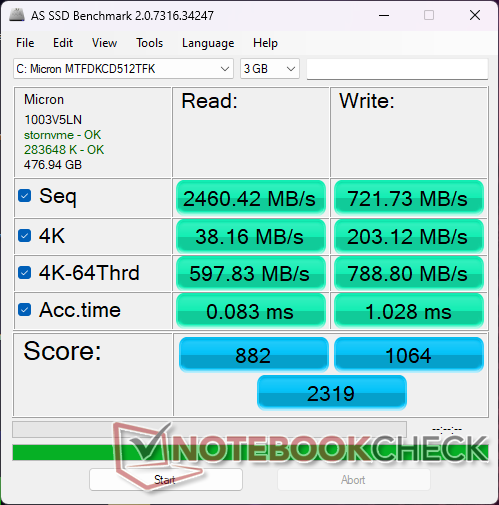
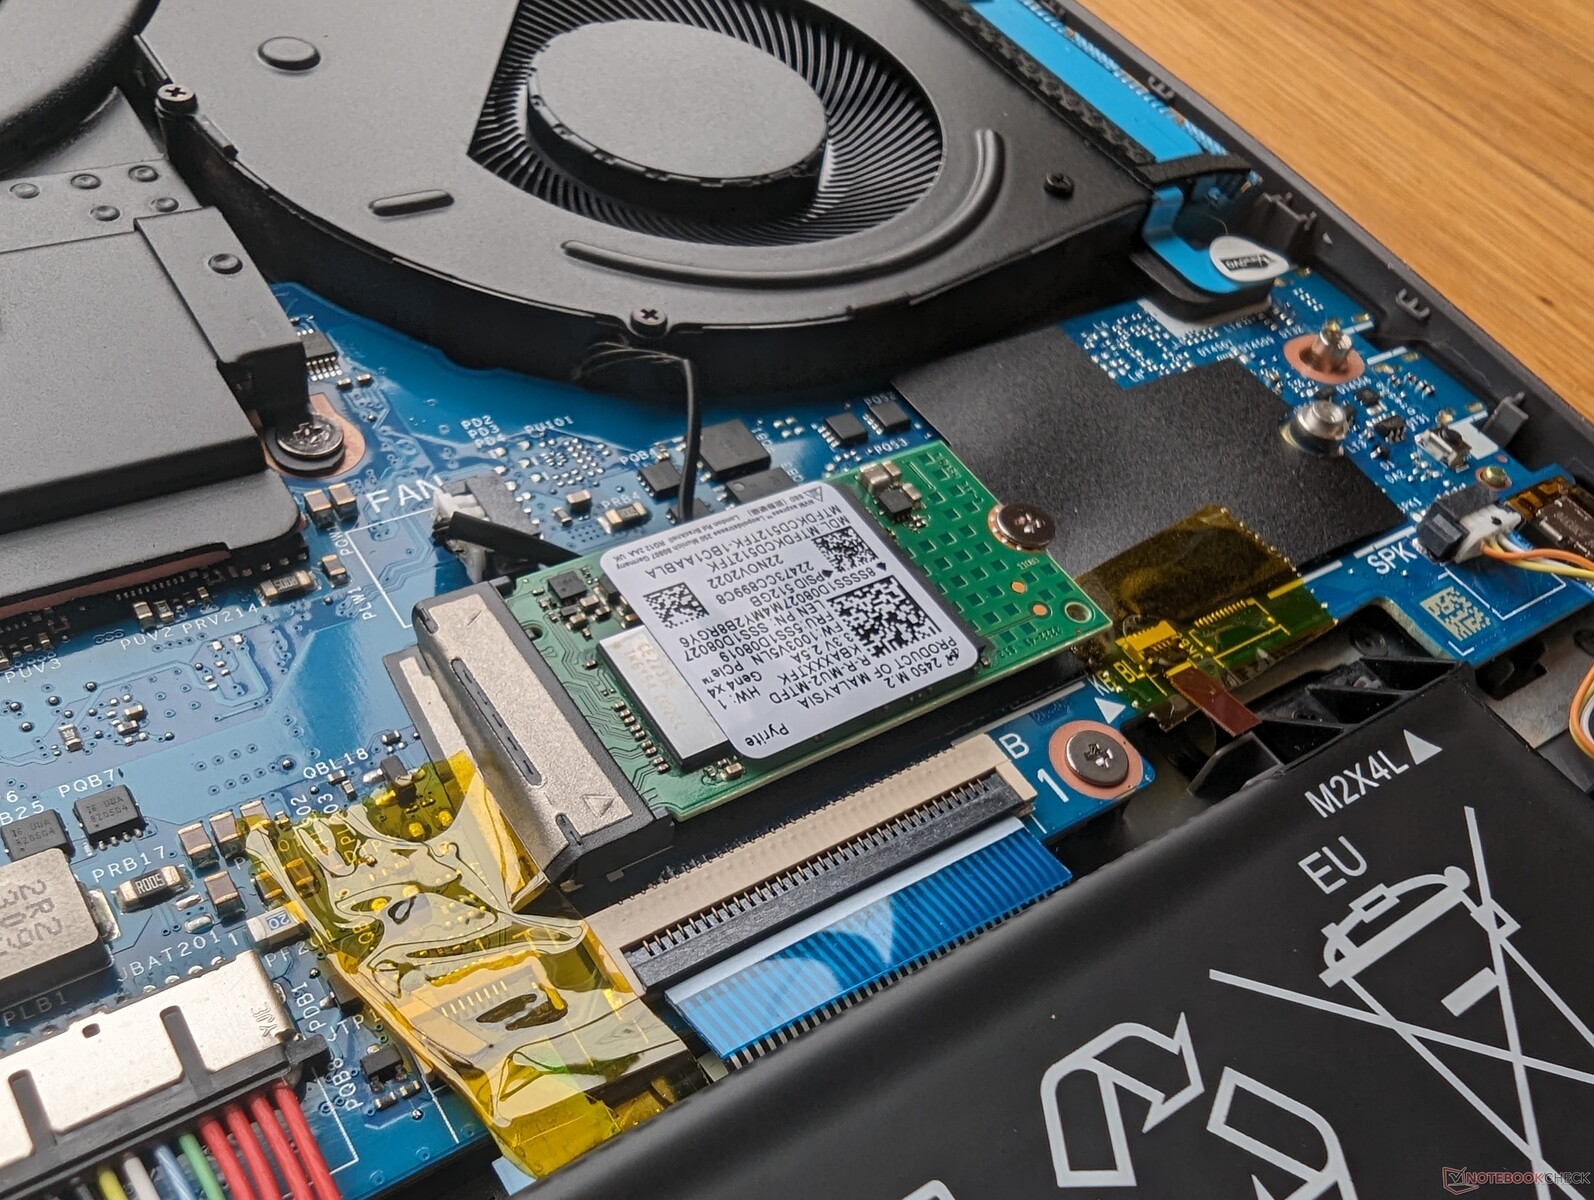
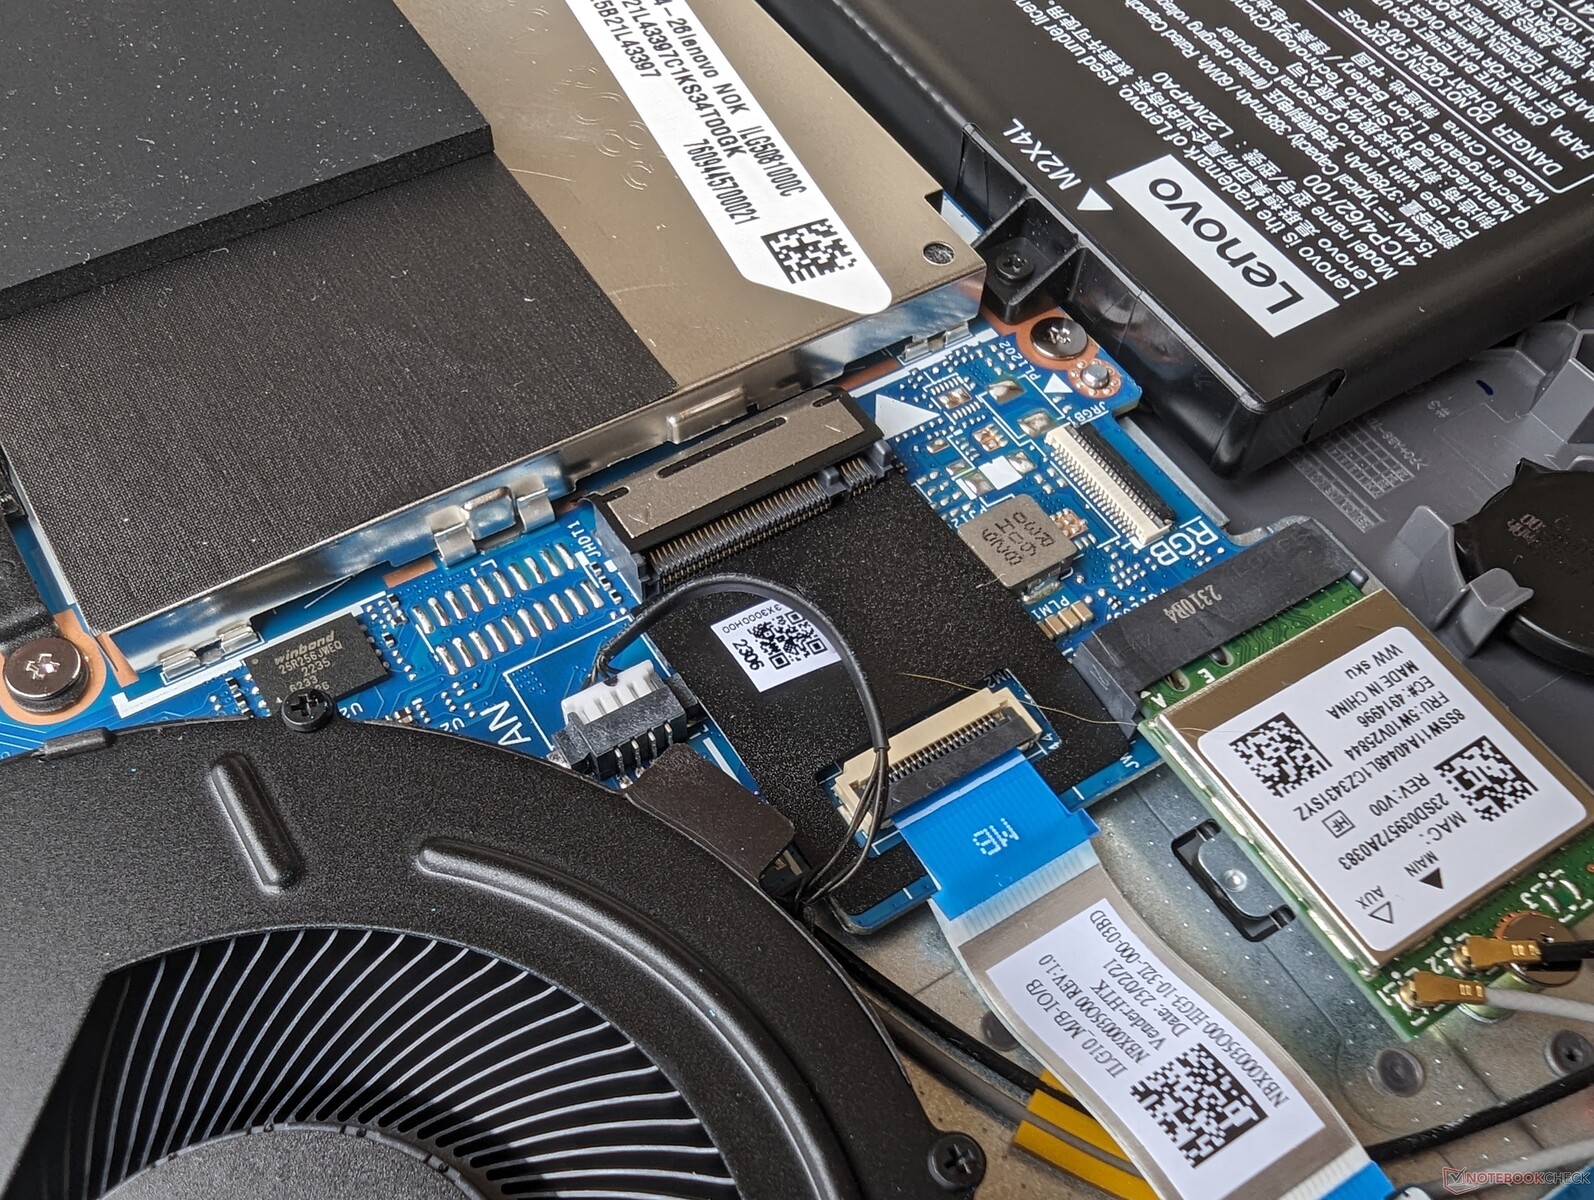
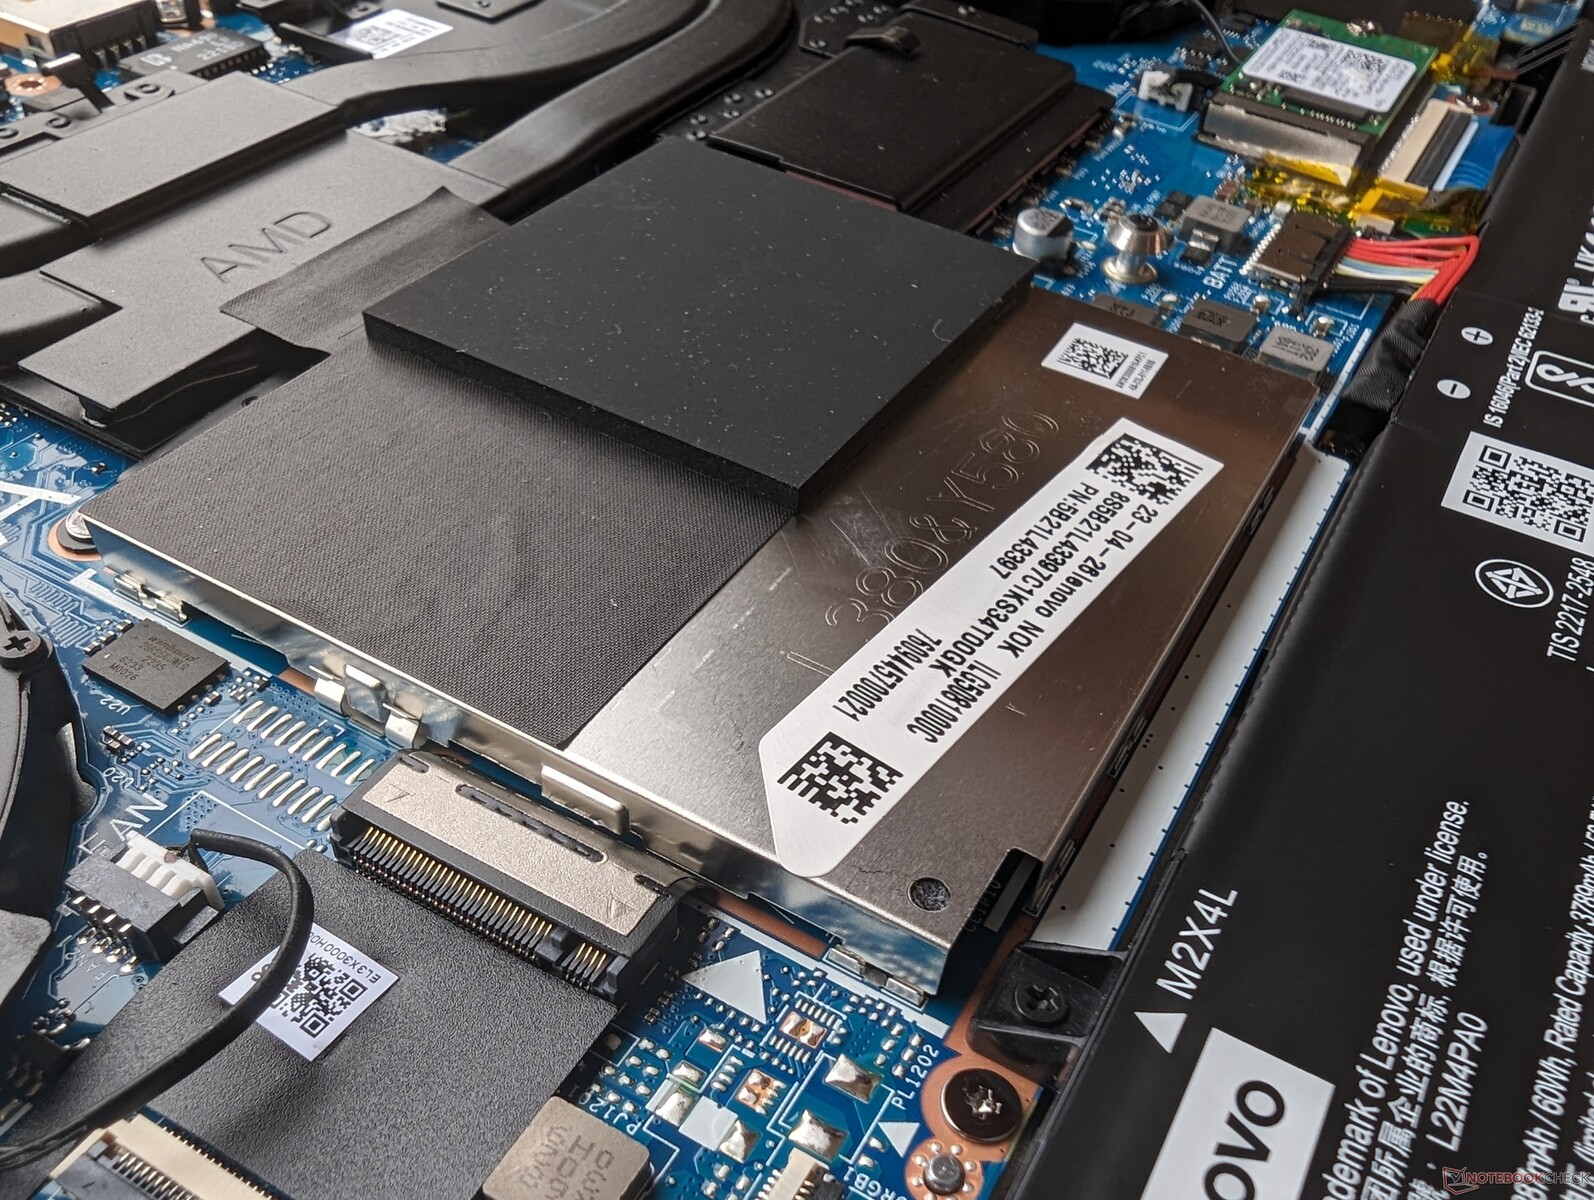
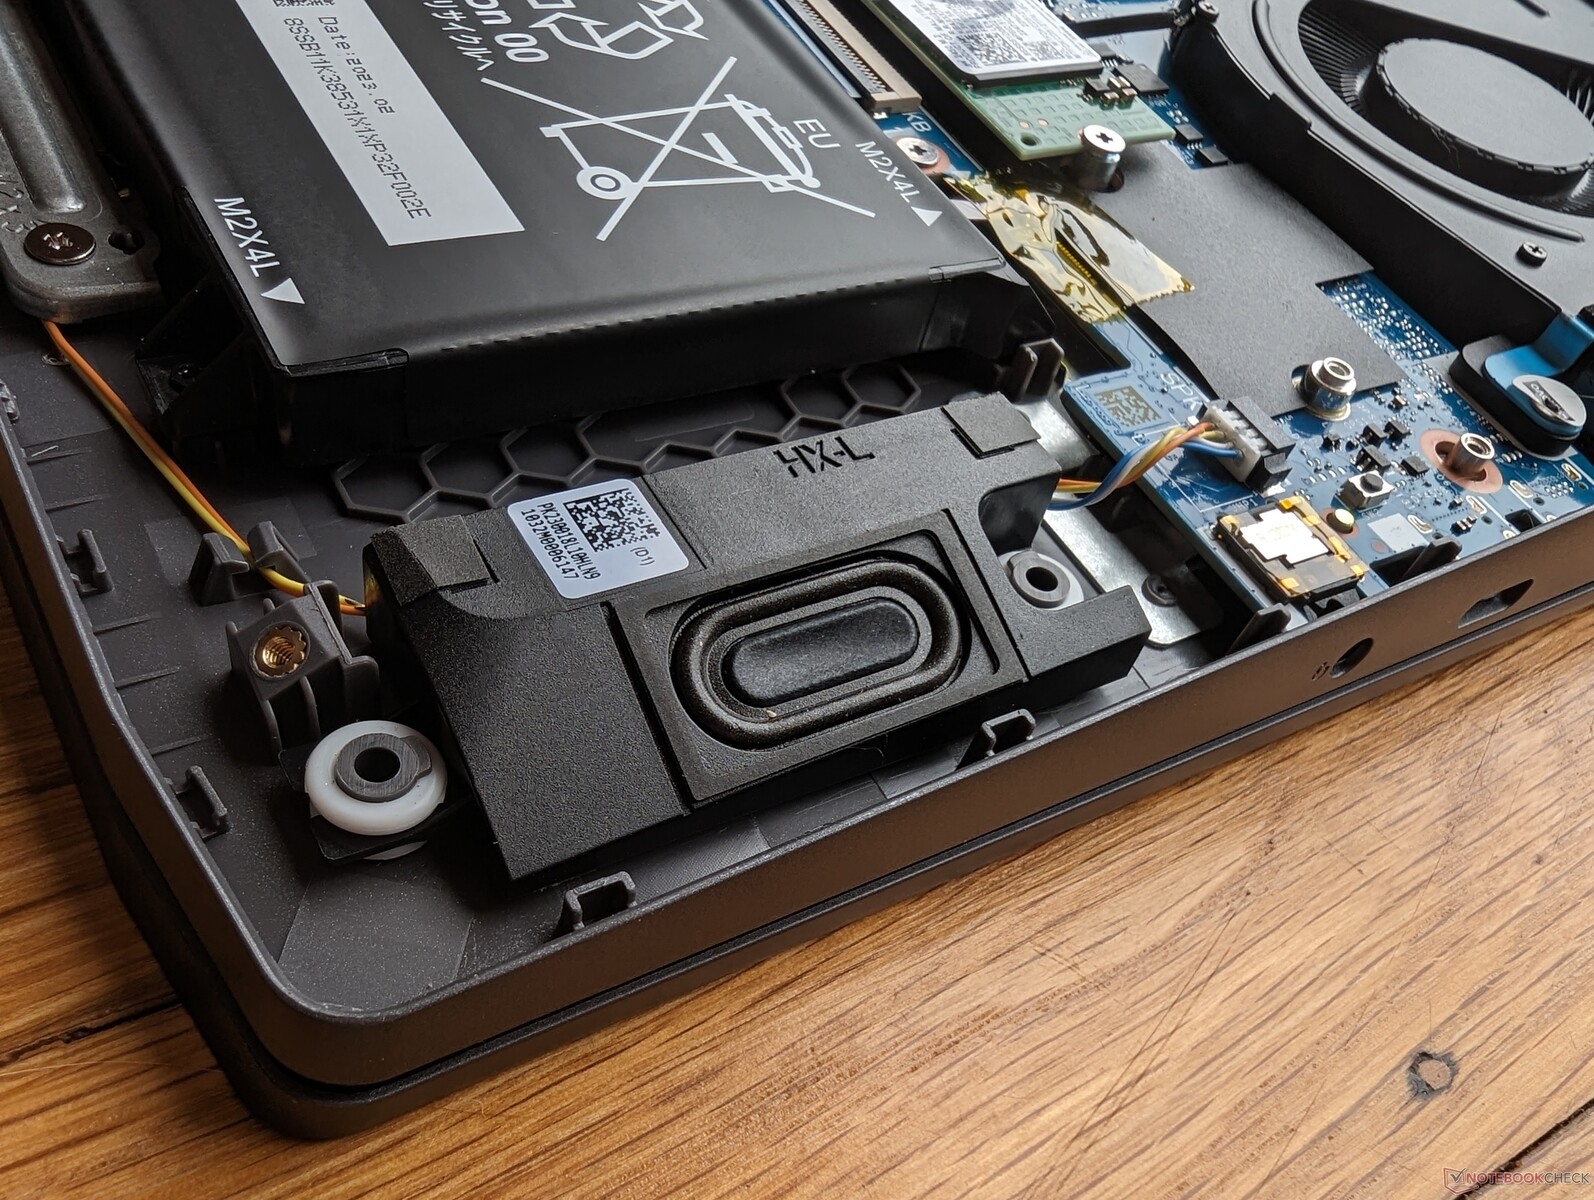
Périphériques de stockage - Prise en charge PCIe4 x4 NVMe
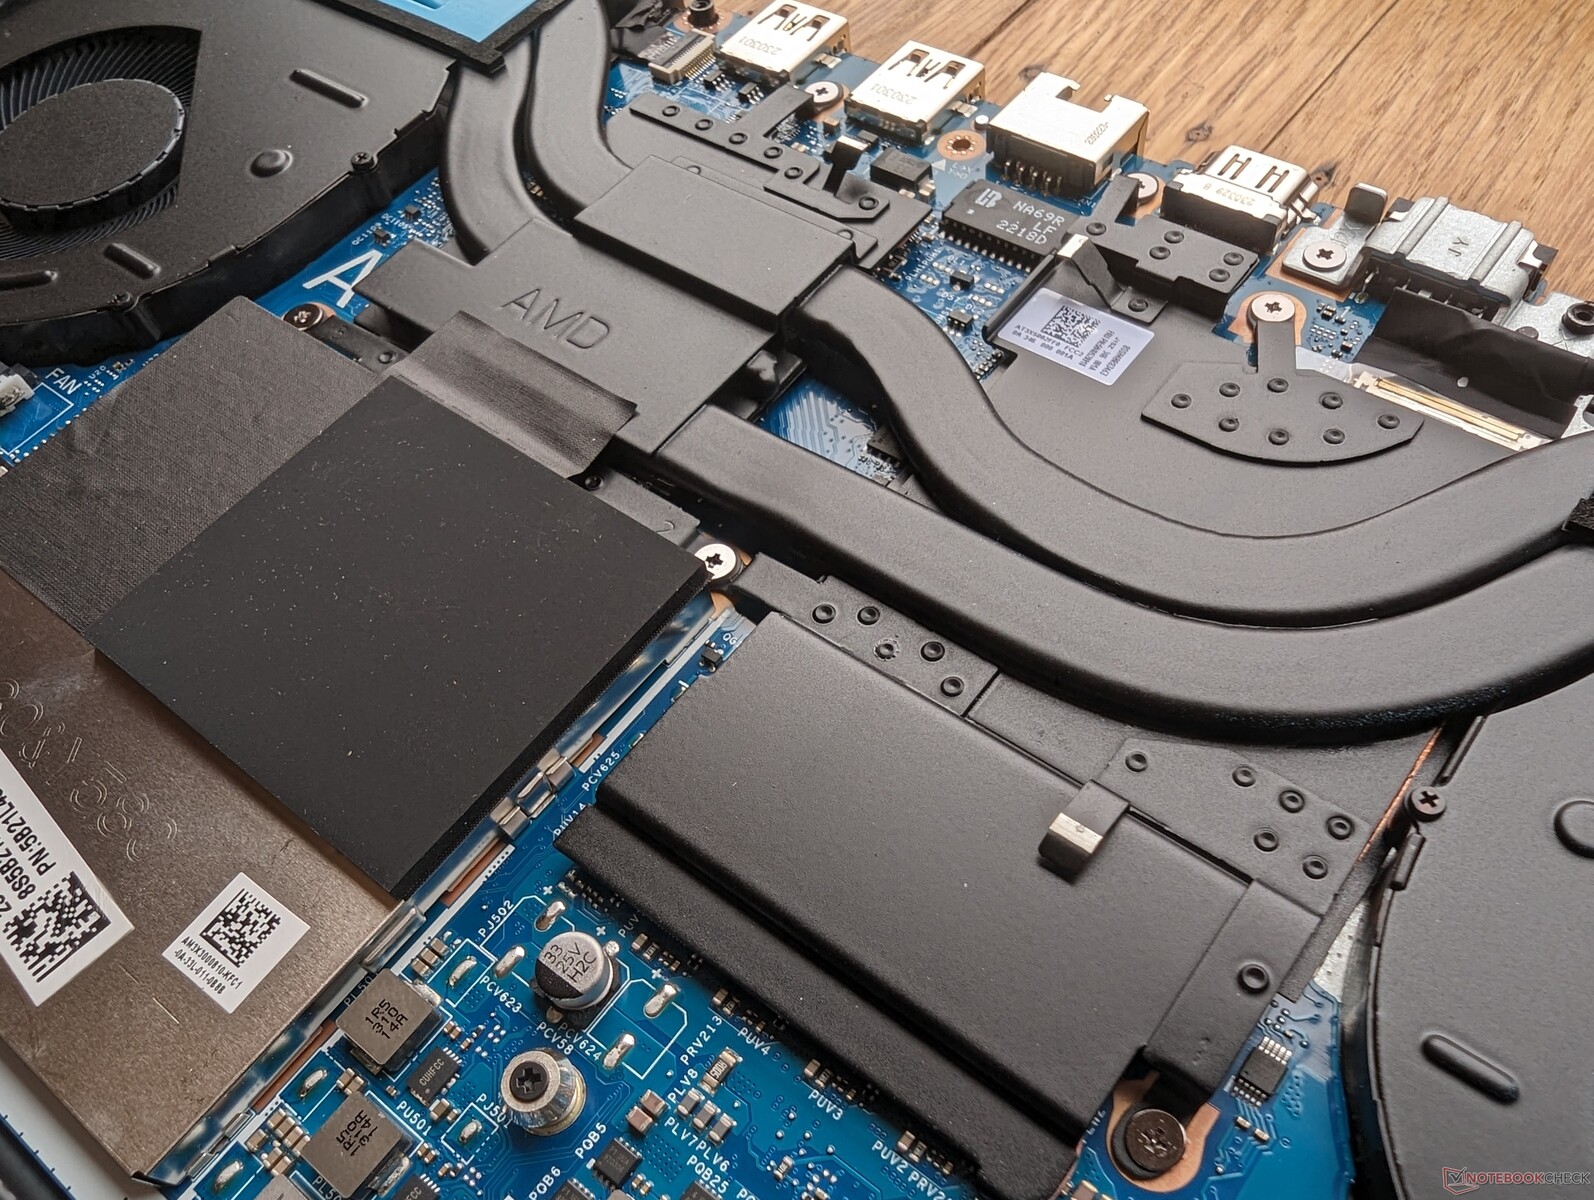
Notre unité est livrée avec un budgetMicron 2450 PCIe4 x4 NVMe SSD capable de soutenir des taux de lecture réels allant jusqu'à 2600 Mo/s sans aucun ralentissement. Jusqu'à deux SSD internes sont pris en charge, mais le second disque doit mesurer 42 mm de long, comme le montrent les images ci-dessous.

| Drive Performance rating - Percent | |
| Lenovo Legion 5 15IAH7H 82RB | |
| HP Victus 15 fa0020nr | |
| MSI Cyborg 15 A12VF | |
| Asus TUF A15 FA507 | |
| Dell G15 5530 | |
| Lenovo LOQ 15APH8 | |
* ... Moindre est la valeur, meilleures sont les performances
Disk Throttling: DiskSpd Read Loop, Queue Depth 8
Performance du GPU
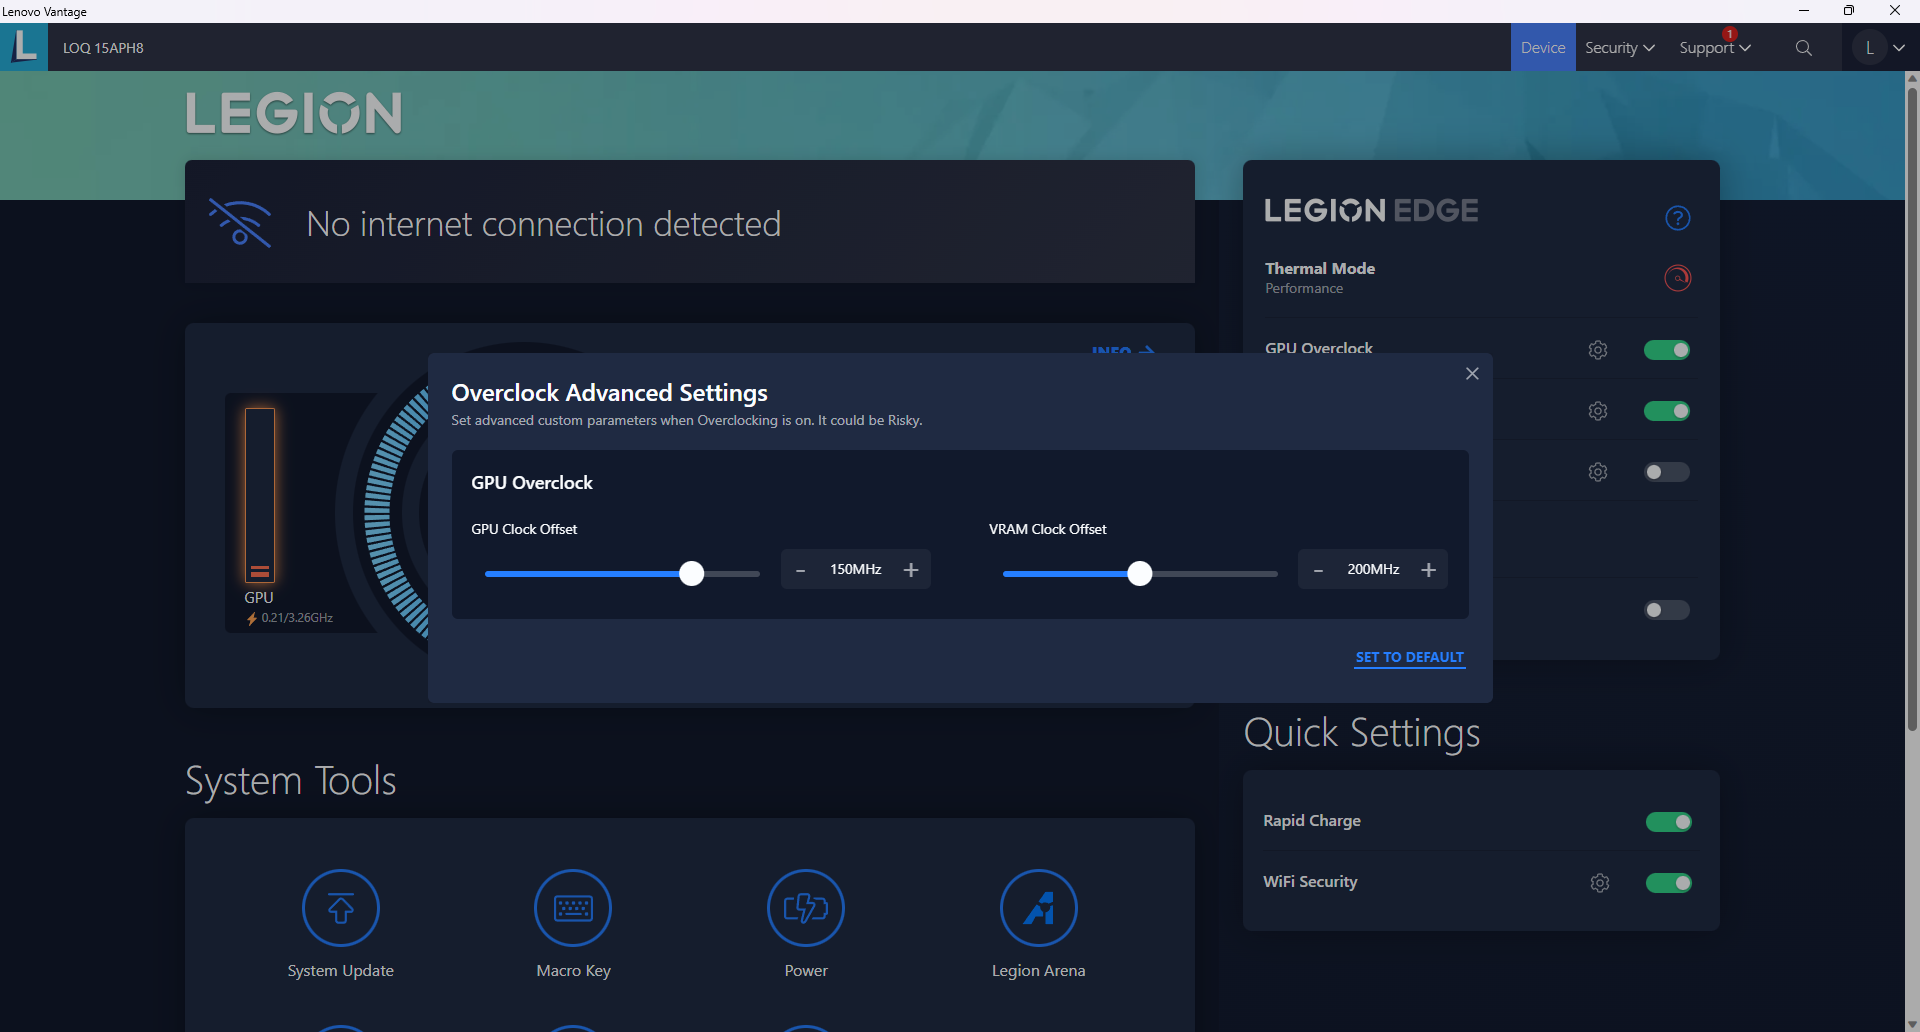
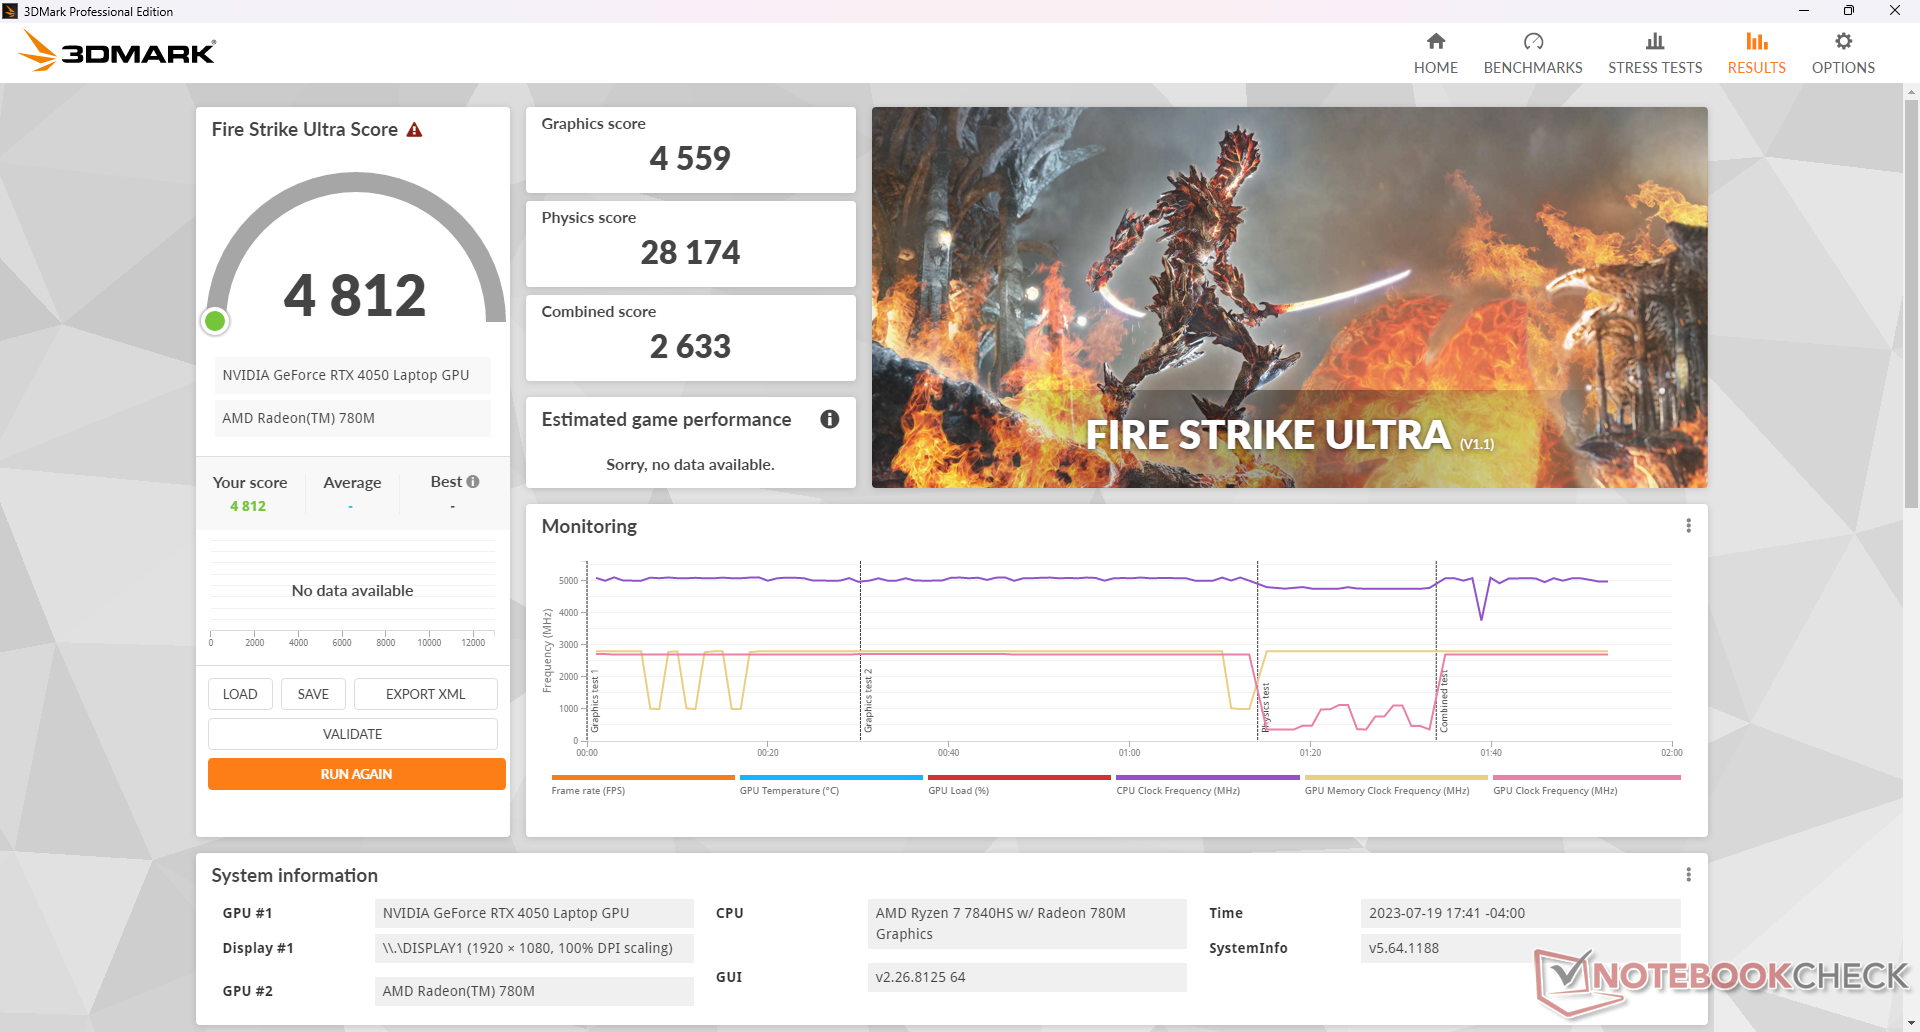
Les performances graphiques sont très bonnes avec des scores 3DMark supérieurs d'environ 10 % à la moyenne des ordinateurs portables de notre base de données équipés de la même carte RTX 4050 et de la même carte graphique même GeForce RTX 4050 GPU. Les performances brutes sont comparables à celles de la rTX 3060 mobile comme on pouvait s'y attendre.
La rétrogradation vers la RTX 3050 réduirait les performances du GPU de 45 %, tandis que la mise à niveau vers la RTX 4060 augmenterait les performances de 15 à 20 %. Pour les joueurs disposant d'un budget limité, nous recommandons de s'en tenir aux options RTX 4050 ou RTX 4060.
L'utilisation de la batterie réduit les performances. Un test Fire Strike sur batterie donnerait des scores de physique et de graphique de 25672 et 16335 points, respectivement, contre 28136 et 23345 points sur secteur.
L'utilisation du système en mode équilibré au lieu du mode performance n'aura qu'un léger impact sur les performances, comme le montrent les résultats de notre site Fire Strike dans le tableau ci-dessous.
| Profil d'alimentation | Score graphique | Score physique | Score combiné |
| Équilibré | 22598 (-3%) | 25910 (-8%) | 9507 (-1%) |
| Performance | 23345 | 28136 | 9593 |
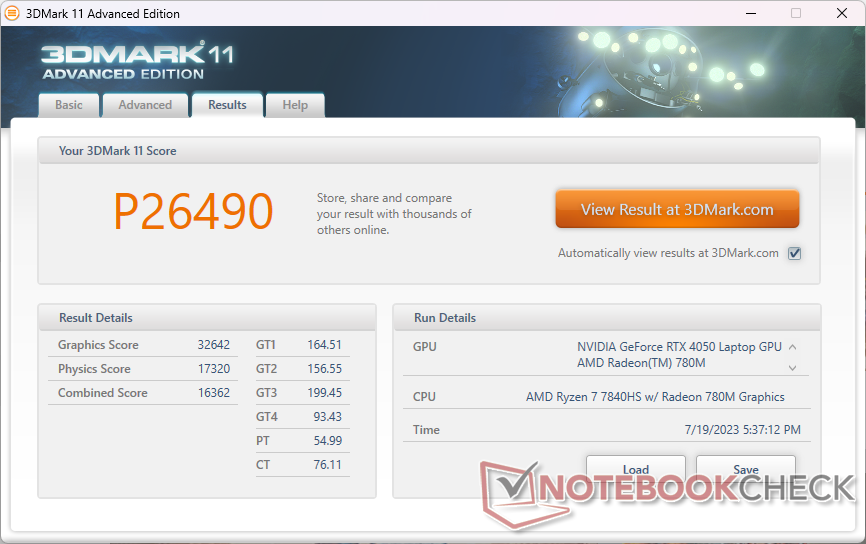
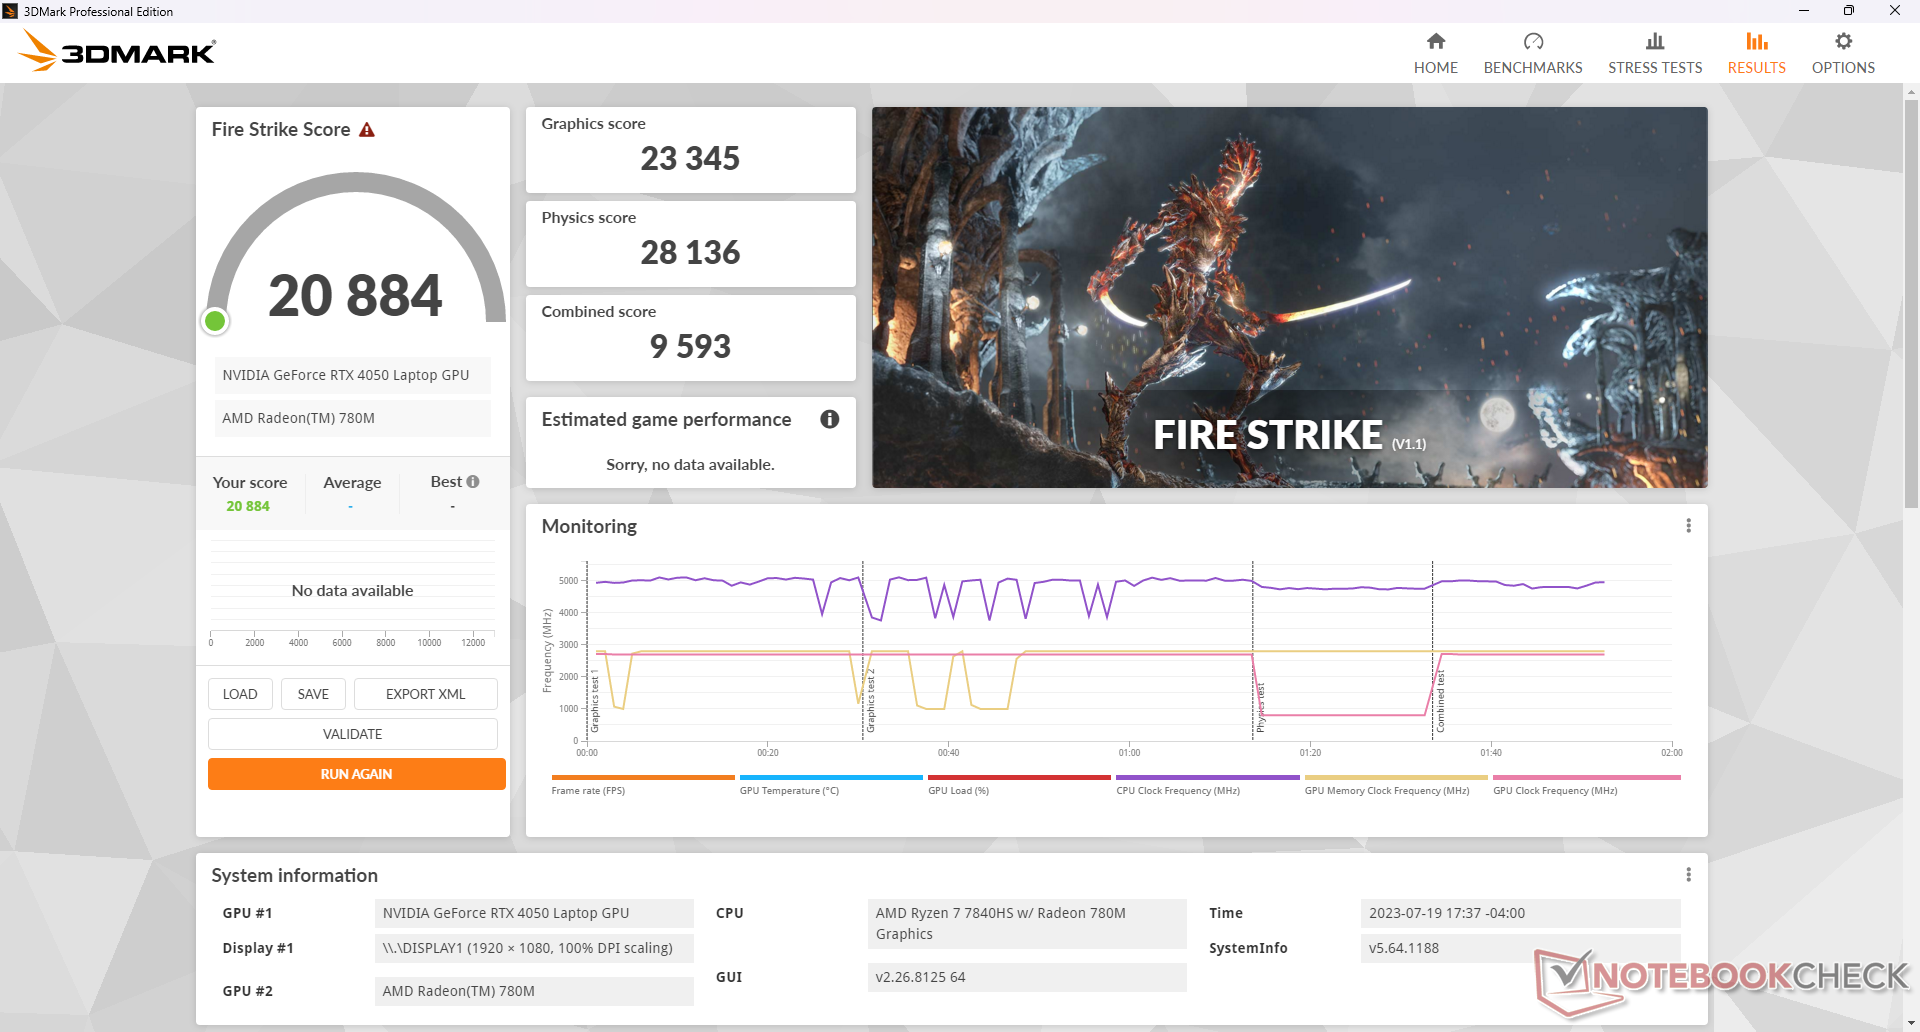
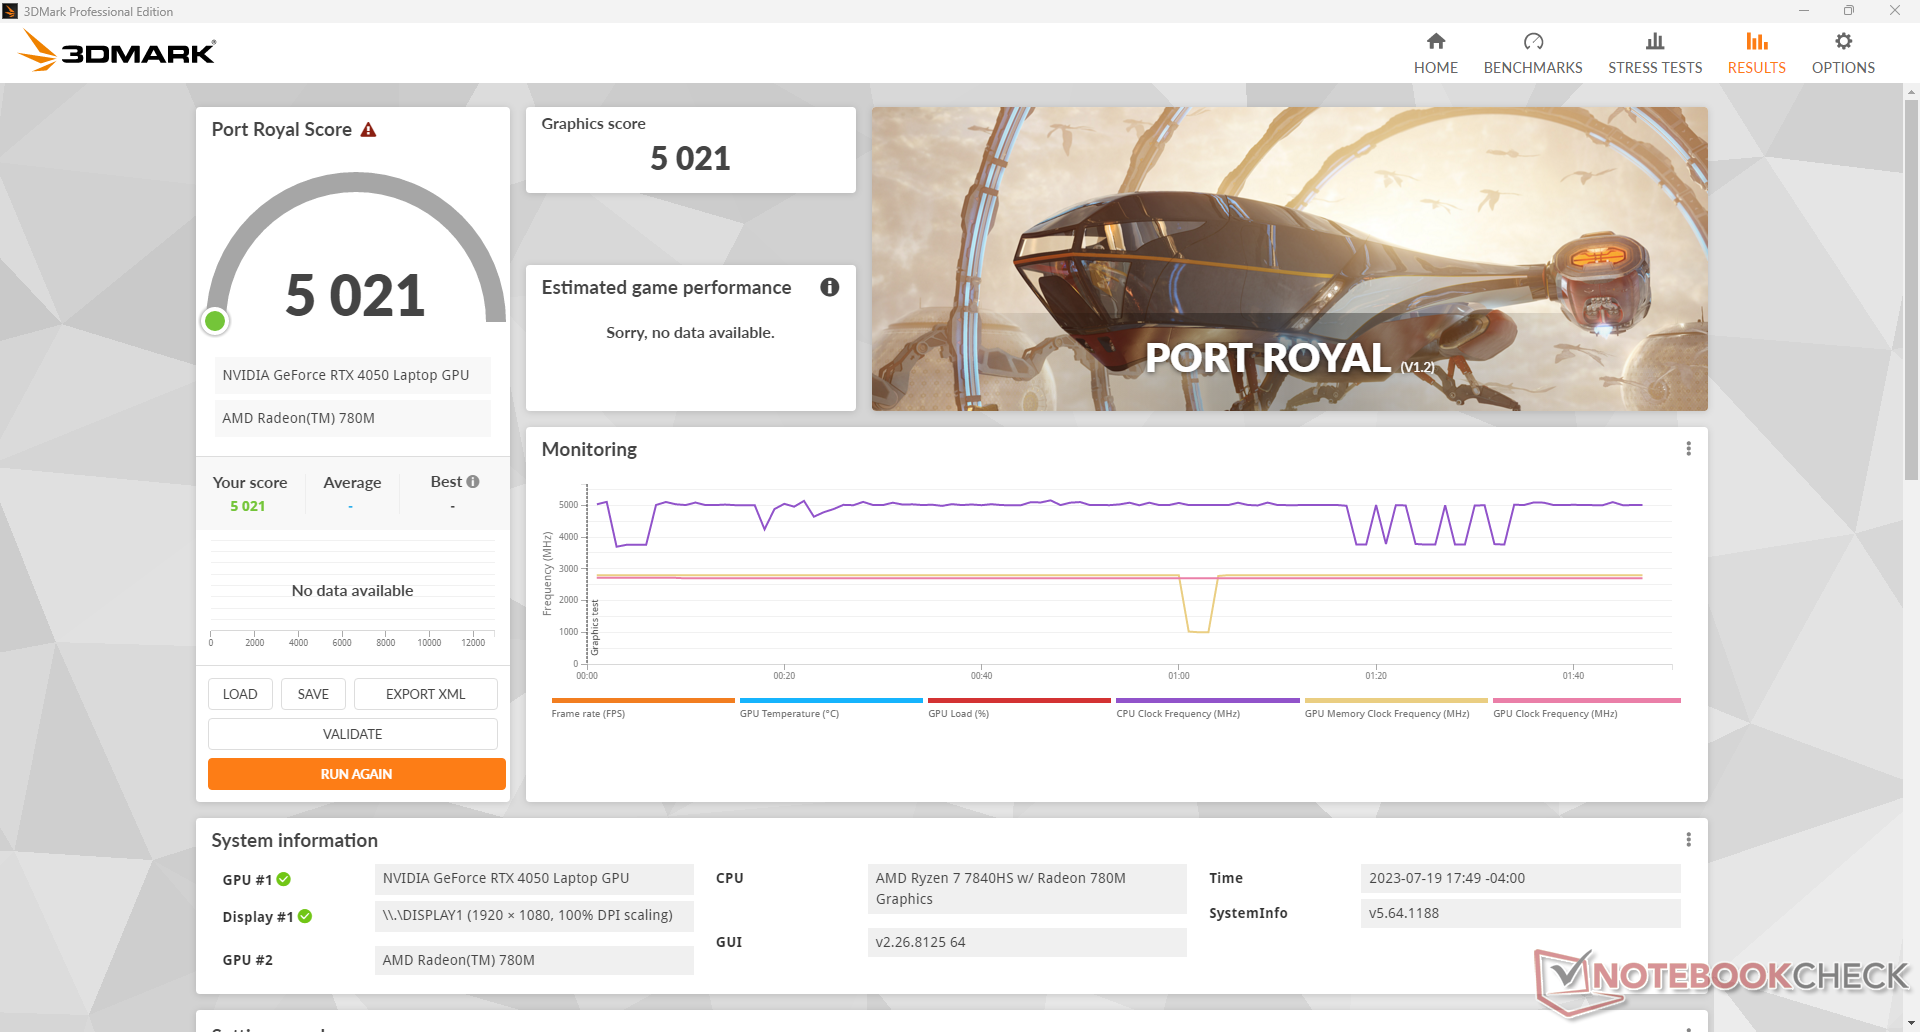
| 3DMark 11 Performance | 26490 points | |
| 3DMark Fire Strike Score | 20884 points | |
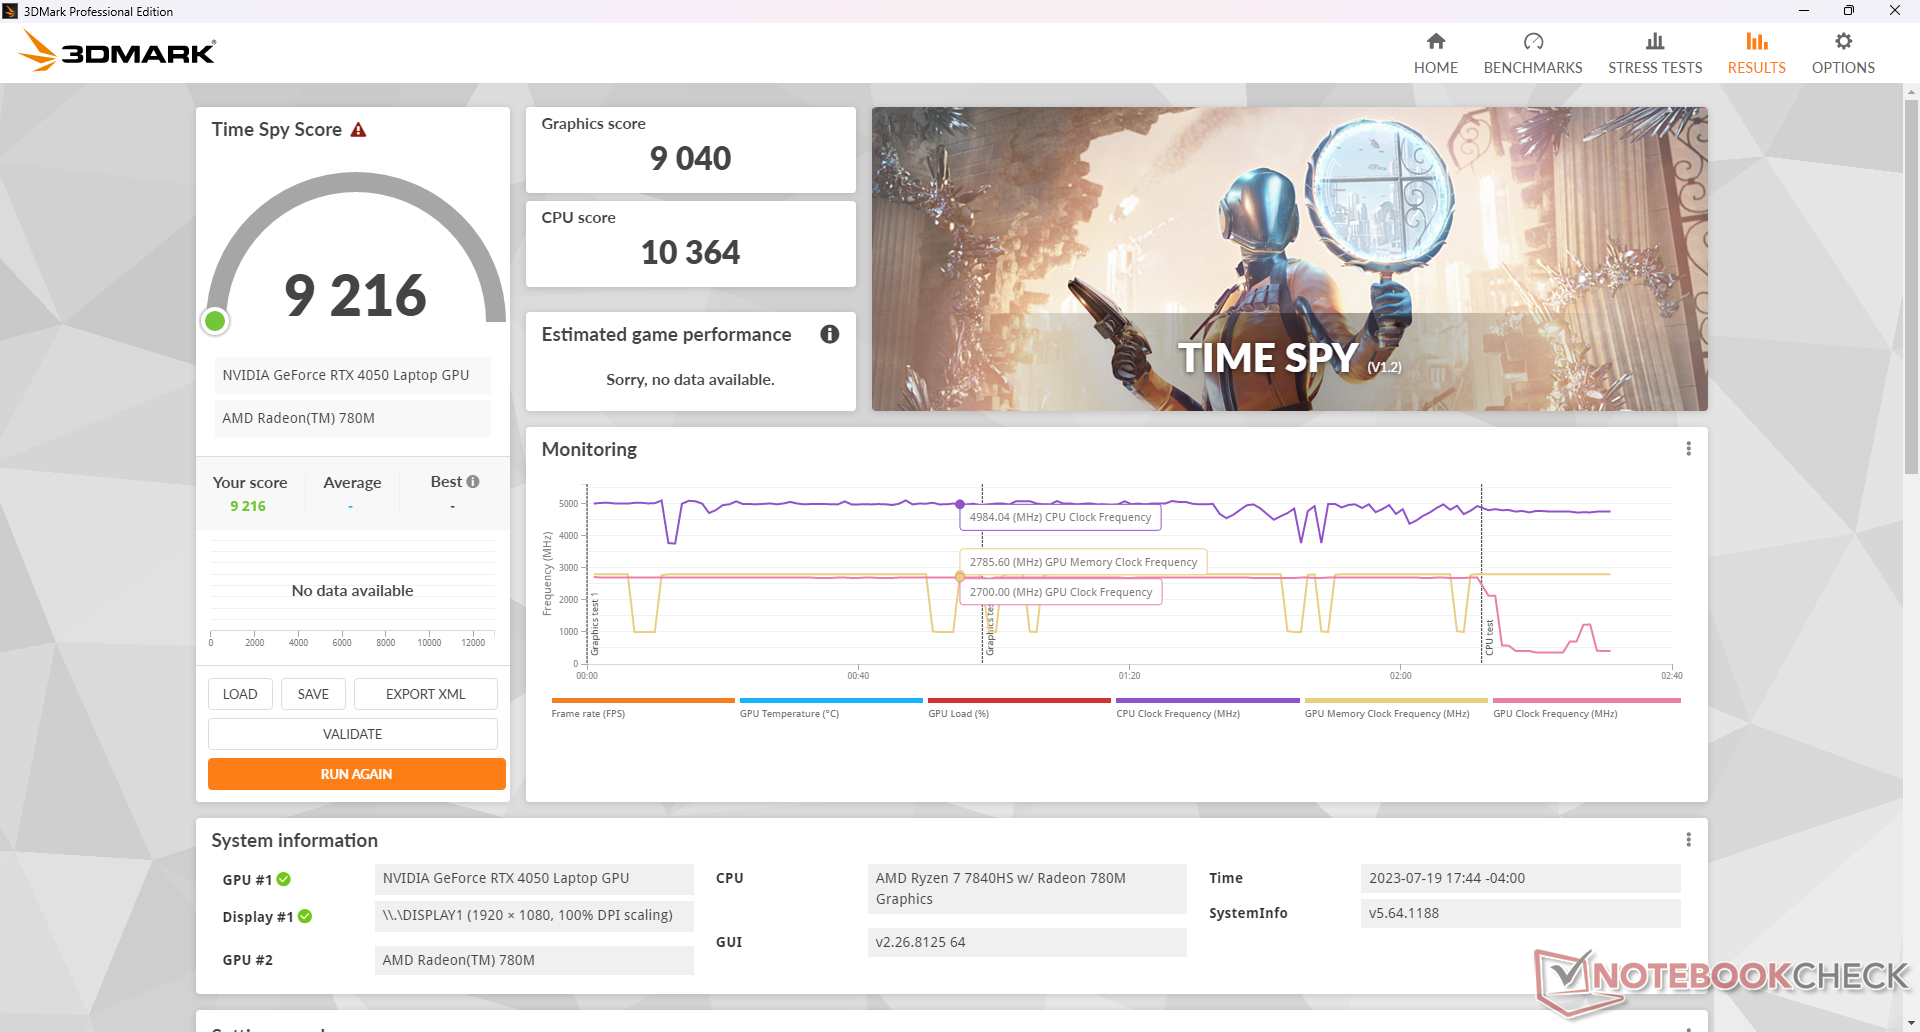
| 3DMark Time Spy Score | 9216 points | |
Aide | ||
* ... Moindre est la valeur, meilleures sont les performances
Performance des jeux
Étonnamment, les 8 Go de mémoire vive ont peu d'impact sur les performances de jeu du système. En fait, les taux de rafraîchissement sont là où nous les attendions dans la plupart des cas par rapport à d'autres ordinateurs portables avec le même GPU RTX 4050, voire légèrement plus rapides. Il y a quelques exceptions, cependant, où certains paramètres graphiques Ultra feraient planter le jeu en raison des limitations de mémoire, y compris F1 22 et Returnal.
Witcher 3 FPS Chart
| Bas | Moyen | Élevé | Ultra | |
|---|---|---|---|---|
| GTA V (2015) | 163.6 | 156 | 132.9 | 78.4 |
| The Witcher 3 (2015) | 286.5 | 251.2 | 165 | 83.8 |
| Dota 2 Reborn (2015) | 148 | 134.9 | 130 | 123.9 |
| Final Fantasy XV Benchmark (2018) | 166.8 | 122.4 | 86.1 | |
| X-Plane 11.11 (2018) | 113.2 | 101.4 | 81.3 | |
| Strange Brigade (2018) | 309 | 214 | 177 | 156.6 |
| Cyberpunk 2077 1.6 (2022) | 117 | 106.4 | 82.2 | 70.1 |
| Tiny Tina's Wonderlands (2022) | 169.2 | 148.8 | 99.5 | 77.3 |
| F1 22 (2022) | 191.2 | 184.3 | 163.2 | |
| Returnal (2023) | 66 | 66 | 63 | 53 |
Émissions
Bruit du système - Loud Gamer
Le bruit du ventilateur tend à s'établir à 25 dB(A) sur un fond silencieux de 23 dB(A) pendant la navigation légère ou le streaming, ce qui est pratiquement inaudible dans un bureau ou une pièce typique. L'exécutionWitcher 3 en mode Performance peut atteindre 46 dB(A), tandis que le jeu en mode Équilibré est à peine plus silencieux (44 dB(A)). Ce dernier mode entraîne toutefois une légère baisse des performances, comme nous l'avons vu plus haut.
Si le CPU et le GPU sont sollicités à 100 %, le bruit du ventilateur peut atteindre 52 dB(A), ce qui est presque aussi fort que le bruit du ventilateur duCyborg 15.
Degré de la nuisance sonore
| Au repos |
| 23.1 / 23.1 / 25.2 dB(A) |
| Fortement sollicité |
| 44.3 / 52 dB(A) |
 | ||
30 dB silencieux 40 dB(A) audible 50 dB(A) bruyant |
||
min: | ||
| Lenovo LOQ 15APH8 GeForce RTX 4050 Laptop GPU, R7 7840HS, Micron 2450 512GB MTFDKCD512TFK | Lenovo Legion 5 15IAH7H 82RB GeForce RTX 3060 Laptop GPU, i7-12700H | Dell G15 5530 GeForce RTX 4060 Laptop GPU, i7-13650HX, SSTC CL4-3D512-Q11 | Asus TUF A15 FA507 GeForce RTX 4050 Laptop GPU, R7 7735HS, Micron 2400 MTFDKBA512QFM | MSI Cyborg 15 A12VF GeForce RTX 4060 Laptop GPU, i7-12650H, Samsung PM9B1 1024GB MZVL41T0HBLB | HP Victus 15 fa0020nr GeForce RTX 3050 Ti Laptop GPU, i7-12700H, Samsung PM9A1 MZVL2512HCJQ | |
|---|---|---|---|---|---|---|
| Noise | 1% | 2% | 9% | -30% | -1% | |
| arrêt / environnement * (dB) | 23.1 | 23.3 -1% | 20.41 12% | 23.3 -1% | 27 -17% | 24.8 -7% |
| Idle Minimum * (dB) | 23.1 | 23.5 -2% | 26.85 -16% | 23.3 -1% | 27 -17% | 26.2 -13% |
| Idle Average * (dB) | 23.1 | 23.5 -2% | 26.85 -16% | 23.3 -1% | 37.5 -62% | 29.2 -26% |
| Idle Maximum * (dB) | 25.2 | 26.8 -6% | 26.85 -7% | 23.3 8% | 38 -51% | 29.4 -17% |
| Load Average * (dB) | 44.3 | 29.3 34% | 27.65 38% | 29.6 33% | 56.3 -27% | 29.9 33% |
| Witcher 3 ultra * (dB) | 45.8 | 51.4 -12% | 47.9 -5% | 43 6% | 41.1 10% | |
| Load Maximum * (dB) | 52 | 53 -2% | 47.86 8% | 43 17% | 56.3 -8% | 45.5 12% |
* ... Moindre est la valeur, meilleures sont les performances
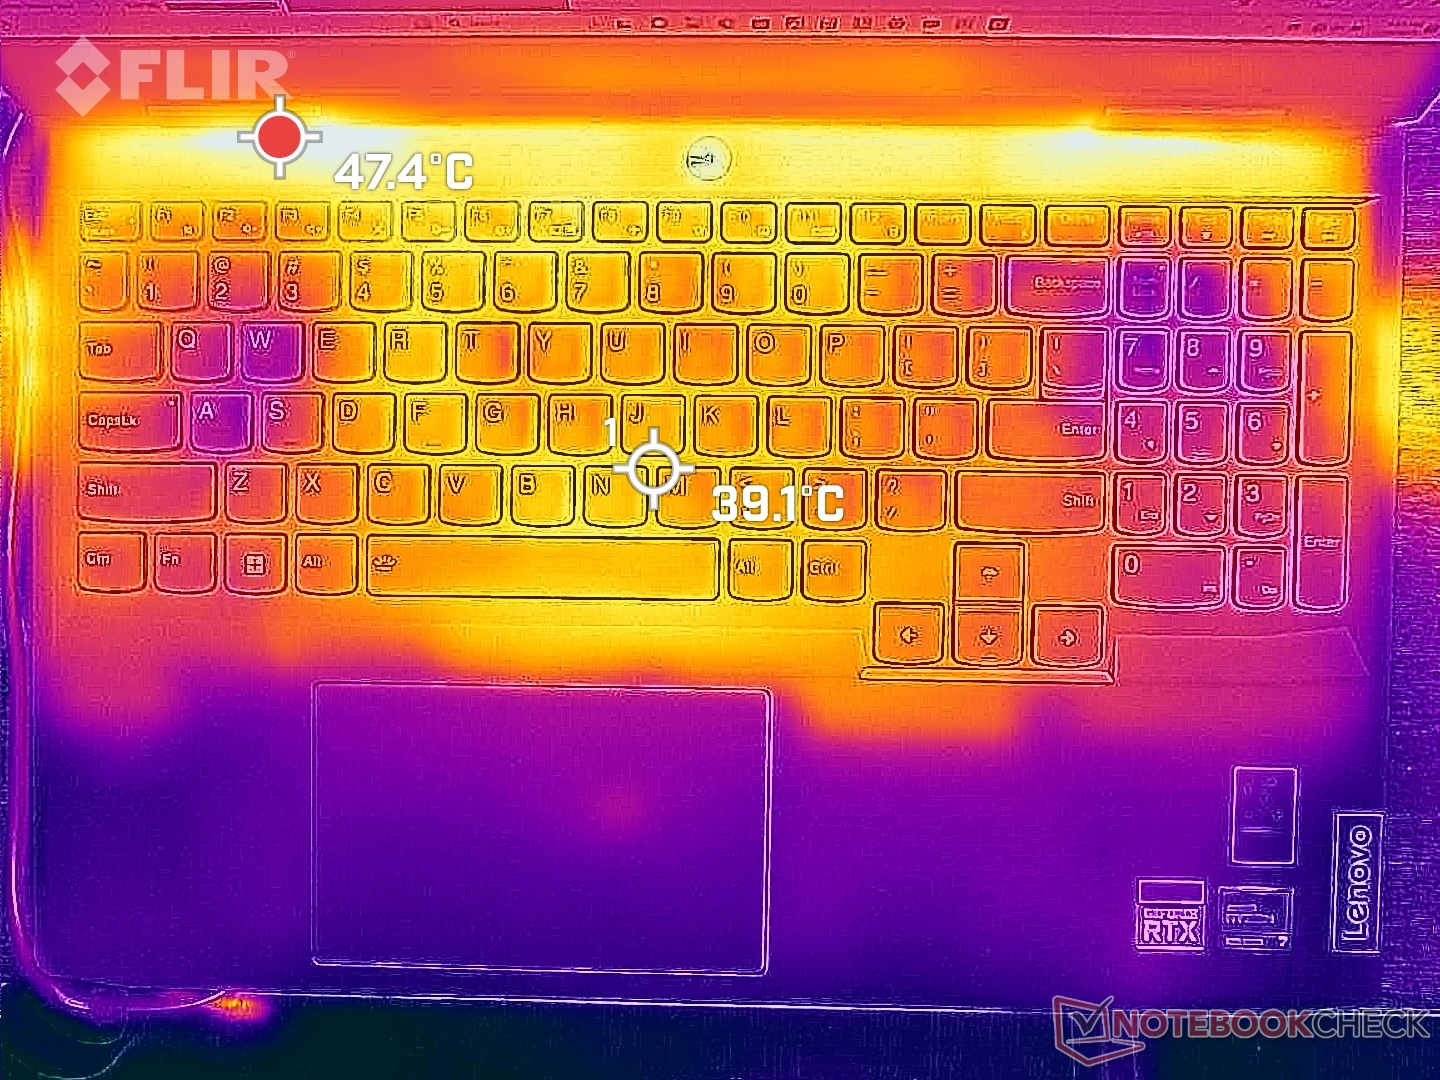
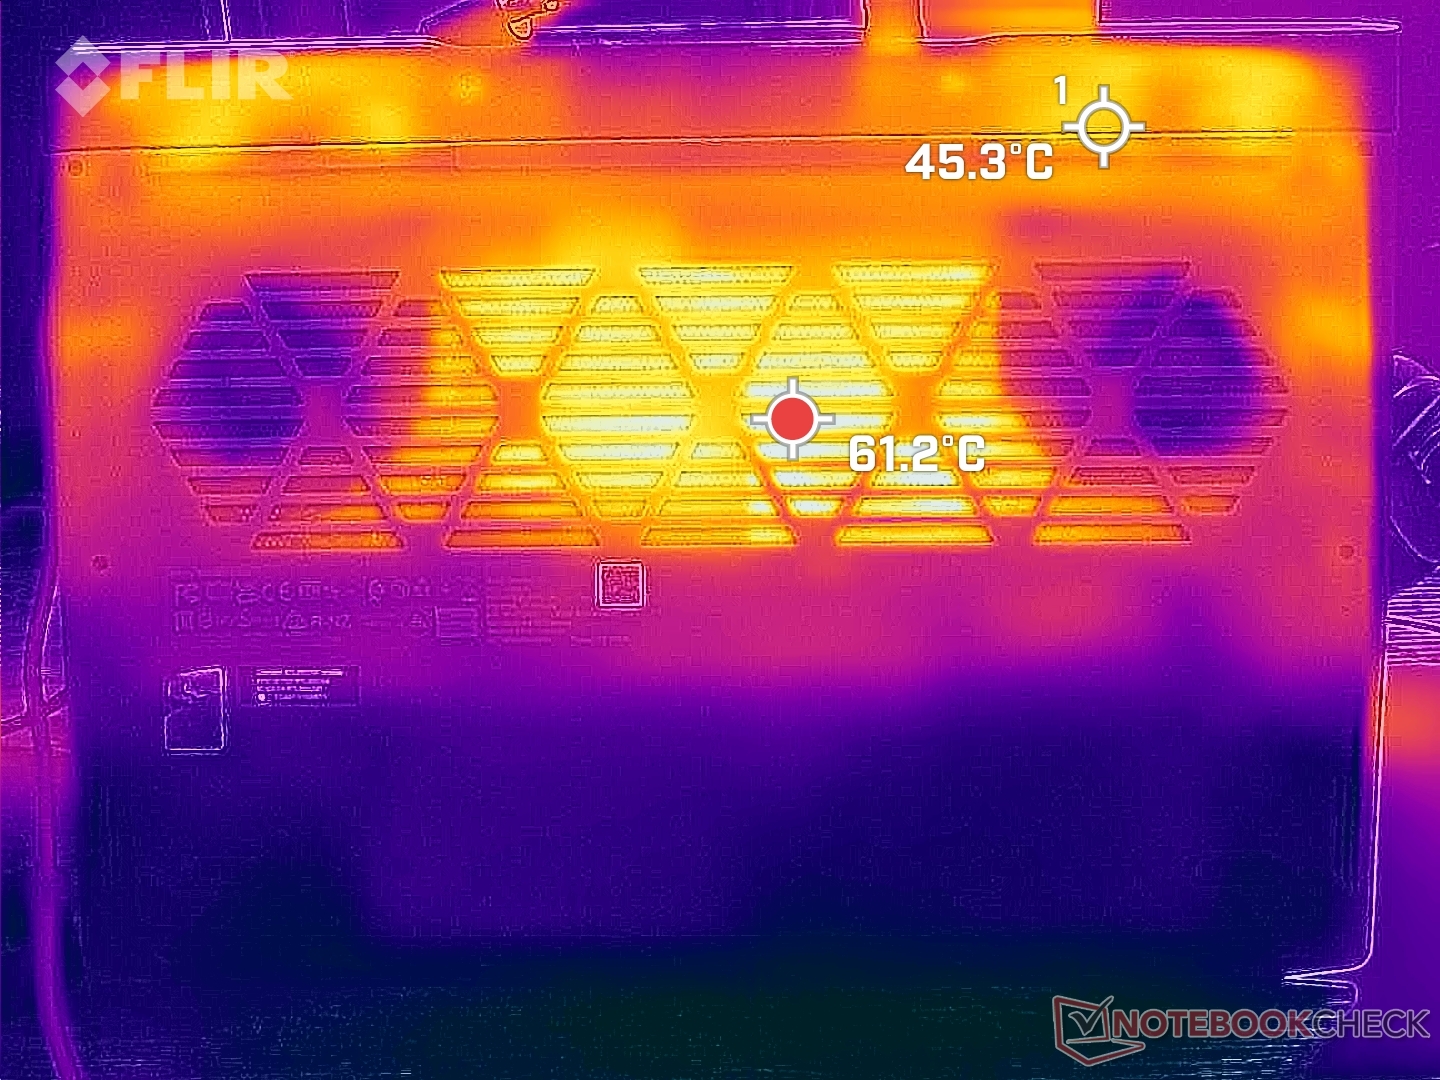
Température
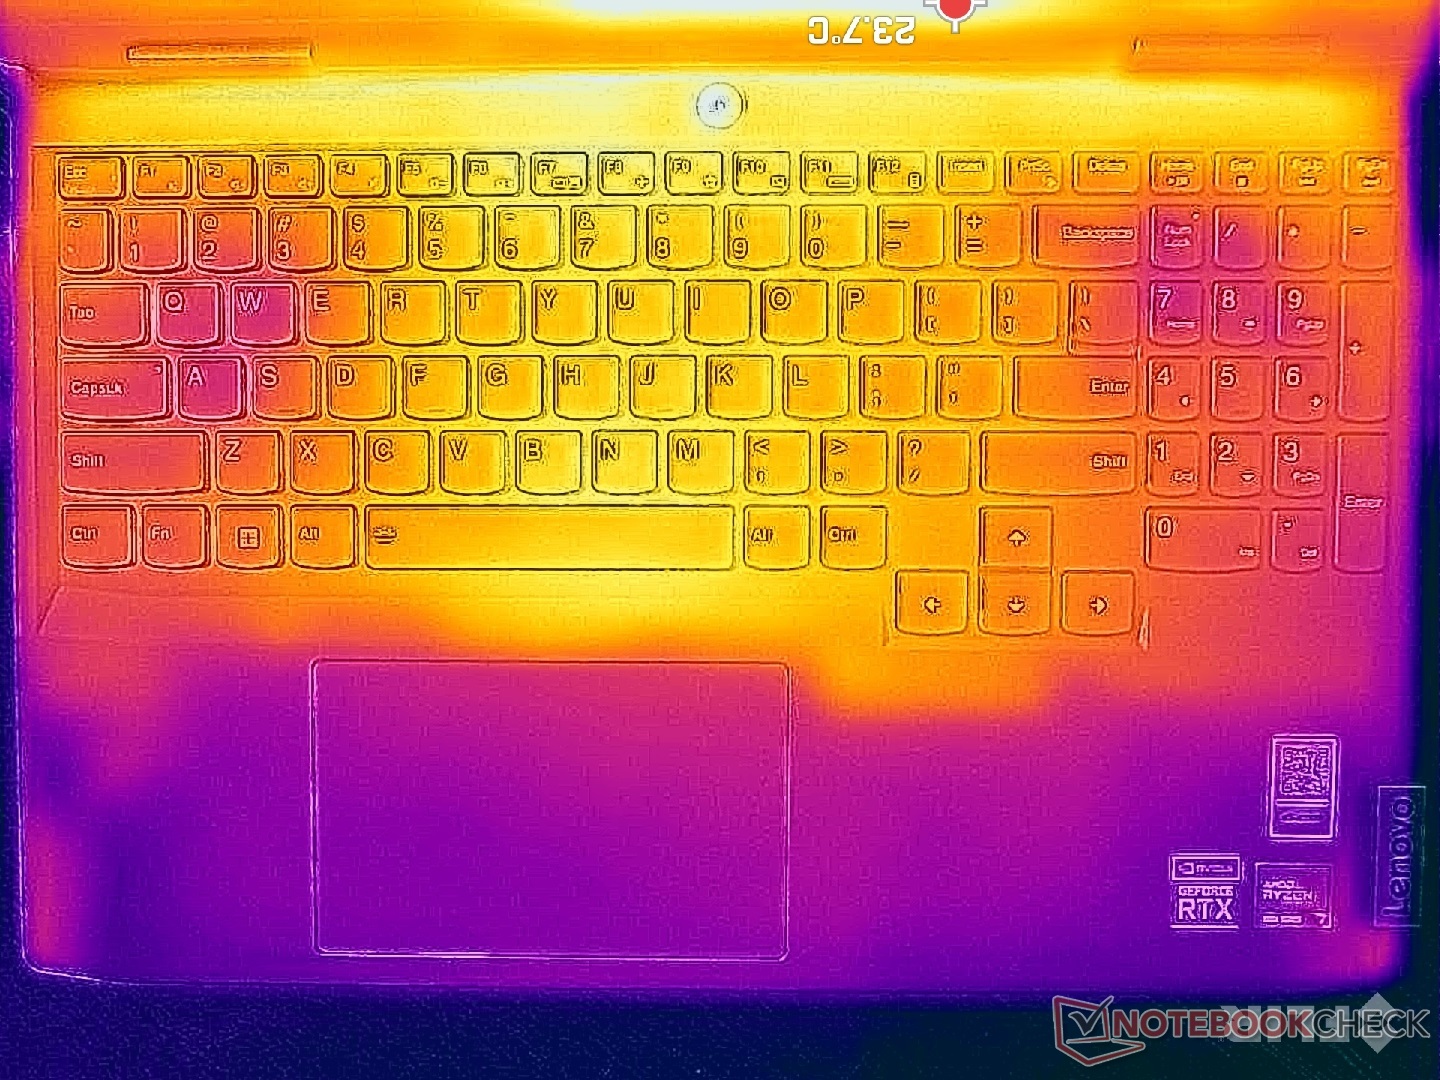
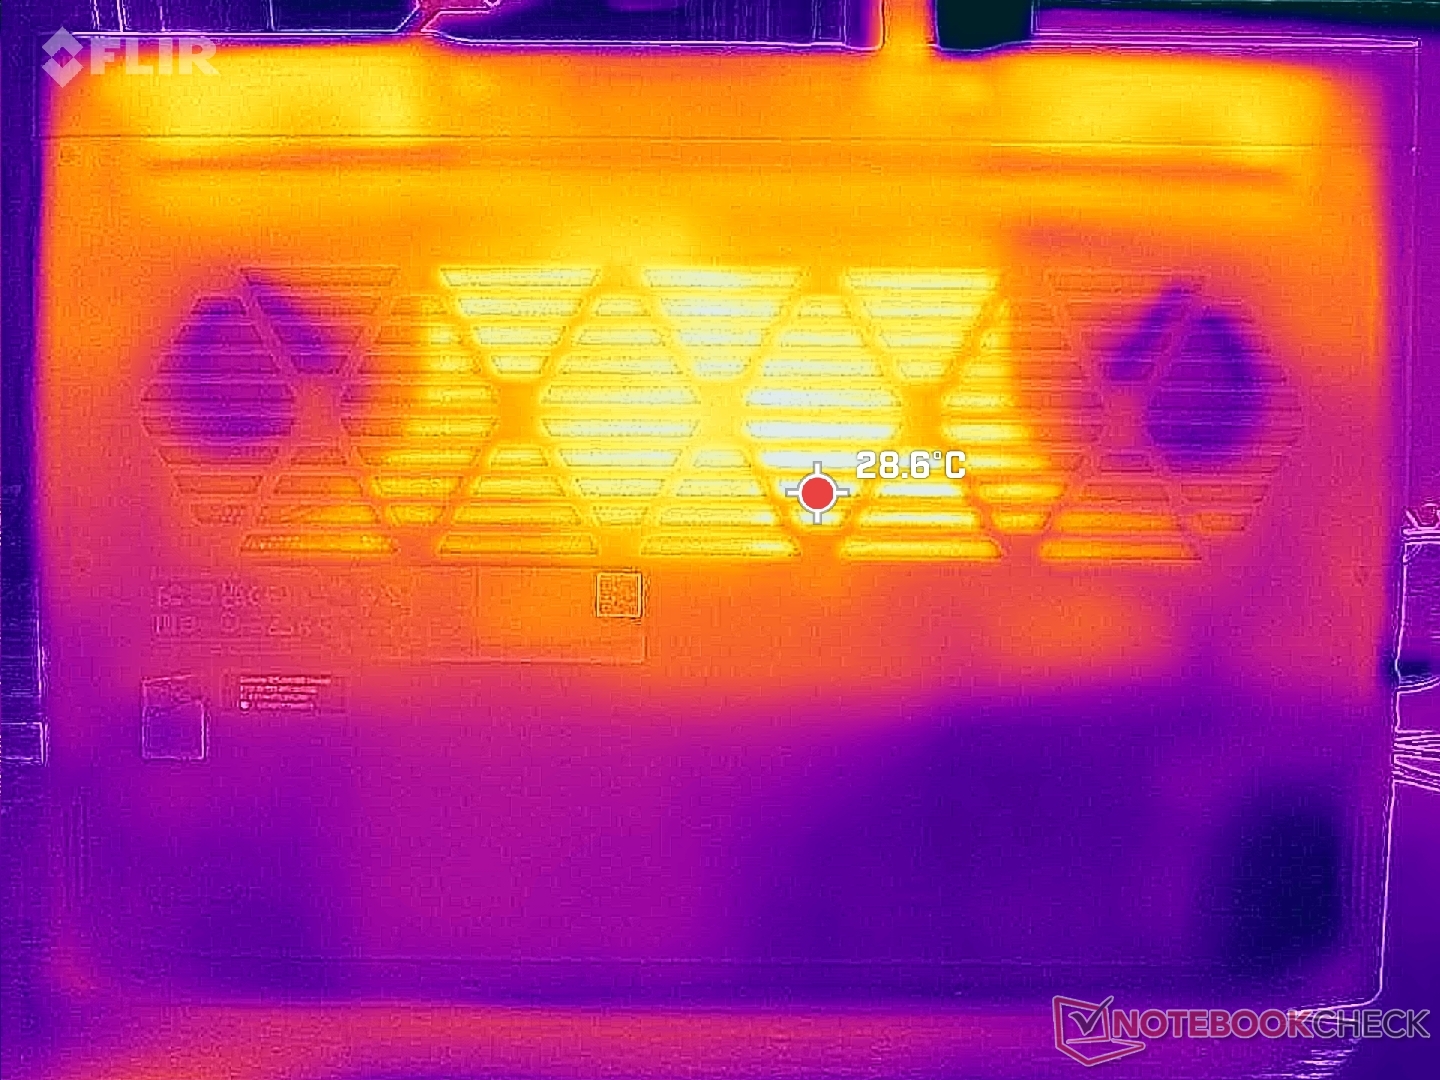
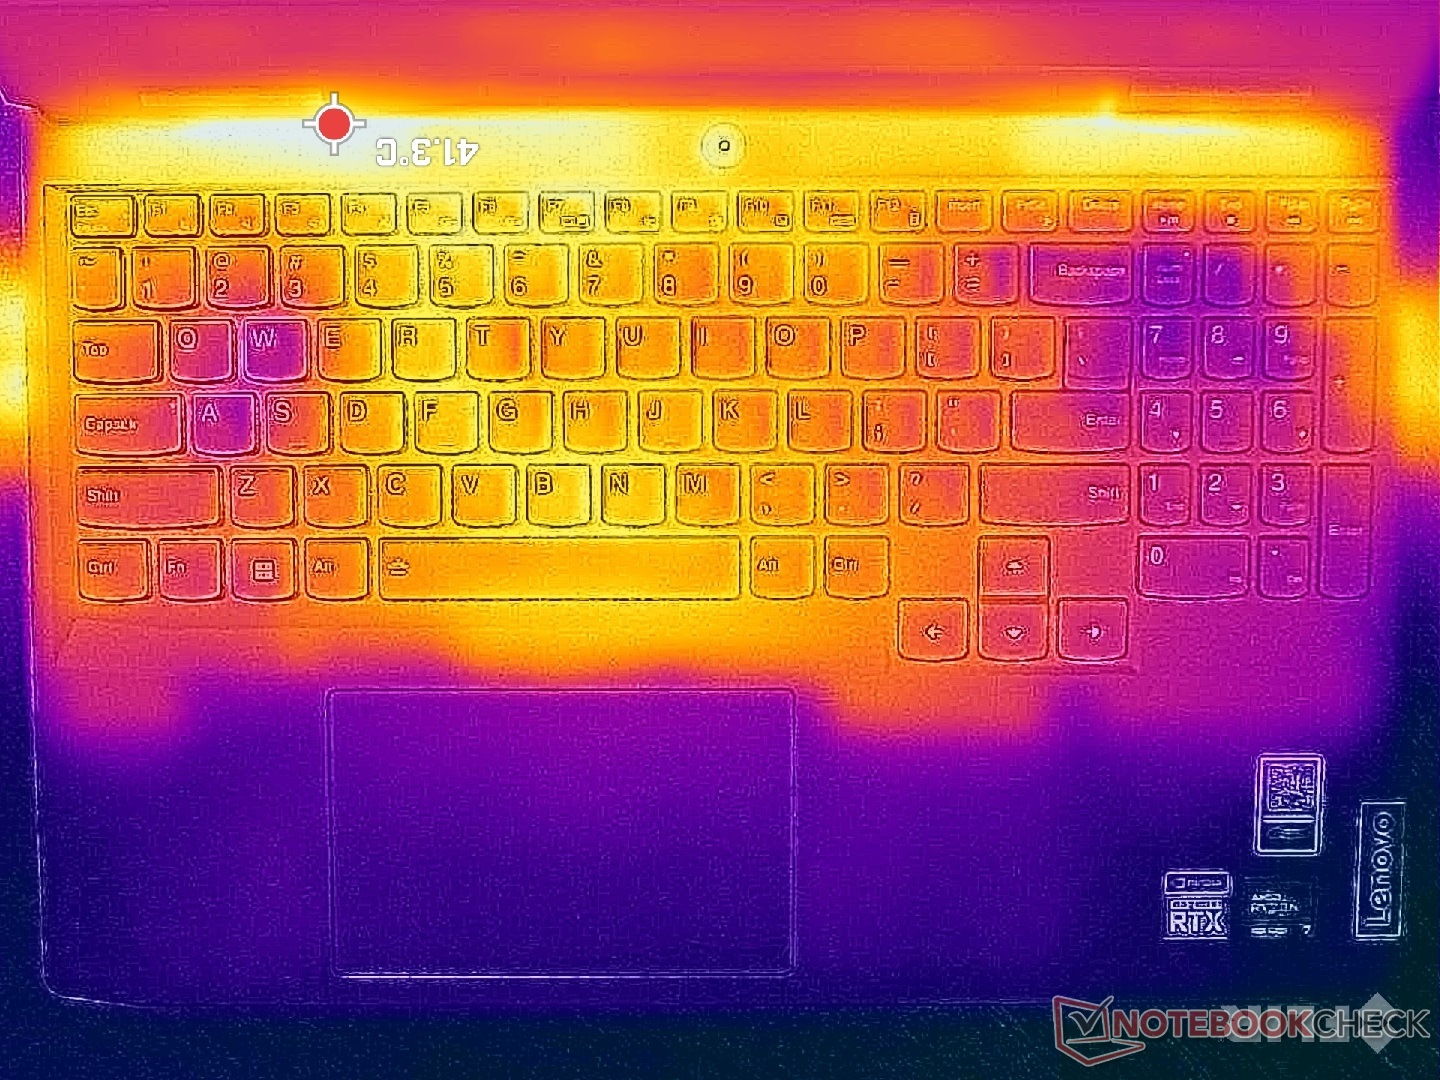
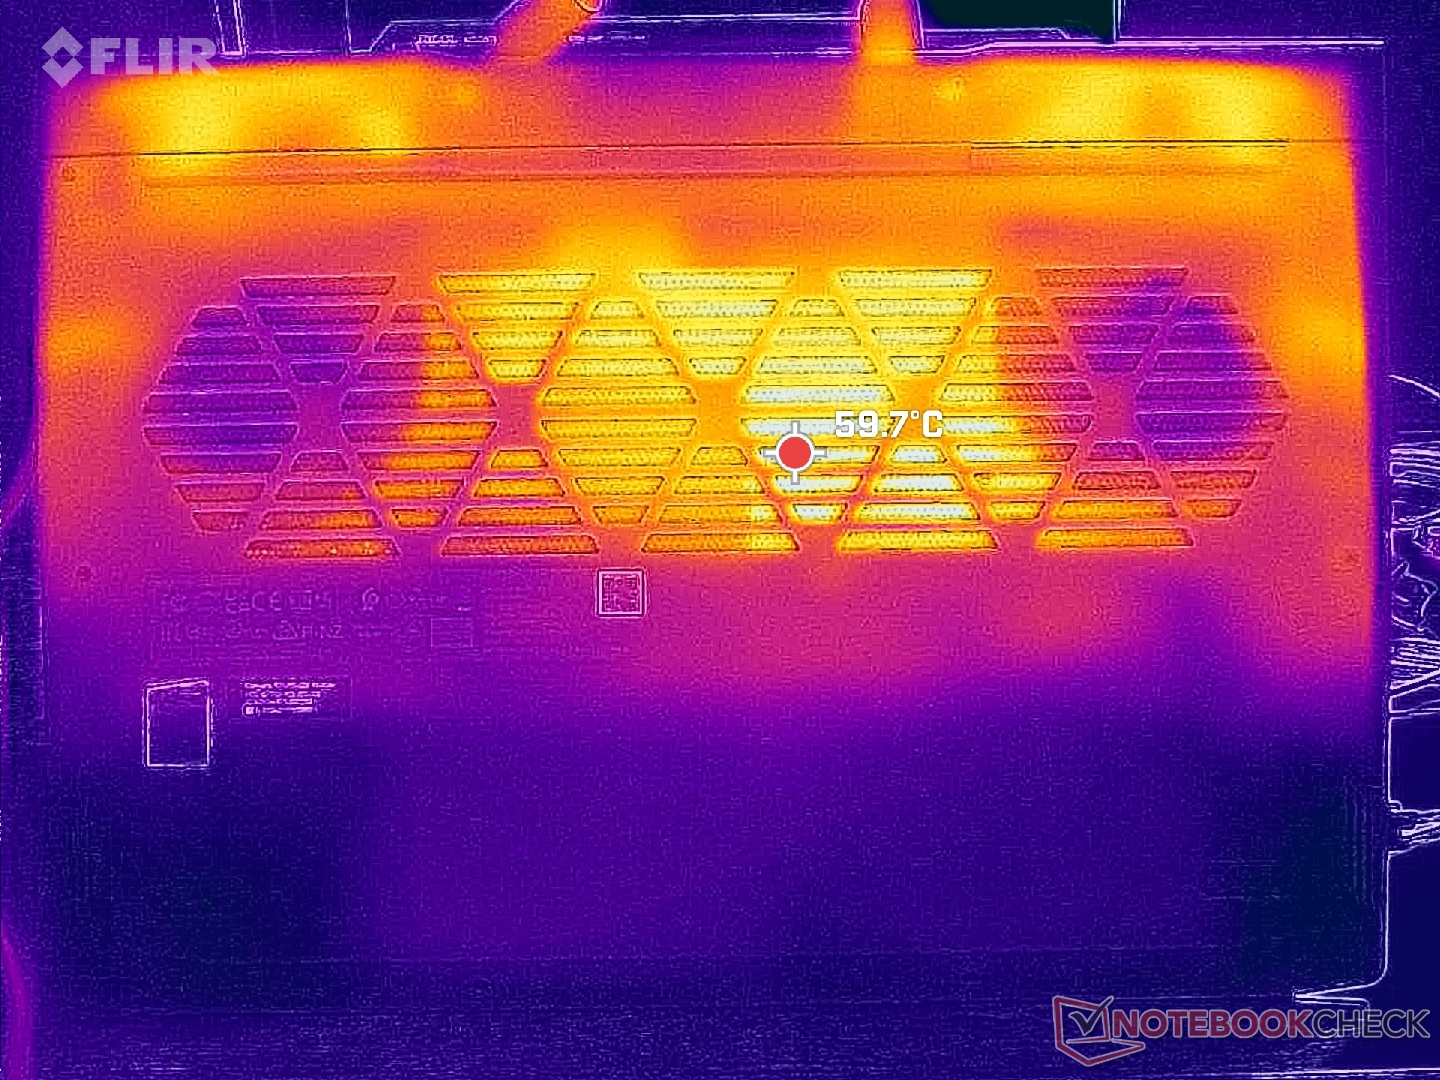
Les températures de surface sous charge peuvent être très élevées, jusqu'à 50°C, contre 38°C seulement pour le modèle HP Victus 15. Heureusement, les points chauds du LOQ 15 se trouvent à l'arrière, là où les doigts ne risquent pas d'entrer en contact avec le clavier. Les touches WASD, le pavé numérique et le repose-paume restent beaucoup plus froids que l'arrière et le centre du clavier lorsque l'on joue, comme le montrent les cartes de température ci-dessous.
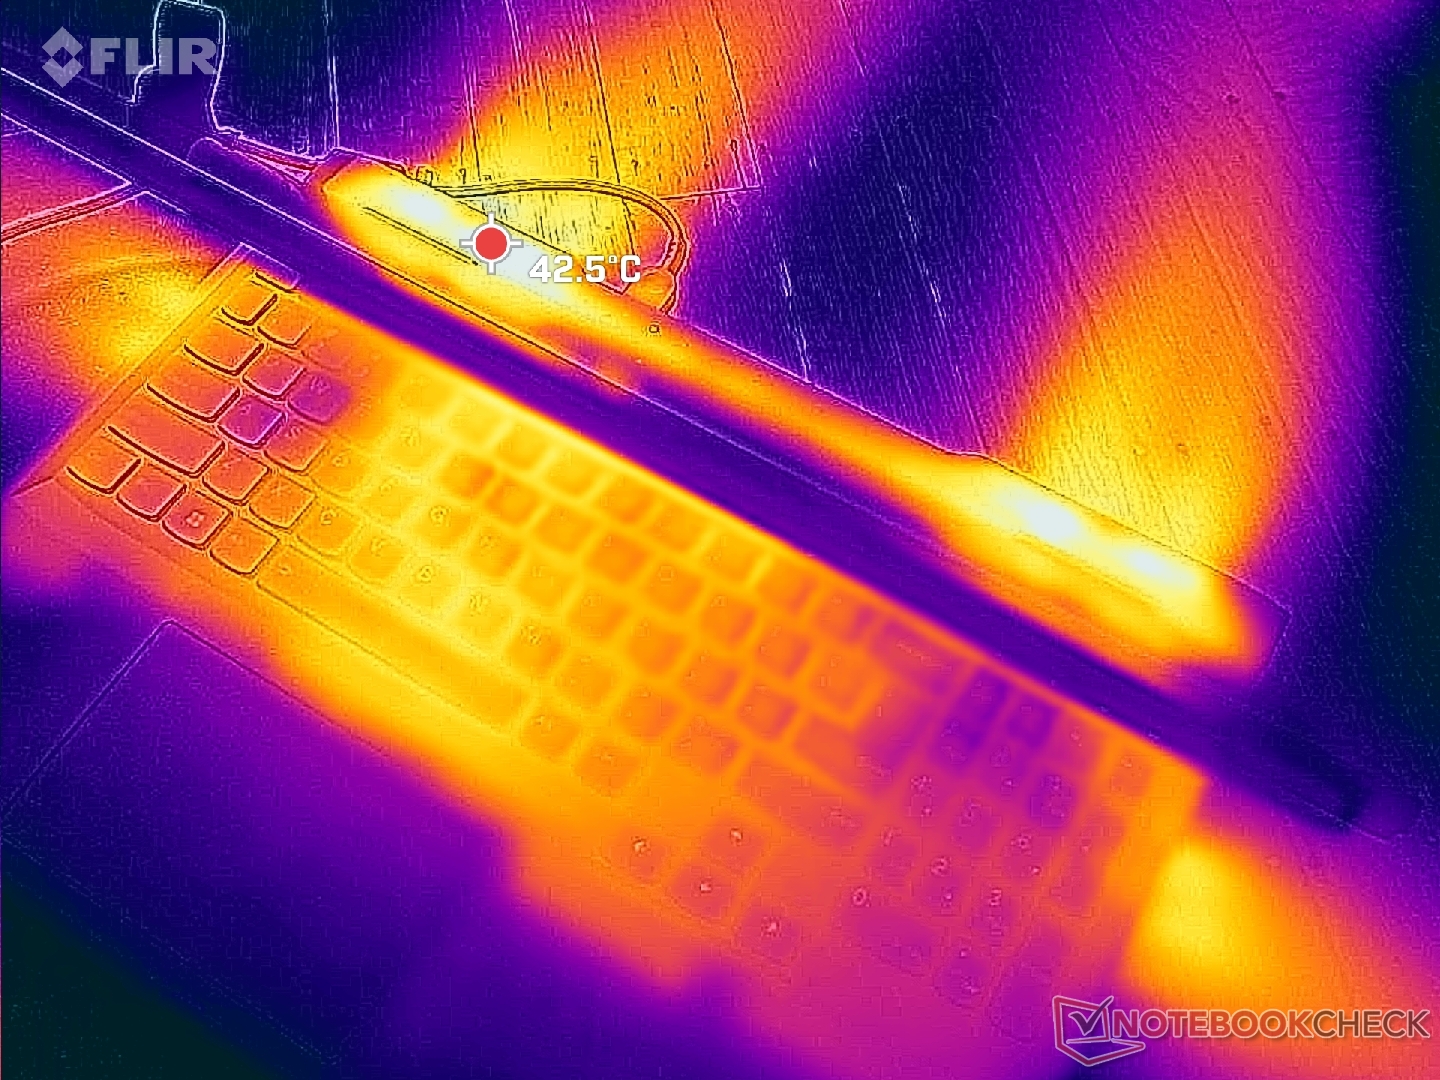
(±) La température maximale du côté supérieur est de 44.4 °C / 112 F, par rapport à la moyenne de 40.4 °C / 105 F, allant de 21.2 à 68.8 °C pour la classe Gaming.
(-) Le fond chauffe jusqu'à un maximum de 52 °C / 126 F, contre une moyenne de 43.2 °C / 110 F
(+) En utilisation inactive, la température moyenne du côté supérieur est de 25.1 °C / 77 F, par rapport à la moyenne du dispositif de 33.9 °C / 93 F.
(±) En jouant à The Witcher 3, la température moyenne du côté supérieur est de 32.7 °C / 91 F, alors que la moyenne de l'appareil est de 33.9 °C / 93 F.
(+) Les repose-poignets et le pavé tactile sont plus froids que la température de la peau avec un maximum de 30 °C / 86 F et sont donc froids au toucher.
(±) La température moyenne de la zone de l'appui-paume de dispositifs similaires était de 28.8 °C / 83.8 F (-1.2 °C / #-2.2 F).
| Lenovo LOQ 15APH8 AMD Ryzen 7 7840HS, NVIDIA GeForce RTX 4050 Laptop GPU | Lenovo Legion 5 15IAH7H 82RB Intel Core i7-12700H, NVIDIA GeForce RTX 3060 Laptop GPU | Dell G15 5530 Intel Core i7-13650HX, NVIDIA GeForce RTX 4060 Laptop GPU | Asus TUF A15 FA507 AMD Ryzen 7 7735HS, NVIDIA GeForce RTX 4050 Laptop GPU | MSI Cyborg 15 A12VF Intel Core i7-12650H, NVIDIA GeForce RTX 4060 Laptop GPU | HP Victus 15 fa0020nr Intel Core i7-12700H, NVIDIA GeForce RTX 3050 Ti Laptop GPU | |
|---|---|---|---|---|---|---|
| Heat | 7% | -19% | 4% | 7% | 23% | |
| Maximum Upper Side * (°C) | 44.4 | 37.8 15% | 54 -22% | 48.9 -10% | 47.5 -7% | 37.2 16% |
| Maximum Bottom * (°C) | 52 | 51 2% | 62.2 -20% | 44.6 14% | 35.5 32% | 35.4 32% |
| Idle Upper Side * (°C) | 28 | 25.8 8% | 33.4 -19% | 27.1 3% | 27.7 1% | 22.4 20% |
| Idle Bottom * (°C) | 29.6 | 28.8 3% | 33.4 -13% | 27.5 7% | 29.5 -0% | 22.6 24% |
* ... Moindre est la valeur, meilleures sont les performances
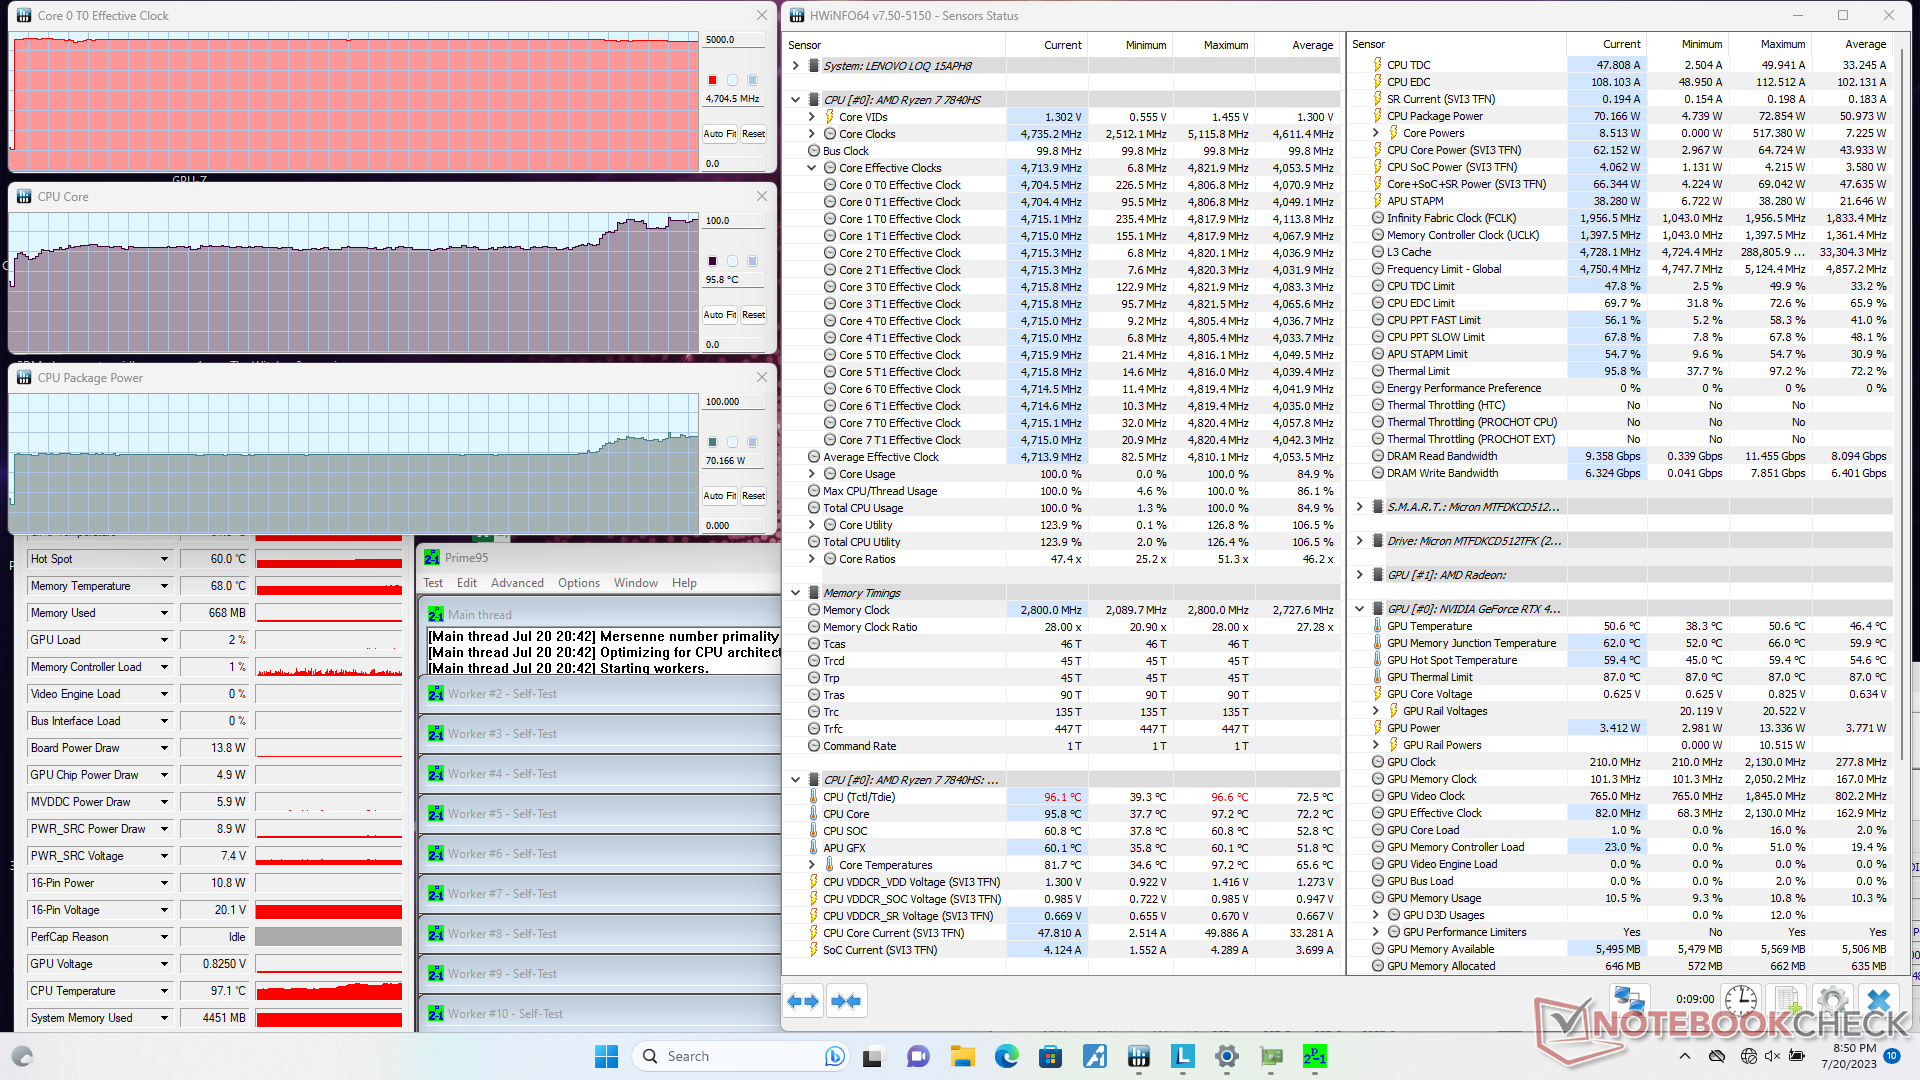
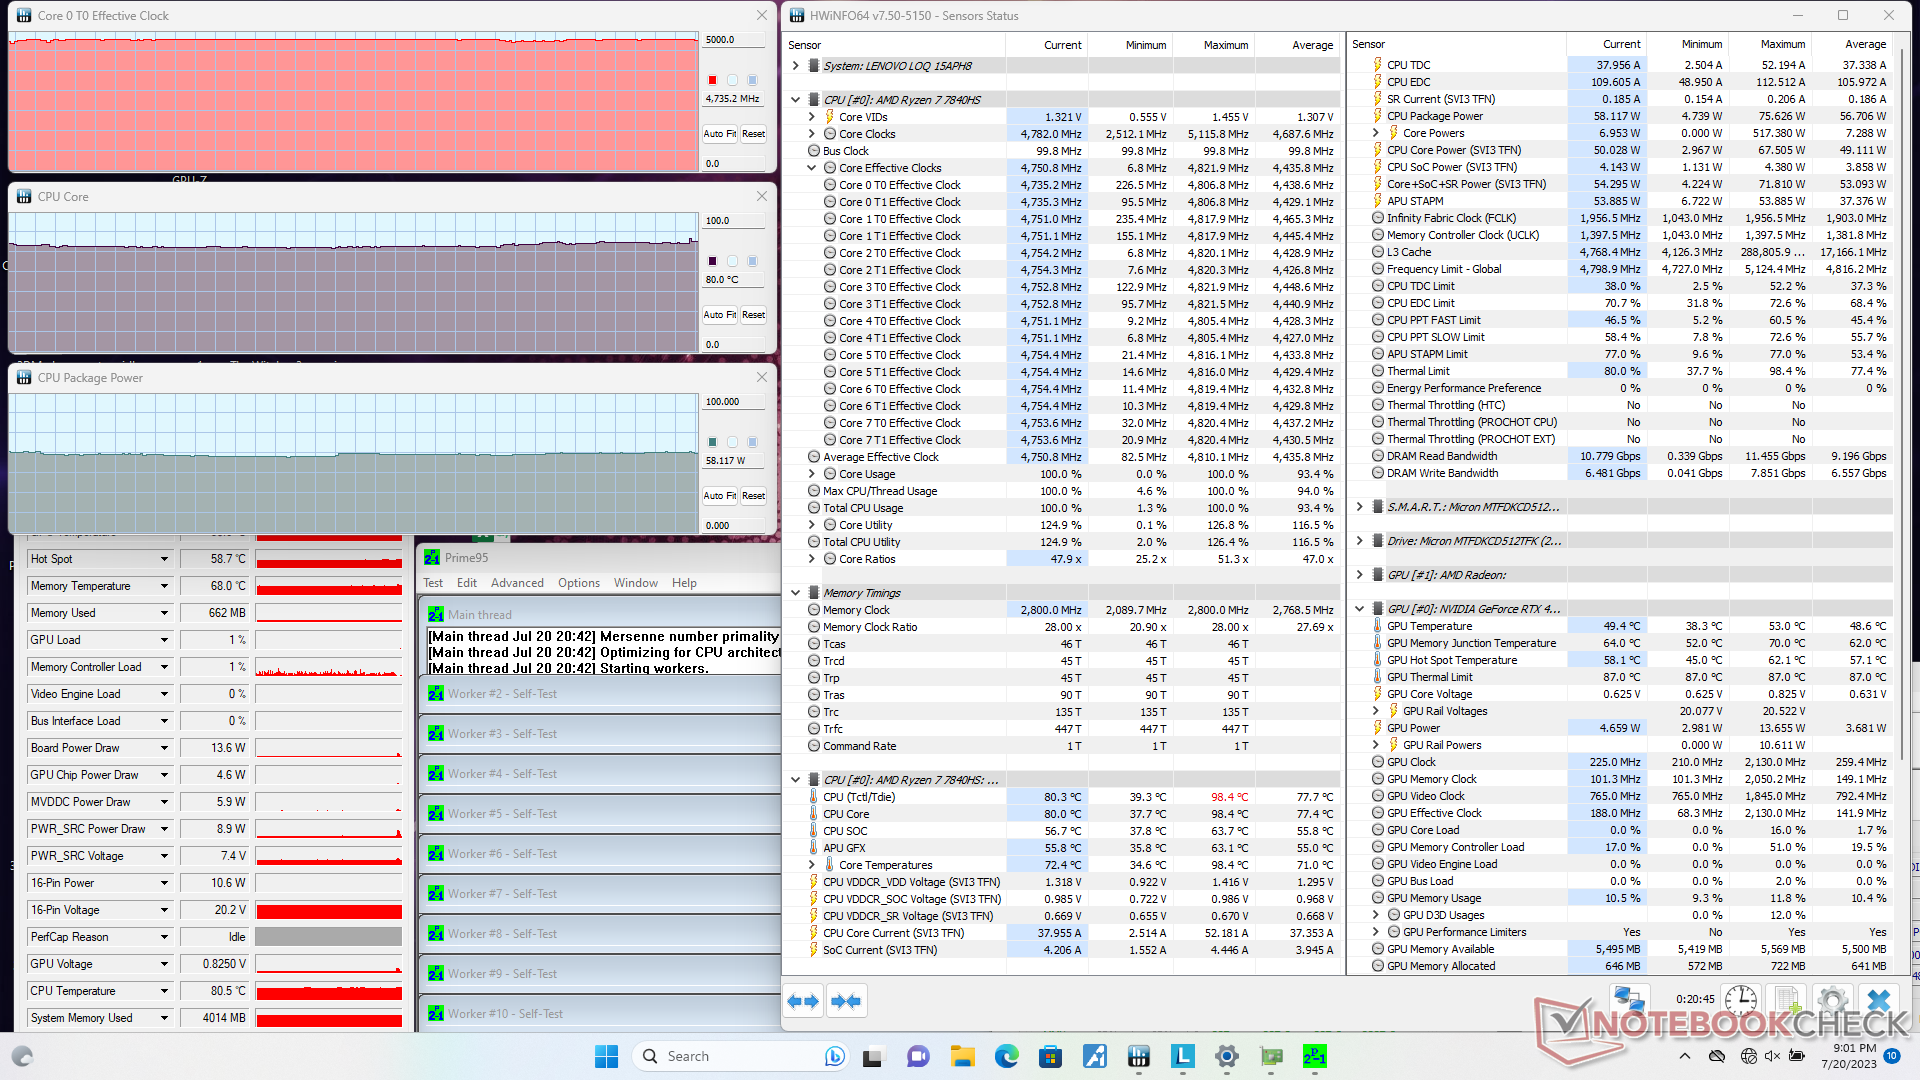
Test de stress
La fréquence d'horloge, la température et la consommation d'énergie du processeur atteignent respectivement 4,8 GHz, 75 °C et 58 W lors de l'exécution du test Prime95. La fréquence d'horloge et la consommation d'énergie de la carte sont soutenues sur de longues périodes, la température du cœur atteignant finalement un plateau à 80 °C, contre 76 °C sur le Victus 15.
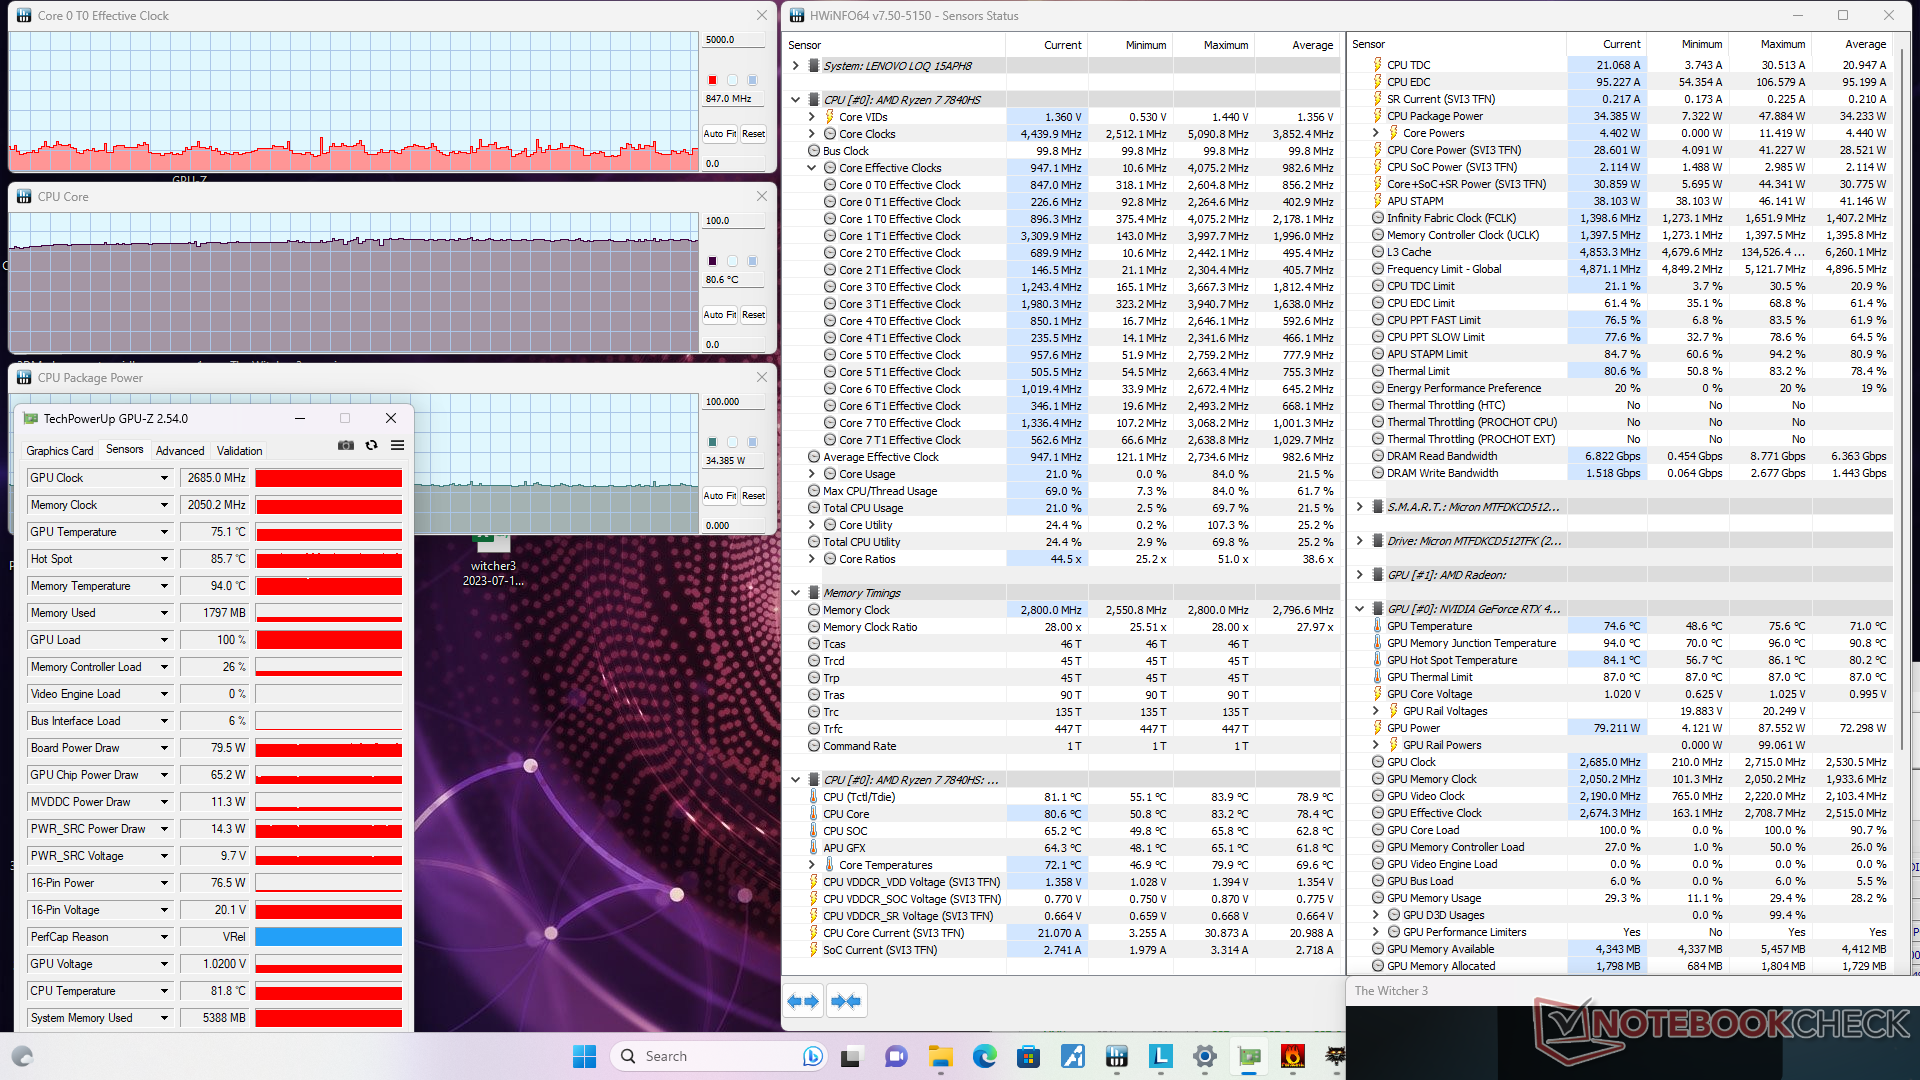
En exécutant Witcher 3 en mode Performance, le GPU Nvidia se stabilise à 2685 MHz, 75 C et 80 W. Il n'y a pas de changements significatifs en mode Équilibré, ce qui correspond à nos observations dans la section Performance du GPU ci-dessus. En revanche, la consommation d'énergie de la carte CPU diminuerait de 15 W. Le mode équilibré aurait donc un impact plus important sur les performances du CPU que sur celles du GPU.
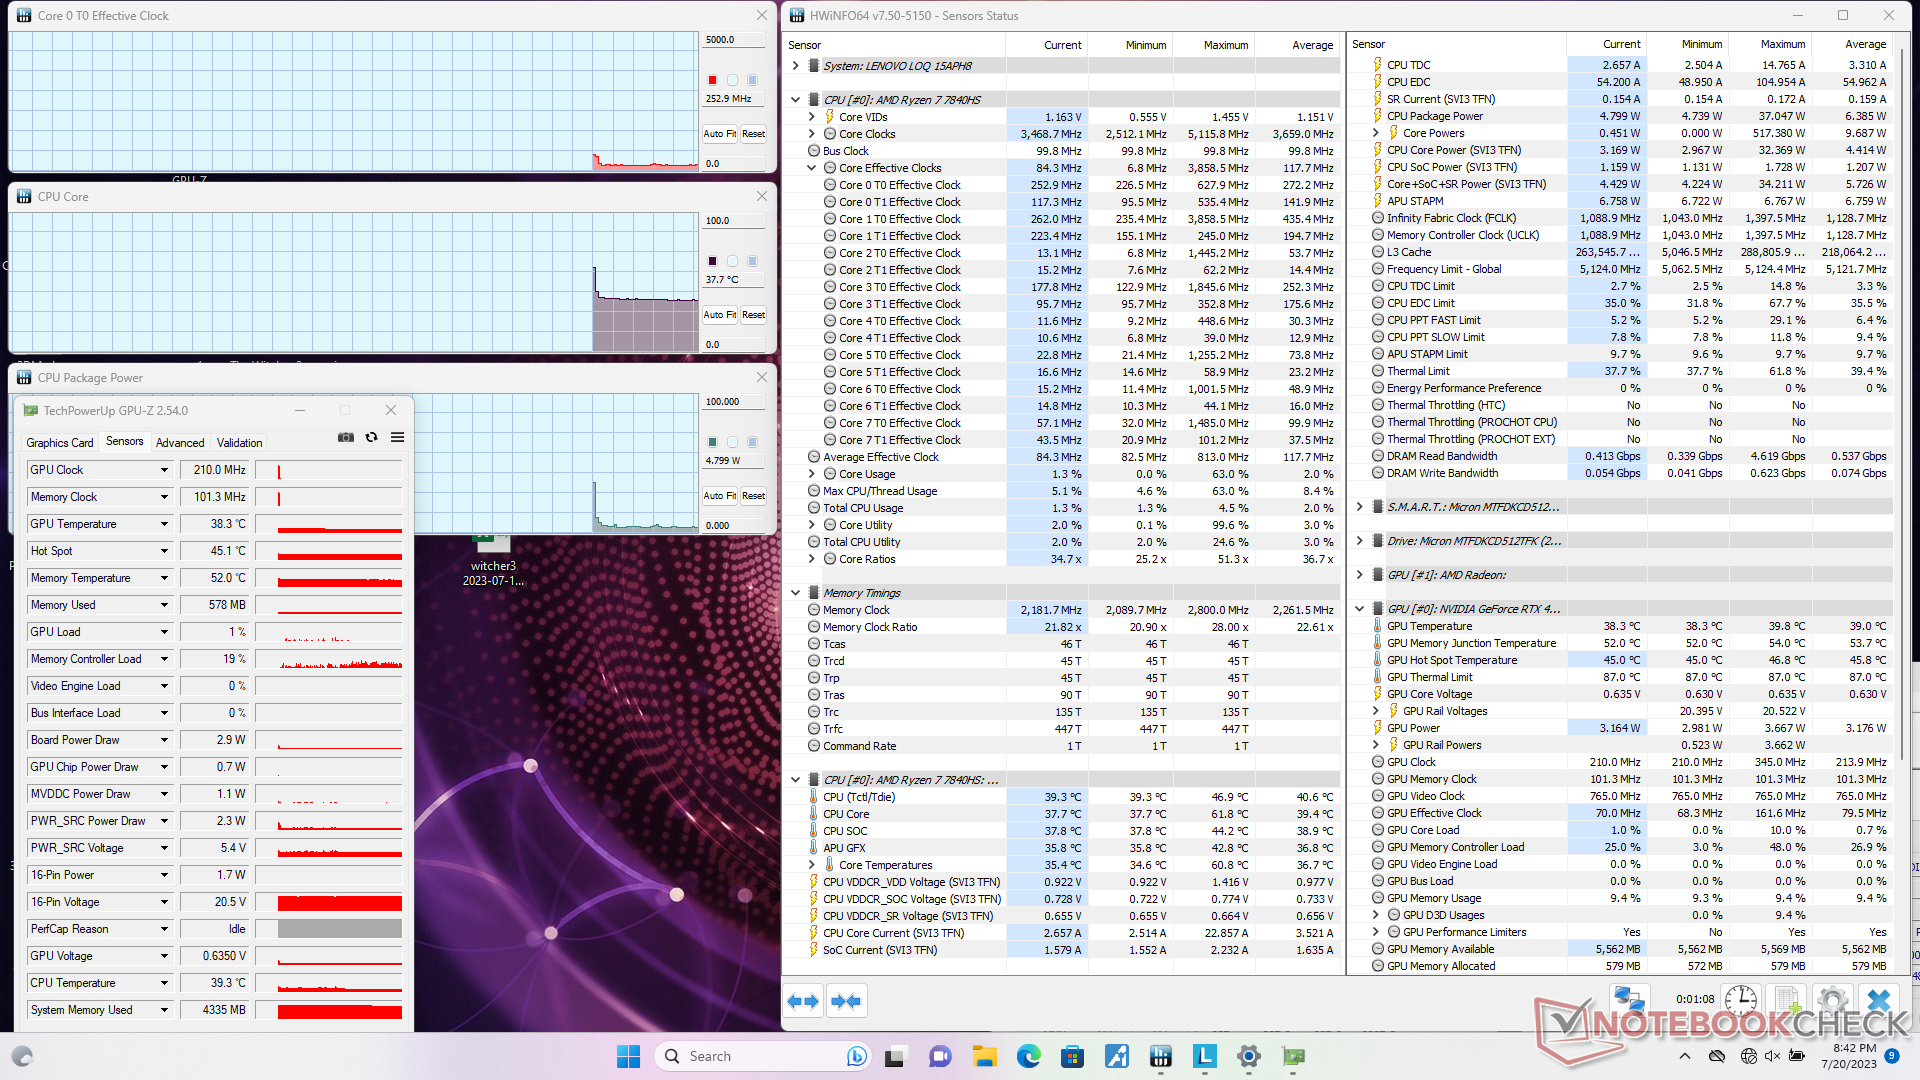
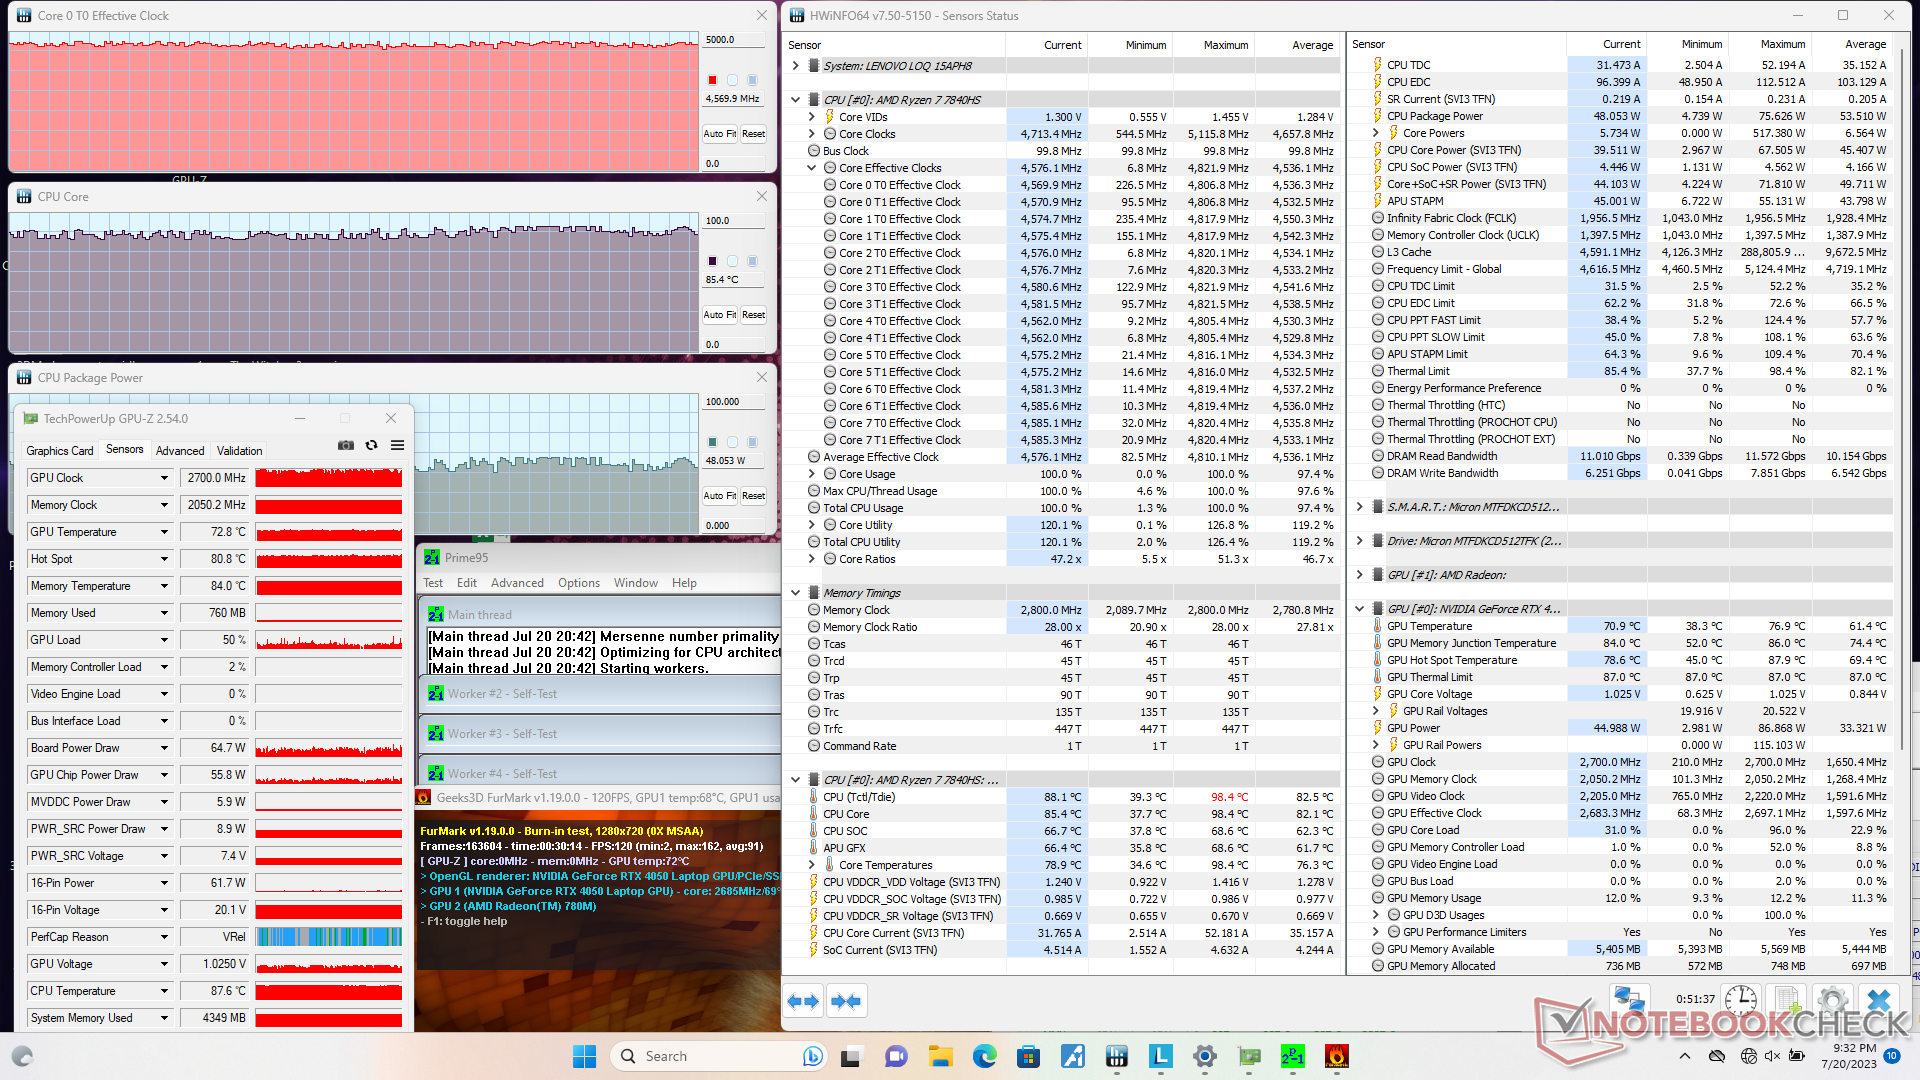

| Horloge du CPU (GHz) | Horloge du GPU (MHz) | Température moyenne du CPU (°C) | Température moyenne du GPU (°C) | |
| Système au repos | -- | -- | 37 | 38 |
| Prime95 Stress | 4.7 | -- | 80 | 49 |
| Prime95 + FurMark Stress | 4.5 | 2700 | 85 | 73 |
| Witcher 3 Stress(mode équilibré) | ~0.9 | 2685 | 69 | 73 |
| Witcher 3 Stress (mode Performance) | ~0,8 | 2685 | 81 | 75 |
Intervenants
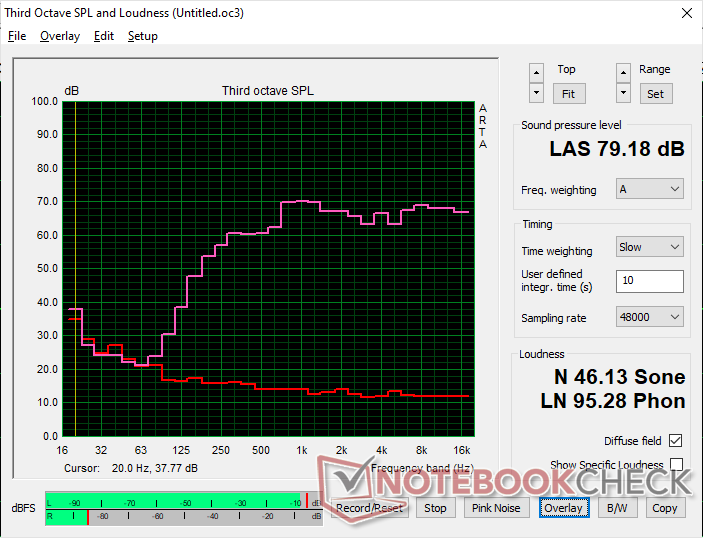
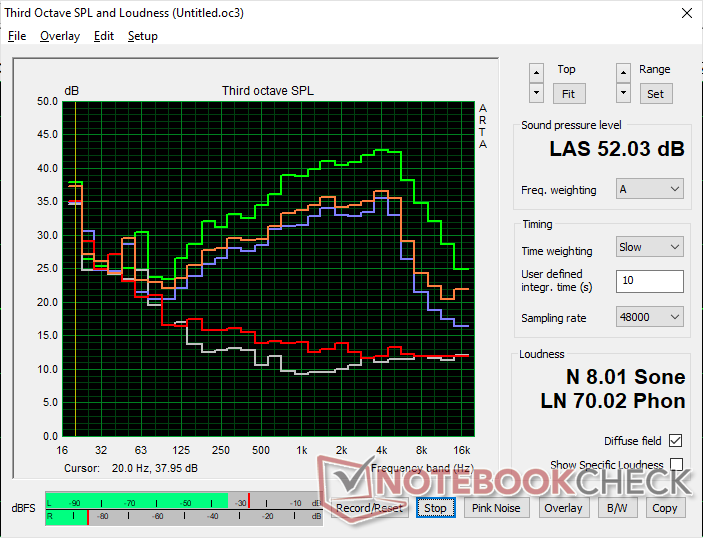
Lenovo LOQ 15APH8 analyse audio
(±) | le niveau sonore du haut-parleur est moyen mais bon (79.2# dB)
Basses 100 - 315 Hz
(-) | presque aucune basse - en moyenne 17.6% plus bas que la médiane
(±) | la linéarité des basses est moyenne (11.8% delta à la fréquence précédente)
Médiums 400 - 2000 Hz
(+) | médiane équilibrée - seulement 3.7% de la médiane
(+) | les médiums sont linéaires (3.1% delta à la fréquence précédente)
Aiguës 2 - 16 kHz
(+) | des sommets équilibrés - à seulement 1.9% de la médiane
(+) | les aigus sont linéaires (4.7% delta à la fréquence précédente)
Globalement 100 - 16 000 Hz
(+) | le son global est linéaire (14.3% différence à la médiane)
Par rapport à la même classe
» 26% de tous les appareils testés de cette catégorie étaient meilleurs, 7% similaires, 67% pires
» Le meilleur avait un delta de 6%, la moyenne était de 18%, le pire était de 132%.
Par rapport à tous les appareils testés
» 17% de tous les appareils testés étaient meilleurs, 4% similaires, 78% pires
» Le meilleur avait un delta de 4%, la moyenne était de 23%, le pire était de 134%.
Apple MacBook Pro 16 2021 M1 Pro analyse audio
(+) | les haut-parleurs peuvent jouer relativement fort (84.7# dB)
Basses 100 - 315 Hz
(+) | bonne basse - seulement 3.8% loin de la médiane
(+) | les basses sont linéaires (5.2% delta à la fréquence précédente)
Médiums 400 - 2000 Hz
(+) | médiane équilibrée - seulement 1.3% de la médiane
(+) | les médiums sont linéaires (2.1% delta à la fréquence précédente)
Aiguës 2 - 16 kHz
(+) | des sommets équilibrés - à seulement 1.9% de la médiane
(+) | les aigus sont linéaires (2.7% delta à la fréquence précédente)
Globalement 100 - 16 000 Hz
(+) | le son global est linéaire (4.6% différence à la médiane)
Par rapport à la même classe
» 0% de tous les appareils testés de cette catégorie étaient meilleurs, 0% similaires, 100% pires
» Le meilleur avait un delta de 5%, la moyenne était de 17%, le pire était de 45%.
Par rapport à tous les appareils testés
» 0% de tous les appareils testés étaient meilleurs, 0% similaires, 100% pires
» Le meilleur avait un delta de 4%, la moyenne était de 23%, le pire était de 134%.
Gestion de l'énergie - Combinaison CPU et GPU très efficace
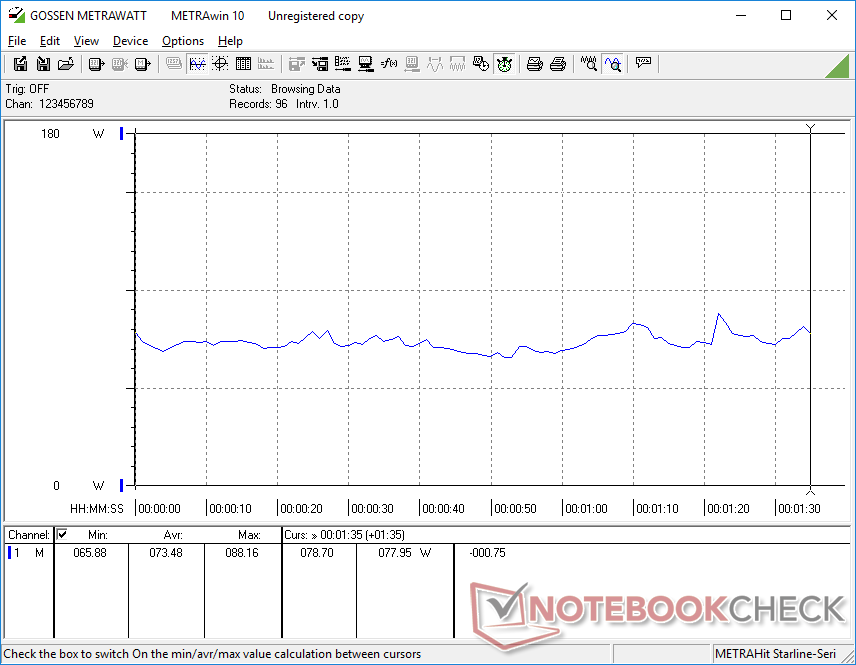
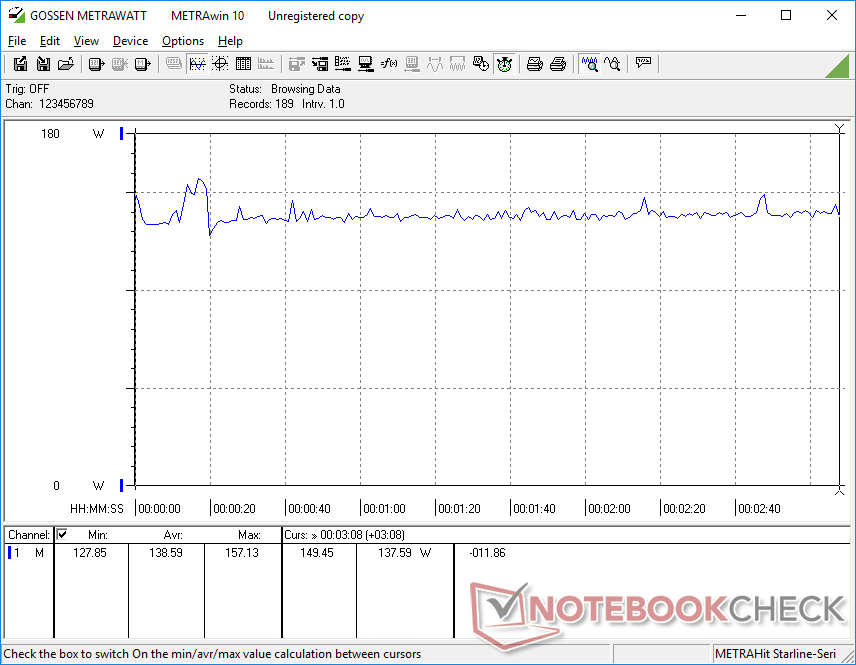
Consommation électrique
La consommation d'énergie pour les jeux est en fait très proche de celle de l'année dernière IdeaPad Gaming 3 15 de l'année dernière, malgré l'augmentation significative de 60 à 70 % des performances graphiques par rapport à la RTX 3050 Ti et de 15 à 20 % des performances du processeur par rapport au Core i5-12500H. Les gains de performance par watt sont donc excellents pour une machine de jeu à petit budget.
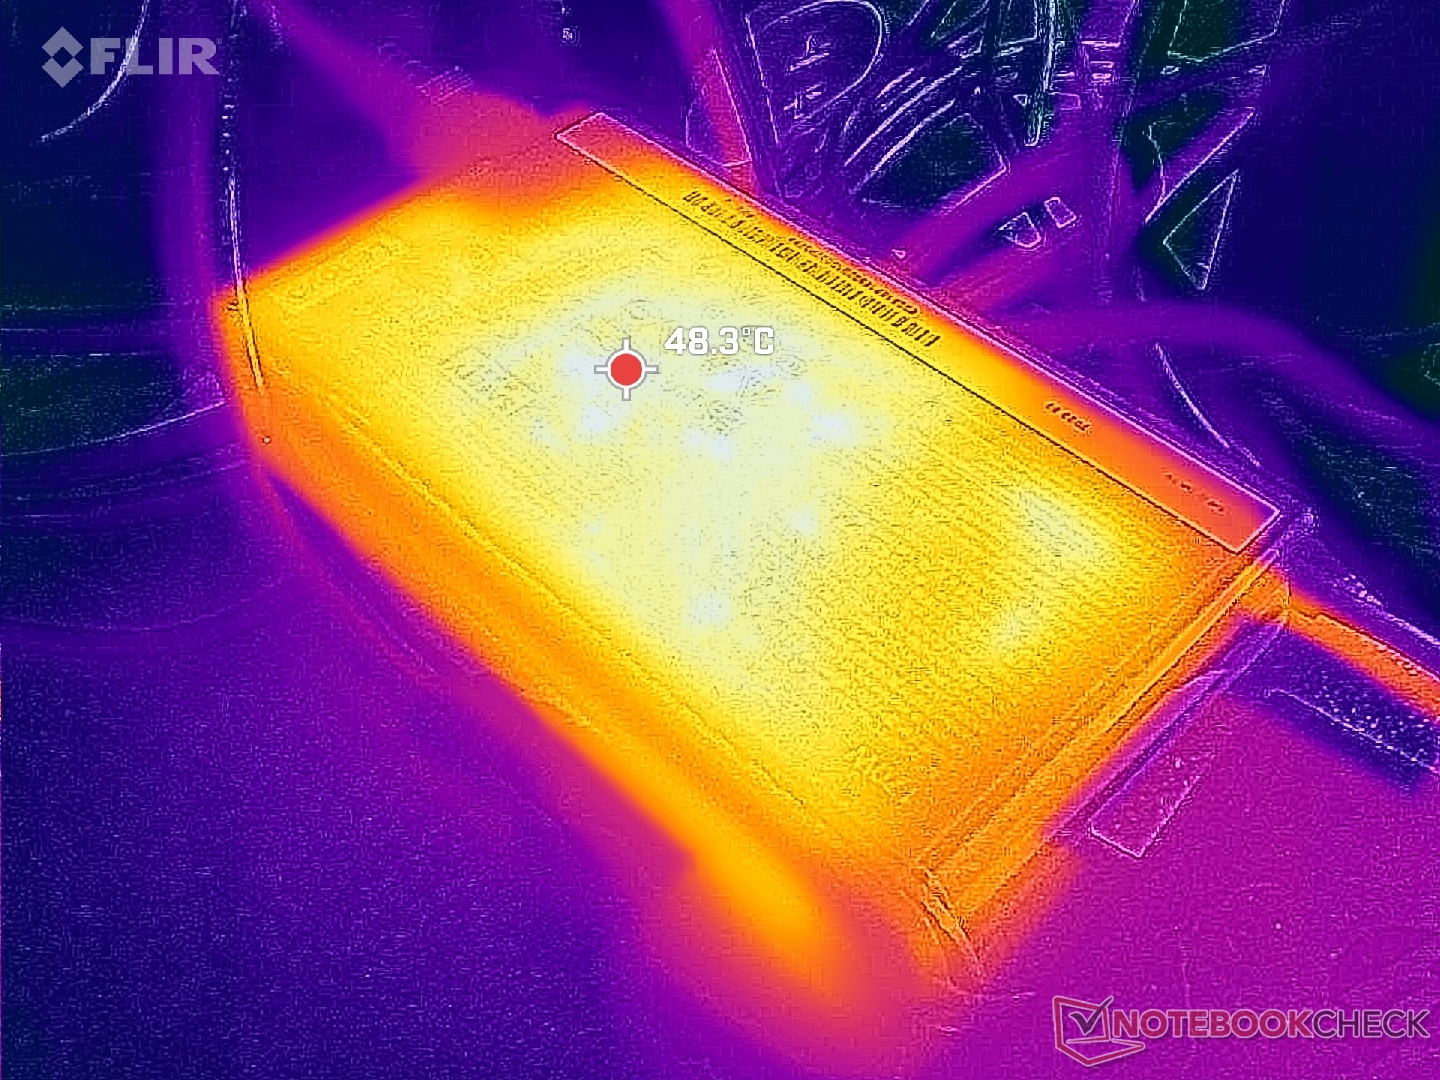
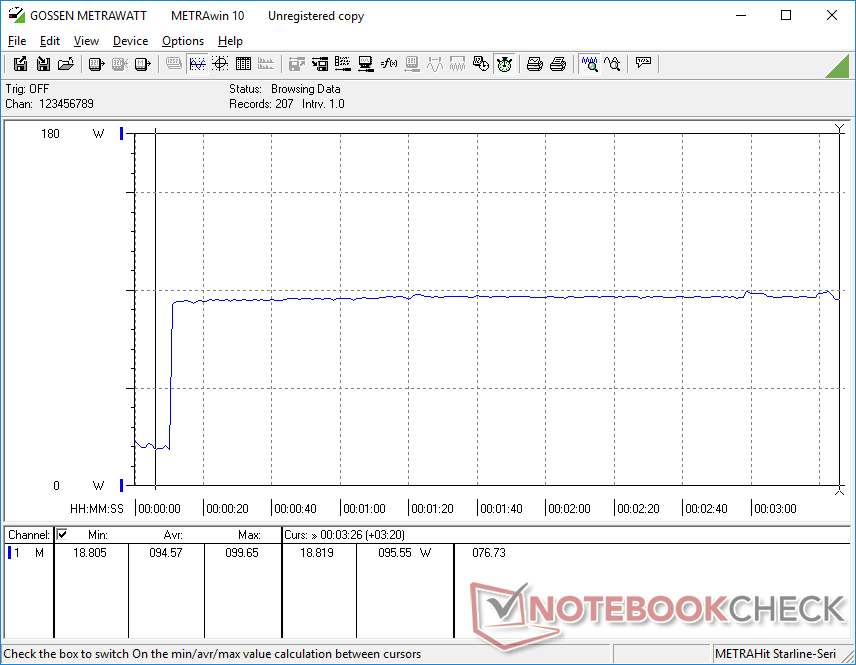
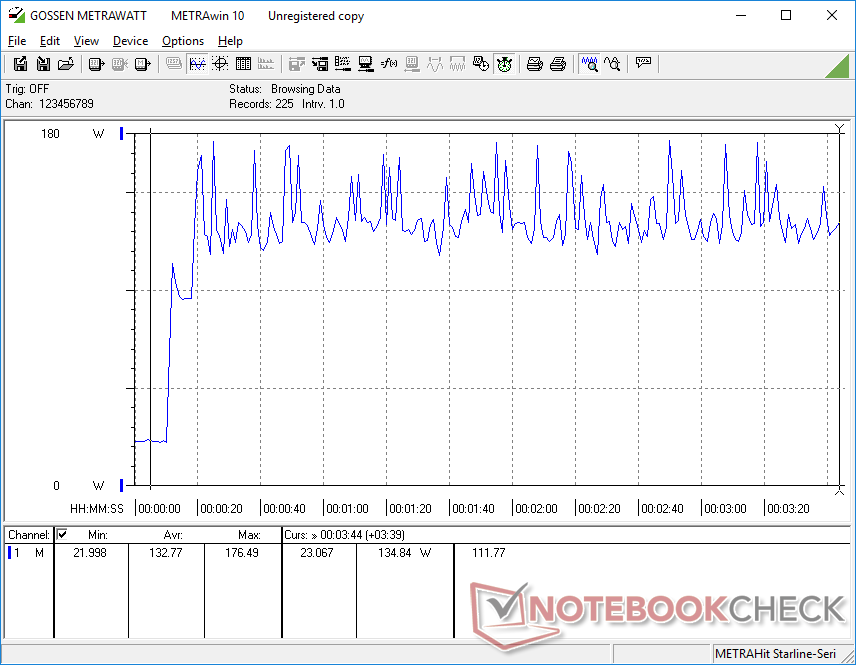
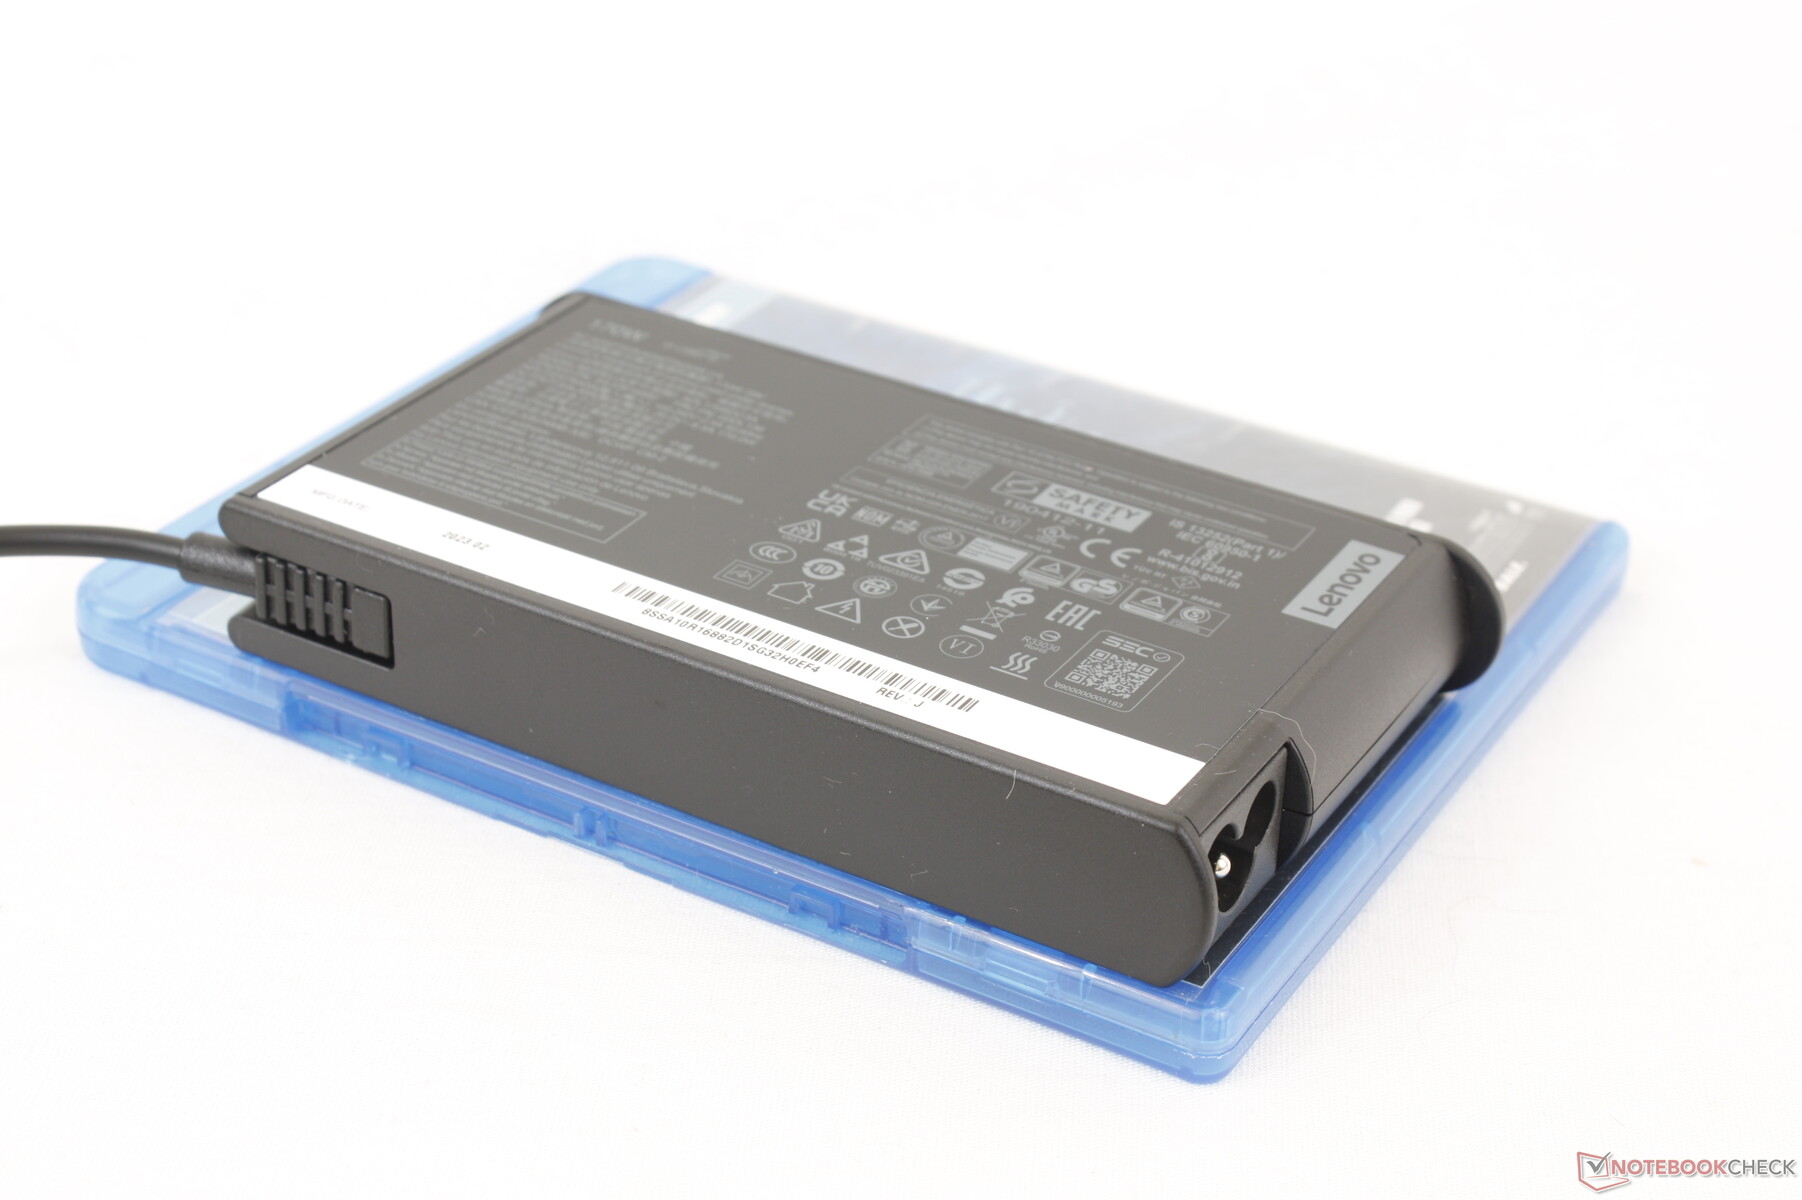
Nous avons pu enregistrer une consommation maximale de 177 W sur l'adaptateur secteur de taille moyenne (~15 x 7,8 x 2,3 cm) de 170 W lorsque le CPU et le GPU sont utilisés à 100 %. Le taux de charge sera donc plus lent si l'on utilise simultanément des charges élevées comme des jeux.
| Éteint/en veille | |
| Au repos | |
| Fortement sollicité |
|
Légende:
min: | |
| Lenovo LOQ 15APH8 R7 7840HS, GeForce RTX 4050 Laptop GPU, Micron 2450 512GB MTFDKCD512TFK, IPS, 1920x1080, 15.6" | Lenovo Legion 5 15IAH7H 82RB i7-12700H, GeForce RTX 3060 Laptop GPU, , IPS, 1920x1080, 15.6" | Dell G15 5530 i7-13650HX, GeForce RTX 4060 Laptop GPU, SSTC CL4-3D512-Q11, IPS, 1920x1080, 15.6" | Asus TUF A15 FA507 R7 7735HS, GeForce RTX 4050 Laptop GPU, Micron 2400 MTFDKBA512QFM, IPS, 1920x1080, 15.6" | MSI Cyborg 15 A12VF i7-12650H, GeForce RTX 4060 Laptop GPU, Samsung PM9B1 1024GB MZVL41T0HBLB, IPS, 1920x1080, 15.6" | HP Victus 15 fa0020nr i7-12700H, GeForce RTX 3050 Ti Laptop GPU, Samsung PM9A1 MZVL2512HCJQ, IPS, 1920x1080, 15.6" | |
|---|---|---|---|---|---|---|
| Power Consumption | -55% | -6% | 19% | 36% | 10% | |
| Idle Minimum * (Watt) | 15 | 19.8 -32% | 8.4 44% | 8 47% | 6 60% | 5.1 66% |
| Idle Average * (Watt) | 17.7 | 26.2 -48% | 14.98 15% | 12.1 32% | 8.8 50% | 15.1 15% |
| Idle Maximum * (Watt) | 21.5 | 48.2 -124% | 15.56 28% | 12.5 42% | 11.9 45% | 18.9 12% |
| Load Average * (Watt) | 73.5 | 102.9 -40% | 96.8 -32% | 74.9 -2% | 89 -21% | 114.5 -56% |
| Witcher 3 ultra * (Watt) | 138.6 | 186.7 -35% | 186 -34% | 136.6 1% | 90.3 35% | 113.9 18% |
| Load Maximum * (Watt) | 176.5 | 268 -52% | 271.42 -54% | 185 -5% | 99 44% | 165.8 6% |
* ... Moindre est la valeur, meilleures sont les performances
Power Consumption Witcher 3 / Stresstest
Power Consumption external Monitor
Autonomie de la batterie
Notre batterie de 60 Wh est relativement petite, car la plupart des autres ordinateurs portables de jeu de 15 pouces sont équipés de batteries de 70 Wh ou plus. Néanmoins, les durées d'utilisation restent respectables avec près de 7,5 heures de navigation WLAN dans le monde réel, ce qui est comparable auCyborg 15.
Le chargement de la batterie à pleine capacité à l'aide de l'adaptateur secteur fourni est très rapide : environ 45 minutes, soit deux fois plus vite que sur la plupart des autres ordinateurs portables de jeu. La fonction Lenovo Rapid Charge est activée par défaut via le logiciel Vantage.
Le système peut être rechargé via USB-C, mais la compatibilité avec la plupart des adaptateurs secteur USB-C n'est pas garantie. Lenovo vend son propre adaptateur secteur USB-C de 140 W qui devrait être compatible avec la plupart des ordinateurs portables Lenovo.
| Lenovo LOQ 15APH8 R7 7840HS, GeForce RTX 4050 Laptop GPU, 60 Wh | Lenovo Legion 5 15IAH7H 82RB i7-12700H, GeForce RTX 3060 Laptop GPU, 80 Wh | Dell G15 5530 i7-13650HX, GeForce RTX 4060 Laptop GPU, 86 Wh | Asus TUF A15 FA507 R7 7735HS, GeForce RTX 4050 Laptop GPU, 90 Wh | MSI Cyborg 15 A12VF i7-12650H, GeForce RTX 4060 Laptop GPU, 53.5 Wh | HP Victus 15 fa0020nr i7-12700H, GeForce RTX 3050 Ti Laptop GPU, 70 Wh | |
|---|---|---|---|---|---|---|
| Autonomie de la batterie | -16% | -20% | 25% | 50% | -48% | |
| Reader / Idle (h) | 9.8 | 8.1 -17% | 13.6 39% | 2.6 -73% | ||
| WiFi v1.3 (h) | 7.4 | 5 -32% | 6.5 -12% | 11.7 58% | 7.5 1% | 2.1 -72% |
| Load (h) | 1.1 | 1.1 0% | 0.8 -27% | 1 -9% | 2.3 109% | 1.1 0% |
| H.264 (h) | 6.8 | 12.5 | 8 | |||
| Witcher 3 ultra (h) | 0.8 |
Points positifs
Points négatifs
Verdict - Ryzen 7 7840HS et GeForce RTX 4050 : un équilibre parfait
Pour une machine de jeu à petit budget dotée de seulement 8 Go de mémoire vive évolutive, le Lenovo LOQ 15 est plus performant que prévu et offre d'excellentes performances par watt par rapport aux ordinateurs portables de jeu équipés de processeurs Core-H de 12e génération, tels que l'IdeaPad Gaming 15 ou l'IdeaPad Gaming 15.HP Victus 15. Son écran 1080p G-Sync s'associe très bien avec la GeForce RTX 4050 pour des jeux fluides à 60 FPS sur des titres modernes, ce qui est un objectif raisonnable pour n'importe quel portable de jeu bon marché.
Le châssis en plastique et les 8 Go de RAM sont un peu décevants, mais la facilité de mise à niveau et la rapidité des performances pour le prix aident le LOQ 15 à se hisser au-dessus des autres dans la catégorie des ordinateurs portables à moins de 1000 USD.
Le principal inconvénient du LOQ 15 est sa gamme de couleurs limitée et ses temps de réponse moyens en noir-blanc et gris-gris. L'option d'un écran 1440p plus haut de gamme répond à ces préoccupations, mais l'augmentation de prix qui s'ensuivrait deviendrait alors terriblement proche d'un modèle Legion 5 et la proposition de valeur du LOQ 15 commencerait à diminuer. Le prix de 1000 USD ou moins est le point idéal pour le LOQ 15, d'autant plus que le Ryzen 7 7840HS et le GeForce RTX 4050 sont au coude à coude avec le Core i7-12700H et le RTX 3060 qui équipaient de nombreux ordinateurs portables de jeu en 2022, vendus à plus de 1500 USD. Les principaux fabricants concurrents comme MSI, HP ou Asus n'ont pas encore proposé d'ordinateurs portables de jeu abordables avec les mêmes options Ryzen 7 7840HS à l'heure où nous écrivons ces lignes.
Prix et disponibilité
Best Buy livre actuellement le Lenovo LOQ 15 dans notre configuration exacte au prix de 1100 USD. Lenovo propose d'autres configurations directement sur son site web à des prix inférieurs.
Lenovo LOQ 15APH8
- 07/26/2023 v7 (old)
Allen Ngo
Transparency
La sélection des appareils à examiner est effectuée par notre équipe éditoriale. L'échantillon de test a été prêté à l'auteur par le fabricant ou le détaillant pour les besoins de cet examen. Le prêteur n'a pas eu d'influence sur cette évaluation et le fabricant n'a pas reçu de copie de cette évaluation avant sa publication. Il n'y avait aucune obligation de publier cet article. En tant que média indépendant, Notebookcheck n'est pas soumis à l'autorité des fabricants, des détaillants ou des éditeurs.
Voici comment Notebookcheck teste
Chaque année, Notebookcheck examine de manière indépendante des centaines d'ordinateurs portables et de smartphones en utilisant des procédures standardisées afin de garantir que tous les résultats sont comparables. Nous avons continuellement développé nos méthodes de test depuis environ 20 ans et avons établi des normes industrielles dans le processus. Dans nos laboratoires de test, des équipements de mesure de haute qualité sont utilisés par des techniciens et des rédacteurs expérimentés. Ces tests impliquent un processus de validation en plusieurs étapes. Notre système d'évaluation complexe repose sur des centaines de mesures et de points de référence bien fondés, ce qui garantit l'objectivité.Price comparison

