Test du Lenovo ThinkPad P16 G1 : station de travail HX55 puissante et nouvellement conçue
Depuis 2015, Lenovo propose deux modèles sur le segment des stations de travail classiques et mobiles, où l'accent est principalement mis sur les performances. Plus récemment, ces modèles ont porté le nom de .Lenovo ThinkPad P15 Gen 2et leLenovo ThinkPad P17 Gen 2. Comme leur nom l'indique, chaque appareil était doté d'un écran de 15 et 17 pouces. En 2022, Lenovo a décidé de mettre fin à cette dualité de stations de travail et propose désormais une seule station de travail mobile complète : le Lenovo ThinkPad P16 Gen 1, qui remplace les deux modèles précédents. Une comparaison avec ses concurrents directs de Dell et Asus permettra notamment de voir comment il se positionne par rapport aux appareils similaires où les performances mobiles sont une priorité.
Comparaison avec les concurrents potentiels
Note | Date | Modèle | Poids | Épaisseur | Taille | Résolution | Prix |
|---|---|---|---|---|---|---|---|
| 88.2 % v7 (old) | 02/23 | Lenovo ThinkPad P16 G1 21D6001DMB i7-12850HX, RTX A2000 Laptop GPU | 3 kg | 30.23 mm | 16.00" | 2560x1600 | |
| 87.2 % v7 (old) | 10/21 | Lenovo ThinkPad P15 G2-20YQ001JGE i7-11800H, RTX A3000 Laptop GPU | 2.9 kg | 31.5 mm | 15.60" | 1920x1080 | |
| 87.8 % v7 (old) | 10/21 | Lenovo ThinkPad P17 G2-20YU0025G i7-11800H, RTX A2000 Laptop GPU | 3.6 kg | 28.38 mm | 17.30" | 1920x1080 | |
| 89.7 % v7 (old) | 02/22 | HP ZBook Fury 17 G8-4A6A9EA i9-11950H, RTX A3000 Laptop GPU | 2.9 kg | 27 mm | 17.30" | 3840x2160 | |
| 88.4 % v7 (old) | 10/22 | Dell Precision 7670 i7-12850HX, RTX A2000 Laptop GPU | 2.7 kg | 24.7 mm | 16.00" | 3840x2400 | |
| 89.6 % v7 (old) | 01/23 | Asus ExpertBook B6 Flip B6602FC2 i9-12950HX, RTX A2000 Laptop GPU | 2.8 kg | 27.2 mm | 16.00" | 2560x1600 |
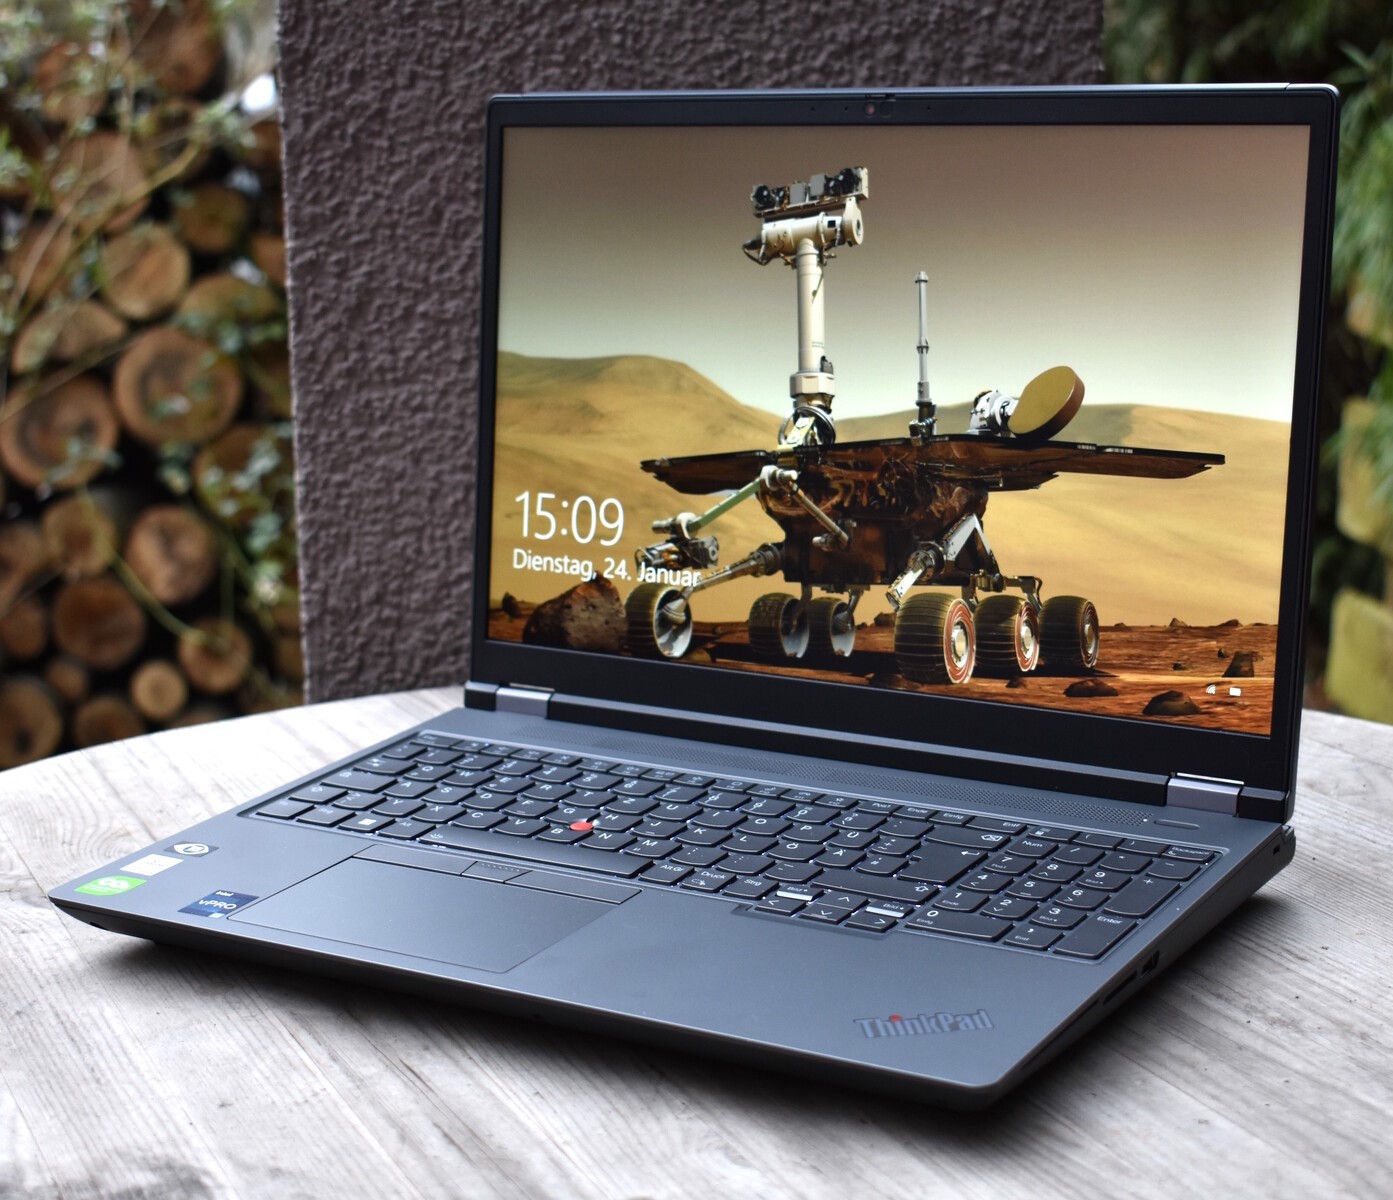
Boîtier : Un couvercle gris en aluminium avec un cadre en magnésium
Depuis la création de la série ThinkPad P, leP15et P17étaient la représentation la plus classique du design des ThinkPad. Avec leurs boîtiers en plastique au cadre en magnésium et leur mécanisme de charnière classique à la base, ce sont les ordinateurs portables ThinkPad qui se rapprochent le plus de modèles tels que le classiqueLenovo ThinkPad T60. Pour les fans de ThinkPad, il s'agit certainement d'une caractéristique positive, mais le design pourrait également être considéré comme ayant dépassé sa date de péremption, notamment en ce qui concerne les grands bords de l'écran.
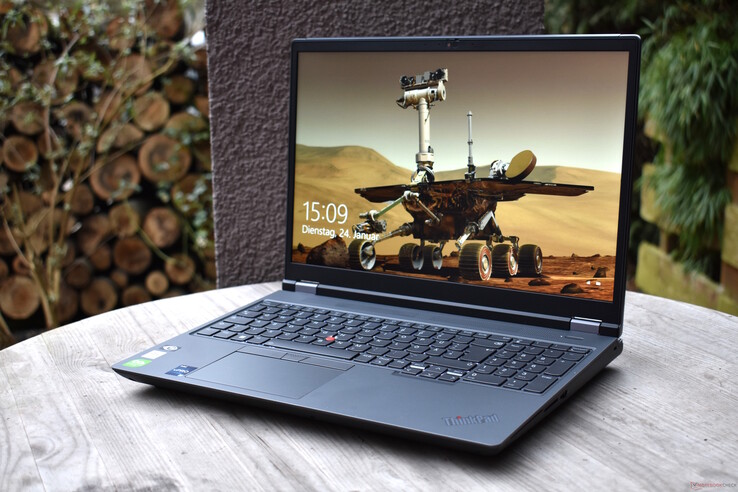
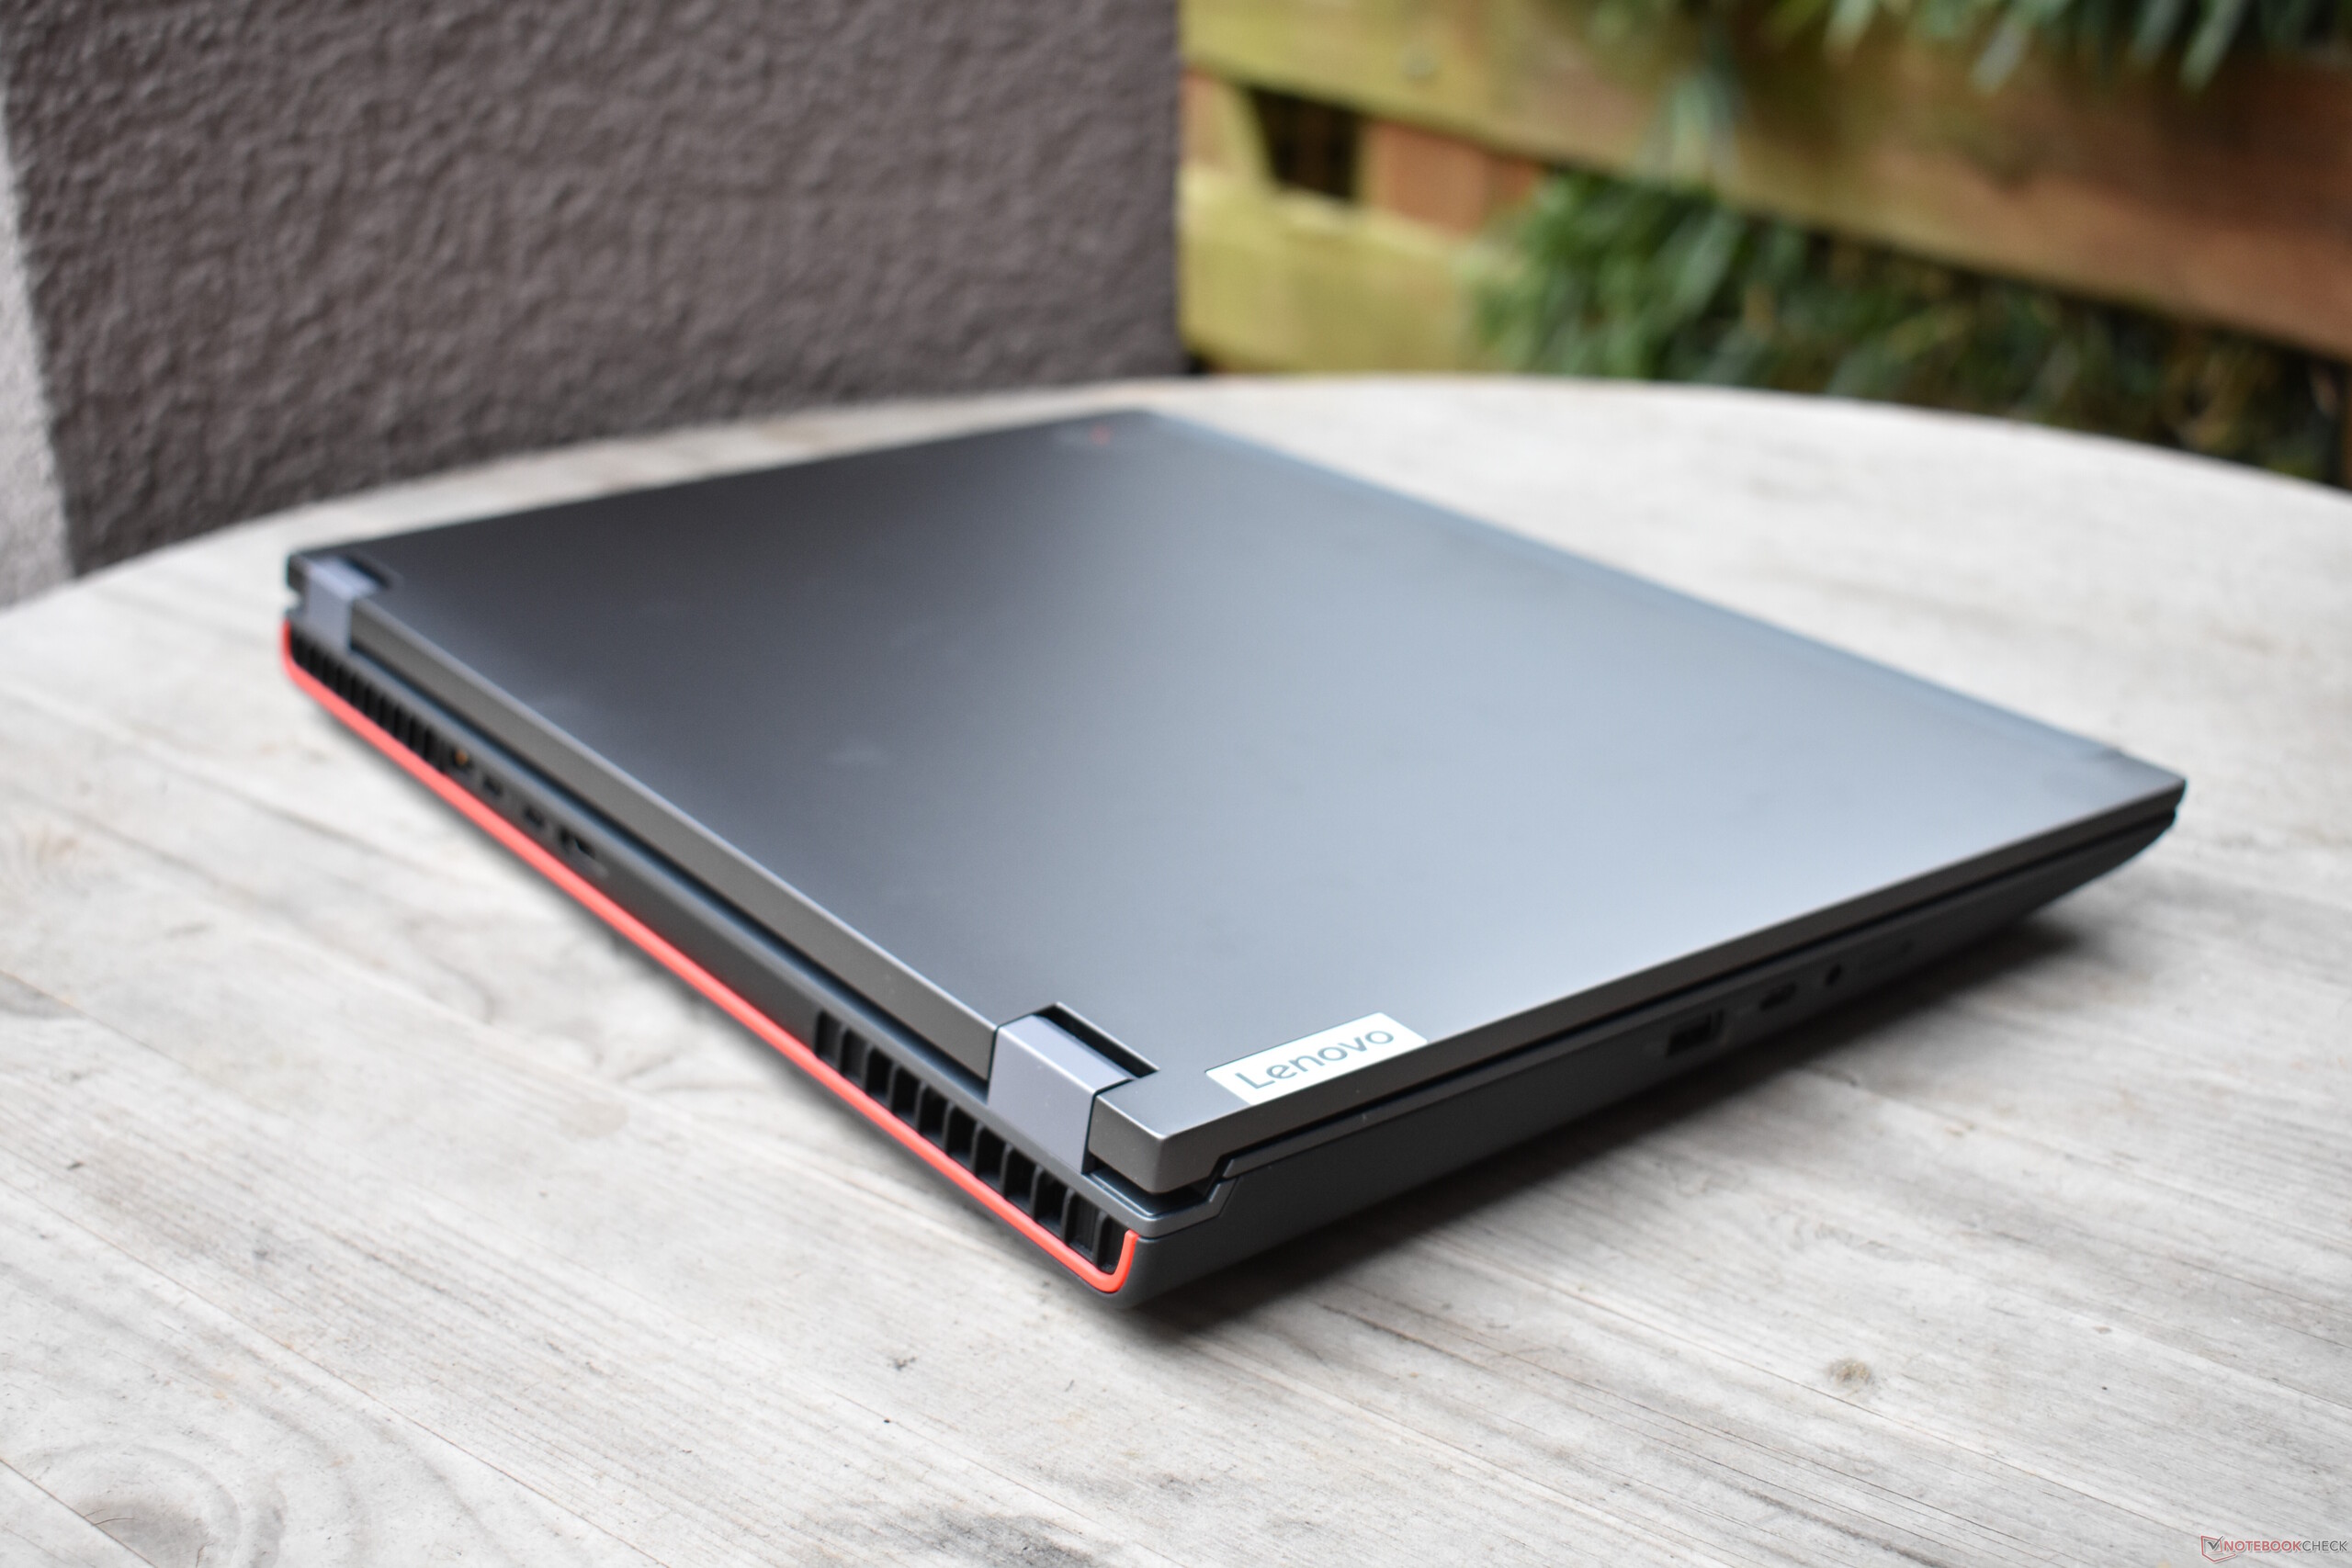
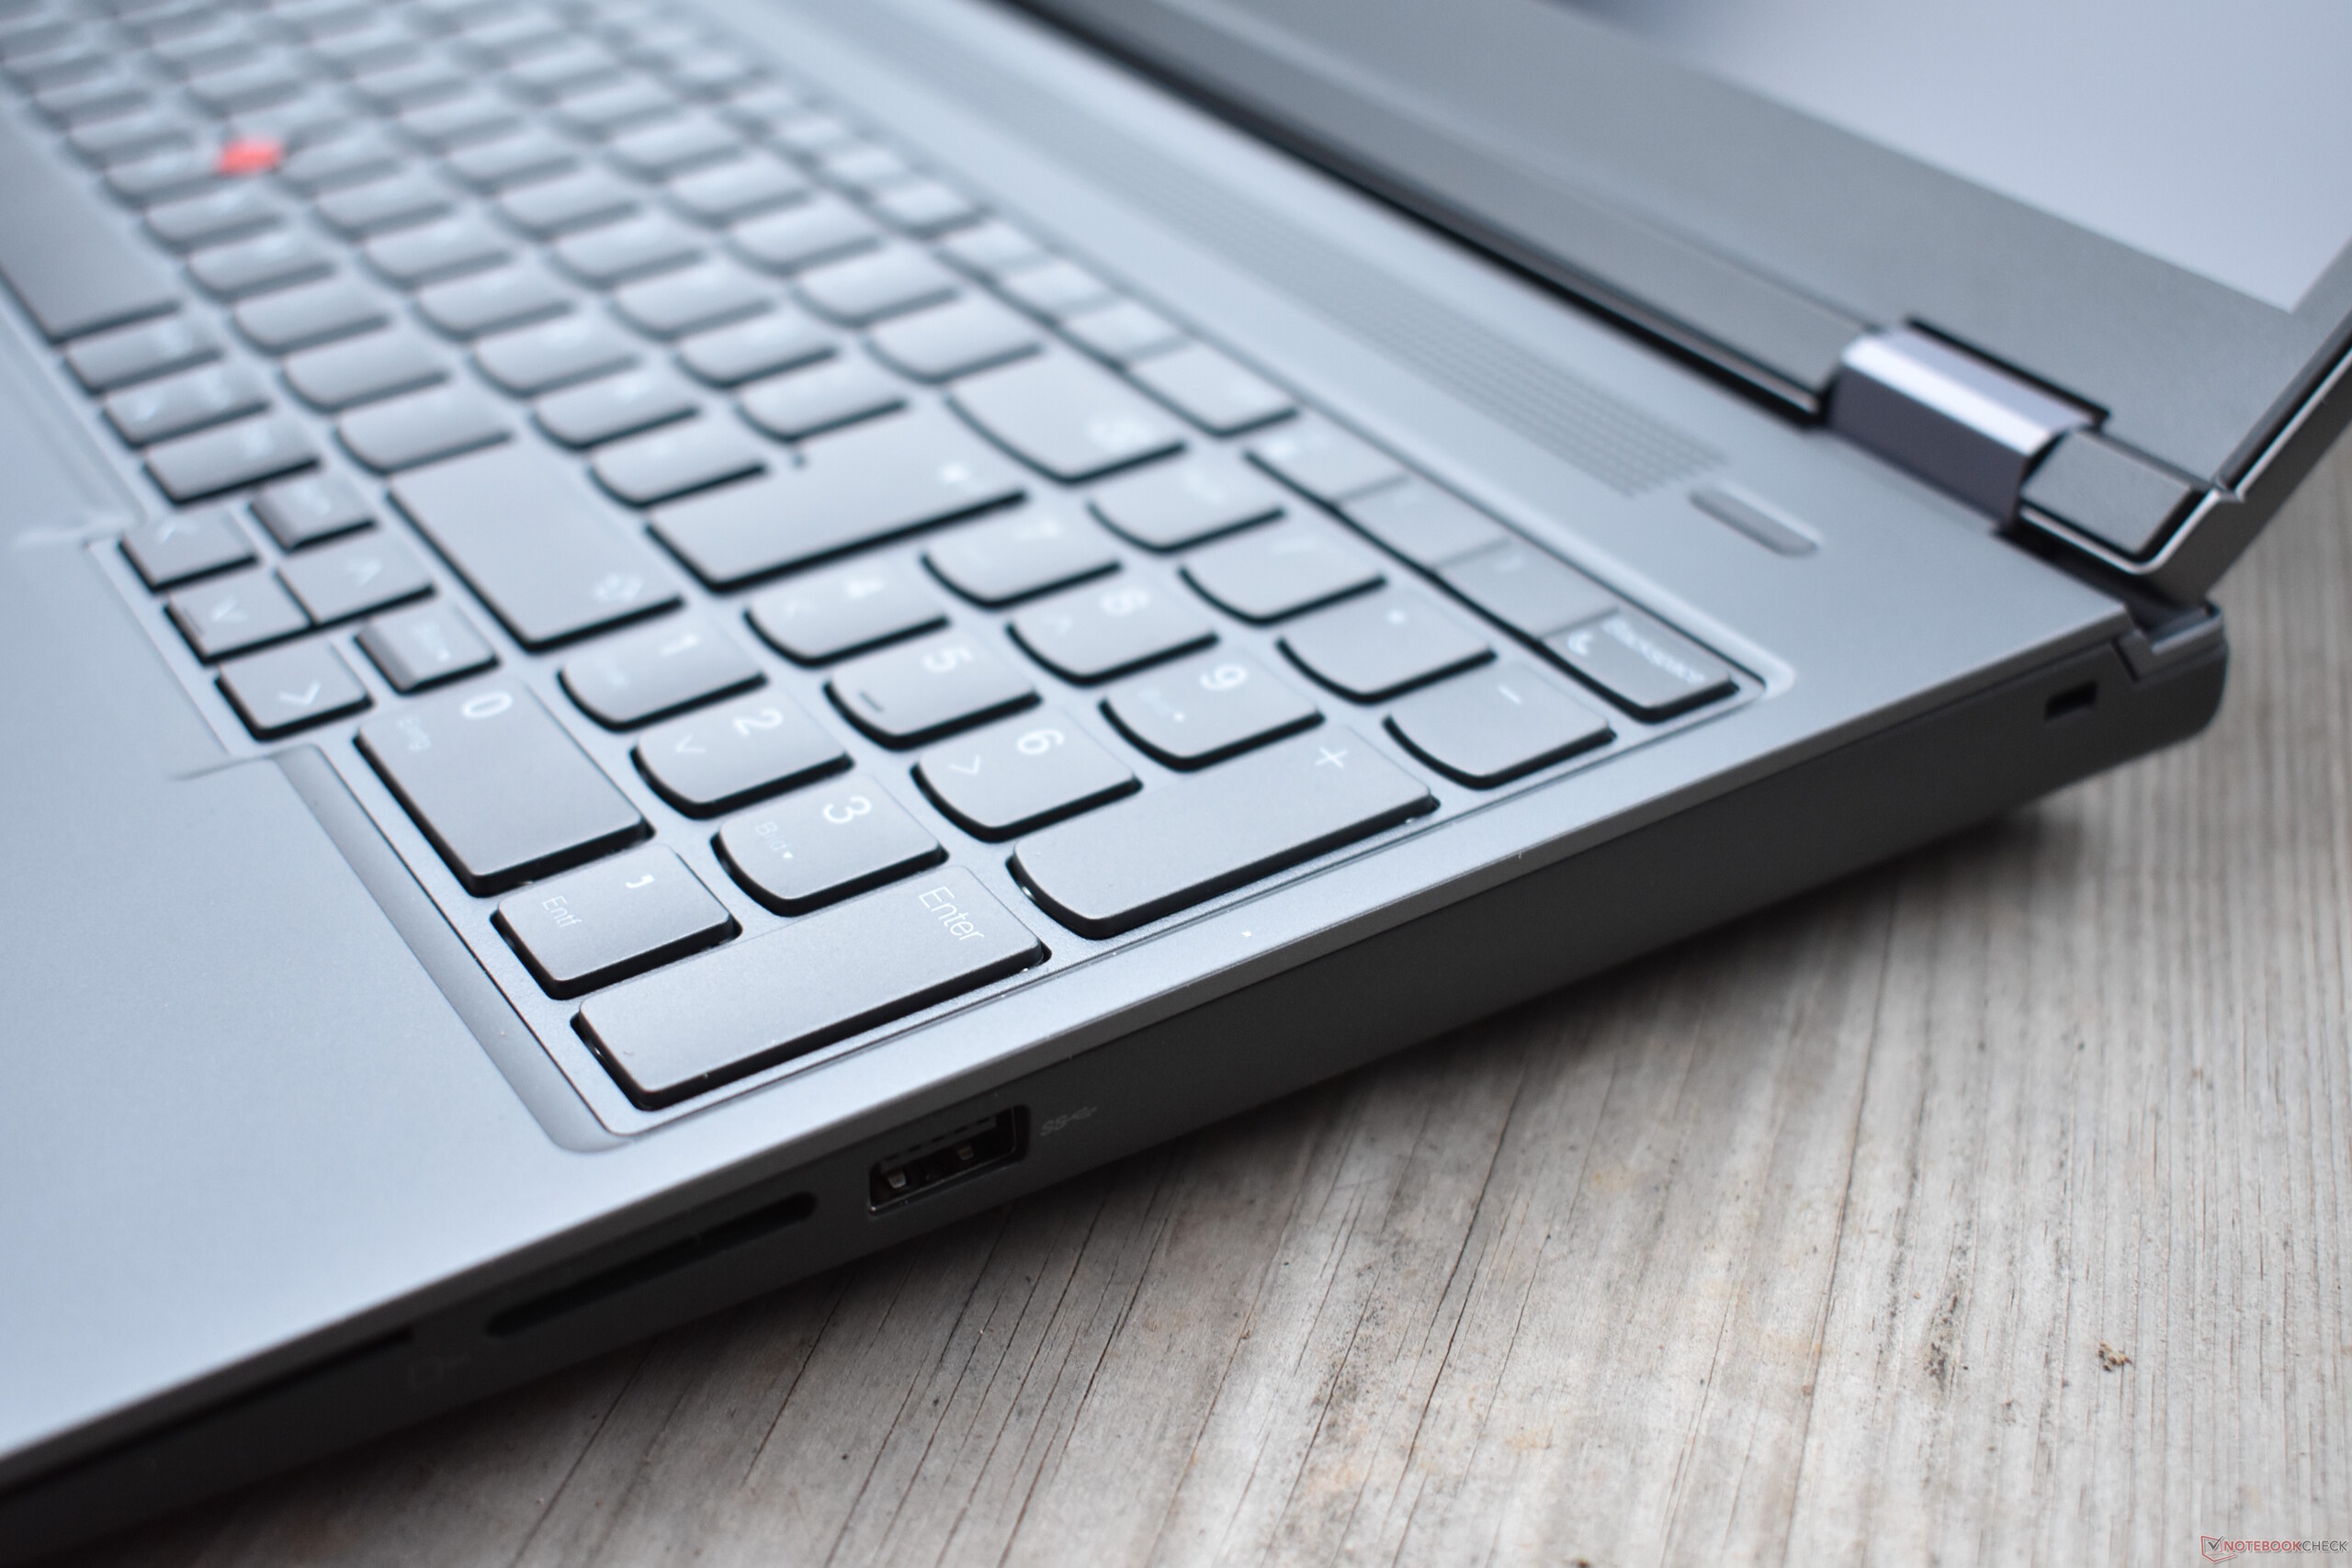
Le ThinkPad P16 change beaucoup de choses. Le repose-poignet, le clavier et le couvercle de l'écran sont entièrement en "Storm Gray". Les bords arrondis lui confèrent une forme légèrement moins carrée. En ce qui concerne l'arrière de l'appareil, Lenovo s'est montré désireux d'expérimenter, puisque cette zone est ornée de touches rouges. Le P16 semble également plus moderne que son prédécesseur car les bords de l'écran sont beaucoup plus fins. Cependant, pour un appareil moderne, ils sont encore relativement grands, en particulier au bas de l'écran.
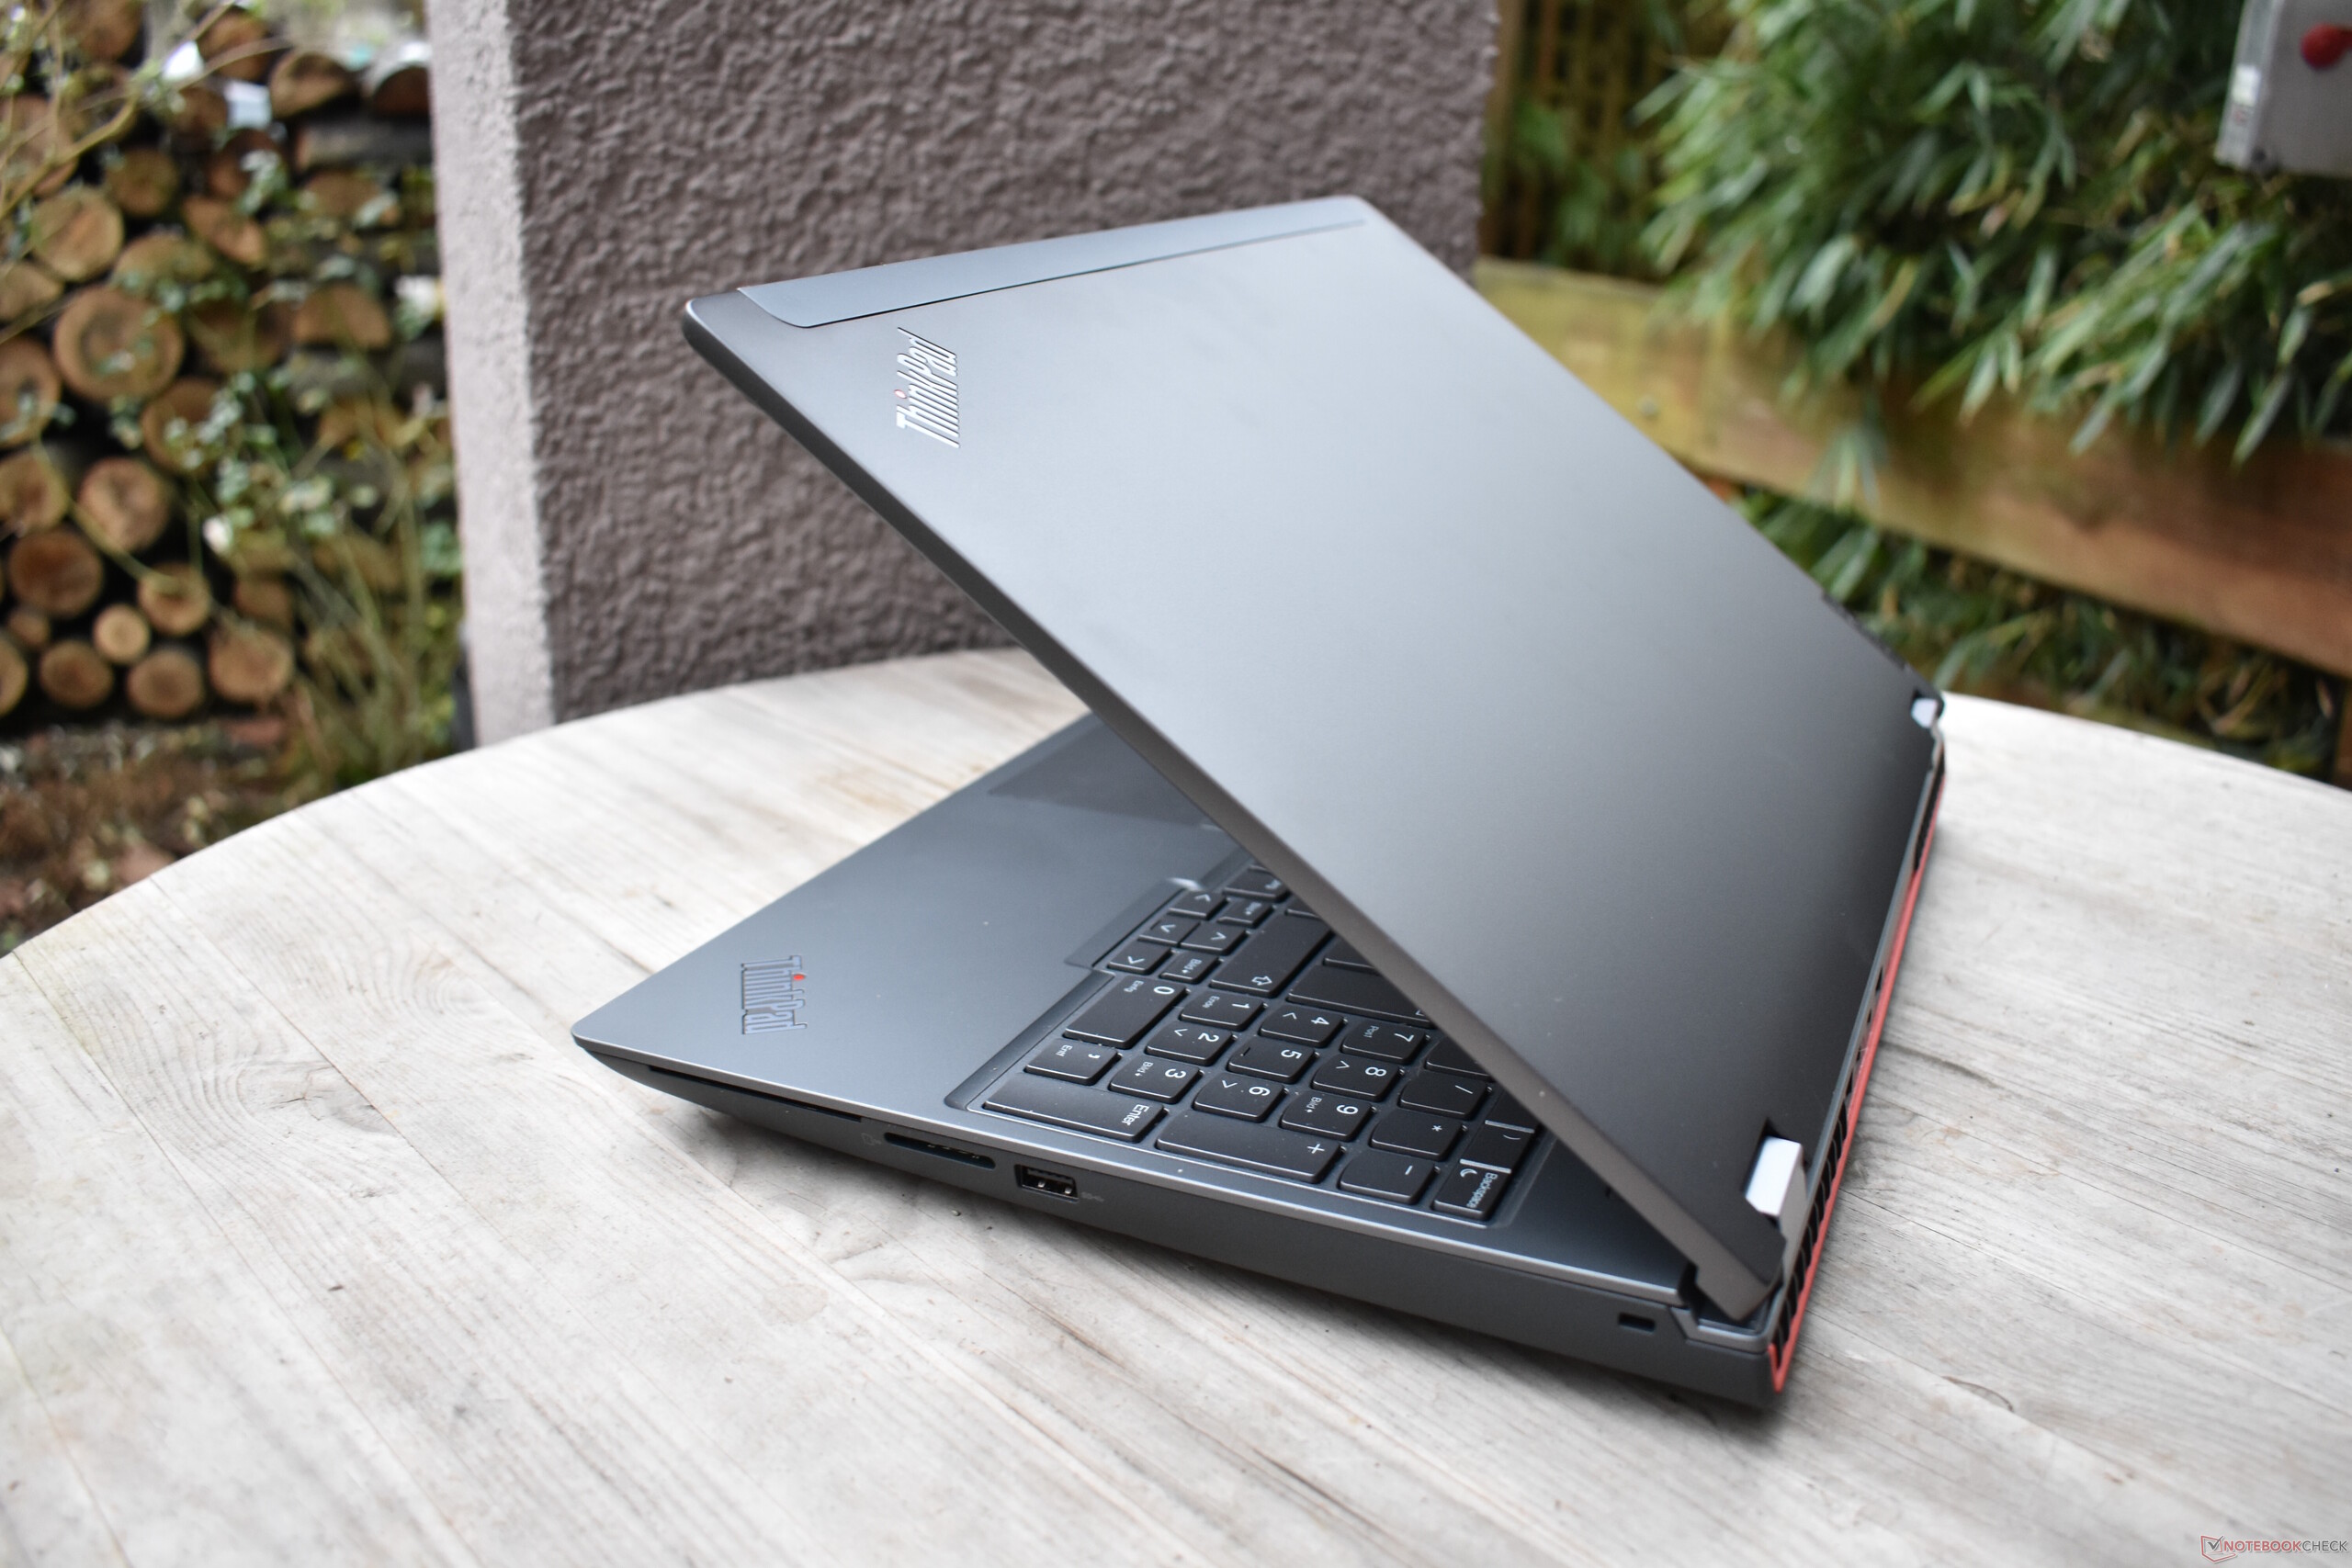
L'unité de base est faite de plastique en fibre de verre qui est renforcé par un cadre en magnésium ; tout comme les précédents. Les surfaces sont recouvertes d'un revêtement velouté et le plastique gris est moins sujet aux traces de doigts que le plastique noir que l'on trouvait sur les précédents modèles de ThinkPad. La base ne peut pas être tordue et la seule zone faible est le lecteur de carte à puce où le repose-paume fléchit légèrement. Lenovo a choisi d'utiliser de l'aluminium pour le couvercle de l'écran LCD et, de même, il a reçu un renfort supplémentaire sous la forme d'une cage de roulement en magnésium. La stabilité du couvercle de l'écran est nettement améliorée par rapport aux P15 et P17.
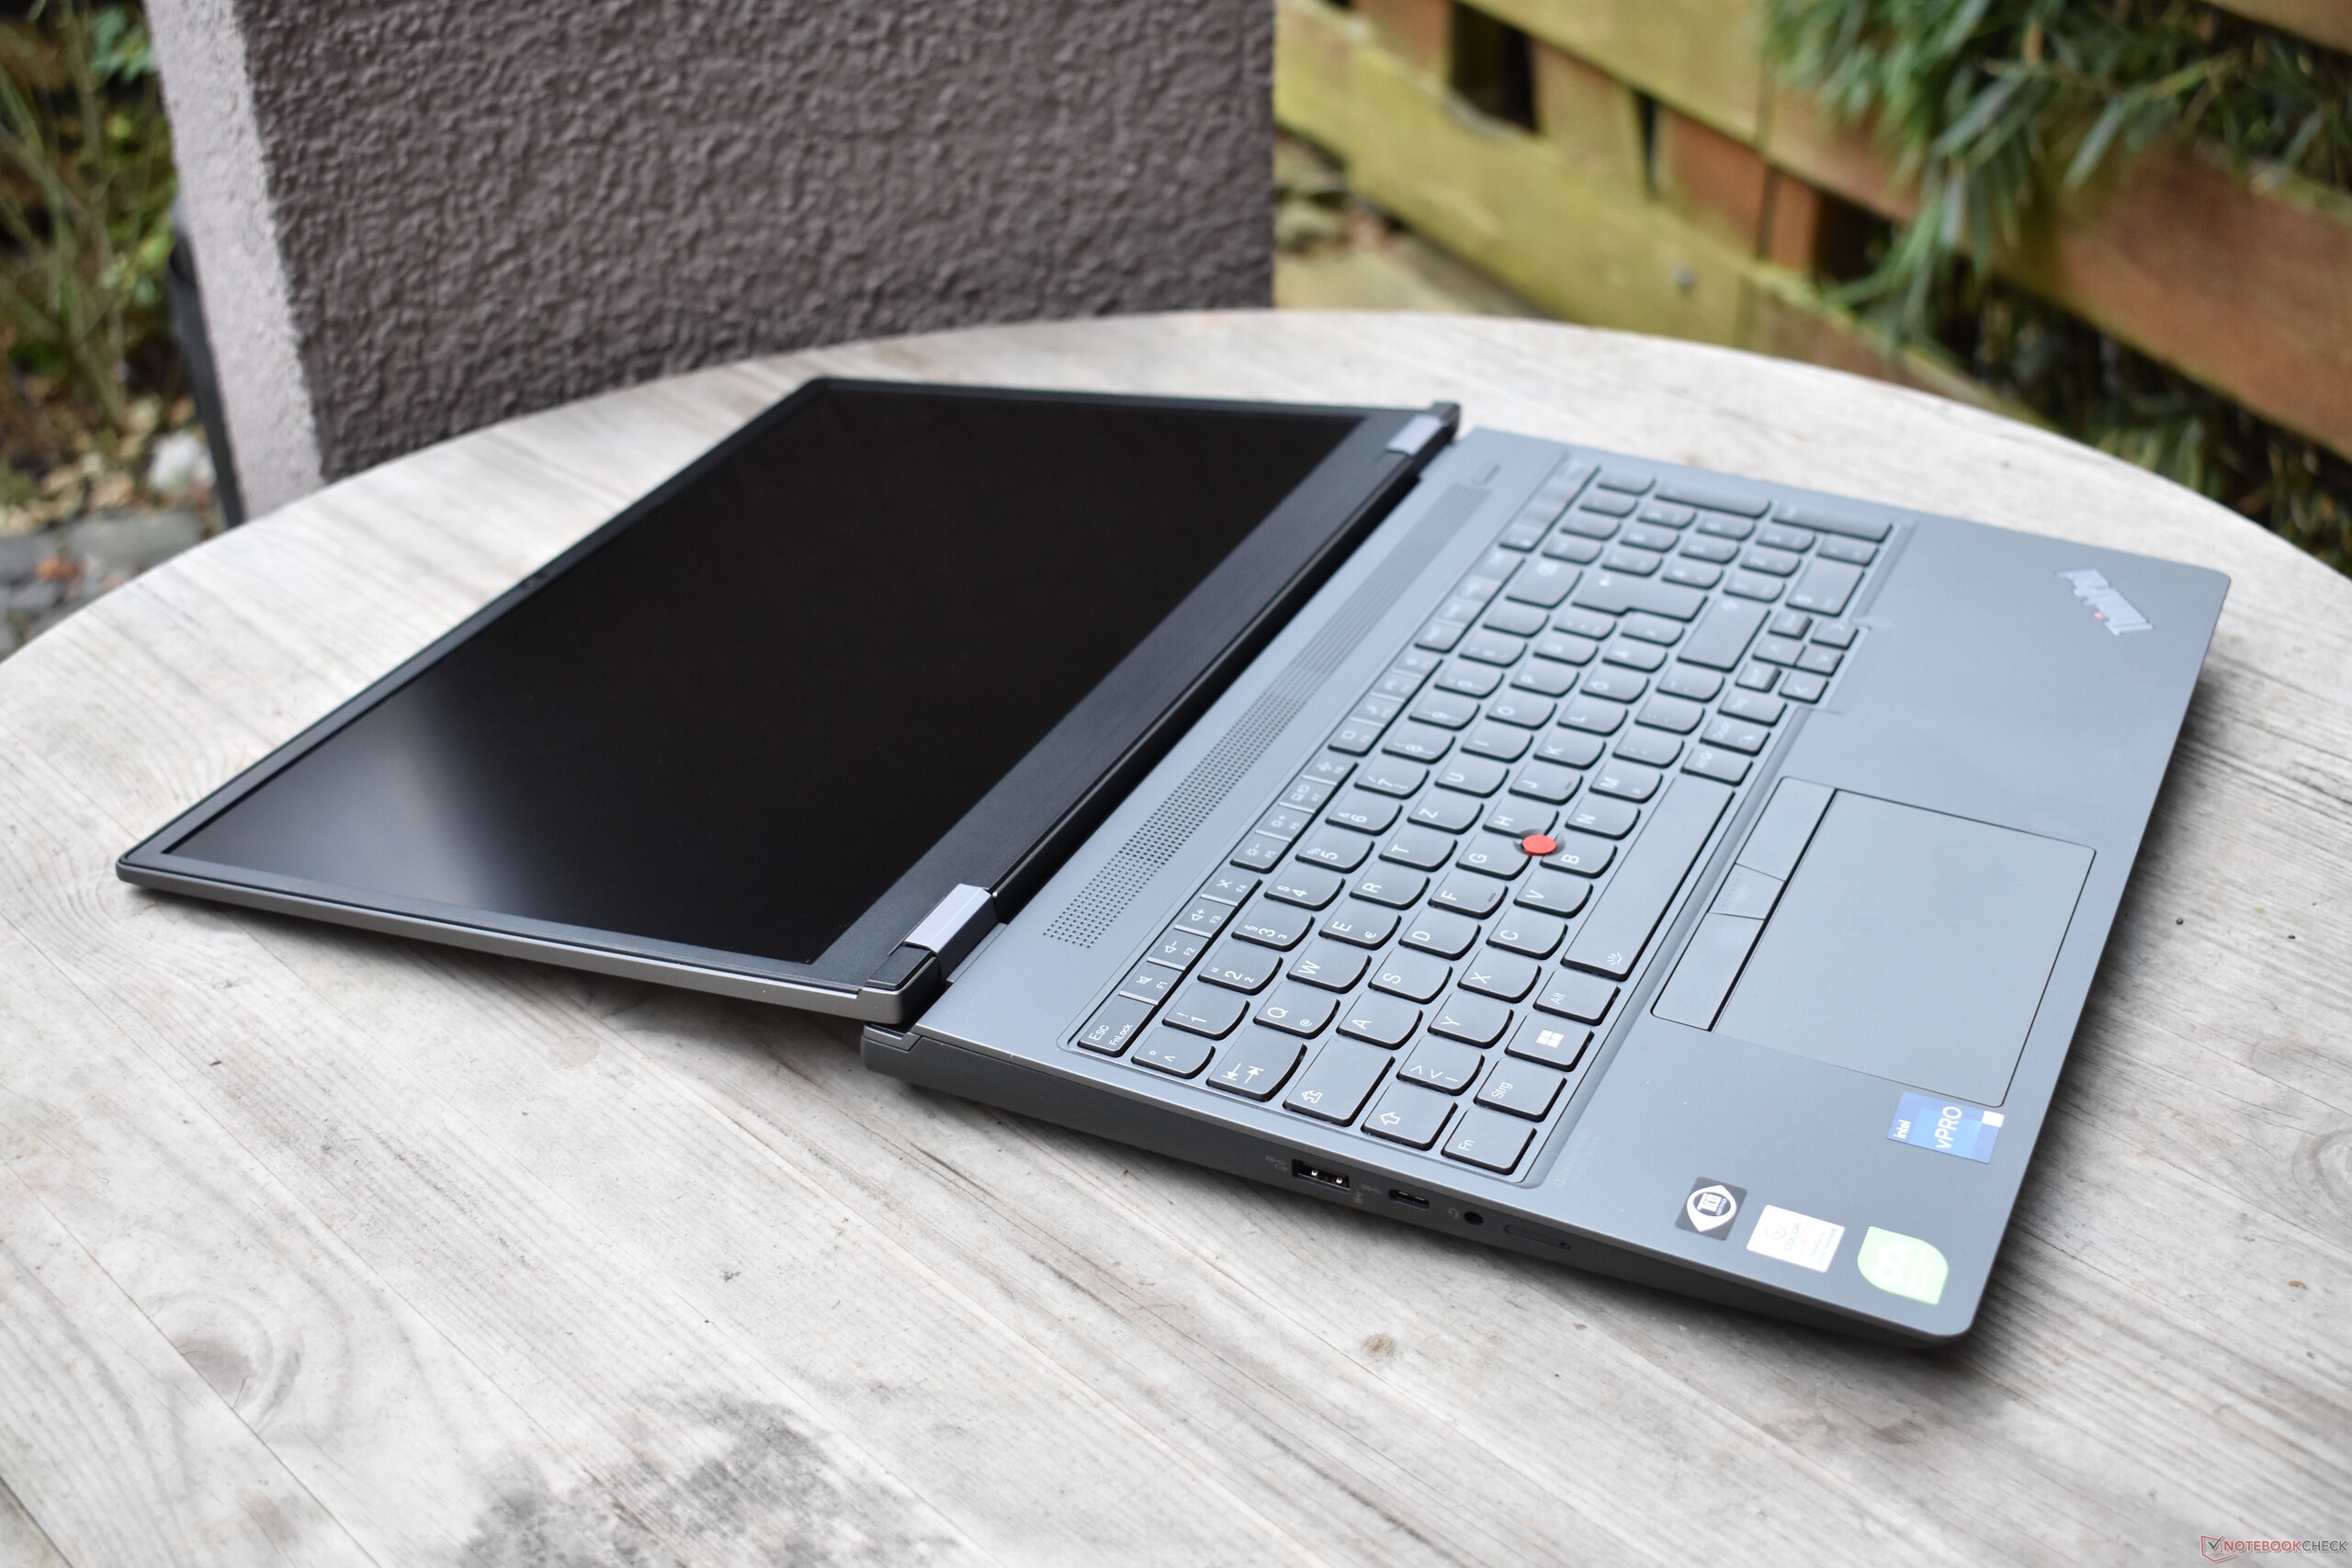
Les grandes charnières supérieures et inférieures, avec leurs capuchons argentés bien visibles, sont pratiquement identiques à celles de ces modèles et maintiennent l'écran solidement en place sans la moindre hésitation. L'écran peut être ouvert d'une seule main à un angle de plus de 180 degrés.
Plus un ThinkPad P15 G3 qu'un P17 G3 : En termes de taille et de poids, le Lenovo ThinkPad P16 G1 est beaucoup plus proche de son petit prédécesseur que de son grand.
Precision Une comparaison avec la station Dell 7670 est également intéressante : La station de travail Dell de 16 pouces est plus mobile à tous points de vue, car elle est non seulement plus petite, mais aussi plus fine et plus légère. Avec le Precision 7770, Dell continue de proposer une variante LCD 17 pouces encore plus grande et plus puissante.
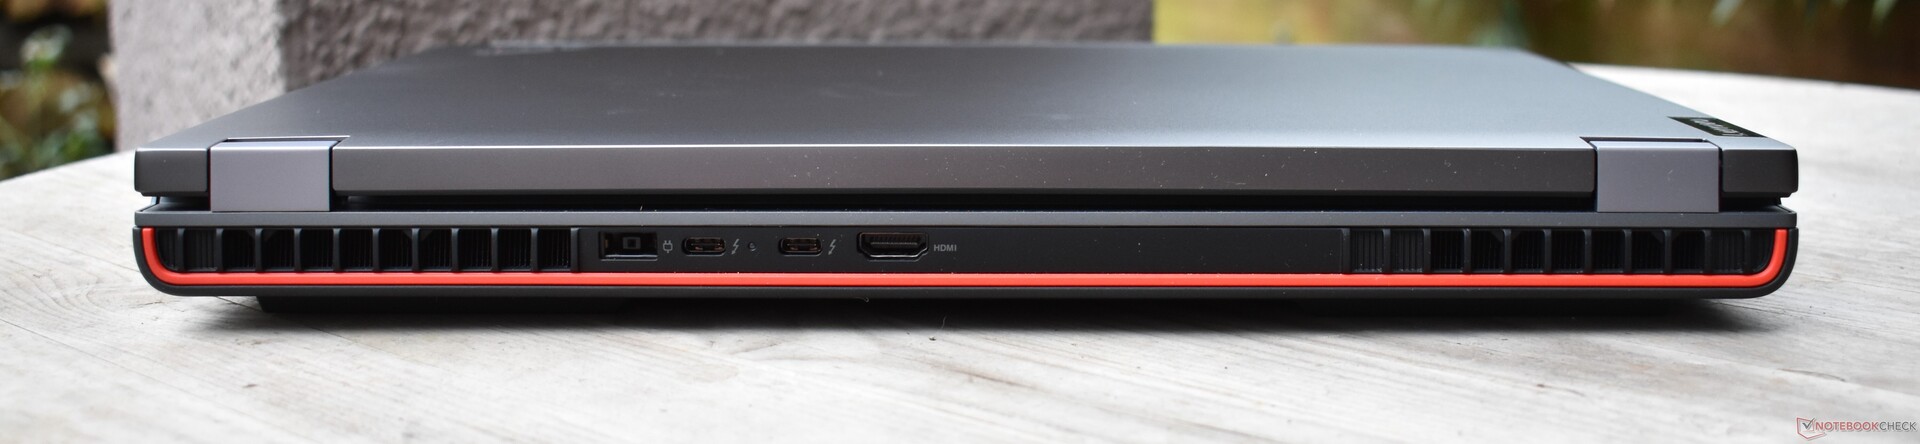
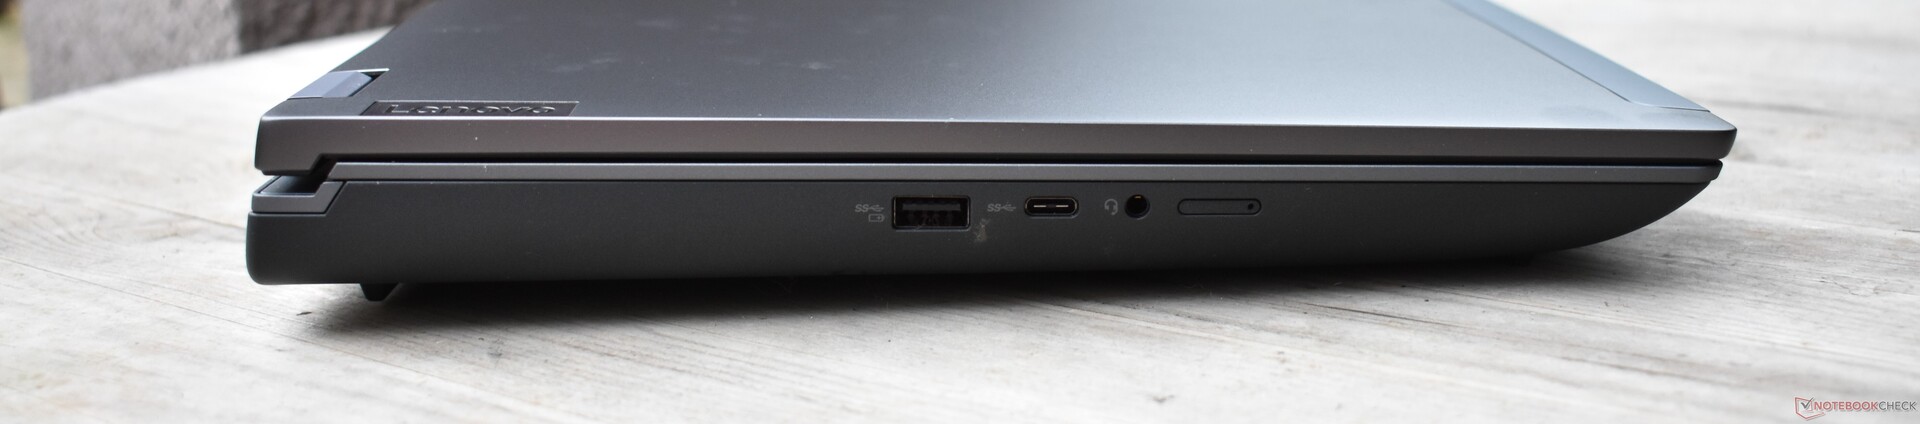
Caractéristiques : Un ThinkPad P16 sans RJ45
Lenovo a mis à jour le design sans modifier radicalement les options de connectivité. Il n'y a qu'un seul changement en plus de l'emplacement des ports : La fonctionnalité Ethernet RJ45 a été abandonnée. L'utilisation de l'Internet filaire est assurée par une station d'accueil ou l'un des ports Thunderbolt.
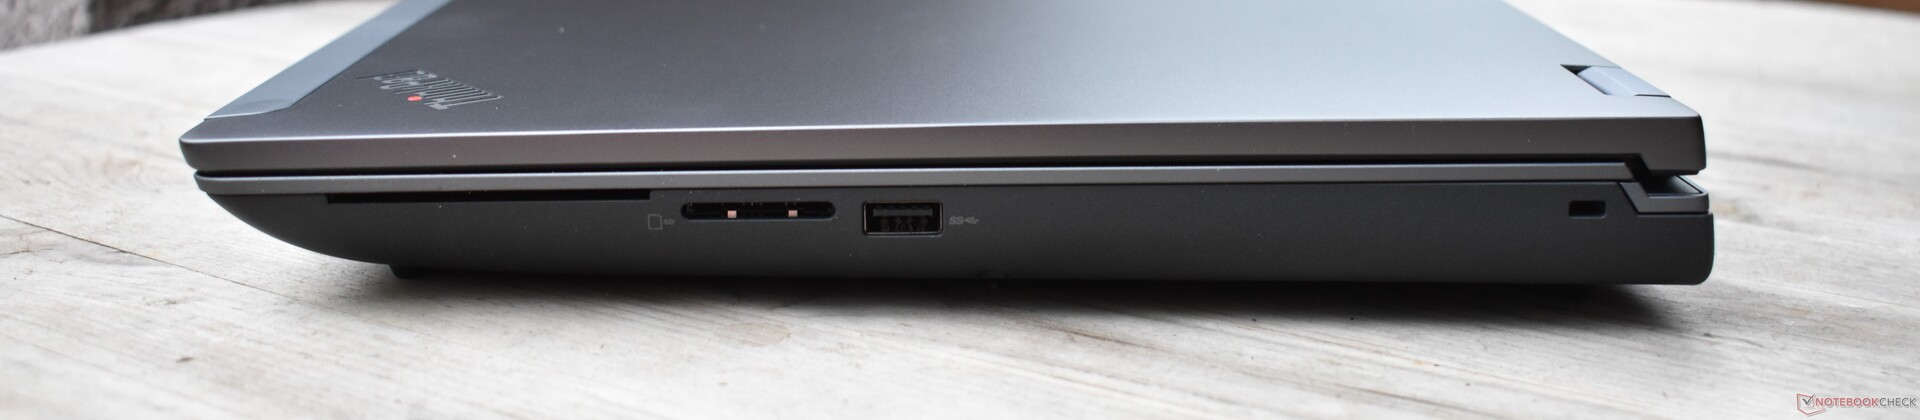
Lecteur de carte SD
Les résultats des tests de référence du lecteur de carte SD - que nous avons testés avec notre carte microSD 128 Go AV Pro de référence - sont étonnamment mauvais. Les scores sont bien en dessous de la moyenne pour un appareil de classe station de travail ainsi que pour son propre prédécesseur.
| SD Card Reader | |
| average JPG Copy Test (av. of 3 runs) | |
| Lenovo ThinkPad P15 G2-20YQ001JGE (AV Pro V60) | |
| Dell Precision 7670 (Toshiba Exceria Pro SDXC 64 GB UHS-II) | |
| Lenovo ThinkPad P17 G2-20YU0025G (Toshiba Exceria Pro SDXC 64 GB UHS-II) | |
| Moyenne de la classe Workstation (49.6 - 681, n=14, 2 dernières années) | |
| HP ZBook Fury 17 G8-4A6A9EA (Angelbird AV Pro V60) | |
| Lenovo ThinkPad P16 G1 21D6001DMB (AV Pro V60) | |
| maximum AS SSD Seq Read Test (1GB) | |
| Moyenne de la classe Workstation (87.6 - 1455, n=14, 2 dernières années) | |
| Lenovo ThinkPad P15 G2-20YQ001JGE (AV Pro V60) | |
| Lenovo ThinkPad P17 G2-20YU0025G (Toshiba Exceria Pro SDXC 64 GB UHS-II) | |
| Dell Precision 7670 (Toshiba Exceria Pro SDXC 64 GB UHS-II) | |
| HP ZBook Fury 17 G8-4A6A9EA (Angelbird AV Pro V60) | |
| Lenovo ThinkPad P16 G1 21D6001DMB (AV Pro V60) | |
Communication
Les performances de la carte Intel AX211WiFi-6E sont meilleures que celles de la carte AX210 qui équipait les modèles précédents, les ThinkPad P15 et P17. Elle est surtout performante au niveau de la réception mais l'envoi de données est un peu plus lent et moins stable.
Notre modèle de référence ne possédait pas de module WWAN (4G LTE) mais peut en être équipé.
| Networking | |
| Lenovo ThinkPad P16 G1 21D6001DMB | |
| iperf3 transmit AXE11000 | |
| iperf3 receive AXE11000 | |
| Lenovo ThinkPad P15 G2-20YQ001JGE | |
| iperf3 transmit AX12 | |
| iperf3 receive AX12 | |
| Lenovo ThinkPad P17 G2-20YU0025G | |
| iperf3 transmit AX12 | |
| iperf3 receive AX12 | |
| HP ZBook Fury 17 G8-4A6A9EA | |
| iperf3 transmit AX12 | |
| iperf3 receive AX12 | |
| Dell Precision 7670 | |
| iperf3 transmit AXE11000 6GHz | |
| iperf3 receive AXE11000 6GHz | |
| Asus ExpertBook B6 Flip B6602FC2 | |
| iperf3 transmit AXE11000 6GHz | |
| iperf3 receive AXE11000 6GHz | |
| iperf3 transmit AXE11000 | |
| iperf3 receive AXE11000 | |
Webcam
Dans l'ensemble, la webcam 1080p produit des images délavées, floues et bruyantes.


Sécurité
Outre le lecteur d'empreintes digitales intégré au bouton d'alimentation, le Lenovo ThinkPad P16 2022 dispose d'une caméra infrarouge compatible avec Windows Hello. Le verrou Kensington peut offrir une protection et il existe également un lecteur de carte à puce en option. Le Lenovo ThinkPad P16 possède une puce TPM dédiée et la webcam possède un obturateur mécanique.
Accessoires
En dehors du bloc d'alimentation de 170 watts, doté d'un connecteur Slim Tip, l'ordinateur portable est livré sans accessoires supplémentaires. L'accessoire optionnel le plus important devrait être une station d'accueil telle que la station d'accueil ThinkPad Thunderbolt 4 Workstation de https://lenovo.vzew.net/c/2597802/218864/3808?subId1=news&u=https%3A%2F%2Fwww.lenovo.com%2Fus%2Fen%2Fp%2Faccessories-and-software%2Fdocking%2Fdocking_thunderbolt-docks-(universal-cable-docks)%2F40b00300us%3ForgRef%3Dhttps%25253A%25252F%25252Fwww.google.com%25252F
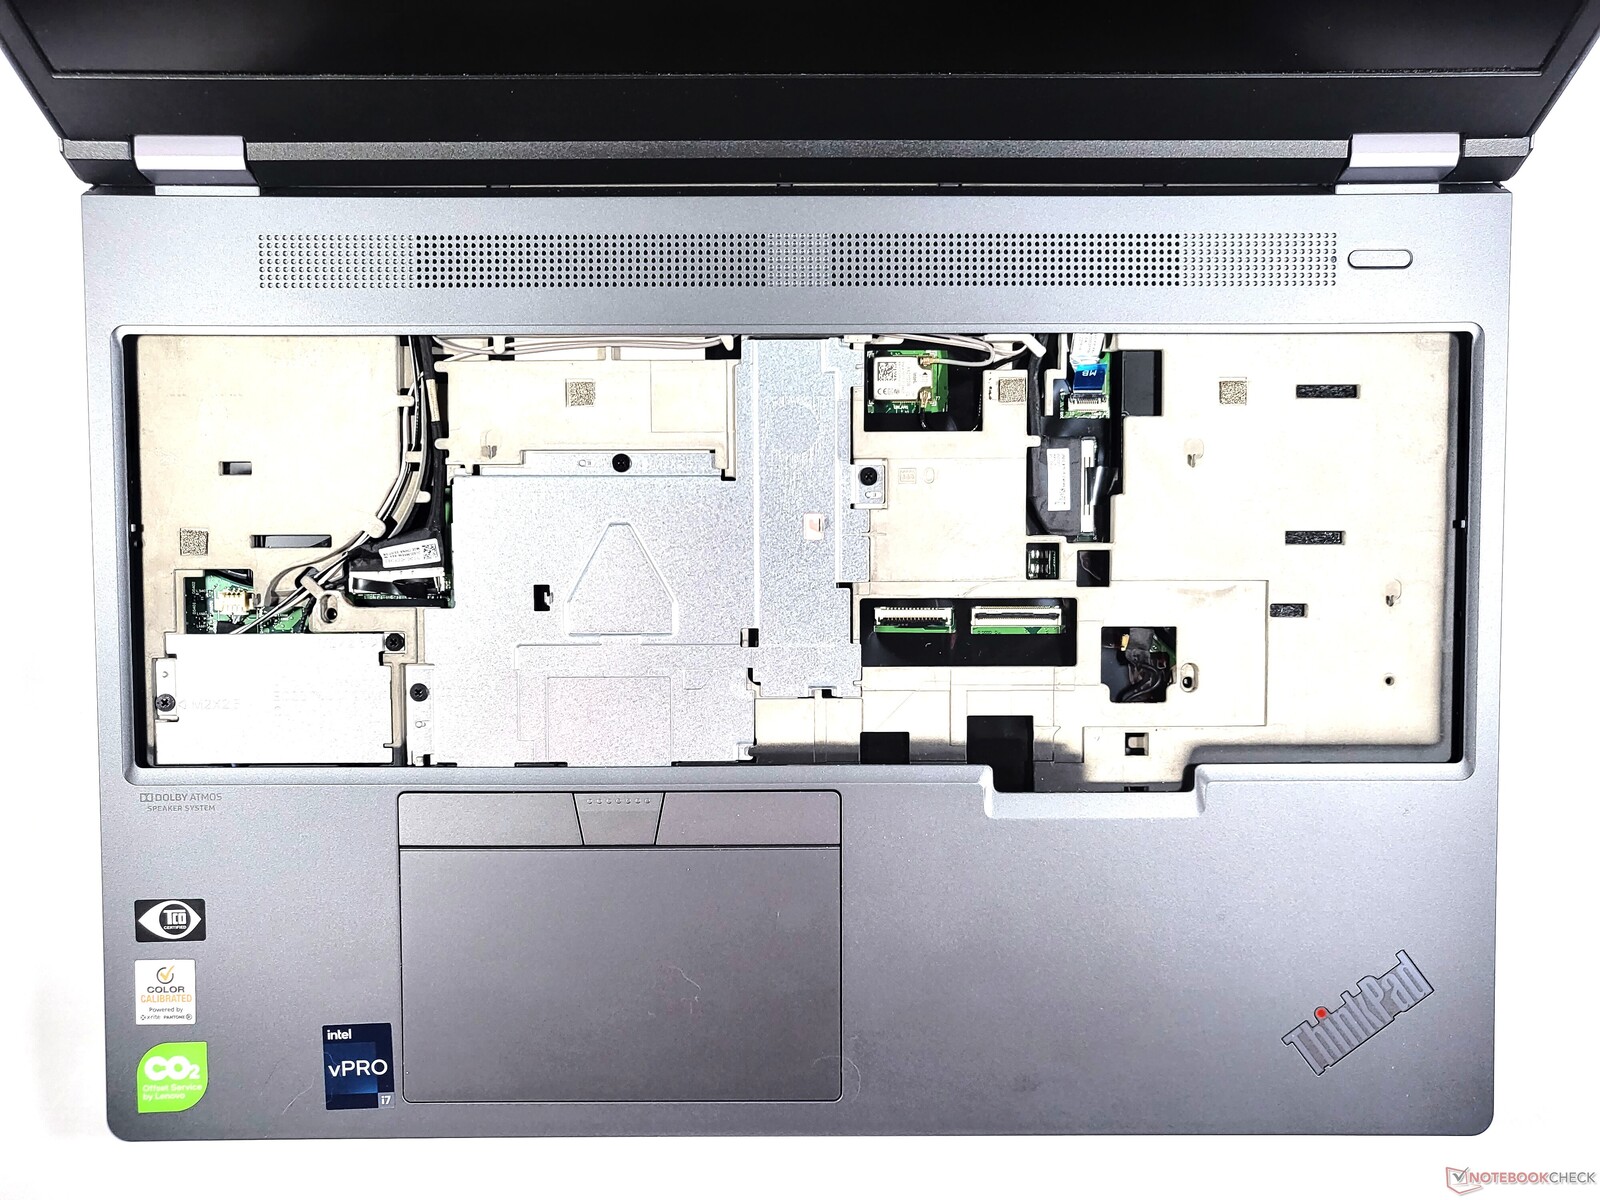
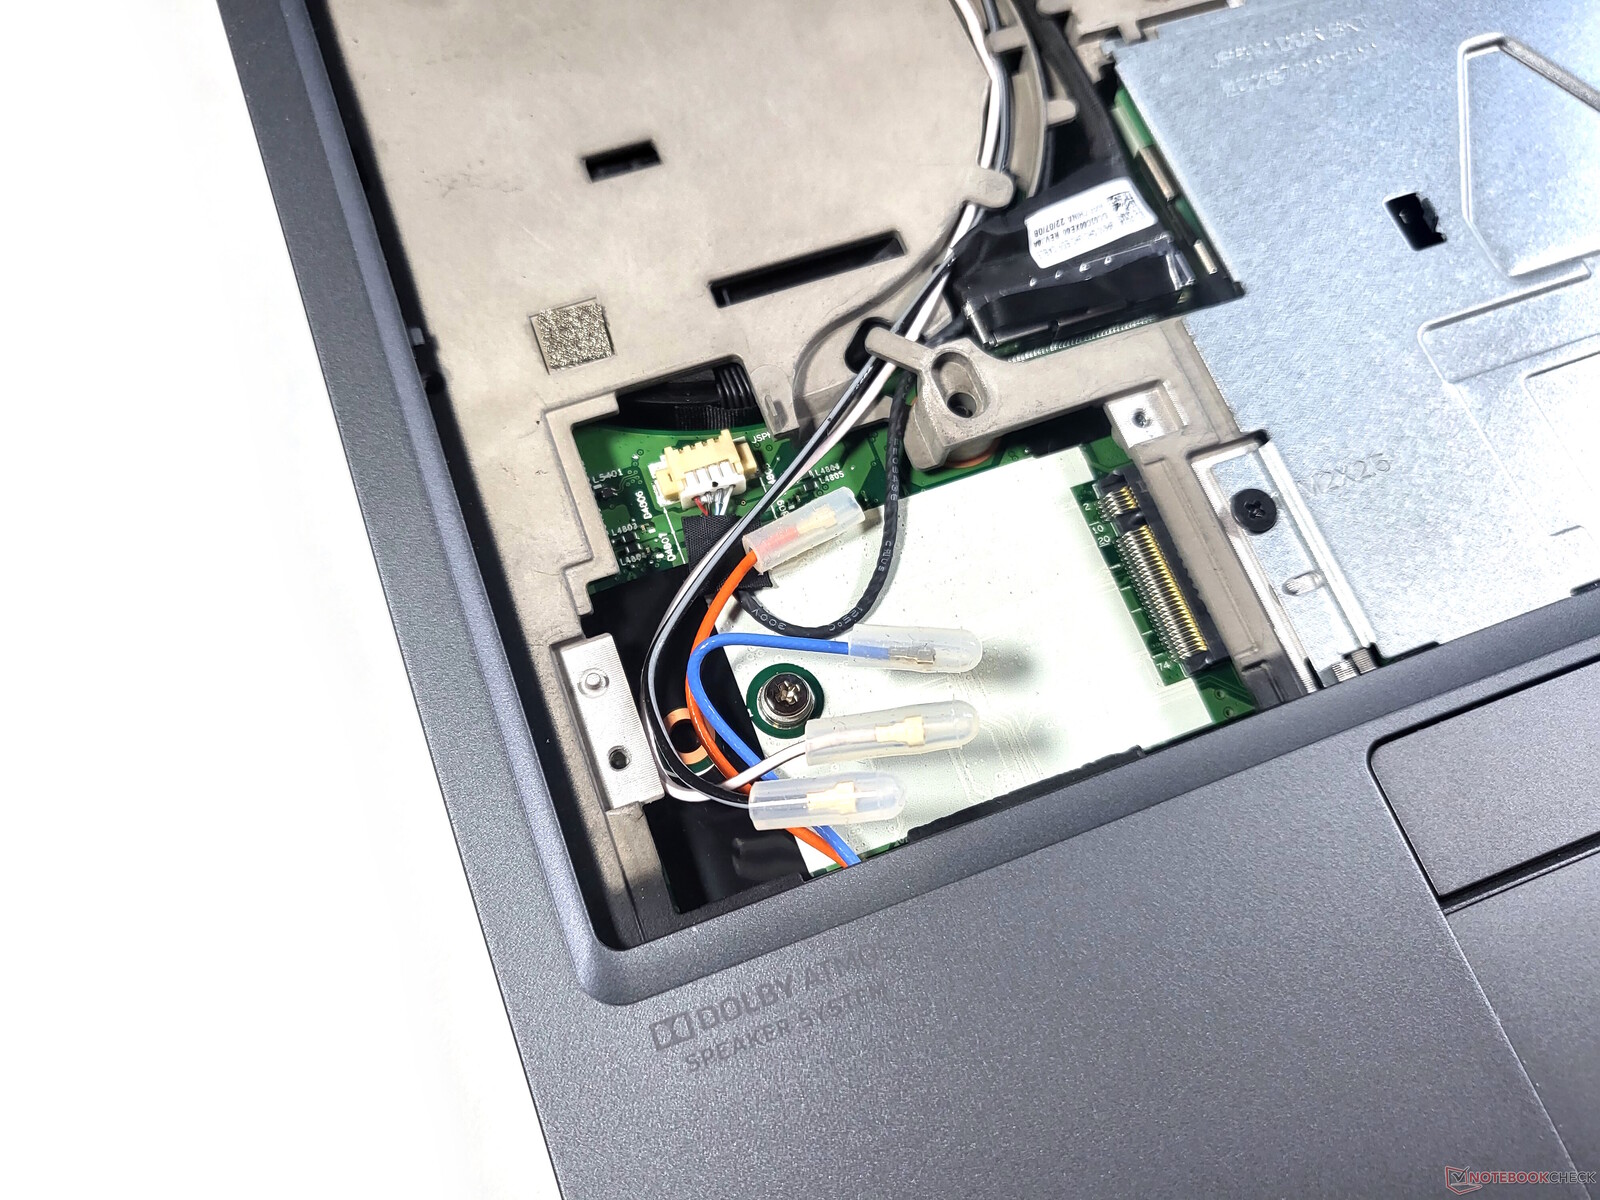
Maintenance
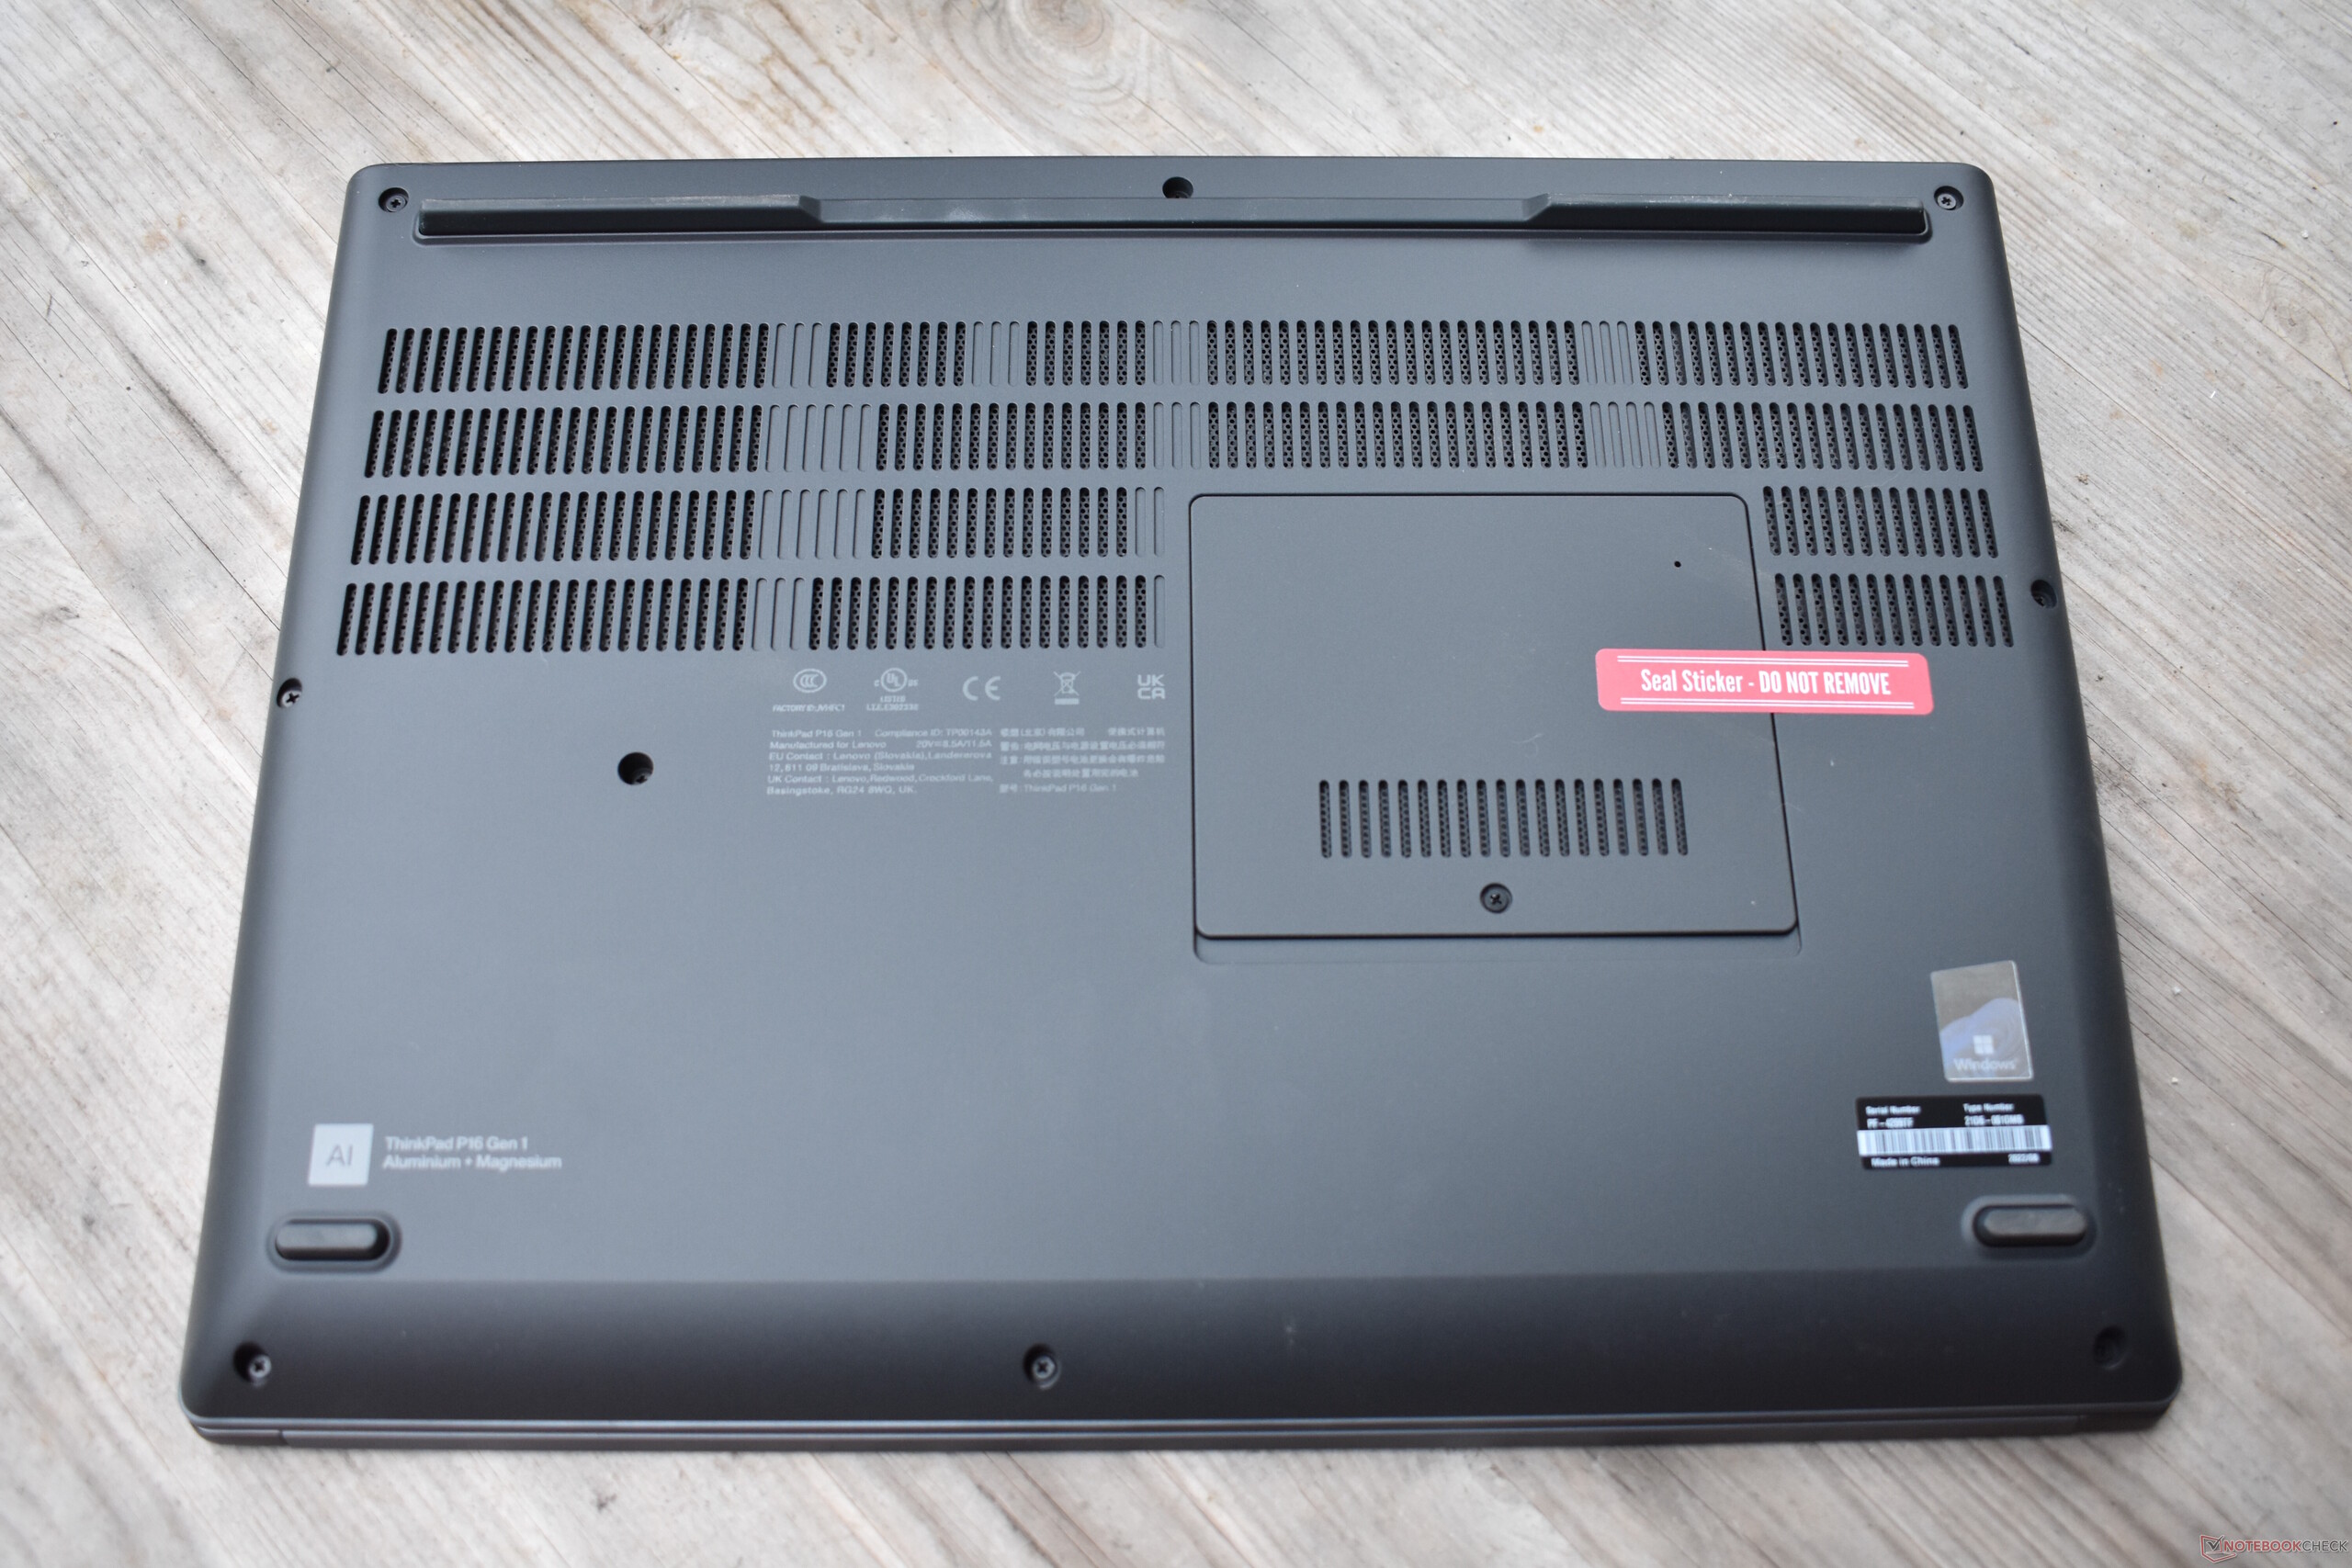
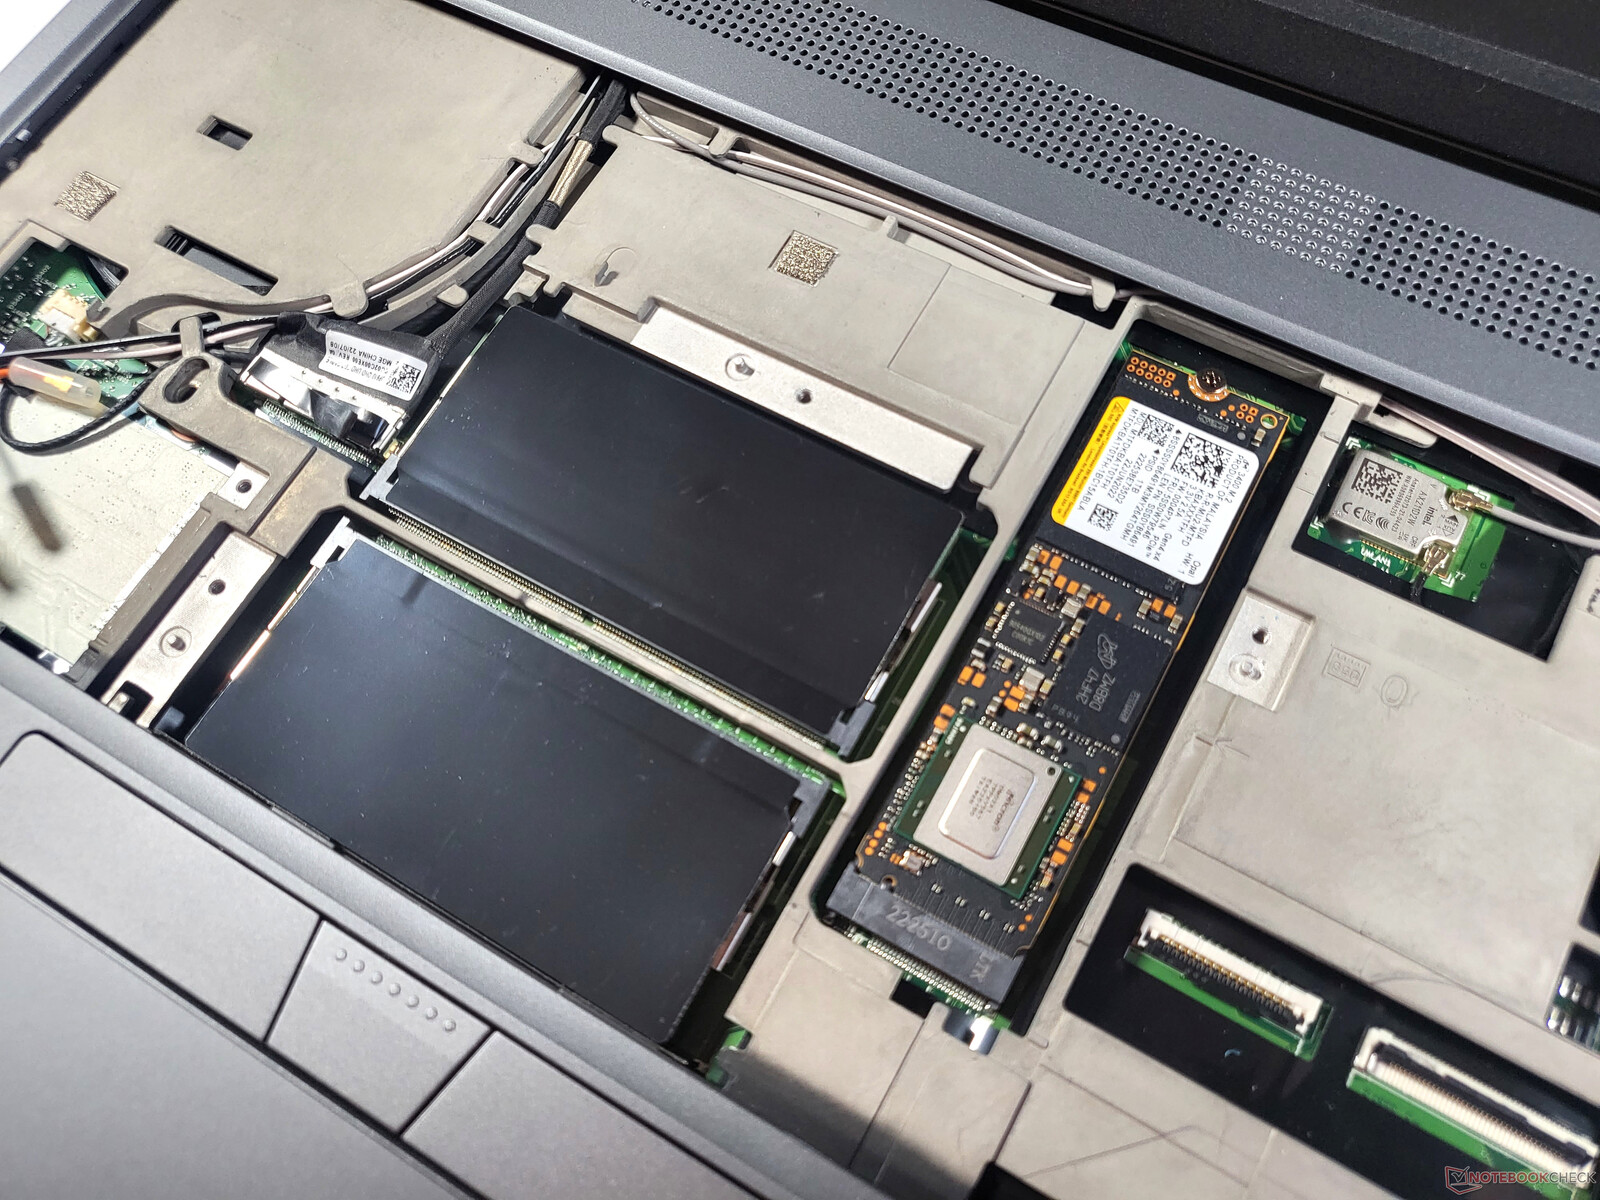
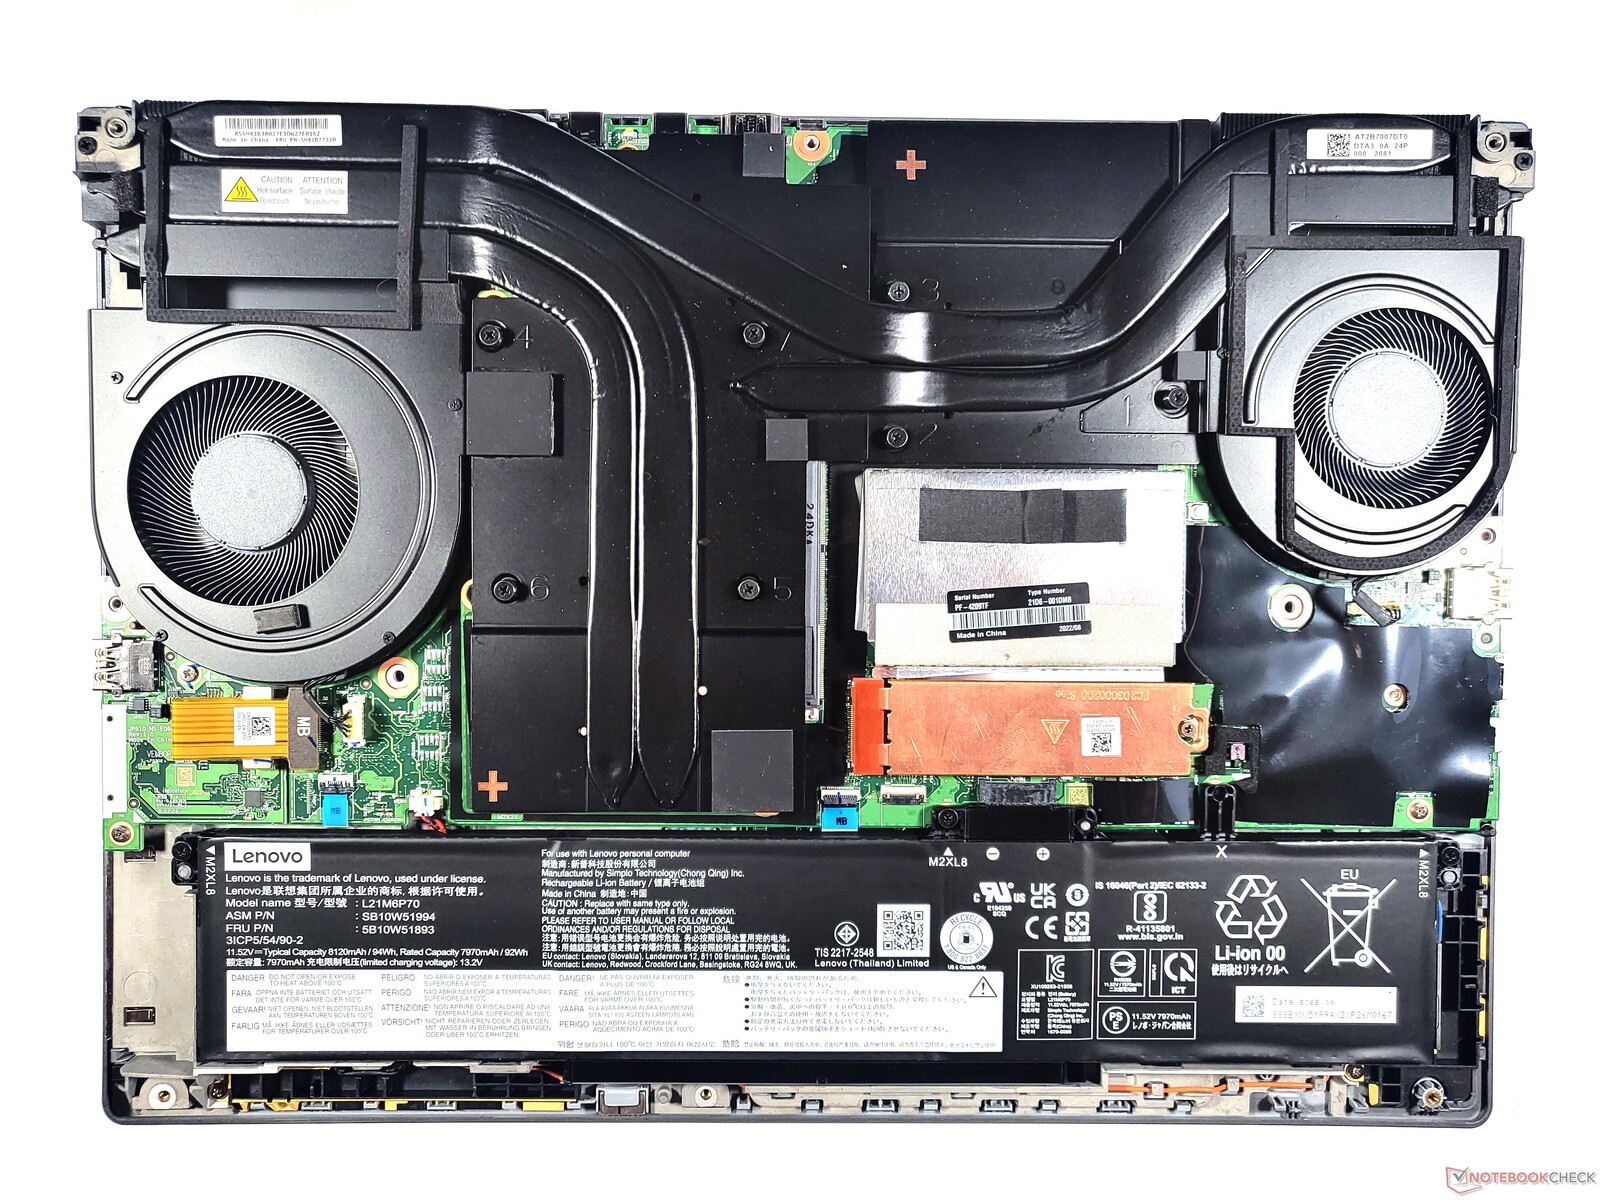
Lenovo a fait en sorte qu'il soit très facile d'atteindre deux des quatre emplacements de mémoire vive, car il suffit de retirer le petit couvercle situé au bas de l'appareil. Vous pouvez également y trouver un emplacement M.2 2280 libre. Il est un peu plus difficile d'accéder aux autres emplacements de RAM, au deuxième emplacement M.2, au module WiFi soudé ainsi qu'à l'emplacement WWAN : le clavier doit faire de la place pour cela. Le dernier obstacle se présente sous la forme de deux couvercles métalliques. Au total, dix autres vis cruciformes supplémentaires sécurisées par des crochets en plastique se trouvent sur le fond de l'ordinateur portable. En retirant cette partie, vous obtenez une vue claire sur le grand système de refroidissement avec un total de deux ventilateurs et la batterie interne.
Toutes ces étapes peuvent être effectuées sans annuler la garantie. Avec le manuel de maintenance du matériel https://download.lenovo.com/pccbbs/mobiles_pdf/p16_gen1_hmm_en.pdf , Lenovo a fourni un ensemble d'instructions appropriées.

Garantie
L'ordinateur portable professionnel Lenovo ThinkPad P16 Gen 1 est livré avec une garantie de 3 ans. Moyennant un supplément, cette garantie peut également être étendue à cinq ans. Notre appareil de test bénéficie de la garantie Premier Support avec service sur site. Cependant, la plupart des configurations du ThinkPad P16 nécessitent un supplément pour bénéficier de cette fonction. Les clients n'ont droit à ces options de service étendu qu'en Allemagne. À l'international, la garantie Bring In est disponible.
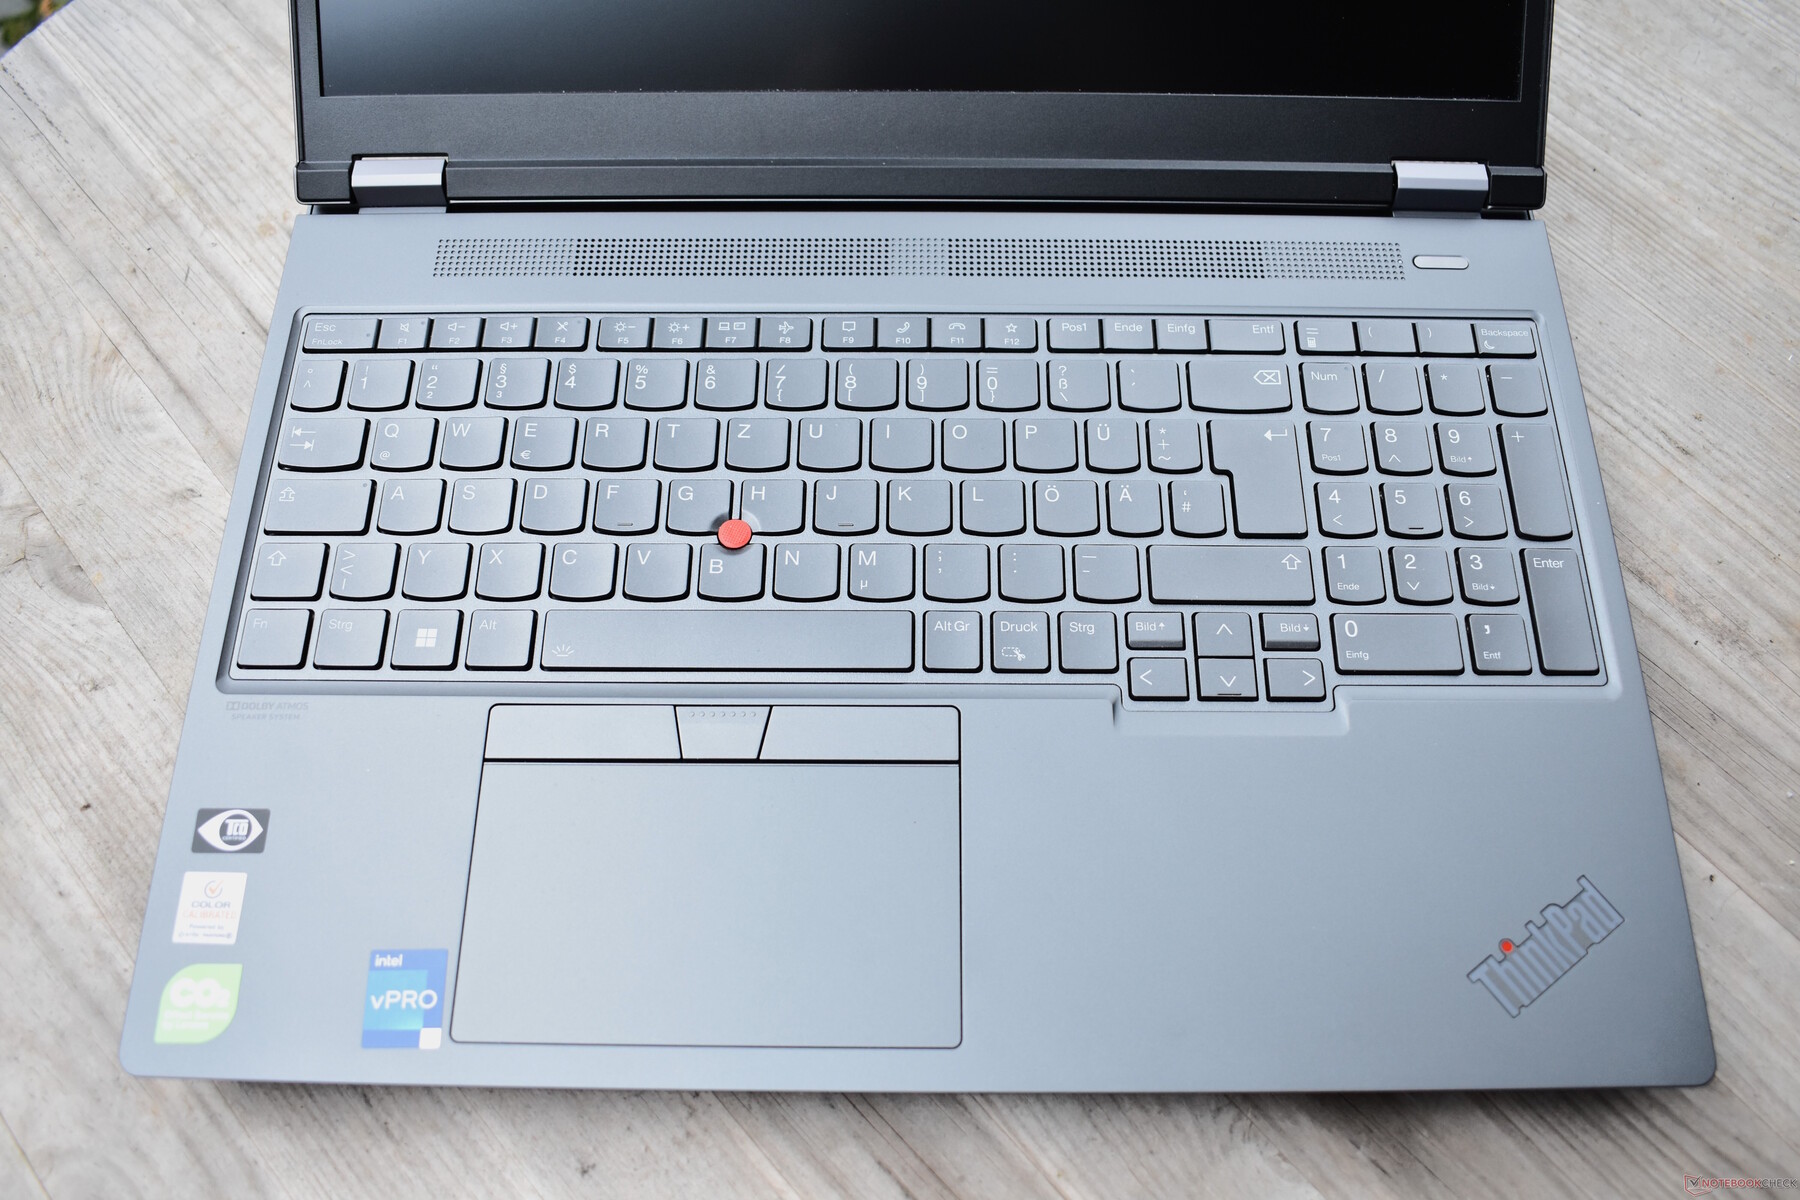
Dispositifs de saisie : Le ThinkPad P dispose désormais d'une course des touches de 1,5 mm
Clavier
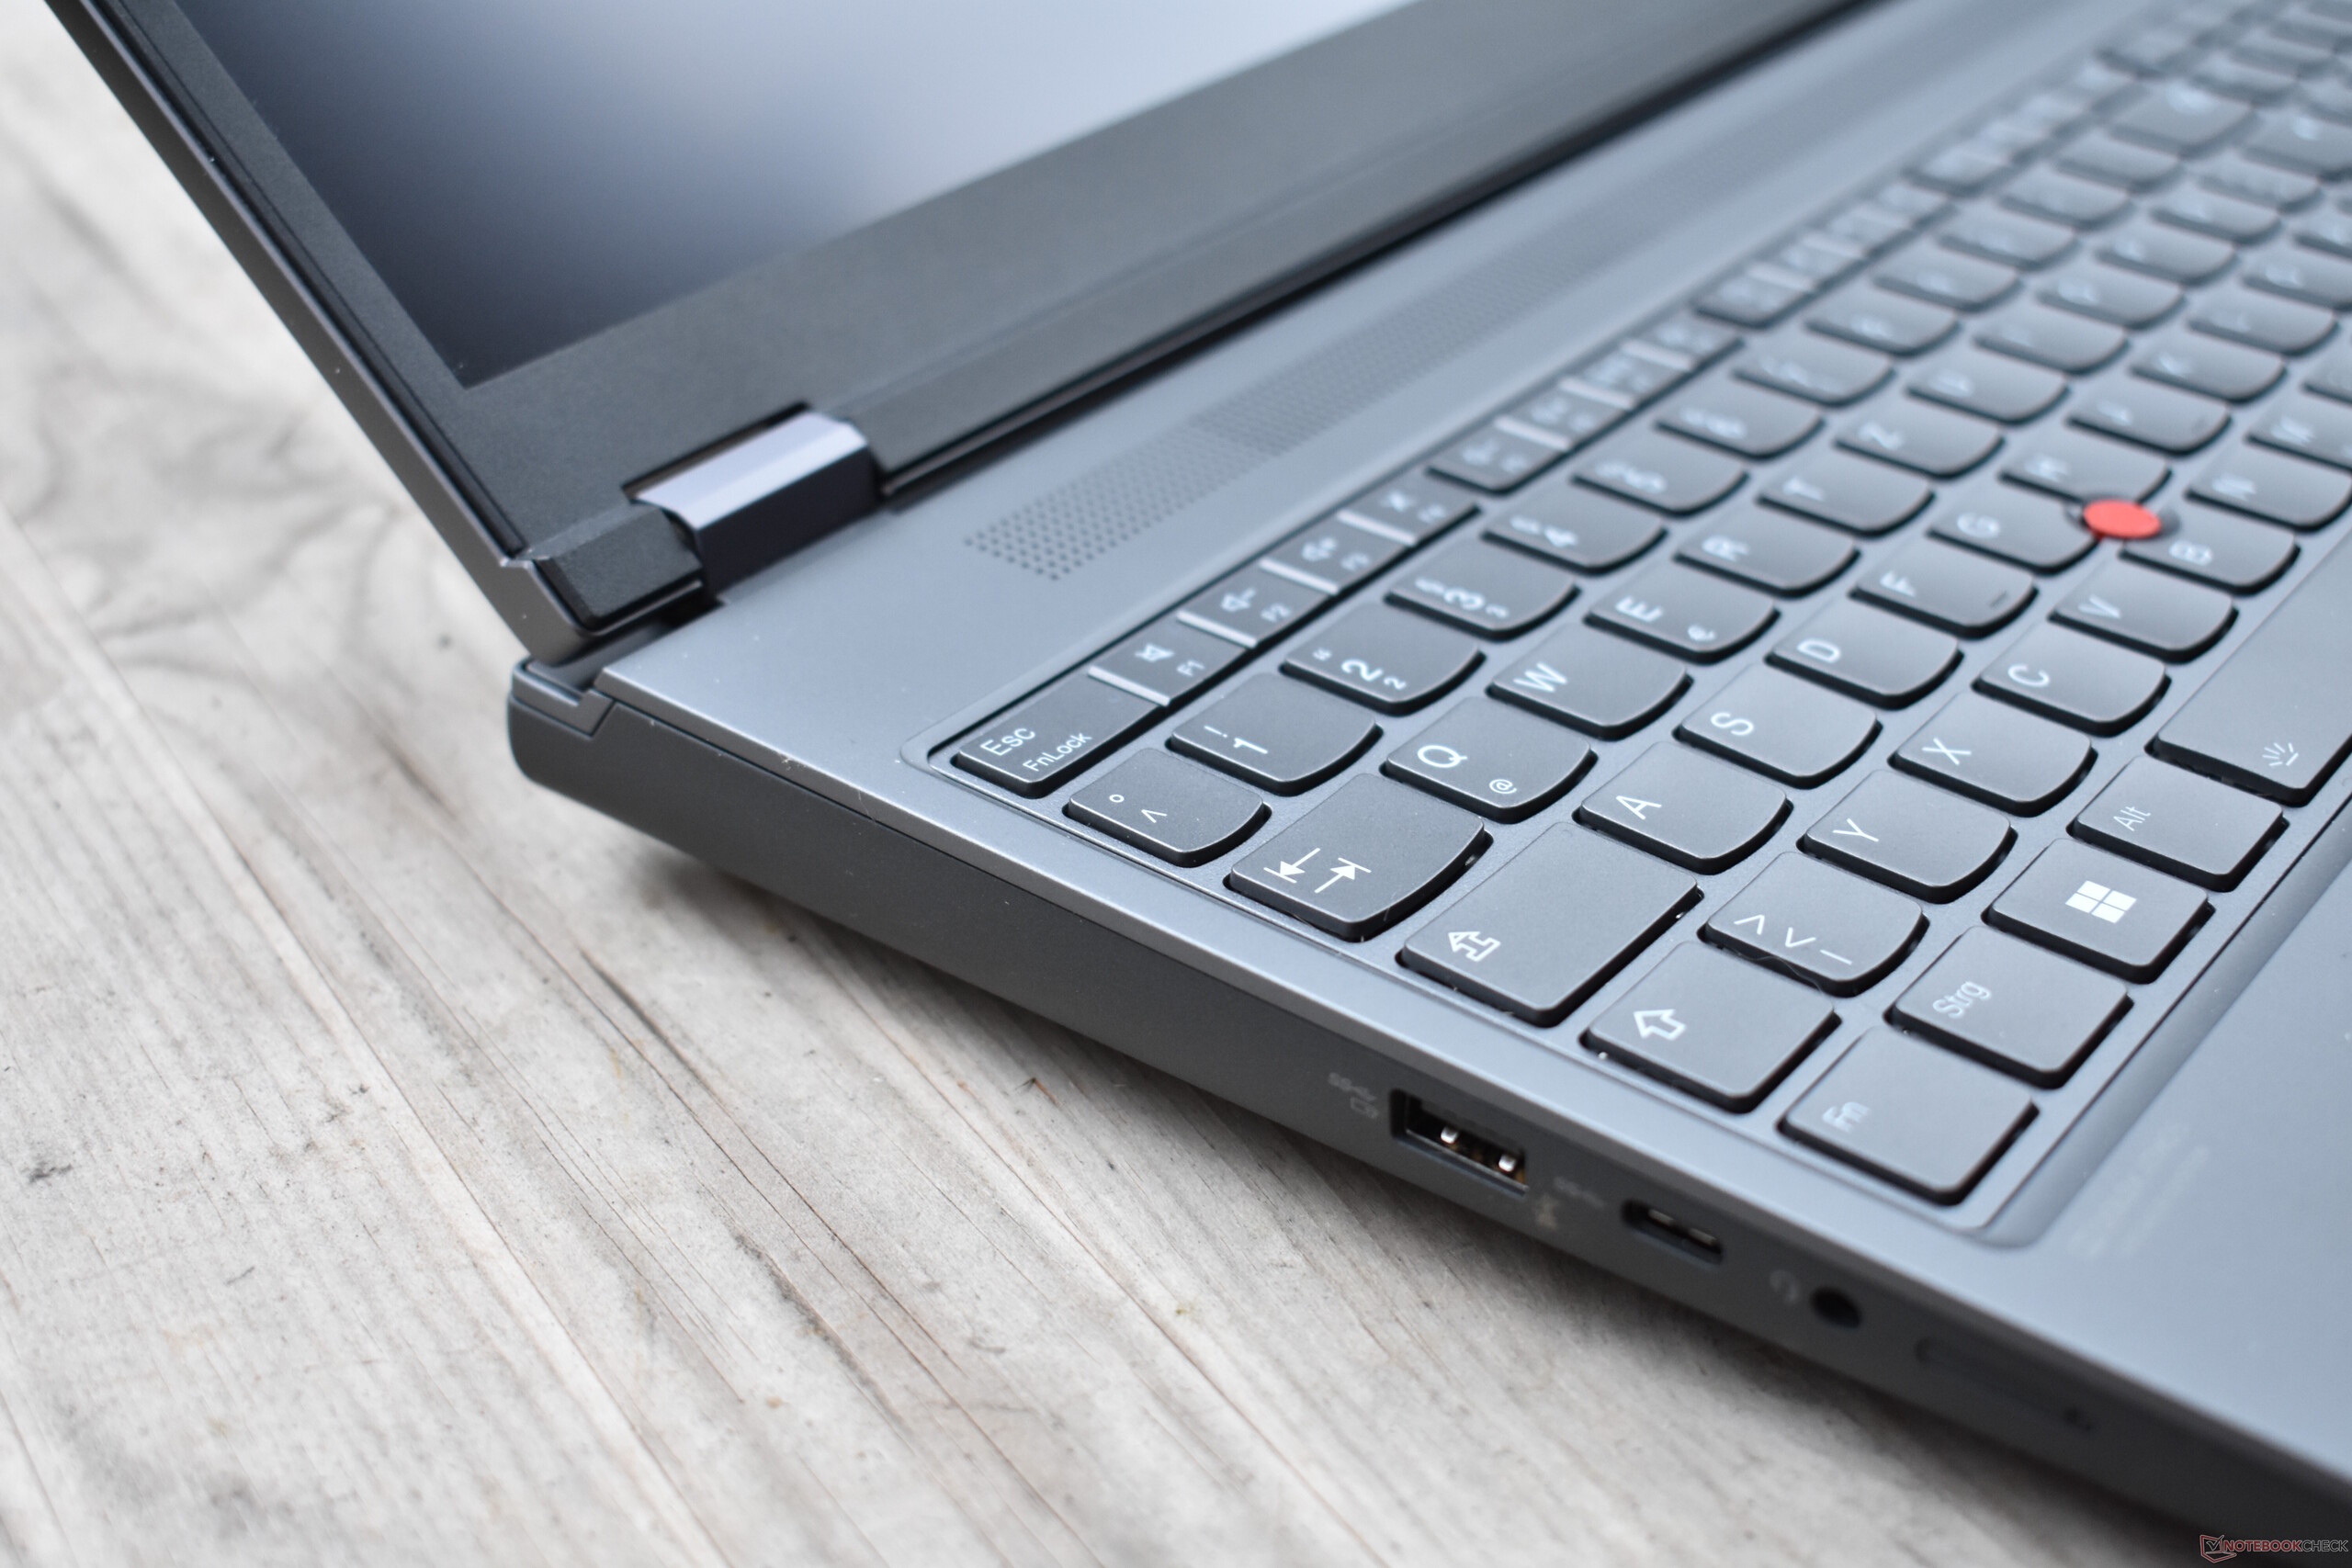
En commençant par la couleur, Lenovo a complètement remanié le clavier du ThinkPad P16. Le clavier est maintenant gris sur toute sa surface, ce qui, à notre avis, n'est pas aussi élégant. Bien qu'il s'agisse d'un point de critique relativement insignifiant, la décision de réduire la course des touches du clavier rétroéclairé de 1,8 à seulement 1,5 mm, ainsi que la hauteur réduite des touches, pèsent lourd : En conséquence, le clavier du ThinkPad perd un peu du flair particulier qu'il avait auparavant. Néanmoins, nous avons toujours affaire à un très bon clavier offrant une expérience de frappe merveilleusement agréable - même si le dispositif Lenovo ne se distingue plus guère de ses concurrents HP et Dell. On peut se demander pourquoi Lenovo a choisi de raccourcir la course des touches d'une station de travail aussi grande et épaisse.
Lenovo n'a apporté aucun changement à la disposition des touches, tout est resté en l'état. Un seul changement est de nature optique : les touches extérieures sont désormais carrées et non plus arrondies. Comme il ne s'agit pas des touches de lettres, cela n'a pas eu d'impact négatif sur l'expérience de frappe. Tout comme les touches arrondies, les touches carrées sont de forme légèrement concave.
Pavé tactile et TrackPoint
Le pavé tactile du Lenovo ThinkPad P16 G1 semble plus large que celui des modèles précédents et, en termes de largeur, il a maintenant gagné 11,5 cm. La surface est faite de plastique qui semble encore plus lisse que son prédécesseur. En termes de manipulation, le pavé tactile est très bon et traduit parfaitement les gestes multitouch. Toutefois, le retour haptique est inférieur à celui des trackpads en verre. Comme nous avons affaire à un trackpad mécanique, il n'est possible d'appliquer des clics que sur la partie inférieure du pavé. Le mécanisme de clic est plutôt terne, mais il n'est ni bruyant ni instable.
Le TrackPoint reste une bonne alternative au pavé tactile si le pointeur de la souris doit être déplacé rapidement pendant la frappe. Par rapport à son prédécesseur, le bâton de pointage rouge à capuchon en caoutchouc est resté inchangé. En revanche, Lenovo a redessiné les touches dédiées au TrackPoint, qui ont désormais un aspect plus moderne sans rien perdre de leur convivialité.
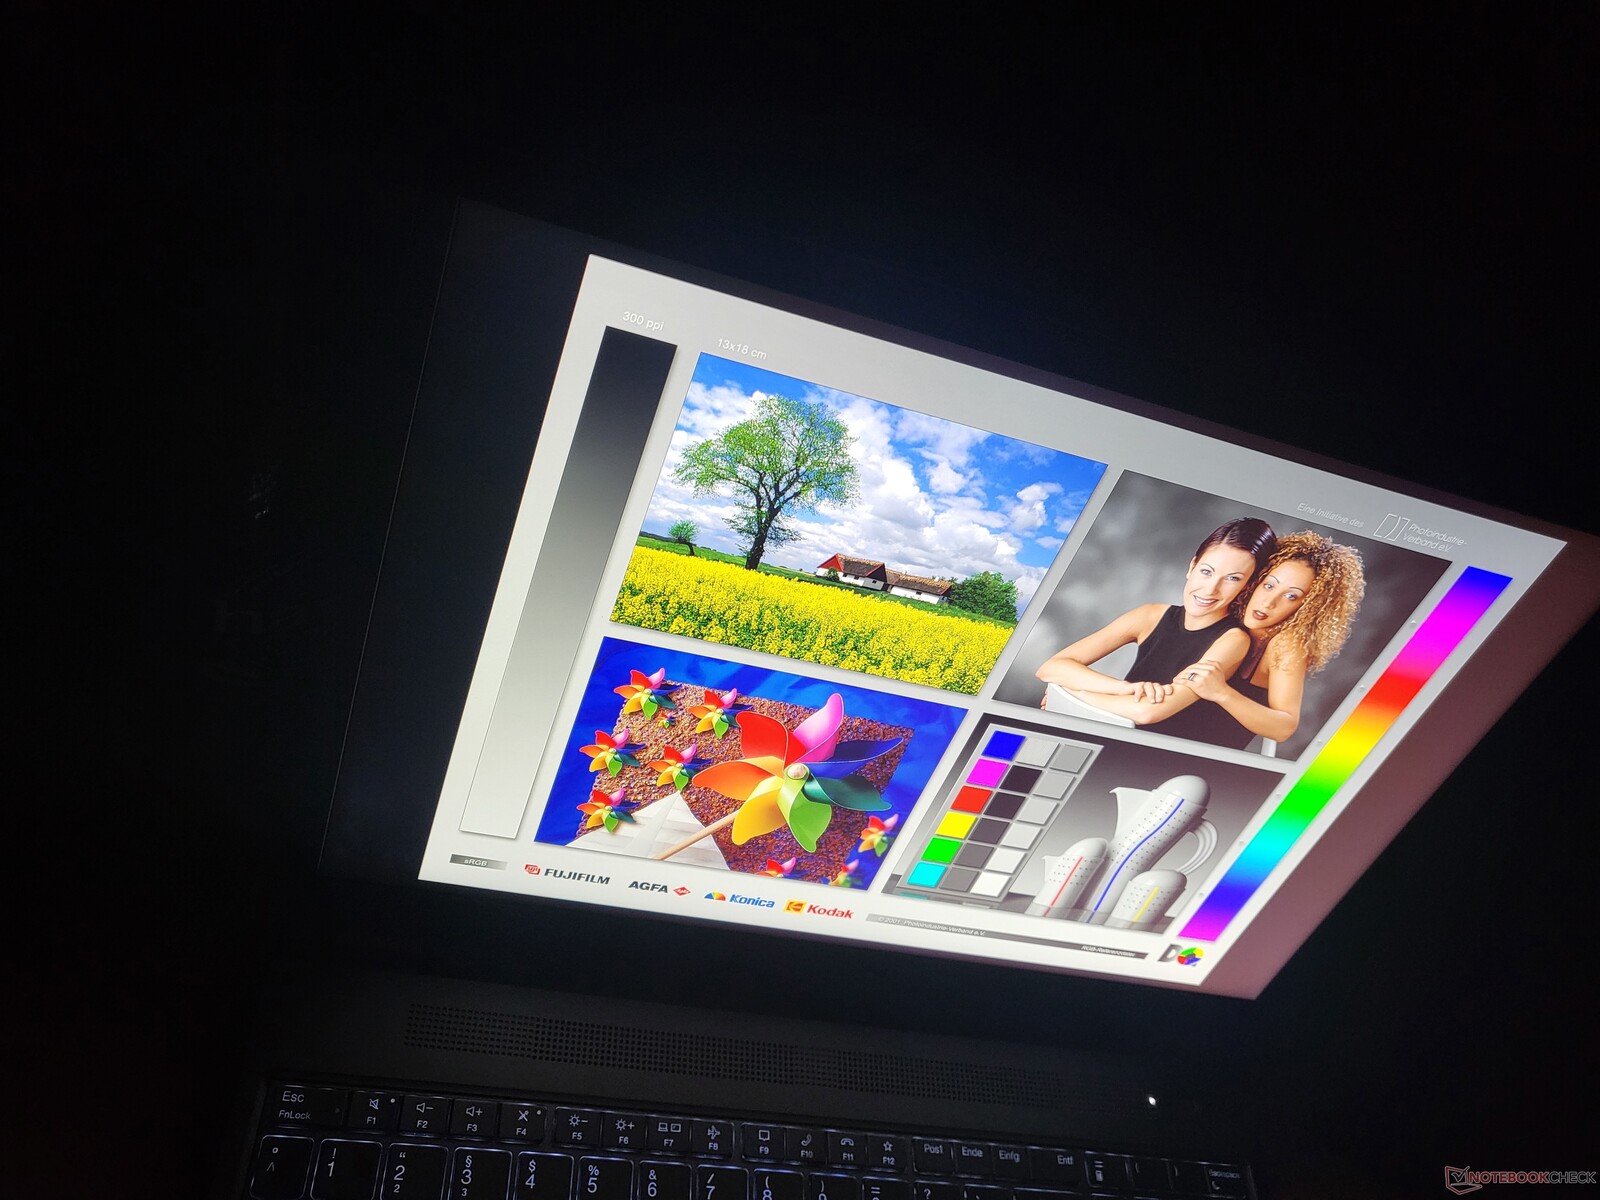
Affichage : Une nouvelle option LCD WQXGA pour la station de travail Thinkpad
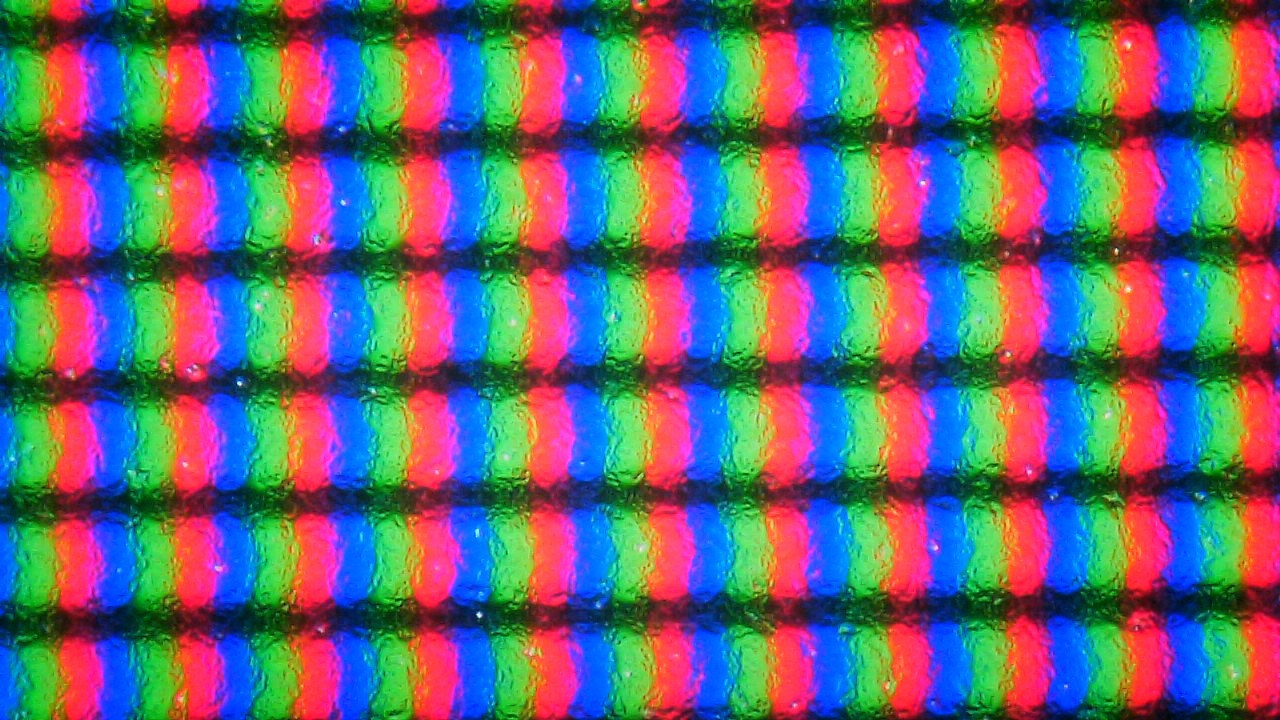
Comme d'habitude pour les ordinateurs portables ThinkPad, le Lenovo ThinkPad P16 2022 offre une sélection de différentes options d'affichage qui couvrent une variété d'applications et de catégories de prix. Toutes ces options ont en commun un format 16:10 et des écrans de 16 pouces :
- WUXGA (1920 x 1200), IPS, 300 cd/m², 100 % sRGB, mat
- WQXGA (2560 x 1600), IPS, 400 cd/m², 100 % sRGB, matte
- WQUXGA (3840 x 2400), IPS, 600 cd/m², 100 % AdobeRGB, mat
- WQUXGA (3840 x 2400), OLED, 400 cd/m², 100 % DCI-P3, antireflet, multi-touch
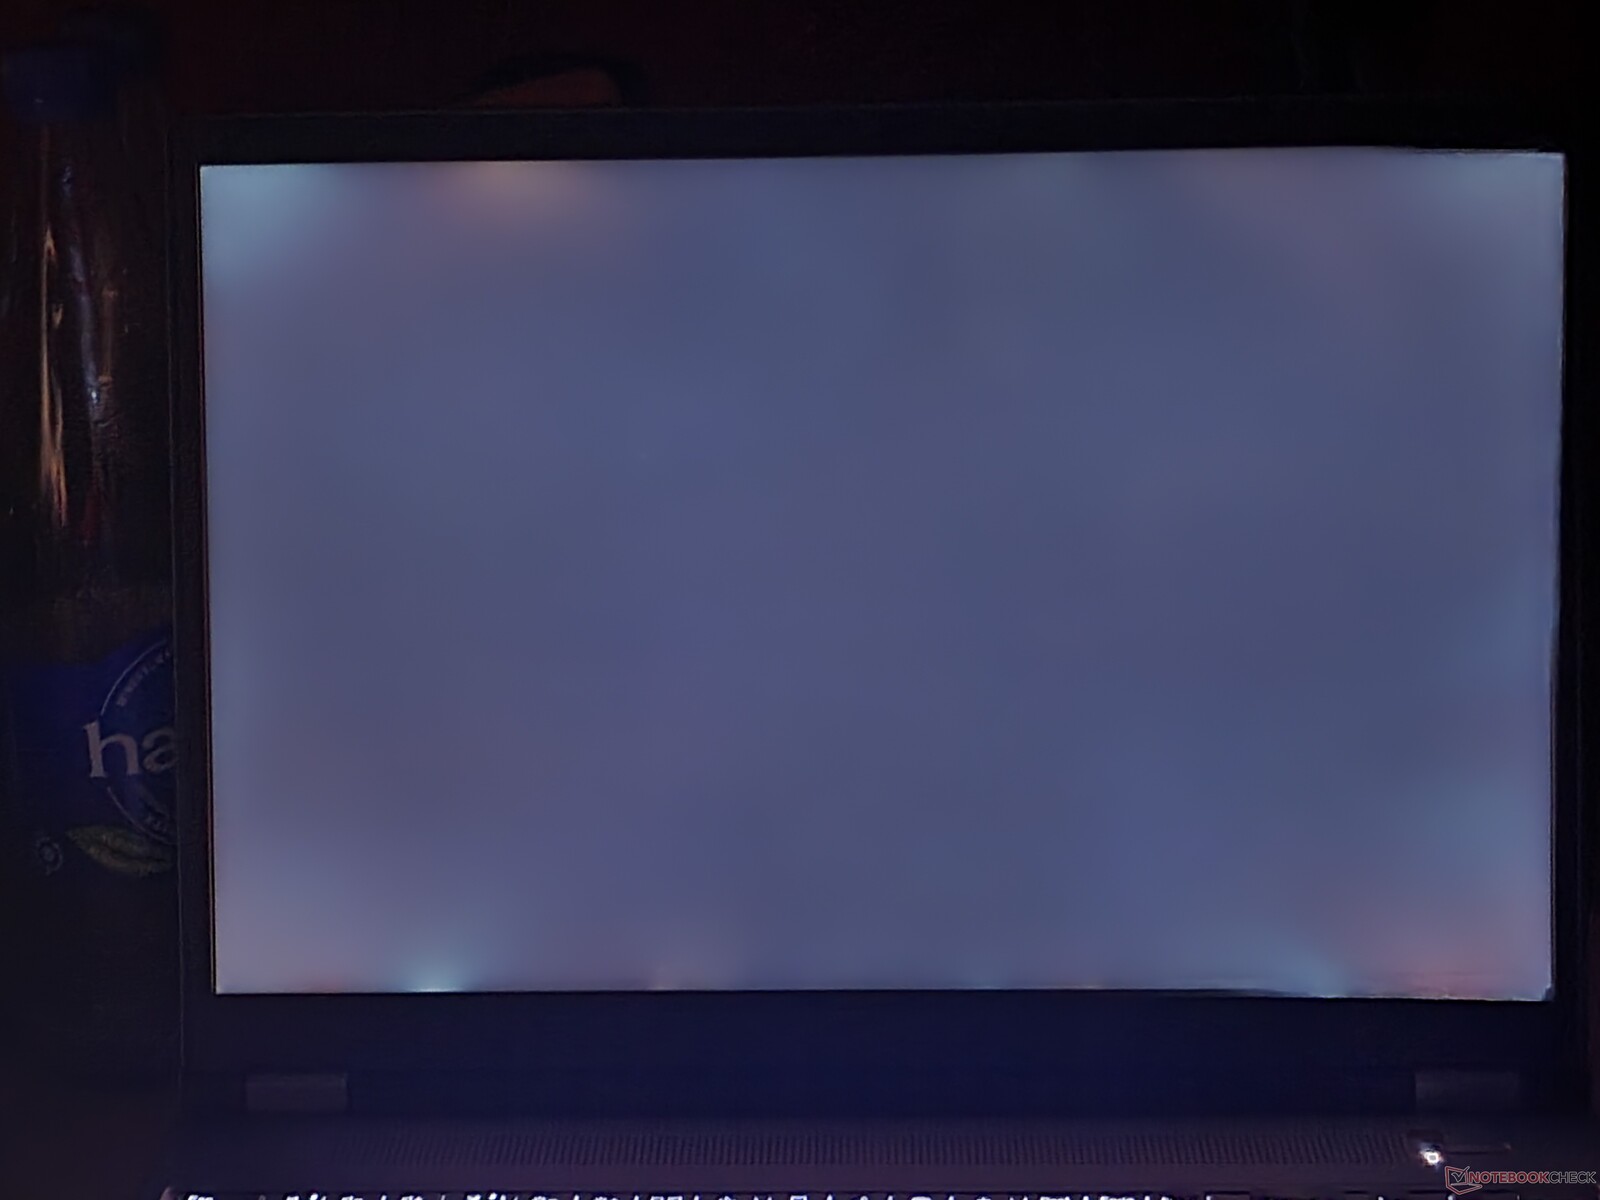
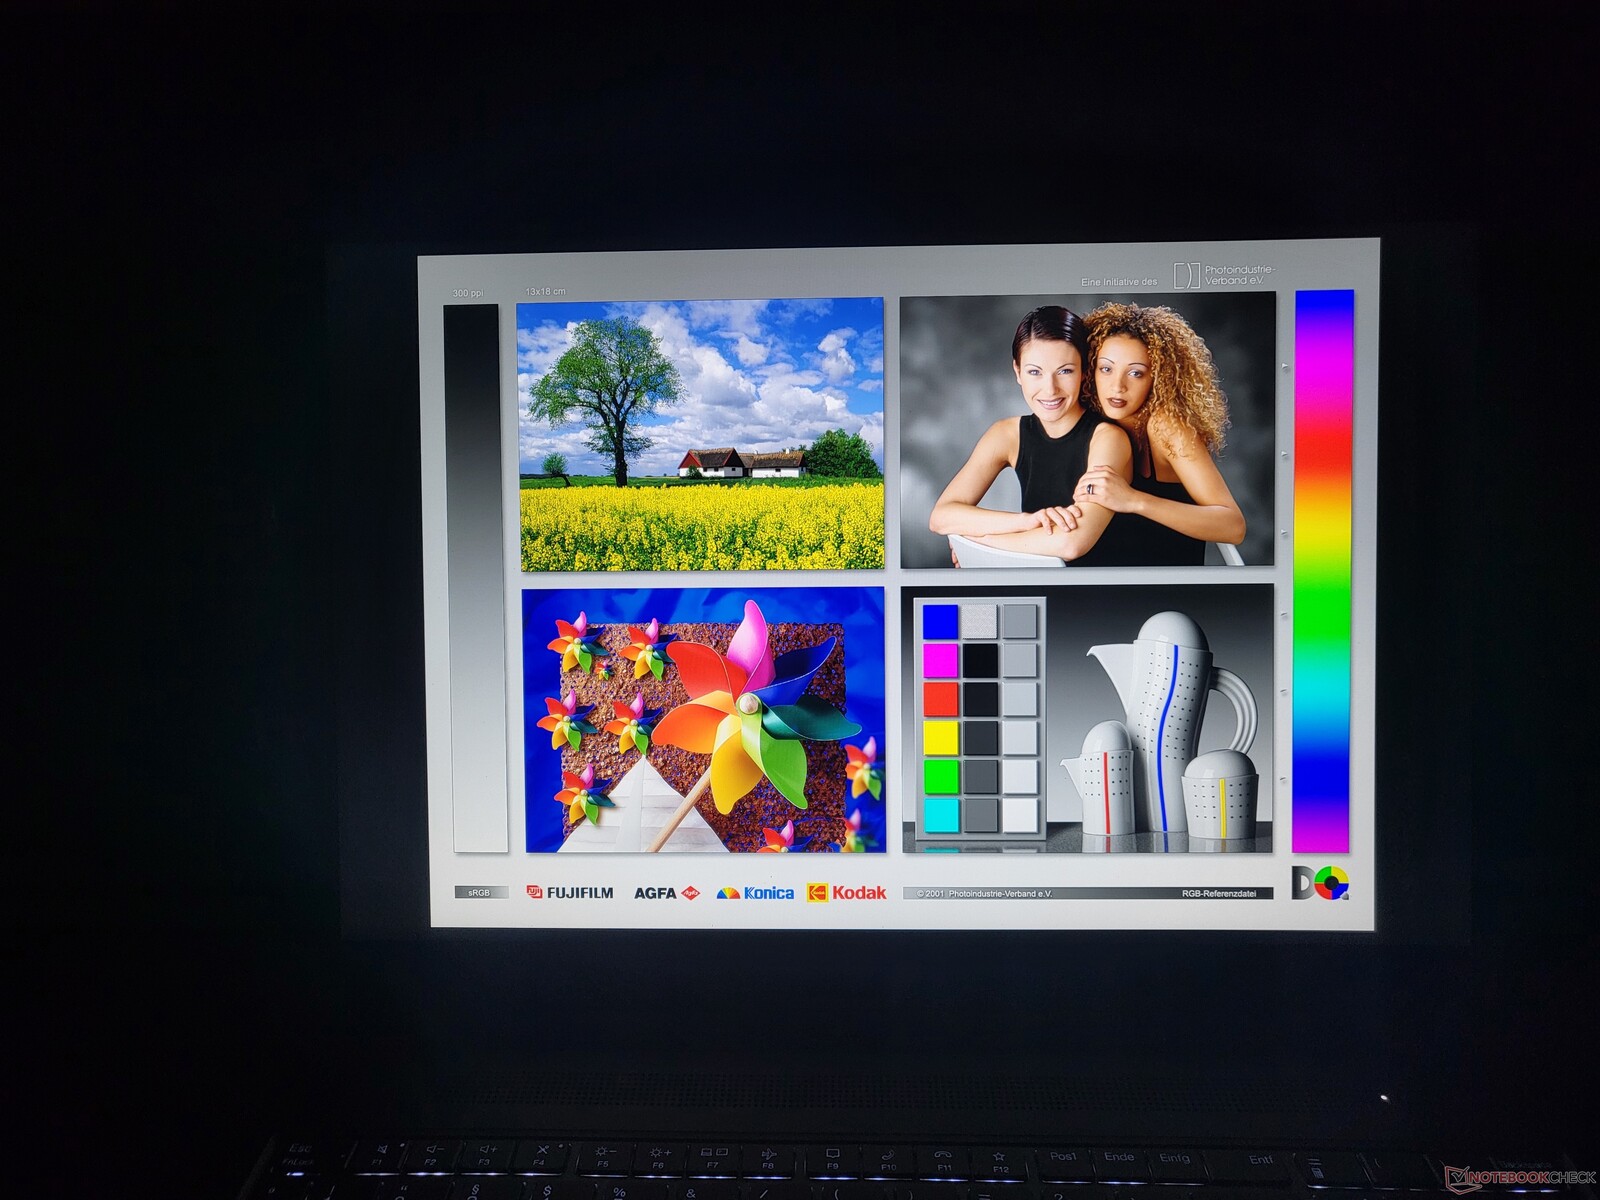
Le niveau de résolution moyen de 2,5K que l'on trouve dans le P16 est nouveau car les P15 et P17 n'étaient disponibles qu'en 16:9 avec soit Full-HD (1920 x 1080) soit 4K UHD (3840 x 2160). L'écran WQXGA intégré fournit les 400 cd/m² annoncés presque sur le bouton avec une moyenne de 398 cd/m². Par rapport à ses homologues directs, cela le place en milieu de peloton. L'écran de l'Asus ExpertBook B6 Flip est légèrement plus lumineux.
| |||||||||||||||||||||||||
Homogénéité de la luminosité: 90 %
Valeur mesurée au centre, sur batterie: 424 cd/m²
Contraste: 1767:1 (Valeurs des noirs: 0.24 cd/m²)
ΔE ColorChecker Calman: 2.6 | ∀{0.5-29.43 Ø4.71}
calibrated: 0.8
ΔE Greyscale Calman: 4.1 | ∀{0.09-98 Ø4.96}
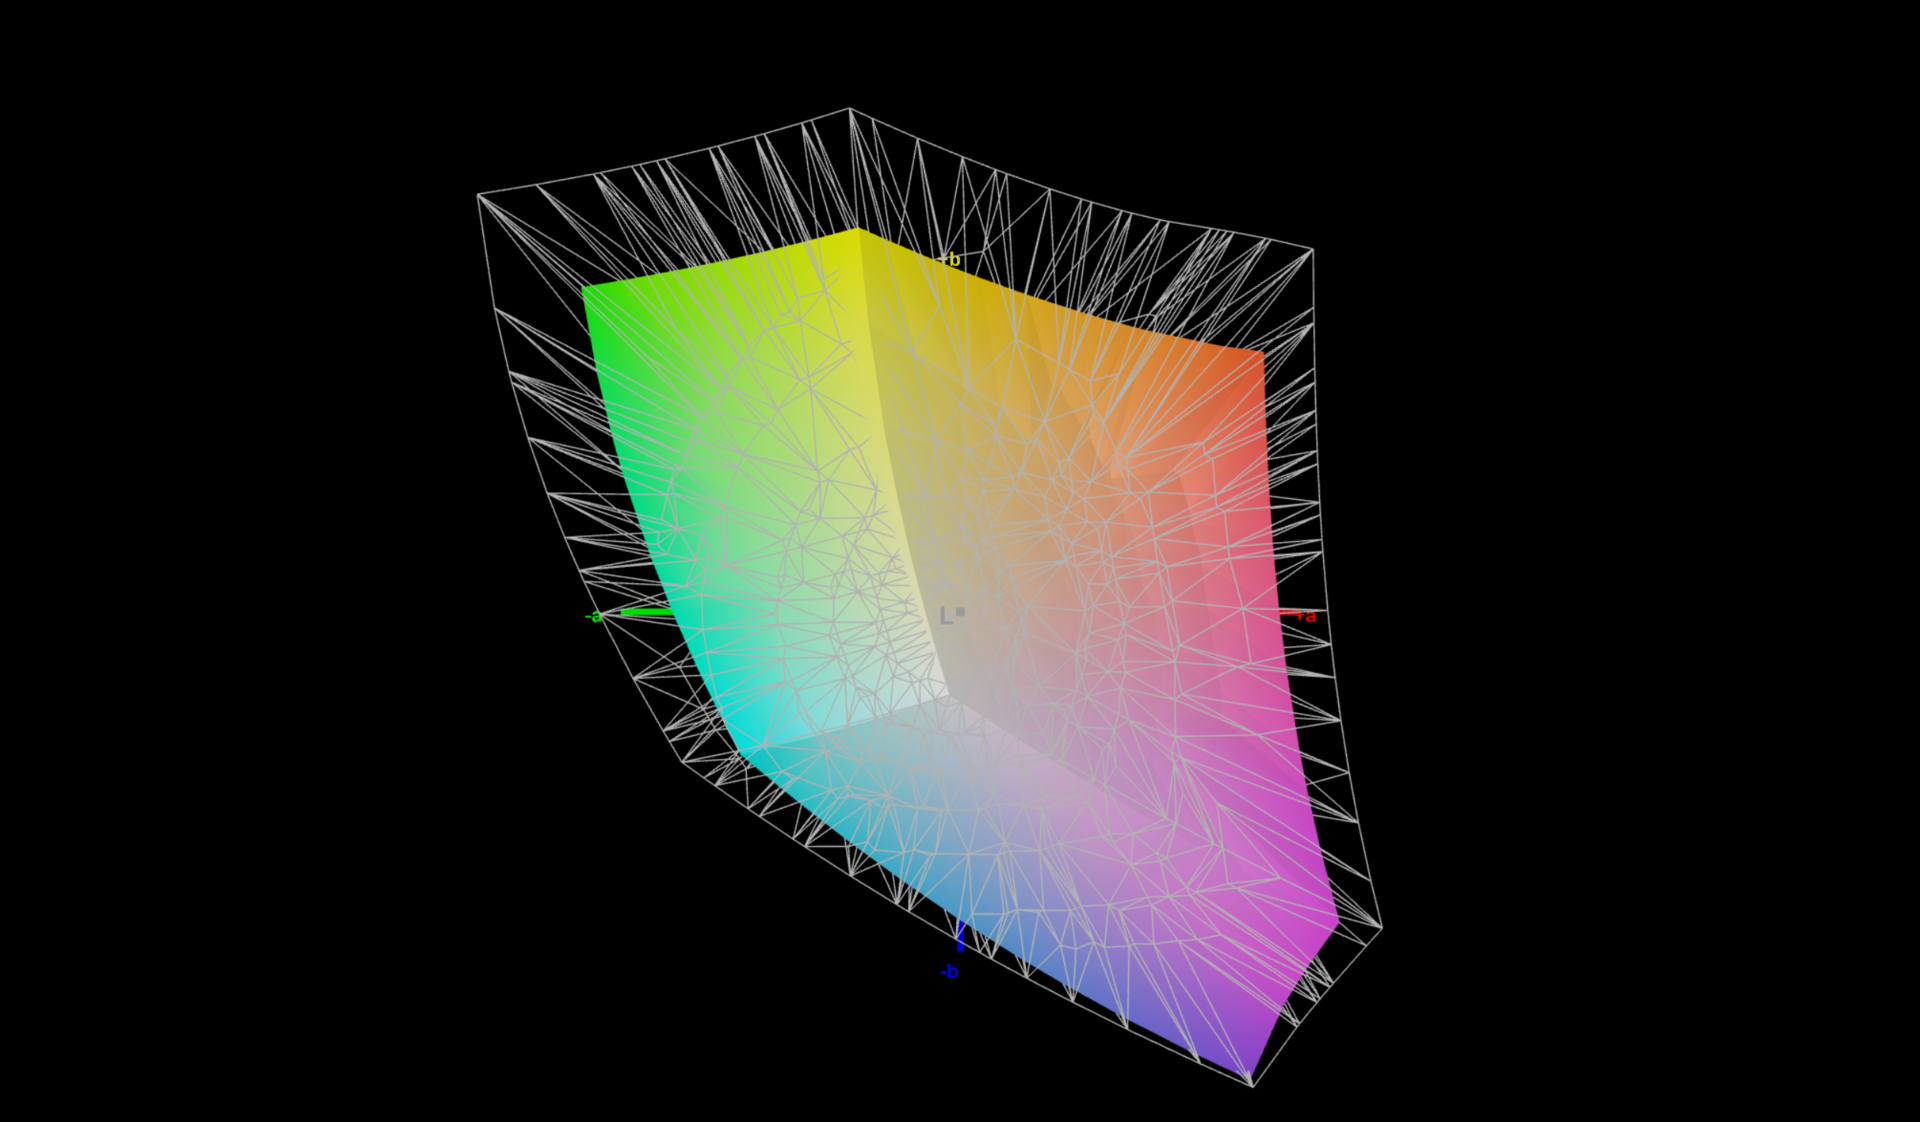
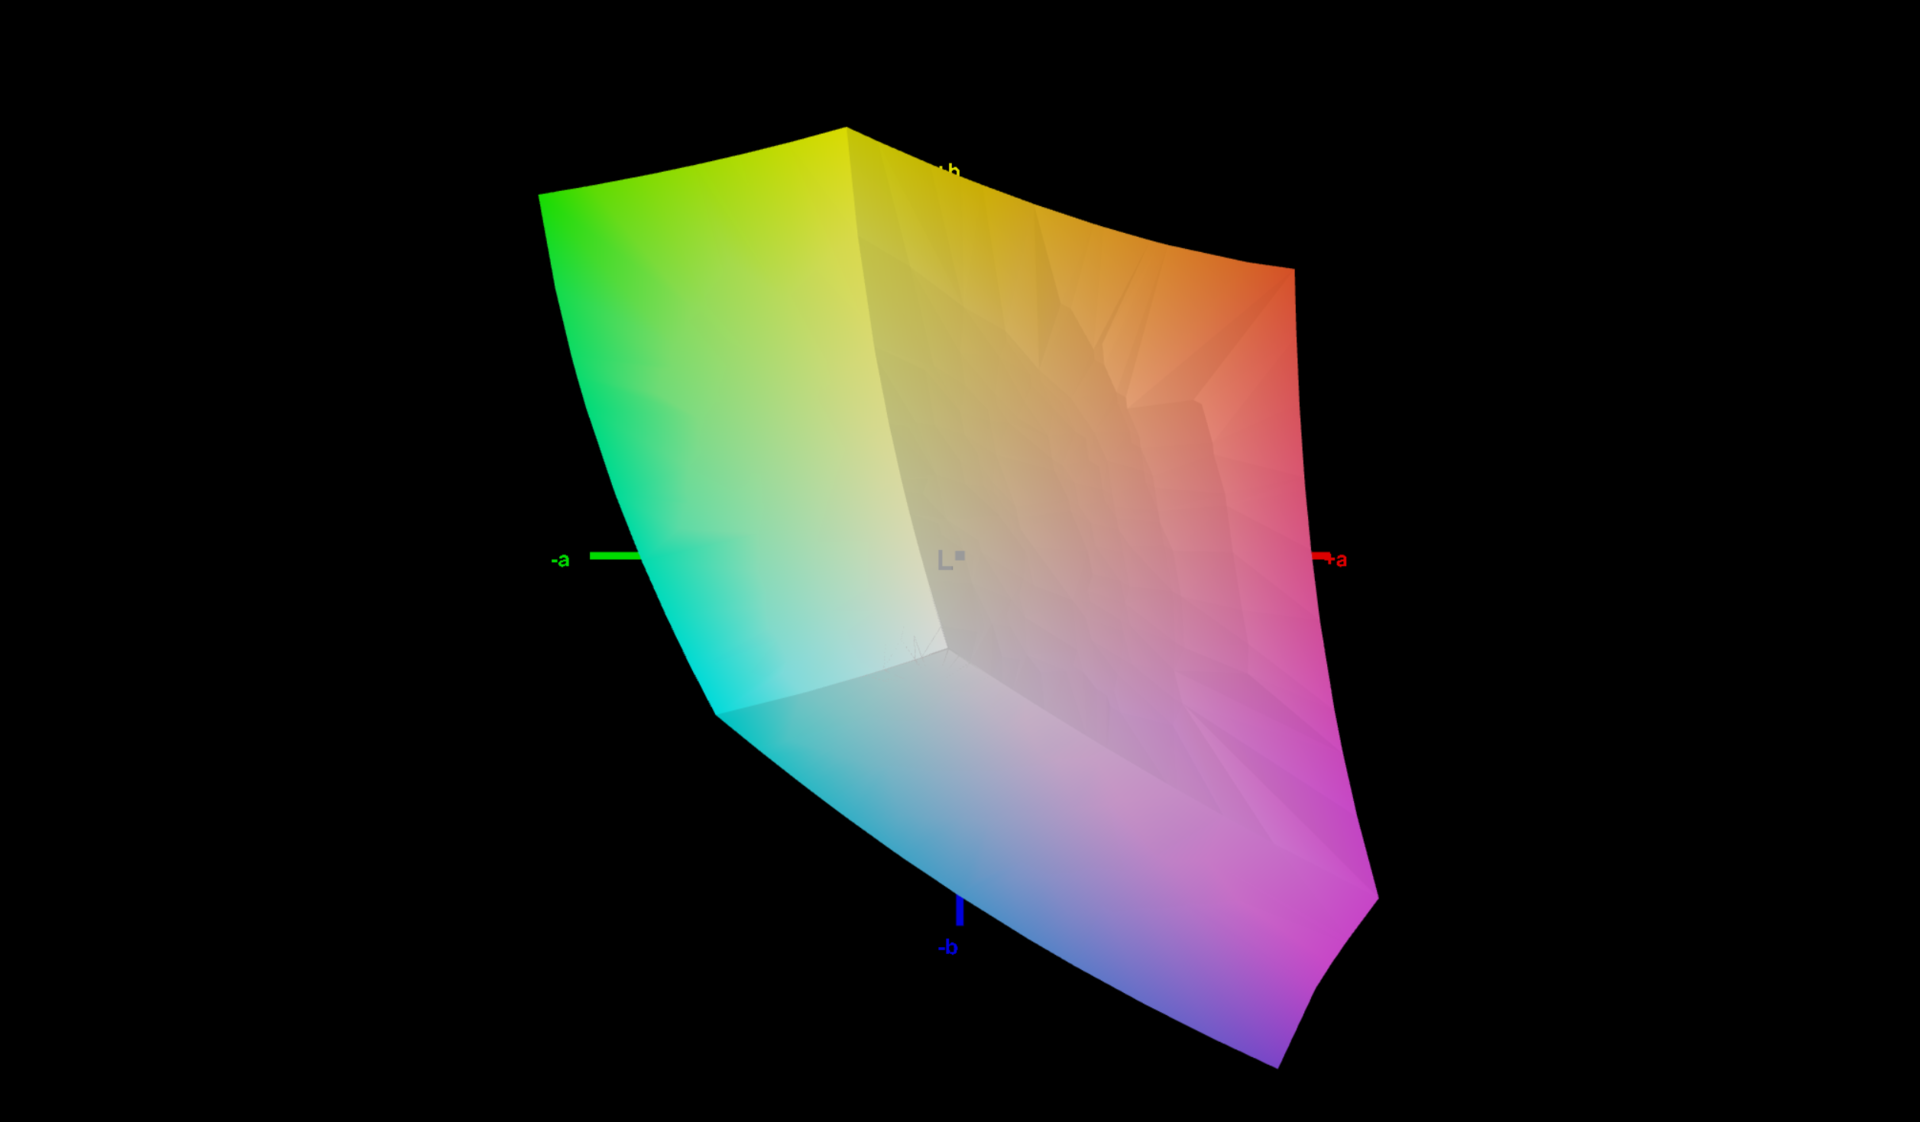
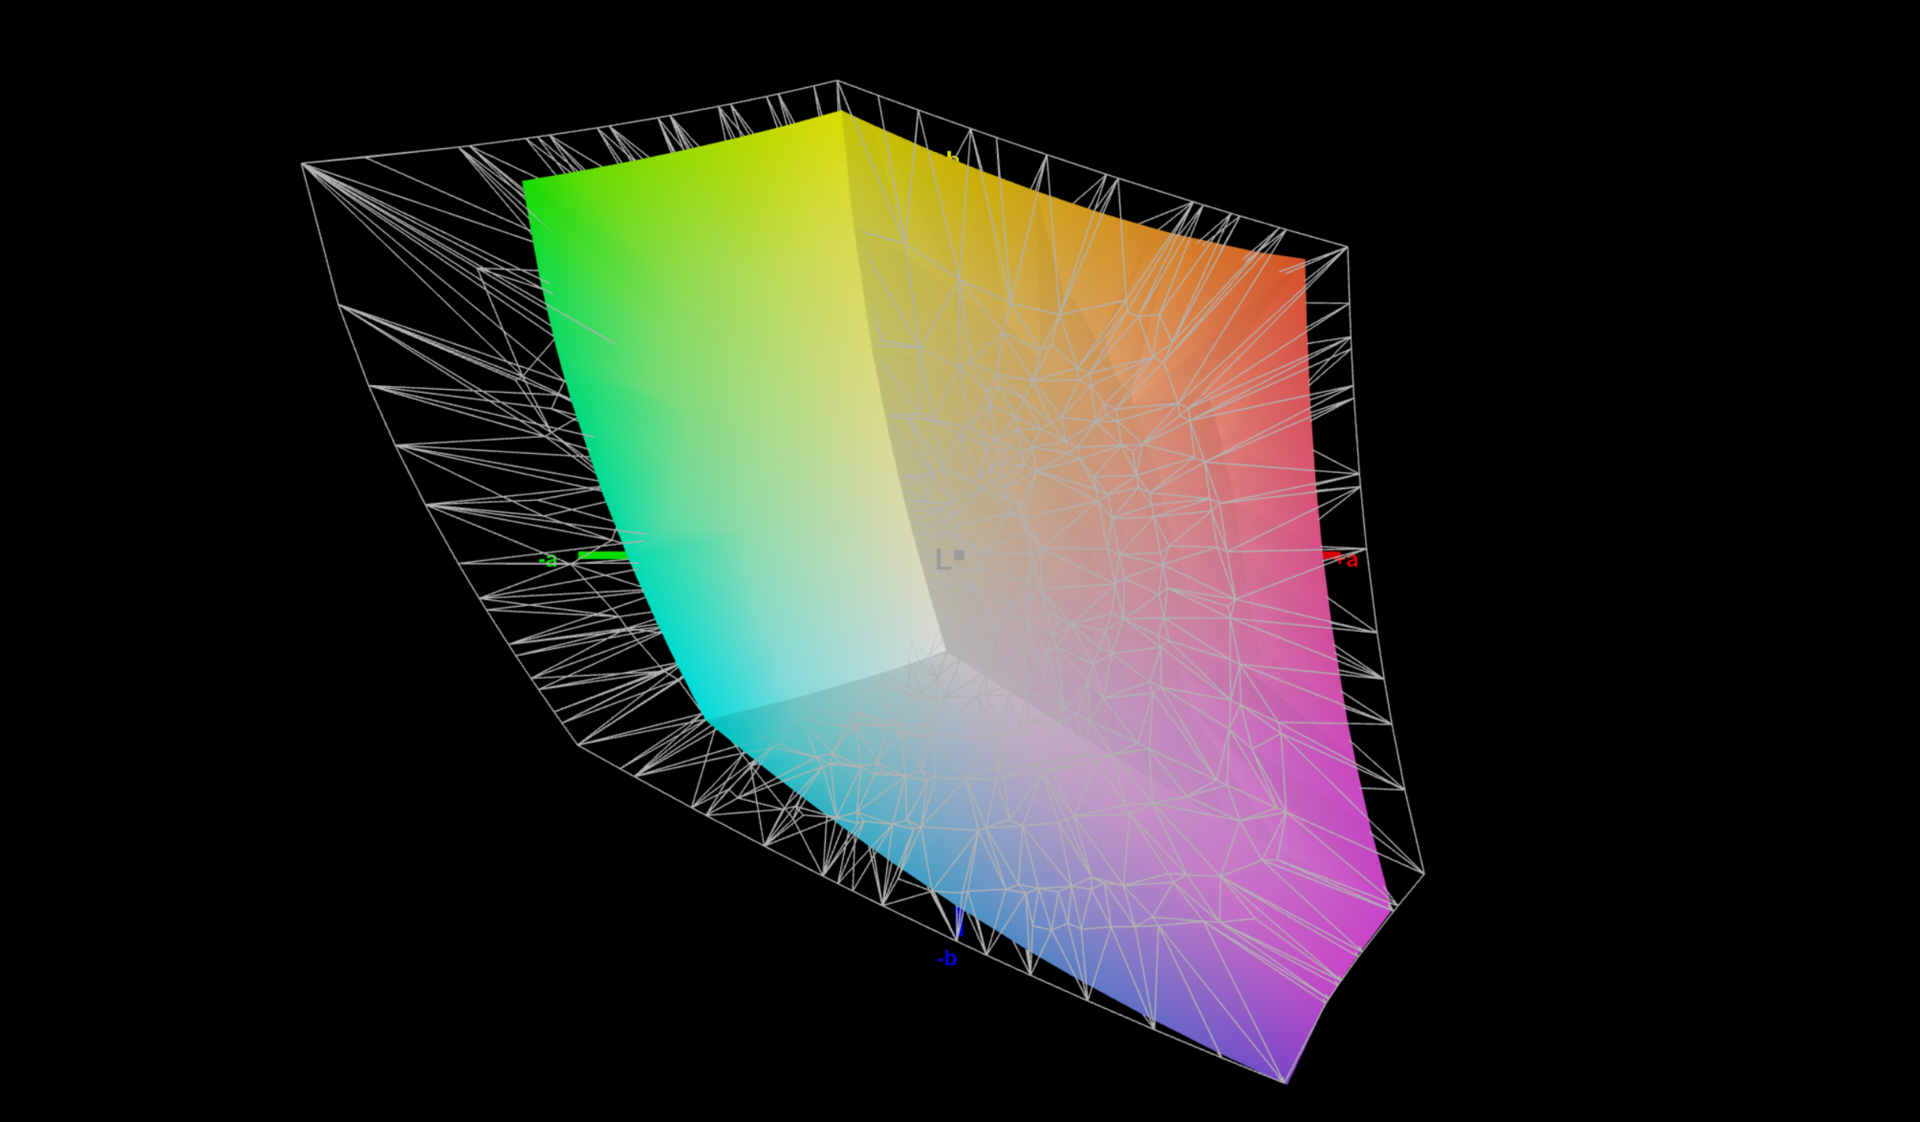
73.3% AdobeRGB 1998 (Argyll 3D)
100% sRGB (Argyll 3D)
71.5% Display P3 (Argyll 3D)
Gamma: 2.13
CCT: 7252 K
| Lenovo ThinkPad P16 G1 21D6001DMB NE160QDM-N63 , IPS LED, 2560x1600, 16" | Lenovo ThinkPad P15 G2-20YQ001JGE N156HCE_GN1, IPS, 1920x1080, 15.6" | Lenovo ThinkPad P17 G2-20YU0025G LP173WF4-SPF7, IPS LED, 1920x1080, 17.3" | HP ZBook Fury 17 G8-4A6A9EA AUOCD8C, IPS, 3840x2160, 17.3" | Dell Precision 7670 Samsung 160YV03, OLED, 3840x2400, 16" | Asus ExpertBook B6 Flip B6602FC2 AU Optronics Model: AUOE495, IPS, 2560x1600, 16" | |
|---|---|---|---|---|---|---|
| Display | -3% | -10% | 19% | 24% | 18% | |
| Display P3 Coverage (%) | 71.5 | 68.6 -4% | 67.9 -5% | 99.1 39% | 99.9 40% | 97.9 37% |
| sRGB Coverage (%) | 100 | 99.8 0% | 87.3 -13% | 100 0% | 100 0% | 99.89 0% |
| AdobeRGB 1998 Coverage (%) | 73.3 | 70.6 -4% | 63.9 -13% | 86.8 18% | 97.5 33% | 85.52 17% |
| Response Times | 20% | 6% | -41% | 94% | 20% | |
| Response Time Grey 50% / Grey 80% * (ms) | 37.7 ? | 37.6 ? -0% | 39.2 ? -4% | 67.6 ? -79% | 1.9 ? 95% | 36 ? 5% |
| Response Time Black / White * (ms) | 26.3 ? | 16 ? 39% | 22.4 ? 15% | 26.8 ? -2% | 2 ? 92% | 17 ? 35% |
| PWM Frequency (Hz) | 26040 ? | 59.5 ? | ||||
| Screen | -3% | -77% | 27% | -12% | -27% | |
| Brightness middle (cd/m²) | 424 | 498 17% | 361 -15% | 568 34% | 340.1 -20% | 440 4% |
| Brightness (cd/m²) | 398 | 490 23% | 334 -16% | 564 42% | 342 -14% | 418 5% |
| Brightness Distribution (%) | 90 | 95 6% | 87 -3% | 88 -2% | 98 9% | 82 -9% |
| Black Level * (cd/m²) | 0.24 | 0.39 -63% | 0.35 -46% | 0.33 -38% | 0.3 -25% | |
| Contrast (:1) | 1767 | 1277 -28% | 1031 -42% | 1721 -3% | 1467 -17% | |
| Colorchecker dE 2000 * | 2.6 | 2.1 19% | 5.4 -108% | 1 62% | 2.5 4% | 2.81 -8% |
| Colorchecker dE 2000 max. * | 4.9 | 5.6 -14% | 9.9 -102% | 2.4 51% | 8.19 -67% | 4.62 6% |
| Colorchecker dE 2000 calibrated * | 0.8 | 0.8 -0% | 3.2 -300% | 0.5 37% | 2.99 -274% | |
| Greyscale dE 2000 * | 4.1 | 3.4 17% | 6.5 -59% | 1.7 59% | 3.5 15% | 0.91 78% |
| Gamma | 2.13 103% | 2.32 95% | 2.23 99% | 2.18 101% | 2.12 104% | 2.2 100% |
| CCT | 7252 90% | 7162 91% | 7351 88% | 6461 101% | 6704 97% | 6600 98% |
| Moyenne finale (programmes/paramètres) | 5% /
1% | -27% /
-51% | 2% /
16% | 35% /
17% | 4% /
-10% |
* ... Moindre est la valeur, meilleures sont les performances
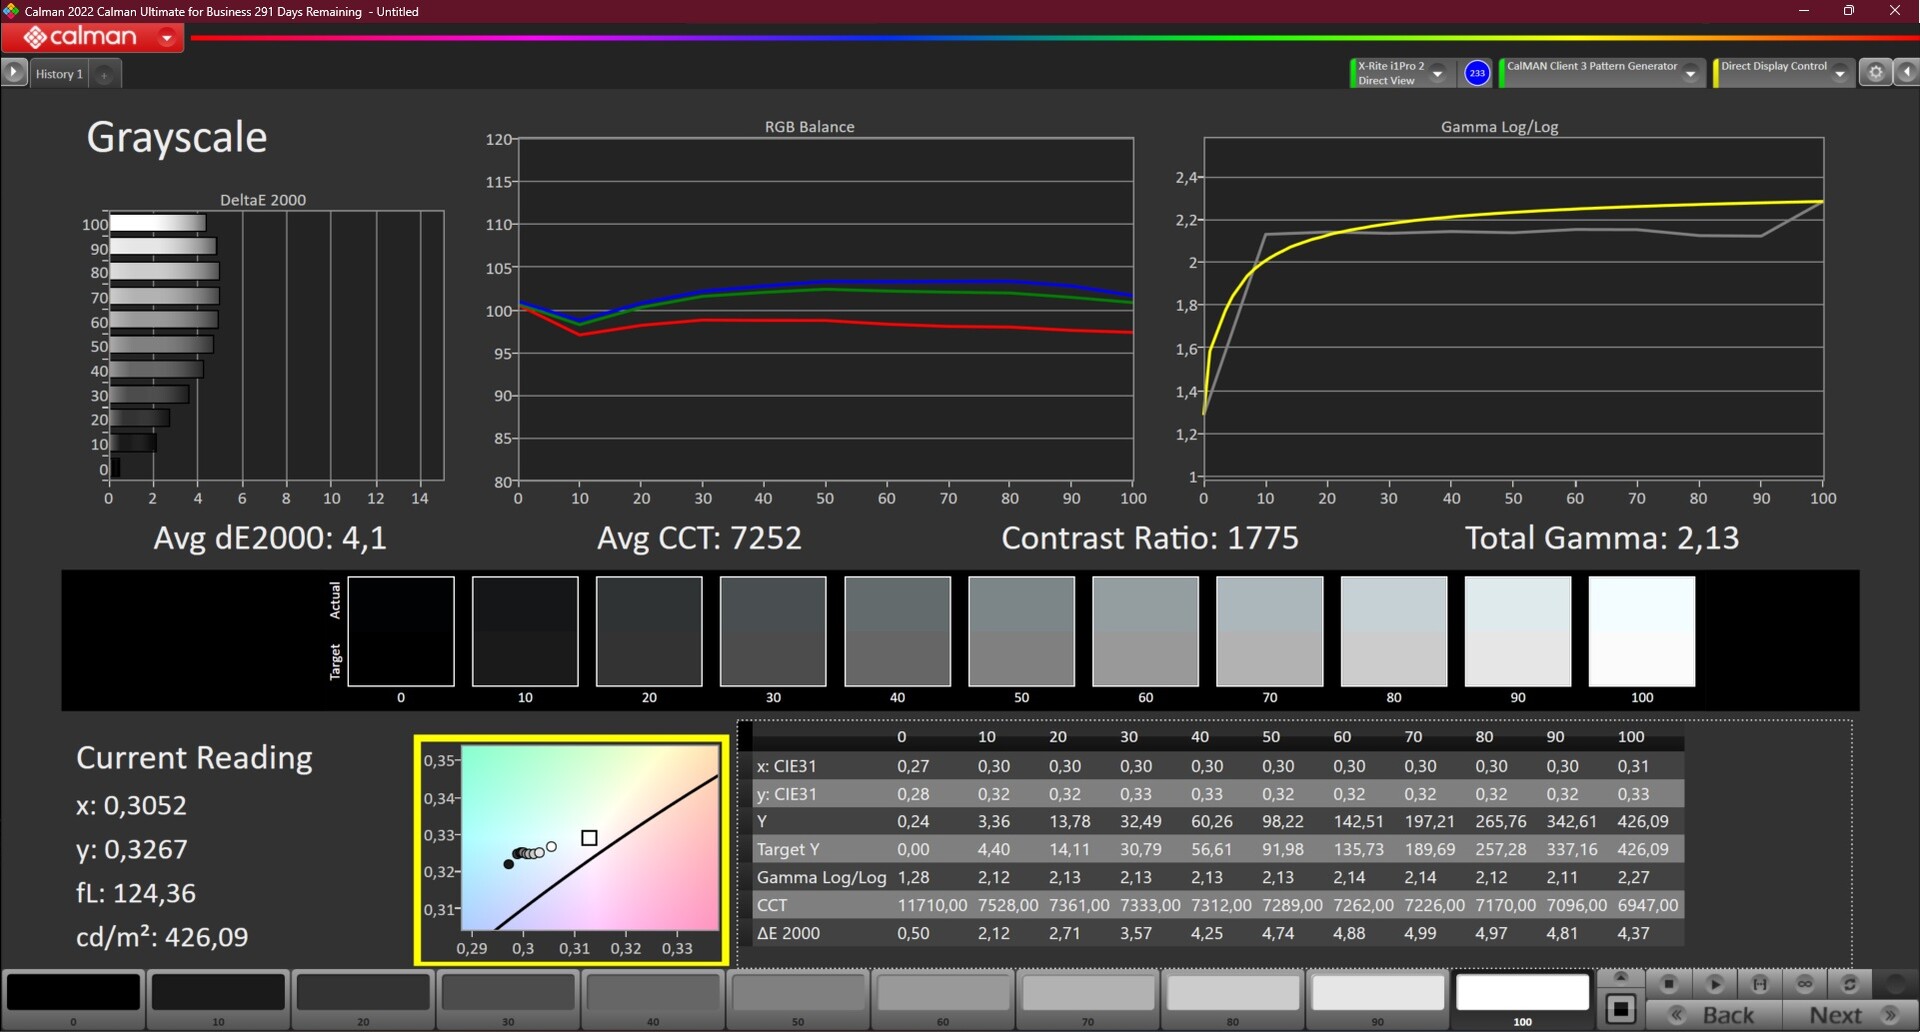
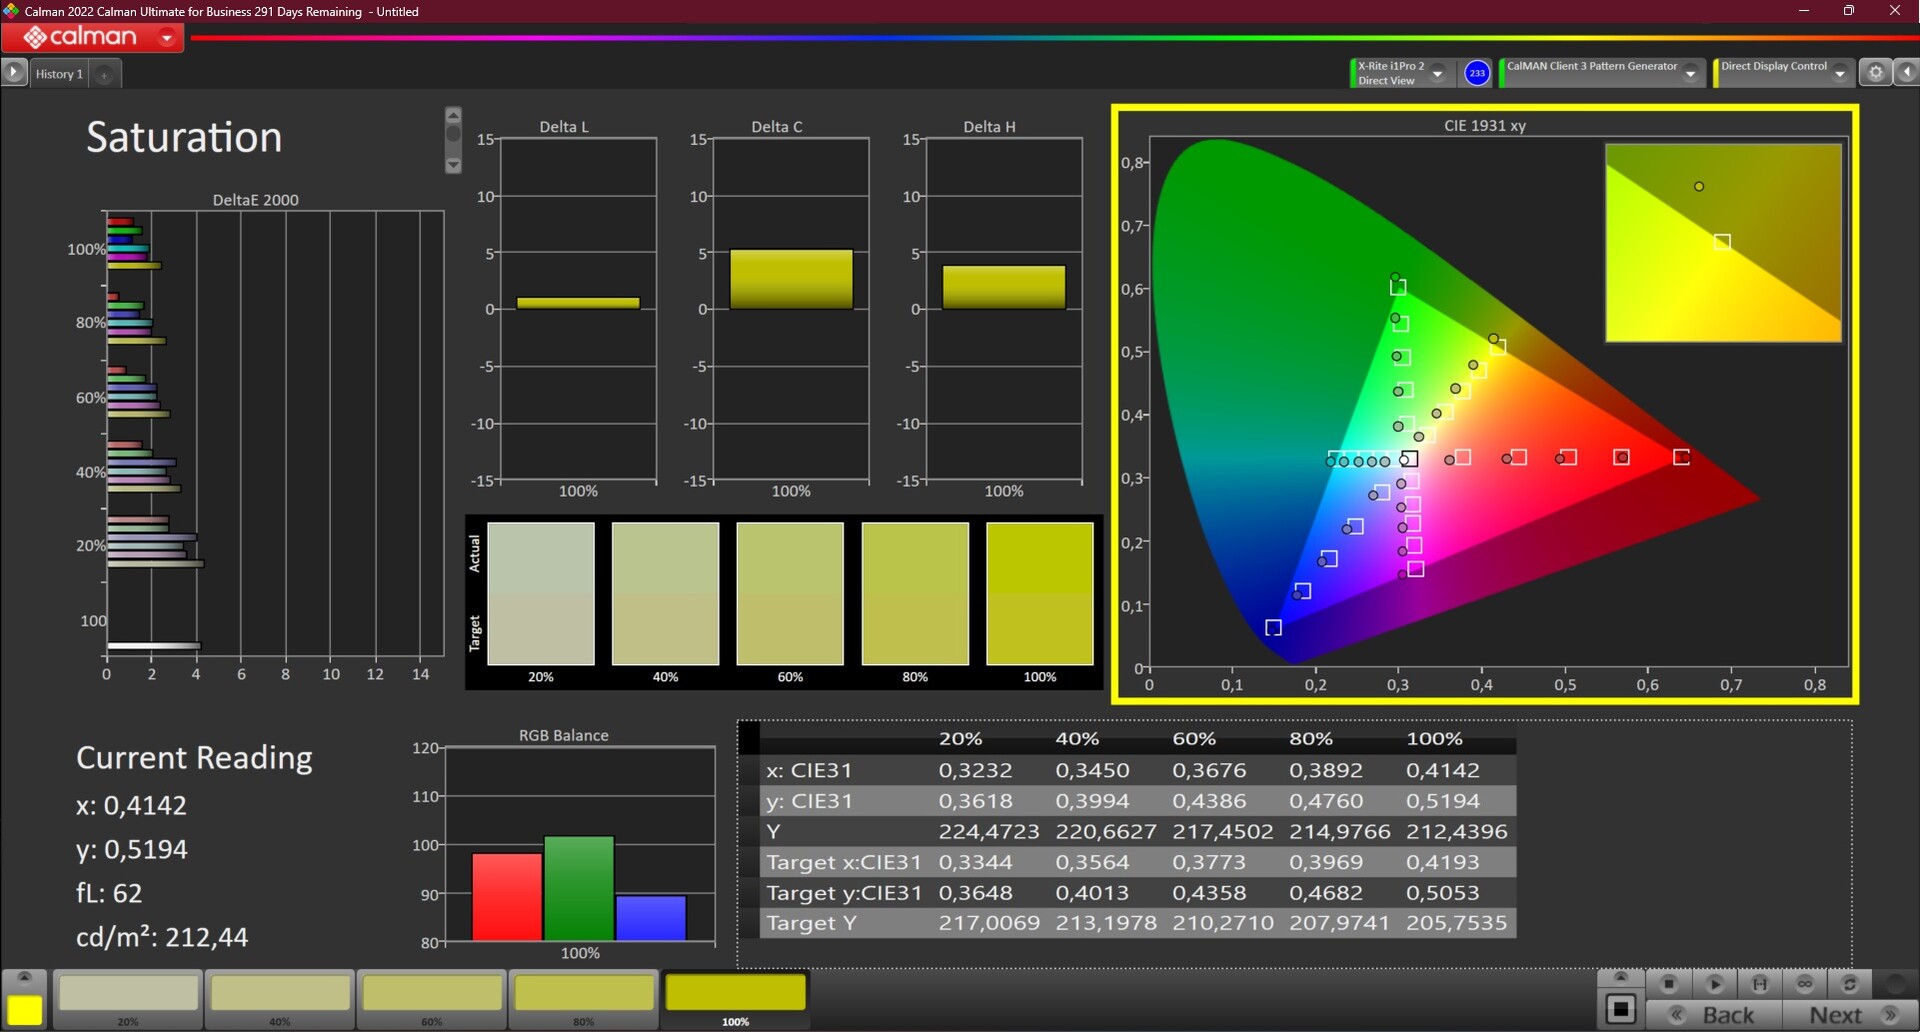
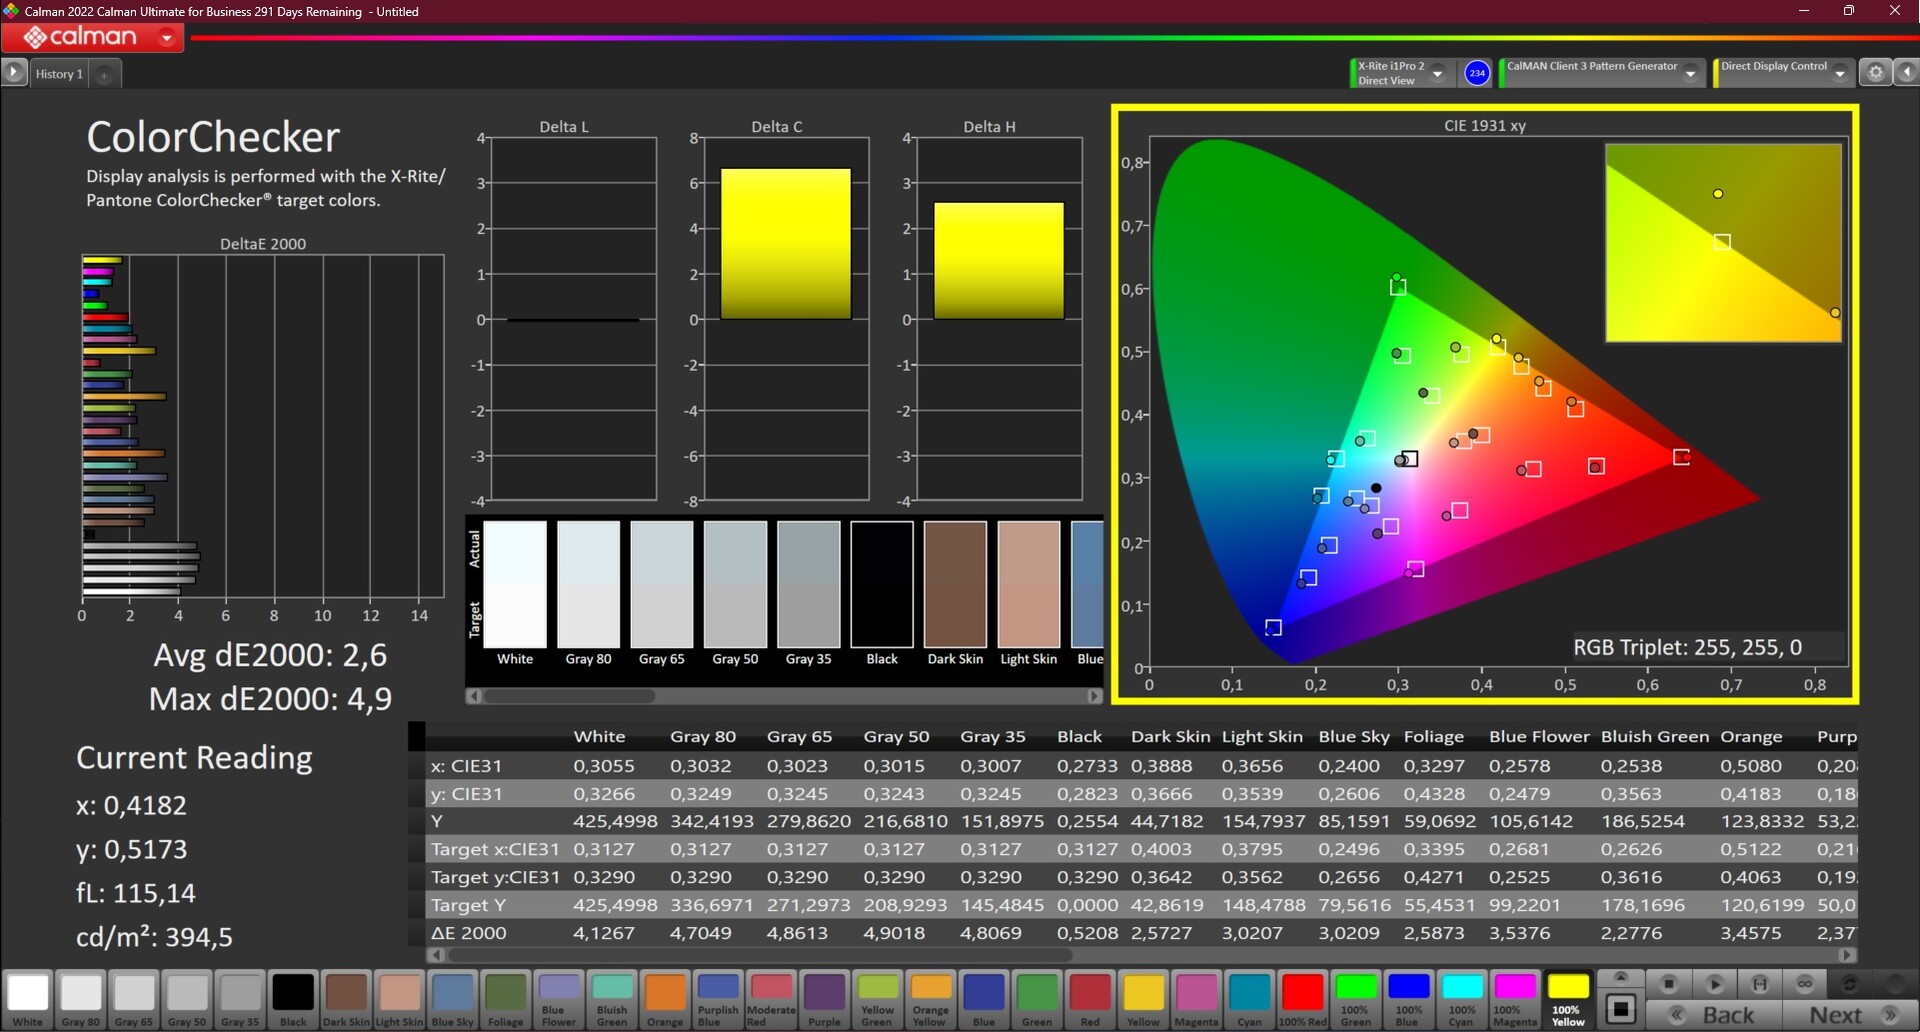
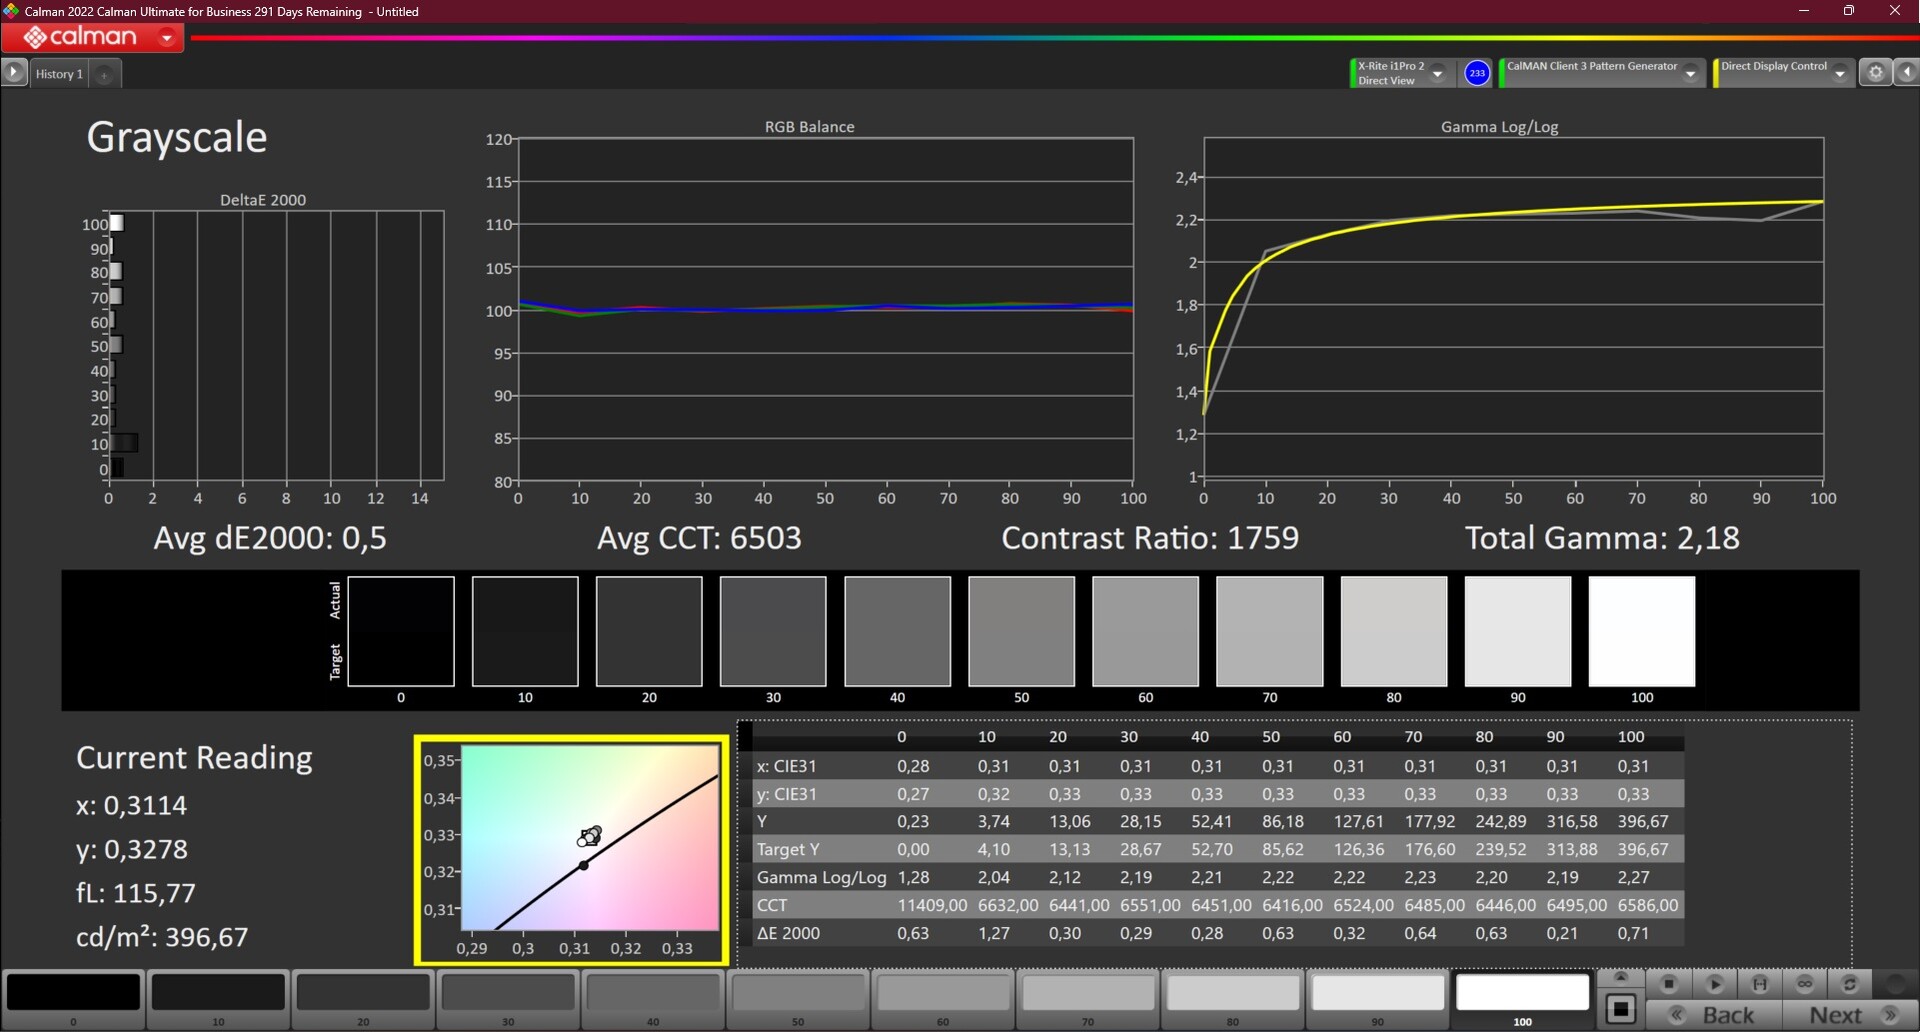
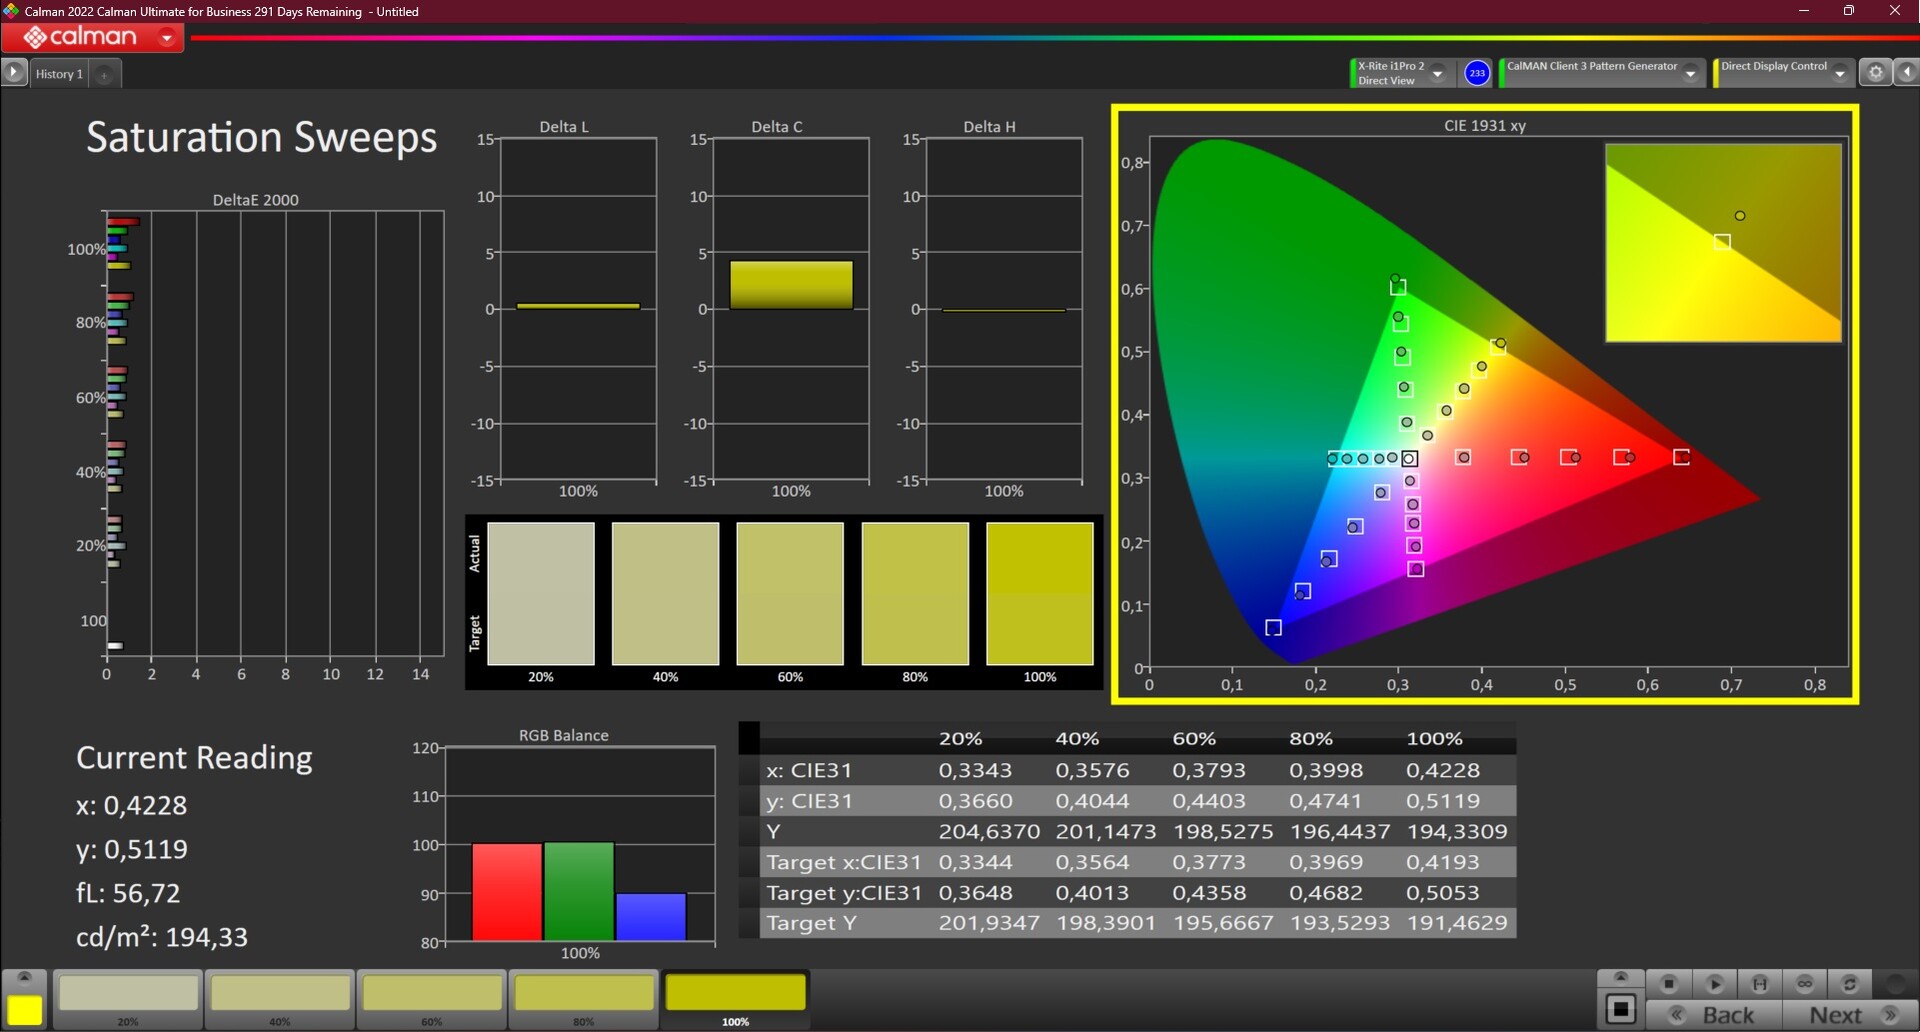
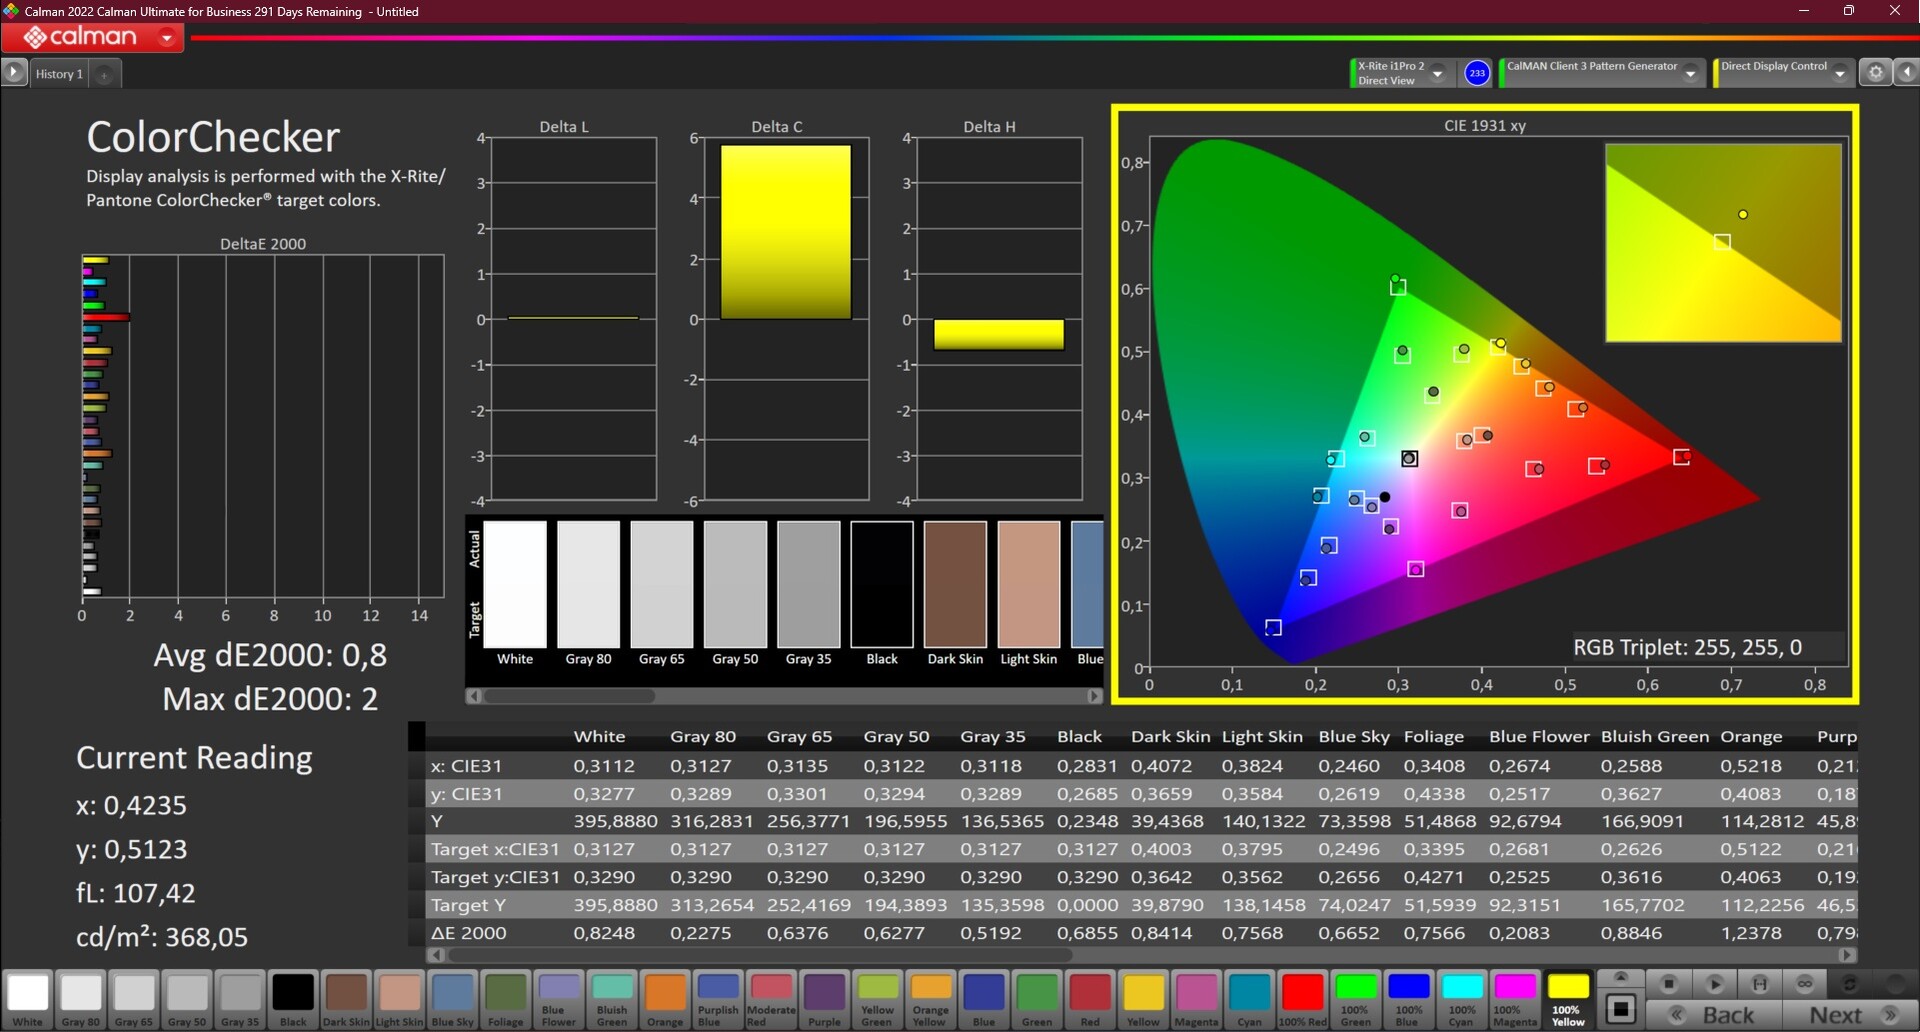
Au départ, les couleurs étaient un peu trop froides, ce que nous avons pu mesurer à l'aide de CalMan et du colorimètre X-Rite i1Pro 2. L'étalonnage a permis de corriger cela et a également contribué à l'obtention d'une excellente valeur DeltaE de 0,8. Comme toujours, le profil que nous avons créé peut être téléchargé gratuitement.
Une fois calibré, l'écran peut également être utilisé pour le traitement simple des images car il couvre entièrement l'espace couleur sRGB. Pour des espaces de couleurs plus larges, il faut choisir l'une des options WQUXGA.
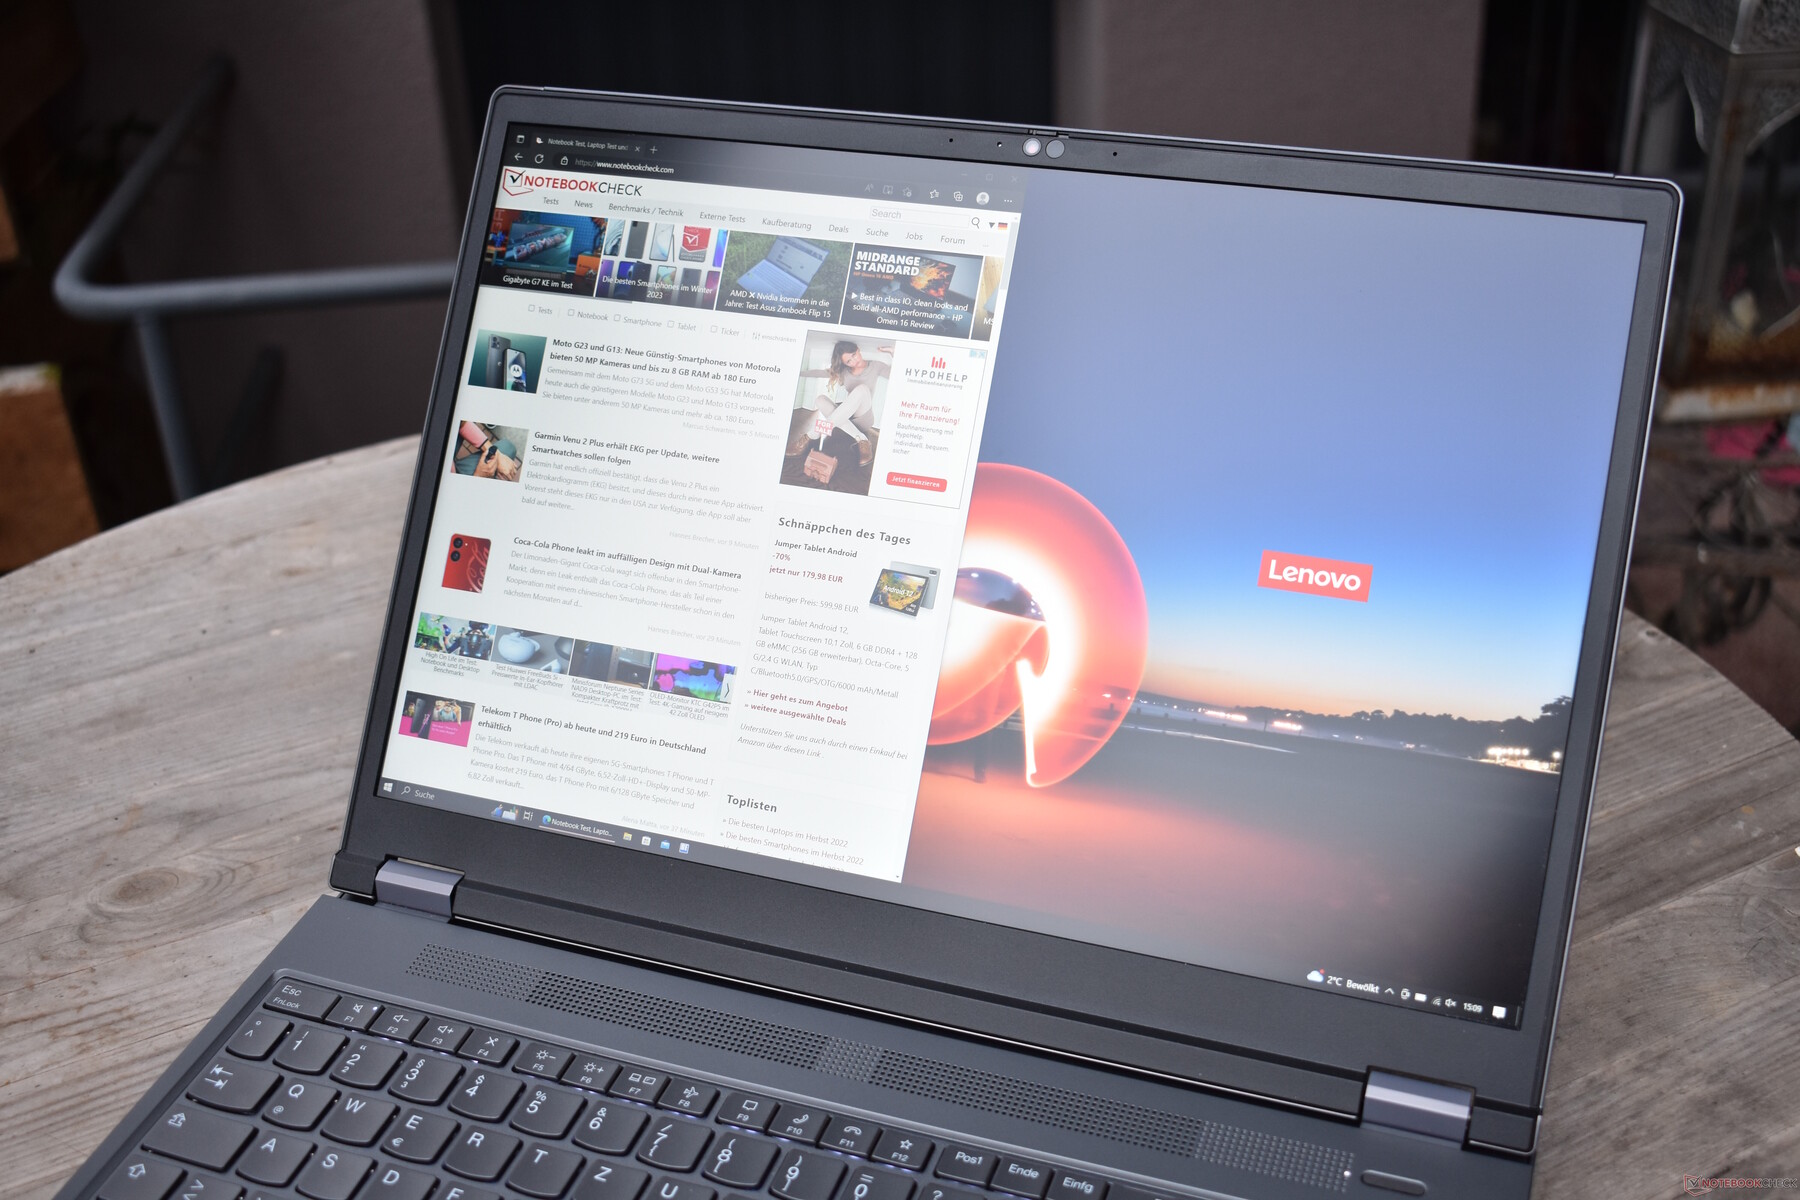
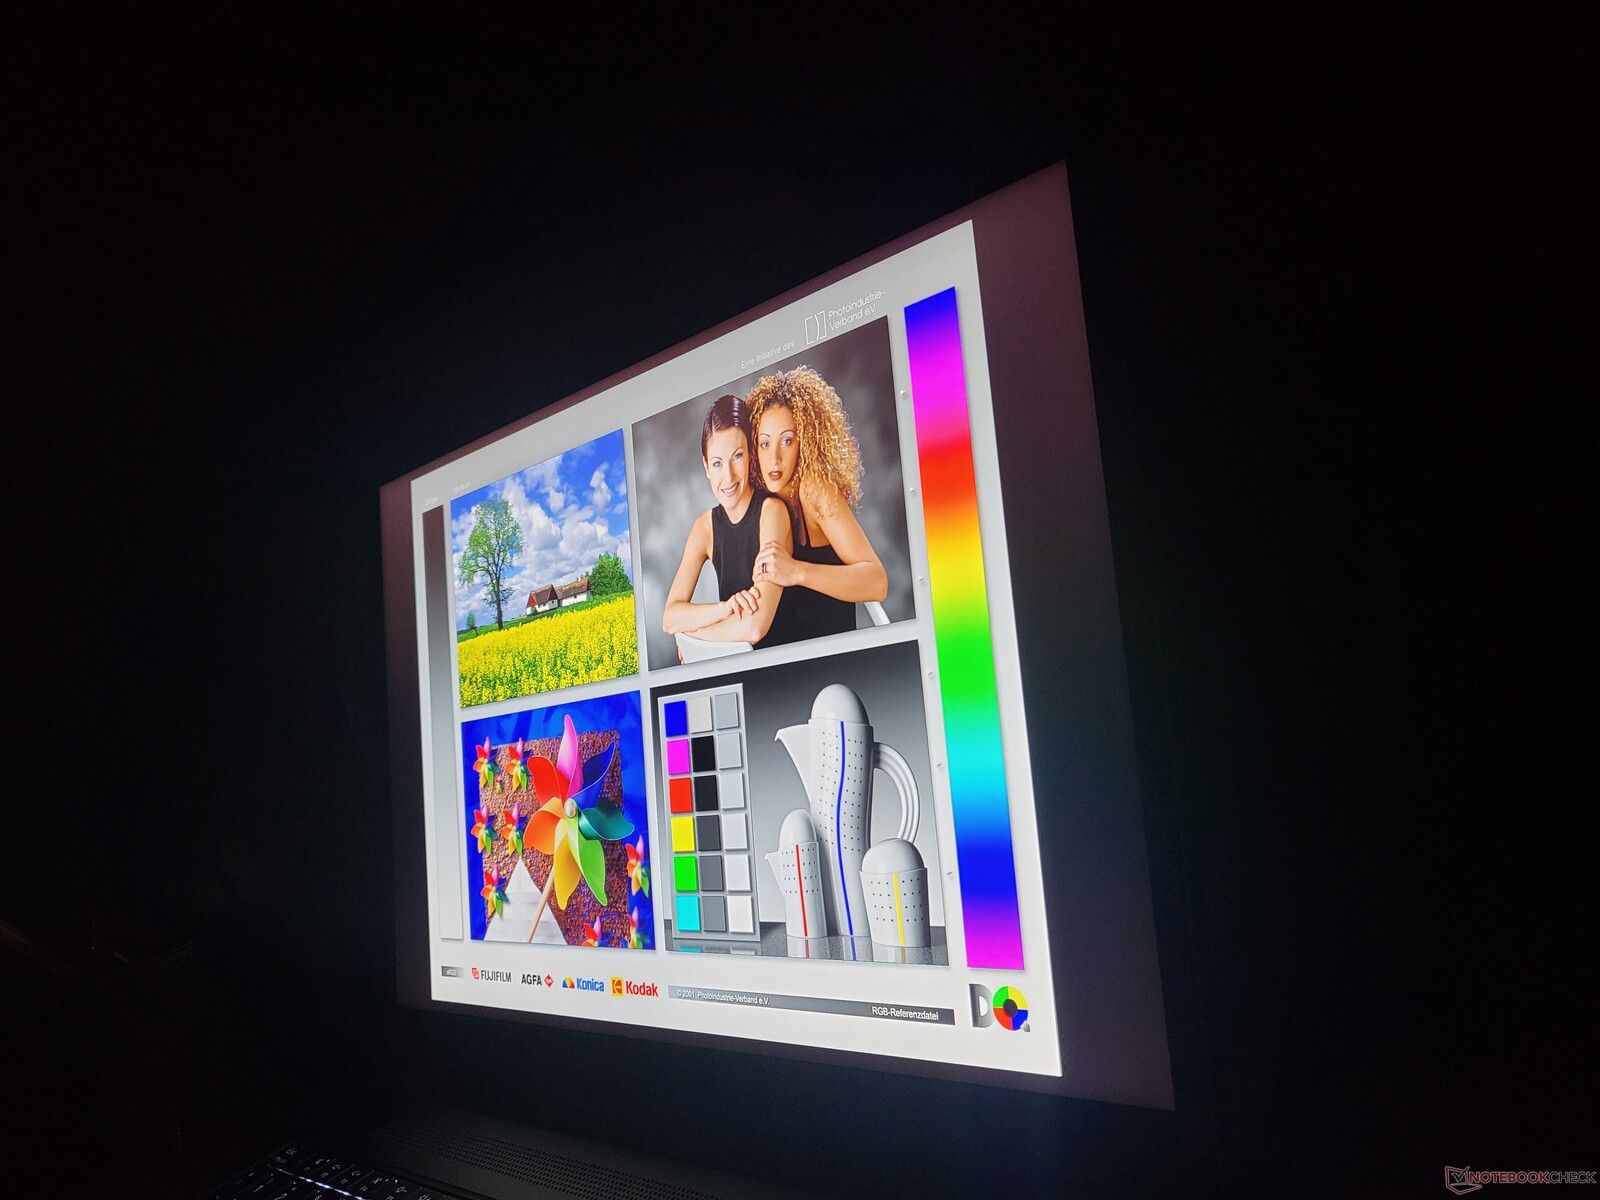
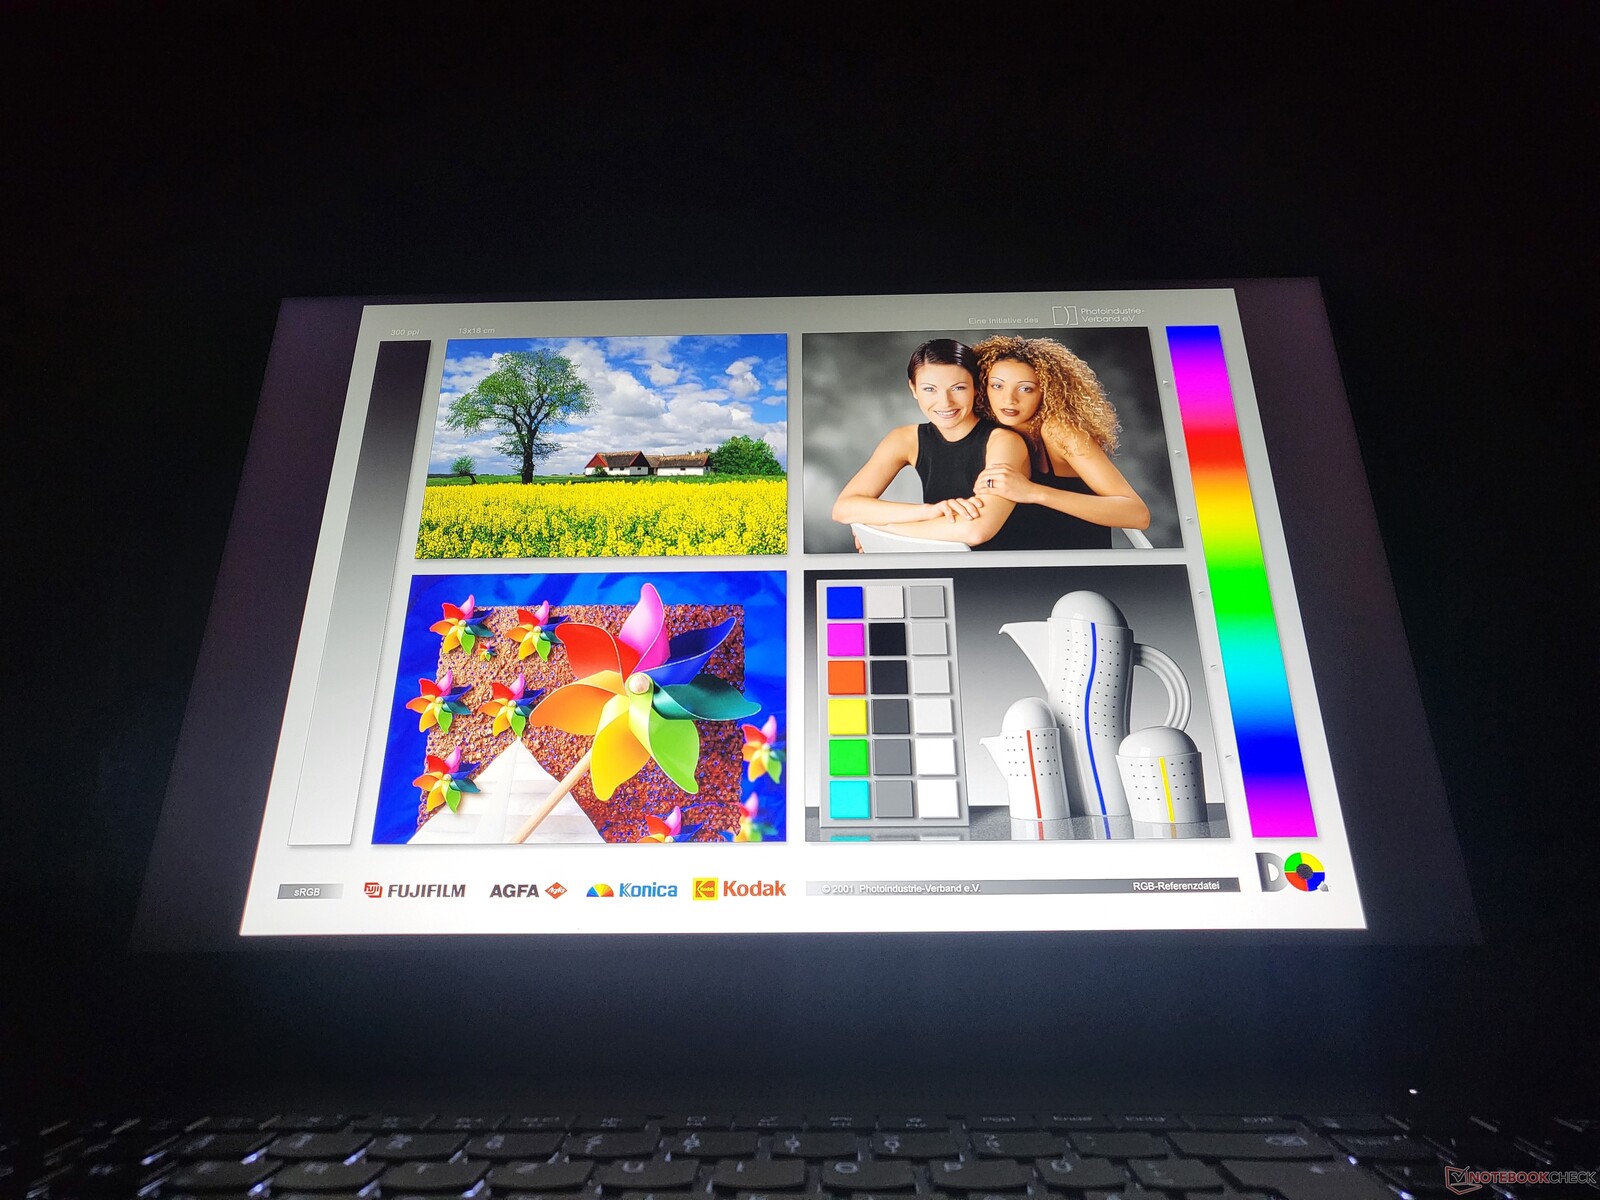
En extérieur, le Lenovo ThinkPad P16 G1 s'en sort très bien grâce aux bons niveaux de luminosité de l'écran mat.
Temps de réponse de l'écran
| ↔ Temps de réponse noir à blanc | ||
|---|---|---|
| 26.3 ms ... hausse ↗ et chute ↘ combinées | ↗ 14 ms hausse | 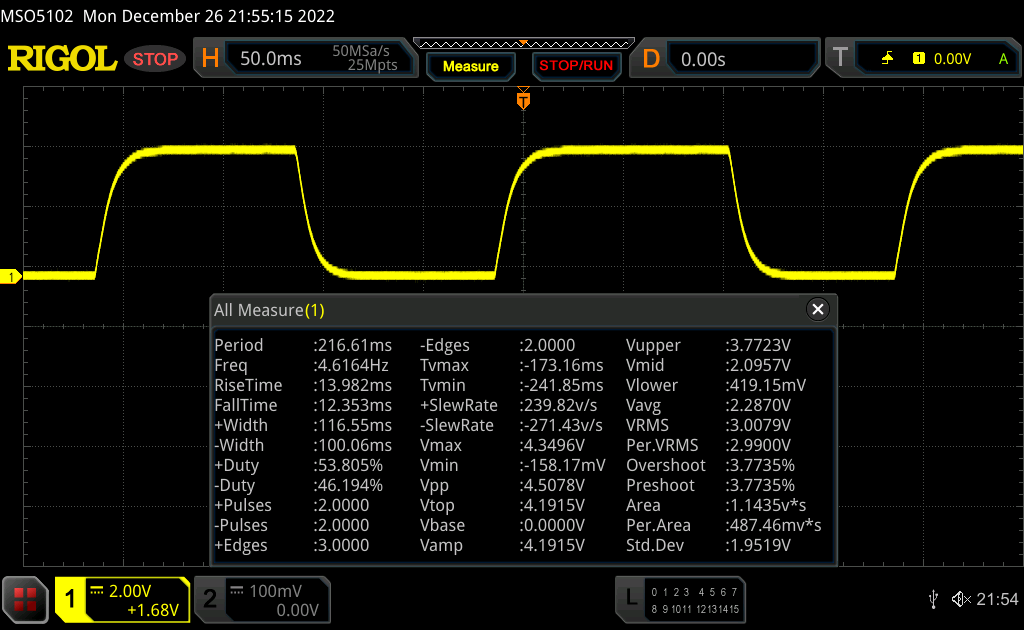 |
| ↘ 12.3 ms chute | ||
| L'écran souffre de latences relativement élevées, insuffisant pour le jeu. En comparaison, tous les appareils testés affichent entre 0.1 (minimum) et 240 (maximum) ms. » 66 % des appareils testés affichent de meilleures performances. Cela signifie que les latences relevées sont moins bonnes que la moyenne (19.8 ms) de tous les appareils testés. | ||
| ↔ Temps de réponse gris 50% à gris 80% | ||
| 37.7 ms ... hausse ↗ et chute ↘ combinées | ↗ 18.6 ms hausse |  |
| ↘ 19.1 ms chute | ||
| L'écran souffre de latences très élevées, à éviter pour le jeu. En comparaison, tous les appareils testés affichent entre 0.165 (minimum) et 636 (maximum) ms. » 55 % des appareils testés affichent de meilleures performances. Cela signifie que les latences relevées sont moins bonnes que la moyenne (31 ms) de tous les appareils testés. | ||
Scintillement / MLI (Modulation de largeur d'impulsion)
| Scintillement / MLI (Modulation de largeur d'impulsion) non décelé |  | ||
En comparaison, 52 % des appareils testés n'emploient pas MDI pour assombrir leur écran. Nous avons relevé une moyenne à 7757 (minimum : 5 - maximum : 343500) Hz dans le cas où une MDI était active. | |||
Performances : Un puissant processeur Intel et un GPU Nvidia plutôt faible
Lenovo propose le ThinkPad P16 G1 dans une grande variété de configurations. Toutes contiennent un processeur Intel de la série HX d'Alder Lake, les options étant leIntel Core i5-12600HX, i7-12800HX, i7-12850HX, i9-12900HXainsi que lei9-12950HX. Malheureusement, les processeurs Xeon ne sont plus disponibles et leur tâche est désormais assurée par les processeurs qui se terminent par 50. Comme Lenovo ne soude pas ses GPU, chacun de ces processeurs peut être configuré avec l'un des GPU suivants : Intel ARC Pro A30M, Nvidia RTX A1000, RTX A2000, RTX A3000, RTX A4500 et RTX A5500.
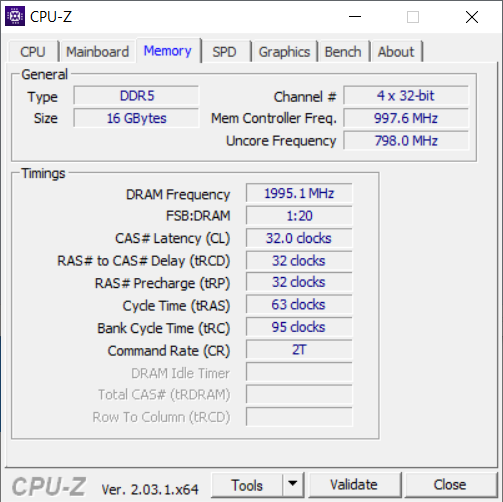
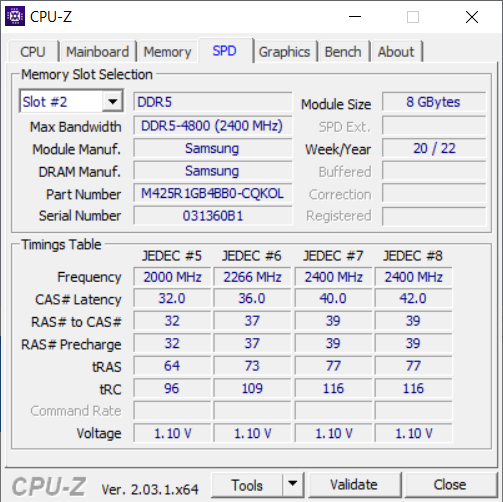
Les variations possibles ne s'arrêtent pas là puisque le Lenovo ThinkPad P16 G1 dispose de quatre emplacements pour la mémoire vive. Cela permet d'avoir jusqu'à 128 Go de RAM DDR5-3600, la RAM ECC étant également disponible pour les processeurs de modèle 50. Il y a un total de deux emplacements pour SSD et les deux peuvent accepter des SSD M.2 2280. La capacité maximale de stockage de masse que Lenovo vend dans son portable ThinkPad est de huit téraoctets et se présente sous la forme de deux SSD de quatre téraoctets.
Conditions d'essai
Lenovo utilise les propres modes d'alimentation de Windows pour ses ThinkPads. Pendant une courte période, le processeur peut consommer jusqu'à 125 watts, mais il est limité à 95 watts pendant des périodes plus longues. Si le mode d'alimentation "Better Performance" est sélectionné au lieu de "Best Performance", la consommation se situe brièvement à 100 watts et à 80 watts en charge continue. En utilisant le mode "Plus d'efficacité de la batterie", les limitations sont considérablement plus sévères avec le turbo à 70 watts et la consommation soutenue à 30 watts. Mis à part le test de la batterie WiFi, nos tests ont été effectués en mode "Best Performance".
Une caractéristique particulière de notre appareil de revue : Il est toujours livré avec Windows 10 Pro. Pour la plupart des tests, ce n'est pas un problème, mais cette ancienne version de Windows était responsable d'un score très bas dans Cinebench R15. Pour cette raison, nous avons décidé de ne pas faire la boucle Cinebench R15 avec cet appareil.
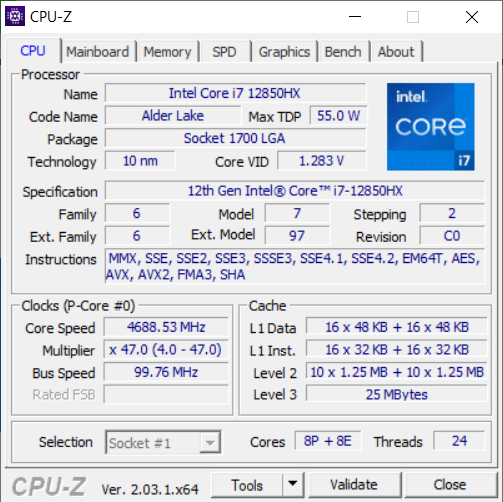
Processeur
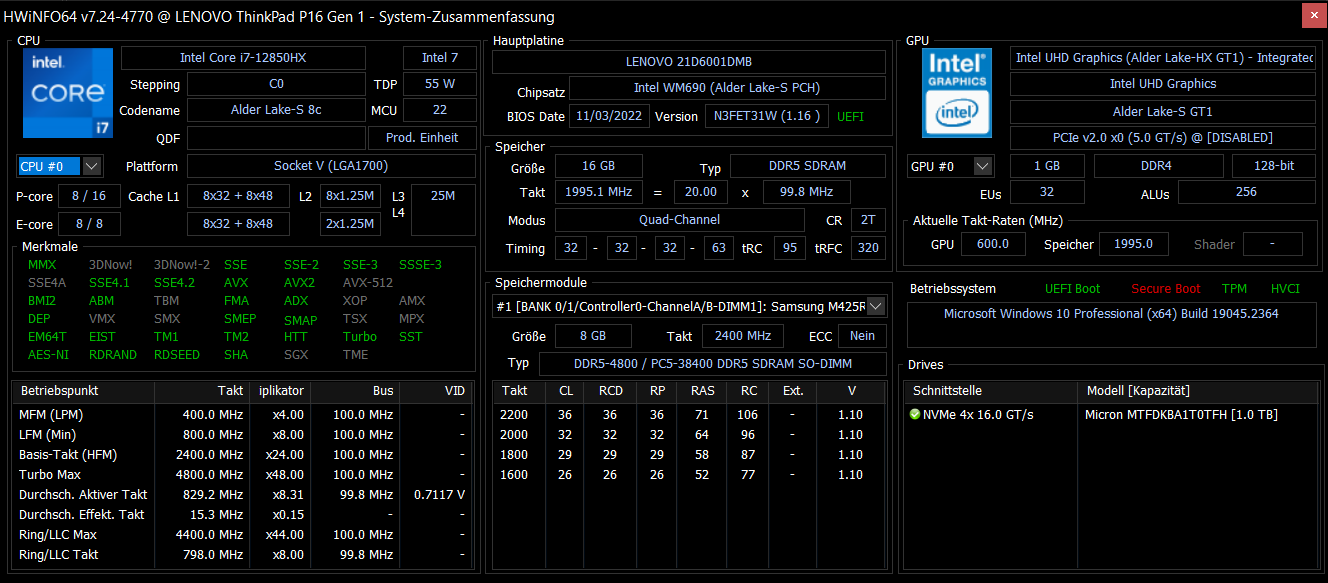
Le siteIntel Core i7-12850HXest un processeur doté d'un total de 16 cœurs. L'architecture "Alder Lake" possédant une structure asymétrique, huit de ces cœurs sont les puissants cœurs P (2,1 à 4,8 GHz), les huit autres étant les efficaces cœurs E (1,5 à 3,4 GHz). Grâce à l'hyperthreading, le processeur dispose de plus de 24 threads. En tant que membre de la série HX55, le TDP typique tourne autour de 55 watts. Pour des comparaisons détaillées avec d'autres processeurs actuels, consultez notre Liste des processeurs.
Les performances du processeur du système sont excellentes et supérieures à la moyenne pour ce processeur. Le ThinkPad P16 bat le Dell Precision 7670 de manière assez convaincante. Toutefois, le Asus ExpertBook B6 Flip est plus rapide grâce à son i9. Il est intéressant de noter que le X1 Extreme G5 est presque à égalité avec le P16 bien qu'il n'ait que six P-cores. Par rapport aux modèles P15 G2 et P17 G2, les performances du processeur sont supérieures de 31 à 35 %.
En mode batterie, le ThinkPad P16 a obtenu 14,844 points dans Cinebench R23. Sans bloc d'alimentation connecté, les performances du processeur sont inférieures d'environ 15 %.
Cinebench R23 Multi Endurance Test
Cinebench R23: Multi Core | Single Core
Cinebench R20: CPU (Multi Core) | CPU (Single Core)
Cinebench R15: CPU Multi 64Bit | CPU Single 64Bit
Blender: v2.79 BMW27 CPU
7-Zip 18.03: 7z b 4 | 7z b 4 -mmt1
Geekbench 5.5: Multi-Core | Single-Core
HWBOT x265 Benchmark v2.2: 4k Preset
LibreOffice : 20 Documents To PDF
R Benchmark 2.5: Overall mean
| CPU Performance rating | |
| Moyenne de la classe Workstation | |
| Asus ExpertBook B6 Flip B6602FC2 | |
| Lenovo ThinkPad P16 G1 21D6001DMB | |
| Lenovo ThinkPad X1 Extreme G5-21DE003RGE | |
| Moyenne Intel Core i7-12850HX | |
| Dell Precision 7670 | |
| HP ZBook Fury 17 G8-4A6A9EA | |
| Lenovo ThinkPad Z16 G1 21D5S00T00 | |
| Lenovo ThinkPad P17 G2-20YU0025G | |
| Lenovo ThinkPad P15 G2-20YQ001JGE | |
| Cinebench R23 / Multi Core | |
| Moyenne de la classe Workstation (14621 - 38520, n=23, 2 dernières années) | |
| Asus ExpertBook B6 Flip B6602FC2 | |
| Lenovo ThinkPad X1 Extreme G5-21DE003RGE | |
| Lenovo ThinkPad P16 G1 21D6001DMB | |
| Moyenne Intel Core i7-12850HX (15093 - 17510, n=2) | |
| Dell Precision 7670 | |
| HP ZBook Fury 17 G8-4A6A9EA | |
| Lenovo ThinkPad P17 G2-20YU0025G | |
| Lenovo ThinkPad Z16 G1 21D5S00T00 | |
| Lenovo ThinkPad P15 G2-20YQ001JGE | |
| Cinebench R23 / Single Core | |
| Moyenne de la classe Workstation (1712 - 2228, n=23, 2 dernières années) | |
| Asus ExpertBook B6 Flip B6602FC2 | |
| Lenovo ThinkPad P16 G1 21D6001DMB | |
| Lenovo ThinkPad X1 Extreme G5-21DE003RGE | |
| Moyenne Intel Core i7-12850HX (1596 - 1845, n=2) | |
| HP ZBook Fury 17 G8-4A6A9EA | |
| Dell Precision 7670 | |
| Lenovo ThinkPad P17 G2-20YU0025G | |
| Lenovo ThinkPad P15 G2-20YQ001JGE | |
| Lenovo ThinkPad Z16 G1 21D5S00T00 | |
| Cinebench R20 / CPU (Multi Core) | |
| Moyenne de la classe Workstation (5760 - 15043, n=23, 2 dernières années) | |
| Asus ExpertBook B6 Flip B6602FC2 | |
| Lenovo ThinkPad X1 Extreme G5-21DE003RGE | |
| Lenovo ThinkPad P16 G1 21D6001DMB | |
| Moyenne Intel Core i7-12850HX (6217 - 6764, n=2) | |
| Dell Precision 7670 | |
| Lenovo ThinkPad P17 G2-20YU0025G | |
| HP ZBook Fury 17 G8-4A6A9EA | |
| Lenovo ThinkPad Z16 G1 21D5S00T00 | |
| Lenovo ThinkPad P15 G2-20YQ001JGE | |
| Cinebench R20 / CPU (Single Core) | |
| Moyenne de la classe Workstation (671 - 857, n=23, 2 dernières années) | |
| Asus ExpertBook B6 Flip B6602FC2 | |
| Lenovo ThinkPad P16 G1 21D6001DMB | |
| Lenovo ThinkPad X1 Extreme G5-21DE003RGE | |
| Moyenne Intel Core i7-12850HX (687 - 708, n=2) | |
| Dell Precision 7670 | |
| HP ZBook Fury 17 G8-4A6A9EA | |
| Lenovo ThinkPad Z16 G1 21D5S00T00 | |
| Lenovo ThinkPad P17 G2-20YU0025G | |
| Lenovo ThinkPad P15 G2-20YQ001JGE | |
| Cinebench R15 / CPU Multi 64Bit | |
| Moyenne de la classe Workstation (2489 - 5810, n=23, 2 dernières années) | |
| Asus ExpertBook B6 Flip B6602FC2 | |
| Lenovo ThinkPad P16 G1 21D6001DMB | |
| Lenovo ThinkPad X1 Extreme G5-21DE003RGE | |
| Moyenne Intel Core i7-12850HX (2432 - 2926, n=2) | |
| Dell Precision 7670 | |
| Lenovo ThinkPad P17 G2-20YU0025G | |
| HP ZBook Fury 17 G8-4A6A9EA | |
| Lenovo ThinkPad Z16 G1 21D5S00T00 | |
| Lenovo ThinkPad P15 G2-20YQ001JGE | |
| Cinebench R15 / CPU Single 64Bit | |
| Moyenne de la classe Workstation (191.4 - 328, n=23, 2 dernières années) | |
| Asus ExpertBook B6 Flip B6602FC2 | |
| Lenovo ThinkPad P16 G1 21D6001DMB | |
| Moyenne Intel Core i7-12850HX (253 - 268, n=2) | |
| Lenovo ThinkPad X1 Extreme G5-21DE003RGE | |
| Dell Precision 7670 | |
| HP ZBook Fury 17 G8-4A6A9EA | |
| Lenovo ThinkPad Z16 G1 21D5S00T00 | |
| Lenovo ThinkPad P17 G2-20YU0025G | |
| Lenovo ThinkPad P15 G2-20YQ001JGE | |
| Blender / v2.79 BMW27 CPU | |
| Lenovo ThinkPad P15 G2-20YQ001JGE | |
| Lenovo ThinkPad P17 G2-20YU0025G | |
| HP ZBook Fury 17 G8-4A6A9EA | |
| Lenovo ThinkPad Z16 G1 21D5S00T00 | |
| Dell Precision 7670 | |
| Moyenne Intel Core i7-12850HX (181 - 205, n=2) | |
| Asus ExpertBook B6 Flip B6602FC2 | |
| Lenovo ThinkPad X1 Extreme G5-21DE003RGE | |
| Lenovo ThinkPad P16 G1 21D6001DMB | |
| Moyenne de la classe Workstation (91 - 222, n=23, 2 dernières années) | |
| 7-Zip 18.03 / 7z b 4 | |
| Moyenne de la classe Workstation (60489 - 116969, n=23, 2 dernières années) | |
| Asus ExpertBook B6 Flip B6602FC2 | |
| Lenovo ThinkPad P16 G1 21D6001DMB | |
| Lenovo ThinkPad X1 Extreme G5-21DE003RGE | |
| Moyenne Intel Core i7-12850HX (53893 - 69464, n=2) | |
| Lenovo ThinkPad Z16 G1 21D5S00T00 | |
| Dell Precision 7670 | |
| HP ZBook Fury 17 G8-4A6A9EA | |
| Lenovo ThinkPad P15 G2-20YQ001JGE | |
| Lenovo ThinkPad P17 G2-20YU0025G | |
| 7-Zip 18.03 / 7z b 4 -mmt1 | |
| Moyenne de la classe Workstation (5126 - 6960, n=23, 2 dernières années) | |
| Asus ExpertBook B6 Flip B6602FC2 | |
| HP ZBook Fury 17 G8-4A6A9EA | |
| Lenovo ThinkPad P16 G1 21D6001DMB | |
| Lenovo ThinkPad X1 Extreme G5-21DE003RGE | |
| Moyenne Intel Core i7-12850HX (5608 - 5916, n=2) | |
| Dell Precision 7670 | |
| Lenovo ThinkPad P15 G2-20YQ001JGE | |
| Lenovo ThinkPad P17 G2-20YU0025G | |
| Lenovo ThinkPad Z16 G1 21D5S00T00 | |
| Geekbench 5.5 / Multi-Core | |
| Moyenne de la classe Workstation (11542 - 25554, n=23, 2 dernières années) | |
| Asus ExpertBook B6 Flip B6602FC2 | |
| Lenovo ThinkPad P16 G1 21D6001DMB | |
| Moyenne Intel Core i7-12850HX (11509 - 13095, n=2) | |
| Lenovo ThinkPad X1 Extreme G5-21DE003RGE | |
| Dell Precision 7670 | |
| Lenovo ThinkPad P15 G2-20YQ001JGE | |
| Lenovo ThinkPad Z16 G1 21D5S00T00 | |
| HP ZBook Fury 17 G8-4A6A9EA | |
| Lenovo ThinkPad P17 G2-20YU0025G | |
| Geekbench 5.5 / Single-Core | |
| Moyenne de la classe Workstation (1783 - 2183, n=23, 2 dernières années) | |
| Asus ExpertBook B6 Flip B6602FC2 | |
| Lenovo ThinkPad X1 Extreme G5-21DE003RGE | |
| Lenovo ThinkPad P16 G1 21D6001DMB | |
| Moyenne Intel Core i7-12850HX (1777 - 1787, n=2) | |
| Dell Precision 7670 | |
| HP ZBook Fury 17 G8-4A6A9EA | |
| Lenovo ThinkPad P15 G2-20YQ001JGE | |
| Lenovo ThinkPad P17 G2-20YU0025G | |
| Lenovo ThinkPad Z16 G1 21D5S00T00 | |
| HWBOT x265 Benchmark v2.2 / 4k Preset | |
| Moyenne de la classe Workstation (17.8 - 40.5, n=23, 2 dernières années) | |
| Asus ExpertBook B6 Flip B6602FC2 | |
| Dell Precision 7670 | |
| Moyenne Intel Core i7-12850HX (17.2 - 17.3, n=2) | |
| Lenovo ThinkPad P16 G1 21D6001DMB | |
| Lenovo ThinkPad X1 Extreme G5-21DE003RGE | |
| Lenovo ThinkPad Z16 G1 21D5S00T00 | |
| Lenovo ThinkPad P17 G2-20YU0025G | |
| HP ZBook Fury 17 G8-4A6A9EA | |
| Lenovo ThinkPad P15 G2-20YQ001JGE | |
| LibreOffice / 20 Documents To PDF | |
| HP ZBook Fury 17 G8-4A6A9EA | |
| Lenovo ThinkPad P17 G2-20YU0025G | |
| Lenovo ThinkPad Z16 G1 21D5S00T00 | |
| Dell Precision 7670 | |
| Lenovo ThinkPad P15 G2-20YQ001JGE | |
| Moyenne Intel Core i7-12850HX (46.9 - 48.6, n=2) | |
| Moyenne de la classe Workstation (37.1 - 74.7, n=23, 2 dernières années) | |
| Lenovo ThinkPad P16 G1 21D6001DMB | |
| Asus ExpertBook B6 Flip B6602FC2 | |
| Lenovo ThinkPad X1 Extreme G5-21DE003RGE | |
| R Benchmark 2.5 / Overall mean | |
| Lenovo ThinkPad P17 G2-20YU0025G | |
| Lenovo ThinkPad P15 G2-20YQ001JGE | |
| HP ZBook Fury 17 G8-4A6A9EA | |
| Lenovo ThinkPad Z16 G1 21D5S00T00 | |
| Dell Precision 7670 | |
| Lenovo ThinkPad X1 Extreme G5-21DE003RGE | |
| Moyenne Intel Core i7-12850HX (0.45 - 0.4698, n=2) | |
| Asus ExpertBook B6 Flip B6602FC2 | |
| Lenovo ThinkPad P16 G1 21D6001DMB | |
| Moyenne de la classe Workstation (0.3825 - 0.603, n=23, 2 dernières années) | |
* ... Moindre est la valeur, meilleures sont les performances
AIDA64: FP32 Ray-Trace | FPU Julia | CPU SHA3 | CPU Queen | FPU SinJulia | FPU Mandel | CPU AES | CPU ZLib | FP64 Ray-Trace | CPU PhotoWorxx
| Performance rating | |
| Moyenne de la classe Workstation | |
| Lenovo ThinkPad P16 G1 21D6001DMB | |
| Asus ExpertBook B6 Flip B6602FC2 | |
| Moyenne Intel Core i7-12850HX | |
| HP ZBook Fury 17 G8-4A6A9EA | |
| Dell Precision 7670 | |
| AIDA64 / FP32 Ray-Trace | |
| Moyenne de la classe Workstation (16730 - 61611, n=23, 2 dernières années) | |
| Lenovo ThinkPad P16 G1 21D6001DMB | |
| Asus ExpertBook B6 Flip B6602FC2 | |
| HP ZBook Fury 17 G8-4A6A9EA | |
| Moyenne Intel Core i7-12850HX (12983 - 16752, n=2) | |
| Dell Precision 7670 | |
| AIDA64 / FPU Julia | |
| Moyenne de la classe Workstation (89597 - 186971, n=23, 2 dernières années) | |
| Lenovo ThinkPad P16 G1 21D6001DMB | |
| Asus ExpertBook B6 Flip B6602FC2 | |
| Moyenne Intel Core i7-12850HX (68219 - 87231, n=2) | |
| Dell Precision 7670 | |
| HP ZBook Fury 17 G8-4A6A9EA | |
| AIDA64 / CPU SHA3 | |
| Moyenne de la classe Workstation (4178 - 8975, n=23, 2 dernières années) | |
| HP ZBook Fury 17 G8-4A6A9EA | |
| Lenovo ThinkPad P16 G1 21D6001DMB | |
| Asus ExpertBook B6 Flip B6602FC2 | |
| Moyenne Intel Core i7-12850HX (3098 - 3818, n=2) | |
| Dell Precision 7670 | |
| AIDA64 / CPU Queen | |
| Moyenne de la classe Workstation (60778 - 144411, n=23, 2 dernières années) | |
| Asus ExpertBook B6 Flip B6602FC2 | |
| HP ZBook Fury 17 G8-4A6A9EA | |
| Lenovo ThinkPad P16 G1 21D6001DMB | |
| Moyenne Intel Core i7-12850HX (26716 - 95664, n=2) | |
| Dell Precision 7670 | |
| AIDA64 / FPU SinJulia | |
| Moyenne de la classe Workstation (8165 - 29343, n=23, 2 dernières années) | |
| Lenovo ThinkPad P16 G1 21D6001DMB | |
| Asus ExpertBook B6 Flip B6602FC2 | |
| Moyenne Intel Core i7-12850HX (9869 - 11286, n=2) | |
| HP ZBook Fury 17 G8-4A6A9EA | |
| Dell Precision 7670 | |
| AIDA64 / FPU Mandel | |
| Moyenne de la classe Workstation (44497 - 98153, n=23, 2 dernières années) | |
| Lenovo ThinkPad P16 G1 21D6001DMB | |
| Asus ExpertBook B6 Flip B6602FC2 | |
| HP ZBook Fury 17 G8-4A6A9EA | |
| Moyenne Intel Core i7-12850HX (34218 - 42580, n=2) | |
| Dell Precision 7670 | |
| AIDA64 / CPU AES | |
| Moyenne de la classe Workstation (73133 - 187841, n=23, 2 dernières années) | |
| HP ZBook Fury 17 G8-4A6A9EA | |
| Lenovo ThinkPad P16 G1 21D6001DMB | |
| Asus ExpertBook B6 Flip B6602FC2 | |
| Moyenne Intel Core i7-12850HX (63362 - 80775, n=2) | |
| Dell Precision 7670 | |
| AIDA64 / CPU ZLib | |
| Moyenne de la classe Workstation (929 - 2148, n=23, 2 dernières années) | |
| Lenovo ThinkPad P16 G1 21D6001DMB | |
| Asus ExpertBook B6 Flip B6602FC2 | |
| Moyenne Intel Core i7-12850HX (817 - 1102, n=2) | |
| Dell Precision 7670 | |
| HP ZBook Fury 17 G8-4A6A9EA | |
| AIDA64 / FP64 Ray-Trace | |
| Moyenne de la classe Workstation (8545 - 32891, n=23, 2 dernières années) | |
| Lenovo ThinkPad P16 G1 21D6001DMB | |
| Asus ExpertBook B6 Flip B6602FC2 | |
| HP ZBook Fury 17 G8-4A6A9EA | |
| Moyenne Intel Core i7-12850HX (7671 - 9145, n=2) | |
| Dell Precision 7670 | |
| AIDA64 / CPU PhotoWorxx | |
| Moyenne de la classe Workstation (37151 - 93684, n=23, 2 dernières années) | |
| Dell Precision 7670 | |
| Moyenne Intel Core i7-12850HX (33415 - 42035, n=2) | |
| Asus ExpertBook B6 Flip B6602FC2 | |
| Lenovo ThinkPad P16 G1 21D6001DMB | |
| HP ZBook Fury 17 G8-4A6A9EA | |
Performance du système
Bien que les scores PCMark 10 soient comparativement plus faibles, le Lenovo ThinkPad P16 G1 offre de très bonnes performances en utilisation quotidienne - ce qui est logique compte tenu de la puissance des composants. En conséquence, CrossMark s'avère nettement meilleur.
CrossMark: Overall | Productivity | Creativity | Responsiveness
| PCMark 10 / Score | |
| Moyenne de la classe Workstation (6563 - 10409, n=19, 2 dernières années) | |
| Asus ExpertBook B6 Flip B6602FC2 | |
| Dell Precision 7670 | |
| Lenovo ThinkPad P15 G2-20YQ001JGE | |
| Moyenne Intel Core i7-12850HX, NVIDIA RTX A2000 Laptop GPU (6226 - 6663, n=2) | |
| Lenovo ThinkPad P17 G2-20YU0025G | |
| Lenovo ThinkPad P16 G1 21D6001DMB | |
| HP ZBook Fury 17 G8-4A6A9EA | |
| PCMark 10 / Essentials | |
| Asus ExpertBook B6 Flip B6602FC2 | |
| Dell Precision 7670 | |
| Moyenne de la classe Workstation (9622 - 11157, n=19, 2 dernières années) | |
| Moyenne Intel Core i7-12850HX, NVIDIA RTX A2000 Laptop GPU (10128 - 10555, n=2) | |
| Lenovo ThinkPad P15 G2-20YQ001JGE | |
| Lenovo ThinkPad P16 G1 21D6001DMB | |
| Lenovo ThinkPad P17 G2-20YU0025G | |
| HP ZBook Fury 17 G8-4A6A9EA | |
| PCMark 10 / Productivity | |
| Moyenne de la classe Workstation (8789 - 20616, n=19, 2 dernières années) | |
| Asus ExpertBook B6 Flip B6602FC2 | |
| Lenovo ThinkPad P16 G1 21D6001DMB | |
| Moyenne Intel Core i7-12850HX, NVIDIA RTX A2000 Laptop GPU (9008 - 9349, n=2) | |
| Dell Precision 7670 | |
| Lenovo ThinkPad P15 G2-20YQ001JGE | |
| Lenovo ThinkPad P17 G2-20YU0025G | |
| HP ZBook Fury 17 G8-4A6A9EA | |
| PCMark 10 / Digital Content Creation | |
| Moyenne de la classe Workstation (8108 - 15631, n=19, 2 dernières années) | |
| HP ZBook Fury 17 G8-4A6A9EA | |
| Asus ExpertBook B6 Flip B6602FC2 | |
| Lenovo ThinkPad P15 G2-20YQ001JGE | |
| Lenovo ThinkPad P17 G2-20YU0025G | |
| Dell Precision 7670 | |
| Moyenne Intel Core i7-12850HX, NVIDIA RTX A2000 Laptop GPU (6918 - 8443, n=2) | |
| Lenovo ThinkPad P16 G1 21D6001DMB | |
| CrossMark / Overall | |
| Asus ExpertBook B6 Flip B6602FC2 | |
| Moyenne de la classe Workstation (1307 - 2267, n=22, 2 dernières années) | |
| Lenovo ThinkPad P16 G1 21D6001DMB | |
| Moyenne Intel Core i7-12850HX, NVIDIA RTX A2000 Laptop GPU (1509 - 1720, n=2) | |
| Dell Precision 7670 | |
| HP ZBook Fury 17 G8-4A6A9EA | |
| CrossMark / Productivity | |
| Asus ExpertBook B6 Flip B6602FC2 | |
| Moyenne de la classe Workstation (1130 - 2122, n=22, 2 dernières années) | |
| Lenovo ThinkPad P16 G1 21D6001DMB | |
| Moyenne Intel Core i7-12850HX, NVIDIA RTX A2000 Laptop GPU (1445 - 1611, n=2) | |
| HP ZBook Fury 17 G8-4A6A9EA | |
| Dell Precision 7670 | |
| CrossMark / Creativity | |
| Moyenne de la classe Workstation (1657 - 2725, n=22, 2 dernières années) | |
| Asus ExpertBook B6 Flip B6602FC2 | |
| Lenovo ThinkPad P16 G1 21D6001DMB | |
| Moyenne Intel Core i7-12850HX, NVIDIA RTX A2000 Laptop GPU (1682 - 1943, n=2) | |
| Dell Precision 7670 | |
| HP ZBook Fury 17 G8-4A6A9EA | |
| CrossMark / Responsiveness | |
| Asus ExpertBook B6 Flip B6602FC2 | |
| Moyenne de la classe Workstation (993 - 2096, n=22, 2 dernières années) | |
| Lenovo ThinkPad P16 G1 21D6001DMB | |
| Moyenne Intel Core i7-12850HX, NVIDIA RTX A2000 Laptop GPU (1238 - 1454, n=2) | |
| Dell Precision 7670 | |
| HP ZBook Fury 17 G8-4A6A9EA | |
| PCMark 10 Score | 6226 points | |
Aide | ||
| AIDA64 / Memory Copy | |
| Moyenne de la classe Workstation (56003 - 164795, n=23, 2 dernières années) | |
| Dell Precision 7670 | |
| Asus ExpertBook B6 Flip B6602FC2 | |
| Moyenne Intel Core i7-12850HX (53840 - 62841, n=2) | |
| Lenovo ThinkPad P16 G1 21D6001DMB | |
| HP ZBook Fury 17 G8-4A6A9EA | |
| AIDA64 / Memory Read | |
| Moyenne de la classe Workstation (55795 - 121563, n=23, 2 dernières années) | |
| Dell Precision 7670 | |
| Moyenne Intel Core i7-12850HX (58944 - 68747, n=2) | |
| Asus ExpertBook B6 Flip B6602FC2 | |
| Lenovo ThinkPad P16 G1 21D6001DMB | |
| HP ZBook Fury 17 G8-4A6A9EA | |
| AIDA64 / Memory Write | |
| Moyenne de la classe Workstation (55663 - 214520, n=23, 2 dernières années) | |
| Dell Precision 7670 | |
| Asus ExpertBook B6 Flip B6602FC2 | |
| Moyenne Intel Core i7-12850HX (52160 - 64365, n=2) | |
| Lenovo ThinkPad P16 G1 21D6001DMB | |
| HP ZBook Fury 17 G8-4A6A9EA | |
| AIDA64 / Memory Latency | |
| Moyenne de la classe Workstation (84.5 - 165.2, n=23, 2 dernières années) | |
| Lenovo ThinkPad P16 G1 21D6001DMB | |
| Asus ExpertBook B6 Flip B6602FC2 | |
| Moyenne Intel Core i7-12850HX (88.5 - 95.4, n=2) | |
| Dell Precision 7670 | |
| HP ZBook Fury 17 G8-4A6A9EA | |
| Lenovo ThinkPad P17 G2-20YU0025G | |
| Lenovo ThinkPad P15 G2-20YQ001JGE | |
* ... Moindre est la valeur, meilleures sont les performances
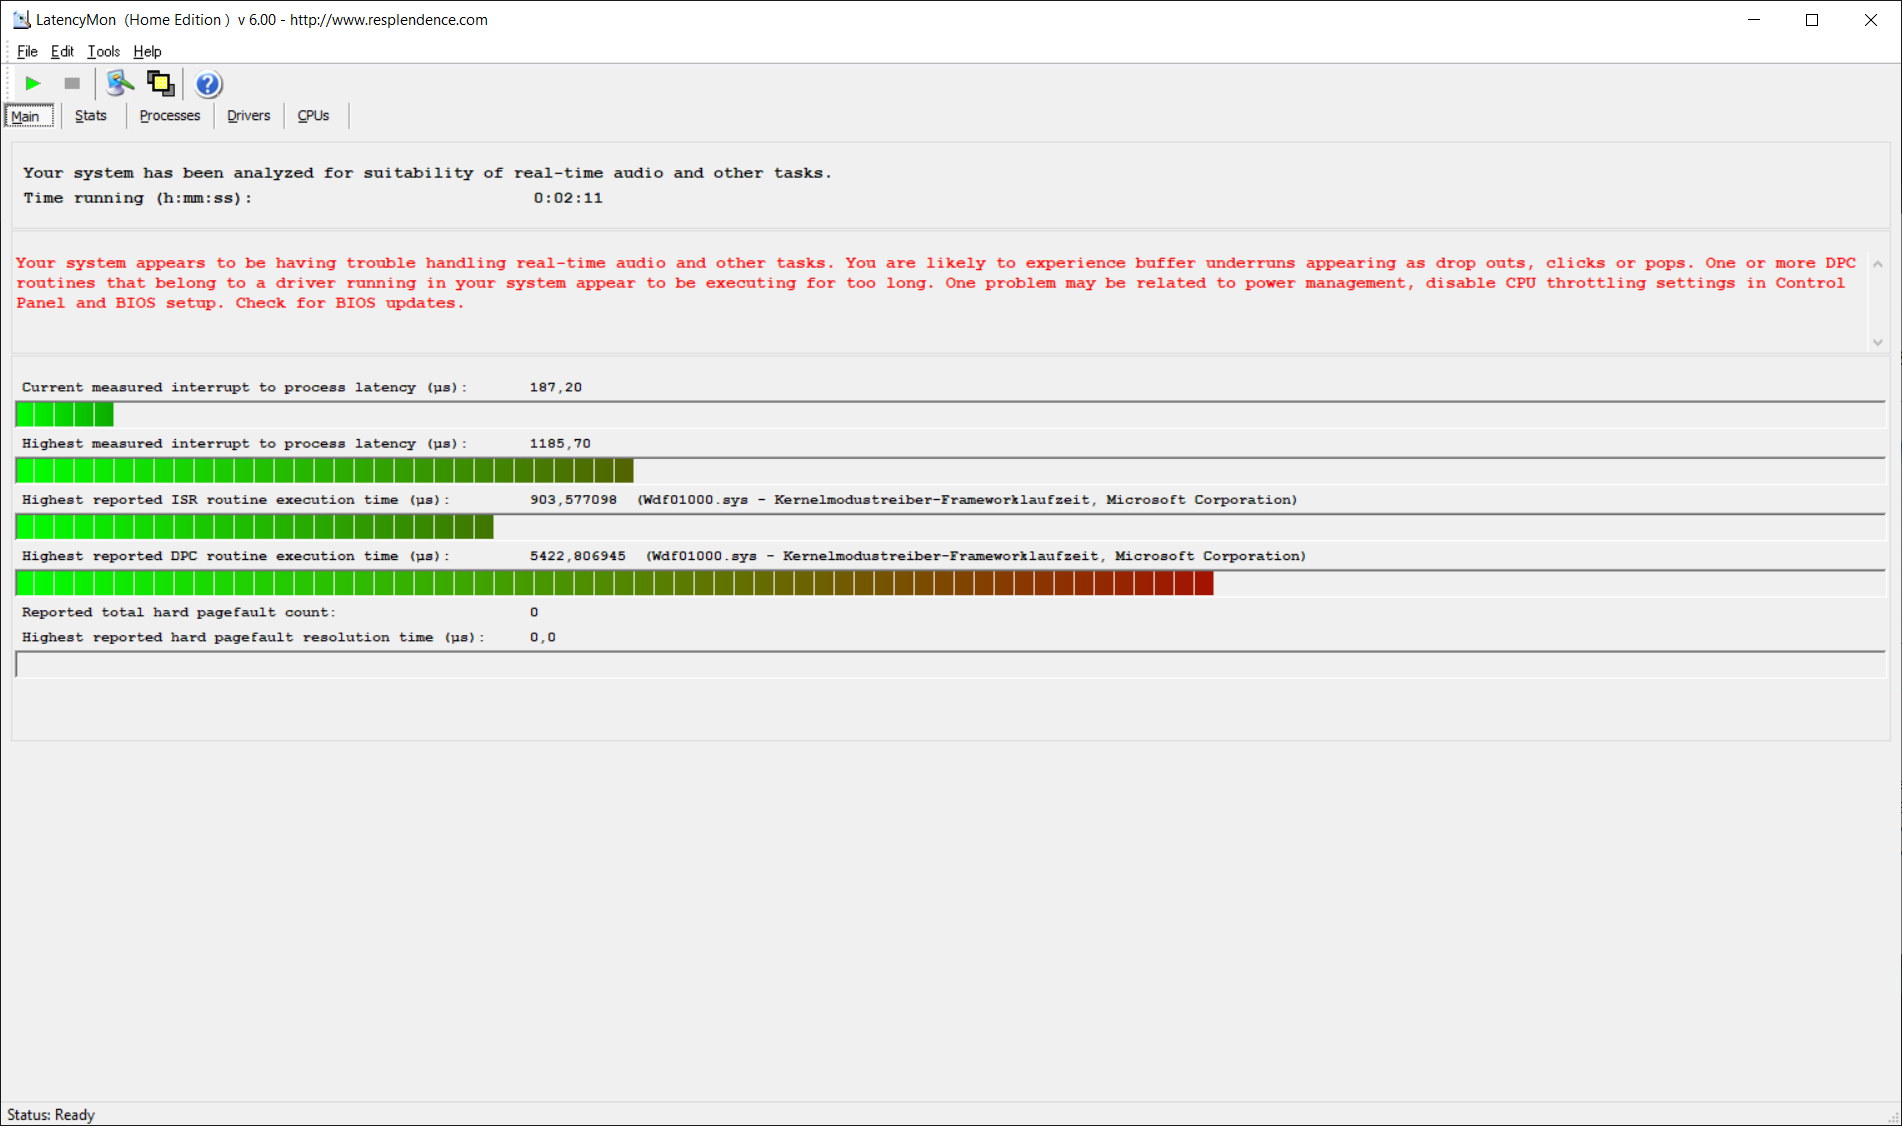
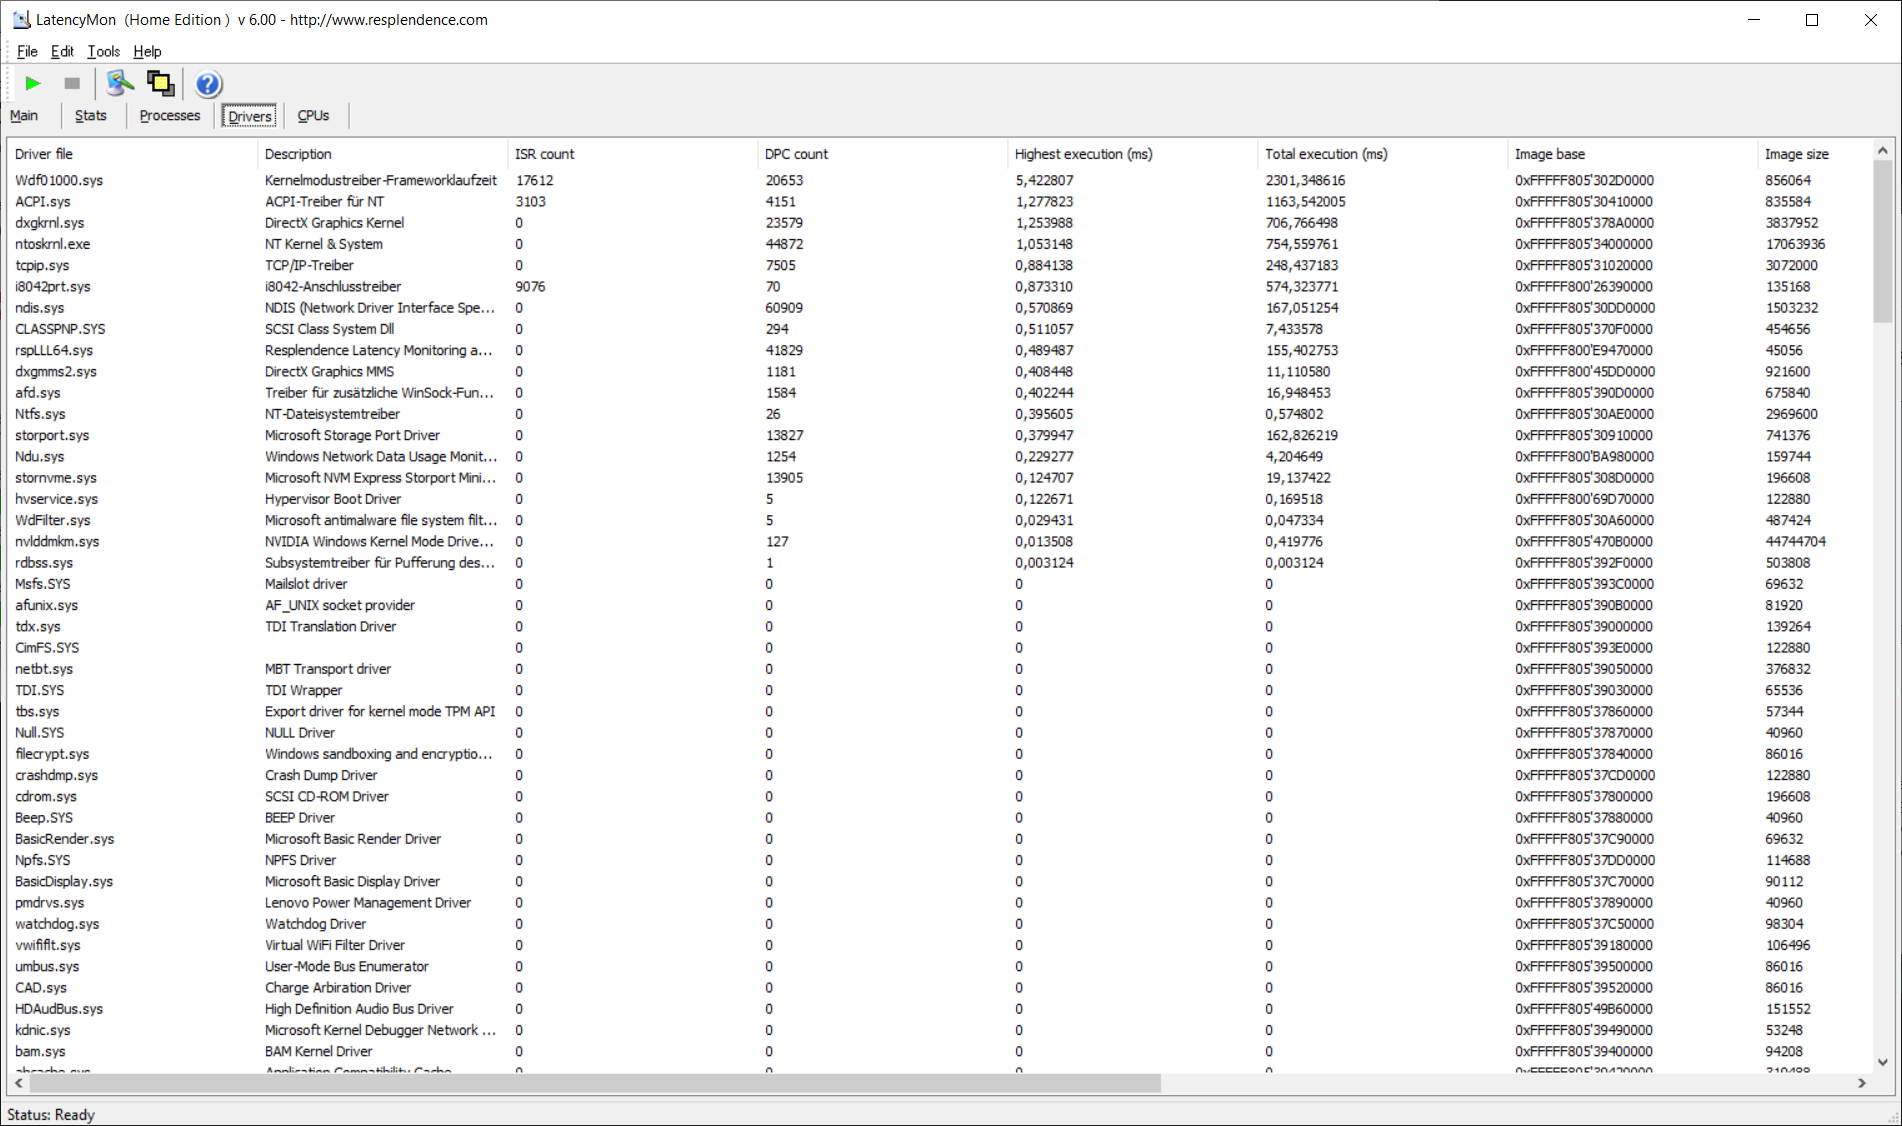
Latences DPC
Les latences du DPC sont nettement inférieures à celles de son prédécesseur, mais encore trop élevées. Néanmoins, cela peut changer à tout moment avec l'aide des mises à jour des pilotes.
| DPC Latencies / LatencyMon - interrupt to process latency (max), Web, Youtube, Prime95 | |
| Lenovo ThinkPad P17 G2-20YU0025G | |
| Lenovo ThinkPad P15 G2-20YQ001JGE | |
| Asus ExpertBook B6 Flip B6602FC2 | |
| Dell Precision 7670 | |
| Lenovo ThinkPad P16 G1 21D6001DMB | |
| HP ZBook Studio 16 G9 62U04EA | |
* ... Moindre est la valeur, meilleures sont les performances
Mémoire de masse
Le SSD du Lenovo ThinkPad P16 G1 est de Micron, a une capacité d'un téraoctet et est un SSD NVMe PCIe 4.0 très rapide au format M.2 2280. Ce SSD est plus lent que le SSD Samsung présent dans l'ExpertBook d'Asus, mais plus rapide que le reste de ses concurrents.

* ... Moindre est la valeur, meilleures sont les performances
Continuous Performance Read: DiskSpd Read Loop, Queue Depth 8
Carte graphique
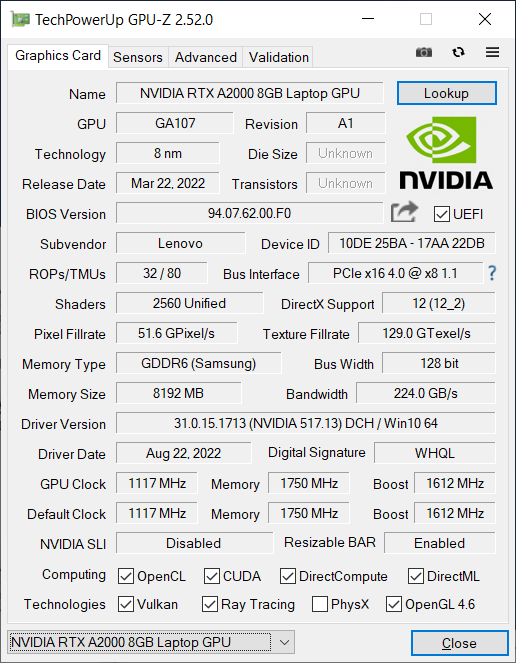
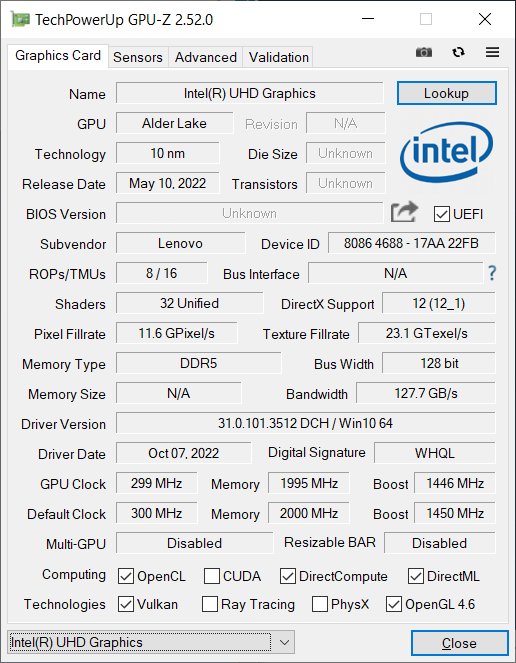
Le siteNvidia RTX A2000 est un GPU de la génération Ampère de la série professionnelle RTX de Nvidia, anciennement connue sous le nom de "Quadro". Les 2560 unités de shaders ont une vitesse d'horloge maximale de 1,678 GHz. Le TDP typique de cette puce graphique se situe entre 35 et 95 watts. Le RTX A2000 dispose de 8 Go de RAM dédiée attachée à un bus mémoire de 128 bits. Le siteListe des GPUest une excellente ressource pour les comparaisons avec d'autres puces graphiques.
Le RTX A2000 du Lenovo ThinkPad P16 peut consommer jusqu'à 60 watts, ce qui en fait l'une des options d'entrée de gamme, le meilleur GPU suivant, le RTX A3000, pouvant consommer jusqu'à 115 watts. En accord avec la consommation limitée, les performances de la RTX A2000 ne sont pas particulièrement exceptionnelles. De toutes les stations de travail comparées, le Lenovo ThinkPad P16 a obtenu les pires résultats, que ce soit dans le test 3DMark ou dans le benchmark SPECviewperf spécifique aux stations de travail. En particulier, leDell Precision 7670ainsi que le Asus ExpertBook B6 Flips'en sortent mieux avec presque les mêmes GPU, qui fonctionnent respectivement à 90 et 95 watts TDP dans ces ordinateurs portables.
Ce résultat se reflète également dans le test Blender : Dans les tests d'accélération GPU, le ThinkPad P16 G1 est plus lent que la concurrence. En revanche, dans le test CPU de Blender, il est la station de travail mobile la plus rapide.
Comme pour le processeur, les performances du GPU sont limitées en mode batterie, les performances chutant d'environ 15 % par rapport au fonctionnement sur secteur.
| 3DMark 11 Performance | 15998 points | |
| 3DMark Cloud Gate Standard Score | 40815 points | |
| 3DMark Fire Strike Score | 10381 points | |
| 3DMark Time Spy Score | 5184 points | |
Aide | ||
* ... Moindre est la valeur, meilleures sont les performances
Performances en matière de jeux
En tant que station de travail mobile, le Lenovo ThinkPad P16 n'est pas un ordinateur portable de jeu. Il est toutefois possible de jouer à des jeux plus récents, si ce n'est en 4K. Comme dans les benchmarks synthétiques, la concurrence directe est plus rapide que le P16. Le faible TDP est rendu encore plus difficile par le fait que le P16 ne parvient pas à maintenir une performance constante du GPU sous une charge constante.
| The Witcher 3 - 1920x1080 Ultra Graphics & Postprocessing (HBAO+) | |
| Moyenne de la classe Workstation (n=12 dernières années) | |
| Lenovo ThinkPad P15 G2-20YQ001JGE | |
| Asus ExpertBook B6 Flip B6602FC2 | |
| HP ZBook Fury 17 G8-4A6A9EA | |
| Dell Precision 7670 | |
| Lenovo ThinkPad P17 G2-20YU0025G | |
| Lenovo ThinkPad P16 G1 21D6001DMB | |
Witcher 3 FPS diagram
| Bas | Moyen | Élevé | Ultra | QHD | |
|---|---|---|---|---|---|
| The Witcher 3 (2015) | 273 | 150.5 | 79.7 | 43.6 | |
| Dota 2 Reborn (2015) | 177.5 | 160.8 | 149.3 | 139.5 | |
| Final Fantasy XV Benchmark (2018) | 96.7 | 51.9 | 38.3 | 31.1 | |
| X-Plane 11.11 (2018) | 140.3 | 119.2 | 95.6 | ||
| Strange Brigade (2018) | 280 | 118.6 | 91.1 | 77.8 | 54.3 |
Émissions : Le ventilateur est bruyant mais l'ordinateur portable ThinkPad reste frais
Émissions sonores
En mode veille, les ventilateurs du Lenovo ThinkPad P16 sont silencieux. À 56,3 dB(a) en charge, ils peuvent être bruyants - même plus bruyants que les homologues directs de l'ordinateur portable. Toutefois, ce n'est pas le cas pour toutes les applications. Dans le test Witcher 3, les ventilateurs ont fonctionné de manière relativement silencieuse, avec seulement 34,1 dB(a).
Nous n'avons pas pu détecter de gémissement de bobine dans l'ordinateur portable Lenovo.
Degré de la nuisance sonore
| Au repos |
| 23.2 / 23.2 / 23.2 dB(A) |
| Fortement sollicité |
| 47.8 / 56.3 dB(A) |
 | ||
30 dB silencieux 40 dB(A) audible 50 dB(A) bruyant |
||
min: | ||
| Lenovo ThinkPad P16 G1 21D6001DMB RTX A2000 Laptop GPU, i7-12850HX, Micron 3400 1TB MTFDKBA1T0TFH | Lenovo ThinkPad P15 G2-20YQ001JGE RTX A3000 Laptop GPU, i7-11800H, Kioxia XG7 KXG7AZNV512G | Lenovo ThinkPad P17 G2-20YU0025G RTX A2000 Laptop GPU, i7-11800H, Kioxia XG7 KXG7AZNV512G | HP ZBook Fury 17 G8-4A6A9EA RTX A3000 Laptop GPU, i9-11950H, Toshiba XG6 KXG60ZNV1T02 | Dell Precision 7670 RTX A2000 Laptop GPU, i7-12850HX, SK Hynix HFS001TEJ9X115N | Asus ExpertBook B6 Flip B6602FC2 RTX A2000 Laptop GPU, i9-12950HX, Samsung PM9A1 MZVL21T0HCLR | |
|---|---|---|---|---|---|---|
| Noise | -6% | -4% | -5% | -4% | -22% | |
| arrêt / environnement * (dB) | 23.2 | 24.3 -5% | 26.4 -14% | 24.5 -6% | 22.7 2% | 26 -12% |
| Idle Minimum * (dB) | 23.2 | 24.3 -5% | 26.4 -14% | 24.5 -6% | 22.9 1% | 32.4 -40% |
| Idle Average * (dB) | 23.2 | 24.3 -5% | 26.4 -14% | 24.5 -6% | 22.9 1% | 32.4 -40% |
| Idle Maximum * (dB) | 23.2 | 28.6 -23% | 26.4 -14% | 26.8 -16% | 24.5 -6% | 32.4 -40% |
| Load Average * (dB) | 47.8 | 47.5 1% | 38.1 20% | 41.8 13% | 48.7 -2% | 51.9 -9% |
| Witcher 3 ultra * (dB) | 34.1 | 38.1 -12% | 44.9 -32% | 45.2 -33% | ||
| Load Maximum * (dB) | 56.3 | 54.9 2% | 45 20% | 47.1 16% | 52.1 7% | 52.1 7% |
* ... Moindre est la valeur, meilleures sont les performances
Température
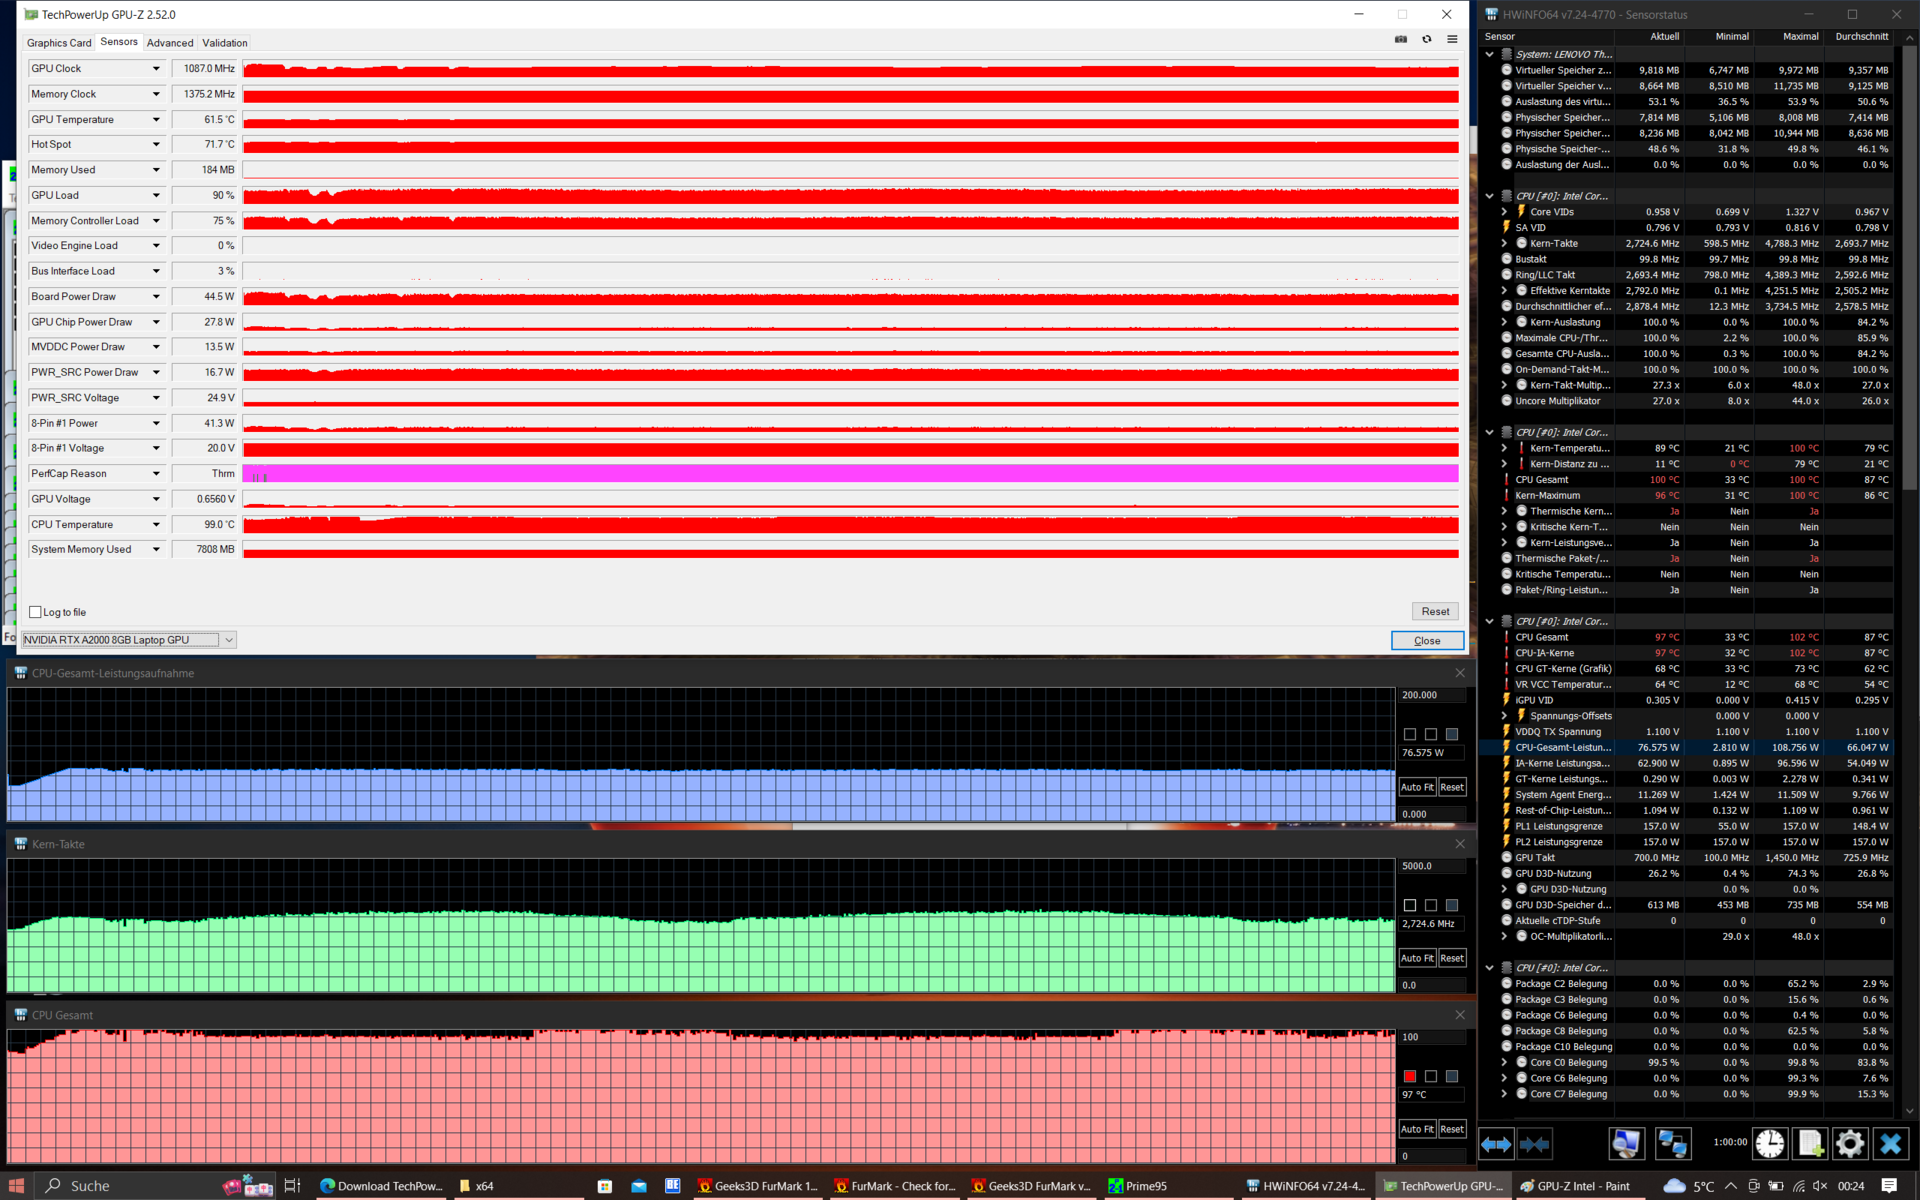
Le boîtier spacieux, avec sa construction en cage de roulement et sa chambre à vapeur, assure une répartition relativement uniforme de la chaleur résiduelle. Par conséquent, le repose-poignets du Lenovo ThinkPad P16 chauffe un peu, mais les températures maximales restent dans des limites acceptables. Dans le test de stress, la température du hotspot a mesuré 43,1 degrés et peut être considérée comme un bon résultat.
Bien que le processeur n'ait pas été bridé pendant le test de stress, les performances du GPU ont chuté : Après une heure, il ne peut plus consommer que 45 watts au lieu de 60.
(±) La température maximale du côté supérieur est de 43.1 °C / 110 F, par rapport à la moyenne de 38.2 °C / 101 F, allant de 22.2 à 69.8 °C pour la classe Workstation.
(+) Le fond chauffe jusqu'à un maximum de 39.9 °C / 104 F, contre une moyenne de 41.1 °C / 106 F
(+) En utilisation inactive, la température moyenne du côté supérieur est de 24.7 °C / 76 F, par rapport à la moyenne du dispositif de 32 °C / 90 F.
(+) En jouant à The Witcher 3, la température moyenne du côté supérieur est de 31.2 °C / 88 F, alors que la moyenne de l'appareil est de 32 °C / 90 F.
(±) Les repose-poignets et le pavé tactile peuvent devenir très chauds au toucher, avec un maximum de 36.7 °C / 98.1# F.
(-) La température moyenne de la zone de l'appui-paume de dispositifs similaires était de 27.8 °C / 82 F (-8.9 °C / #-16.1 F).
| Lenovo ThinkPad P16 G1 21D6001DMB Intel Core i7-12850HX, NVIDIA RTX A2000 Laptop GPU | Lenovo ThinkPad P15 G2-20YQ001JGE Intel Core i7-11800H, NVIDIA RTX A3000 Laptop GPU | Lenovo ThinkPad P17 G2-20YU0025G Intel Core i7-11800H, NVIDIA RTX A2000 Laptop GPU | HP ZBook Fury 17 G8-4A6A9EA Intel Core i9-11950H, NVIDIA RTX A3000 Laptop GPU | Dell Precision 7670 Intel Core i7-12850HX, NVIDIA RTX A2000 Laptop GPU | Asus ExpertBook B6 Flip B6602FC2 Intel Core i9-12950HX, NVIDIA RTX A2000 Laptop GPU | |
|---|---|---|---|---|---|---|
| Heat | -21% | -12% | -12% | -18% | -15% | |
| Maximum Upper Side * (°C) | 43.1 | 49.7 -15% | 49.6 -15% | 41.9 3% | 51 -18% | 48.4 -12% |
| Maximum Bottom * (°C) | 39.9 | 63.2 -58% | 52.1 -31% | 52.9 -33% | 45.8 -15% | 52.3 -31% |
| Idle Upper Side * (°C) | 26 | 27.1 -4% | 26 -0% | 28.2 -8% | 31.8 -22% | 27.8 -7% |
| Idle Bottom * (°C) | 27.6 | 29.8 -8% | 27.6 -0% | 30.7 -11% | 32.6 -18% | 30.3 -10% |
* ... Moindre est la valeur, meilleures sont les performances
Haut-parleurs
Les haut-parleurs stéréo se trouvent en haut du clavier. Par rapport auThinkPad P15 G2les haut-parleurs sont un peu plus silencieux dans l'ensemble mais produisent un son plus équilibré avec des basses supplémentaires. Bien que la qualité sonore soit bonne pour un ordinateur portable, elle n'est toujours pas à la hauteur d'un système audio externe.
Lenovo ThinkPad P16 G1 21D6001DMB analyse audio
(±) | le niveau sonore du haut-parleur est moyen mais bon (73.8# dB)
Basses 100 - 315 Hz
(±) | basse réduite - en moyenne 9.7% inférieure à la médiane
(±) | la linéarité des basses est moyenne (12.8% delta à la fréquence précédente)
Médiums 400 - 2000 Hz
(+) | médiane équilibrée - seulement 2.9% de la médiane
(+) | les médiums sont linéaires (6.3% delta à la fréquence précédente)
Aiguës 2 - 16 kHz
(+) | des sommets équilibrés - à seulement 3.1% de la médiane
(+) | les aigus sont linéaires (4.3% delta à la fréquence précédente)
Globalement 100 - 16 000 Hz
(+) | le son global est linéaire (13% différence à la médiane)
Par rapport à la même classe
» 22% de tous les appareils testés de cette catégorie étaient meilleurs, 6% similaires, 72% pires
» Le meilleur avait un delta de 7%, la moyenne était de 17%, le pire était de 35%.
Par rapport à tous les appareils testés
» 13% de tous les appareils testés étaient meilleurs, 3% similaires, 85% pires
» Le meilleur avait un delta de 4%, la moyenne était de 23%, le pire était de 134%.
Lenovo ThinkPad P15 G2-20YQ001JGE analyse audio
(±) | le niveau sonore du haut-parleur est moyen mais bon (78# dB)
Basses 100 - 315 Hz
(-) | presque aucune basse - en moyenne 15.5% plus bas que la médiane
(±) | la linéarité des basses est moyenne (9.6% delta à la fréquence précédente)
Médiums 400 - 2000 Hz
(±) | médiane supérieure - en moyenne 7.5% supérieure à la médiane
(+) | les médiums sont linéaires (6.6% delta à la fréquence précédente)
Aiguës 2 - 16 kHz
(+) | des sommets équilibrés - à seulement 2.4% de la médiane
(+) | les aigus sont linéaires (5.8% delta à la fréquence précédente)
Globalement 100 - 16 000 Hz
(±) | la linéarité du son global est moyenne (20.6% de différence avec la médiane)
Par rapport à la même classe
» 74% de tous les appareils testés de cette catégorie étaient meilleurs, 6% similaires, 21% pires
» Le meilleur avait un delta de 7%, la moyenne était de 17%, le pire était de 35%.
Par rapport à tous les appareils testés
» 55% de tous les appareils testés étaient meilleurs, 8% similaires, 37% pires
» Le meilleur avait un delta de 4%, la moyenne était de 23%, le pire était de 134%.
Gestion de l'alimentation : Le GPU a un impact négatif sur la gestion de l'énergie
Consommation électrique
Le Lenovo ThinkPad P16 fonctionne plus efficacement que les appareils comparables. Même en veille, il est plus économe en énergie que la concurrence. Cependant, pour être juste, il faut aussi dire que les ordinateurs portables similaires de HP et Dell ont des écrans 4K. De même, malgré son écran LCD WQXGA de plus haute résolution, il est plus efficace que les P15 et P17 avec leurs panneaux Full HD.
L'adaptateur d'alimentation Slim Tip délivre 170 watts - ce qui est assez juste pour la consommation maximale de 168,9 watts.
| Éteint/en veille | |
| Au repos | |
| Fortement sollicité |
|
Légende:
min: | |
| Lenovo ThinkPad P16 G1 21D6001DMB i7-12850HX, RTX A2000 Laptop GPU, Micron 3400 1TB MTFDKBA1T0TFH, IPS LED, 2560x1600, 16" | Lenovo ThinkPad P15 G2-20YQ001JGE i7-11800H, RTX A3000 Laptop GPU, Kioxia XG7 KXG7AZNV512G, IPS, 1920x1080, 15.6" | Lenovo ThinkPad P17 G2-20YU0025G i7-11800H, RTX A2000 Laptop GPU, Kioxia XG7 KXG7AZNV512G, IPS LED, 1920x1080, 17.3" | HP ZBook Fury 17 G8-4A6A9EA i9-11950H, RTX A3000 Laptop GPU, Toshiba XG6 KXG60ZNV1T02, IPS, 3840x2160, 17.3" | Dell Precision 7670 i7-12850HX, RTX A2000 Laptop GPU, SK Hynix HFS001TEJ9X115N, OLED, 3840x2400, 16" | Asus ExpertBook B6 Flip B6602FC2 i9-12950HX, RTX A2000 Laptop GPU, Samsung PM9A1 MZVL21T0HCLR, IPS, 2560x1600, 16" | Moyenne NVIDIA RTX A2000 Laptop GPU | Moyenne de la classe Workstation | |
|---|---|---|---|---|---|---|---|---|
| Power Consumption | -23% | -15% | -49% | -56% | -67% | -24% | -39% | |
| Idle Minimum * (Watt) | 5.1 | 6.3 -24% | 6.1 -20% | 7.6 -49% | 7.5 -47% | 10.5 -106% | 6.6 ? -29% | 9.11 ? -79% |
| Idle Average * (Watt) | 9.2 | 10.7 -16% | 10.9 -18% | 16.7 -82% | 9.5 -3% | 11.9 -29% | 11.8 ? -28% | 13.8 ? -50% |
| Idle Maximum * (Watt) | 9.9 | 11.6 -17% | 12.3 -24% | 17.5 -77% | 28.4 -187% | 18 -82% | 16.7 ? -69% | 17.9 ? -81% |
| Load Average * (Watt) | 124.1 | 99.3 20% | 106.3 14% | 117 6% | 139.1 -12% | 182 -47% | 116.3 ? 6% | 96 ? 23% |
| Witcher 3 ultra * (Watt) | 87.7 | 154 -76% | 124 -41% | 150 -71% | 134 -53% | 177.5 -102% | ||
| Load Maximum * (Watt) | 168.9 | 210 -24% | 168.9 -0% | 202 -20% | 220.8 -31% | 229 -36% | 171.2 ? -1% | 180.3 ? -7% |
* ... Moindre est la valeur, meilleures sont les performances
Power consumption Witcher 3 / stress test
Power consumption with an external monitor
Durée de vie de la batterie
Lenovo n'a apporté aucune modification à la batterie interne au lithium-polymère de 94 watts-heure. En conséquence, l'autonomie de la batterie est du même ordre que celle de ses prédécesseurs, soit environ neuf heures dans le test WiFi (luminosité de l'écran de 150 cd/m²). Le ThinkPad P16 présente un avantage certain par rapport au Dell Precision 7670qui ne dure pas aussi longtemps dans le test WiFi en raison de sa batterie plus petite de 83 watts-heure et de son écran 4K.
| Lenovo ThinkPad P16 G1 21D6001DMB i7-12850HX, RTX A2000 Laptop GPU, 94 Wh | Lenovo ThinkPad P15 G2-20YQ001JGE i7-11800H, RTX A3000 Laptop GPU, 94 Wh | Lenovo ThinkPad P17 G2-20YU0025G i7-11800H, RTX A2000 Laptop GPU, 94 Wh | HP ZBook Fury 17 G8-4A6A9EA i9-11950H, RTX A3000 Laptop GPU, 94 Wh | Dell Precision 7670 i7-12850HX, RTX A2000 Laptop GPU, 83 Wh | Asus ExpertBook B6 Flip B6602FC2 i9-12950HX, RTX A2000 Laptop GPU, 90 Wh | Moyenne de la classe Workstation | |
|---|---|---|---|---|---|---|---|
| Autonomie de la batterie | -12% | -9% | -5% | -33% | -7% | -15% | |
| WiFi v1.3 (h) | 9.4 | 9.9 5% | 9.8 4% | 7.4 -21% | 5.9 -37% | 8.7 -7% | 8.55 ? -9% |
| Load (h) | 1.8 | 1.3 -28% | 1.4 -22% | 2 11% | 1.3 -28% | 1.7 -6% | 1.441 ? -20% |
Points positifs
Points négatifs
Verdict : la nouvelle station de travail ThinkPad est mise à nu par la puce graphique
Avec le ThinkPad P16 Gen 1, Lenovo a fait un grand pas en avant, passant de deux stations de travail de 15 et 17 pouces à un seul modèle de 16 pouces - une simplification rare mais bienvenue de la gamme. Dans le même temps, Lenovo a également osé bousculer le langage stylistique de la série ThinkPad P. Le résultat est une nouvelle génération de ThinkPad. Dans l'ensemble, le résultat est une très bonne station de travail qui, toutefois, n'est pas exempte de défauts.
L'un des points forts de l'ordinateur portable Lenovo est, sans aucun doute, sa capacité d'extension. Seuls ces types de stations de travail peuvent offrir jusqu'à quatre emplacements de mémoire vive. L'appareil est également doté de nombreuses fonctionnalités et est préparé pour le WWAN. Cependant, le port Ethernet RJ45 nous manque. Que le nouveau design soit une amélioration optique est une question de goût, mais le nouveau couvercle d'écran renforcé par du métal est, sans conteste, très solide. L'écran WQXGA mat impressionne par sa haute luminosité mais il est dommage que Lenovo ne propose pas la dalle 165 Hz que l'on trouve dans leX1 Extreme Gen 5. Les périphériques d'entrée du ThinkPad P16 continuent d'être très bons, mais la course réduite des touches ne le place pas tout à fait au même niveau que son prédécesseur, leThinkPad P17.
Lorsqu'il s'agit de stations de travail mobiles, les performances sont essentielles. Ici, nous pouvons voir que les performances du processeur ont été améliorées de manière significative. Cependant, cela ne s'applique pas au GPU : inutilement, Lenovo a laissé la RTX A2000 à une consommation de seulement 60 watts. Étrangement, les ventilateurs ne fonctionnent pas puissamment sous la charge pure du CPU, donc pour cette raison, les performances de l'ordinateur portable sous charge sont étranglées. En parlant du ventilateur : En cas de charge soutenue, le refroidissement actif est très bruyant. Toutefois, cela a l'avantage que le ThinkPad P16 reste considérablement plus frais que ses prédécesseurs, les P15 et P17, dans presque tous les domaines.
Le processeur est très performant, mais le GPU est à la traîne dans cette version du ThinkPad P16.
En résumé, notre modèle Lenovo ThinkPad P16 G1 est un excellent choix lorsqu'il s'agit d'effectuer des tâches lourdes pour le processeur. Si le GPU est important, vous devriez vous abstenir d'acheter la version RTX-A2000. Toutefois, cela ne signifie pas qu'un ThinkPad P16 équipé de l'un des GPU les plus puissants souffre du même problème - notre critique du modèle Nvidia RTX A5500 est maintenant en ligne.
Pour ceux qui recherchent une station de travail plus mobile, une alternative intéressante pourrait être le Dell Precision 7670, avec son boîtier plus fin et plus compact. Le Asus ExpertBook B6 Flip combine la puissance d'une station de travail avec un design convertible et pourrait être un choix intéressant pour les utilisateurs qui travaillent fréquemment avec un stylet.
Prix et disponibilité
Les hautes performances ont un prix : Le ThinkPad P16 coûte au moins 2 050 dollars US, les modèles les mieux équipés dépassant les 3 500 dollars US. Un appareil similaire à notre modèle de référence coûte environ 2 800 dollars US sur Amazon.
Lenovo ThinkPad P16 G1 21D6001DMB
- 01/27/2023 v7 (old)
Benjamin Herzig
Price comparison

