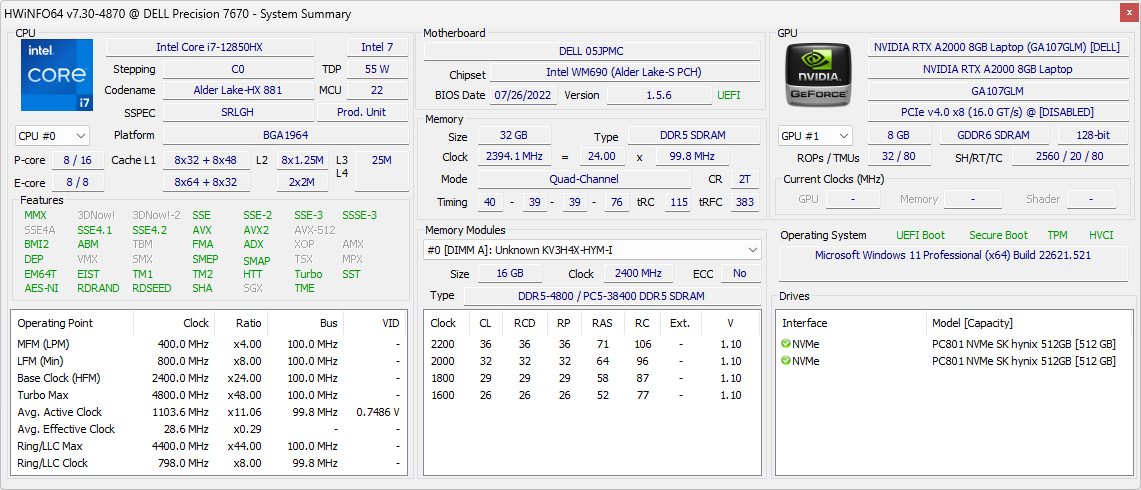
Test du Dell Precision 7670 : lancement du Core i7-12850HX et de la RAM CAMM

La série Precision 7000 abrite les stations de travail mobiles phares de Dell, contrairement à la série de milieu de gamme Precision 5000 ou à la série économique Precision 3000. Le modèle Precision 7670 est le premier modèle 16 pouces de la famille, situé entre les modèles 15,6 pouces Precision 7560 et 17,3 pouces Precision 7760. Curieusement, Dell produit deux variantes du Precision 7670 appelées "Performance base" et "Thin base". Cet examen spécifique porte sur la variante "Thin base", l'examen de la "Performance base" étant prévu à une date ultérieure.
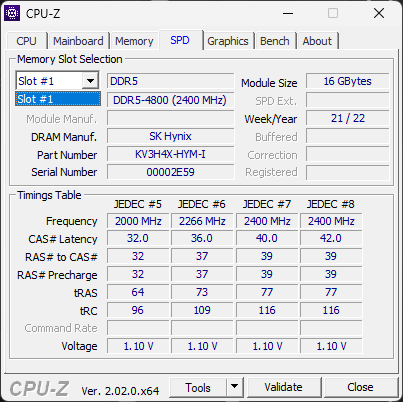
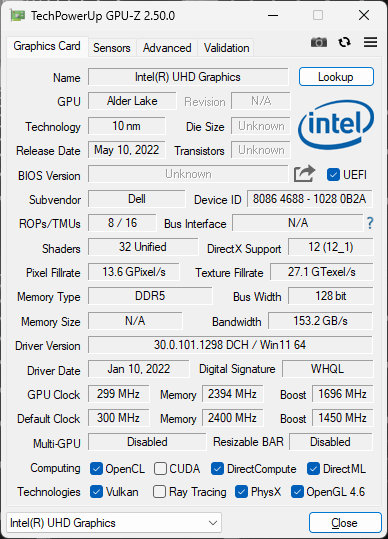
Les options sont très larges, allant du Core i5-12600HX au i9-12950HX, de la carte graphique Iris Xe à la carte discrète Nvidia RTX A5500, de l'écran IPS FHD à l'écran OLED 4K, et même de la RAM SODIMM ou CAMM jusqu'à 128 Go. Notre unité d'examen spécifique est une configuration de milieu de gamme avec le i7-12850HX, la RTX A2000 95 W, et l'écran tactile OLED 4K pour environ 4100 $ US.
Il n'y a malheureusement pas d'options Xeon ou ECC RAM pour le Precision 7670 pour le moment, mais vPro est pris en charge sur toutes les UGS.
Il existe peu de concurrents directs pour le moment, car l'espace des stations de travail de 16 pouces est encore relativement nouveau. Les alternatives actuelles sont les suivantes Asus ProArt StudioBook Pro 16, Lenovo ThinkPad P1 G4et le HP ZBook Fury 16.
Plus de commentaires sur Dell :
Comparaison avec les concurrents potentiels
Note | Date | Modèle | Poids | Épaisseur | Taille | Résolution | Prix |
|---|---|---|---|---|---|---|---|
| 88.4 % v7 (old) | 10/22 | Dell Precision 7670 i7-12850HX, RTX A2000 Laptop GPU | 2.7 kg | 24.7 mm | 16.00" | 3840x2400 | |
| 89.3 % v7 (old) | Lenovo ThinkPad P1 G4-20Y4Z9DVUS i7-11800H, T1200 Laptop GPU | 1.8 kg | 17.7 mm | 16.00" | 2560x1600 | ||
v (old) | 12/21 | Asus ProArt StudioBook 16 W7600H5A-2BL2 W-11955M, RTX A5000 Laptop GPU | 2.4 kg | 21.4 mm | 16.00" | 3840x2400 | |
| 88.3 % v7 (old) | 10/21 | Dell Precision 5000 5560 i7-11850H, RTX A2000 Laptop GPU | 2 kg | 18 mm | 15.60" | 3840x2400 | |
| 87.8 % v7 (old) | 09/20 | Dell Precision 7550 W-10885M, Quadro RTX 5000 Max-Q | 2.8 kg | 27.36 mm | 15.60" | 3840x2160 | |
| 90.3 % v7 (old) | 10/21 | HP ZBook Fury 15 G8 i9-11950H, RTX A5000 Laptop GPU | 2.5 kg | 25.9 mm | 15.60" | 3840x2160 |
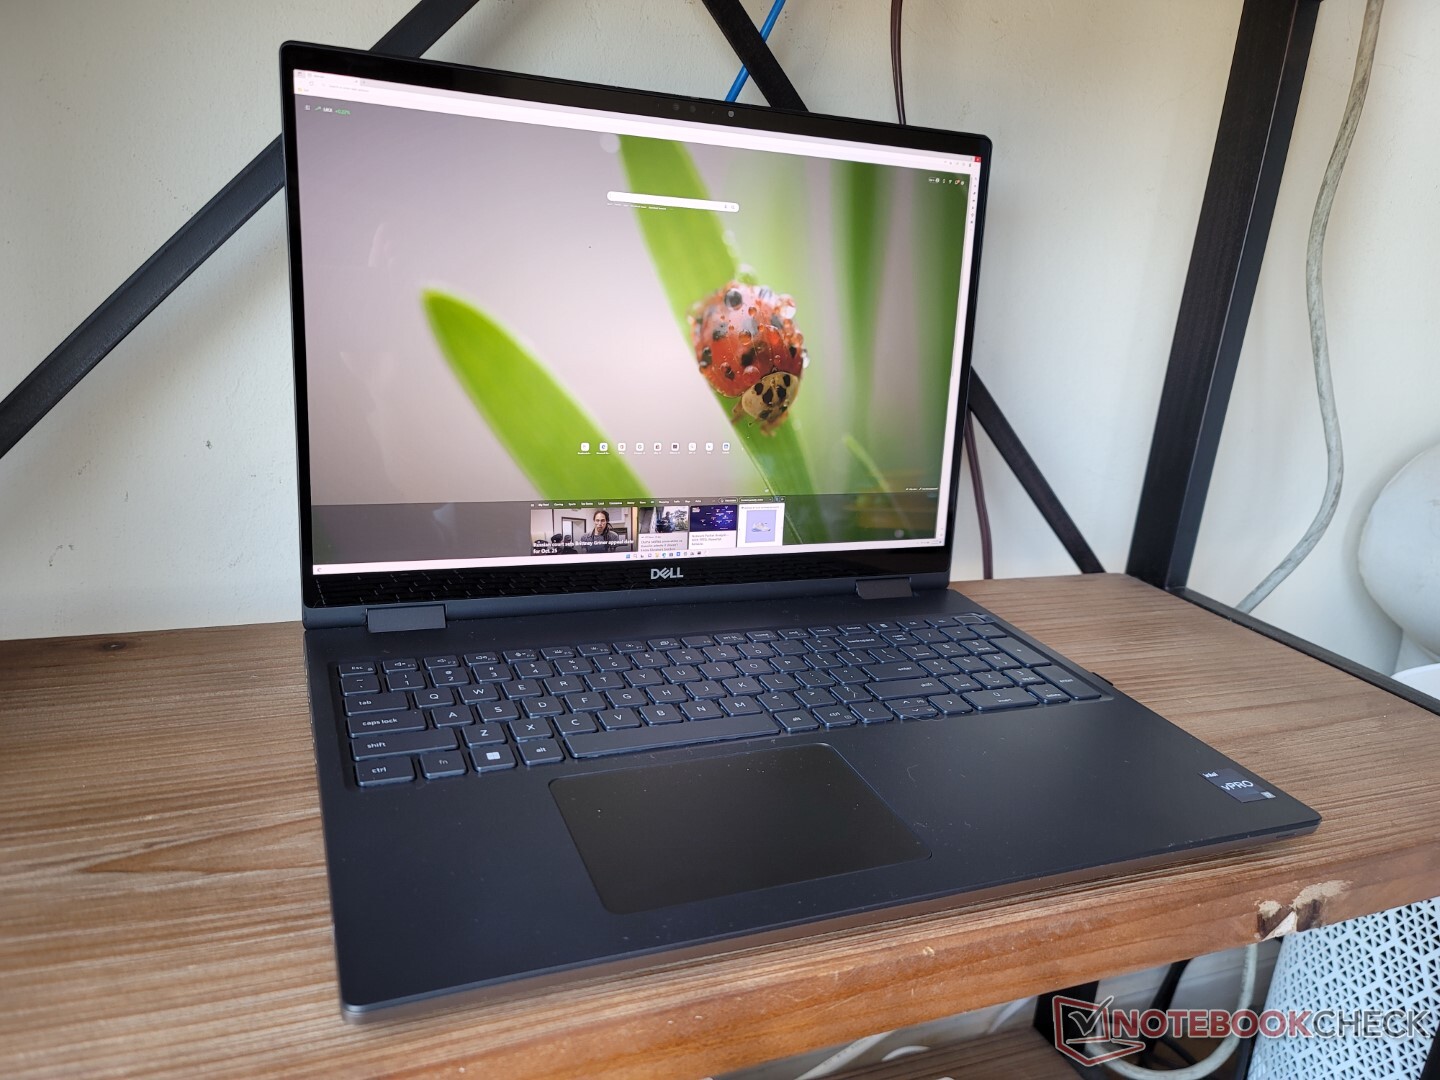
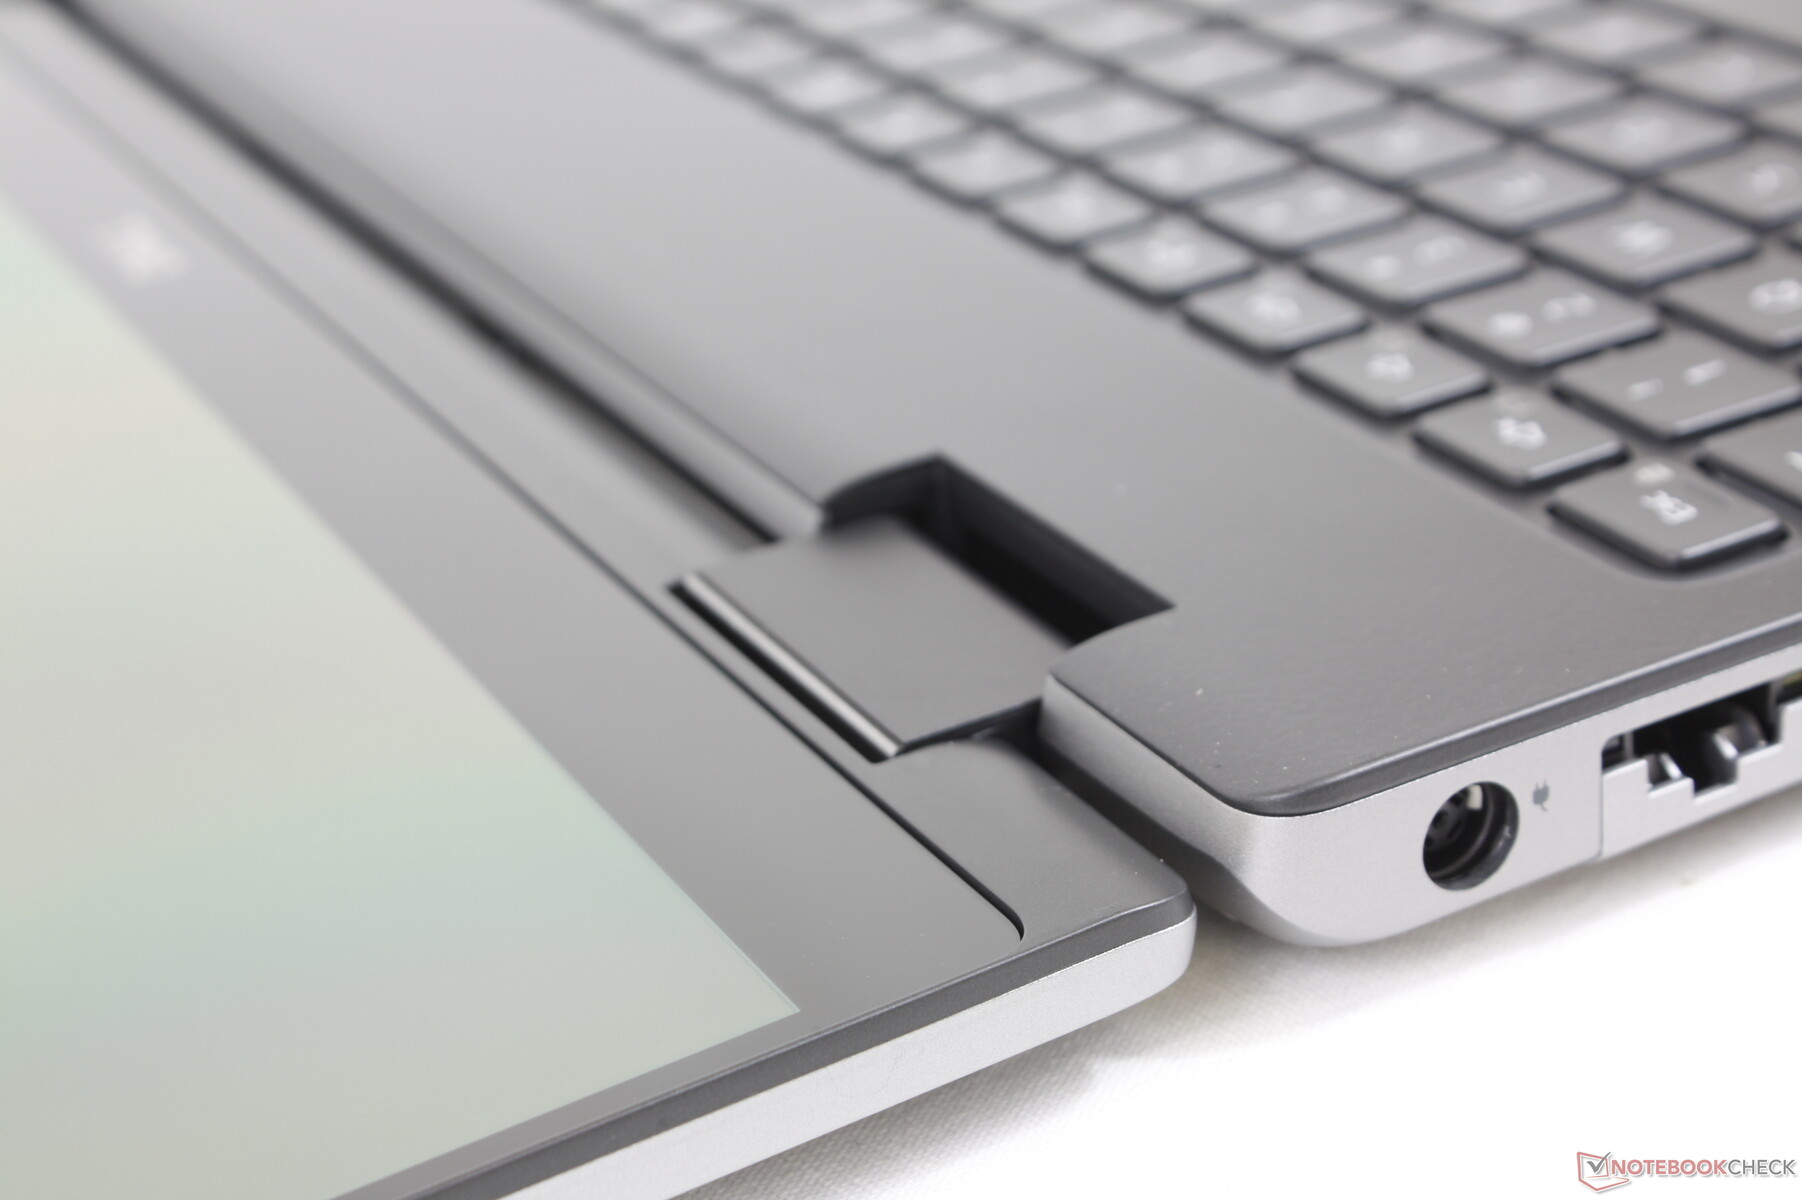
Etui - Look and Feel classique Precision
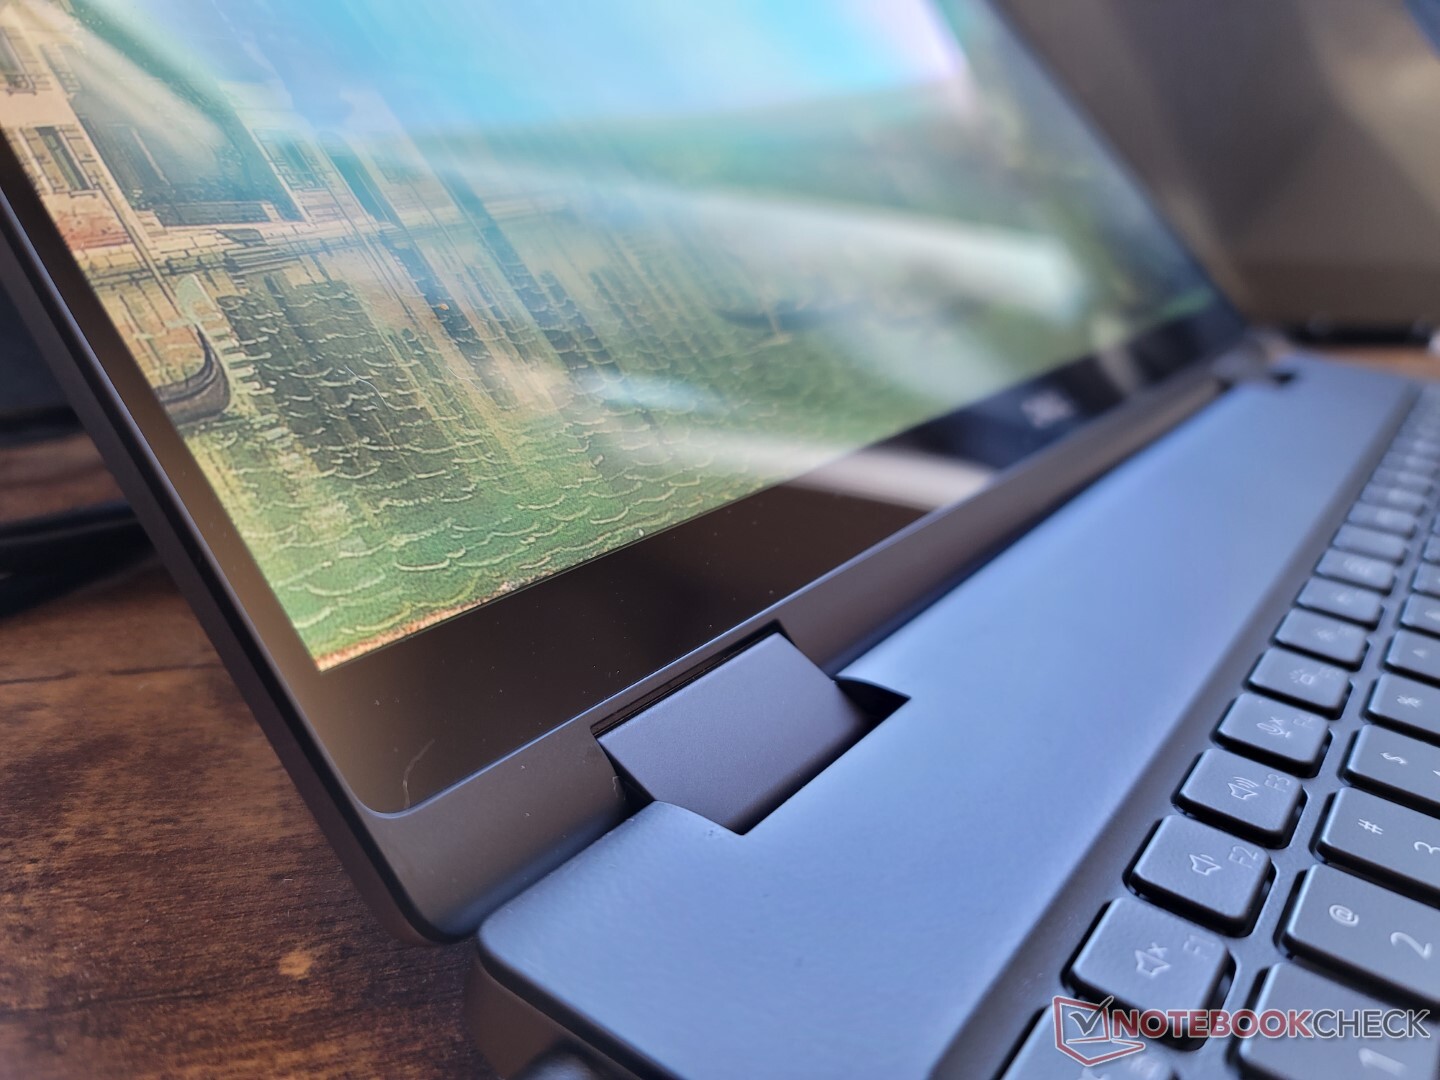
La conception du châssis et les matériaux correspondent étroitement à ceux du modèle 2020 Precision 7550. Le clavier noir, par exemple, est toujours légèrement caoutchouté pour une sensation de qualité, tandis que le squelette métallique extérieur reste épais pour une première impression plus forte que celle du ThinkPad P1 G4 ou Asus ProArt StudioBook. L'application d'une pression sur le centre du clavier ou le couvercle extérieur déforme leurs surfaces un peu plus que sur un HP ZBook Studiomais nous ne remarquons aucun autre craquement ou point faible majeur.
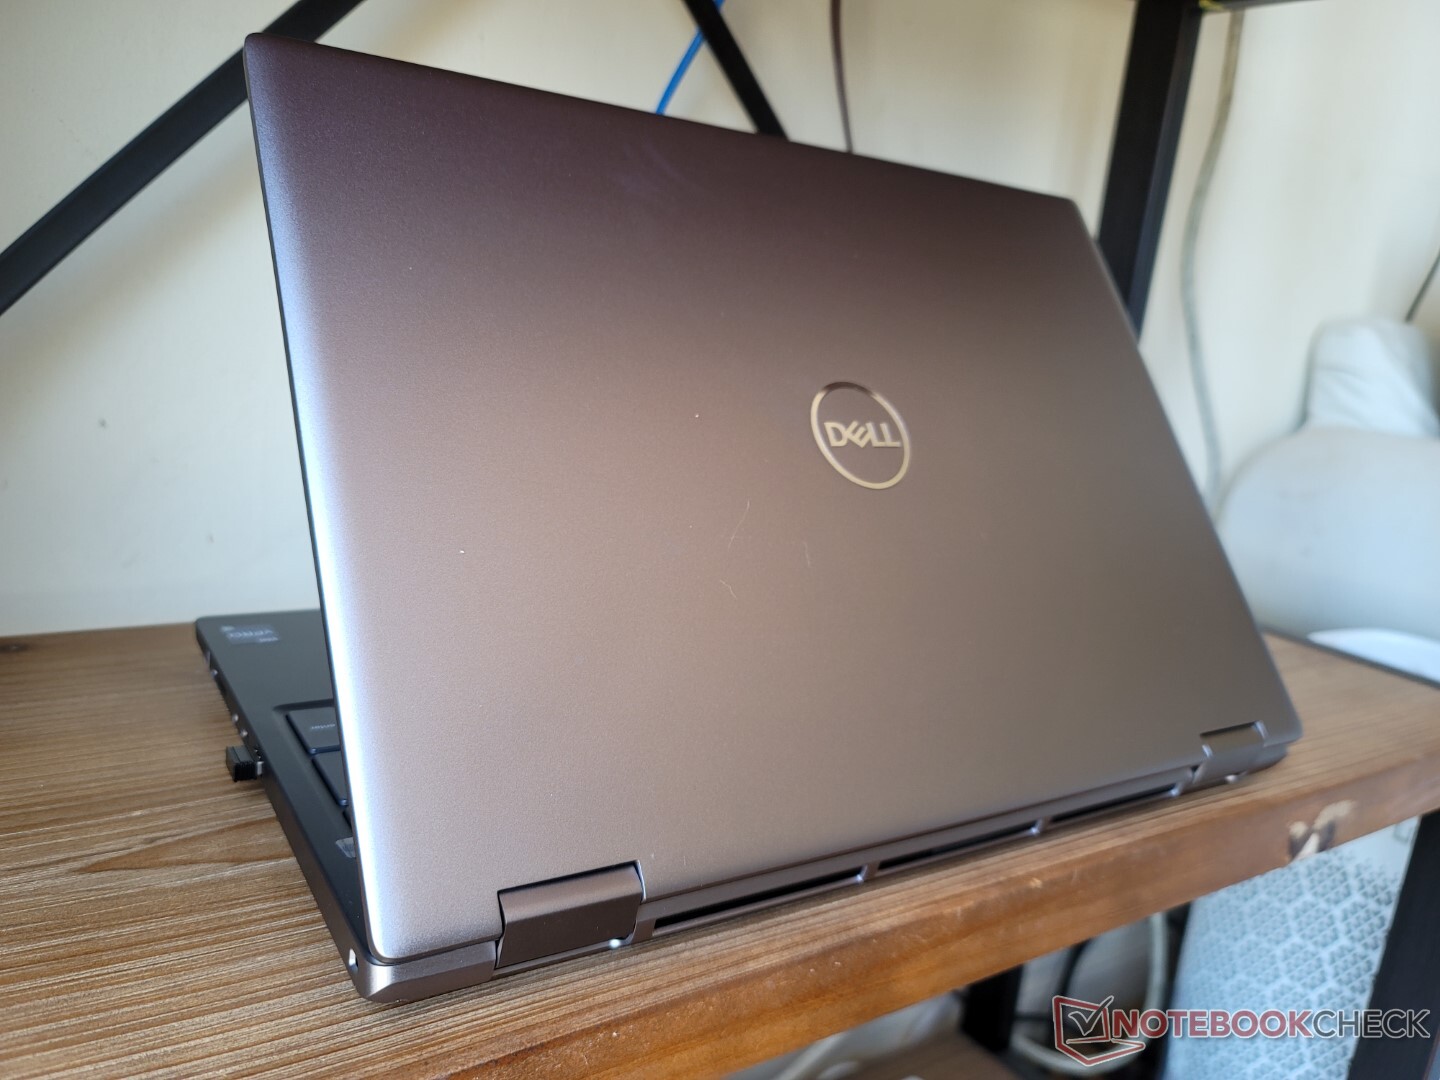
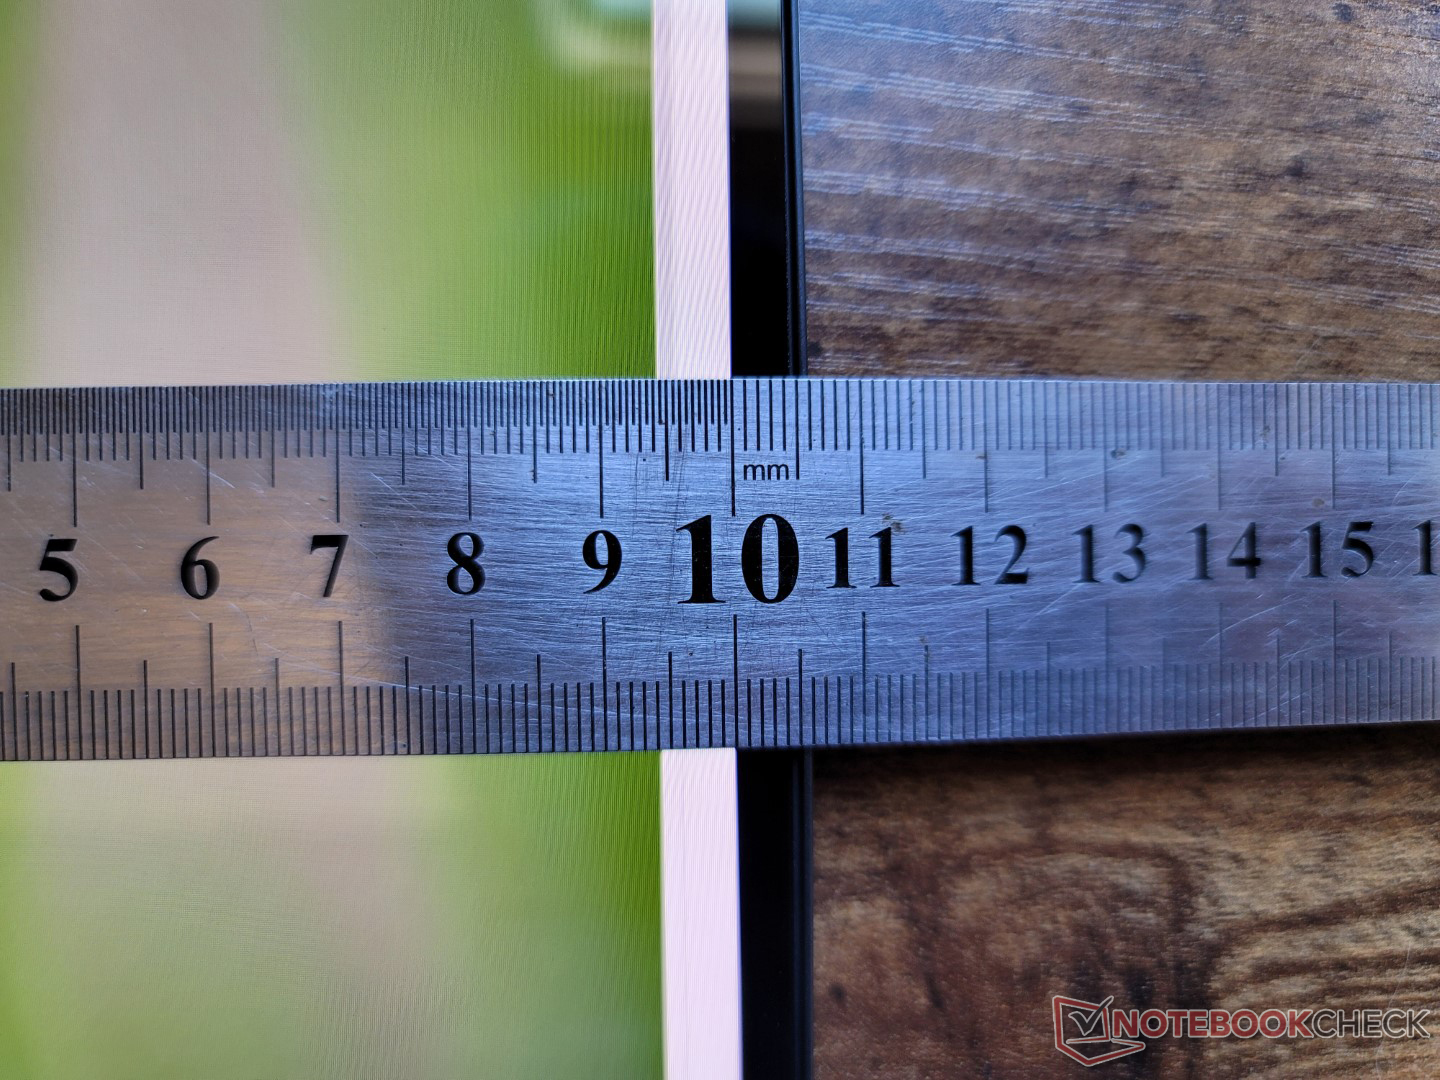
Le Precision 7670 est encore relativement grand et lourd, bien que notre unité de test soit la version "Thin base". Avec une épaisseur de 24,7 mm, le système est plus épais que le Asus ProArt StudioBook 16 et à peine plus fin que le HP ZBook Fury 15 G8. Il est également beaucoup plus lourd, de plusieurs centaines de grammes chacun, en partie à cause de son format 16 pouces 16:10.
La "base Performance" est plus épaisse d'environ 3 mm et plus lourde d'au moins 70 g que la "base Fine", selon la configuration.
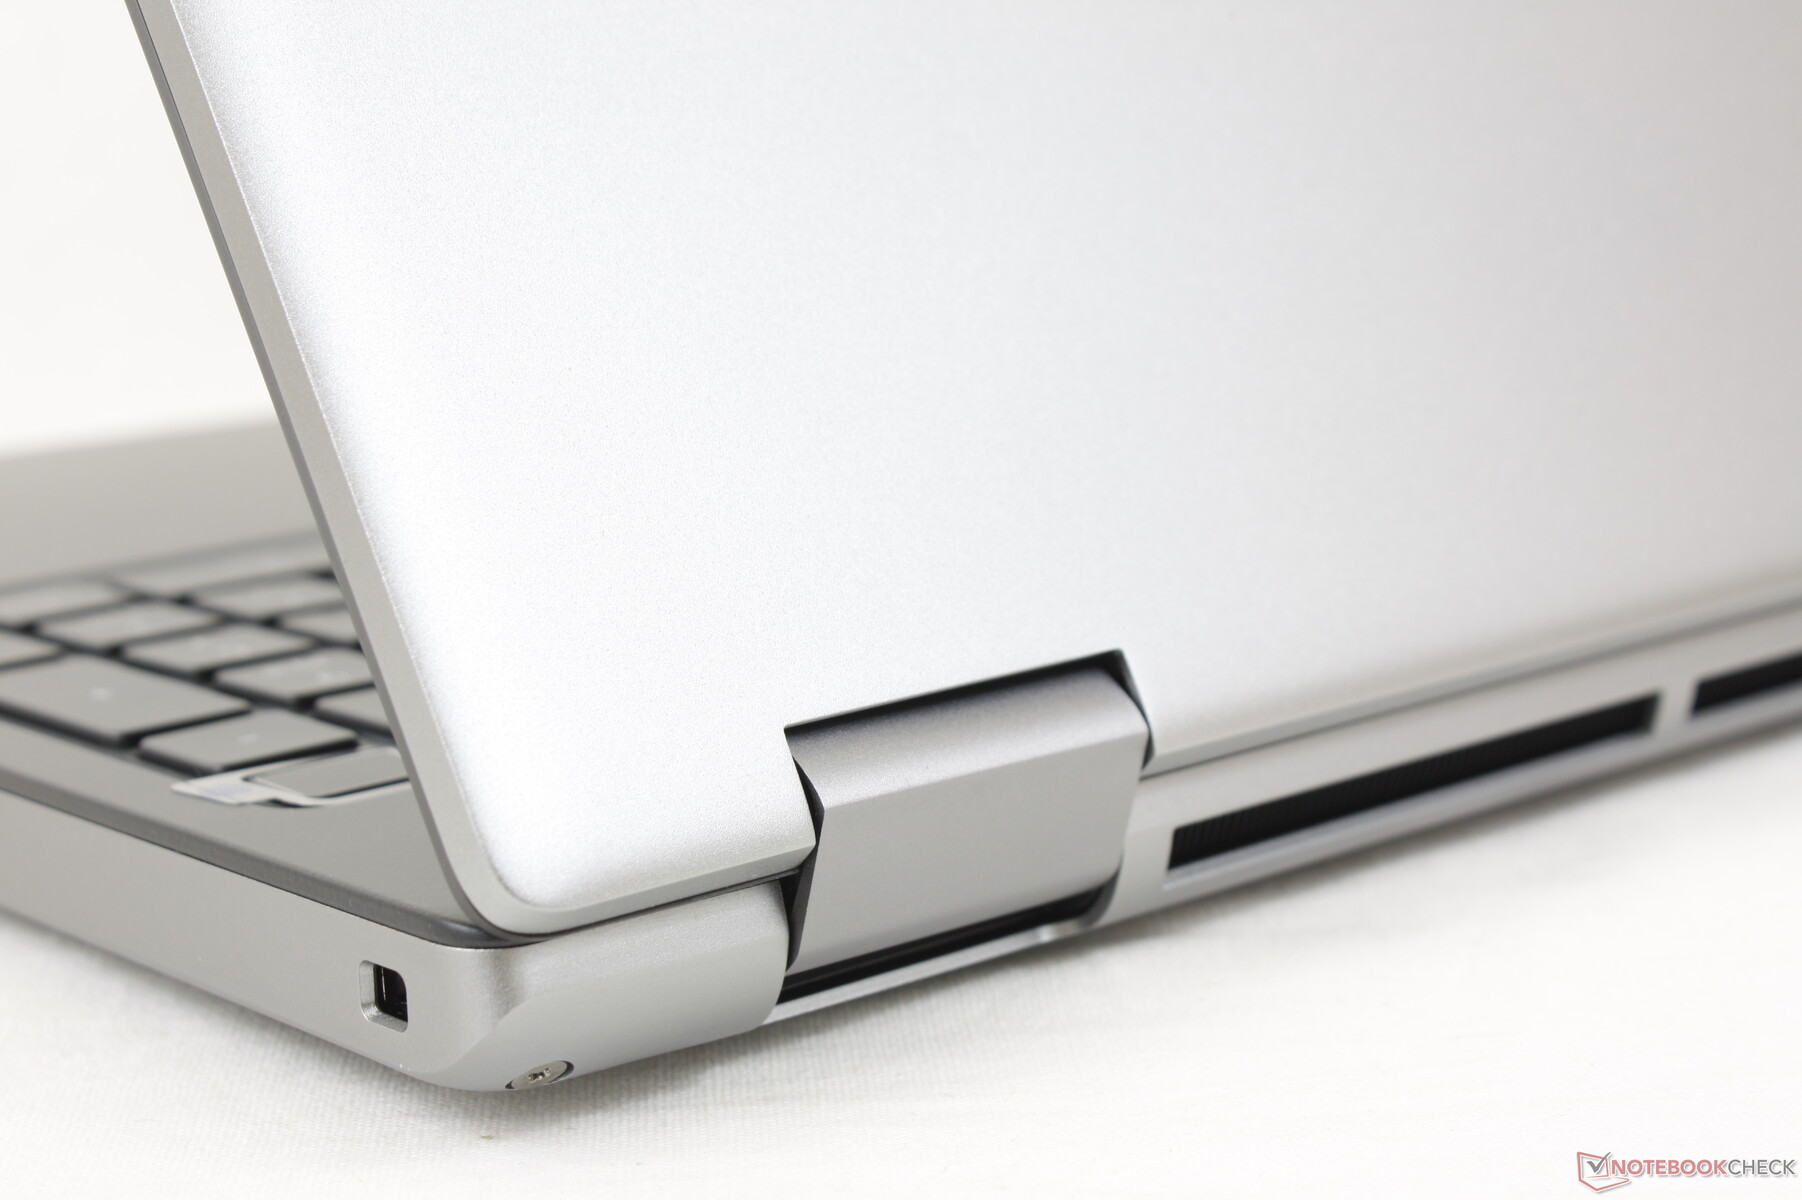
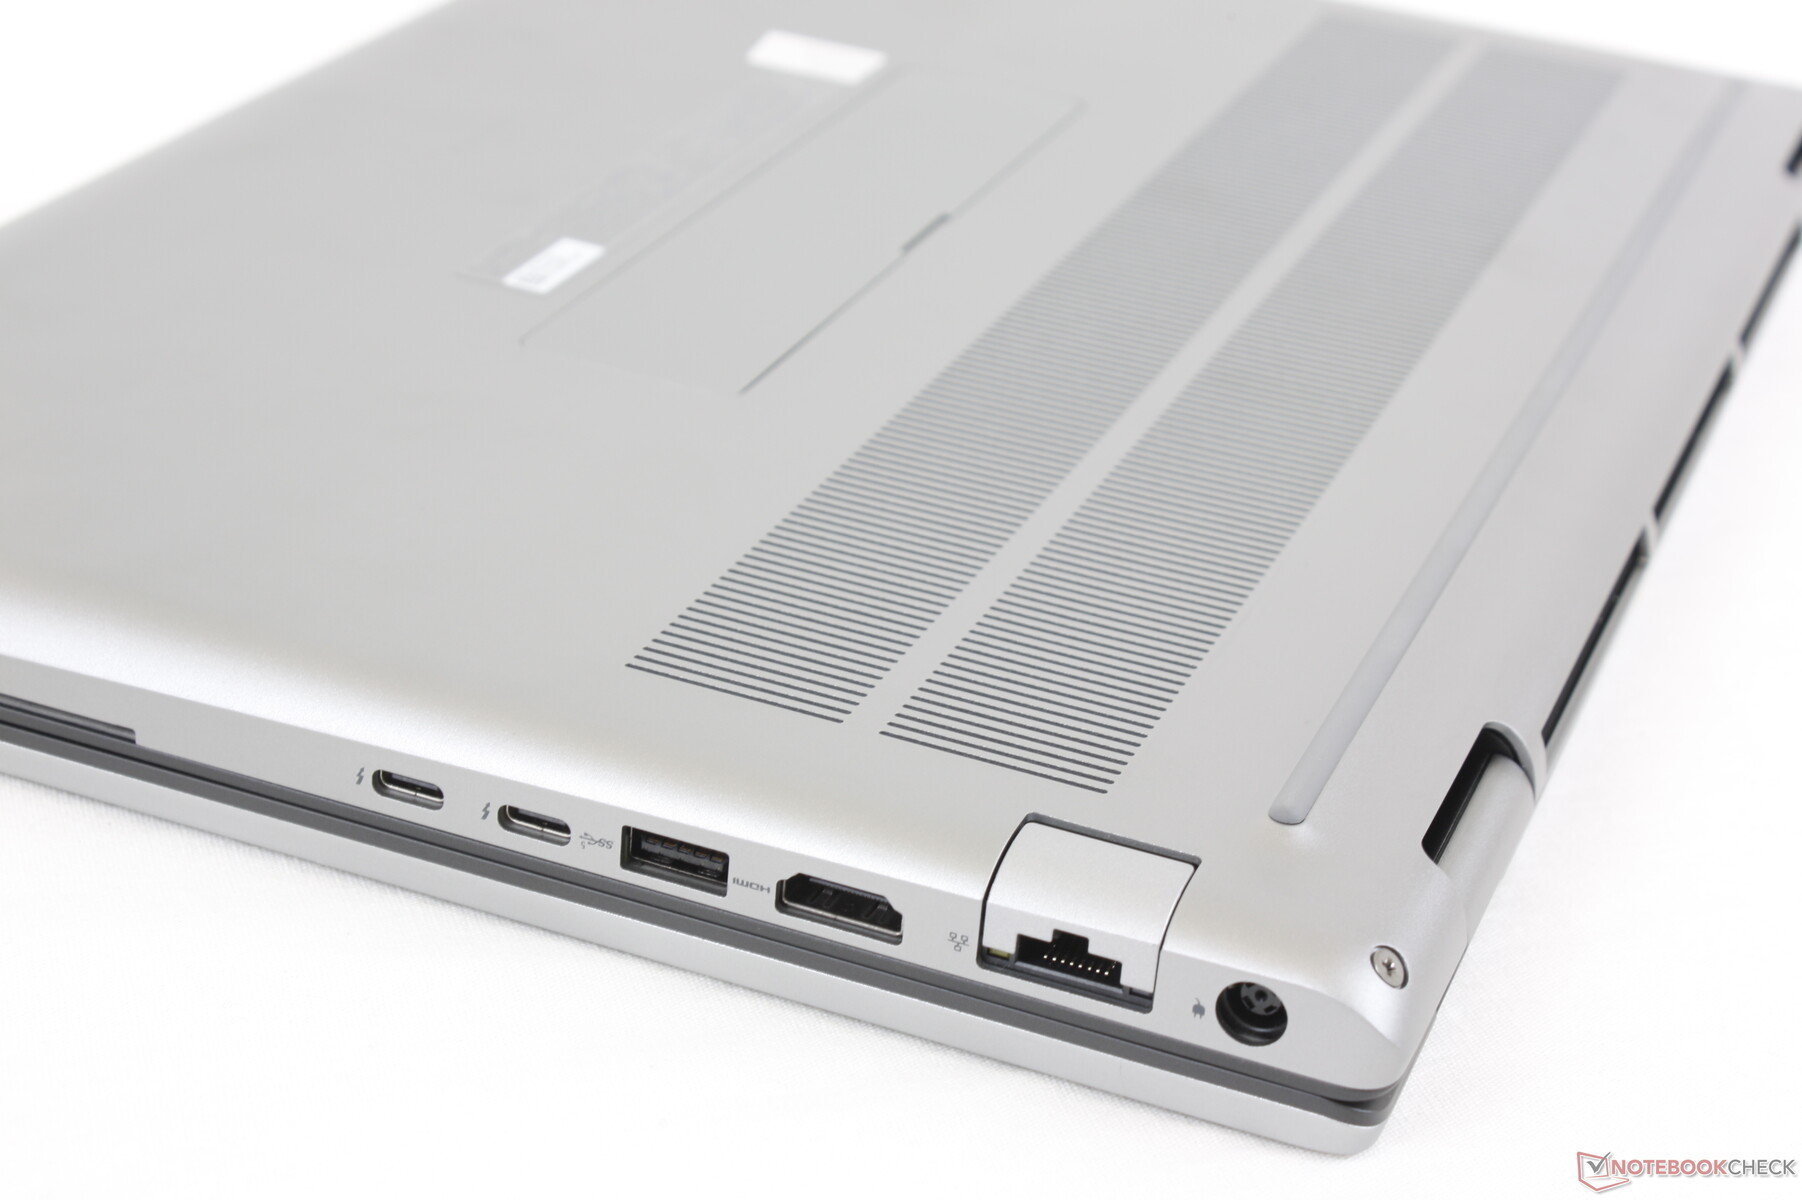
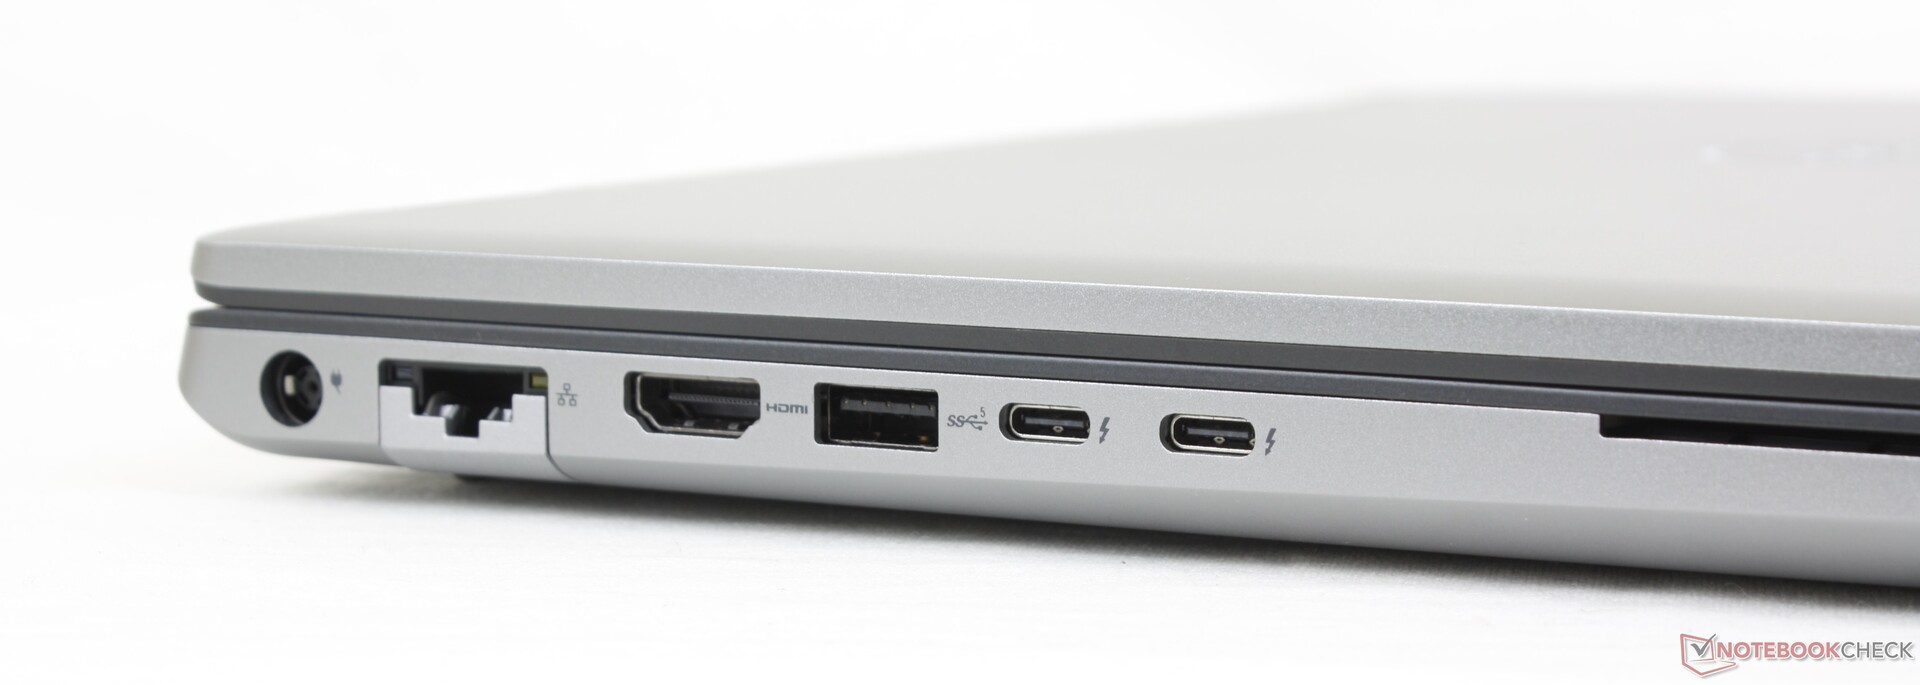
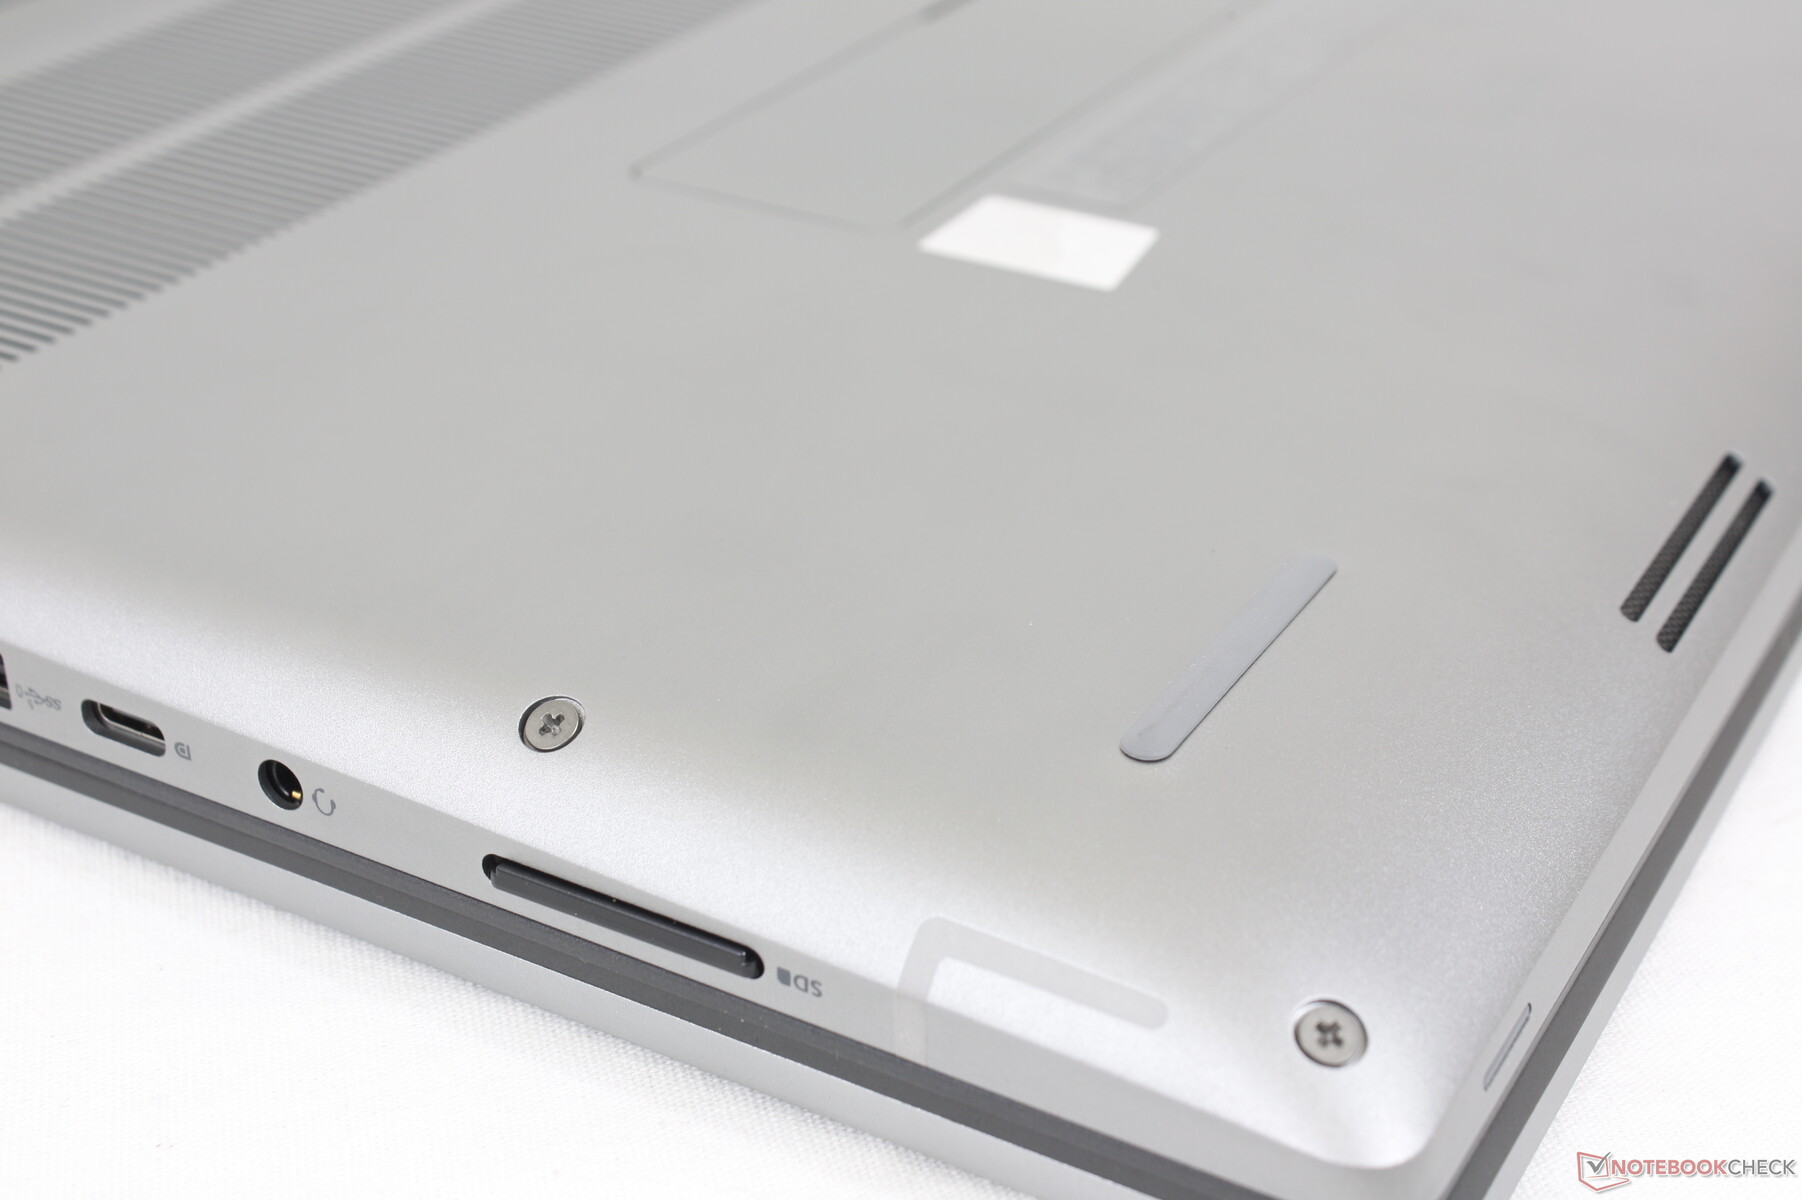
Connectivité - Thunderbolt 4 mais pas de PD-In
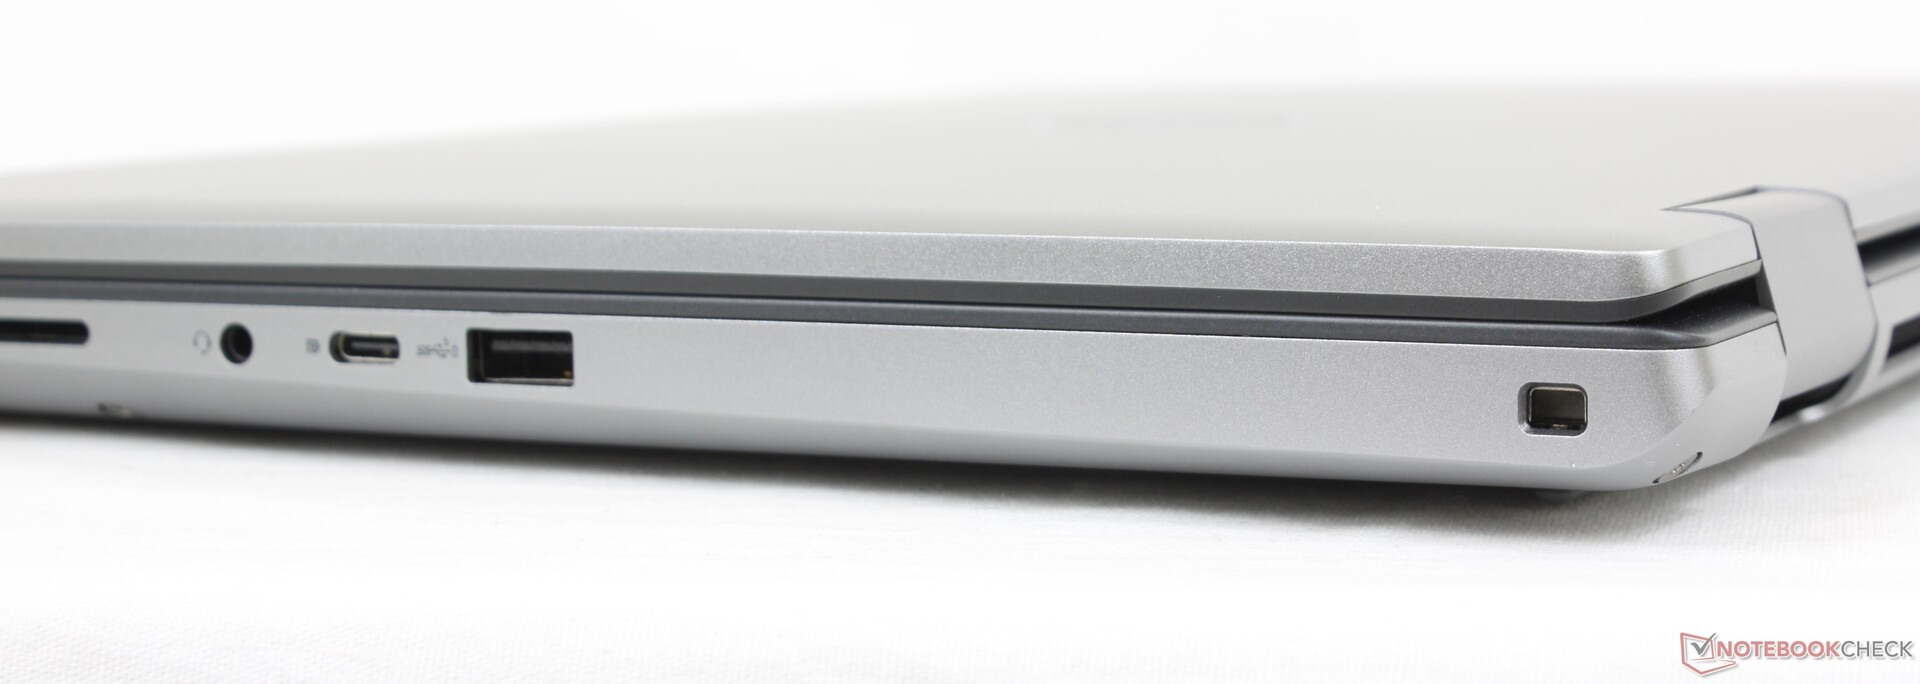
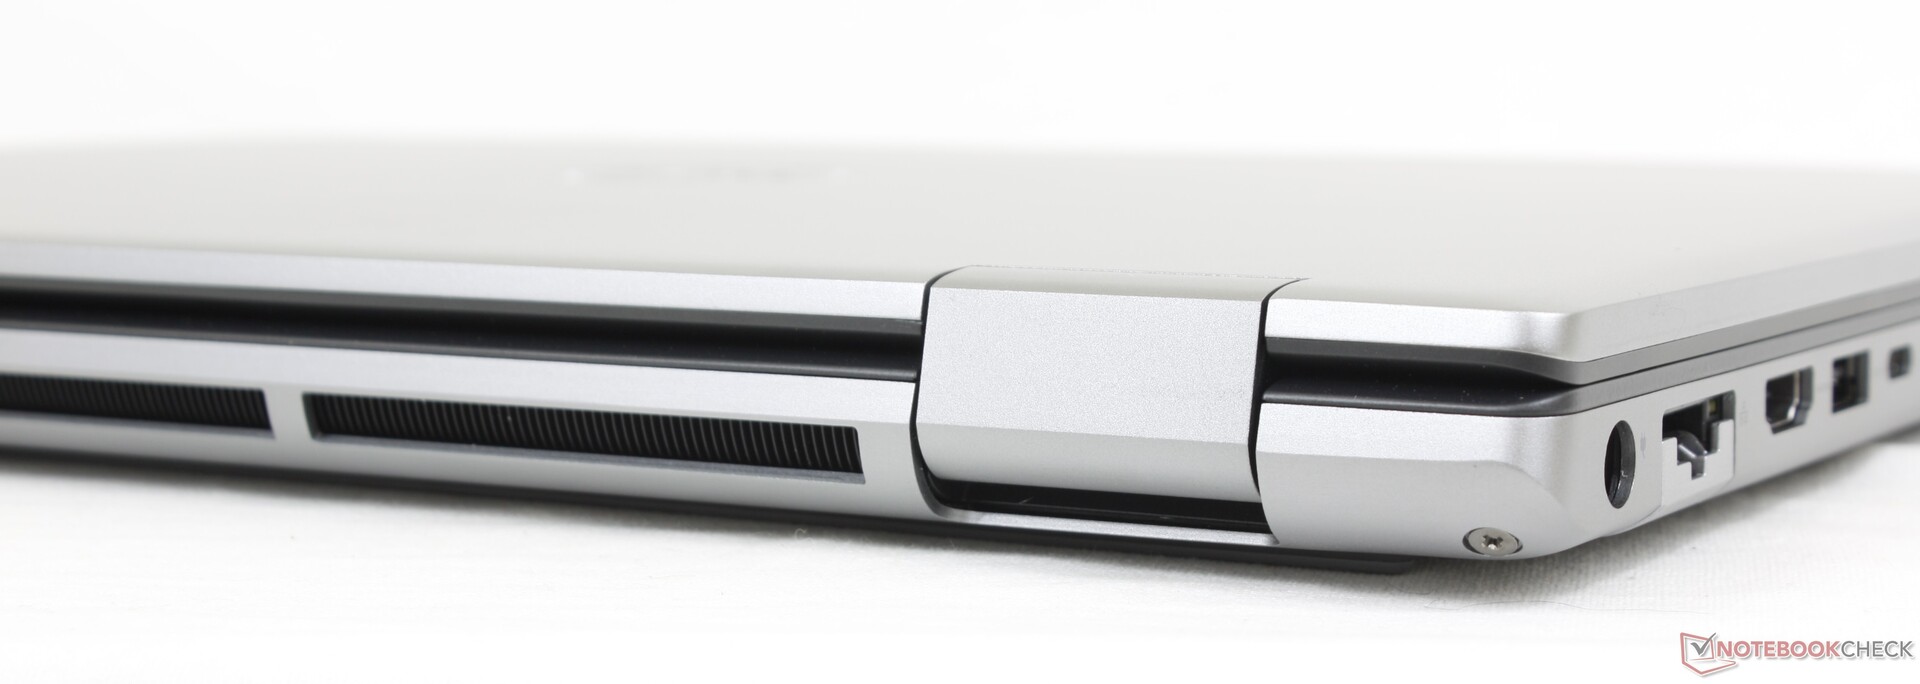
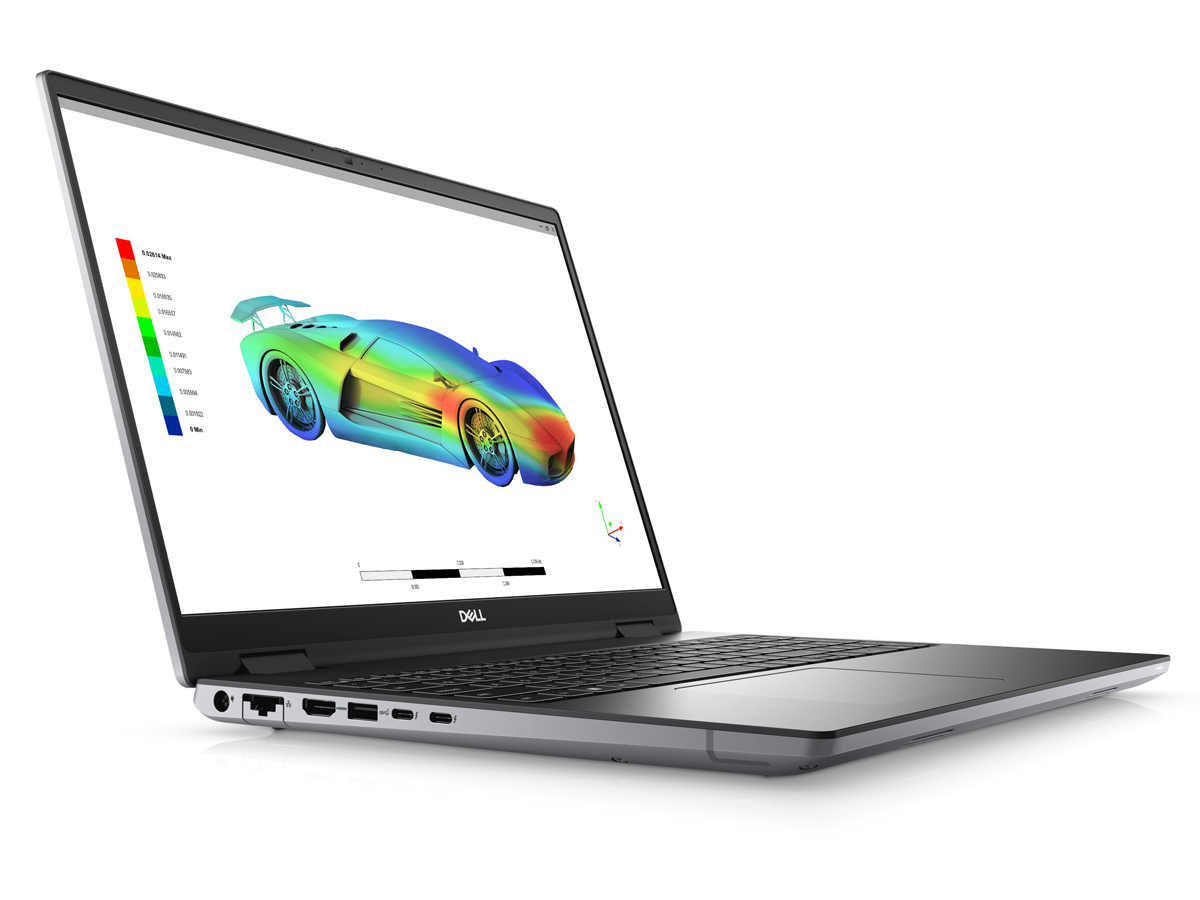
Les options de port sont excellentes, d'autant plus qu'il y a plus de ports USB que sur la plupart des autres stations de travail. De nombreux ports se trouvent le long du bord gauche, tandis que les ports du bord droit sont plutôt proches de l'avant. Notez que le port RJ-45 ne prend en charge que des vitesses allant jusqu'à 1 Gbps au lieu de 10 Gbps.
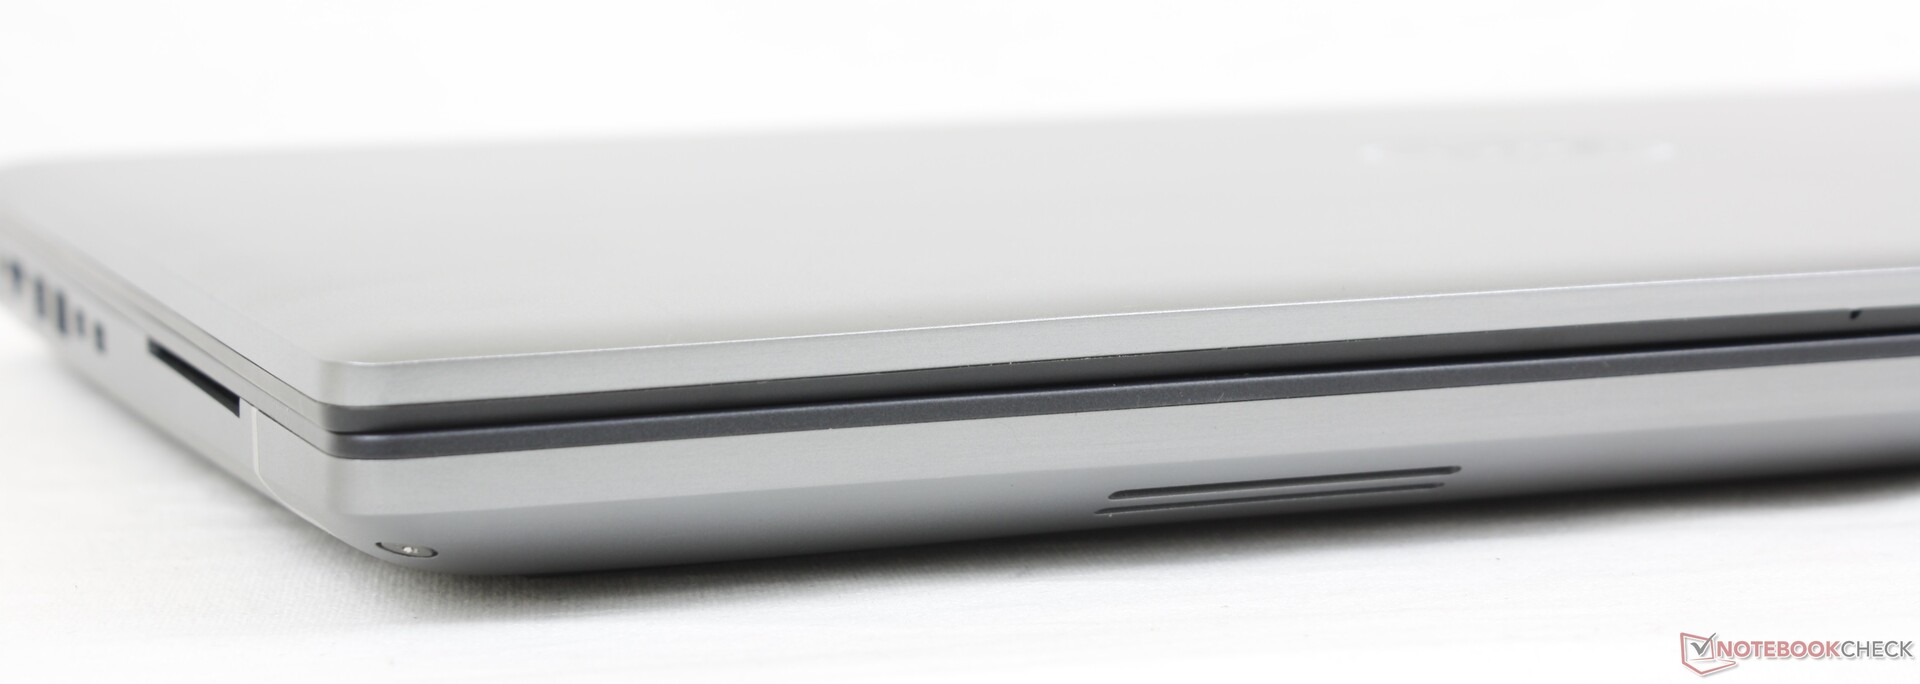
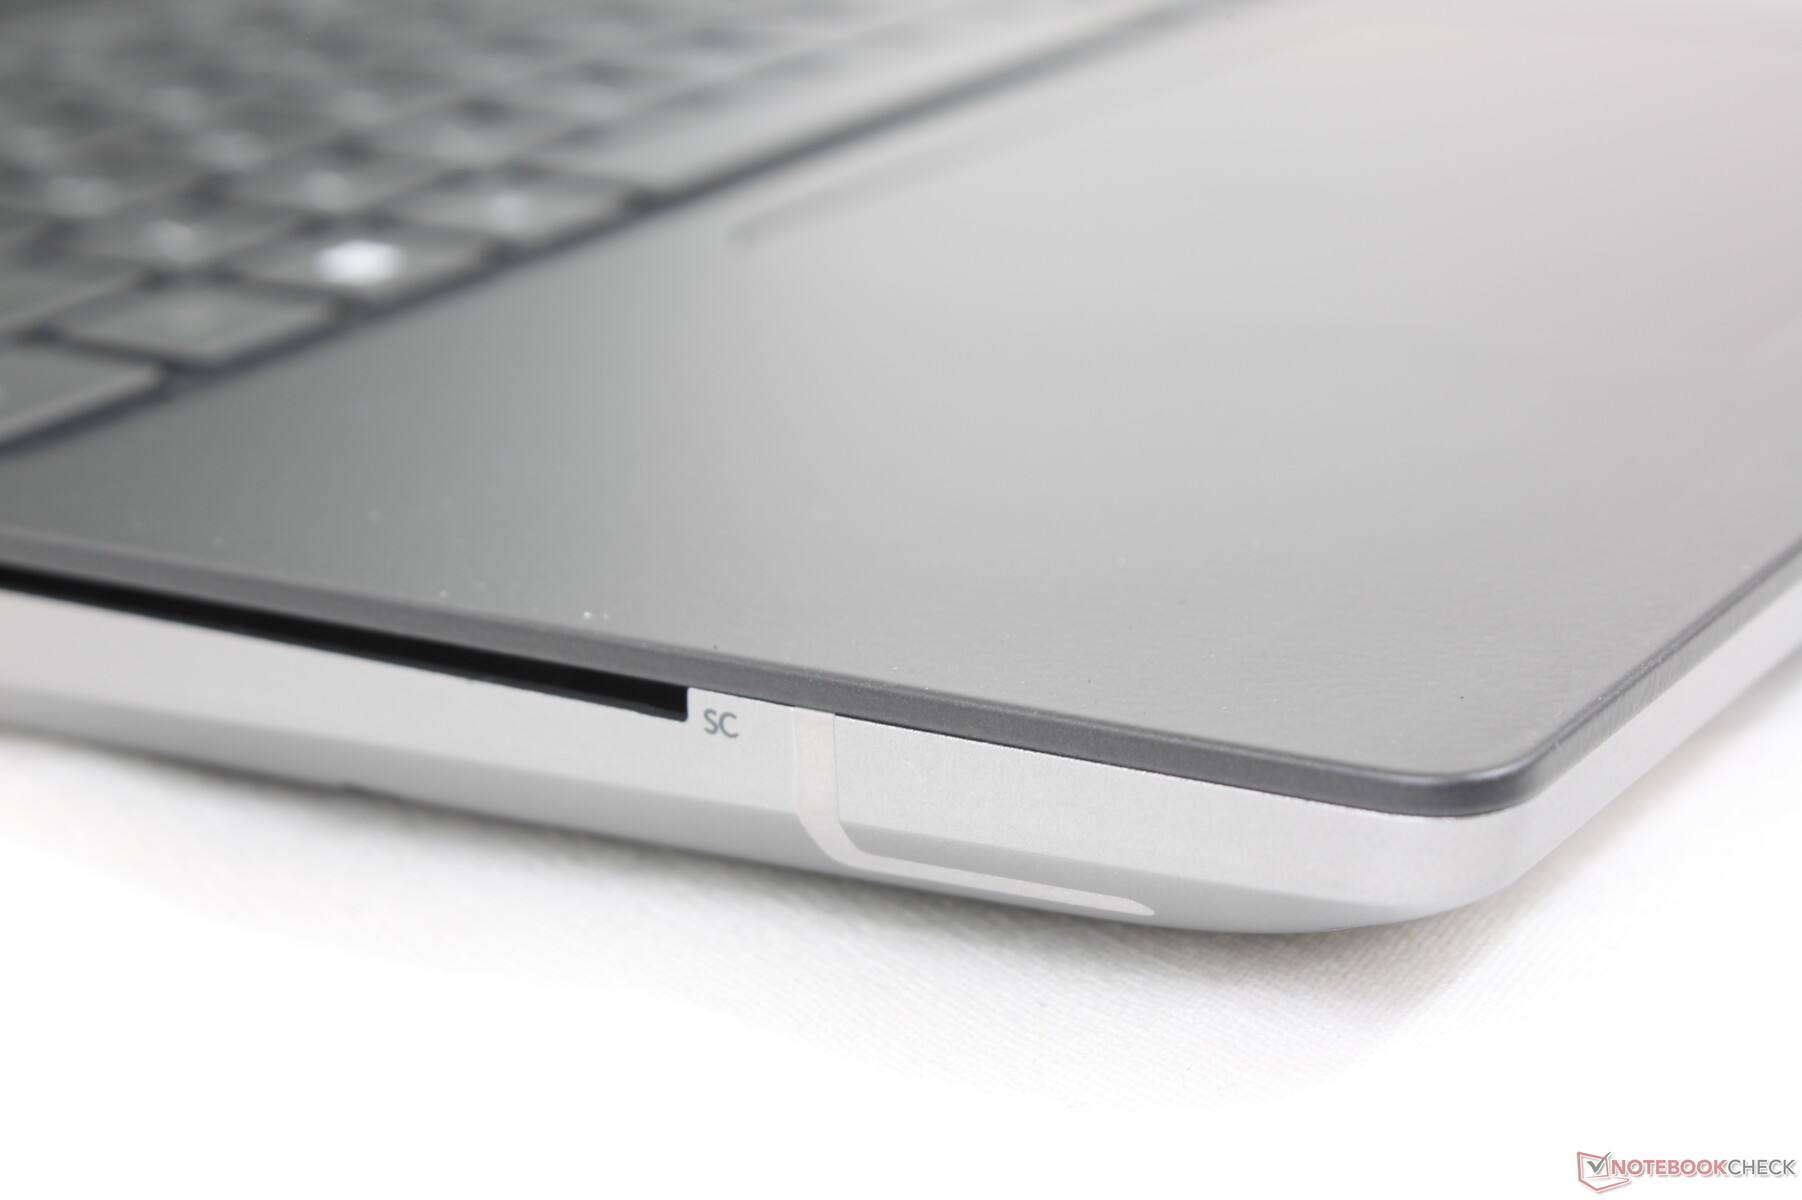
Lecteur de carte SD
Les taux de transfert avec le lecteur SD à ressort sont aussi rapides que sur le Precision 7550 ou plus de 2x plus rapide que sur le HP ZBook Fury G8. Le transfert de 1 Go de photos de notre carte UHS-II vers le bureau ne prend que 5 à 6 secondes.
| SD Card Reader | |
| average JPG Copy Test (av. of 3 runs) | |
| Lenovo ThinkPad P1 G4-20Y4Z9DVUS (Angelbird AV Pro V60) | |
| Dell Precision 5000 5560 (AV Pro V60) | |
| Dell Precision 7670 (Toshiba Exceria Pro SDXC 64 GB UHS-II) | |
| Dell Precision 7550 (Toshiba Exceria Pro SDXC 64 GB UHS-II) | |
| HP ZBook Fury 15 G8 (AV Pro V60) | |
| Asus ProArt StudioBook 16 W7600H5A-2BL2 (AV Pro SD microSD 128 GB V60) | |
| maximum AS SSD Seq Read Test (1GB) | |
| Dell Precision 5000 5560 (AV Pro V60) | |
| Dell Precision 7550 (Toshiba Exceria Pro SDXC 64 GB UHS-II) | |
| Dell Precision 7670 (Toshiba Exceria Pro SDXC 64 GB UHS-II) | |
| Lenovo ThinkPad P1 G4-20Y4Z9DVUS (Angelbird AV Pro V60) | |
| HP ZBook Fury 15 G8 (AV Pro V60) | |
| Asus ProArt StudioBook 16 W7600H5A-2BL2 (AV Pro SD microSD 128 GB V60) | |
Communication
Un Intel AX211 est fourni en standard pour la connectivité Wi-Fi 6E et Bluetooth en option. Malheureusement, le Wi-Fi 6E n'est pas nécessairement plus rapide que le Wi-Fi 6 dans de nombreuses situations. Les taux de transfert semblent varier beaucoup plus sur notre Precision 7670 par rapport à la plupart des autres stations de travail, même à seulement un ou deux mètres de notre point d'accès 6 GHz.
| Networking | |
| iperf3 transmit AX12 | |
| Lenovo ThinkPad P1 G4-20Y4Z9DVUS | |
| HP ZBook Fury 15 G8 | |
| Dell Precision 7550 | |
| Dell Precision 5000 5560 | |
| Asus ProArt StudioBook 16 W7600H5A-2BL2 | |
| iperf3 receive AX12 | |
| Dell Precision 5000 5560 | |
| Lenovo ThinkPad P1 G4-20Y4Z9DVUS | |
| Dell Precision 7550 | |
| HP ZBook Fury 15 G8 | |
| Asus ProArt StudioBook 16 W7600H5A-2BL2 | |
| iperf3 receive AXE11000 6GHz | |
| Dell Precision 7670 | |
| iperf3 transmit AXE11000 6GHz | |
| Dell Precision 7670 | |
Webcam
La webcam de 2 MP est une amélioration par rapport aux webcams de 1 MP de la plupart des systèmes XPS. Cependant, elle n'est pas à la hauteur des caméras de 5 MP qui équipent la plupart des nouveaux ordinateurs portables HP
L'IR et un obturateur sont inclus pour la prise en charge de Windows Hello et la confidentialité, respectivement.


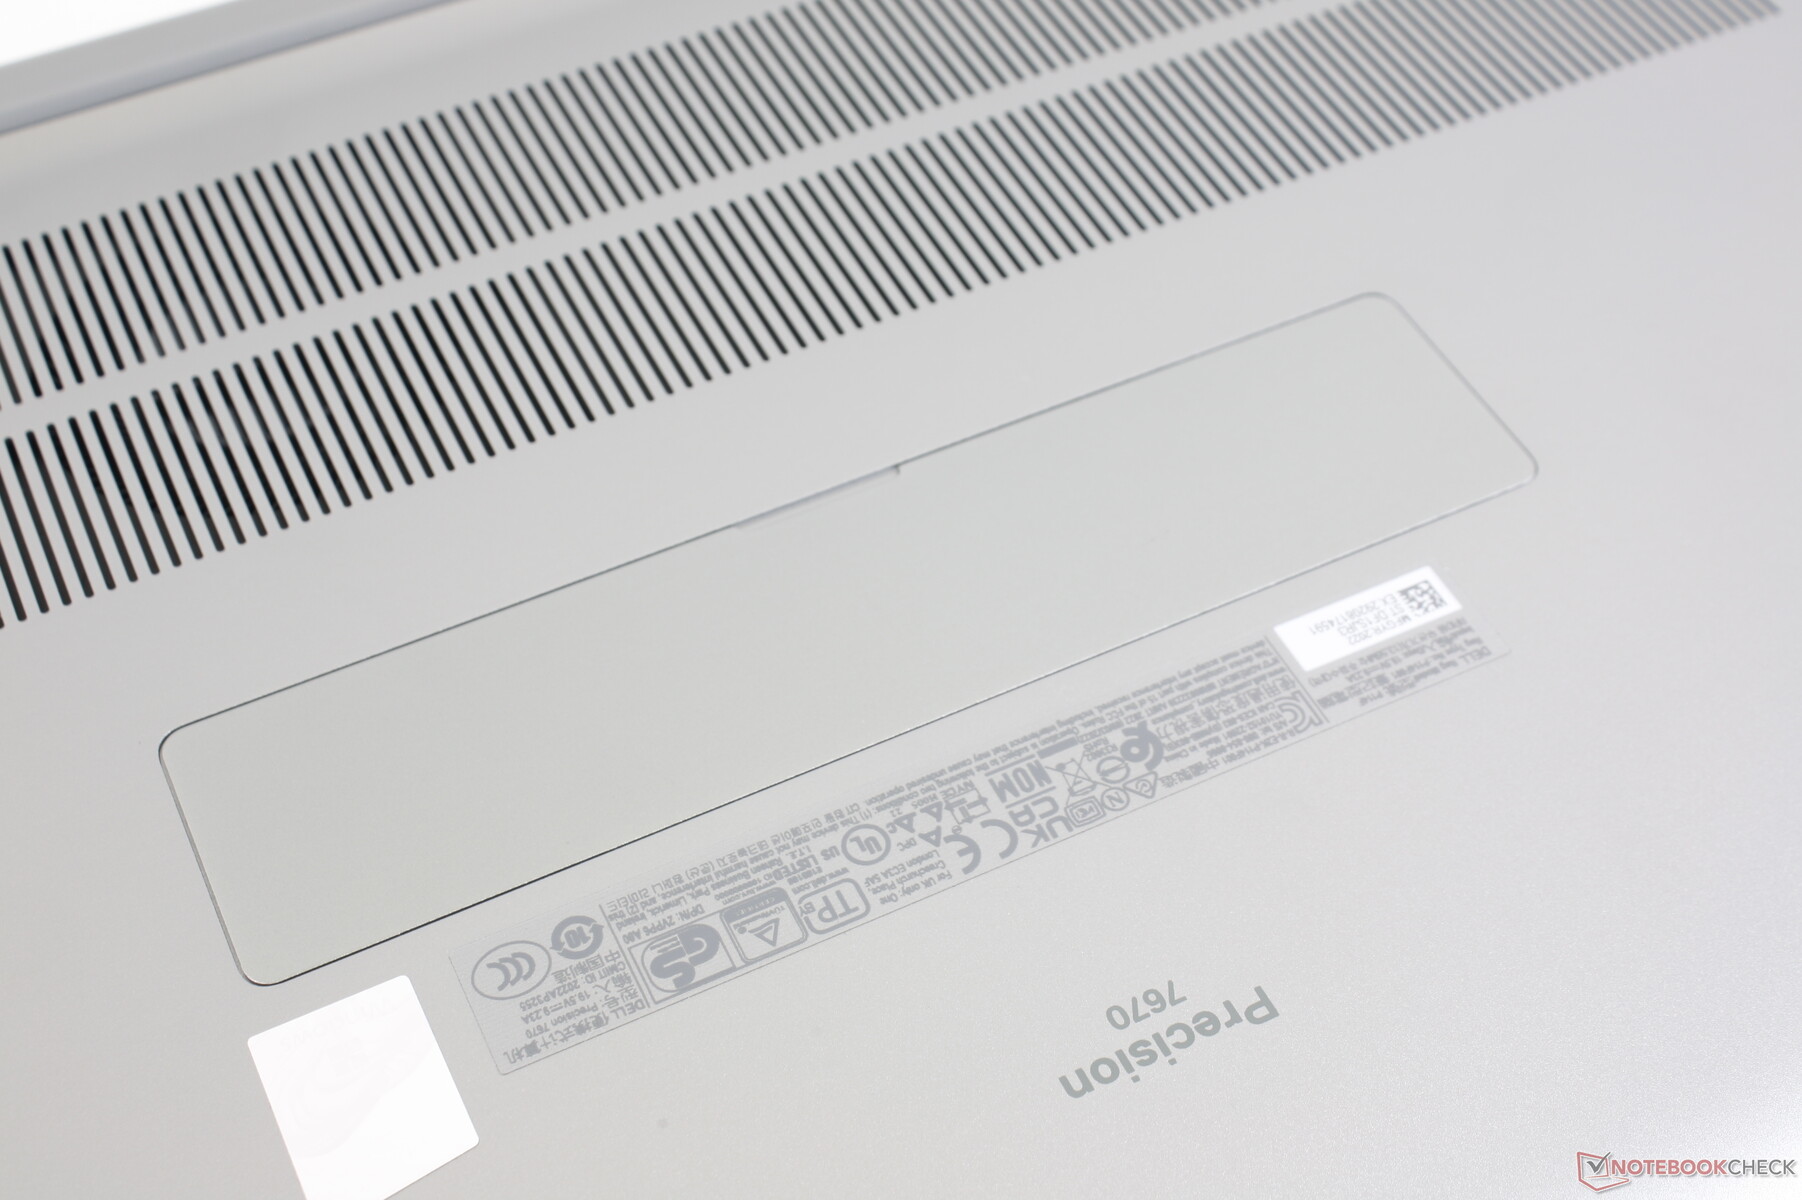
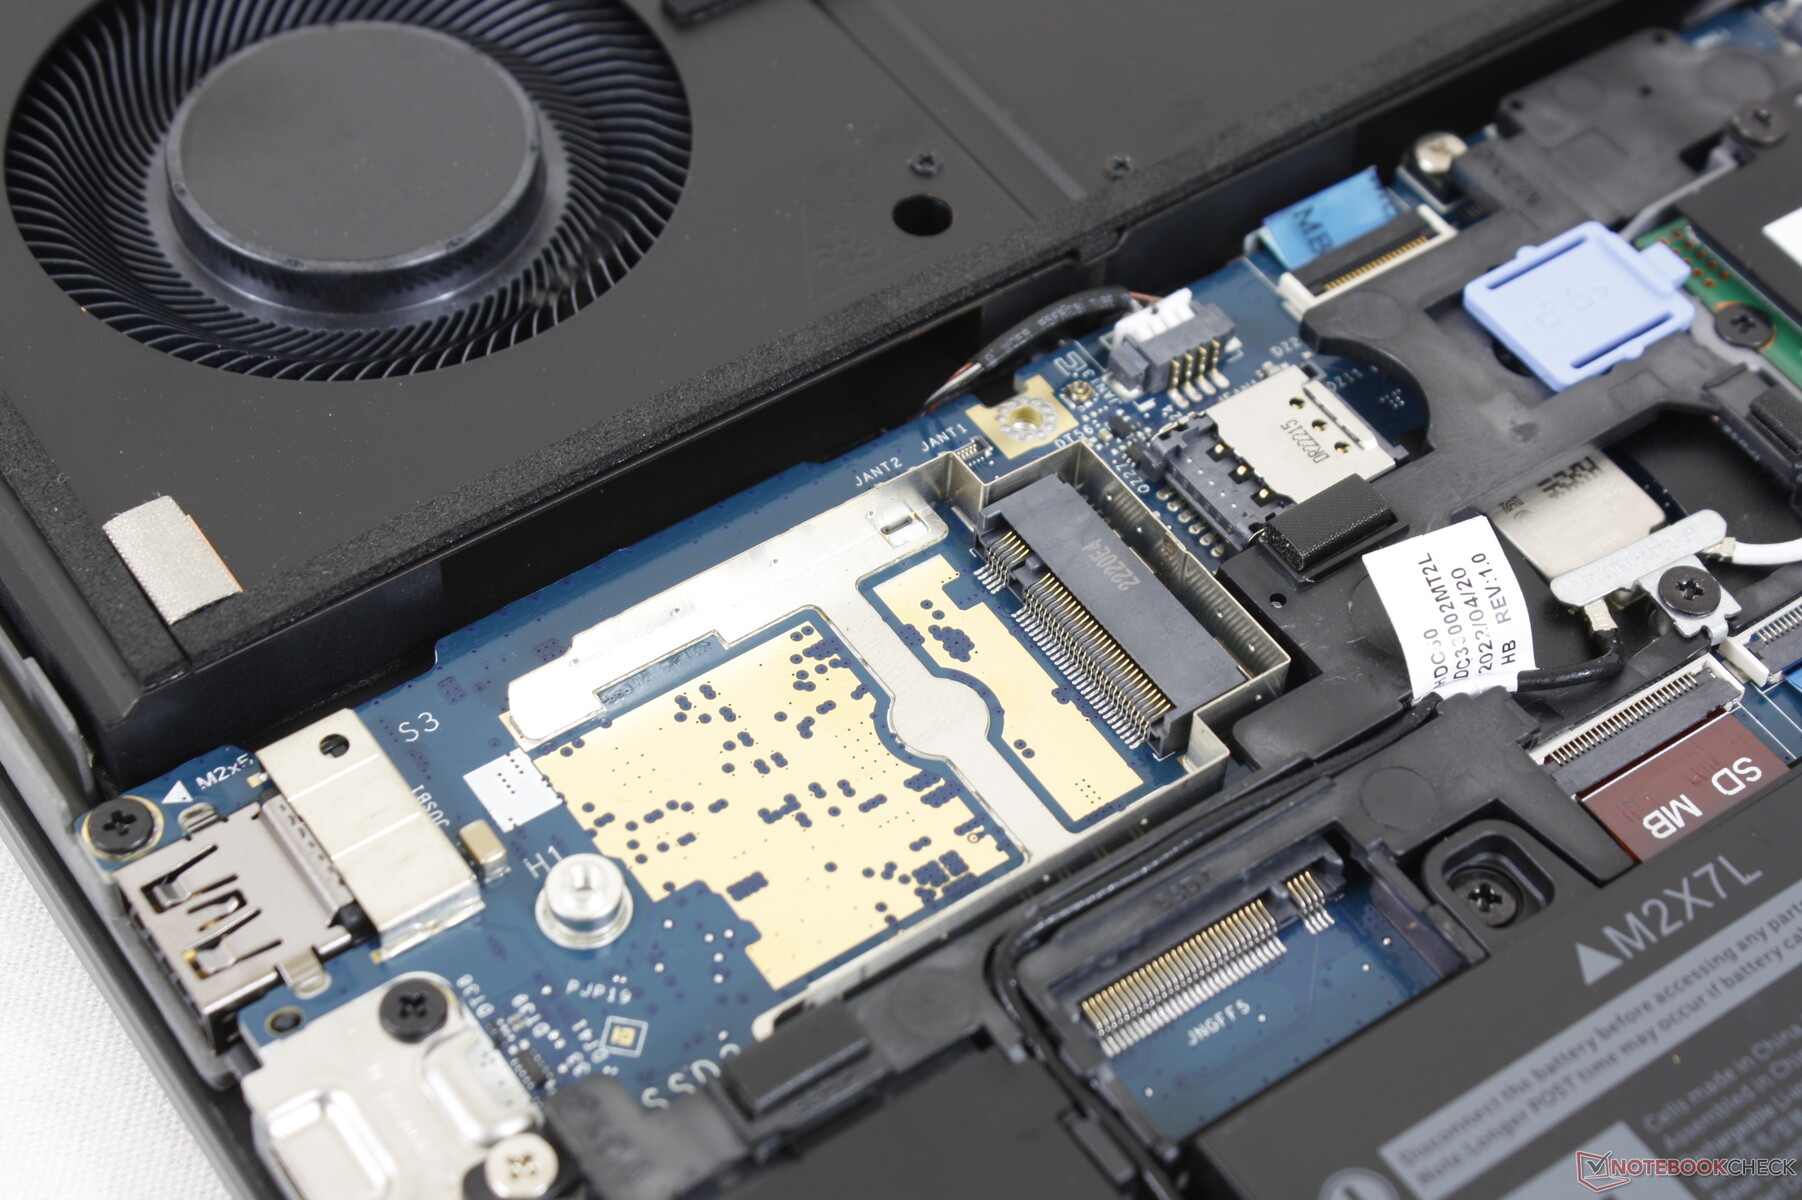
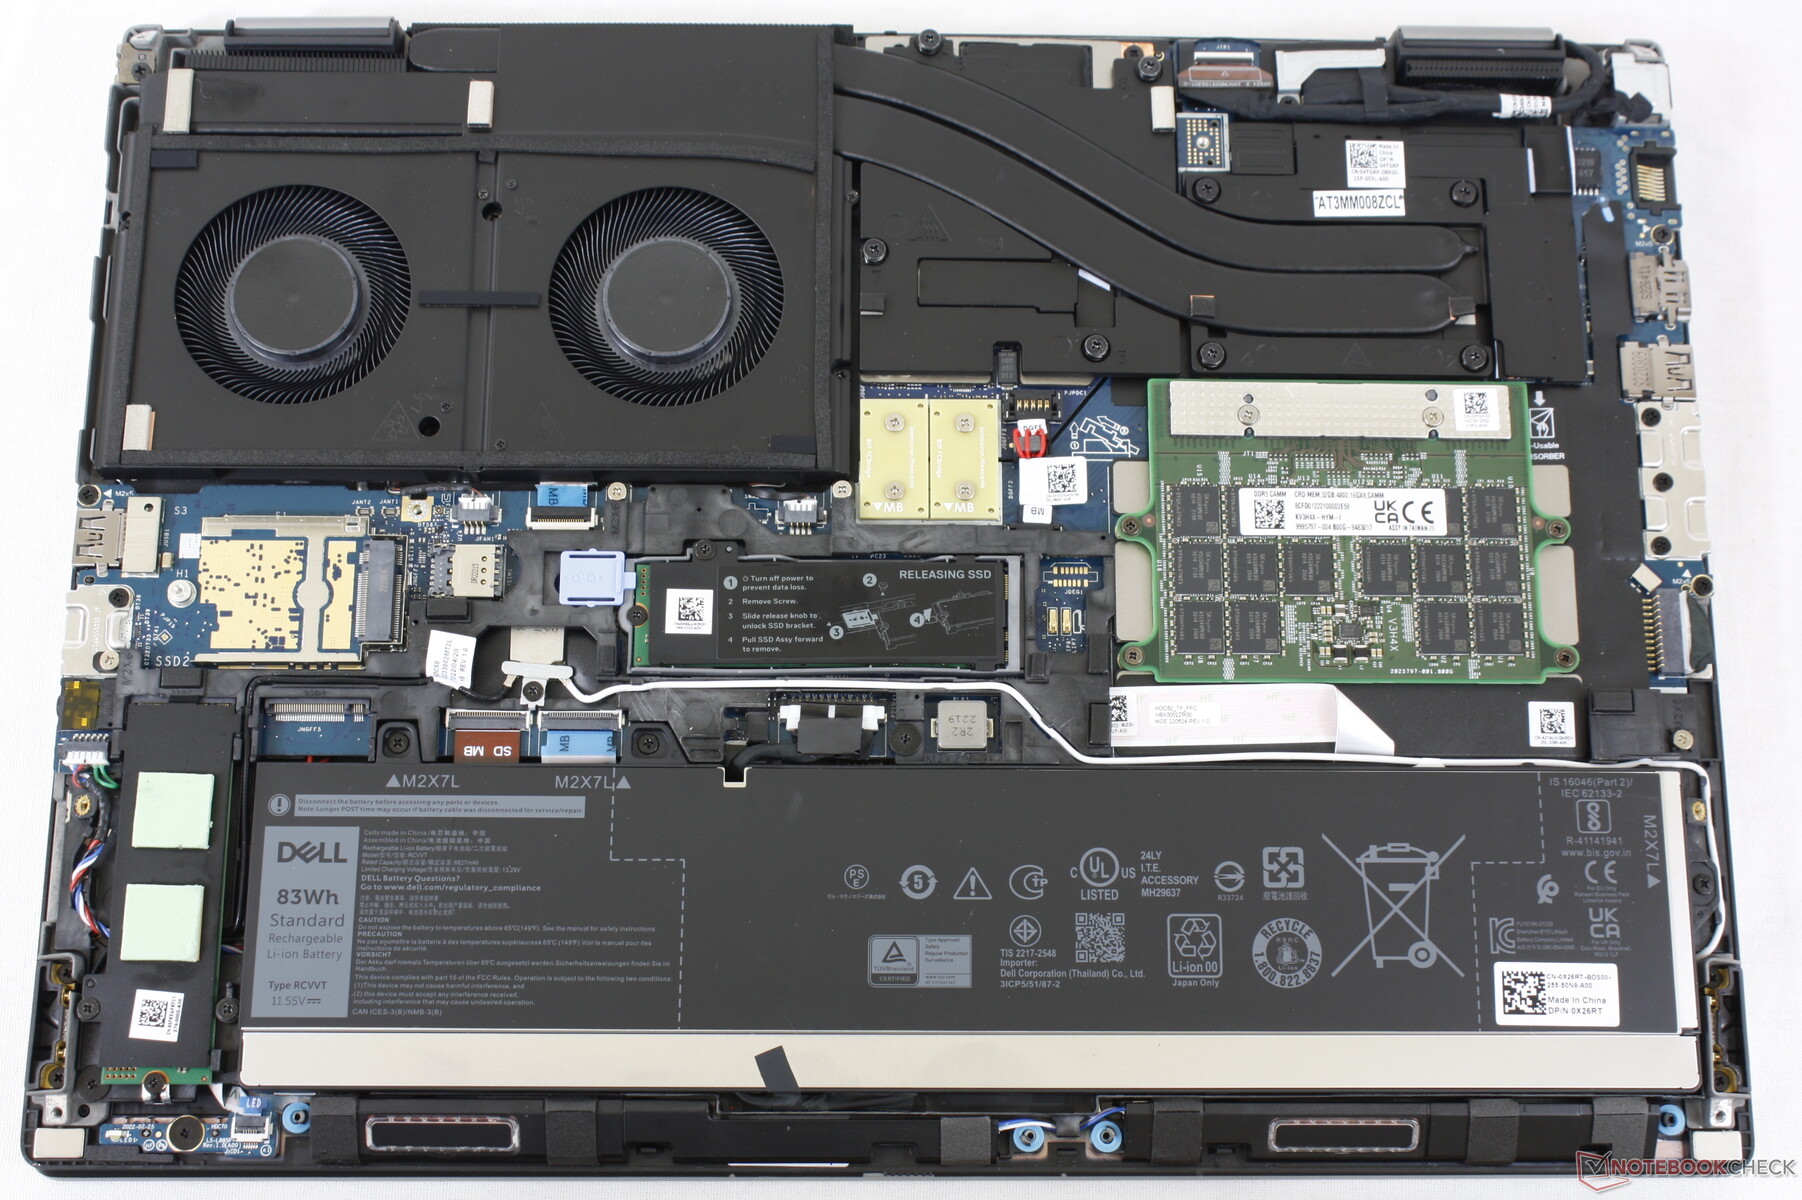
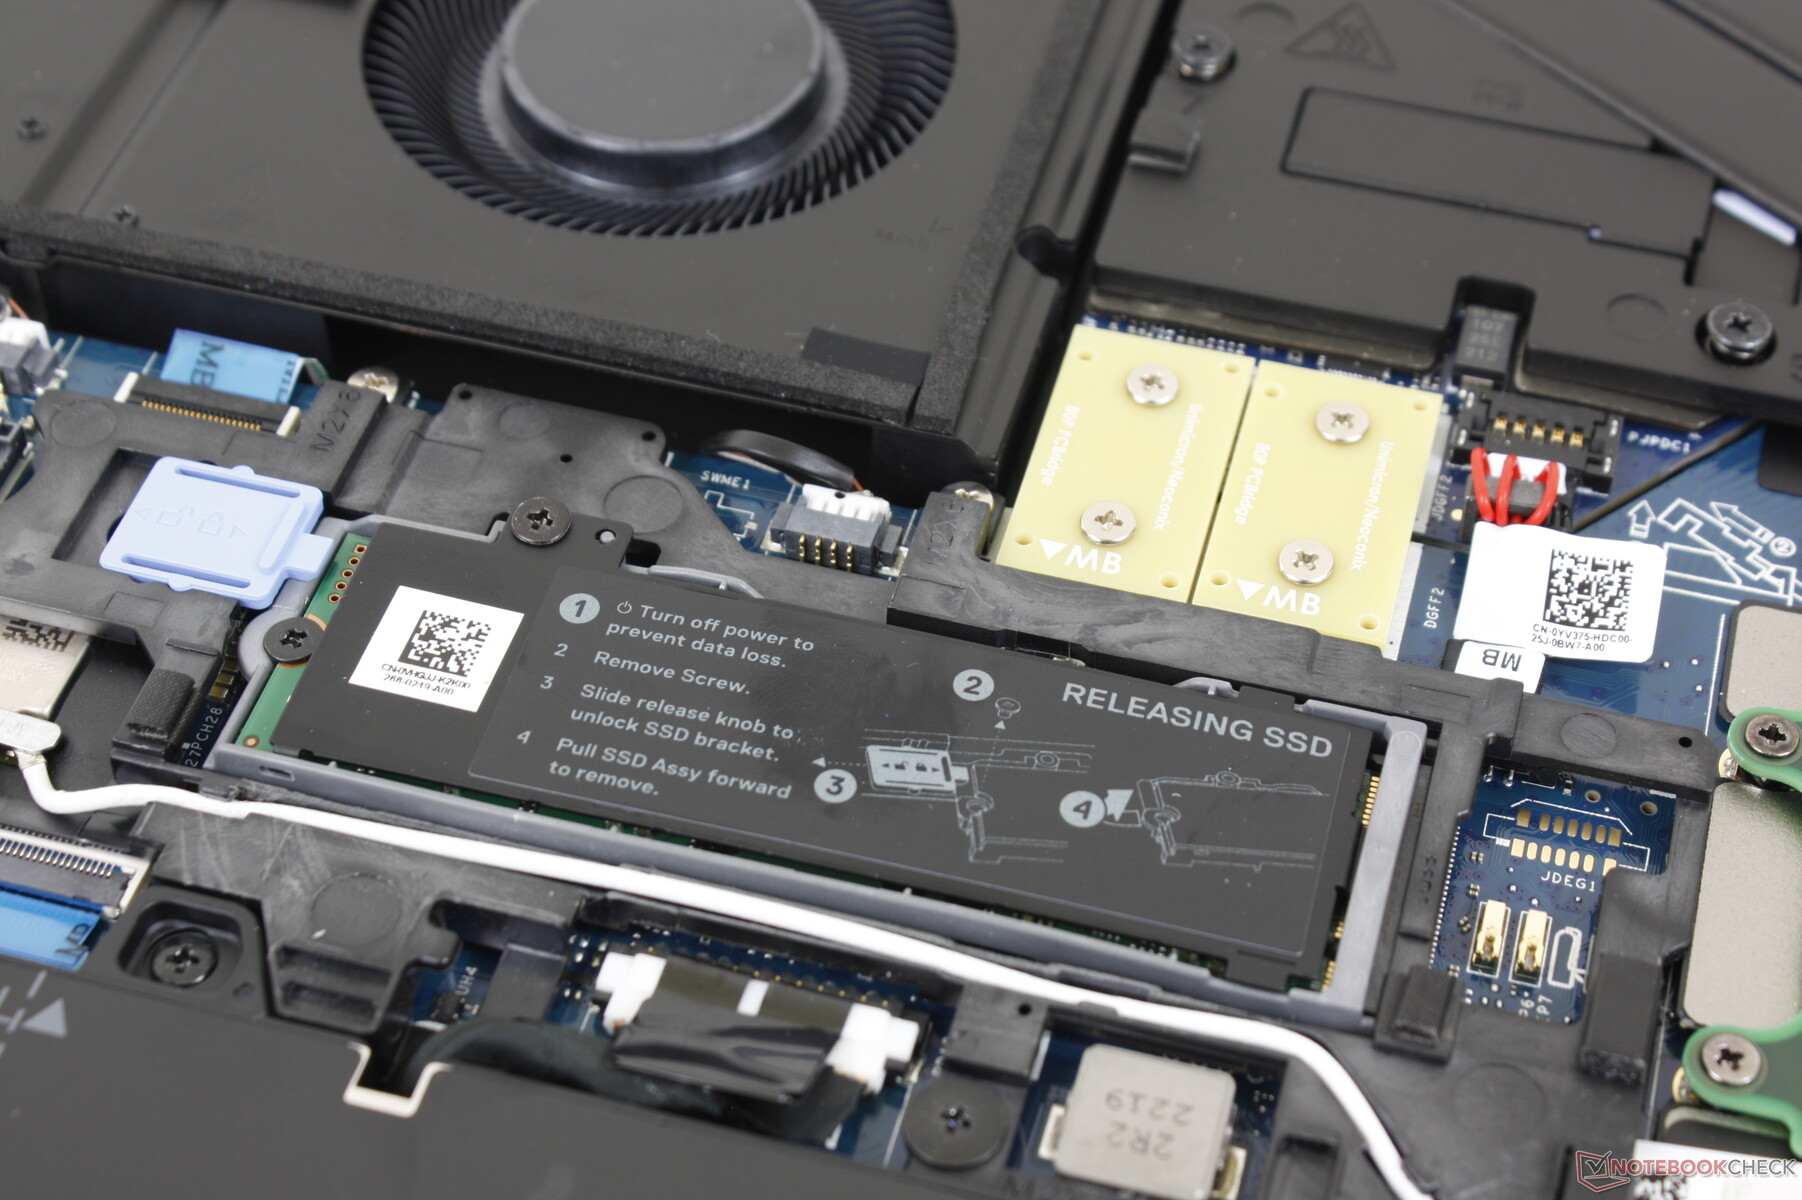
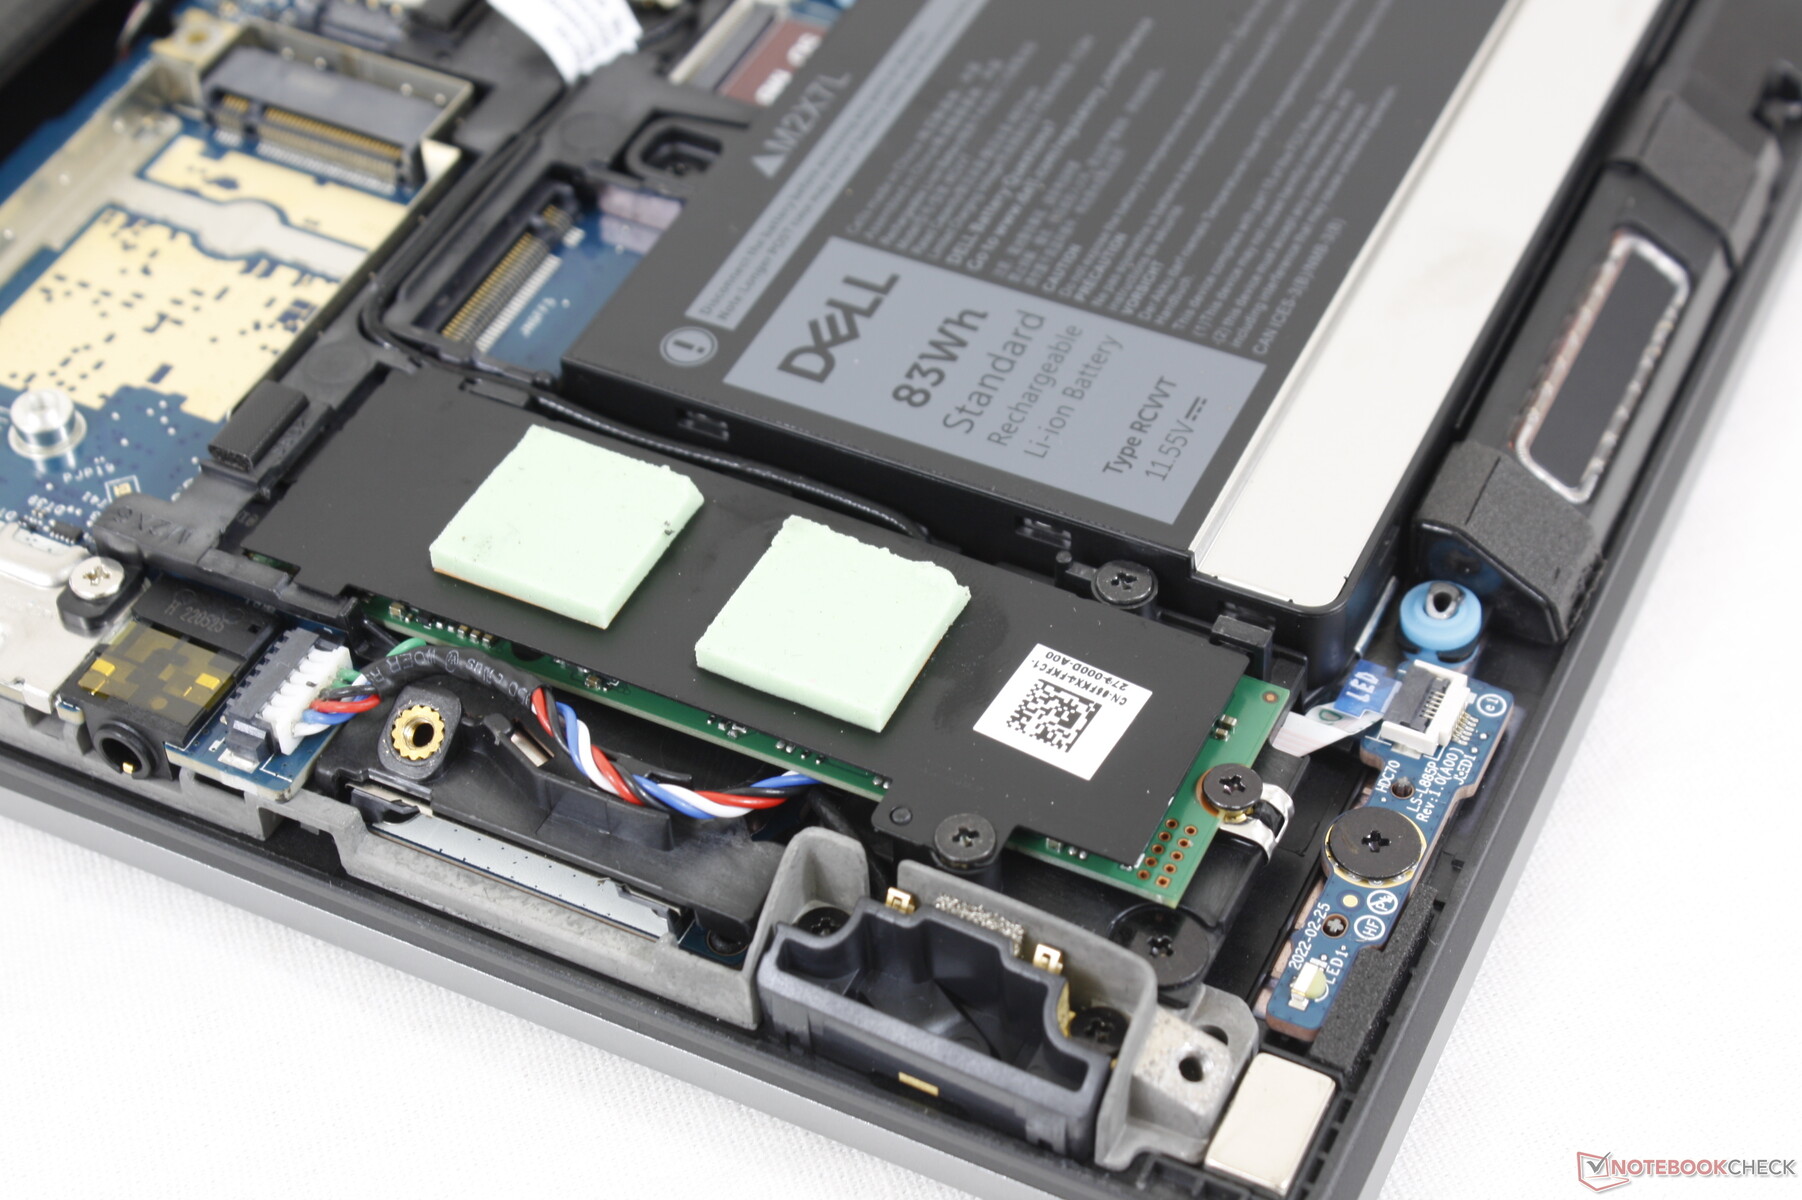
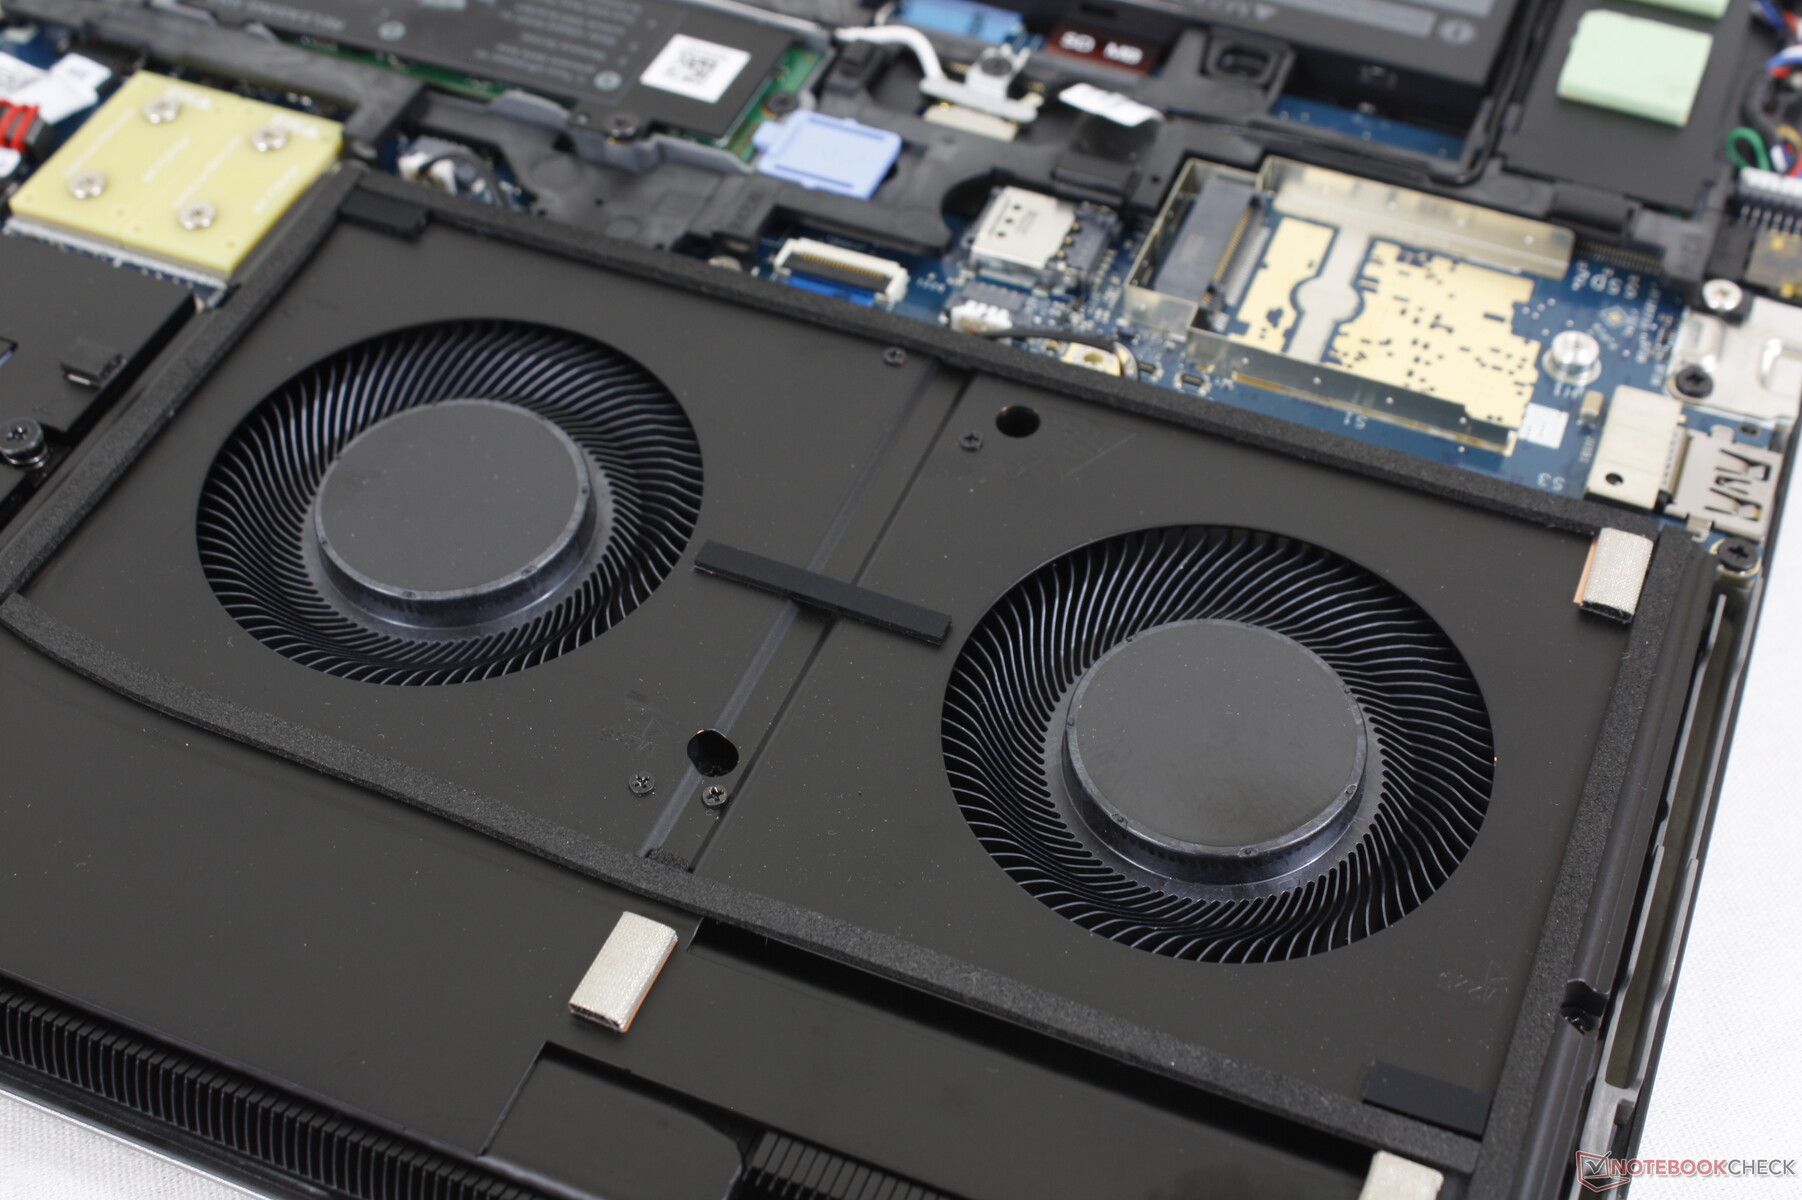
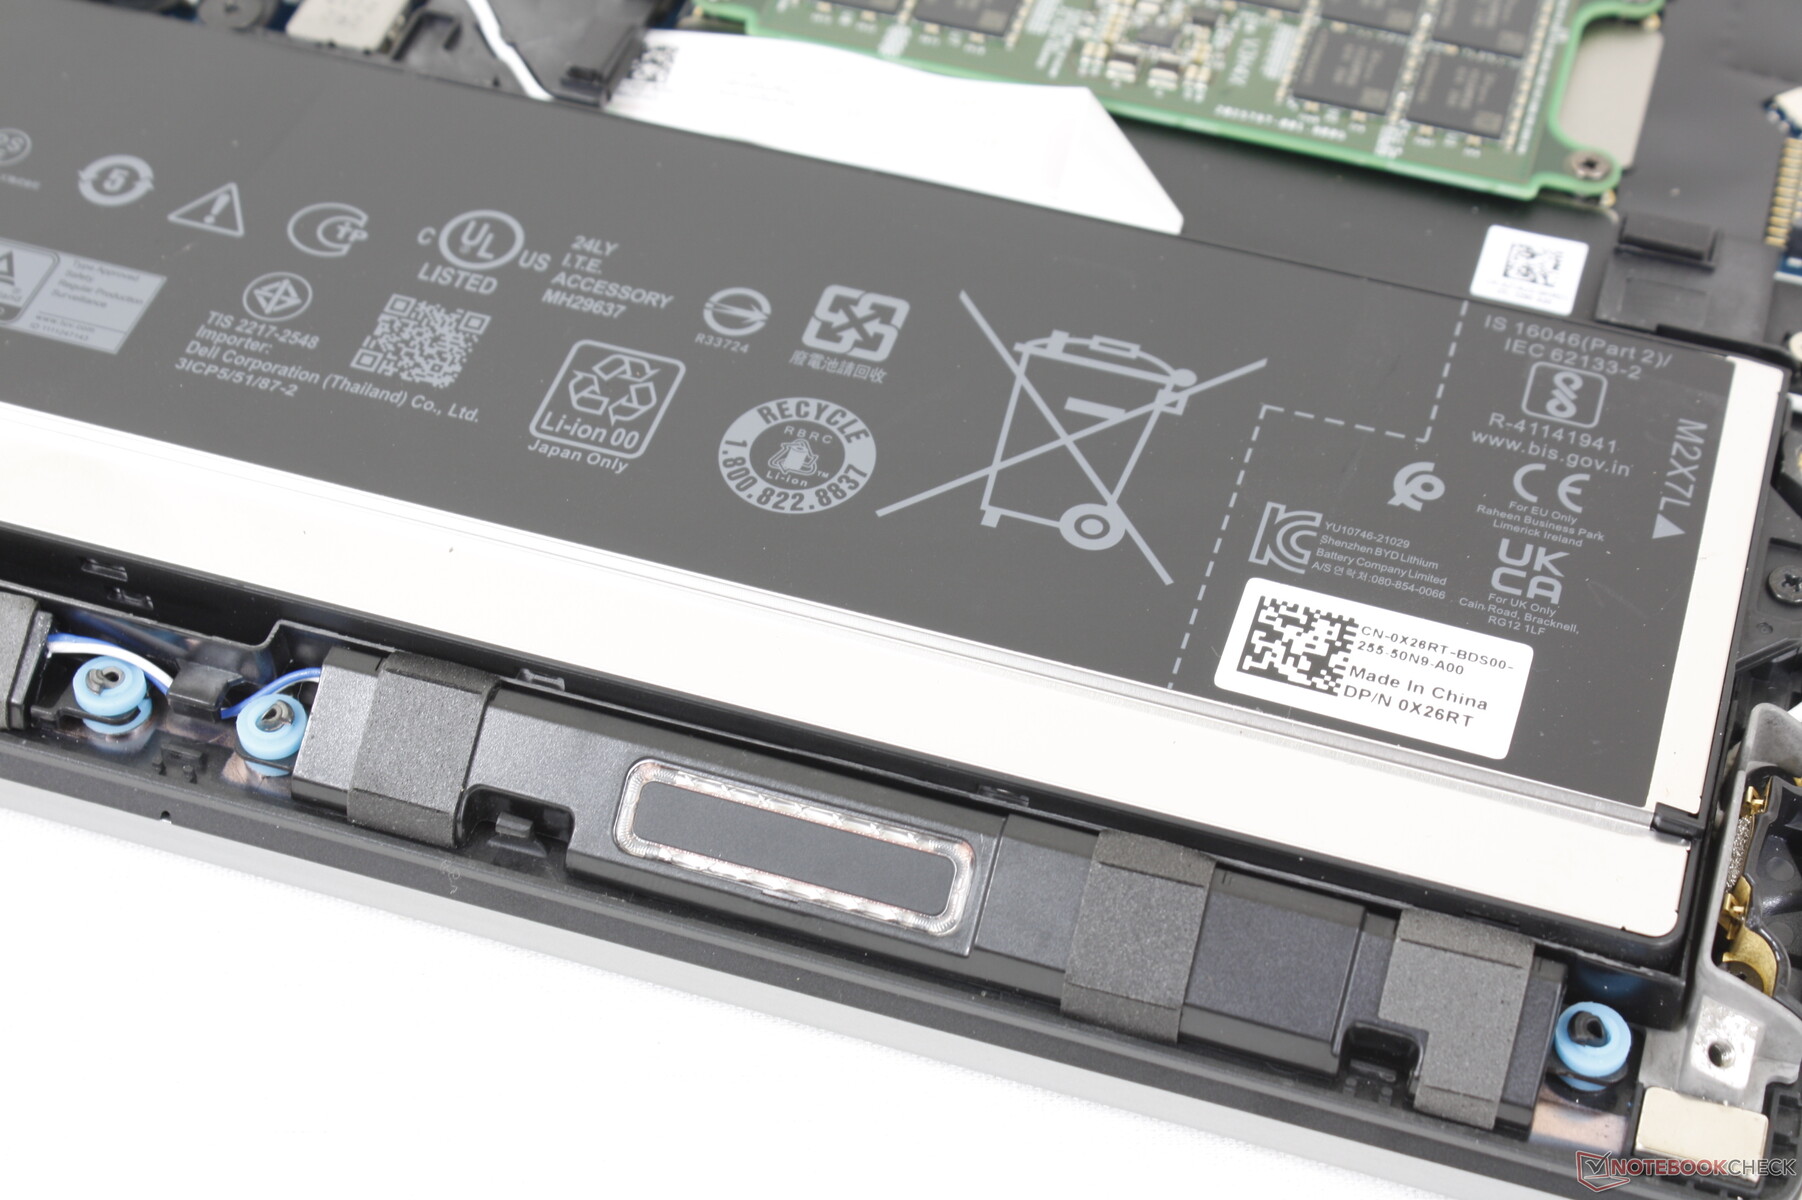
Entretien - Accès facile
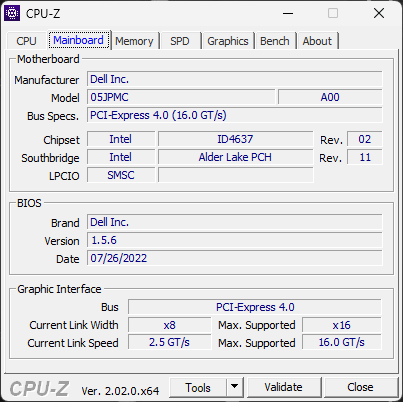
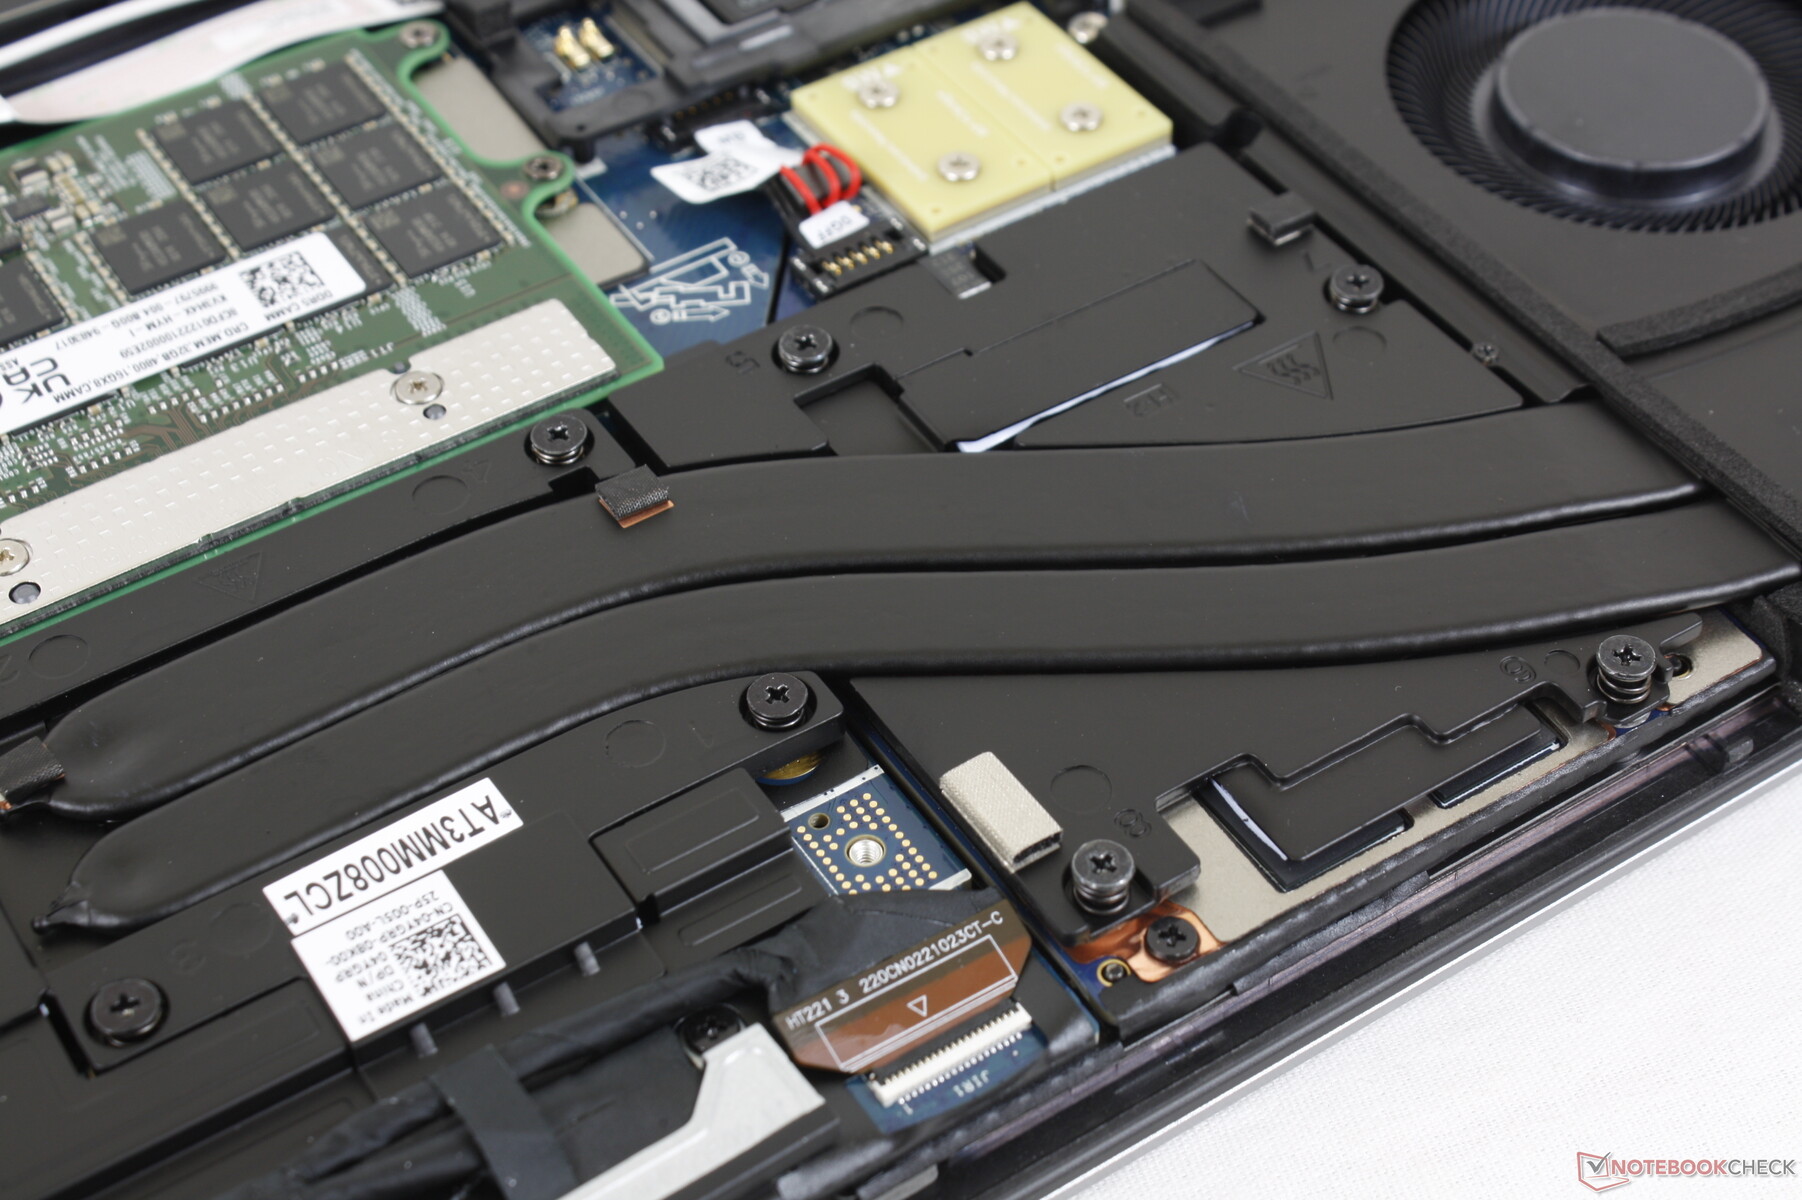
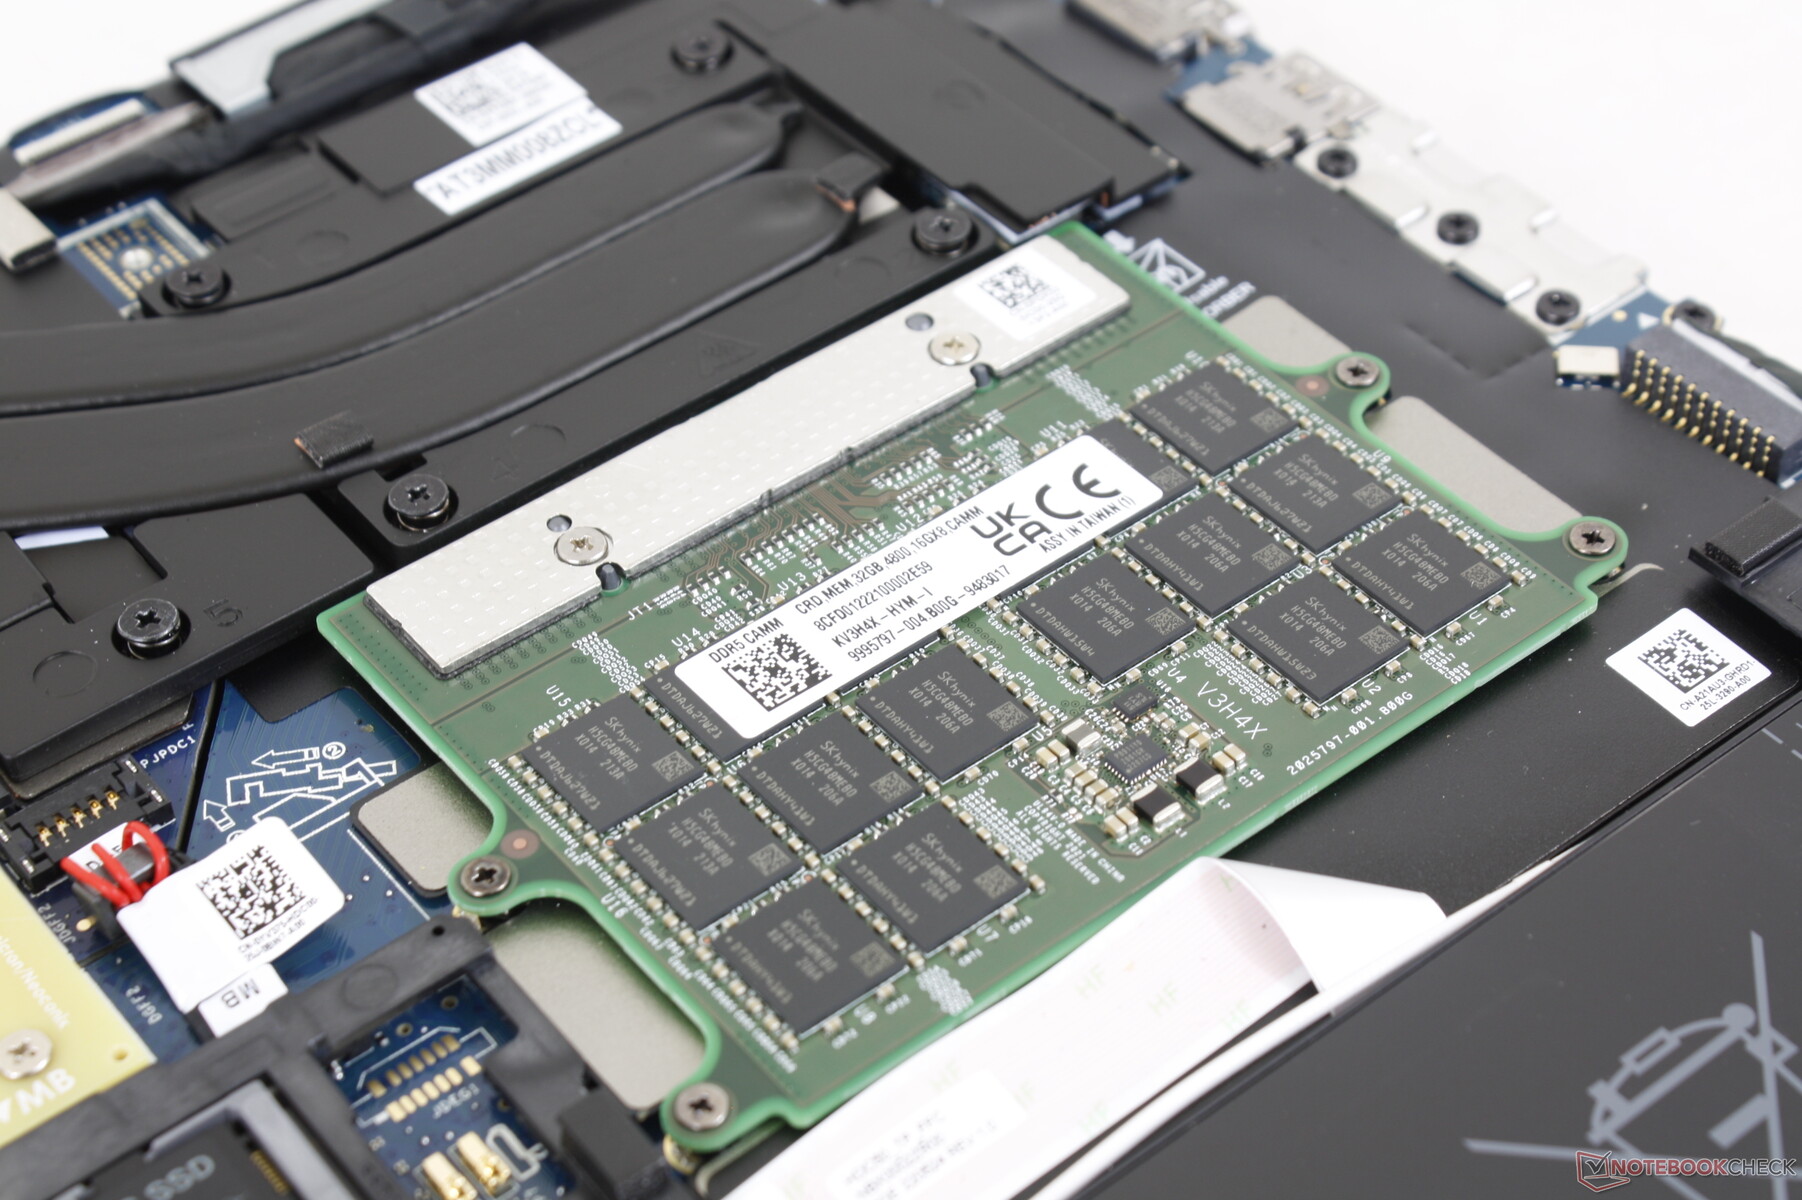
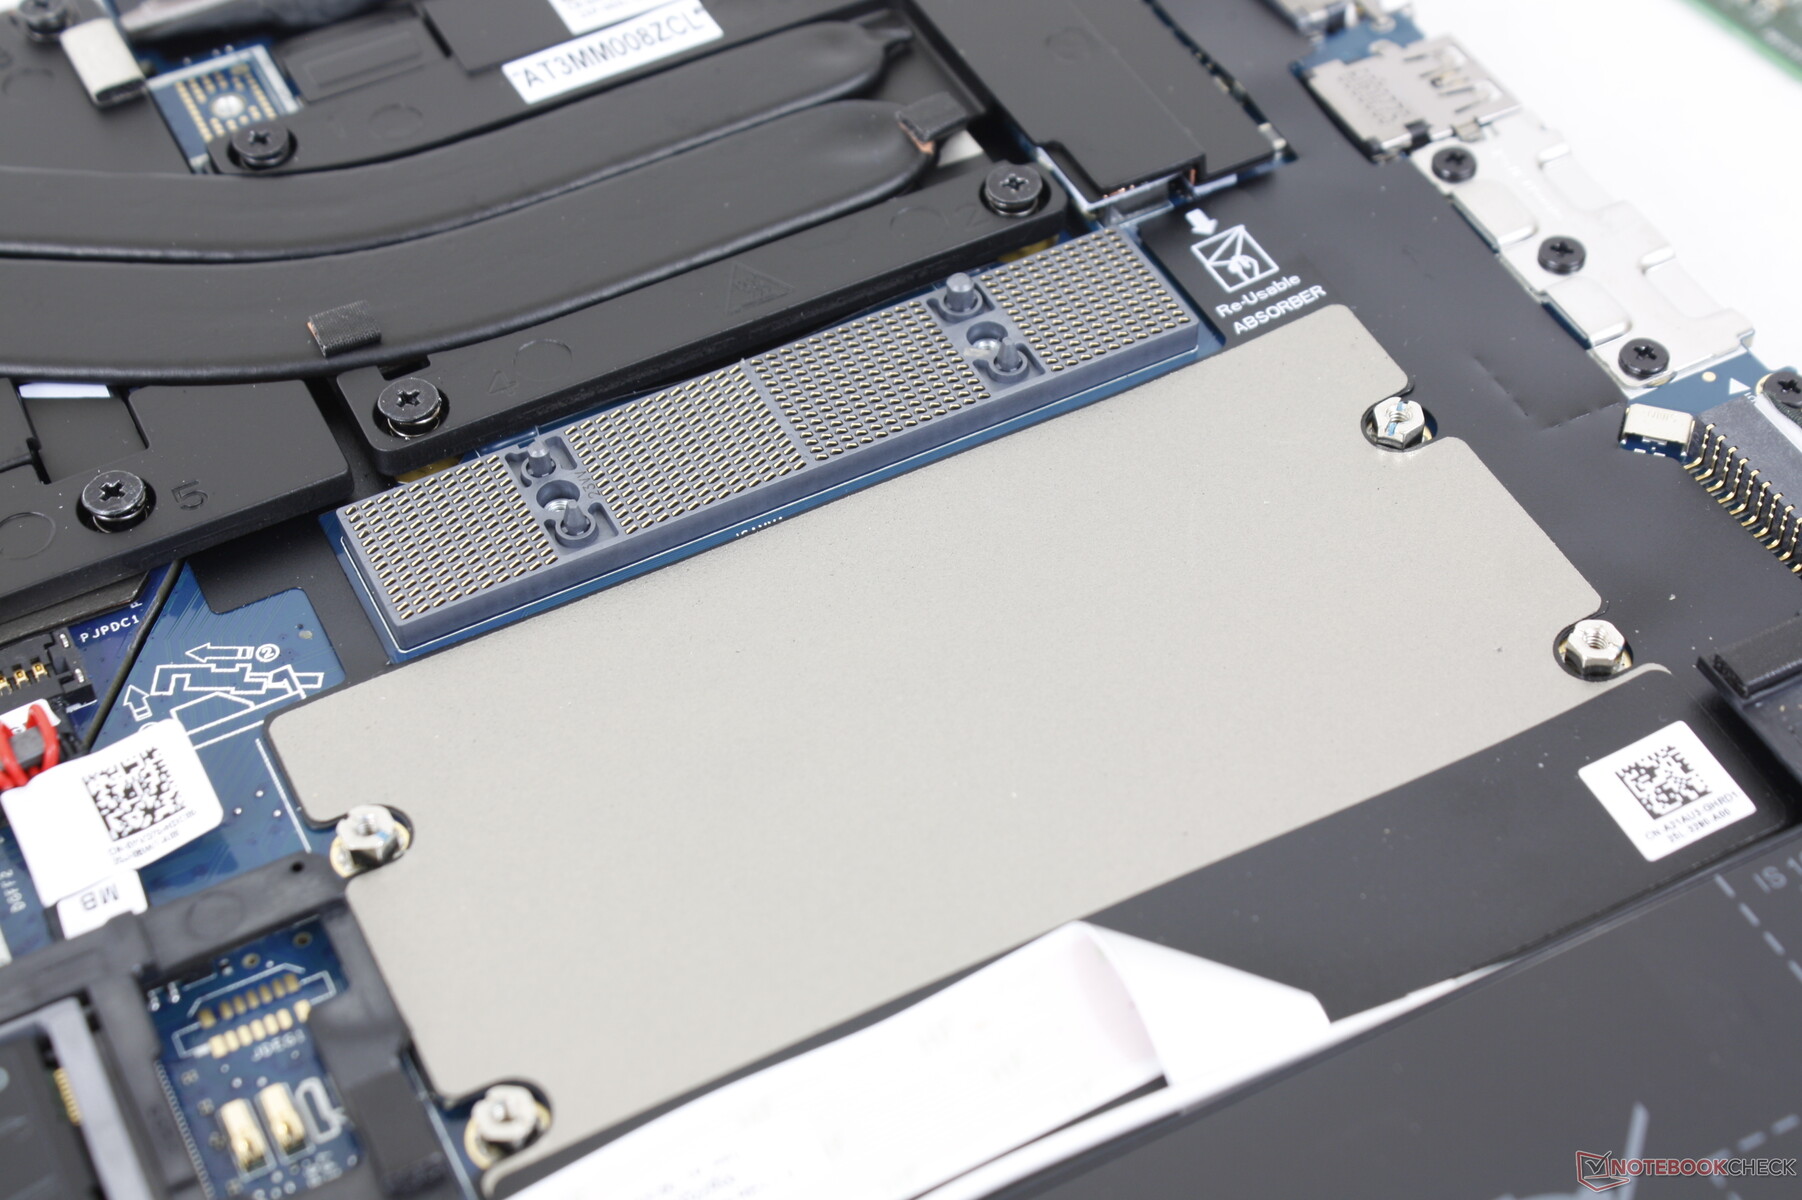
Le panneau inférieur est fixé par 6 vis Philips pour faciliter l'entretien. Les utilisateurs ont accès à deux emplacements M.2 PCIe4 x4 2280, un emplacement WAN, un emplacement Nano-SIM et des emplacements SODIMM ou CAMM selon la configuration. Le module WLAN n'est pas amovible.
Certaines configurations peuvent accueillir jusqu'à trois SSD M.2, comme l'illustre le troisième emplacement M.2 près du bord de la batterie.
Vous trouverez plus d'informations sur la RAM CAMM sur notre page d'aperçu ici.
Accessoires et garantie
La boîte ne contient pas d'autres éléments que l'adaptateur secteur et les documents. Une garantie limitée du fabricant de trois ans est fournie en standard si elle est achetée directement auprès de Dell.
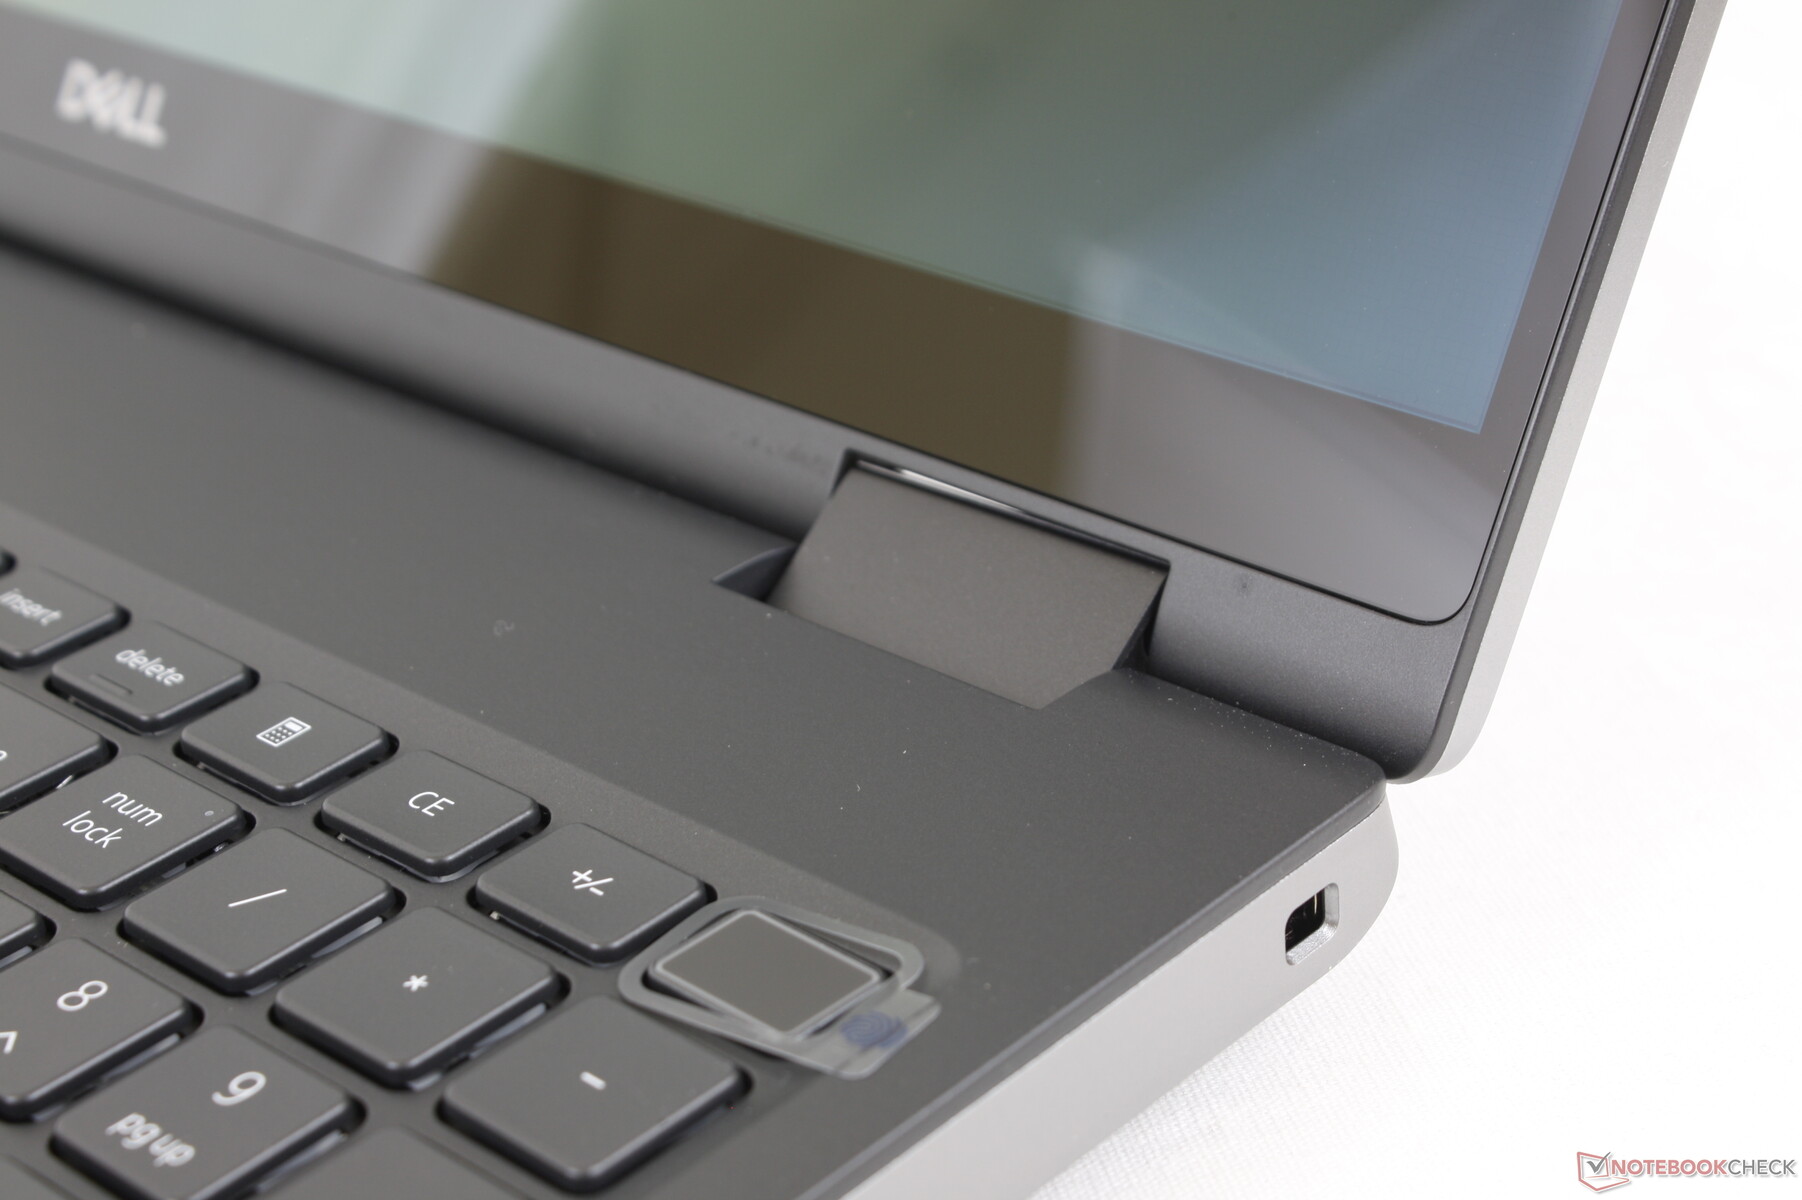
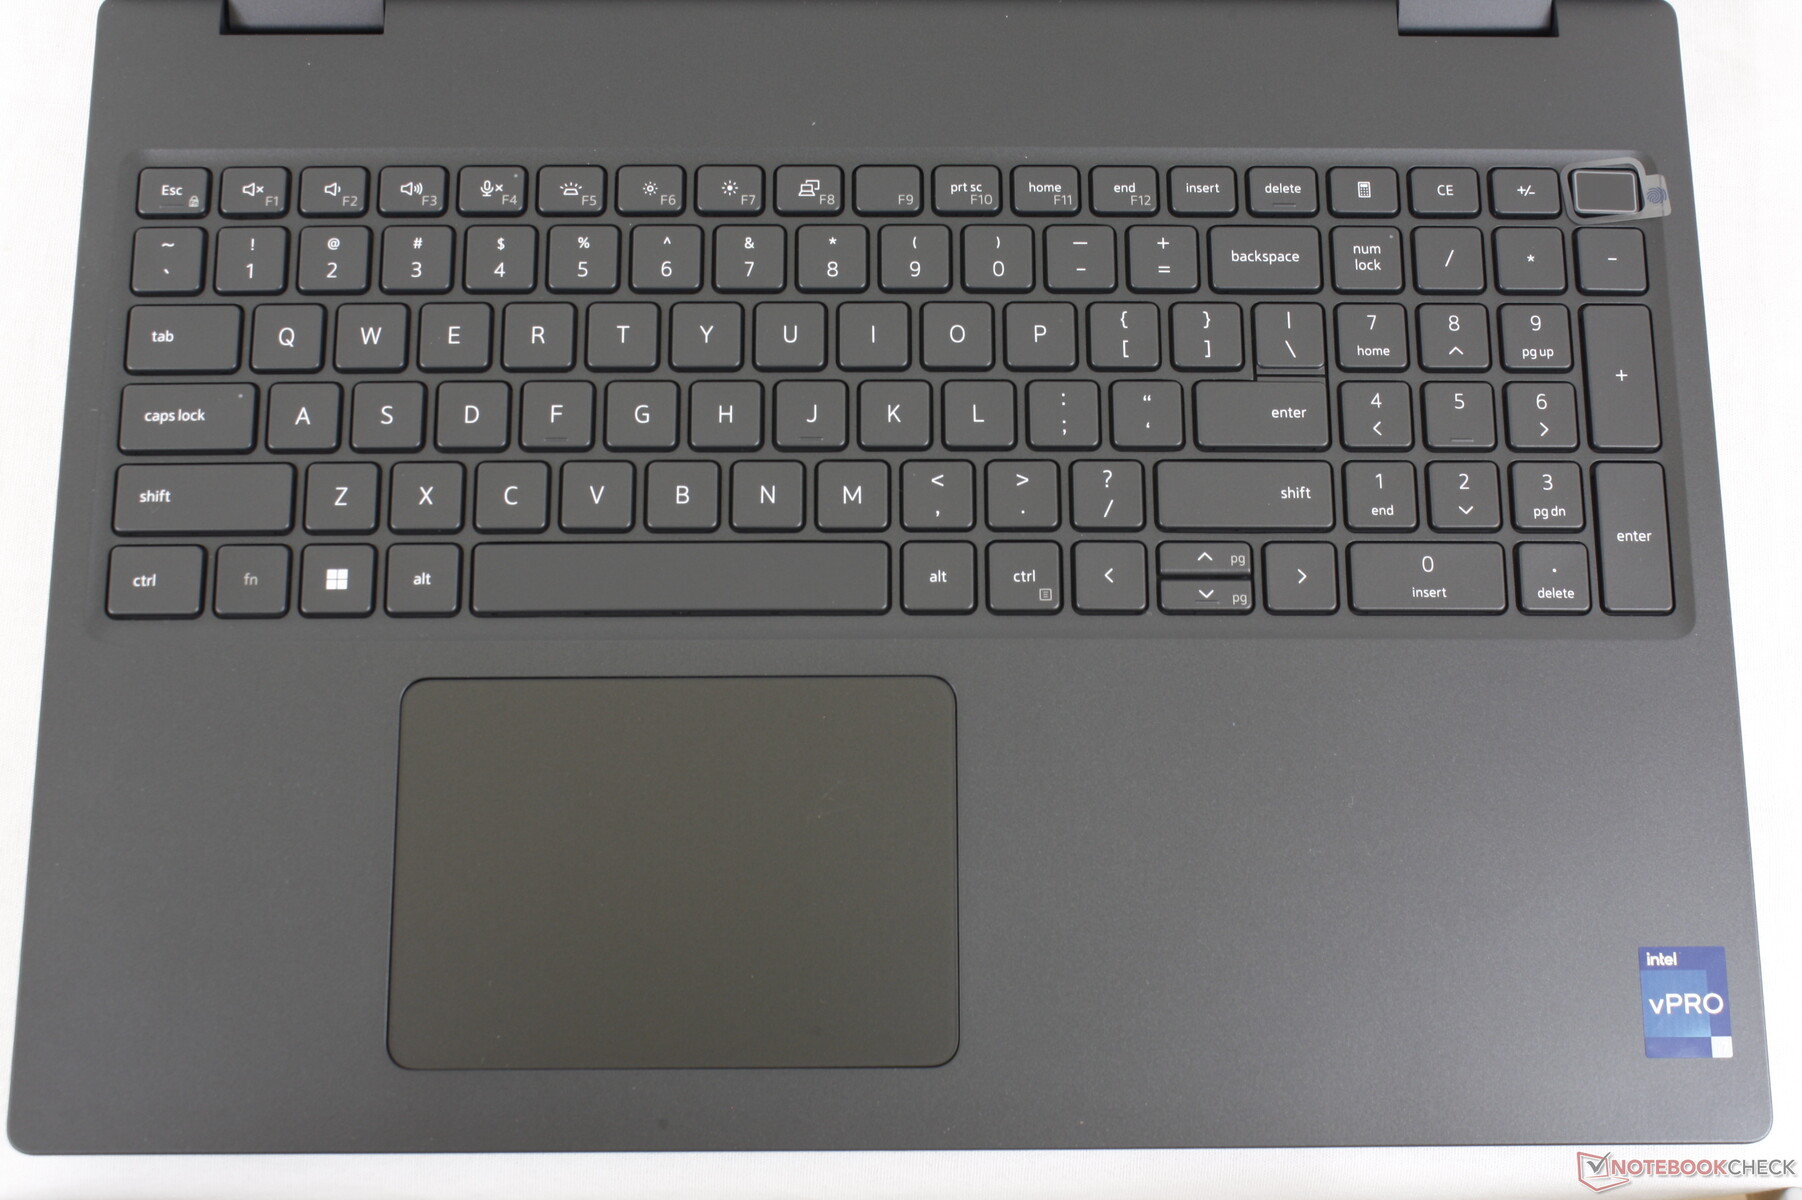
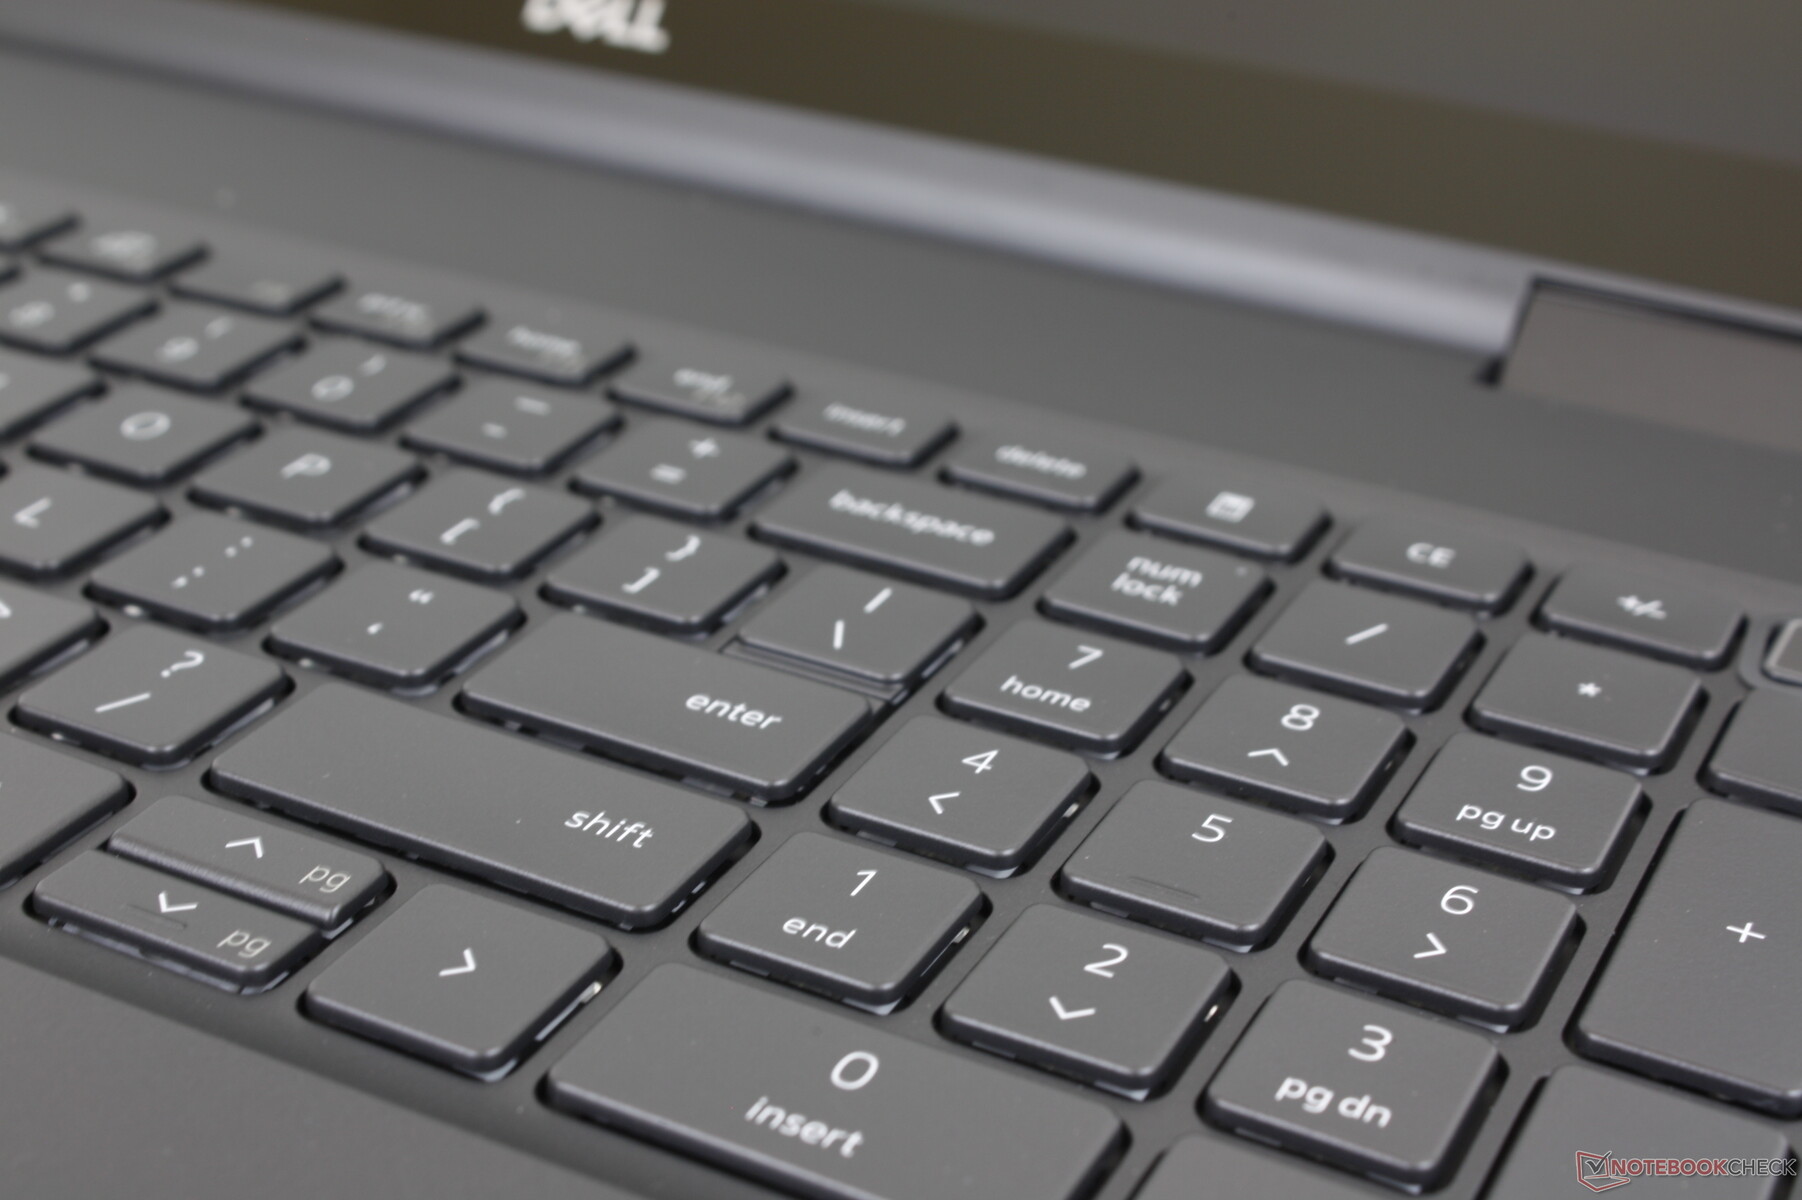
Dispositifs d'entrée - Un grand pavé numérique avec un clavier confortable
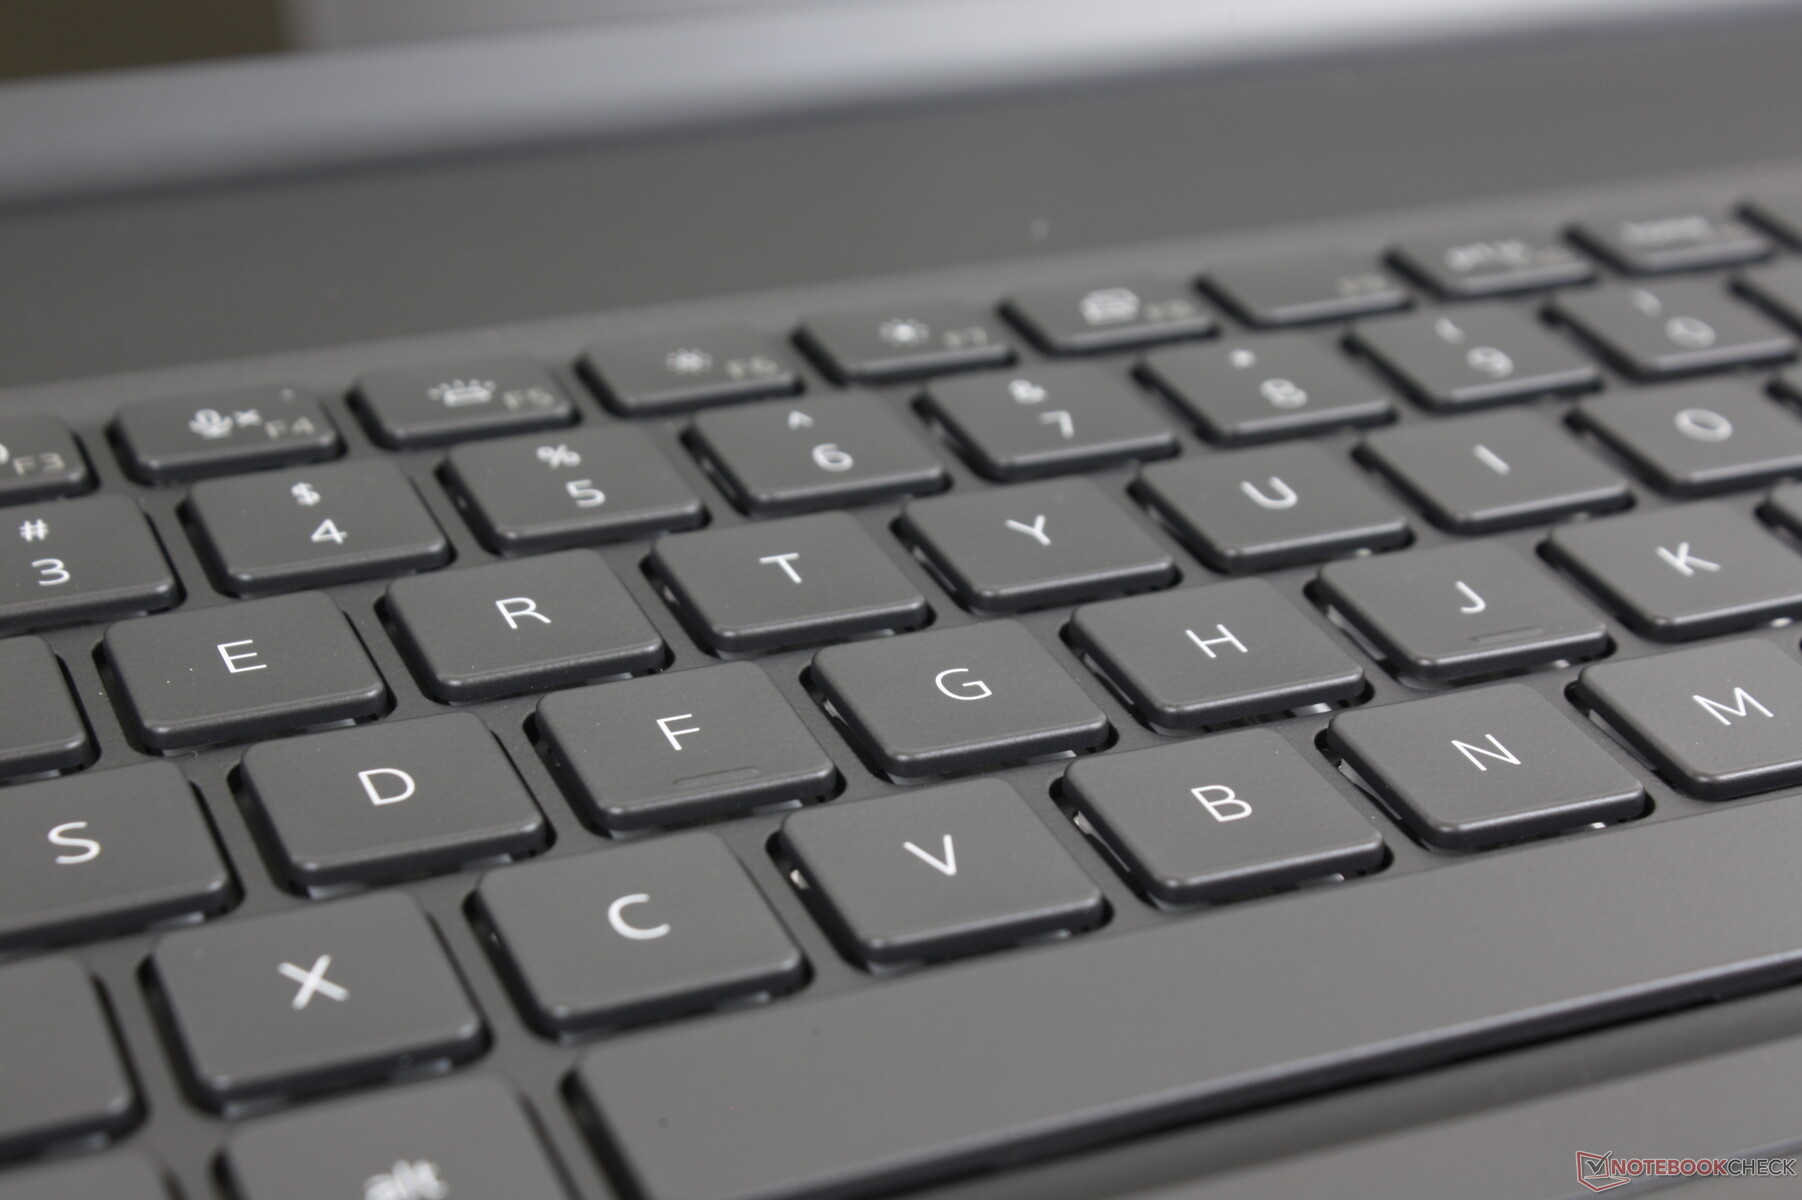
Clavier
La disposition des touches et les commentaires n'ont pas changé par rapport au Precision 7550. Nous trouvons que les touches sont légèrement plus bruyantes que celles de la série XPS mais avec un retour plus fort et une course plus profonde. Cependant, les touches fléchées sont toujours aussi étroites, contrairement aux touches fléchées plus larges du ThinkPad P1 G4 ou de l'Asus ProArt StudioBook.
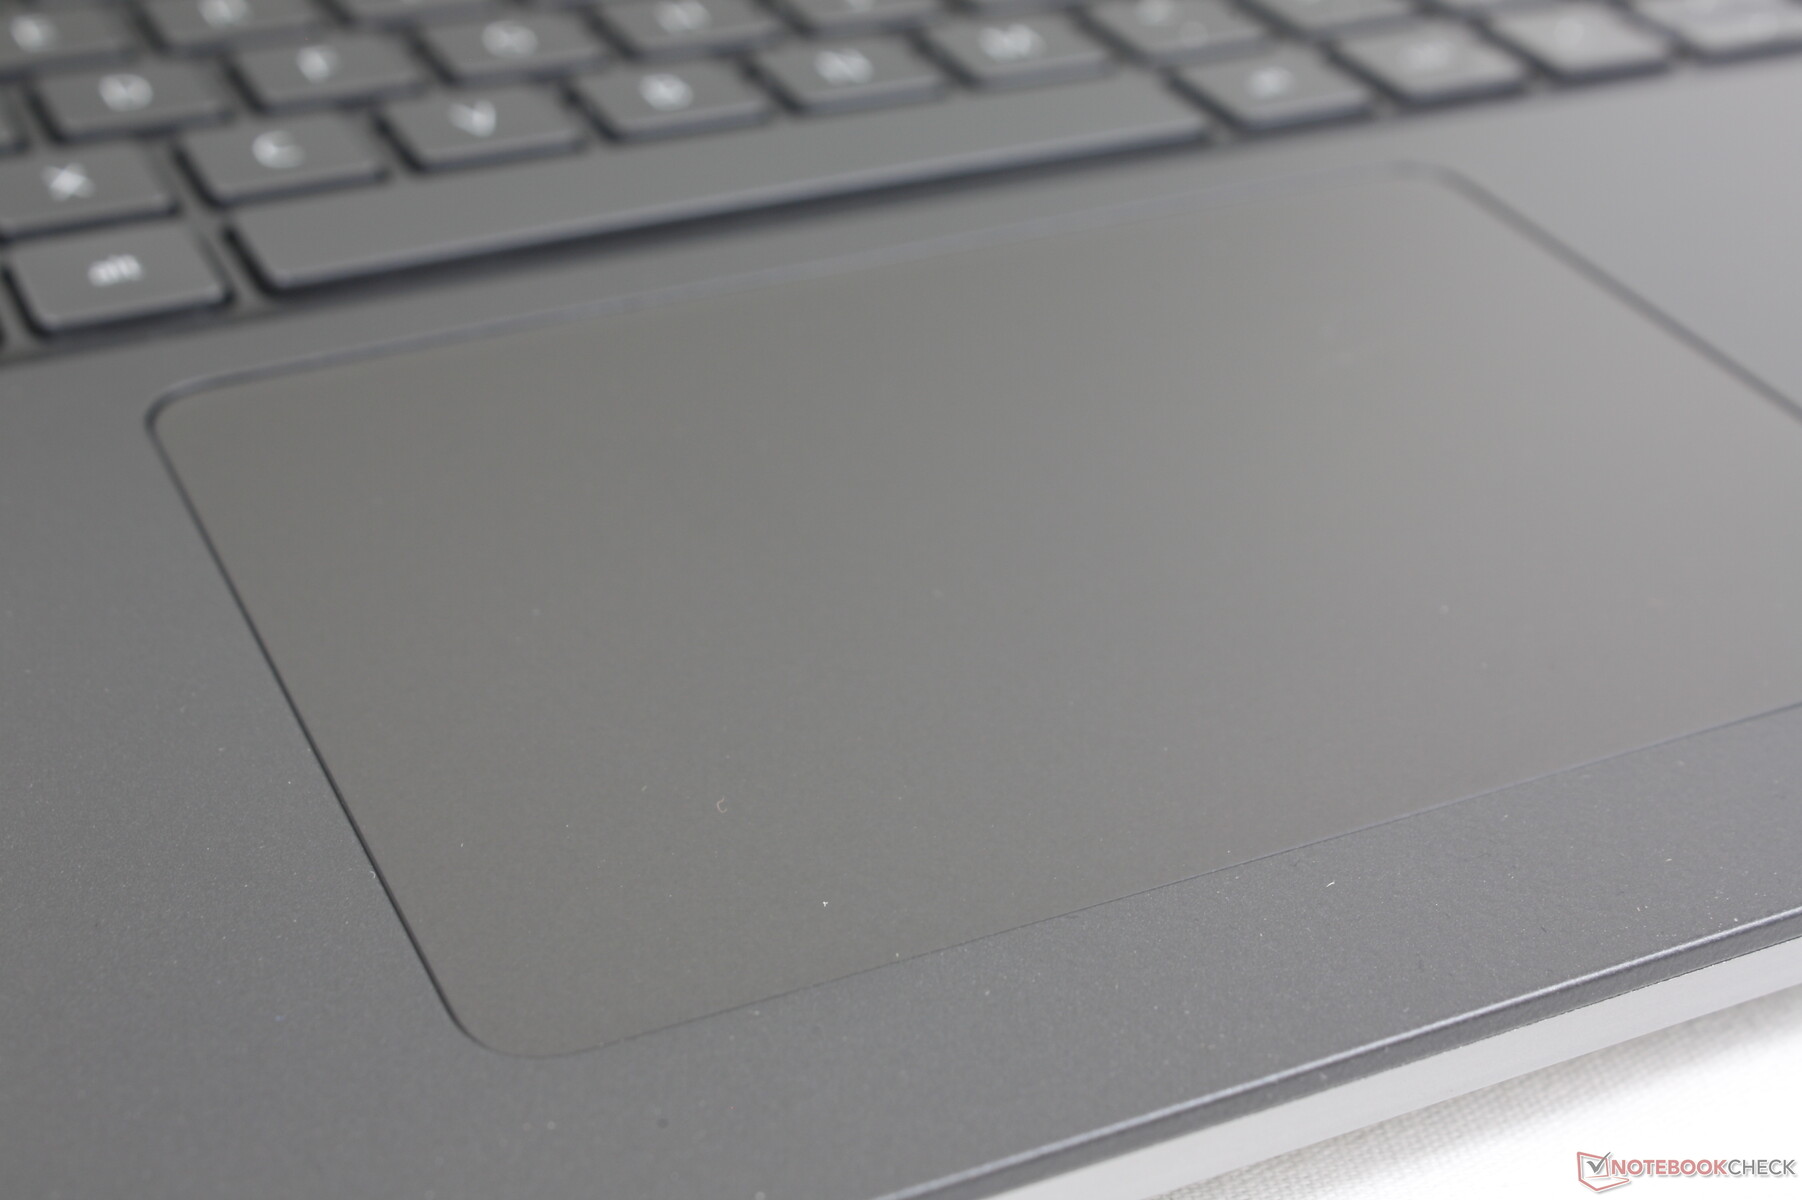
Pavé tactile
Le pavé tactile est plus grand que celui du Precision 7550 (11,5 x 8 cm contre 10 x 6,5 cm). Il n'y a plus de boutons de souris dédiés, cependant, et l'expérience utilisateur est donc plus proche d'un Ultrabook traditionnel que d'un ThinkPad ou d'un ZBook centré sur l'entreprise où les boutons de souris sont toujours proéminents. Nous préférons personnellement les boutons dédiés car les actions de glisser-déposer sont plus faciles, mais l'absence de boutons a permis d'augmenter la surface du pavé tactile, ce que d'autres apprécieront.
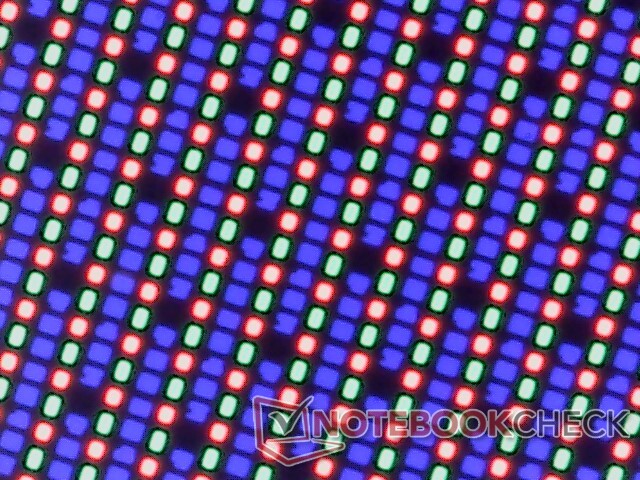
Affichage - Pas d'options 120 Hz
Dell propose trois options d'affichage au moment de la rédaction de cet article
- 1200p, 60 Hz, 60 pour cent sRGB, 250 nits, non tactile
- 1200p, 60 Hz, 99 pour cent DCI-P3, 500 nits, non tactile, IPS
- 2400p, 60 Hz, 100 pour cent DCI-P3, 400 nits, tactile, OLED
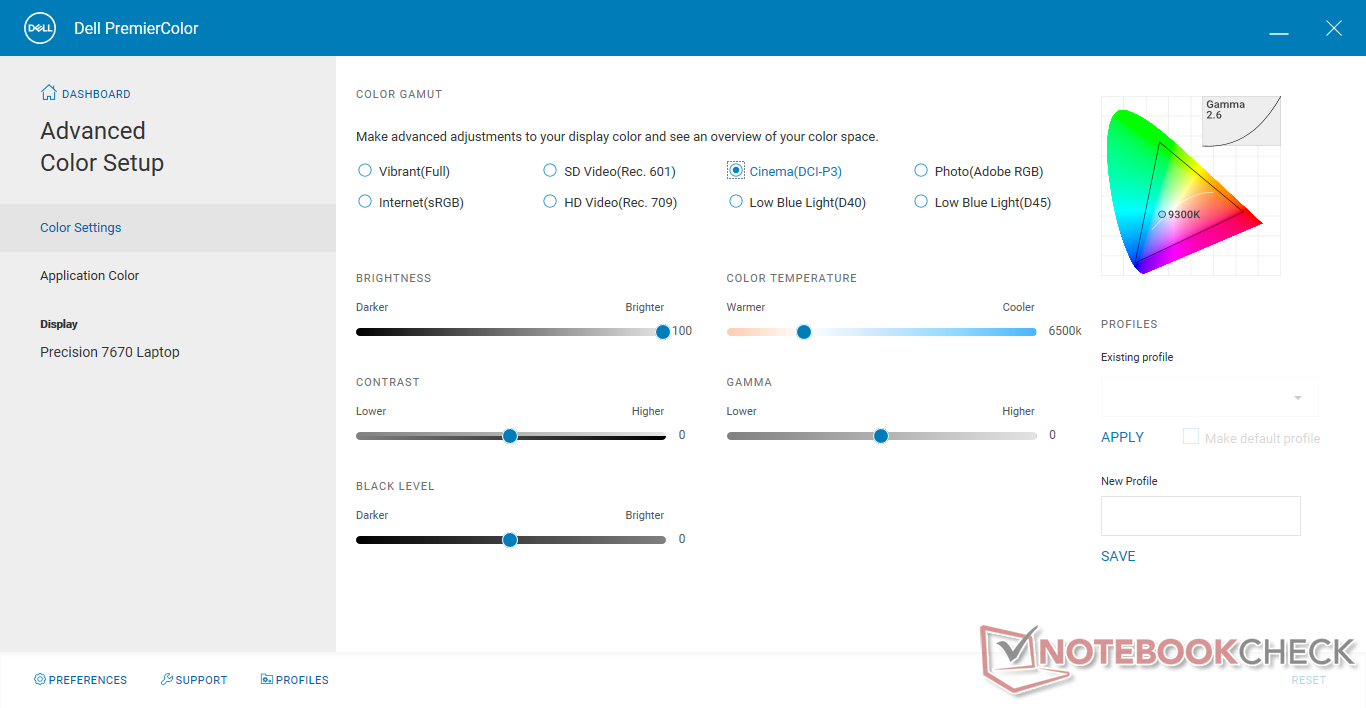
Nos mesures indépendantes ci-dessous reflètent uniquement l'option en gras ci-dessus. Si la précision des couleurs est importante pour vos charges de travail, nous vous recommandons vivement d'éviter l'option de base de 250 nits, car sa reproduction des couleurs est aussi mauvaise que celle de nombreux ordinateurs portables grand public bon marché. Les propriétaires doivent se familiariser avec le logiciel Dell PremierColor pour ajuster le profil de couleur de l'écran
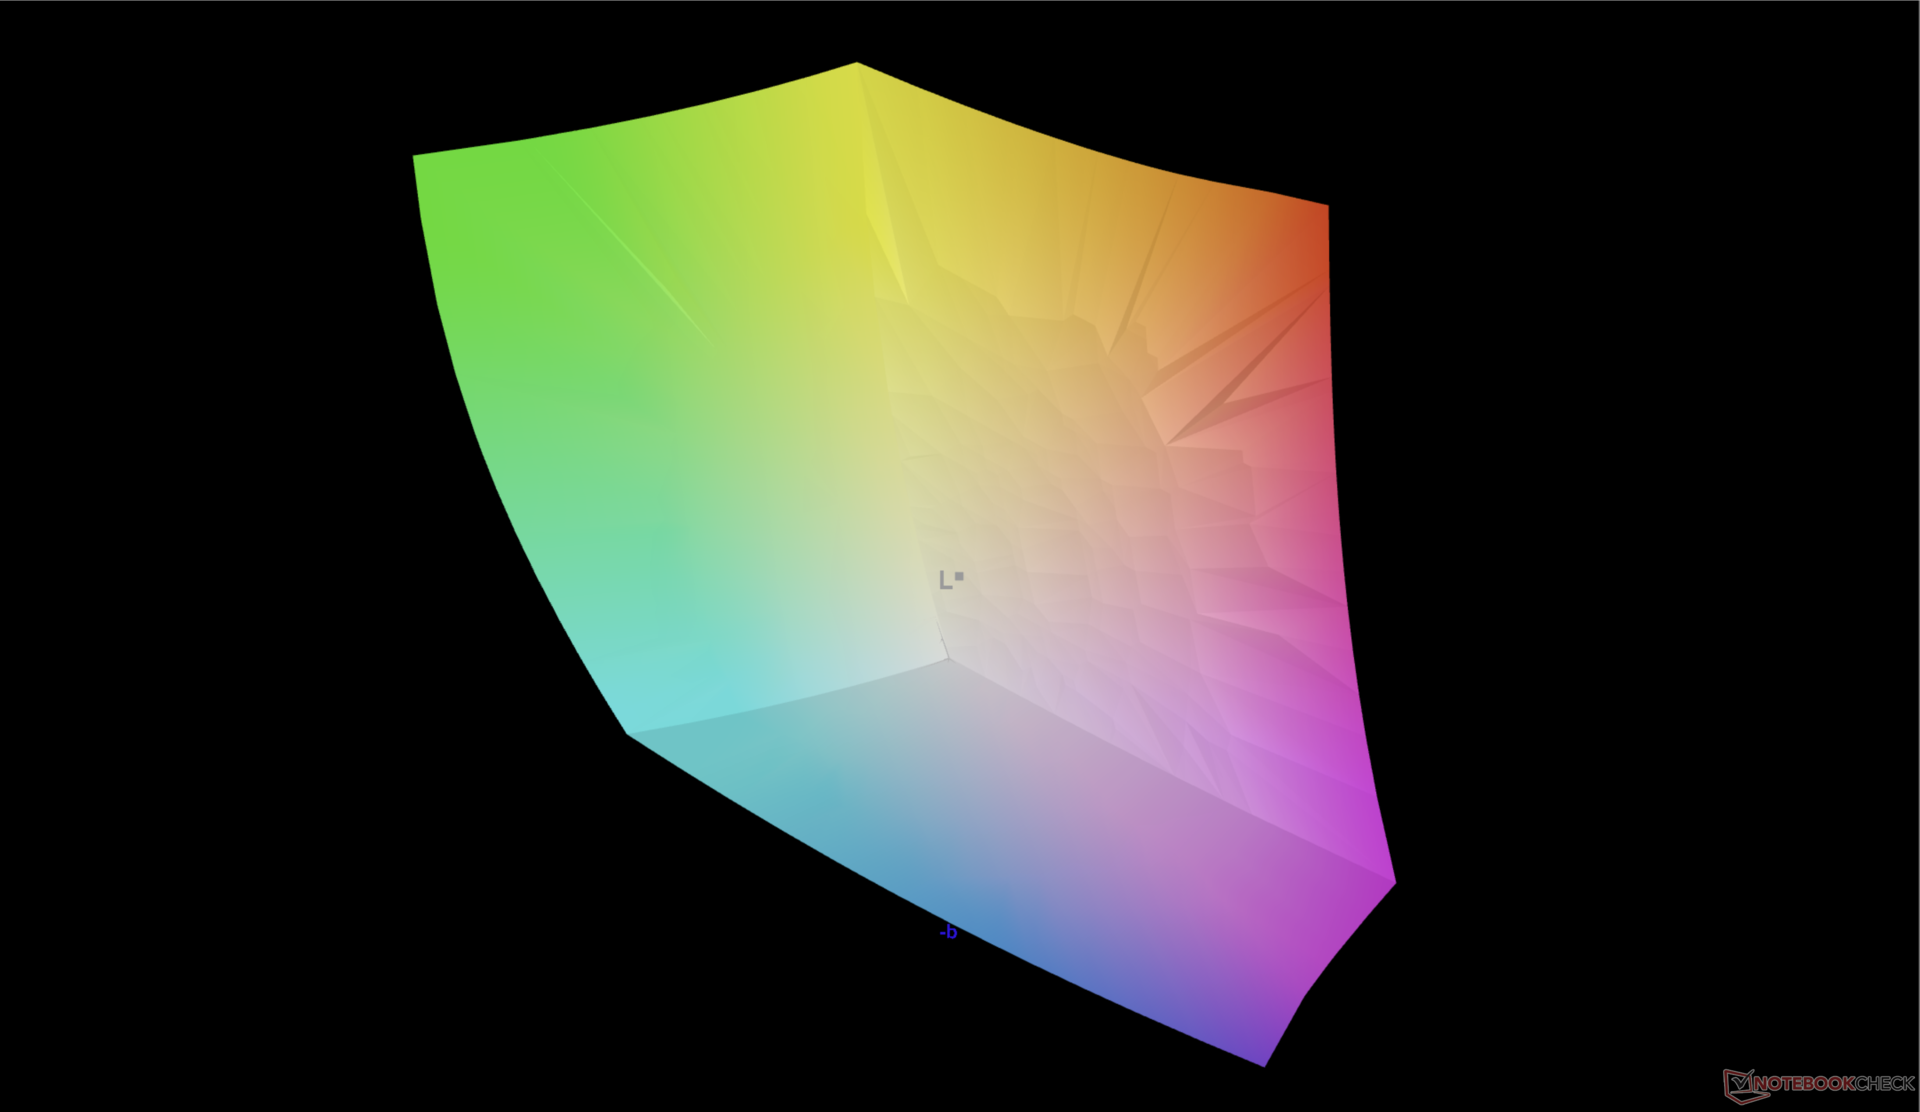
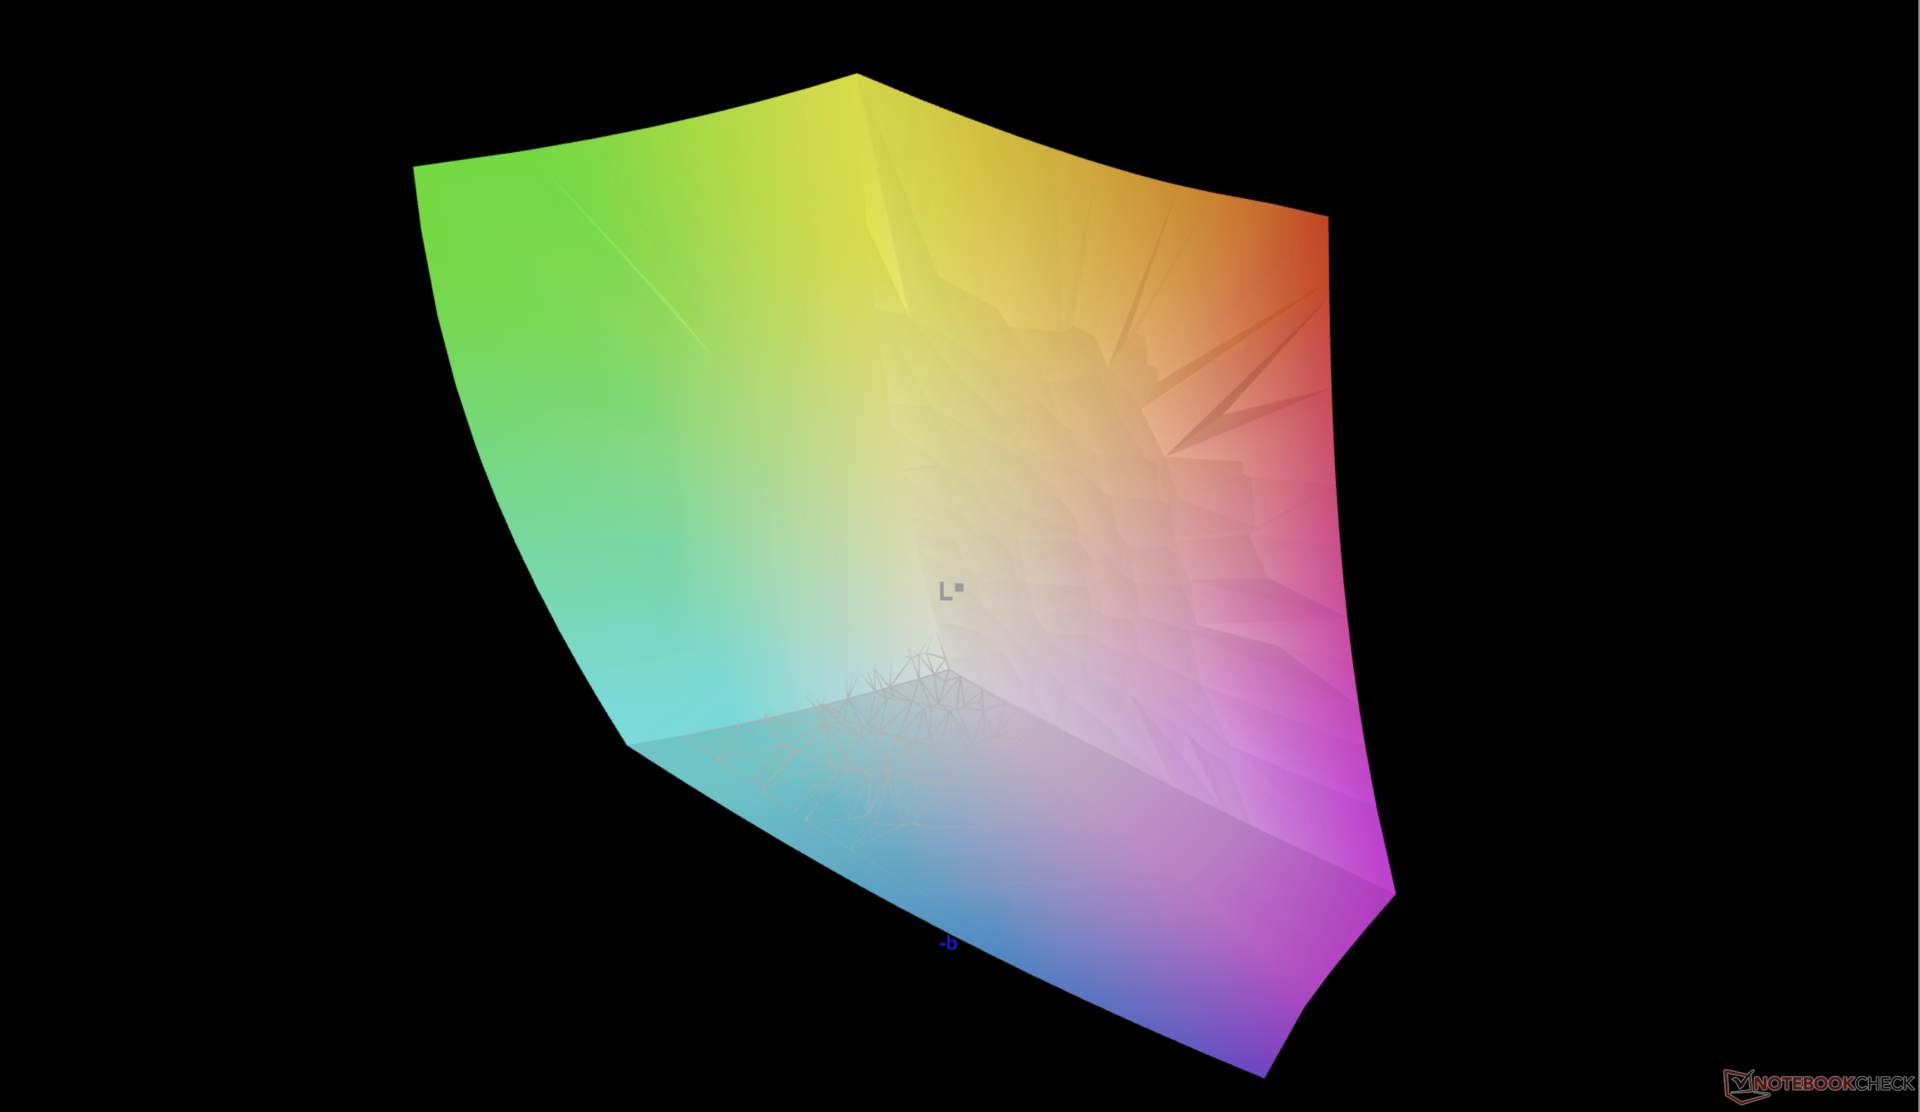
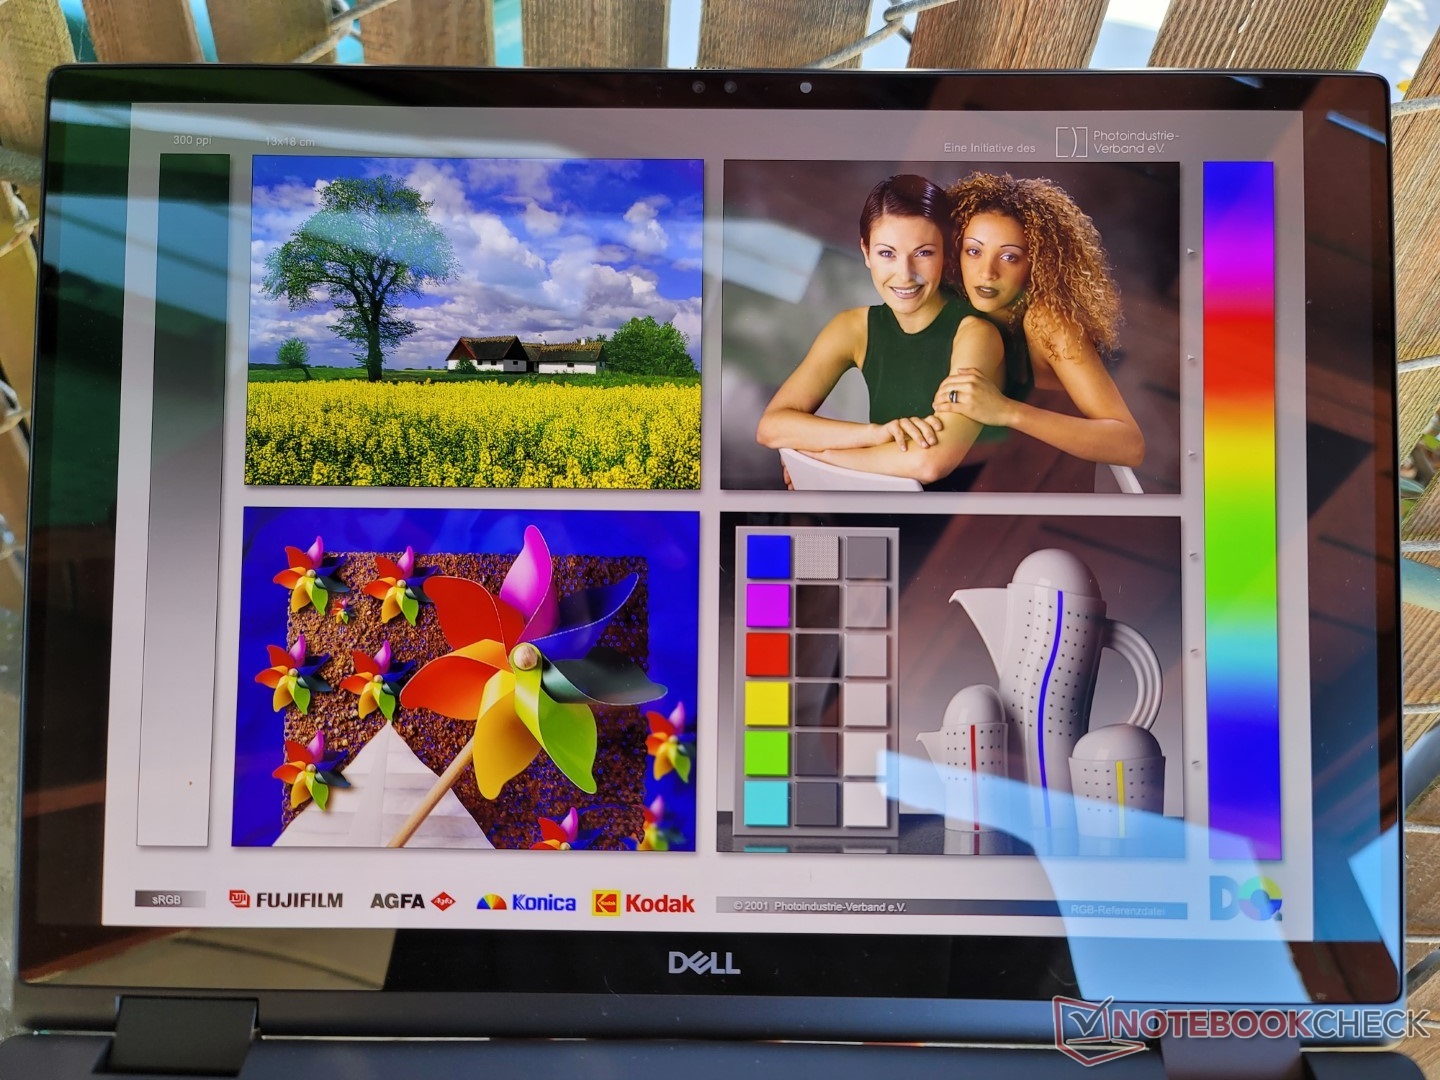
Bien que nous soyons en mesure de confirmer la couverture DCI-P3 complète du panneau OLED avec notre propre colorimètre X-Rite, la luminosité maximale de l'écran n'est que d'environ 340 nits par rapport aux 400 nits annoncés, même après avoir désactivé le contrôle automatique de la luminosité. Cela rend notre écran plus faible que sur la plupart des autres postes de travail où une luminosité de 450 nits ou plus est courante.
| |||||||||||||||||||||||||
Homogénéité de la luminosité: 98 %
Valeur mesurée au centre, sur batterie: 340.1 cd/m²
Contraste: ∞:1 (Valeurs des noirs: 0 cd/m²)
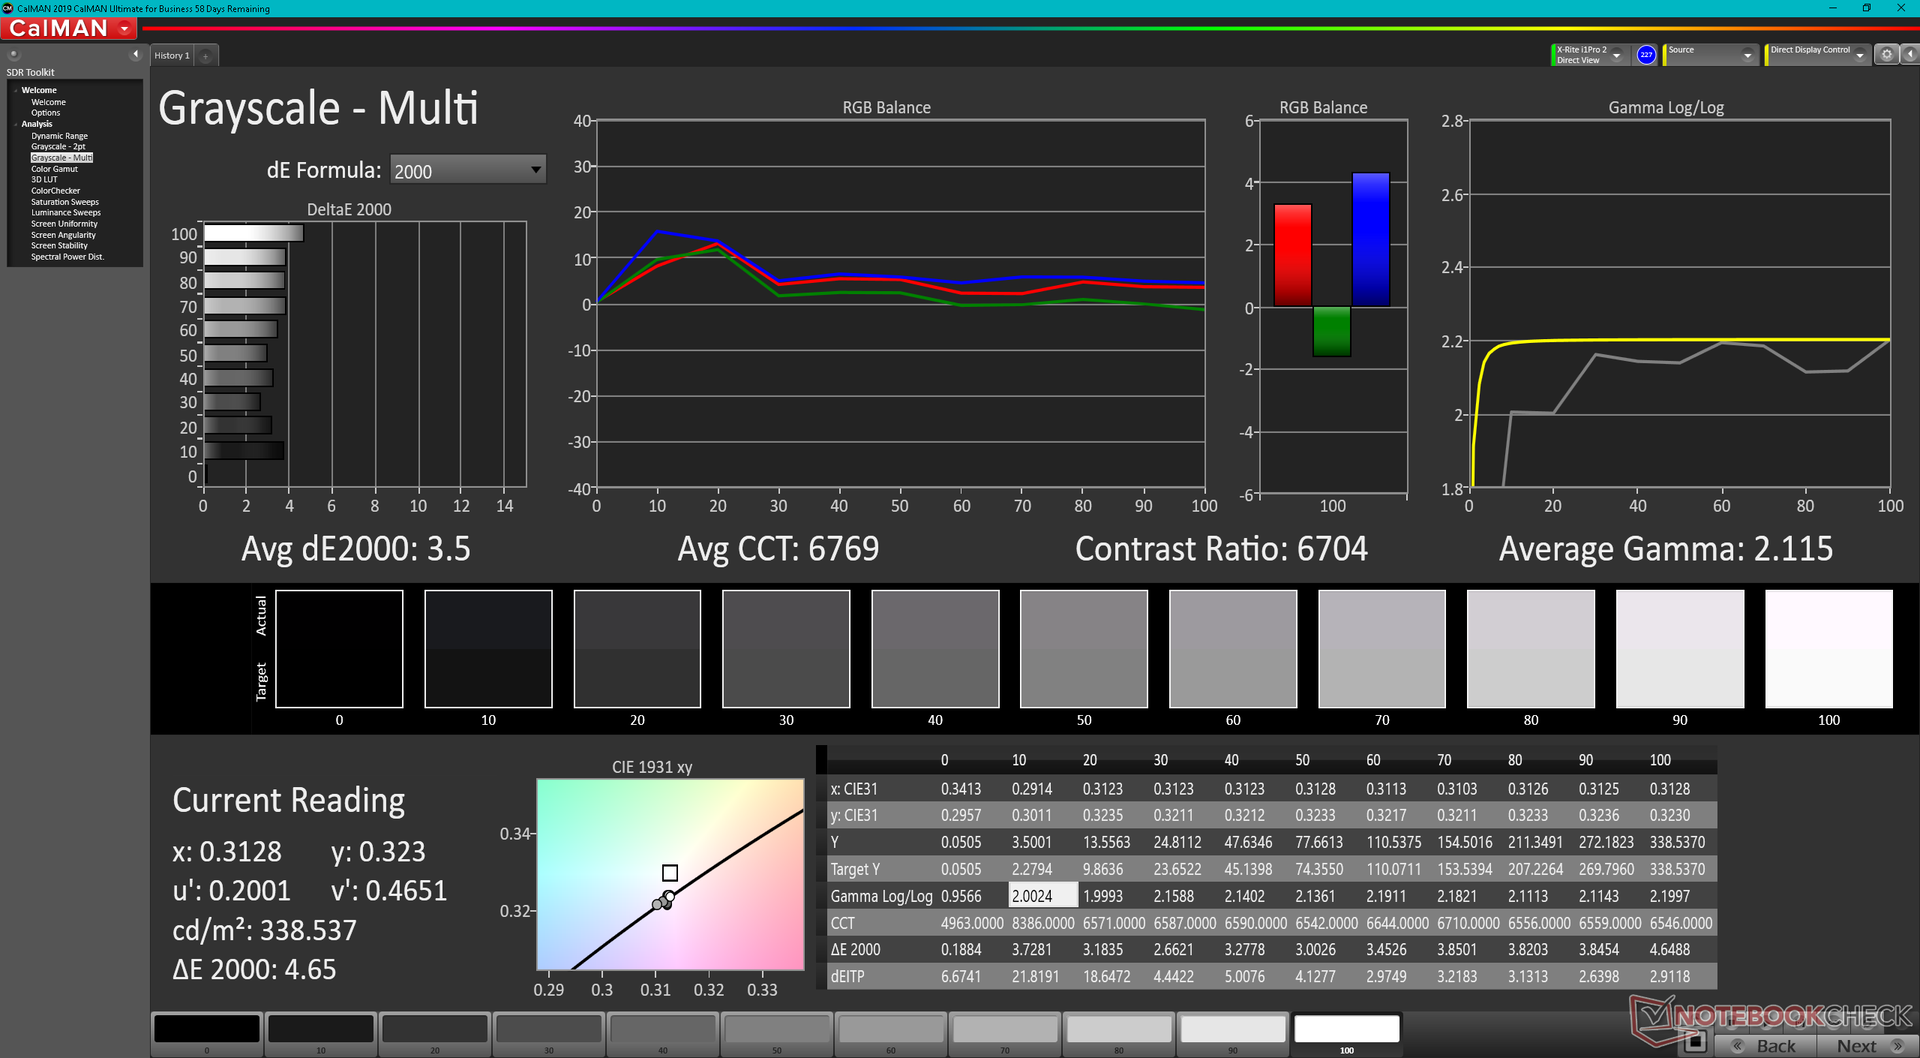
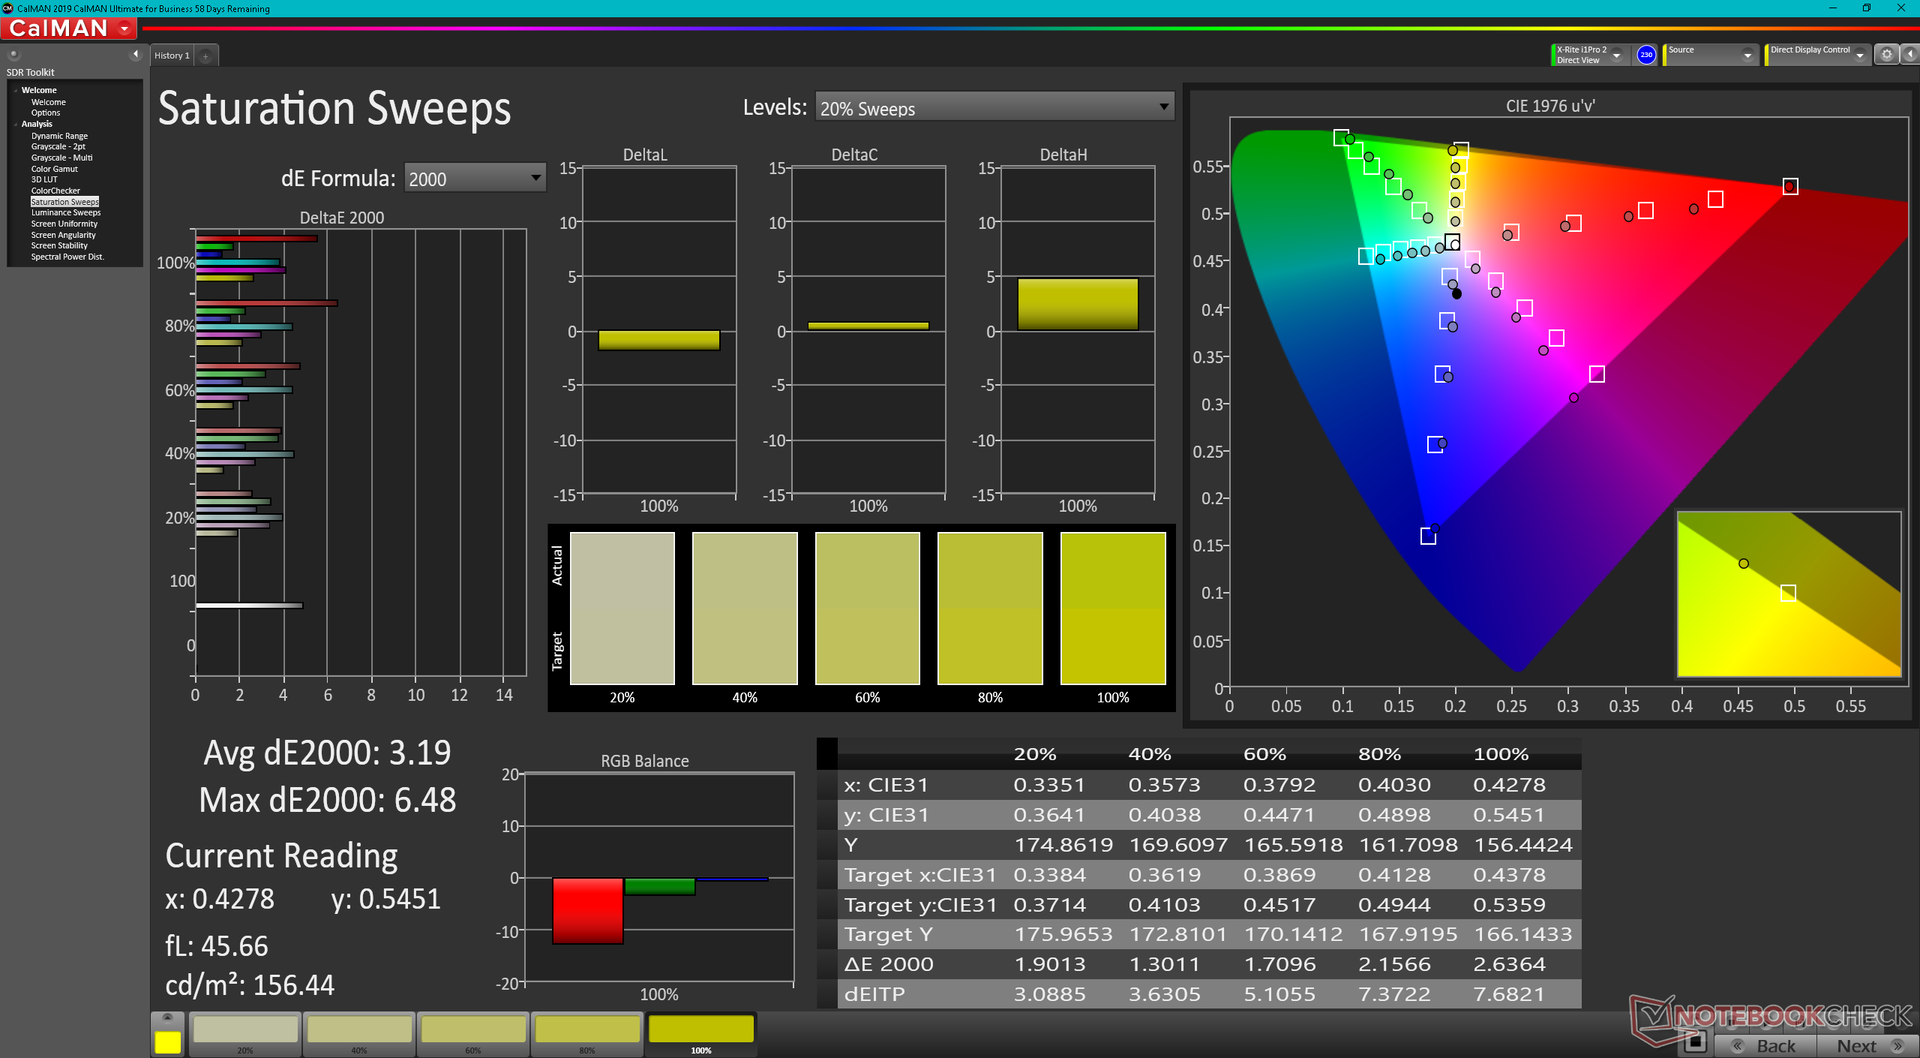
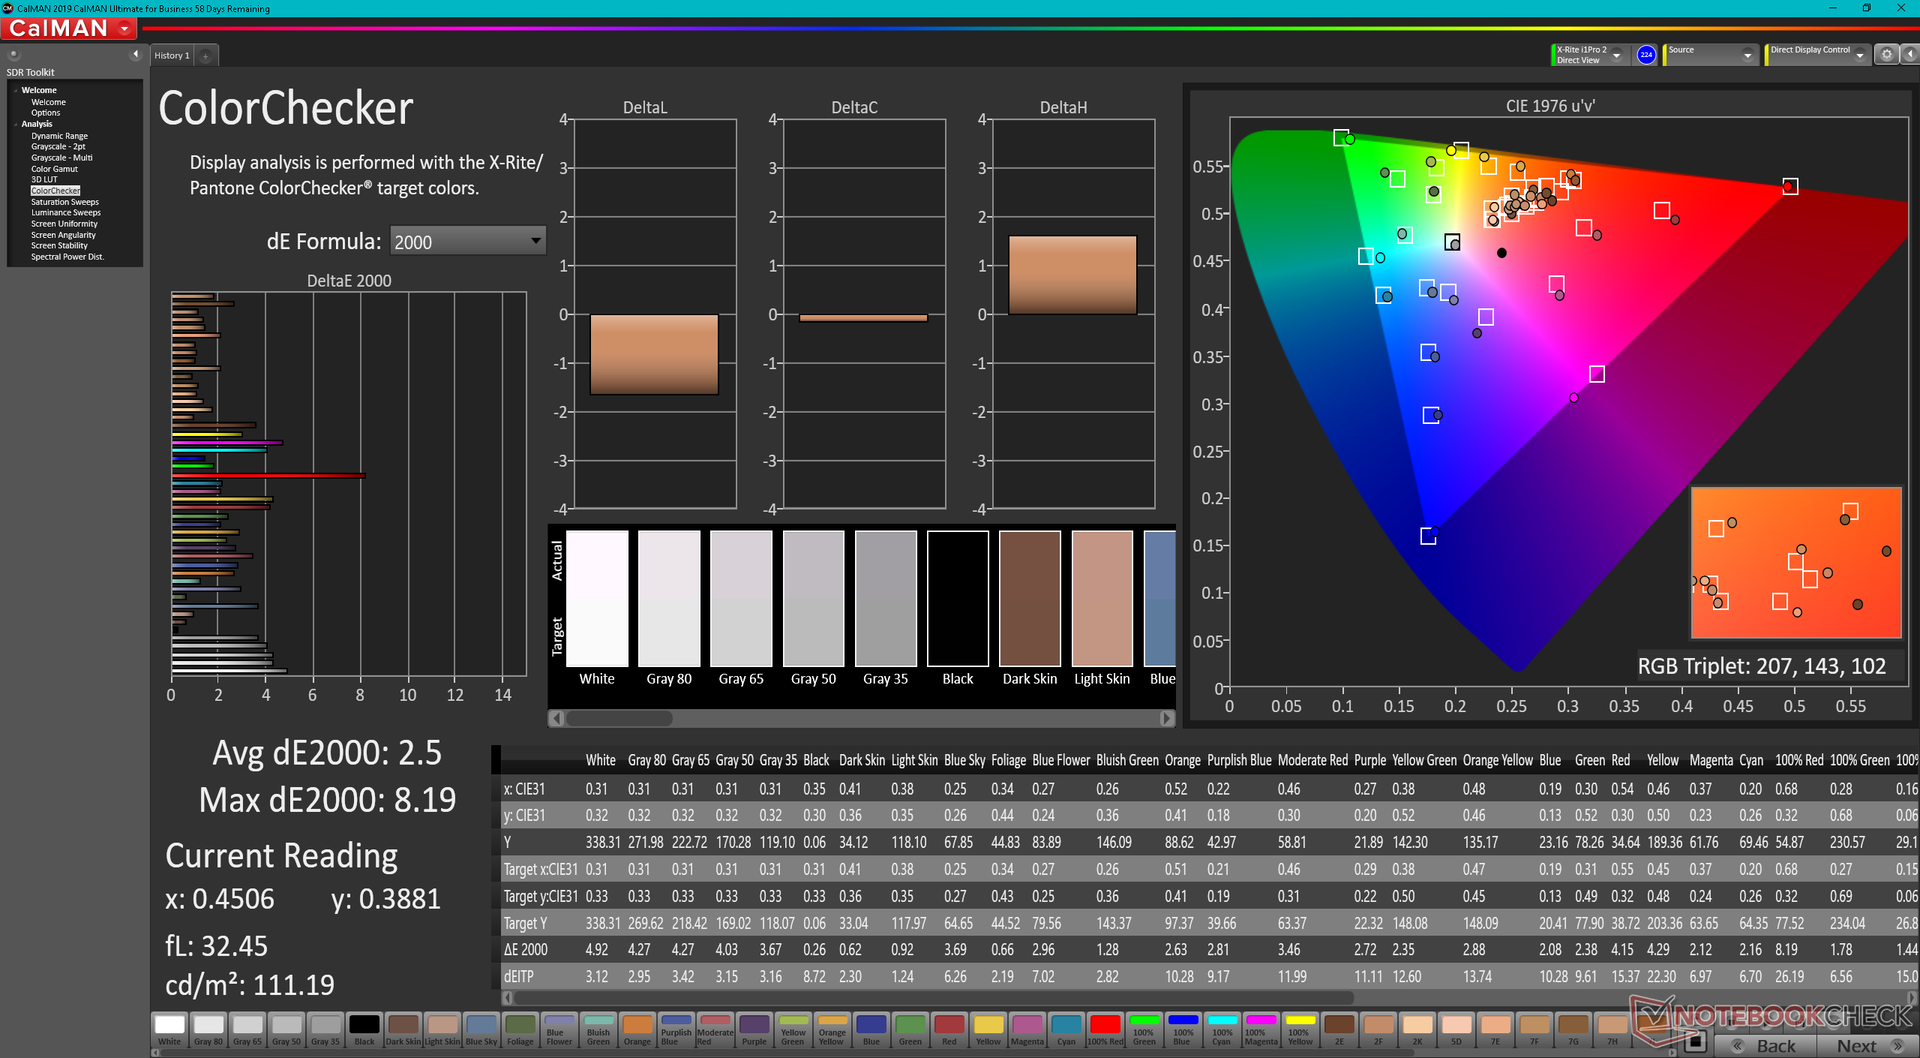
ΔE ColorChecker Calman: 2.5 | ∀{0.5-29.43 Ø4.72}
ΔE Greyscale Calman: 3.5 | ∀{0.09-98 Ø4.97}
97.5% AdobeRGB 1998 (Argyll 3D)
100% sRGB (Argyll 3D)
99.9% Display P3 (Argyll 3D)
Gamma: 2.12
CCT: 6704 K
| Dell Precision 7670 Samsung 160YV03, OLED, 3840x2400, 16" | Lenovo ThinkPad P1 G4-20Y4Z9DVUS NE160QDM-N63, IPS, 2560x1600, 16" | Asus ProArt StudioBook 16 W7600H5A-2BL2 ATNA60YV02-0, OLED, 3840x2400, 16" | Dell Precision 5000 5560 Sharp LQ156R1, IPS, 3840x2400, 15.6" | Dell Precision 7550 AU Optronics B156ZAN, IPS, 3840x2160, 15.6" | HP ZBook Fury 15 G8 BOE0969, IPS, 3840x2160, 15.6" | |
|---|---|---|---|---|---|---|
| Display | -17% | 0% | -1% | -6% | -5% | |
| Display P3 Coverage (%) | 99.9 | 72.7 -27% | 99.9 0% | 94.9 -5% | 82.1 -18% | 95.9 -4% |
| sRGB Coverage (%) | 100 | 99.3 -1% | 100 0% | 100 0% | 99.6 0% | 100 0% |
| AdobeRGB 1998 Coverage (%) | 97.5 | 74.7 -23% | 98.6 1% | 100 3% | 96.8 -1% | 87.3 -10% |
| Response Times | -1494% | -3% | -1902% | -2098% | -565% | |
| Response Time Grey 50% / Grey 80% * (ms) | 1.9 ? | 40.8 -2047% | 2 ? -5% | 47.2 ? -2384% | 51.2 ? -2595% | 14.8 ? -679% |
| Response Time Black / White * (ms) | 2 ? | 20.8 -940% | 2 ? -0% | 30.4 ? -1420% | 34 ? -1600% | 11 ? -450% |
| PWM Frequency (Hz) | 59.5 ? | 240 ? | ||||
| Screen | 7% | 18% | -4% | -16% | -10% | |
| Brightness middle (cd/m²) | 340.1 | 441 30% | 353 4% | 501.5 47% | 473.5 39% | 626 84% |
| Brightness (cd/m²) | 342 | 420 23% | 360 5% | 467 37% | 461 35% | 589 72% |
| Brightness Distribution (%) | 98 | 90 -8% | 96 -2% | 83 -15% | 90 -8% | 87 -11% |
| Black Level * (cd/m²) | 0.27 | 0.44 | 0.55 | 0.58 | ||
| Colorchecker dE 2000 * | 2.5 | 2.6 -4% | 2.45 2% | 4.73 -89% | 4.8 -92% | 5.41 -116% |
| Colorchecker dE 2000 max. * | 8.19 | 6 27% | 3.75 54% | 8.45 -3% | 8.73 -7% | 9.05 -11% |
| Greyscale dE 2000 * | 3.5 | 4.5 -29% | 1.88 46% | 3.6 -3% | 5.6 -60% | 6.2 -77% |
| Gamma | 2.12 104% | 2.18 101% | 2.31 95% | 2.08 106% | 2.34 94% | 2.66 83% |
| CCT | 6704 97% | 6623 98% | 6441 101% | 6447 101% | 7549 86% | 6101 107% |
| Contrast (:1) | 1633 | 1140 | 861 | 1079 | ||
| Colorchecker dE 2000 calibrated * | 1.2 | 2.77 | 0.51 | 3.08 | 0.6 | |
| Color Space (Percent of AdobeRGB 1998) (%) | 86.4 | |||||
| Color Space (Percent of sRGB) (%) | 99.7 | |||||
| Moyenne finale (programmes/paramètres) | -501% /
-273% | 5% /
10% | -636% /
-348% | -707% /
-392% | -193% /
-109% |
* ... Moindre est la valeur, meilleures sont les performances
Nulle part dans les publicités ou les documents de Dell, il n'est fait mention d'un écran pré-calibré en usine. Les niveaux de gris et les couleurs sont encore raisonnablement précis sur notre panneau OLED, avec des valeurs deltaE moyennes de seulement 3,5 et 2,5, respectivement.
Temps de réponse de l'écran
| ↔ Temps de réponse noir à blanc | ||
|---|---|---|
| 2 ms ... hausse ↗ et chute ↘ combinées | ↗ 0.8 ms hausse | 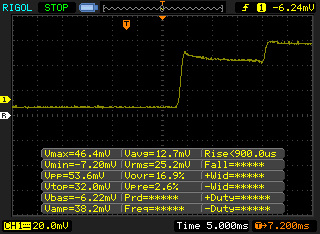 |
| ↘ 1.2 ms chute | ||
| L'écran montre de très faibles temps de réponse, parfait pour le jeu. En comparaison, tous les appareils testés affichent entre 0.1 (minimum) et 240 (maximum) ms. » 11 % des appareils testés affichent de meilleures performances. Cela signifie que les latences relevées sont meilleures que la moyenne (19.8 ms) de tous les appareils testés. | ||
| ↔ Temps de réponse gris 50% à gris 80% | ||
| 1.9 ms ... hausse ↗ et chute ↘ combinées | ↗ 1.1 ms hausse | 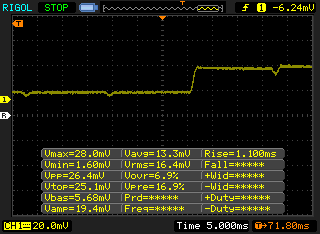 |
| ↘ 0.8 ms chute | ||
| L'écran montre de très faibles temps de réponse, parfait pour le jeu. En comparaison, tous les appareils testés affichent entre 0.165 (minimum) et 636 (maximum) ms. » 9 % des appareils testés affichent de meilleures performances. Cela signifie que les latences relevées sont meilleures que la moyenne (31 ms) de tous les appareils testés. | ||
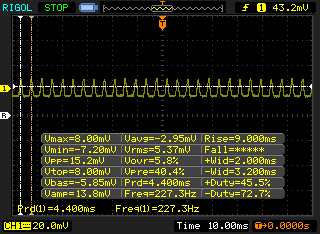
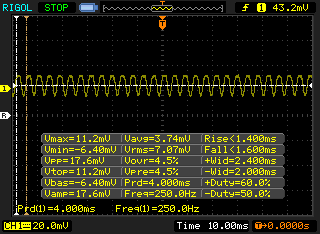
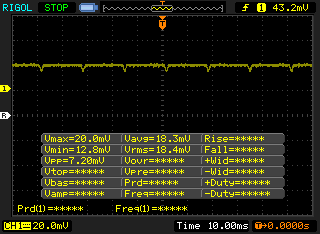
Scintillement / MLI (Modulation de largeur d'impulsion)
| Scintillement / MLI (Modulation de largeur d'impulsion) décelé | 59.5 Hz | ≤ 100 Niveau de luminosité | 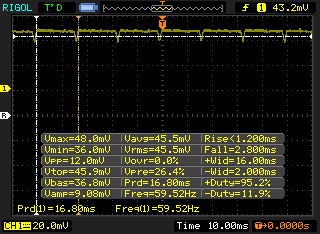 |
Le rétroéclairage de l'écran scintille à la fréquence de 59.5 Hz (certainement du fait de l'utilisation d'une MDI - Modulation de largeur d'impulsion) à un niveau de luminosité inférieur ou égal à 100 % . Aucun scintillement ne devrait être perceptible au-dessus de cette valeur. La fréquence de rafraîchissement de 59.5 Hz est extrêmement faible, de grands risques de fatigue oculaire accrue et de maux de tête en cas d'utilisation prolongée. En comparaison, 52 % des appareils testés n'emploient pas MDI pour assombrir leur écran. Nous avons relevé une moyenne à 7769 (minimum : 5 - maximum : 343500) Hz dans le cas où une MDI était active. | |||
Le scintillement est présent à tous les niveaux de luminosité, comme sur la plupart des autres panneaux OLED. Nous avons pu détecter une fréquence de 250 Hz de 1 à 56 % de luminosité et de 59,5 Hz de 57 % de luminosité au maximum.

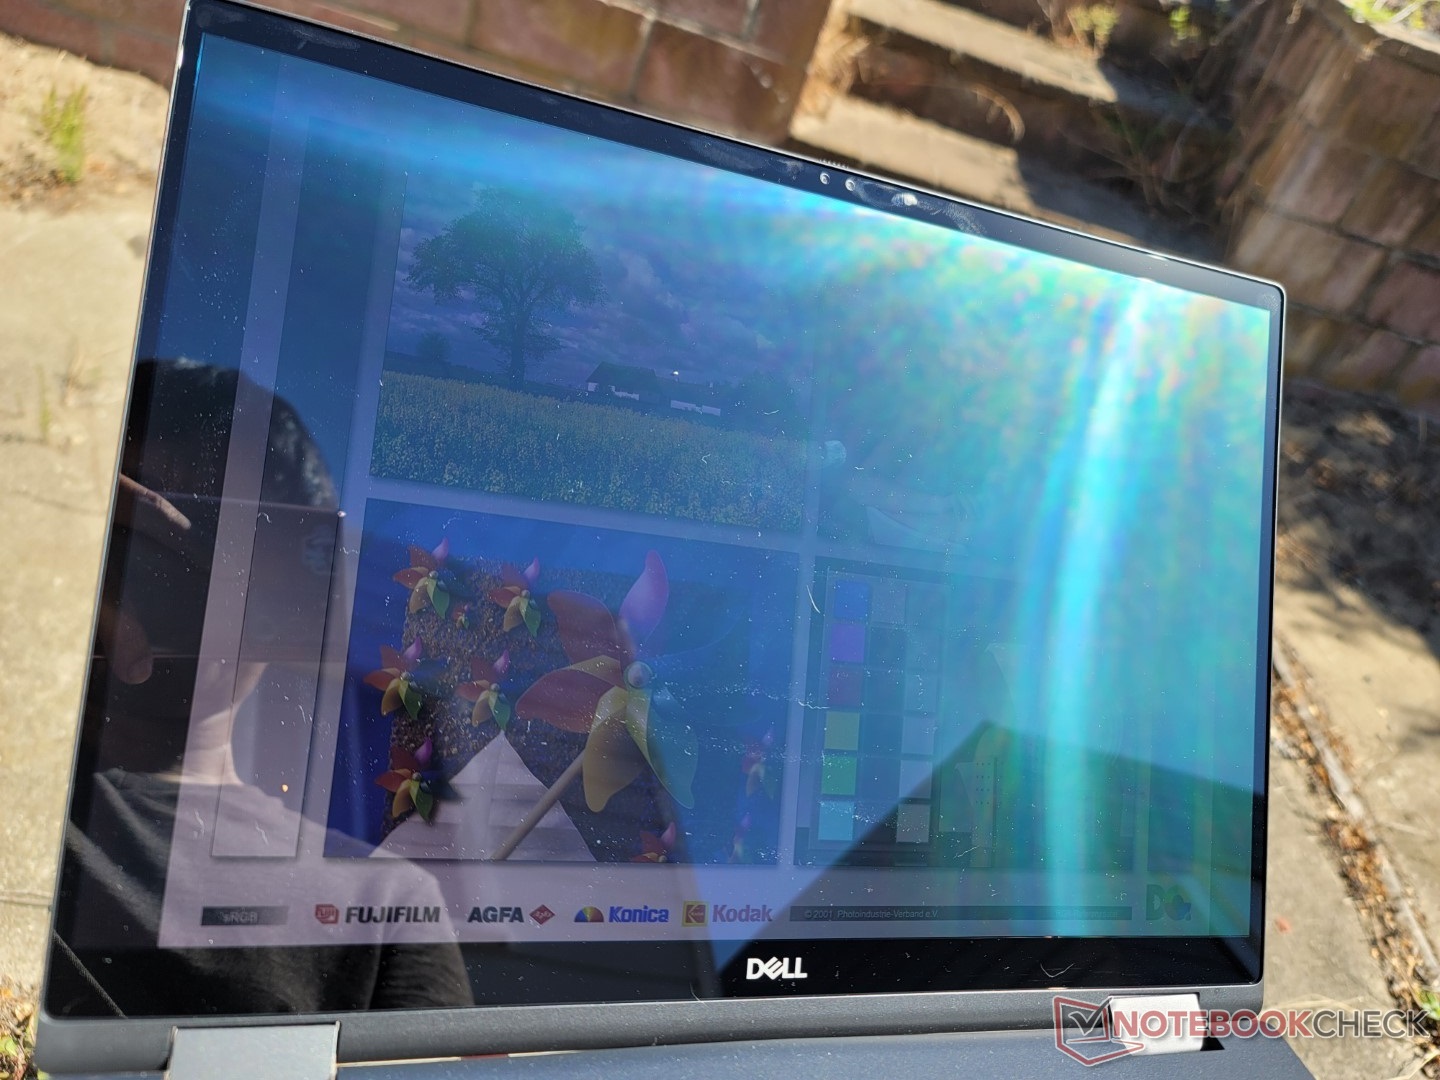
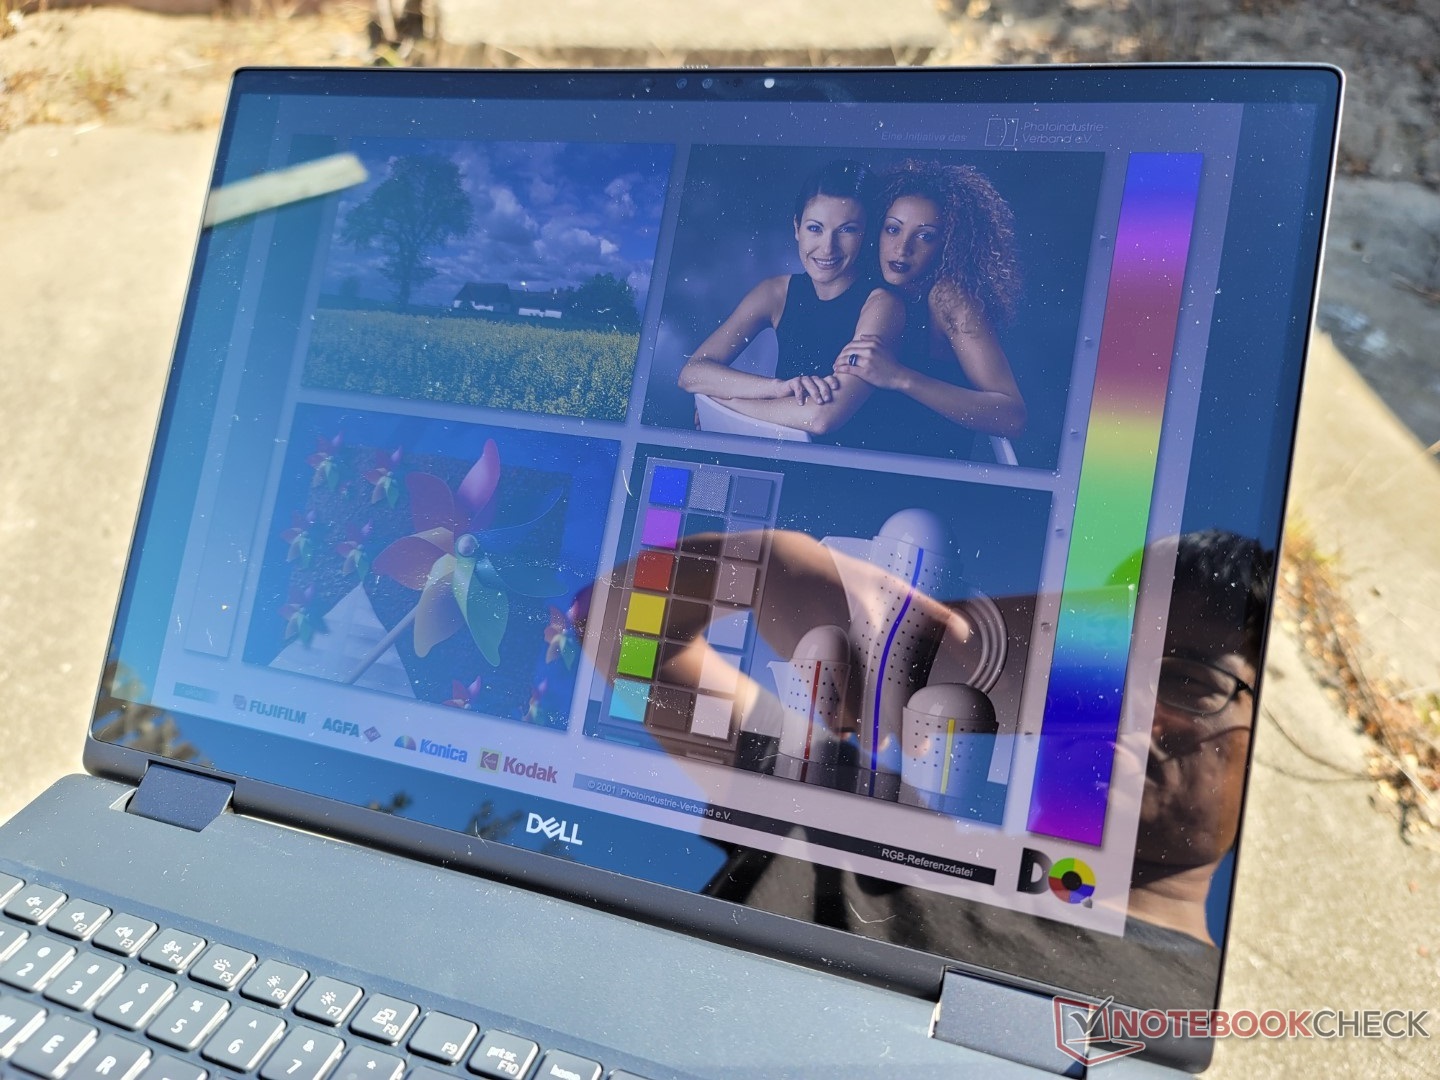
Les reflets sont importants malgré le fait qu'il s'agisse techniquement d'un écran "anti-reflets". Le rétroéclairage n'est pas suffisamment lumineux pour permettre une visualisation confortable dans la plupart des scénarios en extérieur, sauf si vous vous trouvez à l'ombre. Si la visibilité en extérieur est importante, nous vous recommandons d'aller voir leHP ZBook Fury 15 G8 dont l'écran est presque deux fois plus lumineux que celui de notre unité Precision.
Performances - Intel vPro pour tous
Conditions d'essai
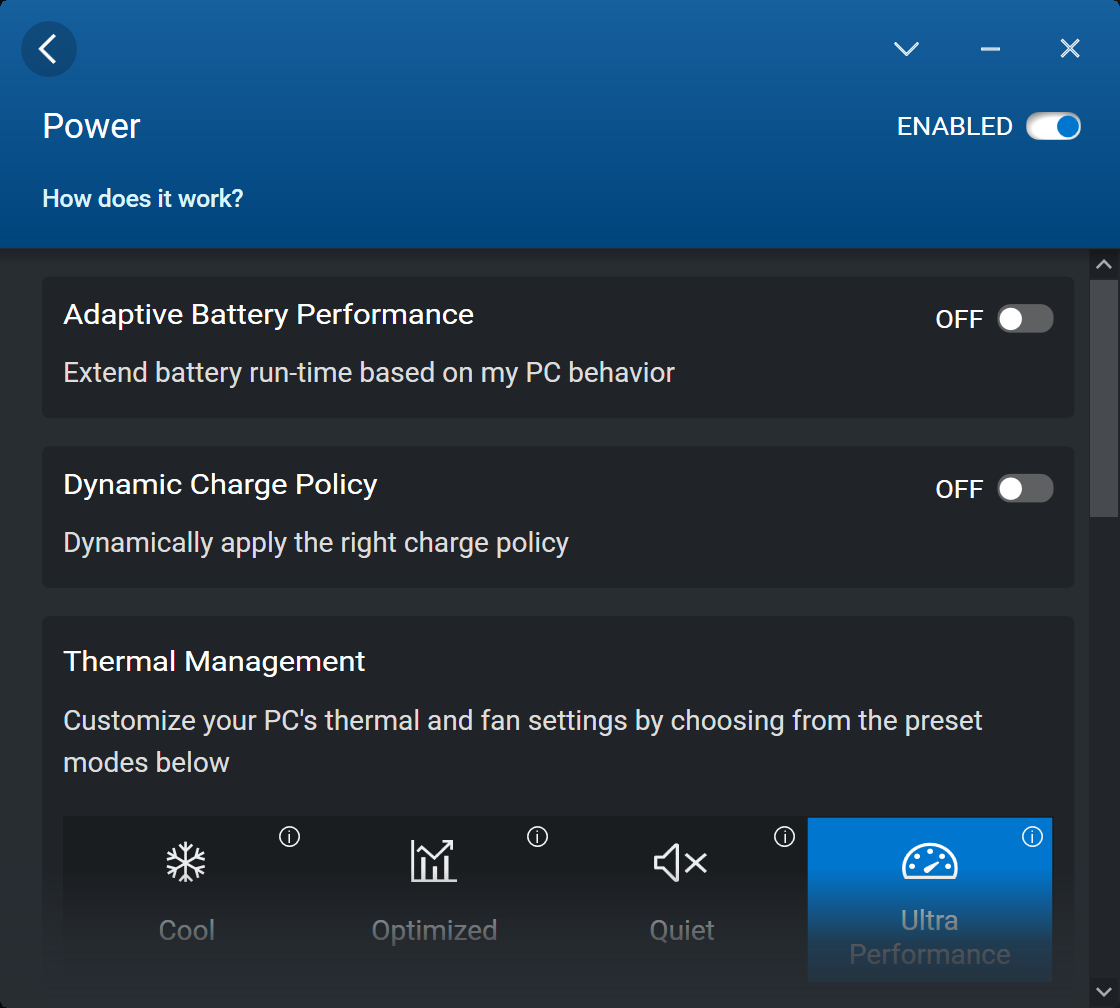
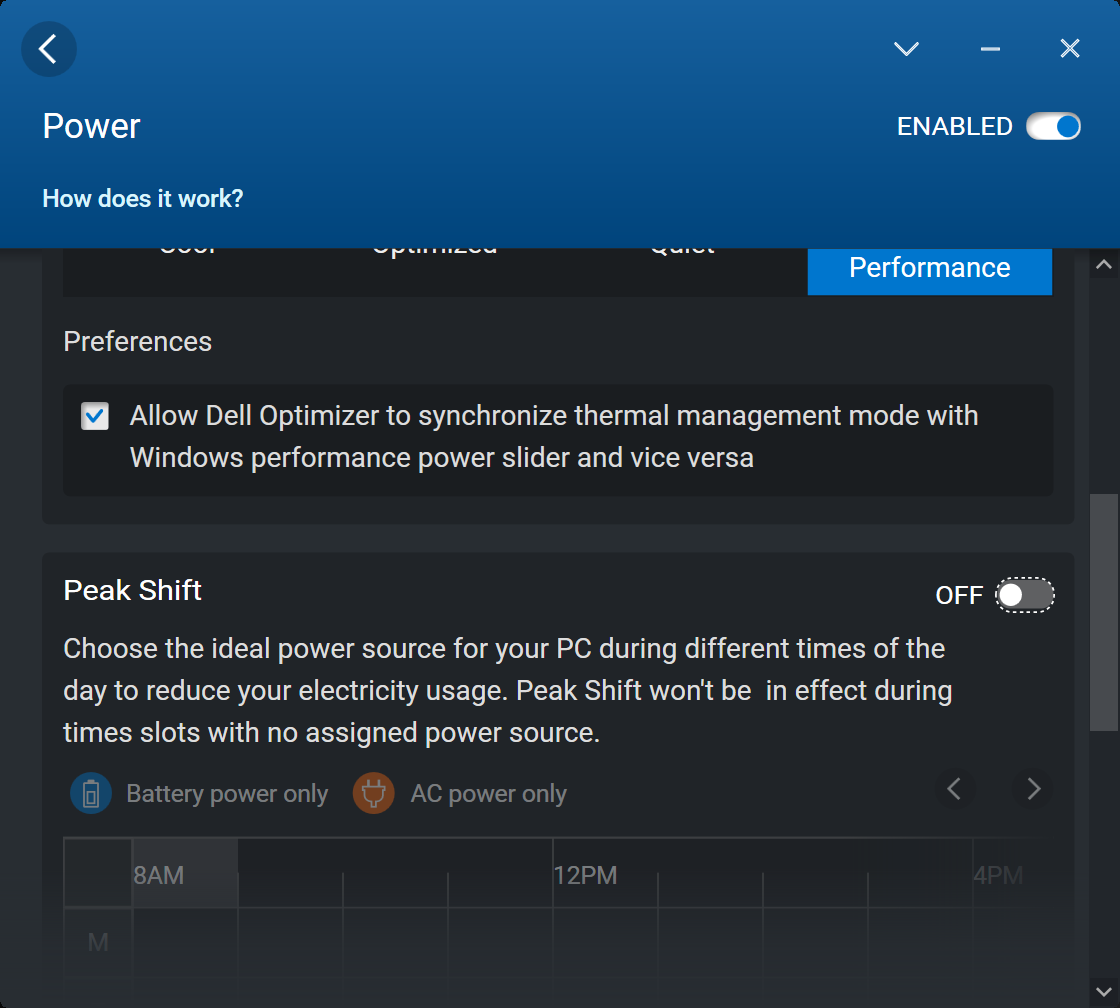
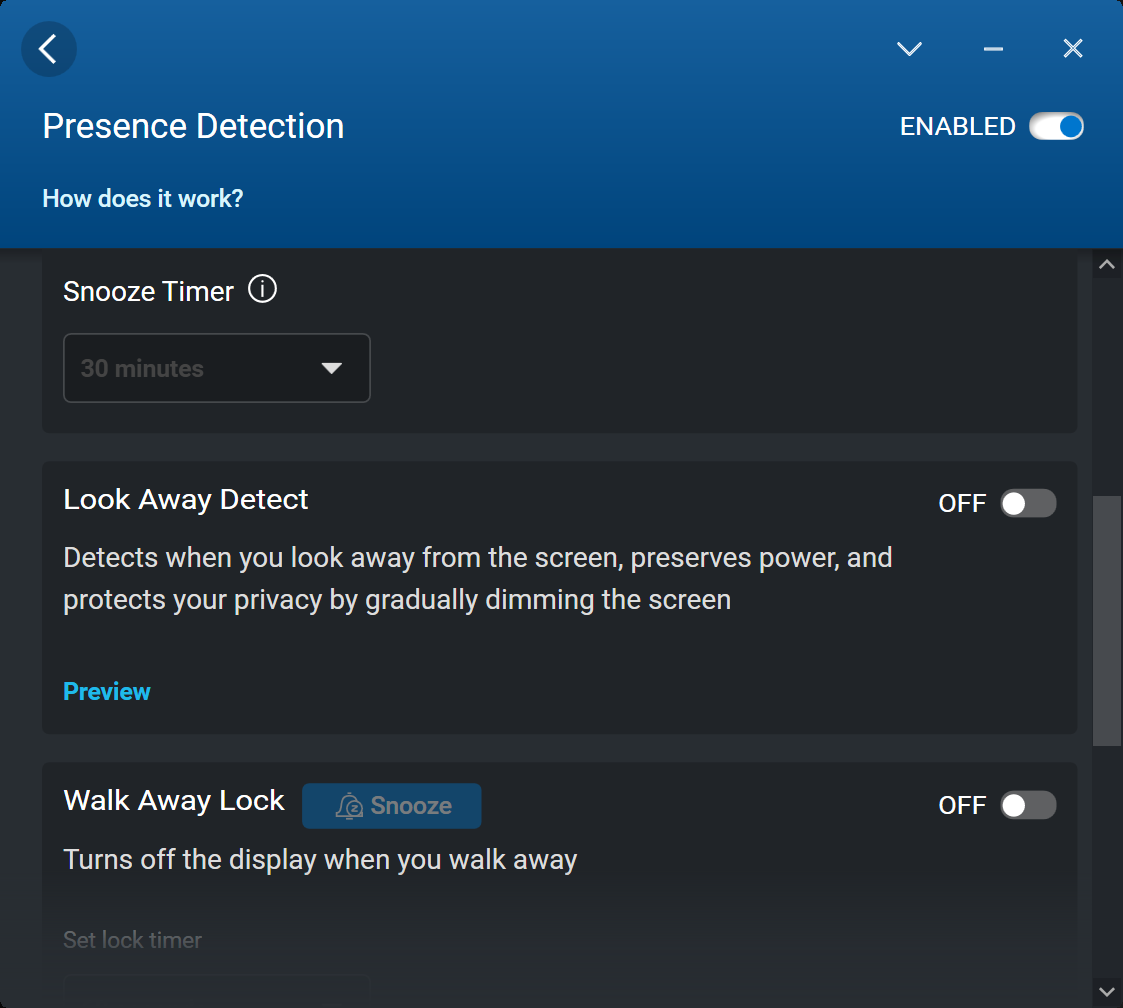
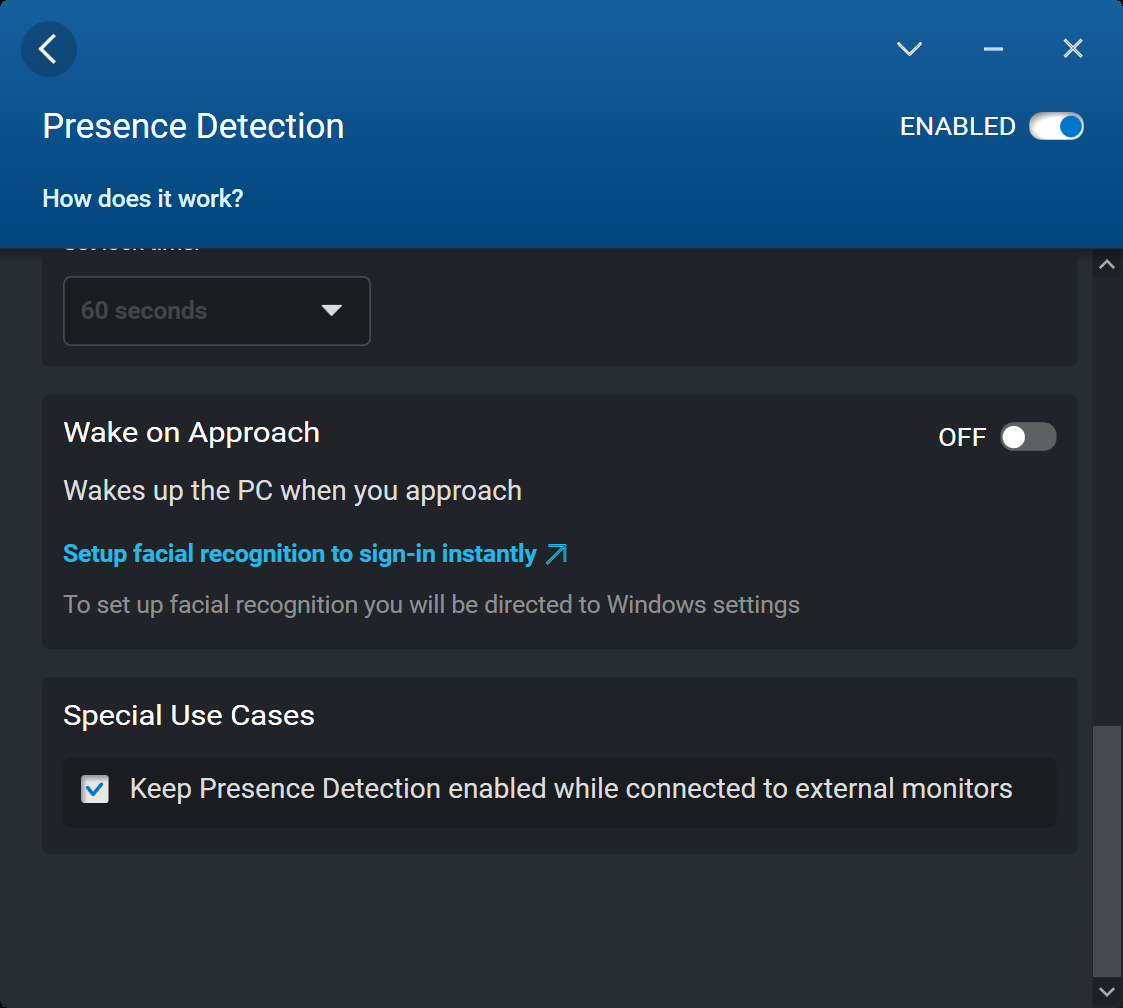
Nous avons réglé notre appareil en mode Ultra Performance via le logiciel Dell Optimizer et le GPU en mode discret via le panneau de configuration Nvidia avant d'exécuter les benchmarks ci-dessous. Il est ennuyeux de constater que le profil d'alimentation peut être réglé via Windows, Dell Optimizer ou Dell Power Manager, ce qui peut rendre les choses très confuses. Nous recommandons d'activer la synchronisation du profil d'alimentation entre les trois applications différentes via Optimizer comme le montre la capture d'écran ci-dessous.

Processeur
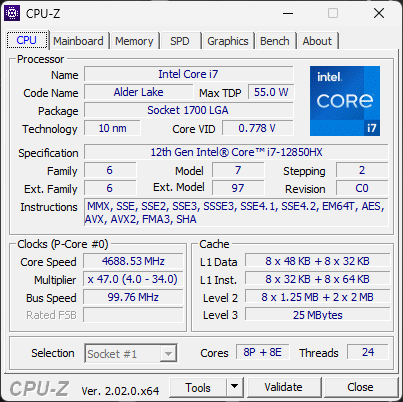
Sur le papier, le Core i7-12850HX présente des fréquences d'horloge, un nombre de cœurs et des tailles de cache similaires à ceux du processeur i7-12800HX mais avec la prise en charge de vPro en plus. Dans la réalité, cependant, leurs performances peuvent varier de manière assez significative
Les performances du processeur sont plus proches de celles du Core i7-12800H que du Core i7-12800HX. En fait, les performances multithread sont environ 30 % plus lentes que celles du i7-12800HX que l'on trouve sur le serveur MSI GE67 HXen raison de sa solution de refroidissement plus performante. Malgré tout, les performances restent parmi les plus rapides par rapport aux autres stations de travail, car beaucoup d'entre elles fonctionnent encore avec des CPU Intel de 11e génération.
La durabilité de Turbo Boost aurait pu être meilleure. Lors de l'exécution de CineBench R15 xT en boucle, les performances chutaient de 25 % après deux ou trois répétitions, ce qui expliquerait l'important déficit de performances par rapport au Core i7-12800HX mentionné ci-dessus.
Cinebench R15 Multi Loop
Cinebench R23: Multi Core | Single Core
Cinebench R15: CPU Multi 64Bit | CPU Single 64Bit
Blender: v2.79 BMW27 CPU
7-Zip 18.03: 7z b 4 | 7z b 4 -mmt1
Geekbench 5.5: Multi-Core | Single-Core
HWBOT x265 Benchmark v2.2: 4k Preset
LibreOffice : 20 Documents To PDF
R Benchmark 2.5: Overall mean
| Cinebench R20 / CPU (Multi Core) | |
| MSI GE67 HX 12UGS | |
| Moyenne Intel Core i7-12850HX (6217 - 6764, n=2) | |
| Dell Precision 7670 | |
| Razer Blade 17 RTX 3080 Ti | |
| Lenovo Legion 7 16ARHA7 | |
| HP Envy 16 h0112nr | |
| Asus Zenbook Pro 15 OLED UM535Q | |
| Lenovo ThinkPad P1 G4-20Y4Z9DVUS | |
| HP ZBook Fury 15 G8 | |
| Dell Precision 5000 5470 | |
| Asus ProArt StudioBook 16 W7600H5A-2BL2 | |
| Dell Precision 7550 | |
| Dell Precision 5000 5560 | |
| Cinebench R20 / CPU (Single Core) | |
| Razer Blade 17 RTX 3080 Ti | |
| Moyenne Intel Core i7-12850HX (687 - 708, n=2) | |
| Dell Precision 7670 | |
| Dell Precision 5000 5470 | |
| HP Envy 16 h0112nr | |
| MSI GE67 HX 12UGS | |
| HP ZBook Fury 15 G8 | |
| Lenovo Legion 7 16ARHA7 | |
| Lenovo ThinkPad P1 G4-20Y4Z9DVUS | |
| Dell Precision 5000 5560 | |
| Asus Zenbook Pro 15 OLED UM535Q | |
| Asus ProArt StudioBook 16 W7600H5A-2BL2 | |
| Dell Precision 7550 | |
| Cinebench R23 / Multi Core | |
| MSI GE67 HX 12UGS | |
| Moyenne Intel Core i7-12850HX (15093 - 17510, n=2) | |
| Razer Blade 17 RTX 3080 Ti | |
| Dell Precision 7670 | |
| Lenovo Legion 7 16ARHA7 | |
| HP Envy 16 h0112nr | |
| Dell Precision 5000 5470 | |
| Asus Zenbook Pro 15 OLED UM535Q | |
| Lenovo ThinkPad P1 G4-20Y4Z9DVUS | |
| HP ZBook Fury 15 G8 | |
| Asus ProArt StudioBook 16 W7600H5A-2BL2 | |
| Dell Precision 5000 5560 | |
| Cinebench R23 / Single Core | |
| Razer Blade 17 RTX 3080 Ti | |
| MSI GE67 HX 12UGS | |
| Dell Precision 5000 5470 | |
| HP Envy 16 h0112nr | |
| Moyenne Intel Core i7-12850HX (1596 - 1845, n=2) | |
| HP ZBook Fury 15 G8 | |
| Dell Precision 7670 | |
| Lenovo Legion 7 16ARHA7 | |
| Dell Precision 5000 5560 | |
| Lenovo ThinkPad P1 G4-20Y4Z9DVUS | |
| Asus ProArt StudioBook 16 W7600H5A-2BL2 | |
| Asus Zenbook Pro 15 OLED UM535Q | |
| Cinebench R15 / CPU Multi 64Bit | |
| MSI GE67 HX 12UGS | |
| Moyenne Intel Core i7-12850HX (2432 - 2926, n=2) | |
| HP Envy 16 h0112nr | |
| Dell Precision 7670 | |
| Lenovo Legion 7 16ARHA7 | |
| Dell Precision 5000 5470 | |
| Razer Blade 17 RTX 3080 Ti | |
| Asus Zenbook Pro 15 OLED UM535Q | |
| Lenovo ThinkPad P1 G4-20Y4Z9DVUS | |
| Asus ProArt StudioBook 16 W7600H5A-2BL2 | |
| HP ZBook Fury 15 G8 | |
| Dell Precision 7550 | |
| Dell Precision 5000 5560 | |
| Cinebench R15 / CPU Single 64Bit | |
| Razer Blade 17 RTX 3080 Ti | |
| Moyenne Intel Core i7-12850HX (253 - 268, n=2) | |
| MSI GE67 HX 12UGS | |
| HP Envy 16 h0112nr | |
| Dell Precision 7670 | |
| Lenovo Legion 7 16ARHA7 | |
| Dell Precision 5000 5470 | |
| HP ZBook Fury 15 G8 | |
| Asus Zenbook Pro 15 OLED UM535Q | |
| Dell Precision 5000 5560 | |
| Lenovo ThinkPad P1 G4-20Y4Z9DVUS | |
| Asus ProArt StudioBook 16 W7600H5A-2BL2 | |
| Dell Precision 7550 | |
| Blender / v2.79 BMW27 CPU | |
| Dell Precision 5000 5560 | |
| Dell Precision 7550 | |
| Asus ProArt StudioBook 16 W7600H5A-2BL2 | |
| HP ZBook Fury 15 G8 | |
| Lenovo ThinkPad P1 G4-20Y4Z9DVUS | |
| HP Envy 16 h0112nr | |
| Dell Precision 5000 5470 | |
| Asus Zenbook Pro 15 OLED UM535Q | |
| Razer Blade 17 RTX 3080 Ti | |
| Lenovo Legion 7 16ARHA7 | |
| Dell Precision 7670 | |
| Moyenne Intel Core i7-12850HX (181 - 205, n=2) | |
| MSI GE67 HX 12UGS | |
| 7-Zip 18.03 / 7z b 4 | |
| MSI GE67 HX 12UGS | |
| Lenovo Legion 7 16ARHA7 | |
| Razer Blade 17 RTX 3080 Ti | |
| Moyenne Intel Core i7-12850HX (53893 - 69464, n=2) | |
| Asus Zenbook Pro 15 OLED UM535Q | |
| HP Envy 16 h0112nr | |
| Dell Precision 7670 | |
| Dell Precision 5000 5470 | |
| Lenovo ThinkPad P1 G4-20Y4Z9DVUS | |
| HP ZBook Fury 15 G8 | |
| Dell Precision 7550 | |
| Asus ProArt StudioBook 16 W7600H5A-2BL2 | |
| Dell Precision 5000 5560 | |
| 7-Zip 18.03 / 7z b 4 -mmt1 | |
| Razer Blade 17 RTX 3080 Ti | |
| Moyenne Intel Core i7-12850HX (5608 - 5916, n=2) | |
| HP ZBook Fury 15 G8 | |
| Dell Precision 5000 5560 | |
| HP Envy 16 h0112nr | |
| Lenovo Legion 7 16ARHA7 | |
| MSI GE67 HX 12UGS | |
| Dell Precision 7670 | |
| Lenovo ThinkPad P1 G4-20Y4Z9DVUS | |
| Asus Zenbook Pro 15 OLED UM535Q | |
| Dell Precision 5000 5470 | |
| Dell Precision 7550 | |
| Asus ProArt StudioBook 16 W7600H5A-2BL2 | |
| Geekbench 5.5 / Multi-Core | |
| MSI GE67 HX 12UGS | |
| Razer Blade 17 RTX 3080 Ti | |
| HP Envy 16 h0112nr | |
| Moyenne Intel Core i7-12850HX (11509 - 13095, n=2) | |
| Dell Precision 5000 5470 | |
| Dell Precision 7670 | |
| Lenovo Legion 7 16ARHA7 | |
| Asus Zenbook Pro 15 OLED UM535Q | |
| Dell Precision 7550 | |
| Asus ProArt StudioBook 16 W7600H5A-2BL2 | |
| Lenovo ThinkPad P1 G4-20Y4Z9DVUS | |
| Geekbench 5.5 / Single-Core | |
| Dell Precision 5000 5470 | |
| Moyenne Intel Core i7-12850HX (1777 - 1787, n=2) | |
| Dell Precision 7670 | |
| HP Envy 16 h0112nr | |
| MSI GE67 HX 12UGS | |
| Razer Blade 17 RTX 3080 Ti | |
| Lenovo Legion 7 16ARHA7 | |
| Lenovo ThinkPad P1 G4-20Y4Z9DVUS | |
| Asus Zenbook Pro 15 OLED UM535Q | |
| Asus ProArt StudioBook 16 W7600H5A-2BL2 | |
| Dell Precision 7550 | |
| HWBOT x265 Benchmark v2.2 / 4k Preset | |
| MSI GE67 HX 12UGS | |
| Lenovo Legion 7 16ARHA7 | |
| Dell Precision 7670 | |
| Moyenne Intel Core i7-12850HX (17.2 - 17.3, n=2) | |
| Razer Blade 17 RTX 3080 Ti | |
| Asus Zenbook Pro 15 OLED UM535Q | |
| HP Envy 16 h0112nr | |
| HP ZBook Fury 15 G8 | |
| Lenovo ThinkPad P1 G4-20Y4Z9DVUS | |
| Asus ProArt StudioBook 16 W7600H5A-2BL2 | |
| Dell Precision 5000 5470 | |
| Dell Precision 7550 | |
| Dell Precision 5000 5560 | |
| LibreOffice / 20 Documents To PDF | |
| Lenovo Legion 7 16ARHA7 | |
| HP ZBook Fury 15 G8 | |
| Lenovo ThinkPad P1 G4-20Y4Z9DVUS | |
| Asus Zenbook Pro 15 OLED UM535Q | |
| Dell Precision 7670 | |
| Dell Precision 5000 5560 | |
| Moyenne Intel Core i7-12850HX (46.9 - 48.6, n=2) | |
| Dell Precision 7550 | |
| Razer Blade 17 RTX 3080 Ti | |
| Dell Precision 5000 5470 | |
| HP Envy 16 h0112nr | |
| MSI GE67 HX 12UGS | |
| Asus ProArt StudioBook 16 W7600H5A-2BL2 | |
| R Benchmark 2.5 / Overall mean | |
| Dell Precision 7550 | |
| Asus ProArt StudioBook 16 W7600H5A-2BL2 | |
| Lenovo ThinkPad P1 G4-20Y4Z9DVUS | |
| HP ZBook Fury 15 G8 | |
| Dell Precision 5000 5560 | |
| Asus Zenbook Pro 15 OLED UM535Q | |
| Lenovo Legion 7 16ARHA7 | |
| Dell Precision 5000 5470 | |
| Dell Precision 7670 | |
| Moyenne Intel Core i7-12850HX (0.45 - 0.4698, n=2) | |
| MSI GE67 HX 12UGS | |
| HP Envy 16 h0112nr | |
| Razer Blade 17 RTX 3080 Ti | |
Cinebench R23: Multi Core | Single Core
Cinebench R15: CPU Multi 64Bit | CPU Single 64Bit
Blender: v2.79 BMW27 CPU
7-Zip 18.03: 7z b 4 | 7z b 4 -mmt1
Geekbench 5.5: Multi-Core | Single-Core
HWBOT x265 Benchmark v2.2: 4k Preset
LibreOffice : 20 Documents To PDF
R Benchmark 2.5: Overall mean
* ... Moindre est la valeur, meilleures sont les performances
AIDA64: FP32 Ray-Trace | FPU Julia | CPU SHA3 | CPU Queen | FPU SinJulia | FPU Mandel | CPU AES | CPU ZLib | FP64 Ray-Trace | CPU PhotoWorxx
| Performance rating | |
| Moyenne Intel Core i7-12850HX | |
| HP ZBook Fury 15 G8 | |
| Lenovo ThinkPad P1 G4-20Y4Z9DVUS | |
| Dell Precision 7670 | |
| Asus ProArt StudioBook 16 W7600H5A-2BL2 -9! | |
| Dell Precision 5000 5560 -9! | |
| AIDA64 / FP32 Ray-Trace | |
| Lenovo ThinkPad P1 G4-20Y4Z9DVUS | |
| Moyenne Intel Core i7-12850HX (12983 - 16752, n=2) | |
| HP ZBook Fury 15 G8 | |
| Dell Precision 7670 | |
| AIDA64 / FPU Julia | |
| Moyenne Intel Core i7-12850HX (68219 - 87231, n=2) | |
| Dell Precision 7670 | |
| Lenovo ThinkPad P1 G4-20Y4Z9DVUS | |
| HP ZBook Fury 15 G8 | |
| AIDA64 / CPU SHA3 | |
| Lenovo ThinkPad P1 G4-20Y4Z9DVUS | |
| HP ZBook Fury 15 G8 | |
| Moyenne Intel Core i7-12850HX (3098 - 3818, n=2) | |
| Dell Precision 7670 | |
| AIDA64 / CPU Queen | |
| HP ZBook Fury 15 G8 | |
| Lenovo ThinkPad P1 G4-20Y4Z9DVUS | |
| Moyenne Intel Core i7-12850HX (26716 - 95664, n=2) | |
| Dell Precision 7670 | |
| AIDA64 / FPU SinJulia | |
| Moyenne Intel Core i7-12850HX (9869 - 11286, n=2) | |
| HP ZBook Fury 15 G8 | |
| Dell Precision 7670 | |
| Lenovo ThinkPad P1 G4-20Y4Z9DVUS | |
| AIDA64 / FPU Mandel | |
| Moyenne Intel Core i7-12850HX (34218 - 42580, n=2) | |
| Lenovo ThinkPad P1 G4-20Y4Z9DVUS | |
| HP ZBook Fury 15 G8 | |
| Dell Precision 7670 | |
| AIDA64 / CPU AES | |
| Lenovo ThinkPad P1 G4-20Y4Z9DVUS | |
| HP ZBook Fury 15 G8 | |
| Moyenne Intel Core i7-12850HX (63362 - 80775, n=2) | |
| Dell Precision 7670 | |
| AIDA64 / CPU ZLib | |
| Moyenne Intel Core i7-12850HX (817 - 1102, n=2) | |
| Dell Precision 7670 | |
| Lenovo ThinkPad P1 G4-20Y4Z9DVUS | |
| HP ZBook Fury 15 G8 | |
| Asus ProArt StudioBook 16 W7600H5A-2BL2 | |
| Asus ProArt StudioBook 16 W7600H5A-2BL2 | |
| Dell Precision 5000 5560 | |
| AIDA64 / FP64 Ray-Trace | |
| Moyenne Intel Core i7-12850HX (7671 - 9145, n=2) | |
| Lenovo ThinkPad P1 G4-20Y4Z9DVUS | |
| HP ZBook Fury 15 G8 | |
| Dell Precision 7670 | |
| AIDA64 / CPU PhotoWorxx | |
| Dell Precision 7670 | |
| Moyenne Intel Core i7-12850HX (33415 - 42035, n=2) | |
| HP ZBook Fury 15 G8 | |
| Lenovo ThinkPad P1 G4-20Y4Z9DVUS | |
Performance du système
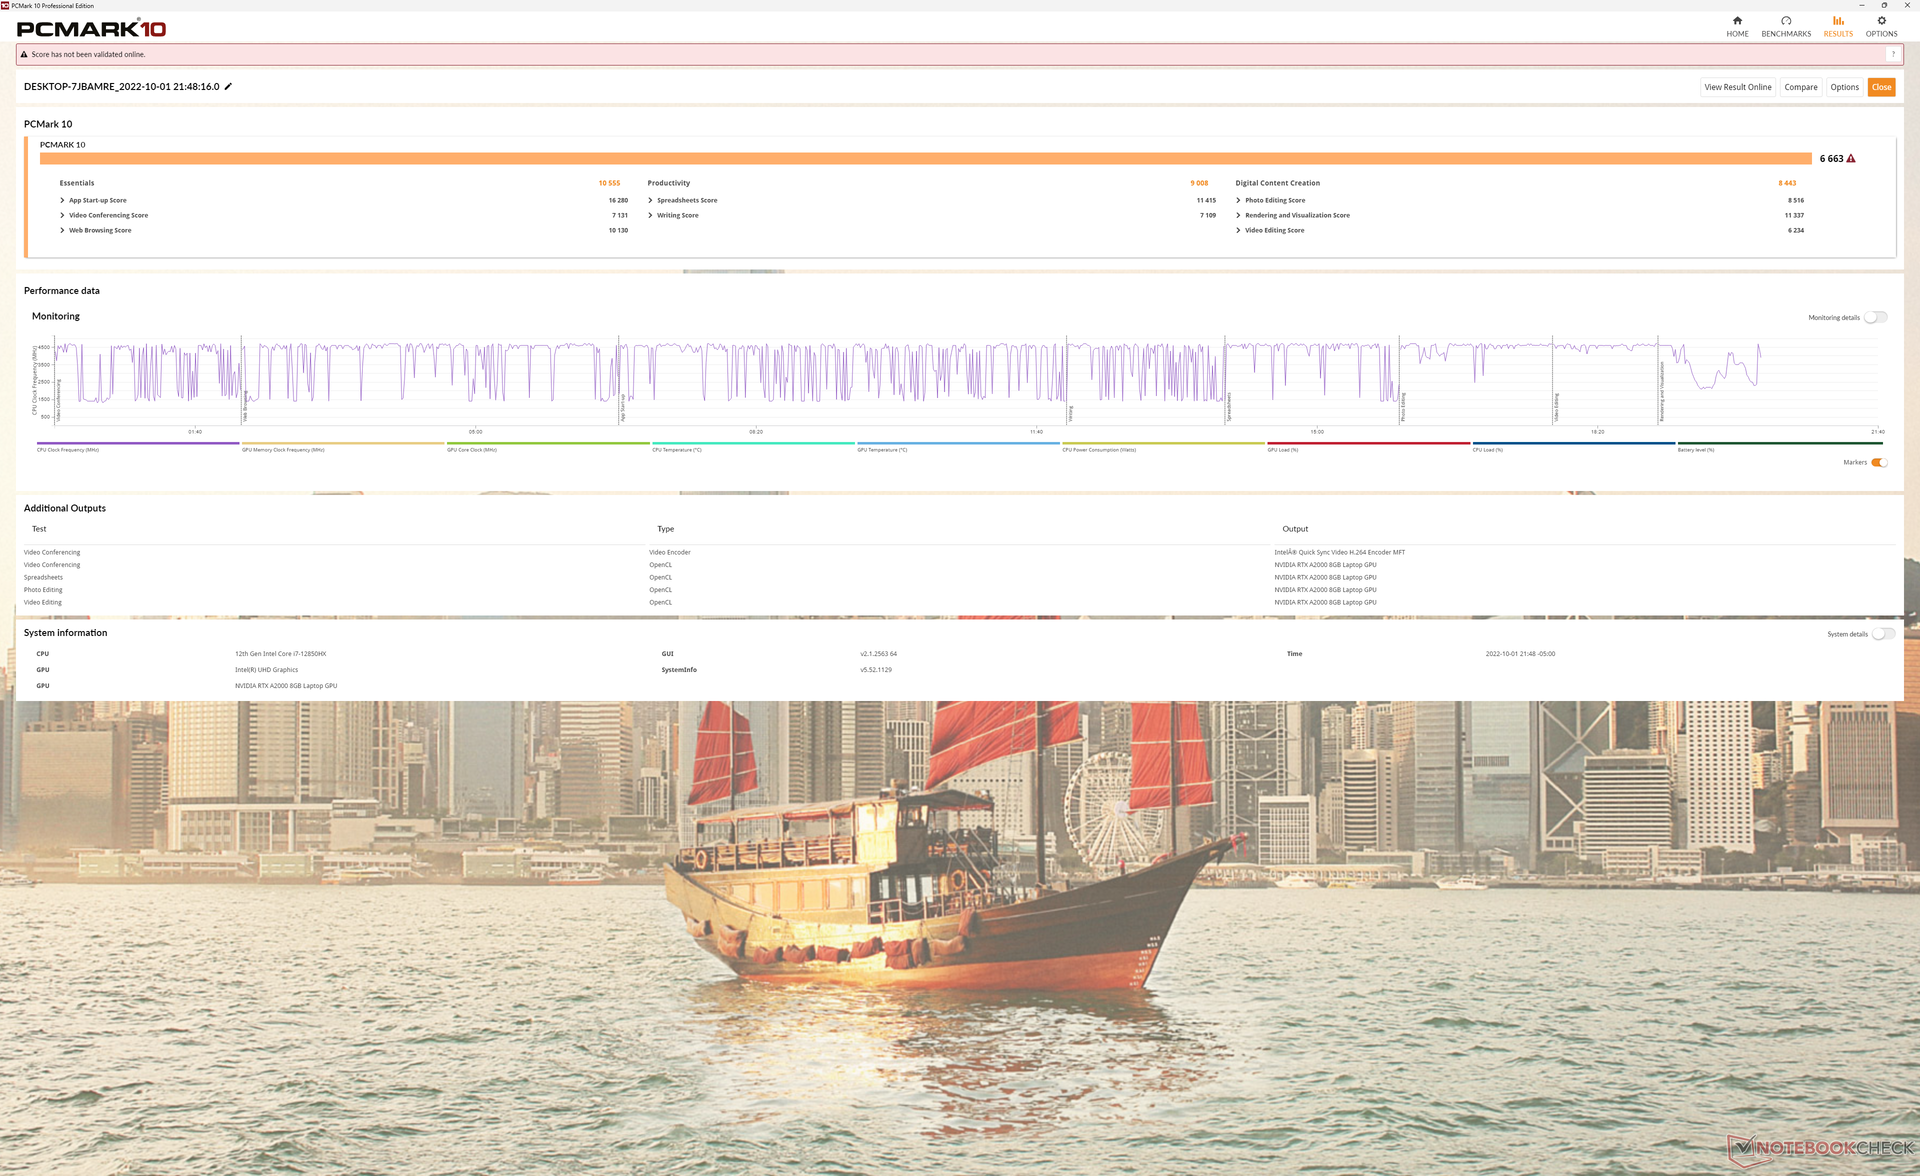
Les résultats de PCMark 10 sont similaires à ceux d'autres stations de travail équipées de processeurs Core série H et de GPU Nvidia Quadro. Les modèles équipés de la RTX A5000 plus rapide, comme le HP ZBook Fury 15 G8, surpassent toujours notre unité de test Precision 7670 dans les benchmarks utilisant beaucoup de GPU, comme la création de contenu numérique.
CrossMark: Overall | Productivity | Creativity | Responsiveness
| PCMark 10 / Score | |
| Asus ProArt StudioBook 16 W7600H5A-2BL2 | |
| HP ZBook Fury 15 G8 | |
| Dell Precision 5000 5560 | |
| Dell Precision 7670 | |
| Lenovo ThinkPad P1 G4-20Y4Z9DVUS | |
| Dell Precision 7550 | |
| PCMark 10 / Essentials | |
| Dell Precision 5000 5560 | |
| Dell Precision 7670 | |
| Asus ProArt StudioBook 16 W7600H5A-2BL2 | |
| HP ZBook Fury 15 G8 | |
| Lenovo ThinkPad P1 G4-20Y4Z9DVUS | |
| Dell Precision 7550 | |
| PCMark 10 / Productivity | |
| Dell Precision 7670 | |
| Dell Precision 5000 5560 | |
| Asus ProArt StudioBook 16 W7600H5A-2BL2 | |
| HP ZBook Fury 15 G8 | |
| Lenovo ThinkPad P1 G4-20Y4Z9DVUS | |
| Dell Precision 7550 | |
| PCMark 10 / Digital Content Creation | |
| Asus ProArt StudioBook 16 W7600H5A-2BL2 | |
| HP ZBook Fury 15 G8 | |
| Dell Precision 5000 5560 | |
| Dell Precision 7670 | |
| Lenovo ThinkPad P1 G4-20Y4Z9DVUS | |
| Dell Precision 7550 | |
| CrossMark / Overall | |
| Lenovo ThinkPad P1 G4-20Y4Z9DVUS | |
| Dell Precision 7670 | |
| CrossMark / Productivity | |
| Lenovo ThinkPad P1 G4-20Y4Z9DVUS | |
| Dell Precision 7670 | |
| CrossMark / Creativity | |
| Dell Precision 7670 | |
| Lenovo ThinkPad P1 G4-20Y4Z9DVUS | |
| CrossMark / Responsiveness | |
| Lenovo ThinkPad P1 G4-20Y4Z9DVUS | |
| Dell Precision 7670 | |
| PCMark 10 Score | 6663 points | |
Aide | ||
| AIDA64 / Memory Copy | |
| Dell Precision 7670 | |
| HP ZBook Fury 15 G8 | |
| Lenovo ThinkPad P1 G4-20Y4Z9DVUS | |
| AIDA64 / Memory Read | |
| Dell Precision 7670 | |
| HP ZBook Fury 15 G8 | |
| Lenovo ThinkPad P1 G4-20Y4Z9DVUS | |
| AIDA64 / Memory Write | |
| Dell Precision 7670 | |
| HP ZBook Fury 15 G8 | |
| Lenovo ThinkPad P1 G4-20Y4Z9DVUS | |
| AIDA64 / Memory Latency | |
| HP ZBook Fury 15 G8 | |
| Dell Precision 7670 | |
| Lenovo ThinkPad P1 G4-20Y4Z9DVUS | |
| Asus ProArt StudioBook 16 W7600H5A-2BL2 | |
| Asus ProArt StudioBook 16 W7600H5A-2BL2 | |
* ... Moindre est la valeur, meilleures sont les performances
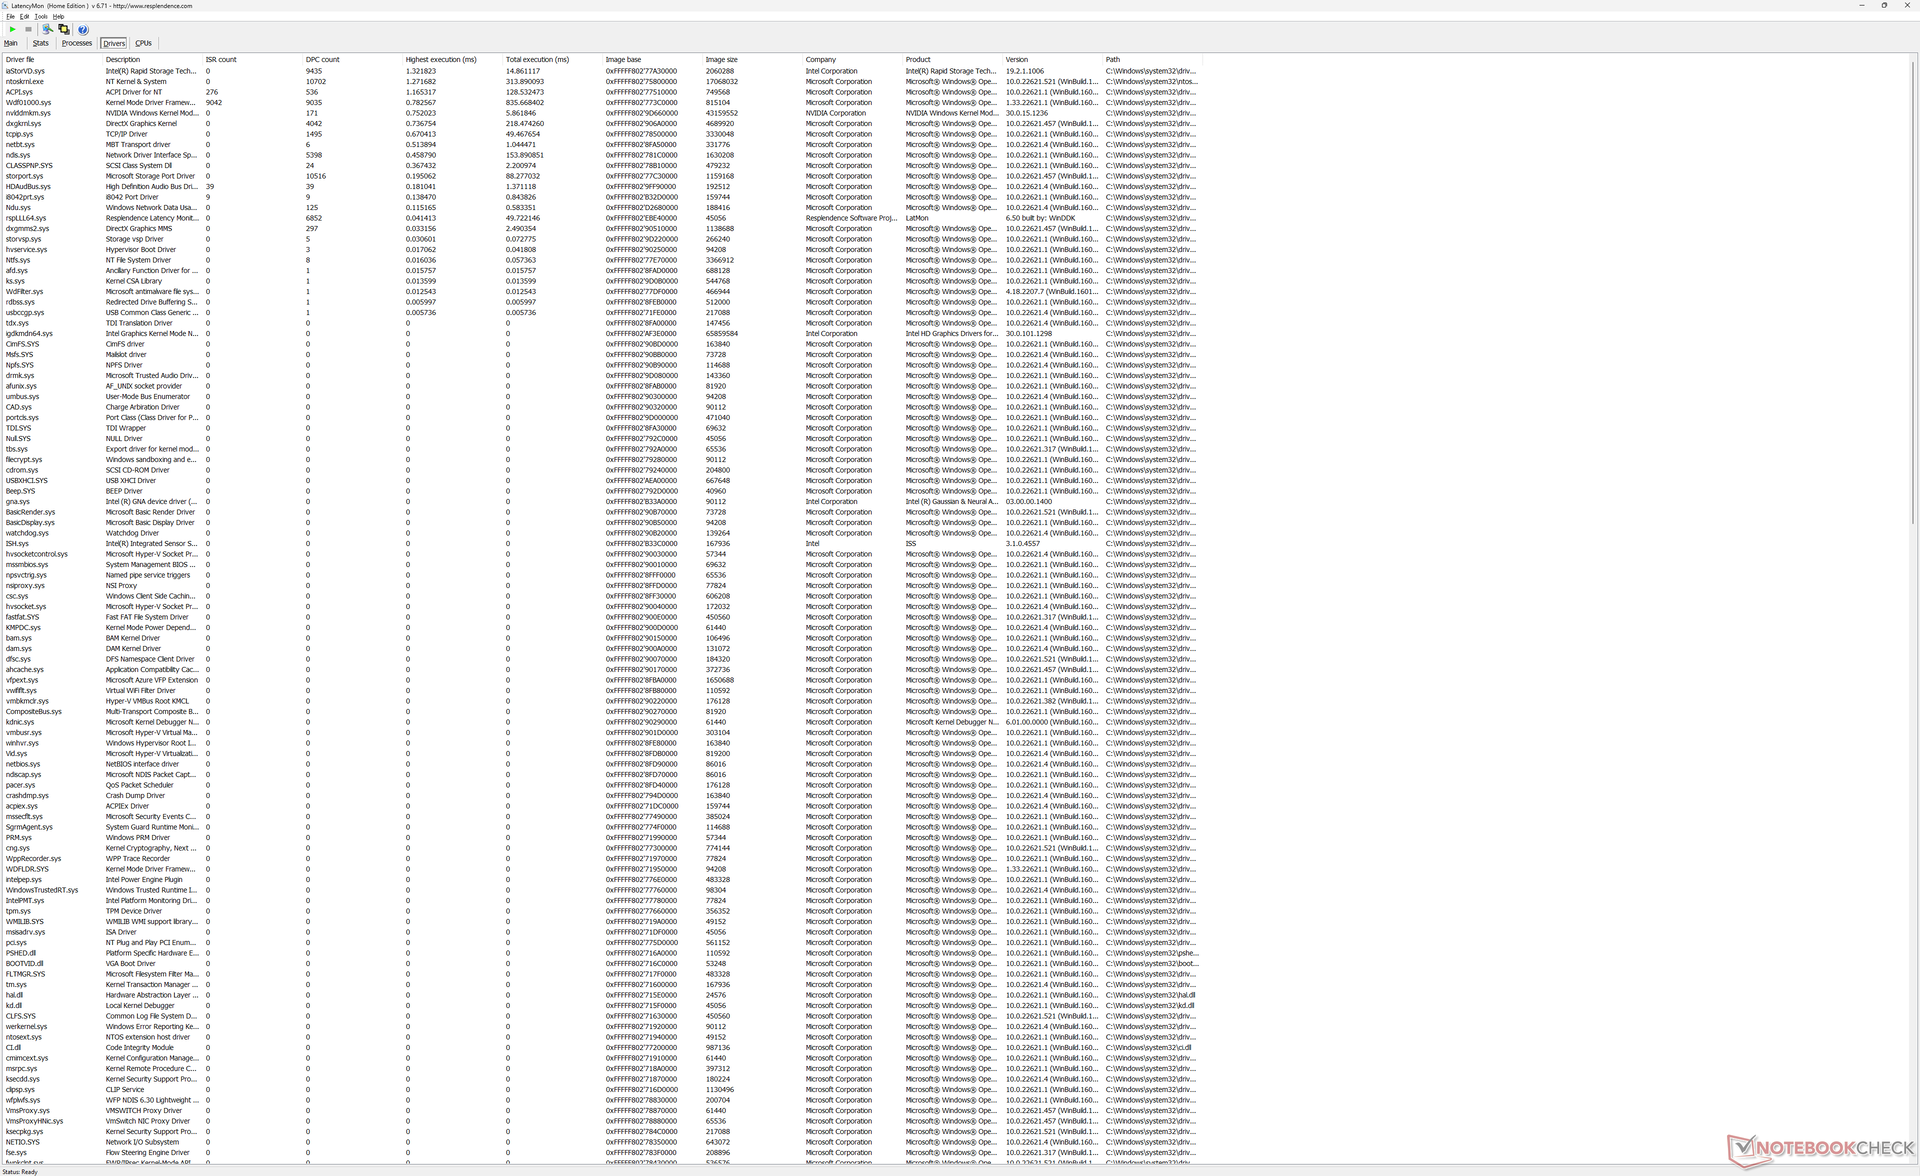
Latence DPC
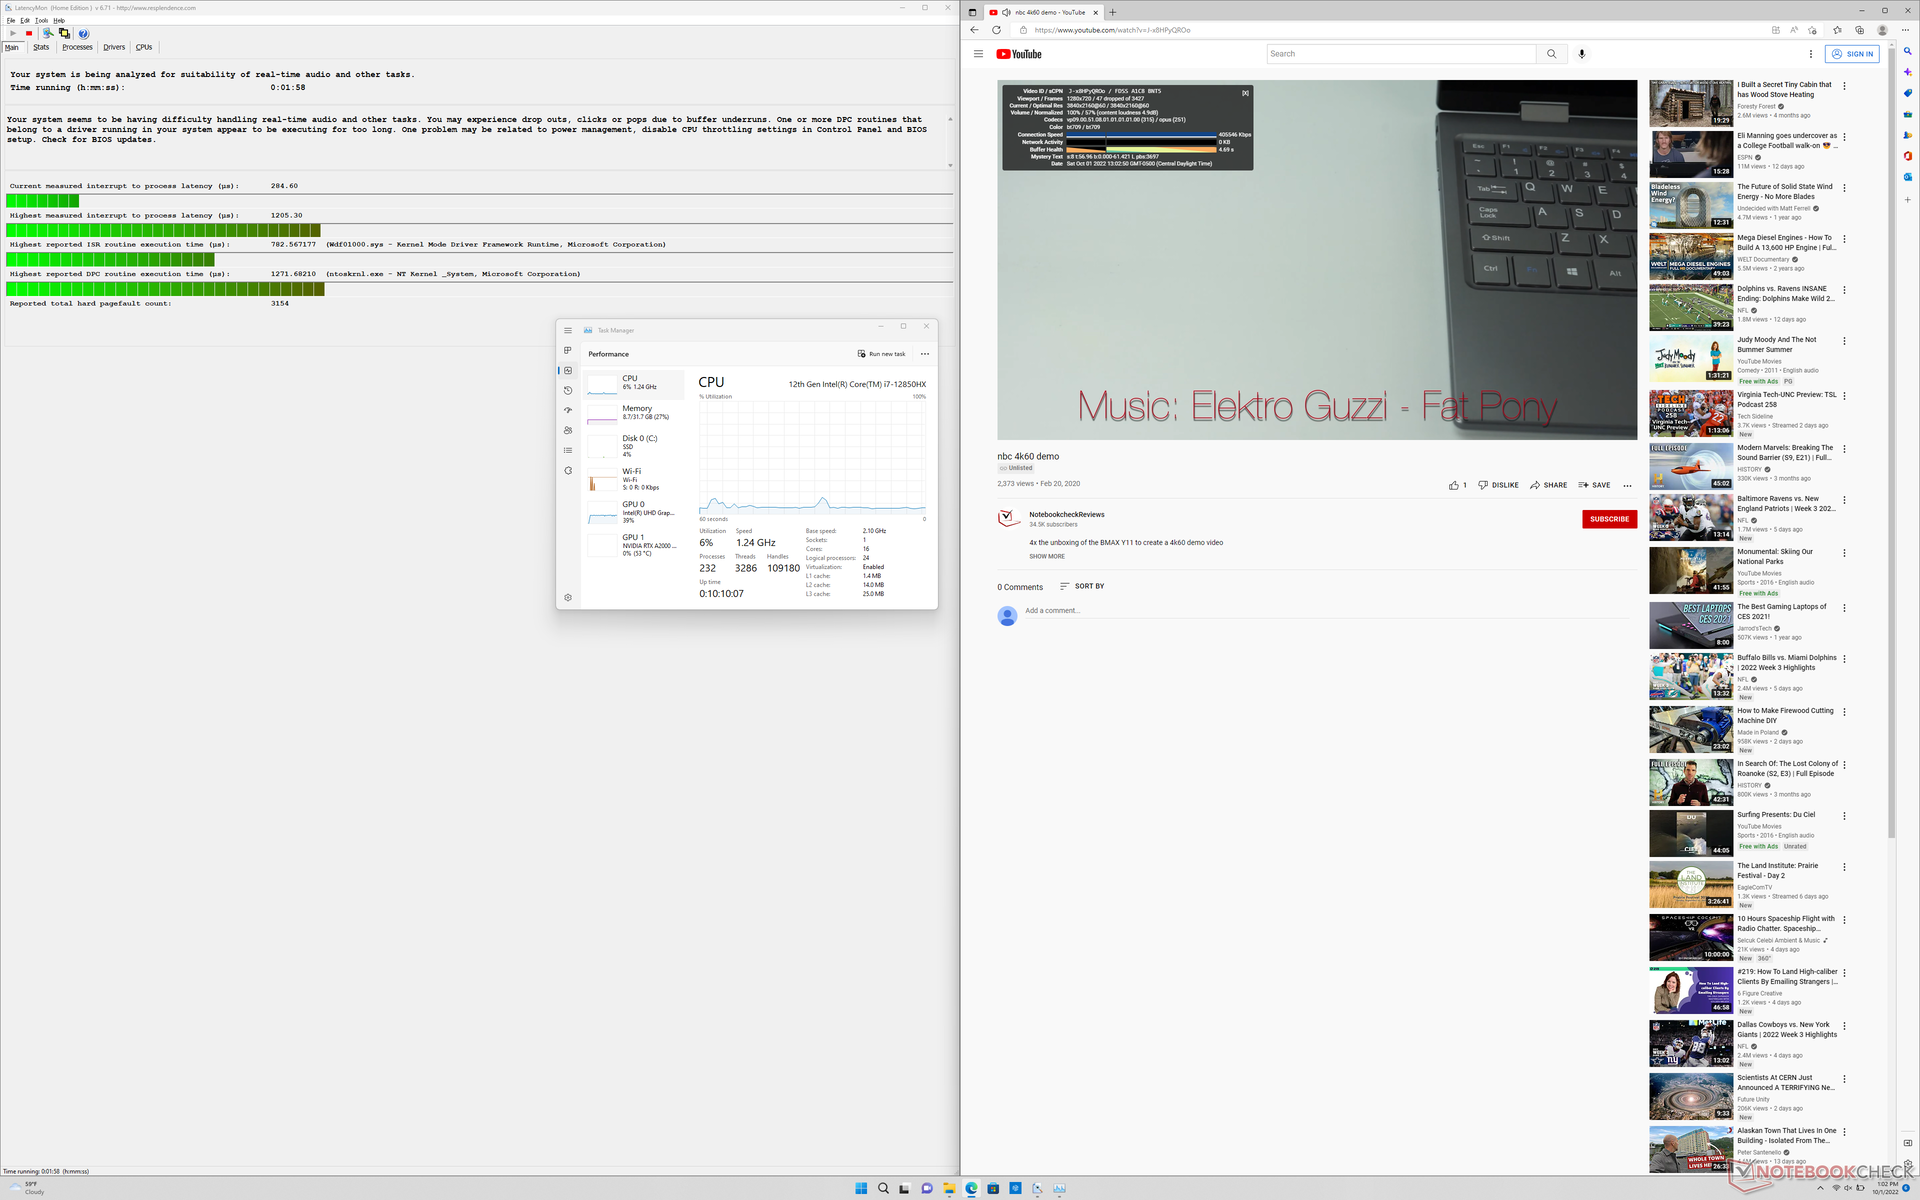
latencyMon révèle des problèmes mineurs de DPC lors de l'ouverture de plusieurs onglets de navigateur de notre page d'accueil. En outre, la lecture de vidéos 4K à 60 FPS est imparfaite avec 47 images perdues pendant notre vidéo de test d'une minute.
| DPC Latencies / LatencyMon - interrupt to process latency (max), Web, Youtube, Prime95 | |
| Dell Precision 7550 | |
| Asus ProArt StudioBook 16 W7600H5A-2BL2 | |
| Lenovo ThinkPad P1 G4-20Y4Z9DVUS | |
| Dell Precision 7670 | |
| Dell Precision 5000 5560 | |
| HP ZBook Fury 15 G8 | |
* ... Moindre est la valeur, meilleures sont les performances
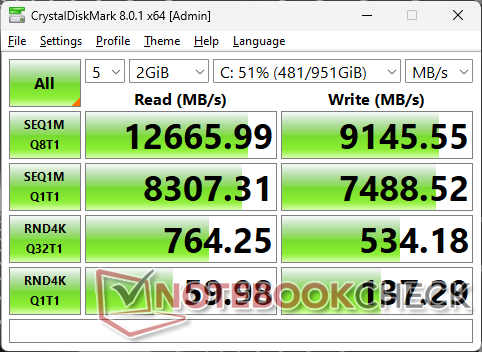
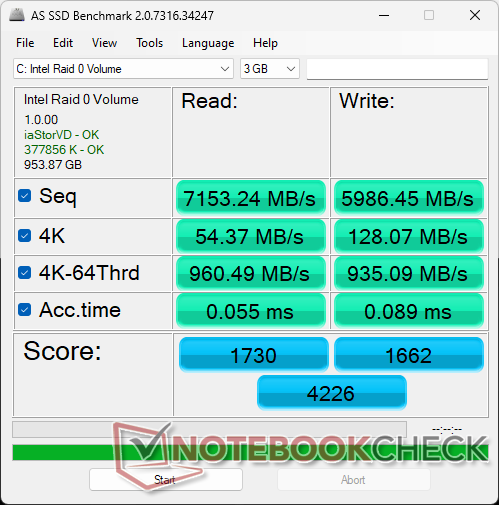
Périphériques de stockage - Vitesses folles avec PCIe4 x4 RAID 0
Toutes les configurations peuvent prendre en charge jusqu'à deux SSD M.2, et certaines jusqu'à trois. Notre unité de test spécifique est équipée de deux SK Hynix PC801 PCIe4 x4 NVMe SSD en RAID 0 pour des taux de lecture et d'écriture séquentiels de près de 13000 Mo/s et 9200 Mo/s, respectivement. Lorsqu'ils étaient sollicités sous DiskSpd, les disques ne montraient aucun signe d'étranglement des performances, même après de longues périodes. Les SSD inclus sont équipés de dissipateurs thermiques ou de coussins thermiques pour faciliter la dissipation de la chaleur.

| Drive Performance rating - Percent | |
| Dell Precision 5000 5560 | |
| Dell Precision 7670 | |
| Lenovo ThinkPad P1 G4-20Y4Z9DVUS | |
| Asus ProArt StudioBook 16 W7600H5A-2BL2 | |
| HP ZBook Fury 15 G8 | |
| Dell Precision 7550 | |
* ... Moindre est la valeur, meilleures sont les performances
Disk Throttling: DiskSpd Read Loop, Queue Depth 8
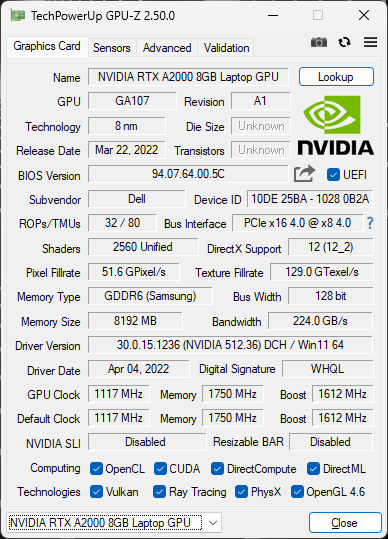
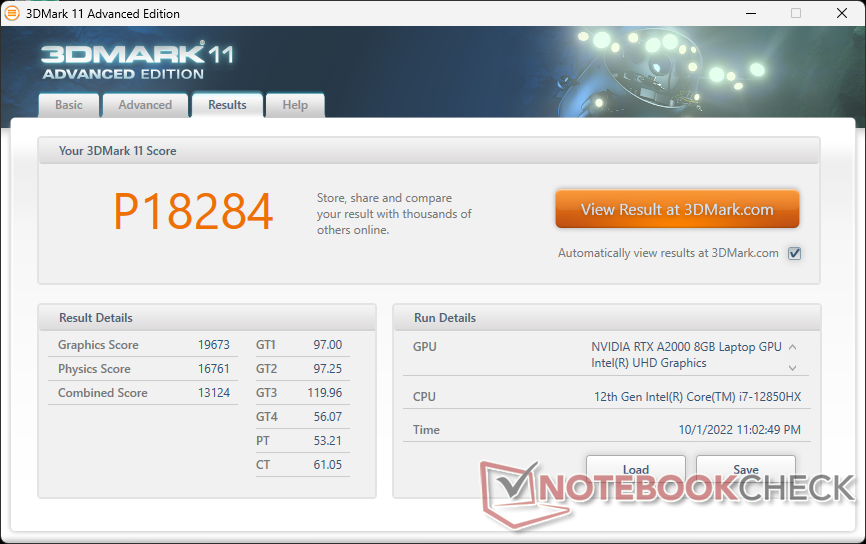
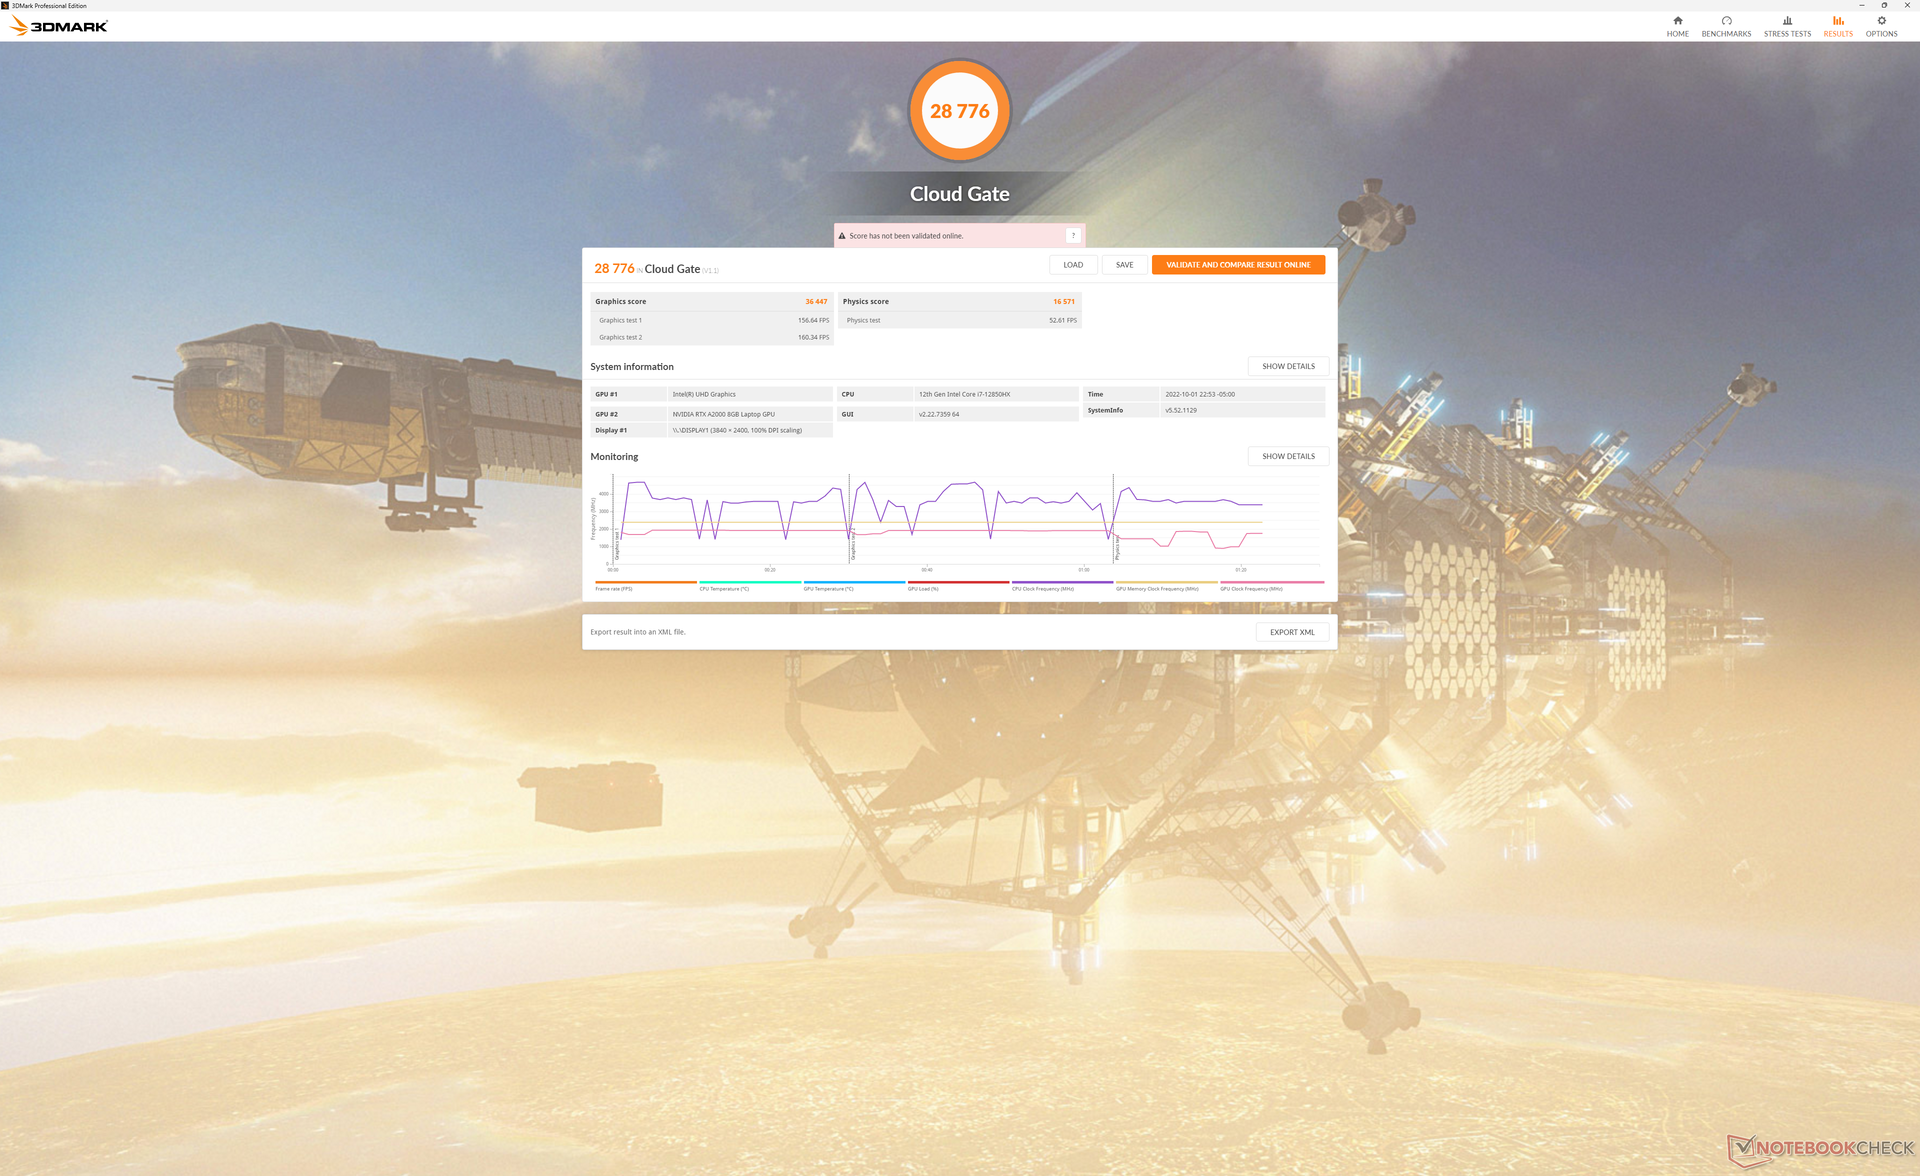
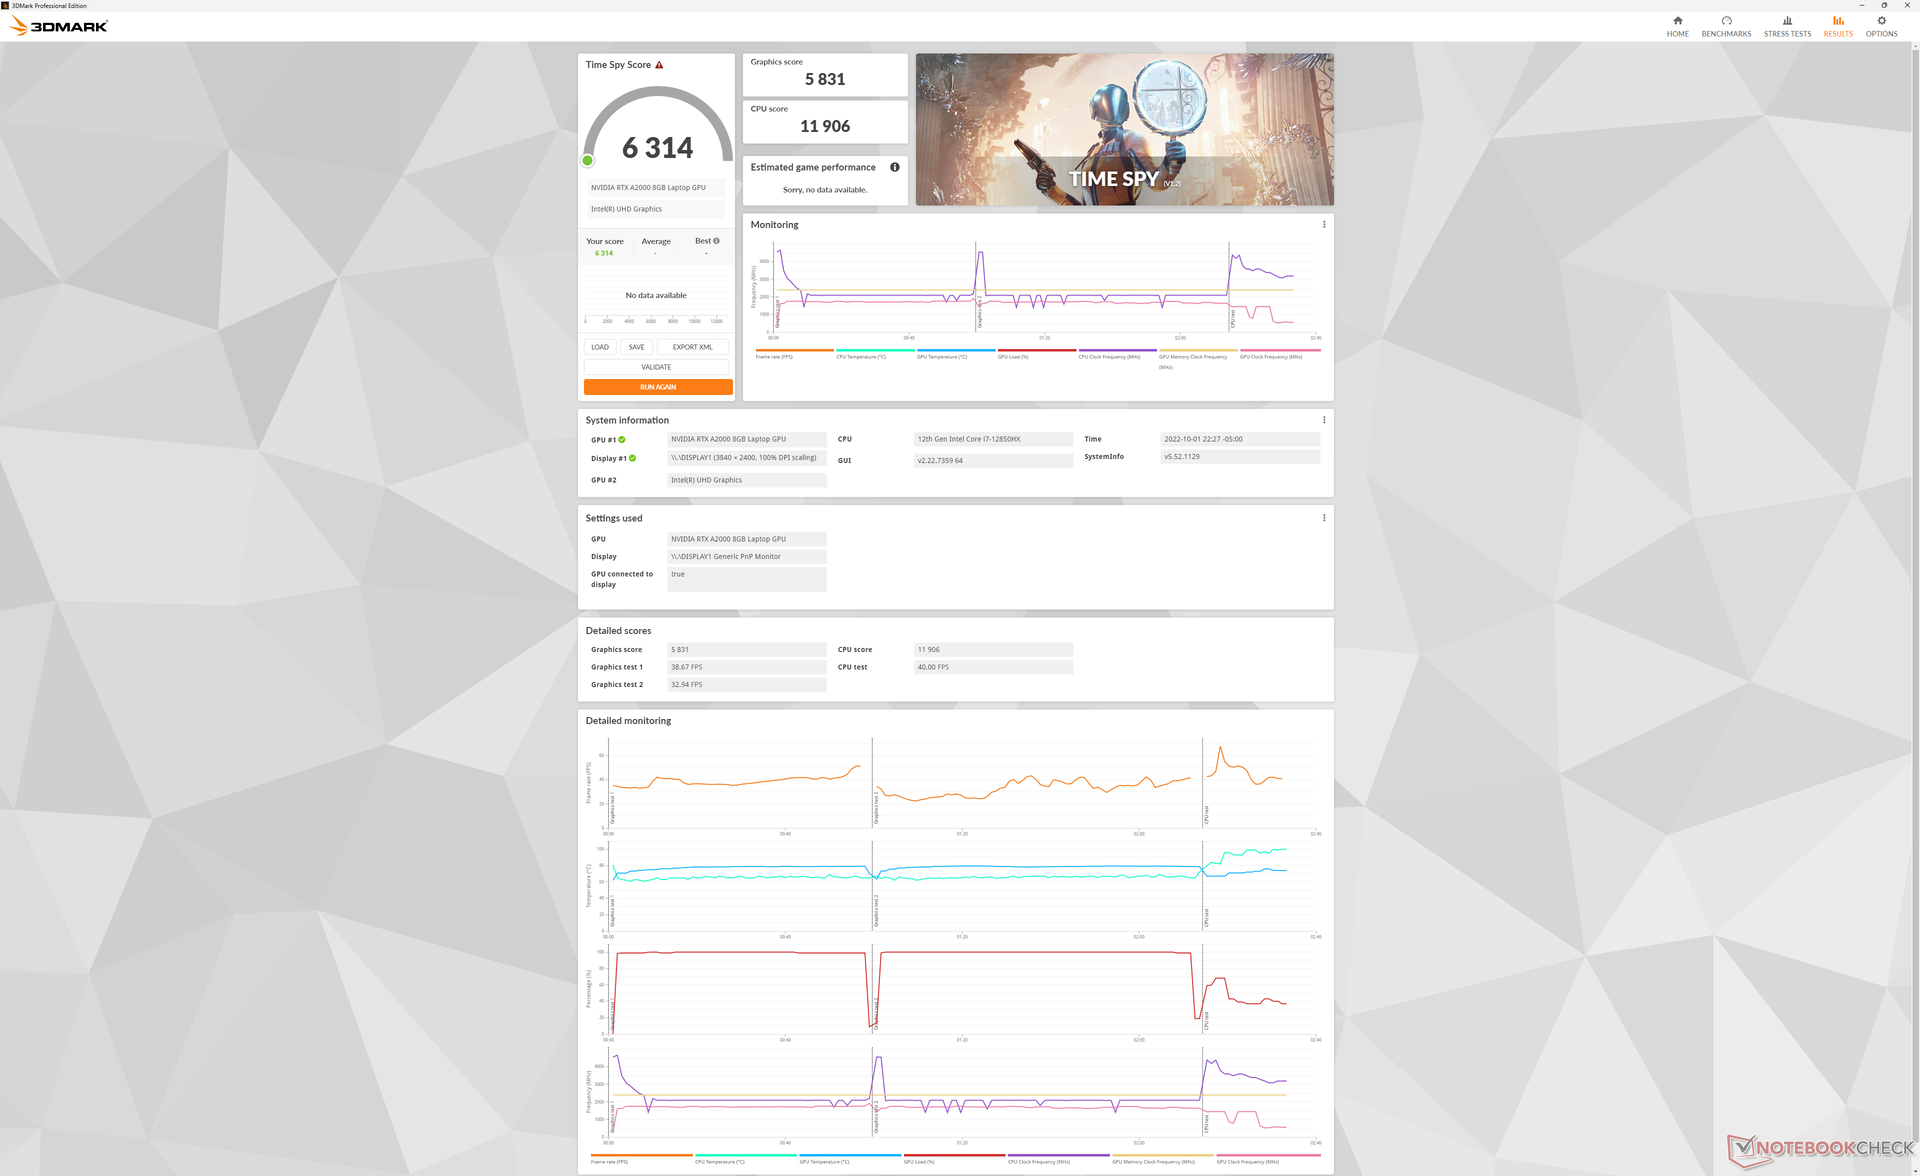
Performances du GPU - 95 W TGP Graphics
Le site RTX A2000 est dérivée de la GeForce RTX 3050 Ti et les deux GPU partagent donc des performances brutes similaires. La mise à niveau vers le RTX A3000 ou RTX A5500 devrait permettre d'augmenter les performances de 15 à 20 % et de 70 à 90 %, respectivement.
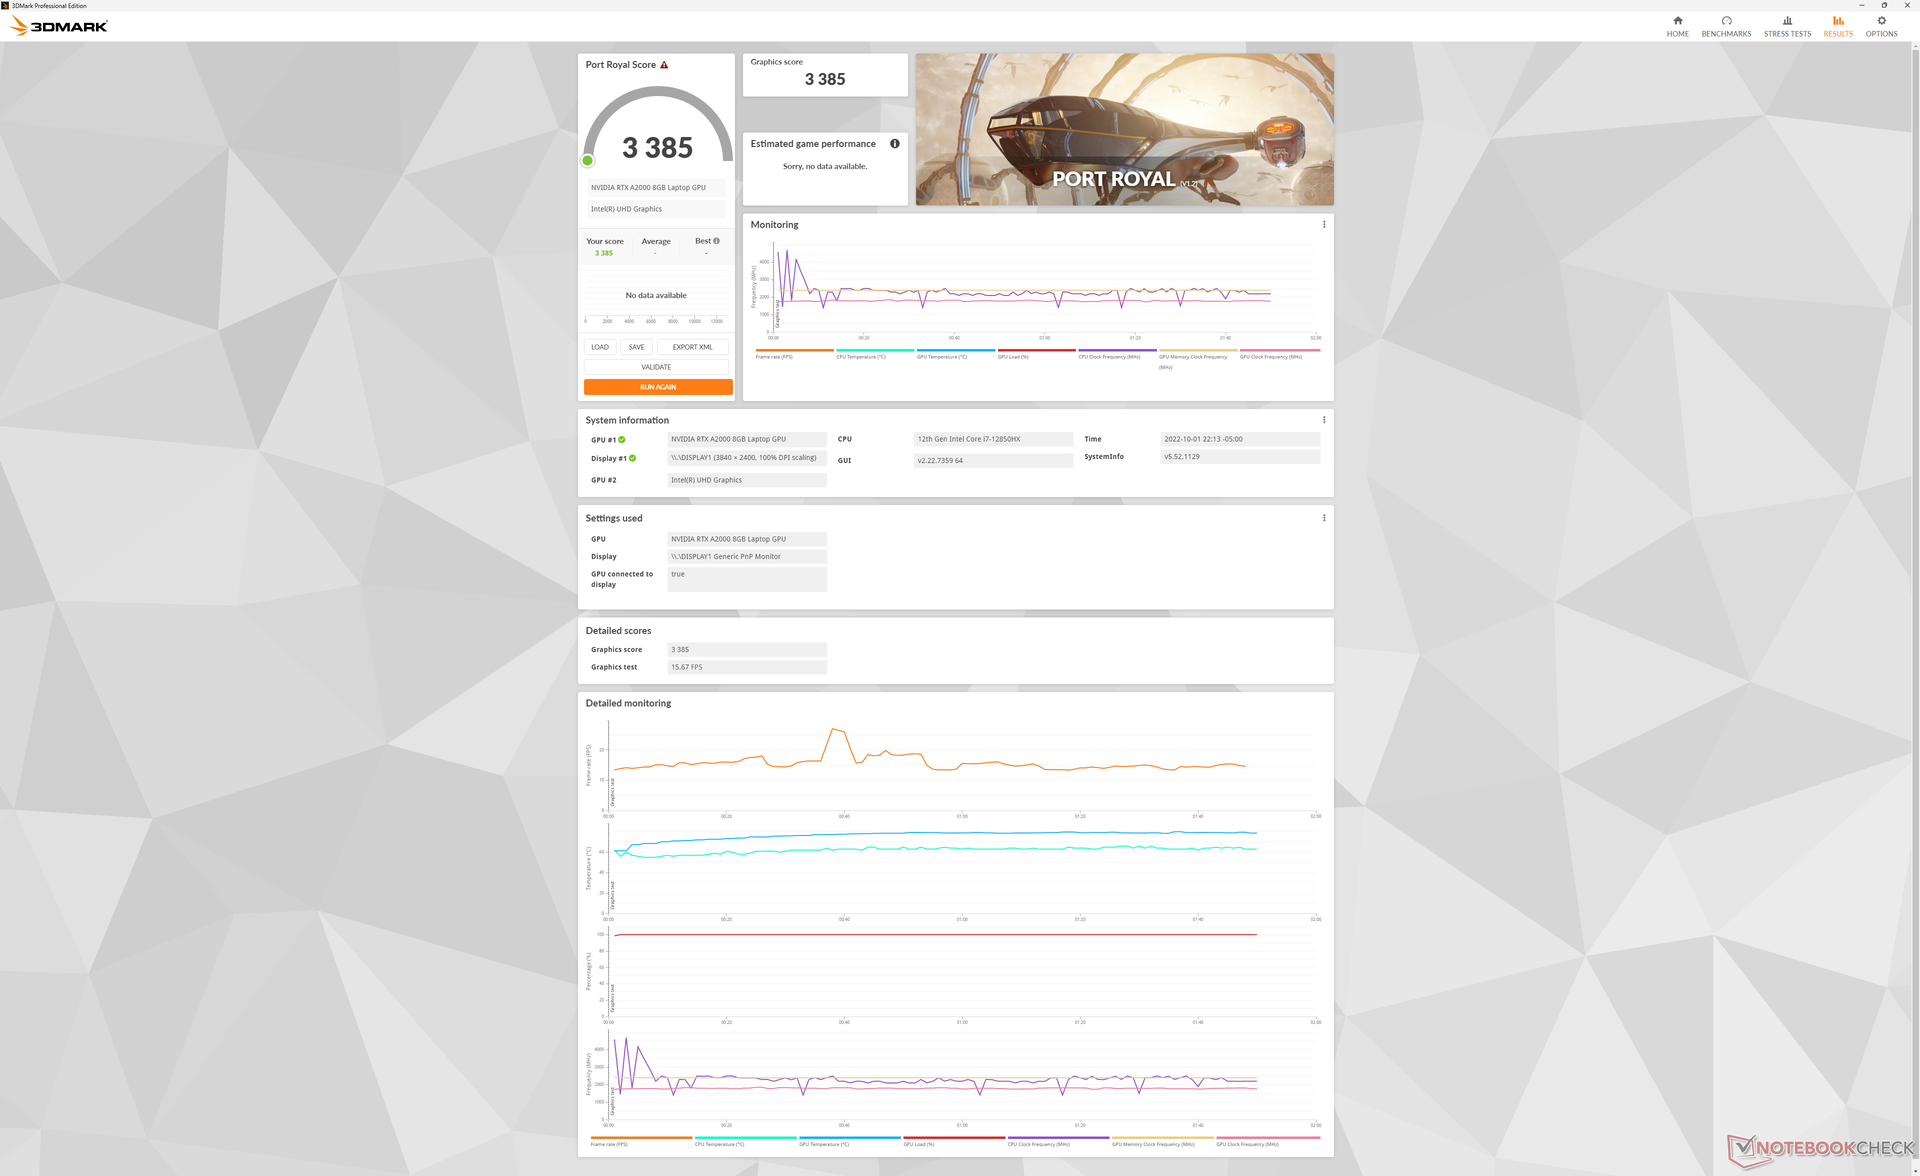
Il est intéressant de noter que les performances de ray-tracing de Port Royal sont nettement meilleures que celles que nous avons enregistrées sur l'ancien modèlePrecision 5560 même s'ils partagent le même GPU RTX A2000. Nous pensons que cela pourrait être dû à la fois à la cible TGP beaucoup plus élevée (95 W contre 45 W) et au pilote Nvidia plus récent (512.36 contre 472.12) de notre Precision 7670.
| 3DMark 11 - 1280x720 Performance GPU | |
| MSI GE67 HX 12UGS | |
| HP ZBook Fury 15 G8 | |
| HP Envy 16 h0112nr | |
| Dell Precision 7550 | |
| HP ZBook Fury 17 G8-4A6A9EA | |
| Dell Precision 7670 | |
| Moyenne NVIDIA RTX A2000 Laptop GPU (14831 - 19823, n=9) | |
| Asus Zenbook Pro 15 OLED UM535Q | |
| Dell Precision 5000 5560 | |
| Dell Precision 5000 5470 | |
| Lenovo ThinkPad P1 G4-20Y4Z9DVUS | |
| 3DMark 11 Performance | 18284 points | |
| 3DMark Cloud Gate Standard Score | 28776 points | |
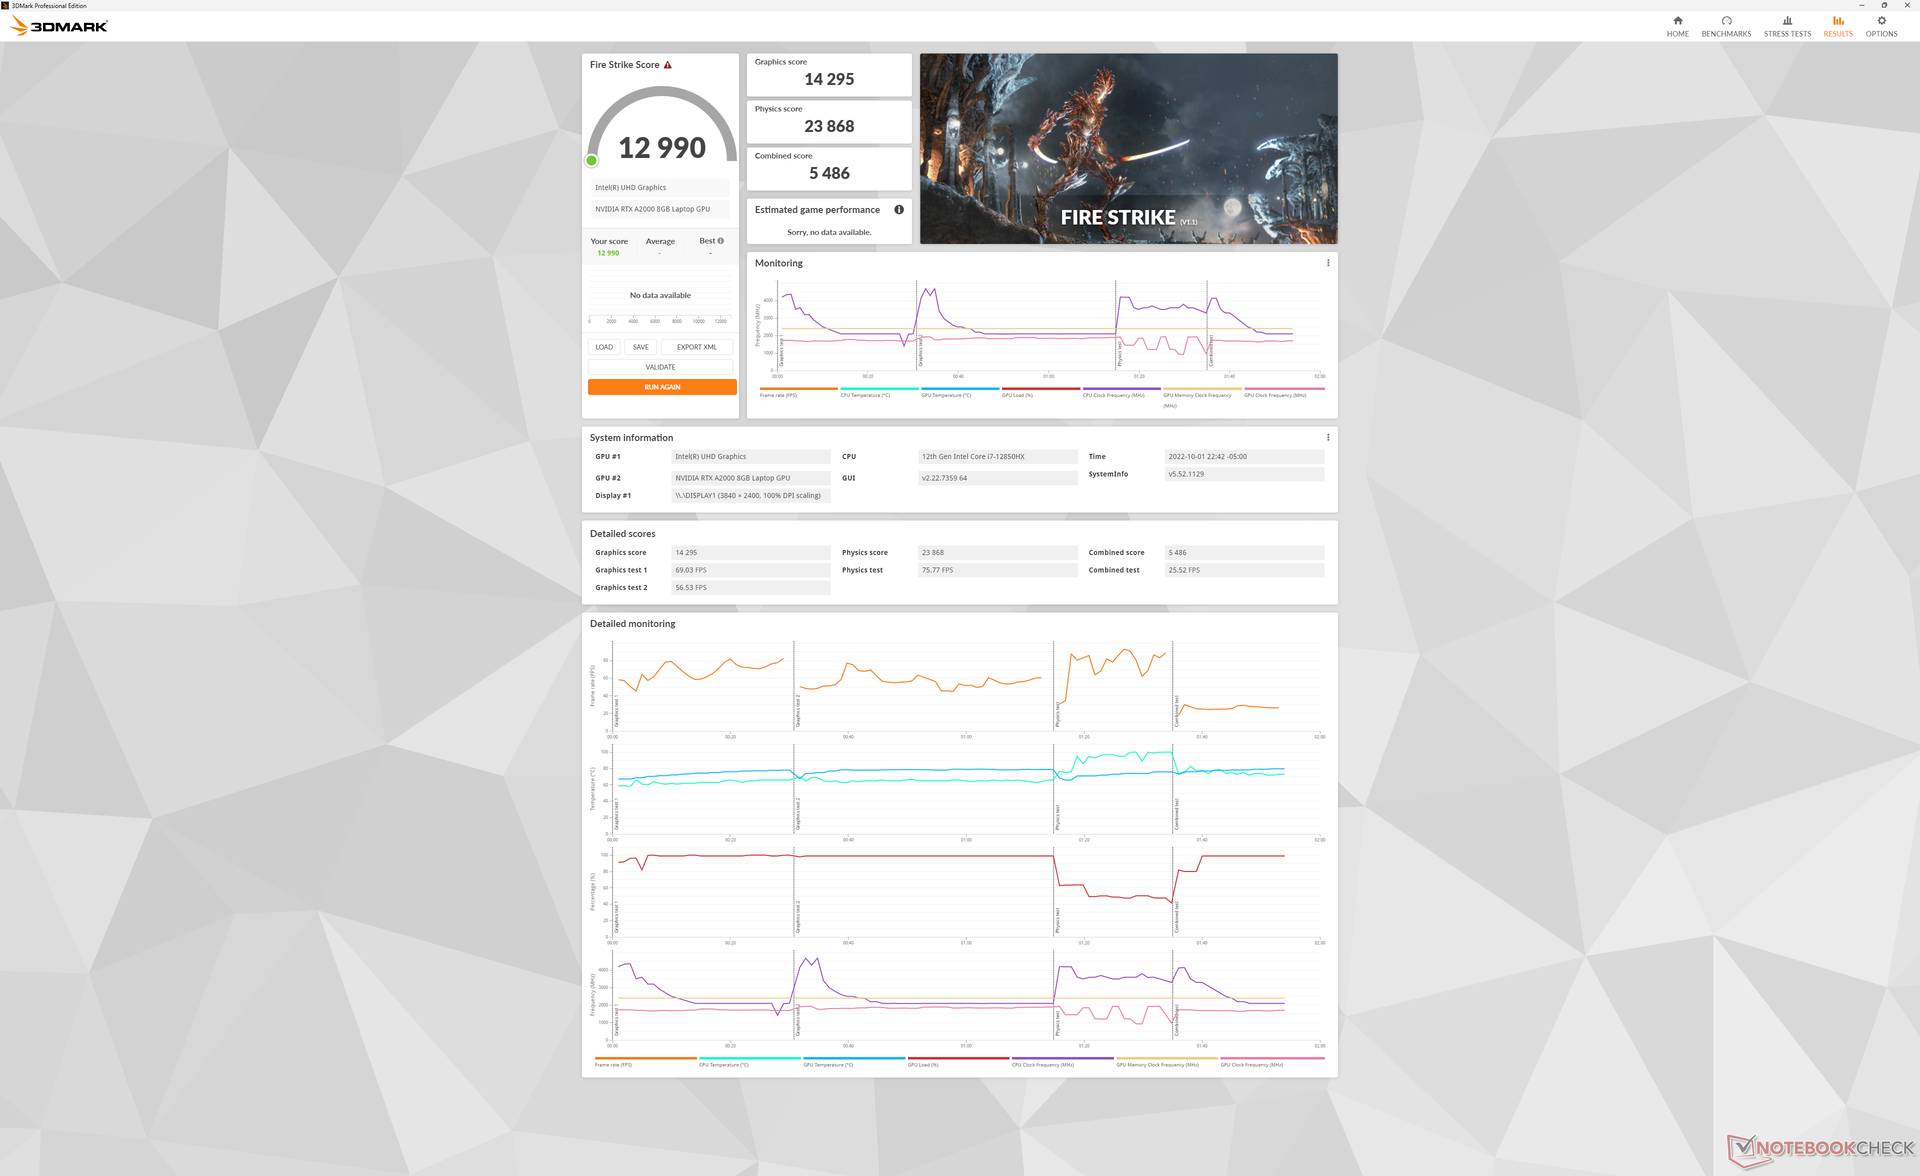
| 3DMark Fire Strike Score | 12990 points | |
| 3DMark Time Spy Score | 6314 points | |
Aide | ||
| Blender | |
| v3.3 Classroom HIP/AMD | |
| Lenovo Legion 7 16ARHA7 | |
| v3.3 Classroom OPTIX/RTX | |
| Dell Precision 5000 5470 | |
| HP Envy 16 h0112nr | |
| Dell Precision 7670 | |
| v3.3 Classroom CUDA | |
| Dell Precision 5000 5470 | |
| HP Envy 16 h0112nr | |
| Dell Precision 7670 | |
| v3.3 Classroom CPU | |
| HP Envy 16 h0112nr | |
| Dell Precision 5000 5470 | |
| Lenovo Legion 7 16ARHA7 | |
| Dell Precision 7670 | |
* ... Moindre est la valeur, meilleures sont les performances
Witcher 3 FPS Chart
| Bas | Moyen | Élevé | Ultra | QHD | 4K | |
|---|---|---|---|---|---|---|
| GTA V (2015) | 181.7 | 177.6 | 155.1 | 79.1 | 57.1 | |
| The Witcher 3 (2015) | 297.1 | 181.7 | 108.6 | 57.4 | ||
| Dota 2 Reborn (2015) | 180.8 | 159.3 | 145.1 | 128.8 | 78.5 | |
| Final Fantasy XV Benchmark (2018) | 129.5 | 80.4 | 60.6 | 44.4 | 26 | |
| X-Plane 11.11 (2018) | 135.2 | 104.1 | 85.5 | 55.1 | ||
| Strange Brigade (2018) | 325 | 151.2 | 120.9 | 103.5 | 76.8 | |
| Cyberpunk 2077 1.6 (2022) | 78.5 | 65.1 | 55 | 44.3 | 27.4 |
Émissions
Bruit du système
Les ventilateurs ne sont presque jamais silencieux, même lorsqu'ils tournent au ralenti sur le bureau, mais ils sont néanmoins silencieux et difficiles à remarquer en cas de faible charge. Attendez-vous à ce que les niveaux sonores restent inférieurs à 28 dB(A) contre un fond silencieux de 22,7 dB(A) pendant la lecture de vidéos. Le bruit du ventilateur est encore plus silencieux à 24,5 dB(A) en cas de navigation sur le Web ou de traitement de texte, ce qui est similaire à ce que nous avons observé sur les ZBook Fury 15 G8 ou Precision 5560
Les niveaux de bruit augmentent un peu rapidement lorsque des charges plus élevées sont introduites. La première scène de benchmark de 3DMark 06, par exemple, causerait le bruit de ventilateur à aussi haut que 49 dB(A) même quand réglé au profil de puissance équilibré. Le bruit du ventilateur culmine à environ 52 dB(A) en cas d'exécution de charges extrêmes comme Prime95 et FurMark, comme sur le Precision 5560. En d'autres termes, le Precision 7670 fonctionne silencieusement dans la plupart des conditions, mais il devient assez bruyant dès que l'on introduit un peu de stress.
Degré de la nuisance sonore
| Au repos |
| 22.9 / 22.9 / 24.5 dB(A) |
| Fortement sollicité |
| 48.7 / 52.1 dB(A) |
 | ||
30 dB silencieux 40 dB(A) audible 50 dB(A) bruyant |
||
min: | ||
| Dell Precision 7670 RTX A2000 Laptop GPU, i7-12850HX, SK Hynix HFS001TEJ9X115N | Lenovo ThinkPad P1 G4-20Y4Z9DVUS T1200 Laptop GPU, i7-11800H, Samsung PM9A1 MZVL2512HCJQ | Asus ProArt StudioBook 16 W7600H5A-2BL2 RTX A5000 Laptop GPU, W-11955M, 2x Micron 2300 2TB MTFDHBA2T0TDV (RAID 0) | Dell Precision 5000 5560 RTX A2000 Laptop GPU, i7-11850H, Samsung PM9A1 MZVL22T0HBLB | Dell Precision 7550 Quadro RTX 5000 Max-Q, W-10885M, SK Hynix PC601A NVMe 1TB | HP ZBook Fury 15 G8 RTX A5000 Laptop GPU, i9-11950H, Samsung PM981a MZVLB1T0HBLR | |
|---|---|---|---|---|---|---|
| Noise | -3% | -3% | 11% | -9% | 3% | |
| arrêt / environnement * (dB) | 22.7 | 24.3 -7% | 26 -15% | 23.4 -3% | 25.8 -14% | 24.1 -6% |
| Idle Minimum * (dB) | 22.9 | 24.3 -6% | 26 -14% | 23.6 -3% | 25.8 -13% | 24.1 -5% |
| Idle Average * (dB) | 22.9 | 24.3 -6% | 26 -14% | 23.6 -3% | 25.8 -13% | 24.1 -5% |
| Idle Maximum * (dB) | 24.5 | 26.6 -9% | 26.5 -8% | 23.6 4% | 25.9 -6% | 24.8 -1% |
| Load Average * (dB) | 48.7 | 46.8 4% | 42 14% | 25.8 47% | 51.2 -5% | 37.8 22% |
| Witcher 3 ultra * (dB) | 45.2 | 46.8 -4% | 40.1 11% | 51.9 -15% | 44.2 2% | |
| Load Maximum * (dB) | 52.1 | 46.8 10% | 43 17% | 41.4 21% | 51.9 -0% | 44.2 15% |
* ... Moindre est la valeur, meilleures sont les performances
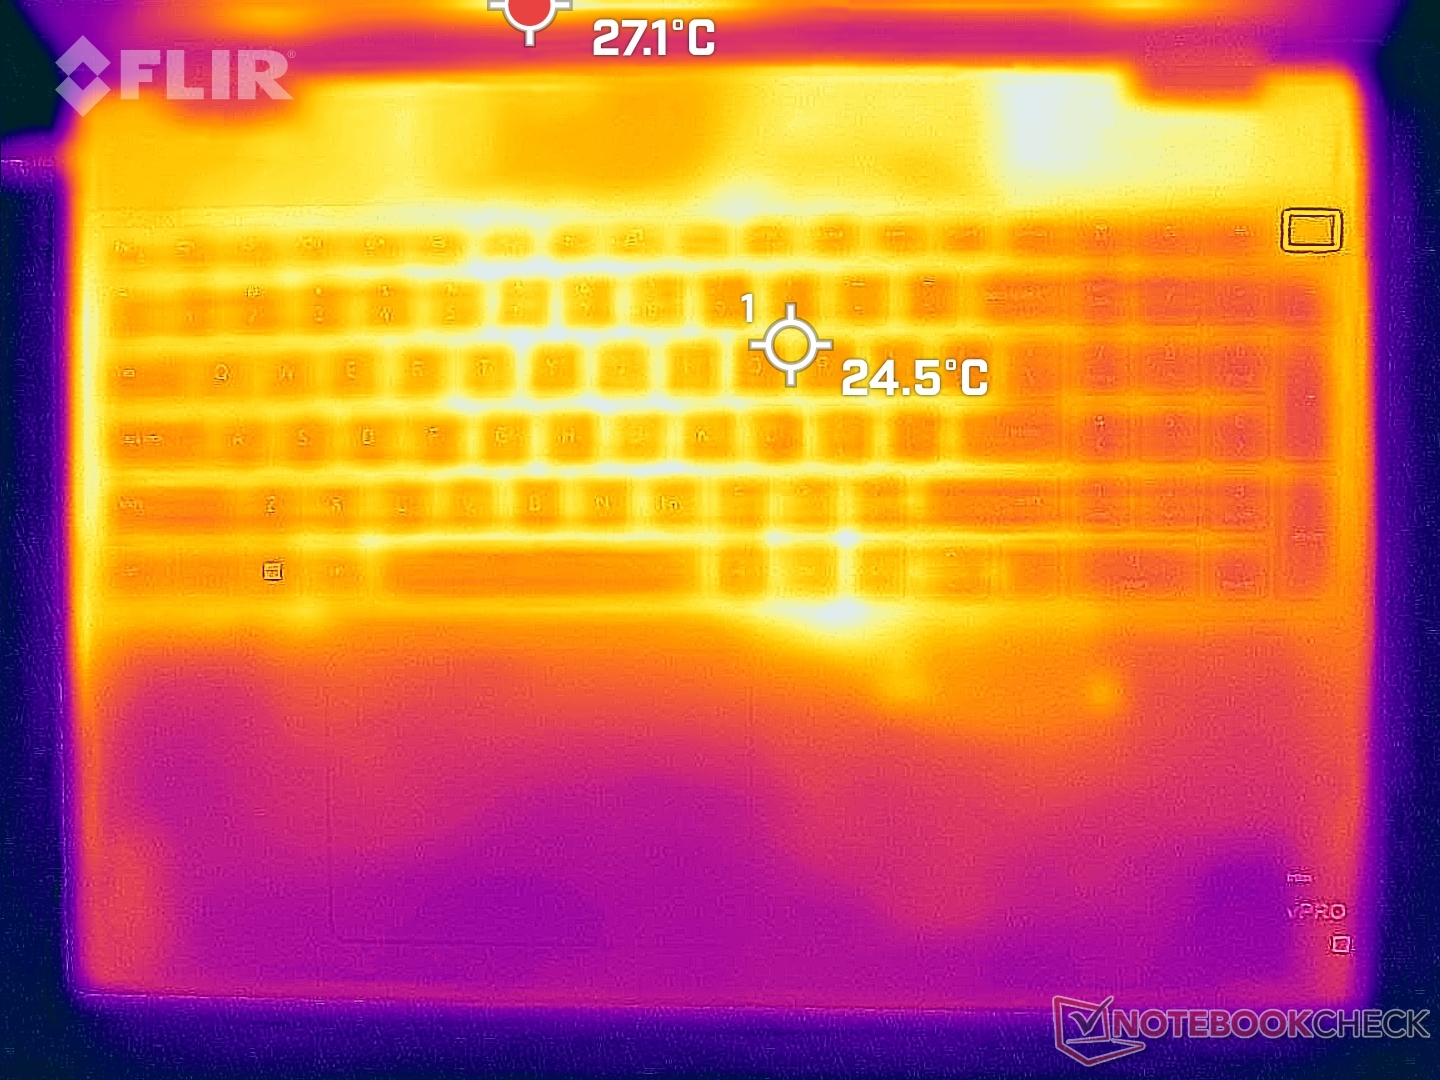
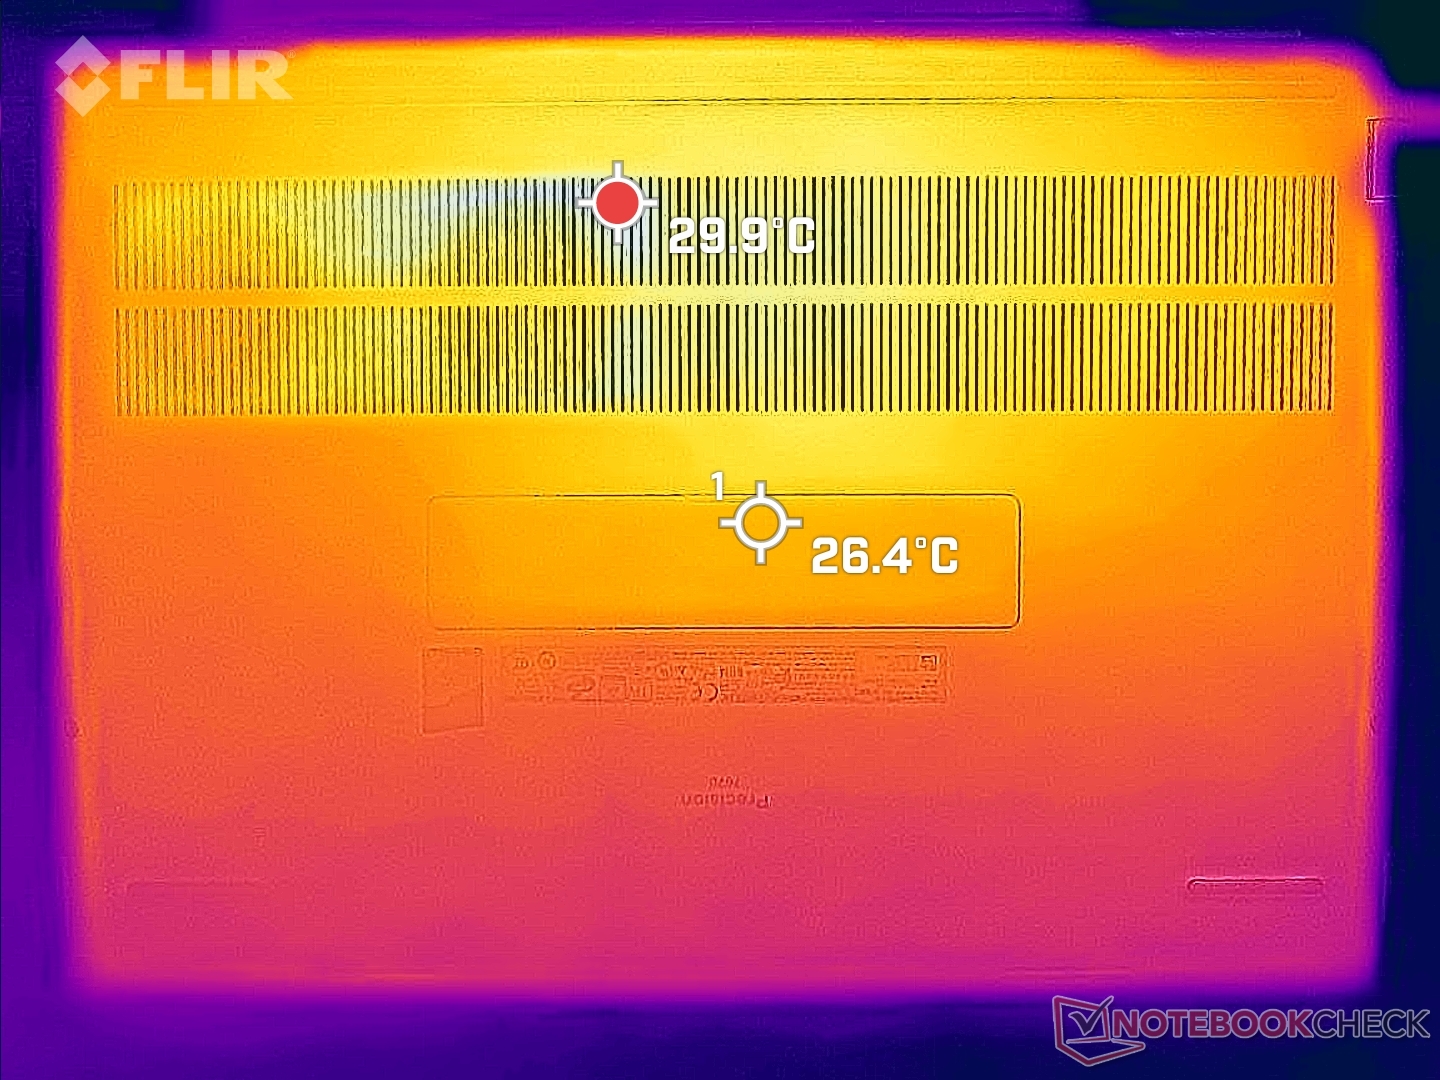
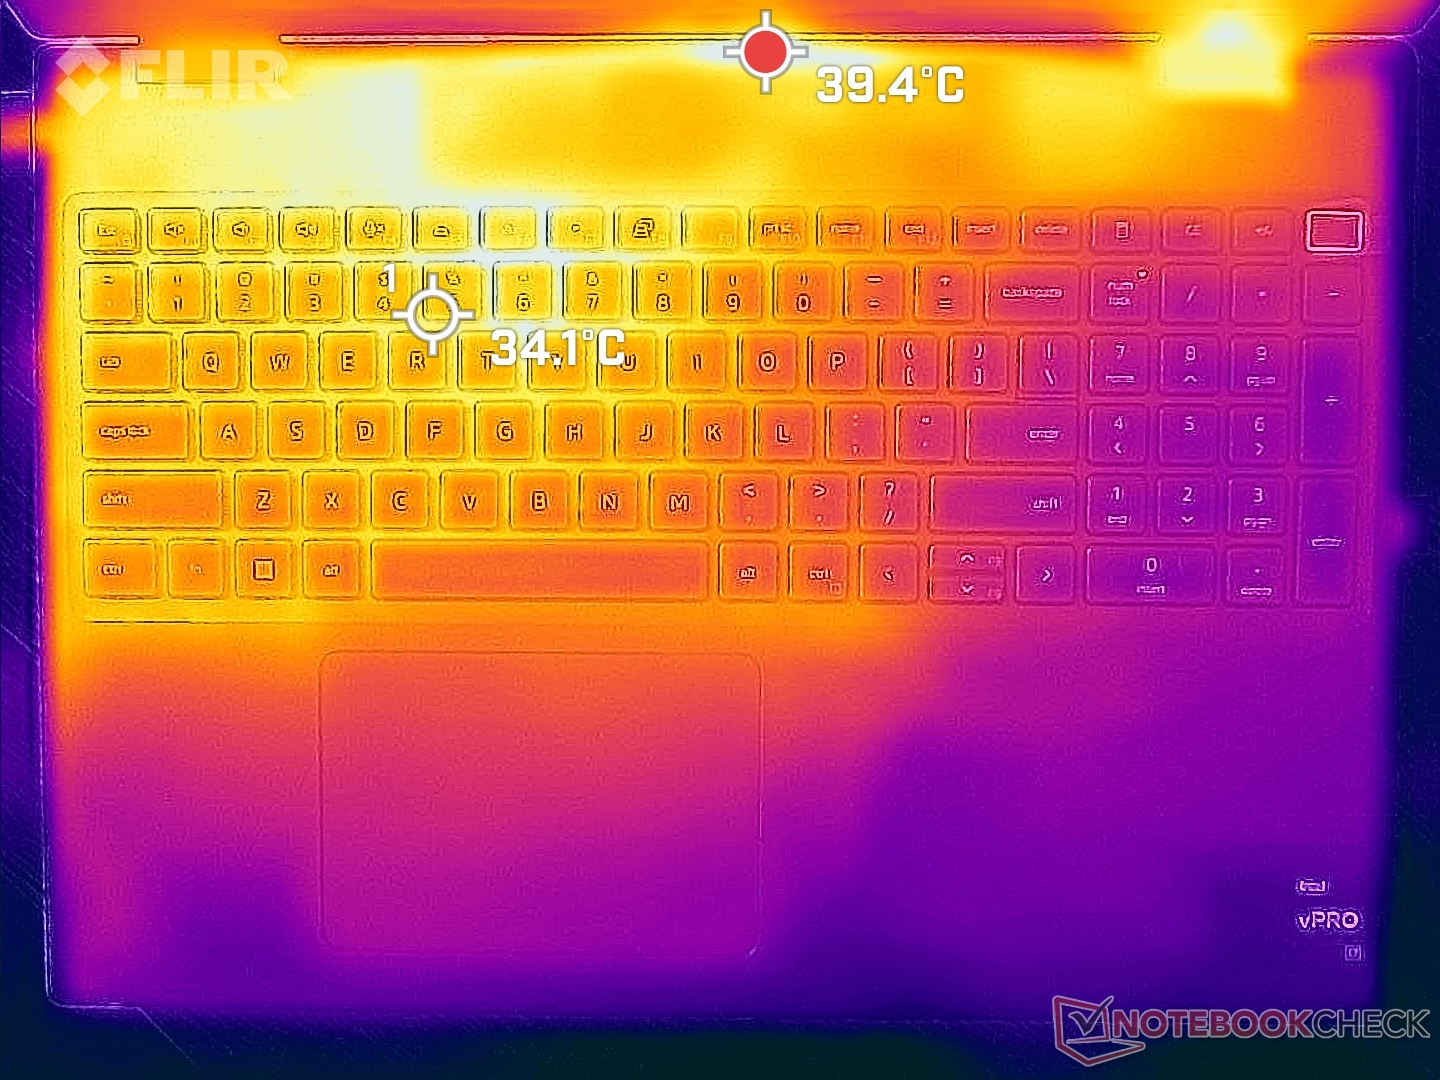
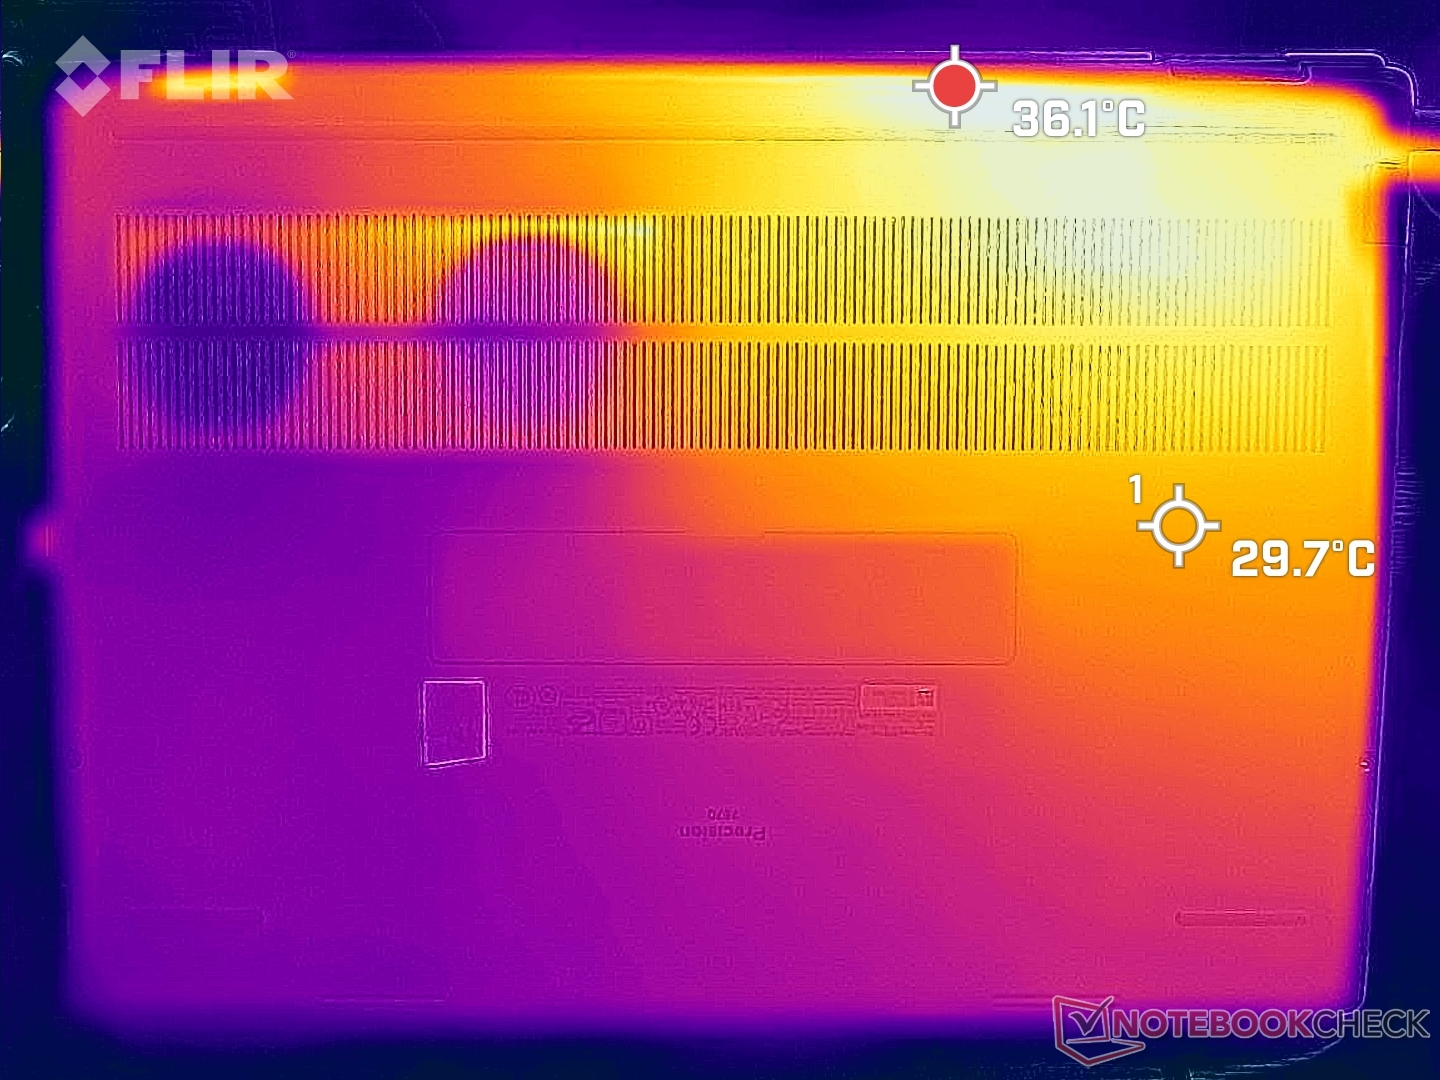
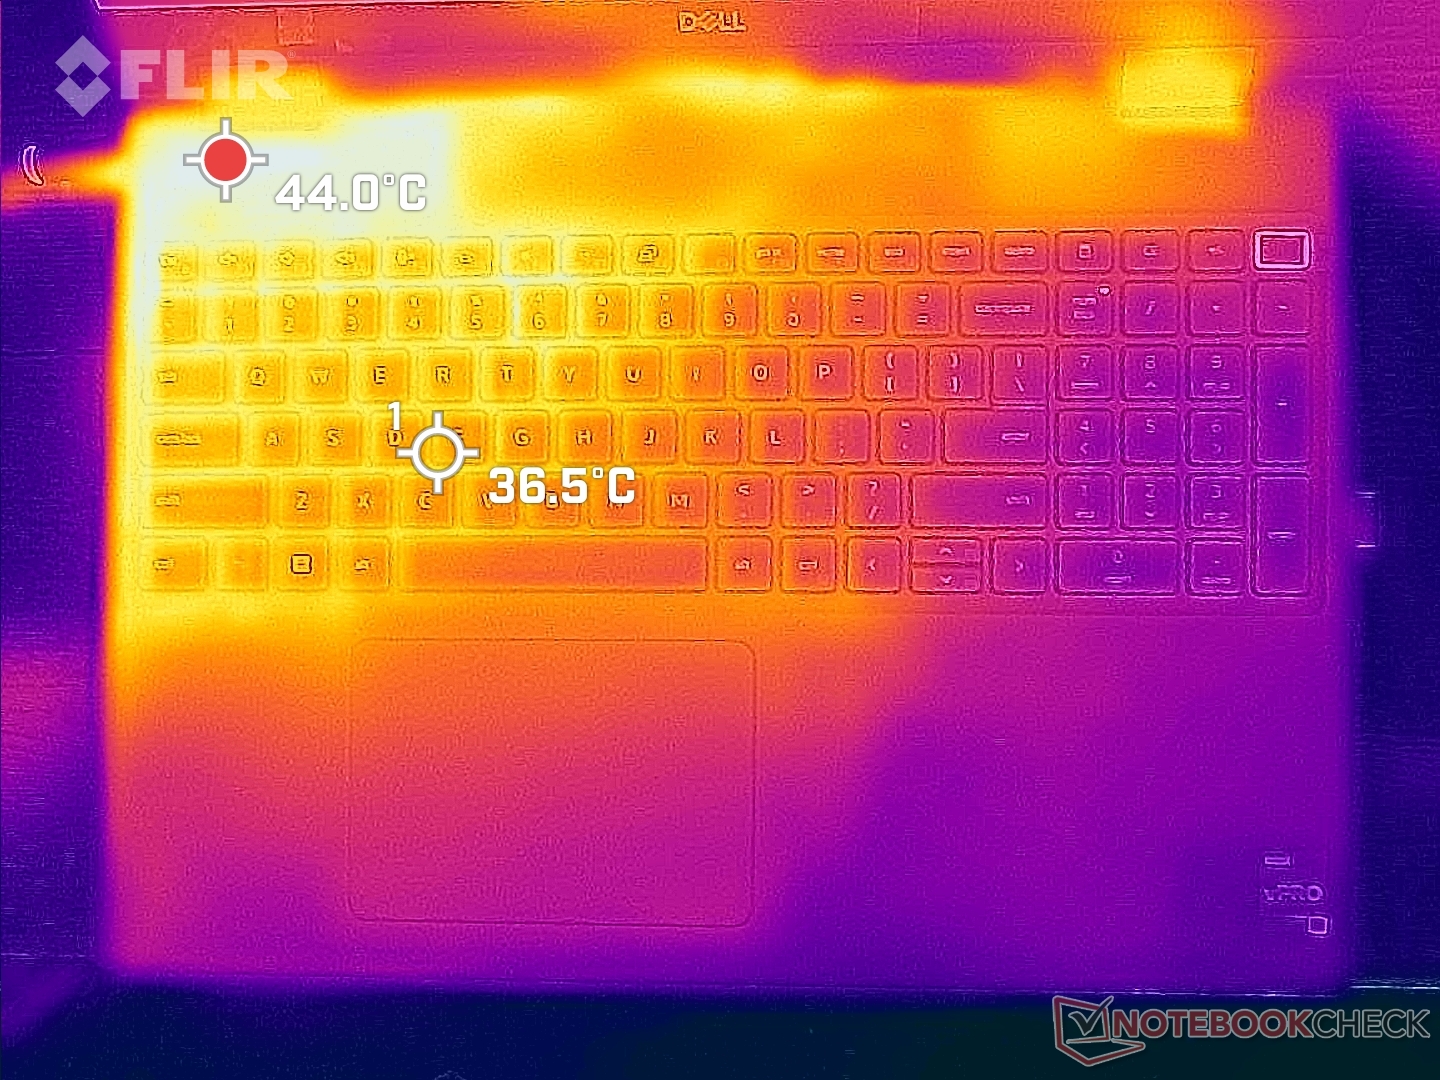
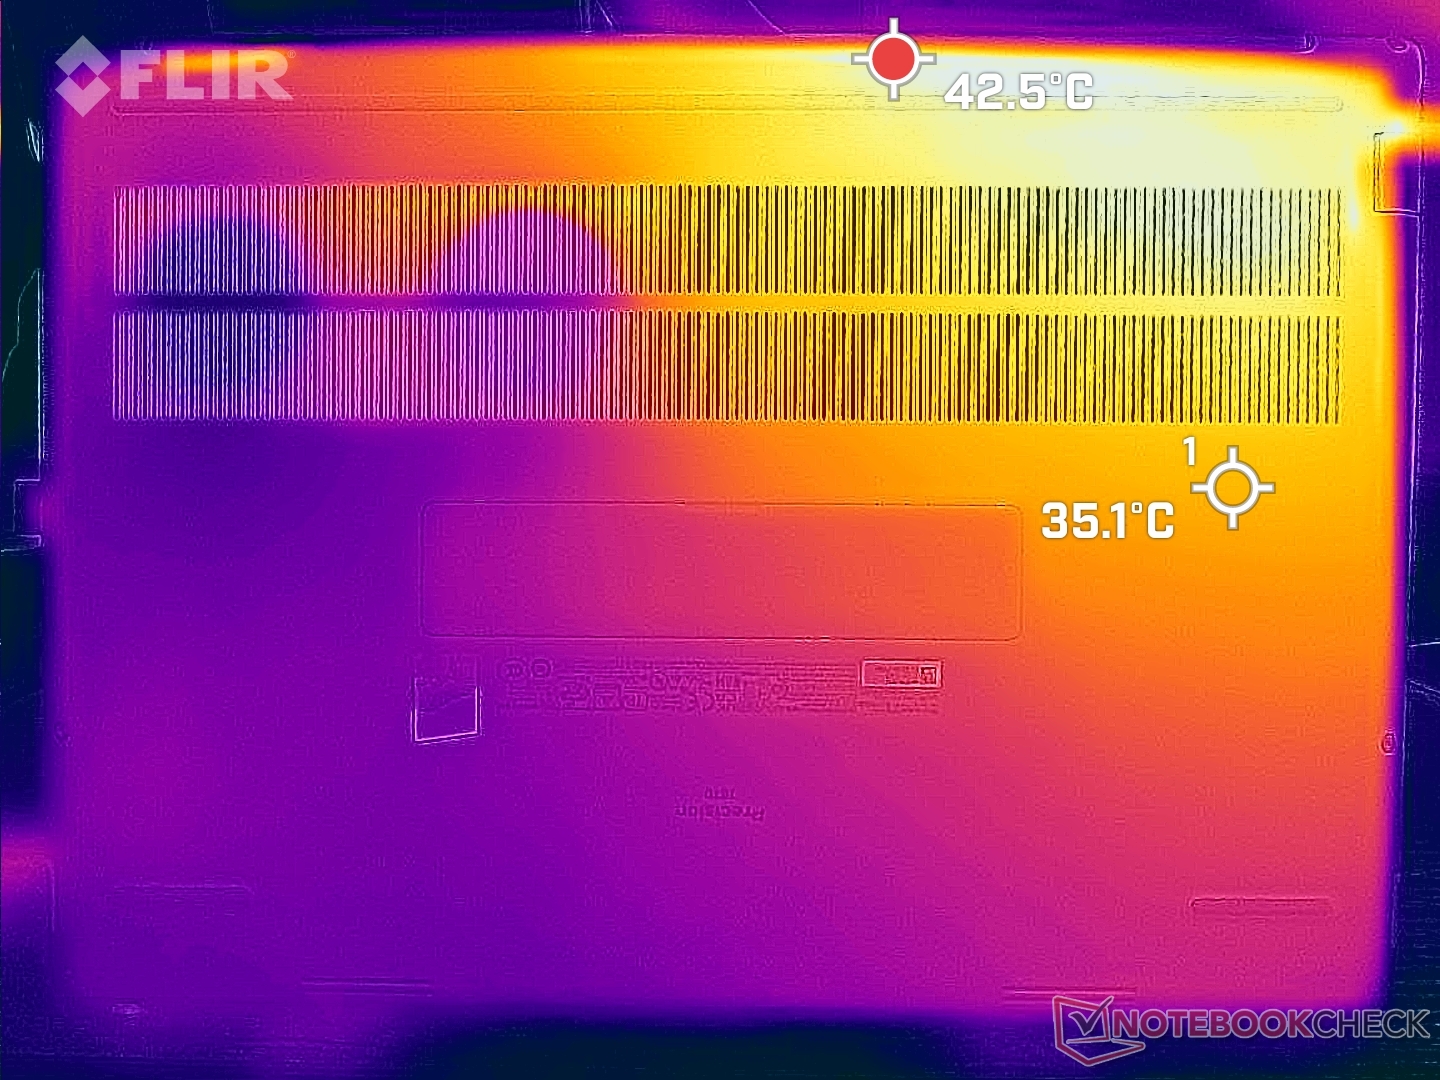
Température
Les températures de surface sont toujours chaudes, quelle que soit la charge à l'écran. Lorsque l'ordinateur tourne au ralenti en mode Economiseur d'énergie, par exemple, le plateau et le fond du clavier s'établissent à 30 C chacun, contre 26 C sur leLenovo ThinkPad P1 G4. Le siteAsus ProArt StudioBook Pro 16 peut être encore plus chaud à presque 35 C dans des conditions similaires.
Nous avons pu enregistrer des points chauds de 51 C et 46 C sur le dessus et le dessous, respectivement, lors de charges extrêmes. La moitié gauche du châssis sera toujours plus chaude que la droite en raison de la façon dont la solution de refroidissement et les processeurs sont positionnés à l'intérieur.
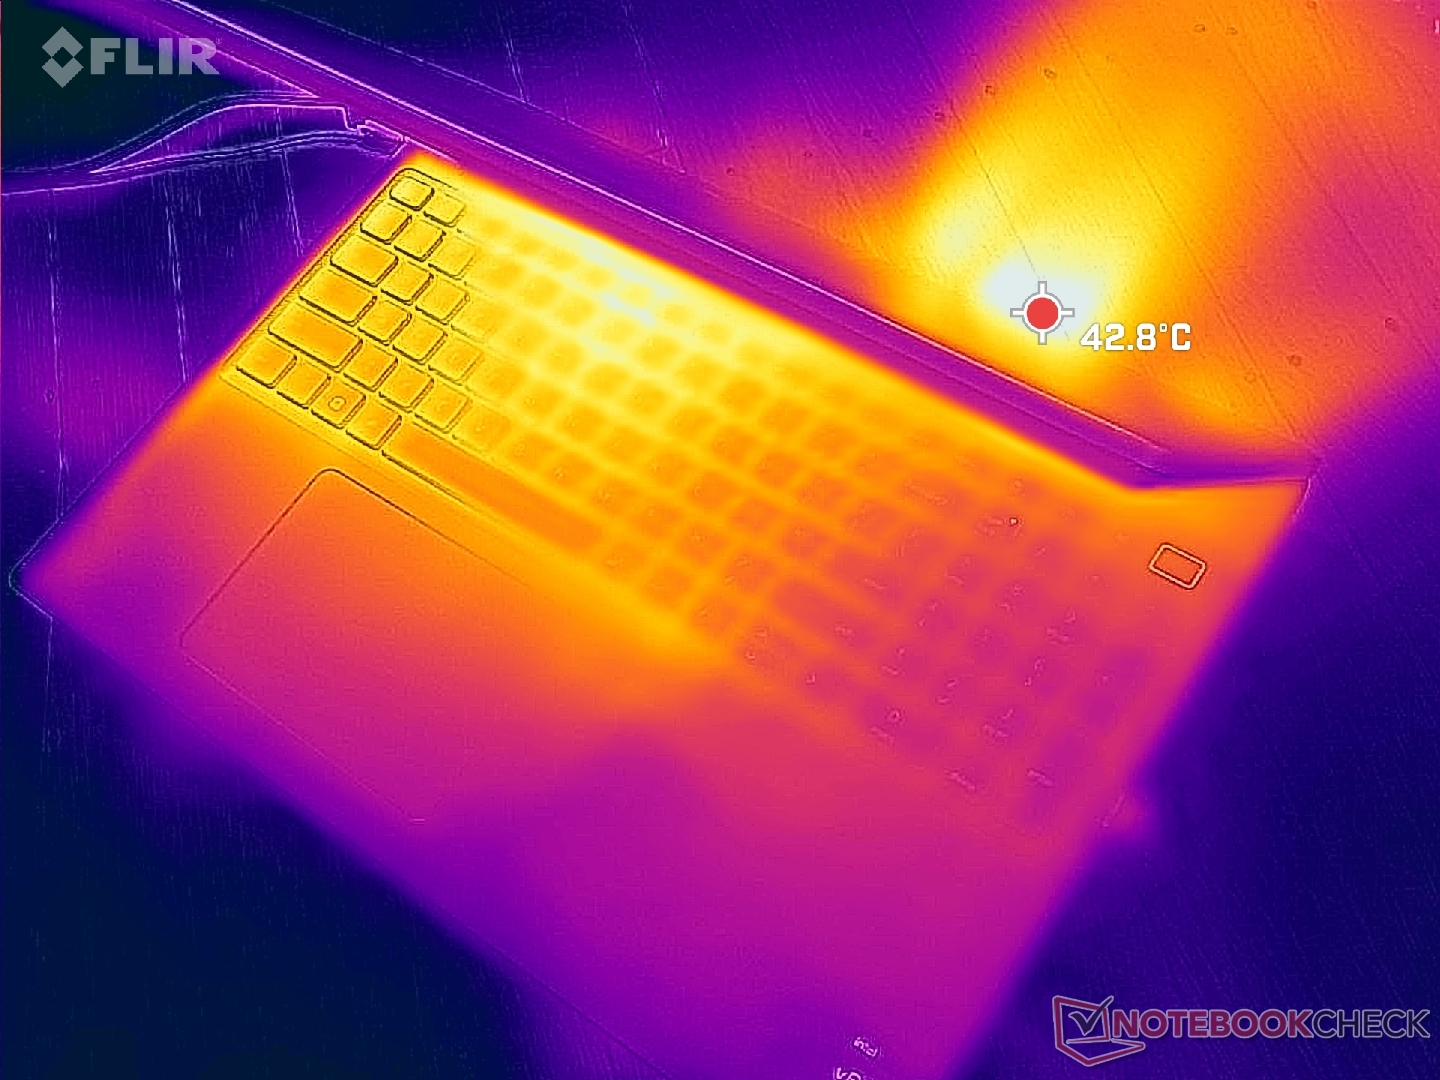
(-) La température maximale du côté supérieur est de 51 °C / 124 F, par rapport à la moyenne de 38.2 °C / 101 F, allant de 22.2 à 69.8 °C pour la classe Workstation.
(-) Le fond chauffe jusqu'à un maximum de 45.8 °C / 114 F, contre une moyenne de 41.1 °C / 106 F
(+) En utilisation inactive, la température moyenne du côté supérieur est de 29.8 °C / 86 F, par rapport à la moyenne du dispositif de 32 °C / 90 F.
(±) En jouant à The Witcher 3, la température moyenne du côté supérieur est de 37.1 °C / 99 F, alors que la moyenne de l'appareil est de 32 °C / 90 F.
(+) Les repose-poignets et le pavé tactile atteignent la température maximale de la peau (34.2 °C / 93.6 F) et ne sont donc pas chauds.
(-) La température moyenne de la zone de l'appui-paume de dispositifs similaires était de 27.8 °C / 82 F (-6.4 °C / #-11.6 F).
| Dell Precision 7670 Intel Core i7-12850HX, NVIDIA RTX A2000 Laptop GPU | Lenovo ThinkPad P1 G4-20Y4Z9DVUS Intel Core i7-11800H, NVIDIA T1200 Laptop GPU | Asus ProArt StudioBook 16 W7600H5A-2BL2 Intel Xeon W-11955M, NVIDIA RTX A5000 Laptop GPU | Dell Precision 5000 5560 Intel Core i7-11850H, NVIDIA RTX A2000 Laptop GPU | Dell Precision 7550 Intel Xeon W-10885M, NVIDIA Quadro RTX 5000 Max-Q | HP ZBook Fury 15 G8 Intel Core i9-11950H, NVIDIA RTX A5000 Laptop GPU | |
|---|---|---|---|---|---|---|
| Heat | 5% | -3% | -1% | 2% | 4% | |
| Maximum Upper Side * (°C) | 51 | 49.9 2% | 45.7 10% | 48.2 5% | 49 4% | 45.6 11% |
| Maximum Bottom * (°C) | 45.8 | 56.7 -24% | 48.3 -5% | 42.6 7% | 51 -11% | 57.6 -26% |
| Idle Upper Side * (°C) | 31.8 | 25.5 20% | 35.3 -11% | 34.8 -9% | 28.2 11% | 26 18% |
| Idle Bottom * (°C) | 32.6 | 26.2 20% | 34.4 -6% | 35.2 -8% | 32 2% | 28.8 12% |
* ... Moindre est la valeur, meilleures sont les performances
Test de stress
Lors de l'exécution de Prime95 pour stresser le CPU, les fréquences d'horloge et la consommation d'énergie de la carte atteignaient respectivement 3,5 GHz et 153 W, mais ne duraient que quelques secondes tout au plus. La température du cœur pouvait atteindre 100°C pendant cette brève période. Les fréquences d'horloge et la consommation d'énergie diminuaient ensuite régulièrement avant de se stabiliser à 2,2 à 2,4 GHz et 73 W, respectivement, afin de maintenir une température centrale plus tolérable de 85 C. Les performances de Turbo Boost ne sont donc pas aussi bonnes que nous l'avions espéré compte tenu de la taille de cette station de travail.
Lorsque nous exécutons Witcher 3 pour représenter une charge lourde et régulière, les fréquences d'horloge du GPU, la température et la consommation d'énergie se stabilisent à 1777 MHz, 80 C et 80 W, respectivement, par rapport à 1462 MHz, 75 C et 45 W, respectivement, sur le plus petit Precision 5560 avec le même GPU RTX A2000.
Le fonctionnement sur batterie limite les performances. Un test de Fire Strike sur batteries donnerait des scores de physique et de graphisme de 9820 et 6911 points, respectivement, contre 23868 et 14295 points sur secteur.
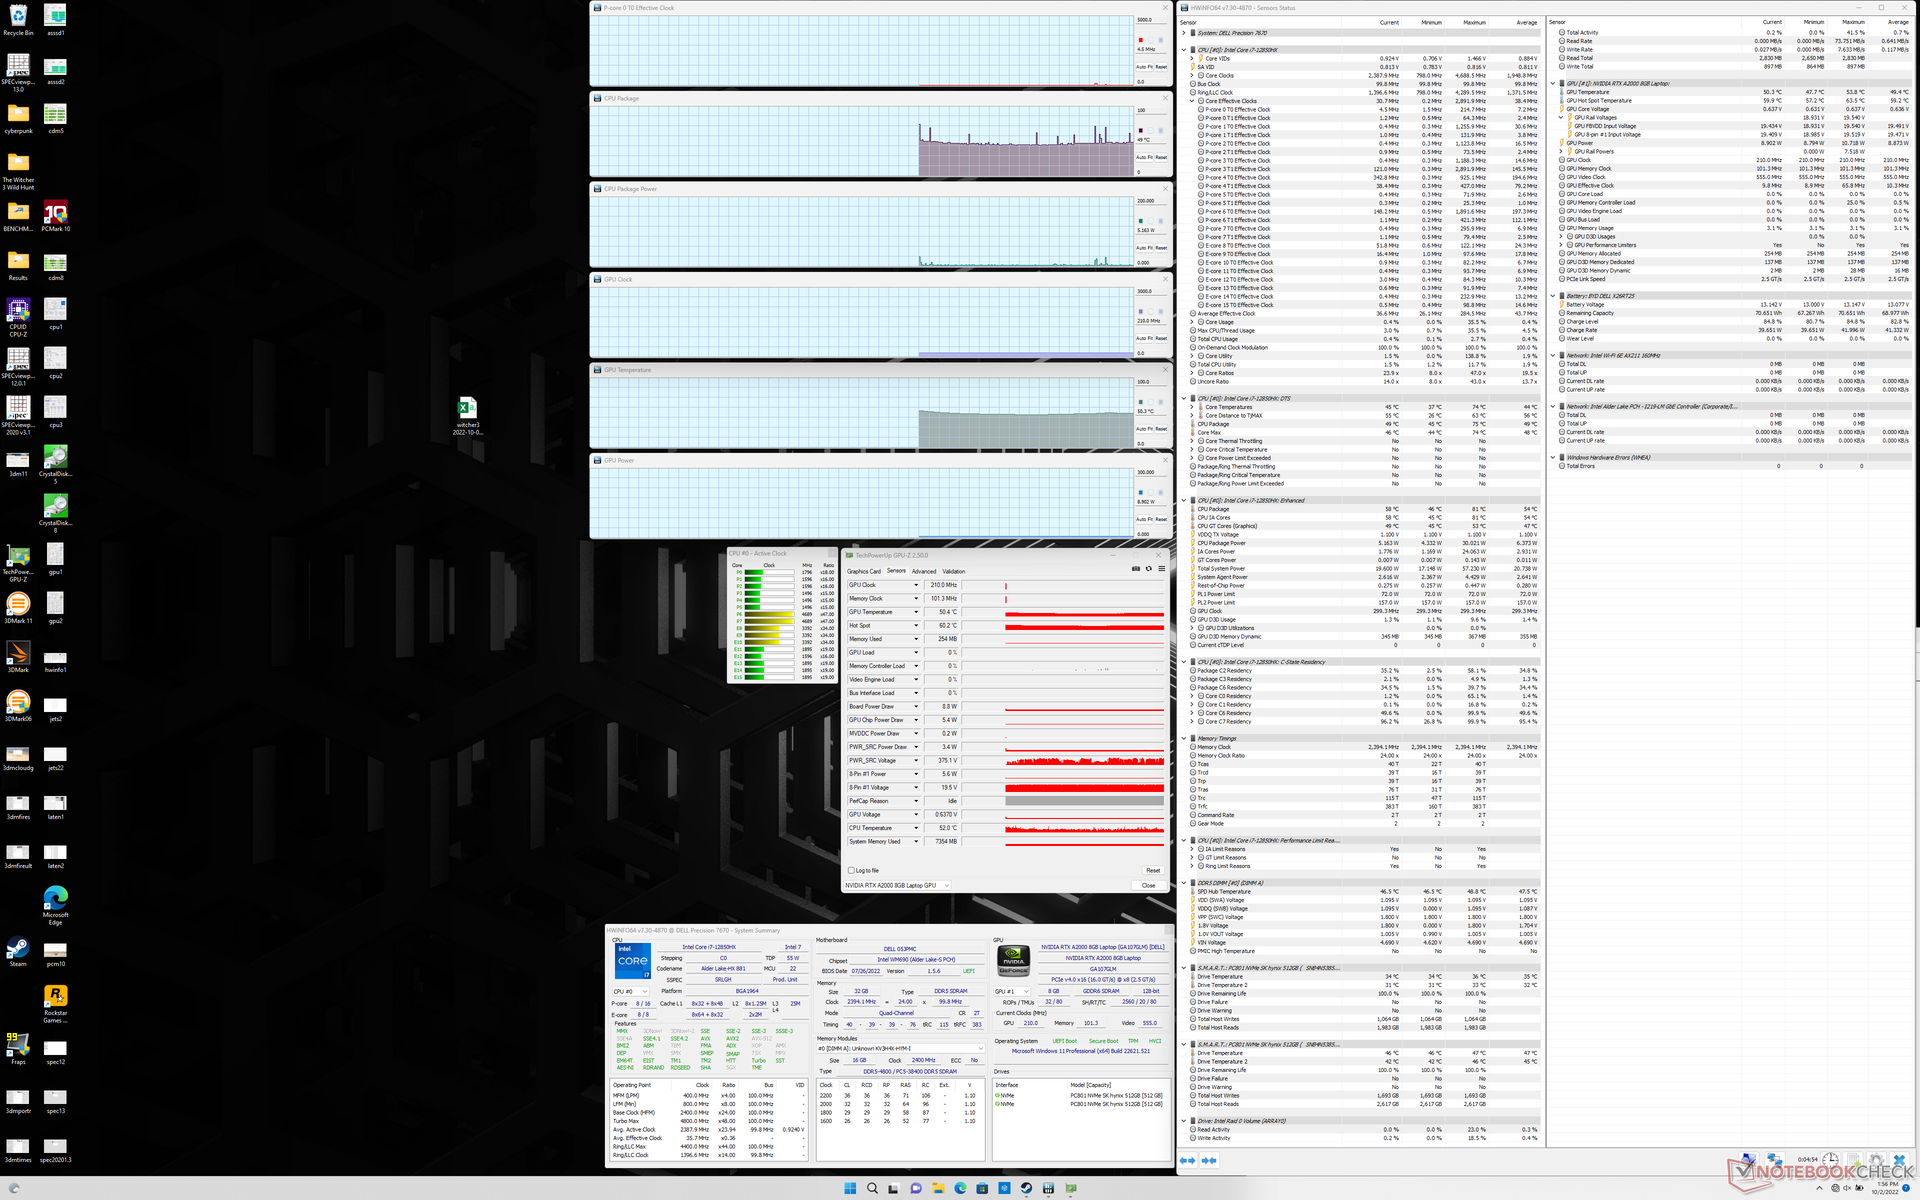
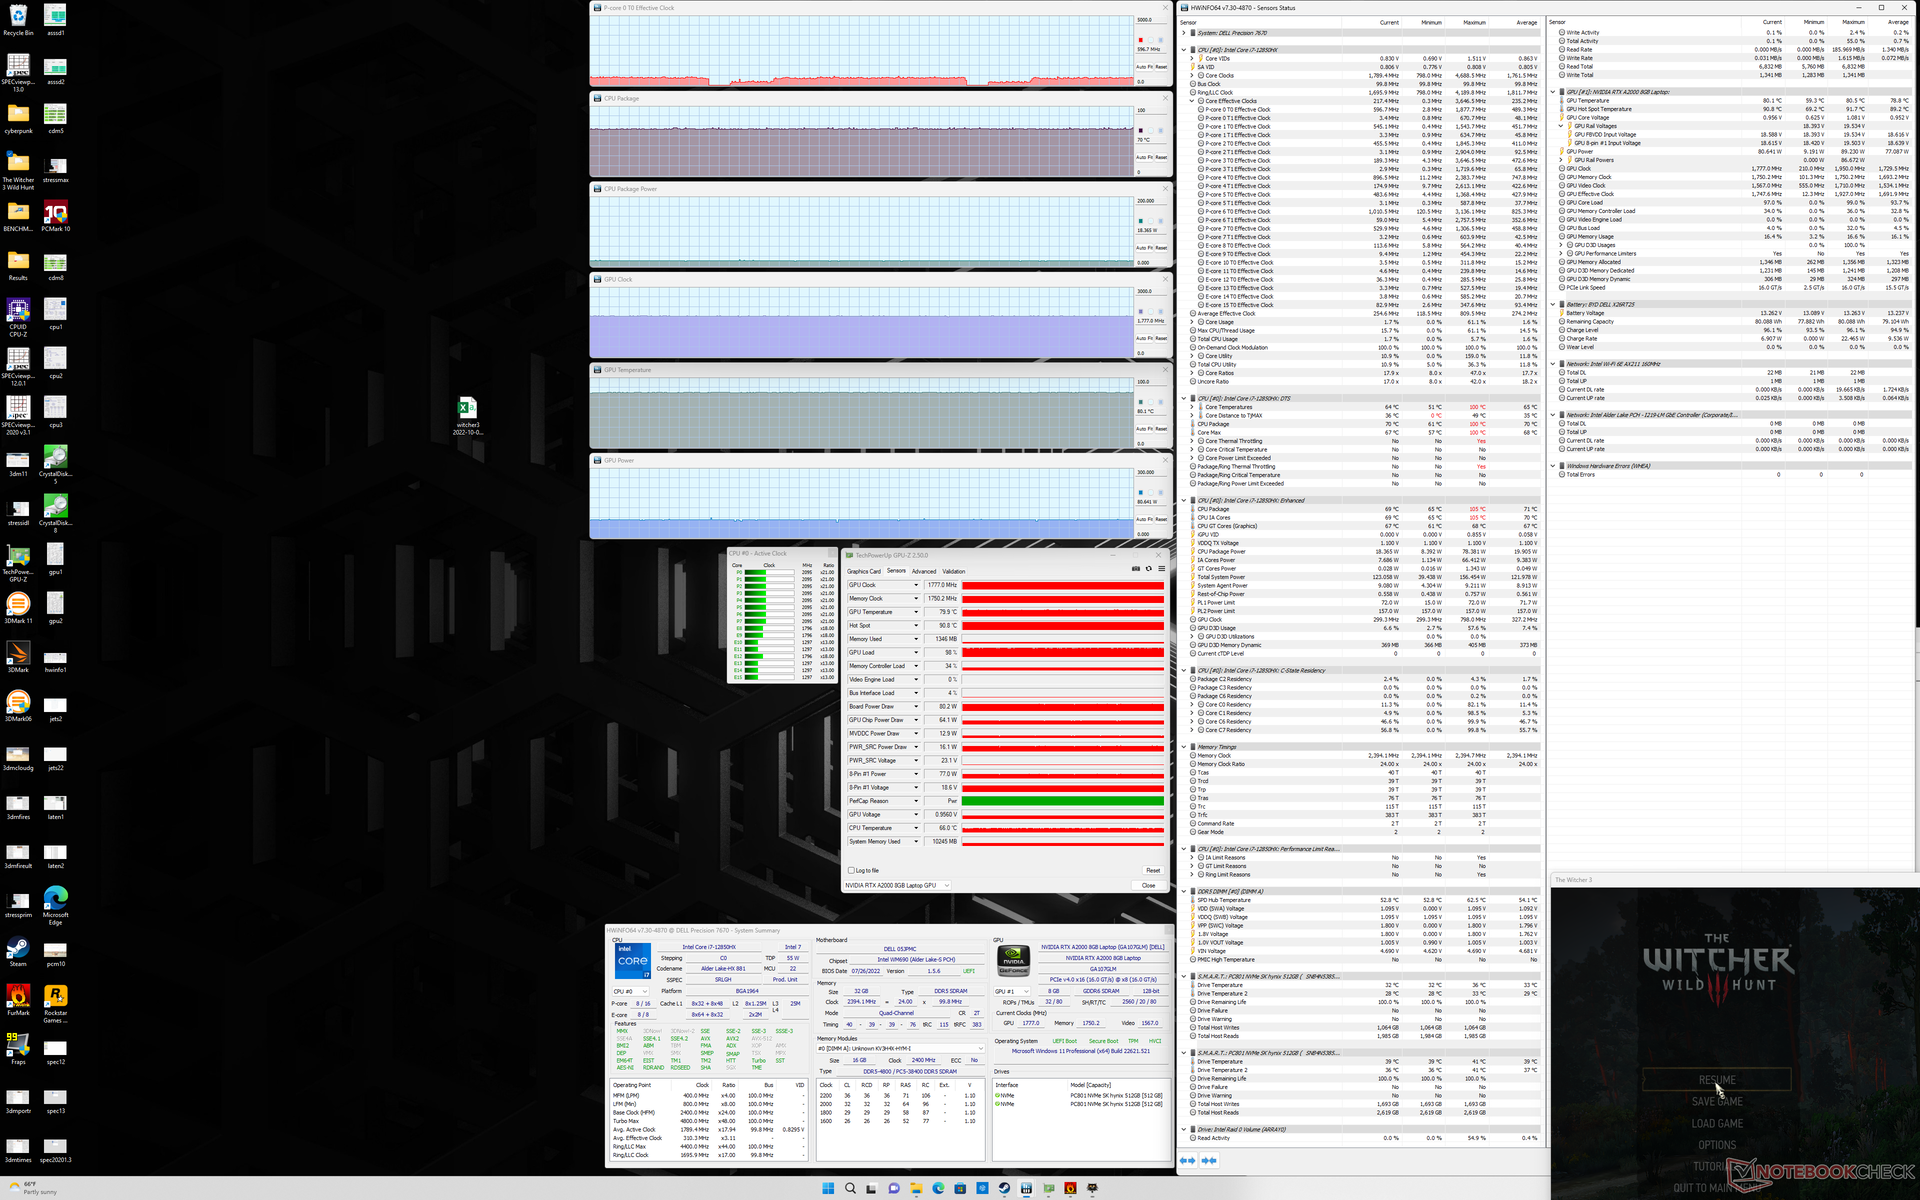
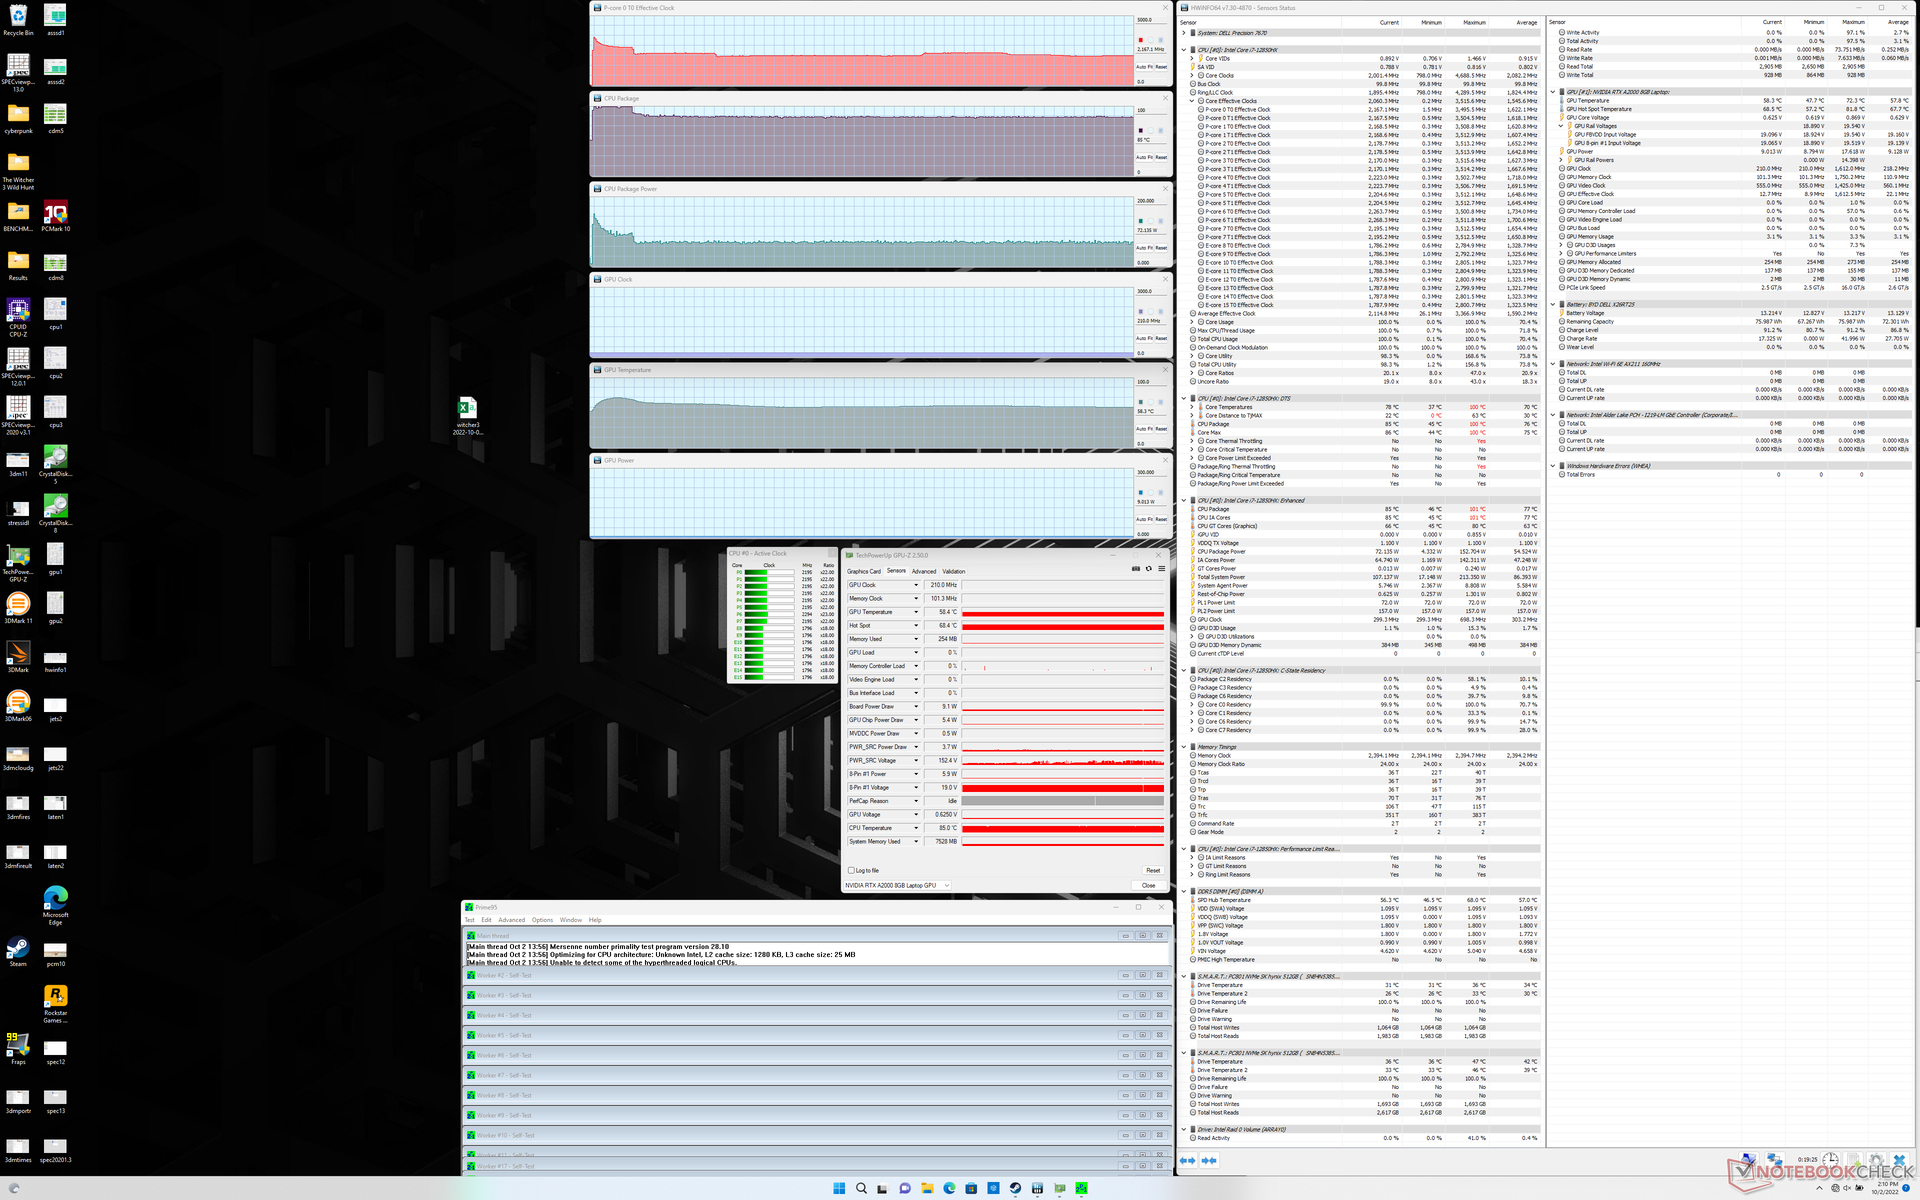
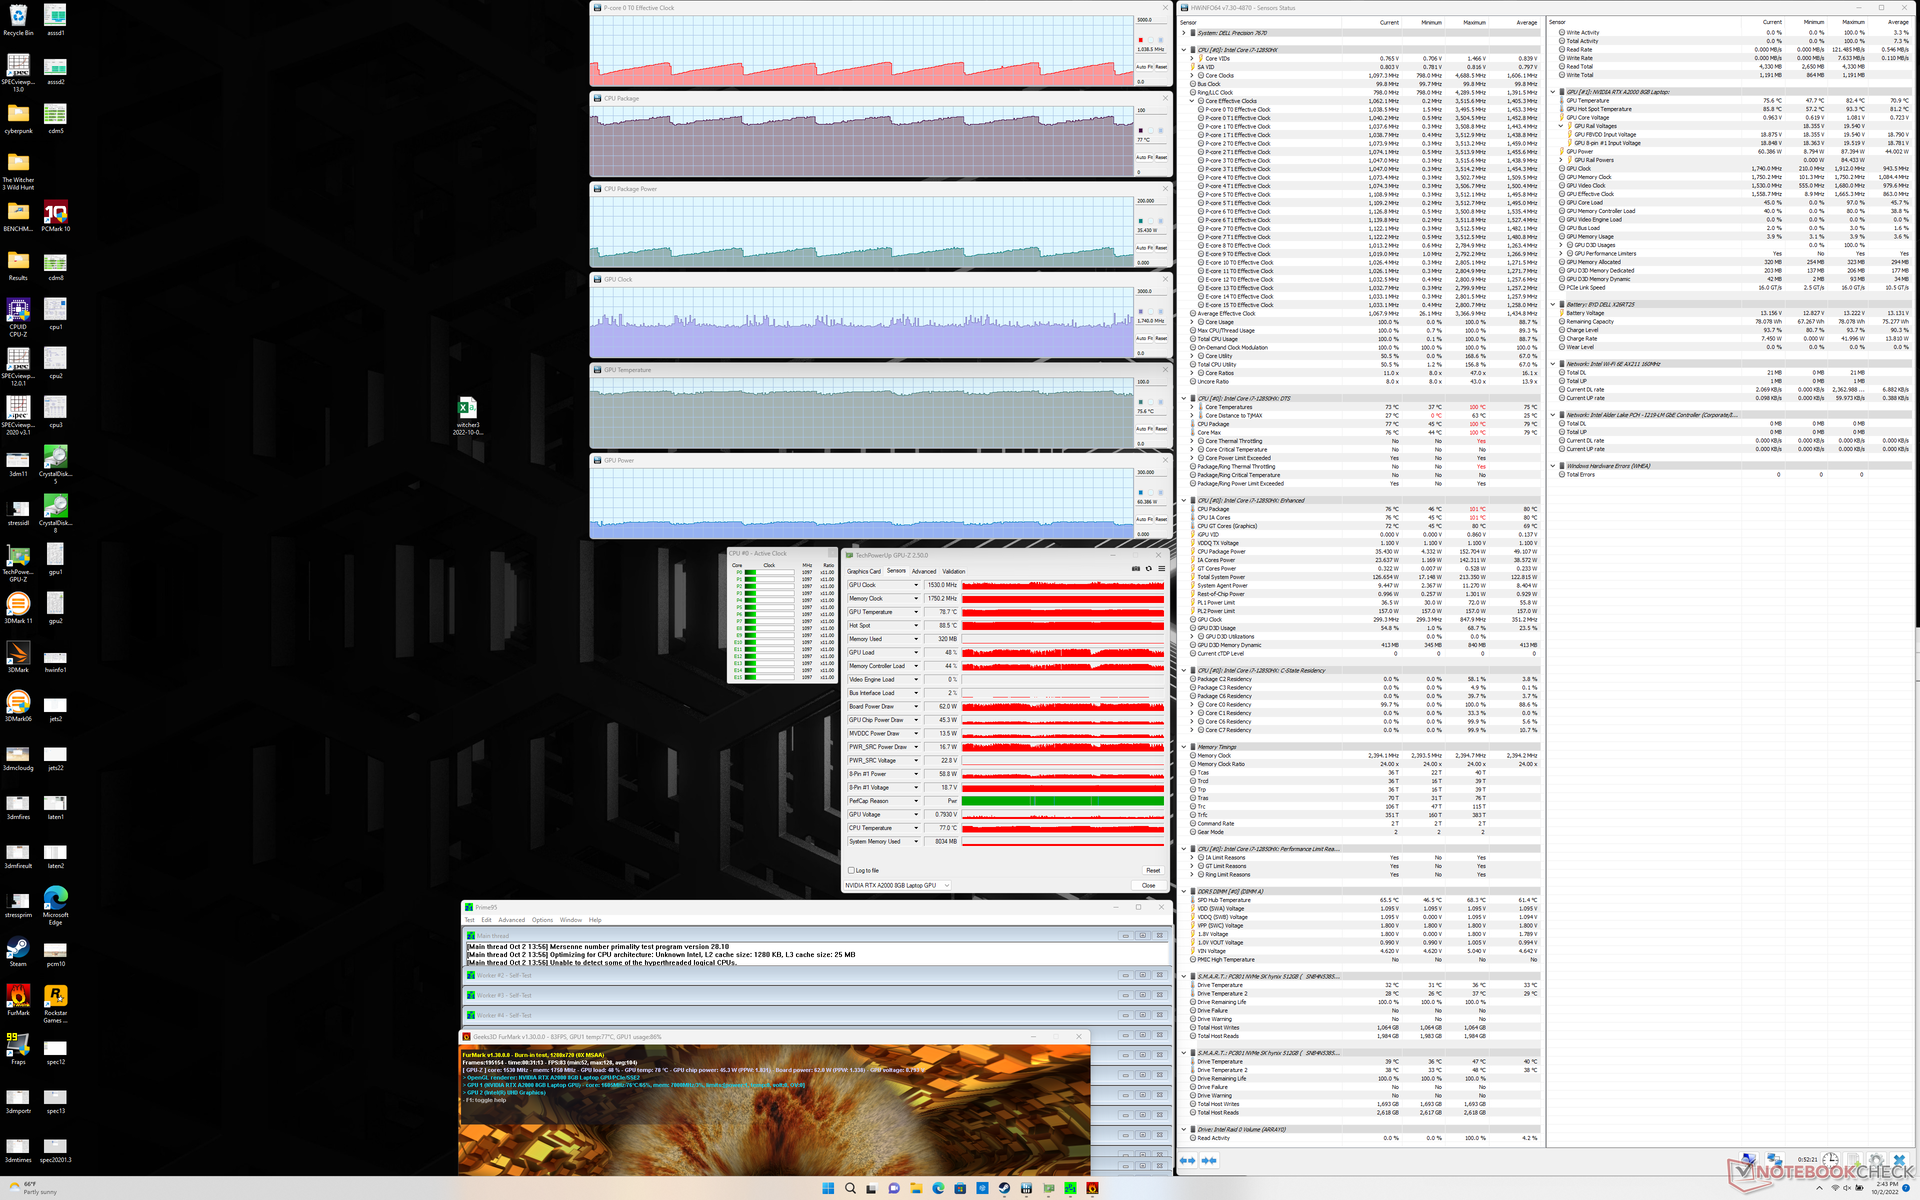
| Fréquence du CPU (GHz) | Fréquence du GPU (MHz) | Température moyenne du CPU (°C) | Température moyenne du GPU (°C) | |
| Système au repos | -- | -- | 49 | 50 |
| Prime95 Stress | 2.2 | -- | 85 | 58 |
| Prime95+ FurMark Stress | 0.8 - 1.3 | ~1450 | 76 - 86 | 62 - 72 |
| Witcher 3 Stress | 0.6 | 1777 | 70 | 80 |
Haut-parleurs
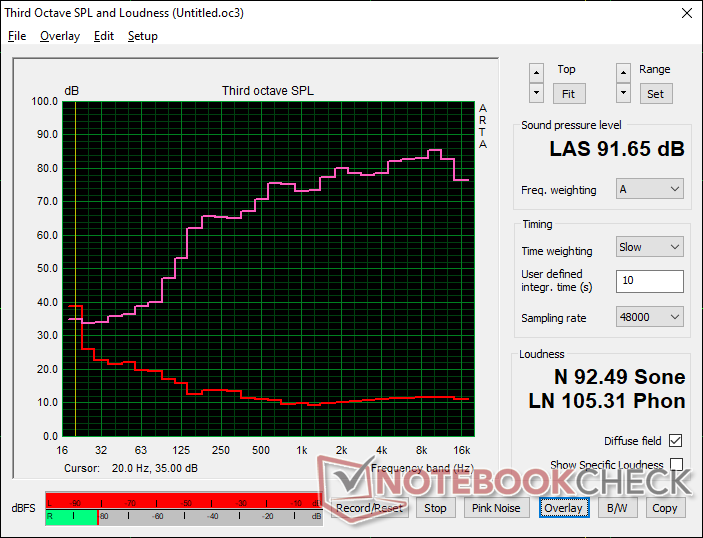
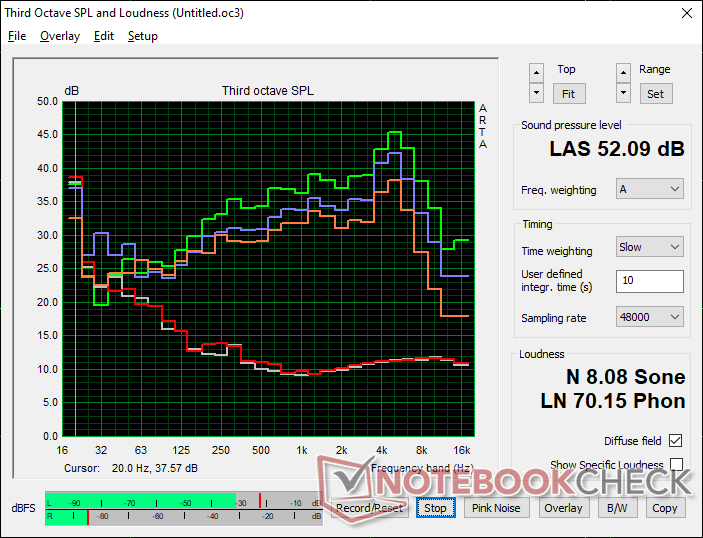
Dell Precision 7670 analyse audio
(+) | les haut-parleurs peuvent jouer relativement fort (91.7# dB)
Basses 100 - 315 Hz
(-) | presque aucune basse - en moyenne 16.8% plus bas que la médiane
(+) | les basses sont linéaires (6.7% delta à la fréquence précédente)
Médiums 400 - 2000 Hz
(+) | médiane équilibrée - seulement 3.5% de la médiane
(+) | les médiums sont linéaires (3.9% delta à la fréquence précédente)
Aiguës 2 - 16 kHz
(+) | des sommets équilibrés - à seulement 4.6% de la médiane
(+) | les aigus sont linéaires (2% delta à la fréquence précédente)
Globalement 100 - 16 000 Hz
(+) | le son global est linéaire (12.2% différence à la médiane)
Par rapport à la même classe
» 18% de tous les appareils testés de cette catégorie étaient meilleurs, 3% similaires, 79% pires
» Le meilleur avait un delta de 7%, la moyenne était de 17%, le pire était de 35%.
Par rapport à tous les appareils testés
» 10% de tous les appareils testés étaient meilleurs, 2% similaires, 88% pires
» Le meilleur avait un delta de 4%, la moyenne était de 24%, le pire était de 134%.
Apple MacBook Pro 16 2021 M1 Pro analyse audio
(+) | les haut-parleurs peuvent jouer relativement fort (84.7# dB)
Basses 100 - 315 Hz
(+) | bonne basse - seulement 3.8% loin de la médiane
(+) | les basses sont linéaires (5.2% delta à la fréquence précédente)
Médiums 400 - 2000 Hz
(+) | médiane équilibrée - seulement 1.3% de la médiane
(+) | les médiums sont linéaires (2.1% delta à la fréquence précédente)
Aiguës 2 - 16 kHz
(+) | des sommets équilibrés - à seulement 1.9% de la médiane
(+) | les aigus sont linéaires (2.7% delta à la fréquence précédente)
Globalement 100 - 16 000 Hz
(+) | le son global est linéaire (4.6% différence à la médiane)
Par rapport à la même classe
» 0% de tous les appareils testés de cette catégorie étaient meilleurs, 0% similaires, 100% pires
» Le meilleur avait un delta de 5%, la moyenne était de 17%, le pire était de 45%.
Par rapport à tous les appareils testés
» 0% de tous les appareils testés étaient meilleurs, 0% similaires, 100% pires
» Le meilleur avait un delta de 4%, la moyenne était de 24%, le pire était de 134%.
Gestion de l'énergie - Très exigeant
Consommation d'énergie
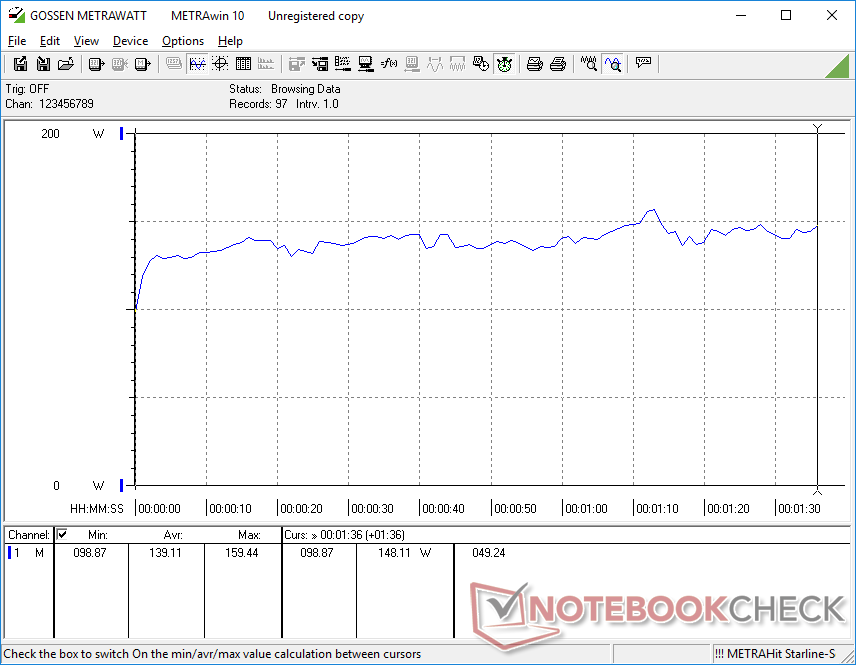
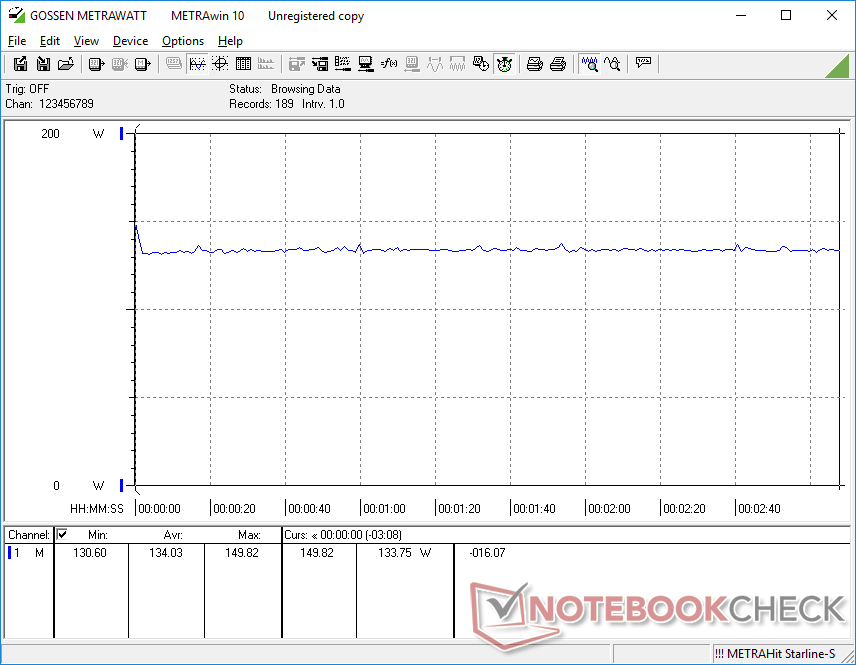
Le système est assez exigeant dans la plupart des conditions. La consommation d'énergie se situe entre 7 W et 25 W en mode veille sur le bureau, tandis que des charges plus élevées comme 3DMark 06 ou Witcher 3 consomment environ 140 W chacun. Les ordinateurs Asus ProArt StudioBook 16 ou Precision 5560 ne consomment que 132 W ou 96 W dans des conditions similaires
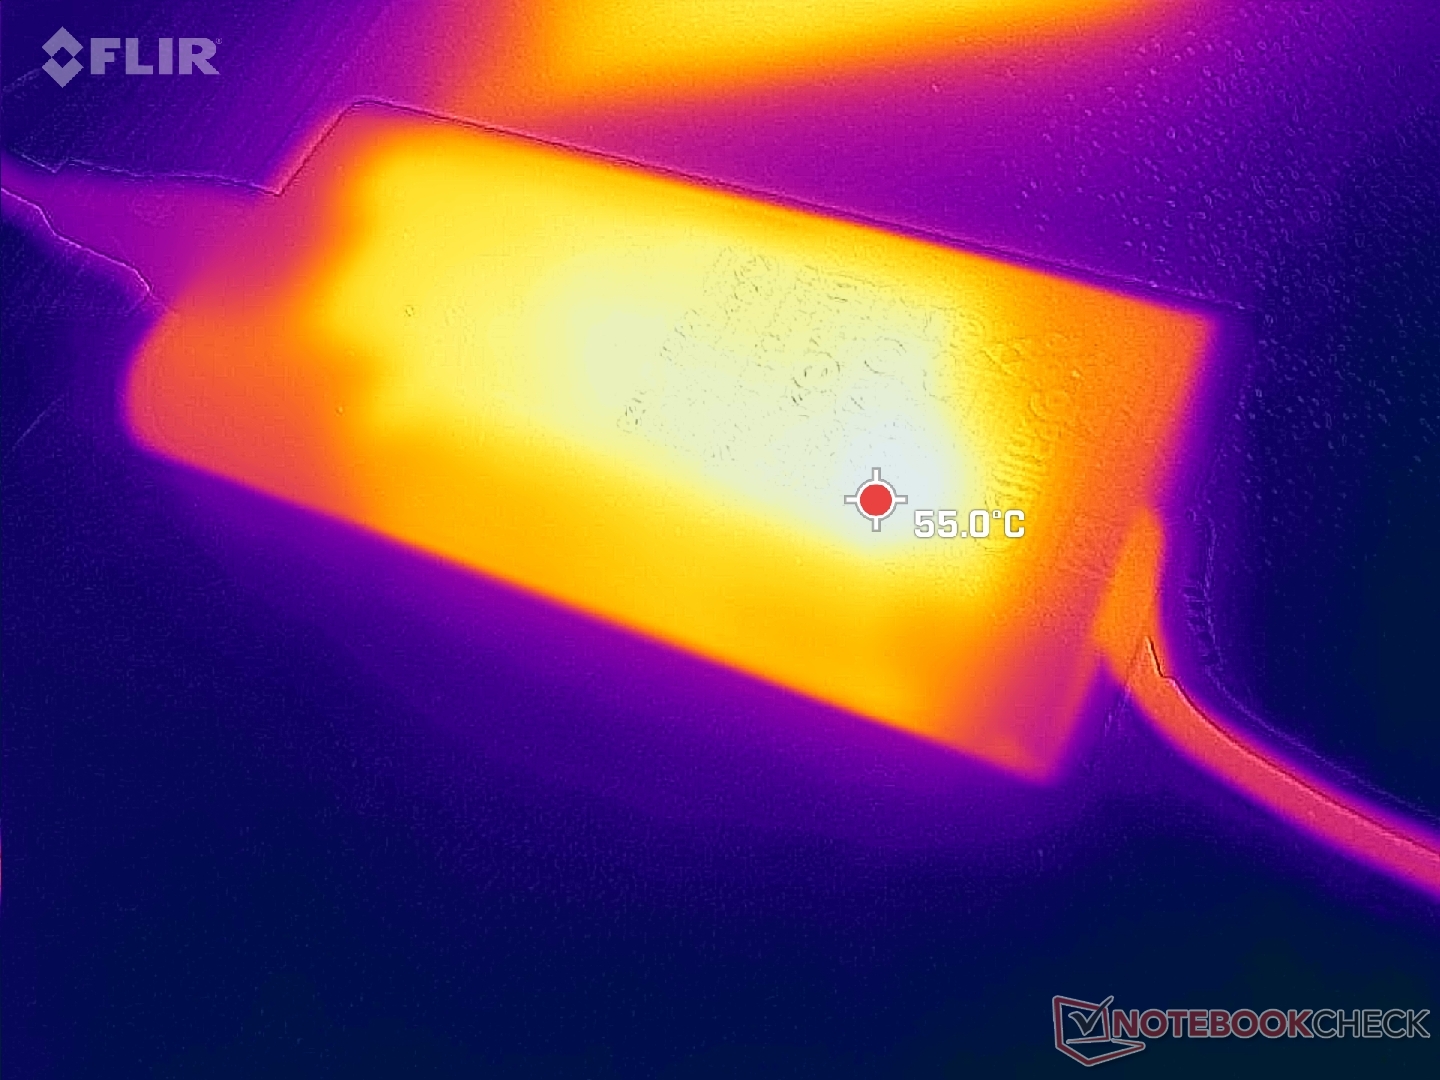
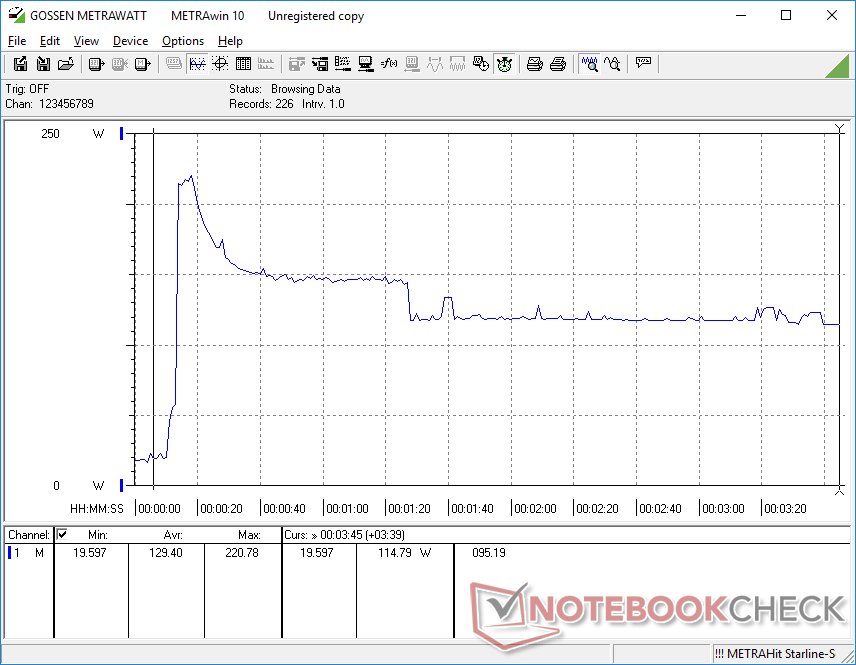
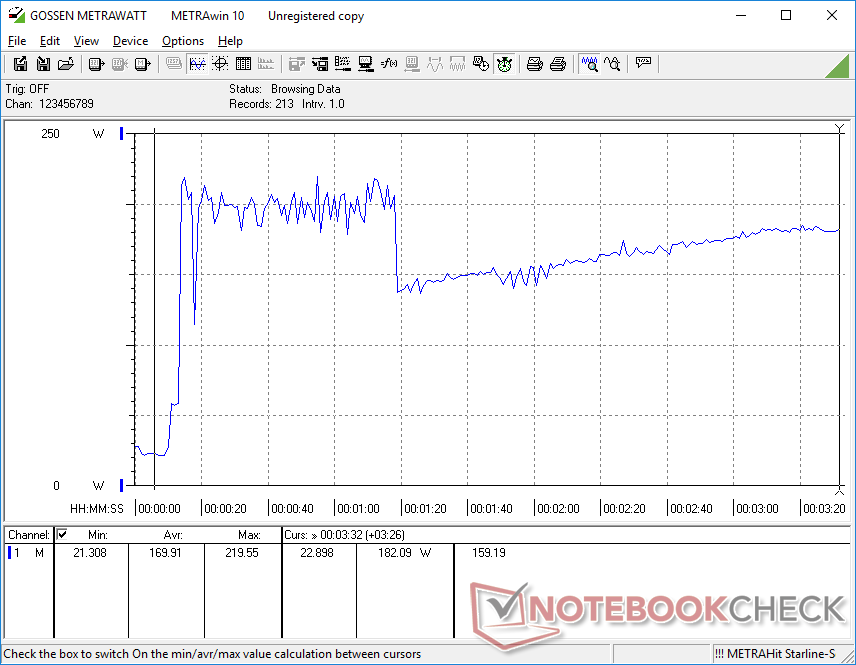
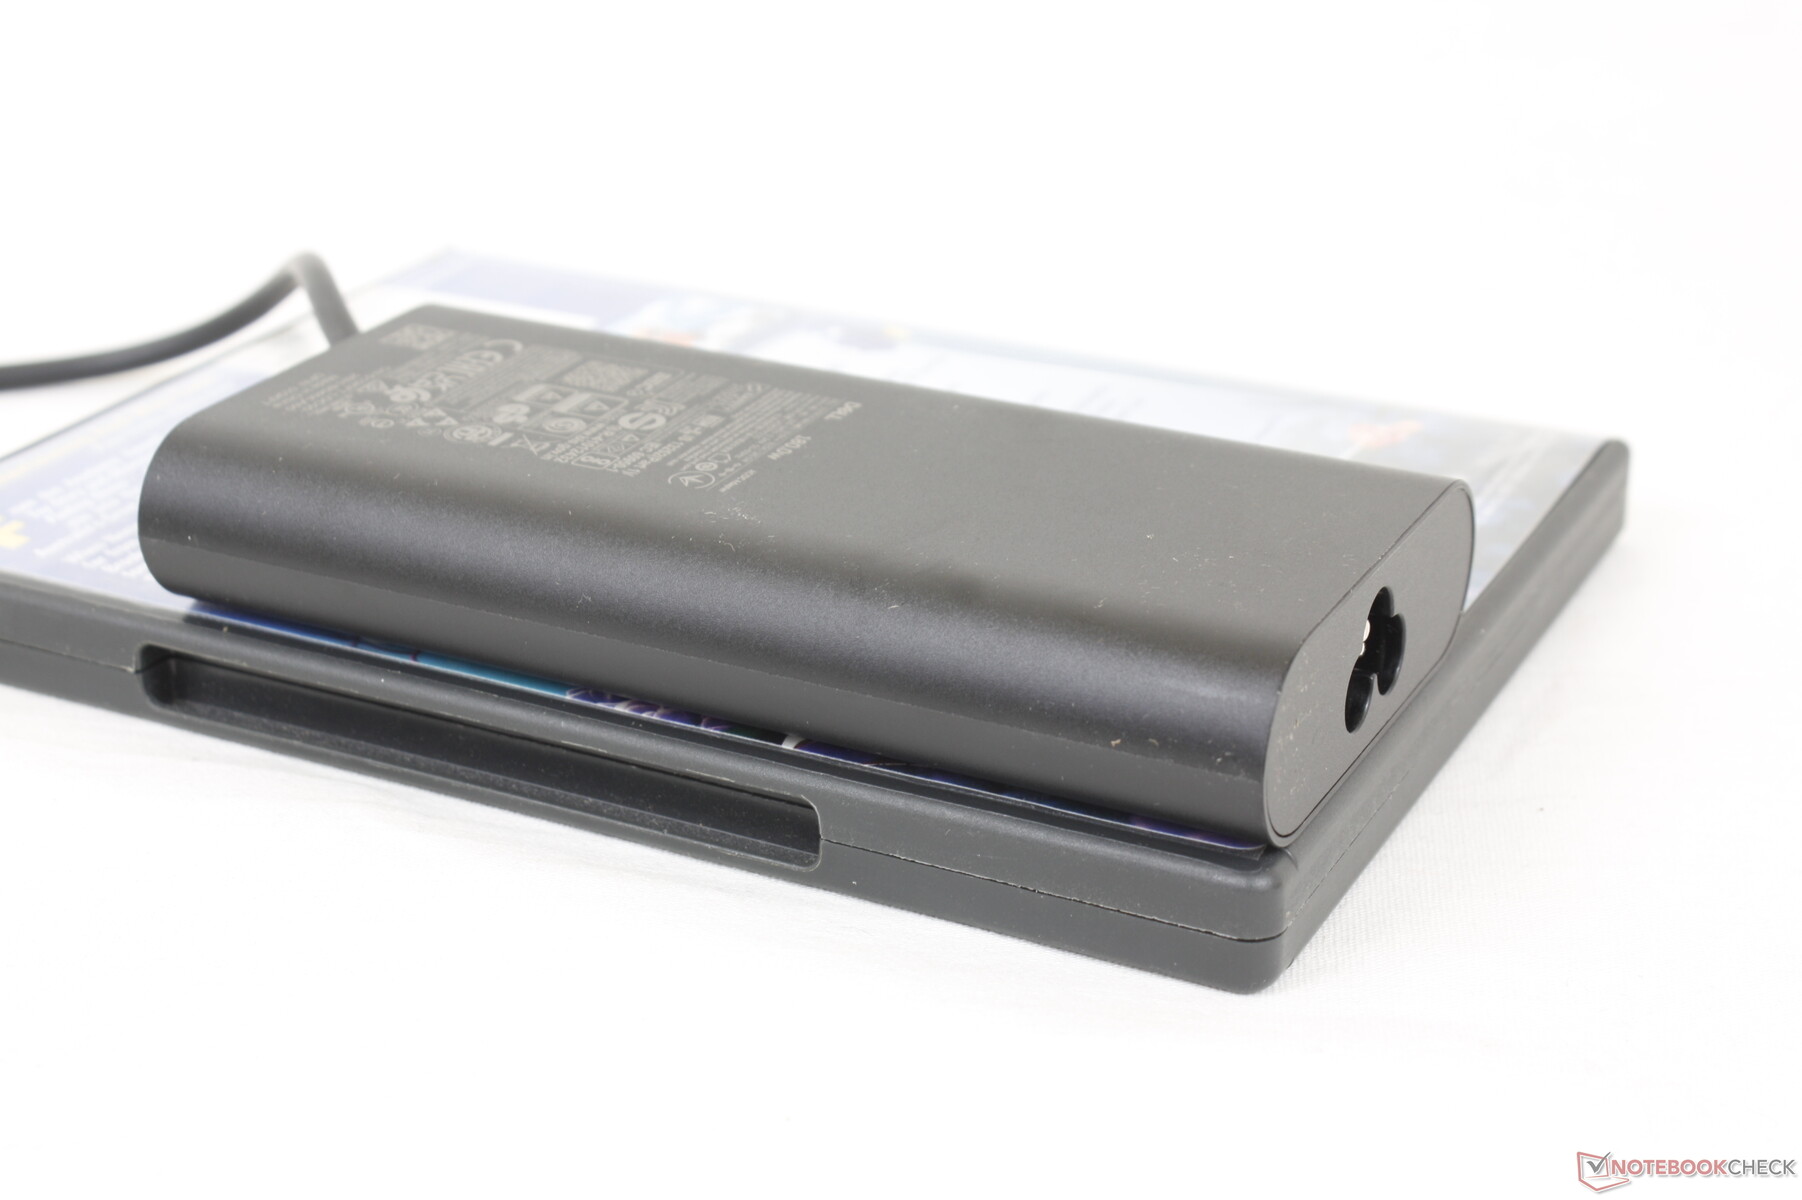
La consommation d'énergie peut atteindre 221 W lorsque le CPU et le GPU sont utilisés au maximum, bien que l'adaptateur secteur de taille moyenne (~13,7 x 6,6 x 2,3 cm) soit conçu pour 180 W seulement. Ce taux extrêmement élevé ne durerait qu'une minute au maximum avant de retomber à 114 W si le CPU est sollicité ou à 180 W si le CPU et le GPU sont sollicités simultanément. Le taux de charge de l'ordinateur portable peut donc ralentir jusqu'à s'arrêter s'il est soumis à des conditions aussi extrêmes
Dell propose un adaptateur secteur de 240 W plus performant si vous configurez le Precision 7670 avec des options de GPU plus rapides. Toutefois, au vu de nos résultats avec l'adaptateur secteur de 180 W, l'option de 240 W devrait peut-être être la norme pour toutes les configurations Nvidia RTX.
| Éteint/en veille | |
| Au repos | |
| Fortement sollicité |
|
Légende:
min: | |
| Dell Precision 7670 i7-12850HX, RTX A2000 Laptop GPU, SK Hynix HFS001TEJ9X115N, OLED, 3840x2400, 16" | Lenovo ThinkPad P1 G4-20Y4Z9DVUS i7-11800H, T1200 Laptop GPU, Samsung PM9A1 MZVL2512HCJQ, IPS, 2560x1600, 16" | Asus ProArt StudioBook 16 W7600H5A-2BL2 W-11955M, RTX A5000 Laptop GPU, 2x Micron 2300 2TB MTFDHBA2T0TDV (RAID 0), OLED, 3840x2400, 16" | Dell Precision 5000 5560 i7-11850H, RTX A2000 Laptop GPU, Samsung PM9A1 MZVL22T0HBLB, IPS, 3840x2400, 15.6" | Dell Precision 7550 W-10885M, Quadro RTX 5000 Max-Q, SK Hynix PC601A NVMe 1TB, IPS, 3840x2160, 15.6" | HP ZBook Fury 15 G8 i9-11950H, RTX A5000 Laptop GPU, Samsung PM981a MZVLB1T0HBLR, IPS, 3840x2160, 15.6" | |
|---|---|---|---|---|---|---|
| Power Consumption | 9% | -14% | 16% | -12% | -13% | |
| Idle Minimum * (Watt) | 7.5 | 9.9 -32% | 12.4 -65% | 6.2 17% | 8.2 -9% | 8.3 -11% |
| Idle Average * (Watt) | 9.5 | 13.9 -46% | 16.5 -74% | 13.9 -46% | 16.8 -77% | 19.9 -109% |
| Idle Maximum * (Watt) | 28.4 | 14.6 49% | 25 12% | 23.8 16% | 24.4 14% | 21.8 23% |
| Load Average * (Watt) | 139.1 | 95 32% | 132 5% | 95.7 31% | 131 6% | 110.9 20% |
| Witcher 3 ultra * (Watt) | 134 | 98.9 26% | 132 1% | 87 35% | 156.6 -17% | 165 -23% |
| Load Maximum * (Watt) | 220.8 | 170.8 23% | 134 39% | 132.6 40% | 201.8 9% | 171.8 22% |
* ... Moindre est la valeur, meilleures sont les performances
Power Consumption Witcher 3 / Stresstest
Power Consumption external Monitor
Autonomie de la batterie
L'autonomie du réseau local sans fil est d'un peu moins de 6 heures, ce qui est inférieur à celle des modèles Precision 5560 ou 7550 Precision 7550. Cela est dû en grande partie à l'écran OLED qui consomme plus d'énergie que l'écran IPS lors de l'affichage des couleurs blanches consomme plus d'énergie que l'IPS lors de l'affichage de couleurs blanches. Étant donné que la plupart des sites Web sont de couleur blanche prédominante, la durée de vie de la batterie généralement plus courte n'est pas inattendue
Le chargement avec l'adaptateur secteur fourni prend environ 2 heures. Le système ne peut pas être rechargé via USB-C car il ne prend pas en charge PD-in.
| Dell Precision 7670 i7-12850HX, RTX A2000 Laptop GPU, 83 Wh | Lenovo ThinkPad P1 G4-20Y4Z9DVUS i7-11800H, T1200 Laptop GPU, 90 Wh | Asus ProArt StudioBook 16 W7600H5A-2BL2 W-11955M, RTX A5000 Laptop GPU, 90 Wh | Dell Precision 5000 5560 i7-11850H, RTX A2000 Laptop GPU, 86 Wh | Dell Precision 7550 W-10885M, Quadro RTX 5000 Max-Q, 95 Wh | HP ZBook Fury 15 G8 i9-11950H, RTX A5000 Laptop GPU, 94 Wh | |
|---|---|---|---|---|---|---|
| Autonomie de la batterie | 49% | -15% | 32% | 23% | 5% | |
| Reader / Idle (h) | 7.9 | 12 52% | 11.1 41% | |||
| WiFi v1.3 (h) | 5.9 | 8.8 49% | 5 -15% | 6.3 7% | 8.9 51% | 6.2 5% |
| Load (h) | 1.3 | 1.8 38% | 1 -23% | |||
| H.264 (h) | 1.8 | |||||
| Witcher 3 ultra (h) | 1.6 |
Points positifs
Points négatifs
Verdict - Puissant sans être trop gros
Le Precision 7670 est en concurrence directe avec le HP ZBook Fury 16 G9. Puisque nous n'avons pas encore examiné le modèle HP, nous ne pouvons que comparer notre Precision au 16-inchLenovo ThinkPad P1 G4 ouAsus ProArt StudioBook Pro 16 W7600. Le modèle Dell est en mesure d'offrir des performances de CPU nettement plus rapides que ces deux modèles, ainsi que de nombreuses autres fonctions auxiliaires, notamment une facilité d'entretien, une connectivité WAN et davantage d'options de stockage.
L'ordinateur Precision 7670 est à son meilleur lorsqu'il est configuré avec des options de CPU et de GPU haut de gamme. Cependant, avec des options plus bas de gamme, vous pouvez trouver des alternatives plus fines et plus légères qui peuvent offrir à peu près le même niveau de performance.
Le poids est l'un des principaux inconvénients du Precision 7670, car le système est presque aussi lourd que le grand Precision 7550 de 17,3 pouces. De plus, il est un peu décevant que le Core i7-12850HX ne puisse pas maintenir les fréquences d'horloge Turbo Boost pendant de longues périodes malgré son poids élevé. Il est toujours rapide, mais la solution de refroidissement qui le recouvre limite son potentiel. L'absence d'options de CPU Xeon fait que le Precision 7670 ressemble plus à un ordinateur portable de type studio qu'à la station de travail à part entière pour laquelle il est commercialisé.
Le Precision 7670 est tout de même idéal pour les utilisateurs intensifs qui peuvent bénéficier de tous ces cœurs Intel de 12e génération et d'un GPU RTX A5500 haut de gamme. Pour les configurations bas de gamme, cependant, des modèles de 16 pouces plus fins et plus légers comme ceux de Lenovo ou Asus mentionnés plus haut peuvent encore être des alternatives décentes.
Prix et disponibilité
Le Precision 7670 est actuellement disponible sur Newegg avec une seule configuration. Nous vous recommandons de commander directement auprès de Dell pour un plus grand choix de configurations et d'options de garantie.
Dell Precision 7670
- 10/06/2022 v7 (old)
Allen Ngo
Price comparison

