Test du Lenovo ThinkPad P16 G1 RTX A5500 : plus puissant que le Dell Precision 7670
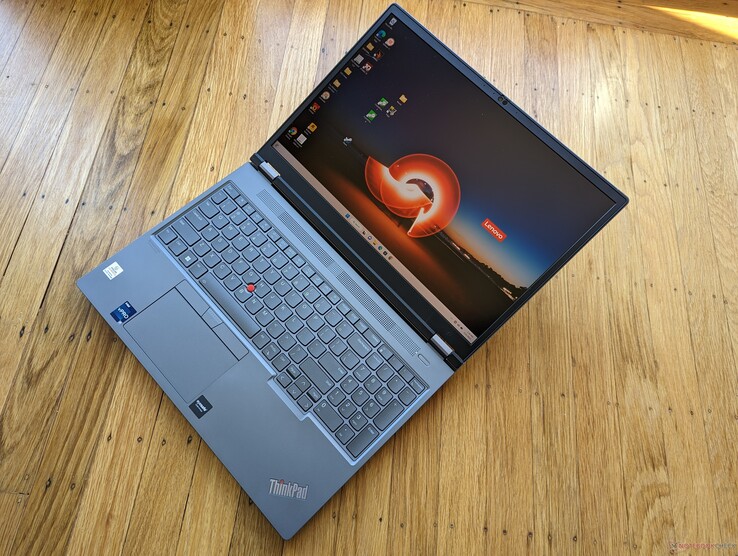
Le ThinkPad P16 G1 est une nouvelle génération de stations de travail ThinkPad de 16 pouces conçue pour surpasser la série ThinkPad P1 de 16 pouces existante .. Il embarque certains des processeurs mobiles et des GPU de station de travail les plus rapides actuellement disponibles, jusqu'au Core i9-12950HX et au RTX A5500, respectivement, pour être l'une des stations de travail mobiles les plus rapides du marché. Notre unité, telle qu'elle est configurée, est vendue au détail pour environ 9000 dollars américains. Bien sûr, des SKU plus bas de gamme avec des graphiques UHD intégrés plus lents ou l'Intel ARC Pro A30M sont également disponibles avec des prix de départ de 3400 $ plutôt.
Ce modèle est en concurrence directe avec d'autres stations de travail mobiles haut de gamme et certains ordinateurs portables Nvidia Studio, comme les modèles Dell Precision 7670, Asus ProArt StudioBook Pro 16, MSI CreatorPro Z16P, ou HP ZBook Studio 16 G9. Consultez notre article complet sur la configuration ThinkPad P16 G1 RTX A2000 pour en savoir plus sur le châssis et les autres caractéristiques physiques du modèle. Cet article se concentre sur ce que les utilisateurs peuvent attendre du ThinkPad P16 G1 en termes de performances s'il est configuré avec les options de CPU et de GPU les plus haut de gamme.
Plus de commentaires sur Lenovo :
Comparaison avec les concurrents potentiels
Note | Date | Modèle | Poids | Épaisseur | Taille | Résolution | Prix |
|---|---|---|---|---|---|---|---|
| 91 % v7 (old) | 02/23 | Lenovo ThinkPad P16 G1 RTX A5500 i9-12950HX, RTX A5500 Laptop GPU | 3 kg | 30.23 mm | 16.00" | 3840x2400 | |
v (old) | 12/21 | Asus ProArt StudioBook 16 W7600H5A-2BL2 W-11955M, RTX A5000 Laptop GPU | 2.4 kg | 21.4 mm | 16.00" | 3840x2400 | |
| 89.1 % v7 (old) | 12/22 | Dell Precision 7000 7670 Performance i9-12950HX, RTX A5500 Laptop GPU | 2.8 kg | 25.95 mm | 16.00" | 3840x2400 | |
| 88.2 % v7 (old) | 02/23 | Lenovo ThinkPad P16 G1 21D6001DMB i7-12850HX, RTX A2000 Laptop GPU | 3 kg | 30.23 mm | 16.00" | 2560x1600 | |
| 84.3 % v7 (old) | 11/22 | MSI CreatorPro Z16P B12UKST i7-12700H, RTX A3000 Laptop GPU | 2.4 kg | 19 mm | 16.00" | 2560x1600 | |
| 90.1 % v7 (old) | 11/22 | HP ZBook Studio 16 G9 62U04EA i7-12800H, RTX A2000 Laptop GPU | 1.8 kg | 19 mm | 16.00" | 3840x2400 |
Cas
Lecteur de carte SD
Le lecteur de cartes intégré offre des taux de transfert tout juste moyens. Le transfert de 1 Go de photos de notre carte de test UHS-II vers le bureau prend environ 14 secondes, contre moins de la moitié sur le Precision 7670. Pour une station de travail mobile haut de gamme comme notre ThinkPad P1, nous nous attendions à un peu plus.
| SD Card Reader | |
| average JPG Copy Test (av. of 3 runs) | |
| Dell Precision 7000 7670 Performance (Toshiba Exceria Pro SDXC 64 GB UHS-II) | |
| MSI CreatorPro Z16P B12UKST (AV Pro V60) | |
| Lenovo ThinkPad P16 G1 RTX A5500 (Toshiba Exceria Pro SDXC 64 GB UHS-II) | |
| HP ZBook Studio 16 G9 62U04EA (Angelbird AV PRO V60) | |
| Asus ProArt StudioBook 16 W7600H5A-2BL2 (AV Pro SD microSD 128 GB V60) | |
| Lenovo ThinkPad P16 G1 21D6001DMB (AV Pro V60) | |
| maximum AS SSD Seq Read Test (1GB) | |
| Dell Precision 7000 7670 Performance (Toshiba Exceria Pro SDXC 64 GB UHS-II) | |
| Asus ProArt StudioBook 16 W7600H5A-2BL2 (AV Pro SD microSD 128 GB V60) | |
| MSI CreatorPro Z16P B12UKST (AV Pro V60) | |
| Lenovo ThinkPad P16 G1 RTX A5500 (Toshiba Exceria Pro SDXC 64 GB UHS-II) | |
| HP ZBook Studio 16 G9 62U04EA (Angelbird AV PRO V60) | |
| Lenovo ThinkPad P16 G1 21D6001DMB (AV Pro V60) | |
Communication
| Networking | |
| iperf3 transmit AX12 | |
| Asus ProArt StudioBook 16 W7600H5A-2BL2 | |
| iperf3 receive AX12 | |
| Asus ProArt StudioBook 16 W7600H5A-2BL2 | |
| iperf3 receive AXE11000 6GHz | |
| MSI CreatorPro Z16P B12UKST | |
| HP ZBook Studio 16 G9 62U04EA | |
| Dell Precision 7000 7670 Performance | |
| Lenovo ThinkPad P16 G1 RTX A5500 | |
| iperf3 receive AXE11000 | |
| Lenovo ThinkPad P16 G1 21D6001DMB | |
| Lenovo ThinkPad P16 G1 RTX A5500 | |
| Dell Precision 7000 7670 Performance | |
| iperf3 transmit AXE11000 | |
| Lenovo ThinkPad P16 G1 RTX A5500 | |
| Lenovo ThinkPad P16 G1 21D6001DMB | |
| Dell Precision 7000 7670 Performance | |
| iperf3 transmit AXE11000 6GHz | |
| MSI CreatorPro Z16P B12UKST | |
| HP ZBook Studio 16 G9 62U04EA | |
| Lenovo ThinkPad P16 G1 RTX A5500 | |
| Dell Precision 7000 7670 Performance | |
Webcam


Maintenance
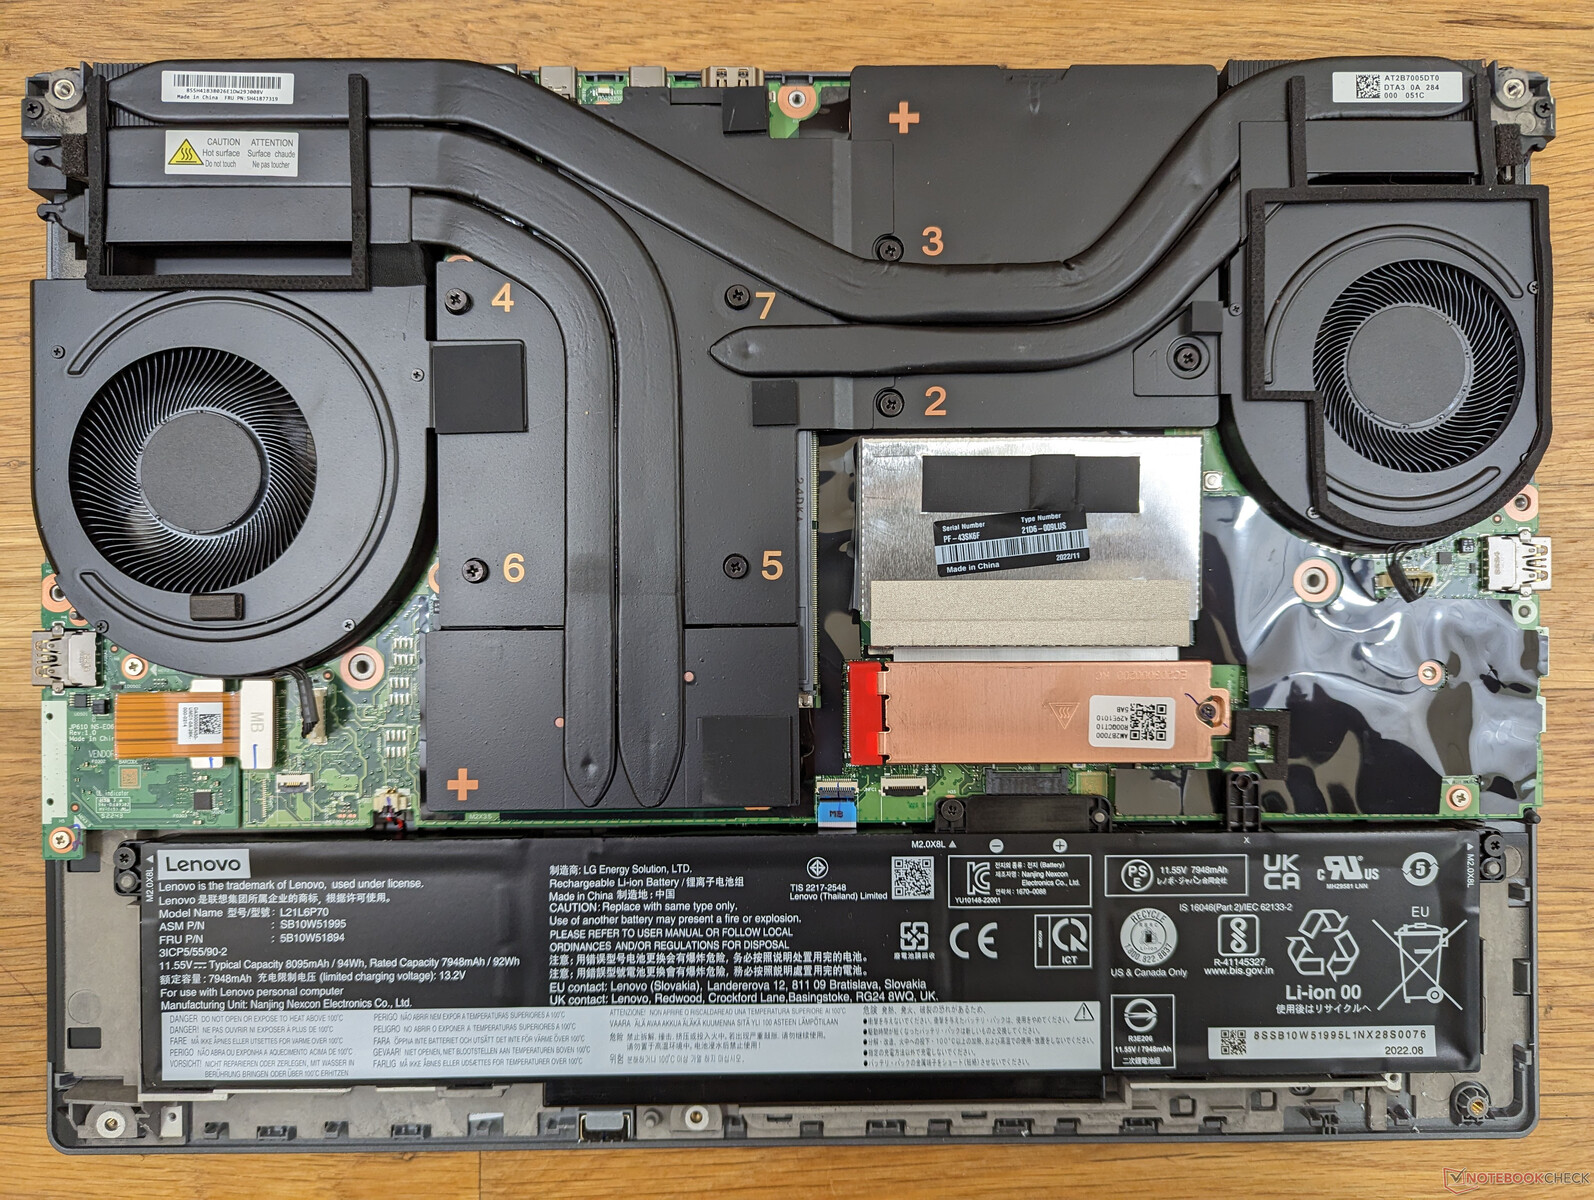
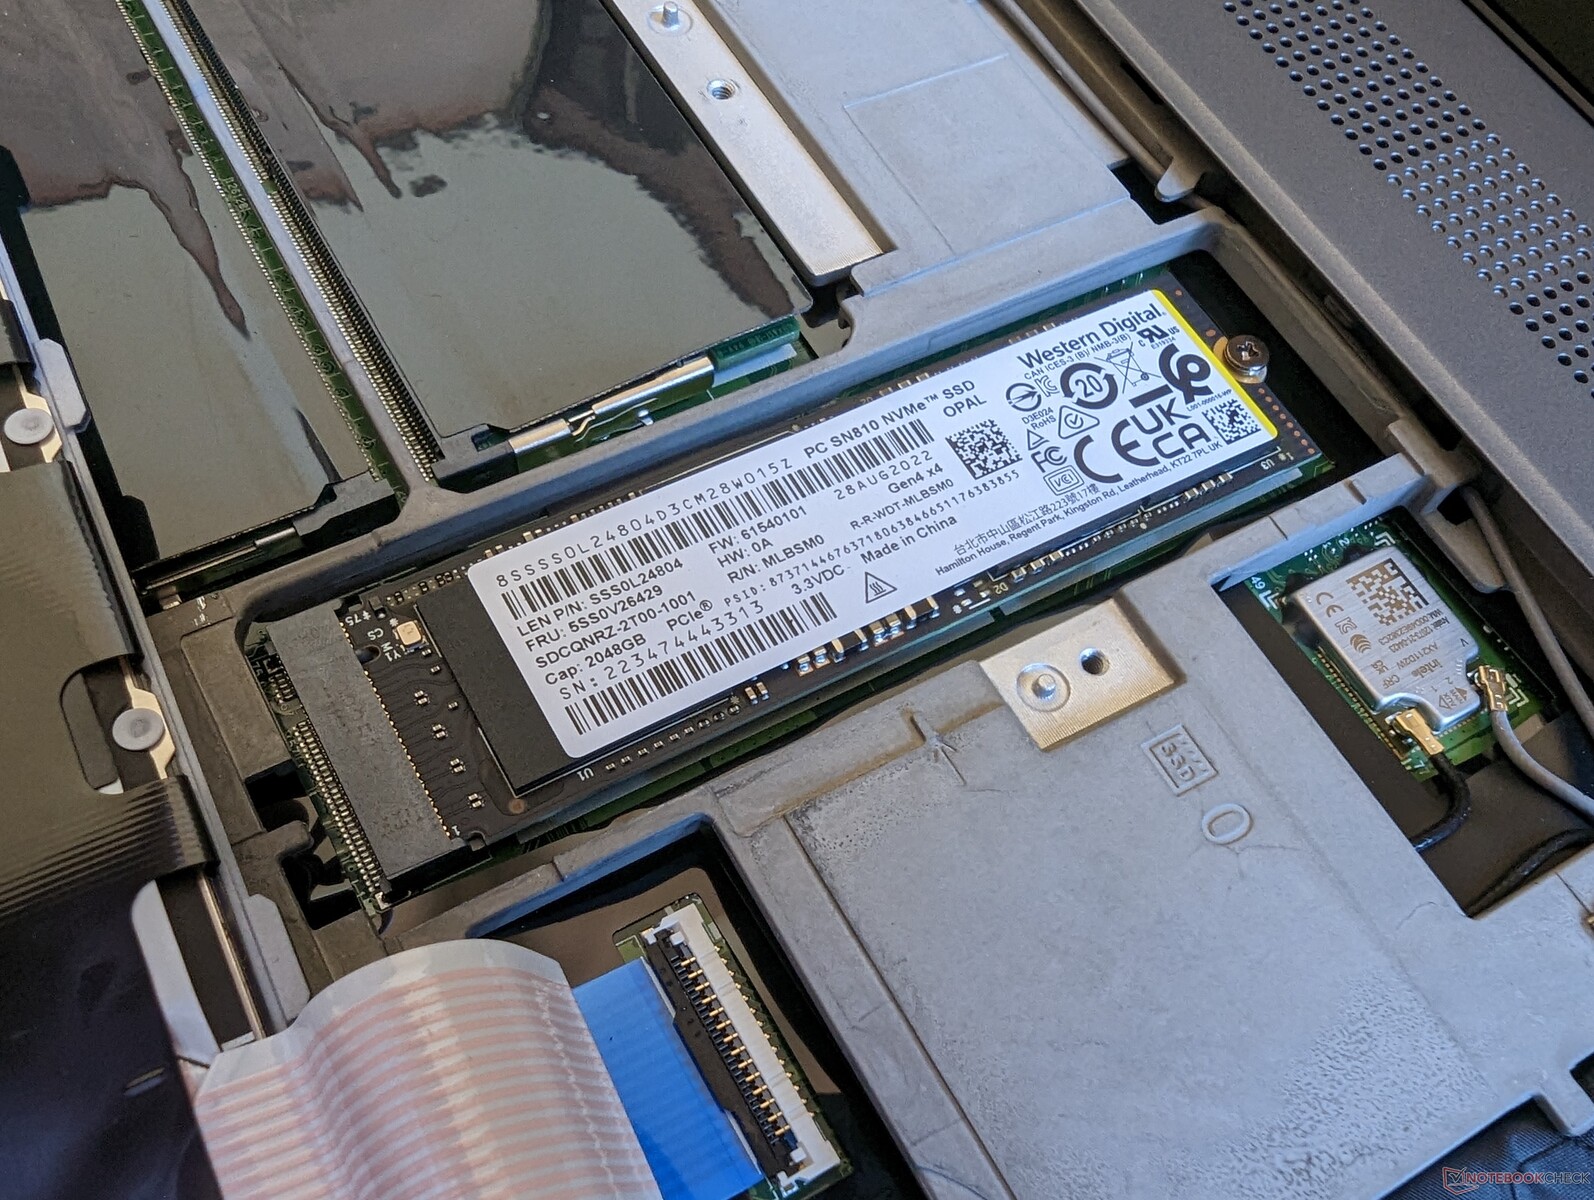
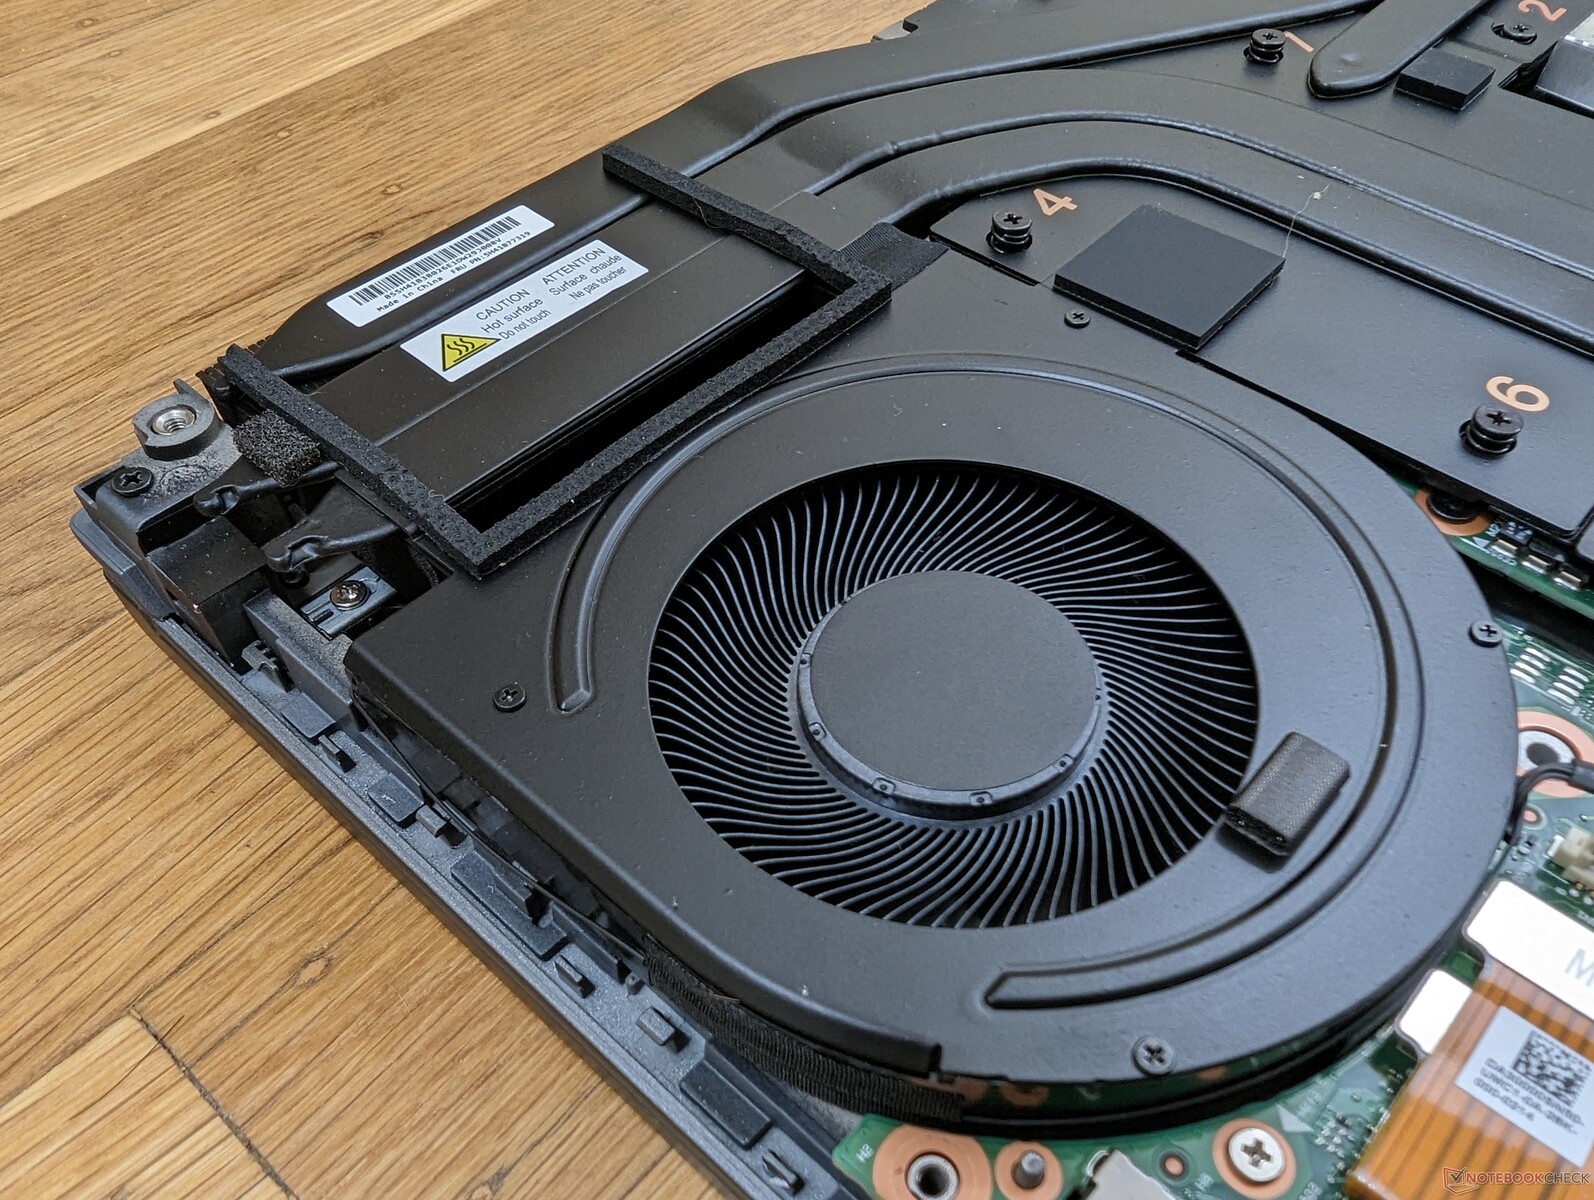
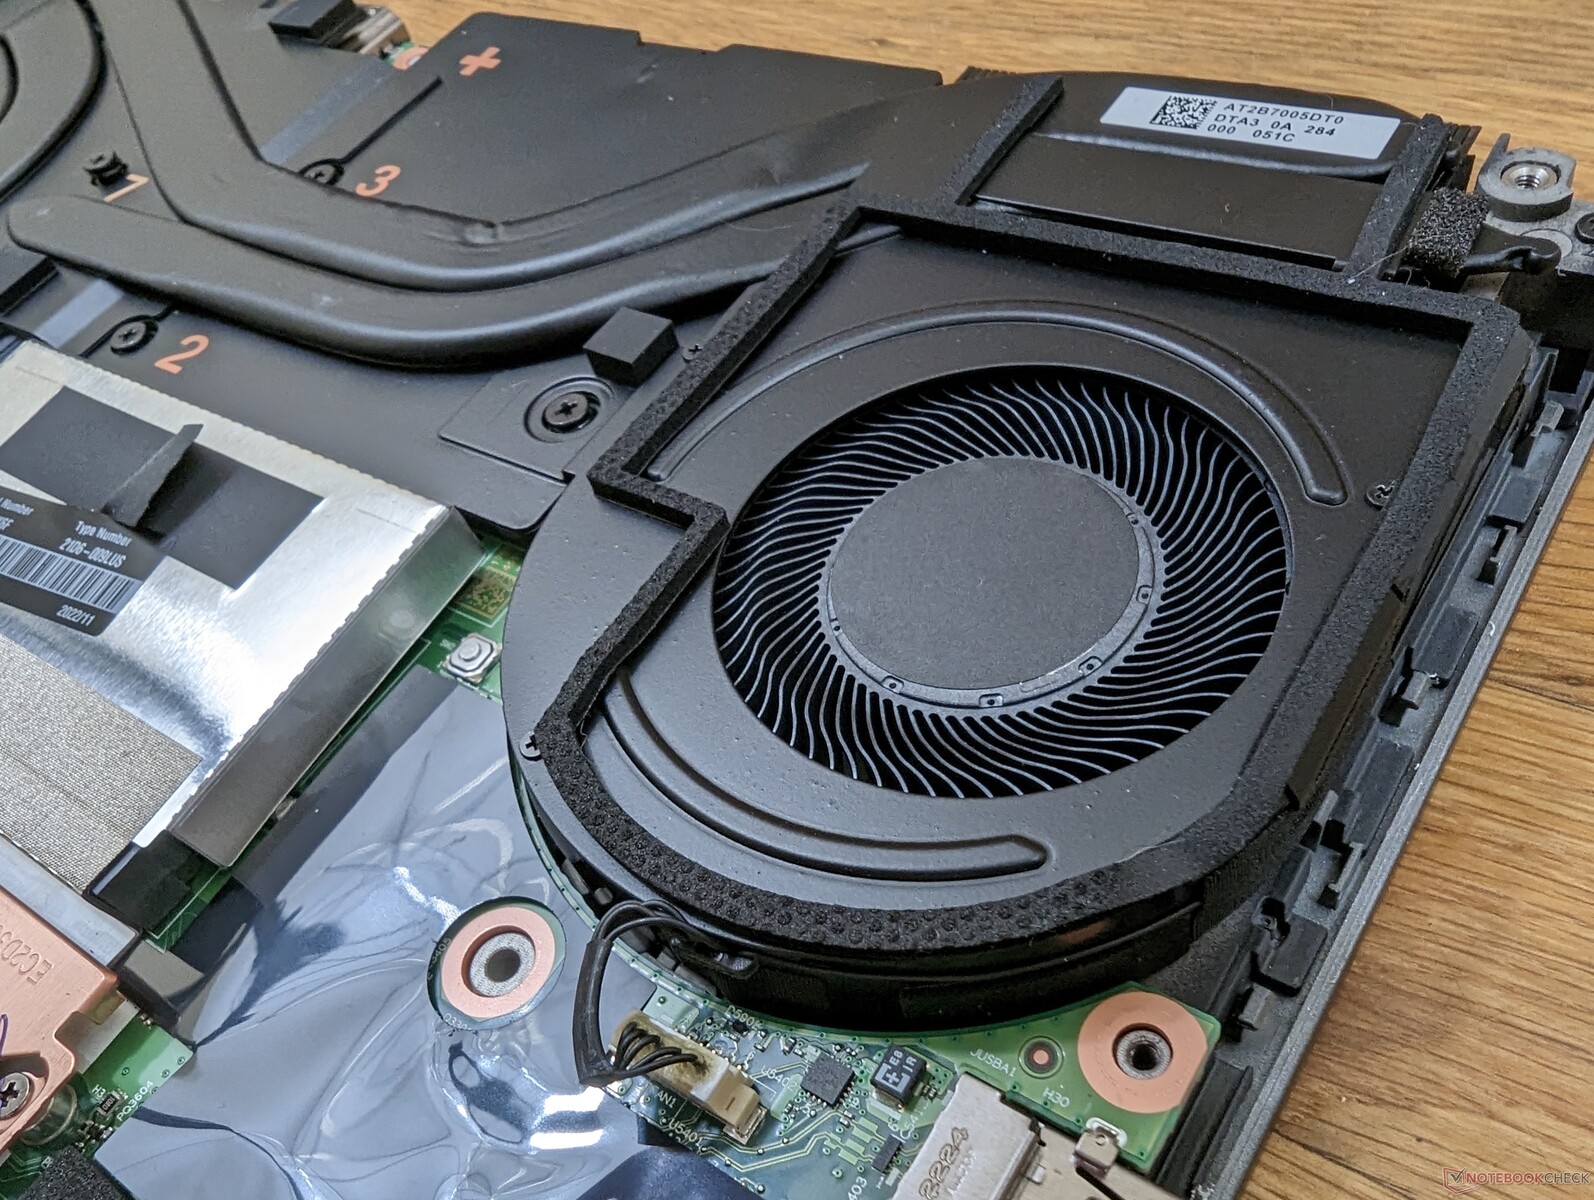
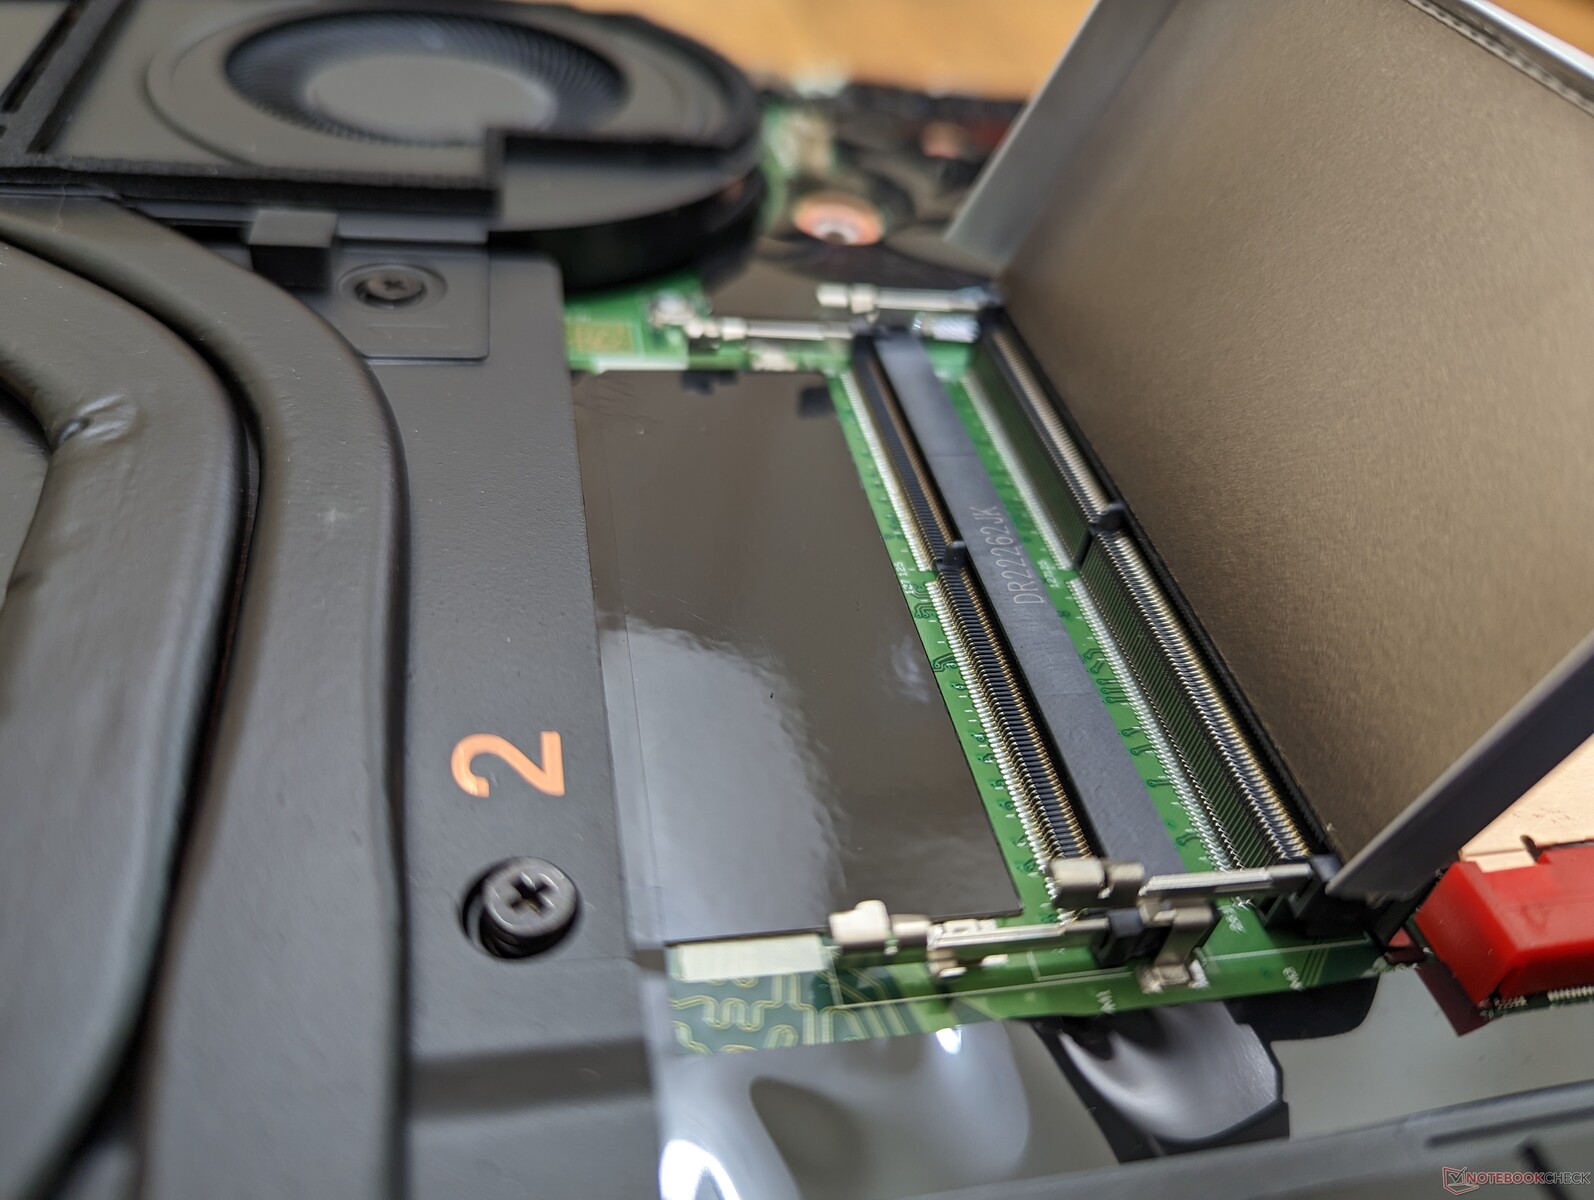
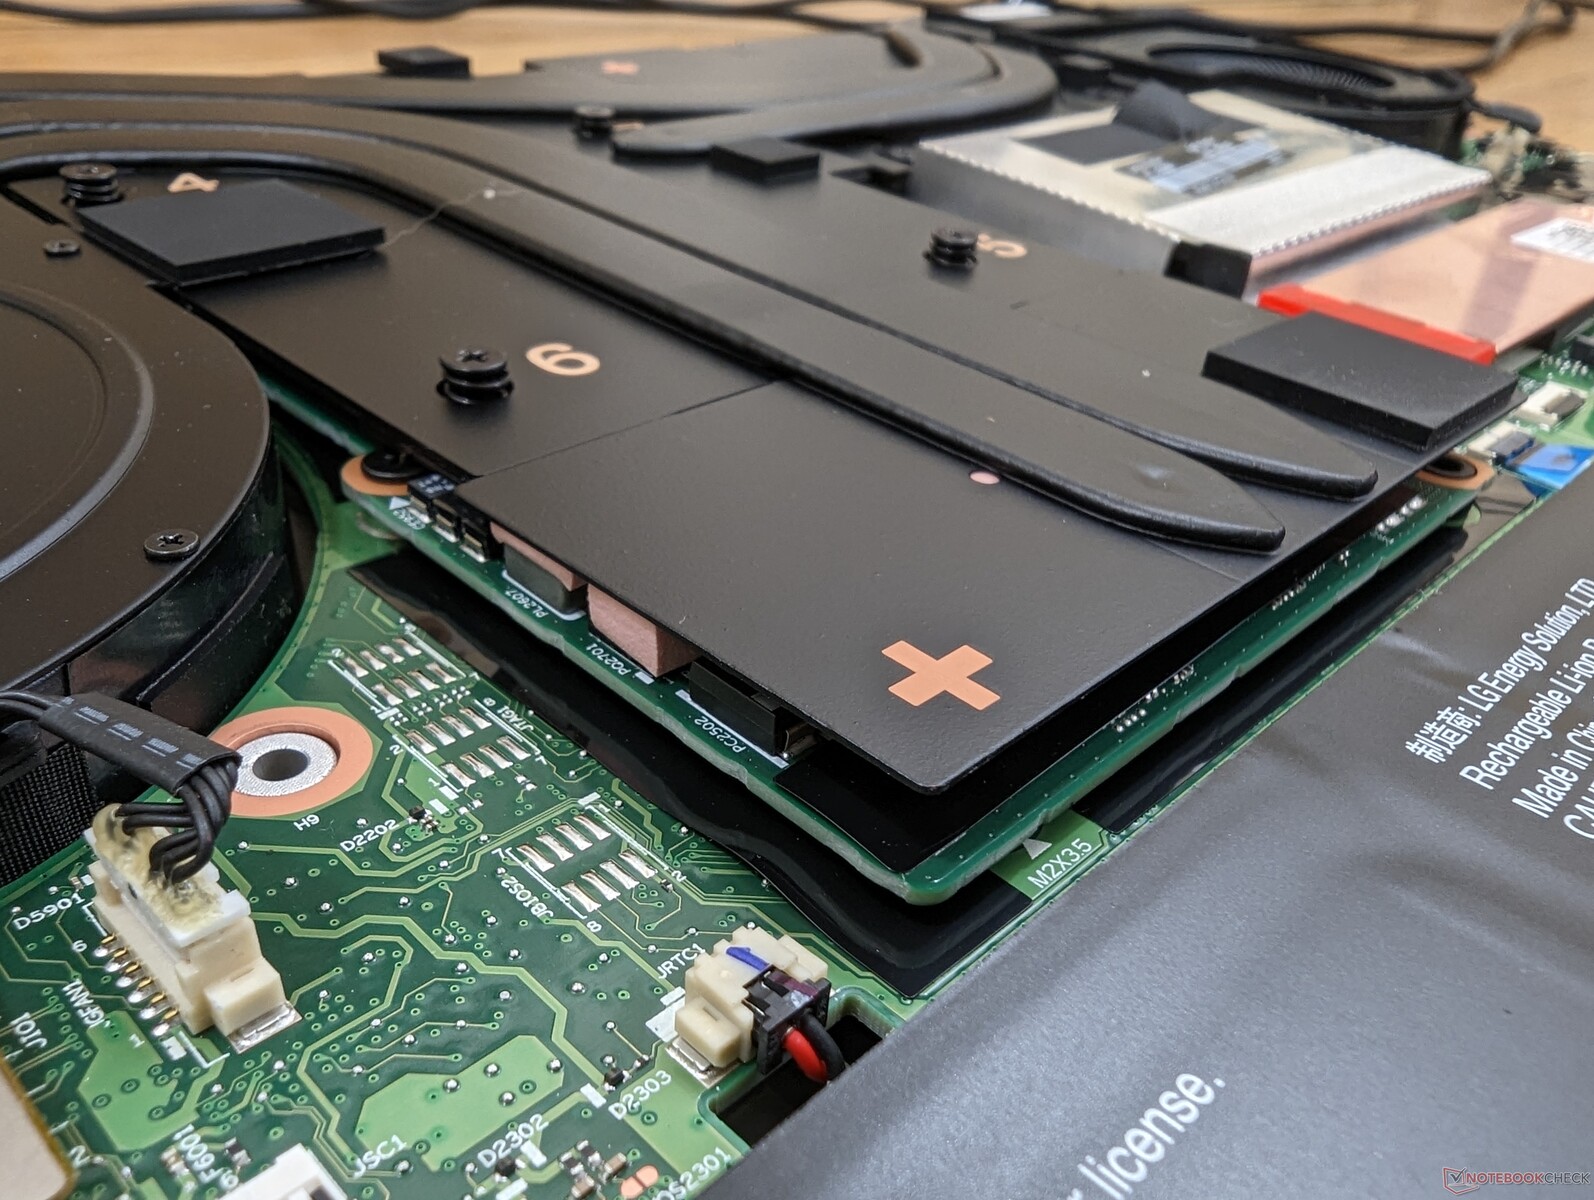
Le panneau inférieur est fixé par 12 vis Philips. Le clavier doit être retiré pour accéder au module WAN, à l'emplacement SSD M.2 primaire et à deux des quatre emplacements SODIMM. Lenovo dispose d'un manuel de maintenance officiel https://download.lenovo.com/pccbbs/mobiles_pdf/p16_gen1_hmm_en.pdf que les utilisateurs finaux doivent suivre.
Il est intéressant de noter que le ThinkPad P16 G1 est l'un des très rares ordinateurs portables livrés avec une carte graphique amovible. Le remplacement de la carte graphique d'un ordinateur portable n'est généralement pas recommandé, sauf à des fins de maintenance ou de remplacement.
Accessoires et garantie
Il n'y a pas d'extras dans la boîte de détail, à part l'adaptateur secteur et les papiers.
Une garantie limitée d'un an s'applique alors que le Dell Precision 7670 est livré avec trois ans en standard. Lenovo propose toutefois un service sur site pendant la durée d'un an si nécessaire.
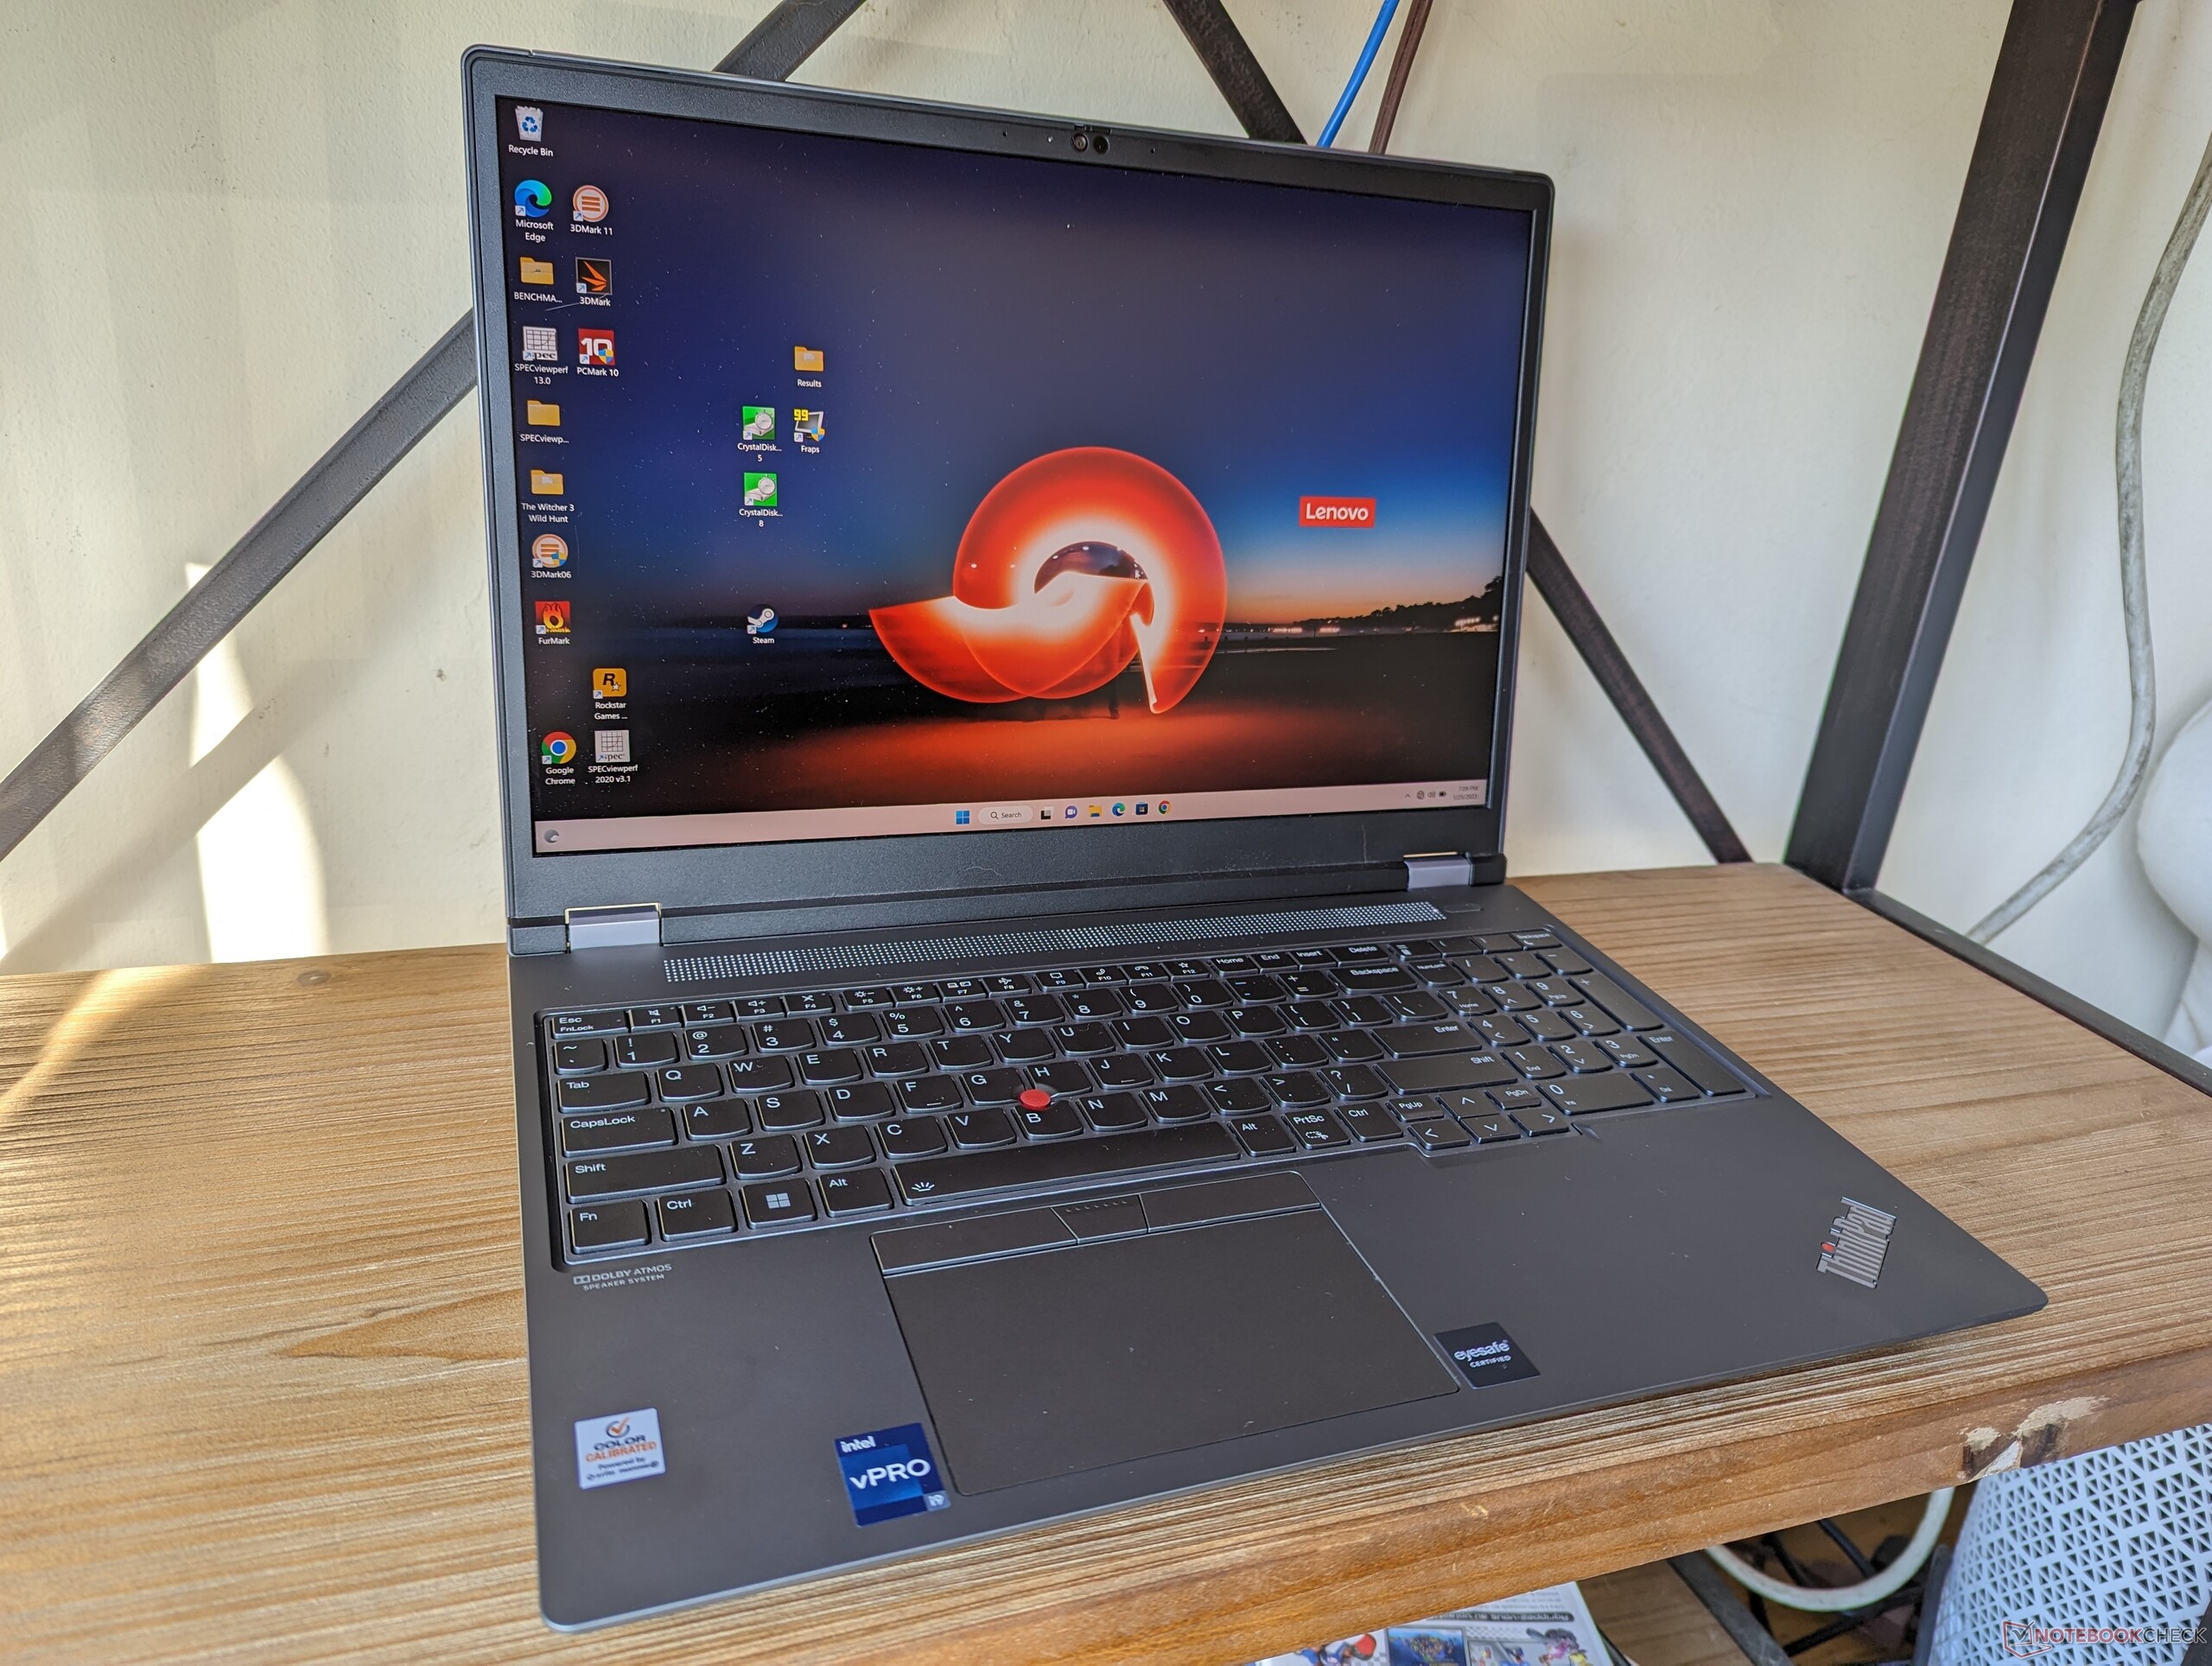
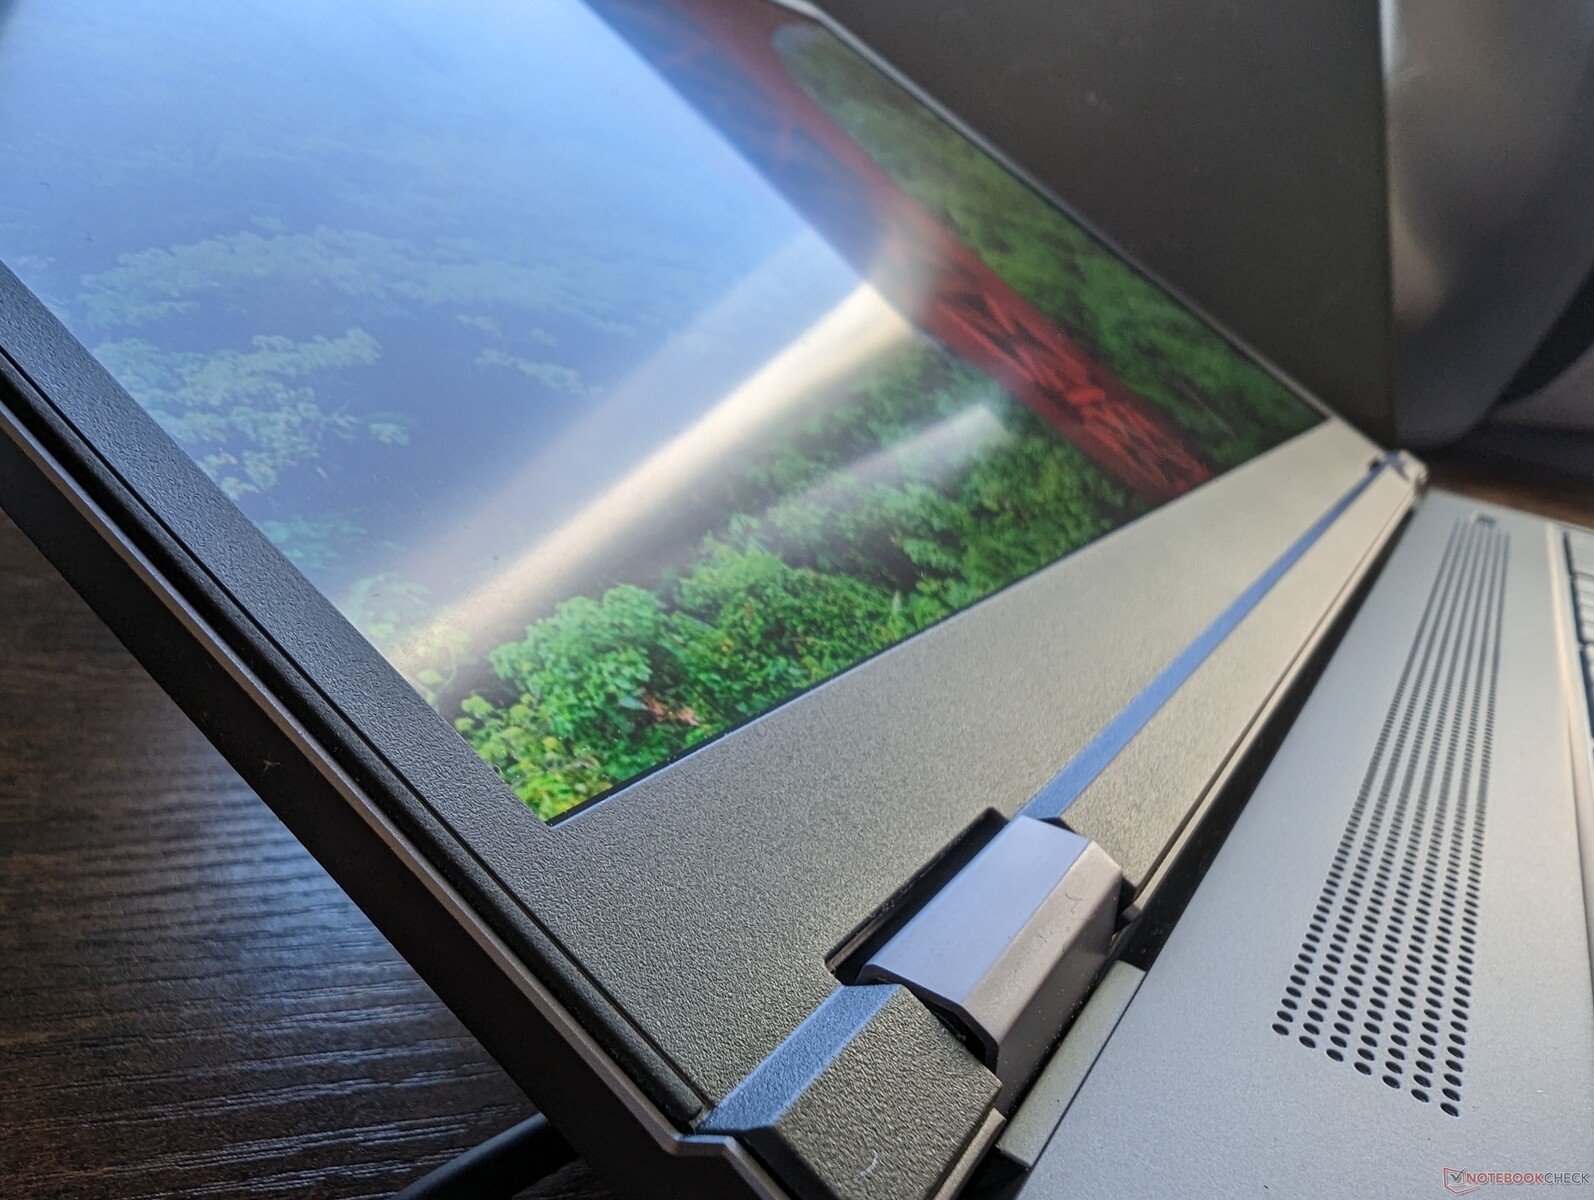
Afficher
Lenovo propose quatre options d'affichage 60 Hz différentes, qui sont toutes calibrées en usine par Pantone et dotées d'une gradation DC. Nos mesures ci-dessous reflètent uniquement l'option en gras tandis que notre deuxième unité avec le GPU RTX A2000 est équipée de l'option 1600p.
- 1920 x 1200, non tactile, IPS, 300 nits, mat, 100% sRGB
- 2560 x 1600, non tactile, IPS, 400-nits, mat, 100% sRGB
- 3840 x 2400, non-touch, IPS, 600-nits, mat, 100% AdobeRGB
- 3840 x 2400, tactile, OLED, 400-nits, brillant, 100% DCI-P3
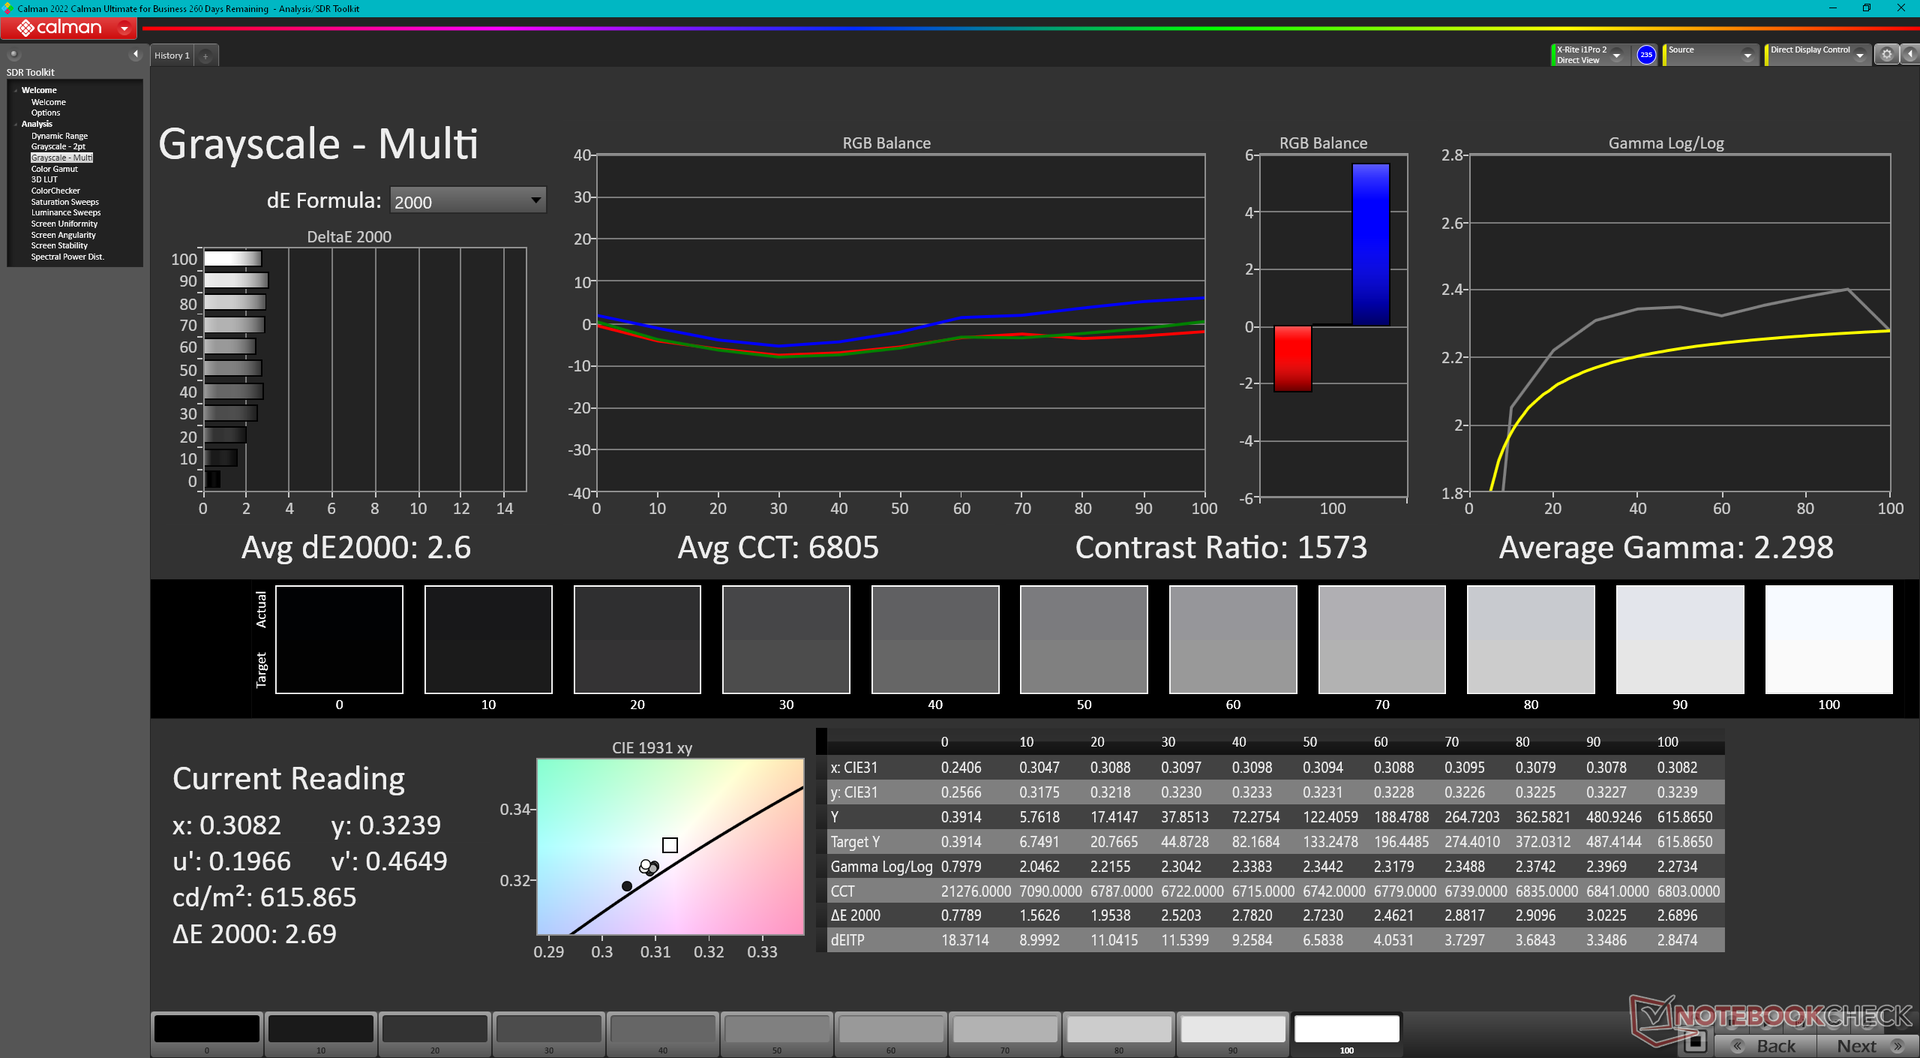
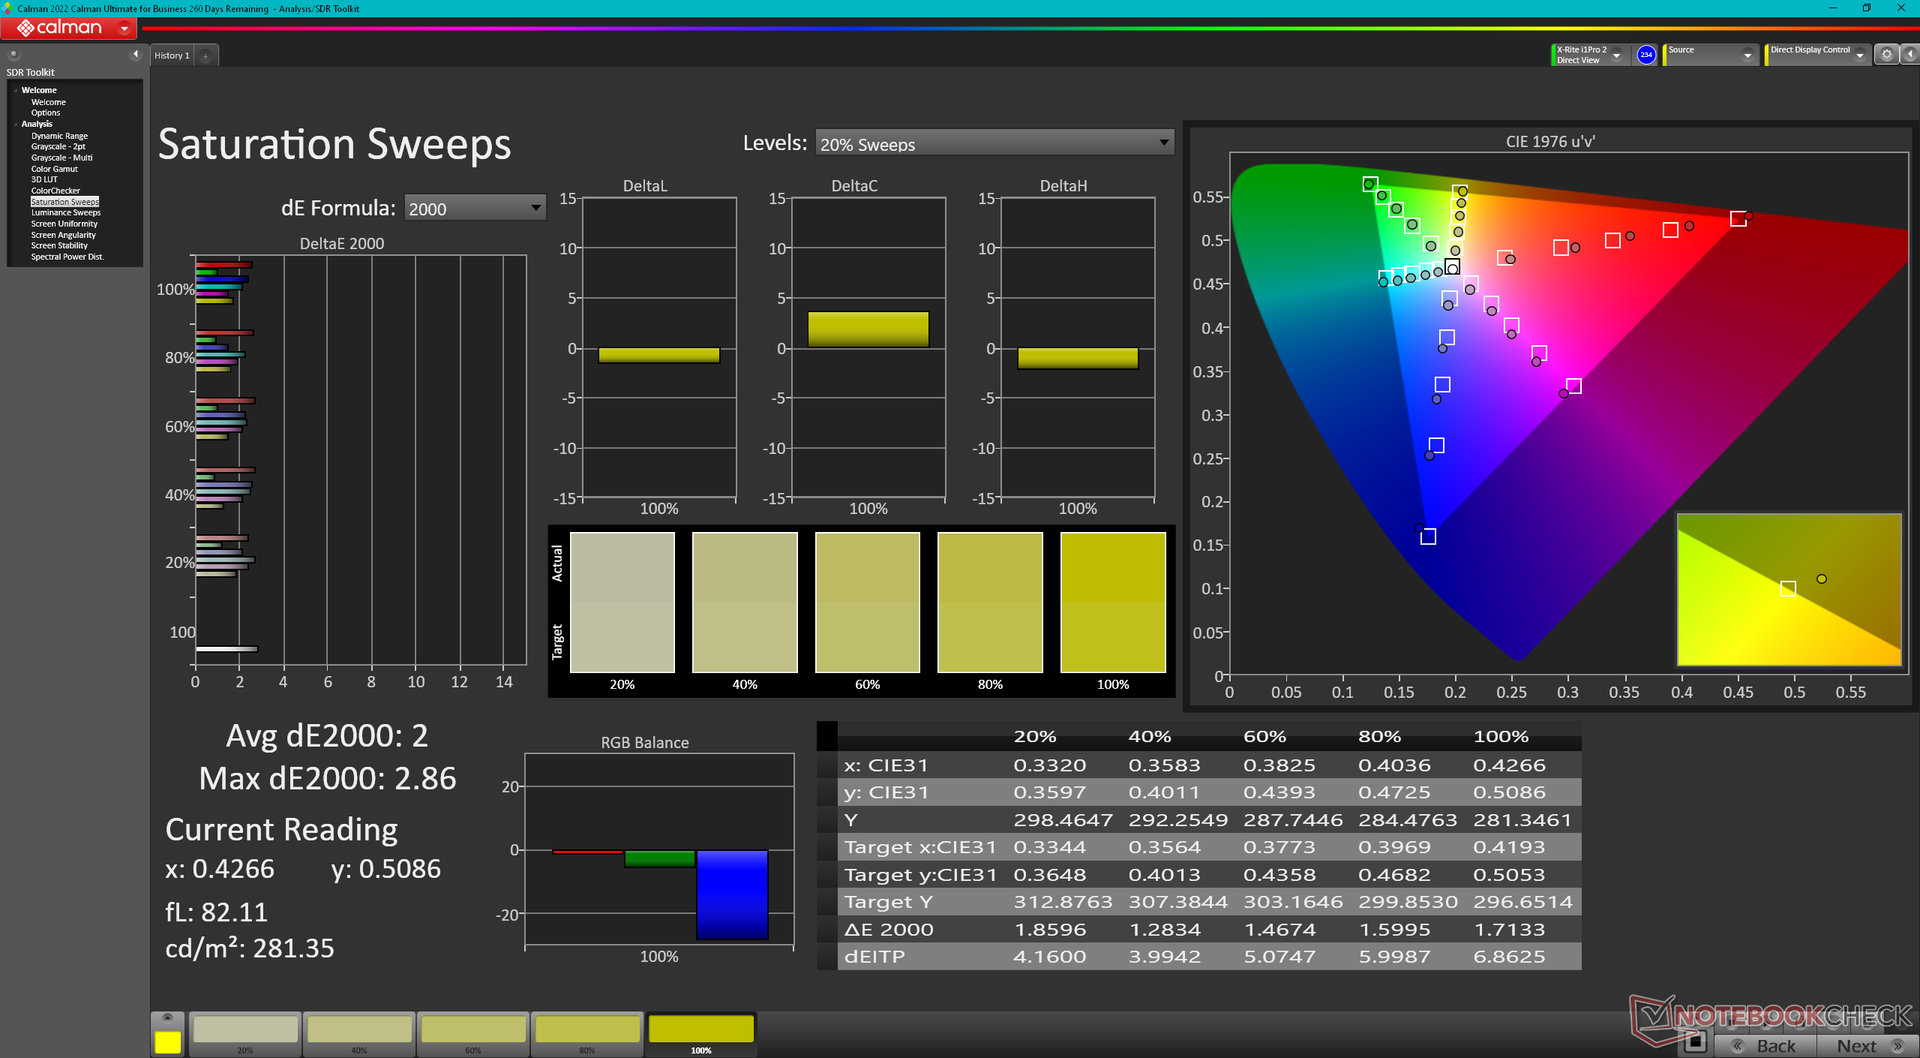
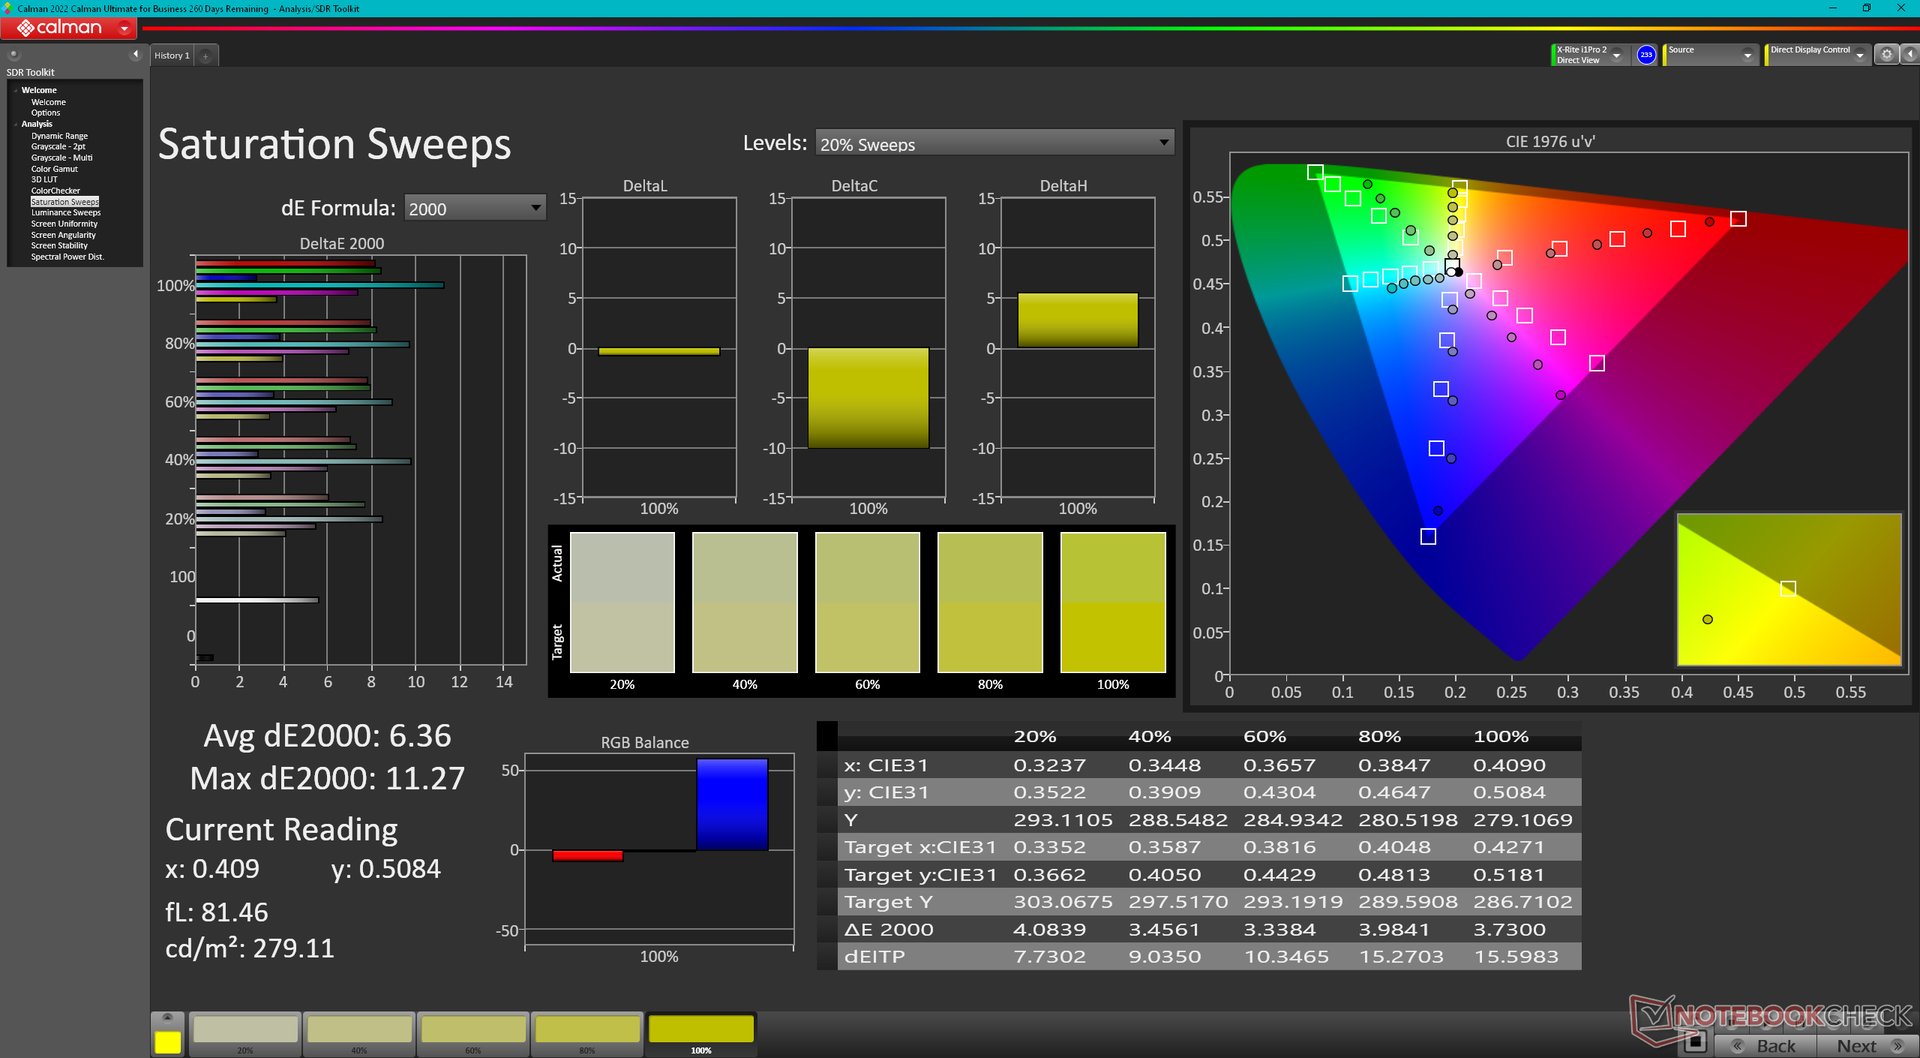
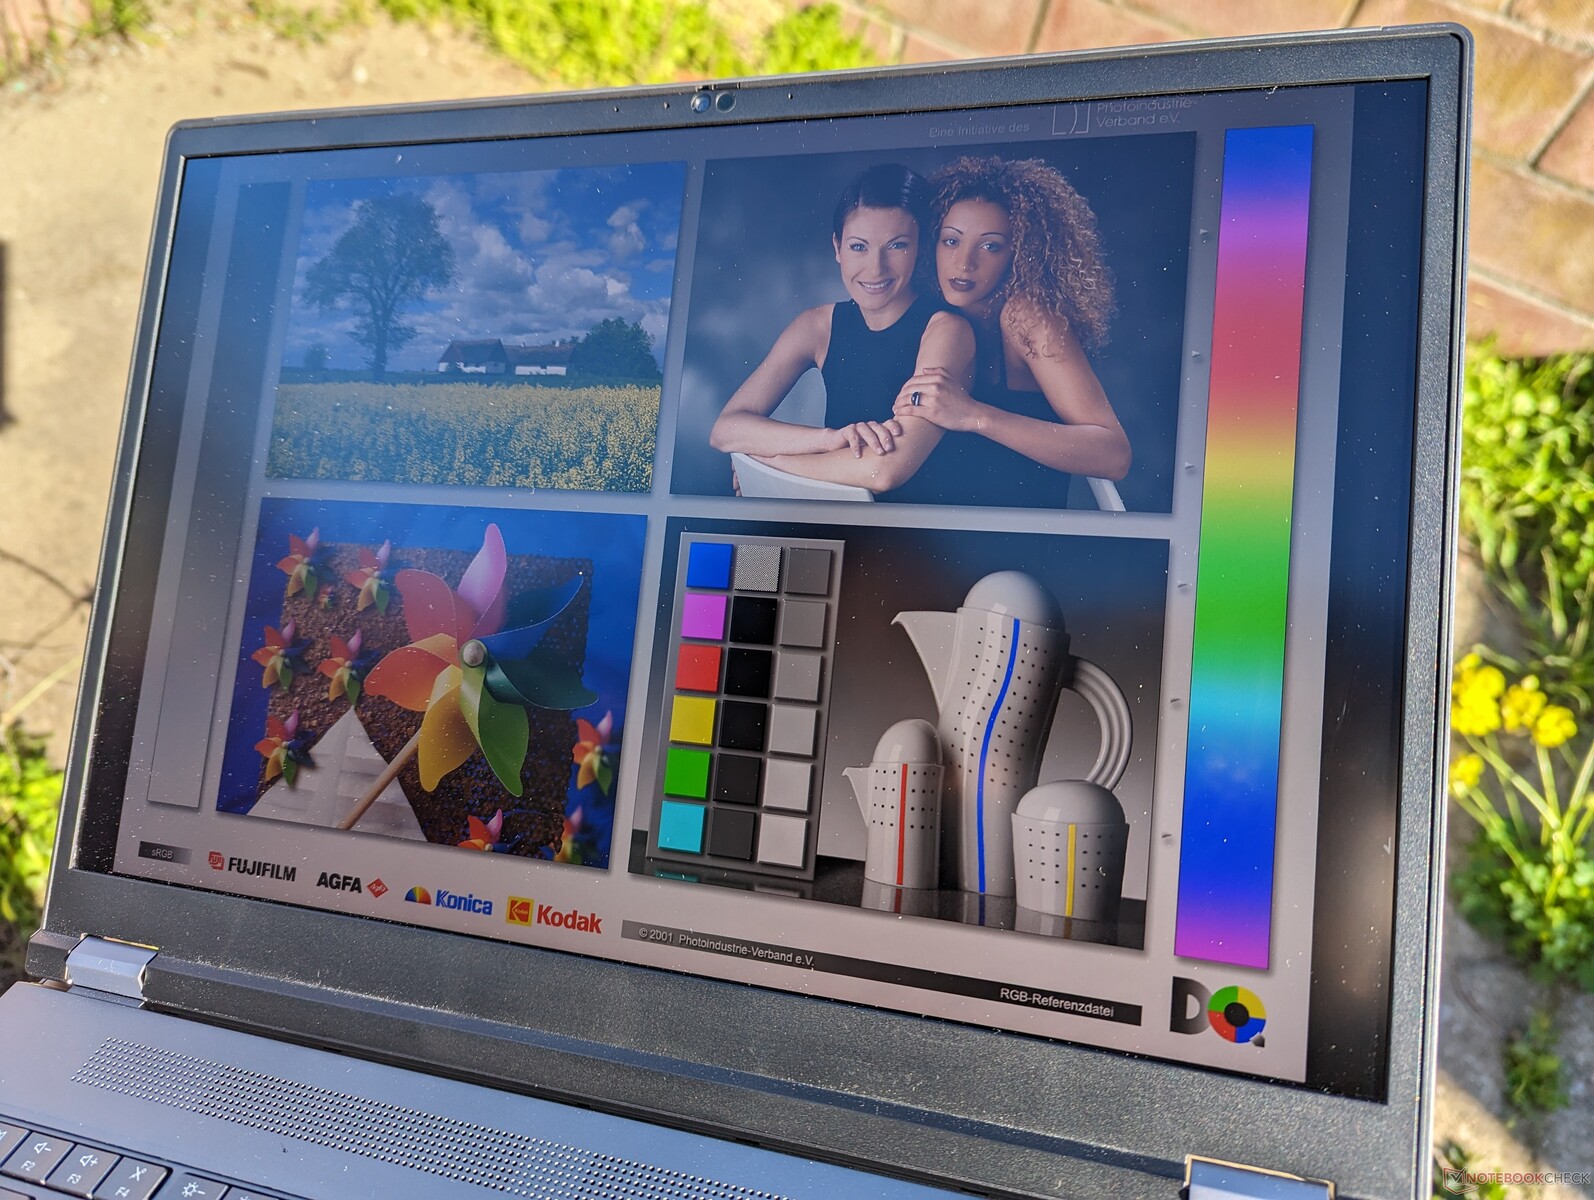
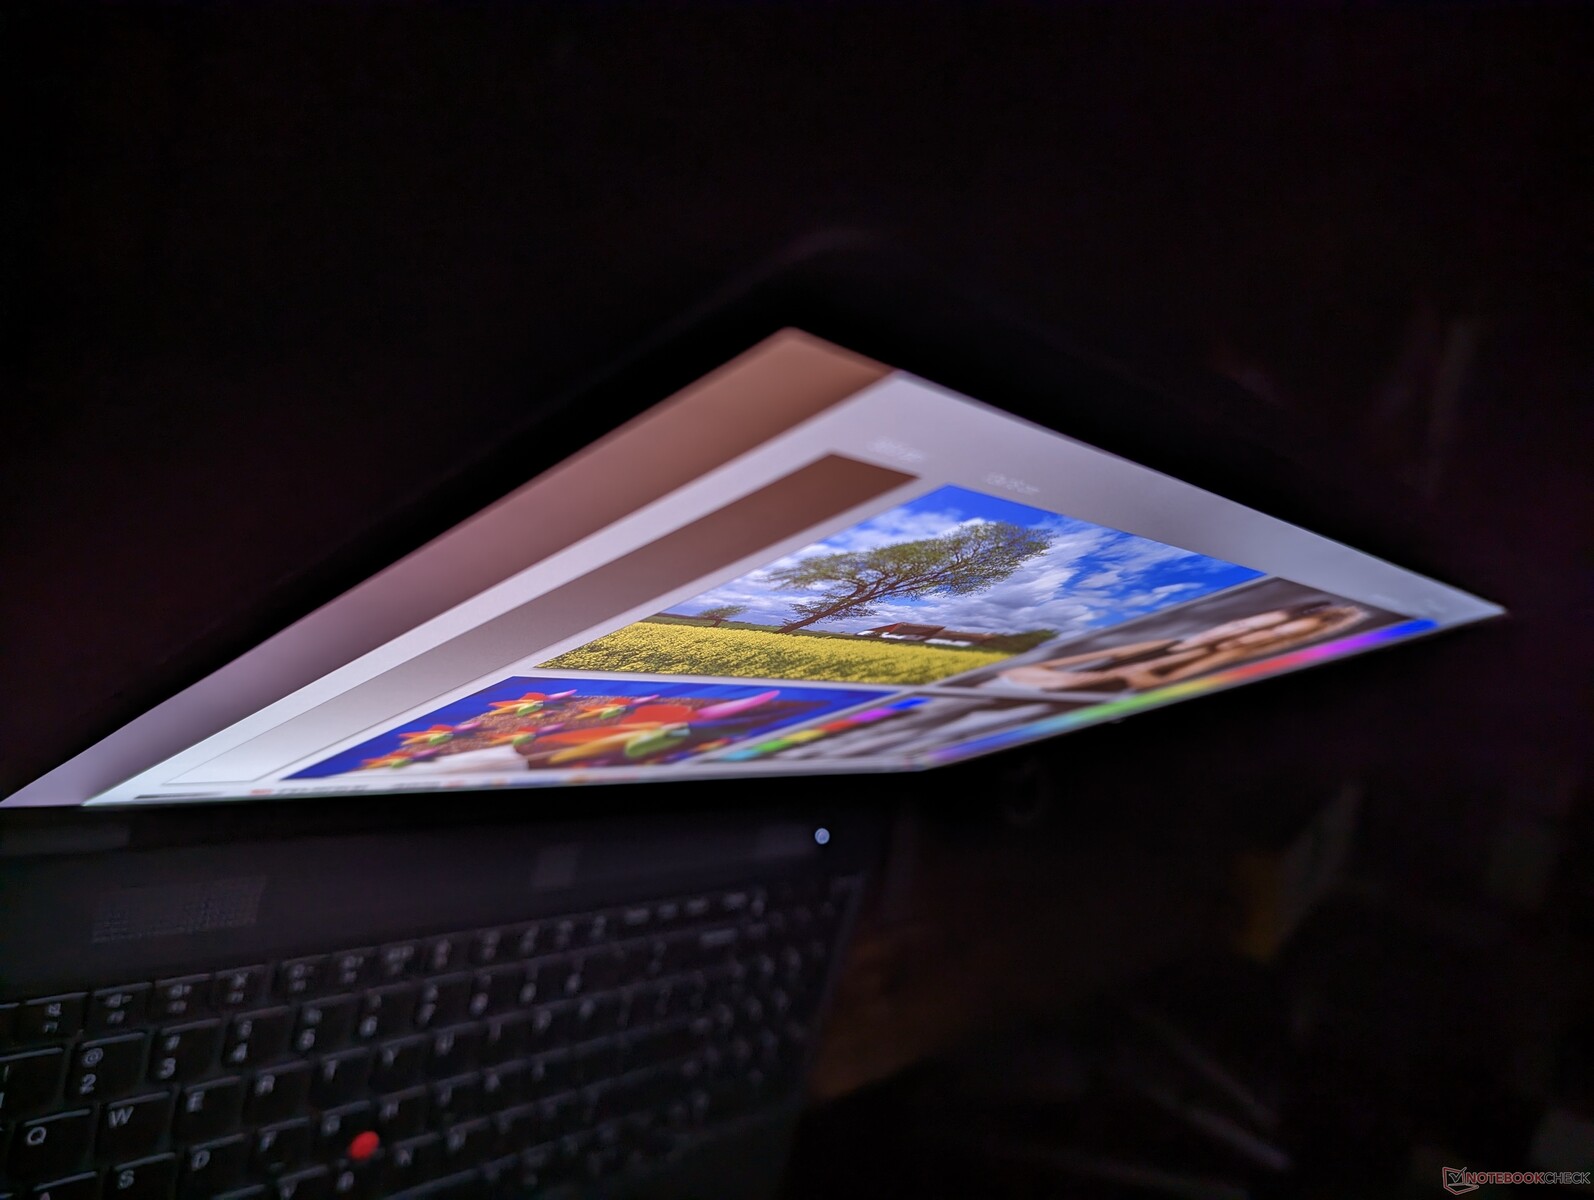
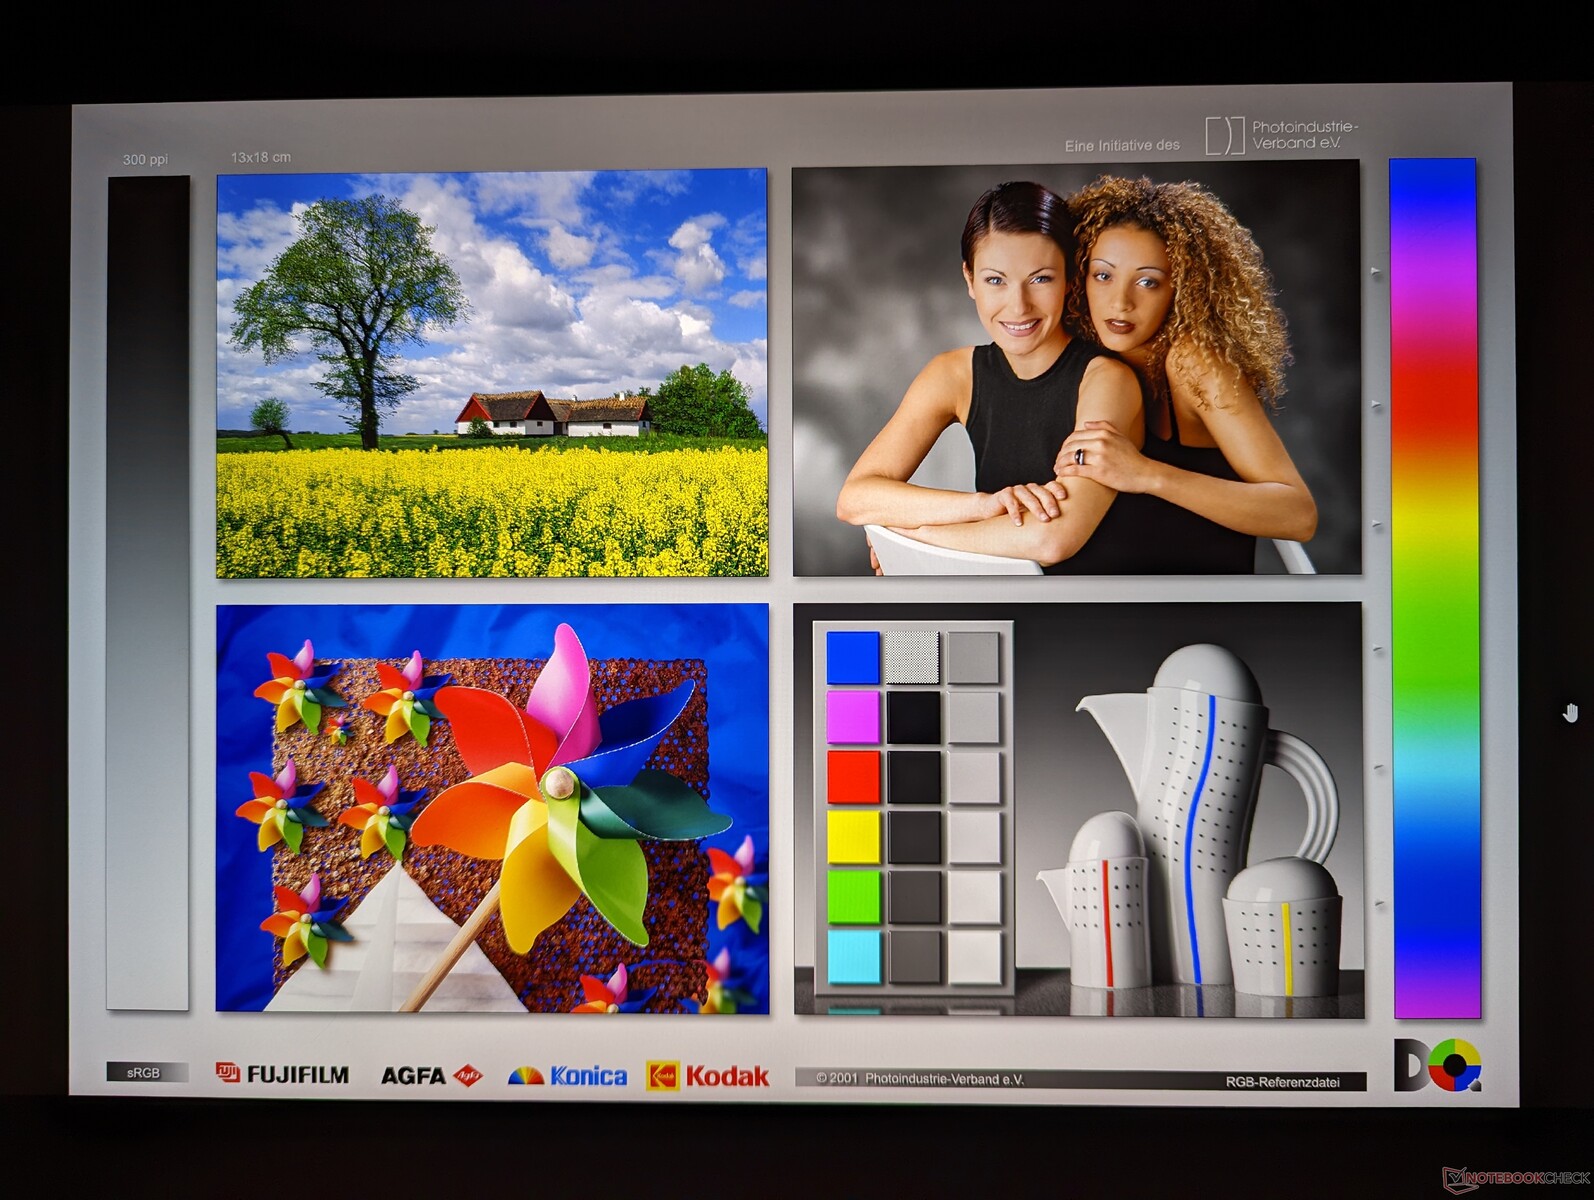
Nos mesures indépendantes peuvent confirmer la couverture complète d'AdobeRGB et la luminosité de 600 nits. La distribution de la luminosité, cependant, n'est que moyenne malgré l'objectif de 600-nits. Le quadrant supérieur gauche de notre écran, par exemple, est 29 % plus lumineux que le quadrant inférieur droit (642 nits contre 497 nits). Le choix de la dalle OLED améliorerait la répartition de la luminosité, mais nous nous attendions à mieux de notre dalle IPS compte tenu du prix demandé pour le ThinkPad P1 G1.
Il convient de noter que Lenovo utilise la même dalle IPS LP160UQ1-SPB1 sur le ThinkPad P1 G1 pour ses autres modèles ThinkPad de 16 pouces, notamment leThinkPad P1 G4 etThinkPad X1 Extreme G4.


| |||||||||||||||||||||||||
Homogénéité de la luminosité: 77 %
Valeur mesurée au centre, sur batterie: 601.9 cd/m²
Contraste: 1281:1 (Valeurs des noirs: 0.47 cd/m²)
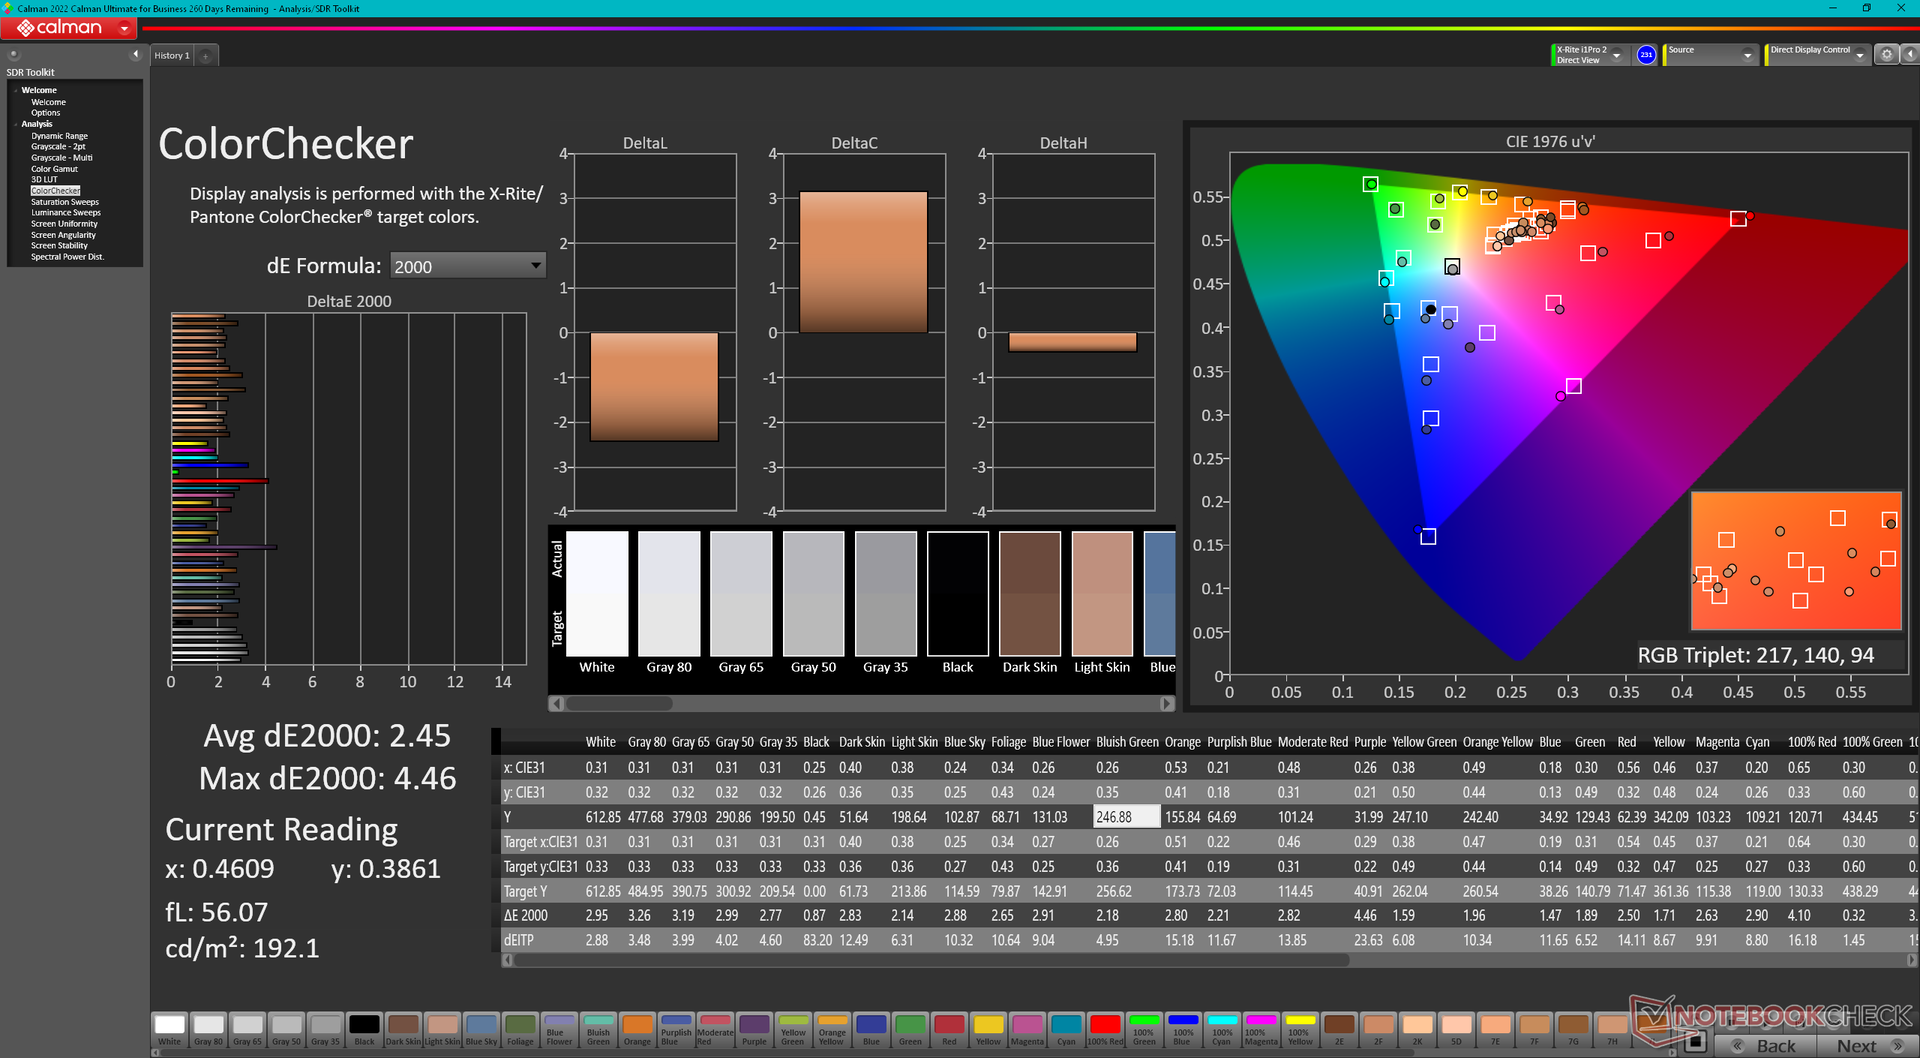
ΔE ColorChecker Calman: 2.45 | ∀{0.5-29.43 Ø4.72}
ΔE Greyscale Calman: 2.6 | ∀{0.09-98 Ø4.97}
95.9% AdobeRGB 1998 (Argyll 3D)
98.9% sRGB (Argyll 3D)
82.9% Display P3 (Argyll 3D)
Gamma: 2.3
CCT: 6805 K
| Lenovo ThinkPad P16 G1 RTX A5500 LP160UQ1-SPB1, IPS, 3840x2400, 16" | Asus ProArt StudioBook 16 W7600H5A-2BL2 ATNA60YV02-0, OLED, 3840x2400, 16" | Dell Precision 7000 7670 Performance Samsung 160YV03, OLED, 3840x2400, 16" | Lenovo ThinkPad P16 G1 21D6001DMB NE160QDM-N63 , IPS LED, 2560x1600, 16" | MSI CreatorPro Z16P B12UKST B160QAN02.N, IPS, 2560x1600, 16" | HP ZBook Studio 16 G9 62U04EA BOE0A52, IPS, 3840x2400, 16" | |
|---|---|---|---|---|---|---|
| Display | 8% | 8% | -12% | 3% | 3% | |
| Display P3 Coverage (%) | 82.9 | 99.9 21% | 99.9 21% | 71.5 -14% | 97.6 18% | 97.5 18% |
| sRGB Coverage (%) | 98.9 | 100 1% | 100 1% | 100 1% | 99.9 1% | 99.9 1% |
| AdobeRGB 1998 Coverage (%) | 95.9 | 98.6 3% | 98.1 2% | 73.3 -24% | 87.4 -9% | 86.3 -10% |
| Response Times | 96% | 96% | 23% | 76% | 75% | |
| Response Time Grey 50% / Grey 80% * (ms) | 45.6 ? | 2 ? 96% | 1.84 ? 96% | 37.7 ? 17% | 12.8 ? 72% | 15.3 ? 66% |
| Response Time Black / White * (ms) | 36.8 ? | 2 ? 95% | 1.92 ? 95% | 26.3 ? 29% | 7.4 ? 80% | 6.1 ? 83% |
| PWM Frequency (Hz) | 240 ? | 59.52 ? | ||||
| Screen | -2% | -36% | -4% | 9% | 16% | |
| Brightness middle (cd/m²) | 601.9 | 353 -41% | 325.2 -46% | 424 -30% | 407 -32% | 554 -8% |
| Brightness (cd/m²) | 569 | 360 -37% | 328 -42% | 398 -30% | 388 -32% | 516 -9% |
| Brightness Distribution (%) | 77 | 96 25% | 97 26% | 90 17% | 88 14% | 84 9% |
| Black Level * (cd/m²) | 0.47 | 0.24 49% | 0.36 23% | 0.47 -0% | ||
| Contrast (:1) | 1281 | 1767 38% | 1131 -12% | 1179 -8% | ||
| Colorchecker dE 2000 * | 2.45 | 2.45 -0% | 4.59 -87% | 2.6 -6% | 1.3 47% | 1 59% |
| Colorchecker dE 2000 max. * | 4.46 | 3.75 16% | 7.65 -72% | 4.9 -10% | 2.5 44% | 2.4 46% |
| Greyscale dE 2000 * | 2.6 | 1.88 28% | 2.5 4% | 4.1 -58% | 2.1 19% | 1.6 38% |
| Gamma | 2.3 96% | 2.31 95% | 2.1 105% | 2.13 103% | 2.26 97% | 2.29 96% |
| CCT | 6805 96% | 6441 101% | 6541 99% | 7252 90% | 6437 101% | 6458 101% |
| Colorchecker dE 2000 calibrated * | 2.77 | 0.8 | 0.7 | 0.6 | ||
| Moyenne finale (programmes/paramètres) | 34% /
19% | 23% /
-0% | 2% /
-2% | 29% /
18% | 31% /
22% |
* ... Moindre est la valeur, meilleures sont les performances
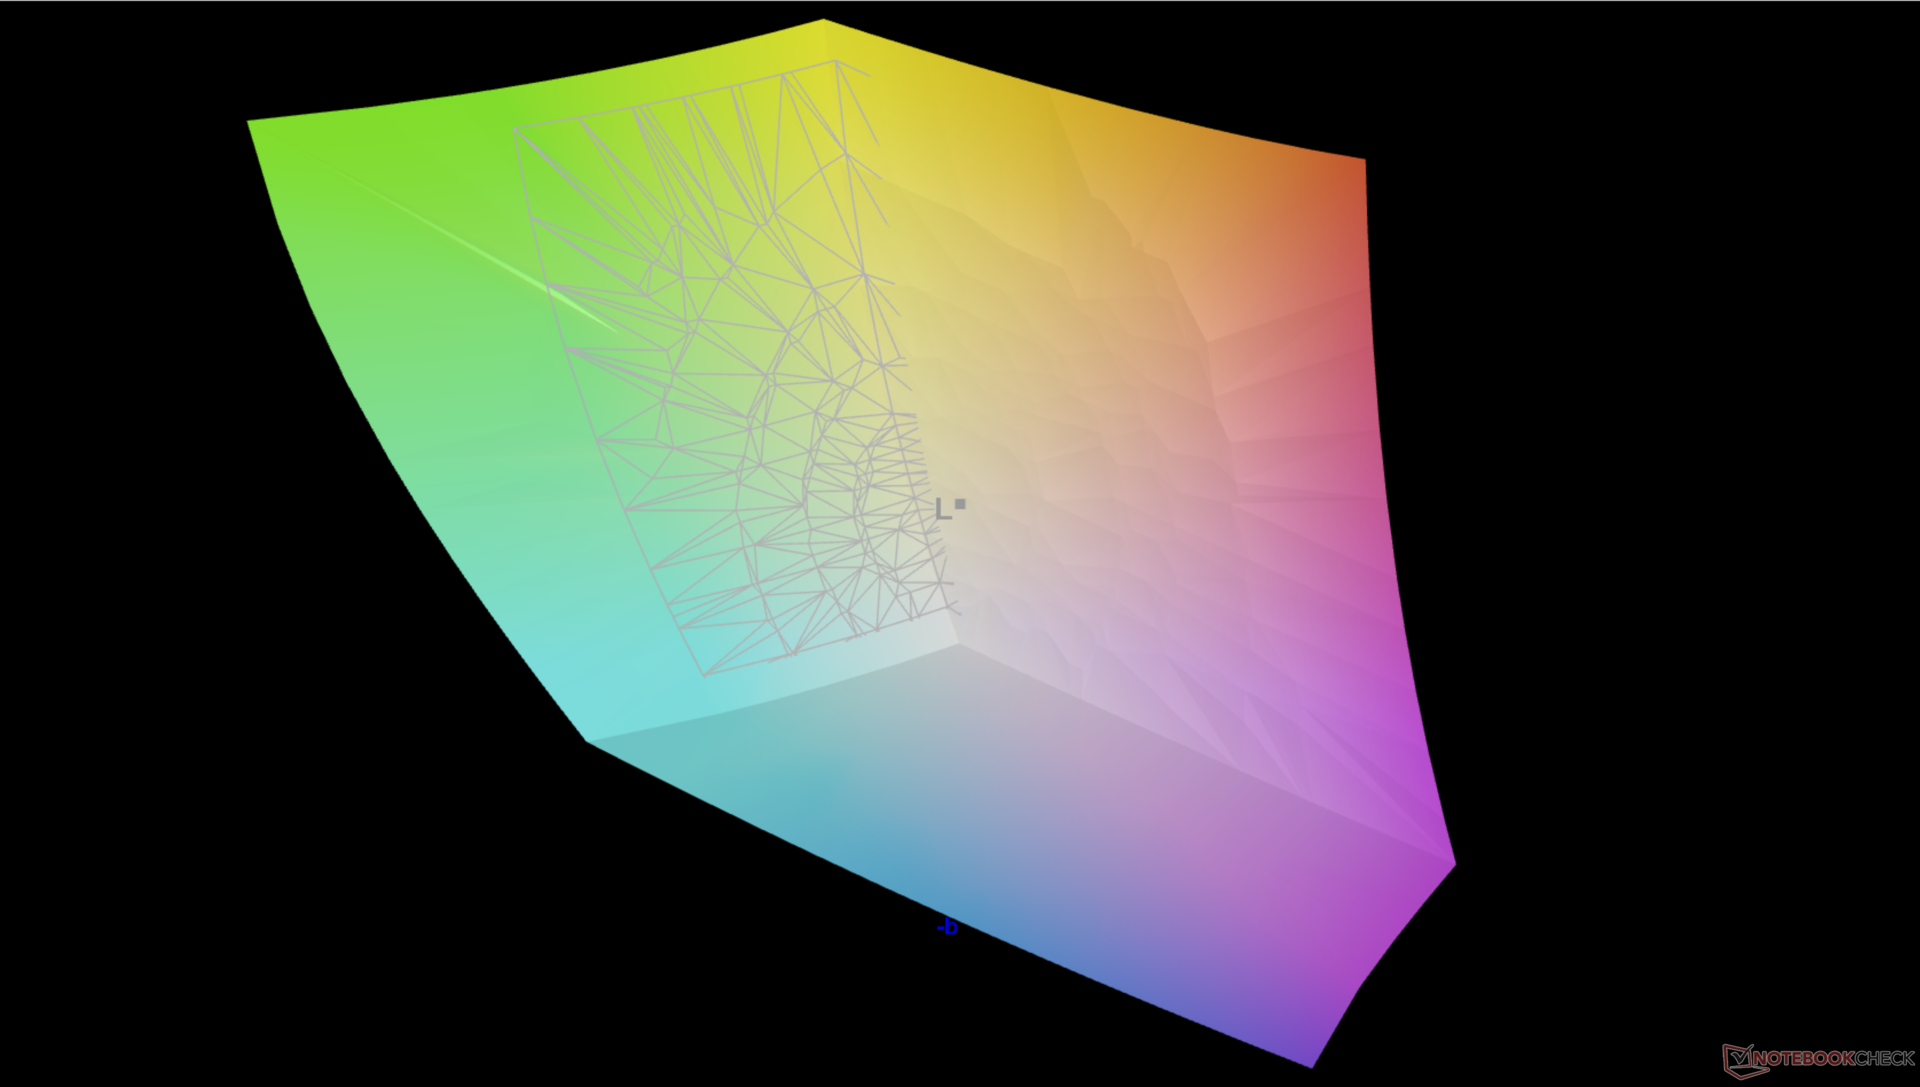
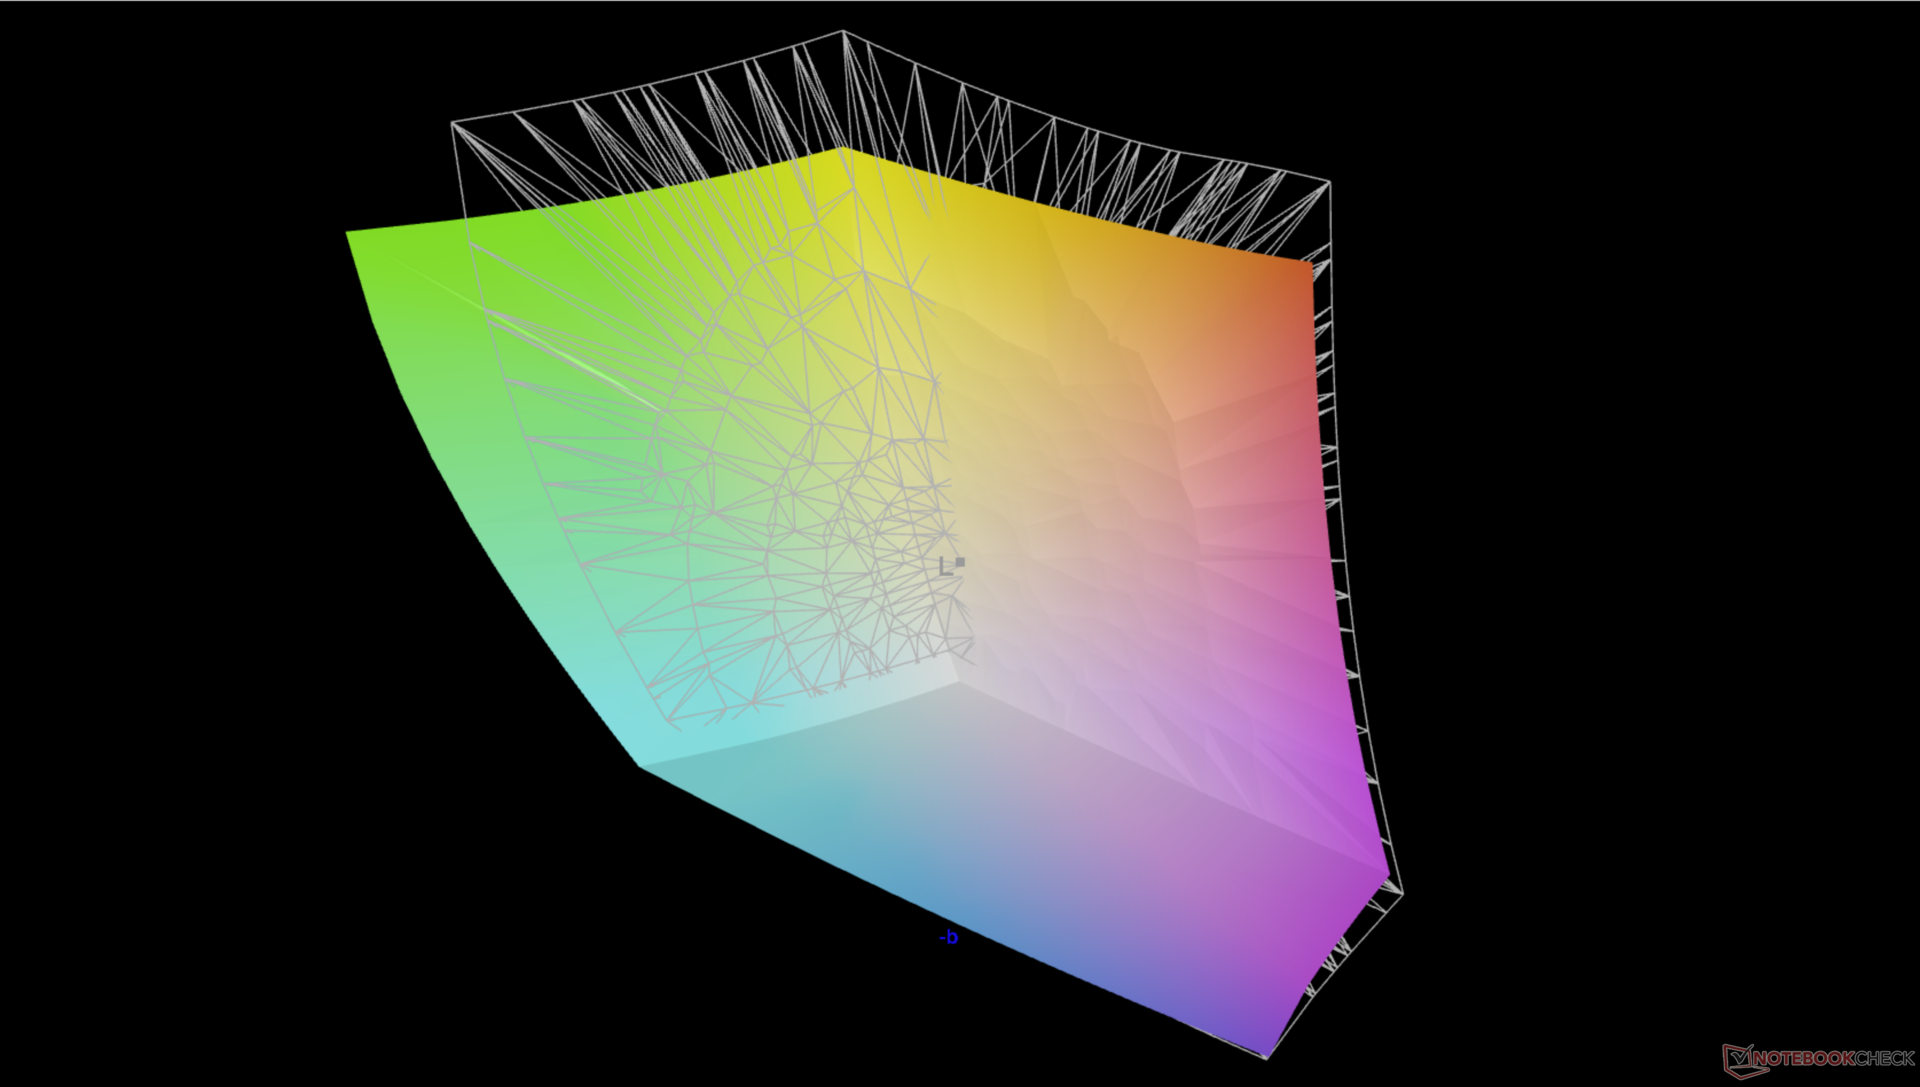
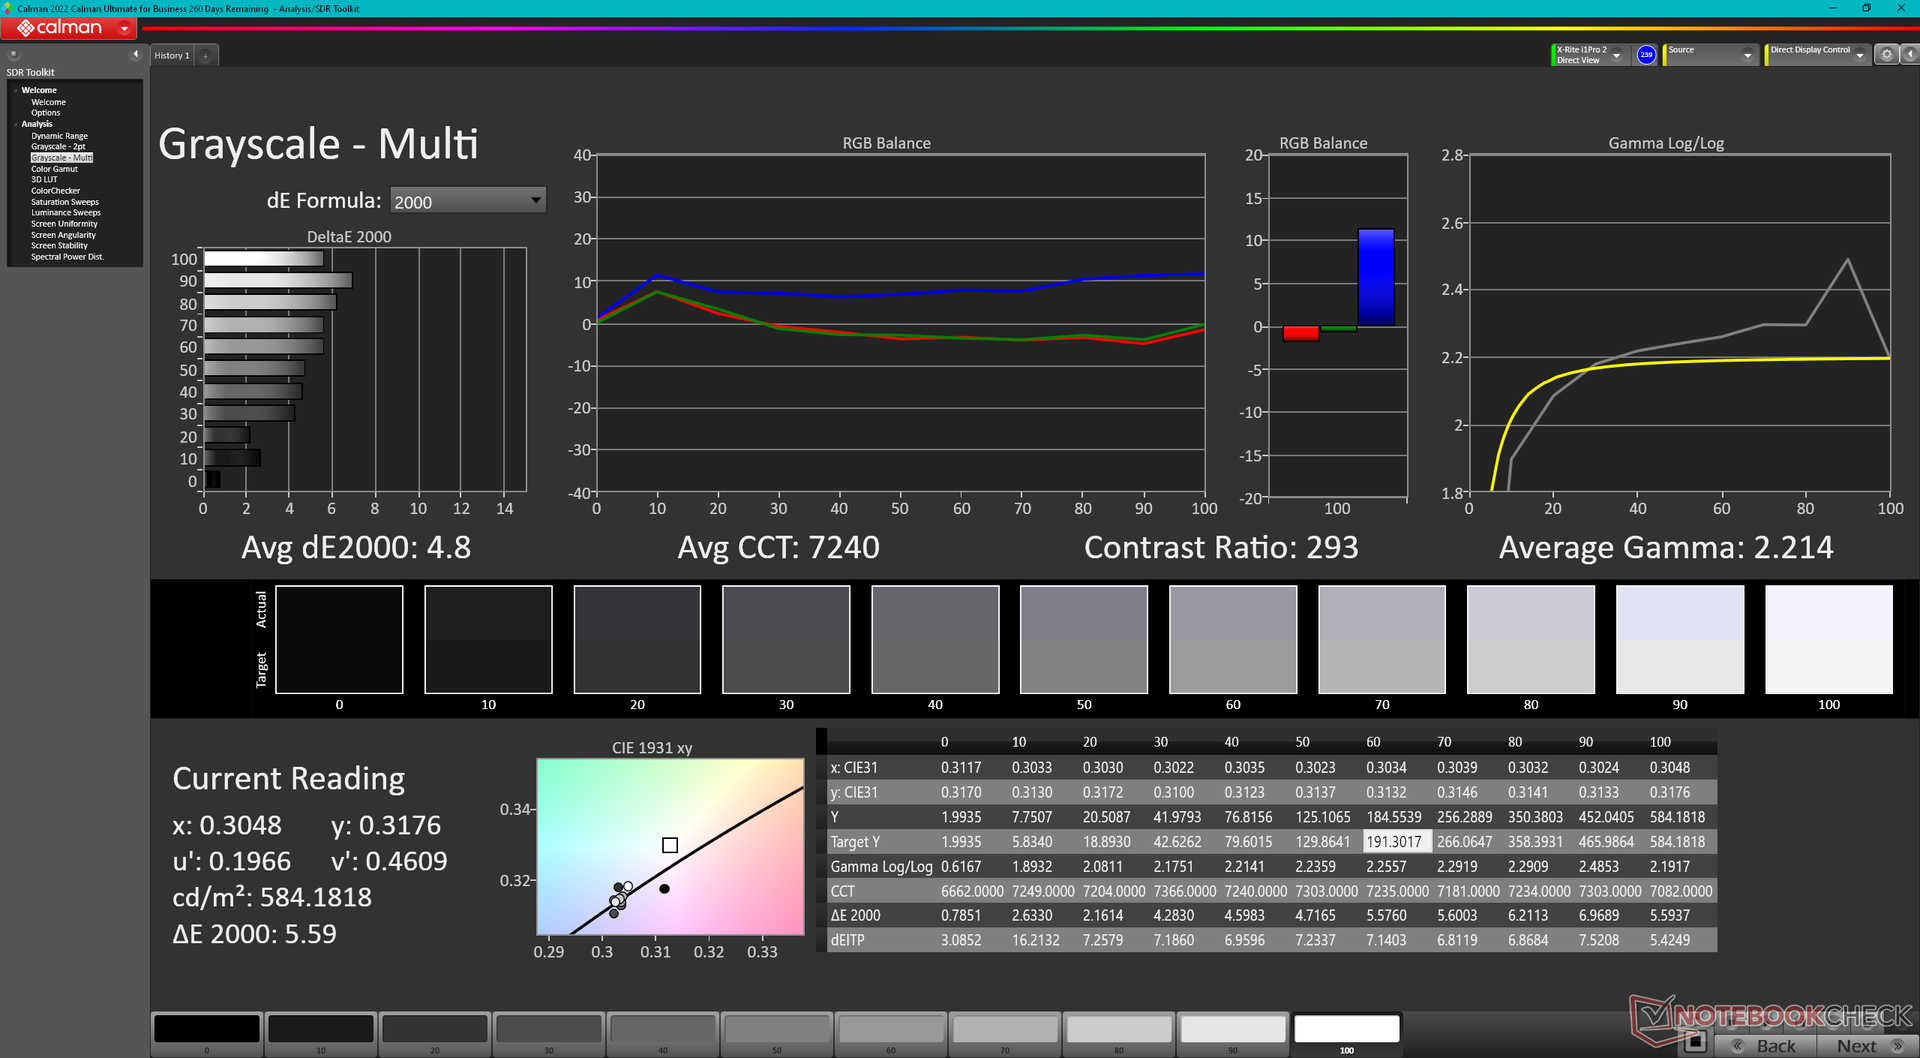
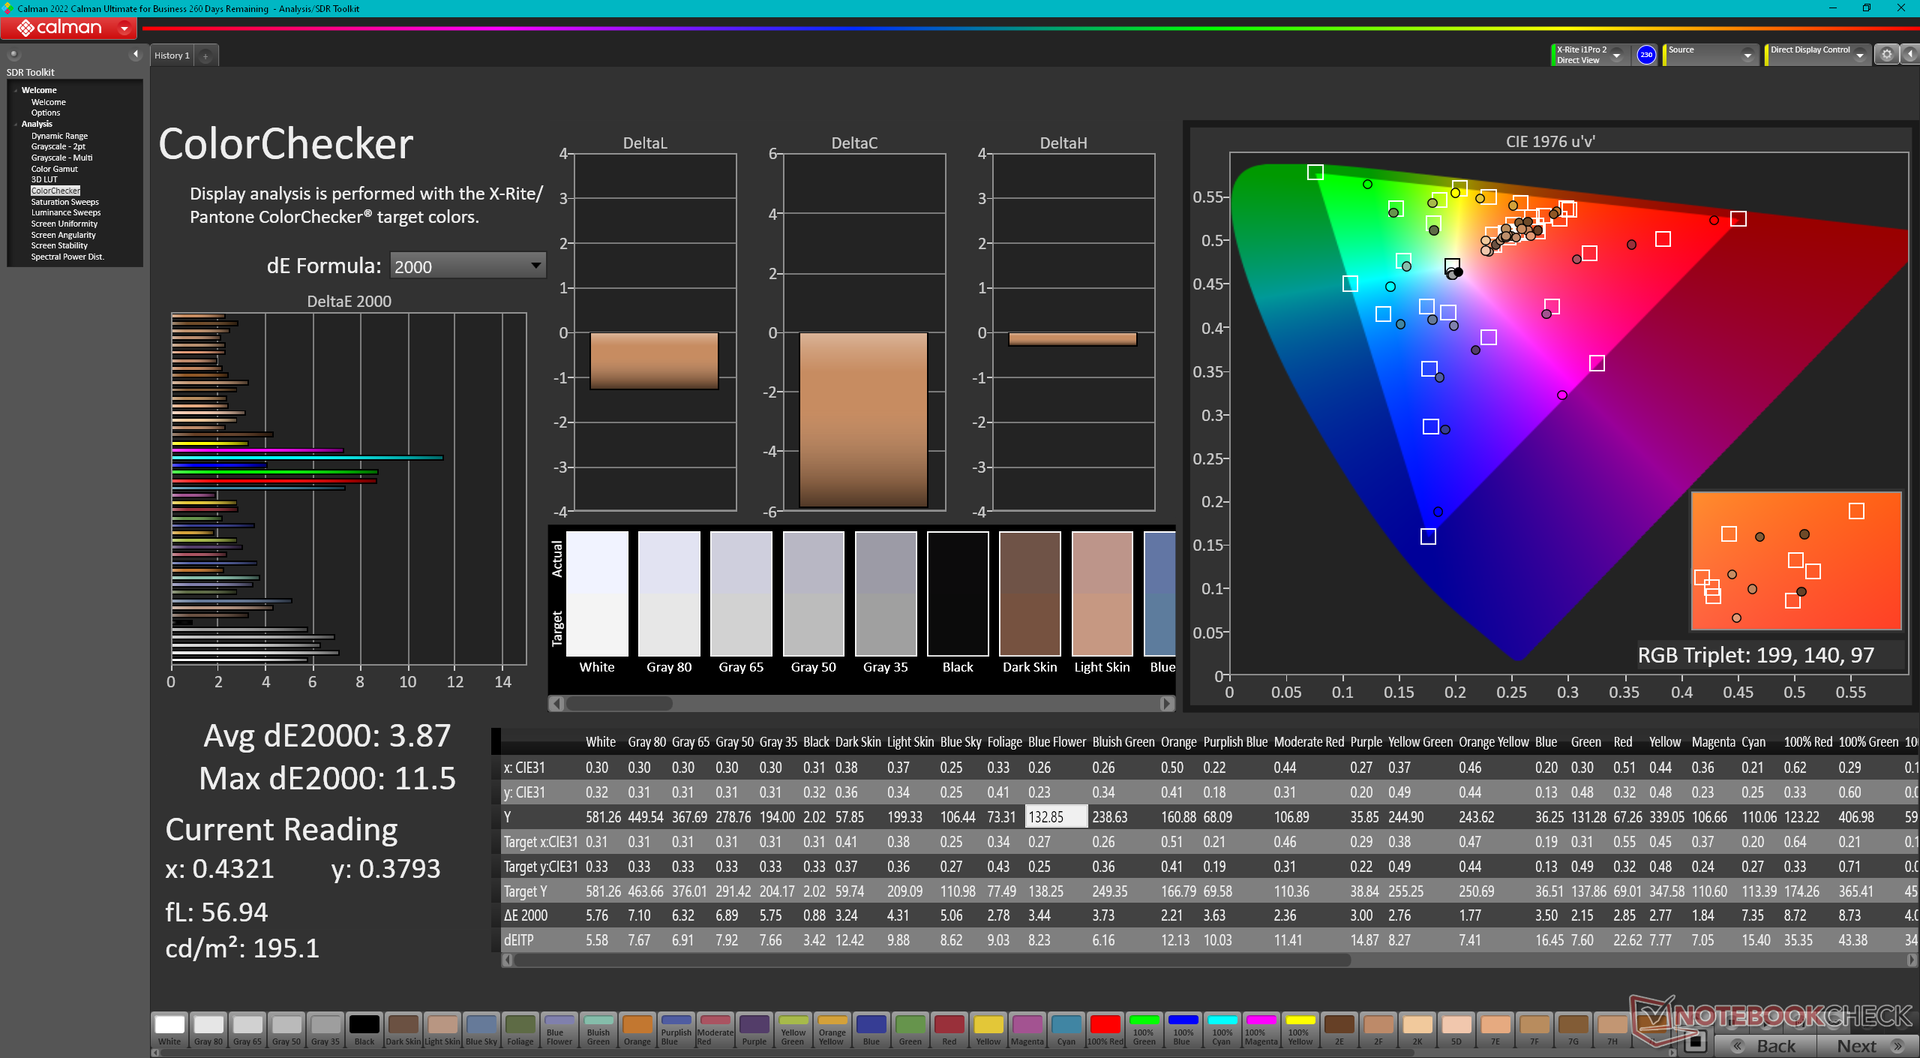
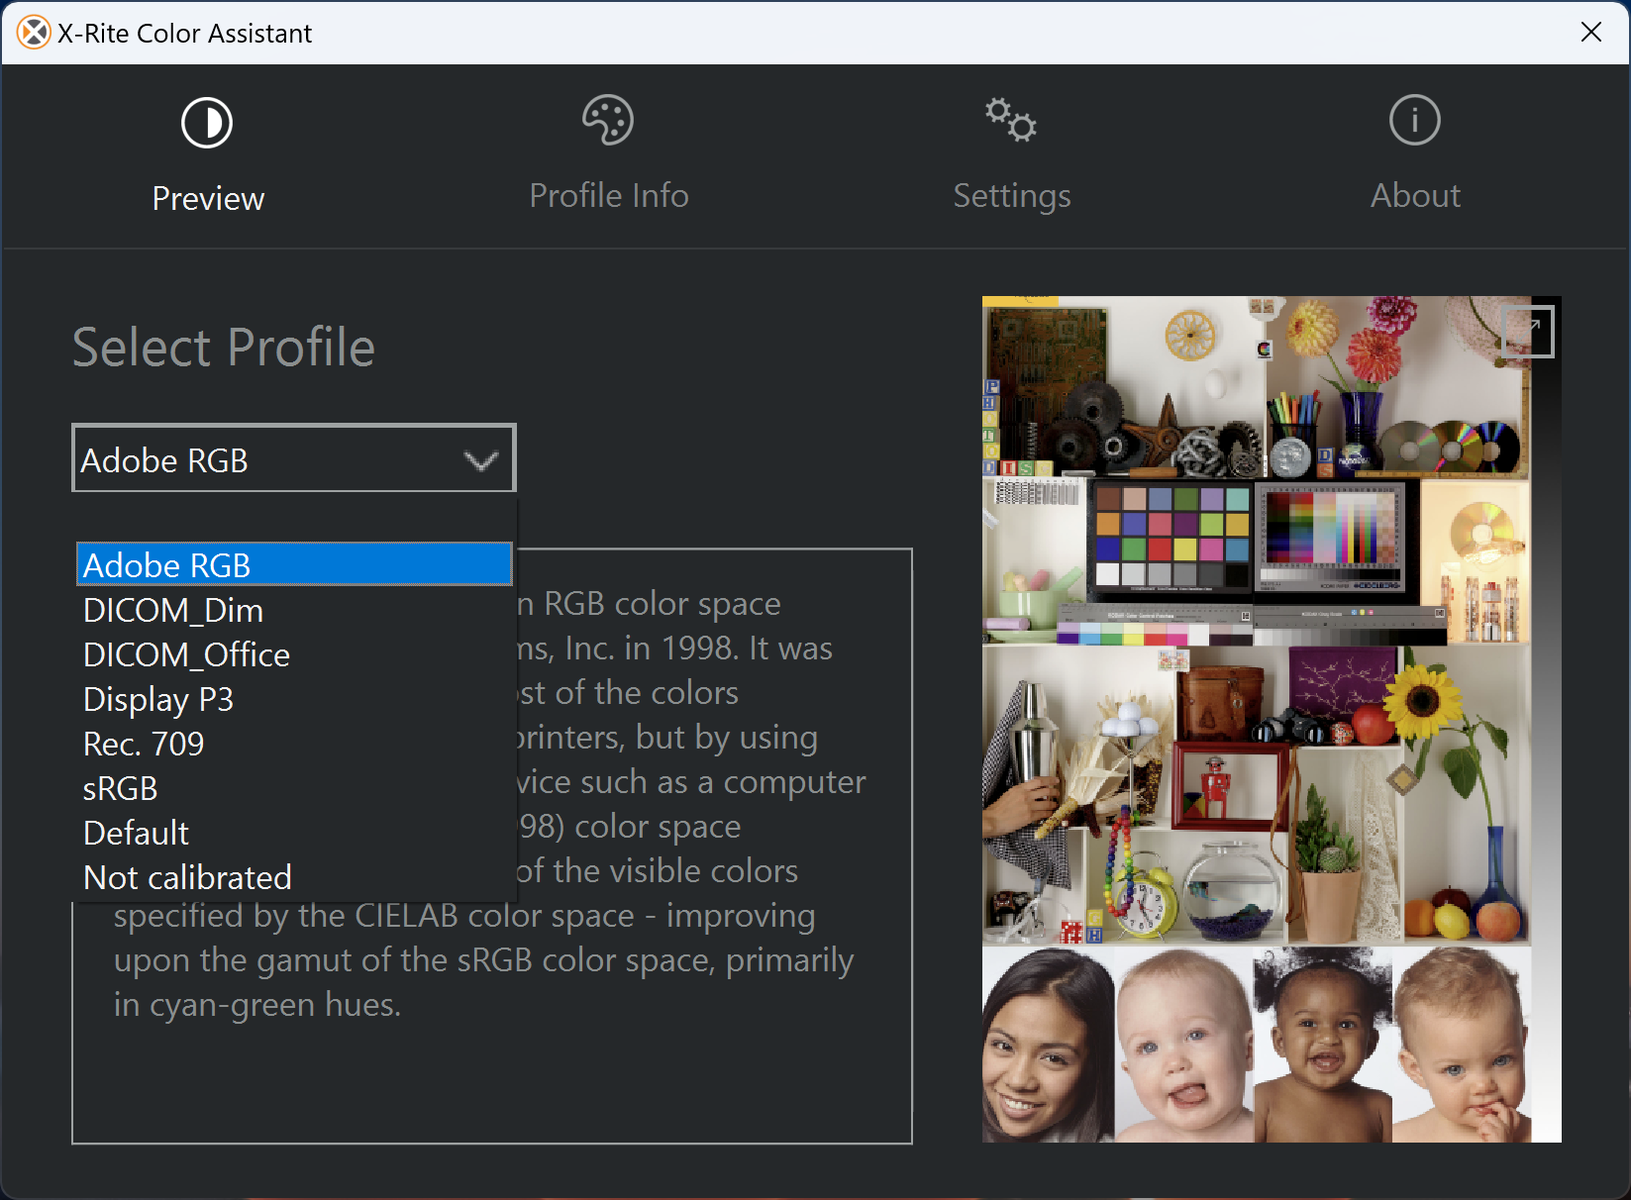
Le profil de couleur peut être modifié via le logiciel X-Rite Color Assistant préinstallé. Il semble qu'il soit bogué pour le moment car les couleurs ne sont pas aussi précises qu'elles devraient l'être, malgré la couverture AdobeRGB complète de notre panneau. En mode sRGB, par exemple, les valeurs moyennes du deltaE des niveaux de gris et des couleurs ne sont que de 2,6 et 2,45, respectivement, contre 4,8 et 3,87 en mode AdobeRGB.
Temps de réponse de l'écran
| ↔ Temps de réponse noir à blanc | ||
|---|---|---|
| 36.8 ms ... hausse ↗ et chute ↘ combinées | ↗ 19.6 ms hausse | 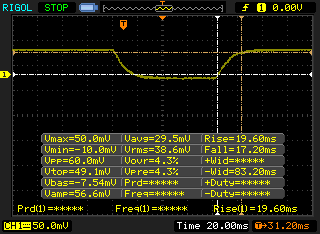 |
| ↘ 17.2 ms chute | ||
| L'écran souffre de latences très élevées, à éviter pour le jeu. En comparaison, tous les appareils testés affichent entre 0.1 (minimum) et 240 (maximum) ms. » 95 % des appareils testés affichent de meilleures performances. Cela signifie que les latences relevées sont moins bonnes que la moyenne (19.8 ms) de tous les appareils testés. | ||
| ↔ Temps de réponse gris 50% à gris 80% | ||
| 45.6 ms ... hausse ↗ et chute ↘ combinées | ↗ 21.2 ms hausse | 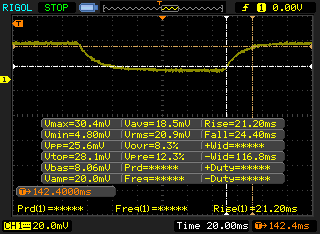 |
| ↘ 24.4 ms chute | ||
| L'écran souffre de latences très élevées, à éviter pour le jeu. En comparaison, tous les appareils testés affichent entre 0.165 (minimum) et 636 (maximum) ms. » 78 % des appareils testés affichent de meilleures performances. Cela signifie que les latences relevées sont moins bonnes que la moyenne (31 ms) de tous les appareils testés. | ||
Scintillement / MLI (Modulation de largeur d'impulsion)
| Scintillement / MLI (Modulation de largeur d'impulsion) non décelé | 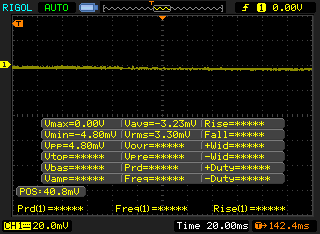 | ||
En comparaison, 52 % des appareils testés n'emploient pas MDI pour assombrir leur écran. Nous avons relevé une moyenne à 7781 (minimum : 5 - maximum : 343500) Hz dans le cas où une MDI était active. | |||
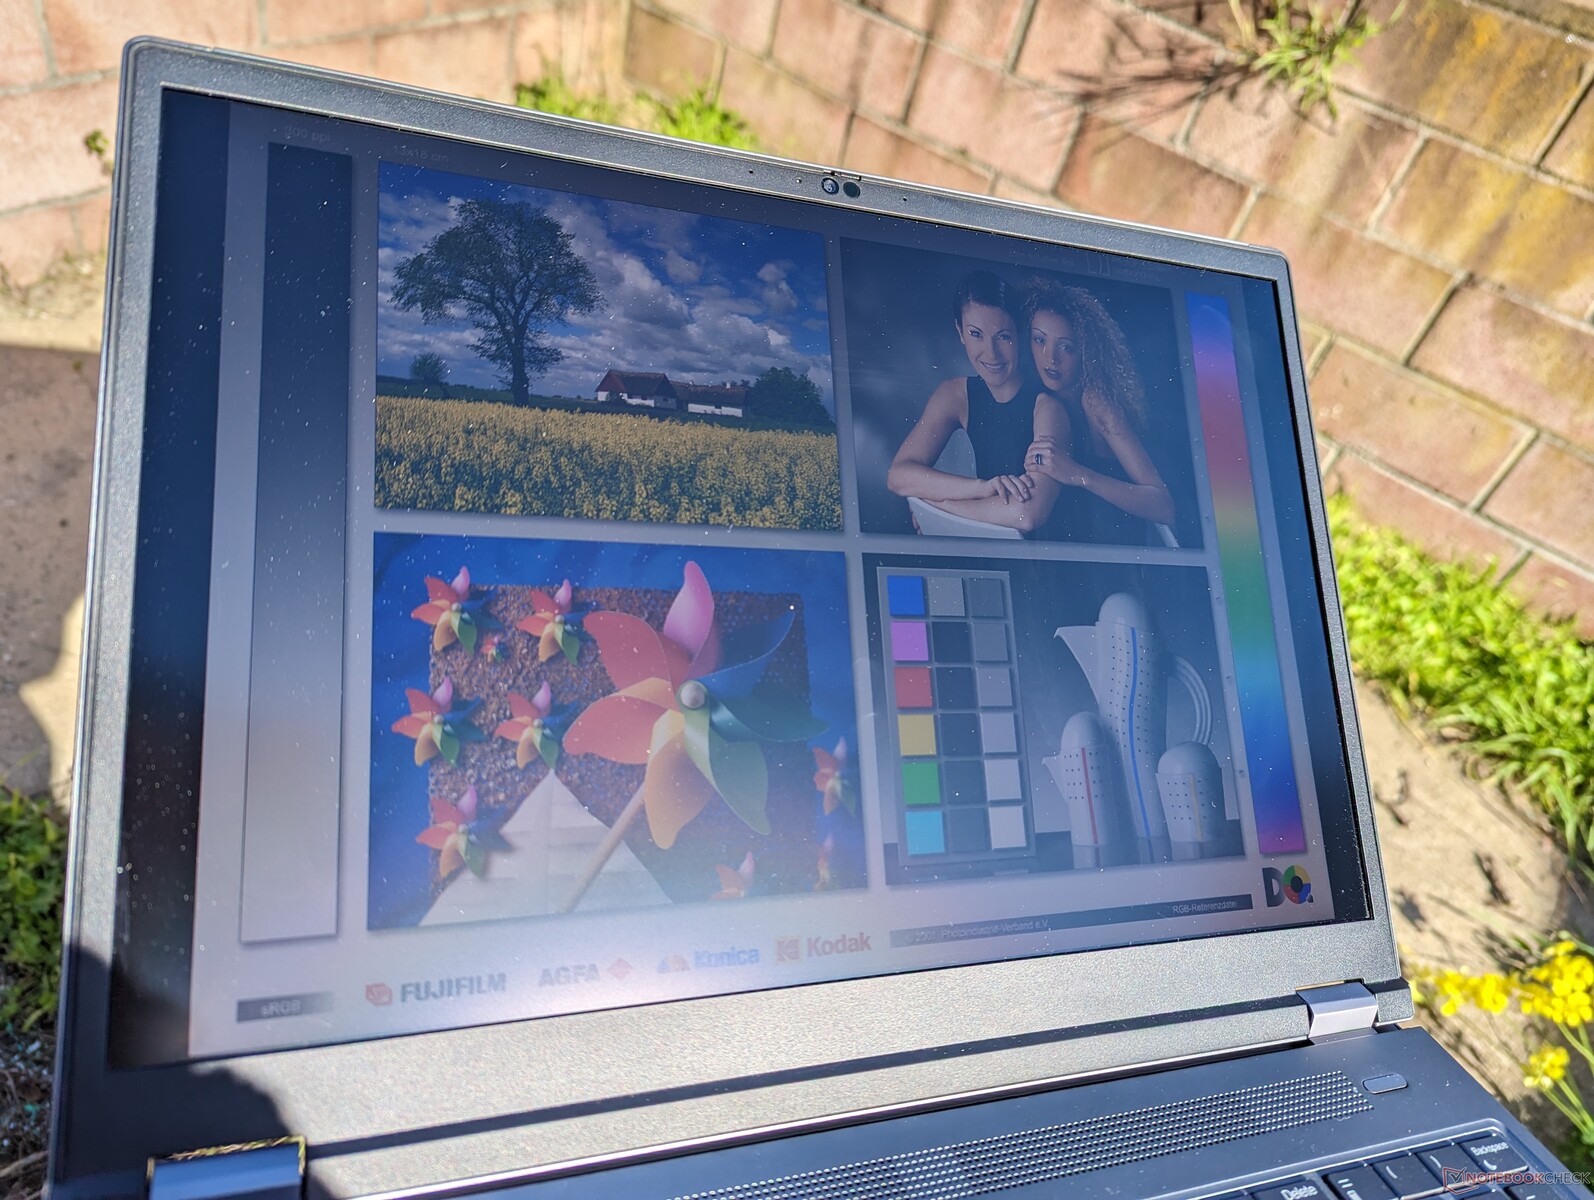
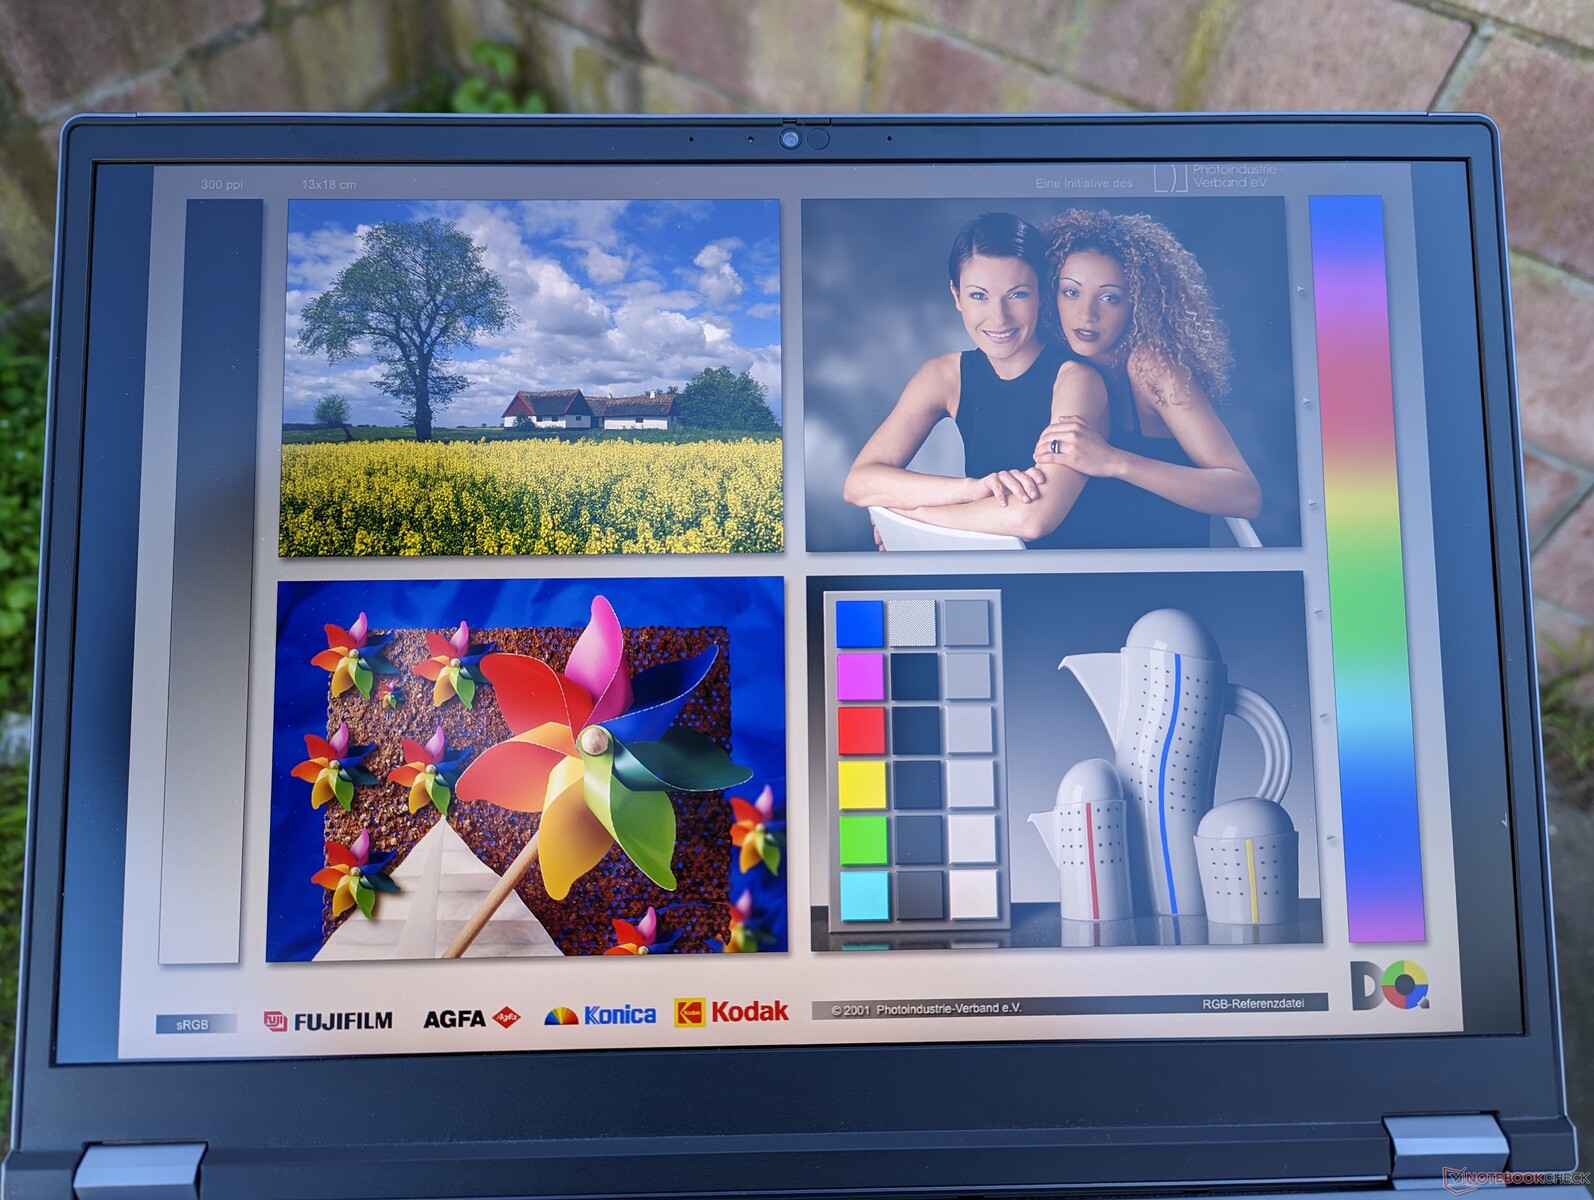
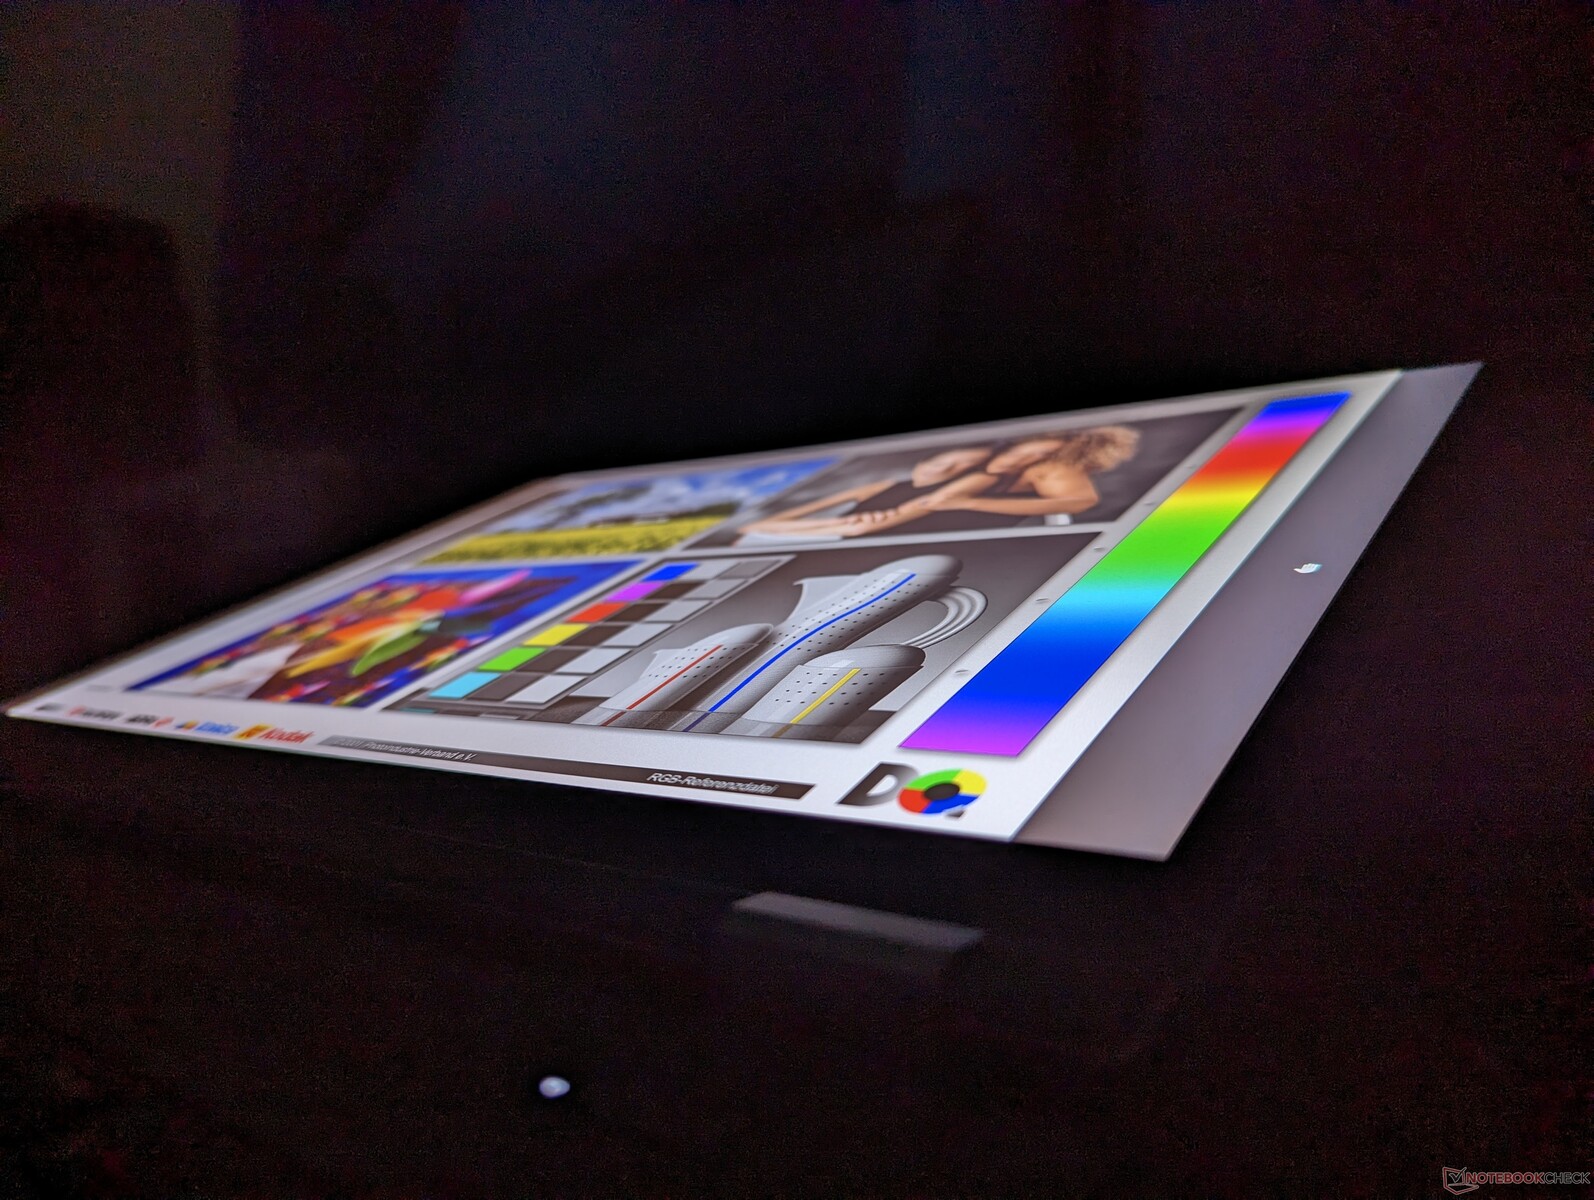
La visibilité en extérieur est décente, car l'écran est plus lumineux que sur la plupart des autres ordinateurs portables, où la gamme 300 à 400 nit est plus courante. Il est toutefois recommandé de travailler à l'ombre dans la mesure du possible, car la lumière directe du soleil dégrade la qualité de l'image et les couleurs.
Performance
Conditions d'essai
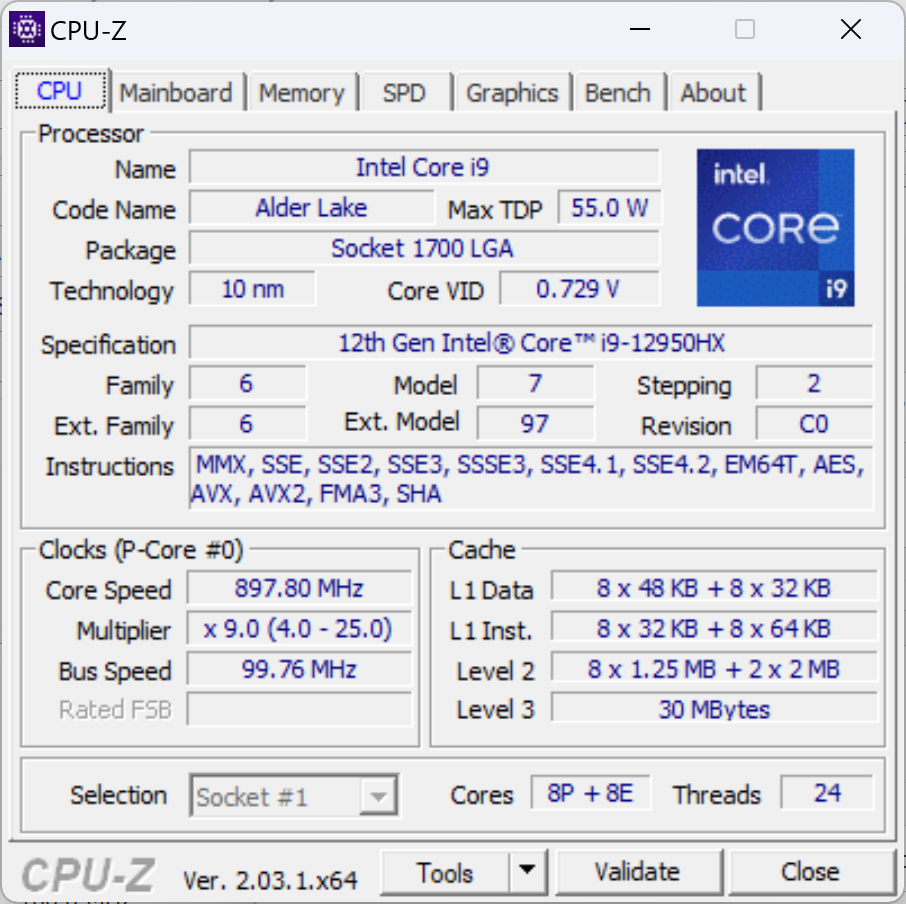
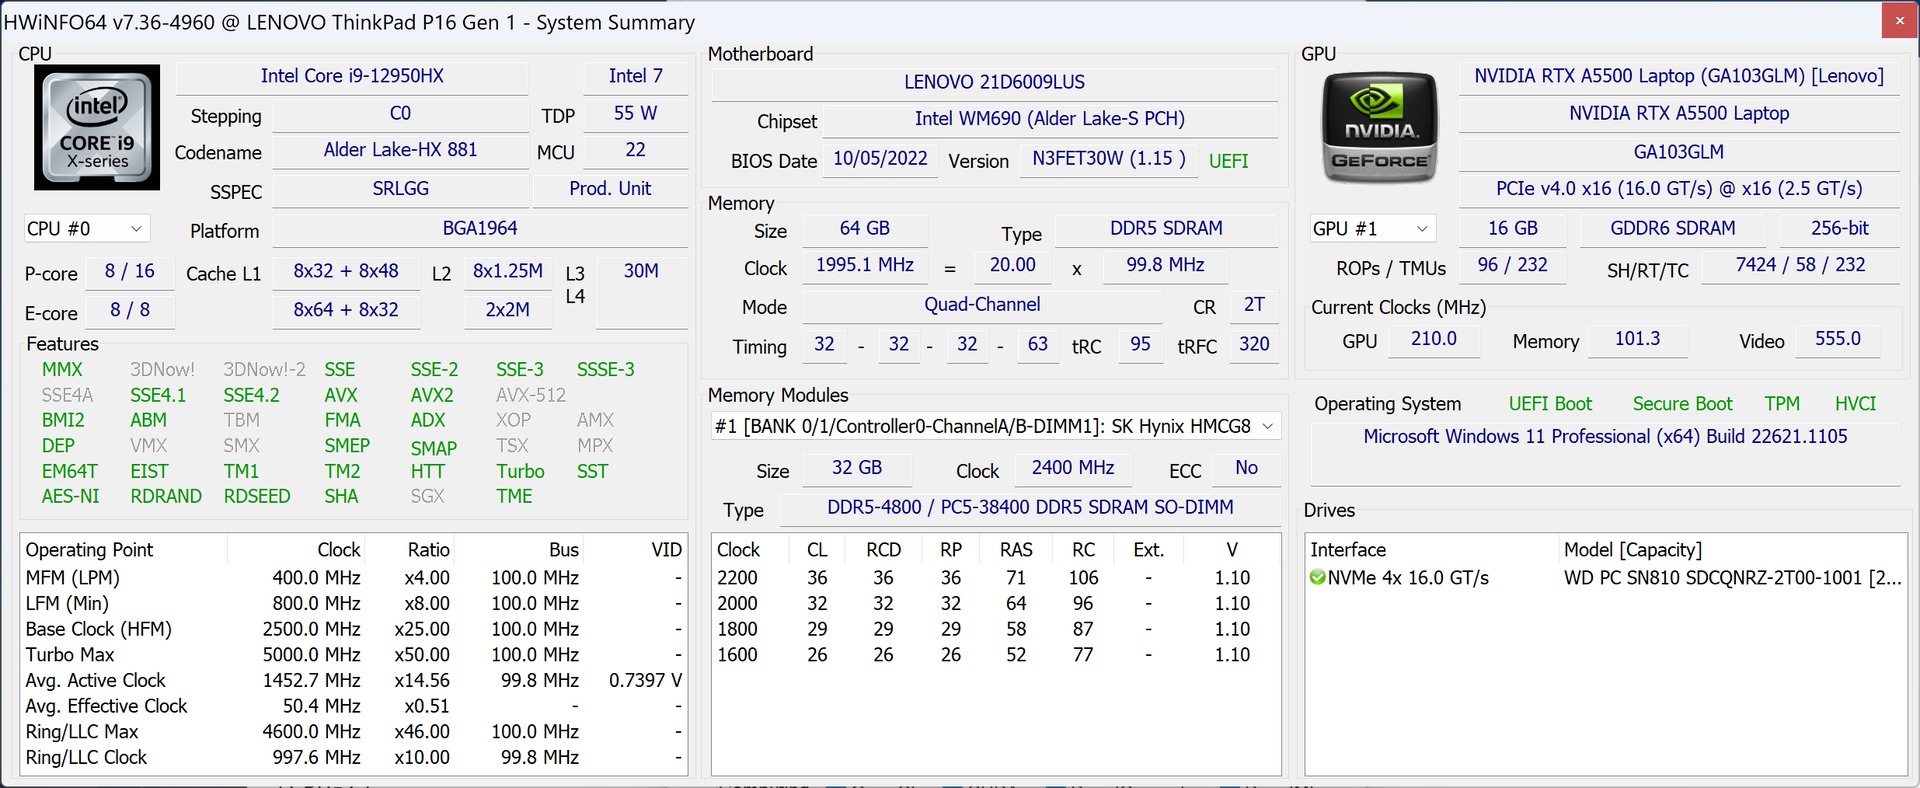
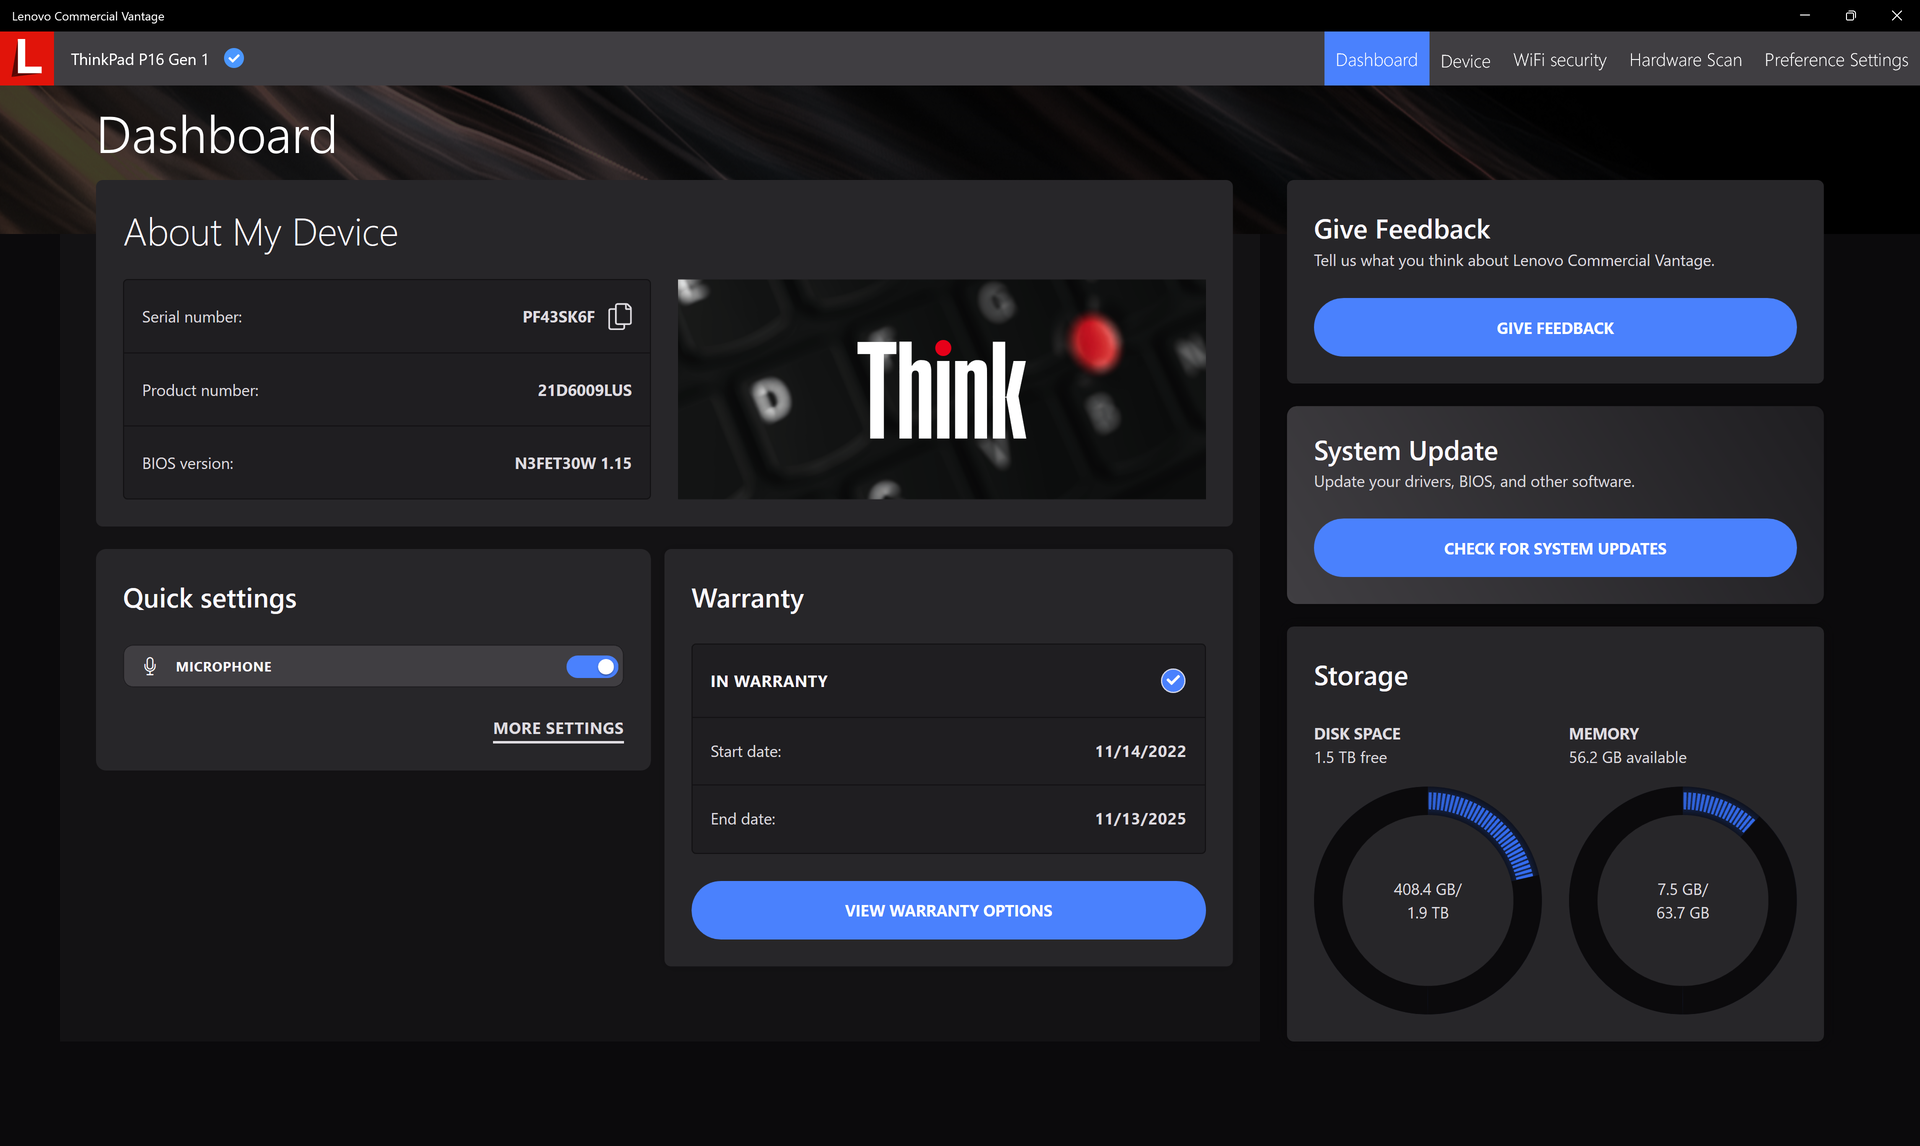
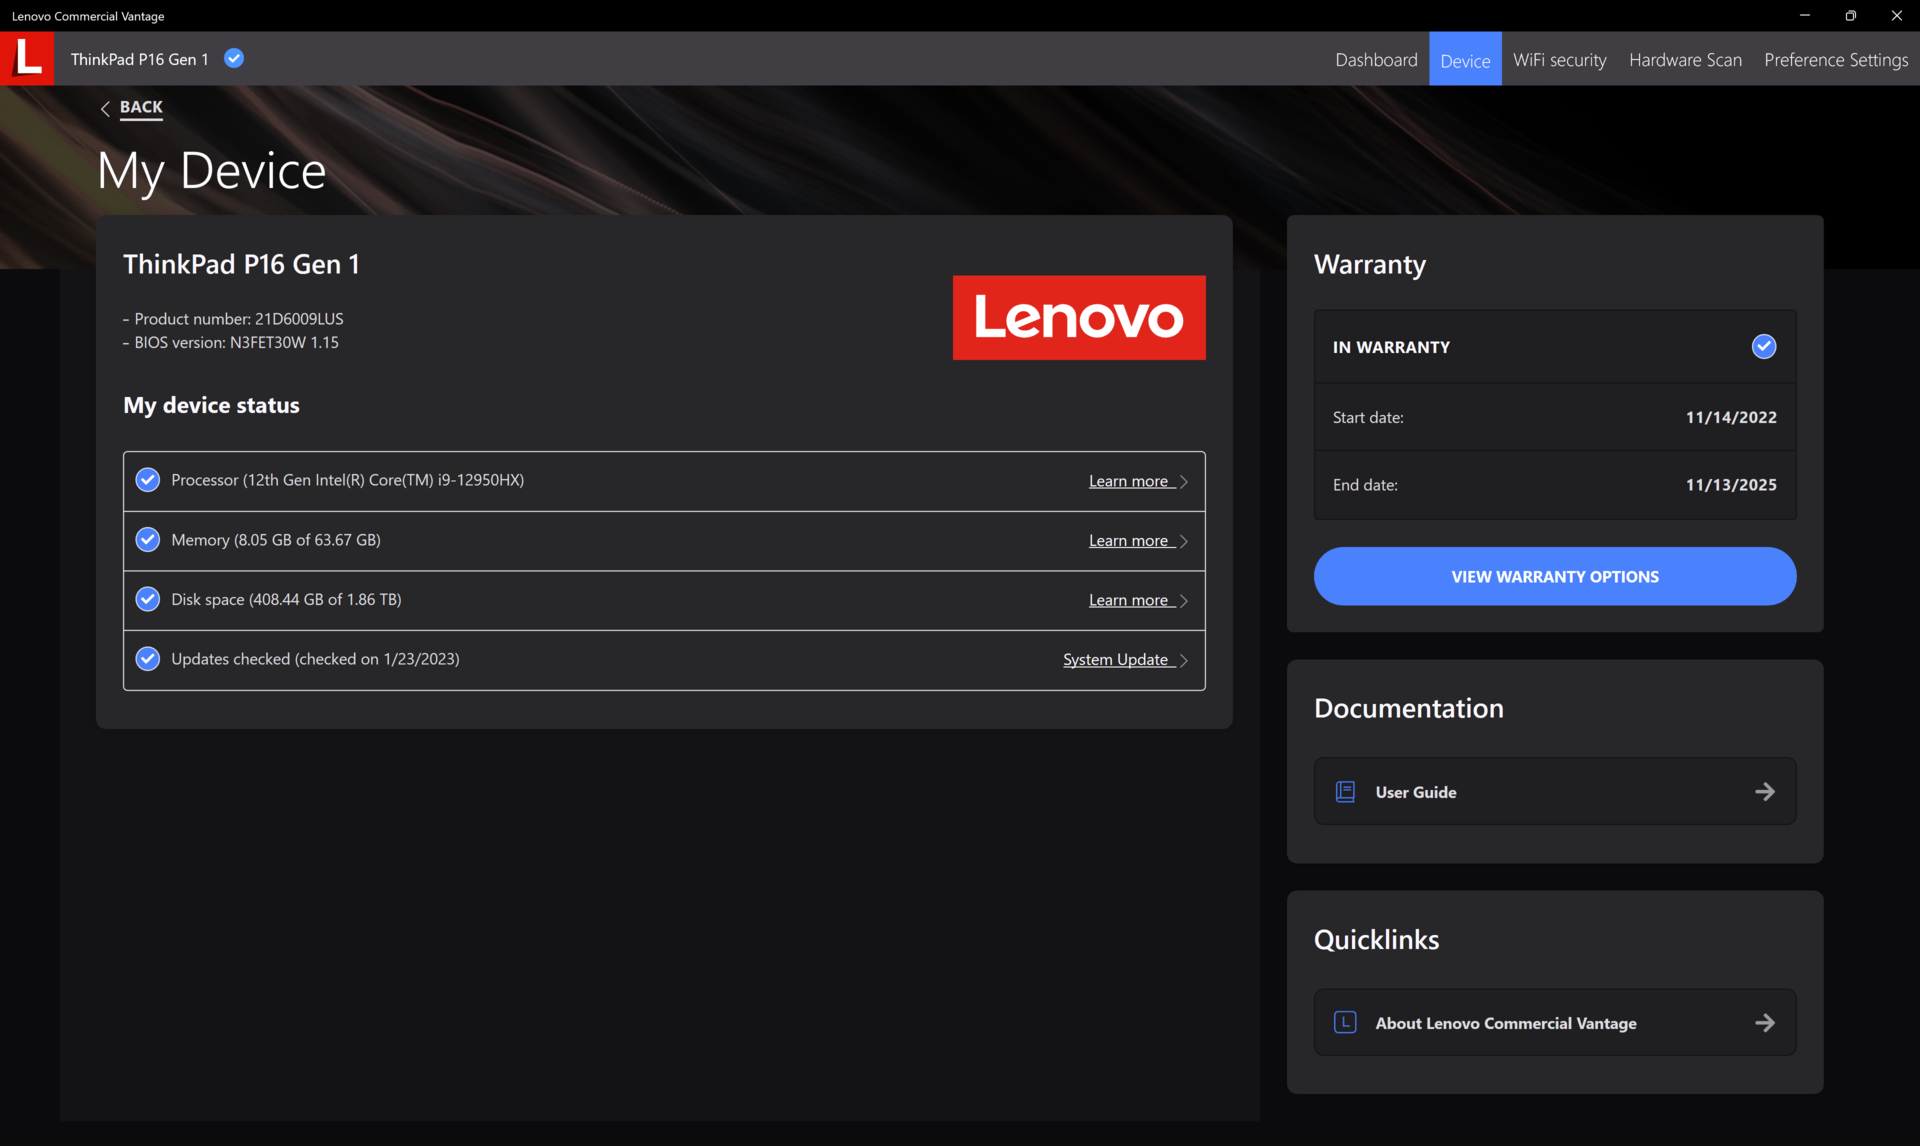
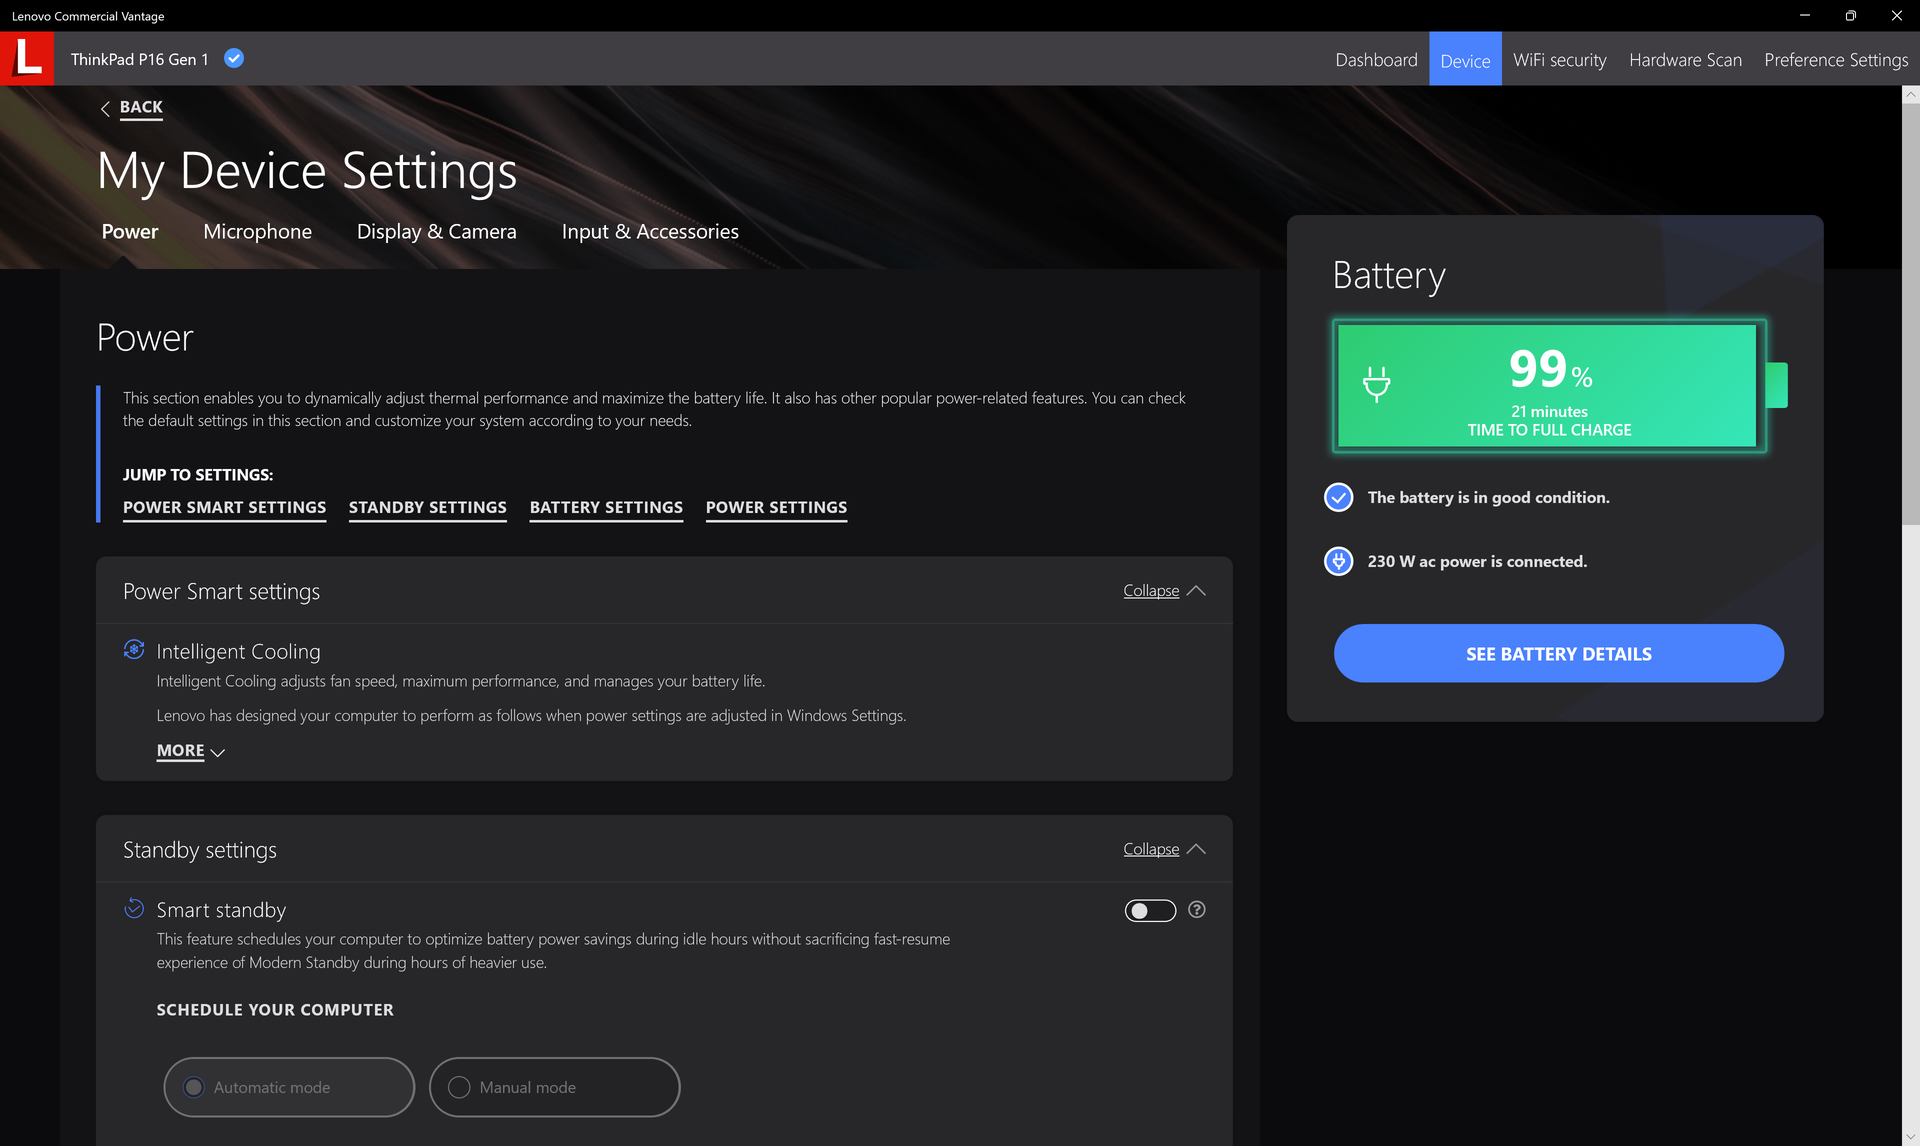
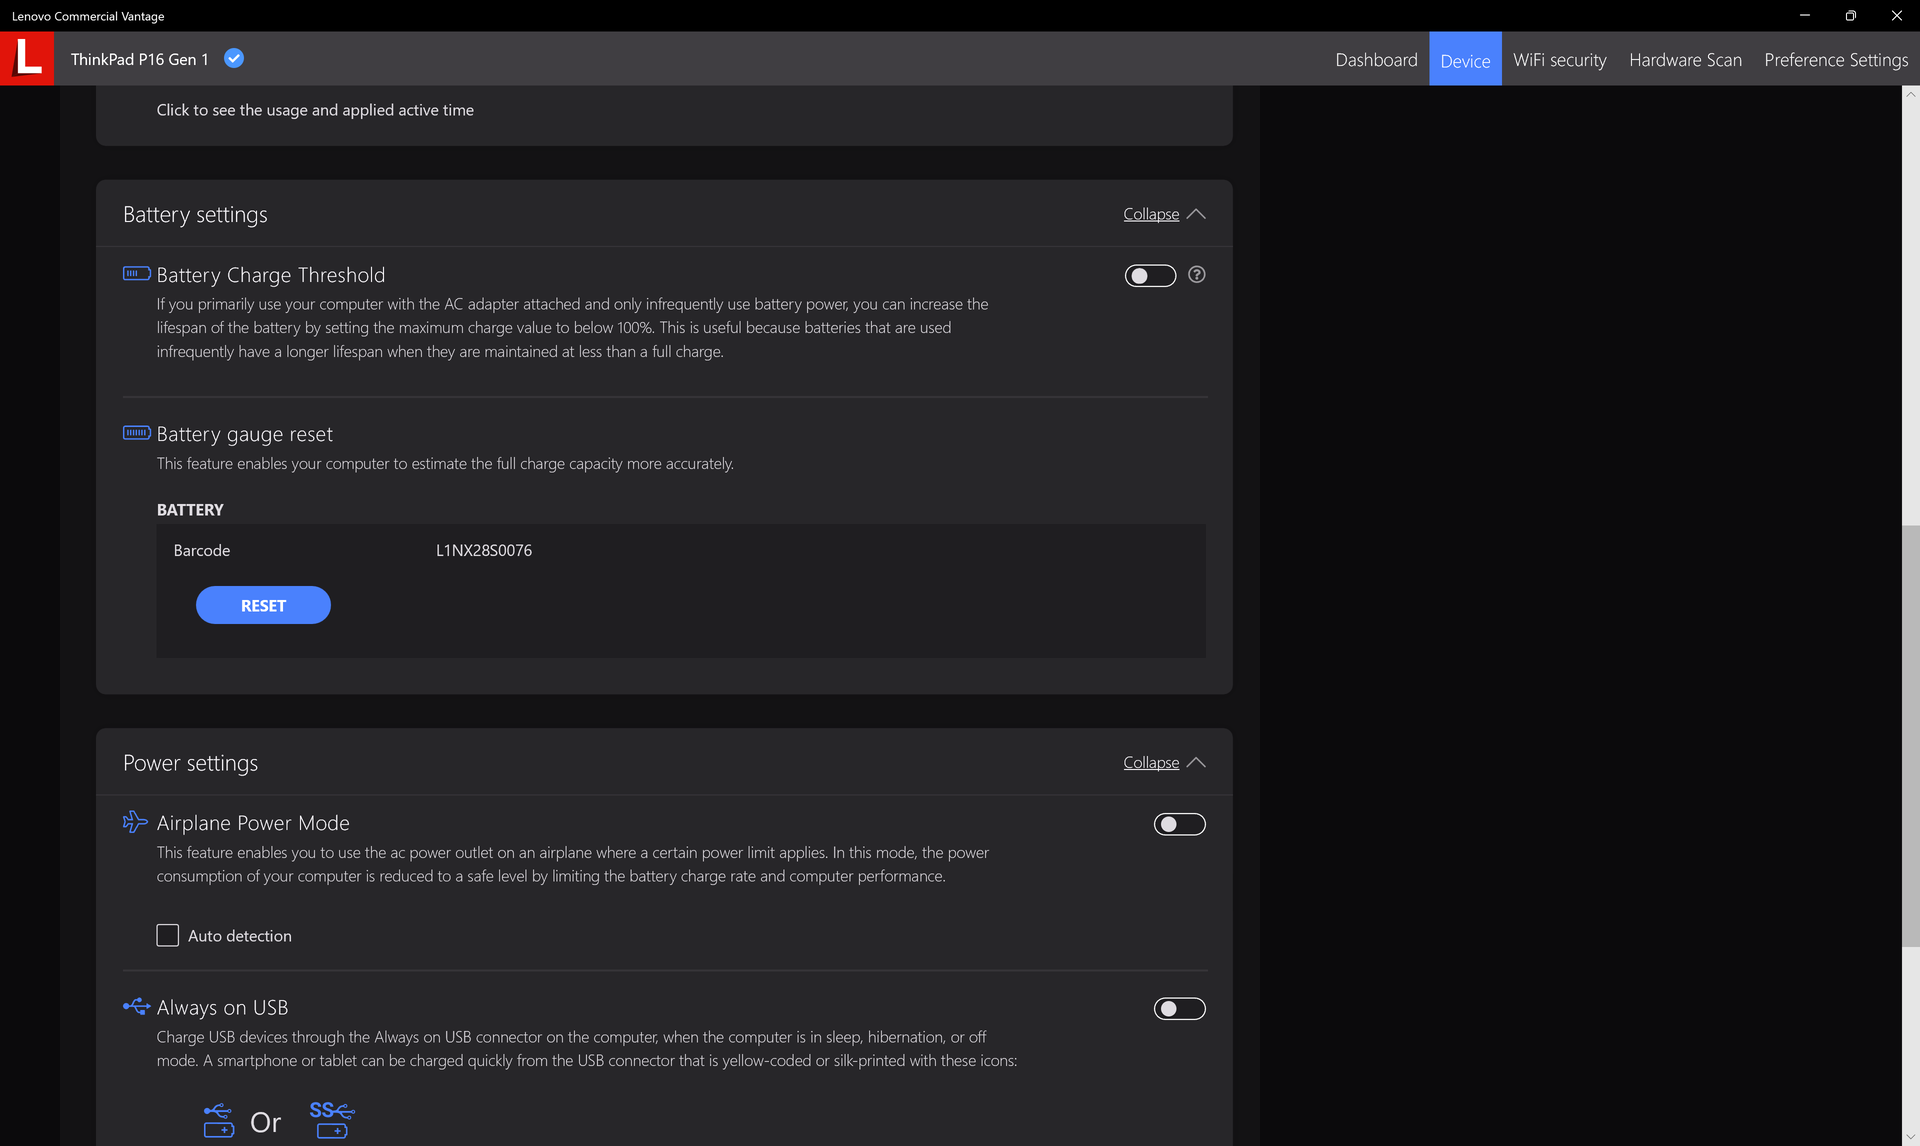
Nous avons configuré notre appareil en mode Performance et en mode dGPU via Windows et le panneau de configuration Nvidia, respectivement, avant d'effectuer les tests de performances ci-dessous. Il est recommandé aux utilisateurs de se familiariser avec le logiciel préinstallé Lenovo Vantage, car il s'agit d'un point central pour les mises à jour du BIOS spécifiques à Lenovo, les caractéristiques, l'état de la garantie, etc.
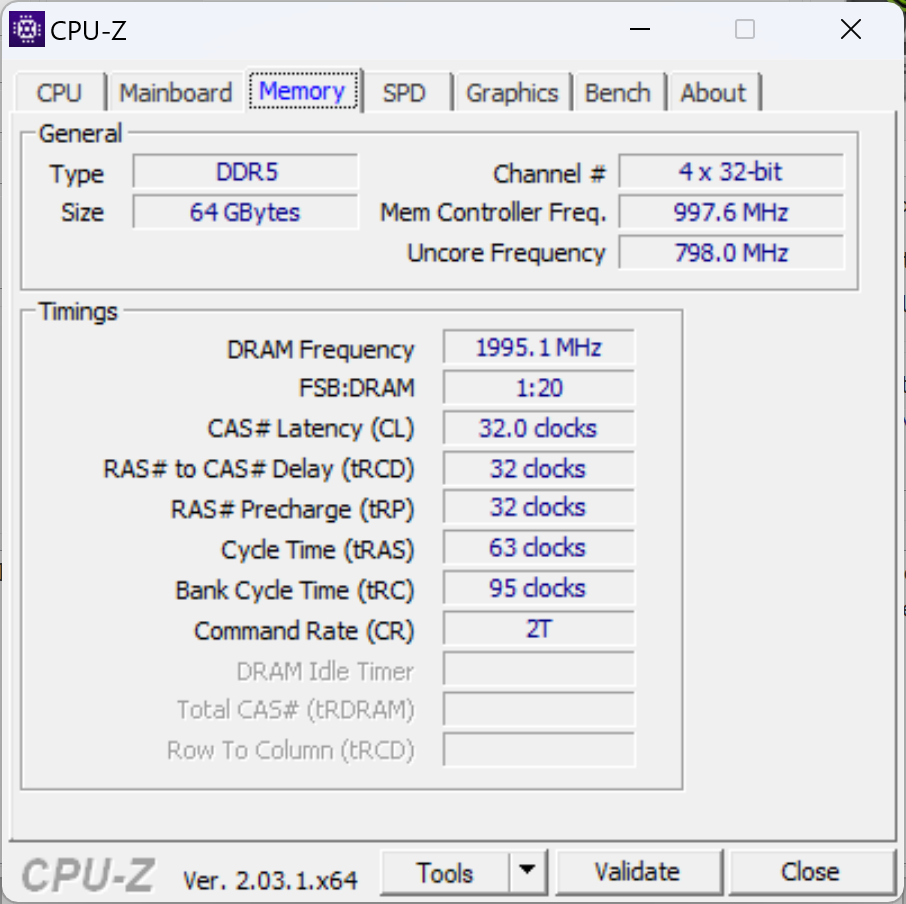
Il n'y a pas d'options de CPU Xeon et la RAM ECC n'est donc pas prise en charge. Cependant, l'état ECC pour le GPU peut être activé ou désactivé via le panneau de contrôle Nvidia.
Processeur
La performance multithread brute est environ 10 % plus rapide que celle du Core i9-12900H de la carte concurrente MSI CreatorPro Z16P. En passant duCore i7-12850HX à notre configuration Core i9-12950HX augmentera les performances de 15 %. Le plus remarquable est peut-être que le Precision 7670 est environ 15 à 20 % plus lent, même s'il est livré avec le même processeur Core i9-12950HX que notre Lenovo.
La durabilité de Turbo Boost est bonne mais pas parfaite. En exécutant CineBench R15 xT en boucle, par exemple, le score initial de 3141 points tombe à ~2830 points au fil du temps, soit une baisse de performance de 10 %.
Cinebench R15 Multi Loop
Cinebench R23: Multi Core | Single Core
Cinebench R20: CPU (Multi Core) | CPU (Single Core)
Cinebench R15: CPU Multi 64Bit | CPU Single 64Bit
Blender: v2.79 BMW27 CPU
7-Zip 18.03: 7z b 4 | 7z b 4 -mmt1
Geekbench 5.5: Multi-Core | Single-Core
HWBOT x265 Benchmark v2.2: 4k Preset
LibreOffice : 20 Documents To PDF
R Benchmark 2.5: Overall mean
* ... Moindre est la valeur, meilleures sont les performances
AIDA64: FP32 Ray-Trace | FPU Julia | CPU SHA3 | CPU Queen | FPU SinJulia | FPU Mandel | CPU AES | CPU ZLib | FP64 Ray-Trace | CPU PhotoWorxx
| Performance rating | |
| Moyenne Intel Core i9-12950HX | |
| Lenovo ThinkPad P16 G1 RTX A5500 | |
| Lenovo ThinkPad P16 G1 21D6001DMB | |
| MSI CreatorPro Z16P B12UKST | |
| HP ZBook Studio 16 G9 62U04EA | |
| Dell Precision 7000 7670 Performance | |
| Asus ProArt StudioBook 16 W7600H5A-2BL2 -9! | |
| AIDA64 / FP32 Ray-Trace | |
| Lenovo ThinkPad P16 G1 RTX A5500 | |
| Moyenne Intel Core i9-12950HX (15499 - 22868, n=7) | |
| Lenovo ThinkPad P16 G1 21D6001DMB | |
| Dell Precision 7000 7670 Performance | |
| HP ZBook Studio 16 G9 62U04EA | |
| MSI CreatorPro Z16P B12UKST | |
| AIDA64 / FPU Julia | |
| Lenovo ThinkPad P16 G1 RTX A5500 | |
| Moyenne Intel Core i9-12950HX (77846 - 115907, n=7) | |
| Lenovo ThinkPad P16 G1 21D6001DMB | |
| HP ZBook Studio 16 G9 62U04EA | |
| Dell Precision 7000 7670 Performance | |
| MSI CreatorPro Z16P B12UKST | |
| AIDA64 / CPU SHA3 | |
| Lenovo ThinkPad P16 G1 RTX A5500 | |
| Moyenne Intel Core i9-12950HX (3426 - 5069, n=7) | |
| Lenovo ThinkPad P16 G1 21D6001DMB | |
| HP ZBook Studio 16 G9 62U04EA | |
| MSI CreatorPro Z16P B12UKST | |
| Dell Precision 7000 7670 Performance | |
| AIDA64 / CPU Queen | |
| HP ZBook Studio 16 G9 62U04EA | |
| Moyenne Intel Core i9-12950HX (102752 - 104726, n=7) | |
| Lenovo ThinkPad P16 G1 RTX A5500 | |
| Dell Precision 7000 7670 Performance | |
| MSI CreatorPro Z16P B12UKST | |
| Lenovo ThinkPad P16 G1 21D6001DMB | |
| AIDA64 / FPU SinJulia | |
| Lenovo ThinkPad P16 G1 RTX A5500 | |
| Moyenne Intel Core i9-12950HX (10134 - 12823, n=7) | |
| Lenovo ThinkPad P16 G1 21D6001DMB | |
| Dell Precision 7000 7670 Performance | |
| HP ZBook Studio 16 G9 62U04EA | |
| MSI CreatorPro Z16P B12UKST | |
| AIDA64 / FPU Mandel | |
| Lenovo ThinkPad P16 G1 RTX A5500 | |
| Moyenne Intel Core i9-12950HX (37146 - 57340, n=7) | |
| Lenovo ThinkPad P16 G1 21D6001DMB | |
| HP ZBook Studio 16 G9 62U04EA | |
| Dell Precision 7000 7670 Performance | |
| MSI CreatorPro Z16P B12UKST | |
| AIDA64 / CPU AES | |
| MSI CreatorPro Z16P B12UKST | |
| Moyenne Intel Core i9-12950HX (72599 - 181128, n=7) | |
| Lenovo ThinkPad P16 G1 RTX A5500 | |
| Lenovo ThinkPad P16 G1 21D6001DMB | |
| HP ZBook Studio 16 G9 62U04EA | |
| Dell Precision 7000 7670 Performance | |
| AIDA64 / FP64 Ray-Trace | |
| Lenovo ThinkPad P16 G1 RTX A5500 | |
| Moyenne Intel Core i9-12950HX (8455 - 12432, n=7) | |
| Lenovo ThinkPad P16 G1 21D6001DMB | |
| HP ZBook Studio 16 G9 62U04EA | |
| Dell Precision 7000 7670 Performance | |
| MSI CreatorPro Z16P B12UKST | |
| AIDA64 / CPU PhotoWorxx | |
| MSI CreatorPro Z16P B12UKST | |
| Dell Precision 7000 7670 Performance | |
| Moyenne Intel Core i9-12950HX (35479 - 42655, n=7) | |
| Lenovo ThinkPad P16 G1 RTX A5500 | |
| HP ZBook Studio 16 G9 62U04EA | |
| Lenovo ThinkPad P16 G1 21D6001DMB | |
Performance du système
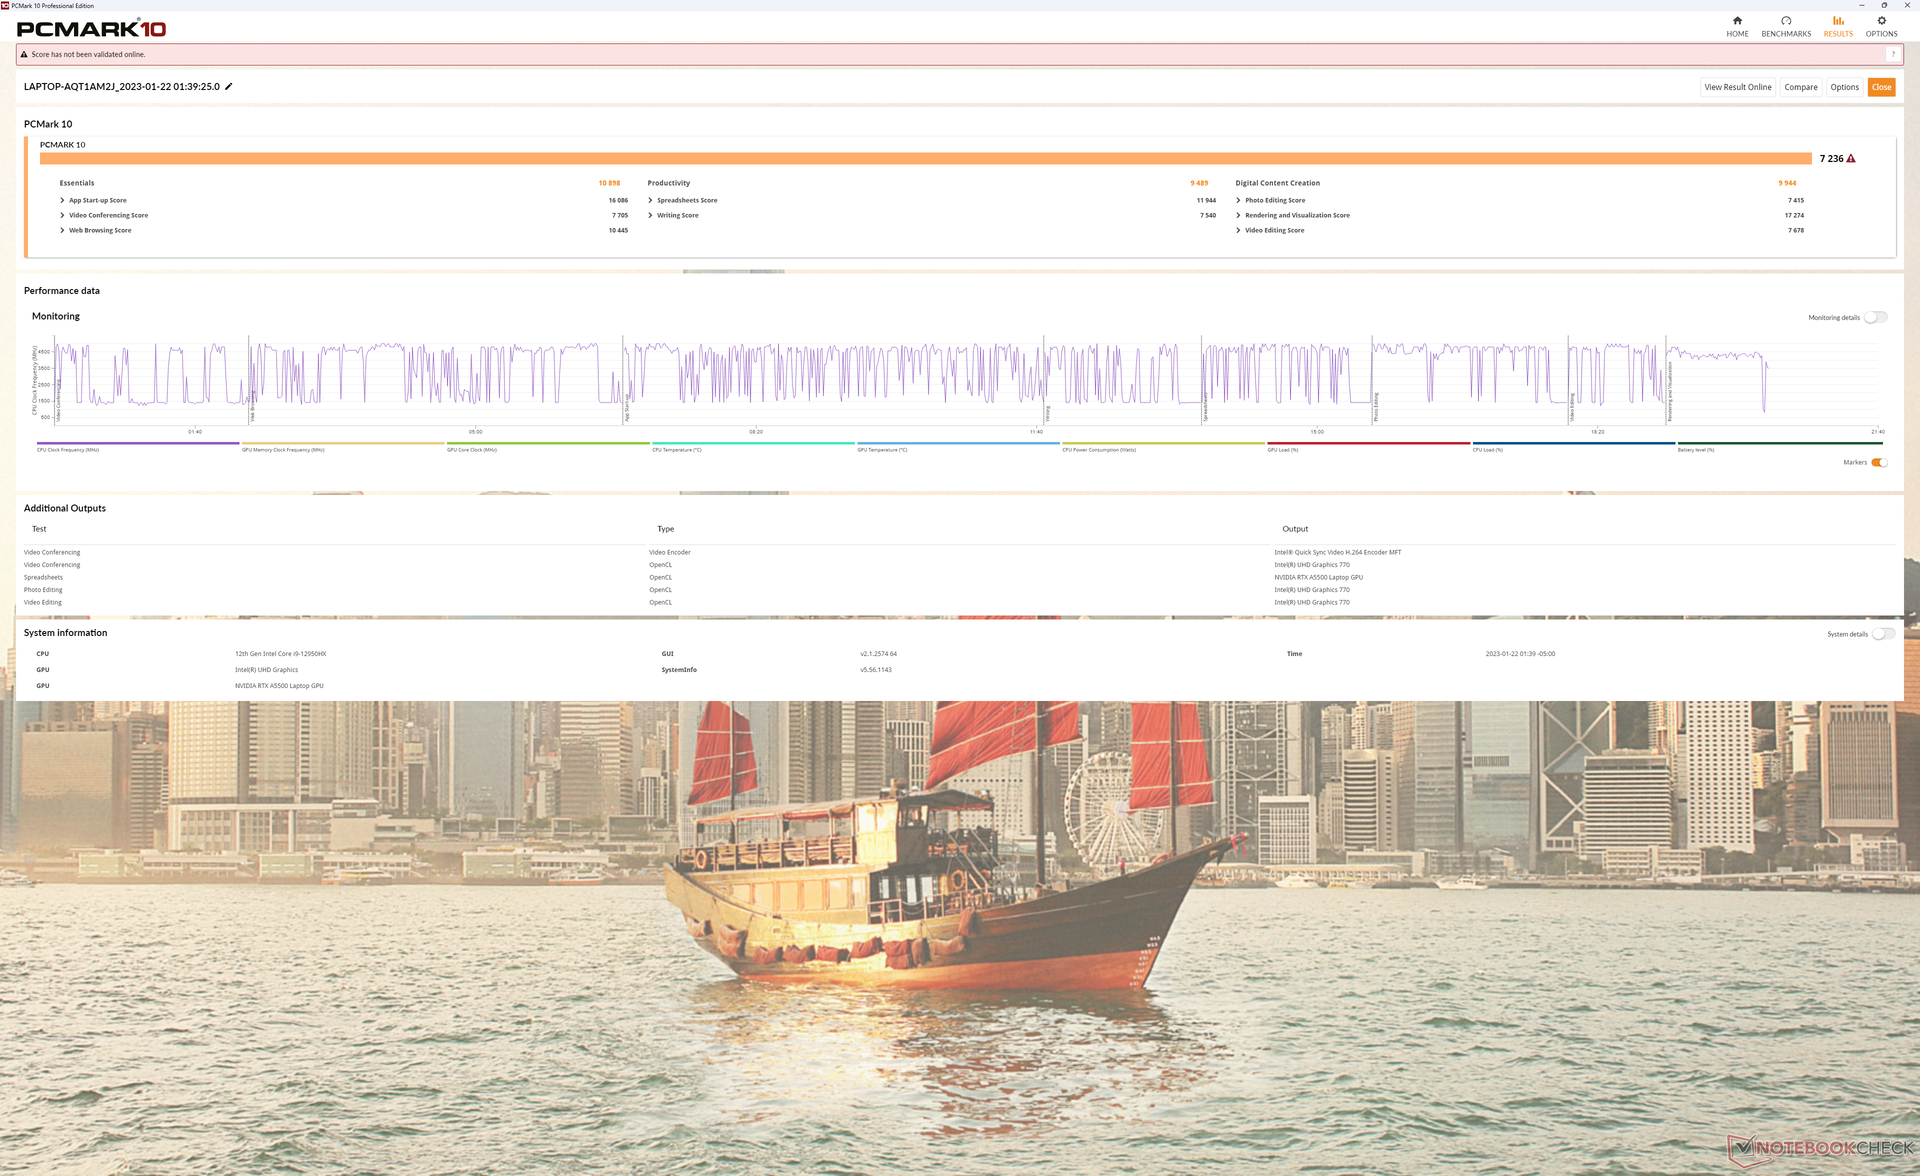
Les scores PCMark sont parmi les plus élevés que nous ayons vus sur une station de travail mobile. Notre système devance même le Dell Precision 7670 qui est livré avec les mêmes options de CPU et de GPU que le ThinkPad P16 G1.
CrossMark: Overall | Productivity | Creativity | Responsiveness
| PCMark 10 / Score | |
| Lenovo ThinkPad P16 G1 RTX A5500 | |
| MSI CreatorPro Z16P B12UKST | |
| Moyenne Intel Core i9-12950HX, NVIDIA RTX A5500 Laptop GPU (6883 - 7236, n=3) | |
| Asus ProArt StudioBook 16 W7600H5A-2BL2 | |
| Dell Precision 7000 7670 Performance | |
| HP ZBook Studio 16 G9 62U04EA | |
| Lenovo ThinkPad P16 G1 21D6001DMB | |
| PCMark 10 / Essentials | |
| Dell Precision 7000 7670 Performance | |
| Moyenne Intel Core i9-12950HX, NVIDIA RTX A5500 Laptop GPU (10898 - 11465, n=3) | |
| Lenovo ThinkPad P16 G1 RTX A5500 | |
| MSI CreatorPro Z16P B12UKST | |
| Asus ProArt StudioBook 16 W7600H5A-2BL2 | |
| Lenovo ThinkPad P16 G1 21D6001DMB | |
| HP ZBook Studio 16 G9 62U04EA | |
| PCMark 10 / Productivity | |
| Lenovo ThinkPad P16 G1 RTX A5500 | |
| MSI CreatorPro Z16P B12UKST | |
| Lenovo ThinkPad P16 G1 21D6001DMB | |
| Asus ProArt StudioBook 16 W7600H5A-2BL2 | |
| Moyenne Intel Core i9-12950HX, NVIDIA RTX A5500 Laptop GPU (8054 - 9489, n=3) | |
| Dell Precision 7000 7670 Performance | |
| HP ZBook Studio 16 G9 62U04EA | |
| PCMark 10 / Digital Content Creation | |
| Asus ProArt StudioBook 16 W7600H5A-2BL2 | |
| Lenovo ThinkPad P16 G1 RTX A5500 | |
| MSI CreatorPro Z16P B12UKST | |
| Dell Precision 7000 7670 Performance | |
| Moyenne Intel Core i9-12950HX, NVIDIA RTX A5500 Laptop GPU (9155 - 9944, n=3) | |
| HP ZBook Studio 16 G9 62U04EA | |
| Lenovo ThinkPad P16 G1 21D6001DMB | |
| CrossMark / Overall | |
| MSI CreatorPro Z16P B12UKST | |
| Lenovo ThinkPad P16 G1 RTX A5500 | |
| Moyenne Intel Core i9-12950HX, NVIDIA RTX A5500 Laptop GPU (1801 - 1889, n=3) | |
| HP ZBook Studio 16 G9 62U04EA | |
| Dell Precision 7000 7670 Performance | |
| Lenovo ThinkPad P16 G1 21D6001DMB | |
| CrossMark / Productivity | |
| MSI CreatorPro Z16P B12UKST | |
| Lenovo ThinkPad P16 G1 RTX A5500 | |
| Moyenne Intel Core i9-12950HX, NVIDIA RTX A5500 Laptop GPU (1684 - 1785, n=3) | |
| HP ZBook Studio 16 G9 62U04EA | |
| Dell Precision 7000 7670 Performance | |
| Lenovo ThinkPad P16 G1 21D6001DMB | |
| CrossMark / Creativity | |
| Lenovo ThinkPad P16 G1 RTX A5500 | |
| Moyenne Intel Core i9-12950HX, NVIDIA RTX A5500 Laptop GPU (2042 - 2192, n=3) | |
| HP ZBook Studio 16 G9 62U04EA | |
| MSI CreatorPro Z16P B12UKST | |
| Dell Precision 7000 7670 Performance | |
| Lenovo ThinkPad P16 G1 21D6001DMB | |
| CrossMark / Responsiveness | |
| MSI CreatorPro Z16P B12UKST | |
| HP ZBook Studio 16 G9 62U04EA | |
| Moyenne Intel Core i9-12950HX, NVIDIA RTX A5500 Laptop GPU (1501 - 1585, n=3) | |
| Dell Precision 7000 7670 Performance | |
| Lenovo ThinkPad P16 G1 RTX A5500 | |
| Lenovo ThinkPad P16 G1 21D6001DMB | |
| PCMark 10 Score | 7236 points | |
Aide | ||
| AIDA64 / Memory Copy | |
| Dell Precision 7000 7670 Performance | |
| Moyenne Intel Core i9-12950HX (59731 - 64732, n=7) | |
| Lenovo ThinkPad P16 G1 RTX A5500 | |
| MSI CreatorPro Z16P B12UKST | |
| HP ZBook Studio 16 G9 62U04EA | |
| Lenovo ThinkPad P16 G1 21D6001DMB | |
| AIDA64 / Memory Read | |
| Dell Precision 7000 7670 Performance | |
| Moyenne Intel Core i9-12950HX (59744 - 70359, n=7) | |
| MSI CreatorPro Z16P B12UKST | |
| HP ZBook Studio 16 G9 62U04EA | |
| Lenovo ThinkPad P16 G1 RTX A5500 | |
| Lenovo ThinkPad P16 G1 21D6001DMB | |
| AIDA64 / Memory Write | |
| MSI CreatorPro Z16P B12UKST | |
| Dell Precision 7000 7670 Performance | |
| HP ZBook Studio 16 G9 62U04EA | |
| Moyenne Intel Core i9-12950HX (57750 - 67899, n=7) | |
| Lenovo ThinkPad P16 G1 RTX A5500 | |
| Lenovo ThinkPad P16 G1 21D6001DMB | |
* ... Moindre est la valeur, meilleures sont les performances
Latence DPC
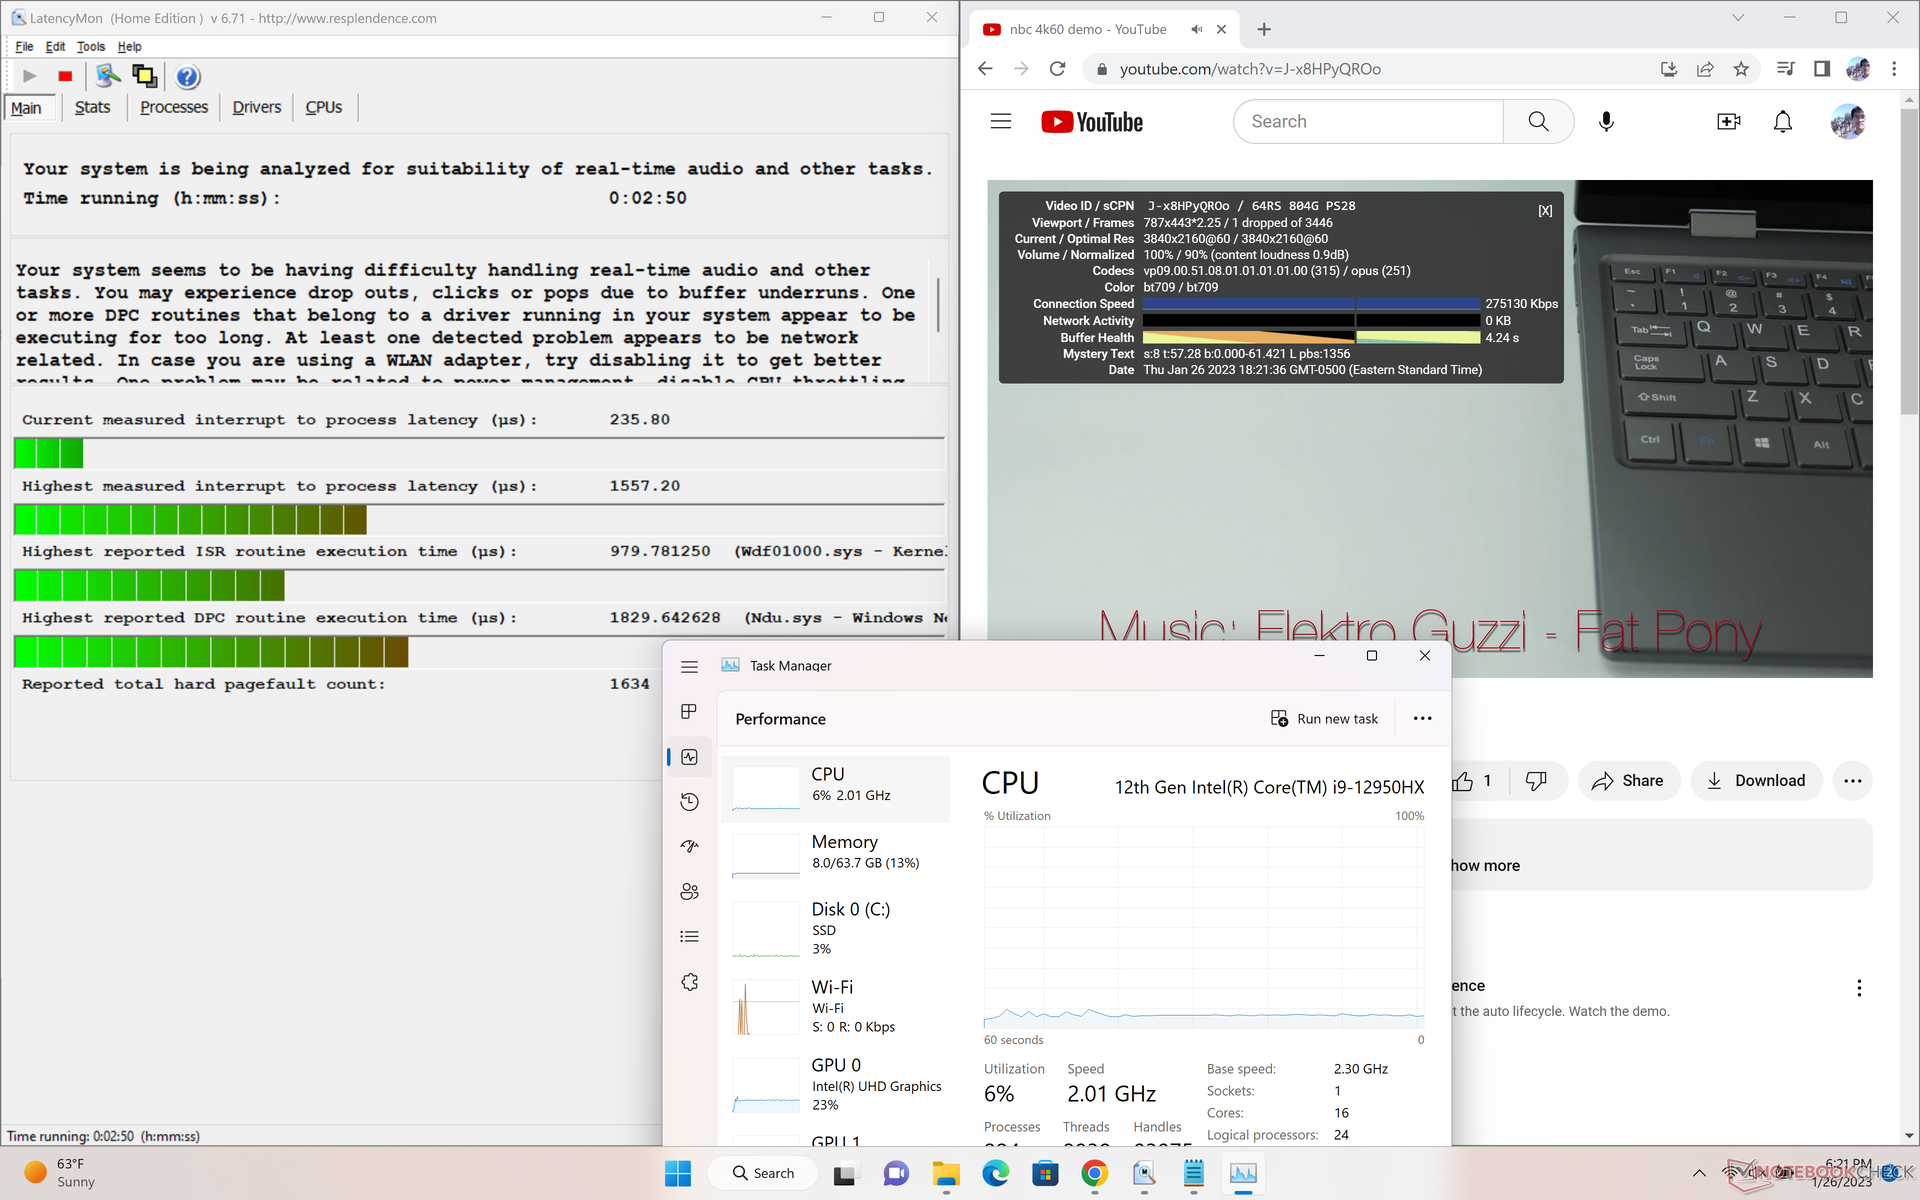
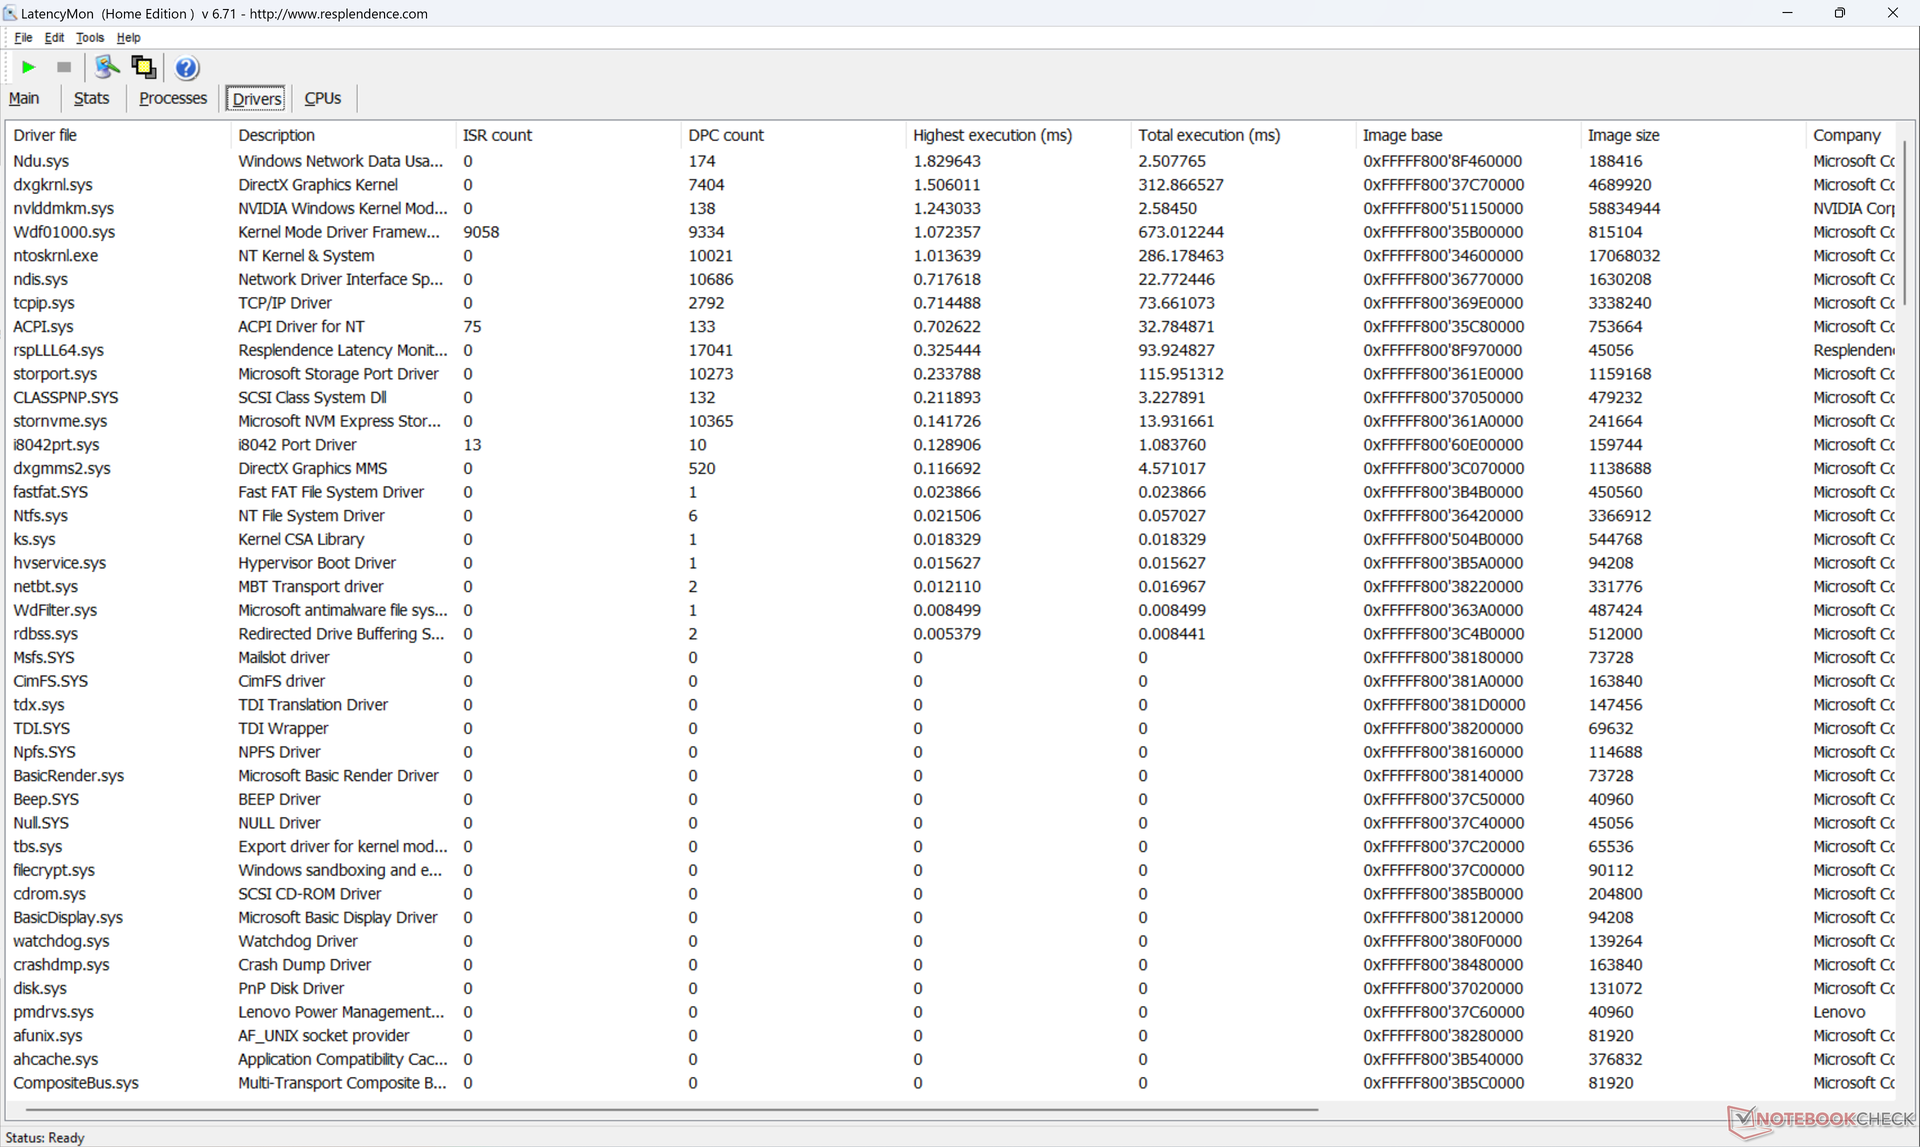
LatencyMon révèle des problèmes mineurs de DPC lors de l'ouverture de plusieurs onglets de navigateur de notre page d'accueil, ce qui est décevant pour une station de travail. la lecture de vidéos 4K à 60 FPS est par ailleurs excellente, avec une seule image perdue pendant notre vidéo de test.
| DPC Latencies / LatencyMon - interrupt to process latency (max), Web, Youtube, Prime95 | |
| Dell Precision 7000 7670 Performance | |
| Lenovo ThinkPad P16 G1 RTX A5500 | |
| Asus ProArt StudioBook 16 W7600H5A-2BL2 | |
| Lenovo ThinkPad P16 G1 21D6001DMB | |
| HP ZBook Studio 16 G9 62U04EA | |
| MSI CreatorPro Z16P B12UKST | |
* ... Moindre est la valeur, meilleures sont les performances
Périphériques de stockage
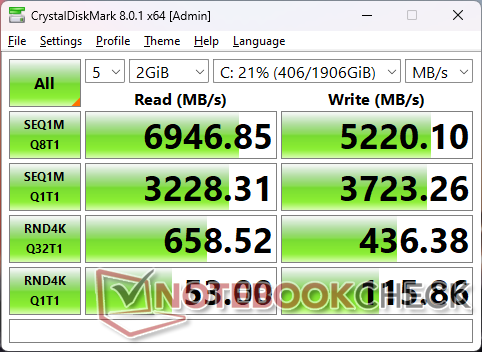
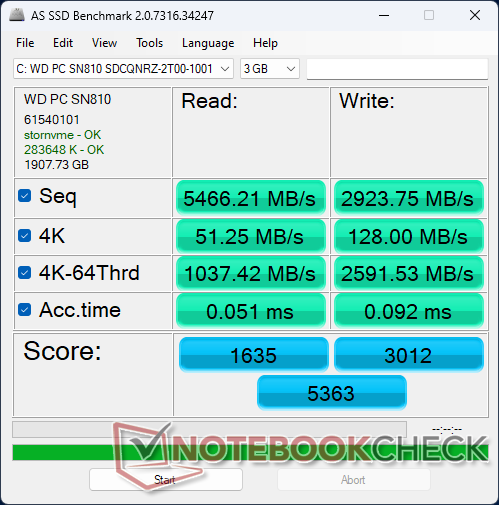
Alors que notre configuration A2000 est livrée avec un SSD Micron 3400, notre configuration A5500 est livrée avec un SSD WD SN10 OPAL WD SN810 OPAL SSD à la place. Les taux de lecture et d'écriture séquentielle sont comparables entre les deux, mais notre disque WD semble avoir des problèmes pour maintenir les taux de transfert maximum après environ 5 minutes de stress comme le montre notre graphique de comparaison ci-dessous.

* ... Moindre est la valeur, meilleures sont les performances
Disk Throttling: DiskSpd Read Loop, Queue Depth 8
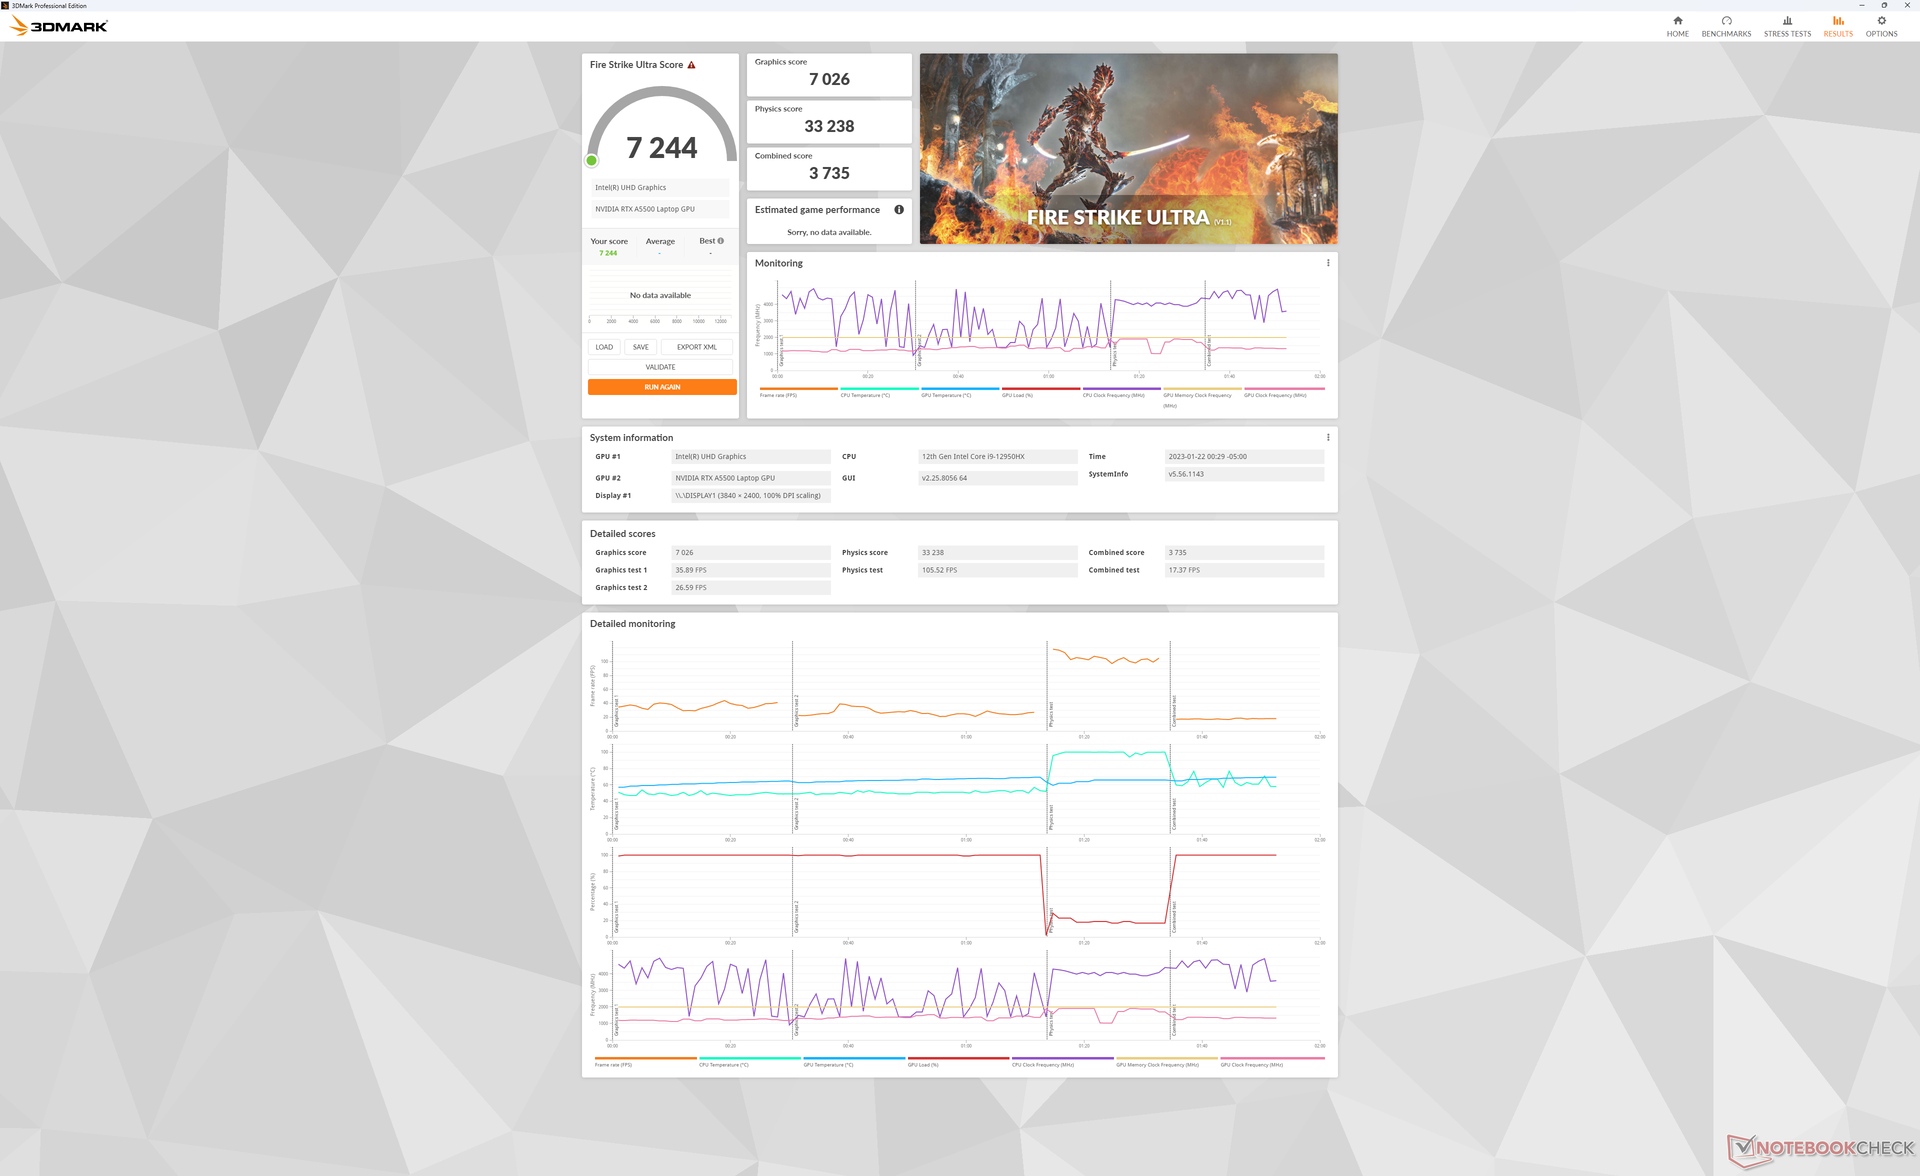
Performances du GPU
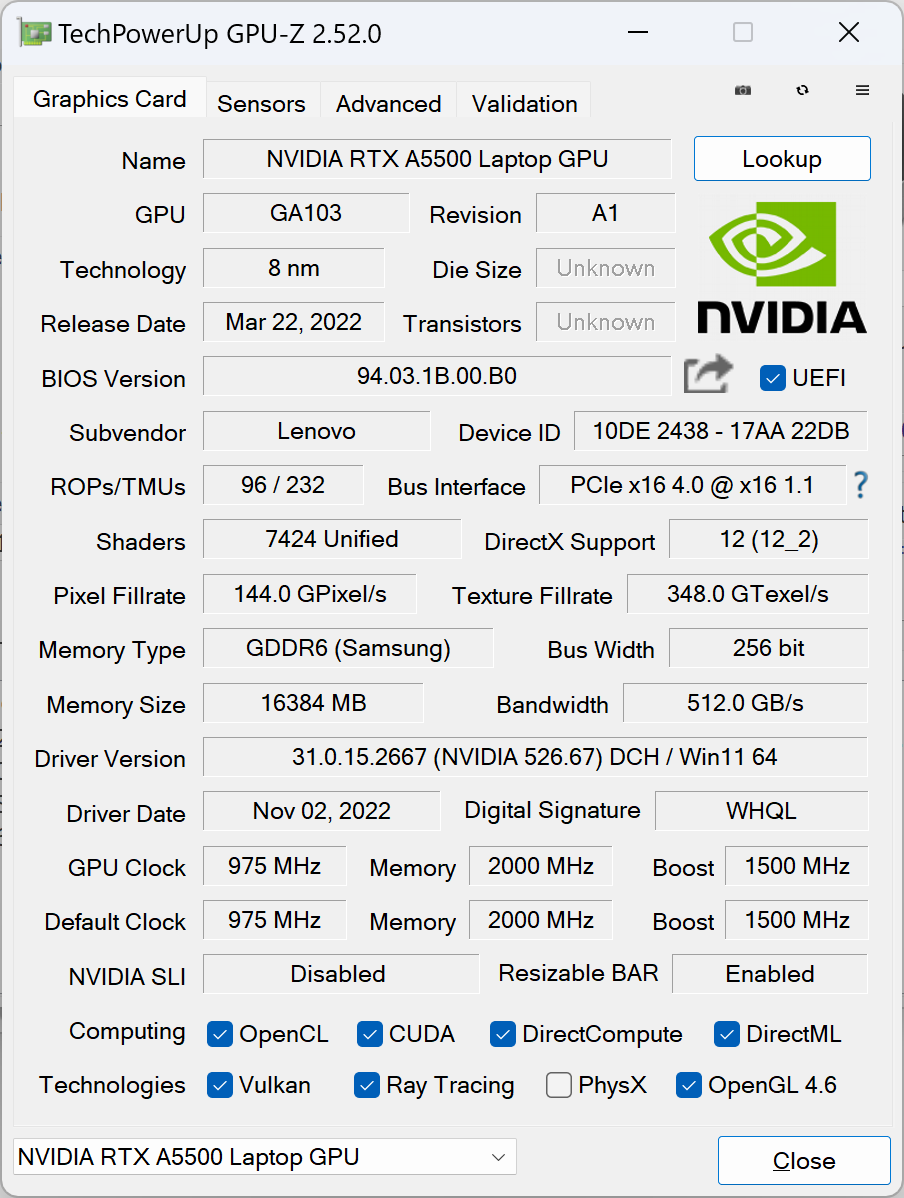
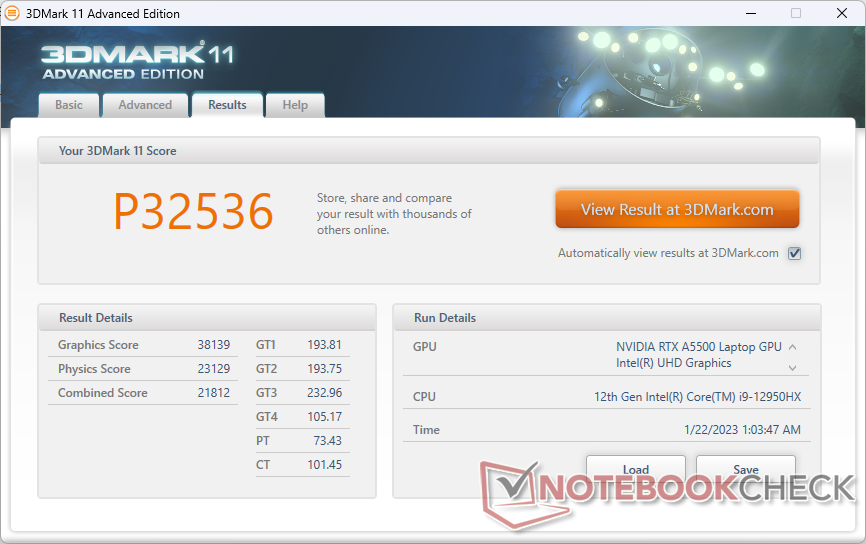
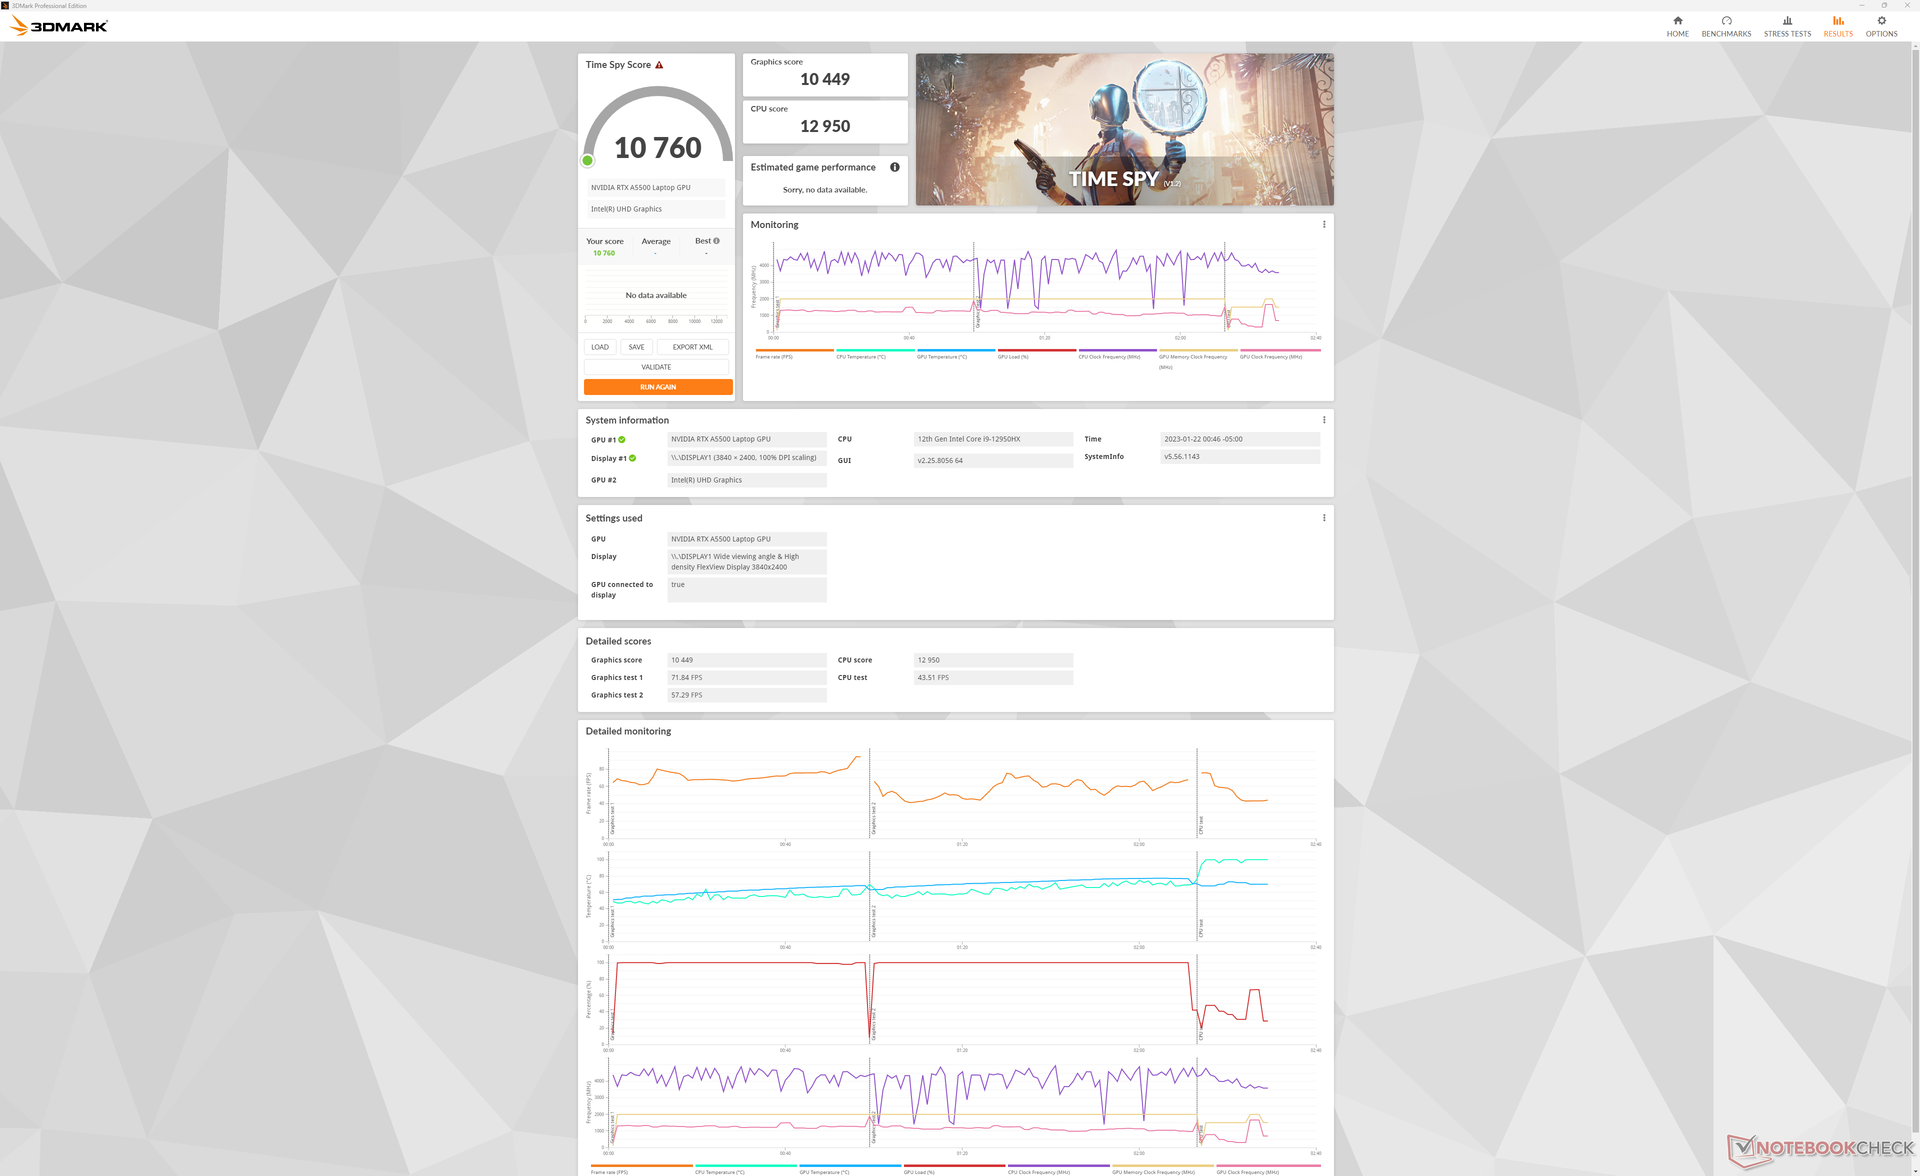
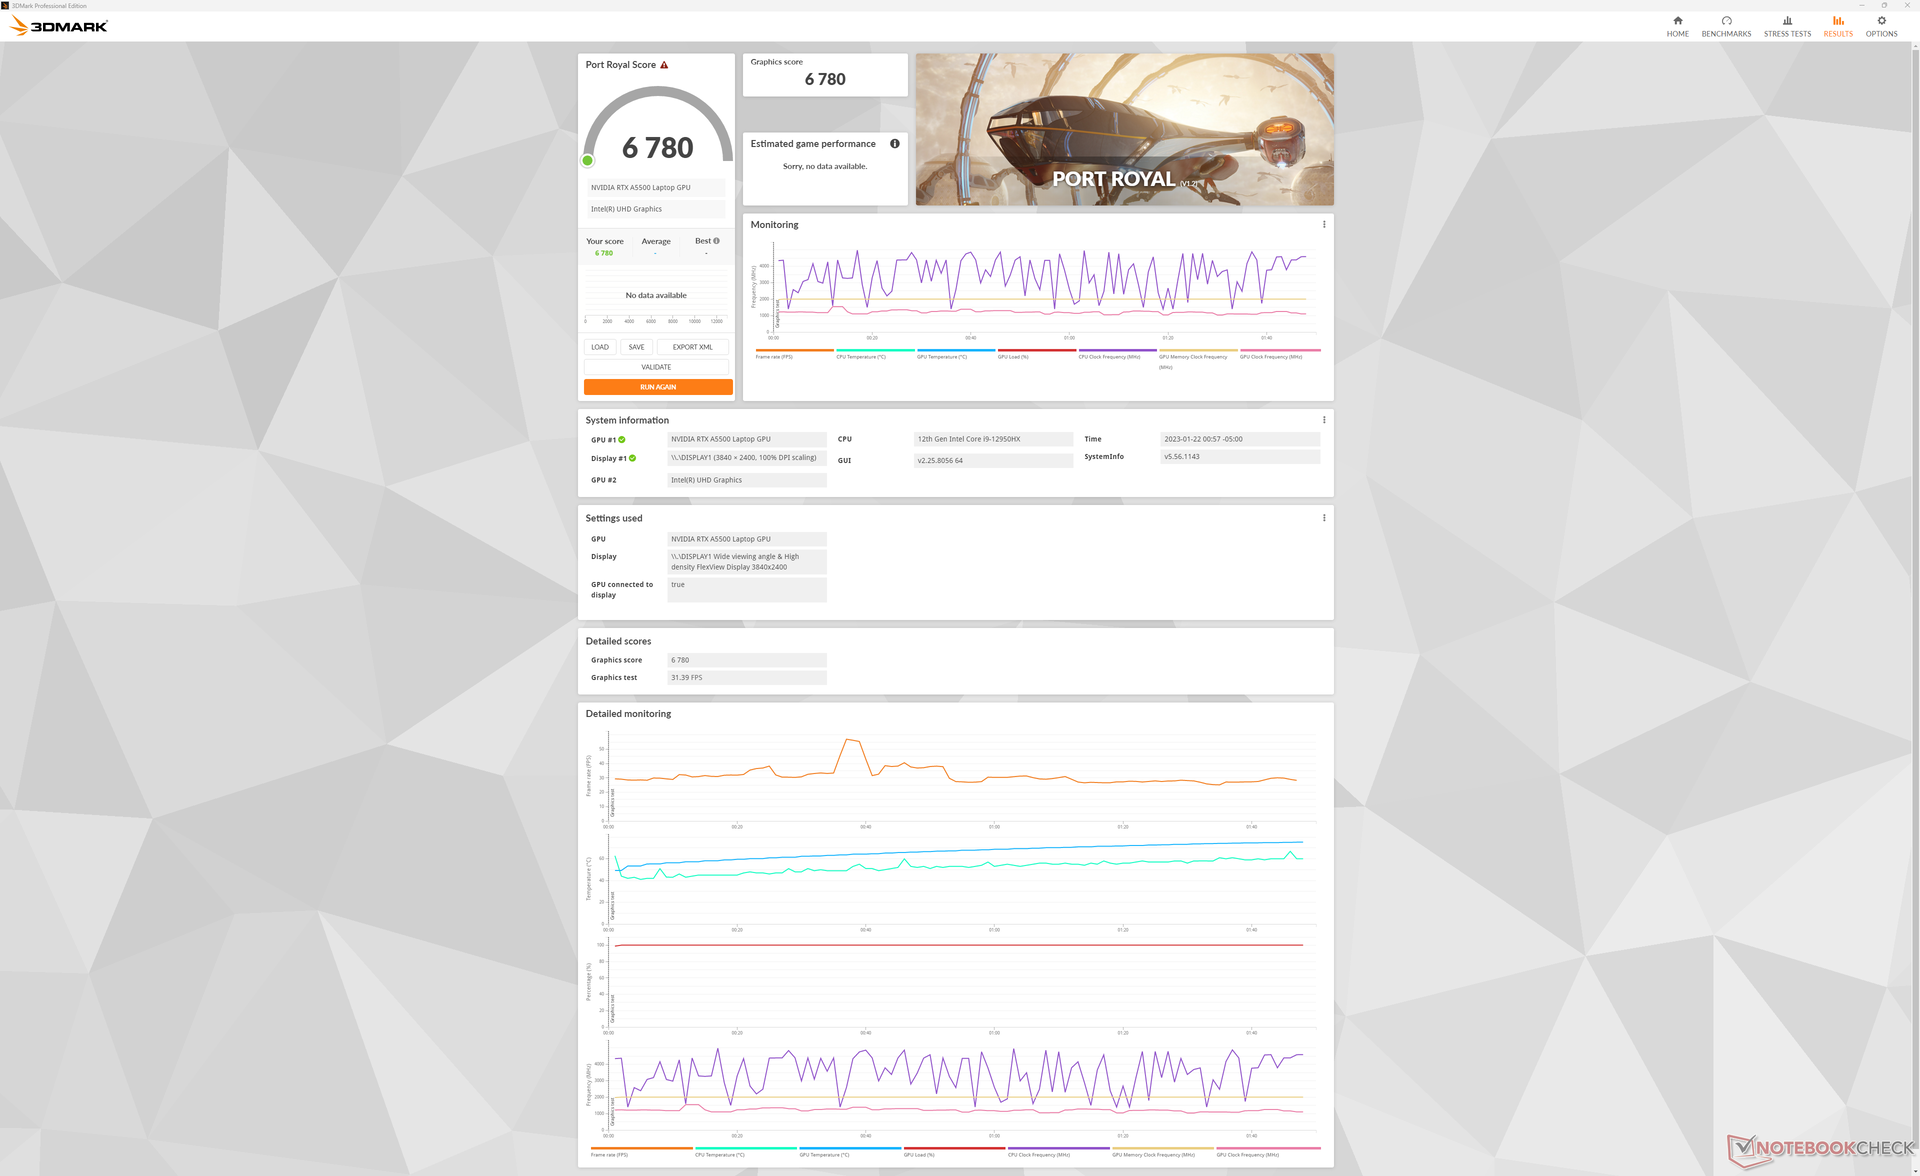
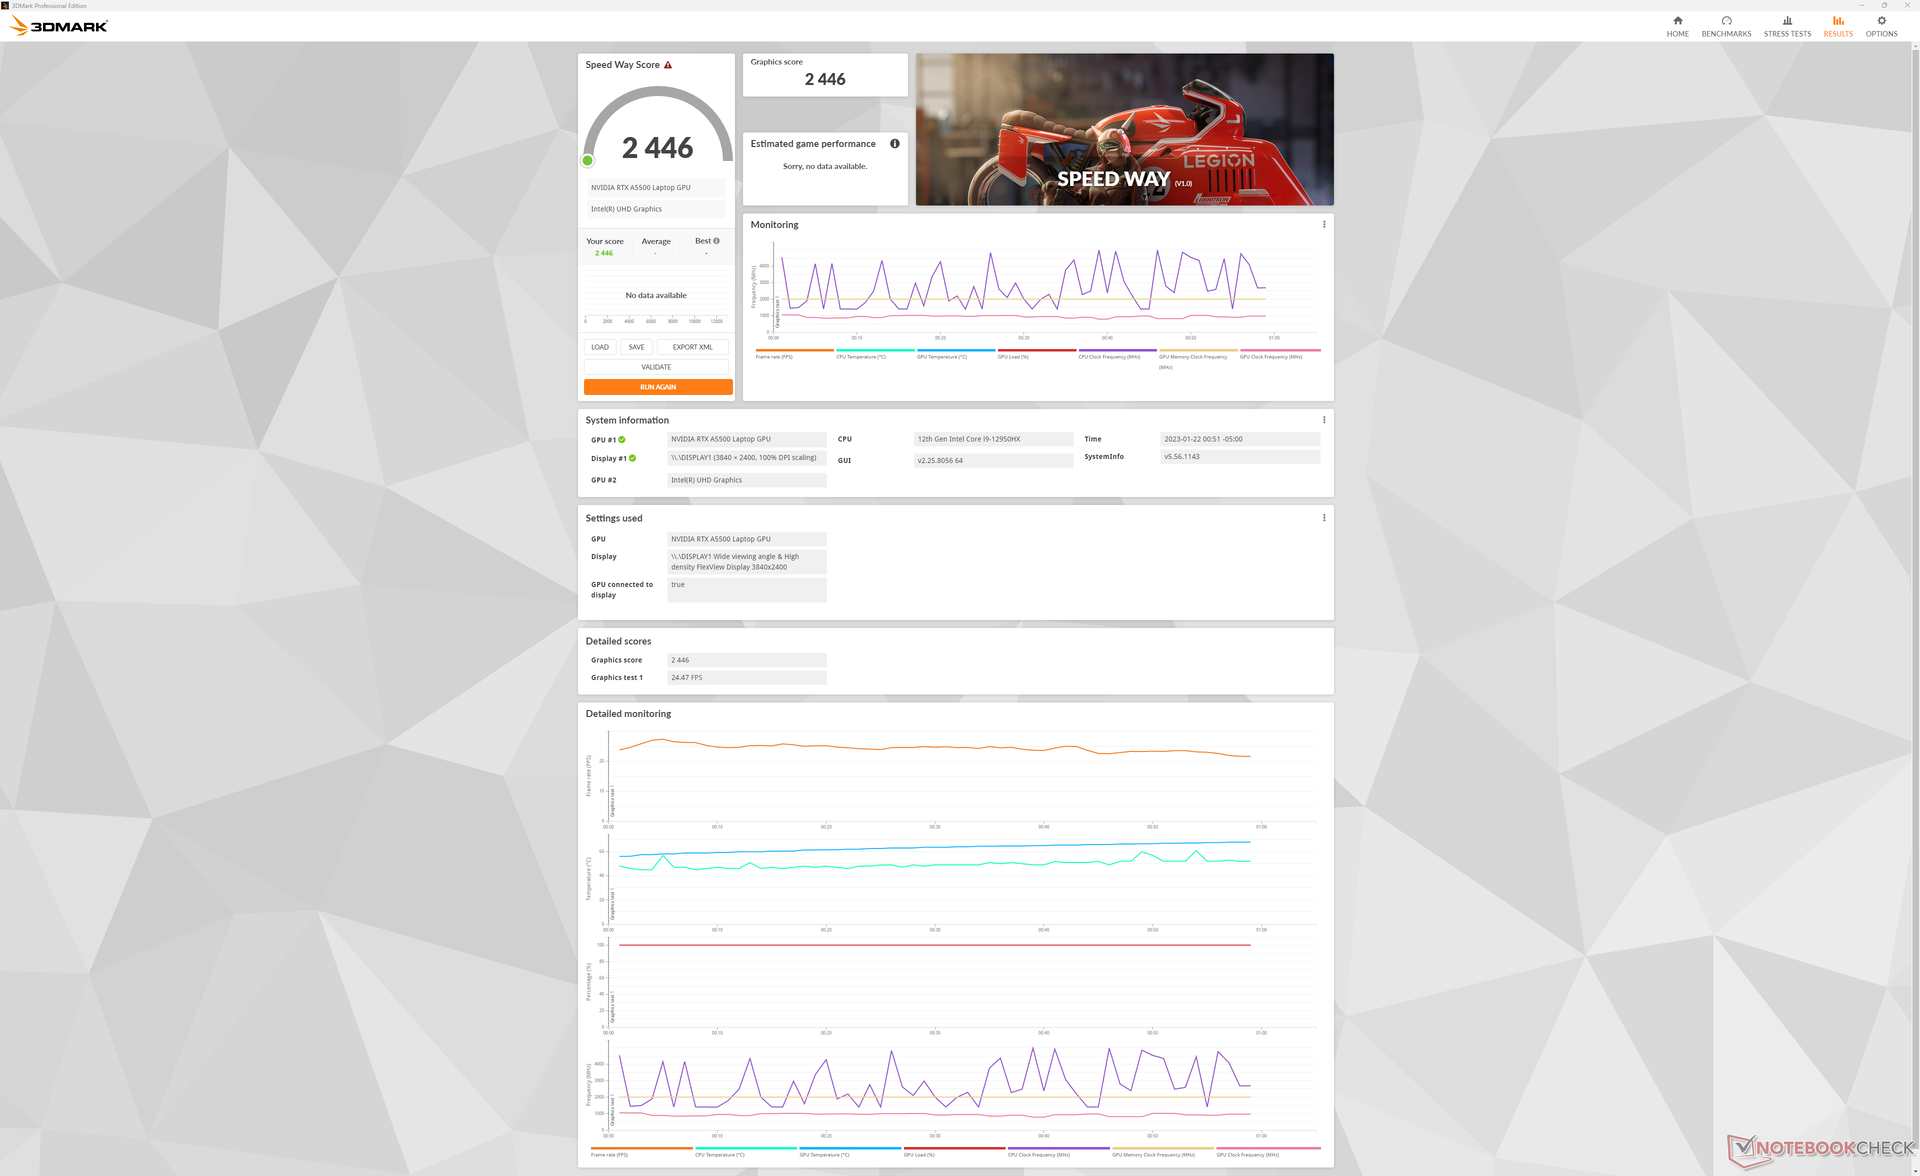
Le site RTX A5500 dans notre Lenovo est environ 10 % plus rapide que le même GPU dans le concurrent Precision 7670. Ceci malgré le fait que le GPU de Dell est évalué à 135 W TGP contre 130 W TGP dans notre Lenovo selon le panneau de contrôle de Nvidia. Si l'on passe au bas de gamme RTX A2000 De bas de gamme, les performances graphiques seront réduites de 50 à 65 %.
| 3DMark Performance rating - Percent | |
| Lenovo Legion 7 16IAX7-82TD004SGE -34! | |
| Lenovo ThinkPad P16 G1 RTX A5500 | |
| Dell Precision 7000 7670 Performance -1! | |
| Moyenne NVIDIA RTX A5500 Laptop GPU | |
| Asus ProArt StudioBook 16 W7600H5A-2BL2 -19! | |
| MSI WE76 11UM-456 -9! | |
| HP ZBook Fury 15 G8 -1! | |
| MSI CreatorPro Z16P B12UKST -17! | |
| HP ZBook Studio 15 G8 -17! | |
| HP ZBook Studio G7 -17! | |
| HP ZBook Studio 16 G9 62U04EA -9! | |
| Dell Precision 5000 5470 -9! | |
| Lenovo ThinkPad P16 G1 21D6001DMB -17! | |
| 3DMark 11 Performance | 32536 points | |
| 3DMark Cloud Gate Standard Score | 54323 points | |
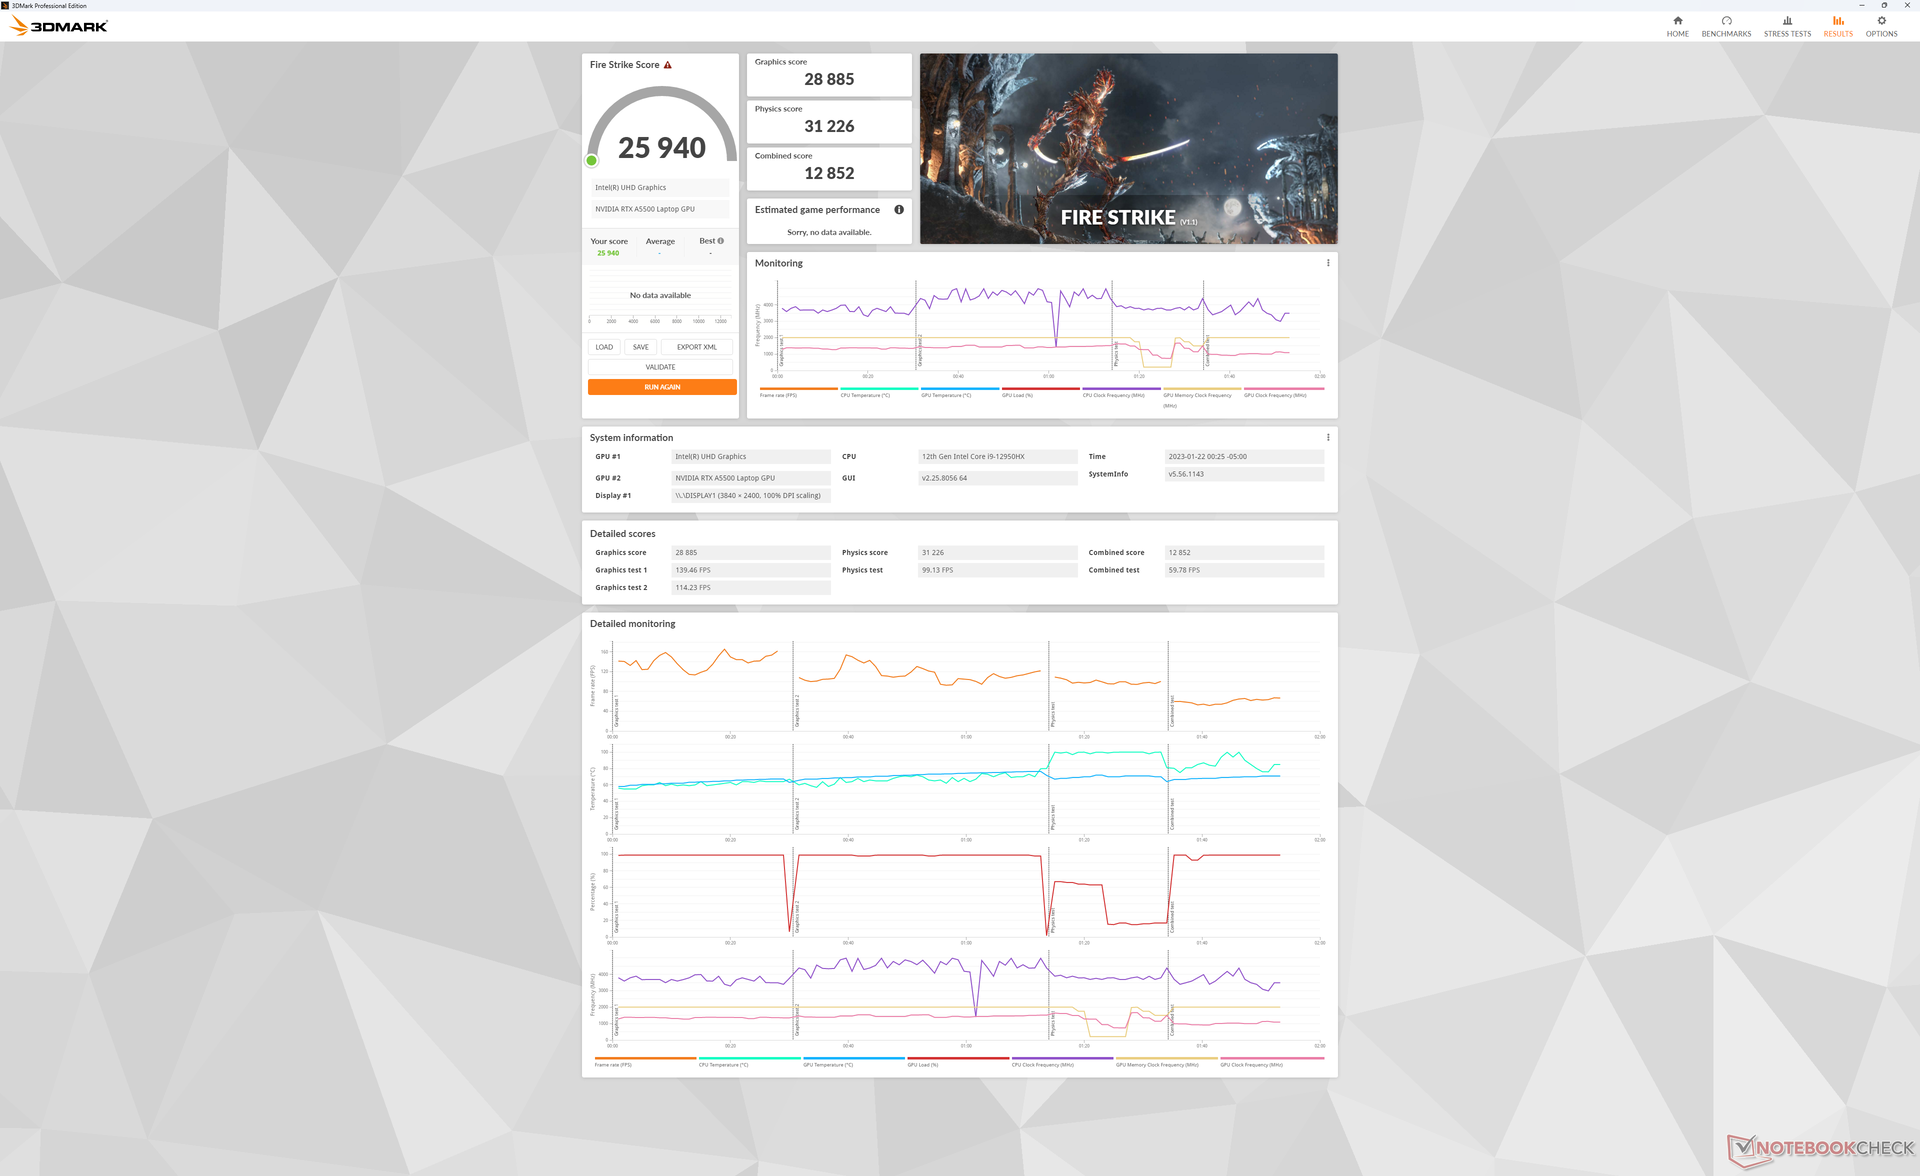
| 3DMark Fire Strike Score | 25940 points | |
| 3DMark Time Spy Score | 10760 points | |
Aide | ||
* ... Moindre est la valeur, meilleures sont les performances
Witcher 3 FPS Chart
| Bas | Moyen | Élevé | Ultra | QHD | 4K | |
|---|---|---|---|---|---|---|
| GTA V (2015) | 185.9 | 183.4 | 177.7 | 124.4 | 103.5 | |
| The Witcher 3 (2015) | 489.4 | 329.9 | 211.8 | 110.4 | 63.7 | |
| Dota 2 Reborn (2015) | 194.3 | 174.5 | 166.1 | 156.3 | 132.8 | |
| Final Fantasy XV Benchmark (2018) | 212 | 142.5 | 113.1 | 83.5 | 45.4 | |
| X-Plane 11.11 (2018) | 155.8 | 137.6 | 108.8 | 93.7 | ||
| Strange Brigade (2018) | 442 | 264 | 223 | 197.7 | 138.6 | |
| Cyberpunk 2077 1.6 (2022) | 132.3 | 117.7 | 96.1 | 80.7 | 47 | 20.4 |
Émissions
Bruit du système
En mode équilibré par défaut, les ventilateurs restent silencieux plus longtemps que prévu, malgré les processeurs hautes performances qu'ils contiennent. Lors de l'exécution de 3DMark 06, par exemple, le nez du ventilateur plafonnait à 28 dB(A) à la fin de la première scène du benchmark. Il fallait attendre plusieurs passages pour que les ventilateurs atteignent un régime plus élevé, jusqu'à 40 dB(A).
Le bruit des ventilateurs lors de l'exécution de charges plus exigeantes en mode Performance atteindrait un peu plus de 50 dB(A), ce qui est nettement plus fort que celui des stations de travail concurrentes, notamment la Precision 7670, comme le montre le tableau ci-dessous. Bien entendu, ces alternatives sont également plus lentes que notre configuration Lenovo.
Degré de la nuisance sonore
| Au repos |
| 23.1 / 23.1 / 23.1 dB(A) |
| Fortement sollicité |
| 28.9 / 51.4 dB(A) |
 | ||
30 dB silencieux 40 dB(A) audible 50 dB(A) bruyant |
||
min: | ||
| Lenovo ThinkPad P16 G1 RTX A5500 RTX A5500 Laptop GPU, i9-12950HX, WDC PC SN810 2TB | Asus ProArt StudioBook 16 W7600H5A-2BL2 RTX A5000 Laptop GPU, W-11955M, 2x Micron 2300 2TB MTFDHBA2T0TDV (RAID 0) | Dell Precision 7000 7670 Performance RTX A5500 Laptop GPU, i9-12950HX | Lenovo ThinkPad P16 G1 21D6001DMB RTX A2000 Laptop GPU, i7-12850HX, Micron 3400 1TB MTFDKBA1T0TFH | MSI CreatorPro Z16P B12UKST RTX A3000 Laptop GPU, i7-12700H, Samsung PM9A1 MZVL21T0HCLR | HP ZBook Studio 16 G9 62U04EA RTX A2000 Laptop GPU, i7-12800H, Micron 3400 1TB MTFDKBA1T0TFH | |
|---|---|---|---|---|---|---|
| Noise | -14% | -16% | -6% | -11% | -9% | |
| arrêt / environnement * (dB) | 23.1 | 26 -13% | 23.9 -3% | 23.2 -0% | 24.1 -4% | 24 -4% |
| Idle Minimum * (dB) | 23.1 | 26 -13% | 24 -4% | 23.2 -0% | 27.1 -17% | 24 -4% |
| Idle Average * (dB) | 23.1 | 26 -13% | 24 -4% | 23.2 -0% | 27.1 -17% | 27.7 -20% |
| Idle Maximum * (dB) | 23.1 | 26.5 -15% | 38 -65% | 23.2 -0% | 27.1 -17% | 27.7 -20% |
| Load Average * (dB) | 28.9 | 42 -45% | 46.3 -60% | 47.8 -65% | 42.9 -48% | 39.8 -38% |
| Witcher 3 ultra * (dB) | 51.6 | 41.9 19% | 34.1 34% | 44 15% | 44.3 14% | |
| Load Maximum * (dB) | 51.4 | 43 16% | 47.9 7% | 56.3 -10% | 47 9% | 47.7 7% |
* ... Moindre est la valeur, meilleures sont les performances
Température
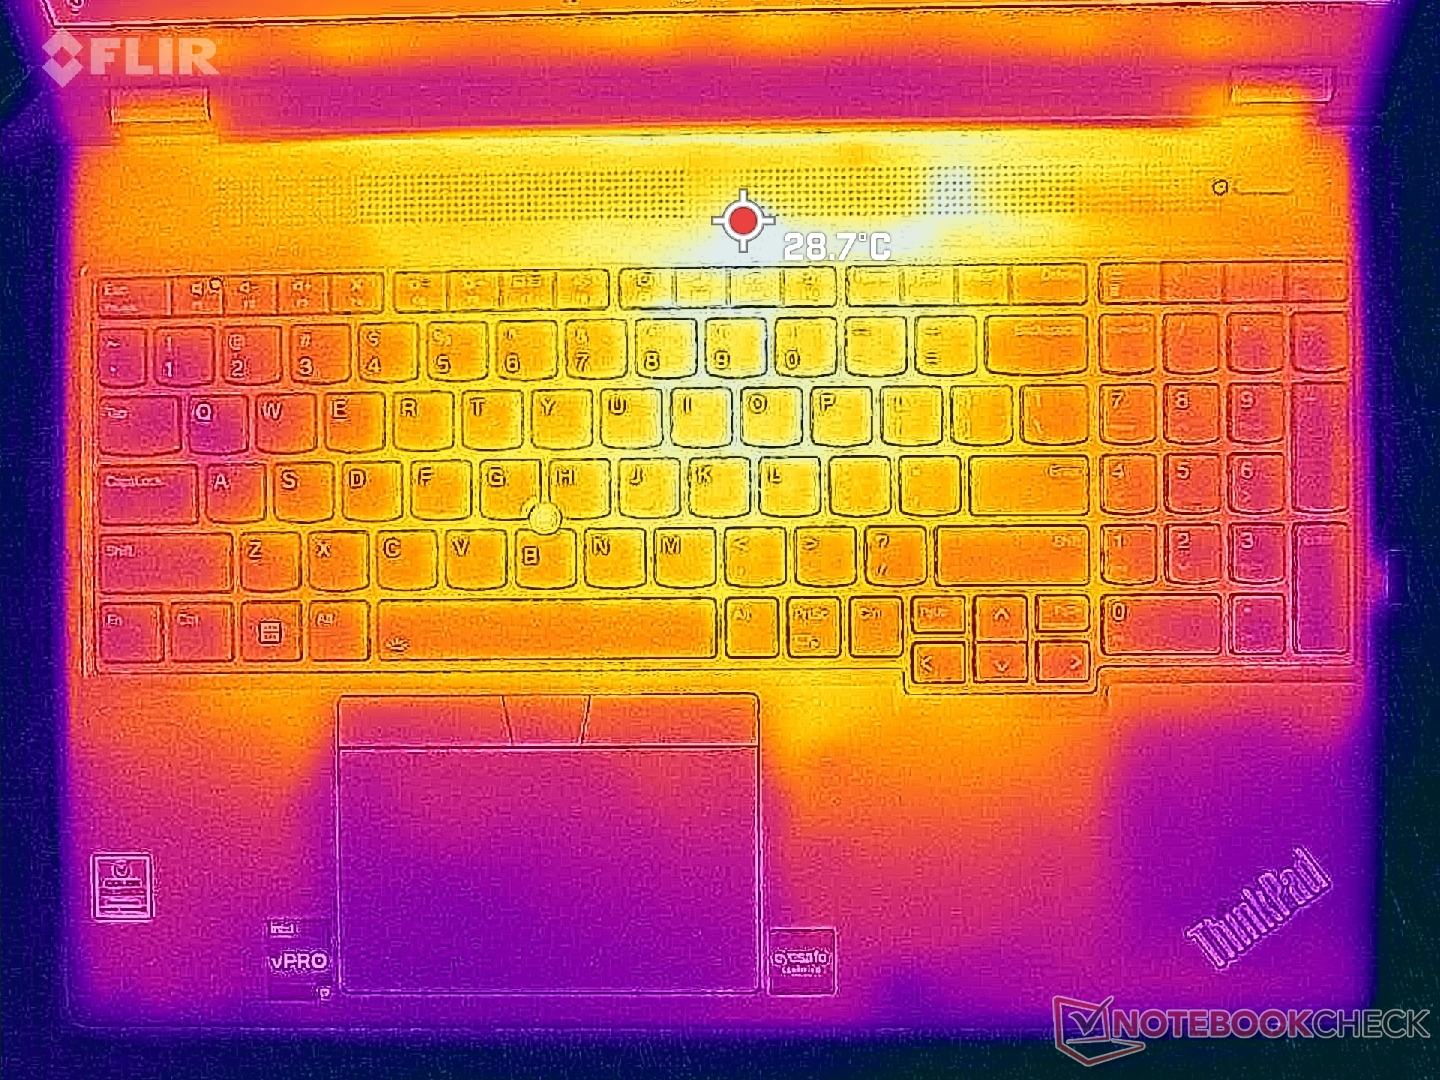
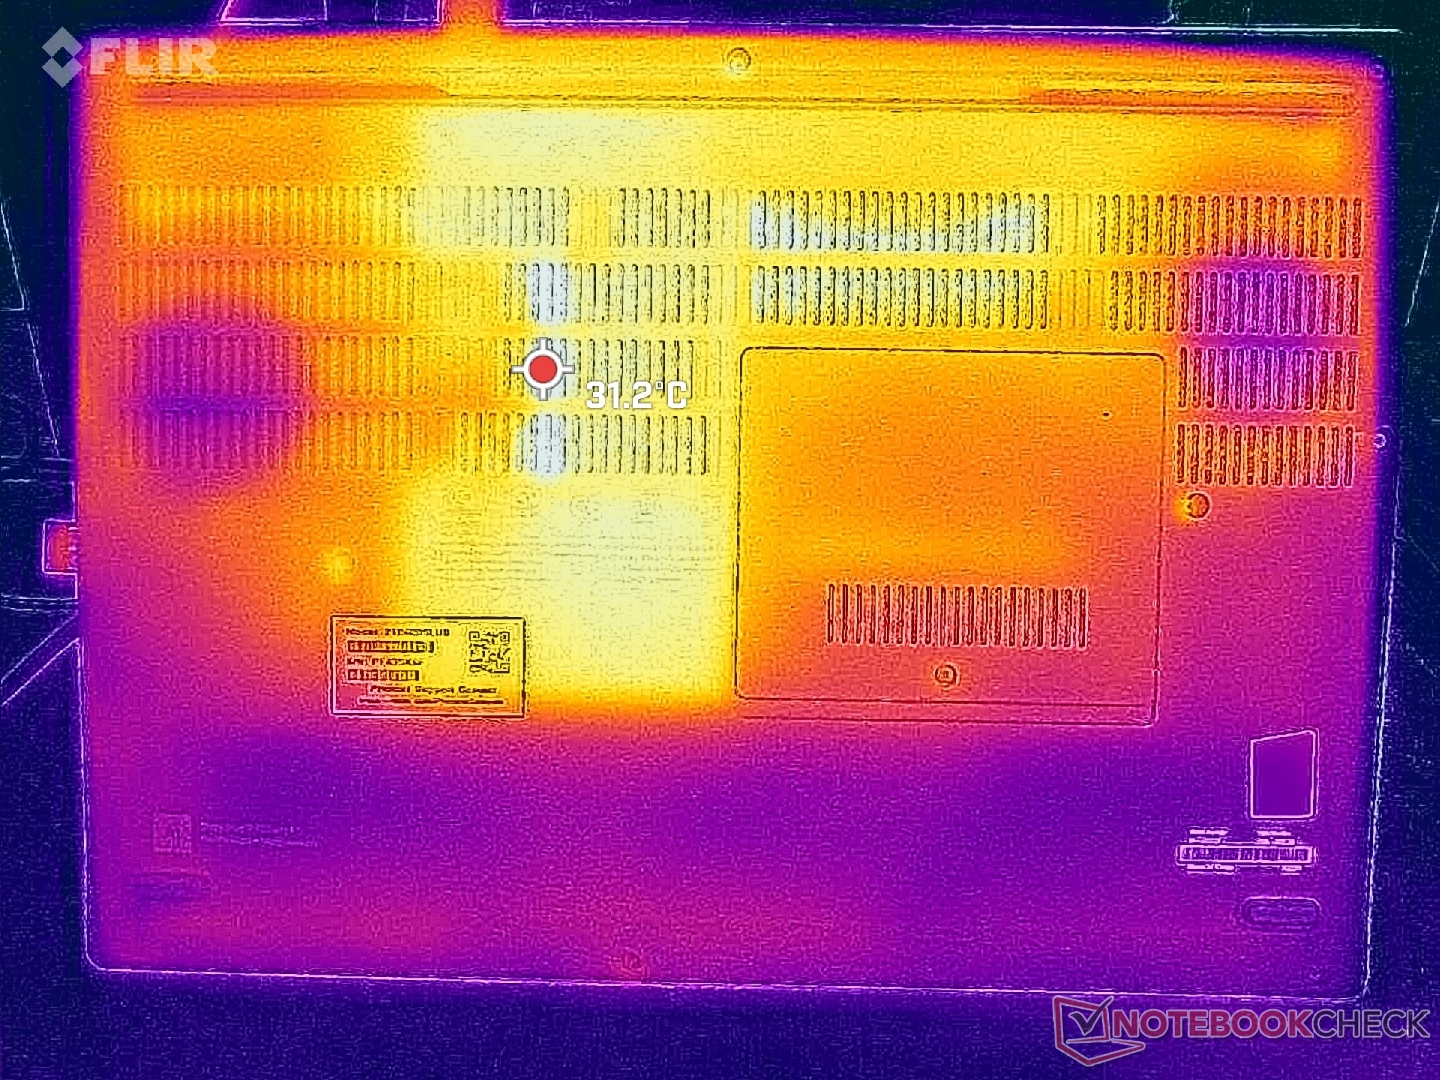
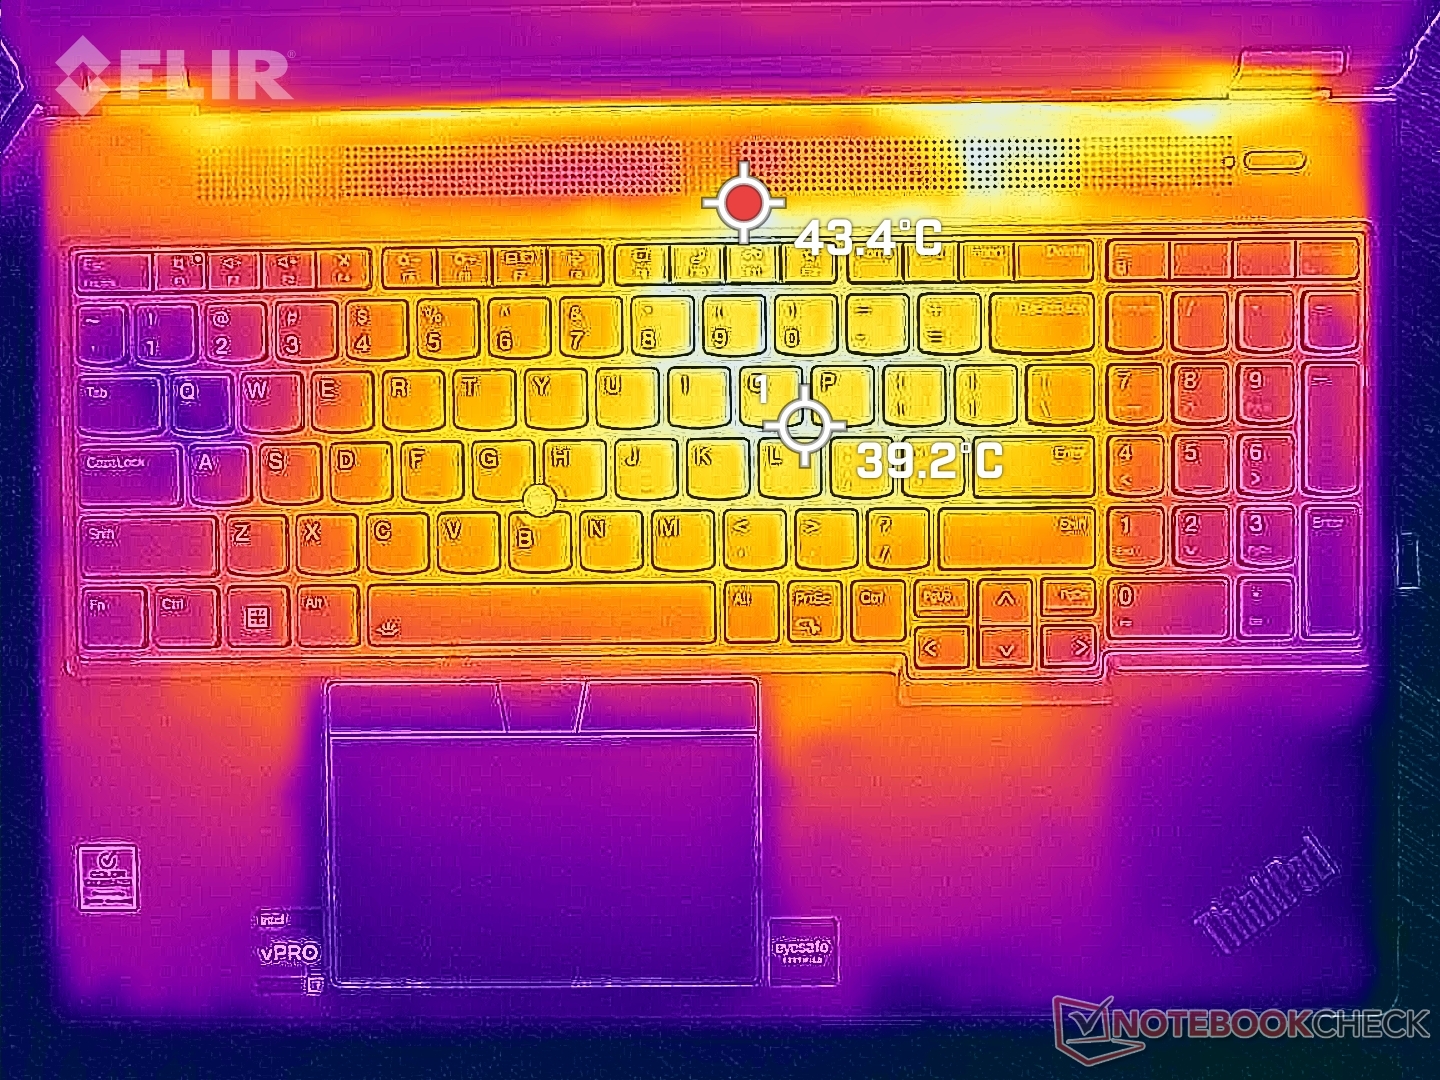
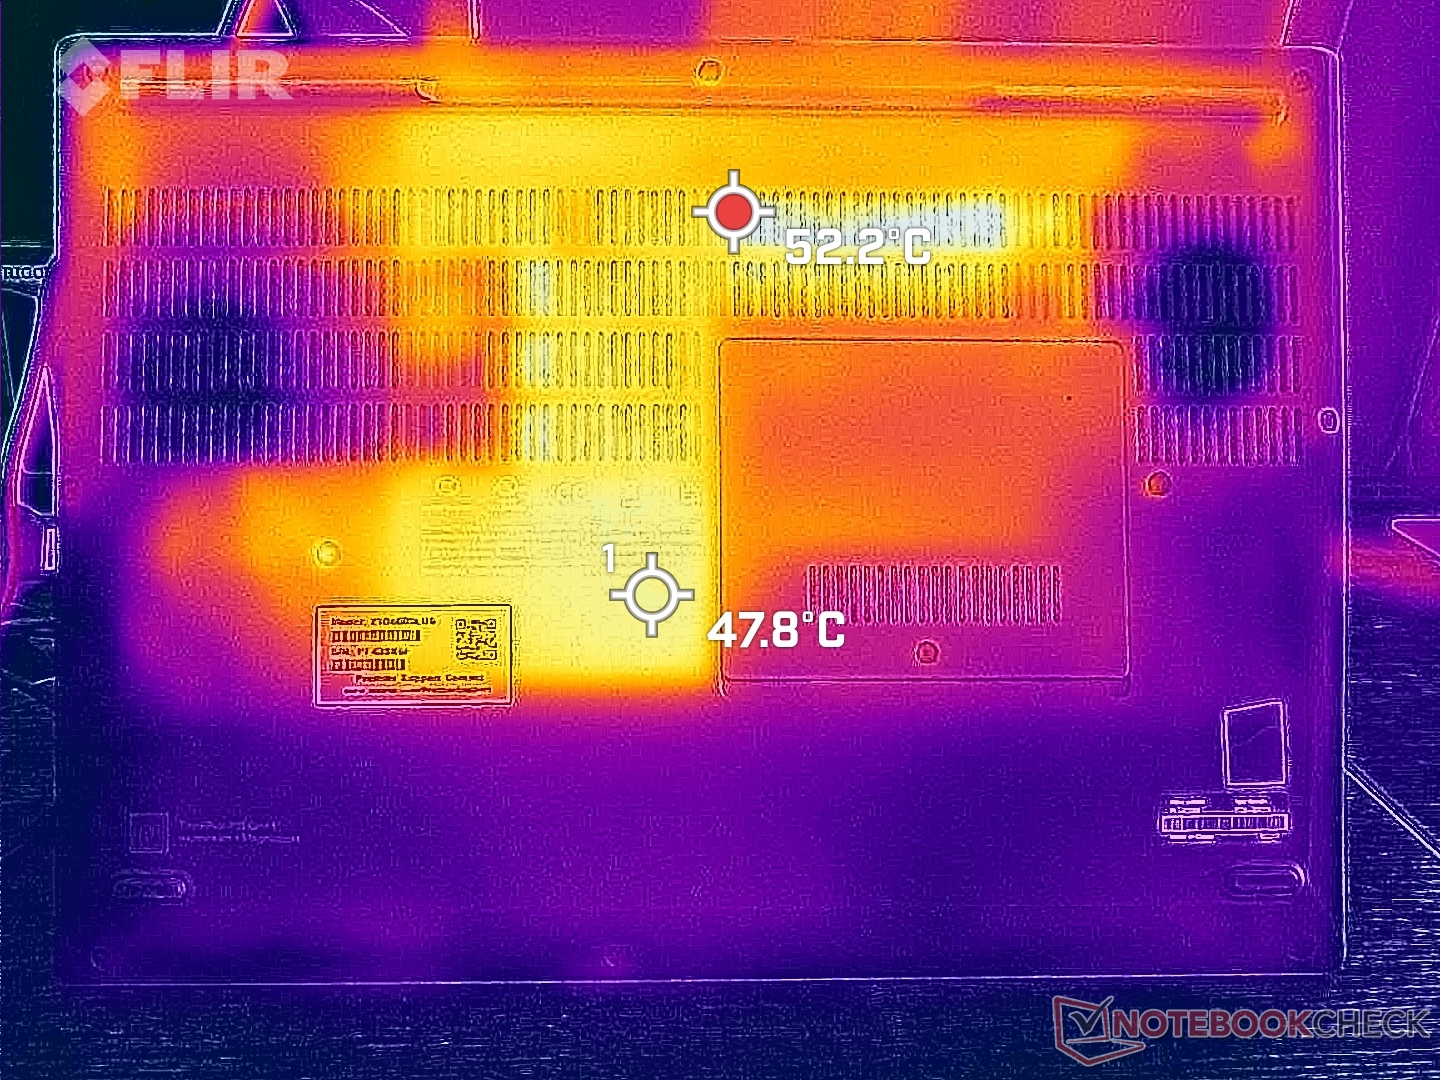
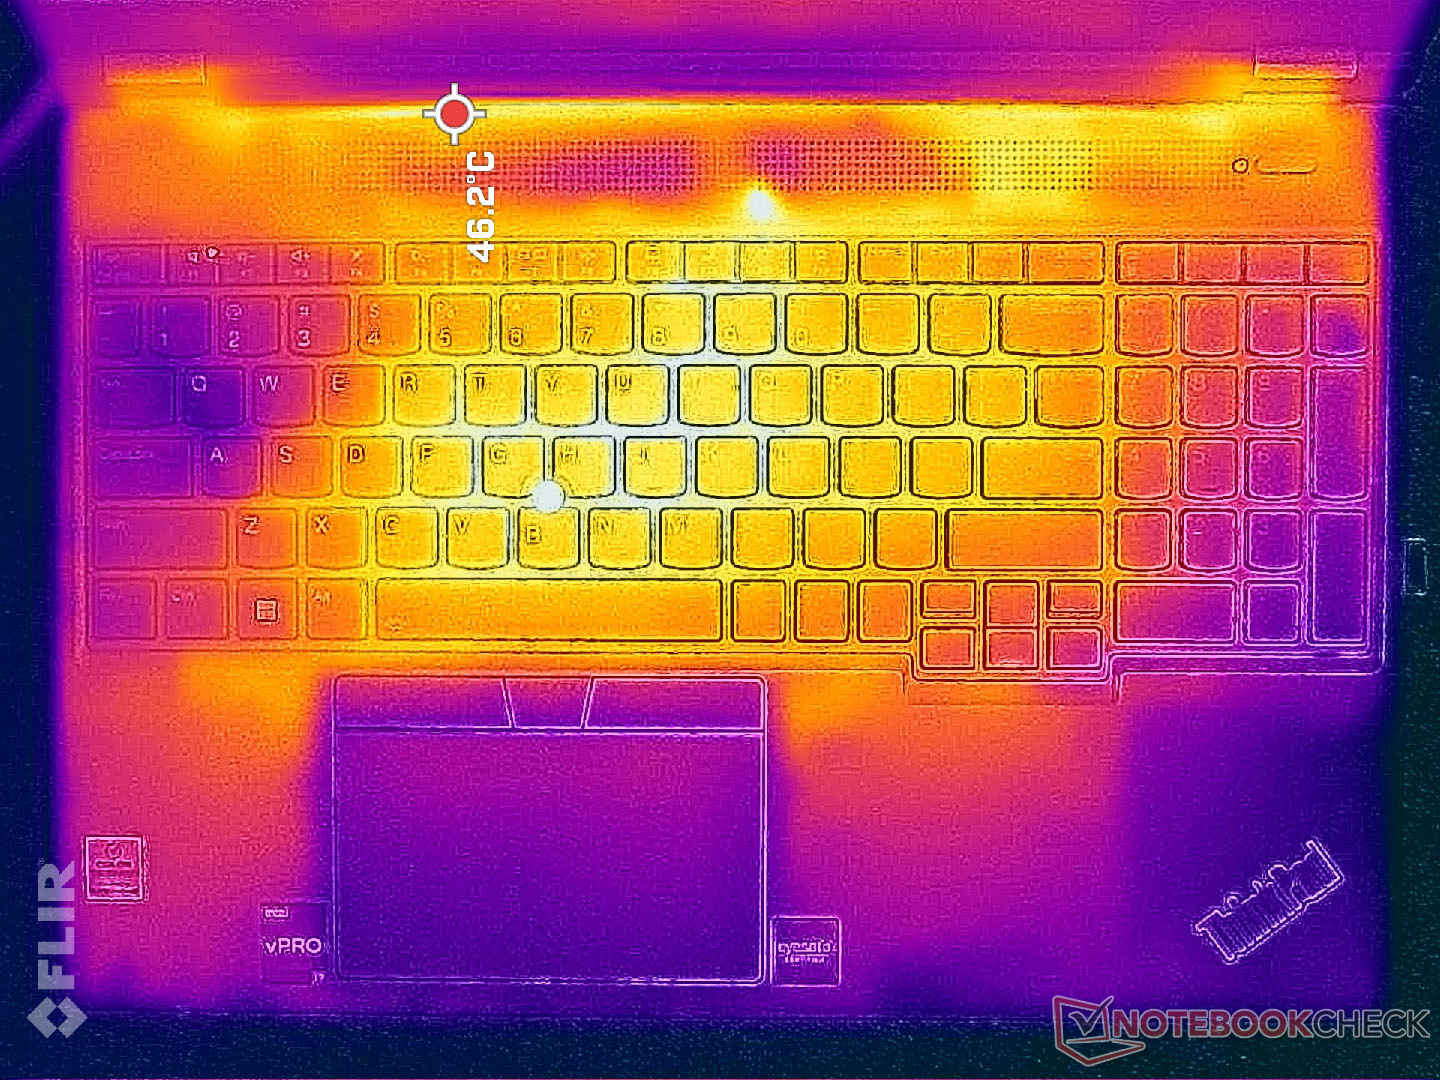
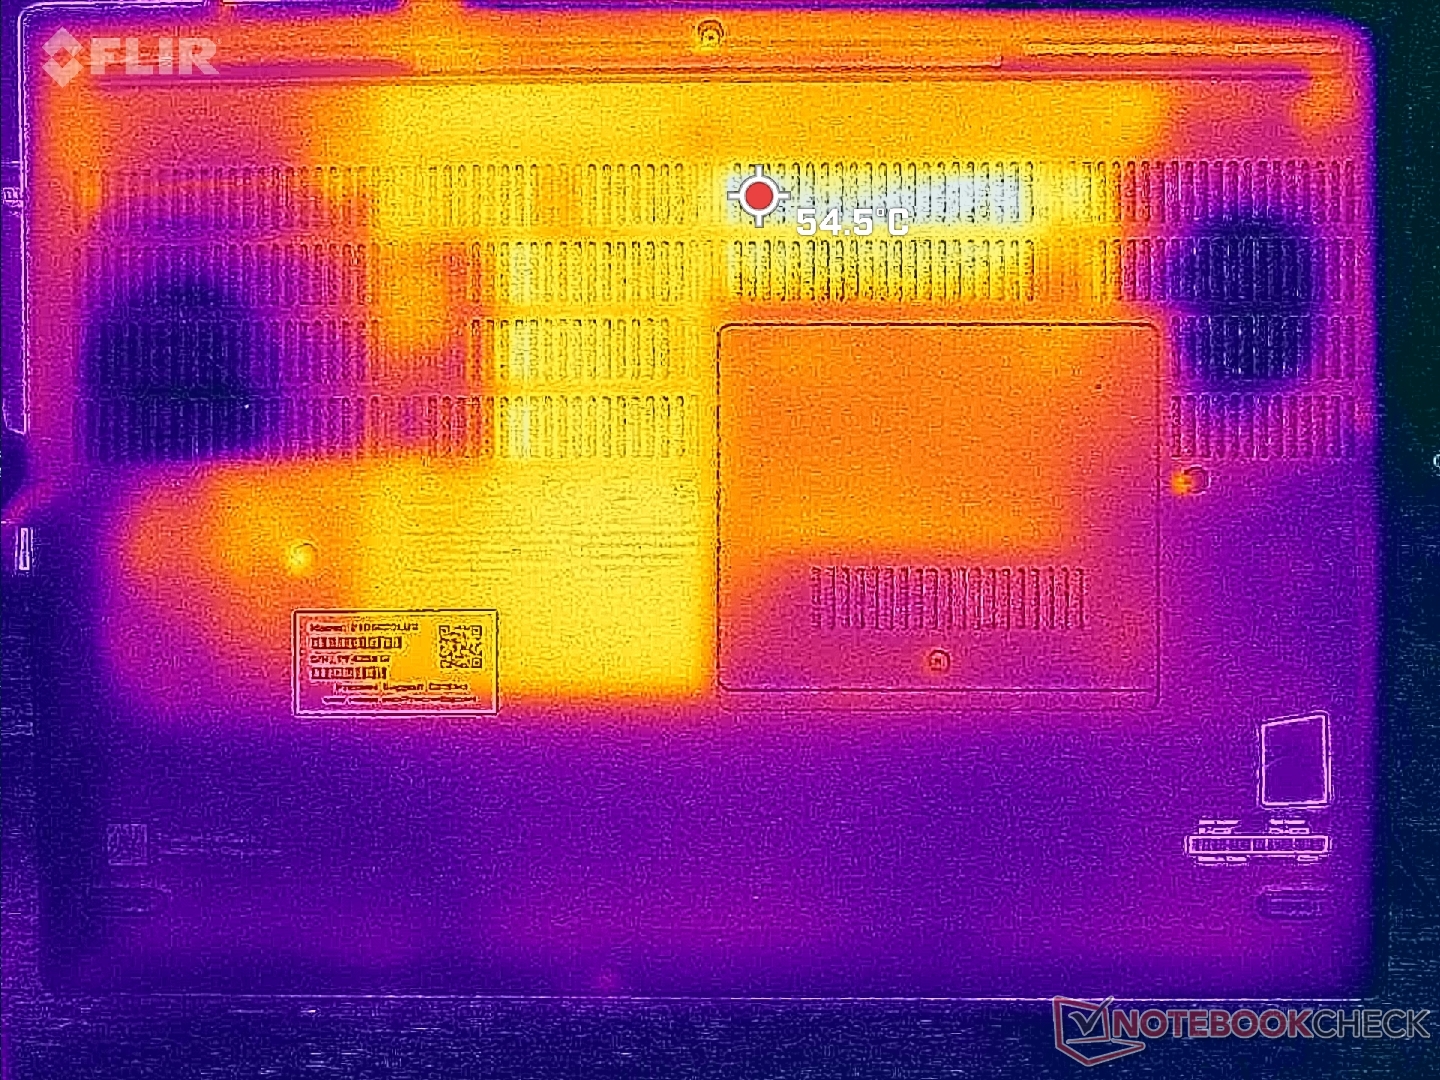
Les températures de surface sont plus élevées que prévu, même lorsque l'ordinateur tourne au ralenti sur le bureau et qu'aucune application n'est en cours d'exécution. Le bas de l'écran, par exemple, peut atteindre 37°C, contre 31°C sur le Precision 7670. En cas de charges plus élevées, ces mêmes points chauds sur le Lenovo peuvent atteindre 49 C ou plus, tandis que le centre du clavier peut atteindre 40 C. Les températures de la peau peuvent être inconfortables si l'ordinateur portable est sur les genoux plutôt que sur une table.
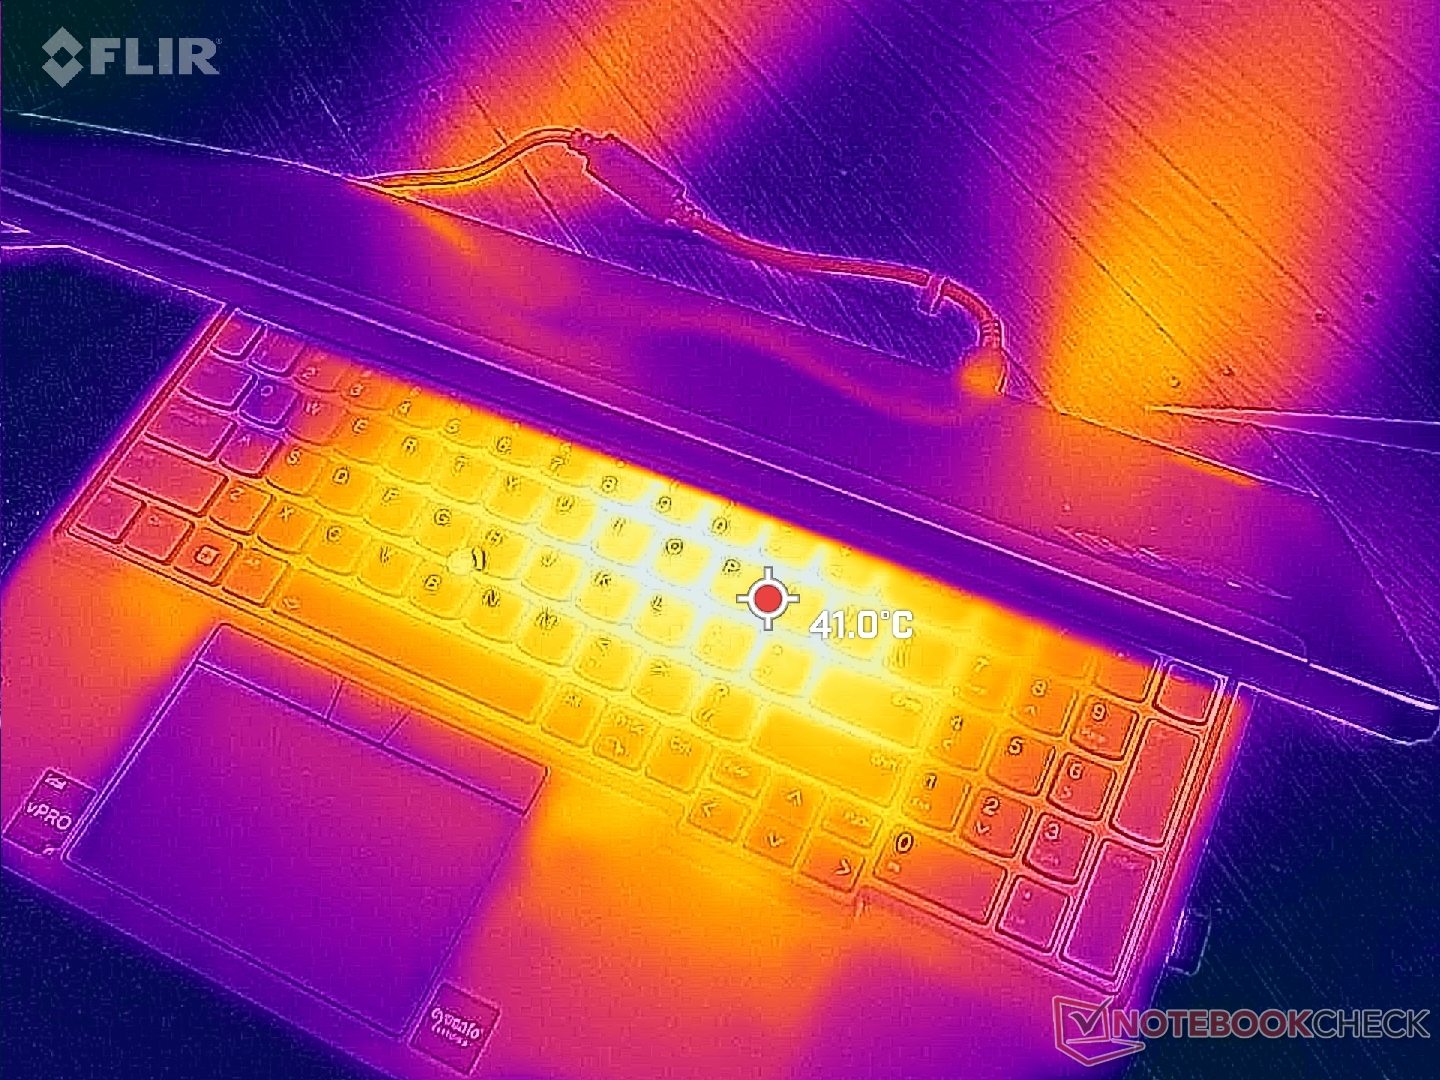
(±) La température maximale du côté supérieur est de 44.8 °C / 113 F, par rapport à la moyenne de 38.2 °C / 101 F, allant de 22.2 à 69.8 °C pour la classe Workstation.
(-) Le fond chauffe jusqu'à un maximum de 49.8 °C / 122 F, contre une moyenne de 41.1 °C / 106 F
(+) En utilisation inactive, la température moyenne du côté supérieur est de 28.6 °C / 83 F, par rapport à la moyenne du dispositif de 32 °C / 90 F.
(±) En jouant à The Witcher 3, la température moyenne du côté supérieur est de 36.4 °C / 98 F, alors que la moyenne de l'appareil est de 32 °C / 90 F.
(+) Les repose-poignets et le pavé tactile atteignent la température maximale de la peau (32.4 °C / 90.3 F) et ne sont donc pas chauds.
(-) La température moyenne de la zone de l'appui-paume de dispositifs similaires était de 27.8 °C / 82 F (-4.6 °C / #-8.3 F).
| Lenovo ThinkPad P16 G1 RTX A5500 Intel Core i9-12950HX, NVIDIA RTX A5500 Laptop GPU | Asus ProArt StudioBook 16 W7600H5A-2BL2 Intel Xeon W-11955M, NVIDIA RTX A5000 Laptop GPU | Dell Precision 7000 7670 Performance Intel Core i9-12950HX, NVIDIA RTX A5500 Laptop GPU | Lenovo ThinkPad P16 G1 21D6001DMB Intel Core i7-12850HX, NVIDIA RTX A2000 Laptop GPU | MSI CreatorPro Z16P B12UKST Intel Core i7-12700H, NVIDIA RTX A3000 Laptop GPU | HP ZBook Studio 16 G9 62U04EA Intel Core i7-12800H, NVIDIA RTX A2000 Laptop GPU | |
|---|---|---|---|---|---|---|
| Heat | -1% | -3% | 17% | -3% | 9% | |
| Maximum Upper Side * (°C) | 44.8 | 45.7 -2% | 53 -18% | 43.1 4% | 56.3 -26% | 38.7 14% |
| Maximum Bottom * (°C) | 49.8 | 48.3 3% | 43.2 13% | 39.9 20% | 68.3 -37% | 53.4 -7% |
| Idle Upper Side * (°C) | 30.6 | 35.3 -15% | 36.8 -20% | 26 15% | 25.2 18% | 27.3 11% |
| Idle Bottom * (°C) | 38.6 | 34.4 11% | 33.8 12% | 27.6 28% | 25.9 33% | 31.6 18% |
* ... Moindre est la valeur, meilleures sont les performances
Test de stress
Le système est définitivement mis à rude épreuve lorsque les processeurs sont soumis à une forte charge. Lors de l'exécution de Prime95, par exemple, les fréquences d'horloge du processeur et la consommation d'énergie de la carte mère augmentent à 4,1 GHz et 135 W, respectivement. Malheureusement, la température du cœur atteignait presque immédiatement 100°C et les fréquences d'horloge baissaient rapidement pour éviter des températures encore plus élevées. Le processeur se stabilise finalement à 3 GHz, 82 W et 100 C, ce qui signifie qu'il repousse les limites de la solution de refroidissement du ThinkPad P16 G1. En répétant ce test sur le Precision 7670 équipé du même processeur, on obtient une fréquence d'horloge stable plus lente de 2,3 GHz et une température centrale plus froide de 78 C.
Lors de l'exécution Witcher 3 pour représenter des charges élevées, la fréquence d'horloge du GPU, l'horloge de la mémoire et la température se stabiliseraient à 1477 MHz, 2000 MHz et 78 C, respectivement, par rapport à 1417 MHz, 1750 MHz et 82 C sur le Precision 7670 dans des conditions similaires. La consommation électrique de la carte serait également plus élevée sur notre Lenovo (129 W) que sur le Dell (100 W), ce qui expliquerait les avantages en termes de performances du GPU mentionnés ci-dessus.
Le fonctionnement sur batterie limite les performances. Un test de Fire Strike sur batteries donnerait des scores de physique et de graphisme de 18903 et 12395 points, respectivement, contre 31226 et 28885 points sur secteur.
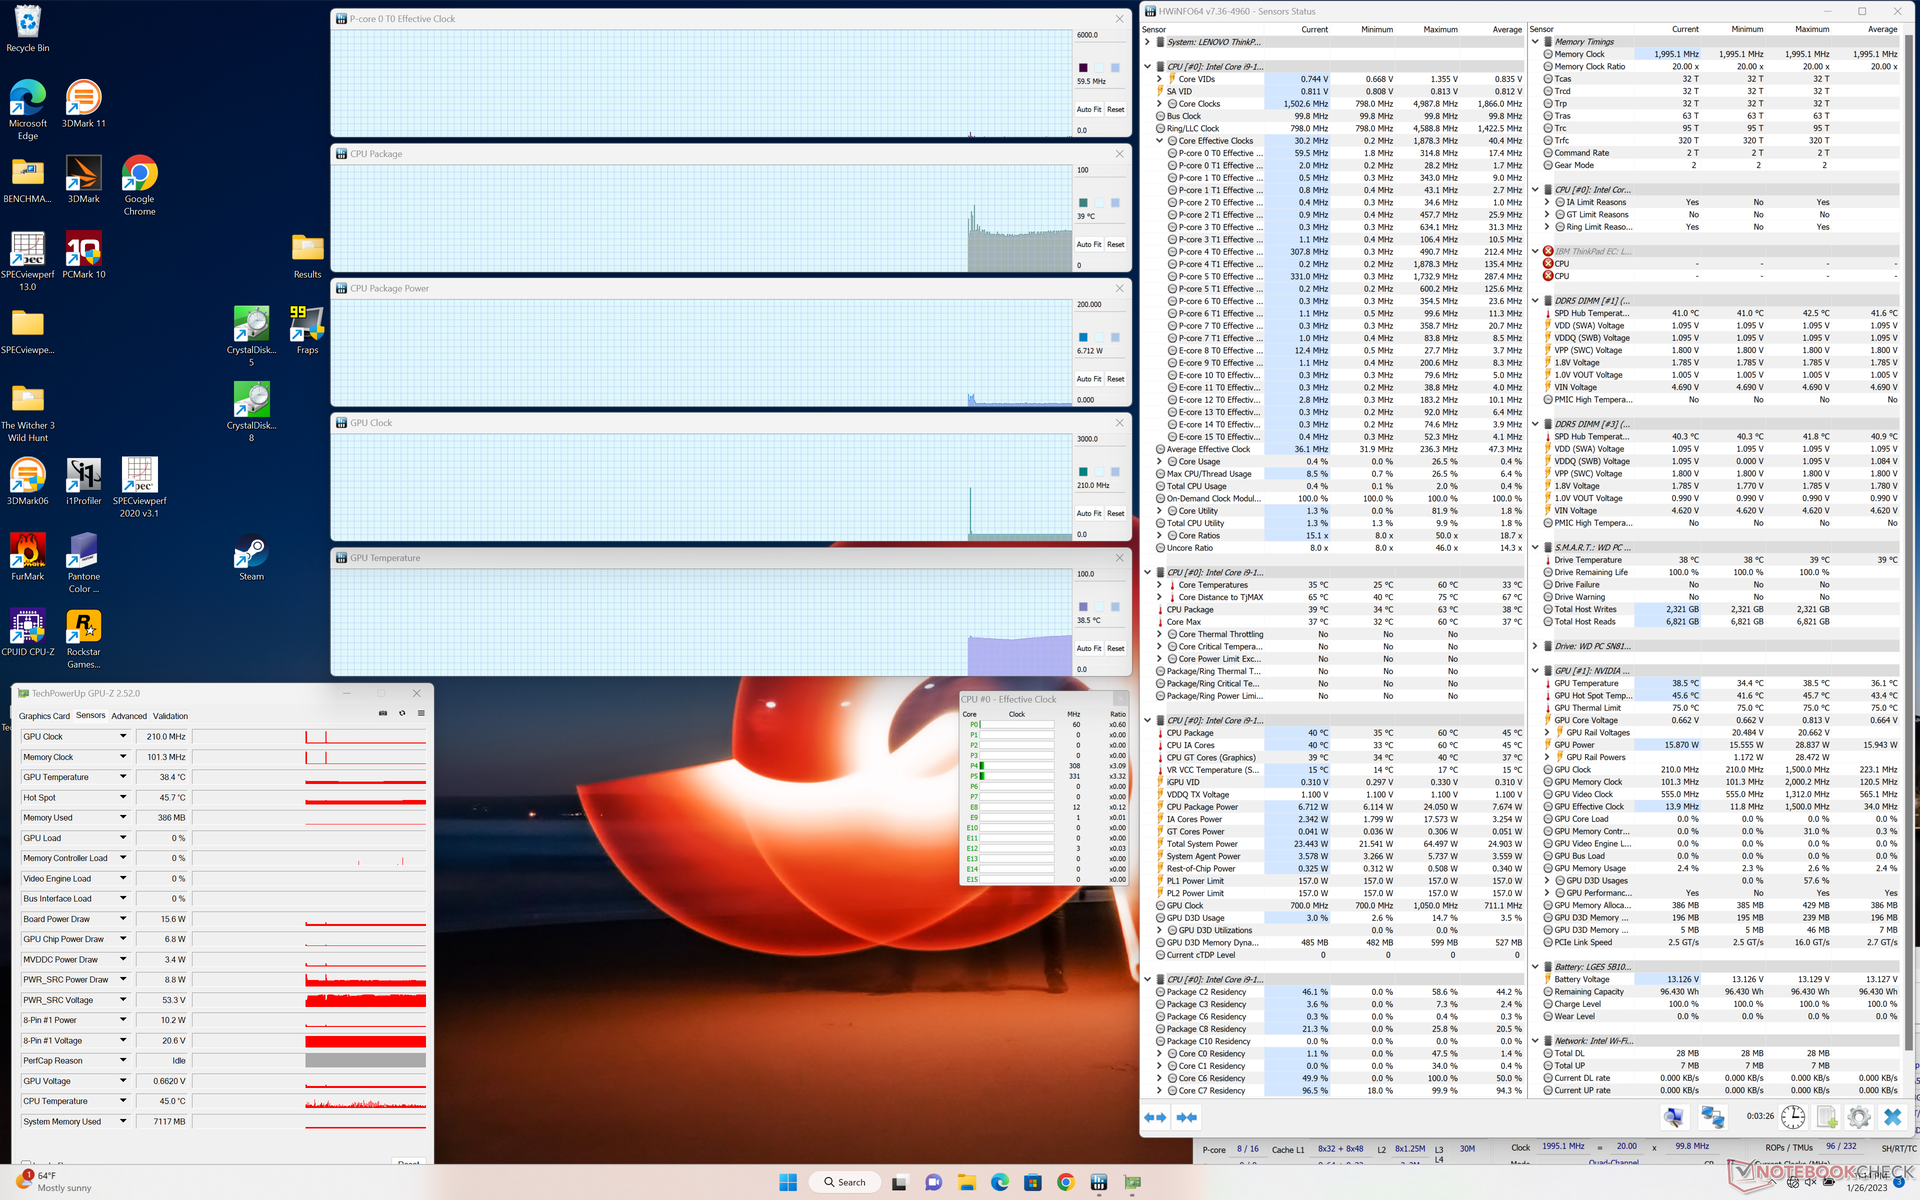
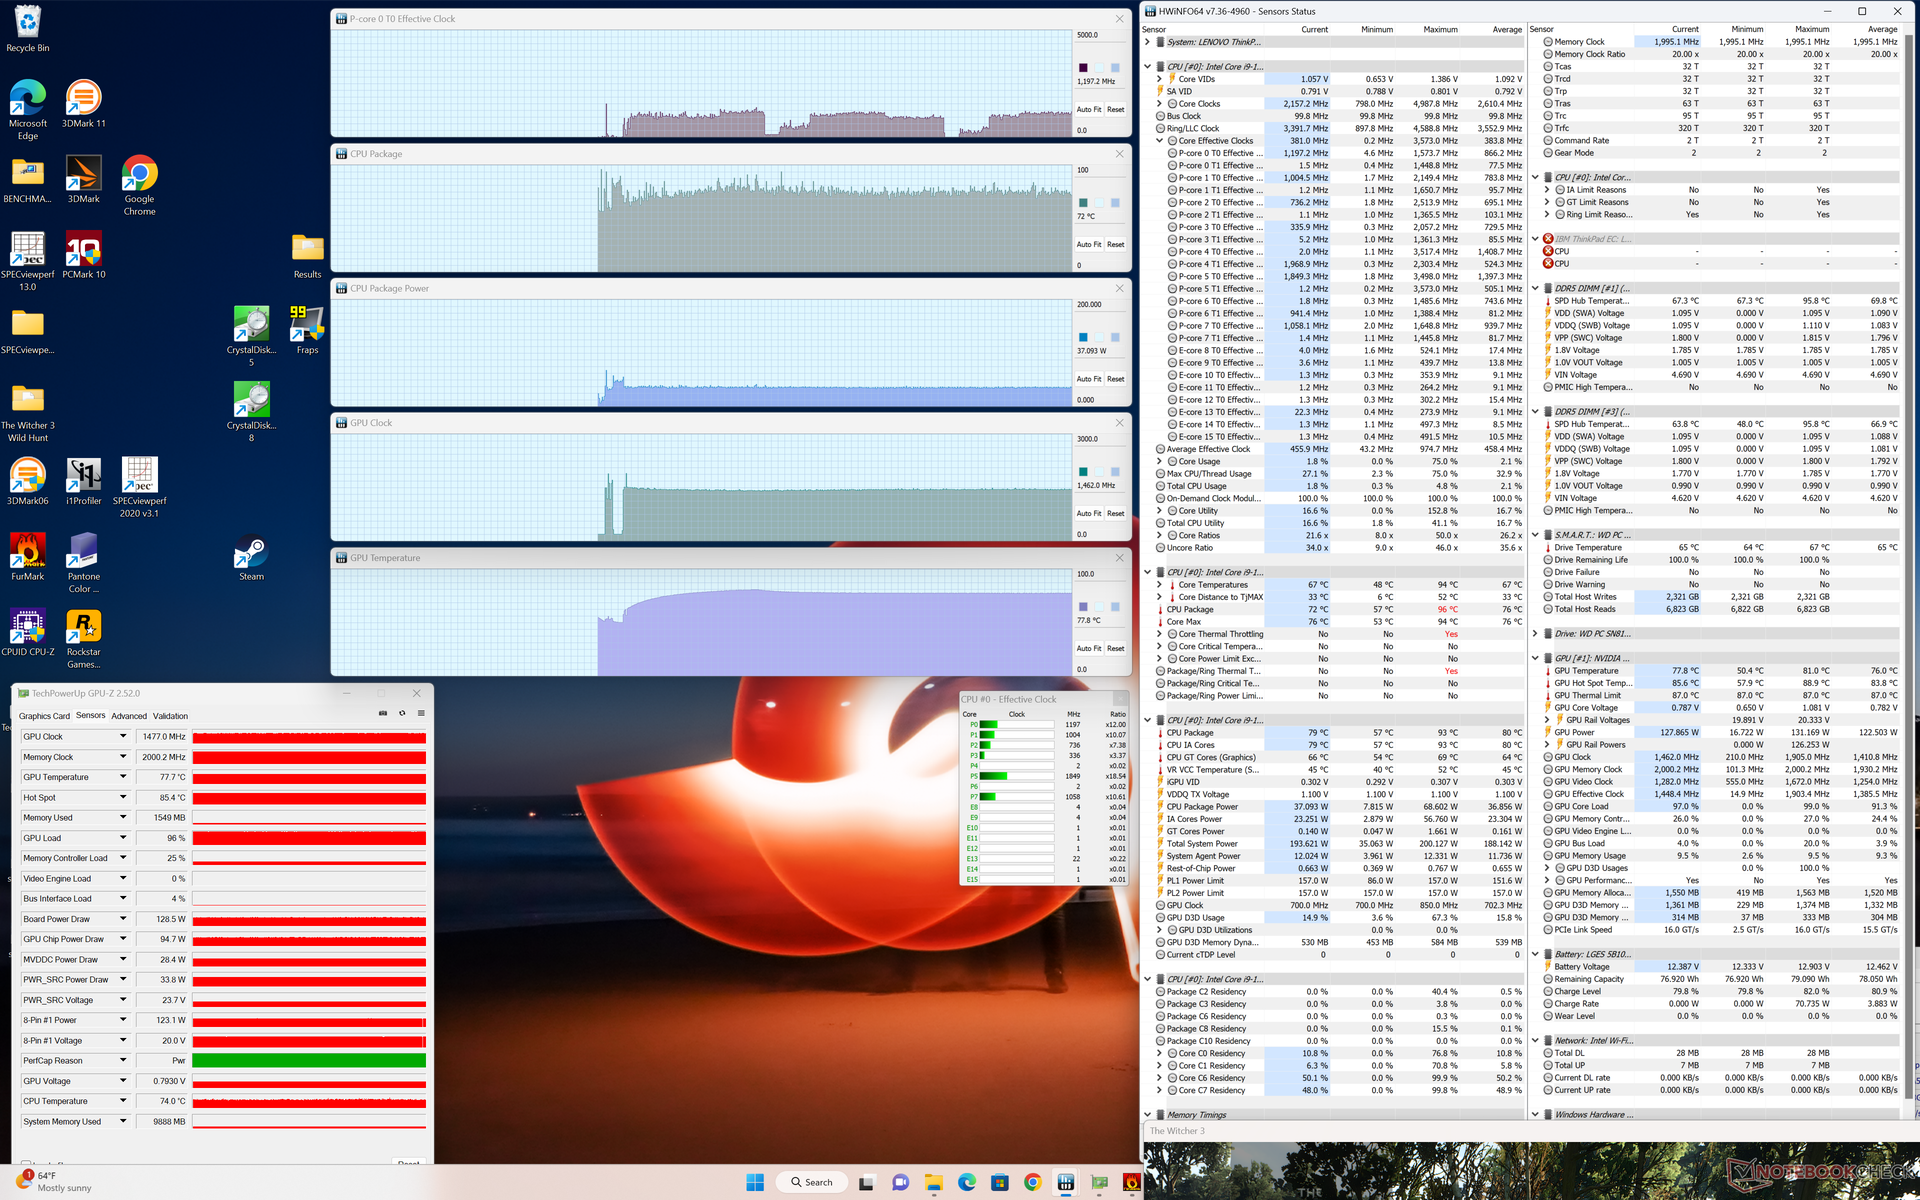
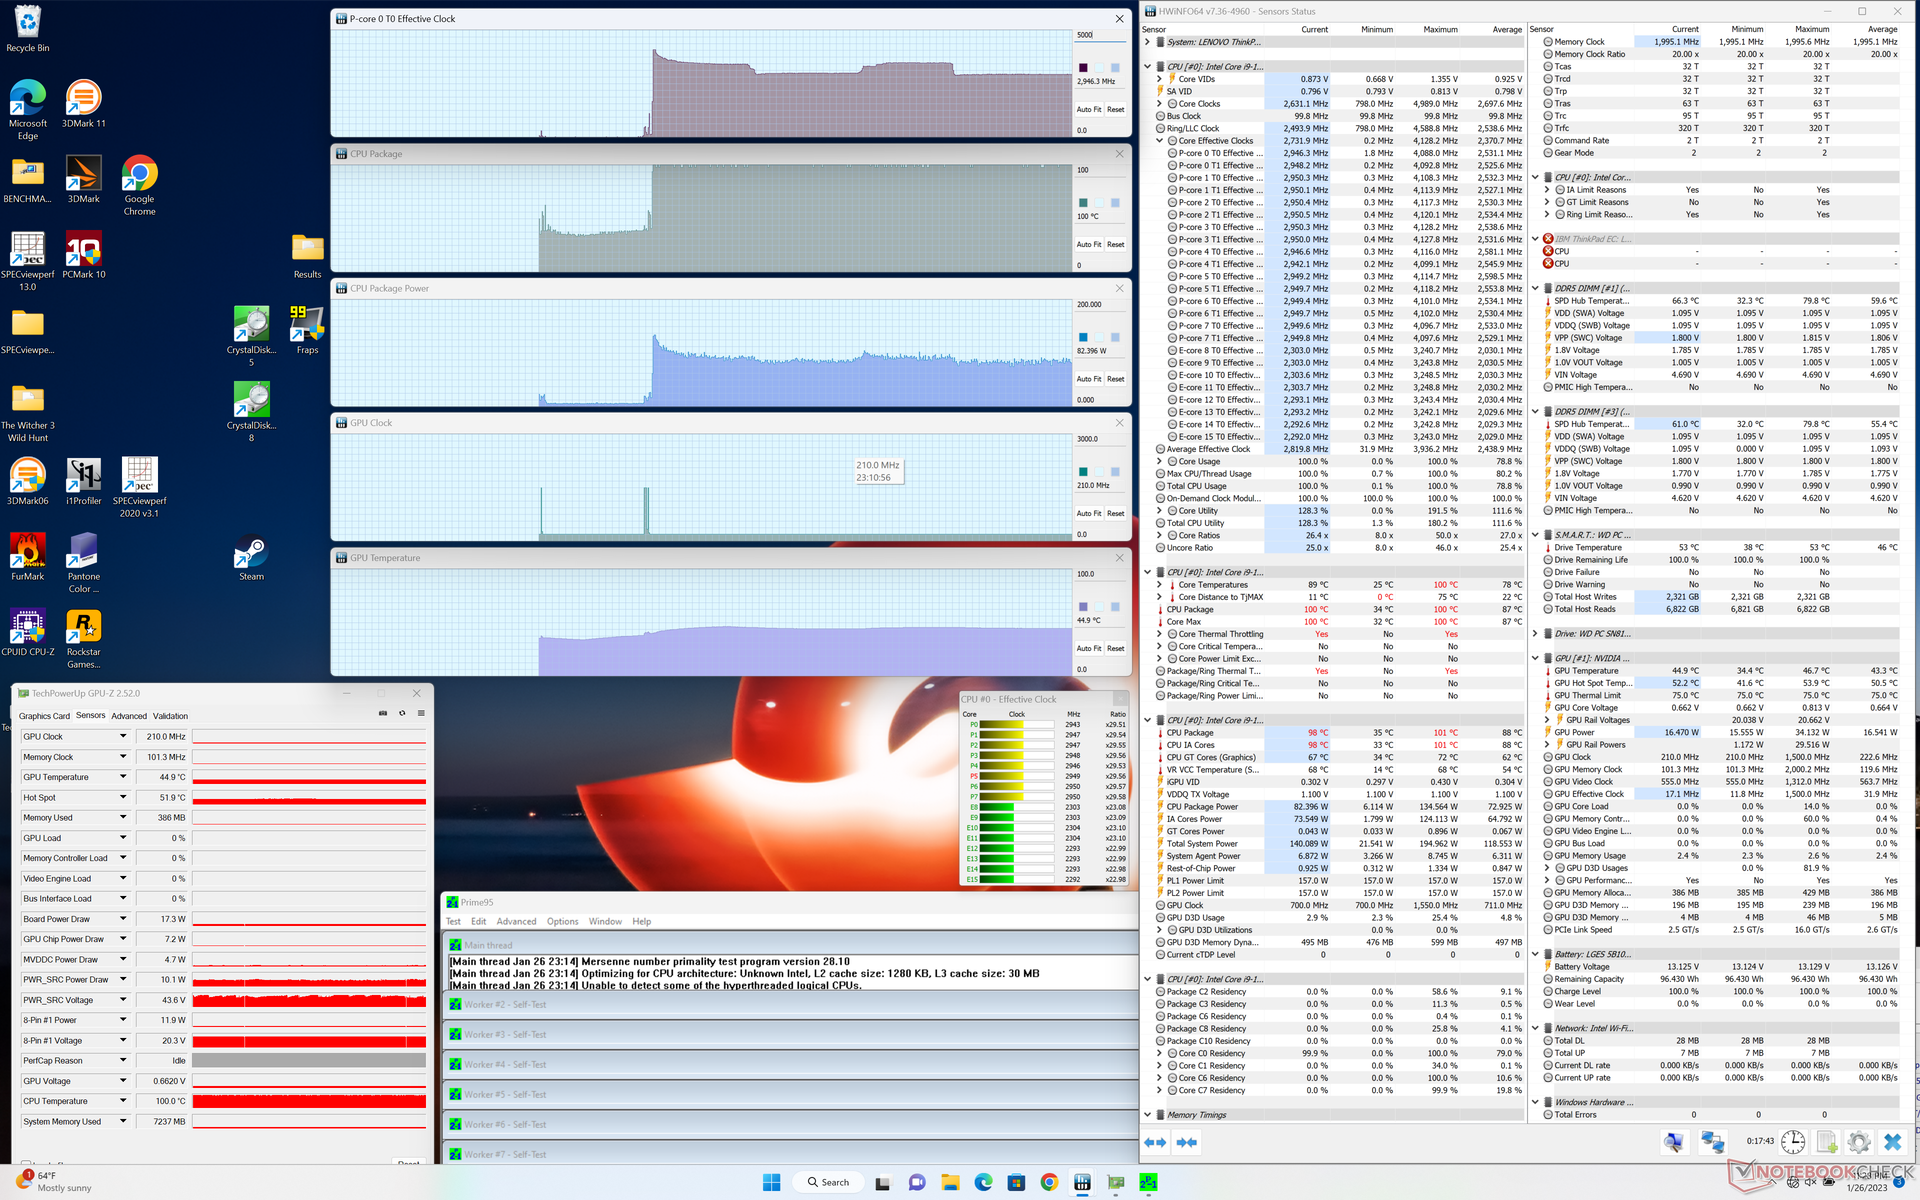
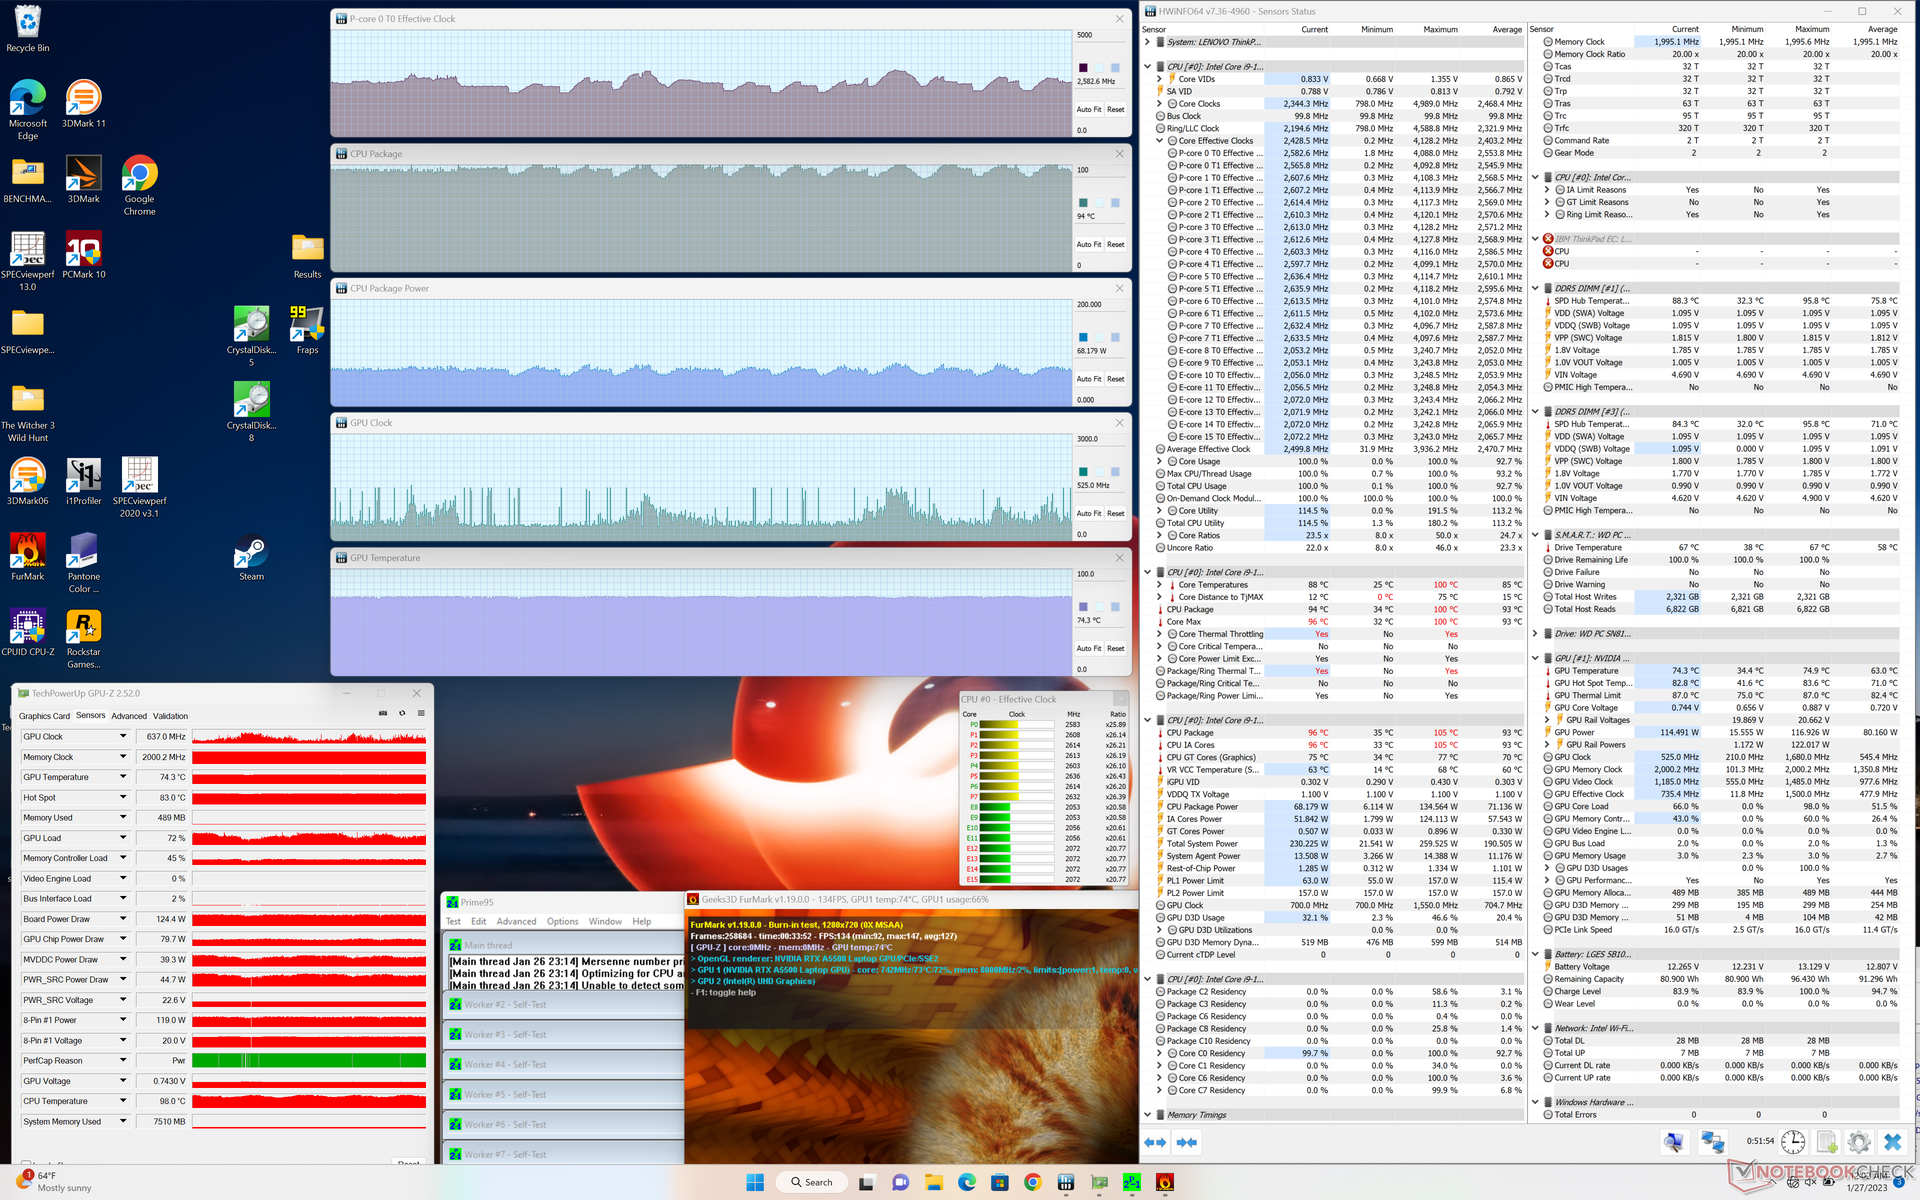
| Fréquence CPU (GHz) | Fréquence GPU (MHz) | Température CPU moyenne (°C) | Température GPU moyenne (°C) | |
| Système au repos | -- | -- | 39 | 39 |
| Prime95 Stress | 3.0 | -- | 100 | 45 |
| Prime95+ FurMark Stress | 2.1 - 2.8 | ~500 - 1550 | 88 - 100 | 75 |
| Witcher 3 Stress | ~1.2 | 1477 | 72 | 78 |
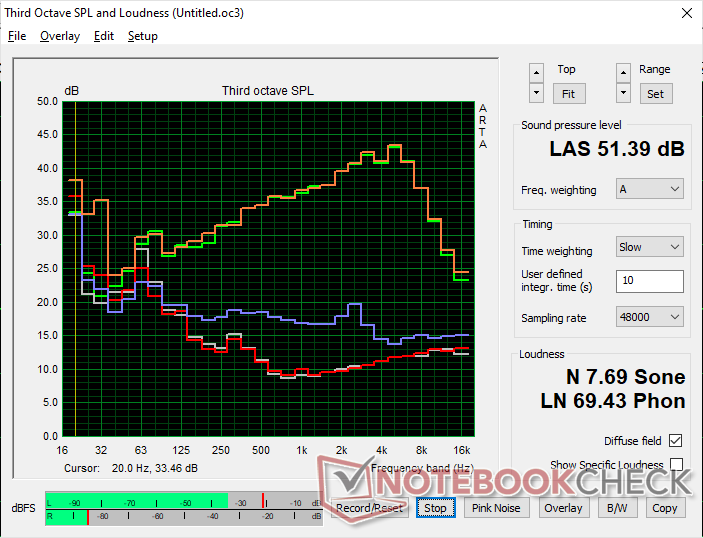
Haut-parleurs
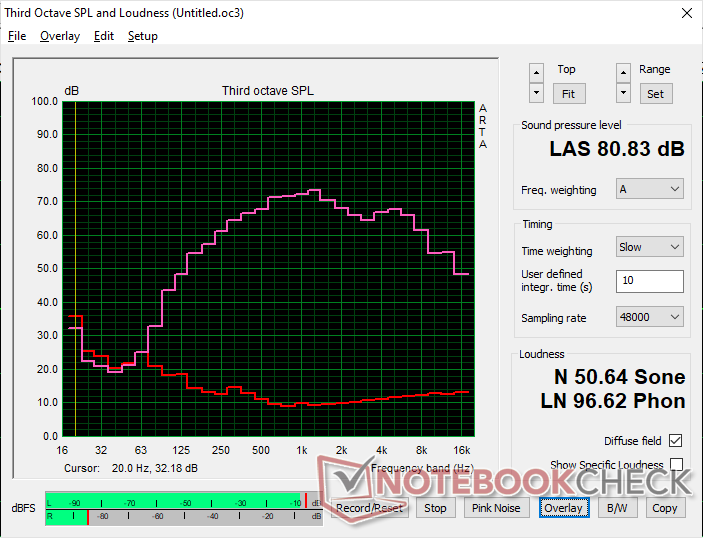
Lenovo ThinkPad P16 G1 RTX A5500 analyse audio
(±) | le niveau sonore du haut-parleur est moyen mais bon (80.8# dB)
Basses 100 - 315 Hz
(±) | basse réduite - en moyenne 11.1% inférieure à la médiane
(±) | la linéarité des basses est moyenne (9.7% delta à la fréquence précédente)
Médiums 400 - 2000 Hz
(+) | médiane équilibrée - seulement 4.1% de la médiane
(+) | les médiums sont linéaires (3.3% delta à la fréquence précédente)
Aiguës 2 - 16 kHz
(+) | des sommets équilibrés - à seulement 2.9% de la médiane
(+) | les aigus sont linéaires (5.2% delta à la fréquence précédente)
Globalement 100 - 16 000 Hz
(+) | le son global est linéaire (13.2% différence à la médiane)
Par rapport à la même classe
» 23% de tous les appareils testés de cette catégorie étaient meilleurs, 6% similaires, 71% pires
» Le meilleur avait un delta de 7%, la moyenne était de 17%, le pire était de 35%.
Par rapport à tous les appareils testés
» 13% de tous les appareils testés étaient meilleurs, 3% similaires, 84% pires
» Le meilleur avait un delta de 4%, la moyenne était de 24%, le pire était de 134%.
Apple MacBook Pro 16 2021 M1 Pro analyse audio
(+) | les haut-parleurs peuvent jouer relativement fort (84.7# dB)
Basses 100 - 315 Hz
(+) | bonne basse - seulement 3.8% loin de la médiane
(+) | les basses sont linéaires (5.2% delta à la fréquence précédente)
Médiums 400 - 2000 Hz
(+) | médiane équilibrée - seulement 1.3% de la médiane
(+) | les médiums sont linéaires (2.1% delta à la fréquence précédente)
Aiguës 2 - 16 kHz
(+) | des sommets équilibrés - à seulement 1.9% de la médiane
(+) | les aigus sont linéaires (2.7% delta à la fréquence précédente)
Globalement 100 - 16 000 Hz
(+) | le son global est linéaire (4.6% différence à la médiane)
Par rapport à la même classe
» 0% de tous les appareils testés de cette catégorie étaient meilleurs, 0% similaires, 100% pires
» Le meilleur avait un delta de 5%, la moyenne était de 17%, le pire était de 45%.
Par rapport à tous les appareils testés
» 0% de tous les appareils testés étaient meilleurs, 0% similaires, 100% pires
» Le meilleur avait un delta de 4%, la moyenne était de 24%, le pire était de 134%.
Gestion de l'énergie
Consommation d'énergie
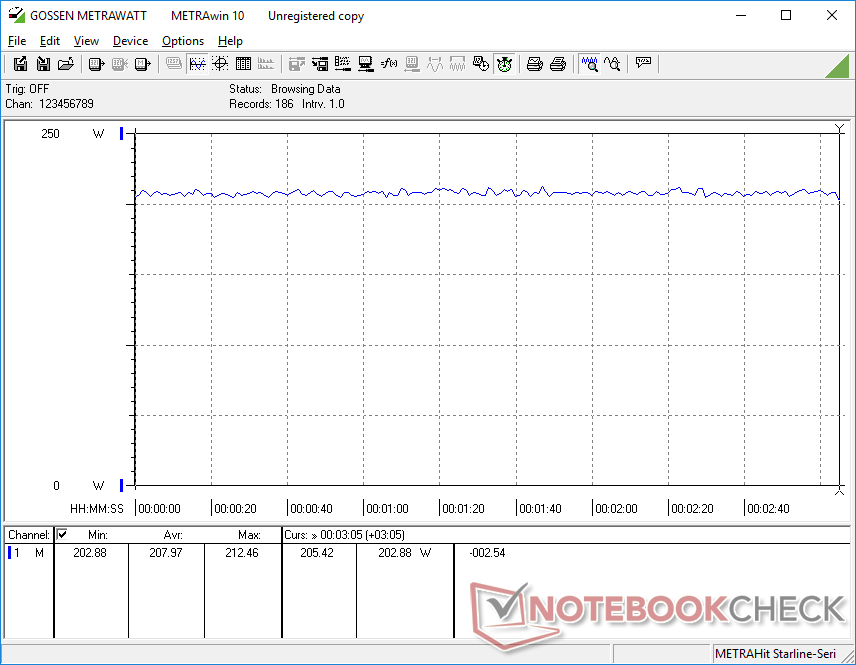
La consommation d'énergie au ralenti est inférieure de plusieurs watts à celle du Precision 7670, probablement en raison de la dalle OLED plus exigeante de ce dernier. En cas de charges plus élevées comme Witcher 3cependant, la consommation devient nettement plus élevée sur le Lenovo que sur le Dell (208 W contre 159 W). Cette consommation plus élevée coïncide avec les performances plus rapides du CPU et du GPU par rapport au modèle Dell concurrent, comme le montrent nos benchmarks ci-dessus.
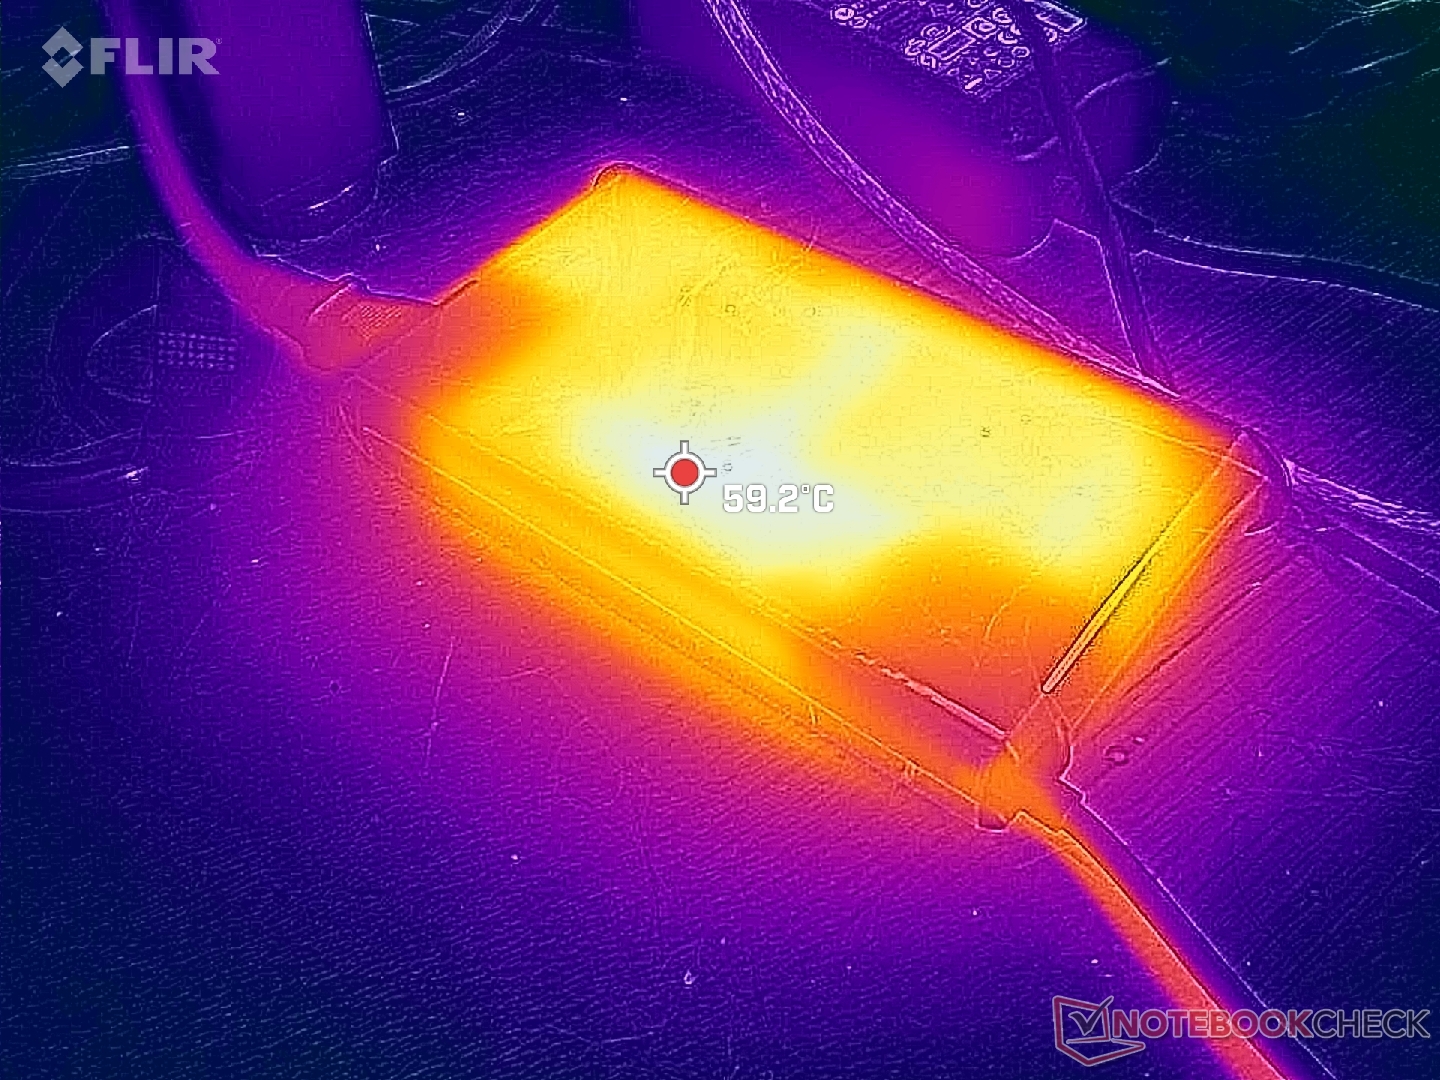
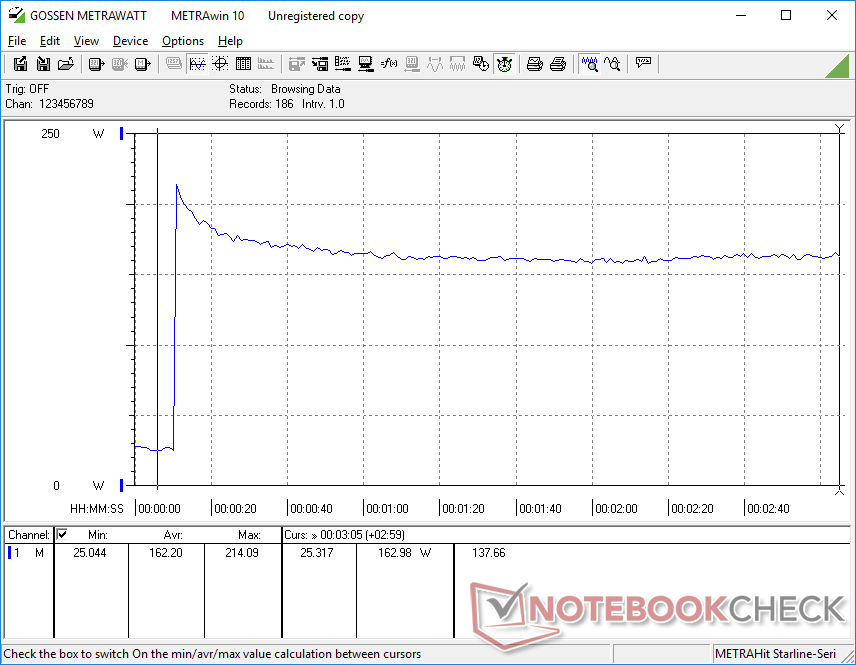
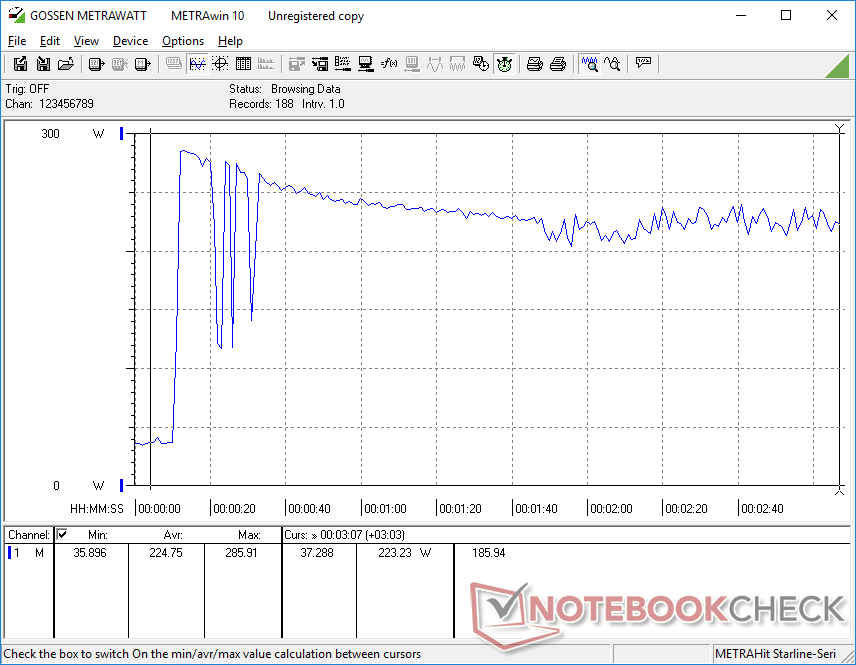
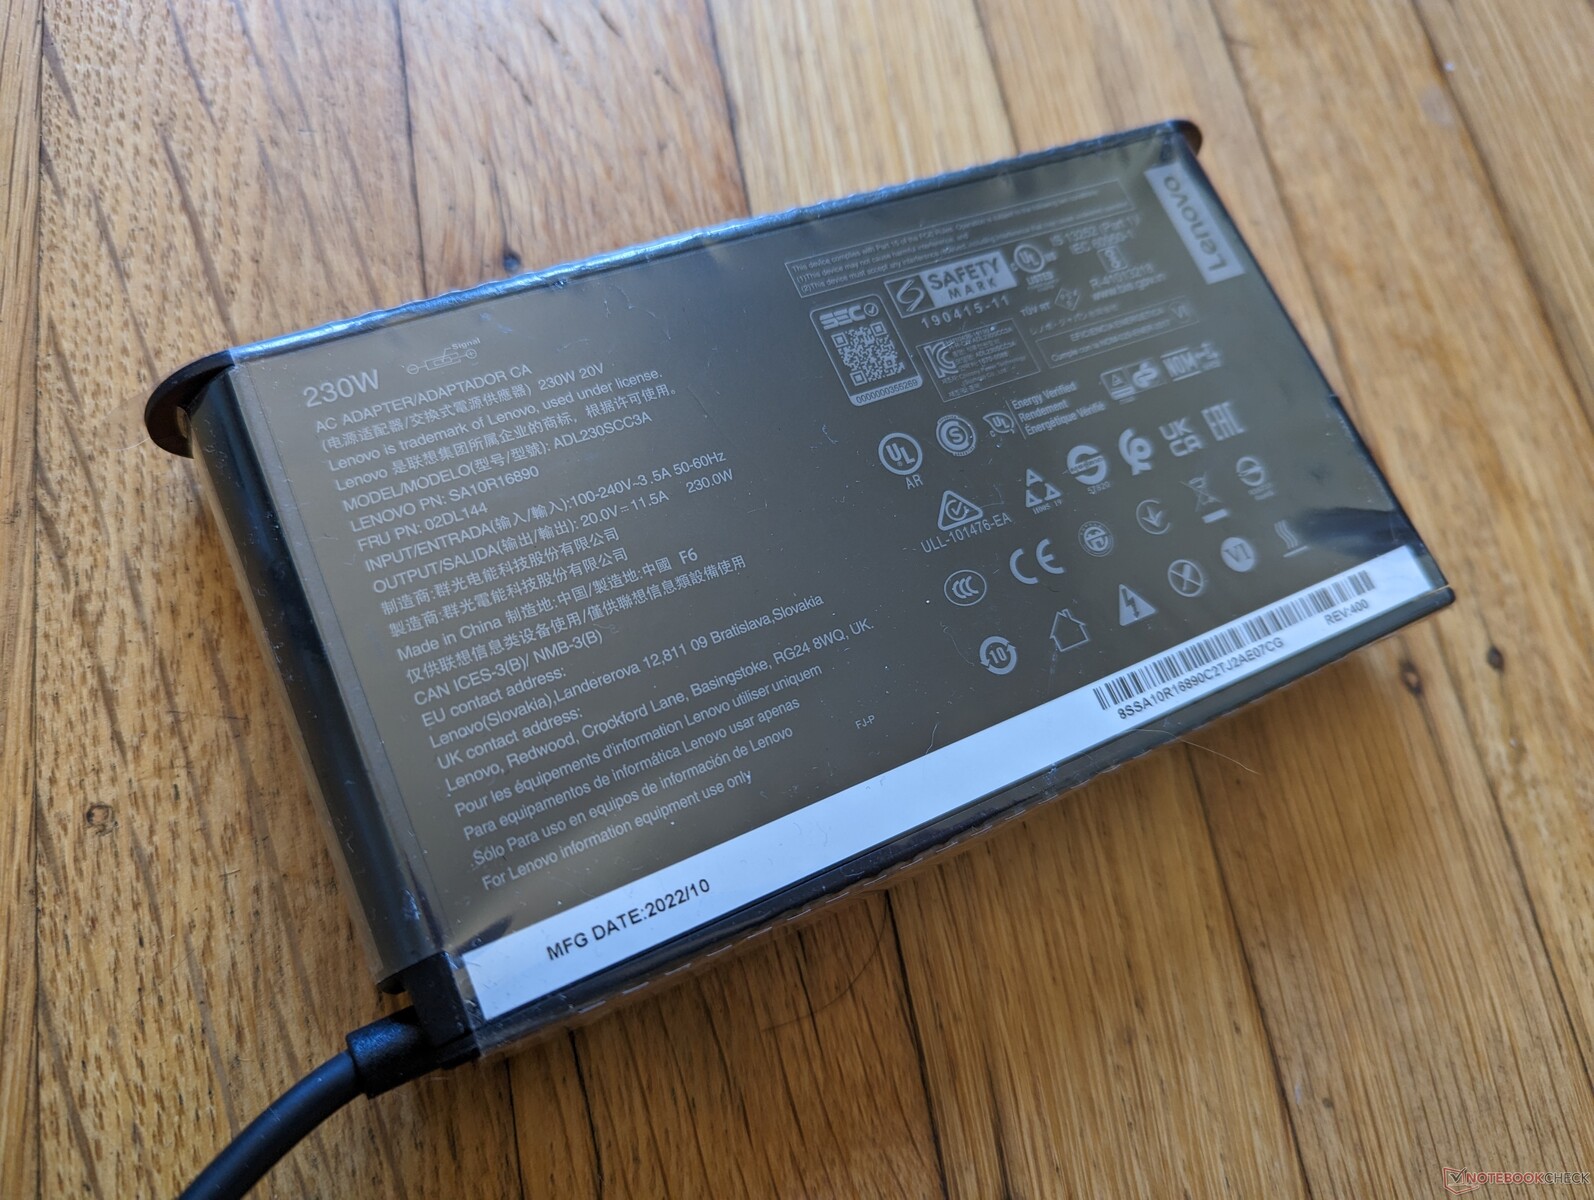
Bien que les utilisateurs intensifs puissent apprécier les performances supplémentaires, notre Lenovo entièrement chargé est nettement plus exigeant que la plupart des autres stations de travail mobiles. En fait, l'adaptateur secteur 230 W de taille moyenne (~15 x 8,6 x 2,6 cm) peut ne pas suffire à alimenter la machine lorsque le CPU et le GPU sont fortement sollicités. Nous avons pu mesurer une consommation maximale temporaire de 286 W à partir de l'adaptateur de 230 W avant qu'elle ne diminue et se stabilise autour de 223 W. Ainsi, attendez-vous à ce que le taux de charge de la batterie ralentisse ou devienne même négatif lors de l'exécution de charges exigeantes. Par exemple, lorsque vous Witcher 3 pendant 90 minutes d'affilée, par exemple, nous avons observé que le niveau de la batterie est passé de 100 % à 87 %. Un comportement similaire a été observé sur le ancien XPS 17 ou Precision 5750. Il est dommage que Lenovo ne propose pas d'options d'adaptateur secteur supérieures à 230 W à la caisse.
La configuration avec la RTX A2000 de bas de gamme permettrait de réduire la consommation de moitié environ. Dans ce cas, l'adaptateur secteur de 230 W serait suffisant.
| Éteint/en veille | |
| Au repos | |
| Fortement sollicité |
|
Légende:
min: | |
| Lenovo ThinkPad P16 G1 RTX A5500 i9-12950HX, RTX A5500 Laptop GPU, WDC PC SN810 2TB, IPS, 3840x2400, 16" | Asus ProArt StudioBook 16 W7600H5A-2BL2 W-11955M, RTX A5000 Laptop GPU, 2x Micron 2300 2TB MTFDHBA2T0TDV (RAID 0), OLED, 3840x2400, 16" | Dell Precision 7000 7670 Performance i9-12950HX, RTX A5500 Laptop GPU, , OLED, 3840x2400, 16" | Lenovo ThinkPad P16 G1 21D6001DMB i7-12850HX, RTX A2000 Laptop GPU, Micron 3400 1TB MTFDKBA1T0TFH, IPS LED, 2560x1600, 16" | MSI CreatorPro Z16P B12UKST i7-12700H, RTX A3000 Laptop GPU, Samsung PM9A1 MZVL21T0HCLR, IPS, 2560x1600, 16" | HP ZBook Studio 16 G9 62U04EA i7-12800H, RTX A2000 Laptop GPU, Micron 3400 1TB MTFDKBA1T0TFH, IPS, 3840x2400, 16" | |
|---|---|---|---|---|---|---|
| Power Consumption | 14% | -35% | 45% | 19% | 28% | |
| Idle Minimum * (Watt) | 7.5 | 12.4 -65% | 16.4 -119% | 5.1 32% | 10.8 -44% | 7.2 4% |
| Idle Average * (Watt) | 20.1 | 16.5 18% | 35.9 -79% | 9.2 54% | 16.3 19% | 18.1 10% |
| Idle Maximum * (Watt) | 40 | 25 37% | 47 -18% | 9.9 75% | 16.9 58% | 18.5 54% |
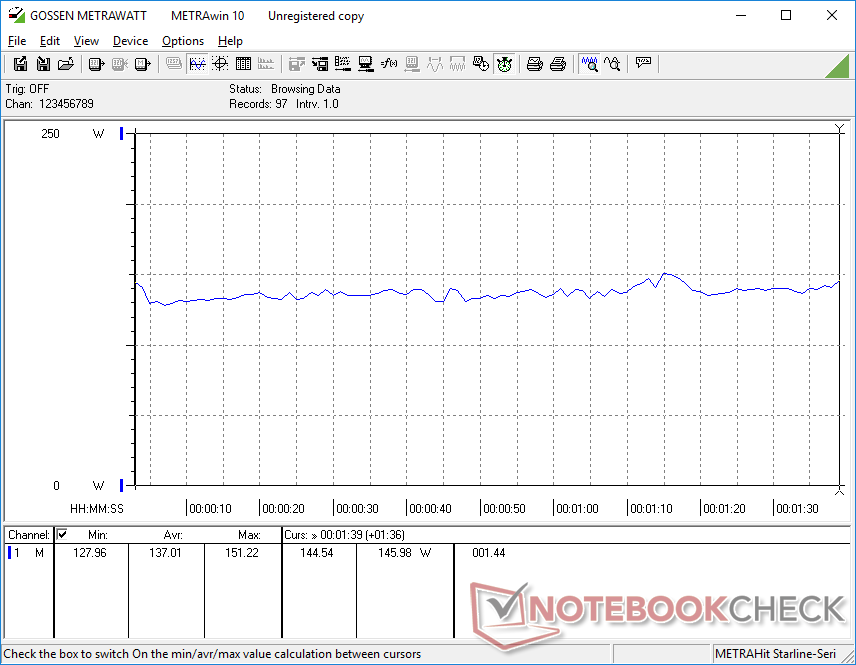
| Load Average * (Watt) | 137 | 132 4% | 147.1 -7% | 124.1 9% | 111.7 18% | 112.8 18% |
| Witcher 3 ultra * (Watt) | 208 | 132 37% | 158.8 24% | 87.7 58% | 152.1 27% | 106.7 49% |
| Load Maximum * (Watt) | 285.9 | 134 53% | 311 -9% | 168.9 41% | 177.4 38% | 186 35% |
* ... Moindre est la valeur, meilleures sont les performances
Power Consumption Witcher 3 / Stresstest
Power Consumption external Monitor
Autonomie de la batterie
Le temps d'exécution est plusieurs heures plus court que sur notre SKU RTX A2000 de moindre importance, pour un total d'un peu moins de 6 heures s'il est réglé sur le profil d'alimentation équilibré.
Le chargement d'une batterie vide à une batterie pleine prend environ 2 heures. Le temps de charge estimé par Lenovo n'est pas si précis, cependant, car Vantage peut montrer qu'il peut atteindre 4 heures au début avant de se recalibrer automatiquement. Gardez à l'esprit que le taux de charge ralentira considérablement si vous exécutez des applications exigeantes comme celles mentionnées ci-dessus.
Le système ne peut pas être rechargé via l'USB-C.
| Lenovo ThinkPad P16 G1 RTX A5500 i9-12950HX, RTX A5500 Laptop GPU, 94 Wh | Asus ProArt StudioBook 16 W7600H5A-2BL2 W-11955M, RTX A5000 Laptop GPU, 90 Wh | Dell Precision 7000 7670 Performance i9-12950HX, RTX A5500 Laptop GPU, 93 Wh | Lenovo ThinkPad P16 G1 21D6001DMB i7-12850HX, RTX A2000 Laptop GPU, 94 Wh | MSI CreatorPro Z16P B12UKST i7-12700H, RTX A3000 Laptop GPU, 90 Wh | HP ZBook Studio 16 G9 62U04EA i7-12800H, RTX A2000 Laptop GPU, 86 Wh | |
|---|---|---|---|---|---|---|
| Autonomie de la batterie | -14% | -19% | 62% | 0% | 9% | |
| WiFi v1.3 (h) | 5.8 | 5 -14% | 4.7 -19% | 9.4 62% | 5.8 0% | 6.3 9% |
| H.264 (h) | 1.8 | 8.5 | ||||
| Witcher 3 ultra (h) | 1.6 | |||||
| Load (h) | 1.8 | 1.1 |
Points positifs
Points négatifs
Verdict - L'adaptateur secteur 230 W n'est pas suffisant
Du point de vue des performances, le ThinkPad P16 G1 est l'une des stations de travail mobiles les plus rapides actuellement disponibles, quelle que soit la taille de l'écran. Son processeur Core i9-12950HX et son GPU RTX A5500 surpassent légèrement, mais constamment, les performances du Precision 7670 même si le modèle Dell est doté d'options de processeur similaires.
Il y a deux inconvénients majeurs que nous espérons que Lenovo pourra corriger sur les prochaines itérations. Tout d'abord, les températures du processeur sont beaucoup plus élevées que la moyenne lors de l'exécution de charges exigeantes. Des températures élevées ne sont pas inattendues, bien sûr, mais un plateau à 100 C est tout simplement trop chaud pour être confortable, alors que le même processeur dans le modèle Dell susmentionné aurait à peine franchi la barre des 80 C dans des conditions similaires. La température élevée est peut-être le prix à payer pour des performances légèrement plus rapides.
Deuxièmement, l'adaptateur secteur de 230 W est en train de suer des balles en essayant d'alimenter un CPU de 100+ W et un GPU de 130 W. La lutte est observable lors de l'exécution de charges exigeantes, car le taux de charge du système ralentit considérablement ou commence même à vider la batterie dans certains scénarios. Lorsque nous sommes en mesure de mesurer un pic de 285 W à partir d'un adaptateur secteur de 230 W, il y a clairement un goulot d'étranglement. Un adaptateur secteur plus grand, de 280 ou 330 W, aurait été plus approprié compte tenu de notre niveau de configuration.
Le ThinkPad P16 Gen 1 maximise les performances même si cela implique une consommation d'énergie et des températures du cœur plus élevées. Cependant, l'adaptateur secteur de 230 W est peut-être trop conservateur, compte tenu des processeurs très exigeants de notre configuration haut de gamme.
Les performances globales élevées du système sont néanmoins indéniables malgré les températures élevées et la brique d'alimentation insuffisante de 230 W. Veillez à sortir de toute application exigeante pour obtenir des vitesses de charge décentes.
Prix et disponibilité
Le ThinkPad P16 G1 est maintenant disponible chez Best Buy et Amazon à des niveaux de configuration inférieurs, à partir de 2570 $ ou 3850 $ US, respectivement. Nous vous recommandons d'acheter directement auprès de Lenovo car ils ont les options les plus configurables en stock.
Lenovo ThinkPad P16 G1 RTX A5500
- 02/06/2023 v7 (old)
Allen Ngo
Transparency
La sélection des appareils à examiner est effectuée par notre équipe éditoriale. L'échantillon de test a été prêté à l'auteur par le fabricant ou le détaillant pour les besoins de cet examen. Le prêteur n'a pas eu d'influence sur cette évaluation et le fabricant n'a pas reçu de copie de cette évaluation avant sa publication. Il n'y avait aucune obligation de publier cet article. En tant que média indépendant, Notebookcheck n'est pas soumis à l'autorité des fabricants, des détaillants ou des éditeurs.
Voici comment Notebookcheck teste
Chaque année, Notebookcheck examine de manière indépendante des centaines d'ordinateurs portables et de smartphones en utilisant des procédures standardisées afin de garantir que tous les résultats sont comparables. Nous avons continuellement développé nos méthodes de test depuis environ 20 ans et avons établi des normes industrielles dans le processus. Dans nos laboratoires de test, des équipements de mesure de haute qualité sont utilisés par des techniciens et des rédacteurs expérimentés. Ces tests impliquent un processus de validation en plusieurs étapes. Notre système d'évaluation complexe repose sur des centaines de mesures et de points de référence bien fondés, ce qui garantit l'objectivité.Price comparison

