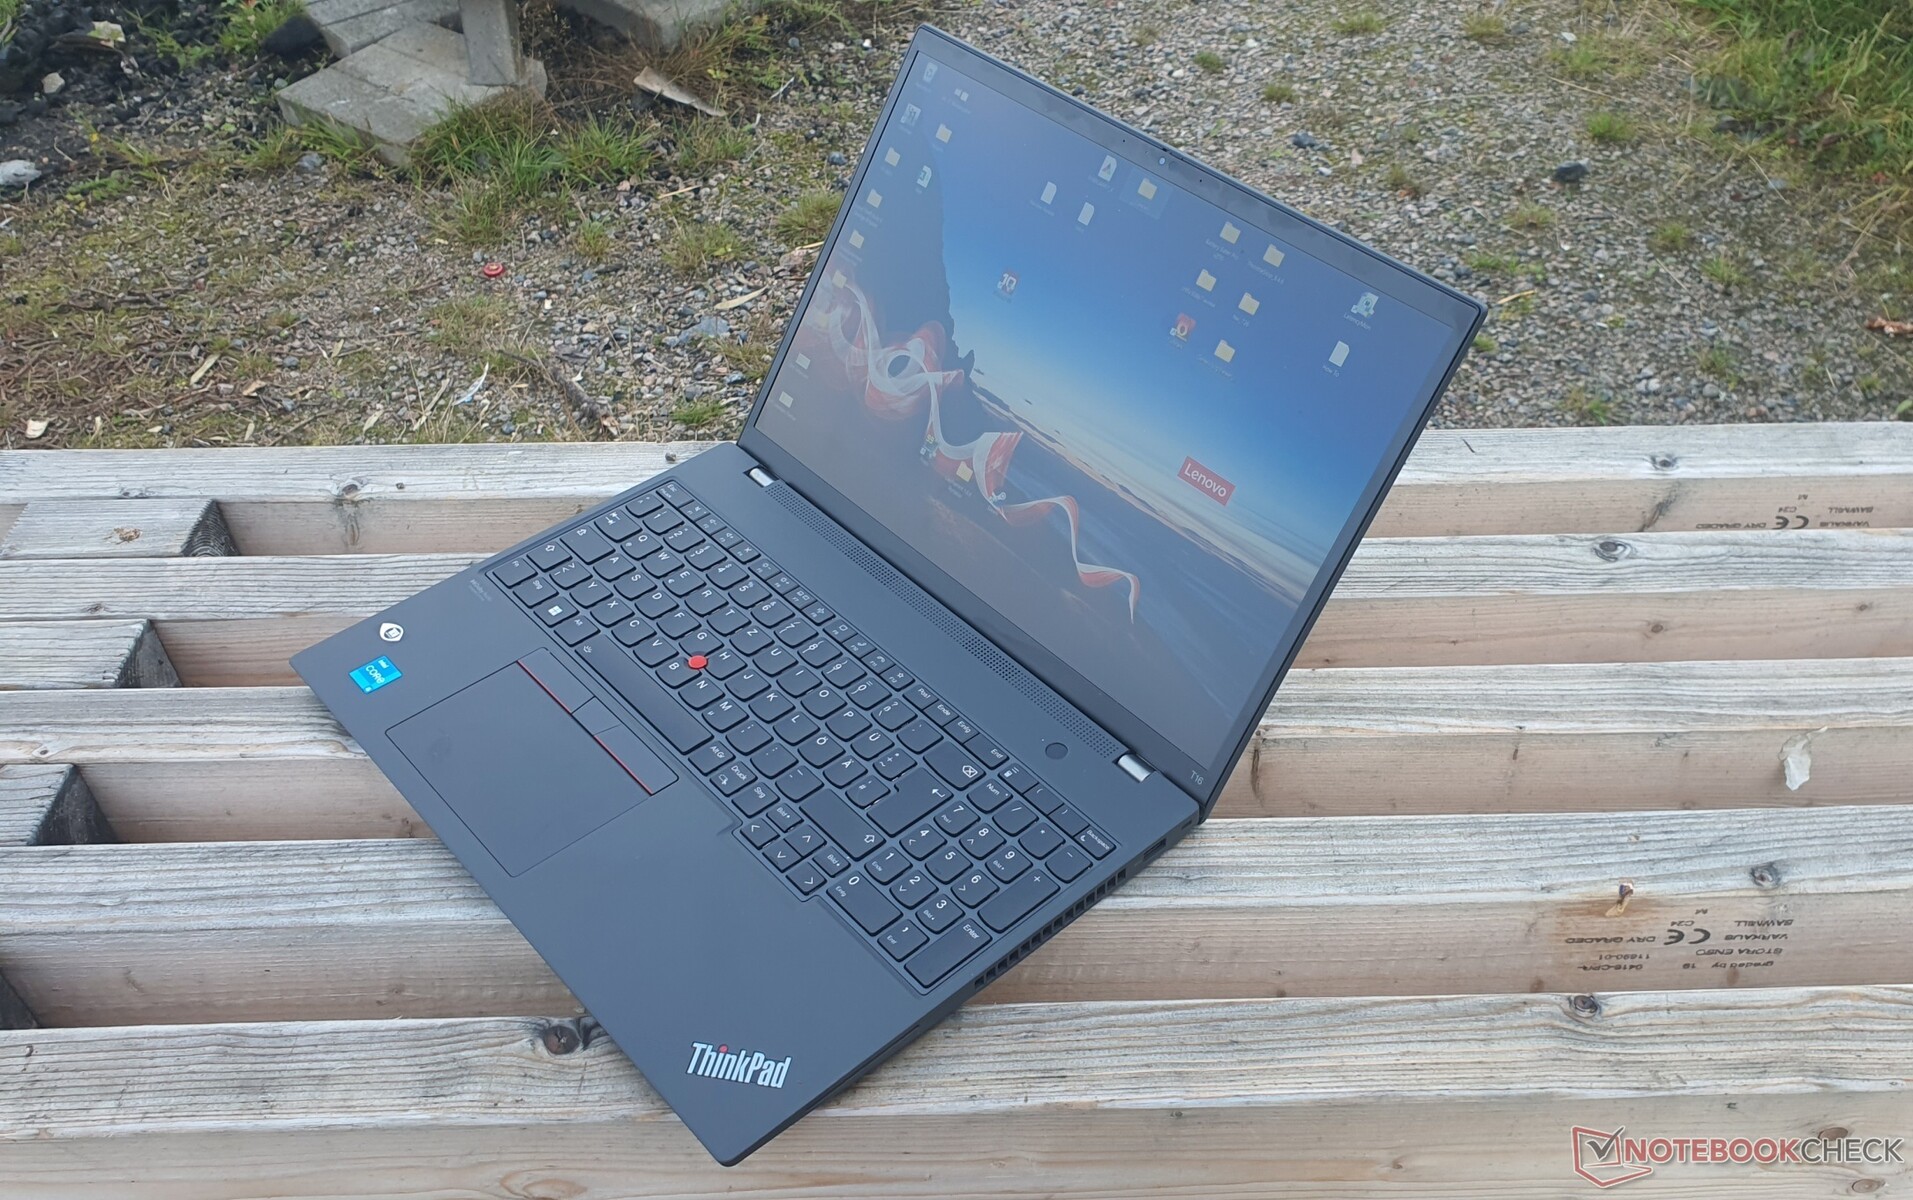
Test du Lenovo ThinkPad T16 G1 Intel : un marathonien de 16 pouces
Enfin, les ThinkPad de Lenovo de la série T classique font également l'objet d'une refonte. L'écran 16:10 du ThinkPad T16 G1, qui a été agrandi à 16 pouces, sera probablement la première chose qui attirera votre attention. L'option d'une batterie nettement plus grande permet d'espérer une longue autonomie, tout comme l'écran basse consommation en option. D'autres changements seront expliqués tout au long de cet article, ainsi que les éventuels inconvénients par rapport à sonpar rapport à son prédécesseur.
Notre modèle est équipé d'un Intel Core i5-1240P, de 16 Go de RAM DDR4-3200, d'un SSD PCIe 4.0 de 512 Go, d'un écran basse consommation FHD+ et d'une grande batterie de 86 Wh. Les CPU Intel U en option semblent être un peu plus économiques d'après nos évaluations jusqu'à présent. Une dalle 2.5K est également disponible, mais l'option 4K UHD du prédécesseur avec 100% de DCI-P3 n'est plus disponible. Le MX550 de Nvidia GeForce est également en option.
La concurrence du ThinkPad T16 en tant qu'appareil professionnel haut de gamme parmi les ordinateurs portables 15/16 pouces comprend principalement le Latitude 15 5531 de Dell et l'EliteBook 865 G9 de HP. Mais la comparaison avec les ordinateurs portables de milieu de gamme est certainement intéressante, y compris les hybrides bureautiques multimédias tels que le MateBook D 16 de Huawei Test du Huawei MateBook D 16 2022 : PC portable multimédia en 16:10 et avec pavé numérique et le Vivobook Pro 16X d'Asus Asus Vivobook Pro 16X Laptop im Test: Asus überzeugt mit einem Top-OLED-Display .
Comparaison avec les concurrents potentiels
Note | Date | Modèle | Poids | Épaisseur | Taille | Résolution | Prix |
|---|---|---|---|---|---|---|---|
| 89.3 % v7 (old) | 09/22 | Lenovo ThinkPad T16 G1 21BWS00200 i5-1240P, Iris Xe G7 80EUs | 1.9 kg | 20.5 mm | 16.00" | 1920x1200 | |
| 87.1 % v7 (old) | 05/21 | Lenovo ThinkPad T15 Gen2-20W5S00100 i7-1165G7, GeForce MX450 | 1.9 kg | 19.1 mm | 15.60" | 1920x1080 | |
| 85.5 % v7 (old) | 08/21 | Lenovo ThinkPad E15 G3-20YG003UGE R7 5700U, Vega 8 | 1.8 kg | 18.9 mm | 15.60" | 1920x1080 | |
| 85.1 % v7 (old) | 07/21 | Lenovo ThinkPad L15 G2 AMD R5 5600U, Vega 7 | 1.9 kg | 21 mm | 15.60" | 1920x1080 | |
| 85 % v7 (old) | 08/22 | HP ProBook 450 G9 6A180EA i7-1255U, Iris Xe G7 96EUs | 1.7 kg | 19.9 mm | 15.60" | 1920x1080 | |
| 87.7 % v7 (old) | 07/22 | HP ZBook Power 15 G8 313S5EA i7-11800H, T600 Laptop GPU | 2 kg | 22.8 mm | 15.60" | 1920x1080 | |
v (old) | 09/22 | Dell Latitude 15 5531, i5-12600H MX550 i5-12600H, GeForce MX550 | 1.8 kg | 24.05 mm | 15.60" | 1920x1080 | |
| 87.4 % v7 (old) | 08/22 | Dell Inspiron 16 Plus 7620 i7-12700H, GeForce RTX 3050 Ti Laptop GPU | 2.1 kg | 18.99 mm | 16.00" | 3072x1920 | |
| 83.6 % v7 (old) | 07/22 | Huawei MateBook D 16 2022 i7-12700H, Iris Xe G7 96EUs | 1.7 kg | 18.4 mm | 16.00" | 1920x1200 | |
v (old) | 12/21 | Asus Vivobook Pro 16X-M7600QE R9 5900HX, GeForce RTX 3050 Ti Laptop GPU | 1.9 kg | 19 mm | 16.10" | 3840x2400 |
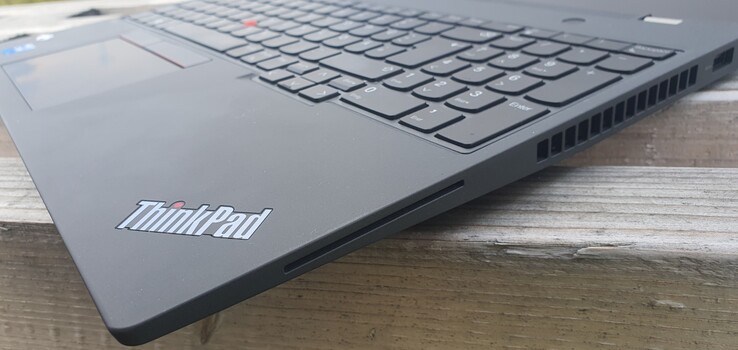
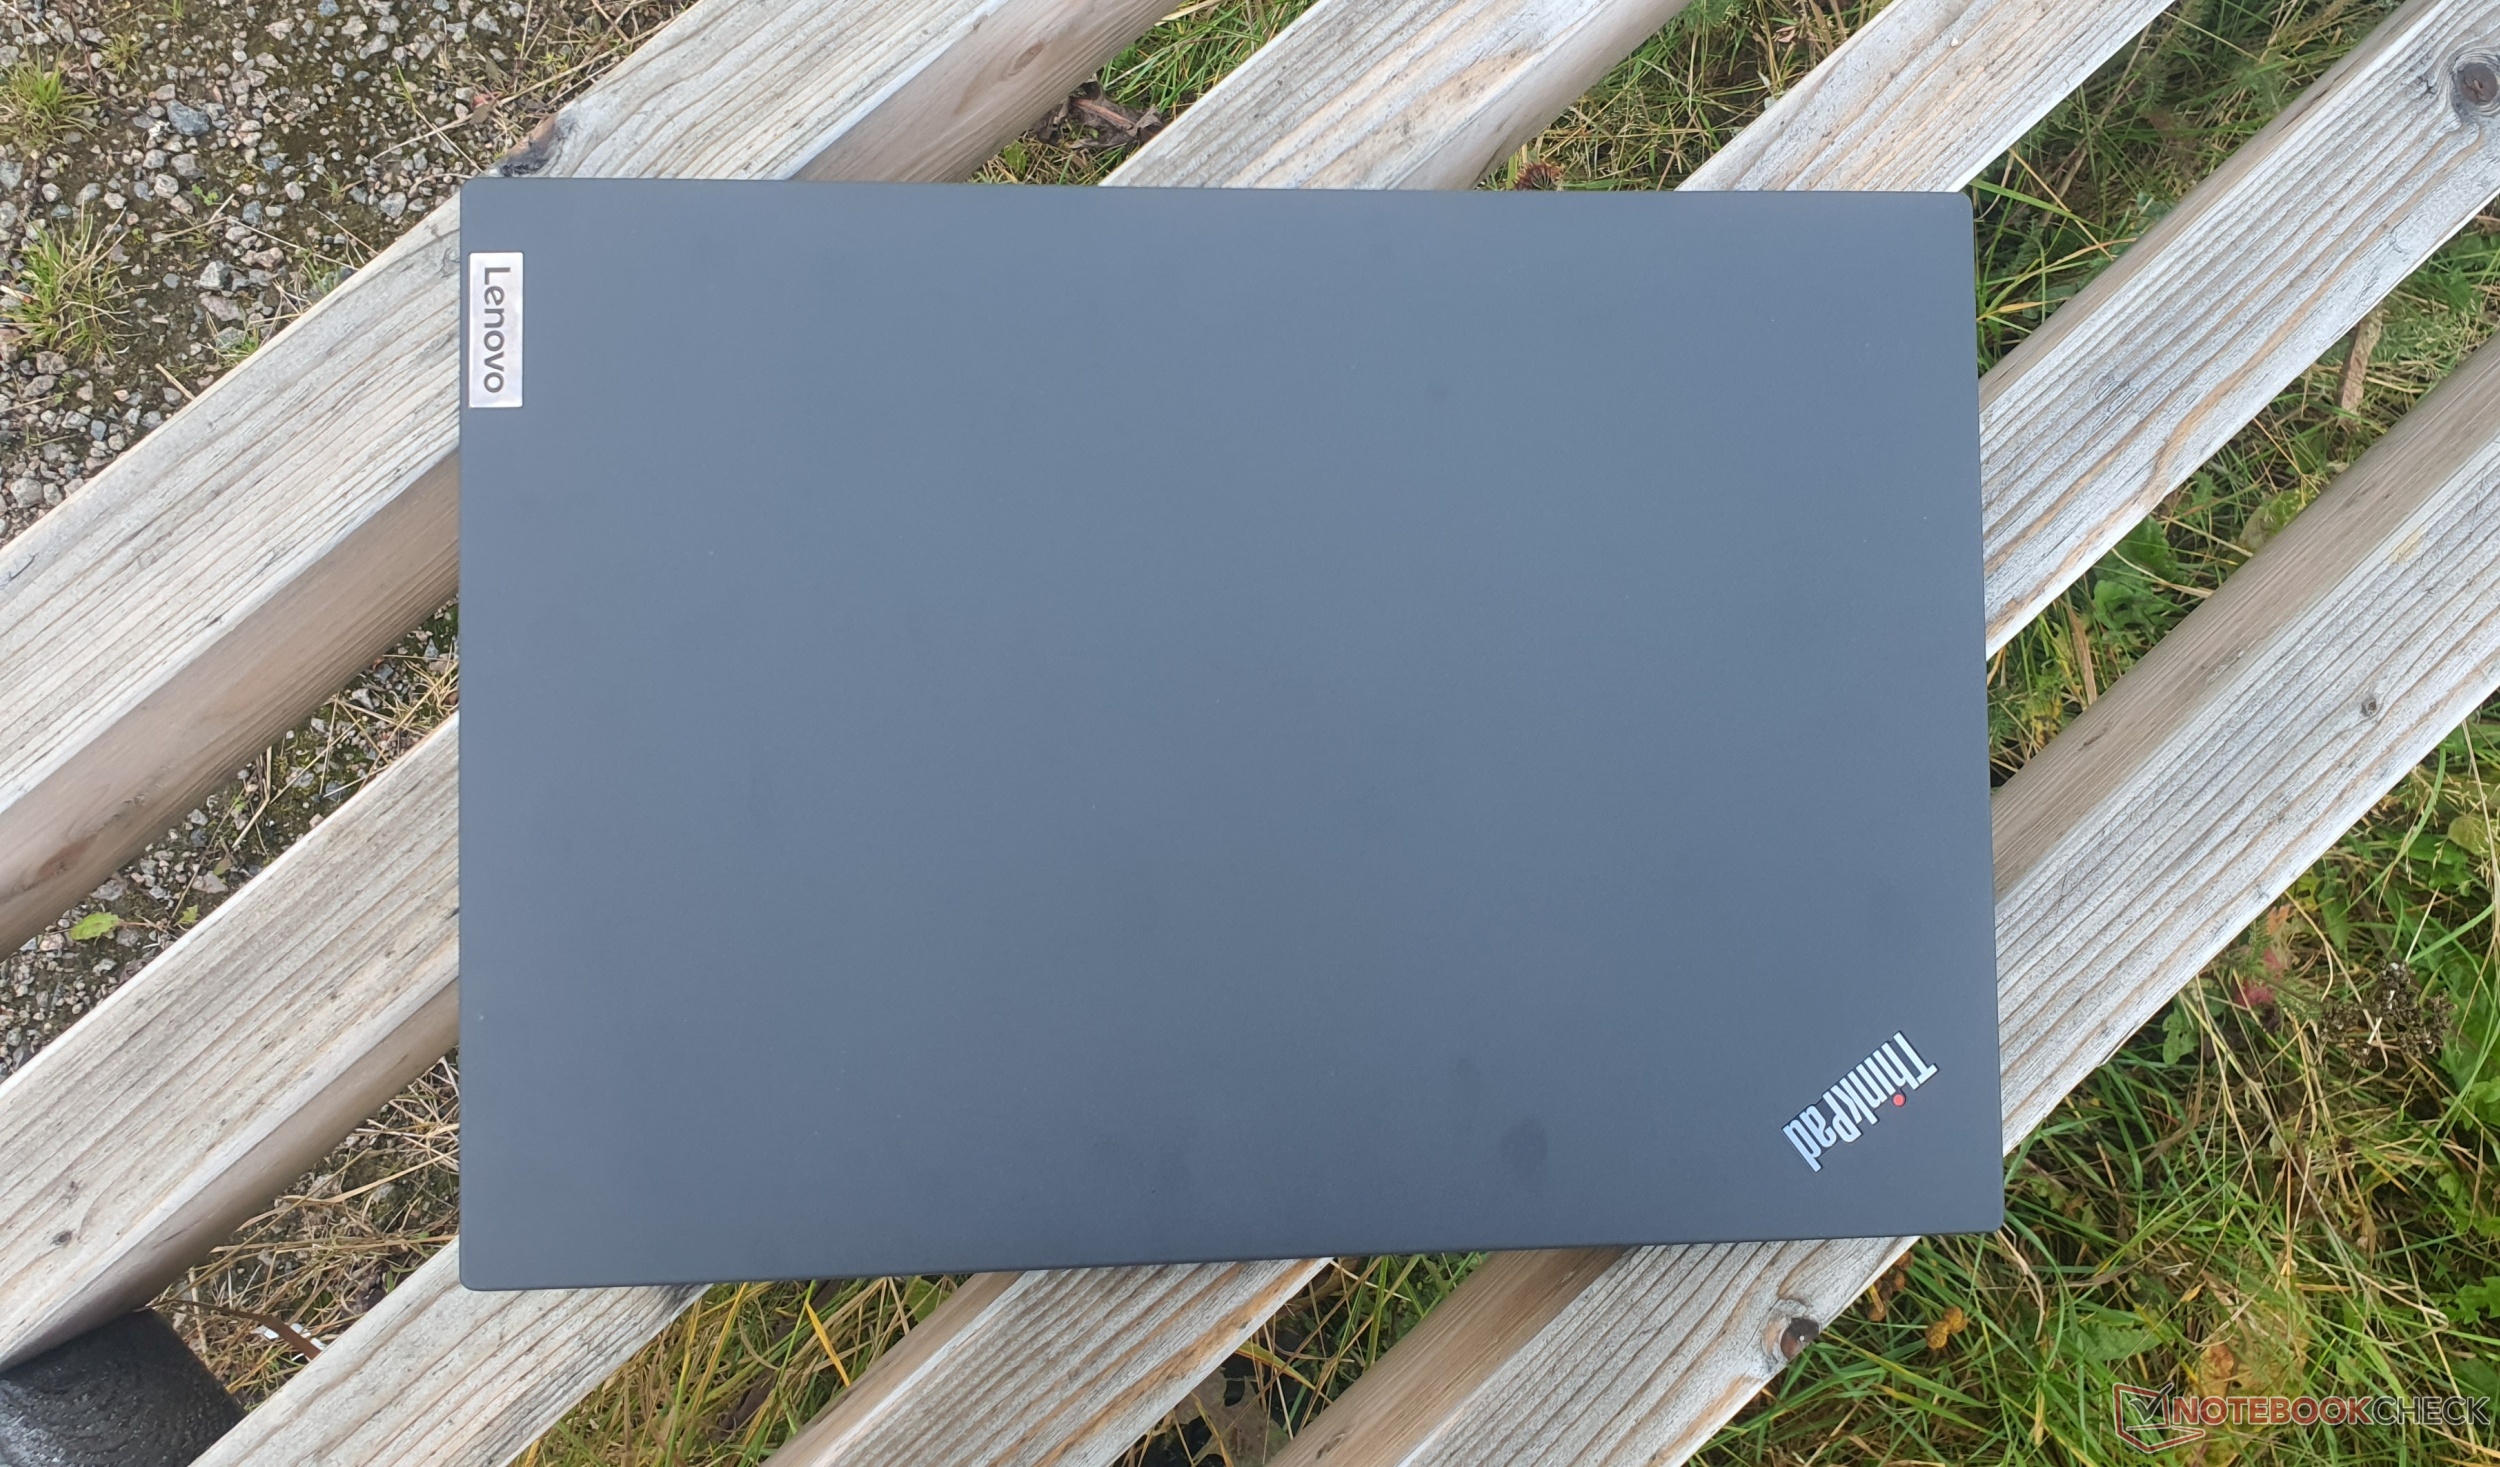
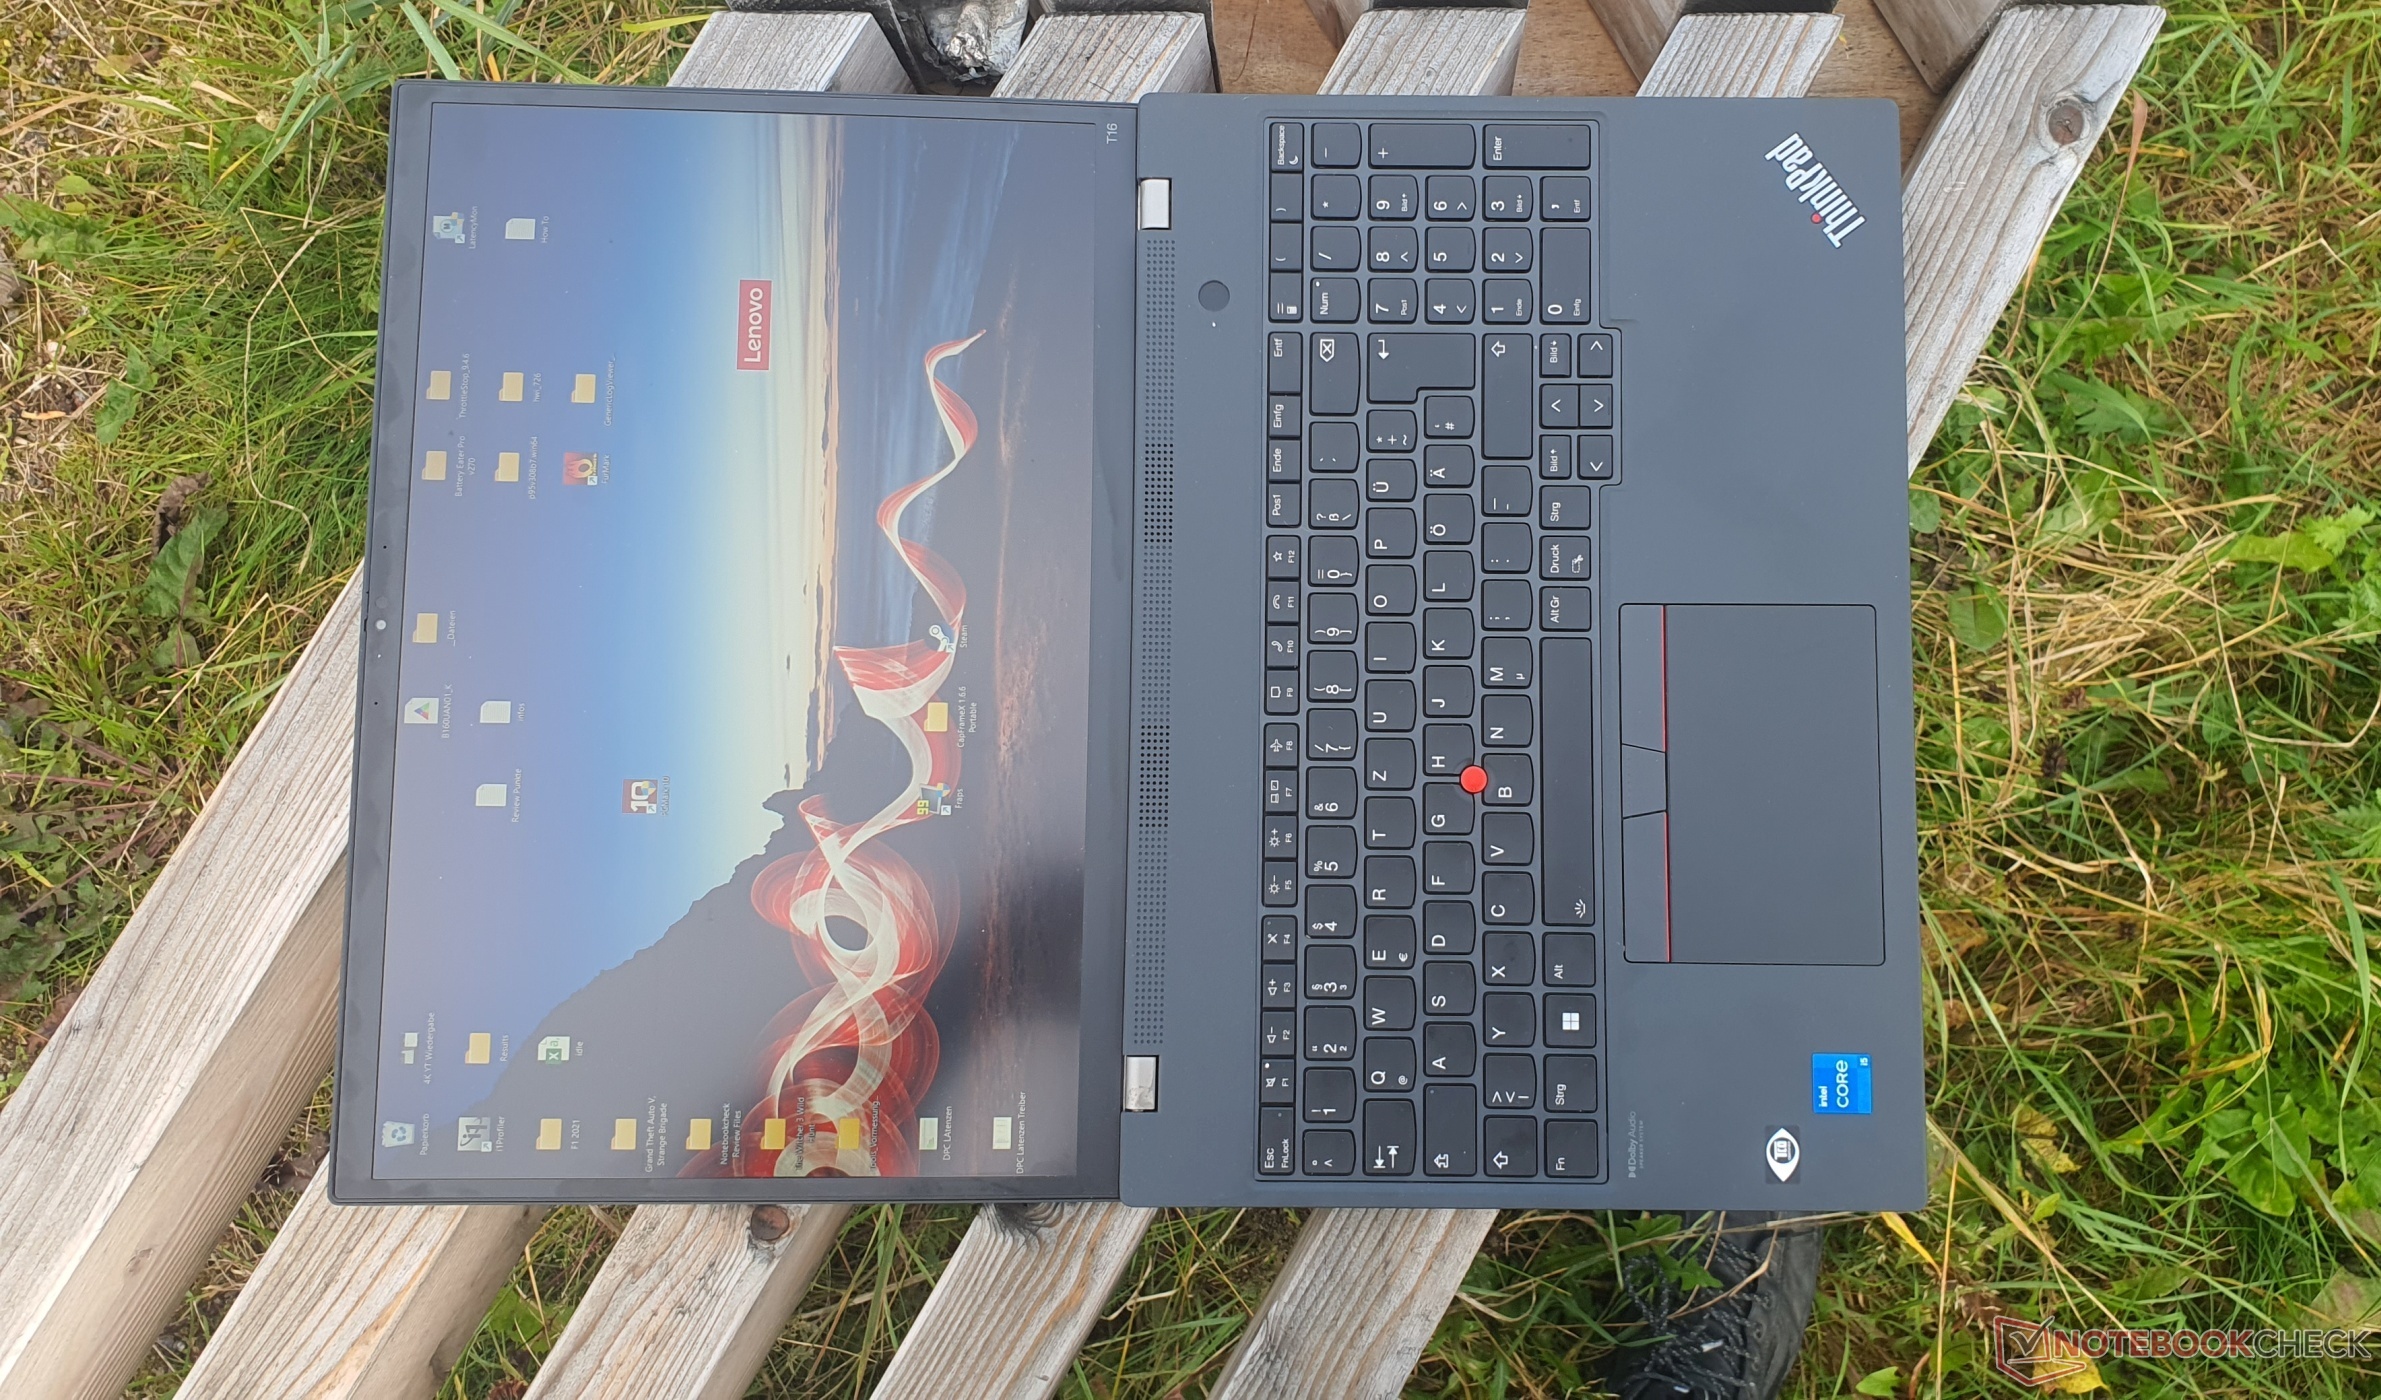
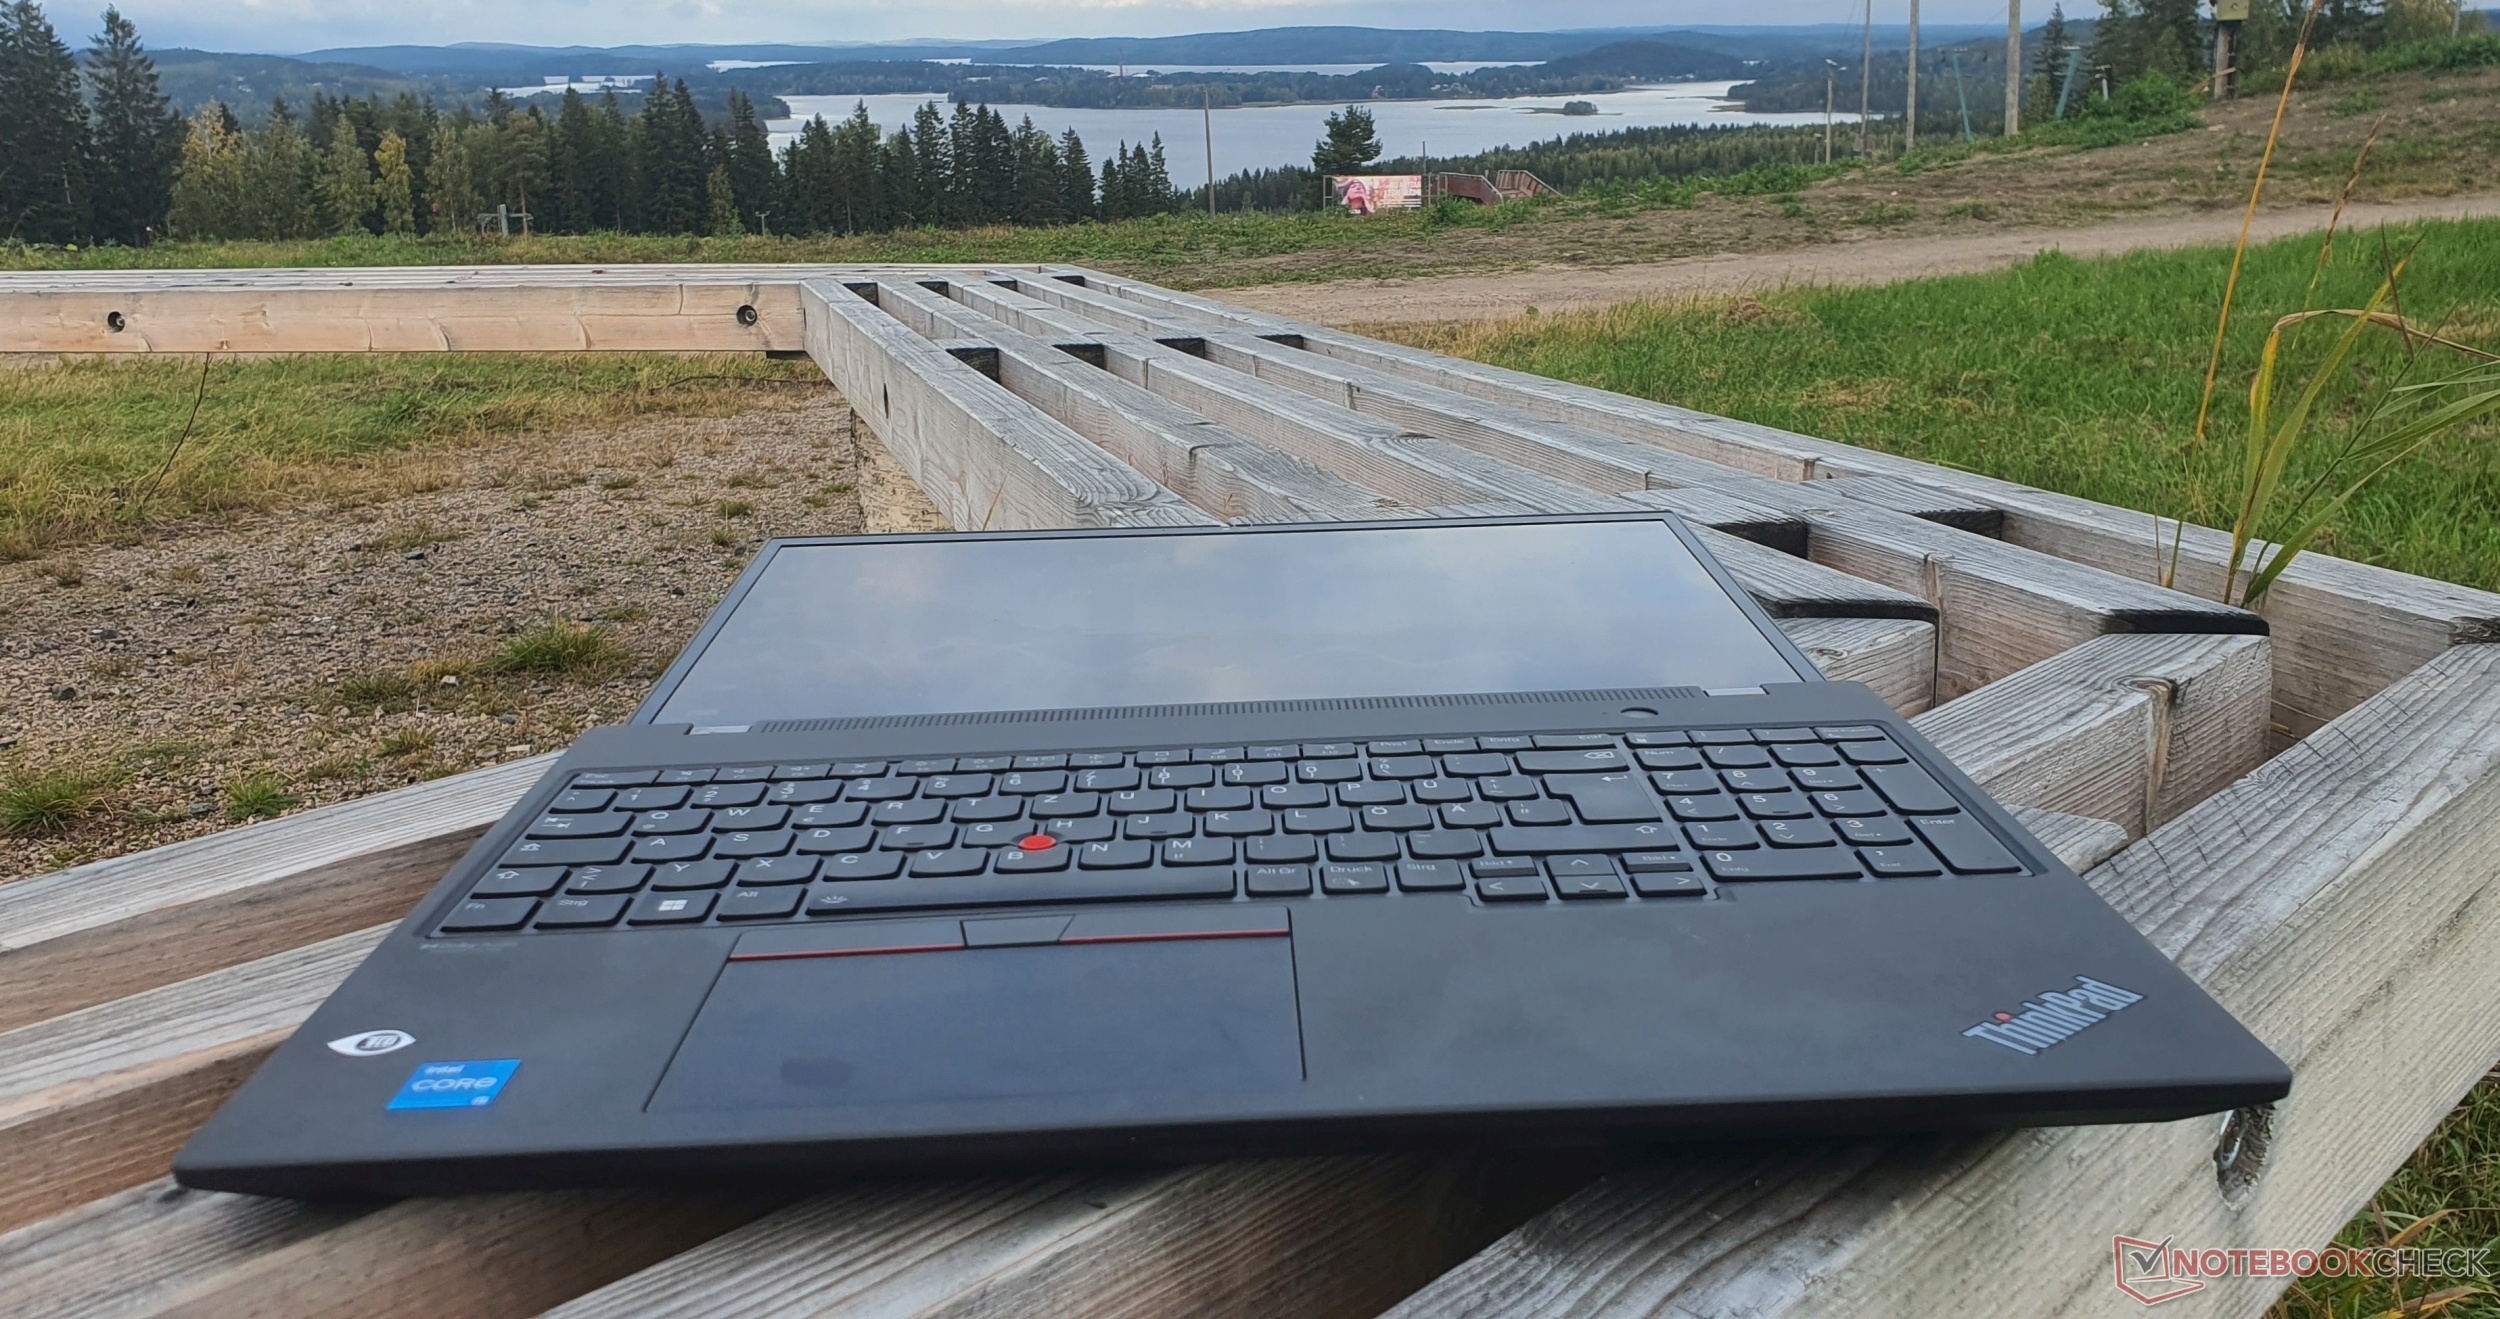
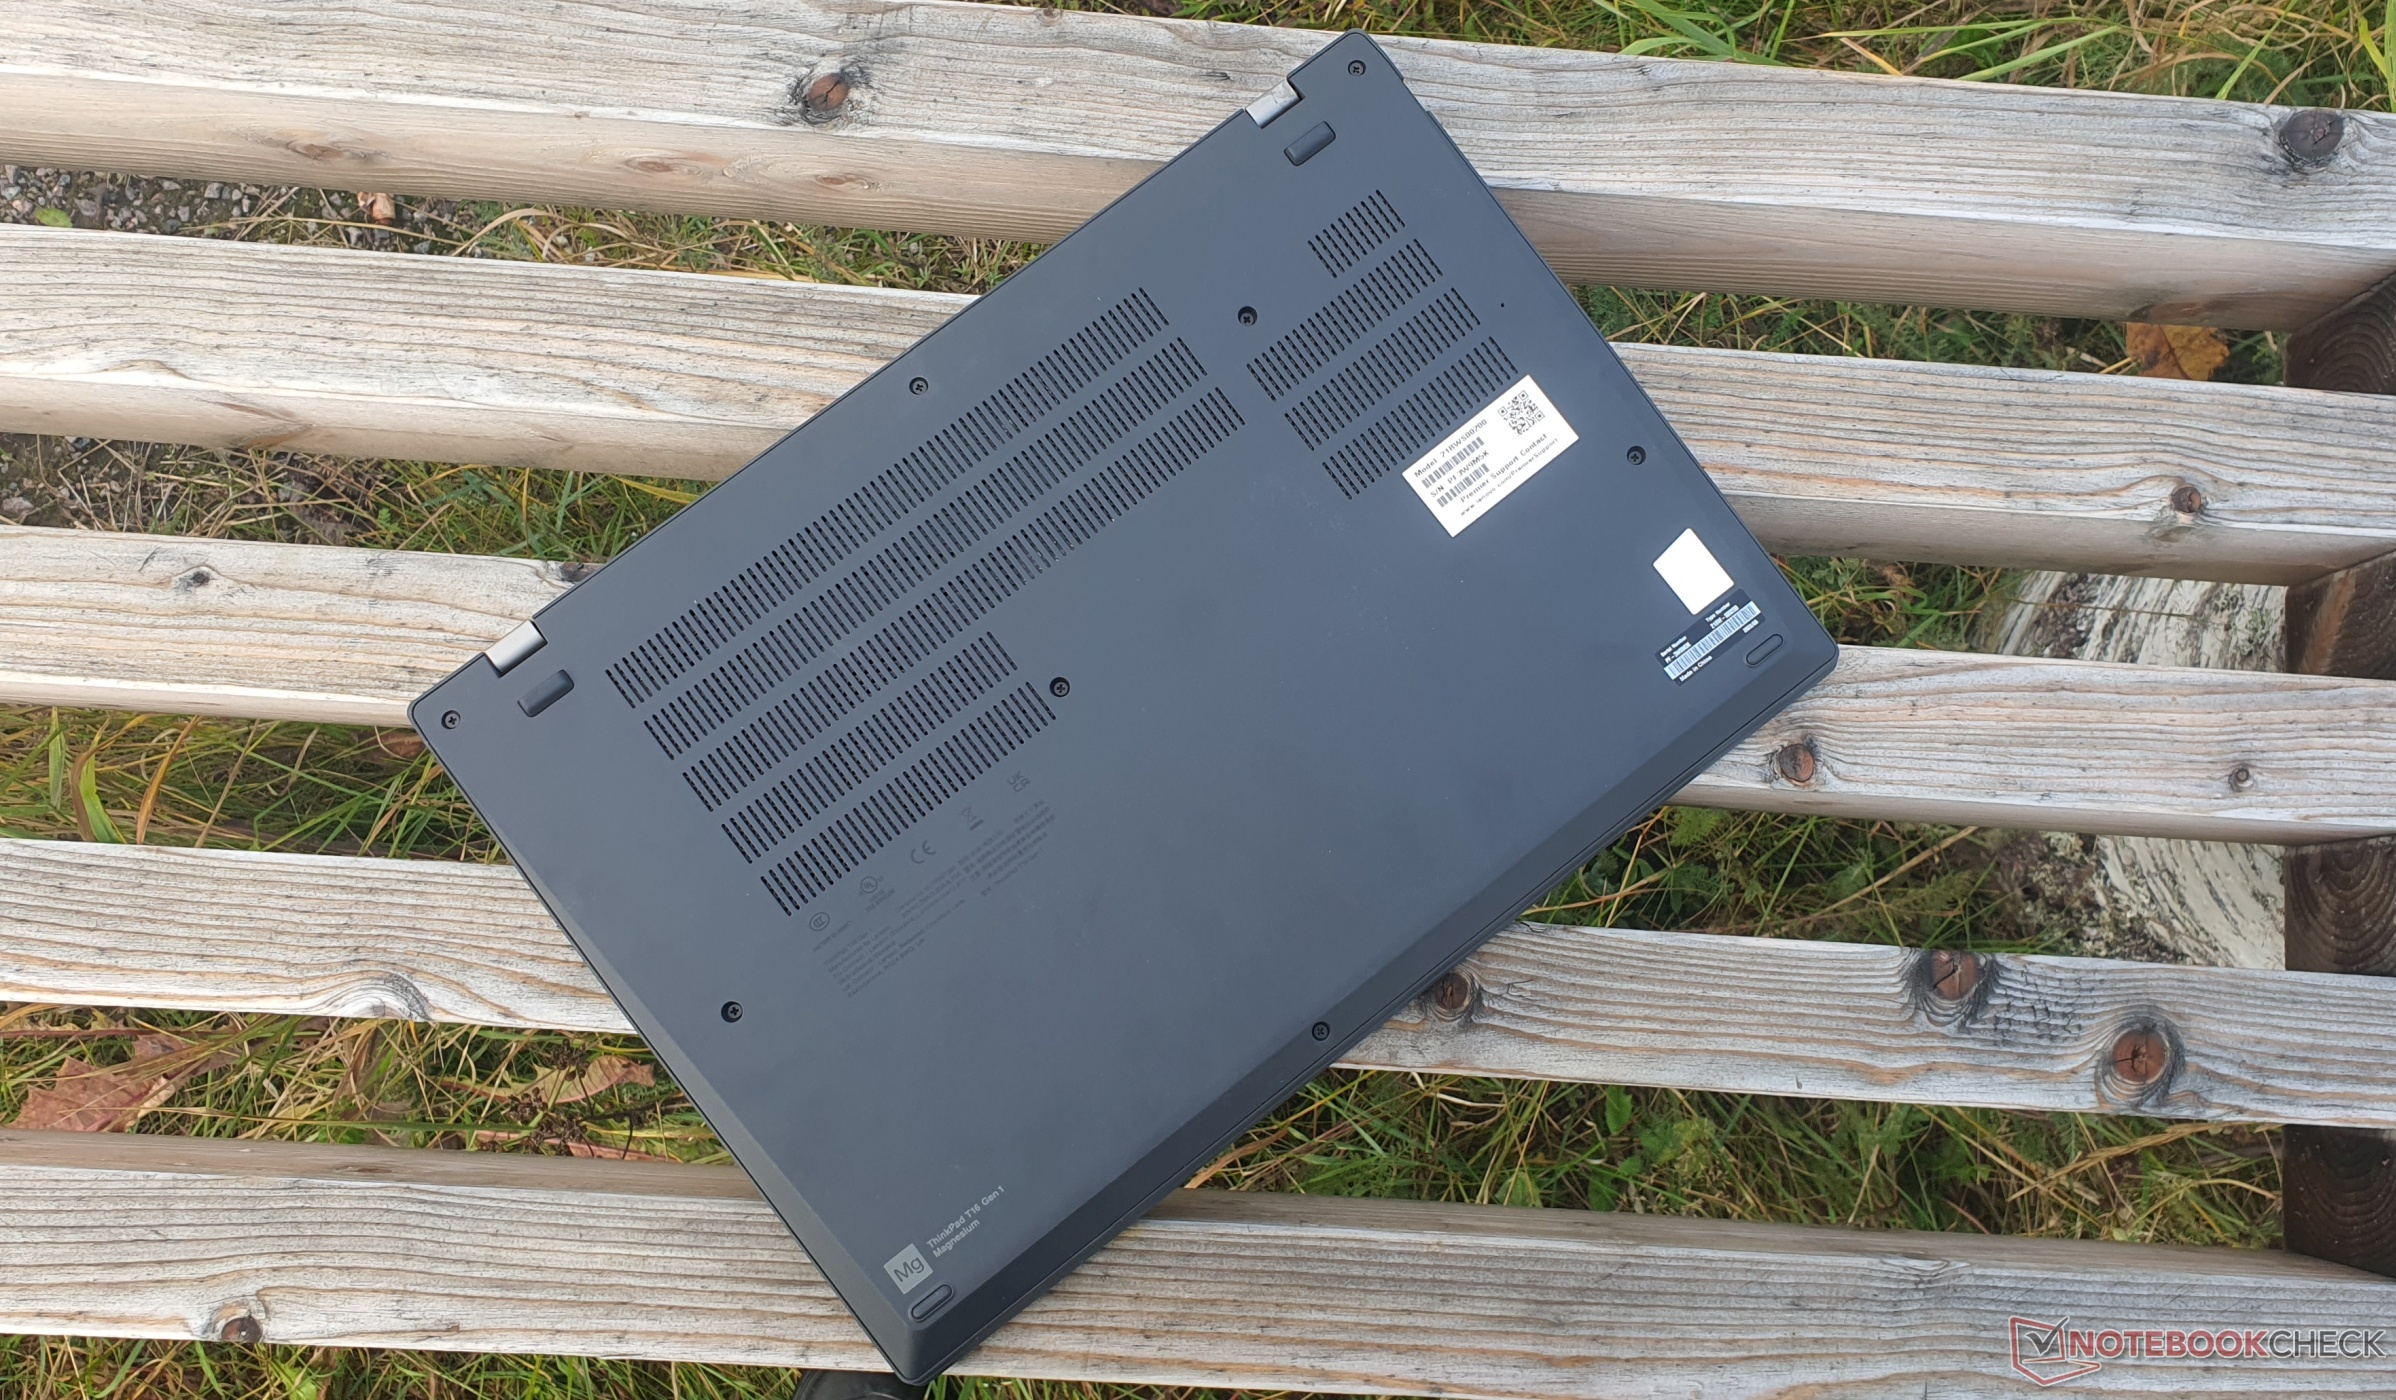
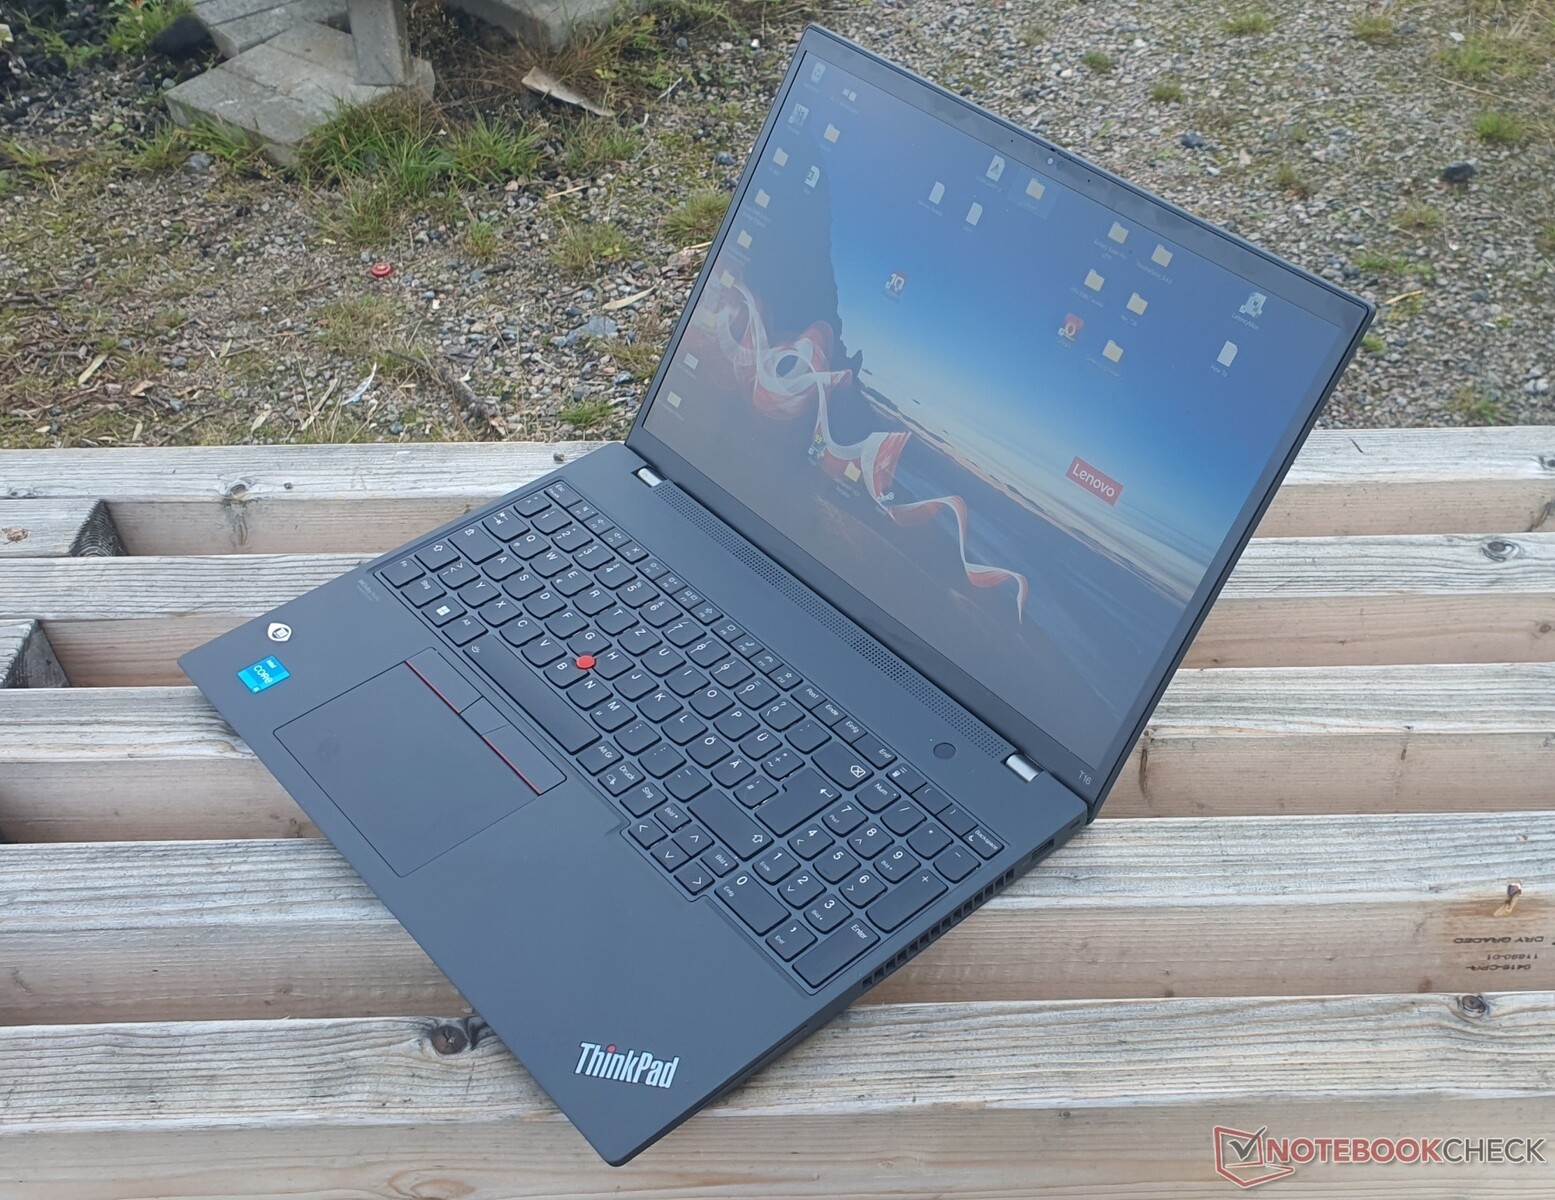
Boîtier - La fibre de carbone est utilisée pour la première fois dans le robuste ThinkPad T16
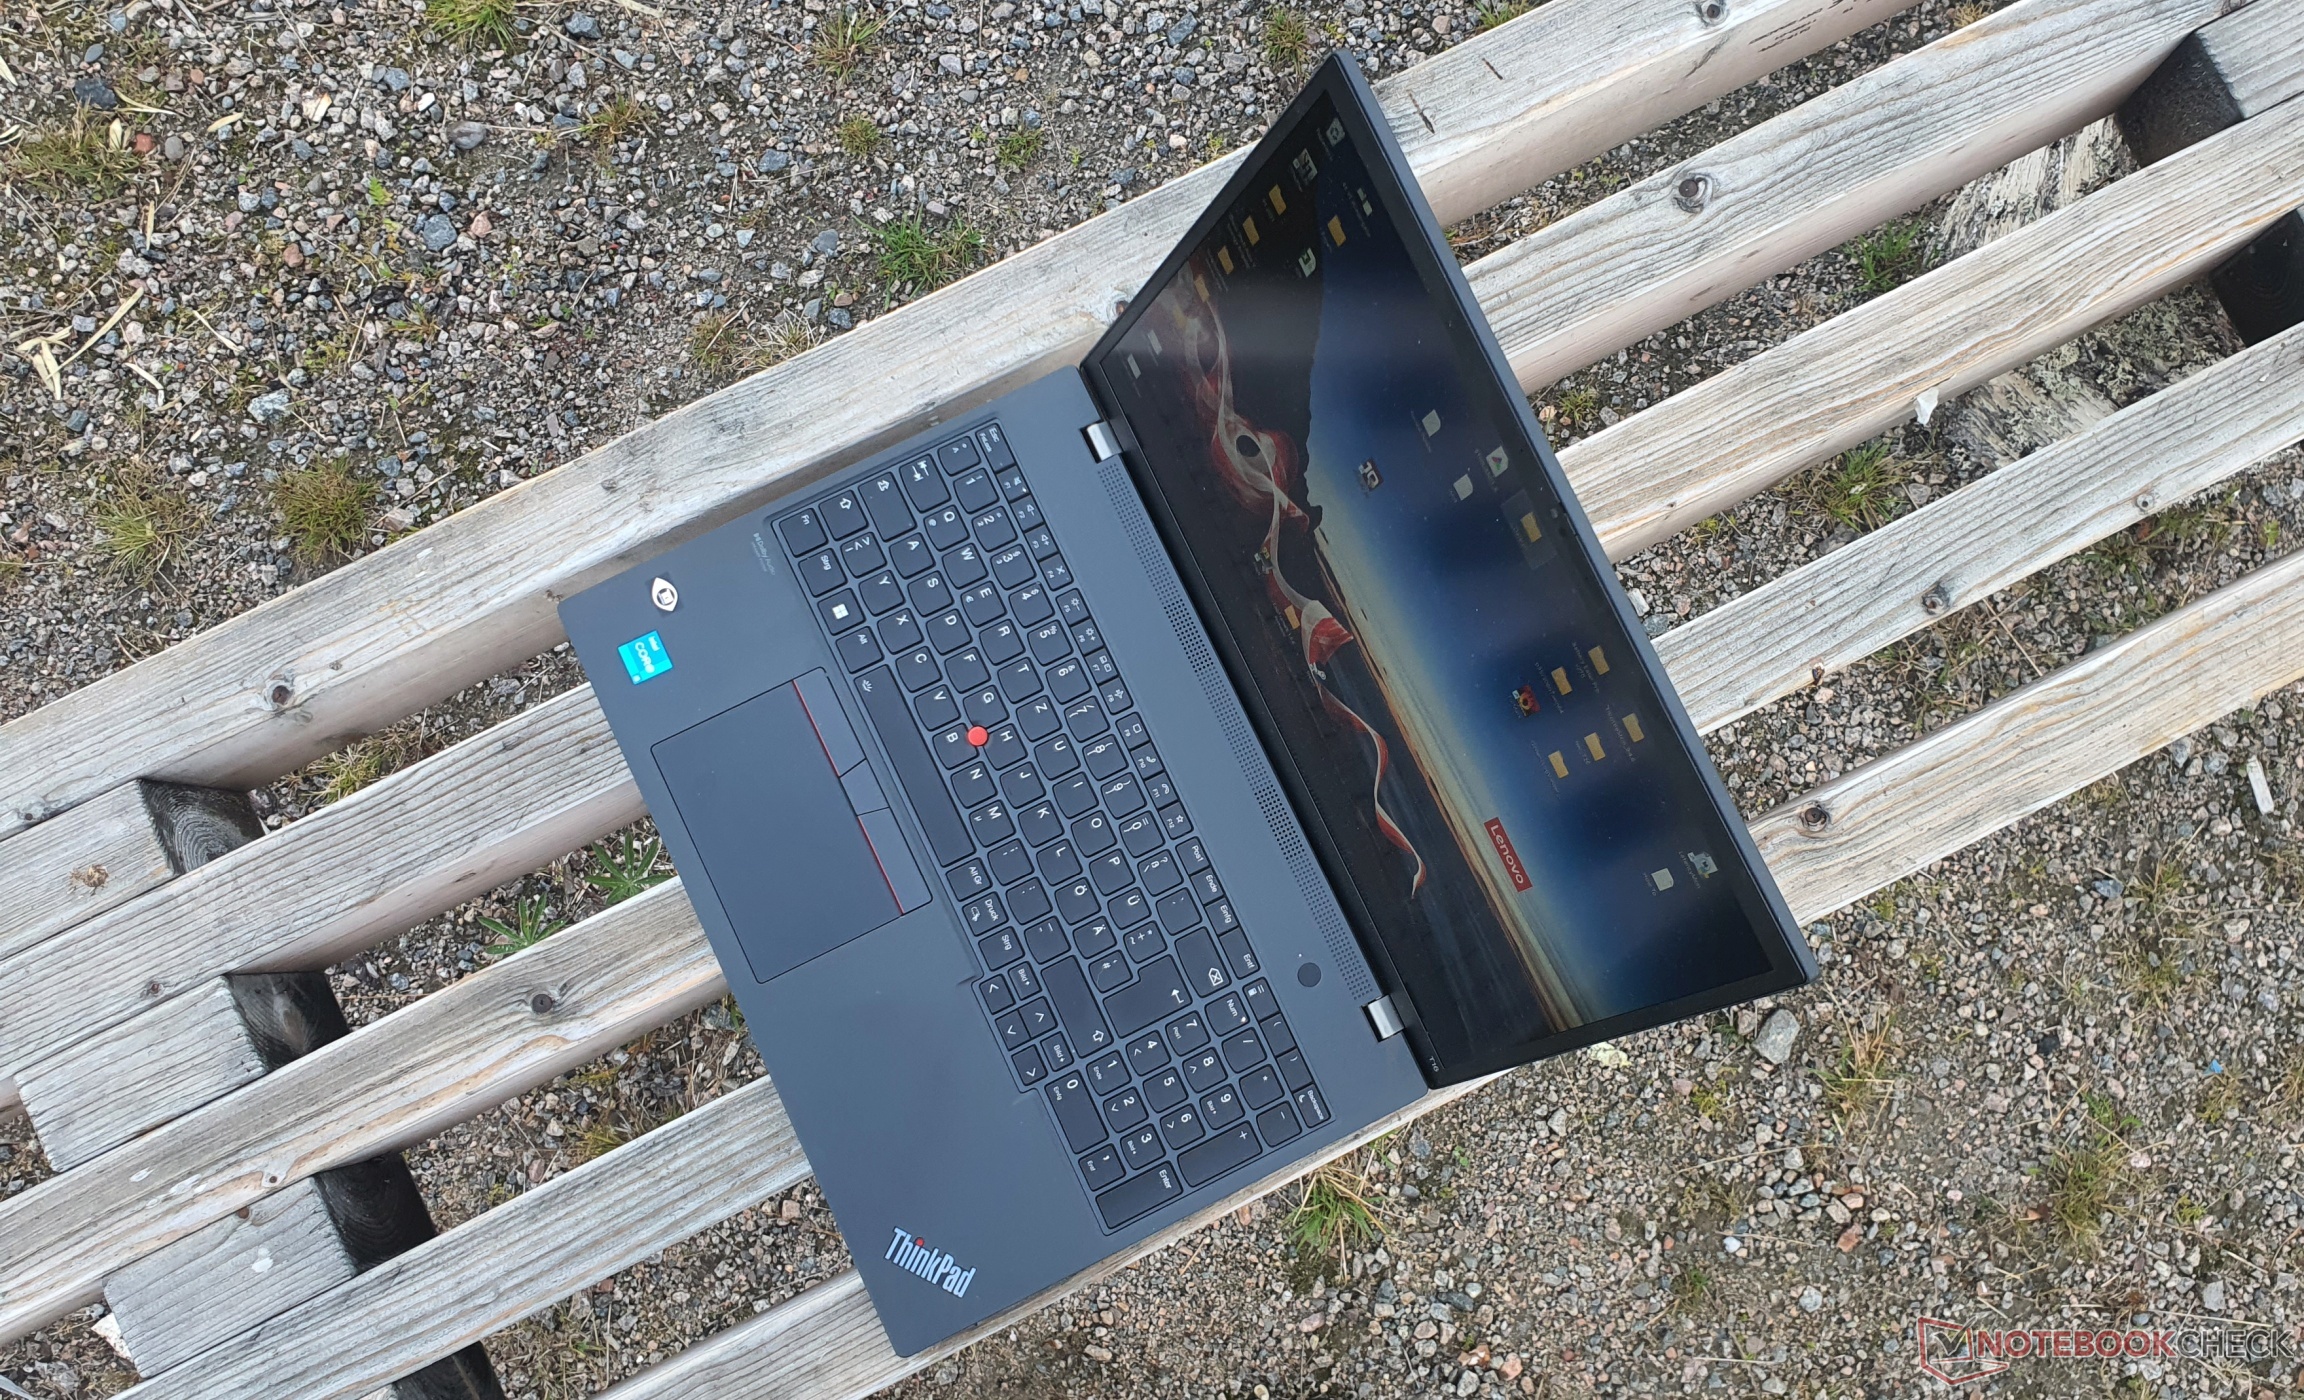
Le ThinkPad T16 est de couleur anthracite, semblable auT14s G2les surfaces caoutchoutées, légèrement rugueuses, sont également identiques et offrent une sensation de très haute qualité.
Les empreintes digitales sont visibles, mais beaucoup moins qu'auparavant. Les bords de l'écran sont plus étroits en raison du format 16:10, tandis que le reste du design reste plus ou moins le même. Pourtant, l'appareil est plus épais de 1,4 mm, un peu plus court, mais aussi un peu plus profond. Notre modèle pèse 1,95 kg, ce qui est principalement dû à la capacité de la batterie choisie.
La finition, exempte de lacunes, est remarquable, tout comme la stabilité. Le couvercle peut à peine être tordu, et une pression ciblée sur le couvercle arrière n'entraîne aucune déformation de l'image. Rien d'étonnant à cela, puisque le couvercle est fabriqué à partir d'un mélange de fibre de carbone, de fibre de verre et de plastique. La fibre de carbone était auparavant et exclusivement réservée aux modèles plus chers avec le s-suffixe
Le repose-poignets est constitué d'un mélange de plastique, de fibre de verre, de magnésium et d'aluminium. La base s'avère ainsi très résistante aux contraintes de torsion. La face inférieure est entièrement réalisée en thermoplastique. Les charnières robustes sont serrées, mais l'ouverture à une main jusqu'à 180° reste possible.

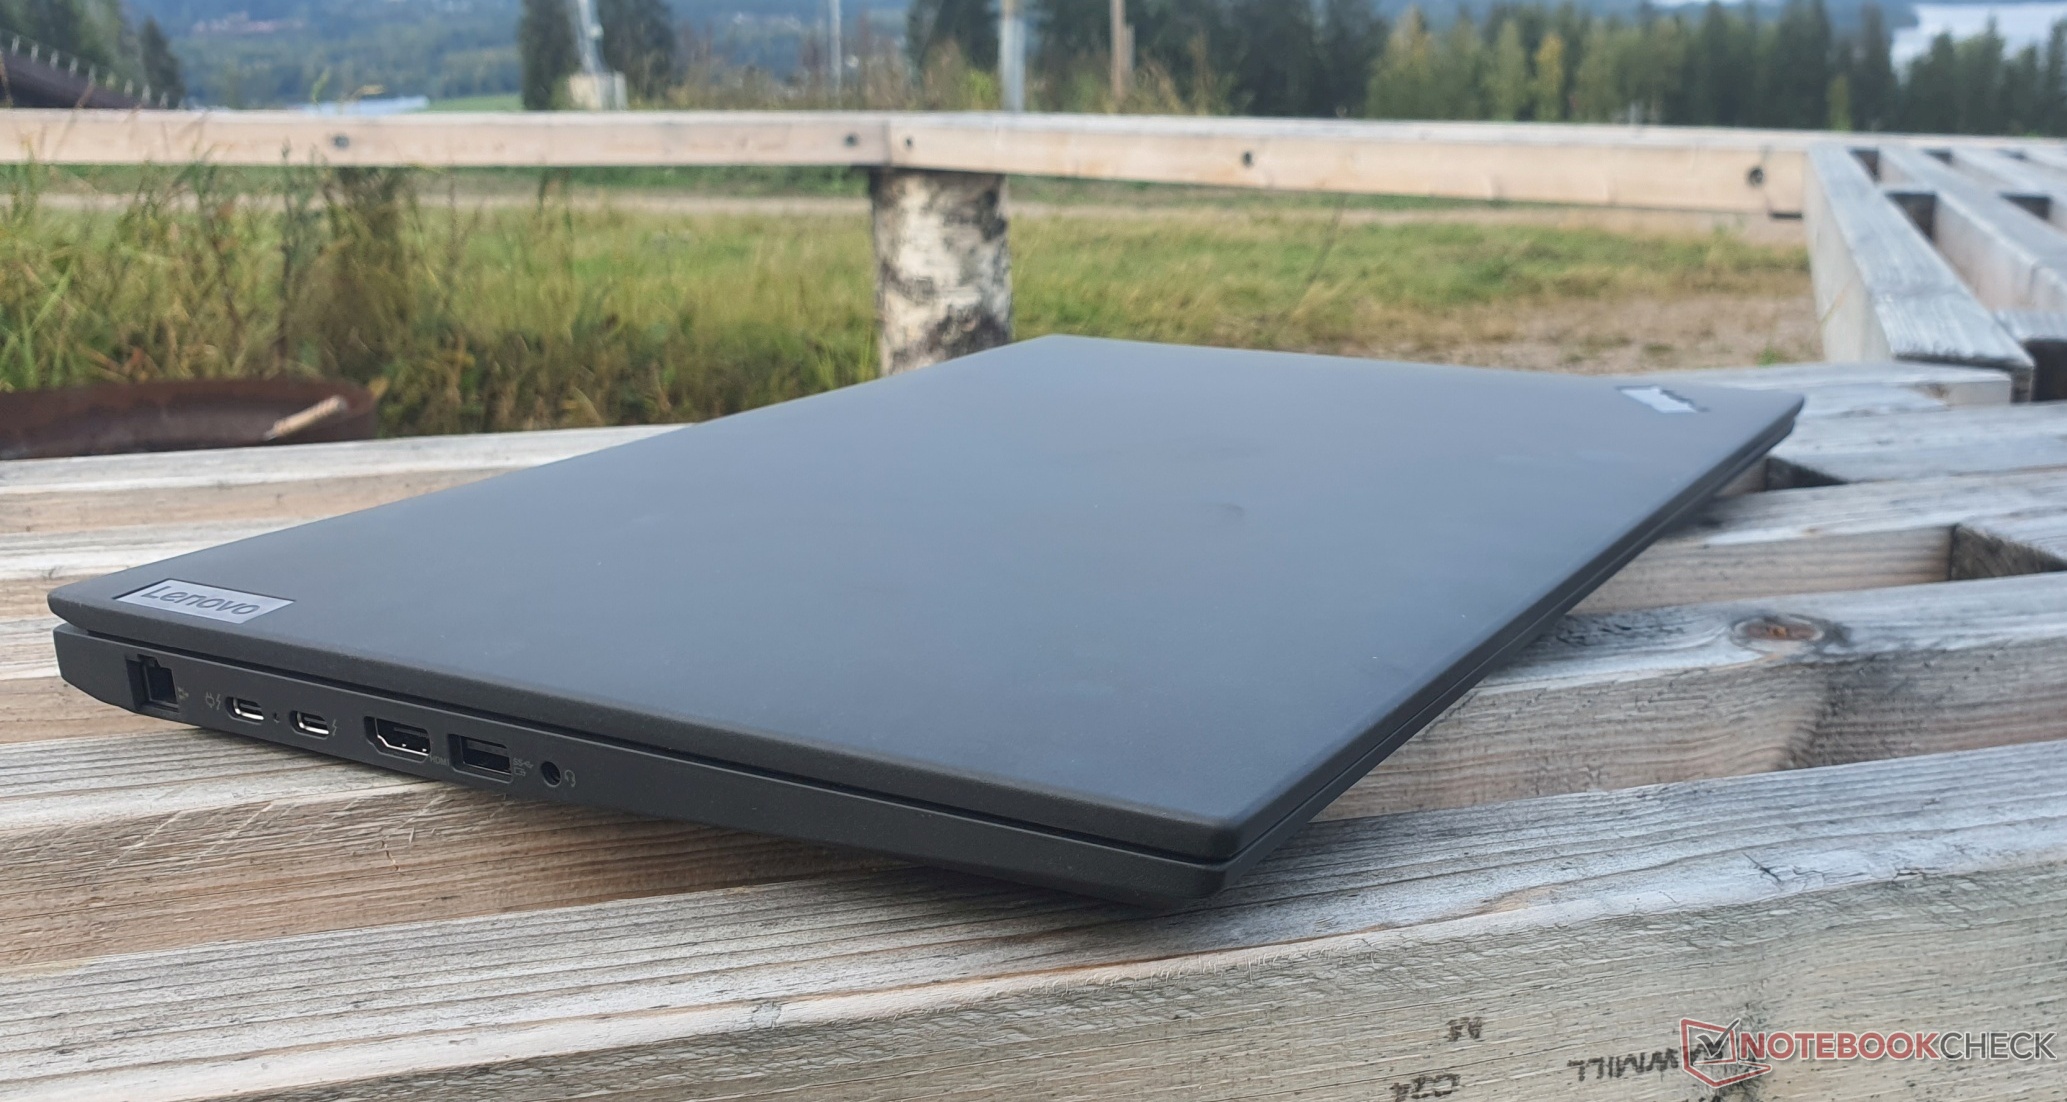

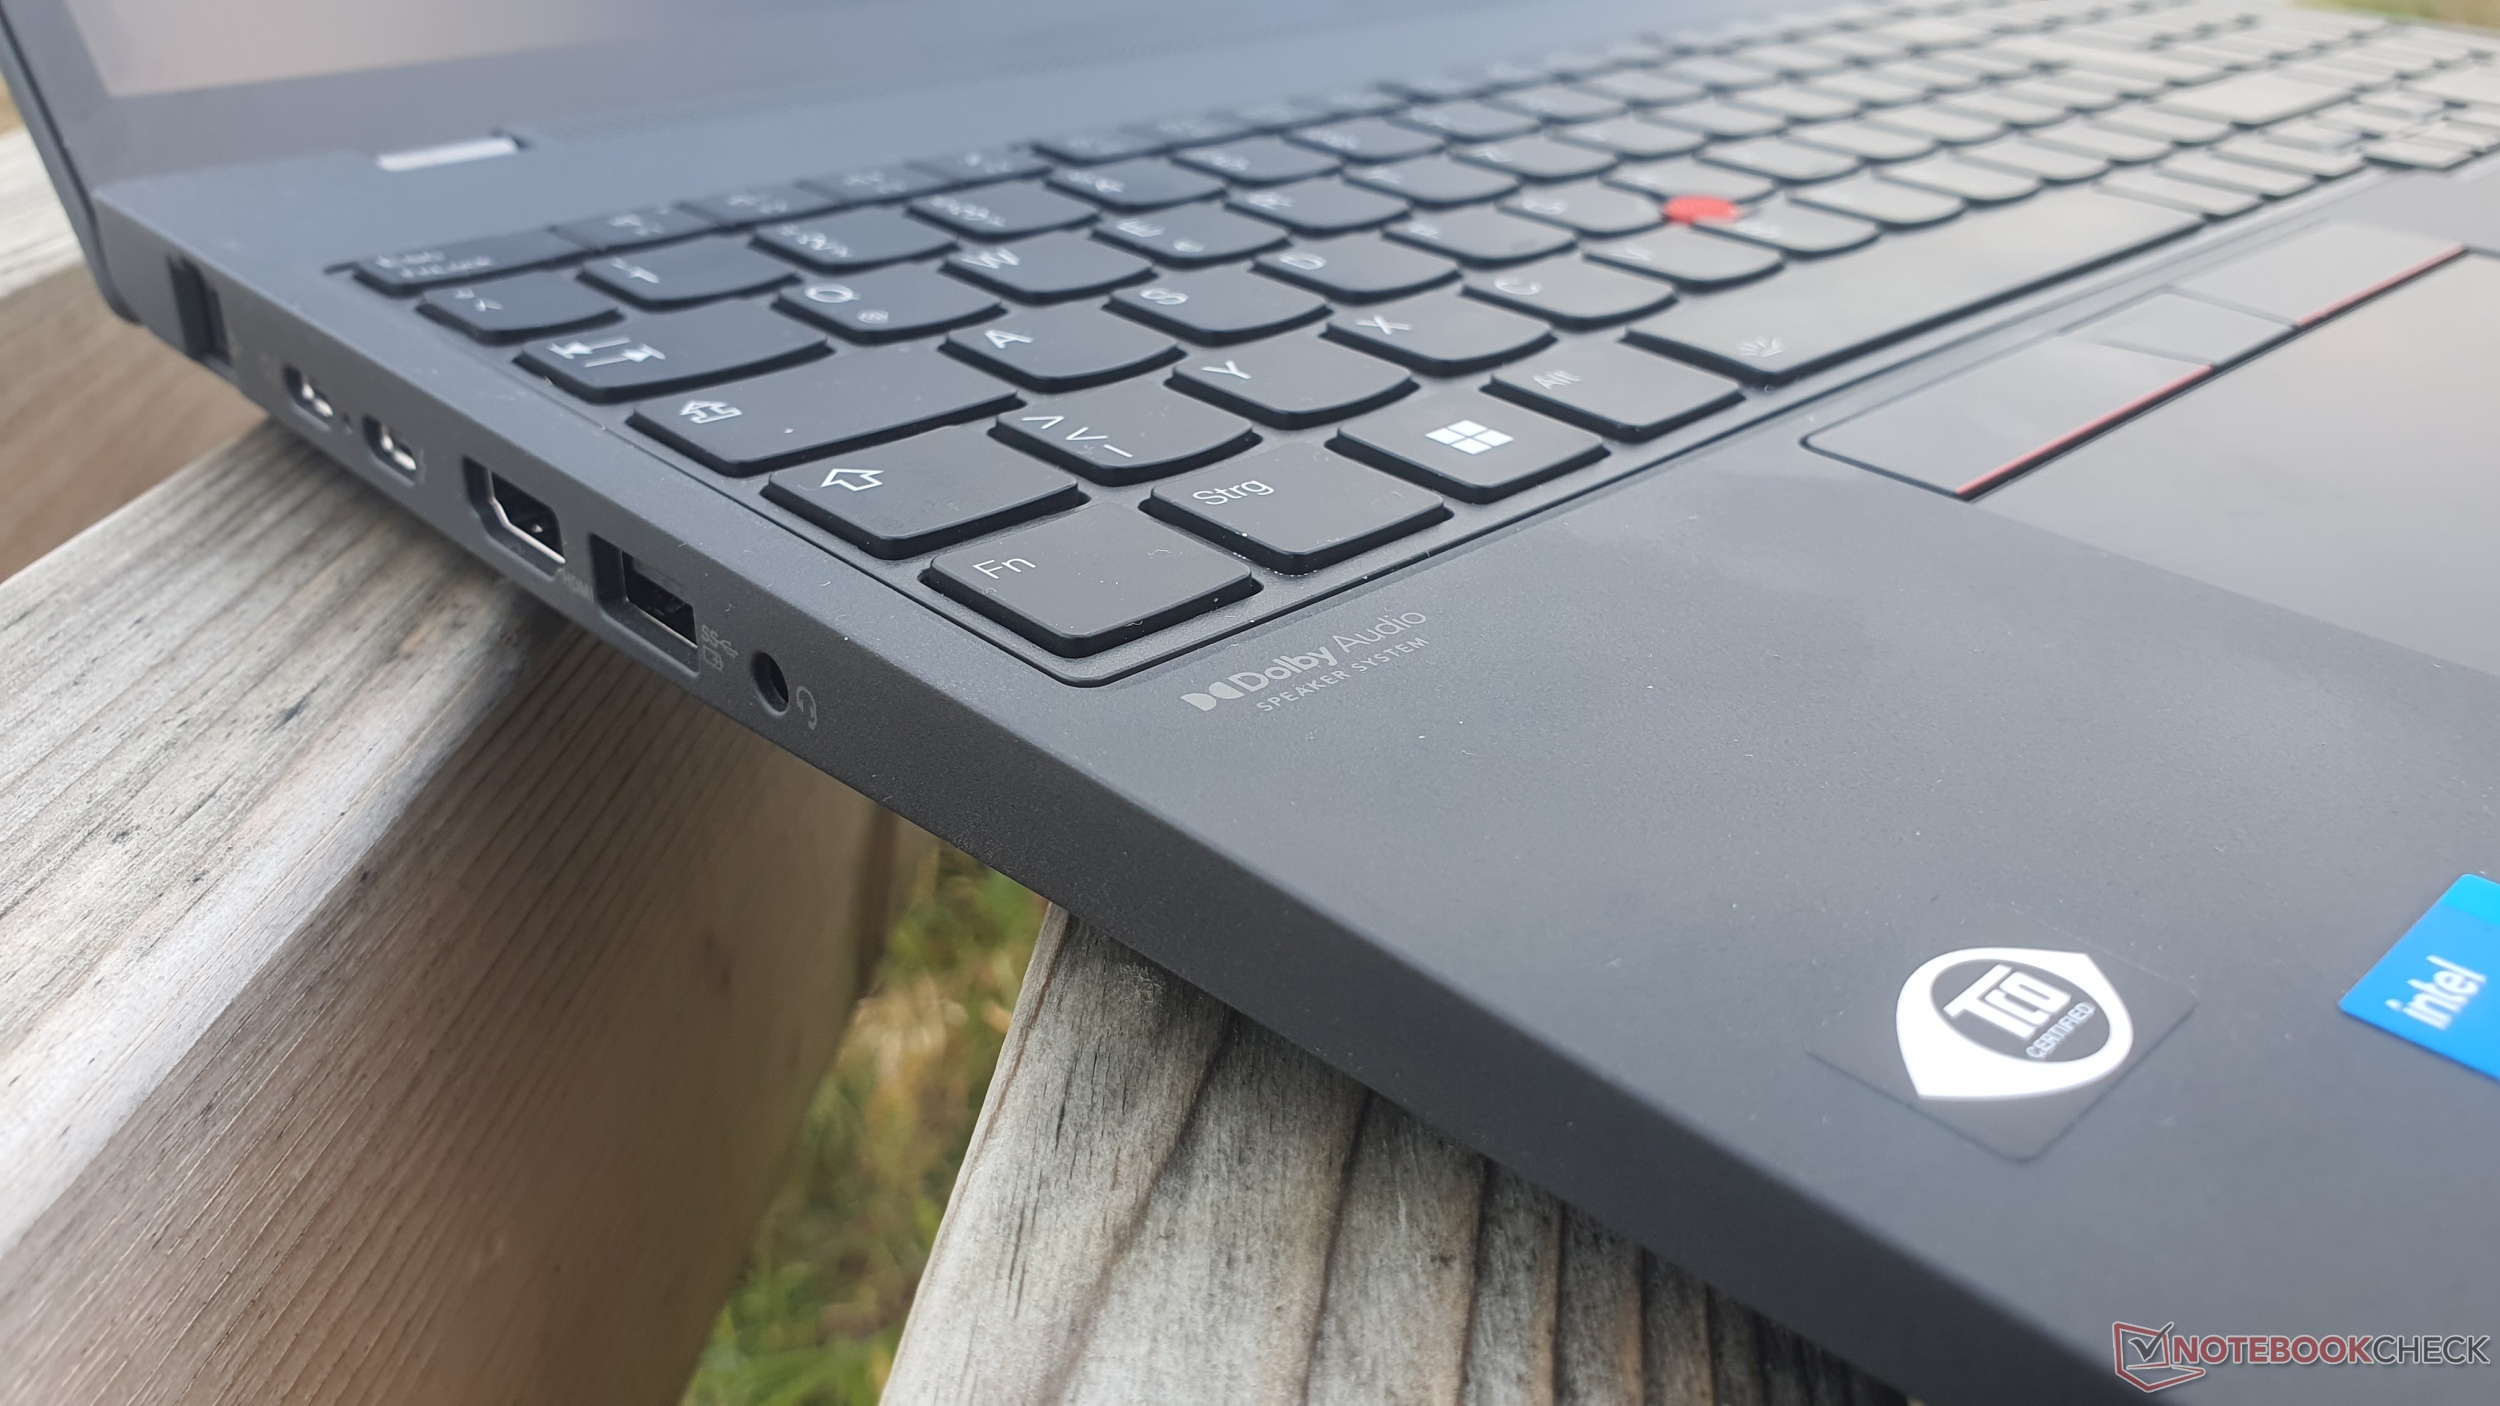
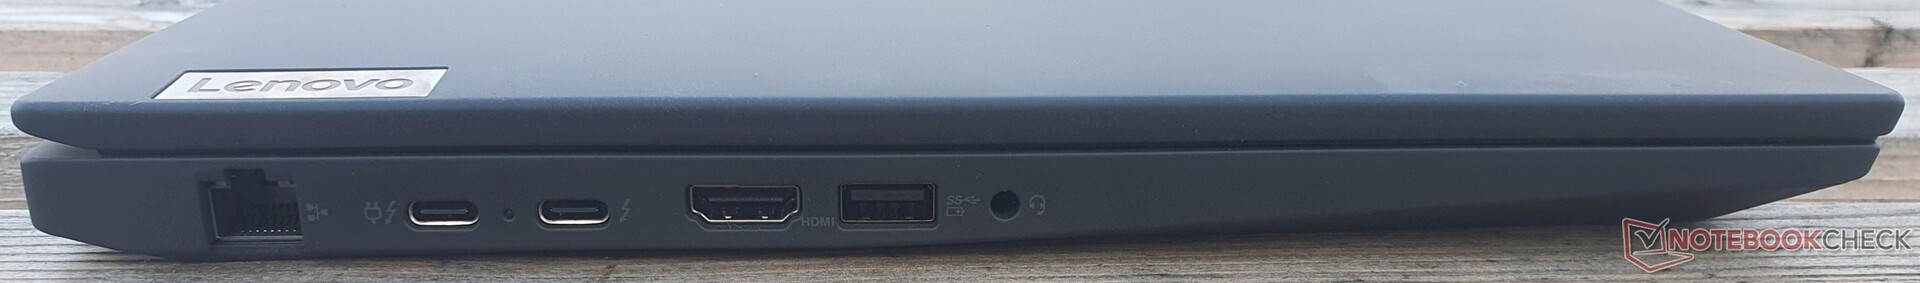
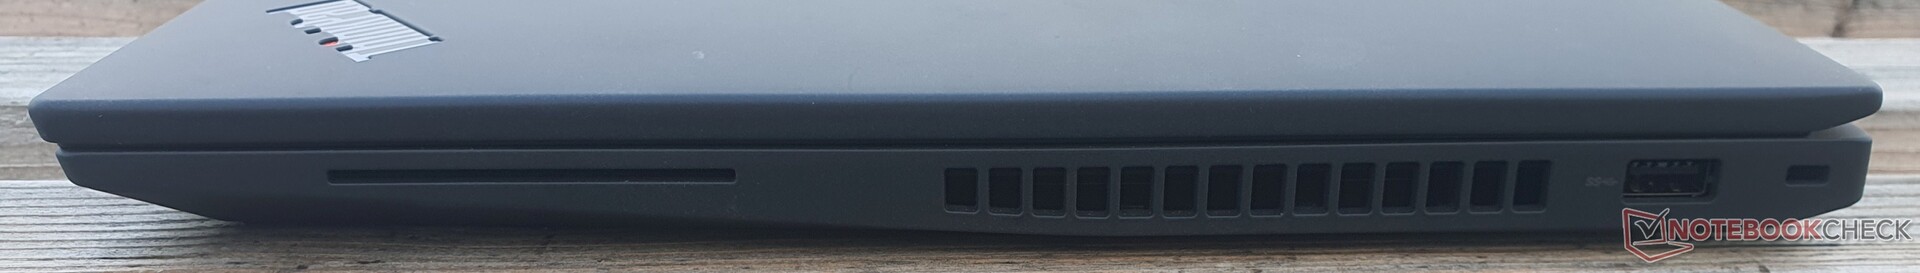
Equipement - RJ45, TB4, soudure Wi-Fi 6E et caméra 1080p
L'utilisation continue d'un port LAN GBit est agréable, mais l'omission du lecteur de carte microSD dans la série T l'est moins. Sinon, le ThinkPad offre tout ce dont vous avez besoin avec 2x USB-A 3.2 Gen 1, HDMI 2.0b et 2x Thunderbolt 4, y compris une charge de 100 watts et DisplayPort 1.4. Cela signifie qu'il est possible de connecter jusqu'à trois moniteurs supplémentaires : 2x 5K60 @TB4 + 1x 4K60 @HDMI.
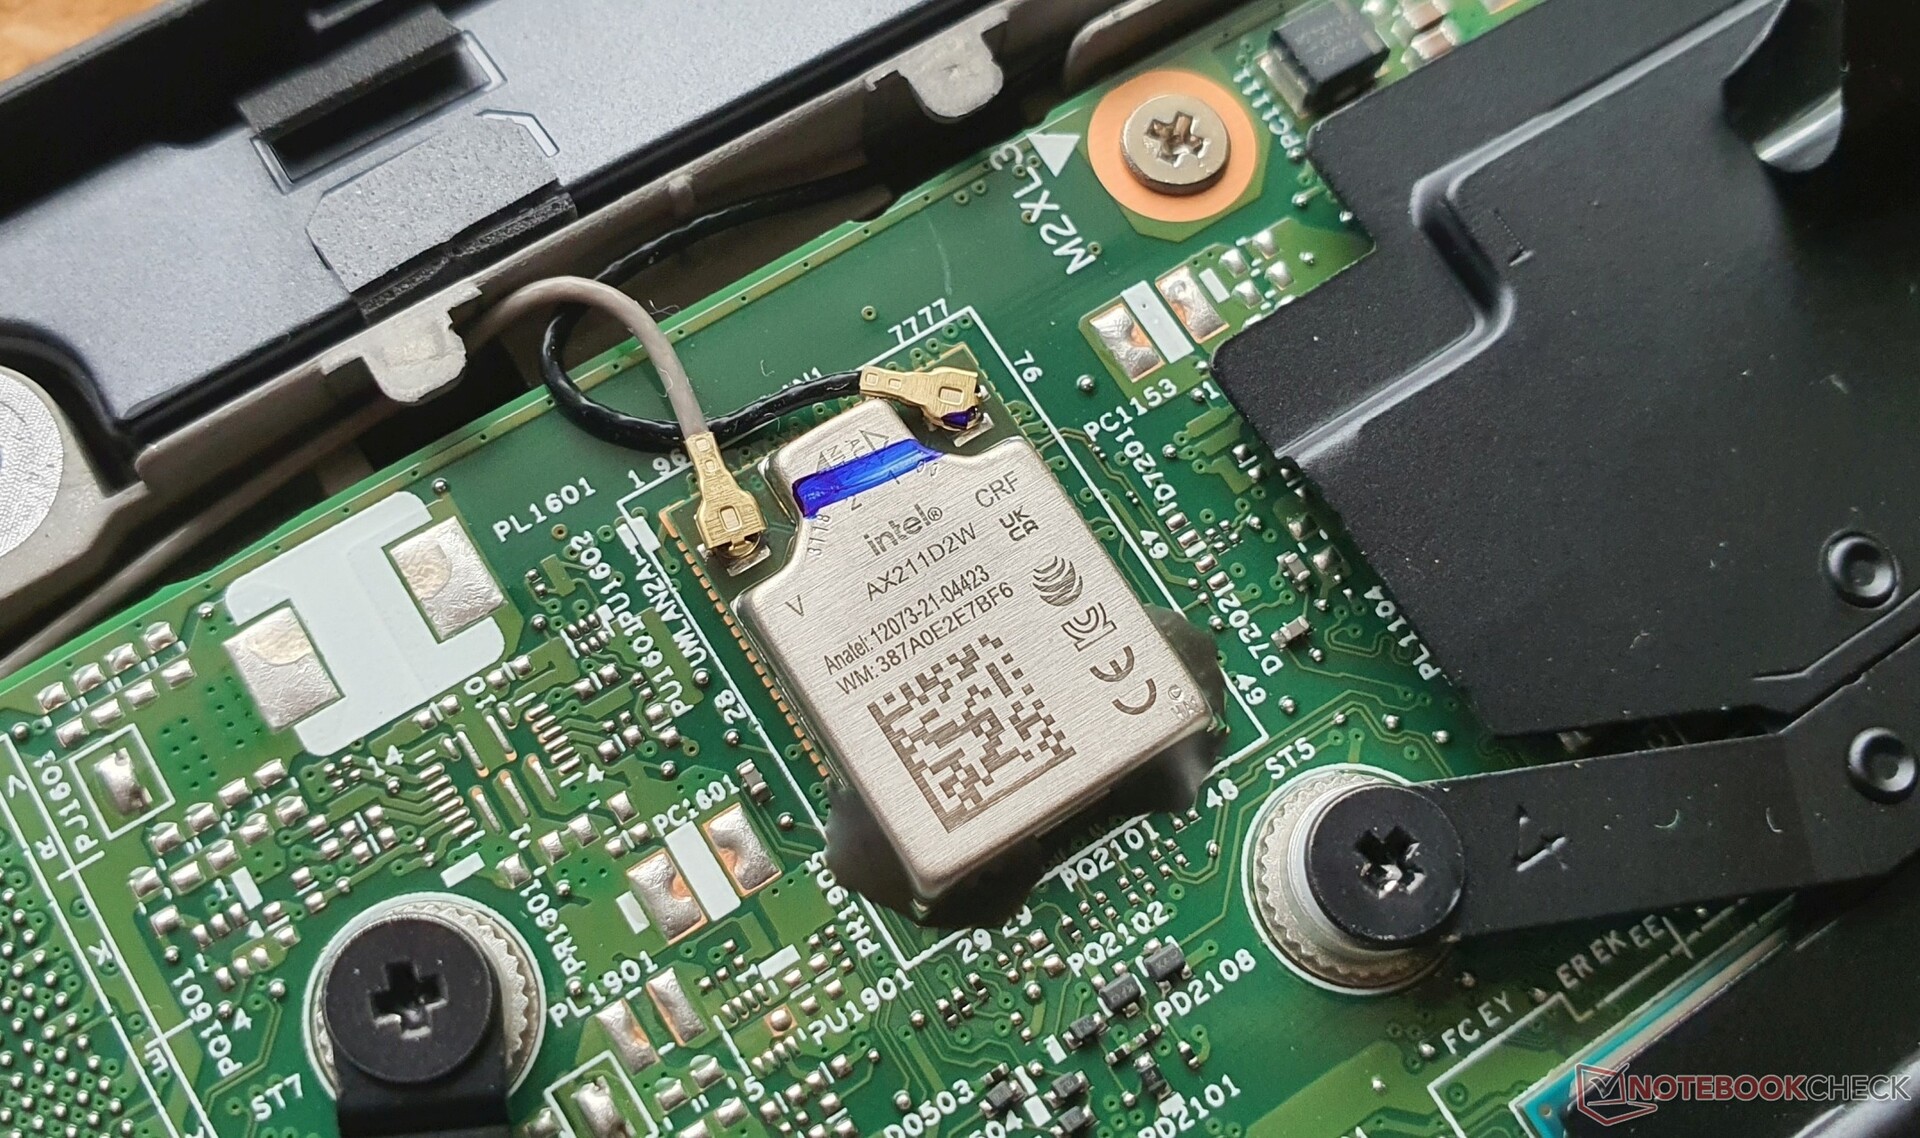
Communication
L'AX211 soudé d'Intel est responsable du Wi-Fi 6E. Nous avons enregistré des vitesses exemplaires de plus de 1,6 GBit/s dans les deux sens, de sorte que notre champ de comparaison est facilement mené par le Lenovo ThinkPad T16 G1.
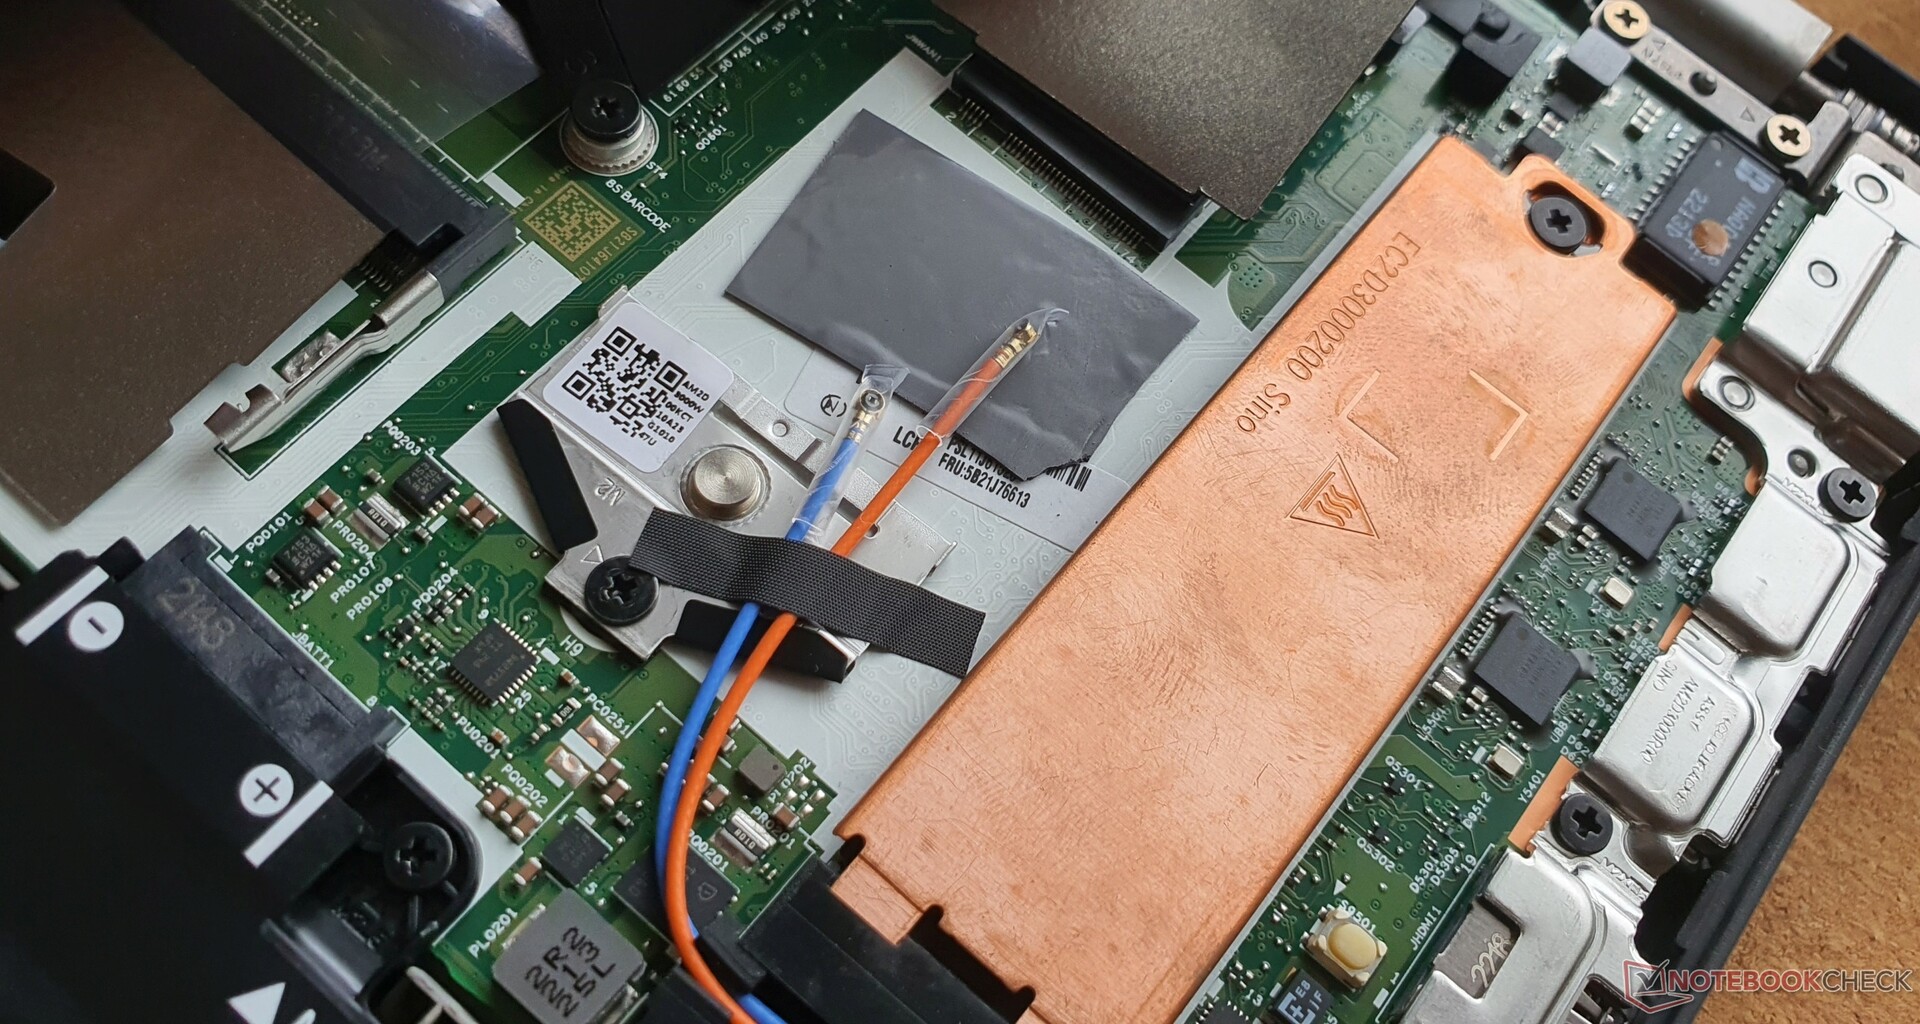
Bluetooth 5.2 et WWAN avec 4G en option sont également disponibles. Dans notre échantillon de revue, il y a un emplacement M.2 2242 libre, et les antennes peuvent être mises à niveau. Le NFC est en option.
| Networking | |
| Lenovo ThinkPad T16 G1 21BWS00200 | |
| iperf3 transmit AXE11000 6GHz | |
| iperf3 receive AXE11000 6GHz | |
| Huawei MateBook D 16 2022 | |
| iperf3 receive AXE11000 | |
| iperf3 transmit AXE11000 | |
| Lenovo ThinkPad T15 Gen2-20W5S00100 | |
| iperf3 transmit AX12 | |
| iperf3 receive AX12 | |
| HP ZBook Power 15 G8 313S5EA | |
| iperf3 transmit AX12 | |
| iperf3 receive AX12 | |
| HP ProBook 450 G9 6A180EA | |
| iperf3 transmit AXE11000 6GHz | |
| iperf3 receive AXE11000 6GHz | |
| Lenovo ThinkPad X1 Extreme G4-20Y5CTO1WW (3050 Ti) | |
| iperf3 transmit AX12 | |
| iperf3 receive AX12 | |
| Dell Inspiron 16 Plus 7620 | |
| iperf3 transmit AXE11000 6GHz | |
| iperf3 receive AXE11000 6GHz | |
| Lenovo ThinkPad E15 G3-20YG003UGE | |
| iperf3 transmit AX12 | |
| iperf3 receive AX12 | |
| Lenovo ThinkPad L15 G2 AMD | |
| iperf3 transmit AX12 | |
| iperf3 receive AX12 | |
Webcam
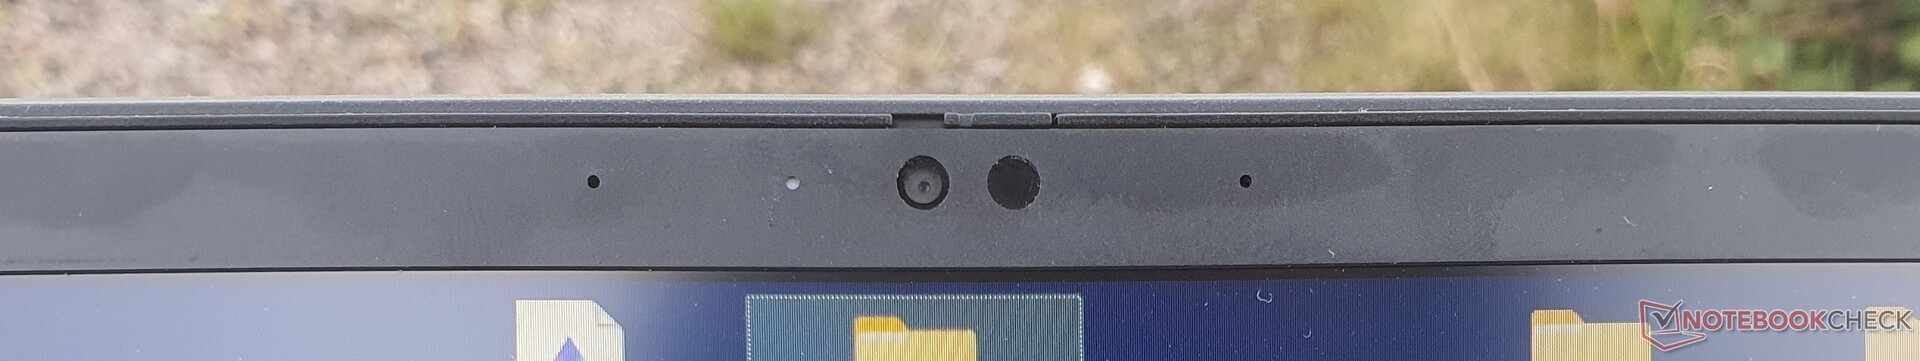
La webcam 1080p reste peu impressionnante, mais elle est beaucoup moins bruyante et délavée. En outre, on retrouve deux microphones à double réseau avec une bonne qualité d'enregistrement ainsi que l'IR pour Windows Hello.


Sécurité
Pour la sécurité, Lenovo propose un lecteur de cartes à puce en option, l'IR pour Windows Hello et une ouverture physique de la caméra dans le ThinkPad T16 Gen. 1. Parmi les autres fonctions de sécurité, citons le TPM 2.0, le verrou Kensington et le scanner d'empreintes digitales en option. Les logiciels Human Presence Detection et Mirametrix Glance sont utilisés pour le logiciel.
Accessoires
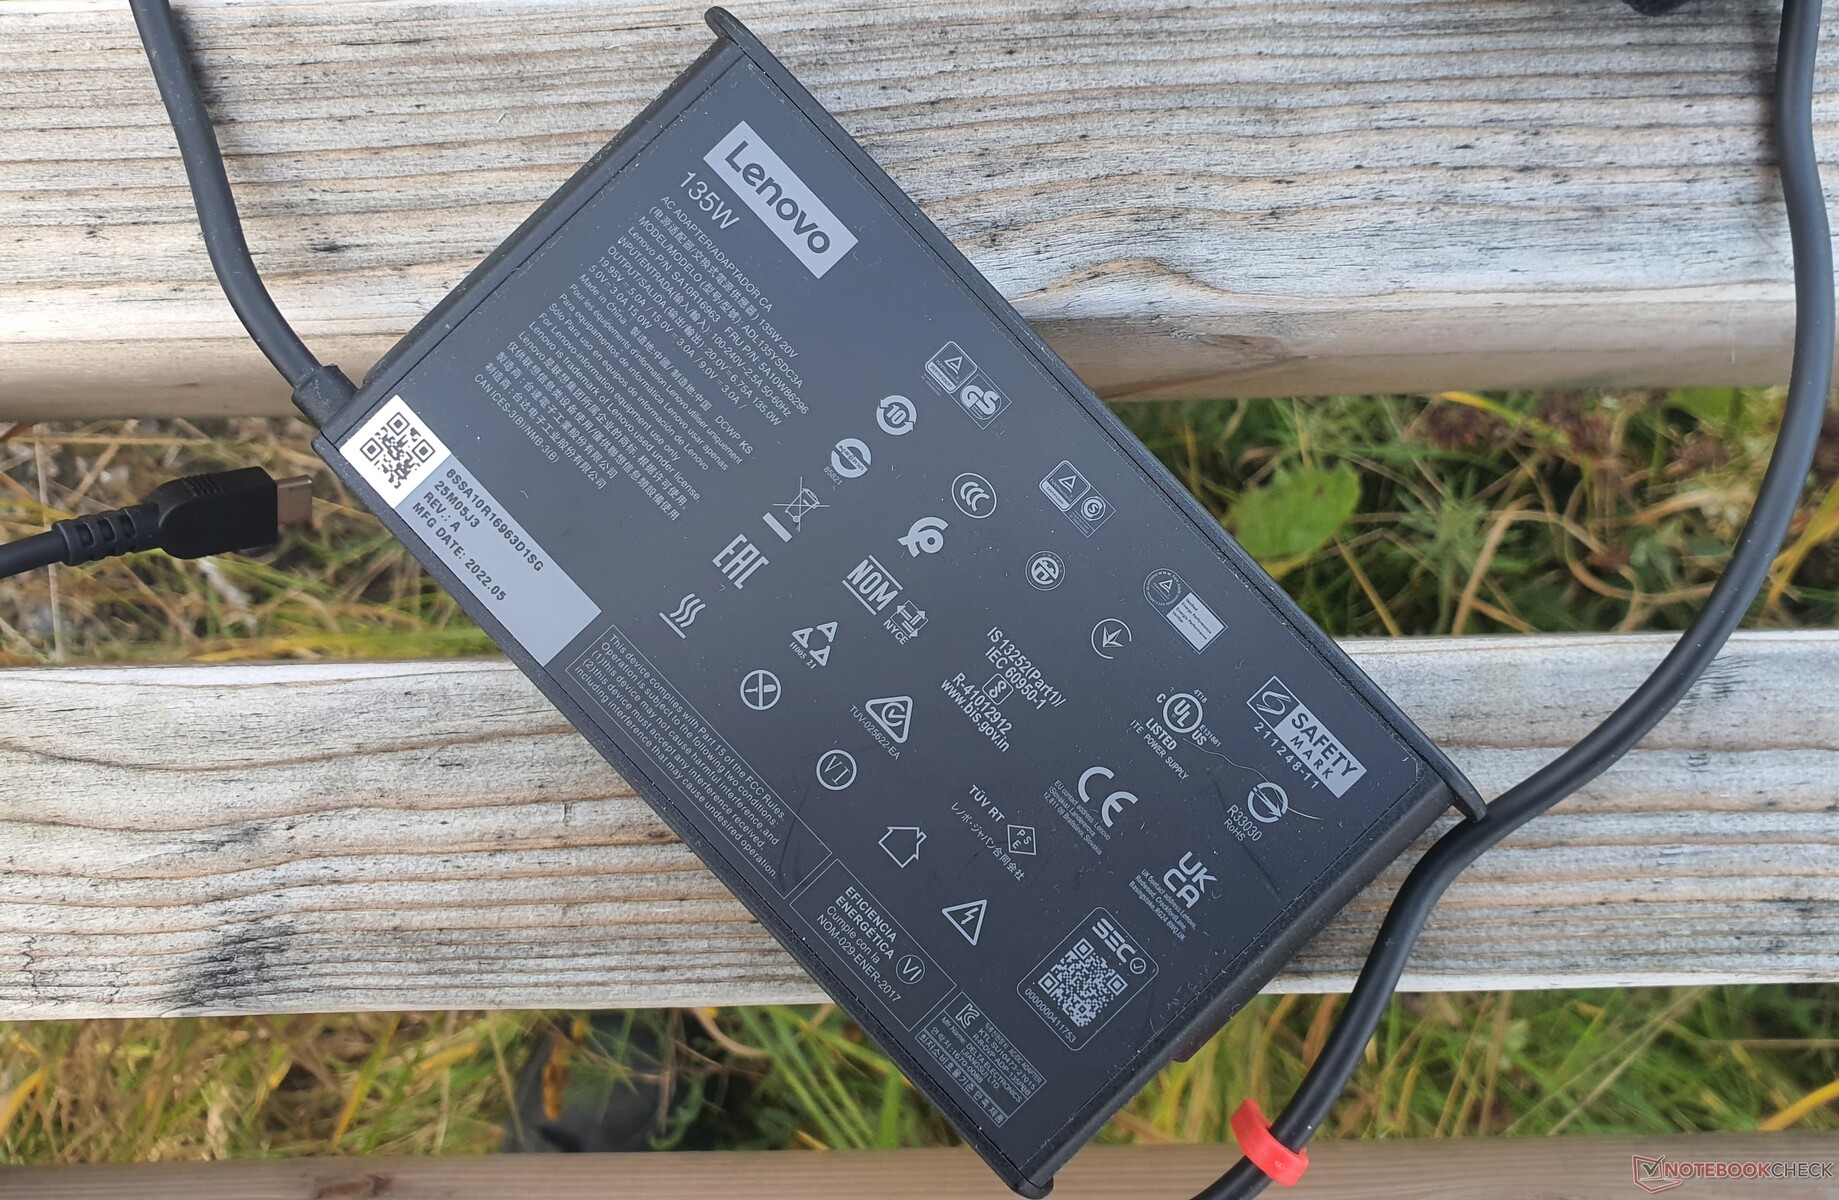
Il n'y a pas de port d'accueil, mais les stations d'accueil USB-C peuvent être utilisées. L'étendue de la livraison comprend uniquement un chargeur USB-C Slim de 135 watts. Les modèles équipés de processeurs de la série U doivent se contenter de 65 watts. D'autre part, l'utilisation de votre propre chargeur de 45 watts est également possible. L'emballage est recyclé à 90 % ou fabriqué à partir de bois durable.
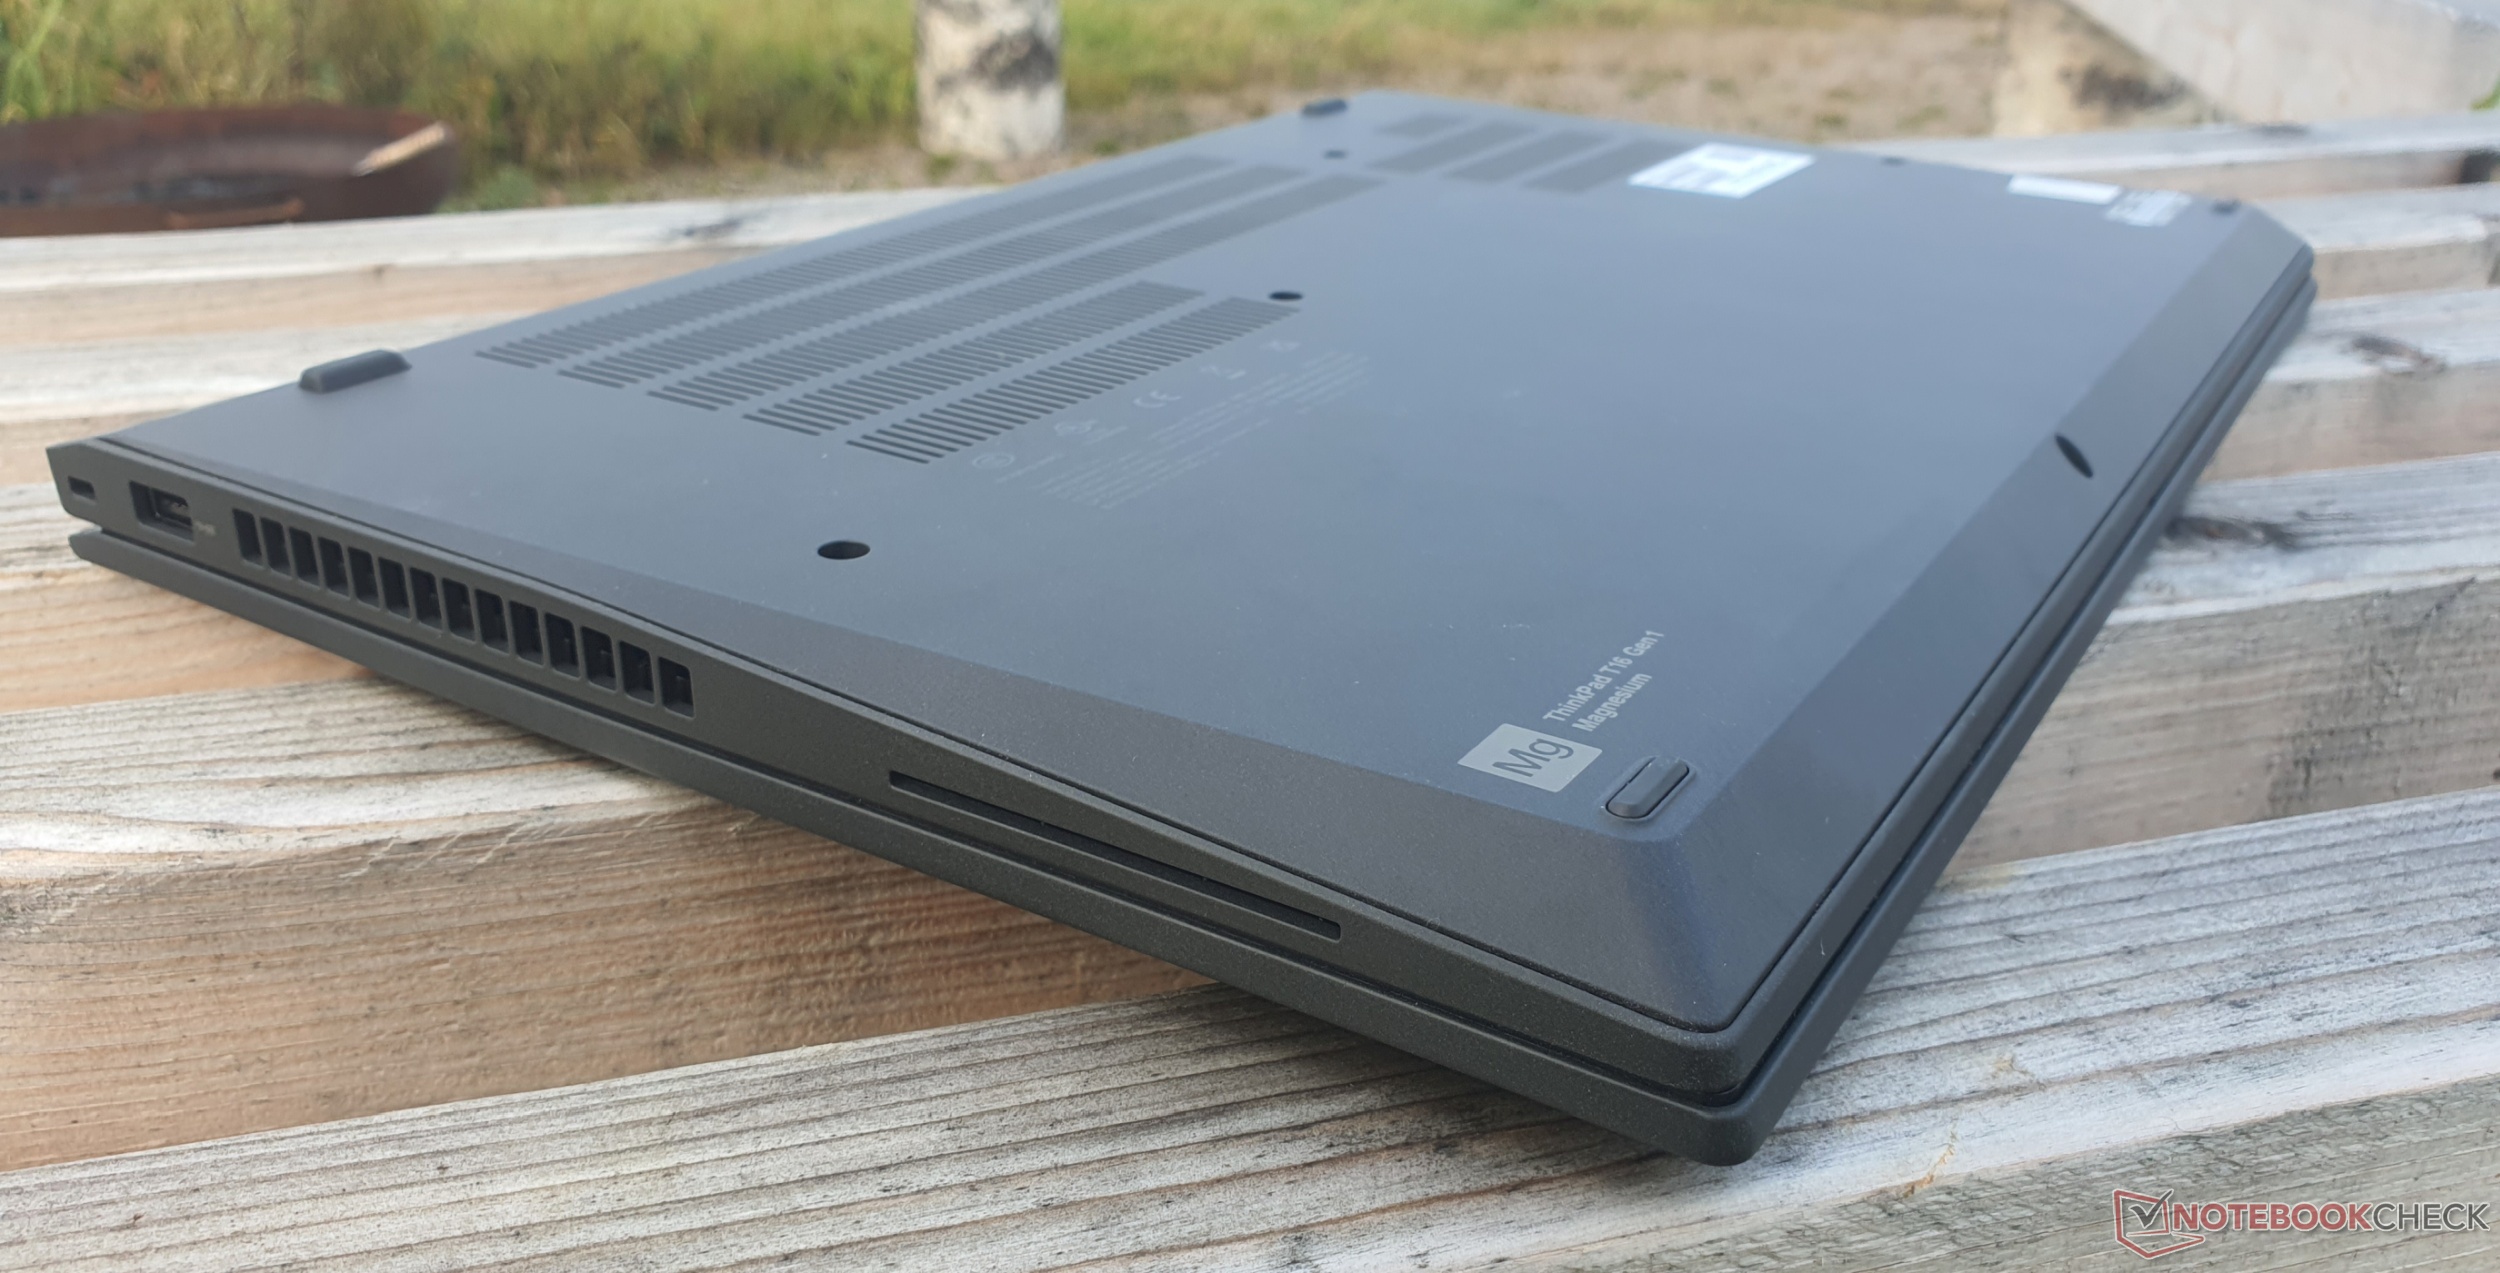
Maintenance
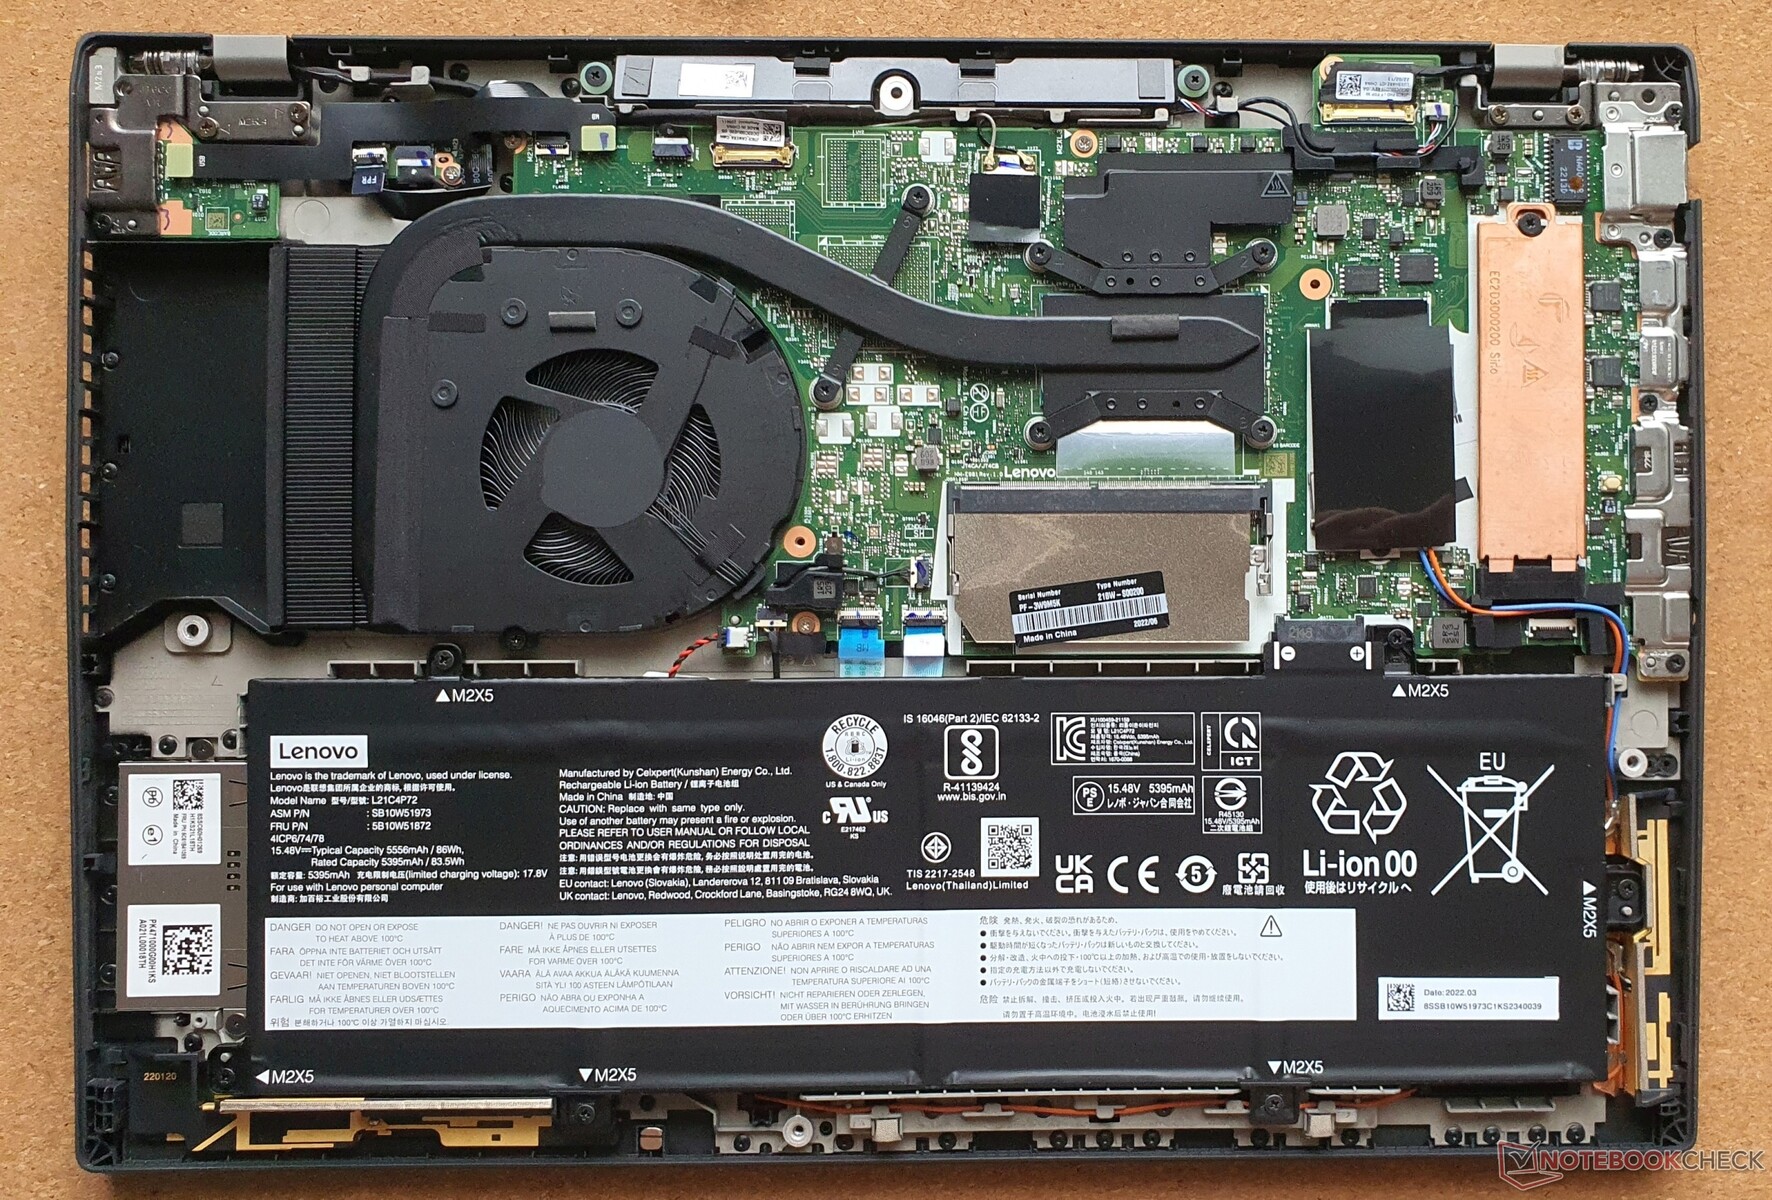
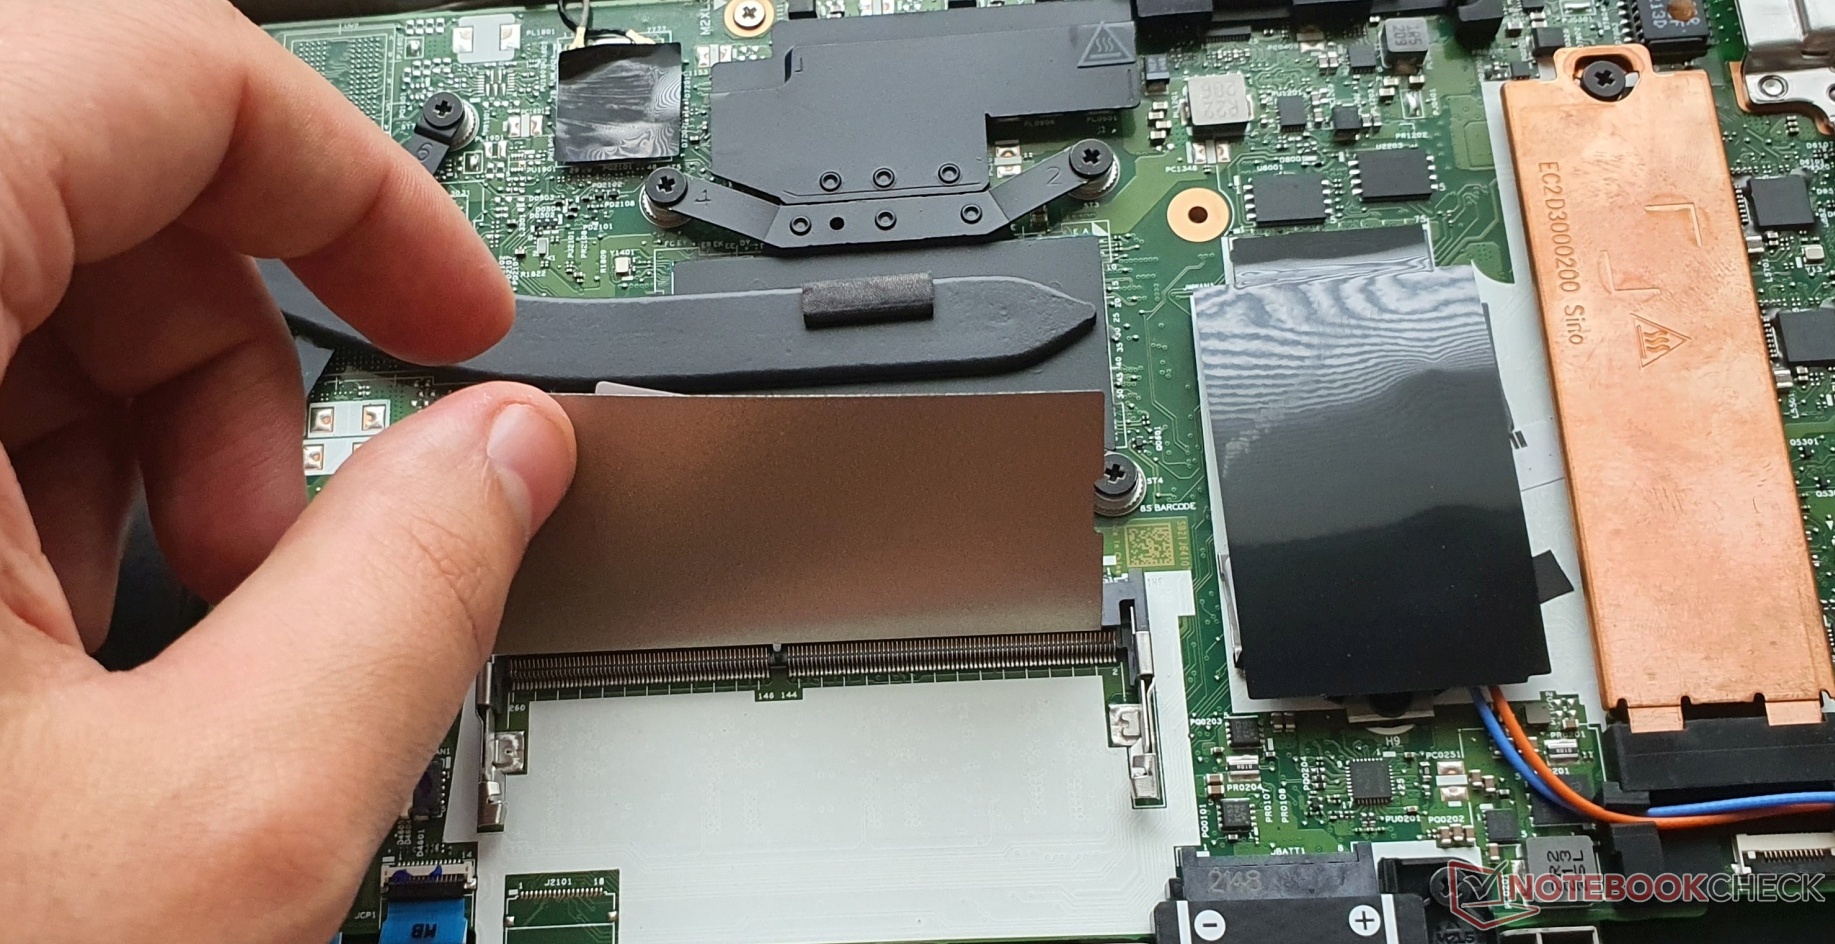
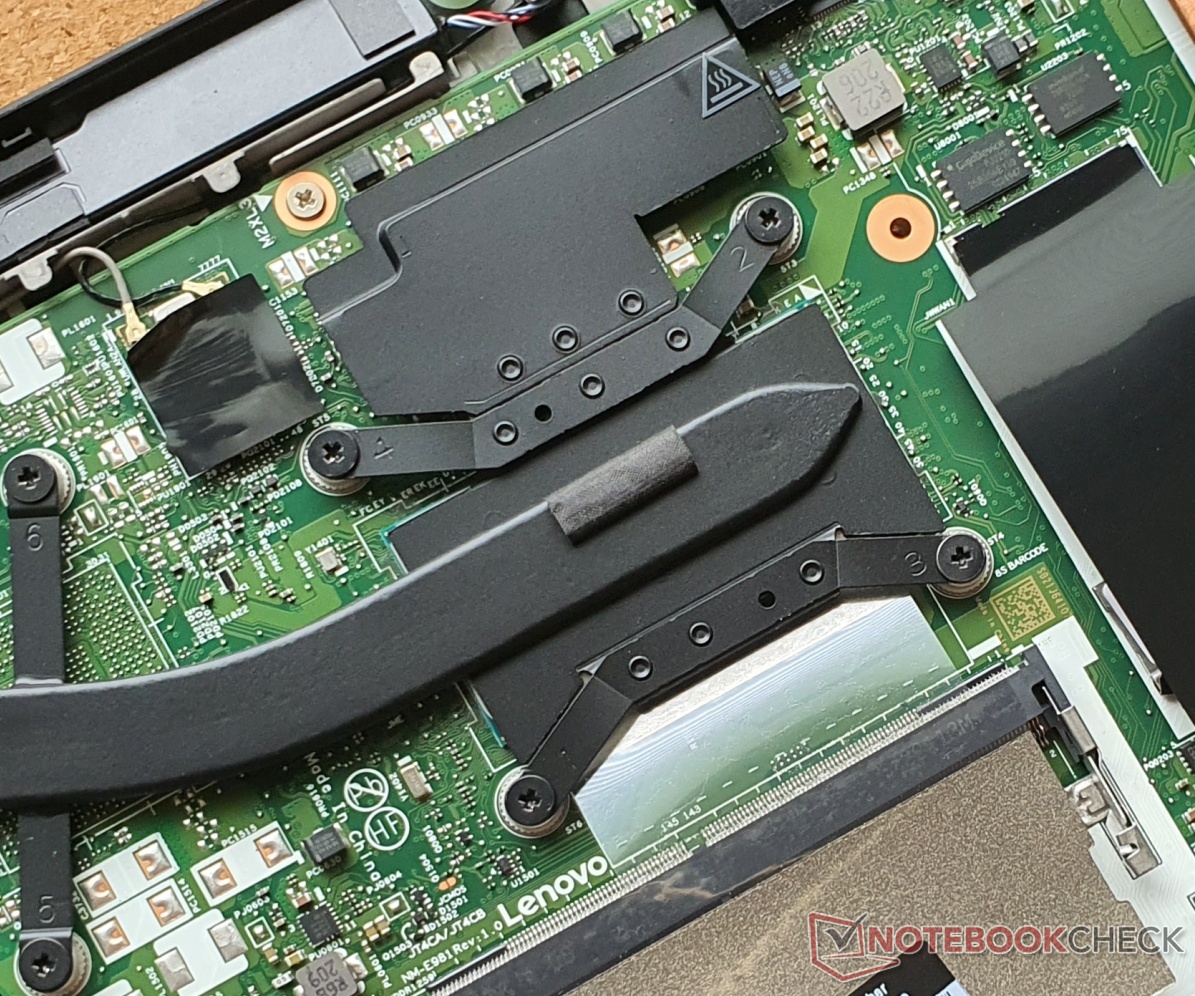
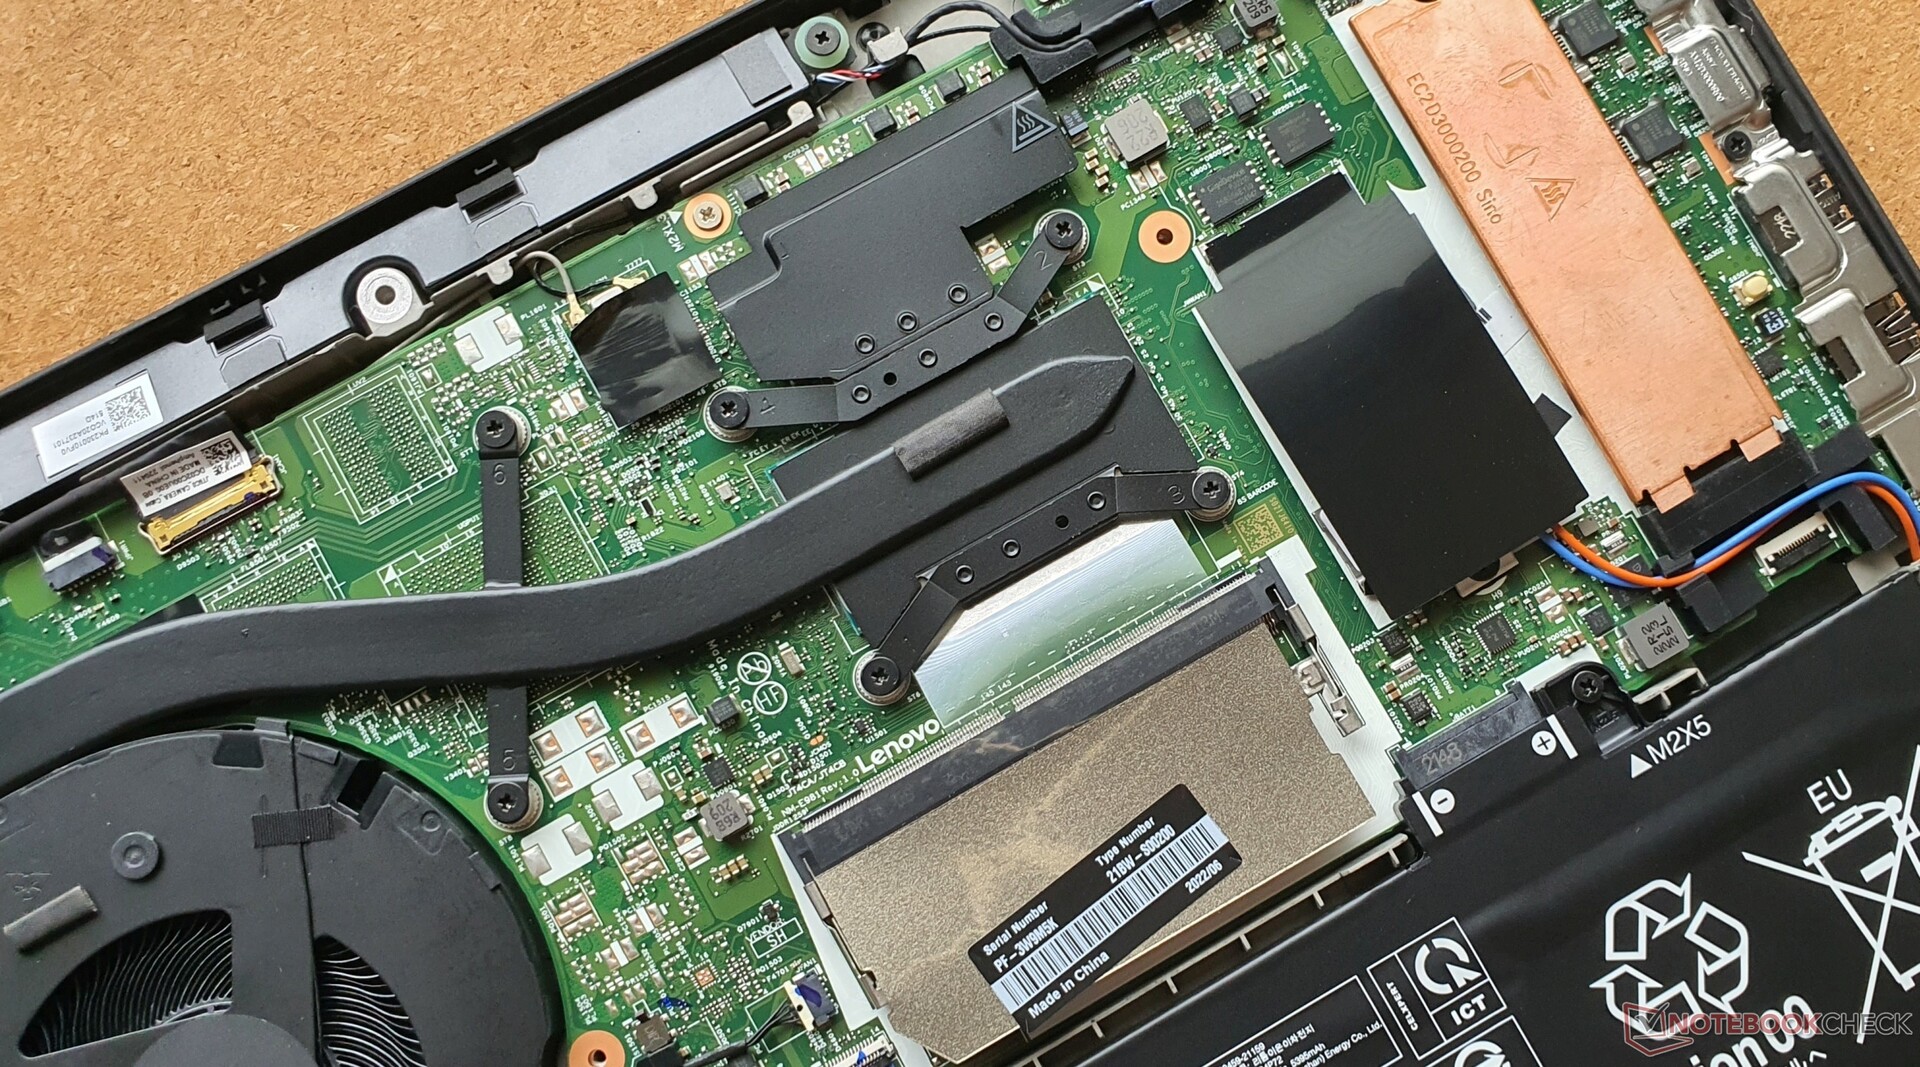
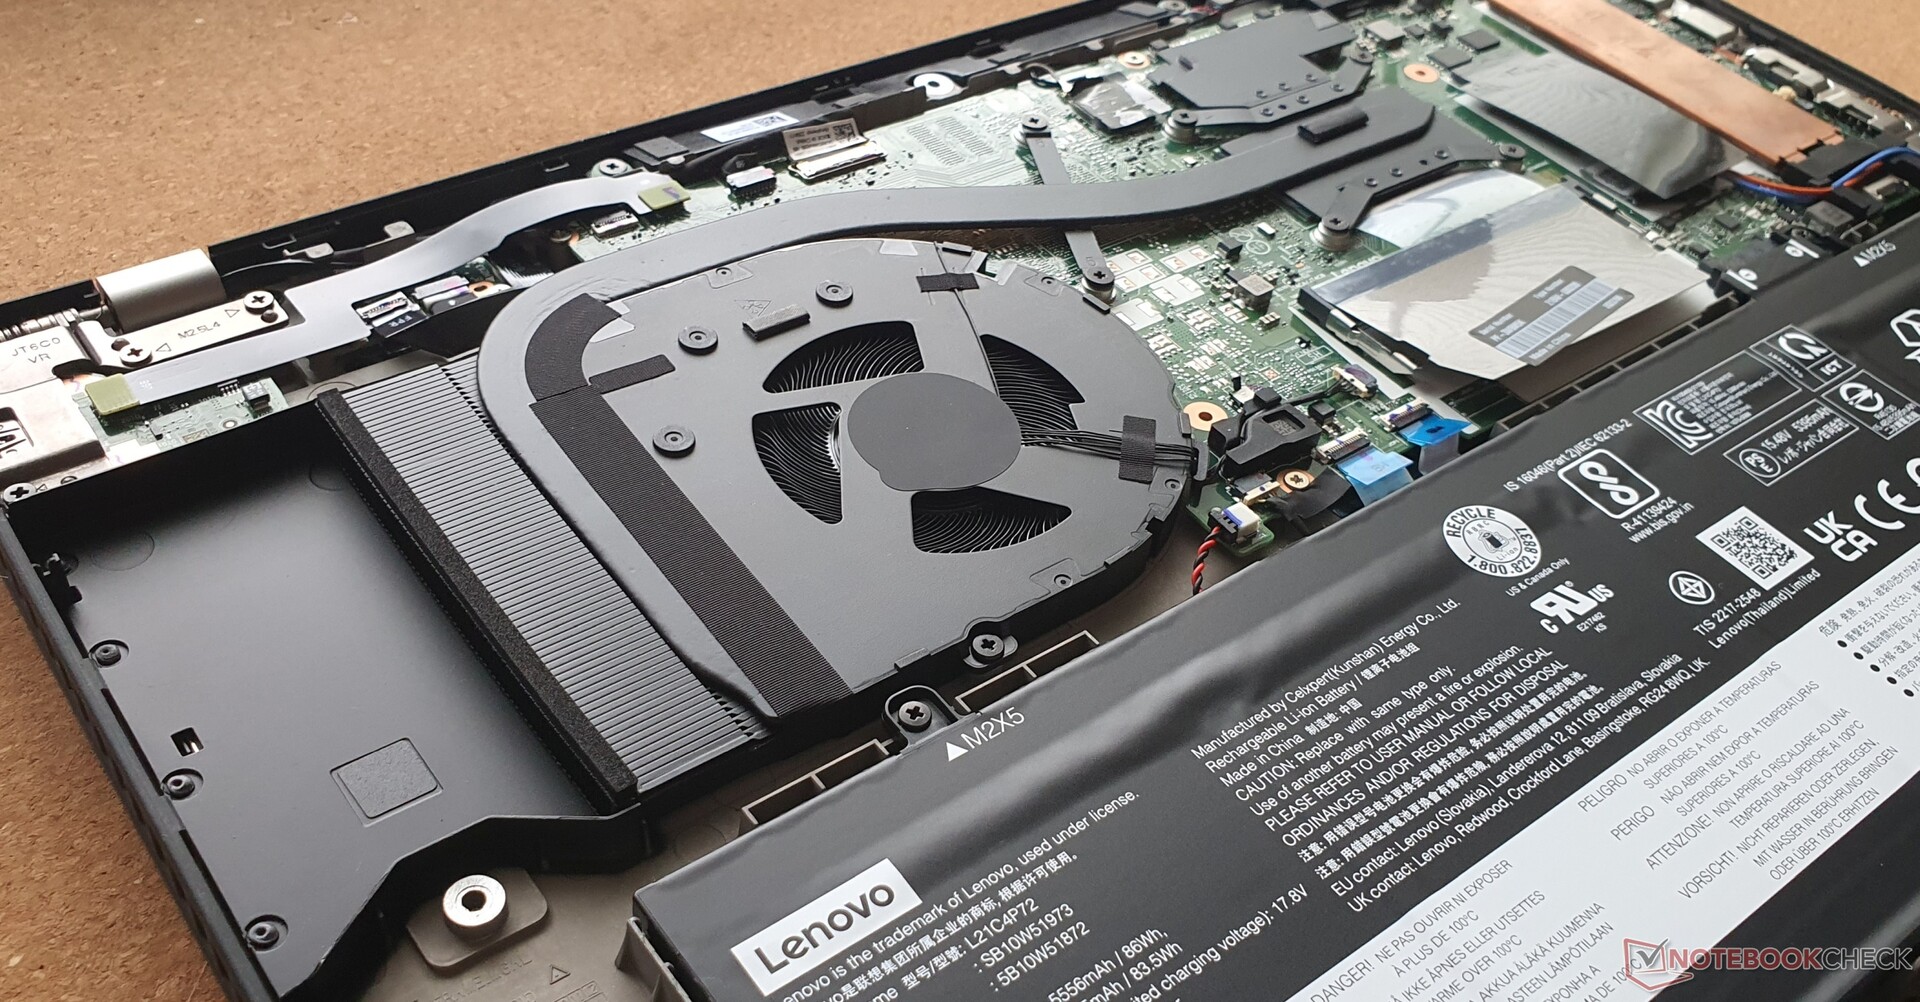
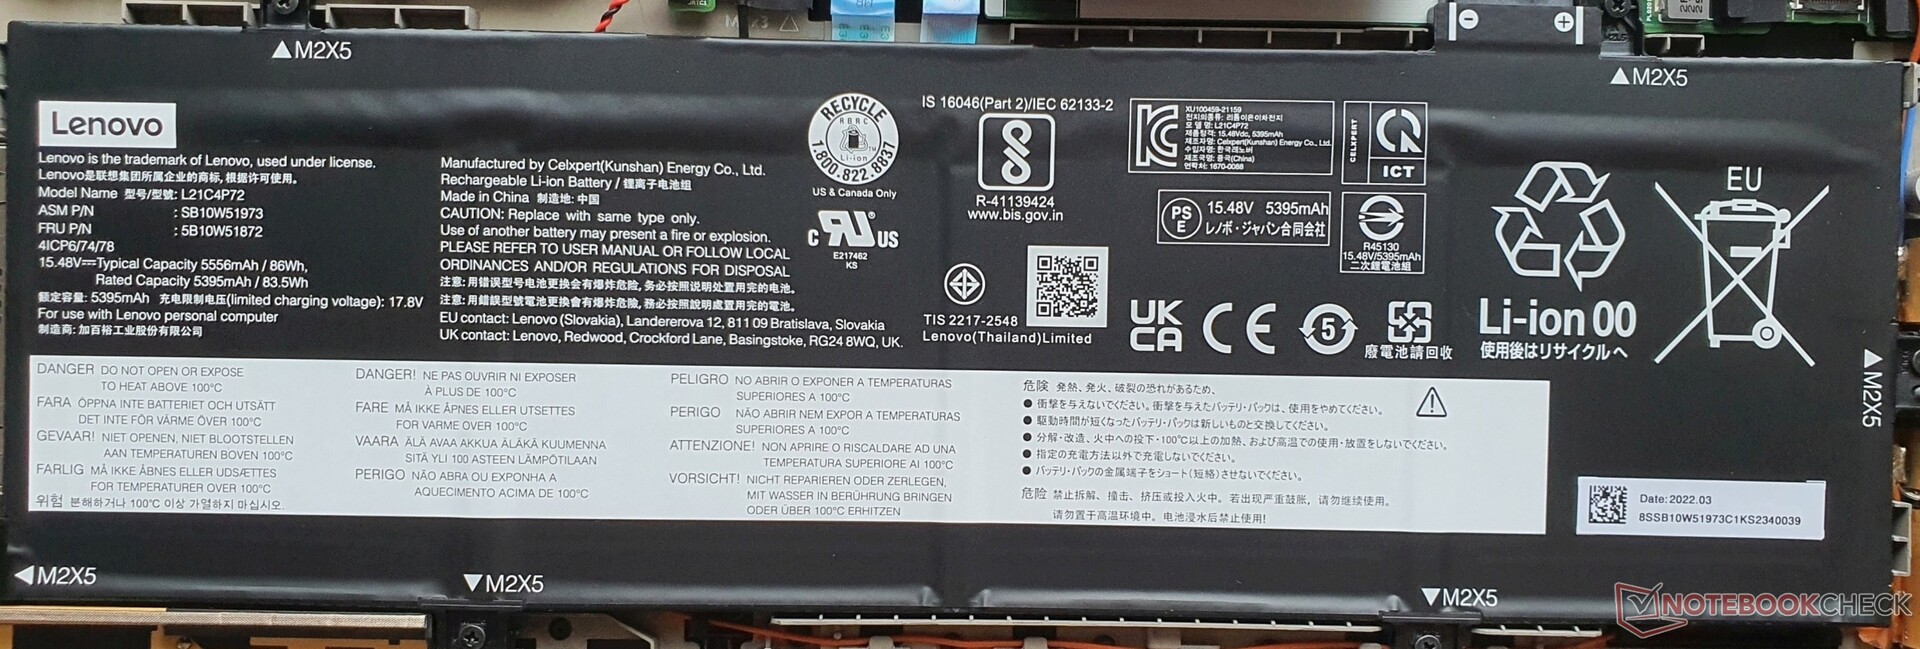
Avant d'ouvrir l'appareil, vous devez désactiver la batterie interne dans le BIOS. Après avoir desserré 8 vis Phillips, vous devez encore desserrer quelques loquets avec un tournevis. Ensuite, vous avez accès au M.2-2280-SSD (PCIe 4.0) inséré, à un emplacement RAM (libre), à un emplacement WWAN, à la batterie vissée de 86 Wh et au système de refroidissement, qui peut être nettoyé.
L'insertion d'un SSD dans l'emplacement WWAN n'est pas possible.

Garantie
En Allemagne, Lenovo offre une garantie de 3 ans (1 an pour la batterie). Notre modèle est livré avec Premier Support, qui comprend un service sur site. Cependant, le standard est un service de messagerie ou de portage. Une extension jusqu'à 5 ans est possible : 223 Euros (~US$ 223) pour la première et 521 Euros (~US$ 521) pour deux années supplémentaires.
Ces conditions de garantie pouvant différer dans d'autres pays, veillez à vous renseigner auprès de votre fournisseur avant d'acheter.
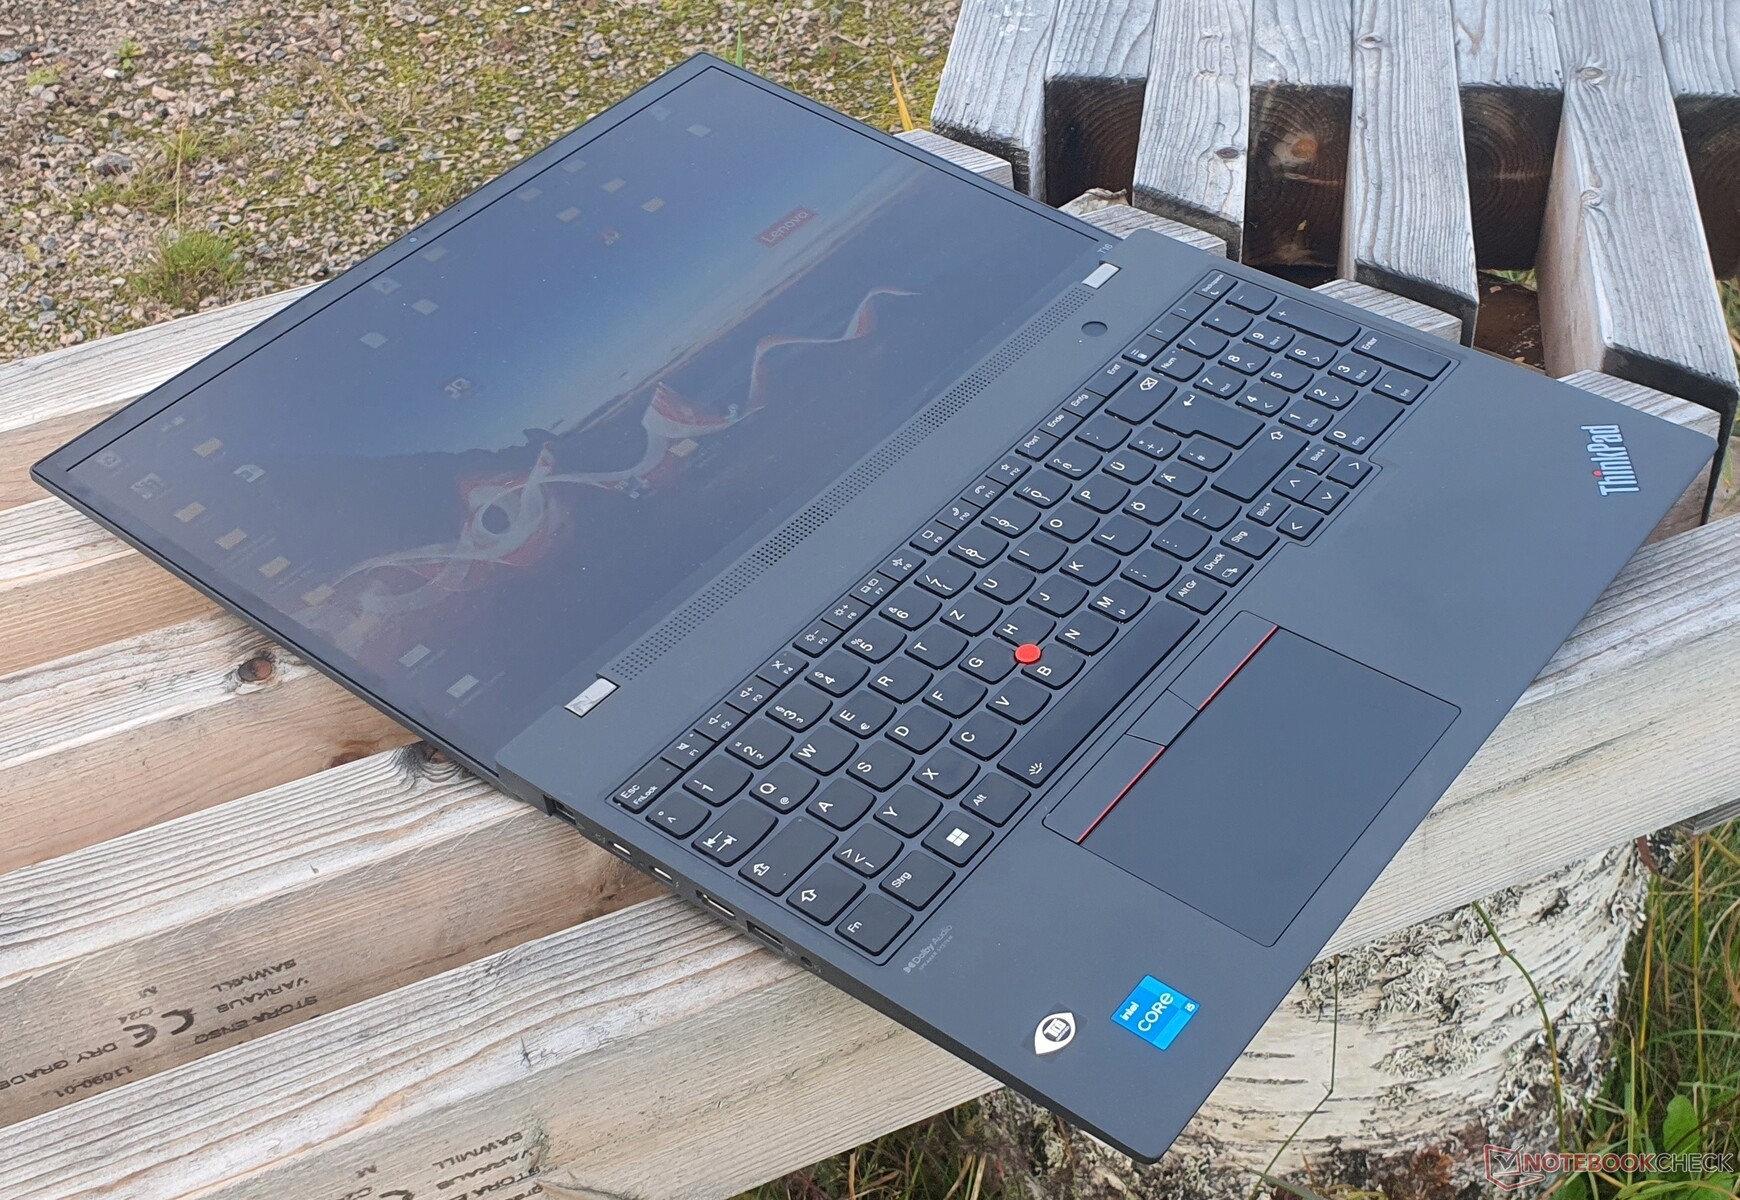
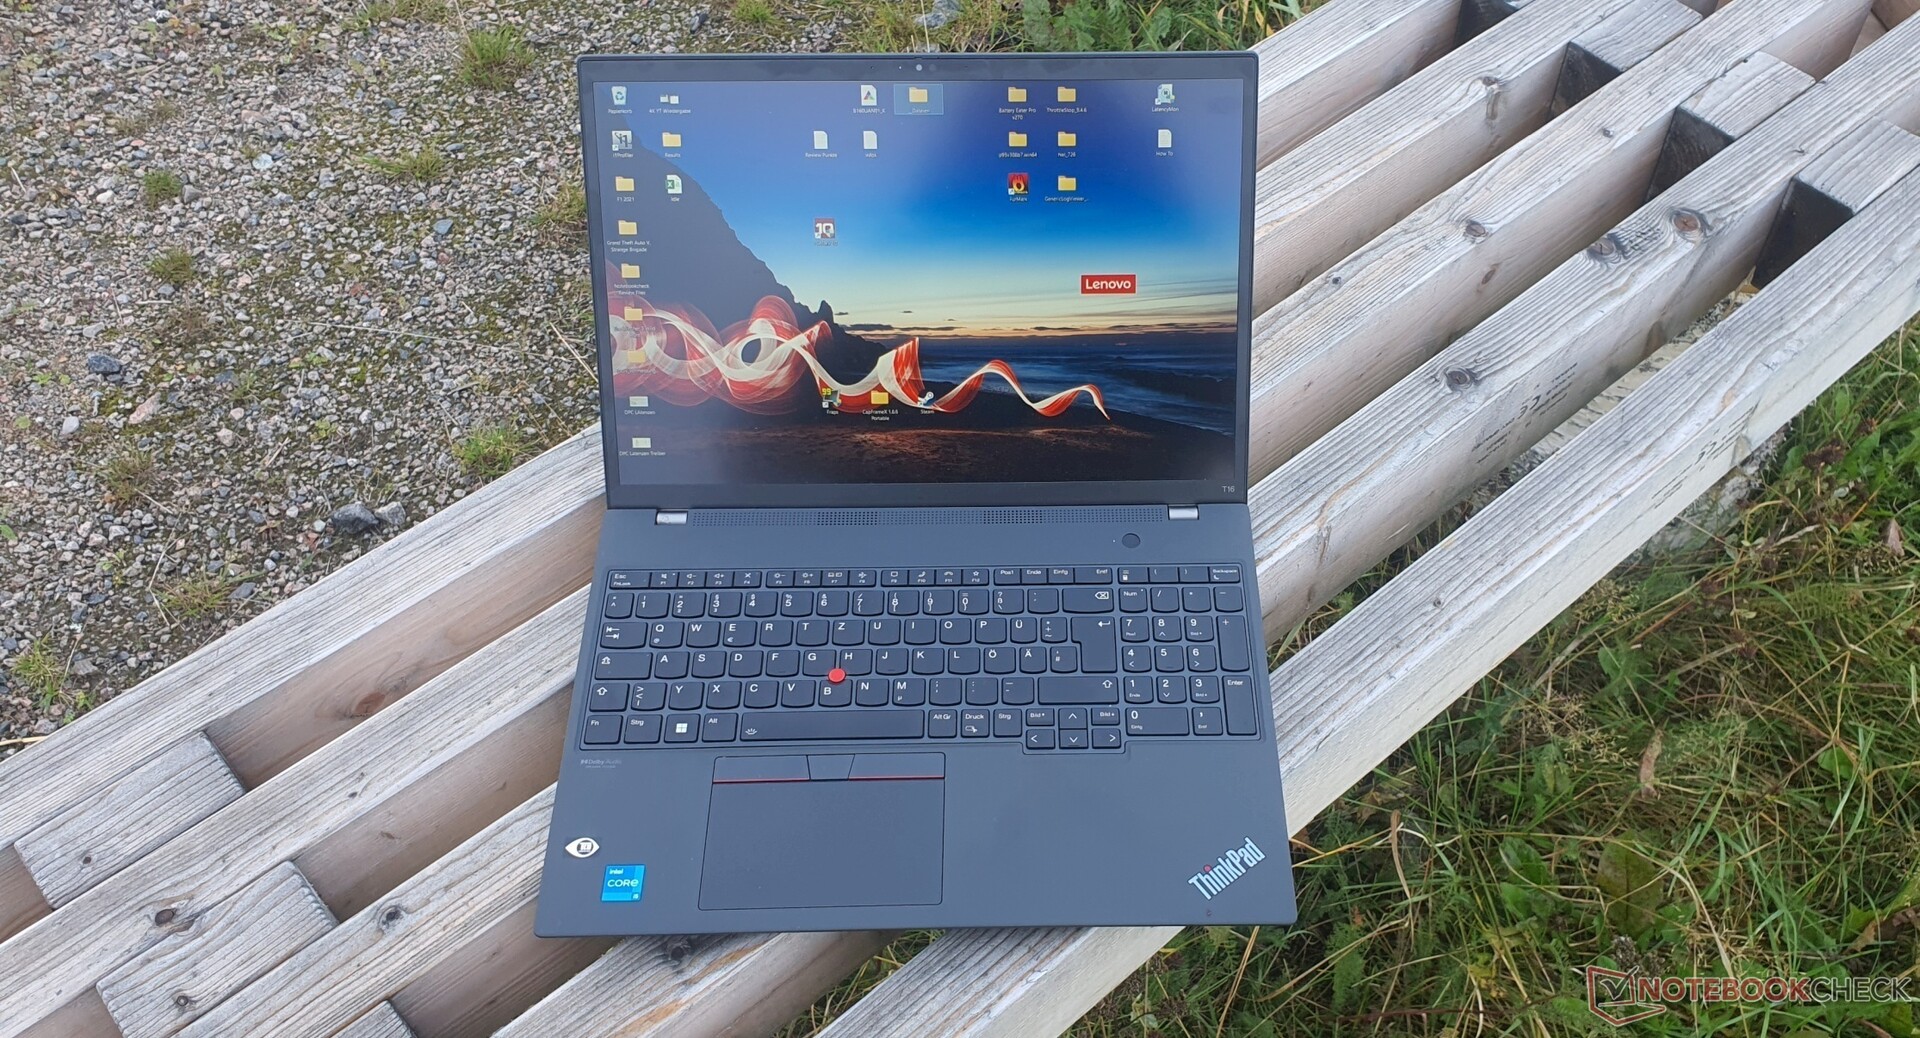
Dispositifs d'entrée - Course de 1,5 mm avec clavier ThinkPad remplaçable
Clavier

Le clavier chiclet à 6 rangées, résistant aux éclaboussures, est doté de touches de 16x16 mm. La rangée inférieure et les touches de déplacement sont désormais carrées. La taille de certaines touches a été réduite, comme le pavé numérique et les touches fléchées, mais pas de moitié (comme sur certains autres modèles). Toutes les touches importantes sont également dédiées.
La course des touches, qui a été réduite à 1,5 mm, a fait son apparition cette année dans la série T sans le s-suffixe. Le point de pression étant très concis et la résistance des touches bien implémentée, cela garantit une frappe plus rapide, plus précise et également plus silencieuse que presque tous les autres claviers. En outre, le clavier peut être remplacé en cas d'usure ou de dommage. La base du clavier ne cède que très peu sous une pression ciblée, ce qui n'est pas le cas lors de la frappe.
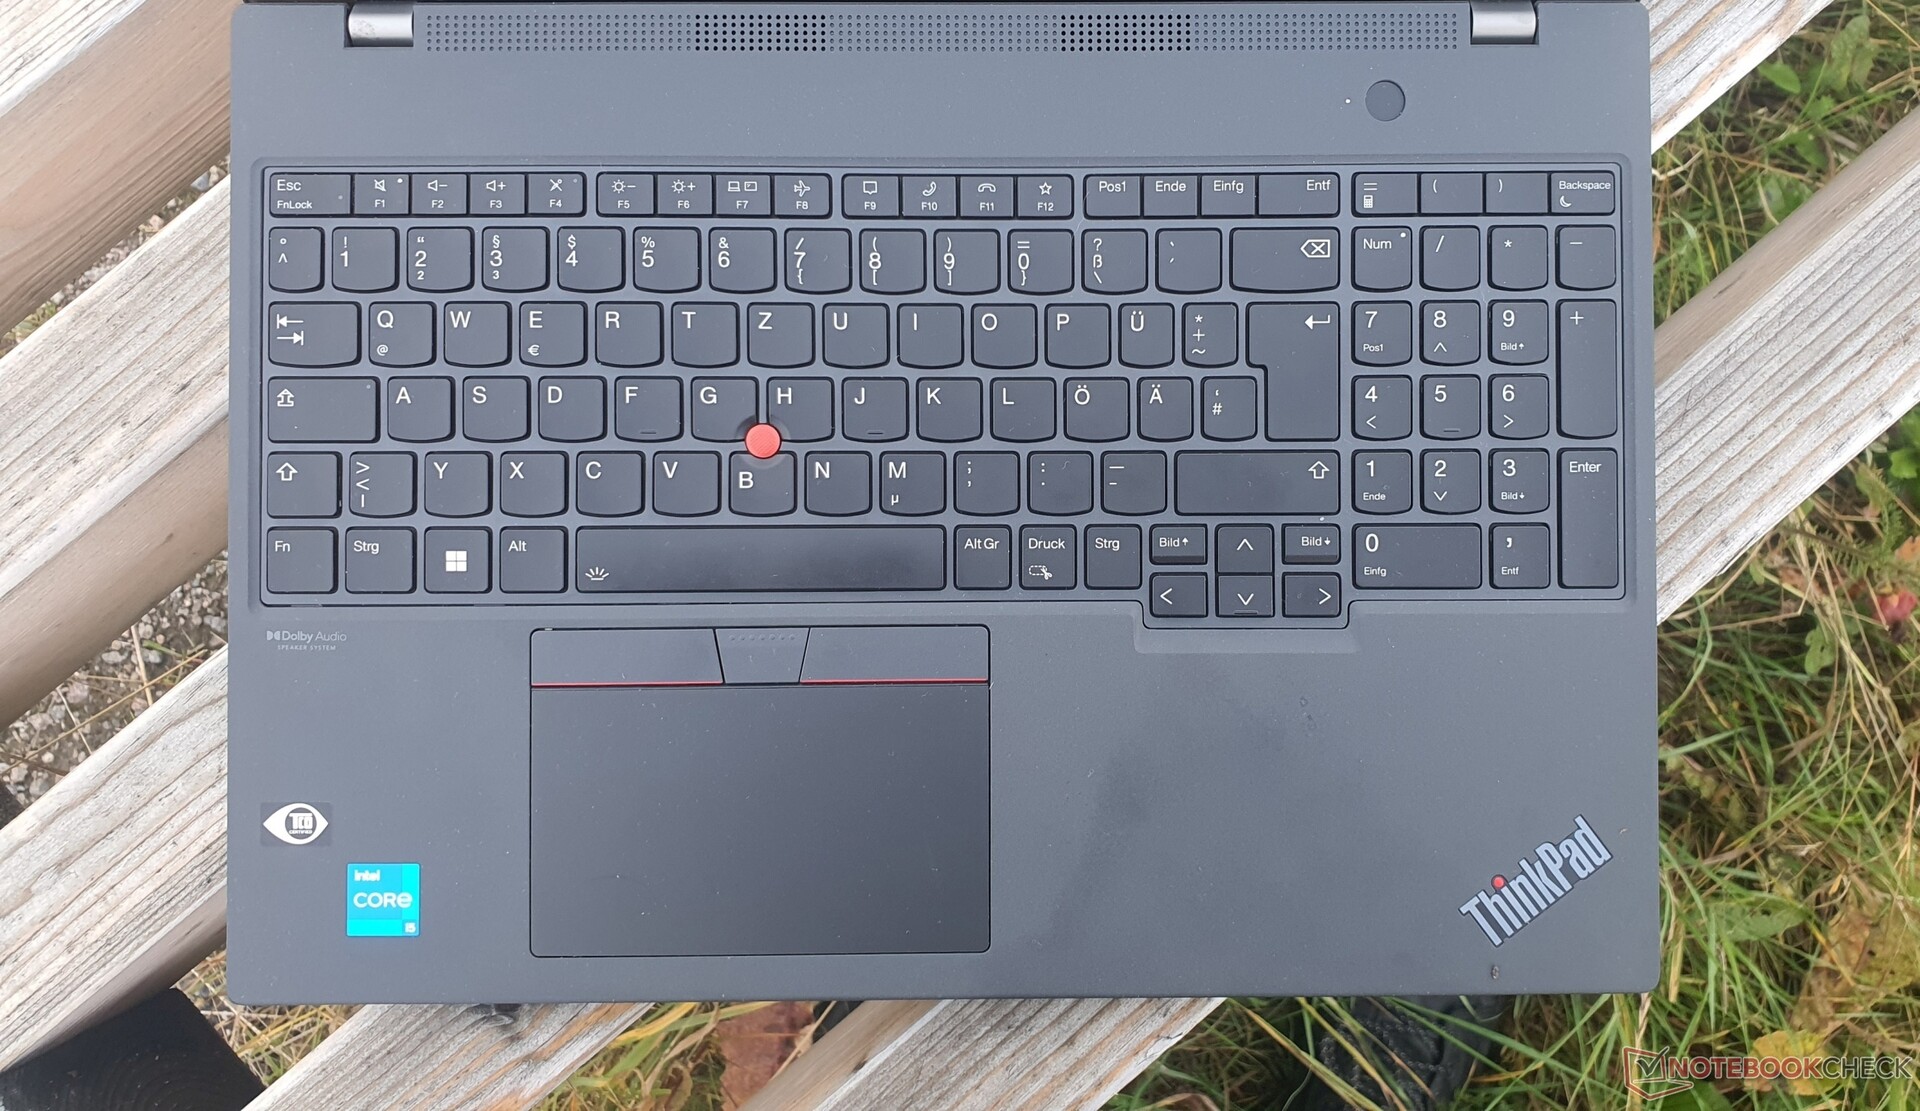
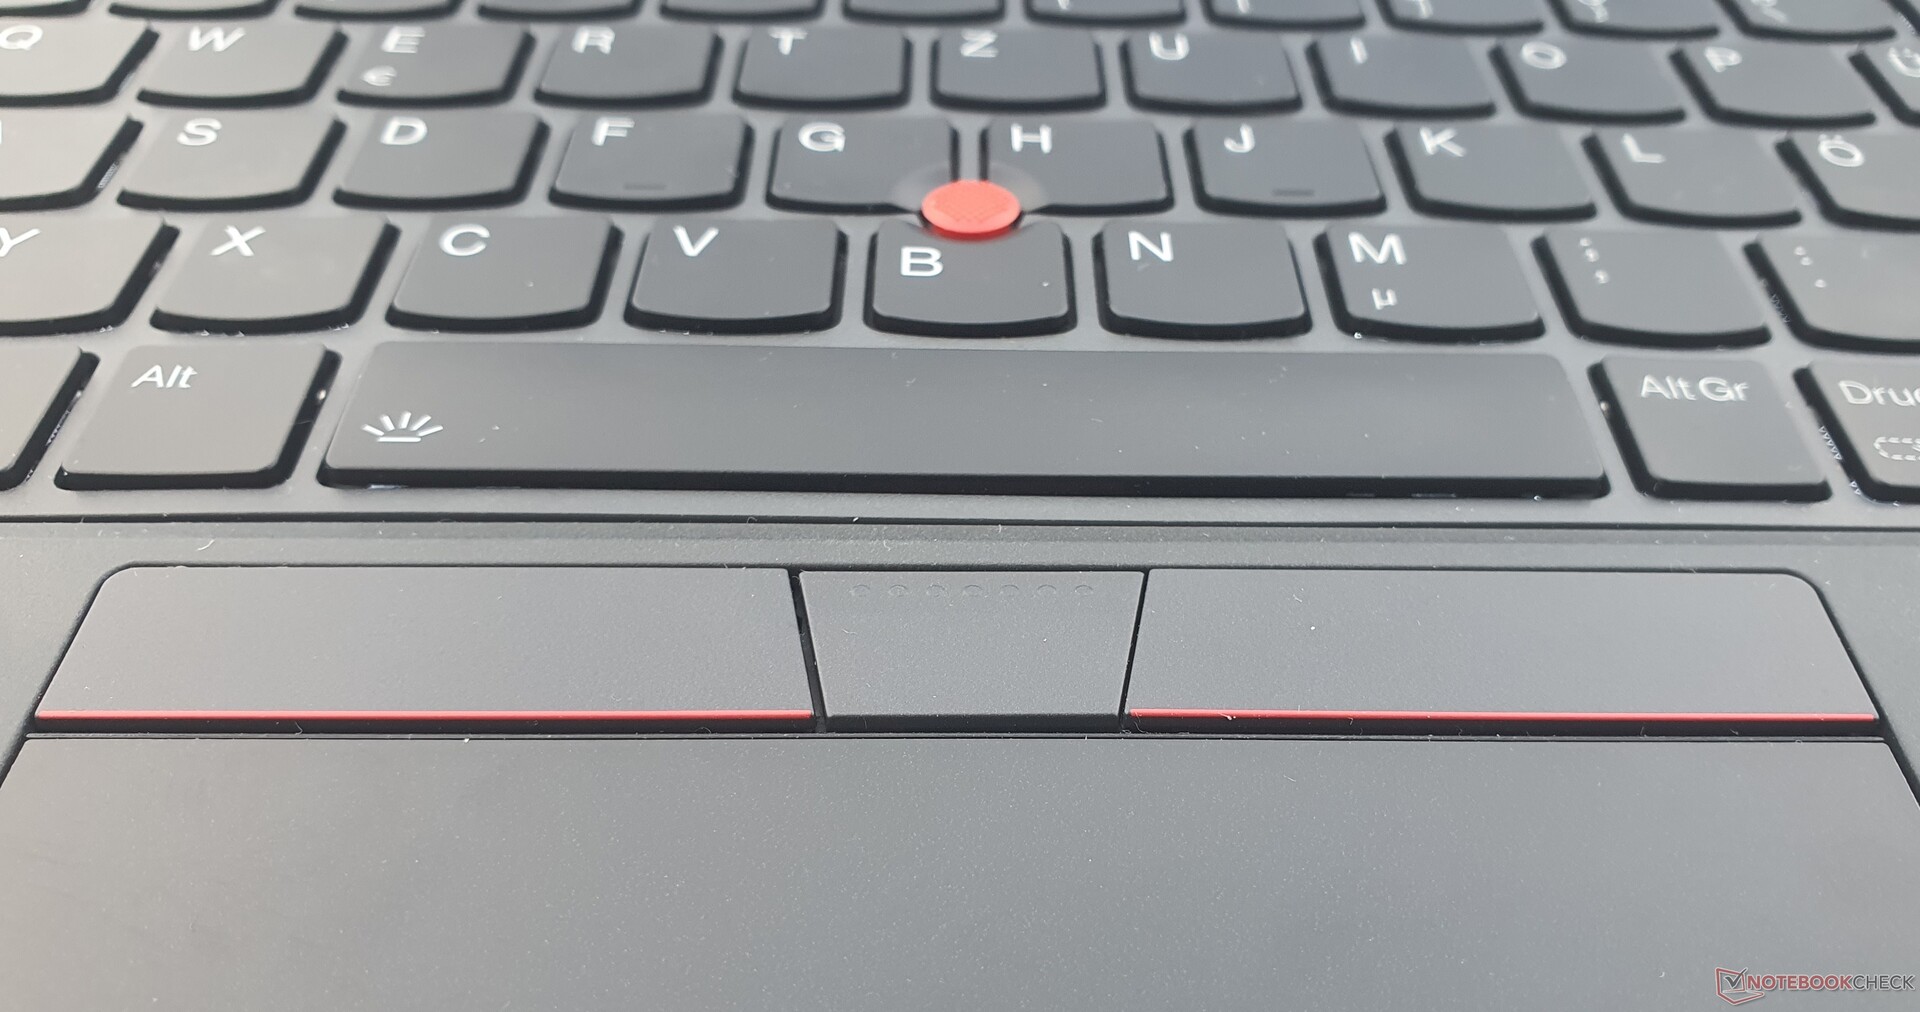
Pavé tactile et TrackPoint
Le pavé tactile, qui a été agrandi à 11,5x6,7 cm avec une surface en Mylar améliorée, est un cran au-dessus en termes de réactivité, glisse plus facilement et ressemble davantage à du verre lisse. La fonction pincer-zoomer et le glisser-déposer fonctionnent à merveille. Les entrées sont mises en œuvre avec précision. Les touches de clic intégrées offrent une course courte, mais un retour riche et clair.
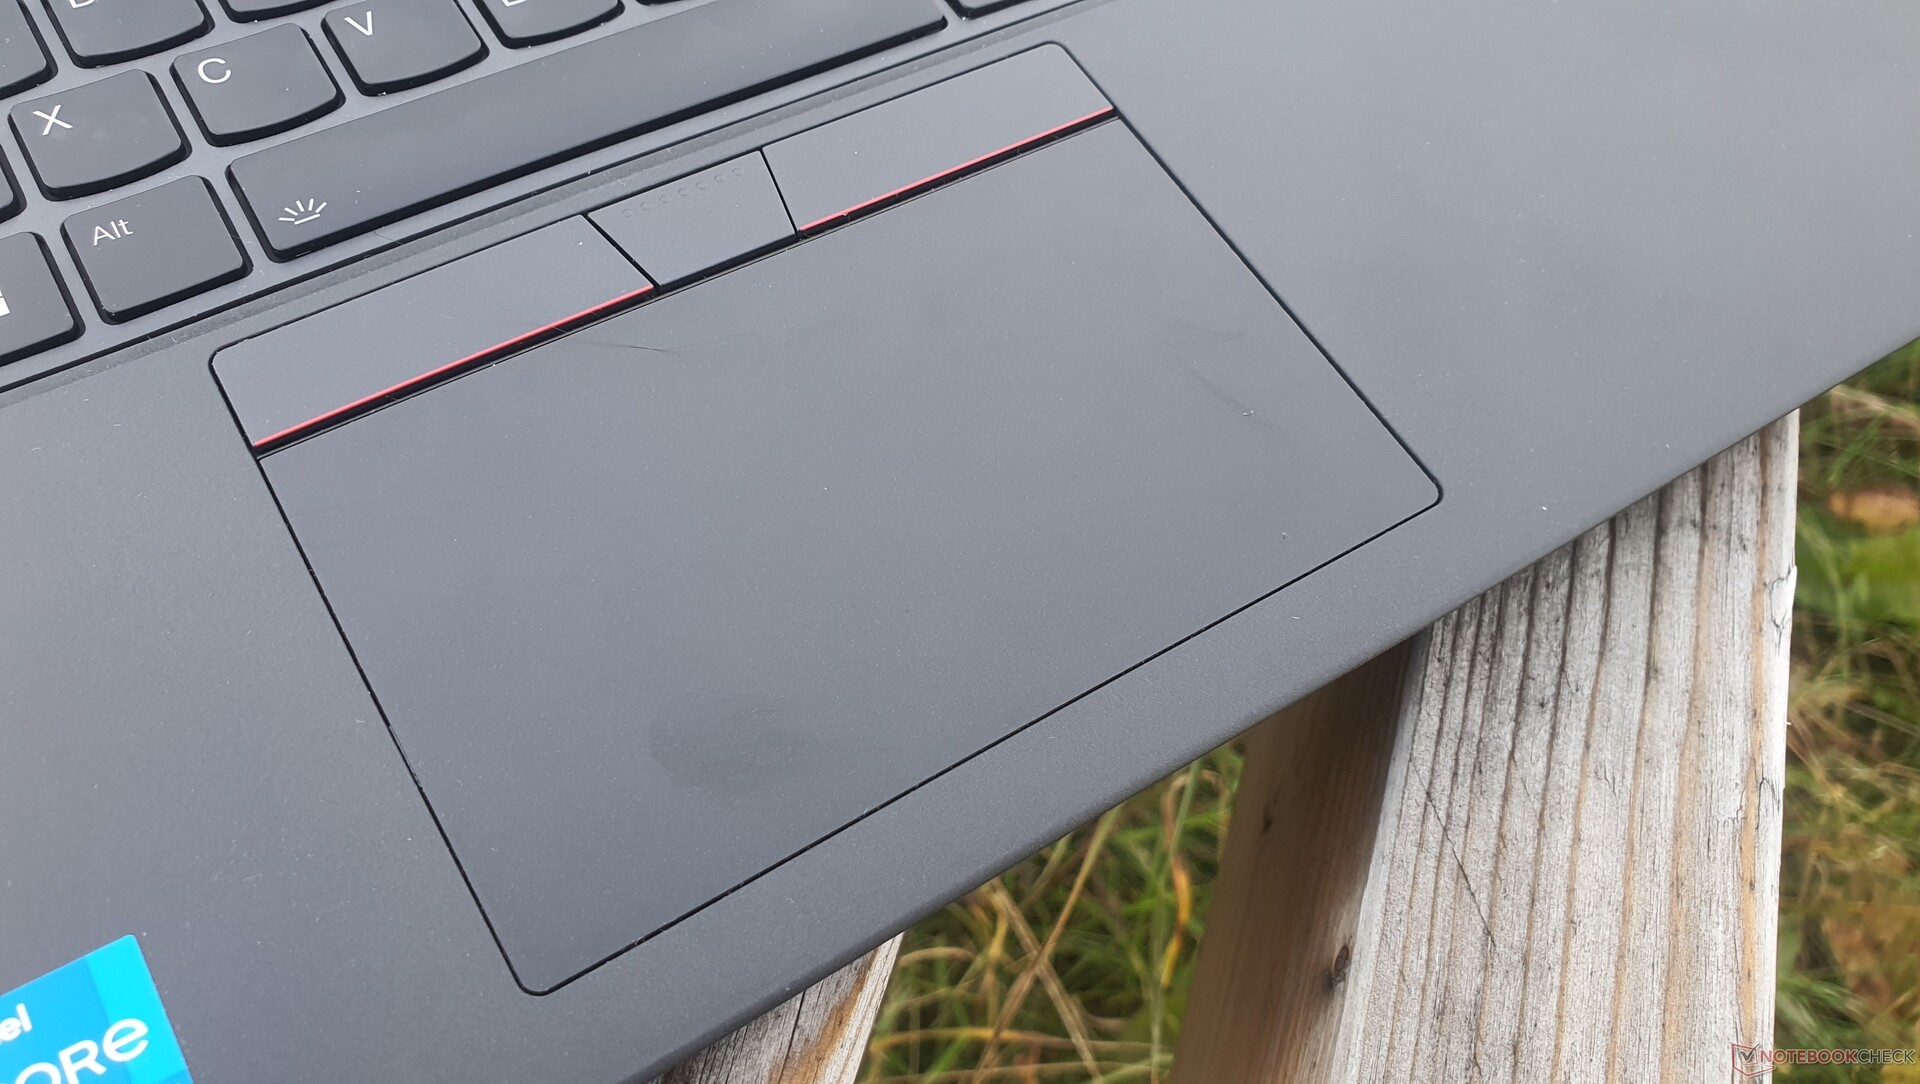
Les fans de TrackPoint peuvent toujours utiliser la méthode avantageuse pour le contrôle de la souris, qui rend inutile le retrait de la main du clavier. Cependant, les trois touches associées au-dessus du pavé tactile sont désormais complètement plates, avec moins de retour et de course. Il faudra peut-être s'y habituer un peu. Néanmoins, elles fonctionnent toujours de manière précise et fiable.
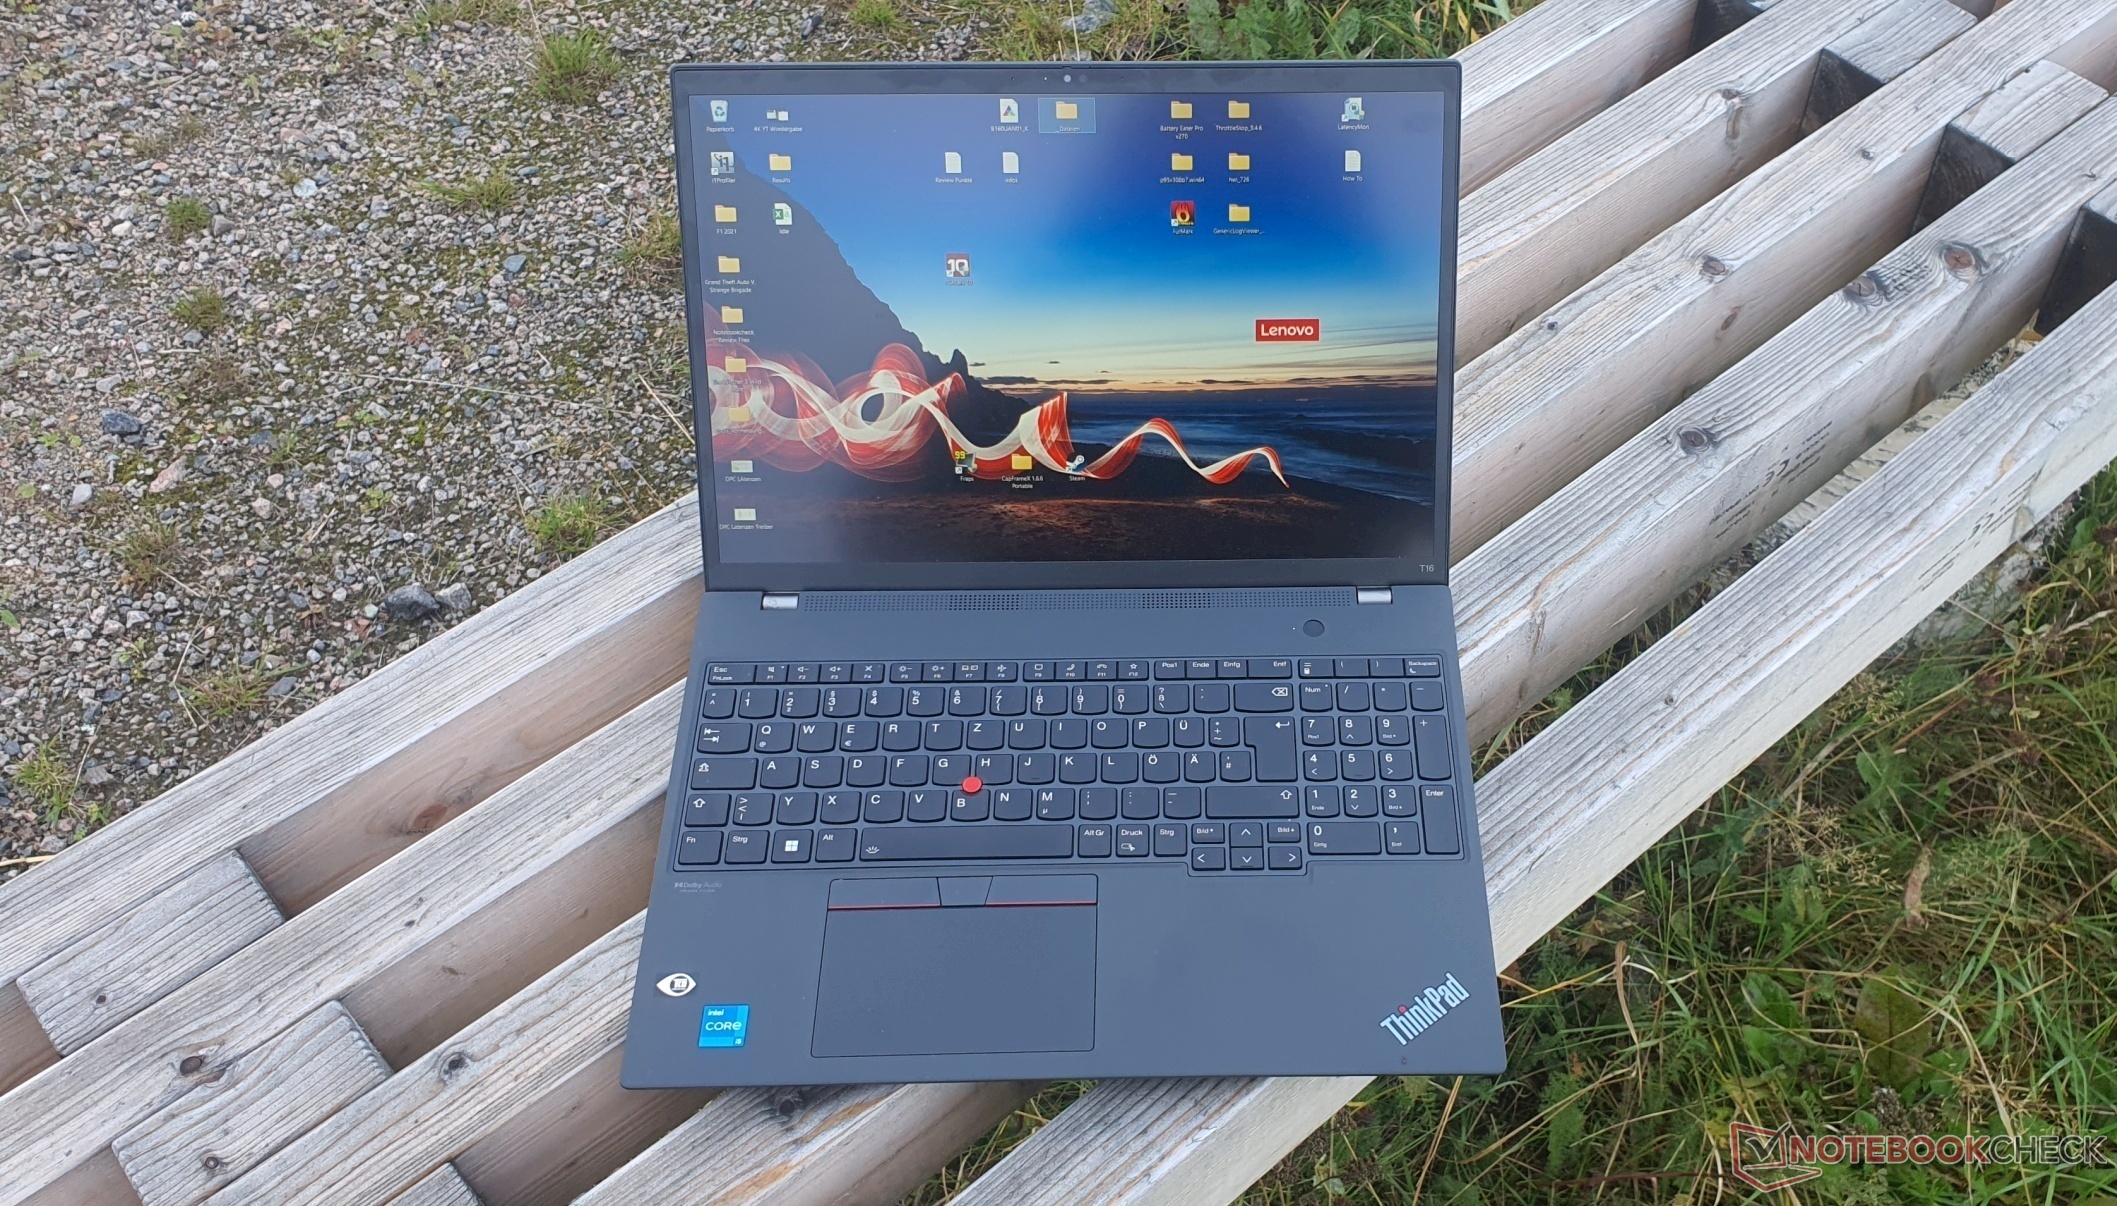
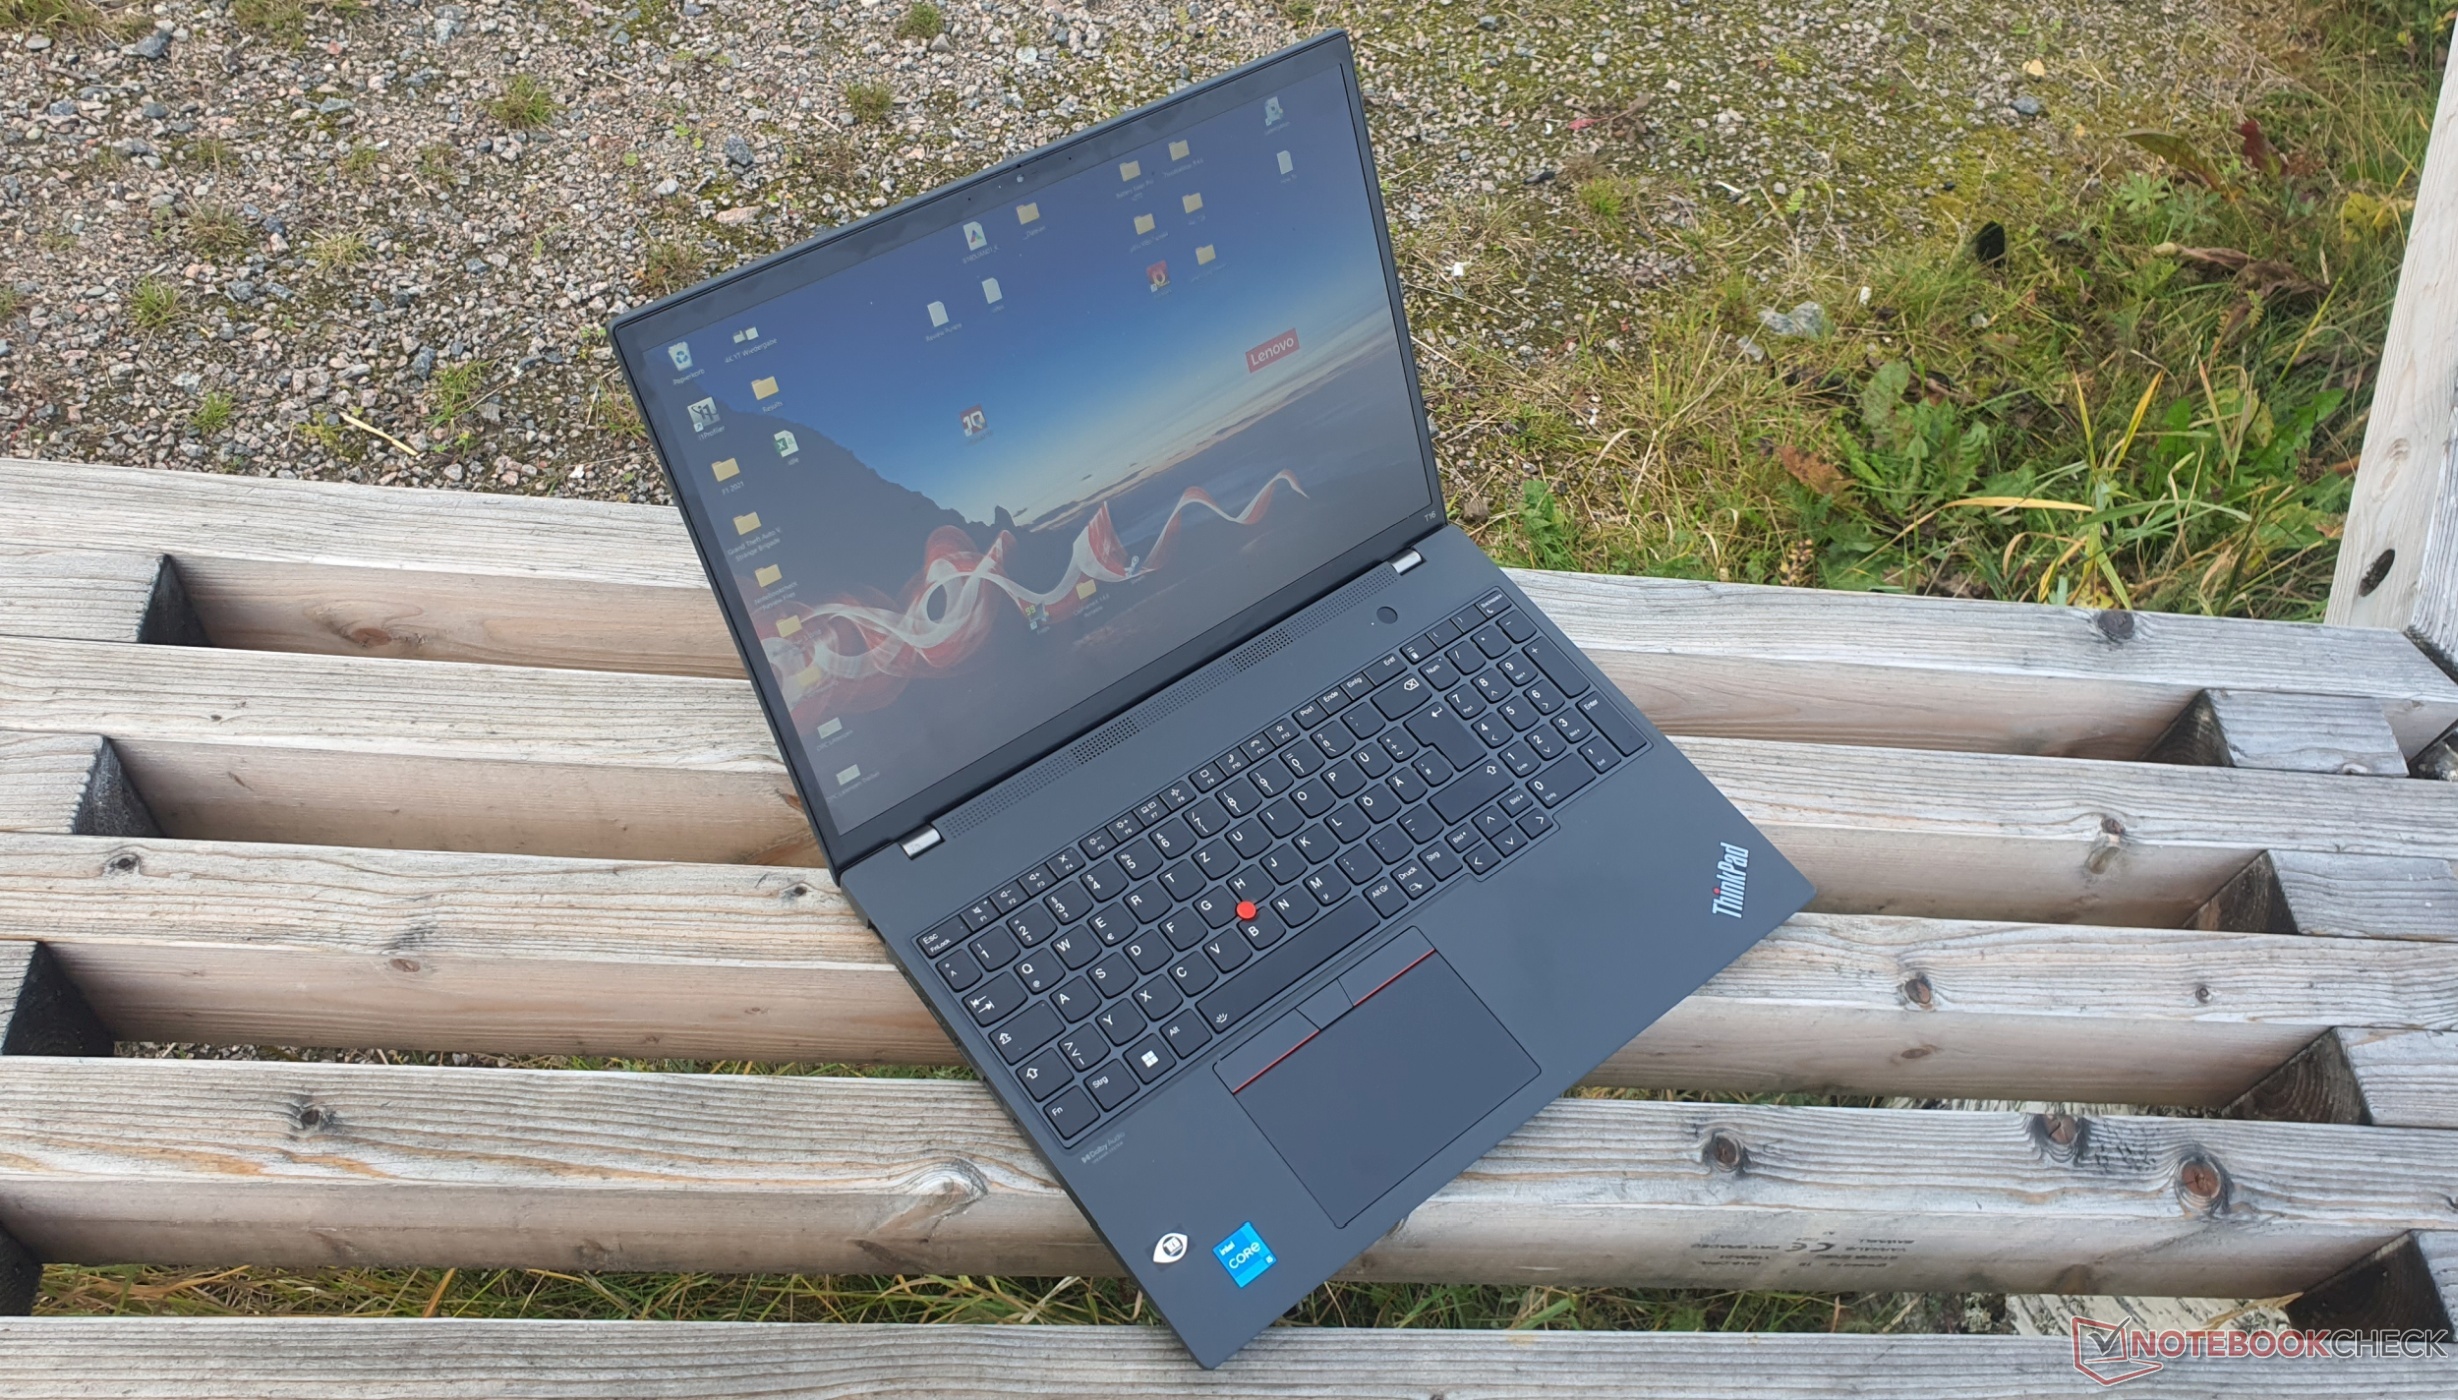
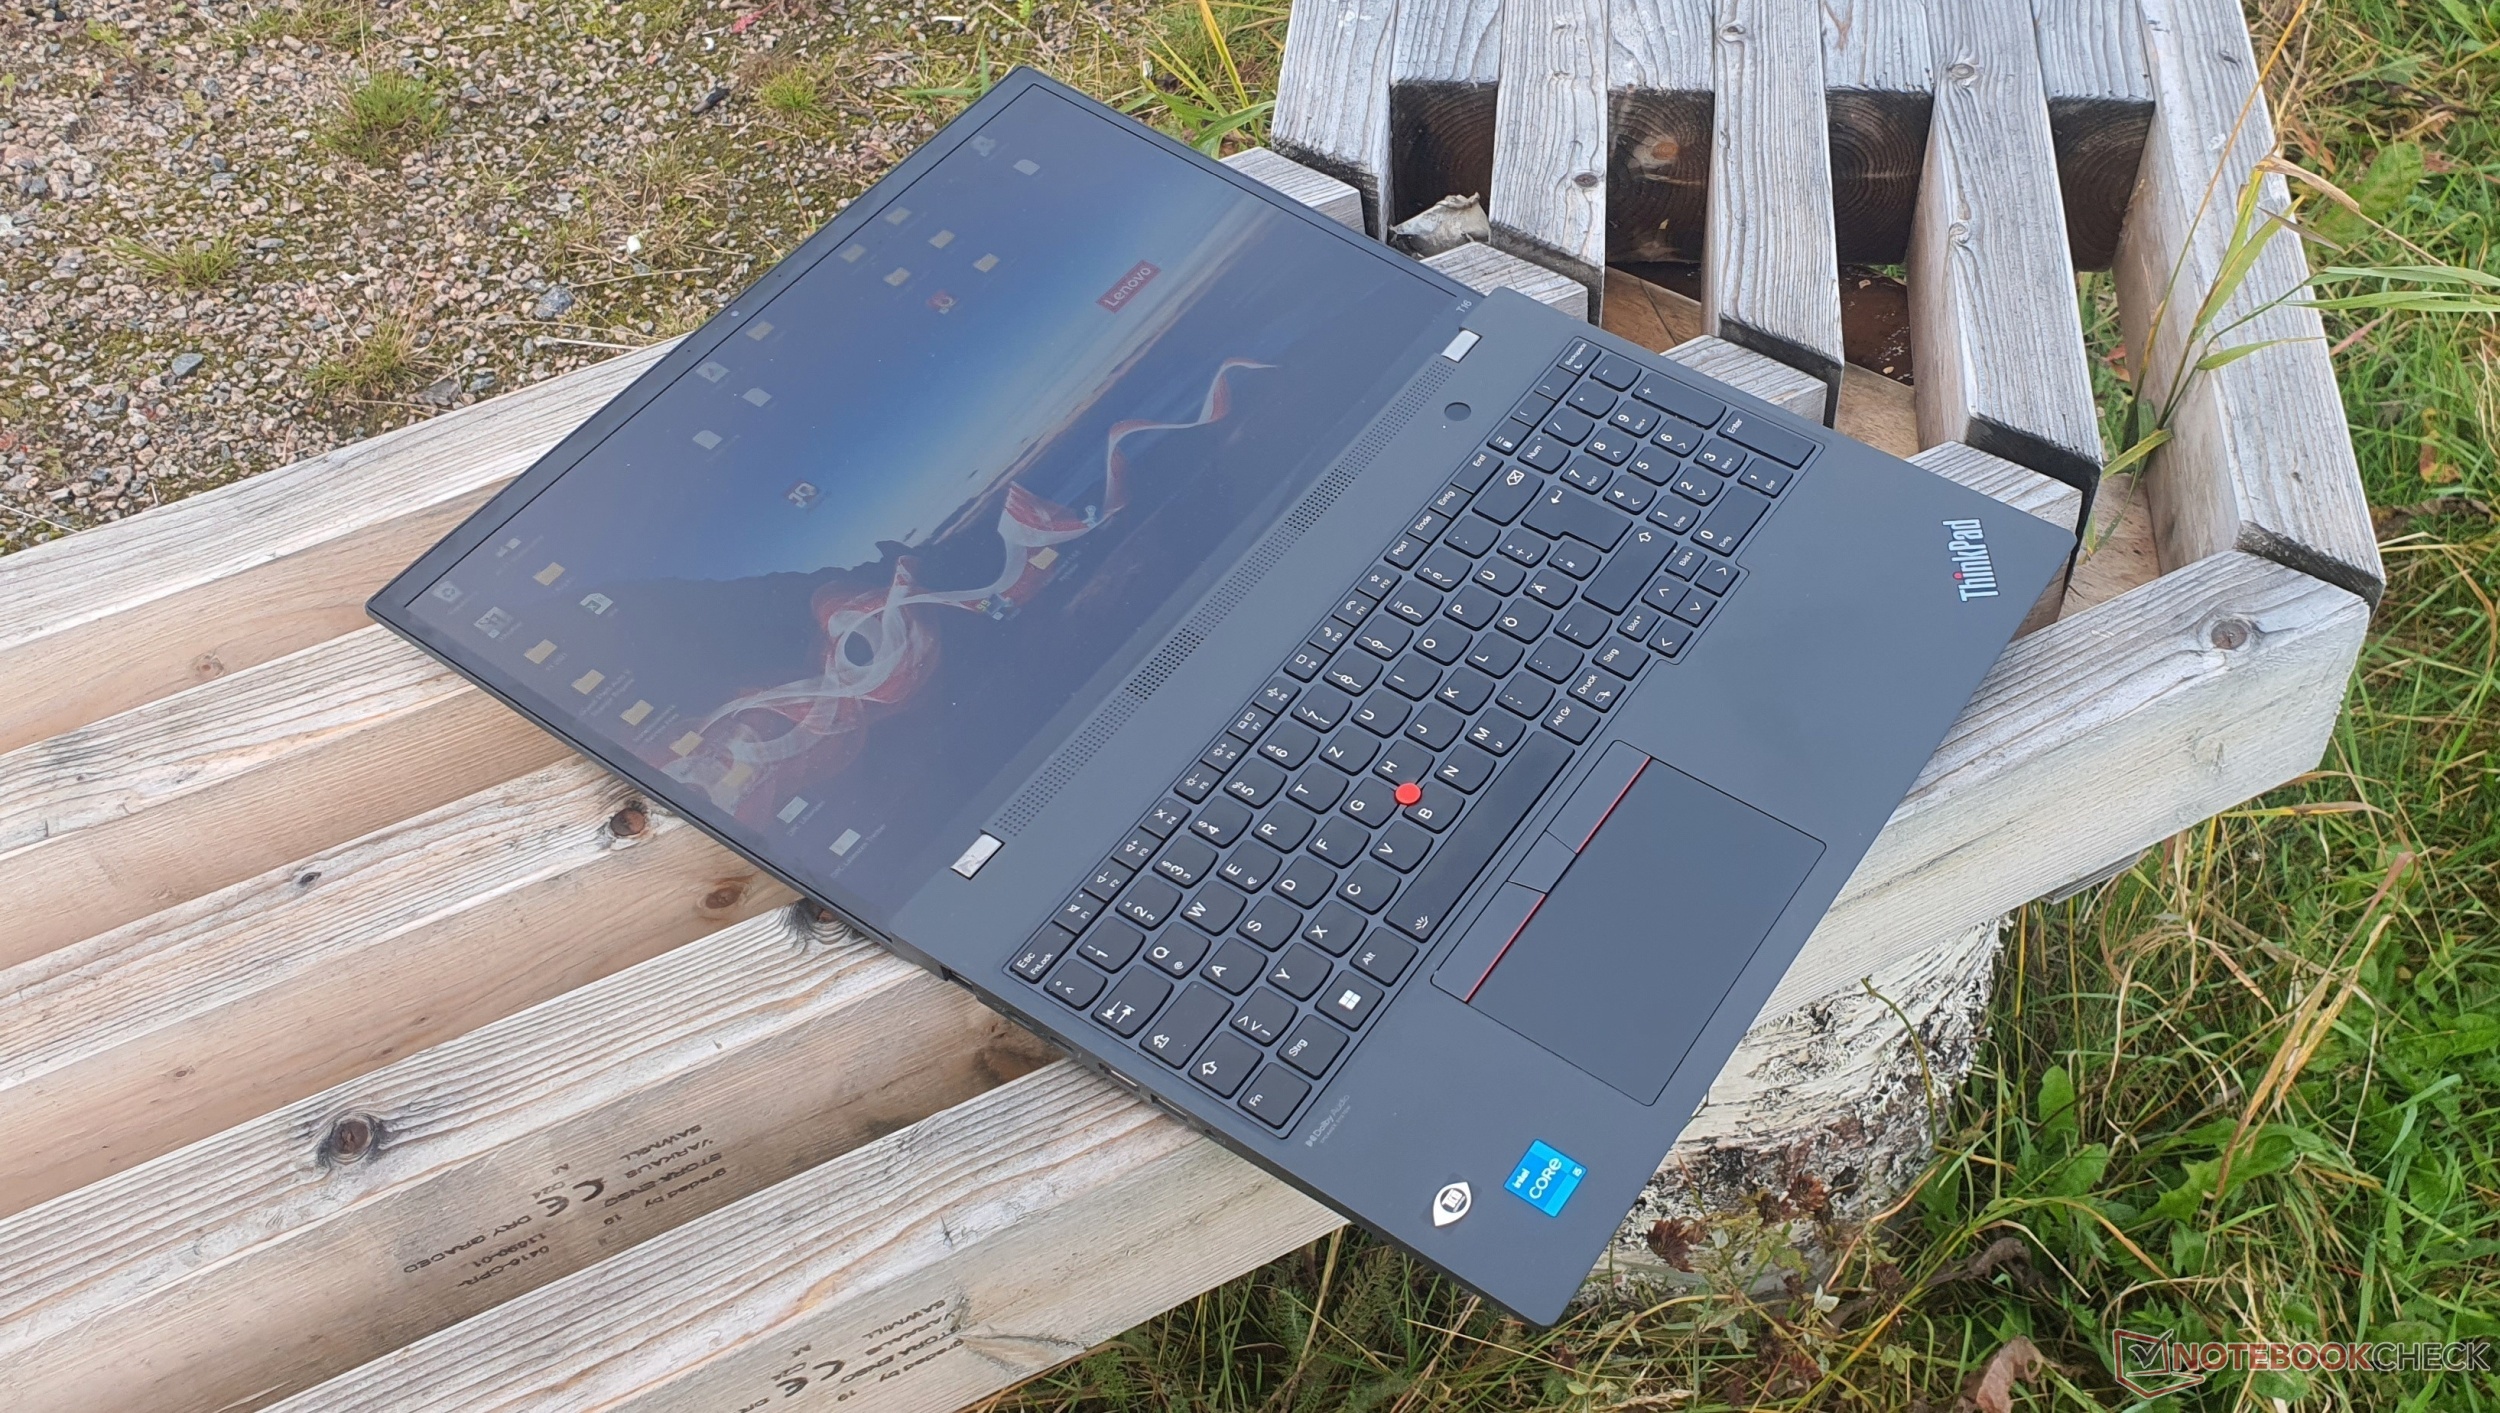
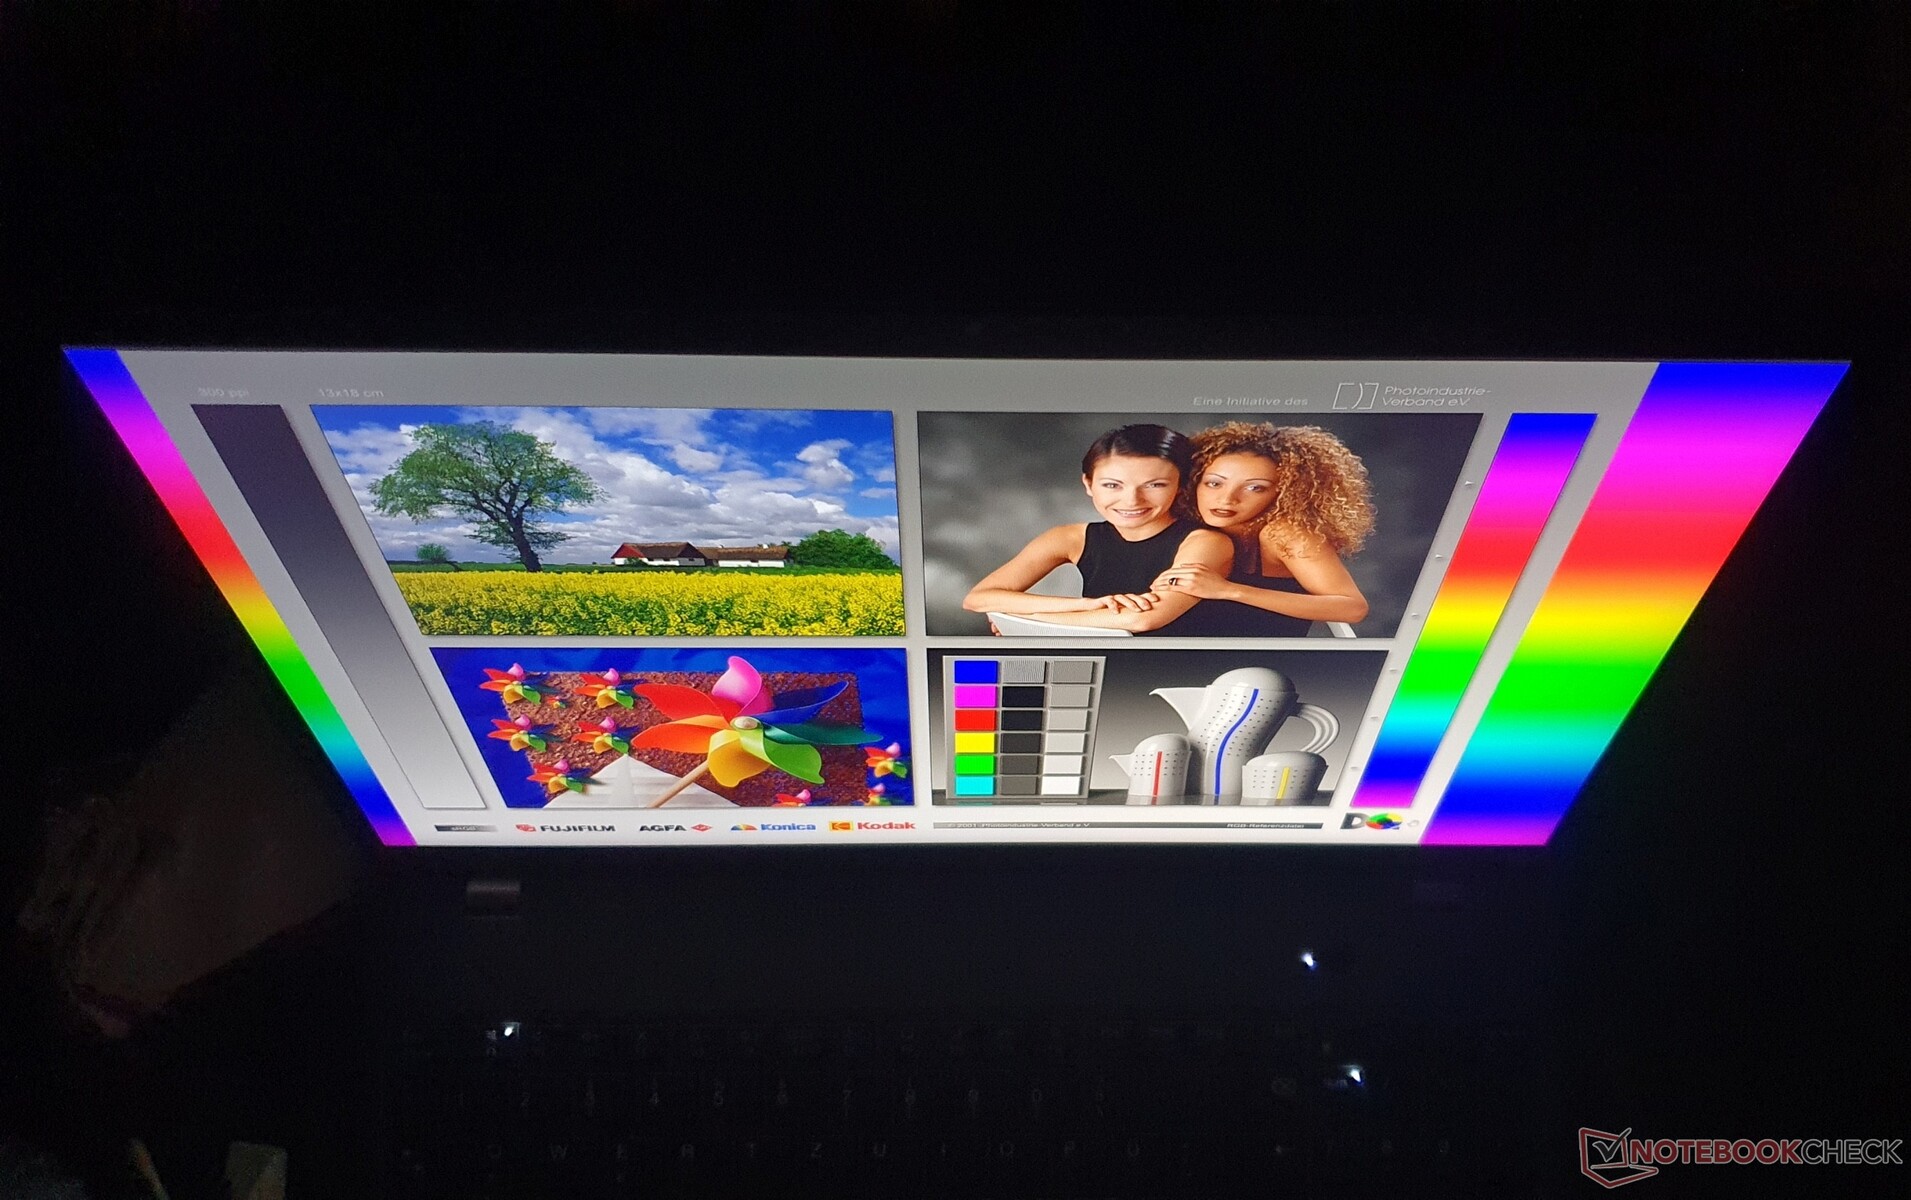
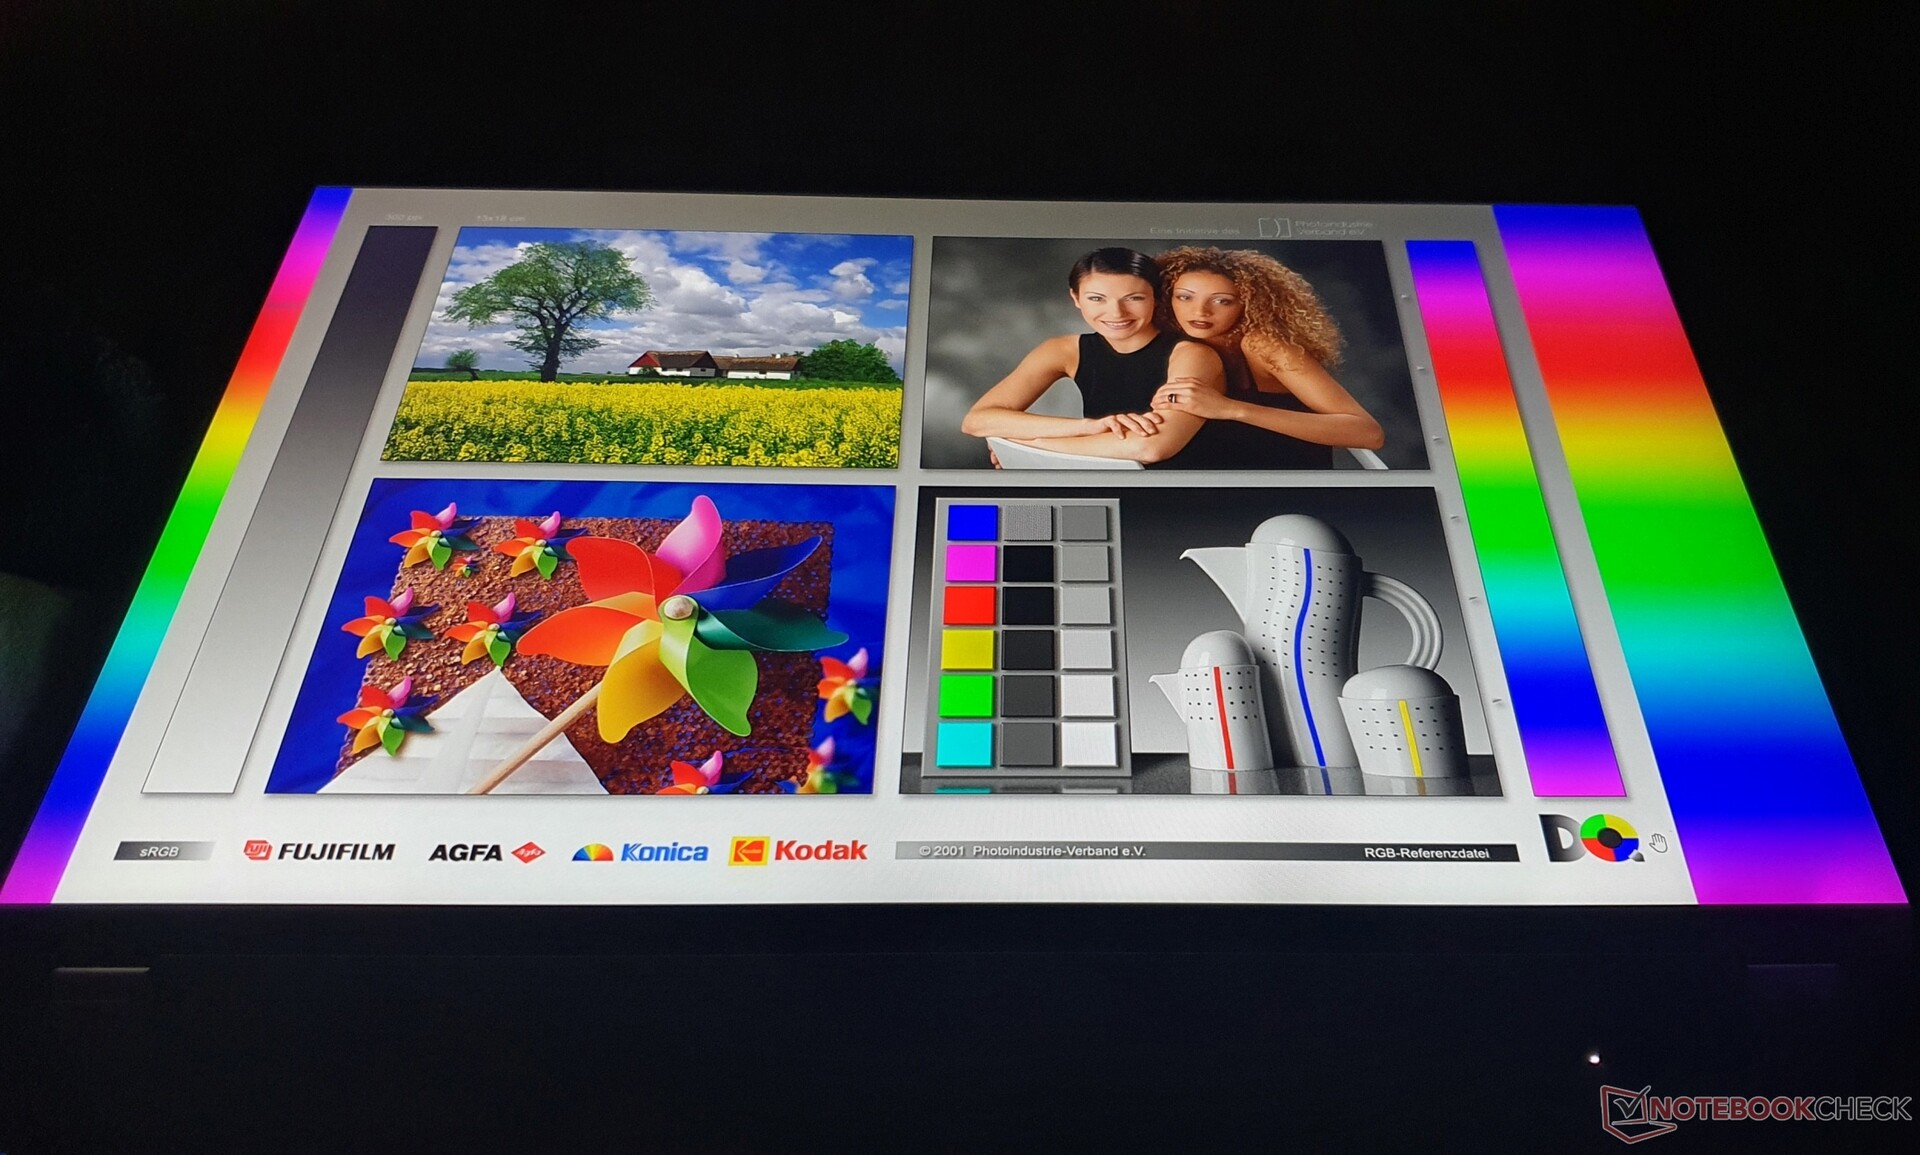
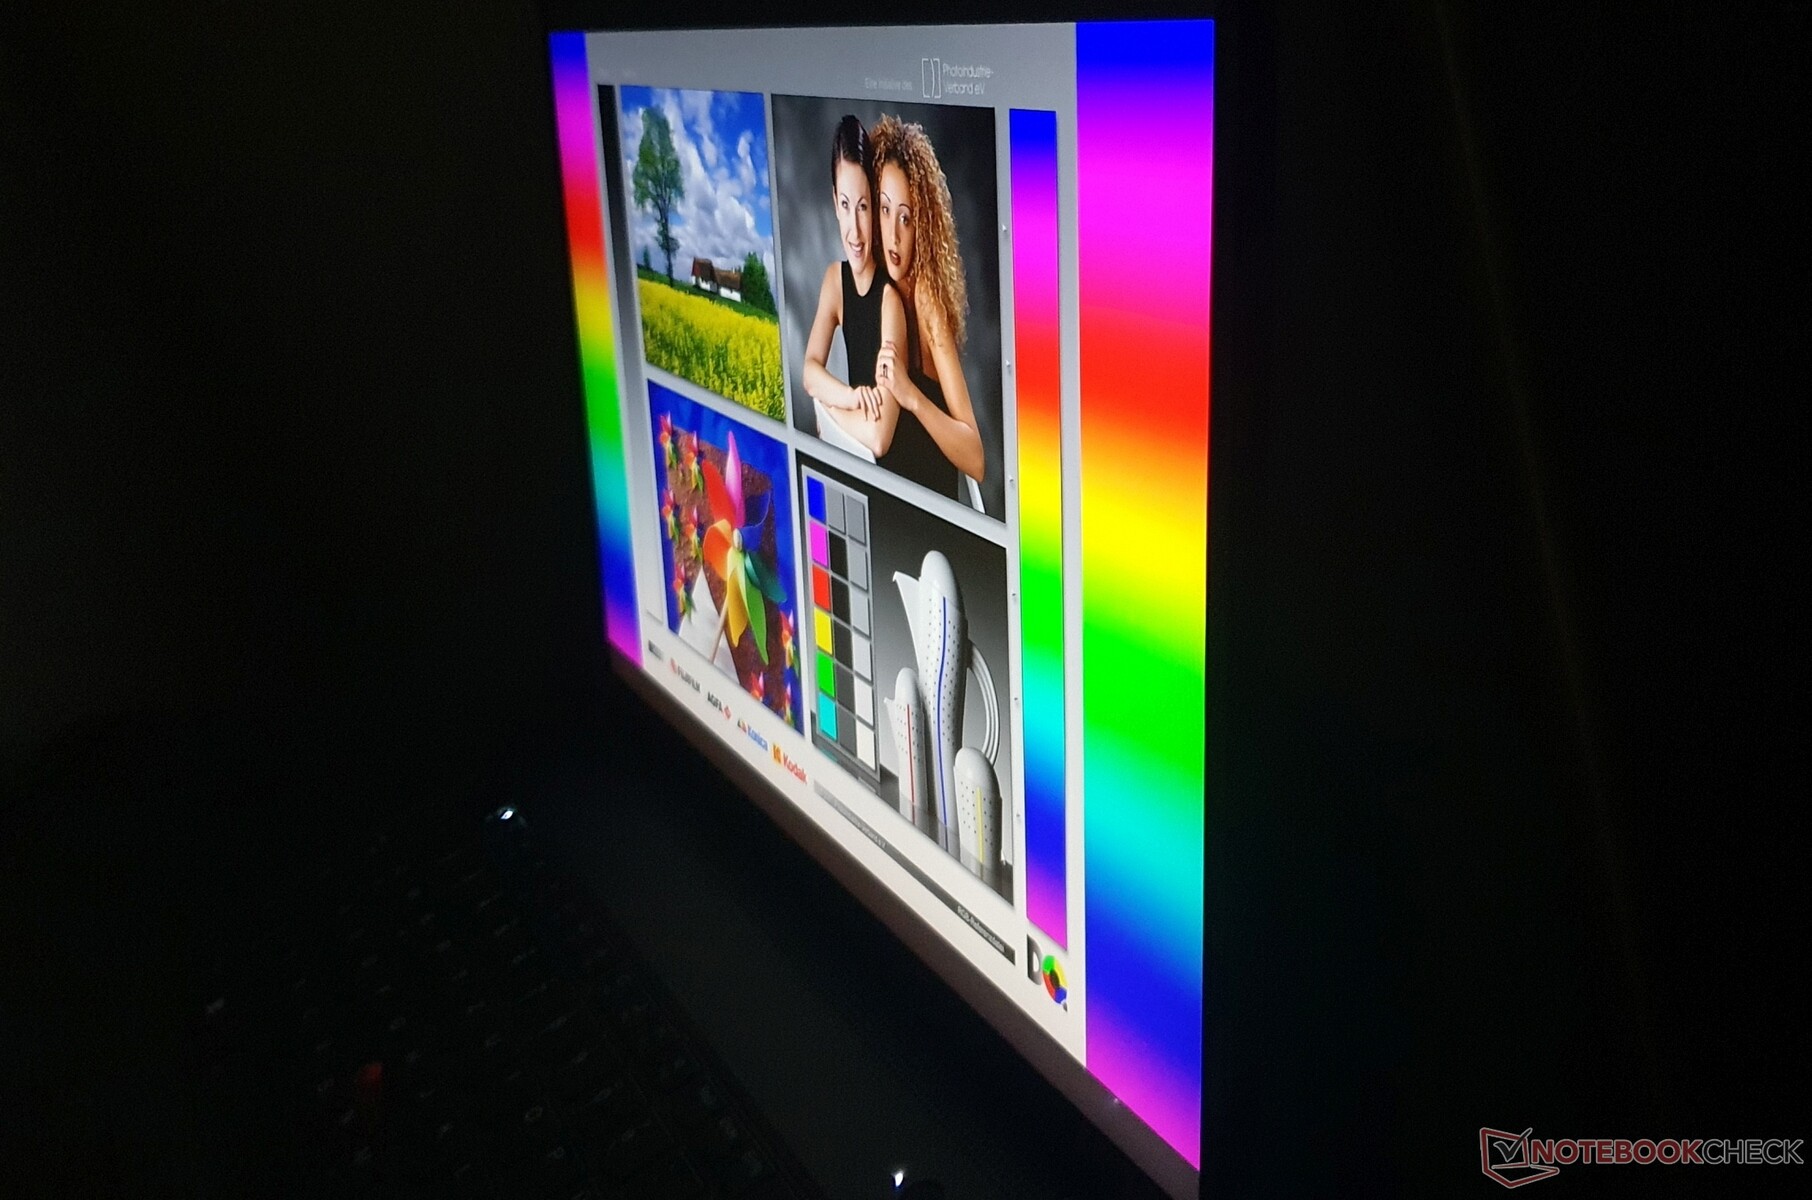
Écran - Écran Sharp FHD+ à faible consommation d'énergie dans le ThinkPad T16
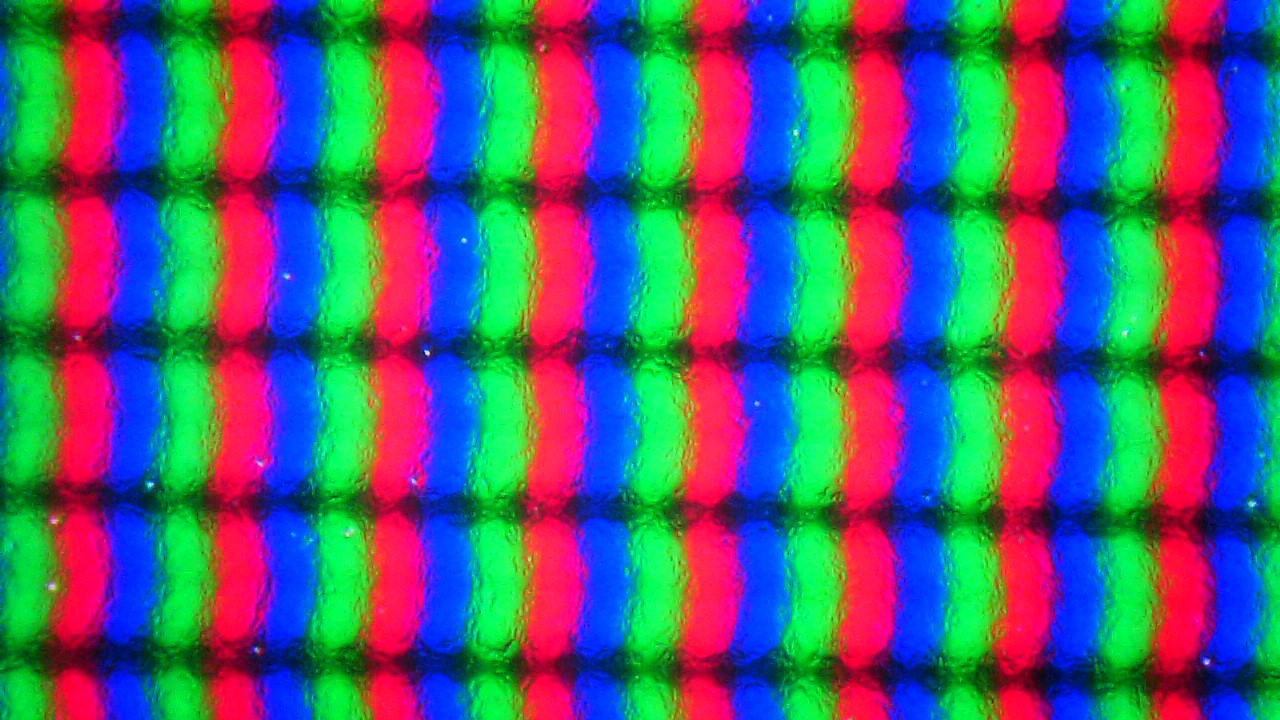

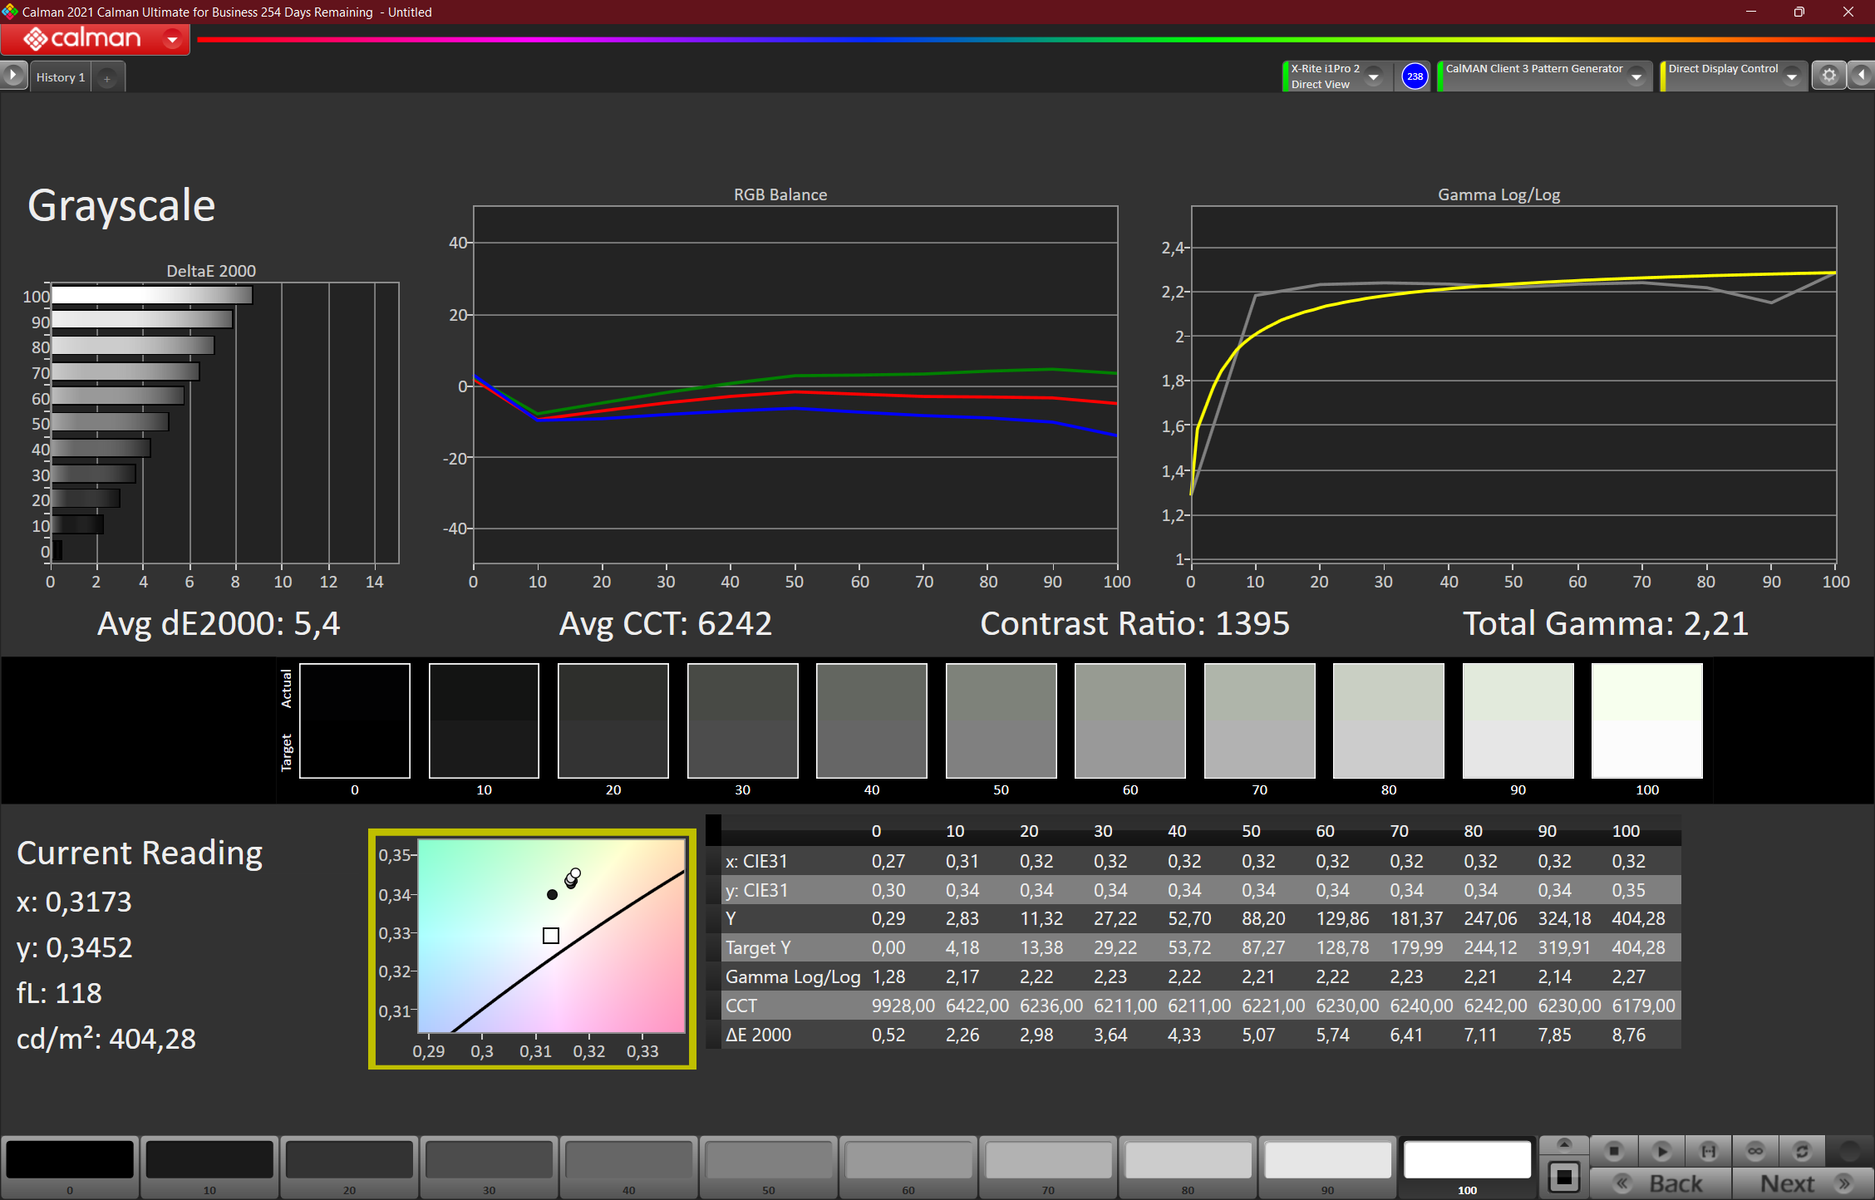
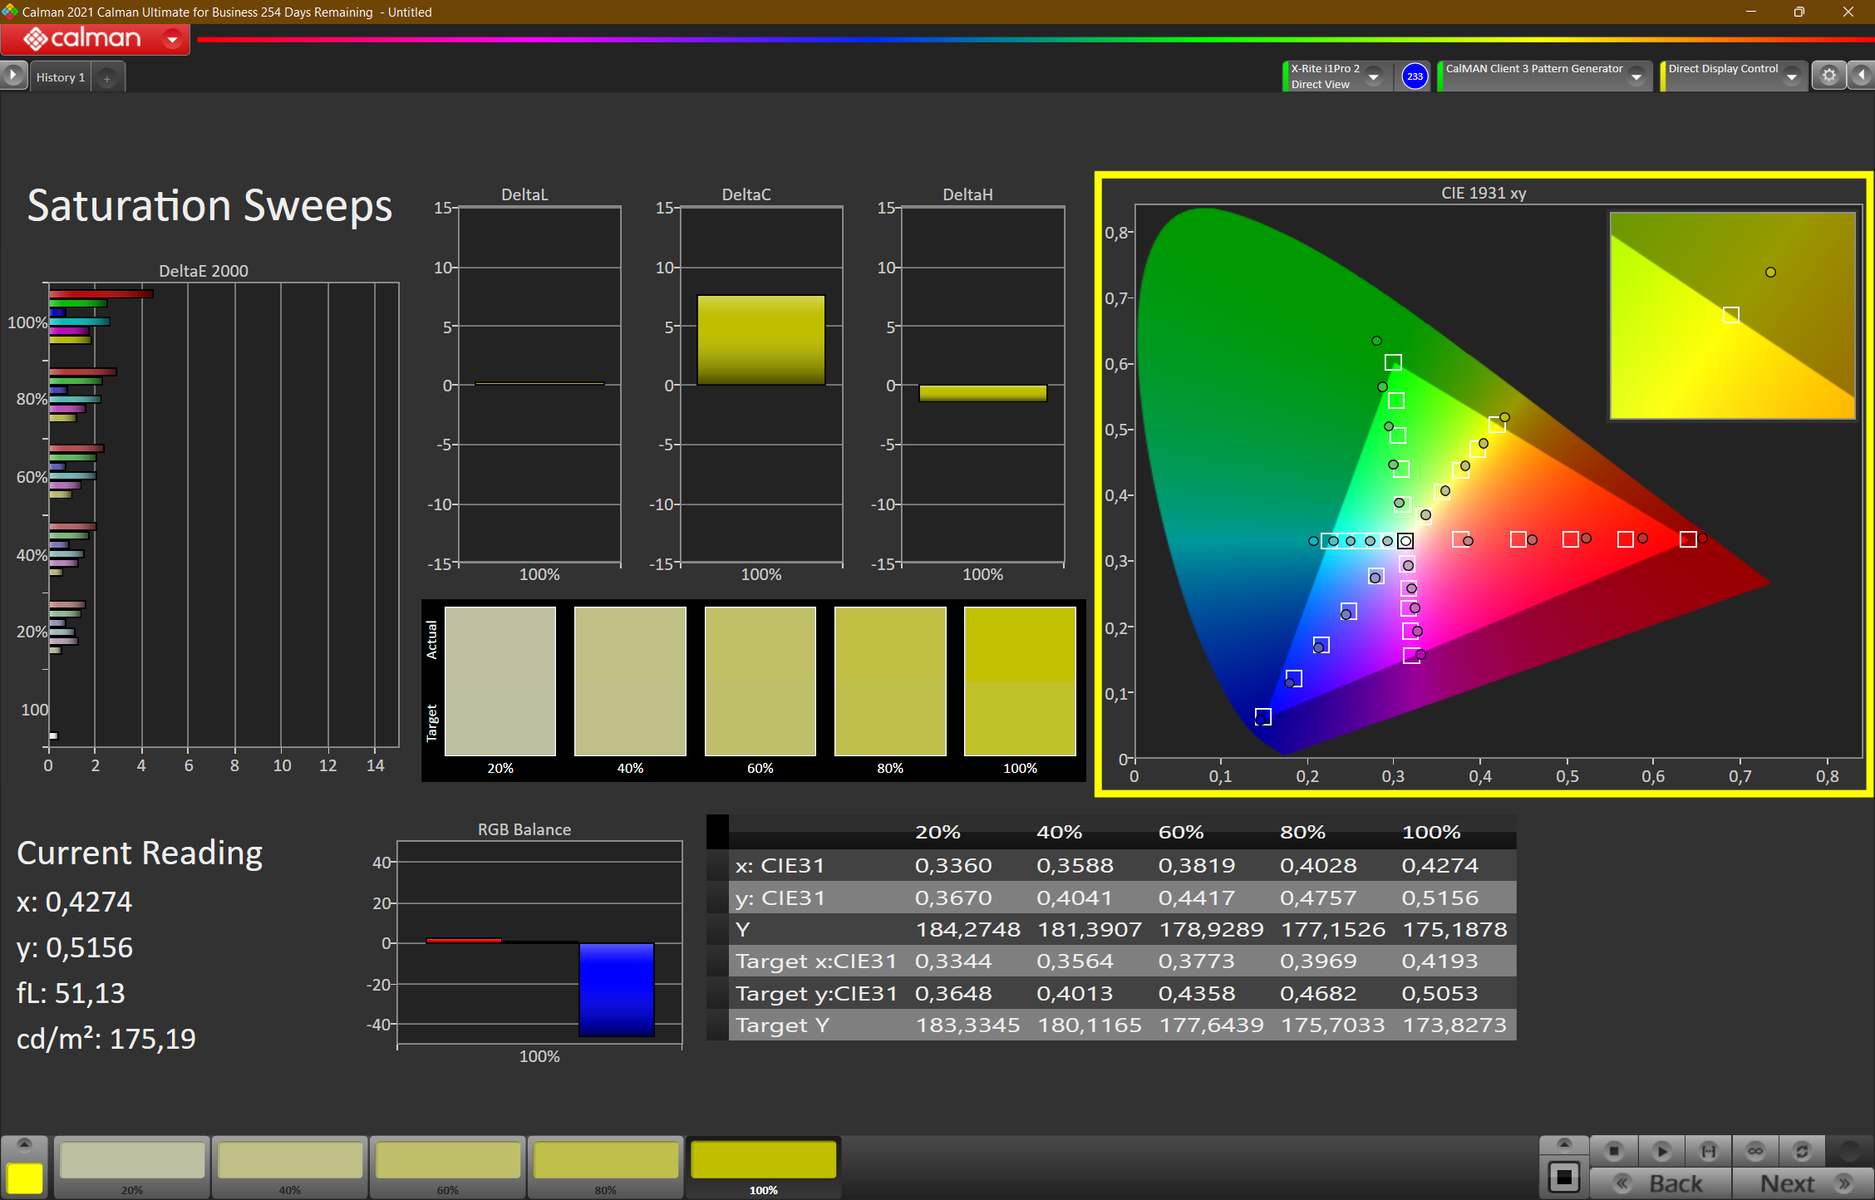
L'écran mat à faible consommation au format 16:10 installé dans notre échantillon d'examen a une résolution de 1920x1200 (WUXGA/FHD+) et offre une bonne netteté sur 16 pouces. La luminosité d'un bon 390 nits est presque conforme aux spécifications (400 nits). Le taux de contraste (1393:1) et la valeur du noir (0,29 nits) sont également à un niveau élevé. Le contenu des images noires apparaît donc riche et profond.
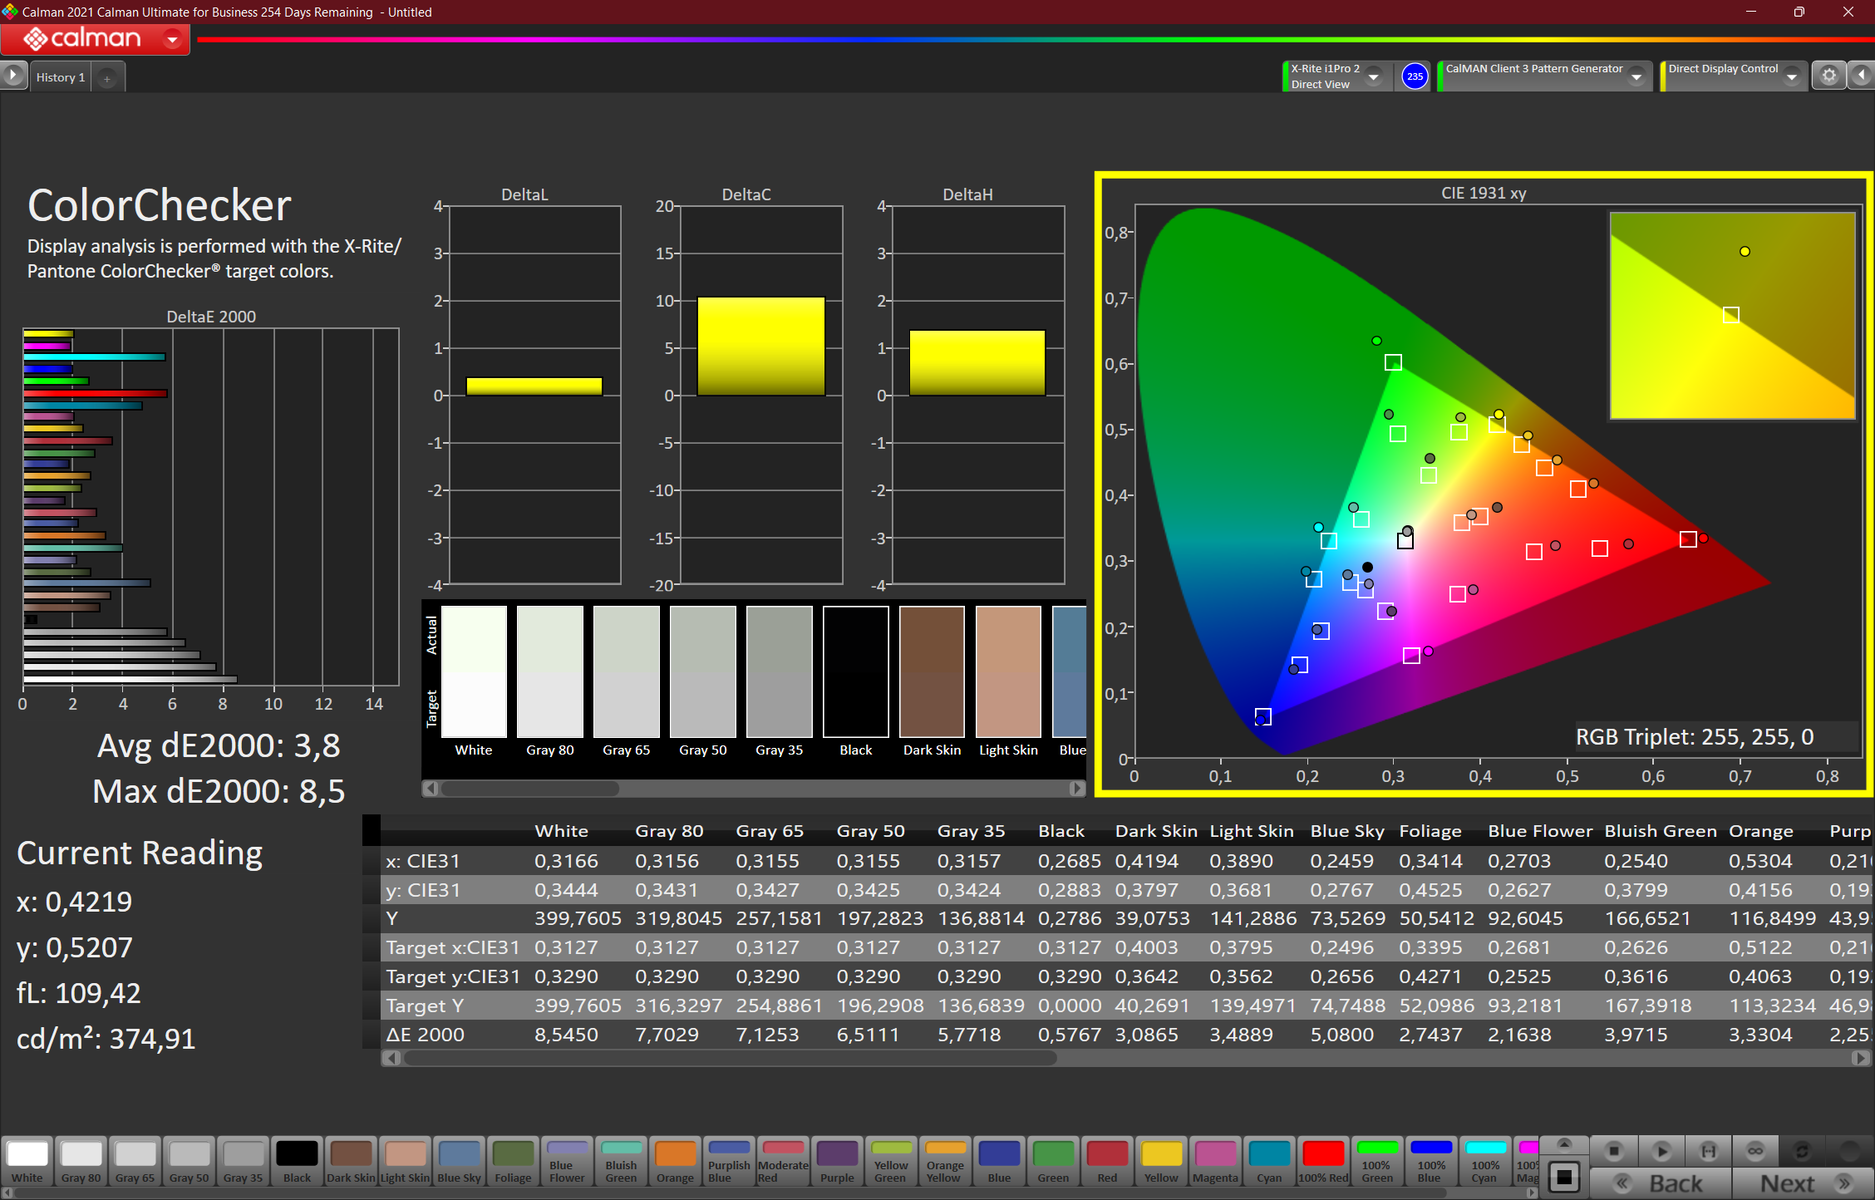
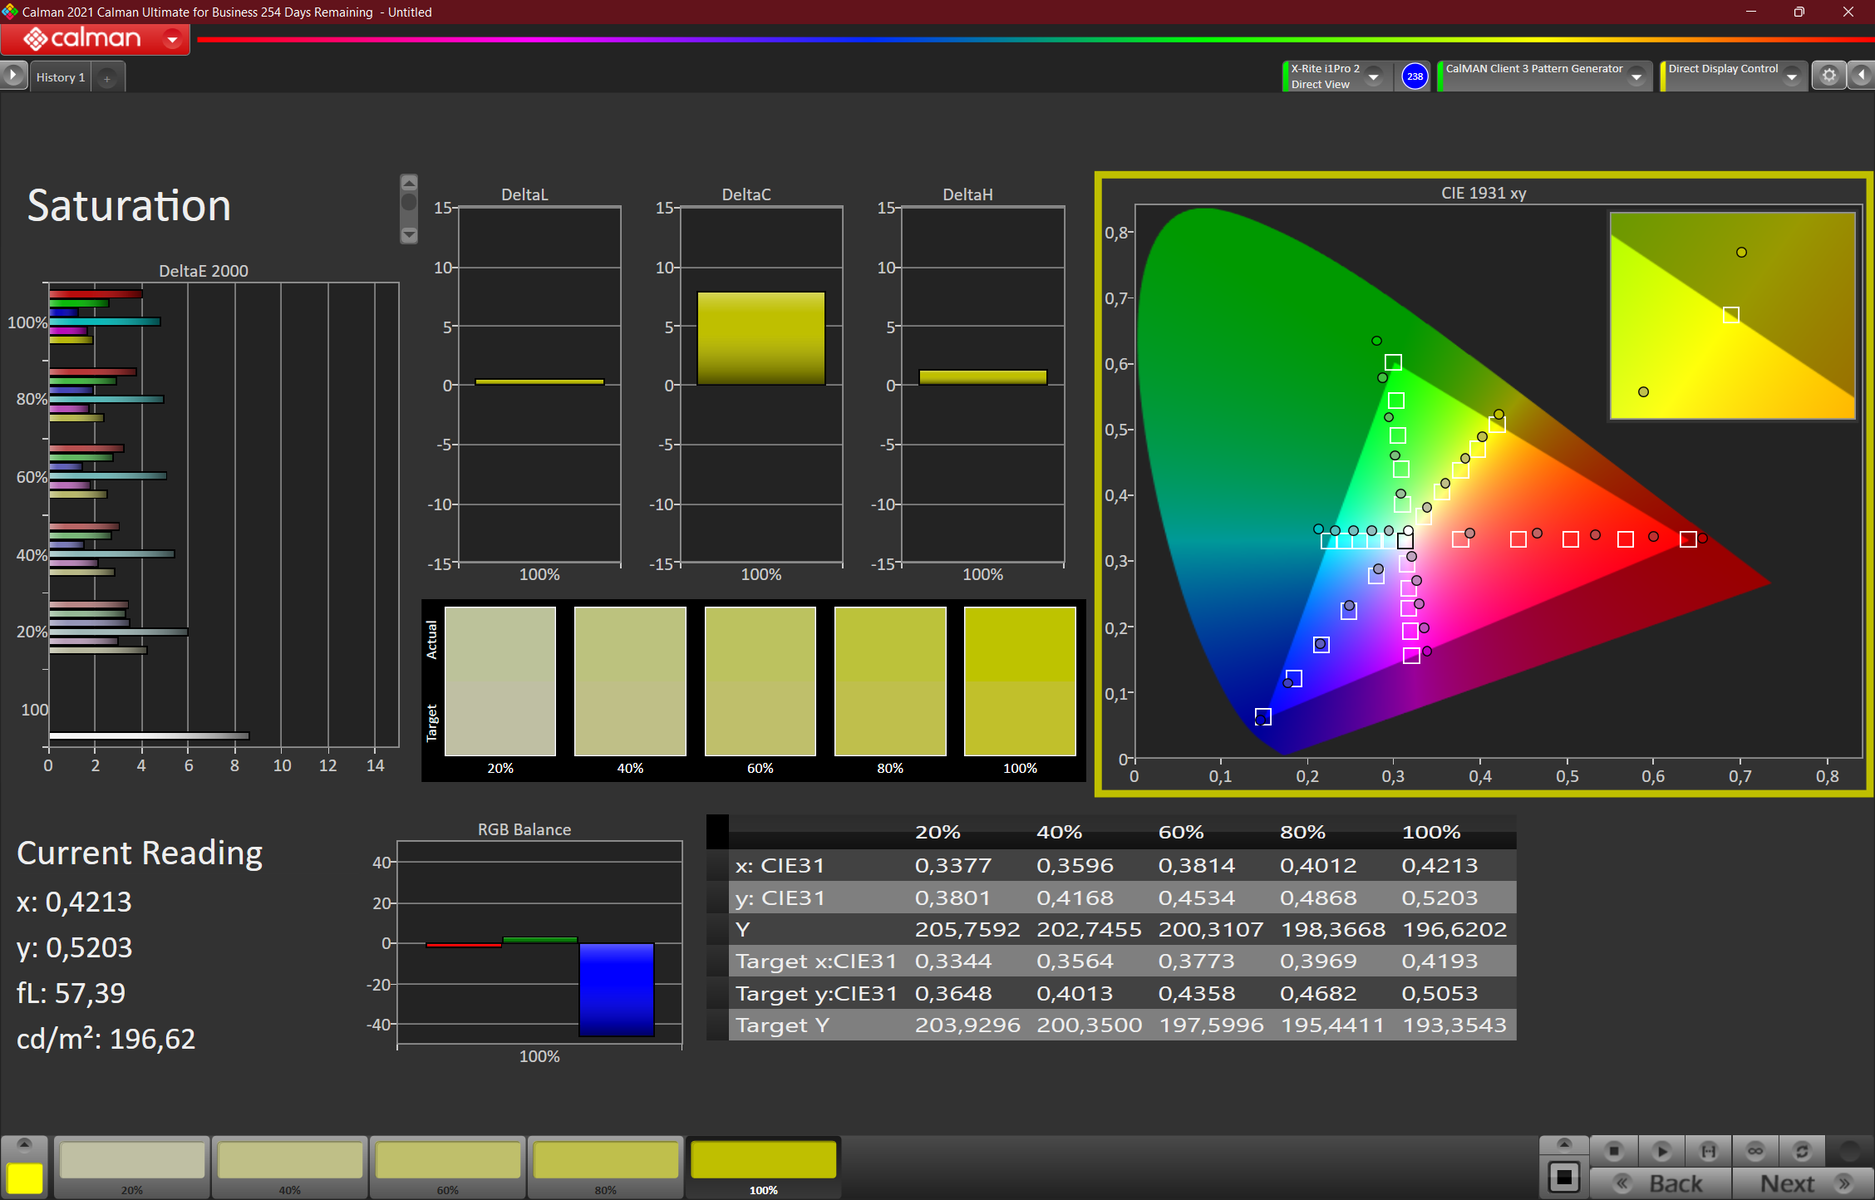
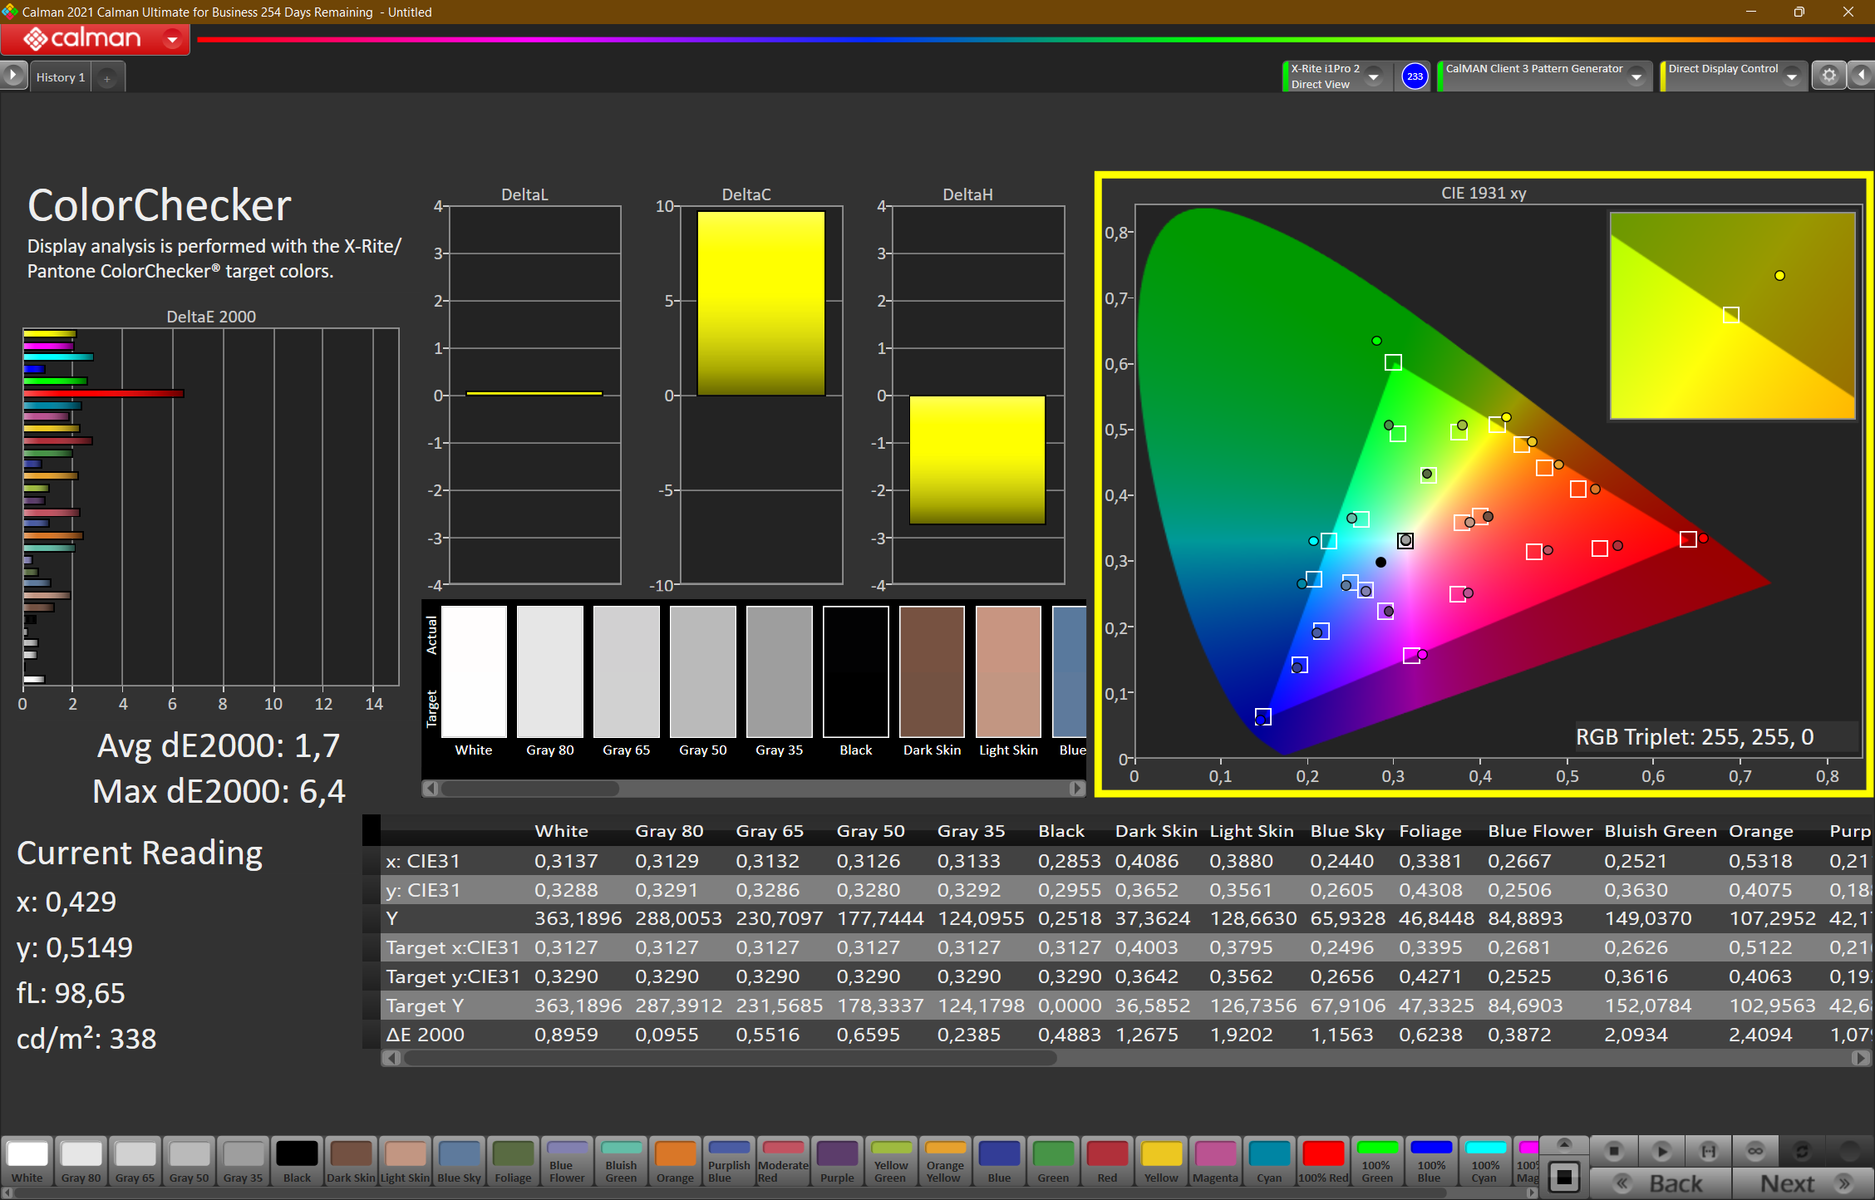
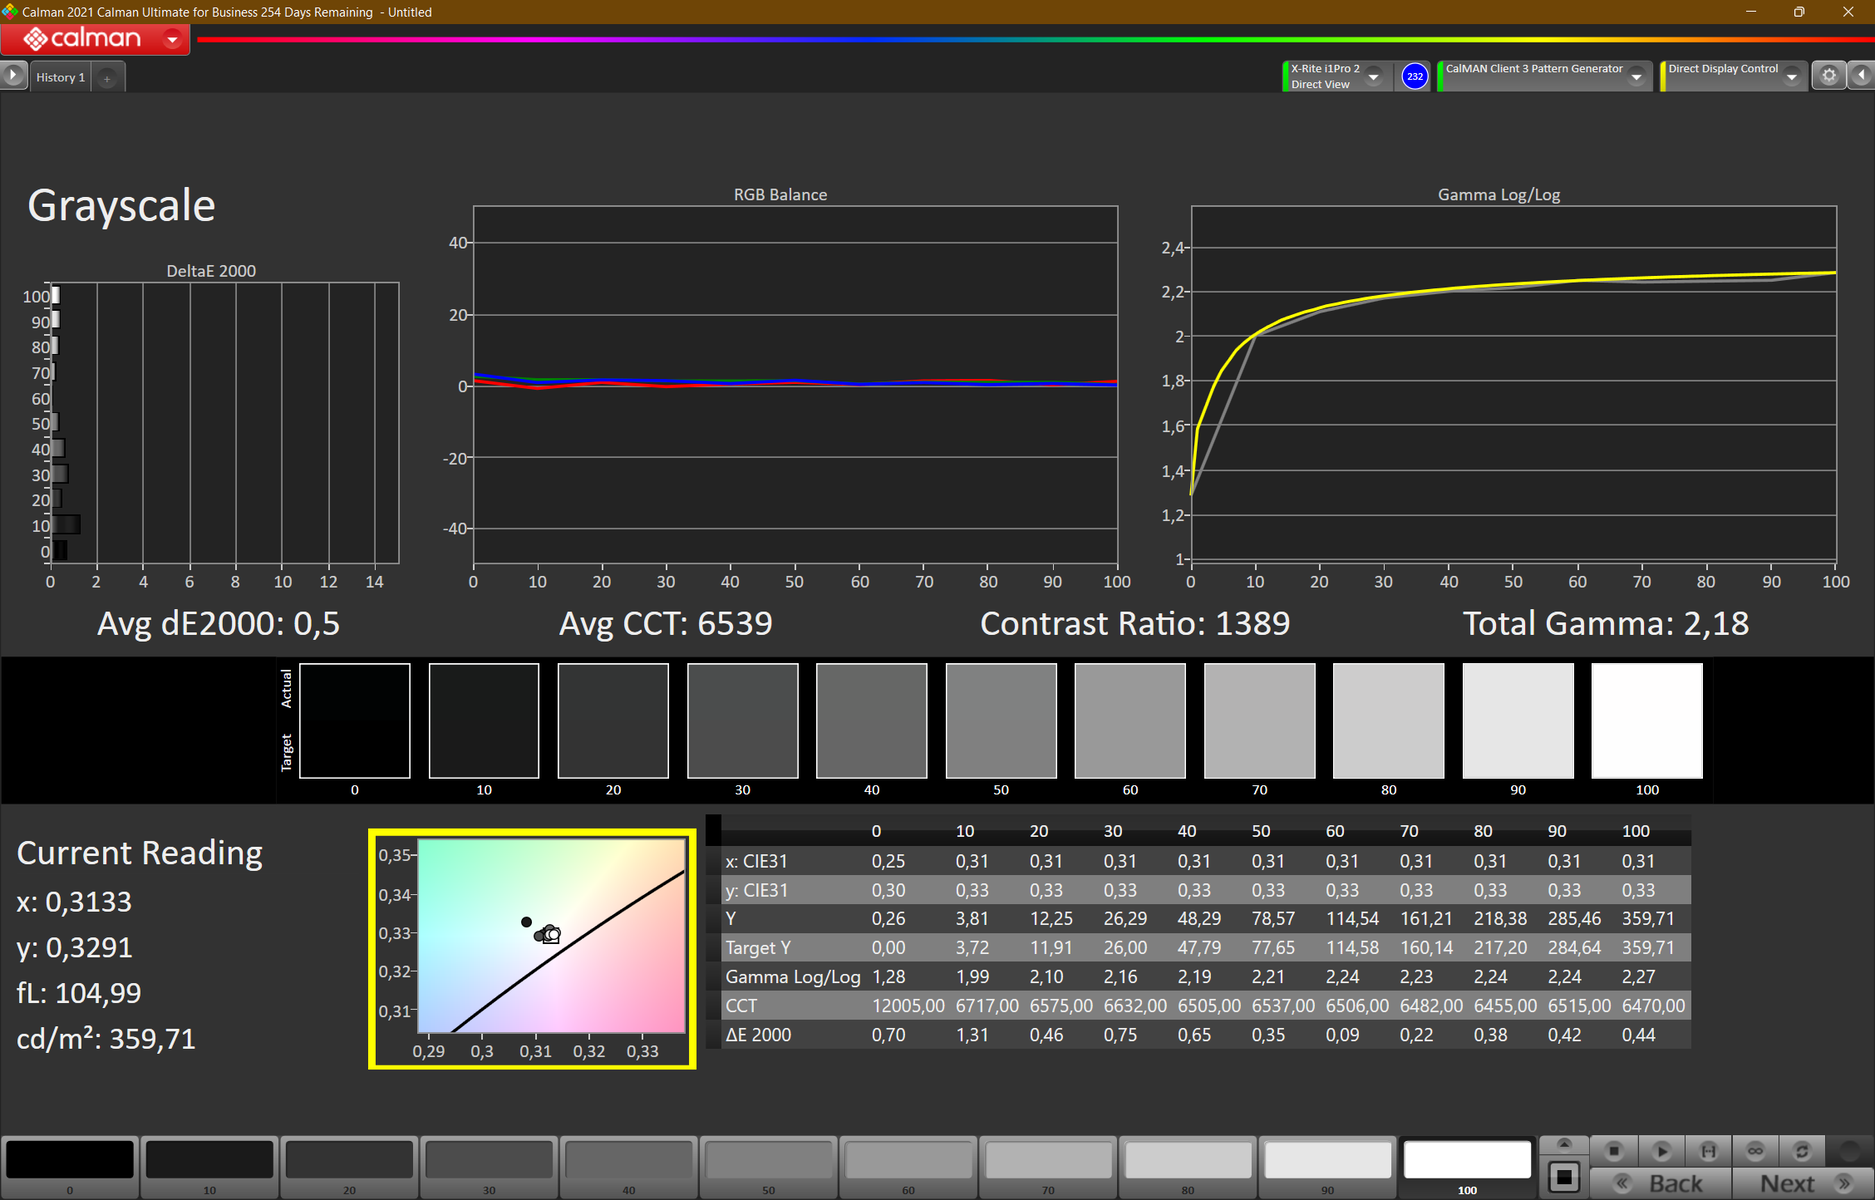
À 6 300K, le point blanc est proche de l'optimum de 6 500K. Les couleurs sont également relativement vives et, selon notre étalonnage, assez équilibrées. Le DeltaE-2000 passe ainsi de 3,9 à un très bon 1,7, bien que le rouge s'écarte encore fortement.
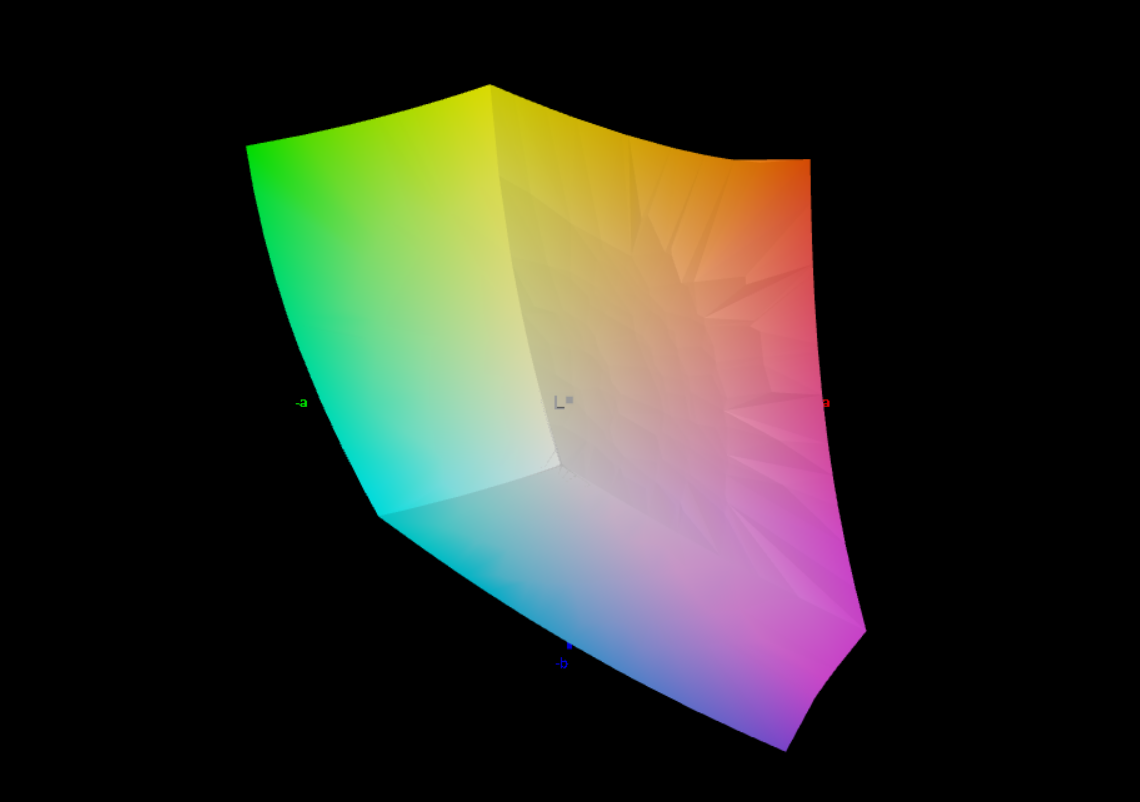
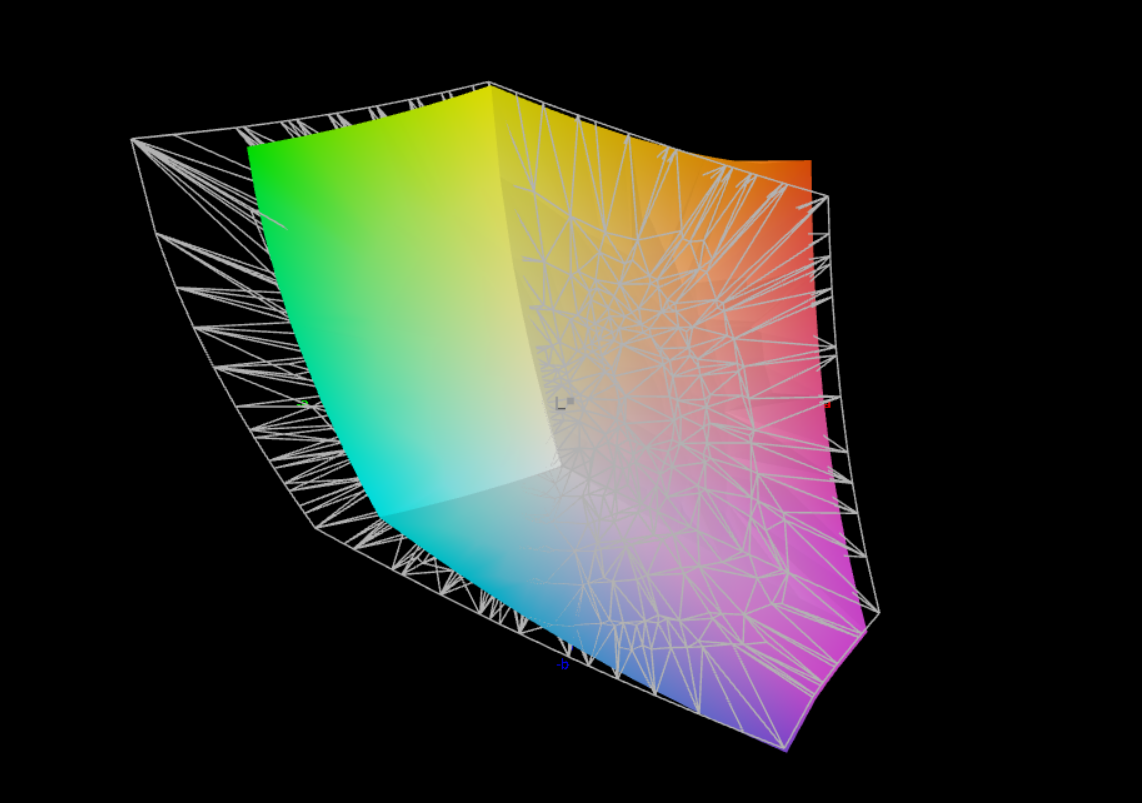
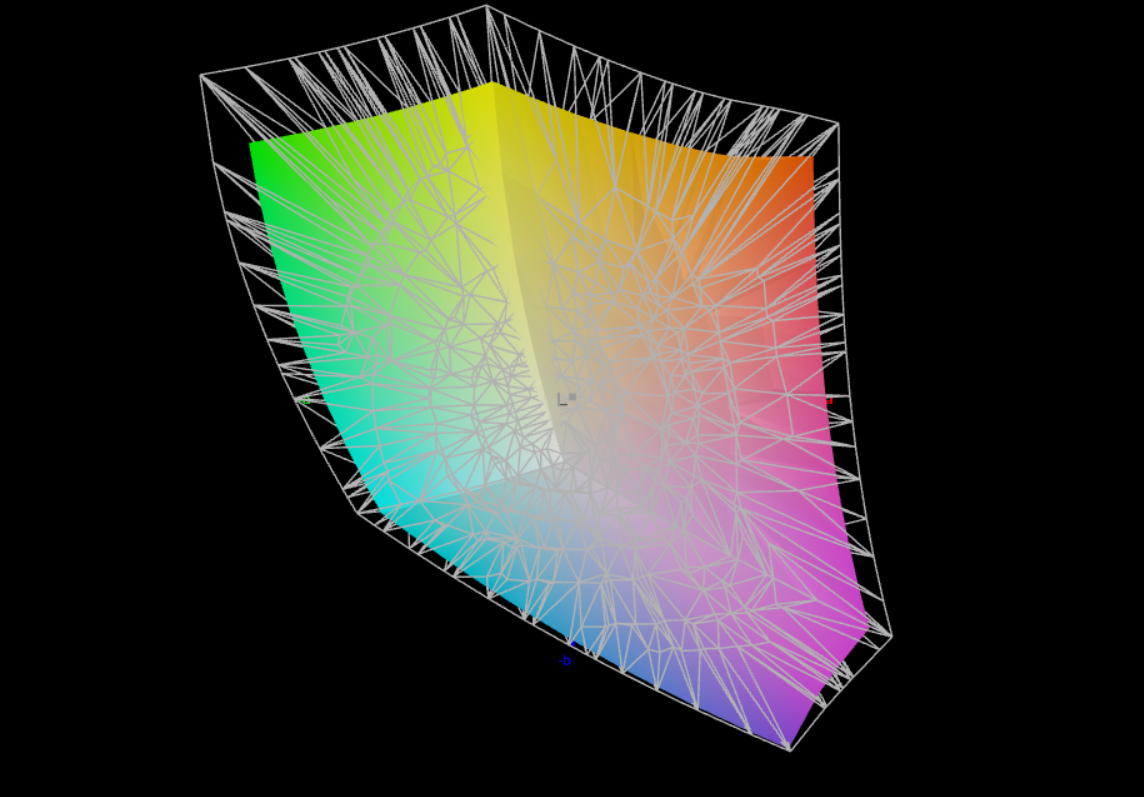
L'espace de couleur sRGB est couvert à 100%, ce qui est suffisant pour une édition d'image moins exigeante. Aucun scintillement PWM n'a été détecté. Comme toujours, notre profil de couleur peut être téléchargé à droite du graphique d'illumination. Trois écrans alternatifs sont proposés, le panneau 2,5K étant une nouveauté. Malheureusement, une option 4K UHD avec 100% de DCI-P3 n'est plus disponible. Dans notre champ de comparaison, le panneau FHD+ LP est le plus performant.
- WUXGA (1920x1200) IPS, tactile, mat, 300 cd/m², 45% NTSC
- WUXGA (1920x1200) IPS, faible consommation, mat, 400 cd/m², 100% sRGB, faible lumière bleue
- WUXGA (1920x1200) IPS, mat, tactile, PrivacyGuard, 500 cd/m², 100% sRGB
- WQXGA (2 560x1 600) IPS, mat, faible consommation, 400 cd/m², 100 % sRGB, faible lumière bleue
| |||||||||||||||||||||||||
Homogénéité de la luminosité: 80 %
Valeur mesurée au centre, sur batterie: 404 cd/m²
Contraste: 1393:1 (Valeurs des noirs: 0.29 cd/m²)
ΔE ColorChecker Calman: 3.9 | ∀{0.5-29.43 Ø4.72}
calibrated: 1.7
ΔE Greyscale Calman: 5.4 | ∀{0.09-98 Ø4.97}
80.5% AdobeRGB 1998 (Argyll 3D)
100% sRGB (Argyll 3D)
80.1% Display P3 (Argyll 3D)
Gamma: 2.21
CCT: 6242 K
| Lenovo ThinkPad T16 G1 21BWS00200 B160UAN01.K, IPS, 1920x1200, 16" | Lenovo ThinkPad T15 Gen2-20W5S00100 B156HAN02.1, IPS, 1920x1080, 15.6" | Huawei MateBook D 16 2022 BOE NV160WUM-NH0, IPS, 1920x1200, 16" | Dell Inspiron 16 Plus 7620 BOE NE16N41, IPS, 3072x1920, 16" | HP ZBook Power 15 G8 313S5EA AUOA08B, IPS LED, 1920x1080, 15.6" | HP ProBook 450 G9 6A180EA Chi Mei CMN1512, , 1920x1080, 15.6" | Lenovo ThinkPad E15 G3-20YG003UGE B156HAN02.1, IPS, 1920x1080, 15.6" | Lenovo ThinkPad L15 G2 AMD N156HCA-EAB, IPS LED, 1920x1080, 15.6" | |
|---|---|---|---|---|---|---|---|---|
| Display | -46% | -12% | -7% | -8% | -43% | -46% | -41% | |
| Display P3 Coverage (%) | 80.1 | 40.18 -50% | 66.2 -17% | 70.8 -12% | 70.5 -12% | 42.76 -47% | 40.3 -50% | 43.8 -45% |
| sRGB Coverage (%) | 100 | 60.2 -40% | 96.4 -4% | 99.5 0% | 99 -1% | 63.9 -36% | 60.2 -40% | 65.7 -34% |
| AdobeRGB 1998 Coverage (%) | 80.5 | 41.55 -48% | 68.3 -15% | 73.2 -9% | 71.3 -11% | 44.2 -45% | 41.6 -48% | 45.3 -44% |
| Response Times | -85% | -12% | -53% | -125% | -11% | -71% | -62% | |
| Response Time Grey 50% / Grey 80% * (ms) | 27 ? | 48.8 ? -81% | 30.5 ? -13% | 38 ? -41% | 61 -126% | 28 ? -4% | 44 ? -63% | 40 -48% |
| Response Time Black / White * (ms) | 17 ? | 32 ? -88% | 18.7 ? -10% | 28 ? -65% | 38 ? -124% | 20 ? -18% | 30.4 ? -79% | 30 -76% |
| PWM Frequency (Hz) | ||||||||
| Screen | -39% | 7% | 22% | 25% | -34% | -27% | -18% | |
| Brightness middle (cd/m²) | 404 | 353 -13% | 319 -21% | 288.9 -28% | 393 -3% | 234 -42% | 347 -14% | 298 -26% |
| Brightness (cd/m²) | 391 | 348 -11% | 317 -19% | 276 -29% | 385 -2% | 218 -44% | 329 -16% | 276 -29% |
| Brightness Distribution (%) | 80 | 95 19% | 90 13% | 92 15% | 78 -2% | 85 6% | 93 16% | 86 8% |
| Black Level * (cd/m²) | 0.29 | 0.2 31% | 0.23 21% | 0.26 10% | 0.25 14% | 0.17 41% | 0.25 14% | 0.26 10% |
| Contrast (:1) | 1393 | 1765 27% | 1387 0% | 1111 -20% | 1572 13% | 1376 -1% | 1388 0% | 1146 -18% |
| Colorchecker dE 2000 * | 3.9 | 6.1 -56% | 3.4 13% | 1.88 52% | 1.5 62% | 5.04 -29% | 4.7 -21% | 3.7 5% |
| Colorchecker dE 2000 max. * | 8.5 | 23.5 -176% | 8.1 5% | 4.37 49% | 4.3 49% | 18.04 -112% | 19.4 -128% | 15 -76% |
| Colorchecker dE 2000 calibrated * | 1.7 | 4.9 -188% | 0.8 53% | 0.42 75% | 1.4 18% | 4.13 -143% | 4.4 -159% | 3.5 -106% |
| Greyscale dE 2000 * | 5.4 | 4.6 15% | 5.7 -6% | 1.4 74% | 1.3 76% | 4.43 18% | 1.7 69% | 1.7 69% |
| Gamma | 2.21 100% | 2.26 97% | 2.1 105% | 2.3 96% | 2.26 97% | 2.41 91% | 2.2 100% | 2.21 100% |
| CCT | 6242 104% | 6732 97% | 7433 87% | 6634 98% | 6435 101% | 6350 102% | 6475 100% | 6588 99% |
| Color Space (Percent of AdobeRGB 1998) (%) | 38.2 | |||||||
| Color Space (Percent of sRGB) (%) | 59.8 | |||||||
| Moyenne finale (programmes/paramètres) | -57% /
-47% | -6% /
0% | -13% /
5% | -36% /
-4% | -29% /
-33% | -48% /
-37% | -40% /
-29% |
* ... Moindre est la valeur, meilleures sont les performances
Temps de réponse de l'écran
| ↔ Temps de réponse noir à blanc | ||
|---|---|---|
| 17 ms ... hausse ↗ et chute ↘ combinées | ↗ 8 ms hausse | 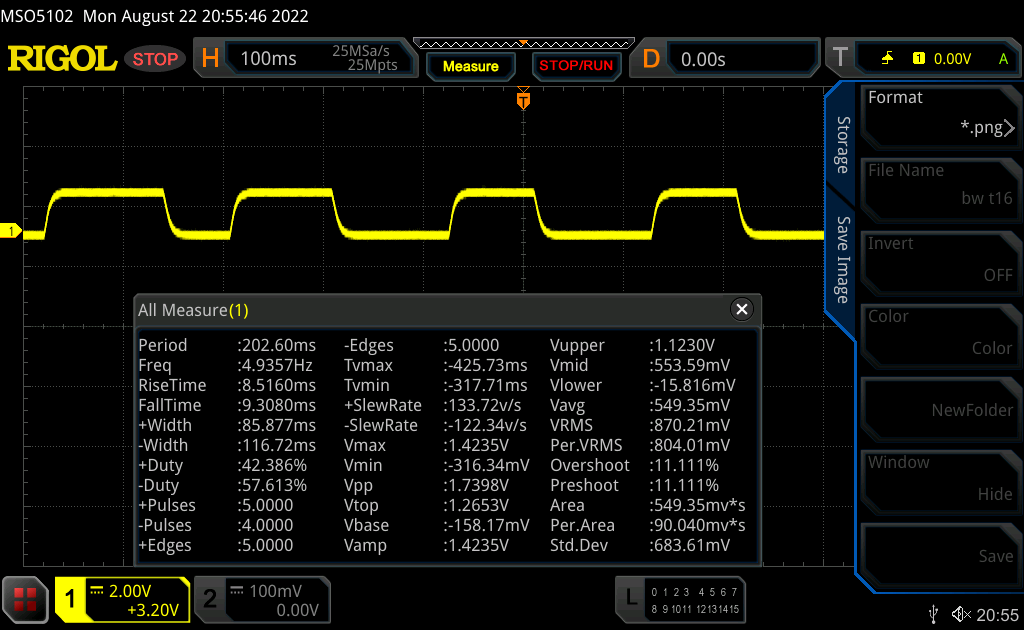 |
| ↘ 9 ms chute | ||
| L'écran montre de bons temps de réponse, mais insuffisant pour du jeu compétitif. En comparaison, tous les appareils testés affichent entre 0.1 (minimum) et 240 (maximum) ms. » 39 % des appareils testés affichent de meilleures performances. Cela signifie que les latences relevées sont meilleures que la moyenne (19.8 ms) de tous les appareils testés. | ||
| ↔ Temps de réponse gris 50% à gris 80% | ||
| 27 ms ... hausse ↗ et chute ↘ combinées | ↗ 12 ms hausse | 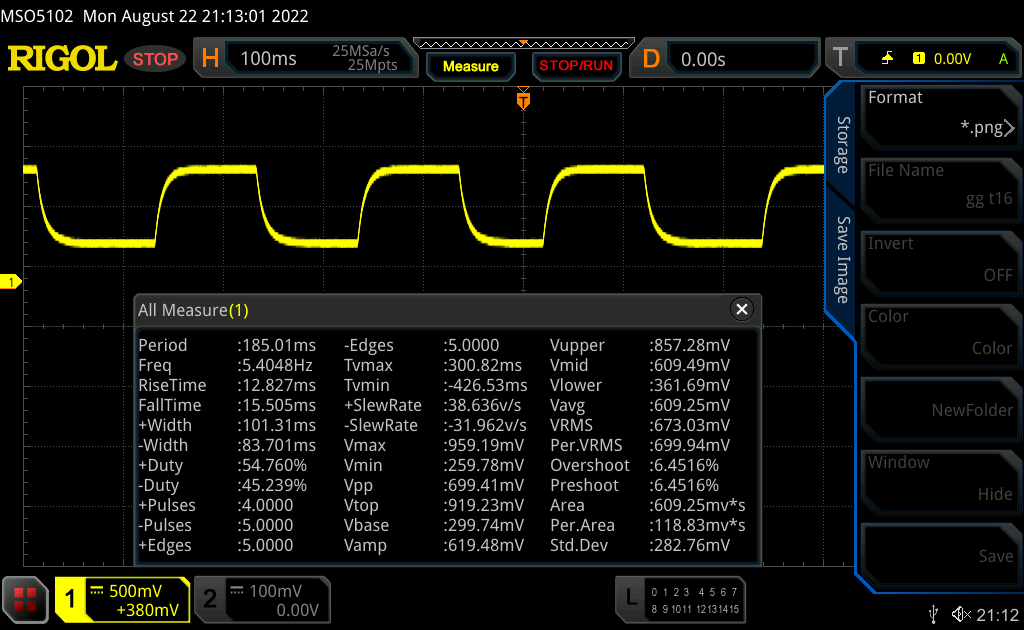 |
| ↘ 15 ms chute | ||
| L'écran souffre de latences relativement élevées, insuffisant pour le jeu. En comparaison, tous les appareils testés affichent entre 0.165 (minimum) et 636 (maximum) ms. » 37 % des appareils testés affichent de meilleures performances. Cela signifie que les latences relevées sont meilleures que la moyenne (31 ms) de tous les appareils testés. | ||
Scintillement / MLI (Modulation de largeur d'impulsion)
| Scintillement / MLI (Modulation de largeur d'impulsion) non décelé | 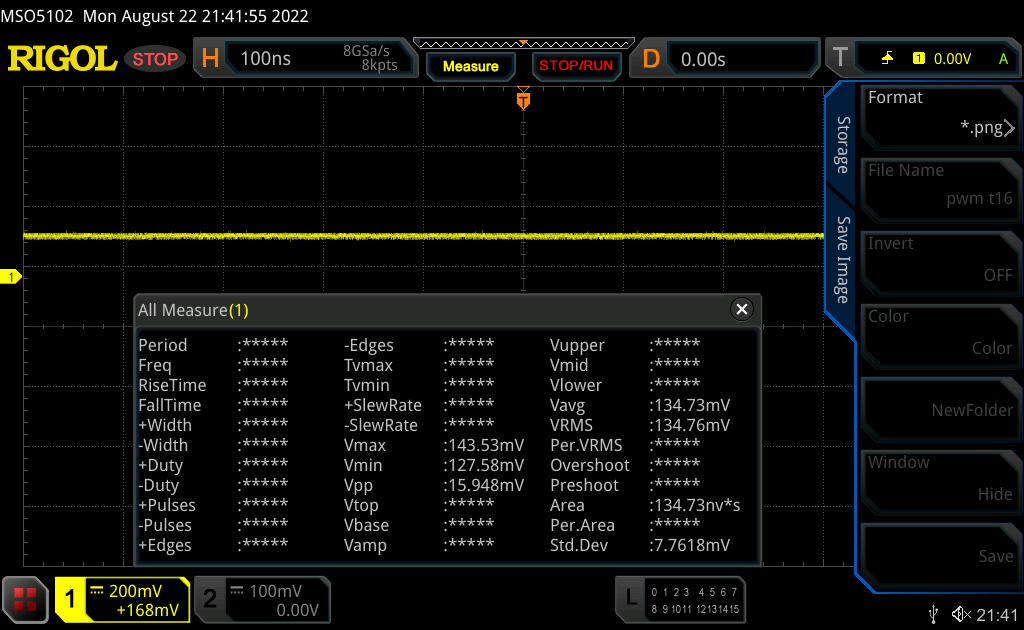 | ||
En comparaison, 52 % des appareils testés n'emploient pas MDI pour assombrir leur écran. Nous avons relevé une moyenne à 7781 (minimum : 5 - maximum : 343500) Hz dans le cas où une MDI était active. | |||
En extérieur, l'écran mat est facile à lire avec une moyenne de 390 nits. Il faut cependant éviter la lumière directe du soleil.

Performances - Lenovo limite avec un étranglement artificiel
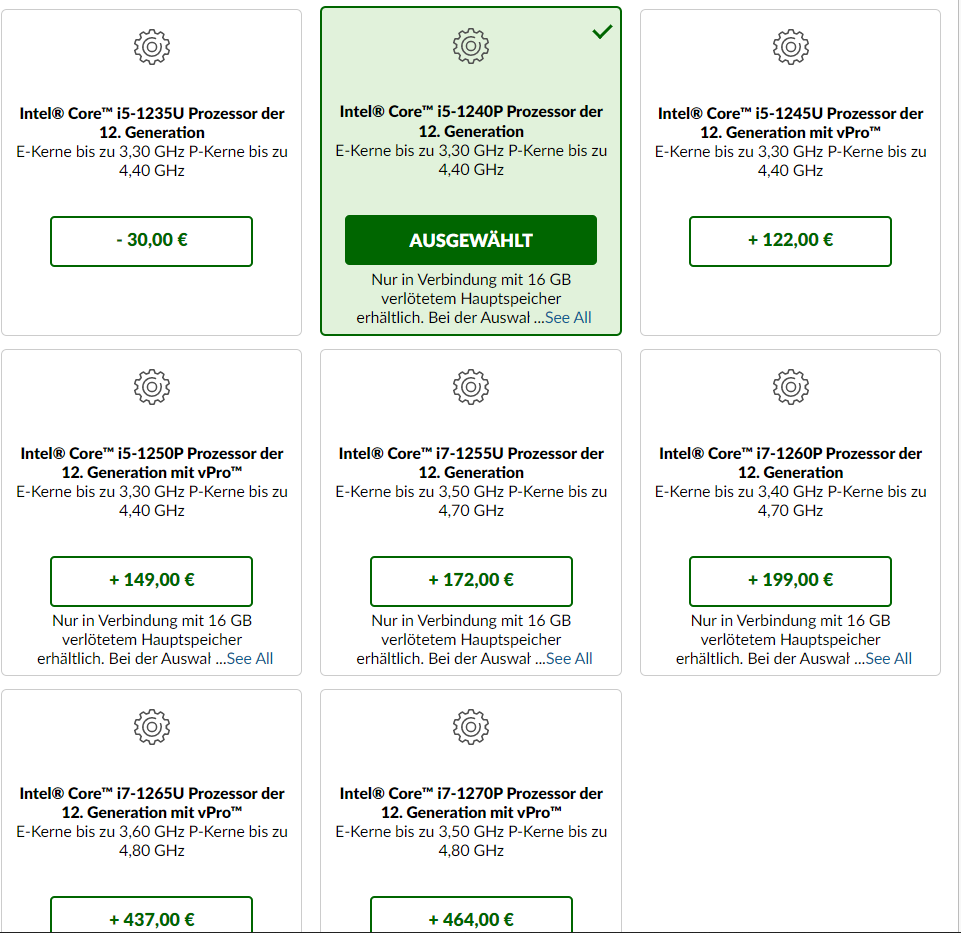
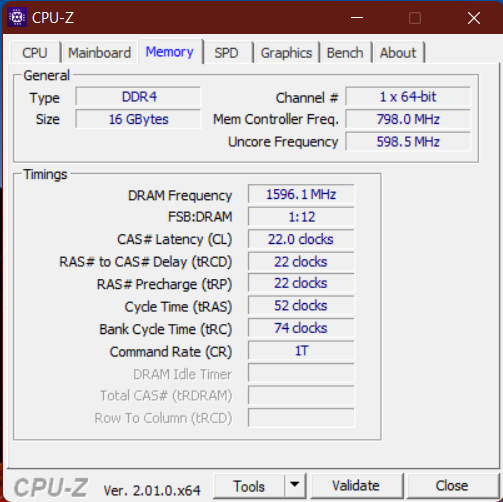
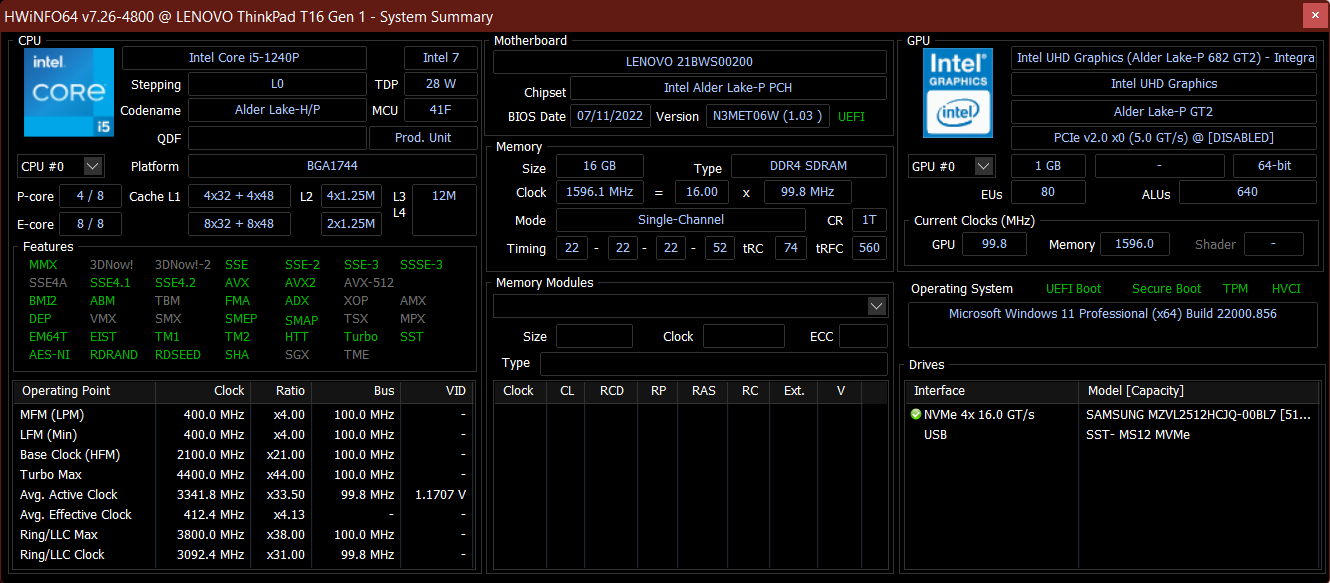
Notre modèle est équipé de 16 Go de RAM DDR4-3200 soudée (monocanal) et est alimenté par le Core i5-1240Pavec une unité graphique intégrée. En outre, il y a un SSD de 512 Go au standard PCIe 4.0. Le système est destiné aux tâches de bureau et autres tâches professionnelles typiques.
Il n'est pas destiné à l'édition vidéo et aux jeux et n'est disponible que dans des configurations alternatives avec le modèle GeForce MX550plus de RAM (en SODIMM libre) et éventuellement un CPU plus puissant (i7-1280Pcomme il existe également des modèles avec AMD cette année, cette option vaut la peine d'être envisagée. Nous tenterons de passer en revue un tel modèle.
Conditions d'essai
Lenovo ne propose pas ses propres profils d'alimentation pour ses ThinkPad, mais les intègre dans les paramètres énergétiques de Windows. Le mode automatique du "refroidissement intelligent" peut être désactivé avec "Fn+T". Les benchmarks liés aux performances ont été réalisés sous le profil de performance maximale avec le mode auto désactivé
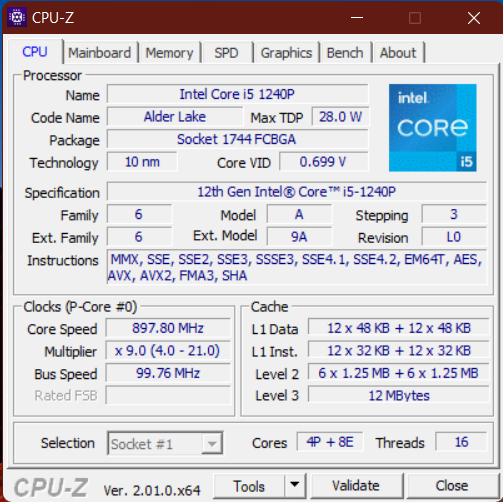
Processeur
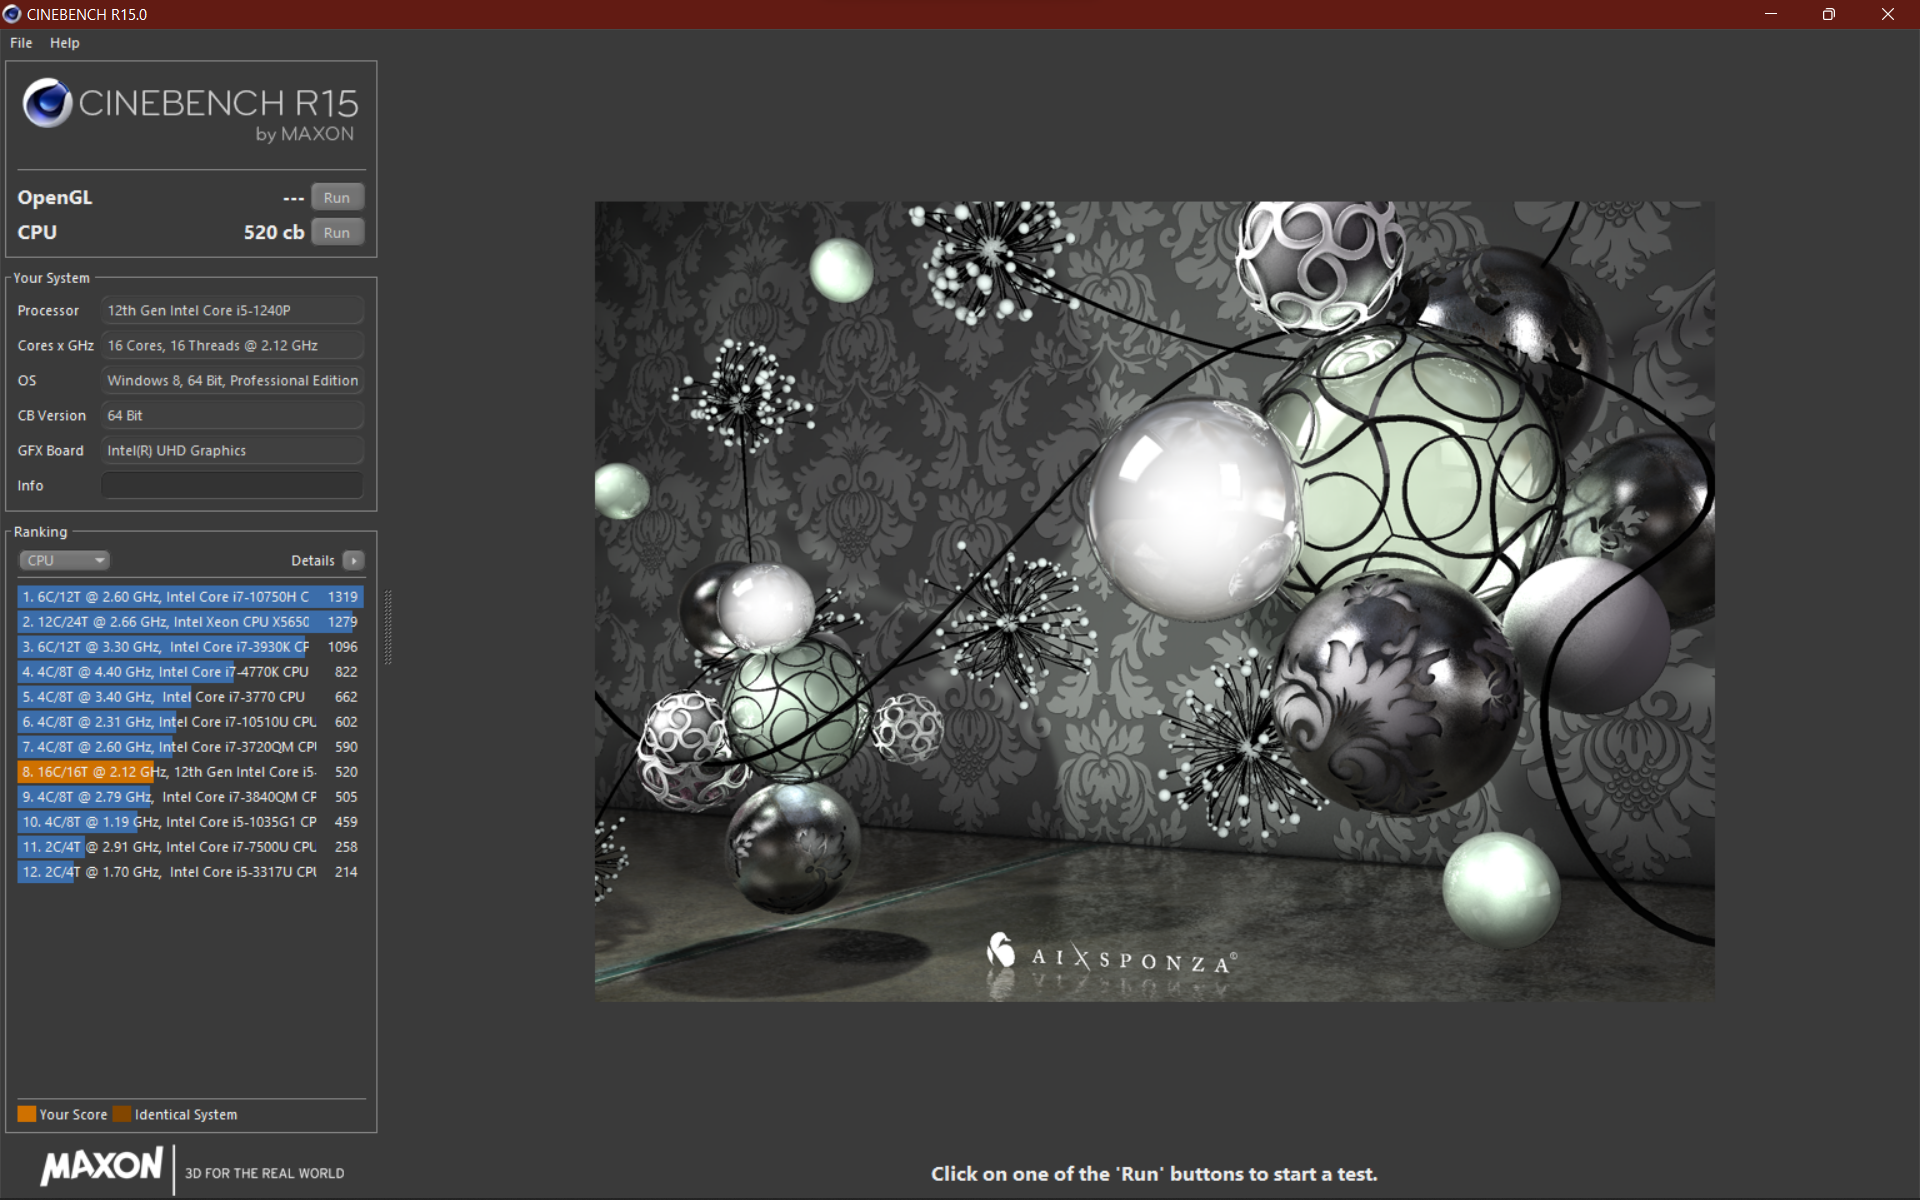
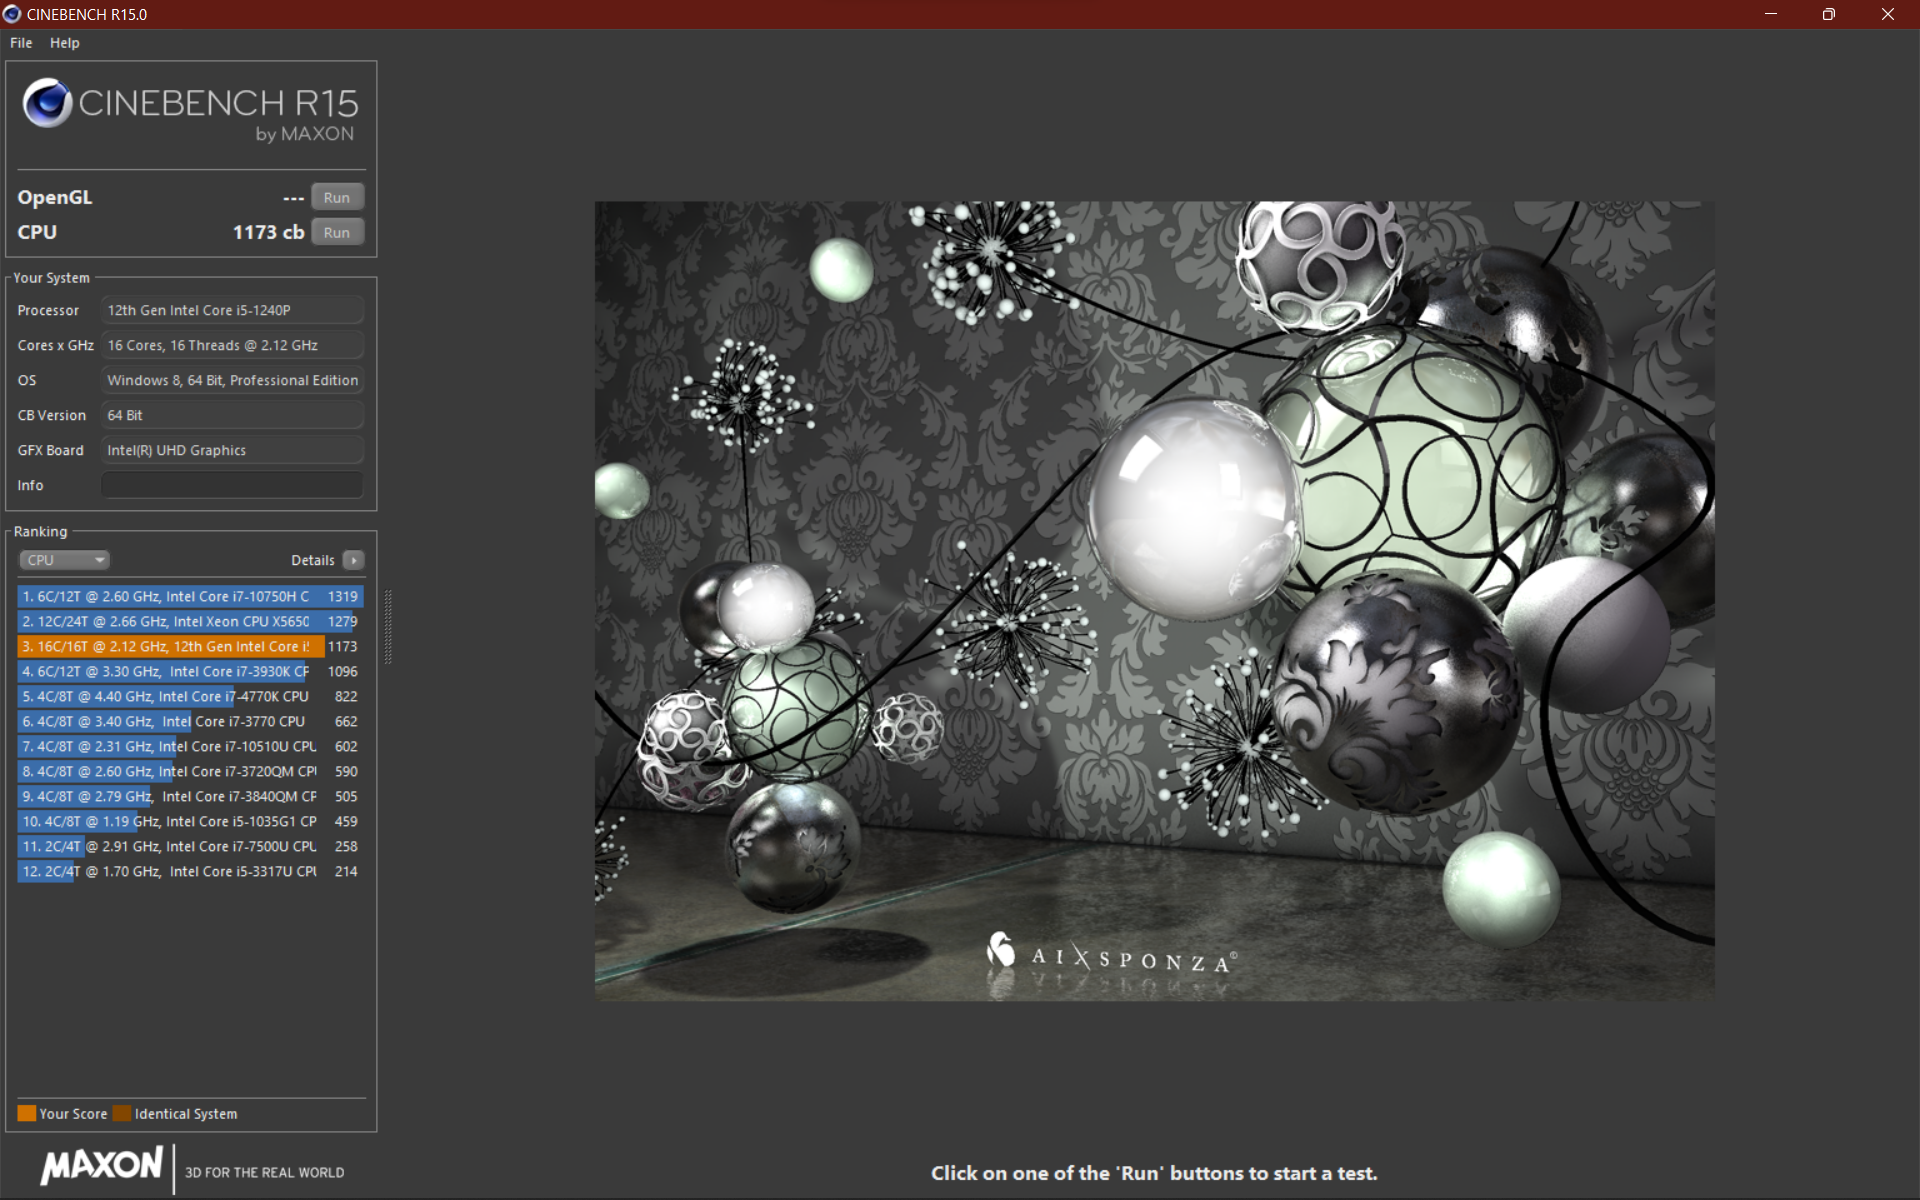
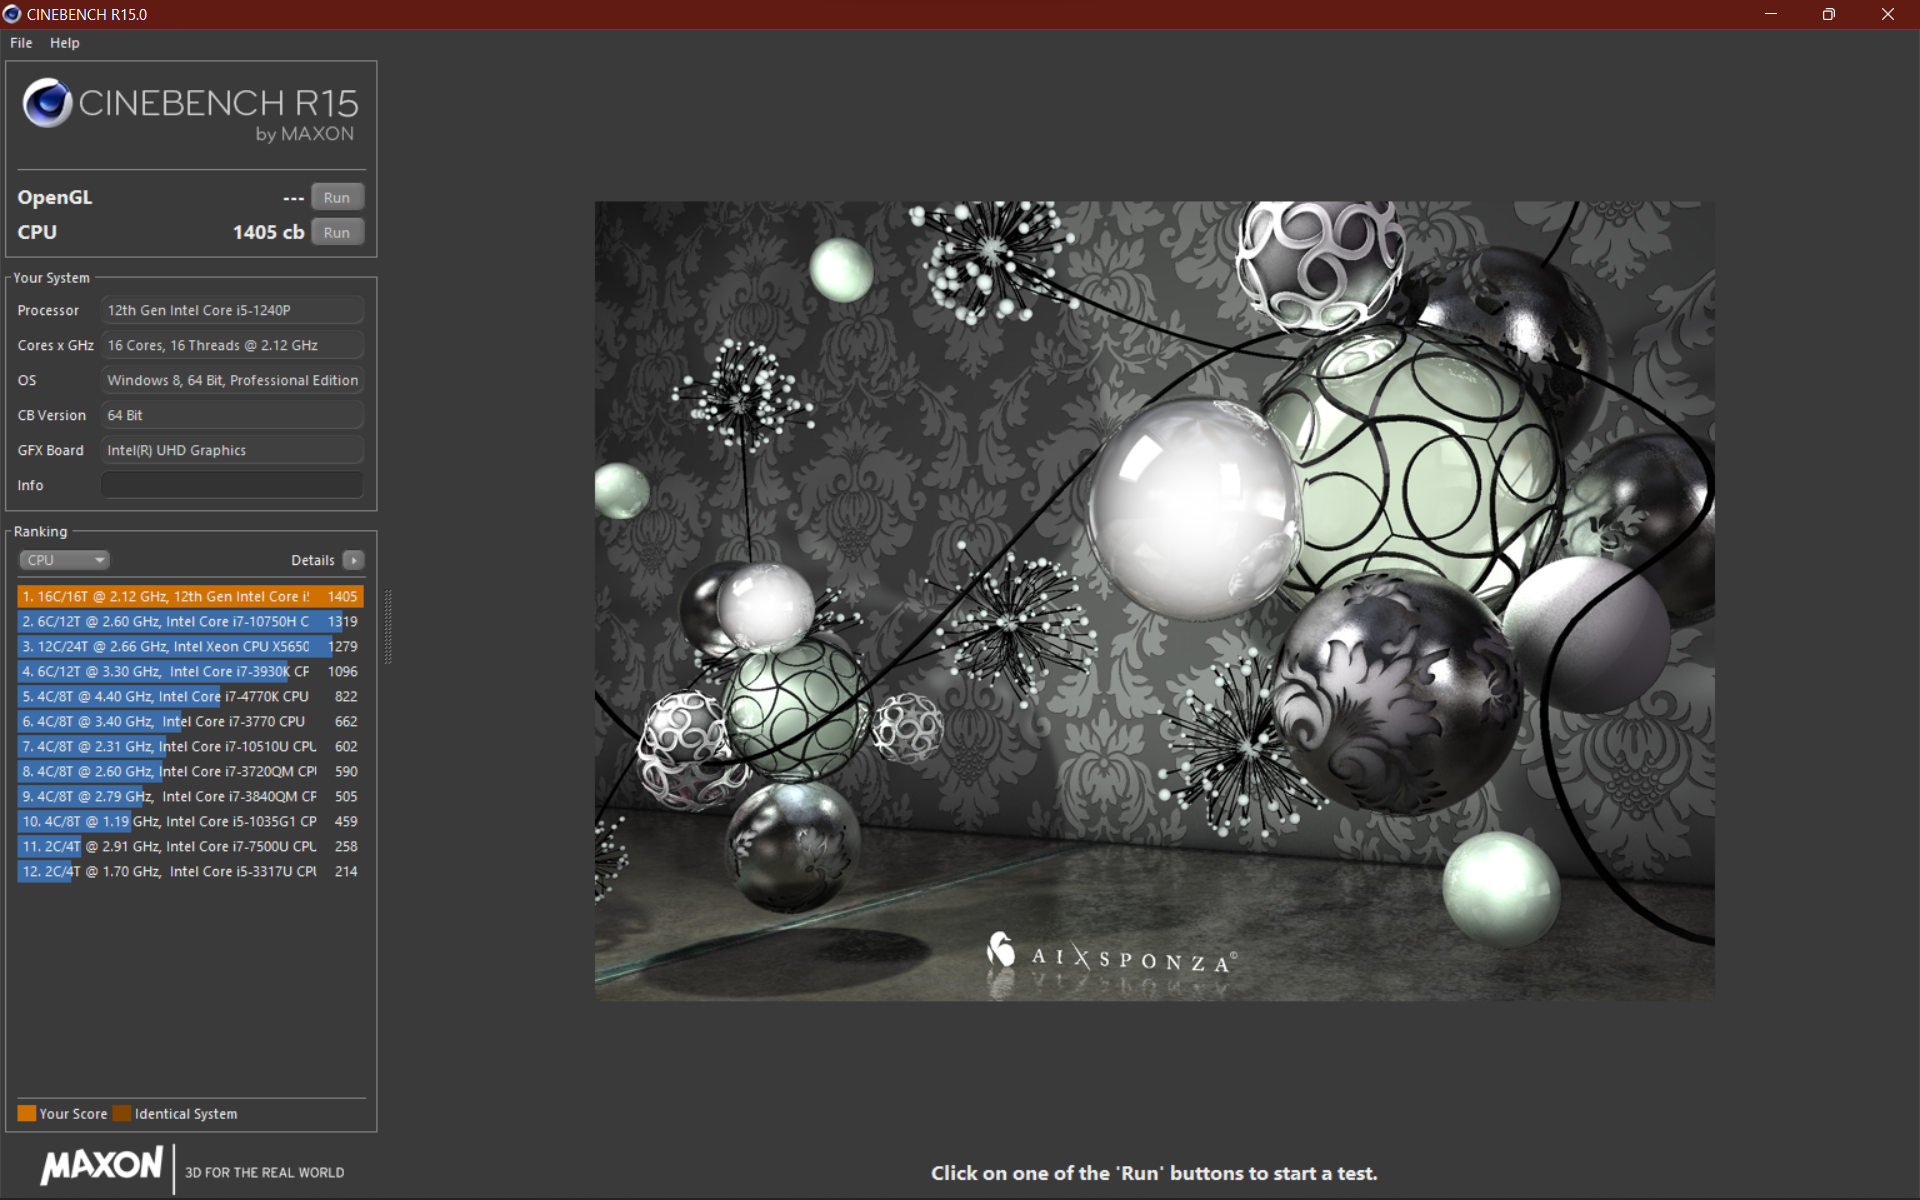
L'Intel Core i5-1240P est un processeur à 12 cœurs avec 4 cœurs de performance et 8 cœurs d'efficacité. Le TDP de 28 W est utilisé pour la première fois dans la série T de Lenovo. Toutefois, nos tests révèlent que Lenovo limite le PL1 à 20 watts, tandis que le turbo court de 12 secondes (PL2) est de 59 watts.
Les températures très basses de 63 °C prouvent que cette approche restreint inutilement les performances et suffit juste à atteindre l'horloge de base de 1,7 GHz. Ceci est incompréhensible, puisque le prédécesseur tourne constamment à 35 watts. Par conséquent, il en résulte une performance soutenue de seulement 15 % supérieure à celle duprédécesseuralors que le ThinkPad E15 équipé du processeur Ryzen de l'année dernière est environ 50 % plus rapide. D'autre part, le T16 est très rapide dans les tâches qui nécessitent de courts boosts.
Si l'étranglement, qui a été confirmé par de nombreuses sources comme se produisant également dans le T14 G3(même carte mère), n'est pas corrigé par une mise à jour du BIOS à l'avenir, AMD serait probablement le meilleur choix ici, puisque les Ryzens peuvent fournir de bien meilleurs résultats avec peu d'énergie de bien meilleurs résultats avec peu de puissance.
En mode batterie, la puissance est encore limitée à 10 watts, mais "Max Performance on Battery" peut être réglé dans le BIOS, de sorte que le résultat est à nouveau plus ou moins le même. Un total de 30 watts peut être maintenu à l'aide de l'outil "ThrottleStop", mais il n'est pas recommandé d'outrepasser les paramètres choisis par le fabricant.


Cinebench R15 Multi Sustained Load
Cinebench R23: Multi Core | Single Core
Cinebench R20: CPU (Multi Core) | CPU (Single Core)
Cinebench R15: CPU Multi 64Bit | CPU Single 64Bit
Blender: v2.79 BMW27 CPU | v3.3 Classroom CPU
7-Zip 18.03: 7z b 4 | 7z b 4 -mmt1
Geekbench 5.5: Multi-Core | Single-Core
HWBOT x265 Benchmark v2.2: 4k Preset
LibreOffice : 20 Documents To PDF
R Benchmark 2.5: Overall mean
V-Ray 5 Benchmark: CPU
V-Ray Benchmark Next 4.10: CPU
| CPU Performance rating | |
| Dell Inspiron 16 Plus 7620 -1! | |
| Huawei MateBook D 16 2022 -1! | |
| Asus Vivobook Pro 16X-M7600QE -2! | |
| Lenovo ThinkPad X1 Extreme G4-20Y5CTO1WW (3050 Ti) -2! | |
| HP ZBook Power 15 G8 313S5EA -2! | |
| Moyenne de la classe Office | |
| Lenovo ThinkPad T16 G1 21BWS00200 | |
| Lenovo ThinkPad E15 G3-20YG003UGE -2! | |
| Lenovo ThinkPad L15 G2 AMD -1! | |
| Moyenne Intel Core i5-1240P | |
| Lenovo ThinkPad T15 Gen2-20W5S00100 -4! | |
| HP ProBook 450 G9 6A180EA | |
| Blender / v3.3 Classroom CPU | |
| HP ProBook 450 G9 6A180EA | |
| Moyenne Intel Core i5-1240P (552 - 3047, n=12) | |
| Lenovo ThinkPad T16 G1 21BWS00200 | |
| Moyenne de la classe Office (245 - 3219, n=72, 2 dernières années) | |
| Huawei MateBook D 16 2022 | |
| Dell Inspiron 16 Plus 7620 | |
| HWBOT x265 Benchmark v2.2 / 4k Preset | |
| Dell Inspiron 16 Plus 7620 | |
| Asus Vivobook Pro 16X-M7600QE | |
| Asus Vivobook Pro 16X-M7600QE | |
| HP ZBook Power 15 G8 313S5EA | |
| Huawei MateBook D 16 2022 | |
| Lenovo ThinkPad X1 Extreme G4-20Y5CTO1WW (3050 Ti) | |
| Moyenne de la classe Office (2.21 - 26, n=74, 2 dernières années) | |
| Lenovo ThinkPad E15 G3-20YG003UGE | |
| Lenovo ThinkPad L15 G2 AMD | |
| Moyenne Intel Core i5-1240P (1.99 - 12.9, n=16) | |
| Lenovo ThinkPad T16 G1 21BWS00200 | |
| Lenovo ThinkPad T15 Gen2-20W5S00100 | |
| HP ProBook 450 G9 6A180EA | |
| V-Ray 5 Benchmark / CPU | |
| Dell Inspiron 16 Plus 7620 | |
| Moyenne de la classe Office (5027 - 13111, n=20, 2 dernières années) | |
| Lenovo ThinkPad L15 G2 AMD | |
| Lenovo ThinkPad T16 G1 21BWS00200 | |
| Moyenne Intel Core i5-1240P (1334 - 7321, n=6) | |
| HP ProBook 450 G9 6A180EA | |
* ... Moindre est la valeur, meilleures sont les performances
AIDA64: FP32 Ray-Trace | FPU Julia | CPU SHA3 | CPU Queen | FPU SinJulia | FPU Mandel | CPU AES | CPU ZLib | FP64 Ray-Trace | CPU PhotoWorxx
| Performance rating | |
| Lenovo ThinkPad X1 Extreme G4-20Y5CTO1WW (3050 Ti) | |
| HP ZBook Power 15 G8 313S5EA | |
| Dell Inspiron 16 Plus 7620 | |
| Huawei MateBook D 16 2022 | |
| Moyenne de la classe Office | |
| Lenovo ThinkPad E15 G3-20YG003UGE | |
| Lenovo ThinkPad L15 G2 AMD | |
| Lenovo ThinkPad T16 G1 21BWS00200 | |
| Moyenne Intel Core i5-1240P | |
| HP ProBook 450 G9 6A180EA | |
| AIDA64 / FP32 Ray-Trace | |
| HP ZBook Power 15 G8 313S5EA | |
| Lenovo ThinkPad X1 Extreme G4-20Y5CTO1WW (3050 Ti) | |
| Moyenne de la classe Office (2083 - 31245, n=80, 2 dernières années) | |
| Dell Inspiron 16 Plus 7620 | |
| Huawei MateBook D 16 2022 | |
| Lenovo ThinkPad E15 G3-20YG003UGE | |
| Lenovo ThinkPad L15 G2 AMD | |
| Lenovo ThinkPad T16 G1 21BWS00200 | |
| Moyenne Intel Core i5-1240P (2405 - 9694, n=16) | |
| HP ProBook 450 G9 6A180EA | |
| AIDA64 / FPU Julia | |
| Dell Inspiron 16 Plus 7620 | |
| Lenovo ThinkPad E15 G3-20YG003UGE | |
| Lenovo ThinkPad X1 Extreme G4-20Y5CTO1WW (3050 Ti) | |
| HP ZBook Power 15 G8 313S5EA | |
| Moyenne de la classe Office (8191 - 125394, n=80, 2 dernières années) | |
| Huawei MateBook D 16 2022 | |
| Lenovo ThinkPad L15 G2 AMD | |
| Lenovo ThinkPad T16 G1 21BWS00200 | |
| Moyenne Intel Core i5-1240P (7407 - 49934, n=16) | |
| HP ProBook 450 G9 6A180EA | |
| AIDA64 / CPU SHA3 | |
| Lenovo ThinkPad X1 Extreme G4-20Y5CTO1WW (3050 Ti) | |
| HP ZBook Power 15 G8 313S5EA | |
| Dell Inspiron 16 Plus 7620 | |
| Moyenne de la classe Office (433 - 5755, n=80, 2 dernières années) | |
| Huawei MateBook D 16 2022 | |
| Lenovo ThinkPad E15 G3-20YG003UGE | |
| Lenovo ThinkPad L15 G2 AMD | |
| Lenovo ThinkPad T16 G1 21BWS00200 | |
| Moyenne Intel Core i5-1240P (415 - 2462, n=16) | |
| HP ProBook 450 G9 6A180EA | |
| AIDA64 / CPU Queen | |
| Huawei MateBook D 16 2022 | |
| Dell Inspiron 16 Plus 7620 | |
| Lenovo ThinkPad X1 Extreme G4-20Y5CTO1WW (3050 Ti) | |
| HP ZBook Power 15 G8 313S5EA | |
| Lenovo ThinkPad E15 G3-20YG003UGE | |
| Lenovo ThinkPad T16 G1 21BWS00200 | |
| Lenovo ThinkPad L15 G2 AMD | |
| Moyenne Intel Core i5-1240P (29405 - 76736, n=16) | |
| Moyenne de la classe Office (22784 - 115197, n=69, 2 dernières années) | |
| HP ProBook 450 G9 6A180EA | |
| AIDA64 / FPU SinJulia | |
| Lenovo ThinkPad E15 G3-20YG003UGE | |
| HP ZBook Power 15 G8 313S5EA | |
| Lenovo ThinkPad X1 Extreme G4-20Y5CTO1WW (3050 Ti) | |
| Dell Inspiron 16 Plus 7620 | |
| Lenovo ThinkPad L15 G2 AMD | |
| Huawei MateBook D 16 2022 | |
| Moyenne de la classe Office (1378 - 18321, n=80, 2 dernières années) | |
| Lenovo ThinkPad T16 G1 21BWS00200 | |
| Moyenne Intel Core i5-1240P (2135 - 6540, n=16) | |
| HP ProBook 450 G9 6A180EA | |
| AIDA64 / FPU Mandel | |
| HP ZBook Power 15 G8 313S5EA | |
| Lenovo ThinkPad X1 Extreme G4-20Y5CTO1WW (3050 Ti) | |
| Lenovo ThinkPad E15 G3-20YG003UGE | |
| Moyenne de la classe Office (4601 - 66922, n=80, 2 dernières années) | |
| Dell Inspiron 16 Plus 7620 | |
| Lenovo ThinkPad L15 G2 AMD | |
| Huawei MateBook D 16 2022 | |
| Lenovo ThinkPad T16 G1 21BWS00200 | |
| Moyenne Intel Core i5-1240P (5113 - 23992, n=16) | |
| HP ProBook 450 G9 6A180EA | |
| AIDA64 / CPU AES | |
| Lenovo ThinkPad X1 Extreme G4-20Y5CTO1WW (3050 Ti) | |
| Huawei MateBook D 16 2022 | |
| HP ZBook Power 15 G8 313S5EA | |
| Lenovo ThinkPad L15 G2 AMD | |
| Dell Inspiron 16 Plus 7620 | |
| Lenovo ThinkPad E15 G3-20YG003UGE | |
| Moyenne de la classe Office (4854 - 155900, n=80, 2 dernières années) | |
| Lenovo ThinkPad T16 G1 21BWS00200 | |
| Moyenne Intel Core i5-1240P (8849 - 90370, n=16) | |
| HP ProBook 450 G9 6A180EA | |
| AIDA64 / CPU ZLib | |
| Dell Inspiron 16 Plus 7620 | |
| Lenovo ThinkPad X1 Extreme G4-20Y5CTO1WW (3050 Ti) | |
| HP ZBook Power 15 G8 313S5EA | |
| Huawei MateBook D 16 2022 | |
| Moyenne de la classe Office (114.6 - 1366, n=80, 2 dernières années) | |
| Lenovo ThinkPad E15 G3-20YG003UGE | |
| Lenovo ThinkPad T16 G1 21BWS00200 | |
| Moyenne Intel Core i5-1240P (101.6 - 812, n=16) | |
| Lenovo ThinkPad L15 G2 AMD | |
| HP ProBook 450 G9 6A180EA | |
| AIDA64 / FP64 Ray-Trace | |
| HP ZBook Power 15 G8 313S5EA | |
| Lenovo ThinkPad X1 Extreme G4-20Y5CTO1WW (3050 Ti) | |
| Moyenne de la classe Office (1109 - 17834, n=80, 2 dernières années) | |
| Dell Inspiron 16 Plus 7620 | |
| Lenovo ThinkPad E15 G3-20YG003UGE | |
| Huawei MateBook D 16 2022 | |
| Lenovo ThinkPad L15 G2 AMD | |
| Lenovo ThinkPad T16 G1 21BWS00200 | |
| Moyenne Intel Core i5-1240P (1154 - 5258, n=16) | |
| HP ProBook 450 G9 6A180EA | |
| AIDA64 / CPU PhotoWorxx | |
| Huawei MateBook D 16 2022 | |
| Moyenne de la classe Office (11090 - 65229, n=80, 2 dernières années) | |
| Dell Inspiron 16 Plus 7620 | |
| Moyenne Intel Core i5-1240P (11873 - 43661, n=16) | |
| Lenovo ThinkPad E15 G3-20YG003UGE | |
| Lenovo ThinkPad X1 Extreme G4-20Y5CTO1WW (3050 Ti) | |
| HP ProBook 450 G9 6A180EA | |
| Lenovo ThinkPad T16 G1 21BWS00200 | |
| HP ZBook Power 15 G8 313S5EA | |
| Lenovo ThinkPad L15 G2 AMD | |
Performance du système
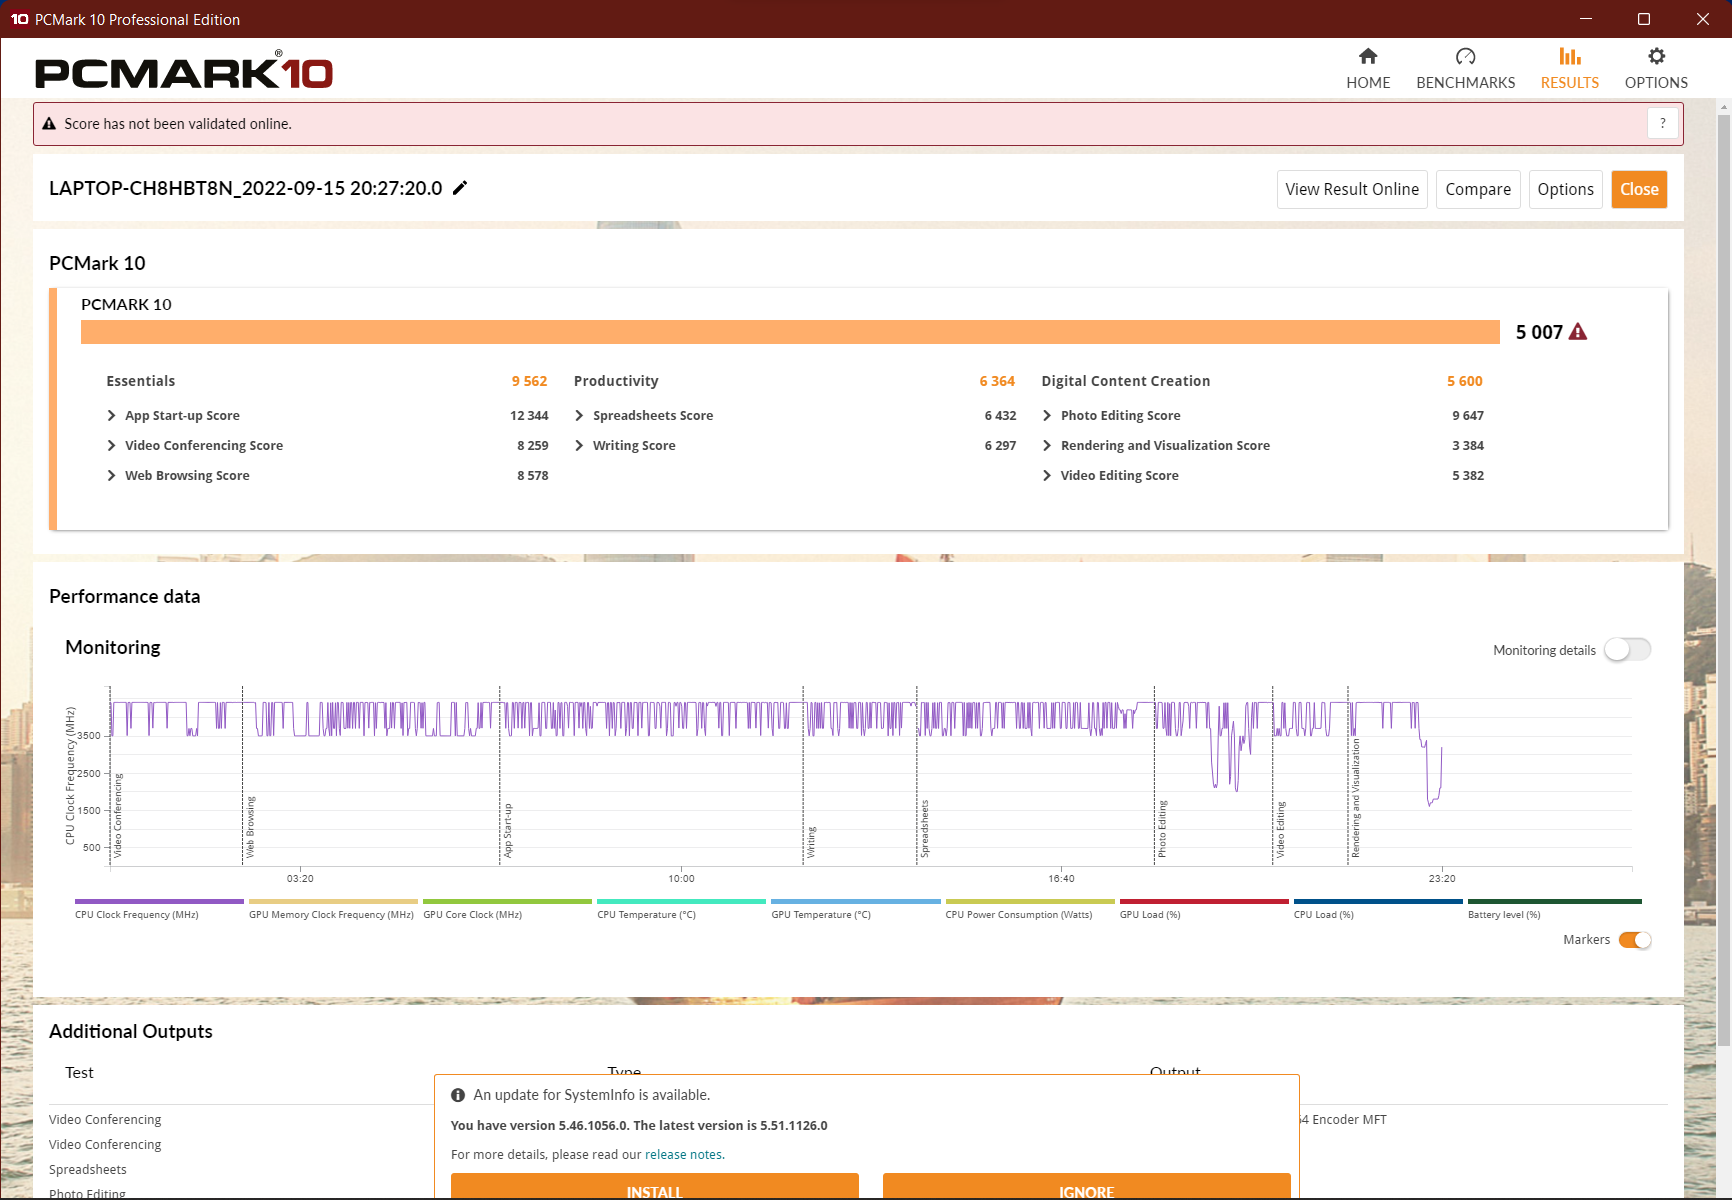
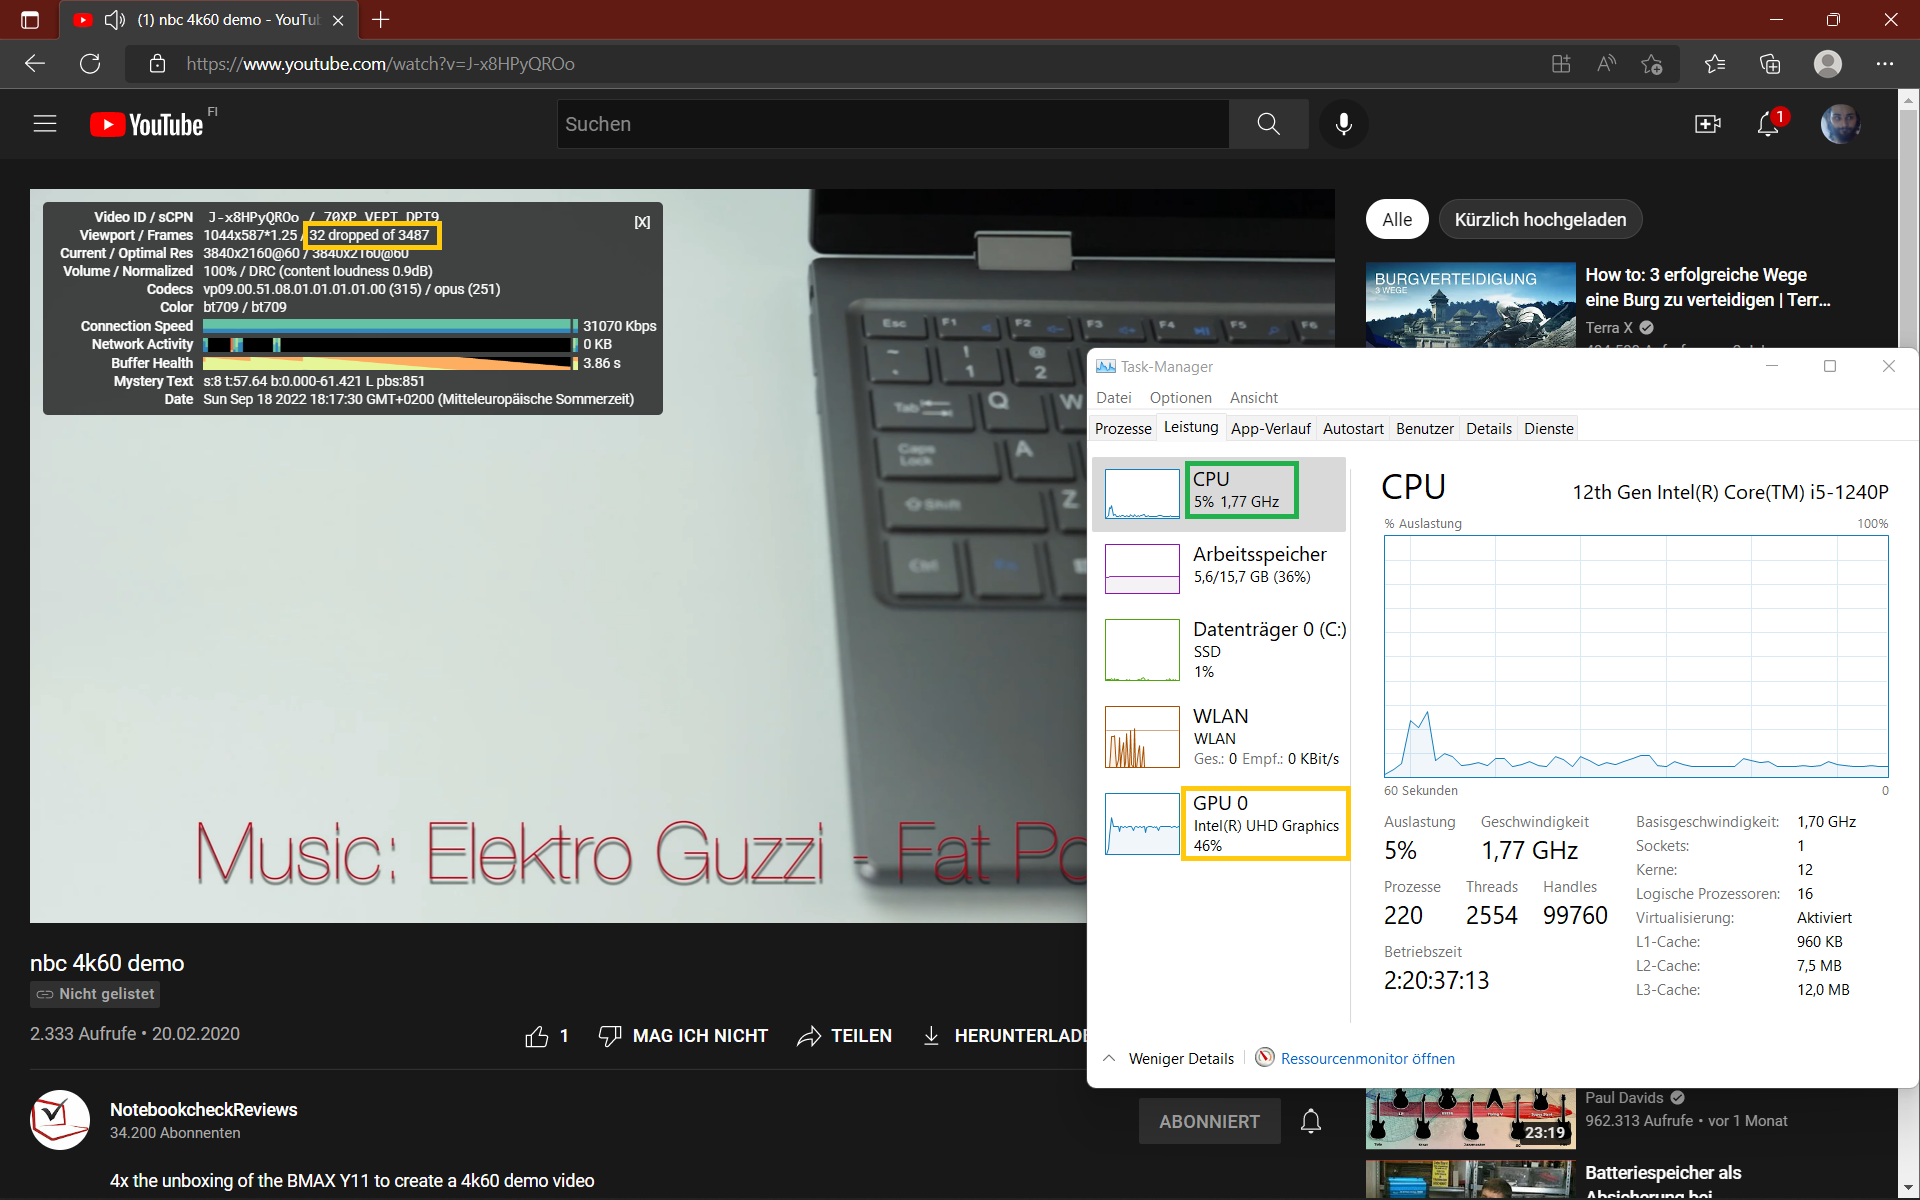
Grâce au fort turbo à court terme, le système est très réactif malgré la RAM monocanal. La navigation sur Internet pendant la lecture de YouTube 4K n'est pas un problème, mais des chutes d'images se produisent.
Cela pourrait certainement être corrigé par l'insertion d'un deuxième module de RAM, ainsi que par l'amélioration des performances globales du système. Le processeur Alder Lake obtient de très bons résultats dans les benchmarks de surf sur le Web grâce au turbo, mais les performances de PCMark sont moyennes.
CrossMark: Overall | Productivity | Creativity | Responsiveness
Sunspider: 1.0 Total Score
Mozilla Kraken 1.1: Total
Speedometer 2.0: Result 2.0
Octane V2: Total Score
Jetstream 2: 2.0 Total
WebXPRT 3: Overall
WebXPRT 4: Overall
| PCMark 10 / Score | |
| Dell Inspiron 16 Plus 7620 | |
| Lenovo ThinkPad X1 Extreme G4-20Y5CTO1WW (3050 Ti) | |
| Moyenne de la classe Office (2601 - 9298, n=64, 2 dernières années) | |
| Huawei MateBook D 16 2022 | |
| Lenovo ThinkPad L15 G2 AMD | |
| Lenovo ThinkPad E15 G3-20YG003UGE | |
| Lenovo ThinkPad T15 Gen2-20W5S00100 | |
| Moyenne Intel Core i5-1240P, Intel Iris Xe Graphics G7 80EUs (4881 - 5345, n=11) | |
| Lenovo ThinkPad T16 G1 21BWS00200 | |
| HP ZBook Power 15 G8 313S5EA | |
| HP ProBook 450 G9 6A180EA | |
| PCMark 10 / Essentials | |
| Huawei MateBook D 16 2022 | |
| Lenovo ThinkPad X1 Extreme G4-20Y5CTO1WW (3050 Ti) | |
| Dell Inspiron 16 Plus 7620 | |
| Lenovo ThinkPad L15 G2 AMD | |
| Moyenne de la classe Office (3245 - 11594, n=64, 2 dernières années) | |
| Moyenne Intel Core i5-1240P, Intel Iris Xe Graphics G7 80EUs (8890 - 10652, n=11) | |
| Lenovo ThinkPad T16 G1 21BWS00200 | |
| HP ProBook 450 G9 6A180EA | |
| Lenovo ThinkPad E15 G3-20YG003UGE | |
| Lenovo ThinkPad T15 Gen2-20W5S00100 | |
| HP ZBook Power 15 G8 313S5EA | |
| PCMark 10 / Productivity | |
| Moyenne de la classe Office (5336 - 17243, n=64, 2 dernières années) | |
| Lenovo ThinkPad L15 G2 AMD | |
| Dell Inspiron 16 Plus 7620 | |
| Lenovo ThinkPad T15 Gen2-20W5S00100 | |
| Lenovo ThinkPad X1 Extreme G4-20Y5CTO1WW (3050 Ti) | |
| Lenovo ThinkPad E15 G3-20YG003UGE | |
| HP ZBook Power 15 G8 313S5EA | |
| Huawei MateBook D 16 2022 | |
| HP ProBook 450 G9 6A180EA | |
| Moyenne Intel Core i5-1240P, Intel Iris Xe Graphics G7 80EUs (6118 - 7058, n=11) | |
| Lenovo ThinkPad T16 G1 21BWS00200 | |
| PCMark 10 / Digital Content Creation | |
| Dell Inspiron 16 Plus 7620 | |
| Lenovo ThinkPad X1 Extreme G4-20Y5CTO1WW (3050 Ti) | |
| Moyenne de la classe Office (2049 - 13541, n=64, 2 dernières années) | |
| Huawei MateBook D 16 2022 | |
| Moyenne Intel Core i5-1240P, Intel Iris Xe Graphics G7 80EUs (5169 - 6213, n=11) | |
| Lenovo ThinkPad E15 G3-20YG003UGE | |
| Lenovo ThinkPad T16 G1 21BWS00200 | |
| Lenovo ThinkPad T15 Gen2-20W5S00100 | |
| HP ZBook Power 15 G8 313S5EA | |
| Lenovo ThinkPad L15 G2 AMD | |
| HP ProBook 450 G9 6A180EA | |
| CrossMark / Overall | |
| Huawei MateBook D 16 2022 | |
| Dell Inspiron 16 Plus 7620 | |
| Moyenne Intel Core i5-1240P, Intel Iris Xe Graphics G7 80EUs (1392 - 1553, n=7) | |
| Moyenne de la classe Office (381 - 2010, n=73, 2 dernières années) | |
| HP ZBook Power 15 G8 313S5EA | |
| Lenovo ThinkPad T16 G1 21BWS00200 | |
| HP ProBook 450 G9 6A180EA | |
| CrossMark / Productivity | |
| Huawei MateBook D 16 2022 | |
| Dell Inspiron 16 Plus 7620 | |
| HP ZBook Power 15 G8 313S5EA | |
| Moyenne Intel Core i5-1240P, Intel Iris Xe Graphics G7 80EUs (1393 - 1524, n=7) | |
| Moyenne de la classe Office (464 - 1880, n=73, 2 dernières années) | |
| Lenovo ThinkPad T16 G1 21BWS00200 | |
| HP ProBook 450 G9 6A180EA | |
| CrossMark / Creativity | |
| Huawei MateBook D 16 2022 | |
| Dell Inspiron 16 Plus 7620 | |
| Moyenne de la classe Office (319 - 2361, n=73, 2 dernières années) | |
| Moyenne Intel Core i5-1240P, Intel Iris Xe Graphics G7 80EUs (1426 - 1647, n=7) | |
| HP ZBook Power 15 G8 313S5EA | |
| Lenovo ThinkPad T16 G1 21BWS00200 | |
| HP ProBook 450 G9 6A180EA | |
| CrossMark / Responsiveness | |
| Huawei MateBook D 16 2022 | |
| Dell Inspiron 16 Plus 7620 | |
| Moyenne Intel Core i5-1240P, Intel Iris Xe Graphics G7 80EUs (1267 - 1545, n=7) | |
| Lenovo ThinkPad T16 G1 21BWS00200 | |
| Moyenne de la classe Office (360 - 1690, n=73, 2 dernières années) | |
| HP ZBook Power 15 G8 313S5EA | |
| HP ProBook 450 G9 6A180EA | |
| Sunspider / 1.0 Total Score | |
| Lenovo ThinkPad T16 G1 21BWS00200 | |
| Moyenne Intel Core i5-1240P, Intel Iris Xe Graphics G7 80EUs (n=1) | |
| Moyenne de la classe Office (87.2 - 111.8, n=2, 2 dernières années) | |
| HP ProBook 450 G9 6A180EA | |
| Mozilla Kraken 1.1 / Total | |
| Lenovo ThinkPad E15 G3-20YG003UGE | |
| HP ProBook 450 G9 6A180EA | |
| Moyenne Intel Core i5-1240P, Intel Iris Xe Graphics G7 80EUs (575 - 1422, n=12) | |
| HP ZBook Power 15 G8 313S5EA | |
| Lenovo ThinkPad L15 G2 AMD | |
| Lenovo ThinkPad T15 Gen2-20W5S00100 | |
| Lenovo ThinkPad X1 Extreme G4-20Y5CTO1WW (3050 Ti) | |
| Lenovo ThinkPad T16 G1 21BWS00200 | |
| Moyenne de la classe Office (391 - 1297, n=76, 2 dernières années) | |
| Dell Inspiron 16 Plus 7620 | |
| Huawei MateBook D 16 2022 | |
| Speedometer 2.0 / Result 2.0 | |
| Moyenne de la classe Office (173 - 640, n=17, 2 dernières années) | |
| Huawei MateBook D 16 2022 | |
| Moyenne Intel Core i5-1240P, Intel Iris Xe Graphics G7 80EUs (241 - 266, n=3) | |
| Lenovo ThinkPad T16 G1 21BWS00200 | |
| HP ProBook 450 G9 6A180EA | |
| Octane V2 / Total Score | |
| Moyenne de la classe Office (49011 - 122119, n=19, 2 dernières années) | |
| Huawei MateBook D 16 2022 | |
| Lenovo ThinkPad T16 G1 21BWS00200 | |
| Moyenne Intel Core i5-1240P, Intel Iris Xe Graphics G7 80EUs (70915 - 80743, n=5) | |
| HP ProBook 450 G9 6A180EA | |
| HP ZBook Power 15 G8 313S5EA | |
| Jetstream 2 / 2.0 Total | |
| Moyenne de la classe Office (126.6 - 455, n=20, 2 dernières années) | |
| Moyenne Intel Core i5-1240P, Intel Iris Xe Graphics G7 80EUs (203 - 418, n=4) | |
| Dell Inspiron 16 Plus 7620 | |
| Huawei MateBook D 16 2022 | |
| Lenovo ThinkPad T16 G1 21BWS00200 | |
| HP ProBook 450 G9 6A180EA | |
| HP ZBook Power 15 G8 313S5EA | |
| WebXPRT 3 / Overall | |
| Huawei MateBook D 16 2022 | |
| Dell Inspiron 16 Plus 7620 | |
| Moyenne de la classe Office (129.9 - 455, n=74, 2 dernières années) | |
| Lenovo ThinkPad X1 Extreme G4-20Y5CTO1WW (3050 Ti) | |
| HP ZBook Power 15 G8 313S5EA | |
| Lenovo ThinkPad L15 G2 AMD | |
| Lenovo ThinkPad T16 G1 21BWS00200 | |
| Moyenne Intel Core i5-1240P, Intel Iris Xe Graphics G7 80EUs (119.2 - 268, n=11) | |
| Lenovo ThinkPad E15 G3-20YG003UGE | |
| HP ProBook 450 G9 6A180EA | |
| WebXPRT 4 / Overall | |
| Huawei MateBook D 16 2022 | |
| Dell Inspiron 16 Plus 7620 | |
| Moyenne de la classe Office (104.2 - 313, n=75, 2 dernières années) | |
| Lenovo ThinkPad T16 G1 21BWS00200 | |
| Moyenne Intel Core i5-1240P, Intel Iris Xe Graphics G7 80EUs (217 - 231, n=6) | |
| HP ProBook 450 G9 6A180EA | |
* ... Moindre est la valeur, meilleures sont les performances
| PCMark 10 Score | 5007 points | |
Aide | ||
| AIDA64 / Memory Copy | |
| Moyenne de la classe Office (20075 - 110930, n=77, 2 dernières années) | |
| Huawei MateBook D 16 2022 | |
| Dell Inspiron 16 Plus 7620 | |
| Moyenne Intel Core i5-1240P (23312 - 70537, n=16) | |
| Lenovo ThinkPad X1 Extreme G4-20Y5CTO1WW (3050 Ti) | |
| Lenovo ThinkPad E15 G3-20YG003UGE | |
| HP ZBook Power 15 G8 313S5EA | |
| Lenovo ThinkPad T16 G1 21BWS00200 | |
| HP ProBook 450 G9 6A180EA | |
| Lenovo ThinkPad L15 G2 AMD | |
| AIDA64 / Memory Read | |
| Moyenne de la classe Office (10084 - 128030, n=78, 2 dernières années) | |
| Dell Inspiron 16 Plus 7620 | |
| Huawei MateBook D 16 2022 | |
| Moyenne Intel Core i5-1240P (18989 - 70553, n=16) | |
| Lenovo ThinkPad E15 G3-20YG003UGE | |
| Lenovo ThinkPad X1 Extreme G4-20Y5CTO1WW (3050 Ti) | |
| HP ZBook Power 15 G8 313S5EA | |
| Lenovo ThinkPad T16 G1 21BWS00200 | |
| Lenovo ThinkPad L15 G2 AMD | |
| HP ProBook 450 G9 6A180EA | |
| AIDA64 / Memory Write | |
| Moyenne de la classe Office (20073 - 119858, n=78, 2 dernières années) | |
| Huawei MateBook D 16 2022 | |
| Dell Inspiron 16 Plus 7620 | |
| Moyenne Intel Core i5-1240P (23454 - 62496, n=16) | |
| Lenovo ThinkPad X1 Extreme G4-20Y5CTO1WW (3050 Ti) | |
| Lenovo ThinkPad E15 G3-20YG003UGE | |
| Lenovo ThinkPad L15 G2 AMD | |
| Lenovo ThinkPad T16 G1 21BWS00200 | |
| HP ProBook 450 G9 6A180EA | |
| HP ZBook Power 15 G8 313S5EA | |
| AIDA64 / Memory Latency | |
| Moyenne Intel Core i5-1240P (85.1 - 188.3, n=11) | |
| Huawei MateBook D 16 2022 | |
| Lenovo ThinkPad E15 G3-20YG003UGE | |
| Moyenne de la classe Office (7.6 - 162.9, n=73, 2 dernières années) | |
| Dell Inspiron 16 Plus 7620 | |
| Lenovo ThinkPad T16 G1 21BWS00200 | |
| Lenovo ThinkPad L15 G2 AMD | |
| Lenovo ThinkPad X1 Extreme G4-20Y5CTO1WW (3050 Ti) | |
| HP ProBook 450 G9 6A180EA | |
| HP ZBook Power 15 G8 313S5EA | |
* ... Moindre est la valeur, meilleures sont les performances
Latence DPC
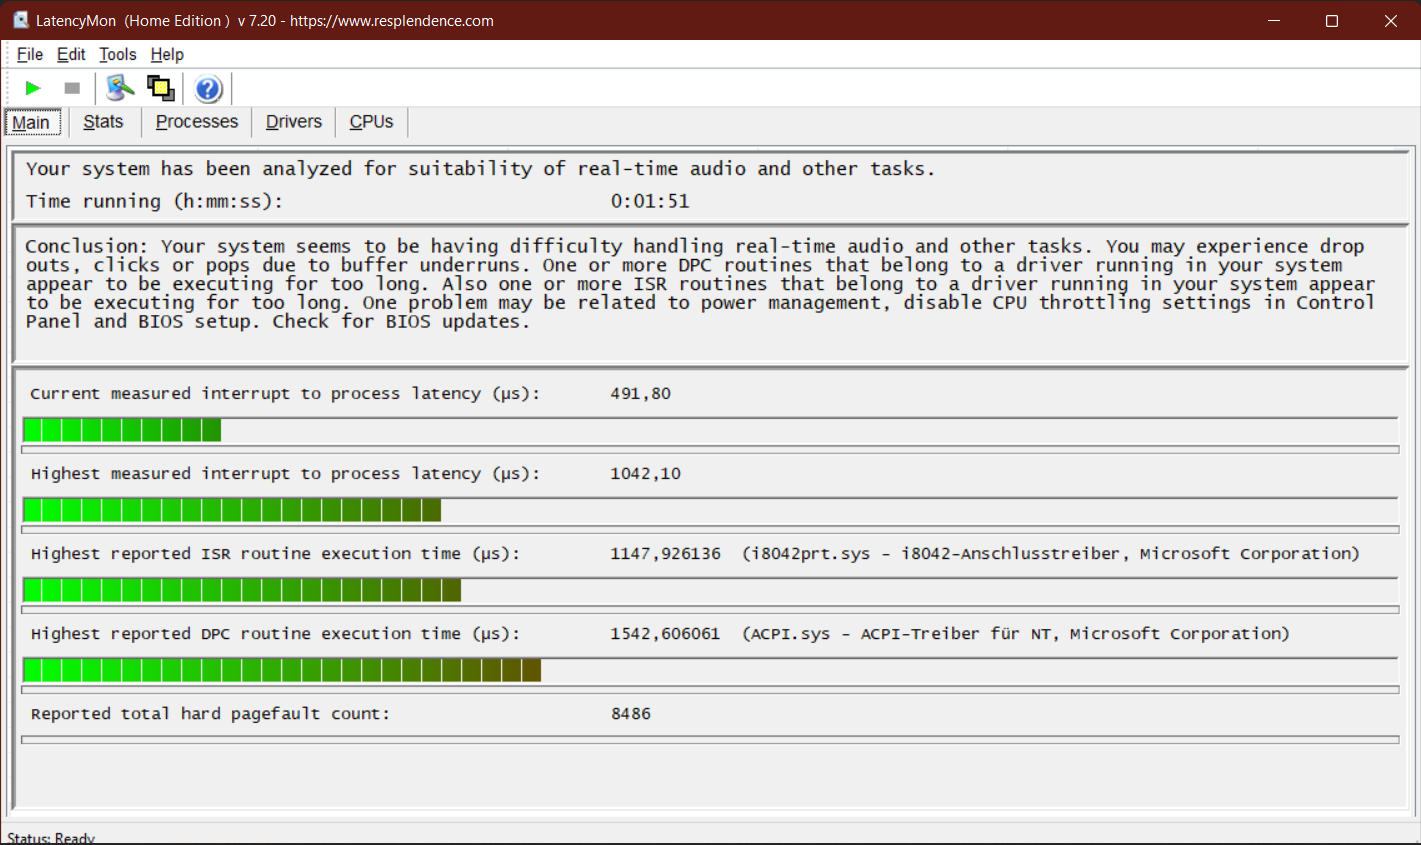
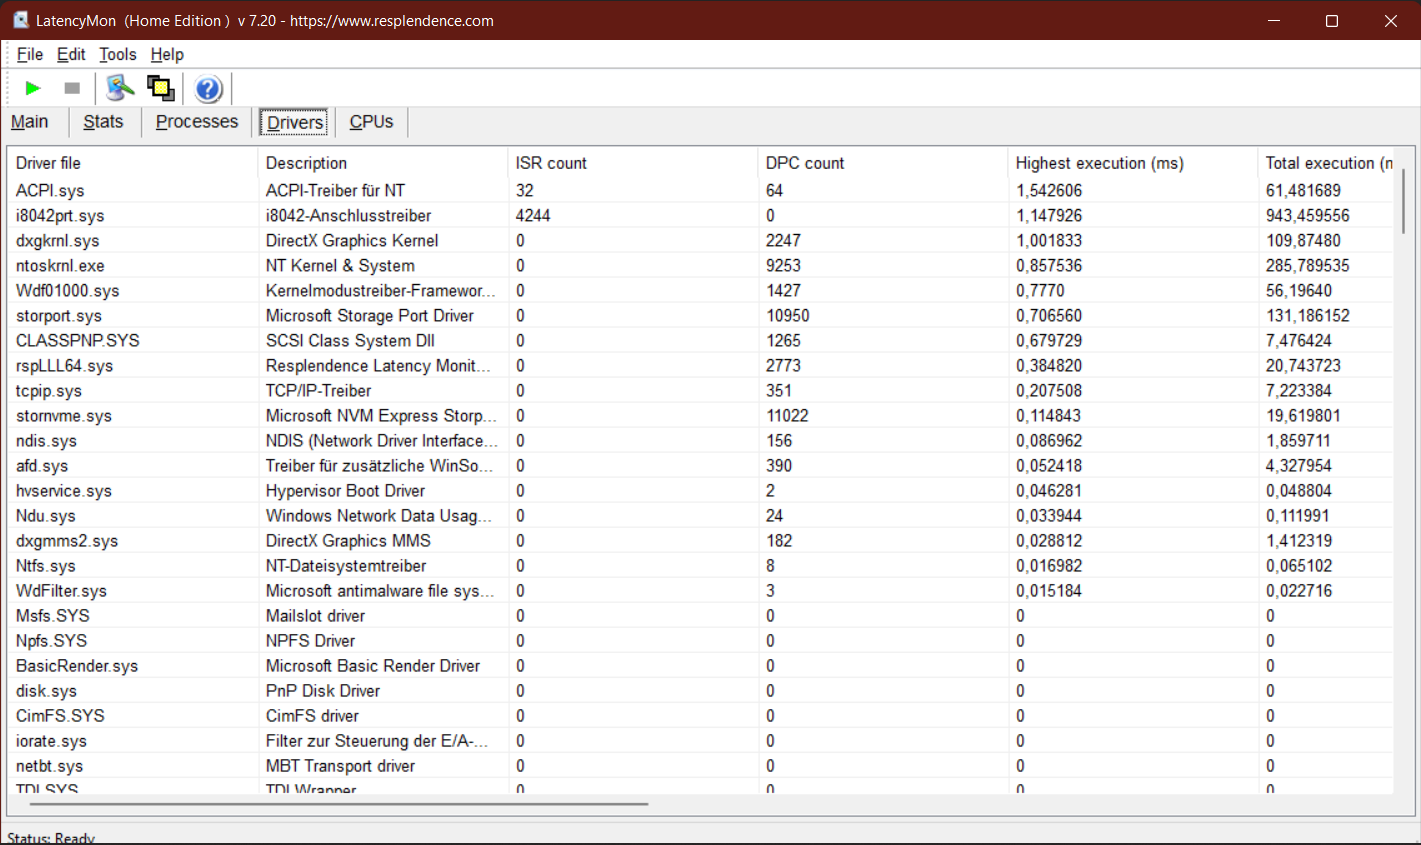
| DPC Latencies / LatencyMon - interrupt to process latency (max), Web, Youtube, Prime95 | |
| HP ProBook 450 G9 6A180EA | |
| Lenovo ThinkPad L15 G2 AMD | |
| Lenovo ThinkPad T16 G1 21BWS00200 | |
| Lenovo ThinkPad T15 Gen2-20W5S00100 | |
| Dell Inspiron 16 Plus 7620 | |
| Lenovo ThinkPad E15 G3-20YG003UGE | |
| Huawei MateBook D 16 2022 | |
| HP ZBook Power 15 G8 313S5EA | |
* ... Moindre est la valeur, meilleures sont les performances
Périphériques de stockage
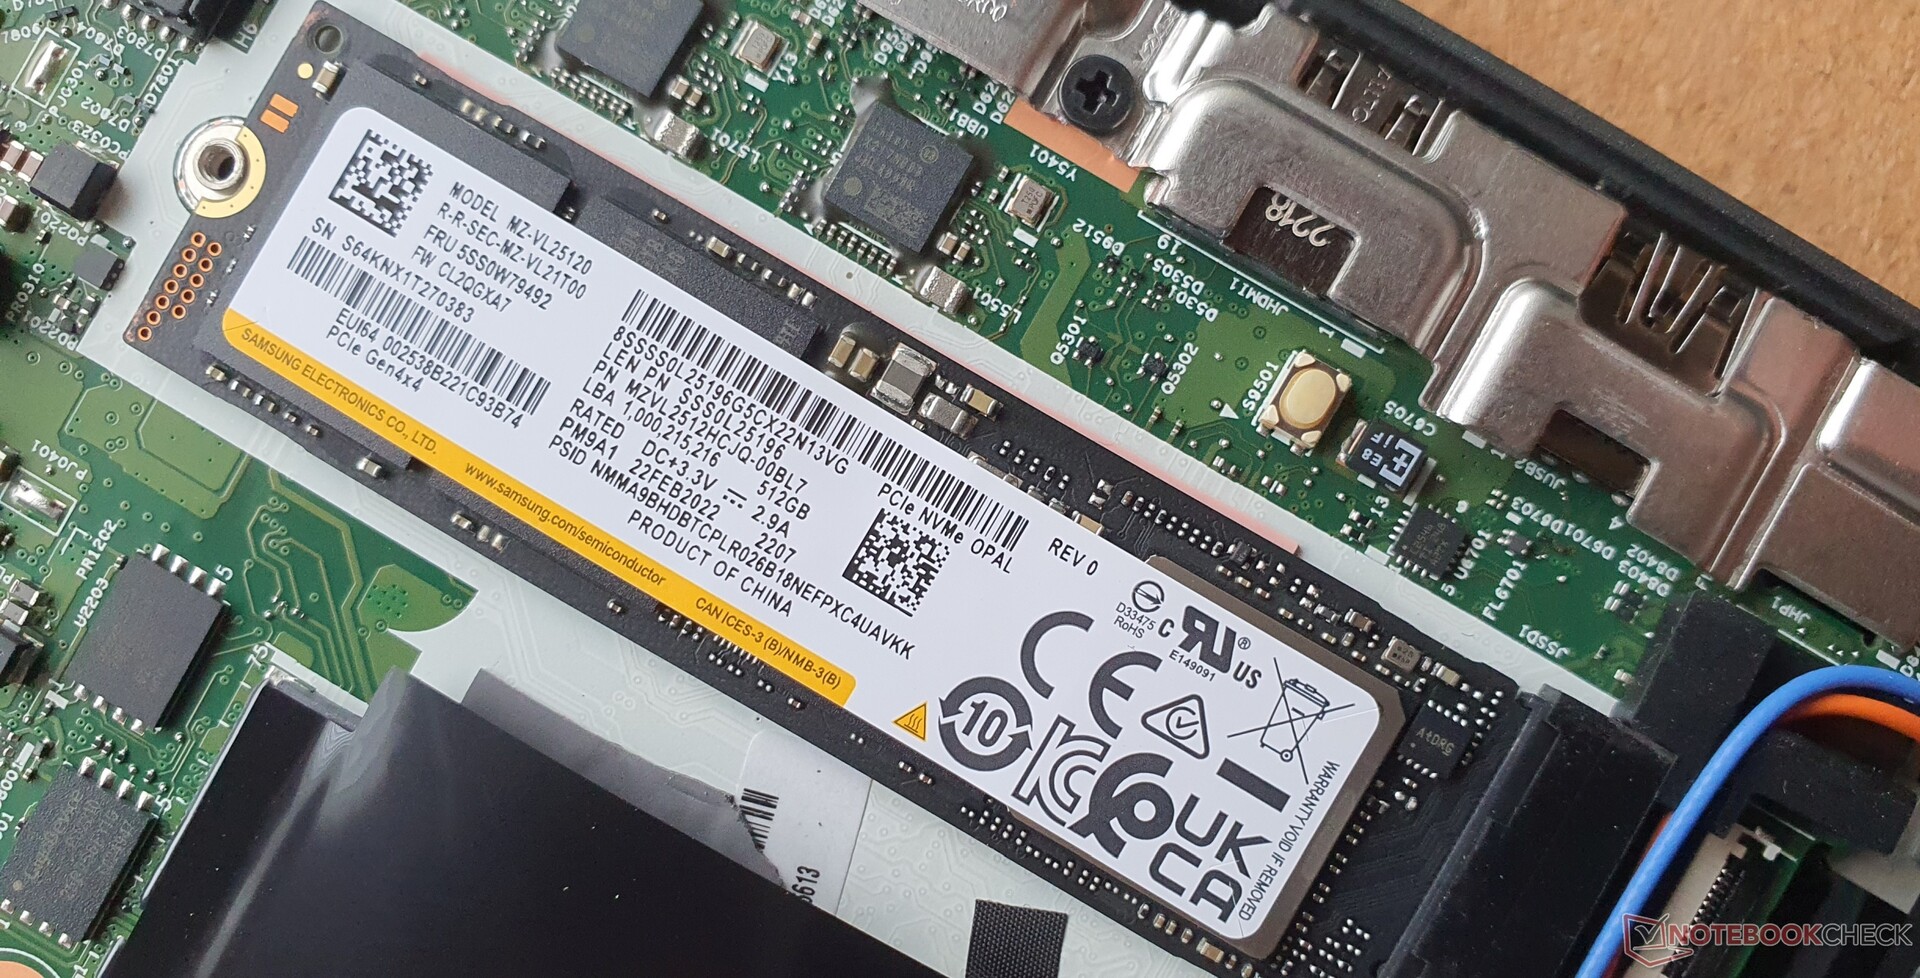
Le PM9A1 de Samsungest un SSD PCIe 4.0 et a une capacité de 512 Go. La vitesse est bonne, mais les lectures 4K 16/64 sont assez lentes, et elles chutent rapidement de moitié dans le test de boucle de lecture en raison de la surchauffe. Le prédécesseur avait un SSD plus rapide, et le reste de notre champ de comparaison a des performances similaires à celles de notre échantillon.
| Lenovo ThinkPad T16 G1 21BWS00200 Samsung PM9A1 MZVL2512HCJQ | Lenovo ThinkPad T15 Gen2-20W5S00100 Samsung PM981a MZVLB1T0HBLR | Lenovo ThinkPad X1 Extreme G4-20Y5CTO1WW (3050 Ti) Samsung PM9A1 MZVL21T0HCLR | HP ZBook Power 15 G8 313S5EA Samsung PM9A1 MZVL2512HCJQ | HP ProBook 450 G9 6A180EA SK Hynix HFM512GD3JX013N | Huawei MateBook D 16 2022 Silicon Motion PCIe-8 SSD | Dell Inspiron 16 Plus 7620 Kioxia BG5 KBG50ZNS512G | Lenovo ThinkPad E15 G3-20YG003UGE SK Hynix PC711 1TB HFS001TDE9X084N | Lenovo ThinkPad L15 G2 AMD SK Hynix HFS512 GDE9X081N | |
|---|---|---|---|---|---|---|---|---|---|
| DiskSpd | 104% | 18% | 60% | -38% | 36% | -15% | 67% | -10% | |
| seq read (MB/s) | 3645 | 2090 -43% | 3285 -10% | 3354.8 -8% | 1914 -47% | 2012 -45% | 2355 -35% | 1624 -55% | 1688 -54% |
| seq write (MB/s) | 2809 | 2270 -19% | 2886 3% | 1353.3 -52% | 1762 -37% | 1438 -49% | 2020 -28% | 1901 -32% | 2072 -26% |
| seq q8 t1 read (MB/s) | 6524 | 3448 -47% | 6641 2% | 6230 -5% | 3463 -47% | 2883 -56% | 2569 -61% | 3269 -50% | 3582 -45% |
| seq q8 t1 write (MB/s) | 4812 | 2945 -39% | 4922 2% | 4757.9 -1% | 2600 -46% | 1911 -60% | 2752 -43% | 3250 -32% | 3072 -36% |
| 4k q1 t1 read (MB/s) | 68.2 | 74.4 9% | 78.4 15% | 51.8 -24% | 52.7 -23% | 43.1 -37% | 62.7 -8% | 57.4 -16% | 46.7 -32% |
| 4k q1 t1 write (MB/s) | 134.8 | 231 71% | 161 19% | 150.2 11% | 112.4 -17% | 273 103% | 162.6 21% | 128 -5% | 123 -9% |
| 4k q32 t16 read (MB/s) | 683 | 2506 267% | 1270 86% | 2187 220% | 328 -52% | 1391 104% | 652 -5% | 2037 198% | 983 44% |
| 4k q32 t16 write (MB/s) | 293 | 2137 629% | 373 27% | 1284.7 338% | 192.2 -34% | 1241 324% | 408 39% | 1833 526% | 521 78% |
| AS SSD | 11% | 28% | 22% | -21% | 11% | -23% | 12% | -8% | |
| Seq Read (MB/s) | 3225 | 2694 -16% | 4588 42% | 4951 54% | 2687 -17% | 2802 -13% | 2693.29 -16% | 2432 -25% | 2721 -16% |
| Seq Write (MB/s) | 1567 | 2370 51% | 1625 4% | 3725 138% | 1476.14 -6% | 1879 20% | 1683.46 7% | 1266 -19% | 1329 -15% |
| 4K Read (MB/s) | 69.7 | 68.4 -2% | 75.2 8% | 52.9 -24% | 60 -14% | 61.03 -12% | 65.01 -7% | 48.88 -30% | 51.5 -26% |
| 4K Write (MB/s) | 170.9 | 208.1 22% | 182.9 7% | 105.35 -38% | 176.81 3% | 248.56 45% | 197.81 16% | 128.4 -25% | 132.5 -22% |
| 4K-64 Read (MB/s) | 720 | 1961 172% | 1318 83% | 2200.26 206% | 696.46 -3% | 1135.53 58% | 855.48 19% | 1805 151% | 932 29% |
| 4K-64 Write (MB/s) | 2682 | 1935 -28% | 3056 14% | 2314.41 -14% | 1624.91 -39% | 1402.68 -48% | 395.8 -85% | 2470 -8% | 1856 -31% |
| Access Time Read * (ms) | 0.059 | 0.032 46% | 0.041 31% | 0.054 8% | 0.04 32% | 0.025 58% | 0.078 -32% | 0.044 25% | 0.038 36% |
| Access Time Write * (ms) | 0.024 | 0.081 -238% | 0.022 8% | 0.04 -67% | 0.028 -17% | 0.016 33% | 0.06 -150% | 0.038 -58% | 0.028 -17% |
| Score Read (Points) | 1112 | 2299 107% | 1852 67% | 2748 147% | 1025 -8% | 1477 33% | 1190 7% | 2097 89% | 1256 13% |
| Score Write (Points) | 3010 | 2380 -21% | 3402 13% | 2792 -7% | 1949 -35% | 1839 -39% | 762 -75% | 2725 -9% | 2122 -30% |
| Score Total (Points) | 4630 | 5846 26% | 6069 31% | 6880 49% | 3457 -25% | 4039 -13% | 2529 -45% | 5837 26% | 3961 -14% |
| Copy ISO MB/s (MB/s) | 1639 | 1287.6 -21% | 863.41 -47% | 1352.52 -17% | 1634.1 0% | 1301 -21% | |||
| Copy Program MB/s (MB/s) | 326.8 | 115.3 -65% | 127.34 -61% | 435.92 33% | 379.46 16% | 554 70% | |||
| Copy Game MB/s (MB/s) | 942.7 | 390.1 -59% | 384.67 -59% | 1058.52 12% | 1174.45 25% | 993 5% | |||
| Moyenne finale (programmes/paramètres) | 58% /
50% | 23% /
24% | 41% /
36% | -30% /
-27% | 24% /
20% | -19% /
-20% | 40% /
32% | -9% /
-9% |
* ... Moindre est la valeur, meilleures sont les performances
* ... Moindre est la valeur, meilleures sont les performances
Sustained Read Performance: DiskSpd Read Loop, Queue Depth 8
Carte graphique
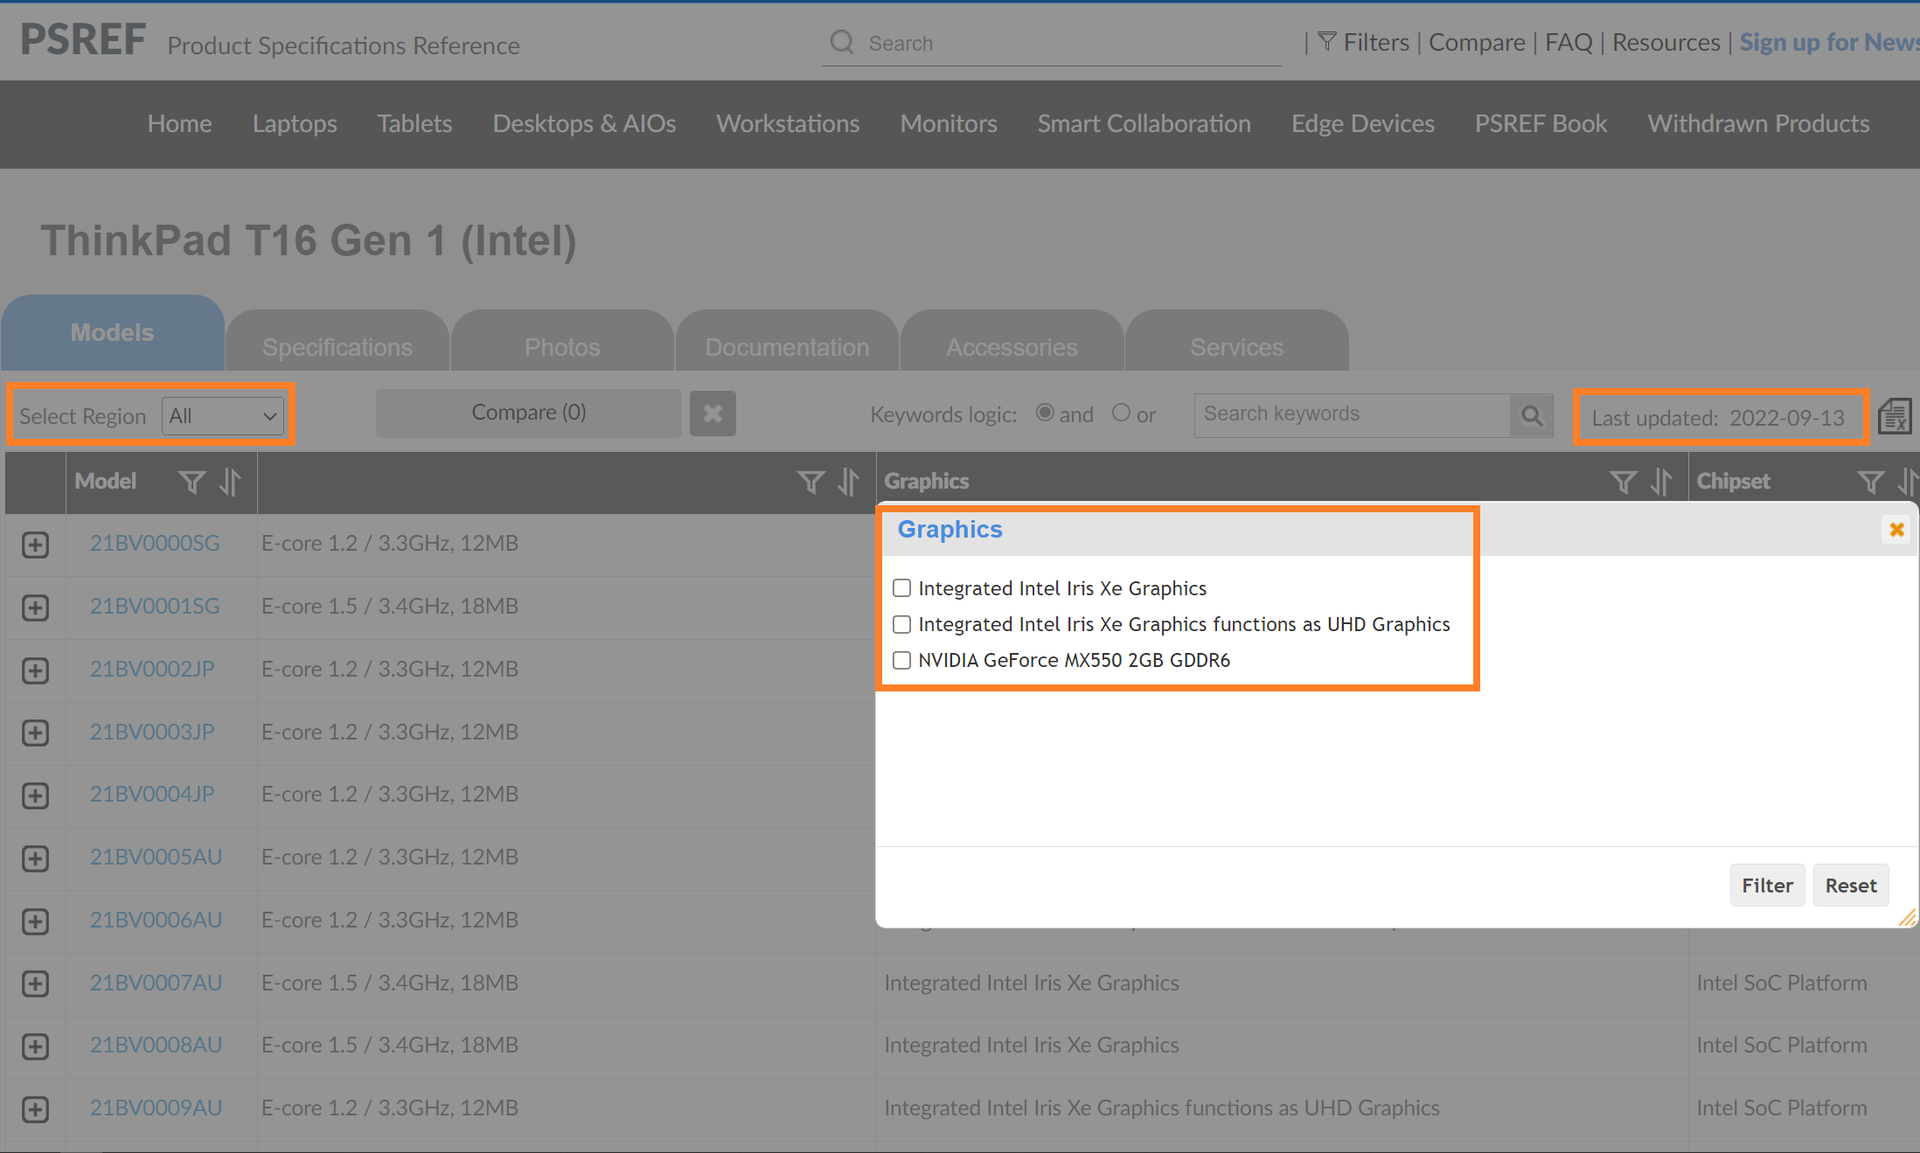
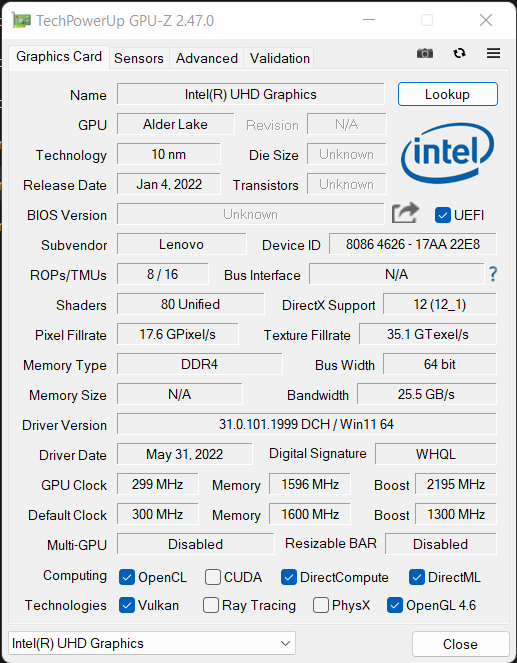
L'intégréIntel UHD Graphics est techniquement un Xe G7 (80 UE)qui est lié à une RAM à canal unique. Par conséquent, ses performances sont limitées et les niveaux de détail faibles sont à l'ordre du jour. Comme l'ordinateur portable n'est pas conçu pour le jeu, cela est tolérable et peut être amélioré de manière significative avec un deuxième module de RAM. Le site MX450du prédécesseur serait également une bonne amélioration d'accompagnement, tandis que le GeForce disponible en option MX550 est encore plus rapide.
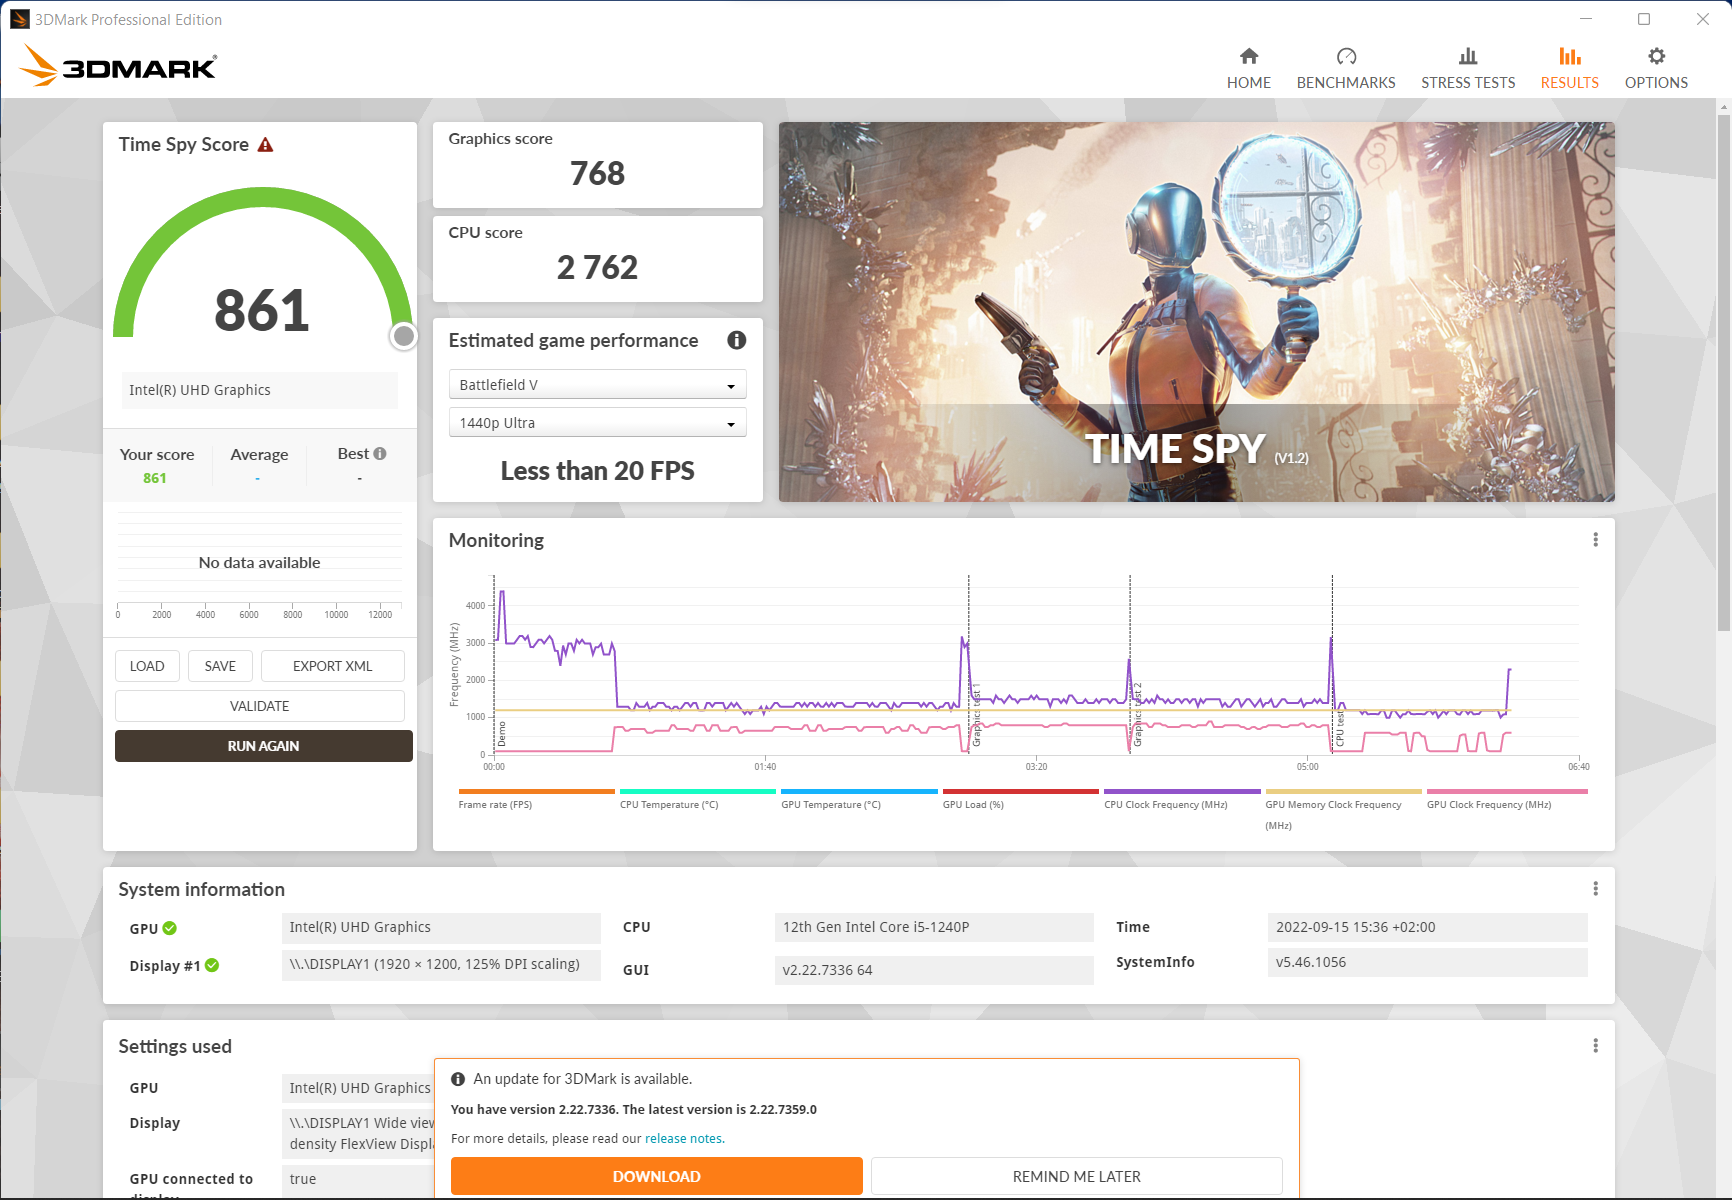
Le ThinkPad T16 a également été annoncé avec une NvidiaGeForce RTX 2050qui n'est même pas mentionnée dans les fiches techniques, mais seulement pour signaler qu'elle n'est pas disponible dans la région EMEA. En mode batterie, les fps dans The Witcher 3 @Medium settings tombent de 32 à 24, ce qui correspond à un throttling de 25%. Le plein 1,300 MHz tombe à ~750 MHz.
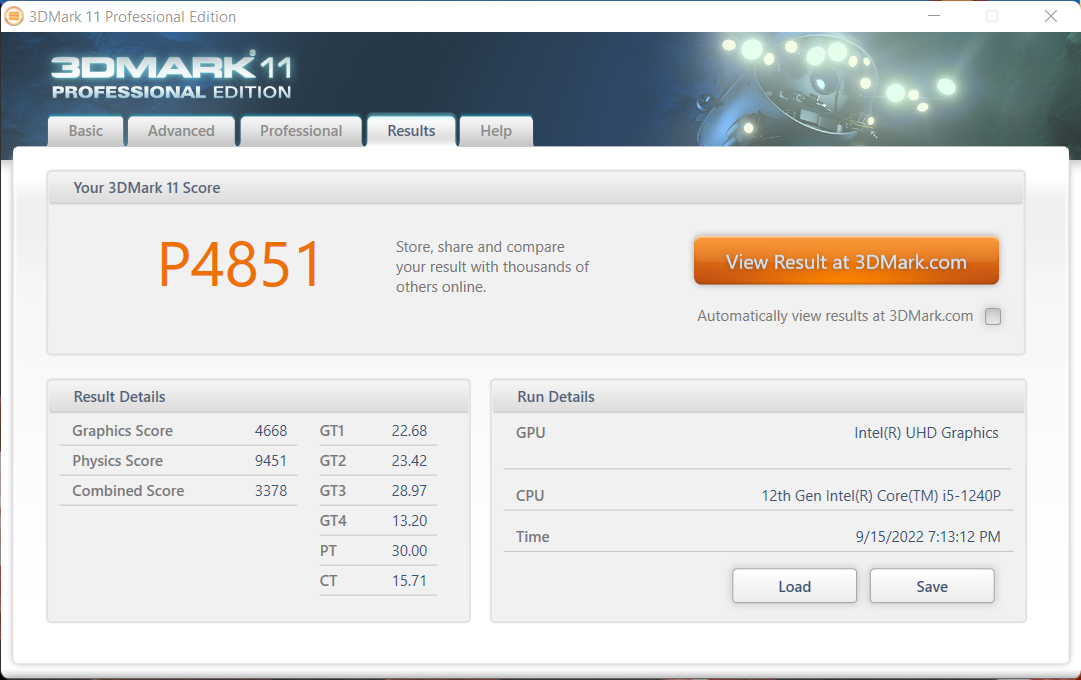
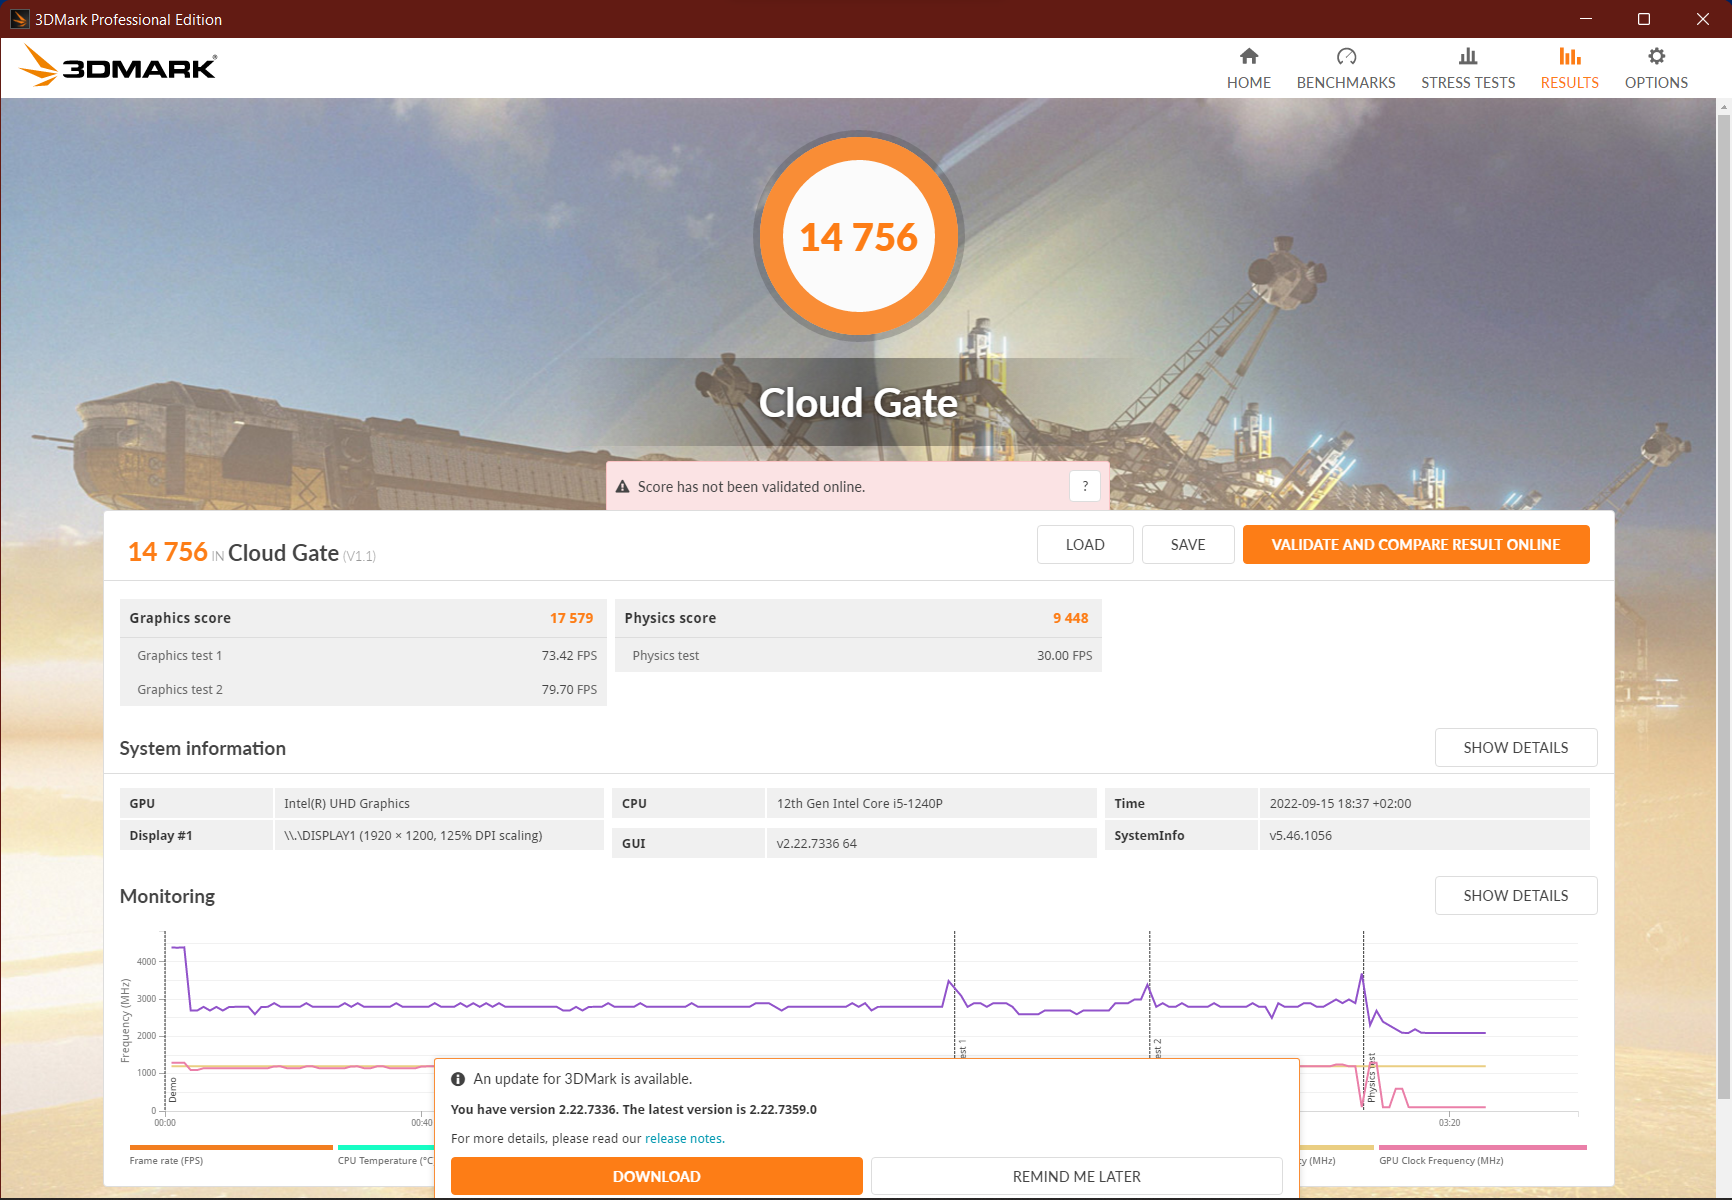
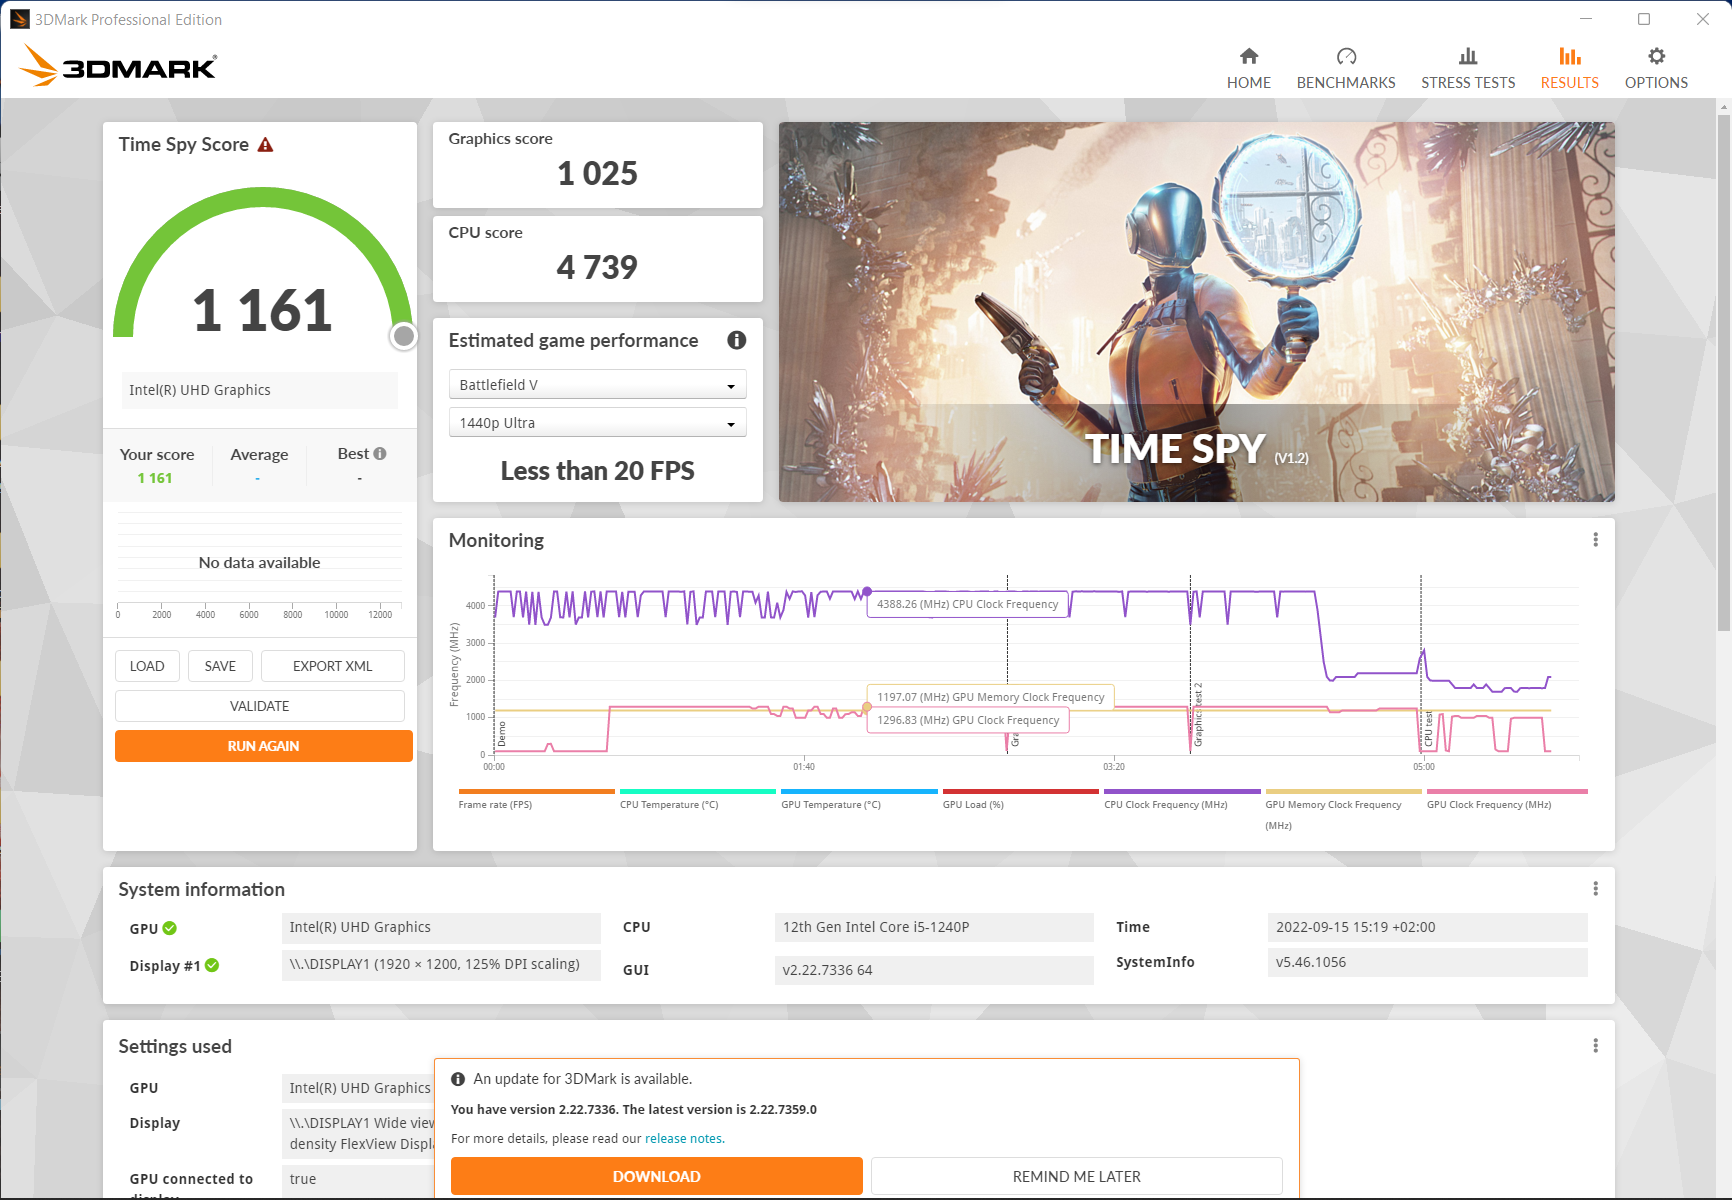
| 3DMark 11 Performance | 4851 points | |
| 3DMark Cloud Gate Standard Score | 14756 points | |
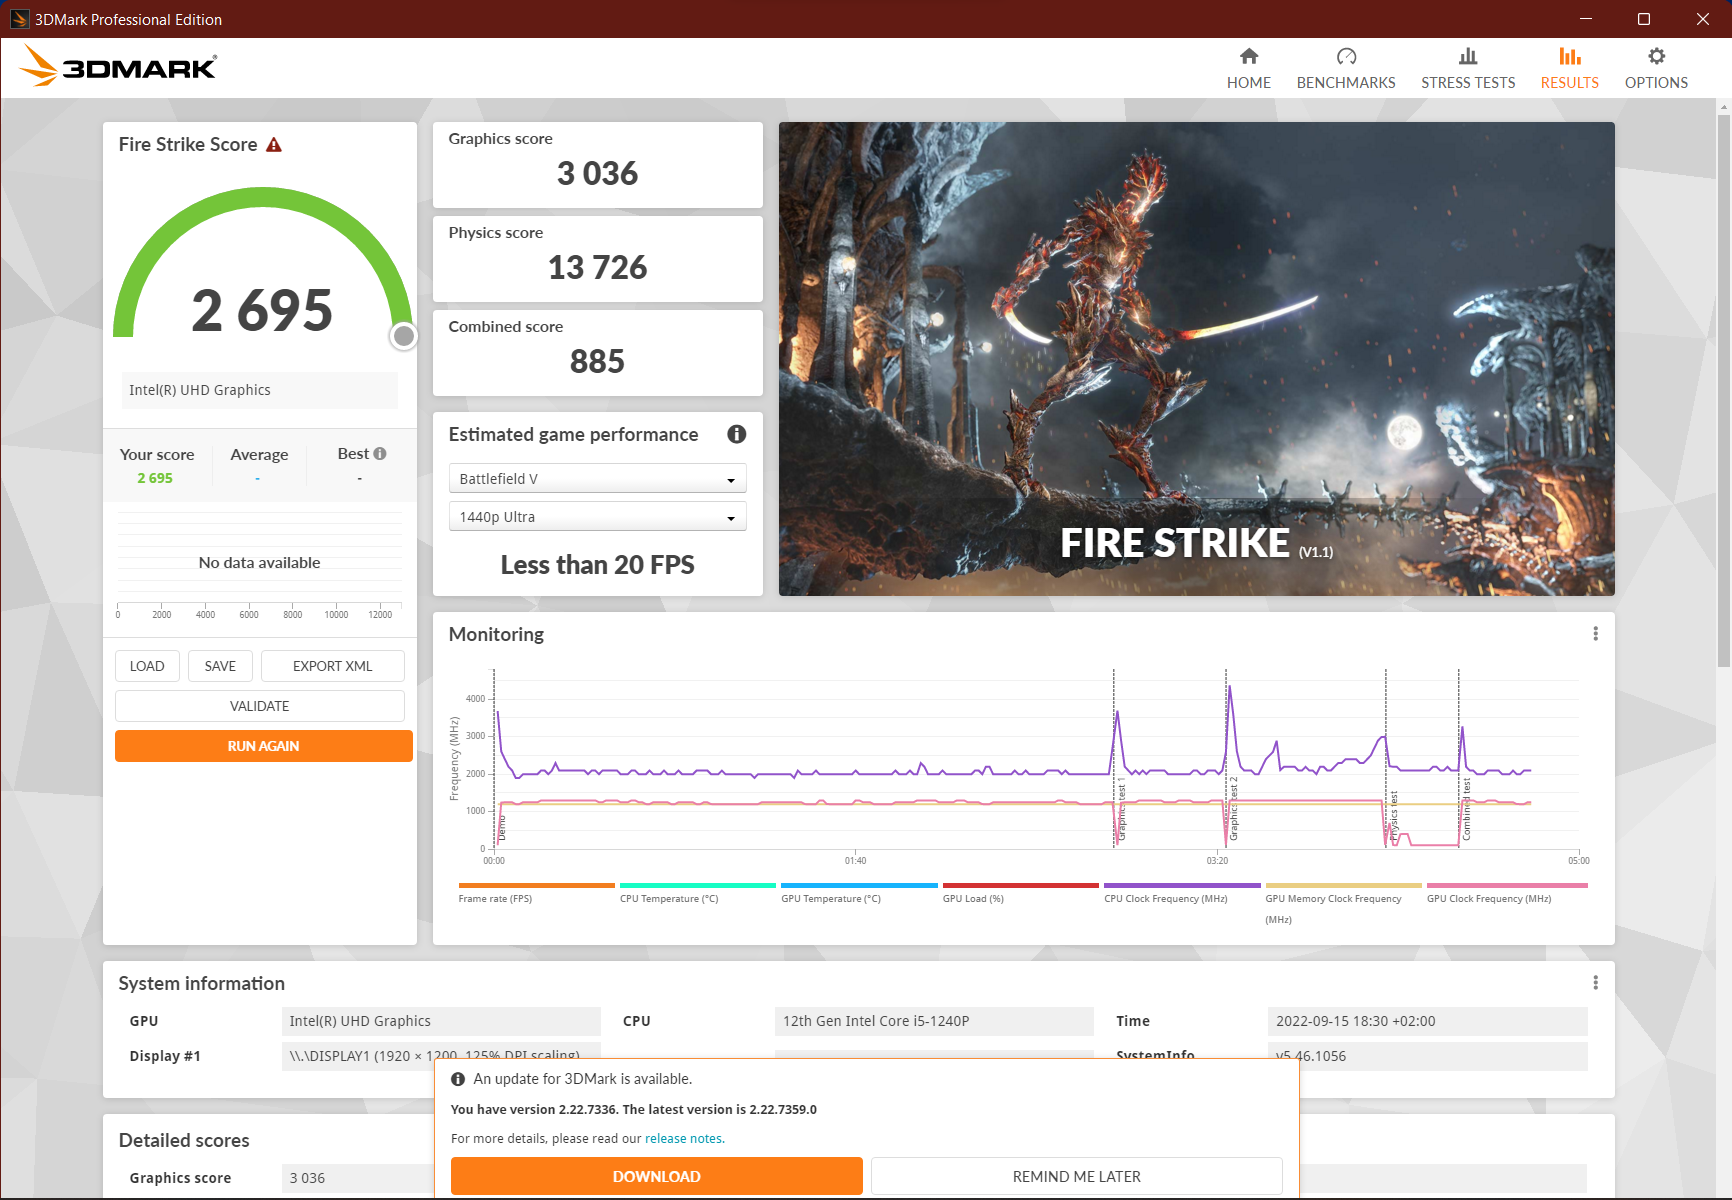
| 3DMark Fire Strike Score | 2695 points | |
| 3DMark Time Spy Score | 1161 points | |
Aide | ||
| Shadow of the Tomb Raider - 1280x720 Lowest Preset | |
| HP ZBook Power 15 G8 313S5EA | |
| Moyenne de la classe Office (16 - 105, n=2, 2 dernières années) | |
| Moyenne Intel Iris Xe Graphics G7 80EUs (31 - 62.8, n=6) | |
| HP ProBook 450 G9 6A180EA | |
| Lenovo ThinkPad T16 G1 21BWS00200 | |
| GRID Legends - 1920x1080 Medium Preset | |
| HP ZBook Power 15 G8 313S5EA | |
| Moyenne Intel Iris Xe Graphics G7 80EUs (25.7 - 39.7, n=4) | |
| HP ProBook 450 G9 6A180EA | |
| Lenovo ThinkPad T16 G1 21BWS00200 | |
Witcher 3 FPS Chart
| Bas | Moyen | Élevé | Ultra | |
|---|---|---|---|---|
| GTA V (2015) | 61.9 | 50.1 | 9.54 | |
| The Witcher 3 (2015) | 50.7 | 32.1 | 15.7 | 8.36 |
| Dota 2 Reborn (2015) | 97.5 | 66.3 | 35.2 | 32.7 |
| Final Fantasy XV Benchmark (2018) | 24.9 | 13.5 | ||
| X-Plane 11.11 (2018) | 42.5 | 29.1 | 26.5 | |
| Far Cry 5 (2018) | 30 | 15 | 14 | 13 |
| Strange Brigade (2018) | 52.7 | 20.3 | 17 | 13.8 |
| Shadow of the Tomb Raider (2018) | 31 | 11 | ||
| GRID Legends (2022) | 36.2 | 25.7 | 21 |
Emissions - Un ordinateur portable de 16 pouces presque silencieux de Lenovo
Bruit
En mode veille, le ThinkPad T16 reste absolument silencieux. Même pendant la navigation intensive sur Internet et les tâches gourmandes en ressources du processeur, le ventilateur reste si silencieux (25 dB(A) en moyenne) que vous pouvez à peine le distinguer du bruit ambiant.
Ce n'est qu'en cas de charge combinée, comme dans les jeux, que l'on se rend compte qu'il ne s'agit pas d'un appareil à refroidissement passif, même si l'ordinateur portable reste discret (32 dB(A)). Cependant, le ventilateur fonctionne alors à des tonalités assez élevées. Au moins, il n'y a pas de bruits électroniques gênants.
Seuls le ThinkPad L15 G2 AMD Test du Lenovo ThinkPad L15 G2 : PC portable de bureau pour 600 € et le ProBook 450 G9 de HP sont aussi silencieux en comparaison
Degré de la nuisance sonore
| Au repos |
| 23.3 / 23.3 / 23.3 dB(A) |
| Fortement sollicité |
| 25.1 / 34 dB(A) |
 | ||
30 dB silencieux 40 dB(A) audible 50 dB(A) bruyant |
||
min: | ||
| Lenovo ThinkPad T16 G1 21BWS00200 Iris Xe G7 80EUs, i5-1240P, Samsung PM9A1 MZVL2512HCJQ | Lenovo ThinkPad T15 Gen2-20W5S00100 GeForce MX450, i7-1165G7, Samsung PM981a MZVLB1T0HBLR | Lenovo ThinkPad E15 G3-20YG003UGE Vega 8, R7 5700U, SK Hynix PC711 1TB HFS001TDE9X084N | Lenovo ThinkPad L15 G2 AMD Vega 7, R5 5600U, SK Hynix HFS512 GDE9X081N | HP ProBook 450 G9 6A180EA Iris Xe G7 96EUs, i7-1255U, SK Hynix HFM512GD3JX013N | HP ZBook Power 15 G8 313S5EA T600 Laptop GPU, i7-11800H, Samsung PM9A1 MZVL2512HCJQ | Dell Inspiron 16 Plus 7620 GeForce RTX 3050 Ti Laptop GPU, i7-12700H, Kioxia BG5 KBG50ZNS512G | Huawei MateBook D 16 2022 Iris Xe G7 96EUs, i7-12700H, Silicon Motion PCIe-8 SSD | Asus Vivobook Pro 16X-M7600QE GeForce RTX 3050 Ti Laptop GPU, R9 5900HX, SK Hynix HFM001TD3JX013N | |
|---|---|---|---|---|---|---|---|---|---|
| Noise | -12% | -10% | -4% | -5% | -33% | -34% | -21% | -27% | |
| arrêt / environnement * (dB) | 23.3 | 24.2 -4% | 23.8 -2% | 24.22 -4% | 25.5 -9% | 25.54 -10% | 23.3 -0% | 24.2 -4% | 26 -12% |
| Idle Minimum * (dB) | 23.3 | 24.2 -4% | 23.8 -2% | 24.22 -4% | 25.5 -9% | 25.54 -10% | 25.7 -10% | 24.2 -4% | 27 -16% |
| Idle Average * (dB) | 23.3 | 24.2 -4% | 23.8 -2% | 24.22 -4% | 25.5 -9% | 25.54 -10% | 26.1 -12% | 25.8 -11% | 27 -16% |
| Idle Maximum * (dB) | 23.3 | 24.2 -4% | 28 -20% | 24.22 -4% | 25.5 -9% | 25.54 -10% | 30.6 -31% | 30.5 -31% | 27.5 -18% |
| Load Average * (dB) | 25.1 | 34.5 -37% | 32.9 -31% | 25.84 -3% | 28 -12% | 48.85 -95% | 46.2 -84% | 39.8 -59% | 41.7 -66% |
| Witcher 3 ultra * (dB) | 32.1 | 37.6 -17% | 46.58 -45% | 49.2 -53% | 39.8 -24% | ||||
| Load Maximum * (dB) | 34 | 37.6 -11% | 35 -3% | 36.02 -6% | 27.7 19% | 50.98 -50% | 49.4 -45% | 39.8 -17% | 45.3 -33% |
* ... Moindre est la valeur, meilleures sont les performances
Température
Le ThinkPad T16 reste frais dans la plupart des cas, ne chauffant qu'à un degré normal en cas de charge soutenue. Ce phénomène n'est pas perceptible dans la zone du clavier, mais uniquement au-dessus de celui-ci, et même dans cette zone, on ne ressent pas trop de chaleur pendant longtemps. Le dessous de l'ordinateur reste généralement plus frais, ce qui vous permet d'utiliser le ThinkPad T16 sur vos genoux.
Le site prédécesseur direct et aussi le ThinkPad E15chauffent beaucoup plus, avec un maximum de 55 °C et 60 °C, respectivement, sur le dessous. Le ZBook Power 15 et Vivobook Pro 16Xen revanche, restent tout aussi frais.
(±) La température maximale du côté supérieur est de 45 °C / 113 F, par rapport à la moyenne de 34.3 °C / 94 F, allant de 21.2 à 62.5 °C pour la classe Office.
(±) Le fond chauffe jusqu'à un maximum de 42.8 °C / 109 F, contre une moyenne de 36.8 °C / 98 F
(+) En utilisation inactive, la température moyenne du côté supérieur est de 30.4 °C / 87 F, par rapport à la moyenne du dispositif de 29.5 °C / 85 F.
(±) En jouant à The Witcher 3, la température moyenne du côté supérieur est de 35.9 °C / 97 F, alors que la moyenne de l'appareil est de 29.5 °C / 85 F.
(+) Les repose-poignets et le pavé tactile atteignent la température maximale de la peau (33.4 °C / 92.1 F) et ne sont donc pas chauds.
(-) La température moyenne de la zone de l'appui-paume de dispositifs similaires était de 27.5 °C / 81.5 F (-5.9 °C / #-10.6 F).
| Lenovo ThinkPad T16 G1 21BWS00200 Intel Core i5-1240P, Intel Iris Xe Graphics G7 80EUs | Lenovo ThinkPad T15 Gen2-20W5S00100 Intel Core i7-1165G7, NVIDIA GeForce MX450 | Lenovo ThinkPad E15 G3-20YG003UGE AMD Ryzen 7 5700U, AMD Radeon RX Vega 8 (Ryzen 4000/5000) | Lenovo ThinkPad L15 G2 AMD AMD Ryzen 5 5600U, AMD Radeon RX Vega 7 | HP ProBook 450 G9 6A180EA Intel Core i7-1255U, Intel Iris Xe Graphics G7 96EUs | HP ZBook Power 15 G8 313S5EA Intel Core i7-11800H, NVIDIA T600 Laptop GPU | Dell Inspiron 16 Plus 7620 Intel Core i7-12700H, NVIDIA GeForce RTX 3050 Ti Laptop GPU | Huawei MateBook D 16 2022 Intel Core i7-12700H, Intel Iris Xe Graphics G7 96EUs | Asus Vivobook Pro 16X-M7600QE AMD Ryzen 9 5900HX, NVIDIA GeForce RTX 3050 Ti Laptop GPU | |
|---|---|---|---|---|---|---|---|---|---|
| Heat | 8% | -2% | 6% | -1% | 16% | 3% | 5% | 11% | |
| Maximum Upper Side * (°C) | 45 | 42.2 6% | 46.4 -3% | 42.8 5% | 40.5 10% | 41.4 8% | 46 -2% | 41.8 7% | 39.4 12% |
| Maximum Bottom * (°C) | 42.8 | 55.1 -29% | 60.9 -42% | 46 -7% | 47.6 -11% | 41.5 3% | 45.8 -7% | 47.3 -11% | 43.6 -2% |
| Idle Upper Side * (°C) | 33 | 23.8 28% | 26.5 20% | 26.9 18% | 32.6 1% | 23.8 28% | 29.2 12% | 28.3 14% | 27.6 16% |
| Idle Bottom * (°C) | 33.6 | 25.1 25% | 27.5 18% | 31.1 7% | 34.2 -2% | 25 26% | 31 8% | 30.2 10% | 27.5 18% |
* ... Moindre est la valeur, meilleures sont les performances
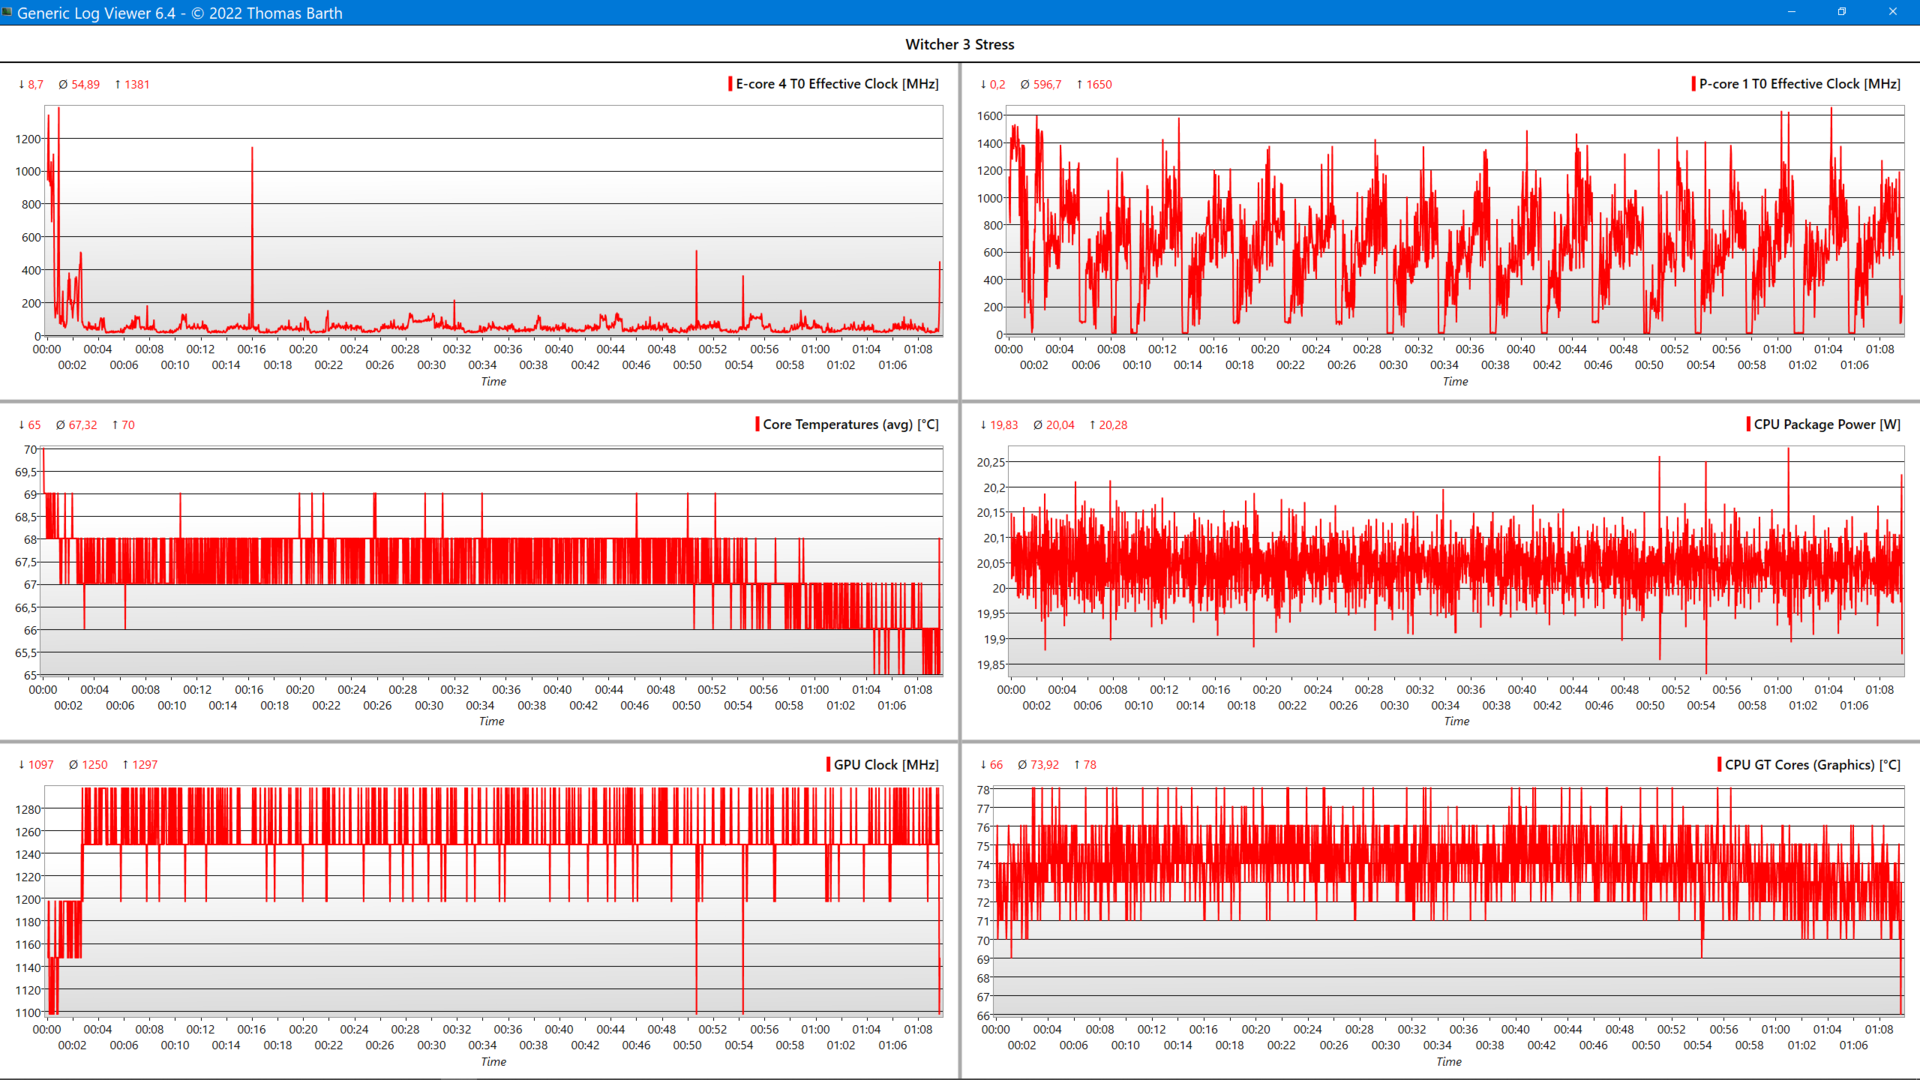
Tests de stress
Sous une charge combinée (Prime95+FurMark), les cœurs P ont chuté de 2,2 à 1,4 GHz après un court laps de temps - légèrement en dessous de l'horloge de base de 1,7 GHz. L'un des cœurs (P-Core 0) semble être désactivé la plupart du temps (0 MHz). La température chute d'un niveau initial de 95 °C à un niveau stable de 62 °C. L'iGPU glisse de 1300 MHz à 480 MHz à 61 °C. Une fois encore, le problème vient de la limite de puissance fixée à 20 watts.
En cas de stress pur du CPU, les cœurs P n'atteignent pas non plus leur horloge de base, mais tournent à 1,5 GHz (tous les cœurs actifs). Ce n'est que lorsque l'iGPU est sollicité qu'il parvient à atteindre 1 118 MHz à 66 °C.
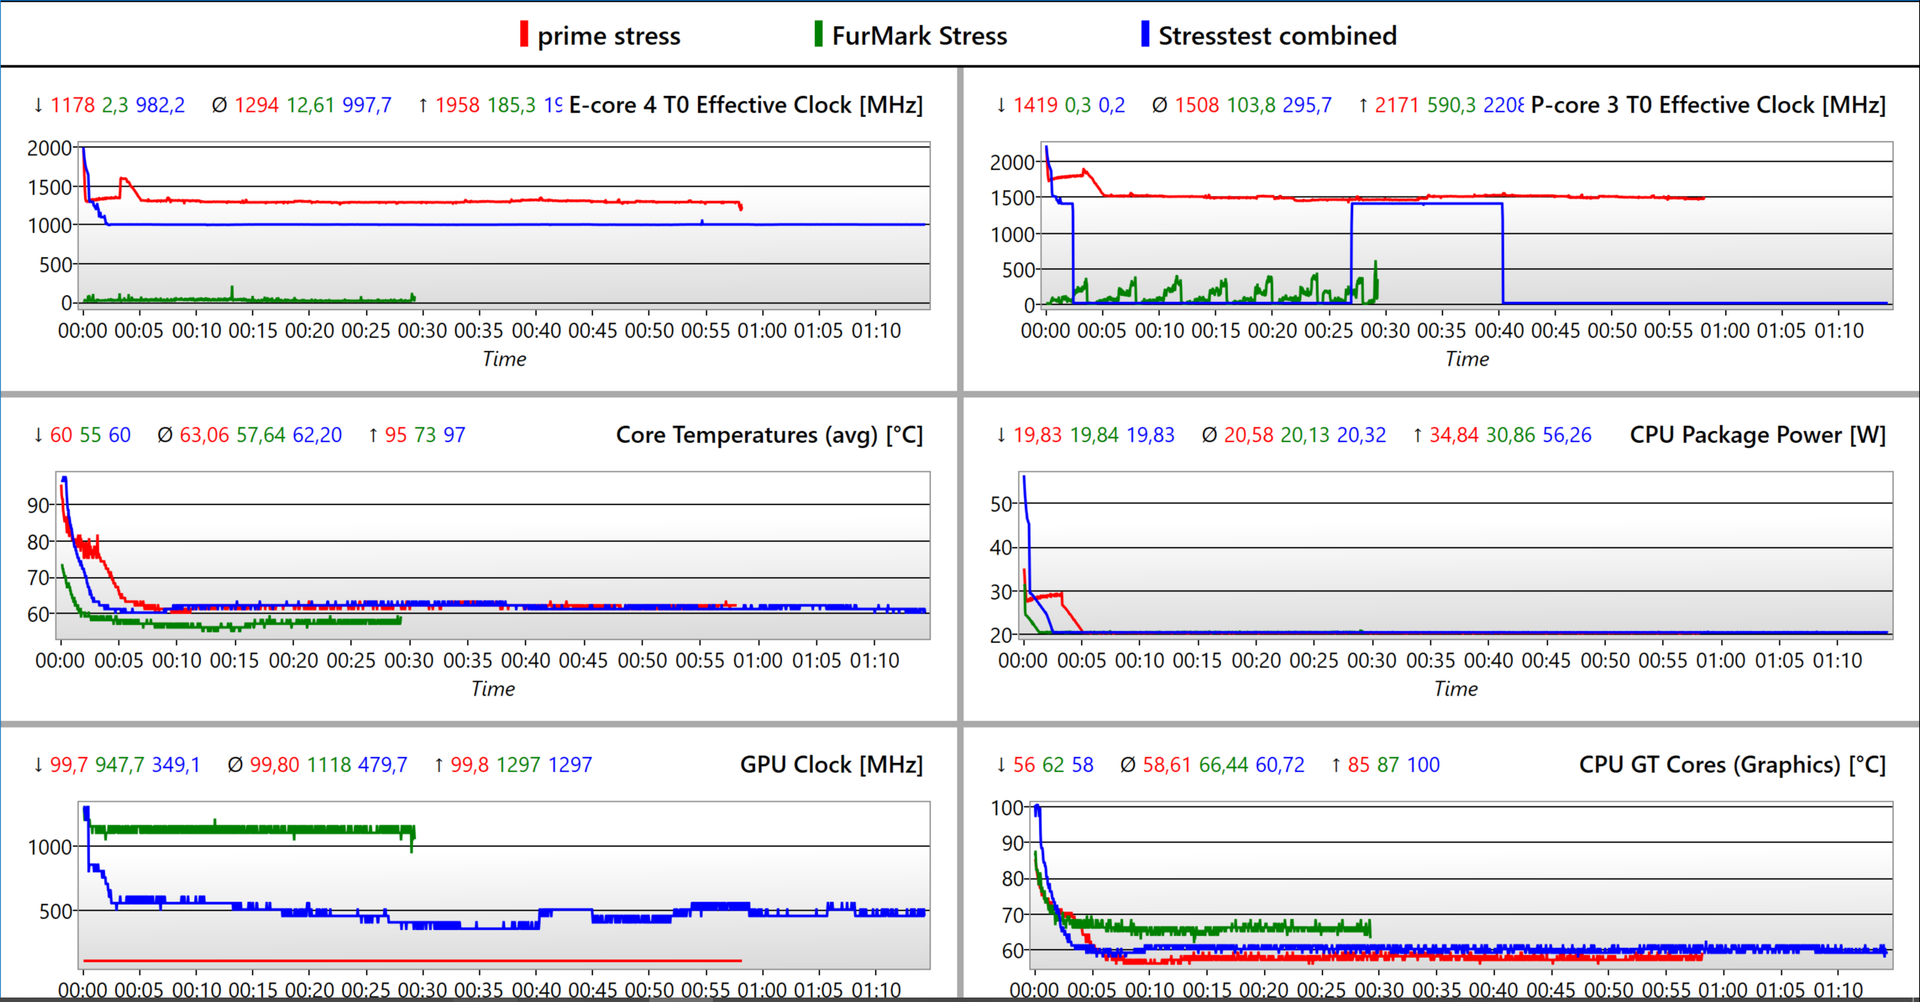
| Horloge CPU P- & E-Cores (GHz) | Horloge GPU (MHz) | Température CPU moyenne (°C) | Température GPU moyenne (°C) | |
| Système au repos | - | 100 | 34 | 36 |
| Prime95 + FurMark Stress | 1,4 / 1 | 480 | 62 | 61 |
| Prime95 Stress | 1,5 / 1,3 | 100 | 63 | 58 |
| FurMark Stress | 0,1 / 0,01 | 1.120 | 58 | 66 |
| Witcher 3 Stress | 0,6 / 0,05 | 1.250 | 67 | 74 |
Haut-parleurs
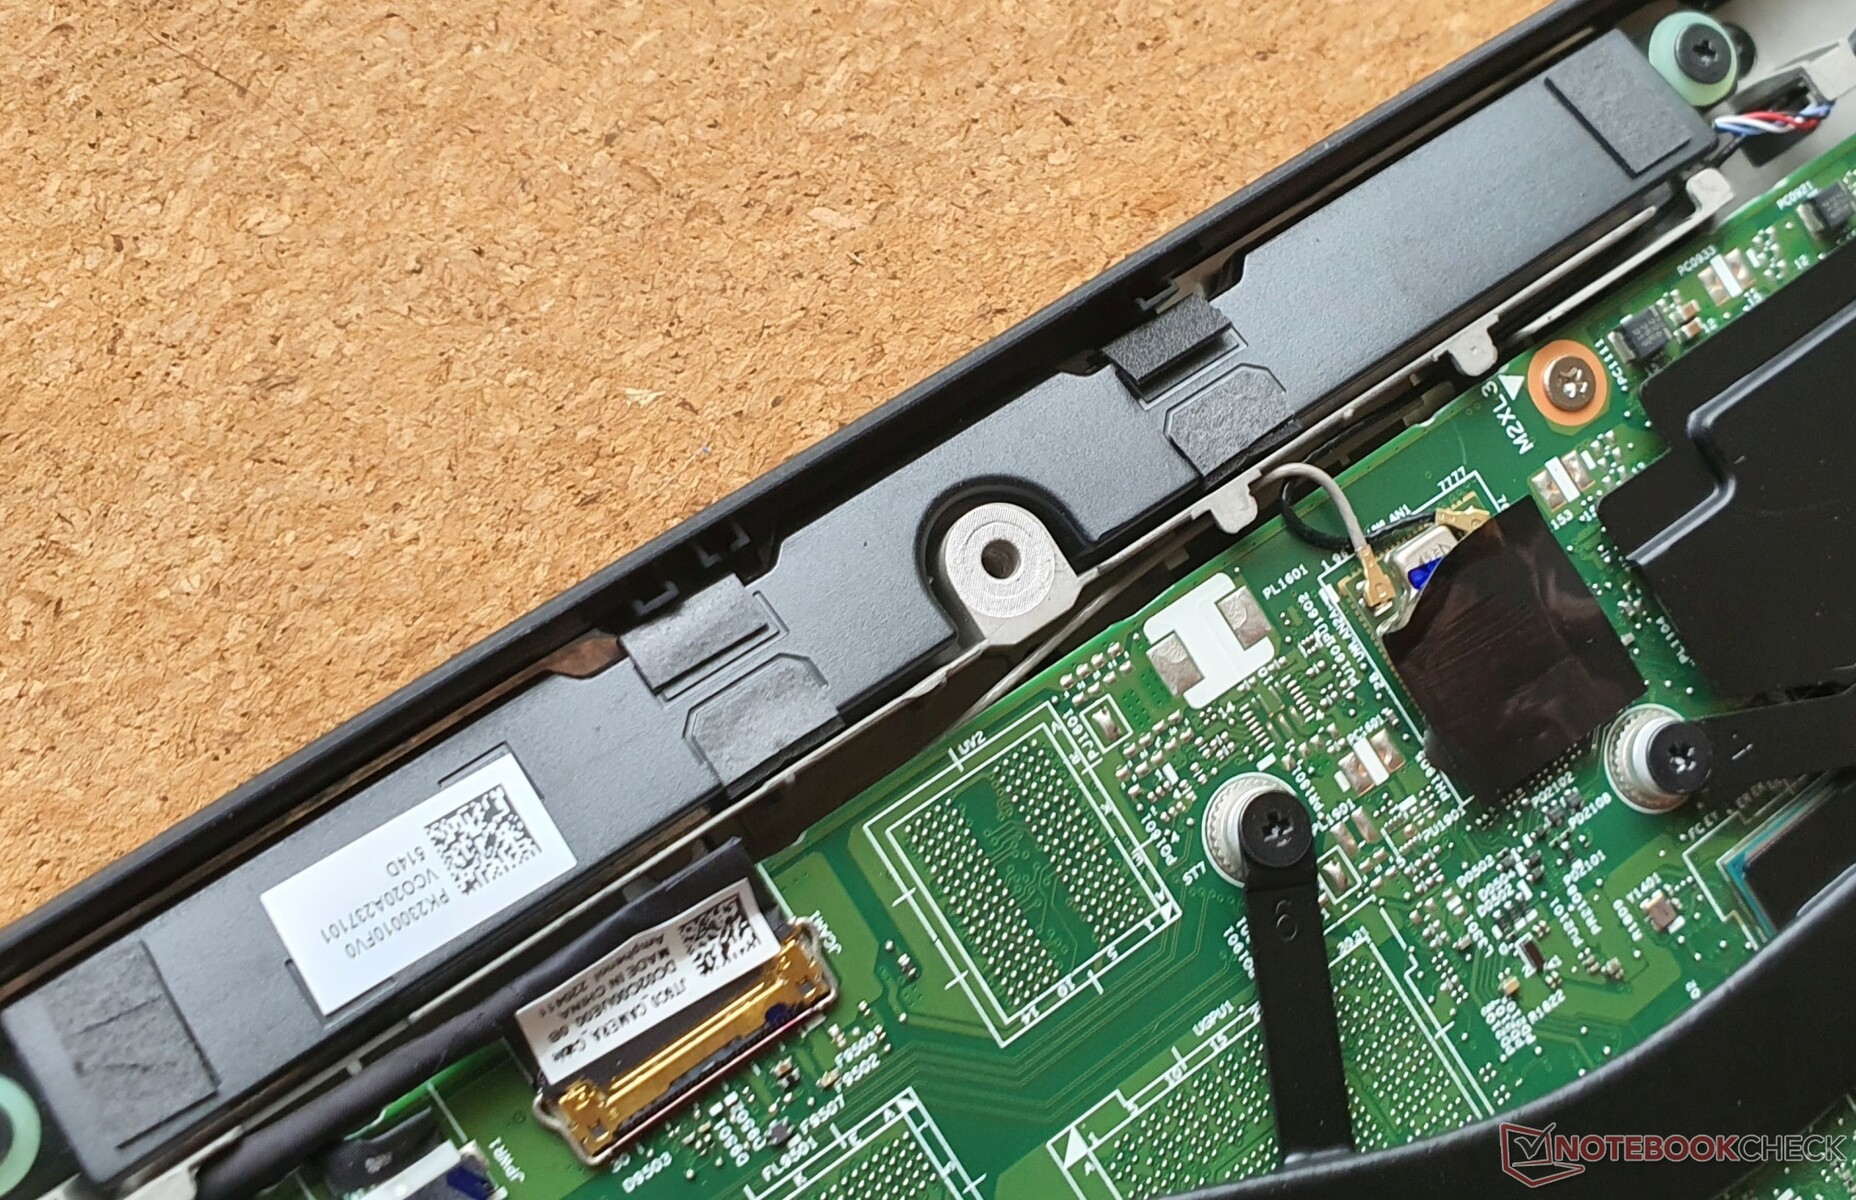
Heureusement, les enceintes de la série T ont été améliorées. Les basses manquent toujours, mais les médiums et les aigus sont équilibrés et reproduits de manière linéaire.
C'est acceptable pour les films et les vidéos, mais le plaisir de la musique n'est possible qu'avec un système de sonorisation externe ou des écouteurs connectés par jack ou Bluetooth. Avec un maximum de 75 dB(A), vous pouvez remplir de son une pièce de taille moyenne.
Lenovo ThinkPad T16 G1 21BWS00200 analyse audio
(±) | le niveau sonore du haut-parleur est moyen mais bon (75.16# dB)
Basses 100 - 315 Hz
(-) | presque aucune basse - en moyenne 20.5% plus bas que la médiane
(-) | les basses ne sont pas linéaires (15.5% delta à la fréquence précédente)
Médiums 400 - 2000 Hz
(+) | médiane équilibrée - seulement 2.3% de la médiane
(+) | les médiums sont linéaires (4.1% delta à la fréquence précédente)
Aiguës 2 - 16 kHz
(+) | des sommets équilibrés - à seulement 3.2% de la médiane
(+) | les aigus sont linéaires (5.5% delta à la fréquence précédente)
Globalement 100 - 16 000 Hz
(±) | la linéarité du son global est moyenne (17% de différence avec la médiane)
Par rapport à la même classe
» 24% de tous les appareils testés de cette catégorie étaient meilleurs, 8% similaires, 69% pires
» Le meilleur avait un delta de 7%, la moyenne était de 21%, le pire était de 53%.
Par rapport à tous les appareils testés
» 30% de tous les appareils testés étaient meilleurs, 8% similaires, 62% pires
» Le meilleur avait un delta de 4%, la moyenne était de 24%, le pire était de 134%.
Huawei MateBook D 16 2022 analyse audio
(±) | le niveau sonore du haut-parleur est moyen mais bon (76# dB)
Basses 100 - 315 Hz
(-) | presque aucune basse - en moyenne 17.7% plus bas que la médiane
(±) | la linéarité des basses est moyenne (9.8% delta à la fréquence précédente)
Médiums 400 - 2000 Hz
(+) | médiane équilibrée - seulement 1.9% de la médiane
(+) | les médiums sont linéaires (5.6% delta à la fréquence précédente)
Aiguës 2 - 16 kHz
(+) | des sommets équilibrés - à seulement 4.4% de la médiane
(+) | les aigus sont linéaires (3.1% delta à la fréquence précédente)
Globalement 100 - 16 000 Hz
(±) | la linéarité du son global est moyenne (16.2% de différence avec la médiane)
Par rapport à la même classe
» 41% de tous les appareils testés de cette catégorie étaient meilleurs, 7% similaires, 51% pires
» Le meilleur avait un delta de 5%, la moyenne était de 17%, le pire était de 45%.
Par rapport à tous les appareils testés
» 26% de tous les appareils testés étaient meilleurs, 6% similaires, 68% pires
» Le meilleur avait un delta de 4%, la moyenne était de 24%, le pire était de 134%.
Gestion de l'alimentation - batterie de 14 heures dans le ThinkPad 16 pouces
Consommation d'énergie
Nous avons mesuré une consommation d'énergie au ralenti de ~6 watts et un minimum de 2,9 watts. Notre champ de comparaison, y compris les dérivés d'AMD, n'est pas à la hauteur. En charge, nous avons mesuré une moyenne de 27,9 watts - une valeur qui est due à l'étranglement du CPU. La charge combinée (CPU+iGPU) donne 42,6 watts.
Les pics de puissance allant jusqu'à 90 watts, provoqués par le turbo à court terme, peuvent être bien absorbés par l'adaptateur d'alimentation de 135 watts. De plus, l'adaptateur électrique permet de charger rapidement la grande batterie de 86 Wh à 80 % en une heure. On peut se demander si un adaptateur de 100 watts, qui serait un peu plus compact et qui est proposé avec la version AMD, ferait aussi bien l'affaire.
| Éteint/en veille | |
| Au repos | |
| Fortement sollicité |
|
Légende:
min: | |
| Lenovo ThinkPad T16 G1 21BWS00200 i5-1240P, Iris Xe G7 80EUs, Samsung PM9A1 MZVL2512HCJQ, IPS, 1920x1200, 16" | Lenovo ThinkPad T15 Gen2-20W5S00100 i7-1165G7, GeForce MX450, Samsung PM981a MZVLB1T0HBLR, IPS, 1920x1080, 15.6" | Lenovo ThinkPad X1 Extreme G4-20Y5CTO1WW (3050 Ti) i7-11800H, GeForce RTX 3050 Ti Laptop GPU, Samsung PM9A1 MZVL21T0HCLR, IPS LED, 3840x2400, 16" | HP ProBook 450 G9 6A180EA i7-1255U, Iris Xe G7 96EUs, SK Hynix HFM512GD3JX013N, , 1920x1080, 15.6" | HP ZBook Power 15 G8 313S5EA i7-11800H, T600 Laptop GPU, Samsung PM9A1 MZVL2512HCJQ, IPS LED, 1920x1080, 15.6" | Huawei MateBook D 16 2022 i7-12700H, Iris Xe G7 96EUs, Silicon Motion PCIe-8 SSD, IPS, 1920x1200, 16" | Dell Inspiron 16 Plus 7620 i7-12700H, GeForce RTX 3050 Ti Laptop GPU, Kioxia BG5 KBG50ZNS512G, IPS, 3072x1920, 16" | Lenovo ThinkPad L15 G2 AMD R5 5600U, Vega 7, SK Hynix HFS512 GDE9X081N, IPS LED, 1920x1080, 15.6" | Moyenne de la classe Office | |
|---|---|---|---|---|---|---|---|---|---|
| Power Consumption | -44% | -210% | -8% | -55% | -70% | -151% | -14% | -27% | |
| Idle Minimum * (Watt) | 2.9 | 4.5 -55% | 10.3 -255% | 4.5 -55% | 4.17 -44% | 6.1 -110% | 6.8 -134% | 4.57 -58% | 4.41 ? -52% |
| Idle Average * (Watt) | 6 | 8.8 -47% | 22.06 -268% | 7.3 -22% | 6.32 -5% | 10.6 -77% | 9.6 -60% | 8.2 -37% | 7.37 ? -23% |
| Idle Maximum * (Watt) | 6.9 | 11.6 -68% | 23 -233% | 8.1 -17% | 7.1 -3% | 11.5 -67% | 17 -146% | 9.3 -35% | 8.58 ? -24% |
| Load Average * (Watt) | 27.3 | 60 -120% | 102.57 -276% | 32.8 -20% | 80.41 -195% | 65.5 -140% | 117.5 -330% | 31.9 -17% | 43 ? -58% |
| Witcher 3 ultra * (Watt) | 42.6 | 39.2 8% | 106 -149% | 32 25% | 62.3 -46% | 61.2 -44% | 113.1 -165% | 34.5 19% | |
| Load Maximum * (Watt) | 81.53 | 68.5 16% | 147.8 -81% | 47 42% | 110.18 -35% | 68.4 16% | 137.4 -69% | 47.4 42% | 64.6 ? 21% |
* ... Moindre est la valeur, meilleures sont les performances
Power consumption Witcher 3 / Stress test
Power consumption with an external monitor
Autonomie de la batterie
Malgré la grande batterie de 86 Wh de notre modèle, nous ne nous attendions pas à ce que le test WLAN dure plus de 14 heures. Nous utilisons un script qui simule le surf sur Internet à une valeur fixe de 150 nits, en utilisant le profil énergétique "Balanced" de Windows. Le siteCore i5-1240P semble être plus économique que le Core i7-1280Pprobablement parce que ce dernier possède plus de P-cores. L'écran à faible consommation d'énergie avec une résolution FHD+ a également un effet positif, notamment à pleine luminosité de 390 nits, où le ThinkPad atteint presque 11 heures.
Une perspective intéressante est de savoir si une variante AMD du T16 sera capable d'offrir encore plus. La durée de fonctionnement à pleine charge de 3,5 heures est proportionnellement longue en raison de la faible limite de puissance de 20 watts.
| Lenovo ThinkPad T16 G1 21BWS00200 i5-1240P, Iris Xe G7 80EUs, 86 Wh | Lenovo ThinkPad T15 Gen2-20W5S00100 i7-1165G7, GeForce MX450, 57 Wh | Lenovo ThinkPad E15 G3-20YG003UGE R7 5700U, Vega 8, 57 Wh | Lenovo ThinkPad L15 G2 AMD R5 5600U, Vega 7, 45 Wh | HP ProBook 450 G9 6A180EA i7-1255U, Iris Xe G7 96EUs, 51 Wh | HP ZBook Power 15 G8 313S5EA i7-11800H, T600 Laptop GPU, 83 Wh | Dell Inspiron 16 Plus 7620 i7-12700H, GeForce RTX 3050 Ti Laptop GPU, 86 Wh | Huawei MateBook D 16 2022 i7-12700H, Iris Xe G7 96EUs, 60 Wh | Asus Vivobook Pro 16X-M7600QE R9 5900HX, GeForce RTX 3050 Ti Laptop GPU, 96 Wh | |
|---|---|---|---|---|---|---|---|---|---|
| Autonomie de la batterie | -44% | -29% | -45% | -17% | -19% | -49% | -50% | -45% | |
| H.264 (h) | 10.4 | 10.1 -3% | |||||||
| WiFi v1.3 (h) | 14.1 | 7.9 -44% | 10 -29% | 7.8 -45% | 10.1 -28% | 12.3 -13% | 9.6 -32% | 7.1 -50% | 11.3 -20% |
| Load (h) | 3.5 | 3.3 -6% | 2.1 -40% | 1.2 -66% | 1.1 -69% | ||||
| Witcher 3 ultra (h) | 2.7 |
Points positifs
Points négatifs
Verdict - ThinkPad T16 : écran solide, longues durées d'exécution, performances limitées

Le ThinkPad T16 G1 Intel offre beaucoup : un écran 16 pouces lumineux 16:10 à faible consommation d'énergie, une très longue autonomie de la batterie, des équipements divers et un fonctionnement pratiquement silencieux. À cela s'ajoute un design haut de gamme robuste
Une refonte globalement réussie, malgré la course des touches plus courte et l'absence de l'option 4K. La limitation PL1 à 20 watts est un peu gênante, ce qui limite inutilement les performances par ailleurs bonnes
Avec le ThinkPad T16 G1, Lenovo propose un solide ordinateur portable professionnel doté d'une très longue autonomie, d'un écran 16:10 lumineux et peu gourmand en énergie et de faibles émissions. Cependant, l'étranglement du processeur peut s'avérer problématique en dehors des tâches de bureau.
Pour les utilisateurs professionnels à la recherche d'un appareil compact avec beaucoup de surface d'écran et une longue durée de vie de la batterie, le T16 semble être inégalé grâce à son bon clavier, ses fonctionnalités et son comportement silencieux. L'examen du EliteBook 865 G9 de HP, qui sera bientôt publié, est donc une perspective intéressante. La comparaison avec la variante AMD du T16, qui a le potentiel d'offrir plus de performances avec des émissions encore plus faibles et des durées d'exécution encore plus élevées, sera également passionnante, mais cela reste à voir dans un prochain article
Ceux qui ont également besoin d'un GPU de station de travail devraient regarder le ZBook Power 15. Ceux qui n'ont pas besoin du meilleur des meilleurs trouveront un meilleur rapport qualité-prix dans le ThinkPad E15 AMDqui est plus de deux fois moins cher
Prix et disponibilité
L'ordinateur portable Lenovo ThinkPad T16 G1 Intel semble être largement disponible en tant qu'ordinateur portable librement configurable via le site officiel de Lenovo. Par exemple, nous avons trouvé l'ordinateur portable sur aux États-Unis (à partir de 1 099,50 $), au Royaume-Uni (1 169,99 £), Inde (₹97,185), France (1,427.25€), Singapour (SG$1,494.58) et Australie (2 229,00 AU$). Cette liste n'est pas exhaustive.
Les prix sont en date du 23.09.22 et peuvent être modifiés
Lenovo ThinkPad T16 G1 21BWS00200
- 09/21/2022 v7 (old)
Marvin Gollor
Price comparison

