Testés dans les ordinateurs portables : NVIDIA GeForce MX450 carte graphique
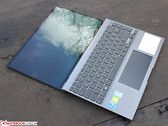
Test de l'Asus ZenBook Flip 15 Q508U : la GeForce MX450 à la traîne
Un ultrabook AMD Zen + Nvidia MX semblait intéressant il y a quelques années, mais c'est trop peu trop tard maintenant que les CPU Zen 3+ sont disponibles avec la Radeon 680M intégrée, plus rapide, plus petite et plus efficace. Le GeForce MX450 n'est toujours pas mauvais si vous n'êtes pas gêné par le poids et l'épaisseur supplémentaires, cependant.
AMD Ryzen 7 5700U, NVIDIA GeForce MX450, 15.6", 1.9 kgTest de l'Asus ZenBook 14X OLED : Jeux et couleurs 3K intenses
Asus a fait un effort supplémentaire : Ce 14 pouces combine les performances graphiques facilement ajustables d'un MX450 avec un Core i7 évolutif Tiger Lake. En plus de cela, il dispose d'un écran large OLED 3K coloré. Est-ce que cela laisse quelque chose à désirer ?
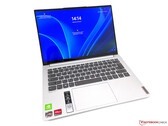
Intel Core i7-1165G7, NVIDIA GeForce MX450, 14", 1.4 kgTest du Lenovo Yoga Slim 7 Pro 14 OLED : un ultraportable au processeur puissant
En option, Lenovo propose également son subnotebook Yoga Slim 7 Pro 14 pouces compact avec un écran OLED et une GeForce MX450 dédiée. Dans le même temps, vous n'aurez pas non plus à vous passer d'un processeur AMD Ryzen 9 très puissant dans cette configuration.
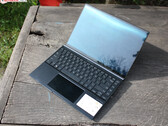
AMD Ryzen 9 5900HS, NVIDIA GeForce MX450, 14", 1.4 kgTest de l'Asus Zenbook 14X OLED de préproduction : des couleurs éclatantes !
L'ordinateur portable de 14 pouces d'Asus combine un superbe écran OLED avec un boîtier de première classe, à la fois robuste et de haute qualité. Les performances devraient également être excellentes grâce au MX450 et à un SoC Tiger Lake d'Intel. Lisez la suite pour savoir ce qui nous a plu et déplu dans ce modèle de pré-production.
Intel Core i7-1165G7, NVIDIA GeForce MX450, 14", 1.4 kgTest du Dell Inspiron 15 5518 : un processeur bridé
L'Inspiron 15 5518 offre un processeur Core i5-11300H, un GPU GeForce-MX450 et 8 Go de mémoire de travail. Cette dernière fonctionne en mode monocanal. Positif : L'ordinateur portable offre une très bonne autonomie de batterie et propose un espace pour deux disques SSD NVMe.
Intel Core i5-11300H, NVIDIA GeForce MX450, 15.6", 1.8 kgDell Inspiron 13 5310-NJ24J: Intel Core i5-11300H, 13.30", 1.3 kg
Critique » Test du Dell Inspiron 13 5310 : plus de graphismes, plus d'autonomie
Lenovo IdeaPad 5 Pro 16IHU6: Intel Core i5-11300H, 16.00", 1.9 kg
Critique » Test du Lenovo IdeaPad 5 Pro 16IHU6 : PC portable polyvalent de 16 pouces avec une bonne autonomie
HP Envy 17-cg: Intel Core i5-1135G7, 17.30", 2.7 kg
Critique » Test du HP Envy 17 cg1356ng : un grand ordinateur portable multimédia
MSI Modern 14 B11SB-085: Intel Core i7-1165G7, 14.00", 1.3 kg
Critique » Test du MSI Modern 14 B11SB : le PC portable polyvalent de 14 pouces chauffe trop
Xiaomi RedmiBook Pro 15: Intel Core i7-11370H, 15.60", 1.7 kg
Critique » Test du Xiaomi RedmiBook Pro 15 (2021) : PC portable abordable avec des caractéristiques solides
HP Pavilion 15-eg: Intel Core i7-1165G7, 15.60", 1.7 kg
Critique » Test du HP Pavilion 15 (2021) : Intel 11e génération et GeForce MX450
Lenovo ThinkPad T14 Gen2-20W1S00000: Intel Core i7-1165G7, 14.00", 1.5 kg
Critique » Test du Lenovo ThinkPad T14 Gen 2 : les avantages habituels d'Intel Tiger Lake
Lenovo ThinkPad T15 Gen2-20W5S00100: Intel Core i7-1165G7, 15.60", 1.9 kg
Critique » Test du Lenovo ThinkPad T15 Gen2 : PC pro avec GPU multimédia et Tiger Lake
Lenovo ThinkPad E15 Gen2-20TD002MGE: Intel Core i7-1165G7, 15.60", 1.8 kg
Critique » Test du Lenovo ThinkPad E15 Gen 2 : PC portable Tiger Lake avec Nvidia GeForce MX450
Asus Zenbook 14 UX435EG: Intel Core i7-1165G7, 14.00", 1.3 kg
Critique » Test de l'Asus ZenBook 14 UX435EG : un PC multimédia compact et mobile avec un écran tactile inutile
Asus Zenbook Flip 15 UM562UG-AC018WS: AMD Ryzen 7 5700U, 15.60", 1.9 kg
Autres tests » Asus Zenbook Flip 15 UM562UG-AC018WS
HP Envy 17-ch1056nf: Intel Core i7-1195G7, 17.30", 2.5 kg
Autres tests » HP Envy 17-ch1056nf
Dell Inspiron 15 5510, i7-11390H MX450: Intel Core i7-11390H, 15.60", 1.6 kg
Autres tests » Dell Inspiron 15 5510, i7-11390H MX450
Dell Inspiron 15 5518-NP37P: Intel Core i5-11320H, 15.60", 1.8 kg
Autres tests » Dell Inspiron 15 5518-NP37P
Lenovo Yoga Slim 7 Pro 14IHU5-82NH002QGE: Intel Core i7-11370H, 14.00", 1.4 kg
Autres tests » Lenovo Yoga Slim 7 Pro 14IHU5-82NH002QGE
Acer Aspire 5 A517-52G-59GP: Intel Core i5-1135G7, 17.30", 2.6 kg
Autres tests » Acer Aspire 5 A517-52G-59GP
Lenovo Yoga Slim 7 Pro 14 OLED Ryzen 9: AMD Ryzen 9 5900HS, 14.00", 1.4 kg
Autres tests » Lenovo Yoga Slim 7 Pro 14 OLED Ryzen 9
Dell Latitude 15 5521, i5-11500H MX450: Intel Core i5-11500H, 15.60", 1.8 kg
Autres tests » Dell Latitude 15 5521, i5-11500H MX450
MSI Modern 14 B11SB, i5-1135G7 MX450: Intel Core i5-1135G7, 14.00", 1.3 kg
Autres tests » MSI Modern 14 B11SB, i5-1135G7 MX450
Asus Zenbook 14X UX5400EG, i5-1135G7: Intel Core i5-1135G7, 14.00", 1.4 kg
Autres tests » Asus Zenbook 14X UX5400EG, i5-1135G7
HP Envy 13-ba1002ns: Intel Core i7-1165G7, 13.30", 1.3 kg
Autres tests » HP Envy 13-ba1002ns
Lenovo Yoga Slim 7 Carbon 14ACN6, 5800U: AMD Ryzen 7 5800U, 14.00", 1.1 kg
Autres tests » Lenovo Yoga Slim 7 Carbon 14ACN-6, 5800U
Lenovo Yoga Slim 7 Pro 14ARH5-82NK001PSB: AMD Ryzen 9 5900HS, 14.00", 1.3 kg
Autres tests » Lenovo Yoga Slim 7 Pro 14ARH5-82NK001PSB
Asus Zenbook 14X UX5400E: Intel Core i7-1165G7, 14.00", 1.4 kg
Autres tests » Asus Zenbook 14X UX5400E
HP Envy 13-ba1012ns: Intel Core i7-1165G7, 13.30", 1.3 kg
Autres tests » HP Envy 13-ba1012ns
HP Pavilion 15-eg0006ns: Intel Core i7-1165G7, 15.60", 1.8 kg
Autres tests » HP Pavilion 15-eg0006ns
HP Pavilion 15-eg0007ns: Intel Core i7-1165G7, 15.60", 1.8 kg
Autres tests » HP Pavilion 15-eg0007ns
HP Envy 17-ch0000ns: Intel Core i7-1165G7, 17.30", 2.5 kg
Autres tests » HP Envy 17-ch0000ns
MSI Prestige 15 A11SB-449: Intel Core i5-1135G7, 15.60", 1.7 kg
Autres tests » MSI Prestige 15 A11SB-449
HP Pavilion 15-eg: Intel Core i7-1165G7, 15.60", 1.7 kg
Autres tests » HP Pavilion 15-eg0025cl
MSI Modern 14 B11SB-008ES: Intel Core i7-1165G7, 14.00", 1.3 kg
Autres tests » MSI Modern 14 B11SB-008ES
MSI Modern 15 A11SB-011ES: Intel Core i7-1165G7, 15.60", 1.6 kg
Autres tests » MSI Modern 15 A11SB-011ES
Xiaomi Mi Notebook Pro 15, i5-11300H MX450: Intel Core i5-11300H, 15.60", 1.8 kg
Autres tests » Xiaomi Mi Notebook Pro 15, i5-11300H MX450
HP Envy 17-cg1000ns: Intel Core i7-1165G7, 17.30", 2.7 kg
Autres tests » HP Envy 17-cg1000ns
Xiaomi RedmiBook Pro 14 2021, i7-1165G7 MX450: Intel Core i7-1165G7, 14.00", 1.5 kg
Autres tests » Xiaomi RedmiBook Pro 14 2021, i7-1165G7 MX450
Xiaomi RedmiBook Pro 15, i5-11300H MX450: Intel Core i5-11300H, 15.60", 1.7 kg
Autres tests » Xiaomi RedmiBook Pro 15, i5-11300H MX450
HP Pavilion 14-dv0005ns: Intel Core i7-1165G7, 14.00", 1.4 kg
Autres tests » HP Pavilion 14-dv0005ns
Lenovo IdeaPad 5 14ITL05-82FE005QGE: Intel Core i7-1165G7, 14.00"
Autres tests » Lenovo IdeaPad 5 14ITL05-82FE005QGE
MSI Modern 14 B11SB-009XES: Intel Core i7-1165G7, 14.00", 1.3 kg
Autres tests » MSI Modern 14 B11SB-009XES
HP Envy 13-ba1033tx: Intel Core i7-1165G7, 13.30", 1.3 kg
Autres tests » HP Envy 13-ba1033tx
HP Pavilion 14-dv0065tx: Intel Core i5-1135G7, 14.00", 1.4 kg
Autres tests » HP Pavilion 14-dv0065tx
HP Pavilion 14-dv0067tx: Intel Core i7-1165G7, 14.00", 1.5 kg
Autres tests » HP Pavilion 14-dv0067tx
Lenovo Yoga Slim 7i Pro: Intel Core i7-1165G7, 14.00", 1.5 kg
Autres tests » Lenovo Yoga Slim 7i Pro
HP Envy 17-cg1490nd : Intel Core i7-1165G7, 17.30", 2.8 kg
Autres tests » HP Envy 17-cg1490nd
Asus Zenbook 14 UX435EG: Intel Core i7-1165G7, 14.00", 1.3 kg
Autres tests » Asus Zenbook 14 UX435EG
MSI Modern 15 A11SB-039RU: Intel Core i7-1165G7, 15.60", 1.6 kg
Autres tests » MSI Modern 15 A11SB-039RU
HP Envy 17-cg1279ng: Intel Core i7-1165G7, 17.30", 2.7 kg
Autres tests » HP Envy 17-cg1279ng
Asus ZenBook Flip 15 Q508U: AMD Ryzen 7 5700U, 15.60", 1.9 kg
» La série Nvidia GeForce MX se bat contre la Radeon 680M d'AMD
Lenovo Yoga Slim 7 Pro 14 OLED Ryzen 9: AMD Ryzen 9 5900HS, 14.00", 1.4 kg
» Alder Lake d'Intel est plus lent que le Zen 3 de Cezanne d'AMD à 45W TDP
HP Pavilion 15-eg: Intel Core i7-1165G7, 15.60", 1.7 kg
» Nvidia a donné aux fabricants d'ordinateurs portables un score 3DMark inutile et exagéré pour GeForce MX450 qui s'est avéré impossible à atteindre
Asus Zenbook 14 UX435EG: Intel Core i7-1165G7, 14.00", 1.3 kg
» 12-Watt GeForce Le MX450 bat le 25-Watt GeForce-MX350 - Test du Asus ZenBook 14 UX435EG