Test du Lenovo ThinkPad T16 Gen 1 Core i7 : le silence au détriment des performances
Le ThinkPad T16 G1 est le deuxième ThinkPad 16 pouces de Lenovo, conçu pour être un cran au-dessus de la série existante des ThinkBook 16 destinés aux professionnels. Il propose des options de CPU Core U et Core P de 12e génération, ainsi que le GPU discret GeForce MX550 sur certaines UGS.
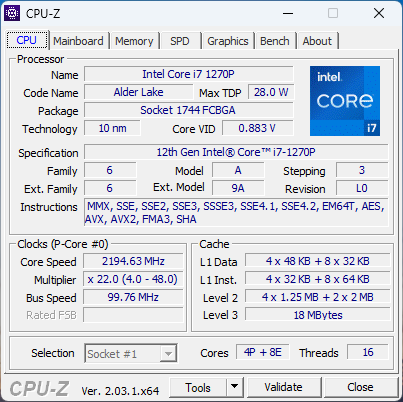
Nous avons récemment examiné les configurations Core i5-1240P et Ryzen 5 Pro 6650U et cet examen se concentrera donc sur la configuration Core i7-1270P. Nous vous recommandons de consulter notre article sur la version Version Core i5 pour en savoir plus sur le châssis et les autres caractéristiques physiques du ThinkPad T16 G1. Quelle différence de performances les utilisateurs peuvent-ils attendre en passant à l'option Core i7, plus coûteuse ?
Parmi les concurrents du ThinkPad T16 G1, citons le 16 pouces LG Gram 16, MSI Summit E16ou HP EliteBook 860/865 G9. Dell n'a pas encore lancé de concurrent direct de 16 pouces sur Latitude au moment de la rédaction de cet article. Notre configuration, telle qu'elle a été examinée, est vendue au détail à environ 1800 dollars américains.
Plus de commentaires sur Lenovo :
Comparaison avec les concurrents potentiels
Note | Date | Modèle | Poids | Épaisseur | Taille | Résolution | Prix |
|---|---|---|---|---|---|---|---|
| 88.6 % v7 (old) | 01/23 | Lenovo ThinkPad T16 Gen 1 Core i7-1270P i7-1270P, Iris Xe G7 96EUs | 2 kg | 20.5 mm | 16.00" | 1920x1200 | |
| 90.2 % v7 (old) | 02/23 | Lenovo ThinkPad T16 G1 21CH004MGE R5 PRO 6650U, Radeon 660M | 1.8 kg | 20.5 mm | 16.00" | 2560x1600 | |
| 86.6 % v7 (old) | 01/23 | LG Gram 16Z90Q i7-1260P, Iris Xe G7 96EUs | 1.2 kg | 16.8 mm | 16.00" | 2560x1600 | |
| 87.2 % v7 (old) | 12/22 | HP EliteBook 865 G9 R7 PRO 6850U, Radeon 680M | 1.9 kg | 19 mm | 16.00" | 1920x1200 | |
| 86.4 % v7 (old) | 07/22 | Huawei MateBook 16s i7 i7-12700H, Iris Xe G7 96EUs | 2 kg | 17.8 mm | 16.00" | 2520x1680 | |
| 93.2 % v7 (old) | 11/21 | Apple MacBook Pro 16 2021 M1 Pro M1 Pro, M1 Pro 16-Core GPU | 2.2 kg | 16.8 mm | 16.20" | 3456x2234 |
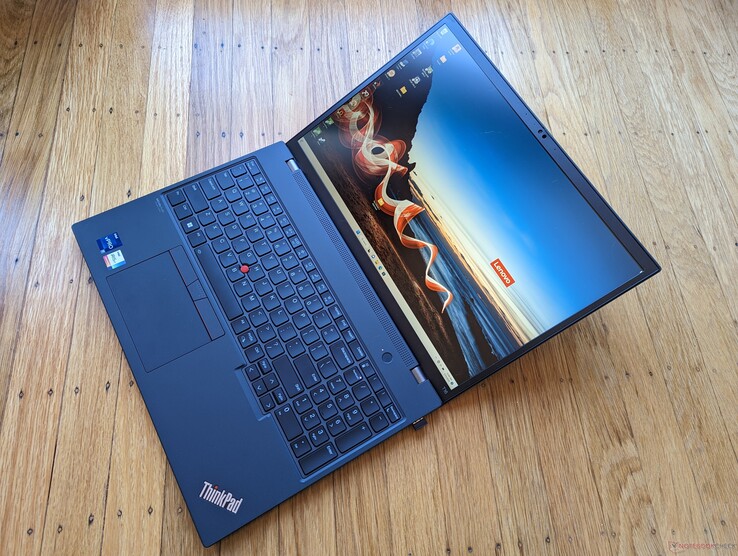
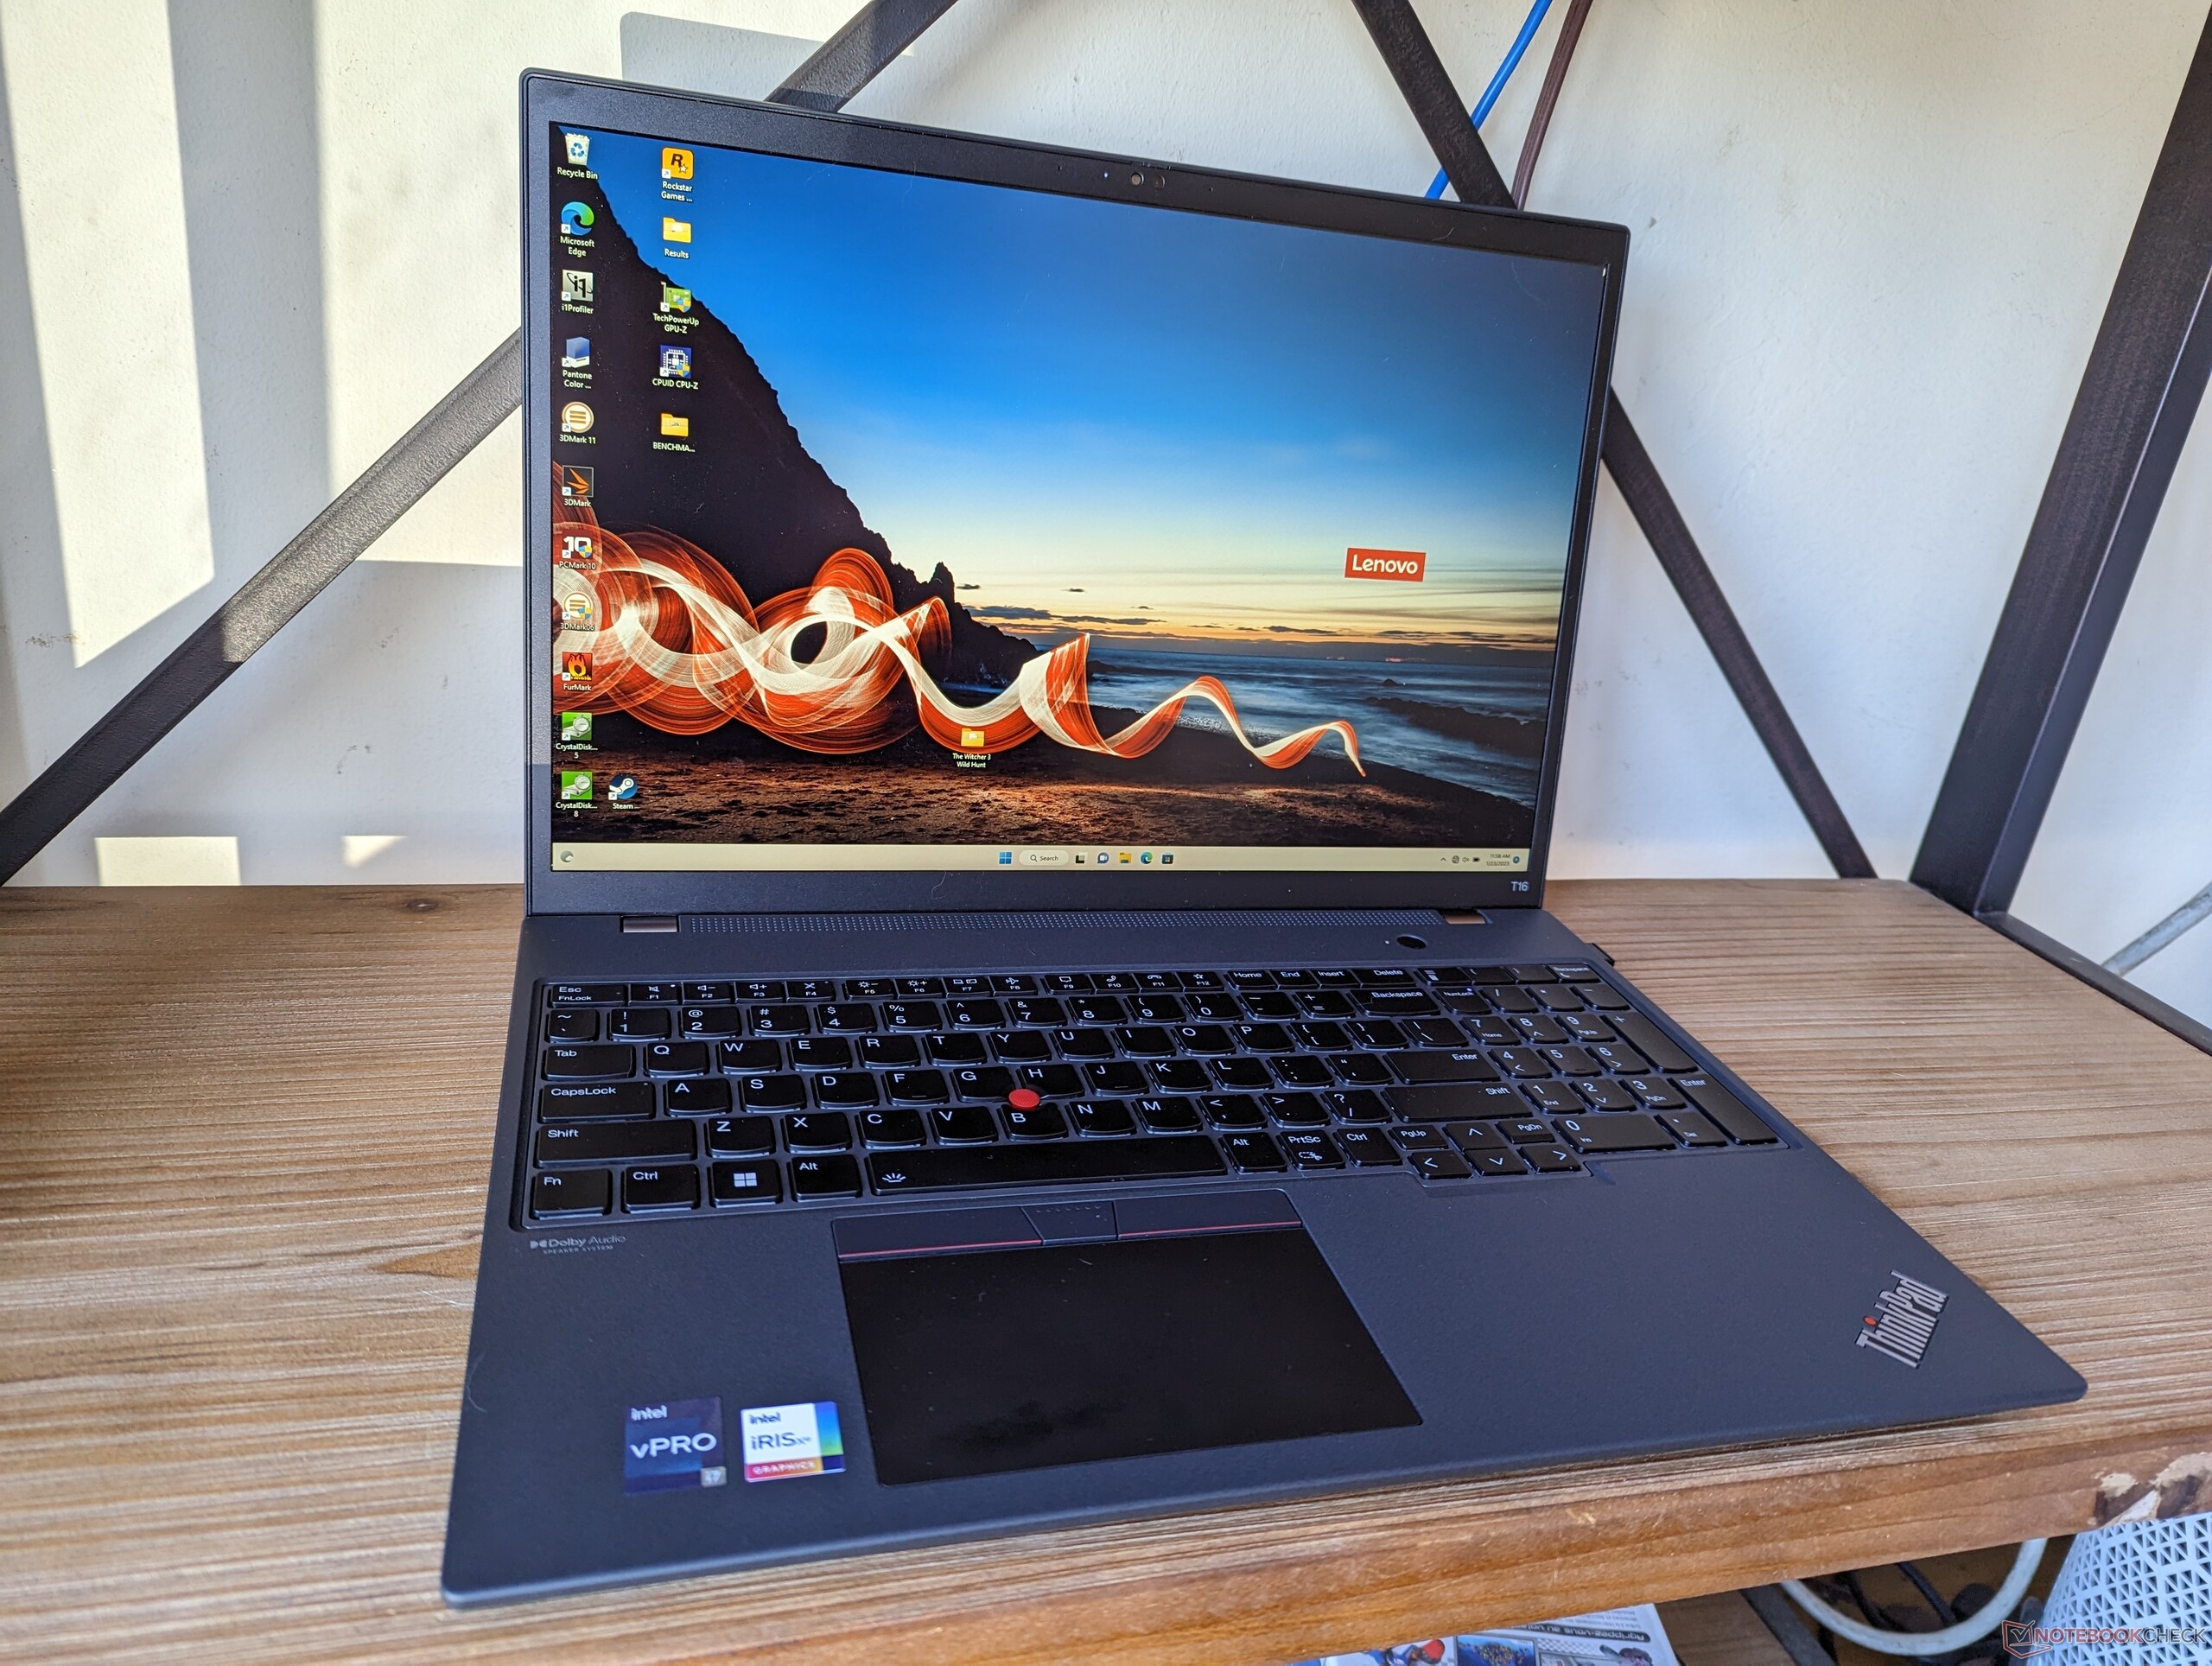
Affaire - A Little Big
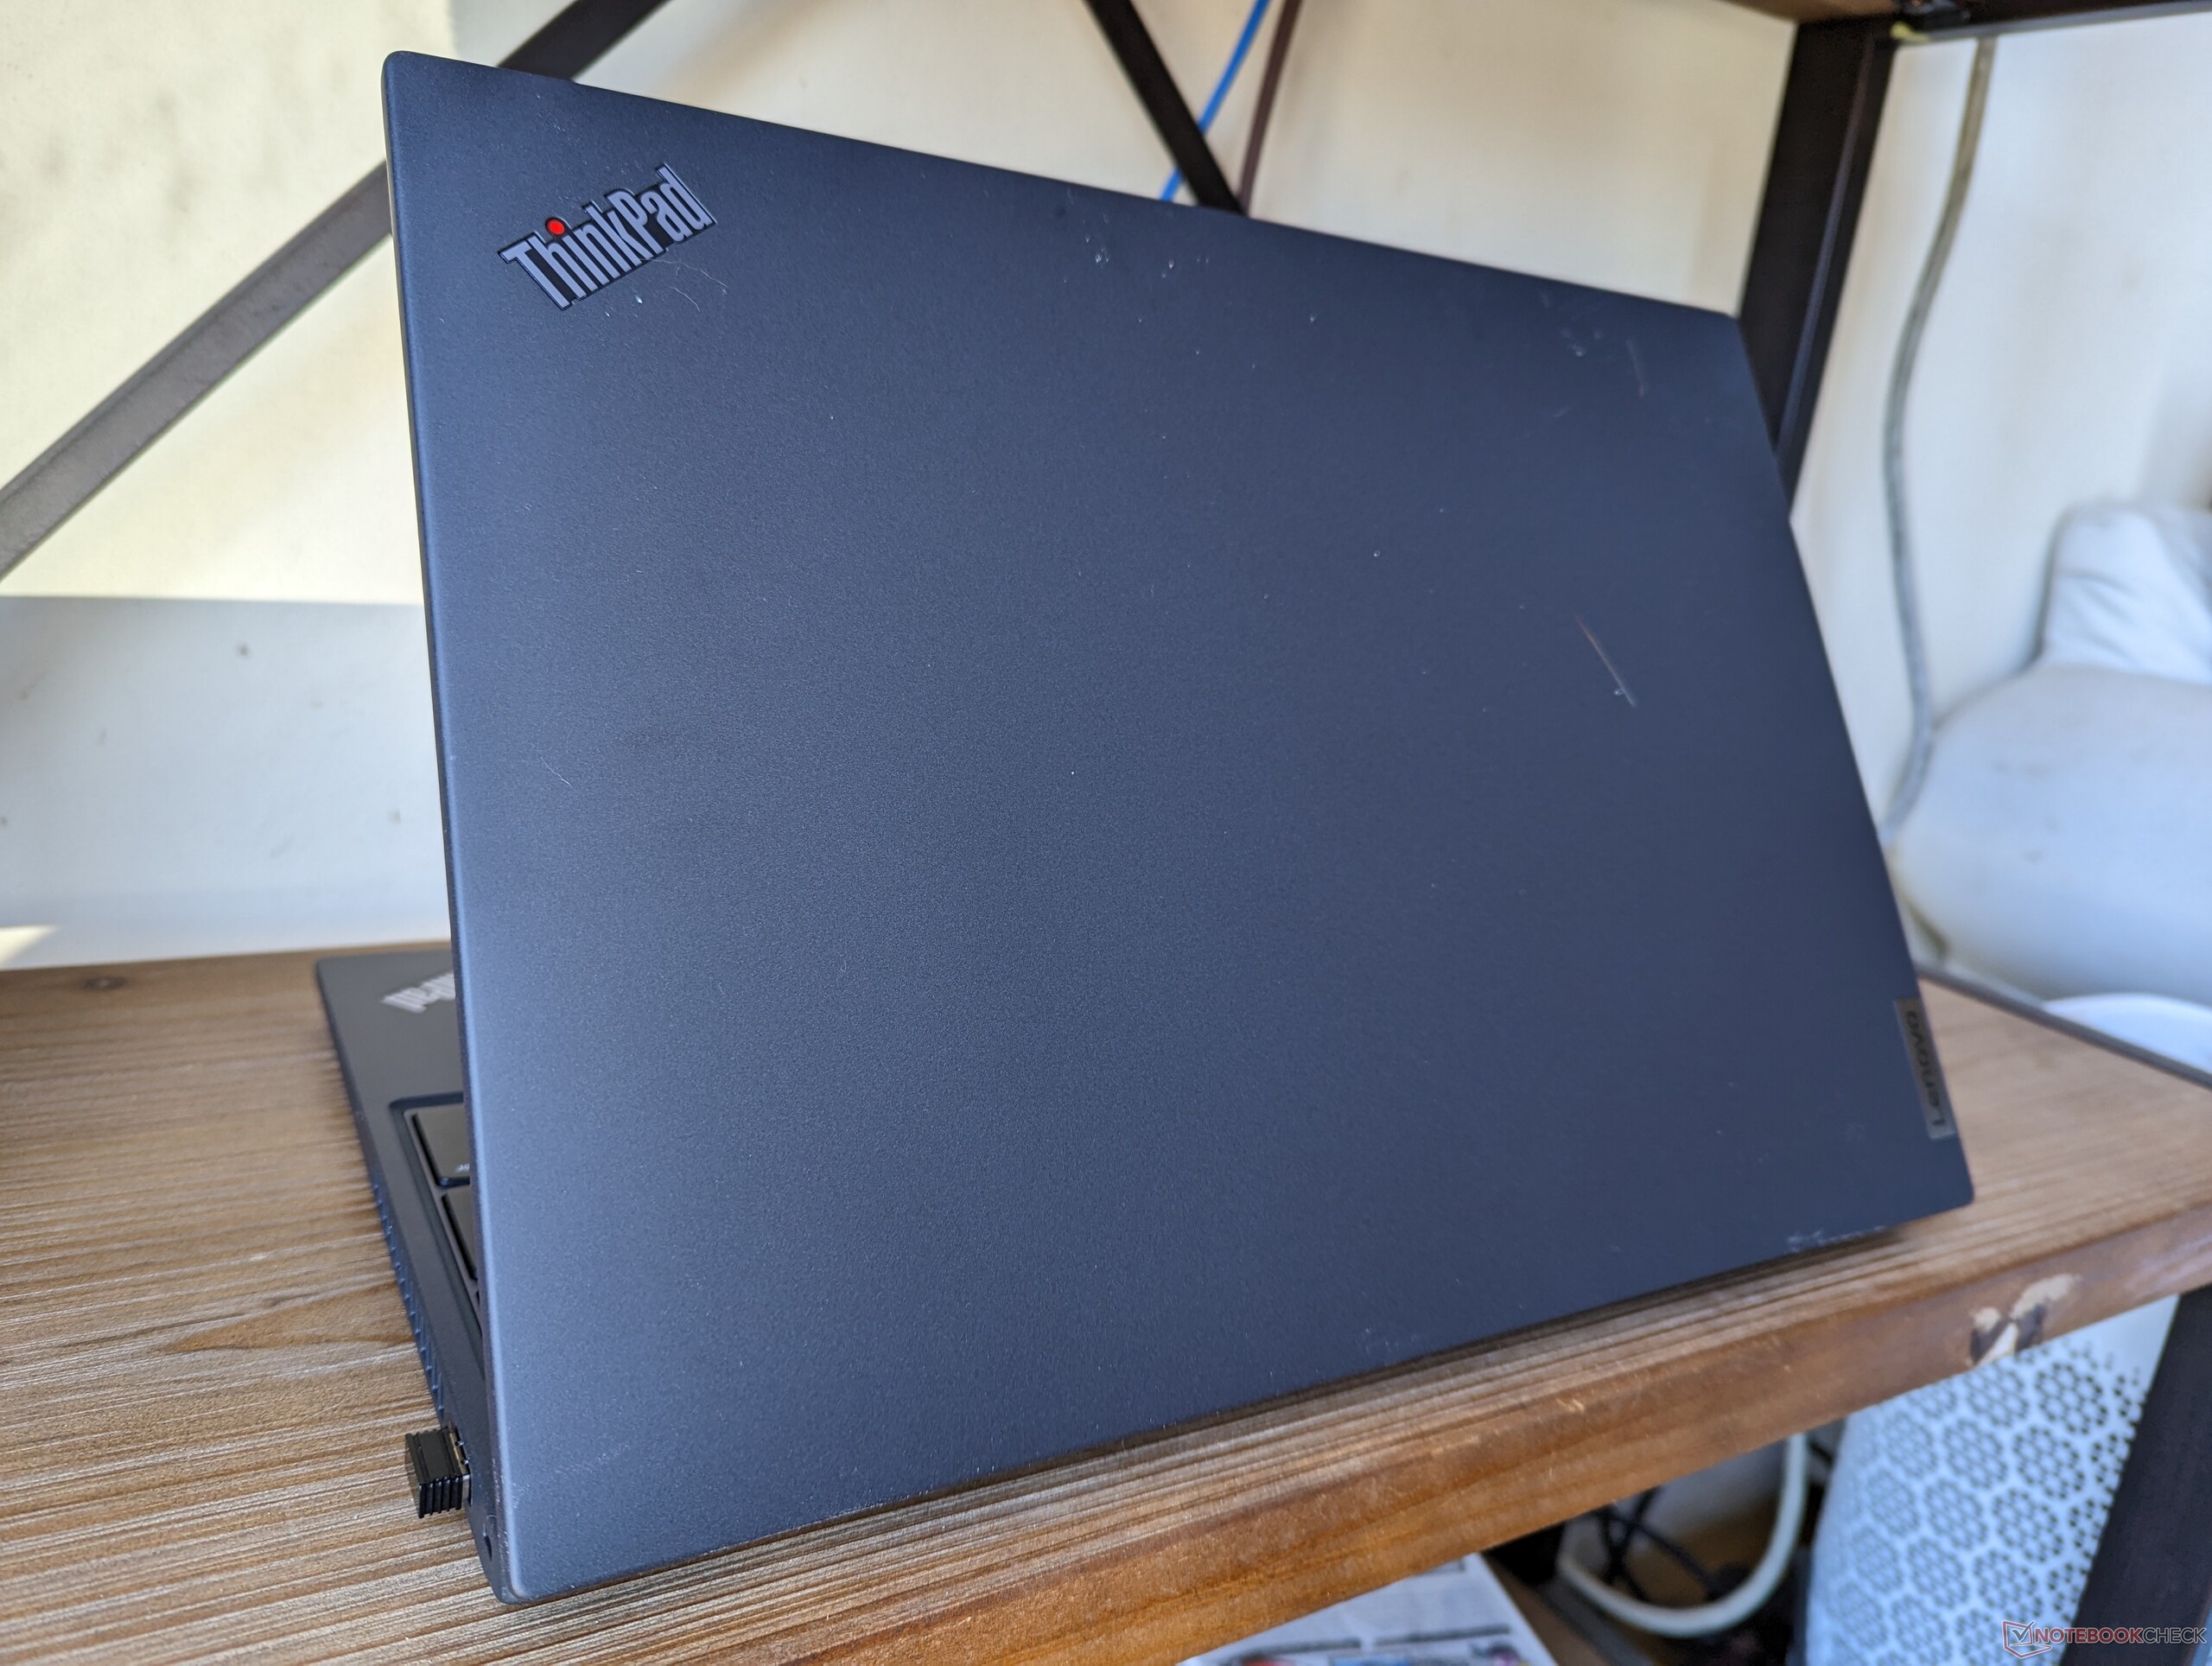
Bien que le modèle n'ait que quelques mois, son châssis est légèrement plus grand dans toutes les dimensions par rapport aux ordinateurs portables 16 pouces concurrents comme le HP EliteBook 865 G9 ou le Apple MacBook Pro 16. Le LG Gram 16, en particulier, est plus léger de 800 grammes.
Attendez-vous à ce que la graisse et les empreintes digitales s'accumulent très rapidement sur les surfaces noires mates. L'approche sombre de la fibre de carbone, de la fibre de verre et du plastique contraste ici avec l'approche gris brillant de l'alliage métallique du HP EliteBook concurrent.
Communication
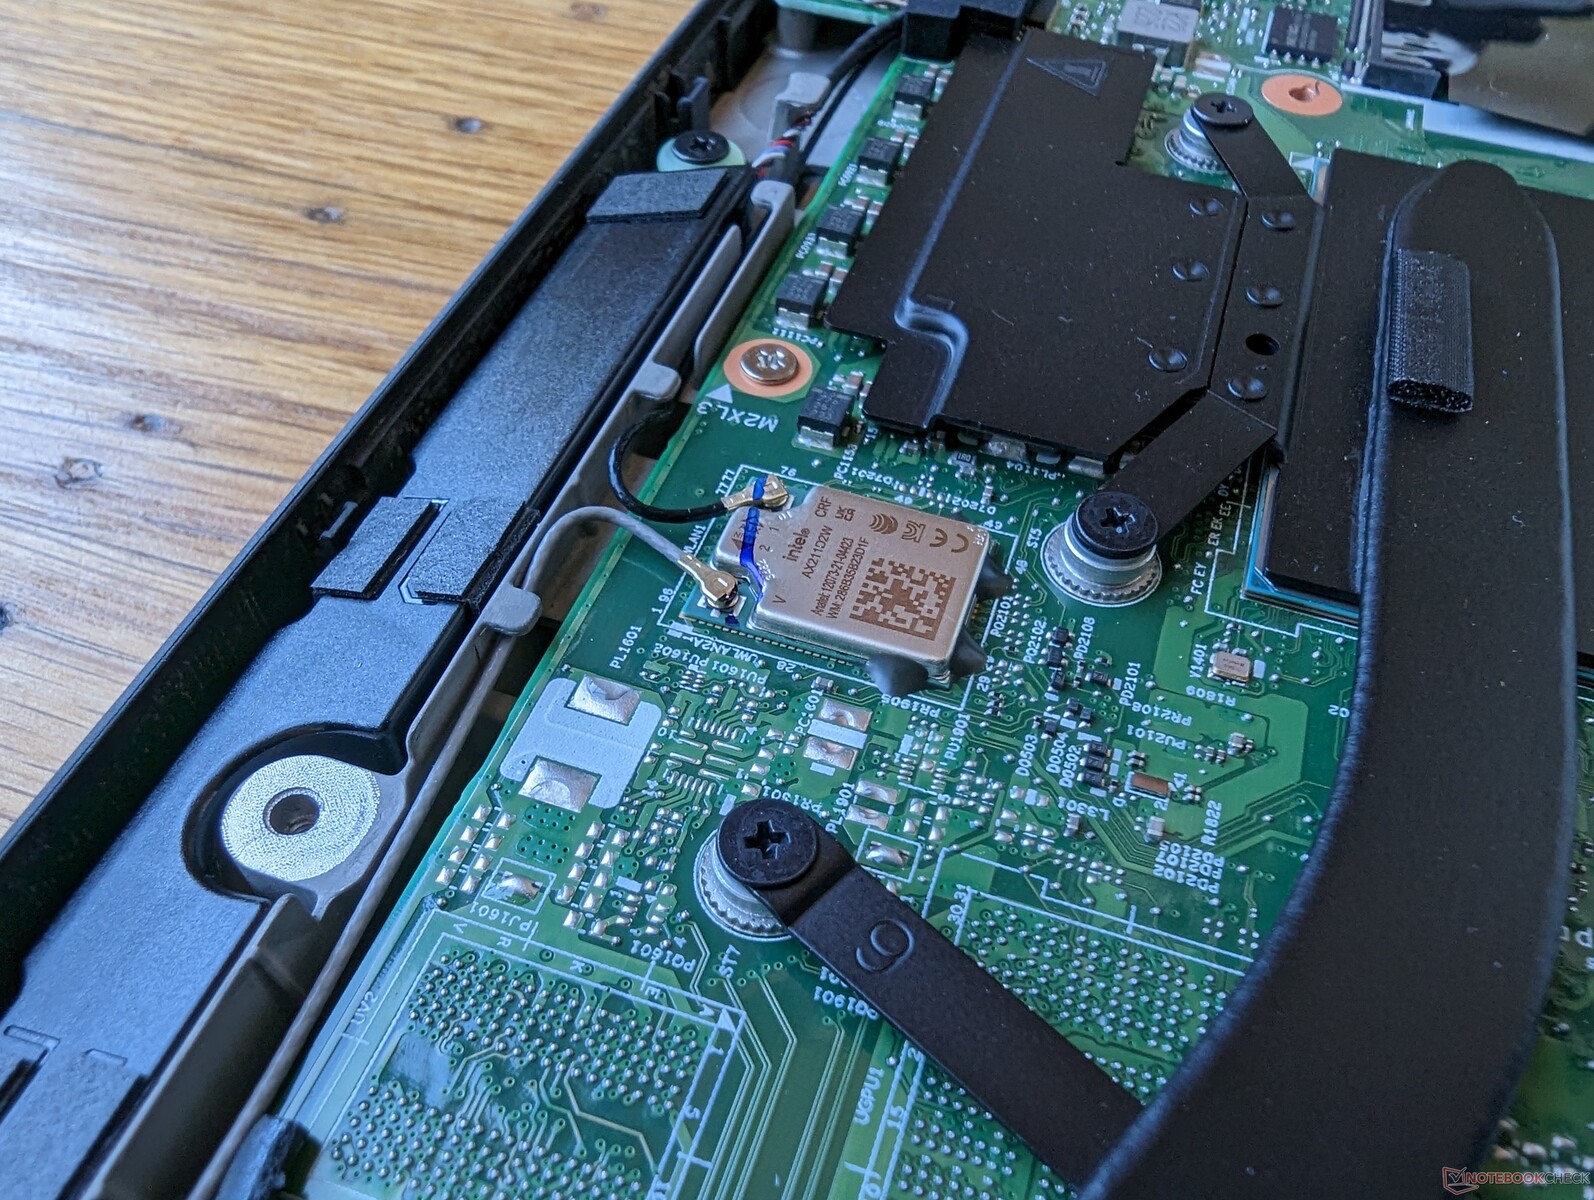
Un Intel AX211 est fourni en standard pour la connectivité Bluetooth 5.2 et Wi-Fi 6E. Les taux de transfert sont stables lorsqu'ils sont couplés à notre routeur de test Asus AXE11000.
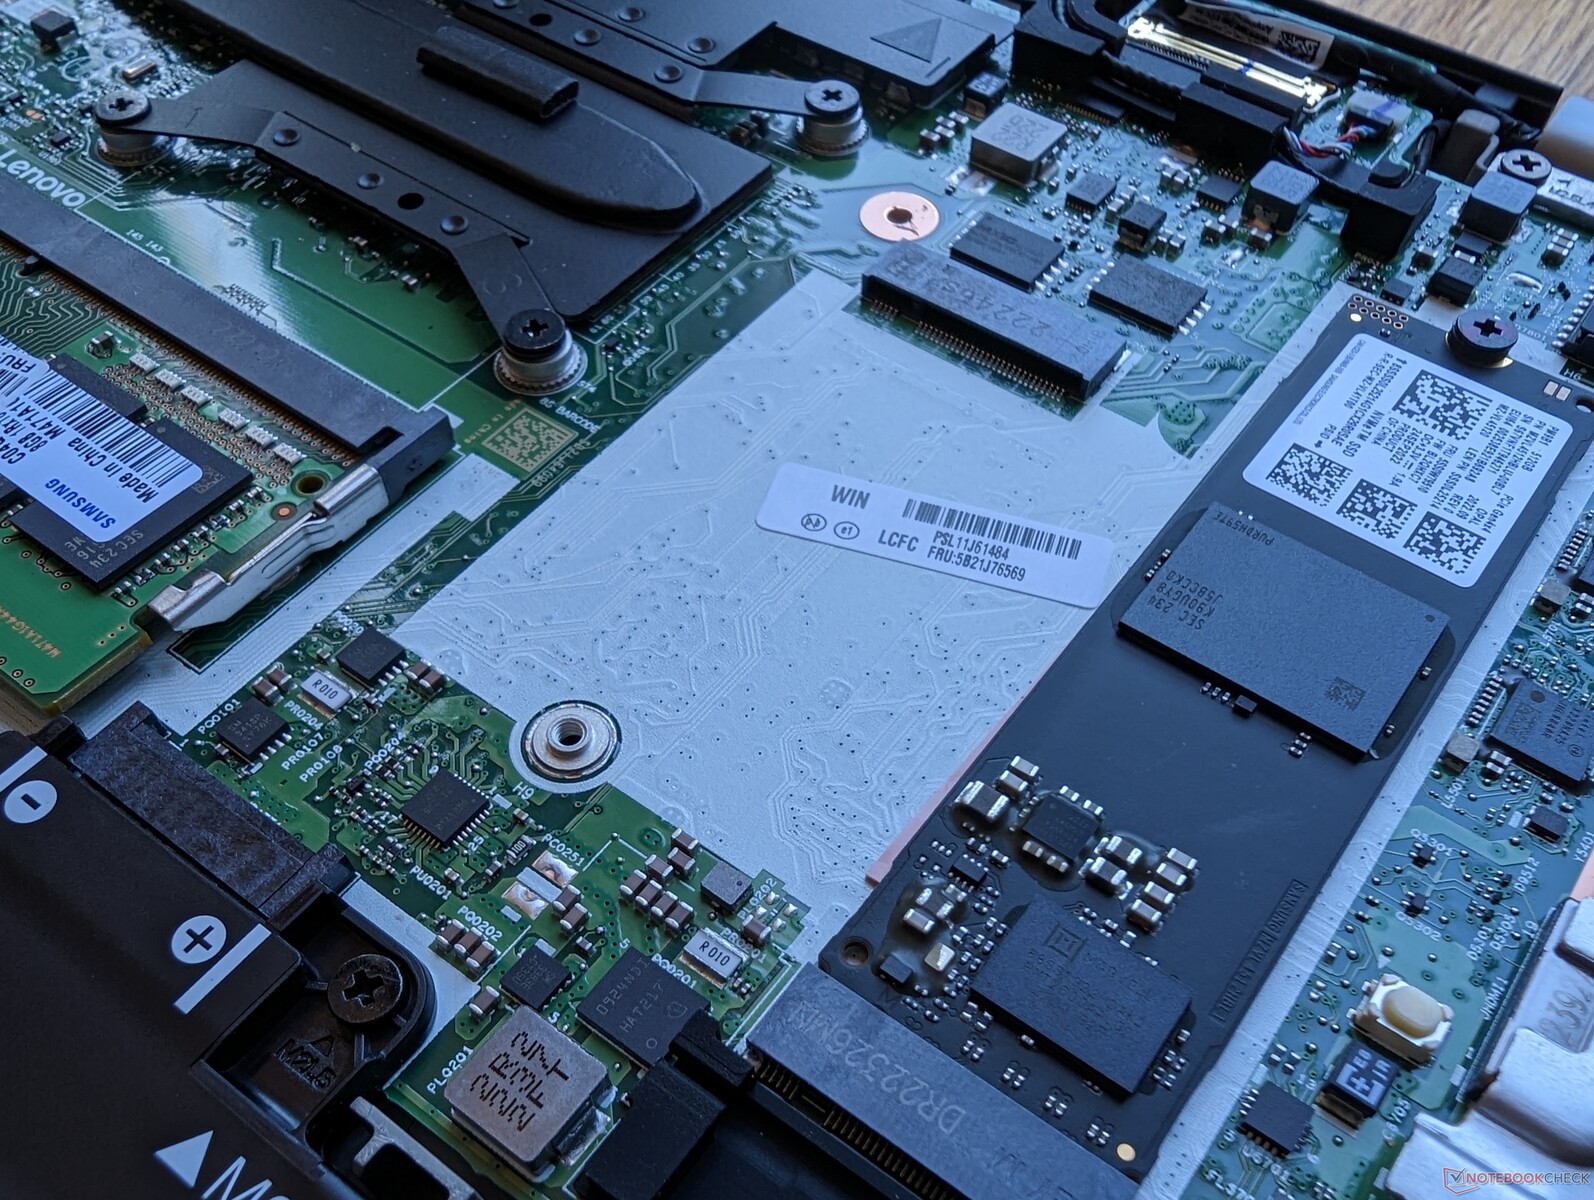
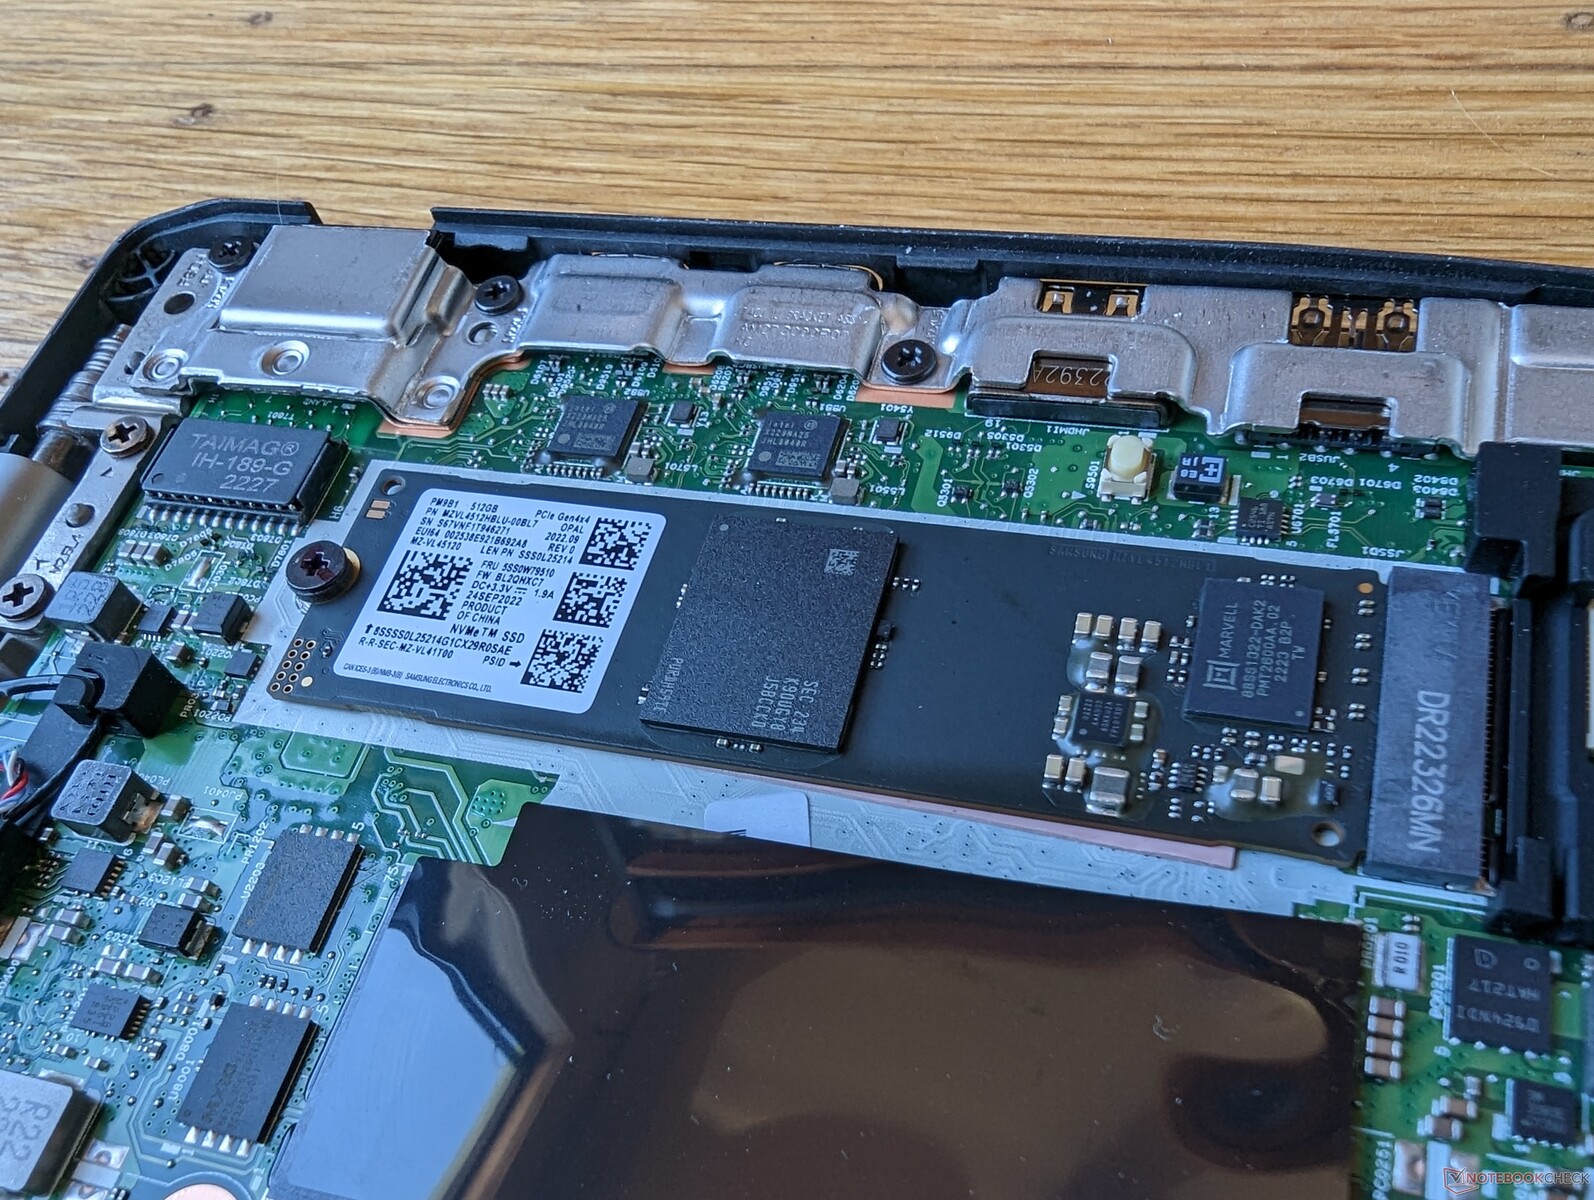
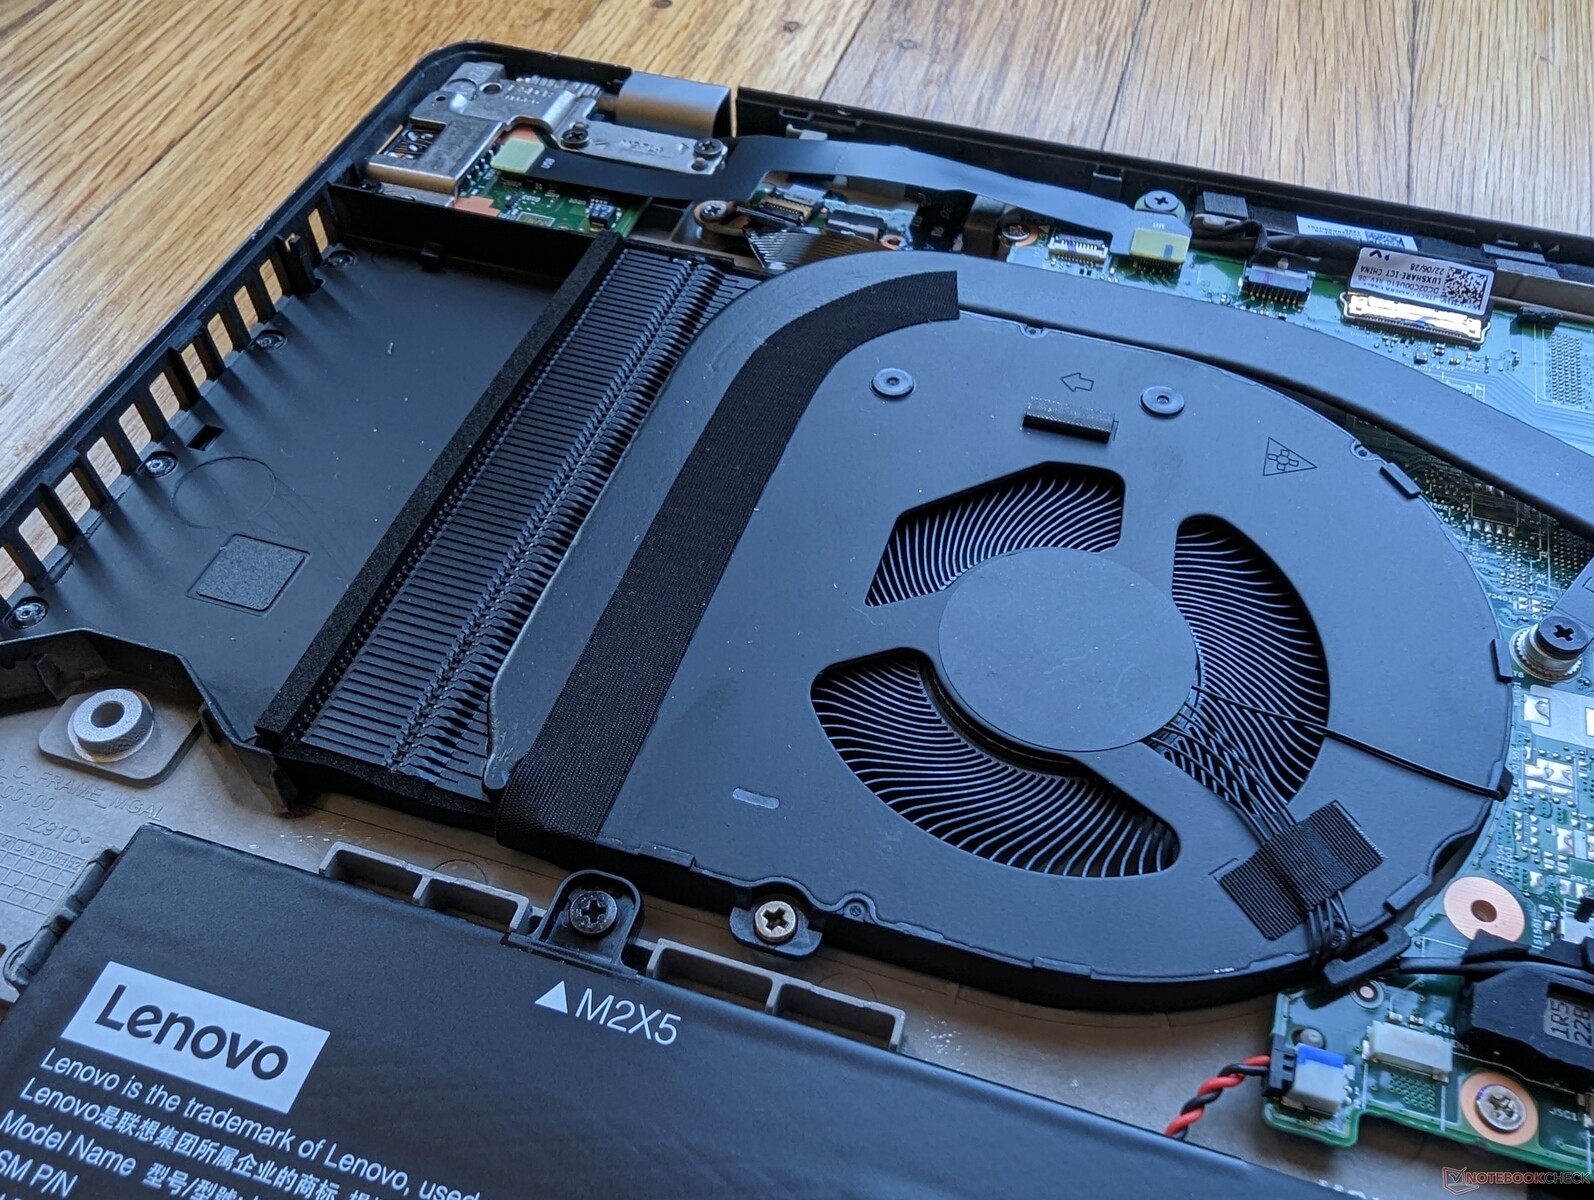
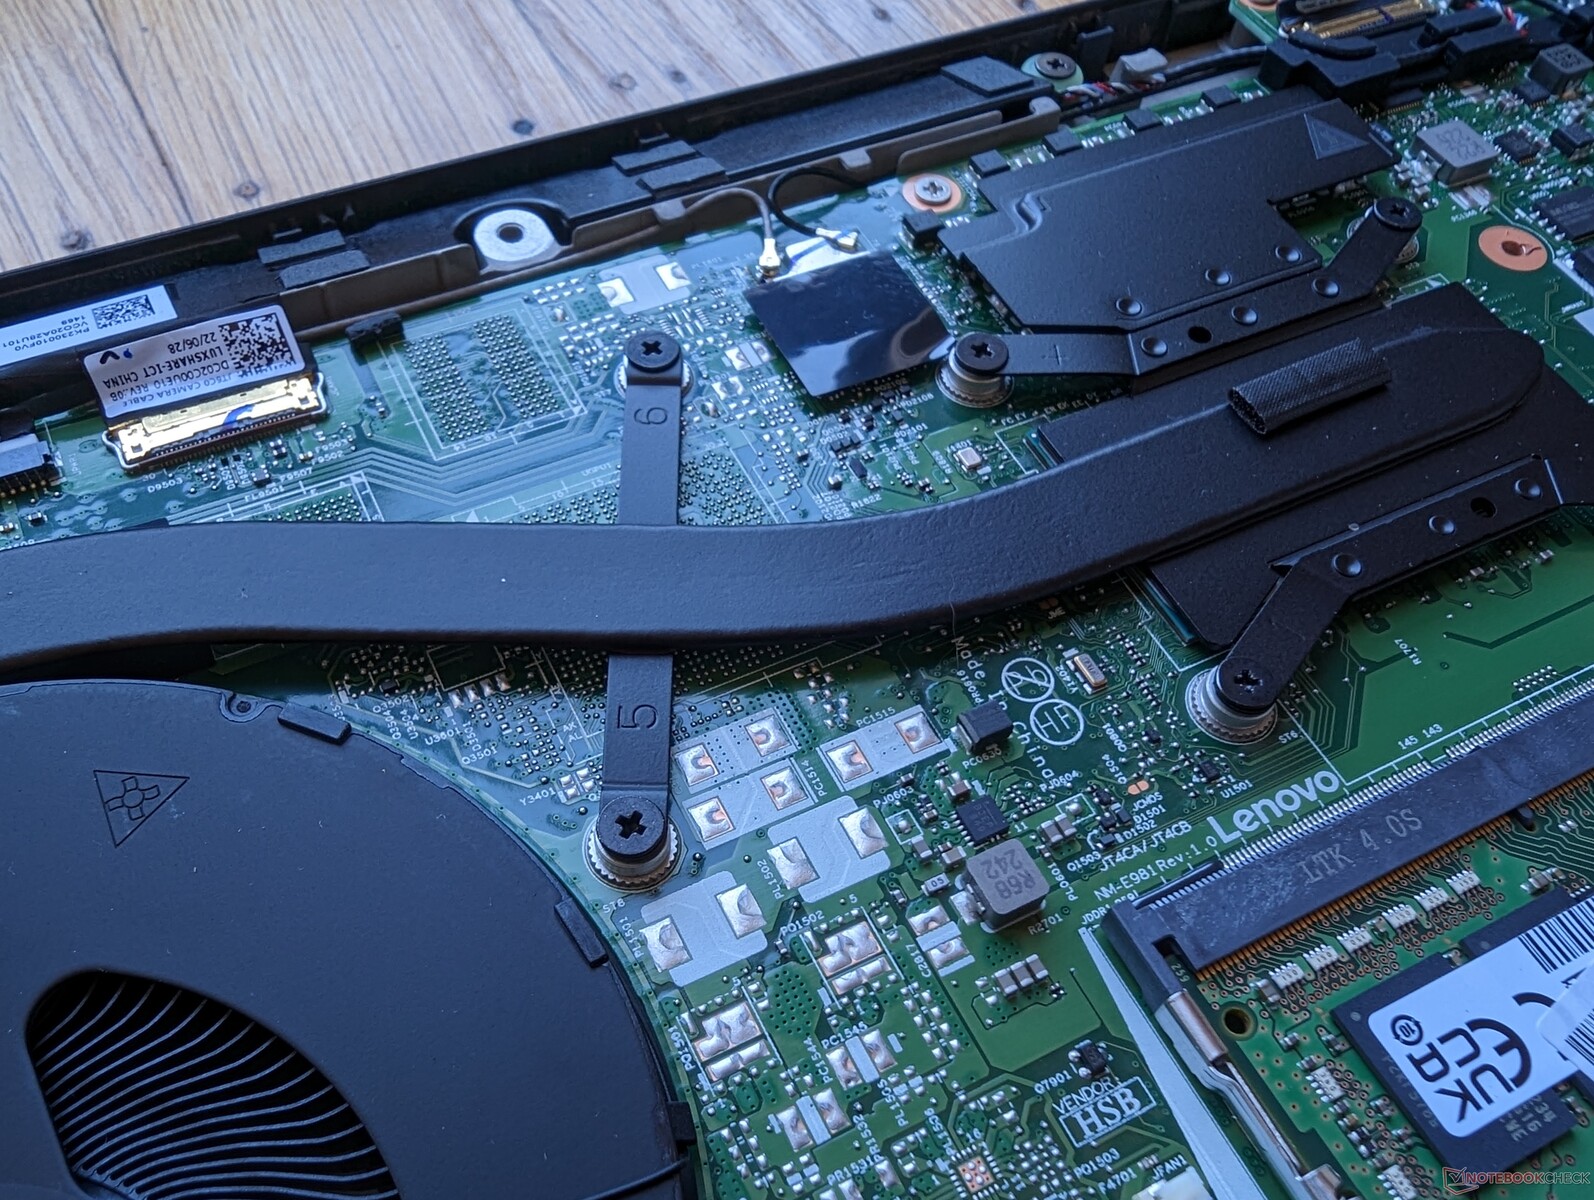
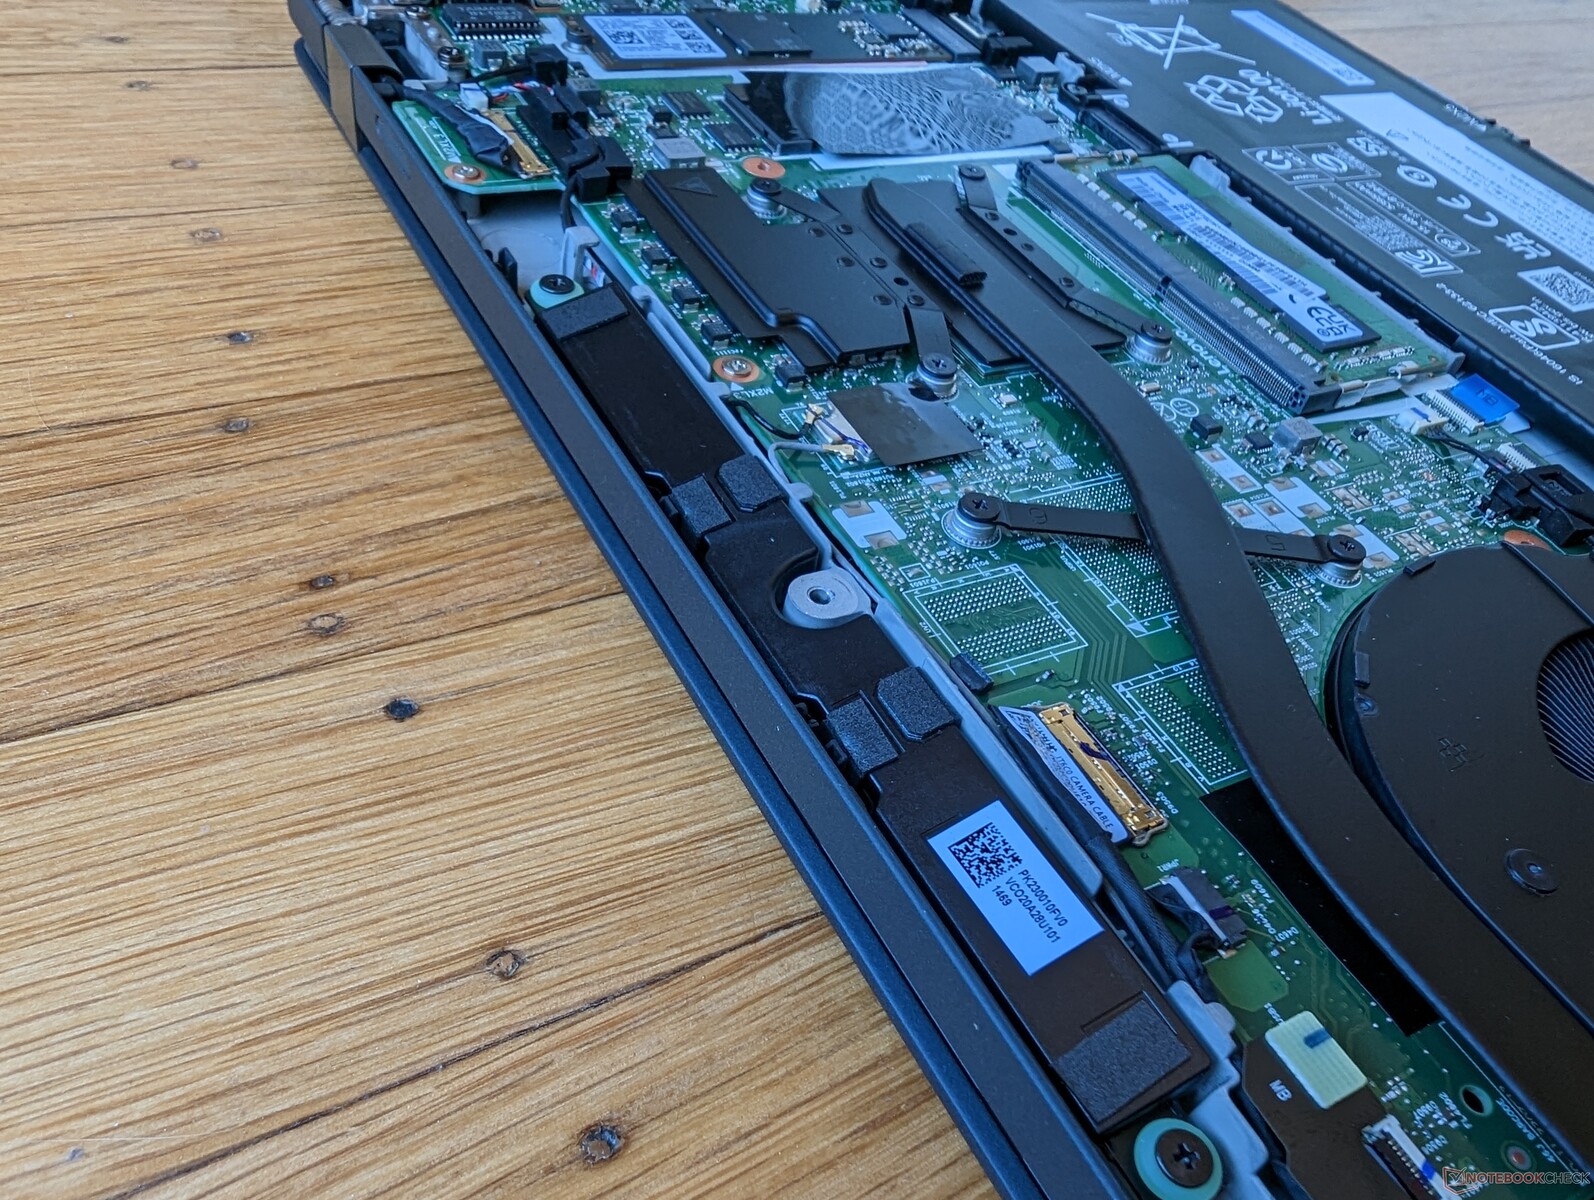
L'emplacement WWAN M.2 est vide dans notre configuration spécifique comme le montre l'image ci-dessous. Malheureusement, Lenovo n'inclut pas l'antenne si vous configurez sans WWAN.
| Networking | |
| iperf3 transmit AX12 | |
| Apple MacBook Pro 16 2021 M1 Pro | |
| iperf3 receive AX12 | |
| Apple MacBook Pro 16 2021 M1 Pro | |
| iperf3 receive AXE11000 6GHz | |
| Lenovo ThinkPad T16 G1 21CH004MGE | |
| Huawei MateBook 16s i7 | |
| Lenovo ThinkPad T16 Gen 1 Core i7-1270P | |
| iperf3 receive AXE11000 | |
| Lenovo ThinkPad T16 G1 21CH004MGE | |
| HP EliteBook 865 G9 | |
| LG Gram 16Z90Q | |
| Lenovo ThinkPad T16 Gen 1 Core i7-1270P | |
| Apple MacBook Pro 16 2021 M1 Pro | |
| iperf3 transmit AXE11000 | |
| Lenovo ThinkPad T16 G1 21CH004MGE | |
| HP EliteBook 865 G9 | |
| LG Gram 16Z90Q | |
| Lenovo ThinkPad T16 Gen 1 Core i7-1270P | |
| Apple MacBook Pro 16 2021 M1 Pro | |
| iperf3 transmit AXE11000 6GHz | |
| Lenovo ThinkPad T16 G1 21CH004MGE | |
| Huawei MateBook 16s i7 | |
| Lenovo ThinkPad T16 Gen 1 Core i7-1270P | |
Webcam
La webcam de 2 MP n'est pas à la hauteur des webcams de 5 MP qui équipent désormais de nombreux HP EliteBook. Le ThinkPad T16 est équipé d'un obturateur IR et d'un obturateur physique.


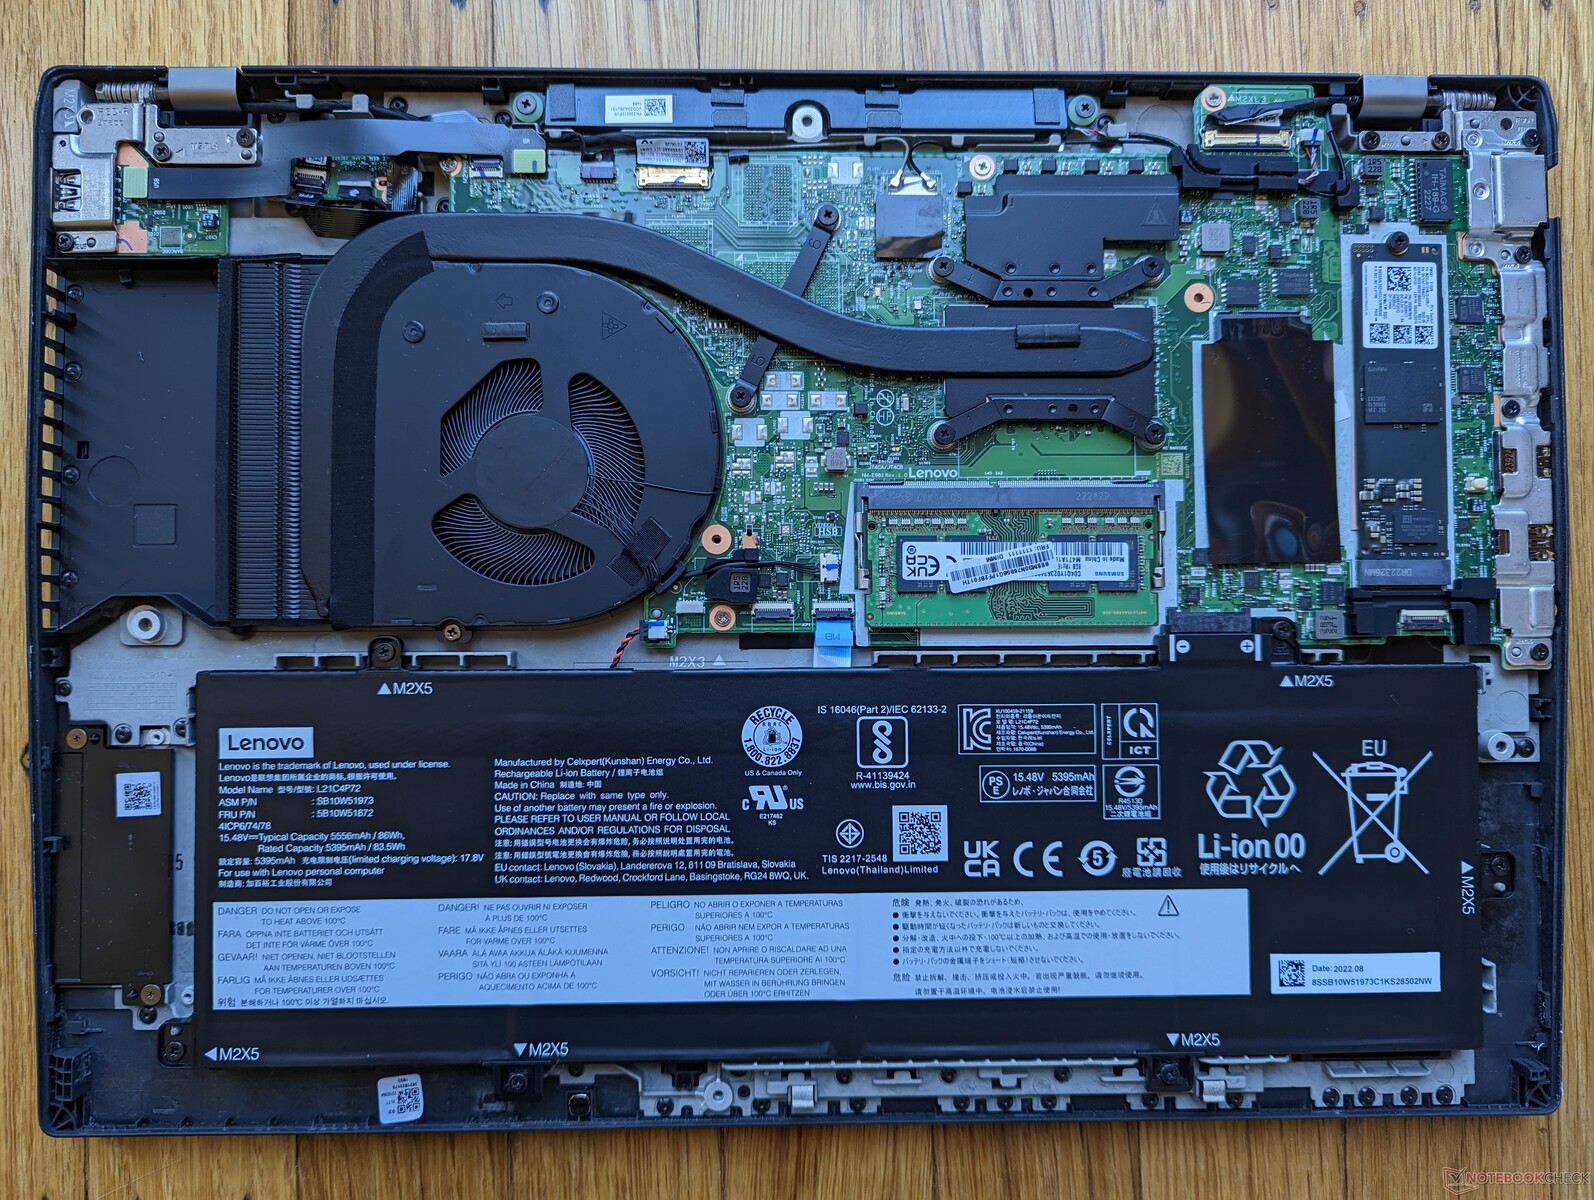
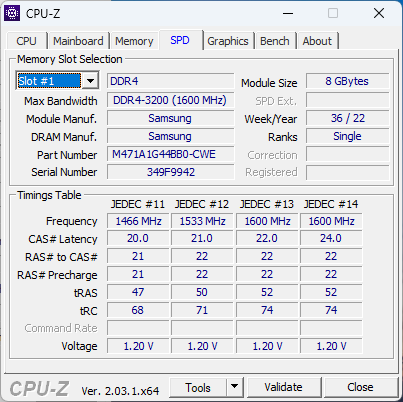
Maintenance
Le panneau inférieur est fixé par huit vis Philips pour faciliter l'entretien. N'oubliez pas que ce modèle est équipé de 8 Go de RAM soudée et d'un emplacement SODIMM pour l'extension, alors que la plupart des autres ordinateurs portables utilisent exclusivement de la RAM soudée ou deux SODIMM. Certains modèles peuvent être équipés de 16 Go de RAM soudée.
Accessoires et garantie
Il n'y a pas d'extras dans la boîte de détail, à part l'adaptateur secteur et les papiers. Une garantie limitée d'un an par le fabricant s'applique si l'appareil est acheté aux États-Unis.
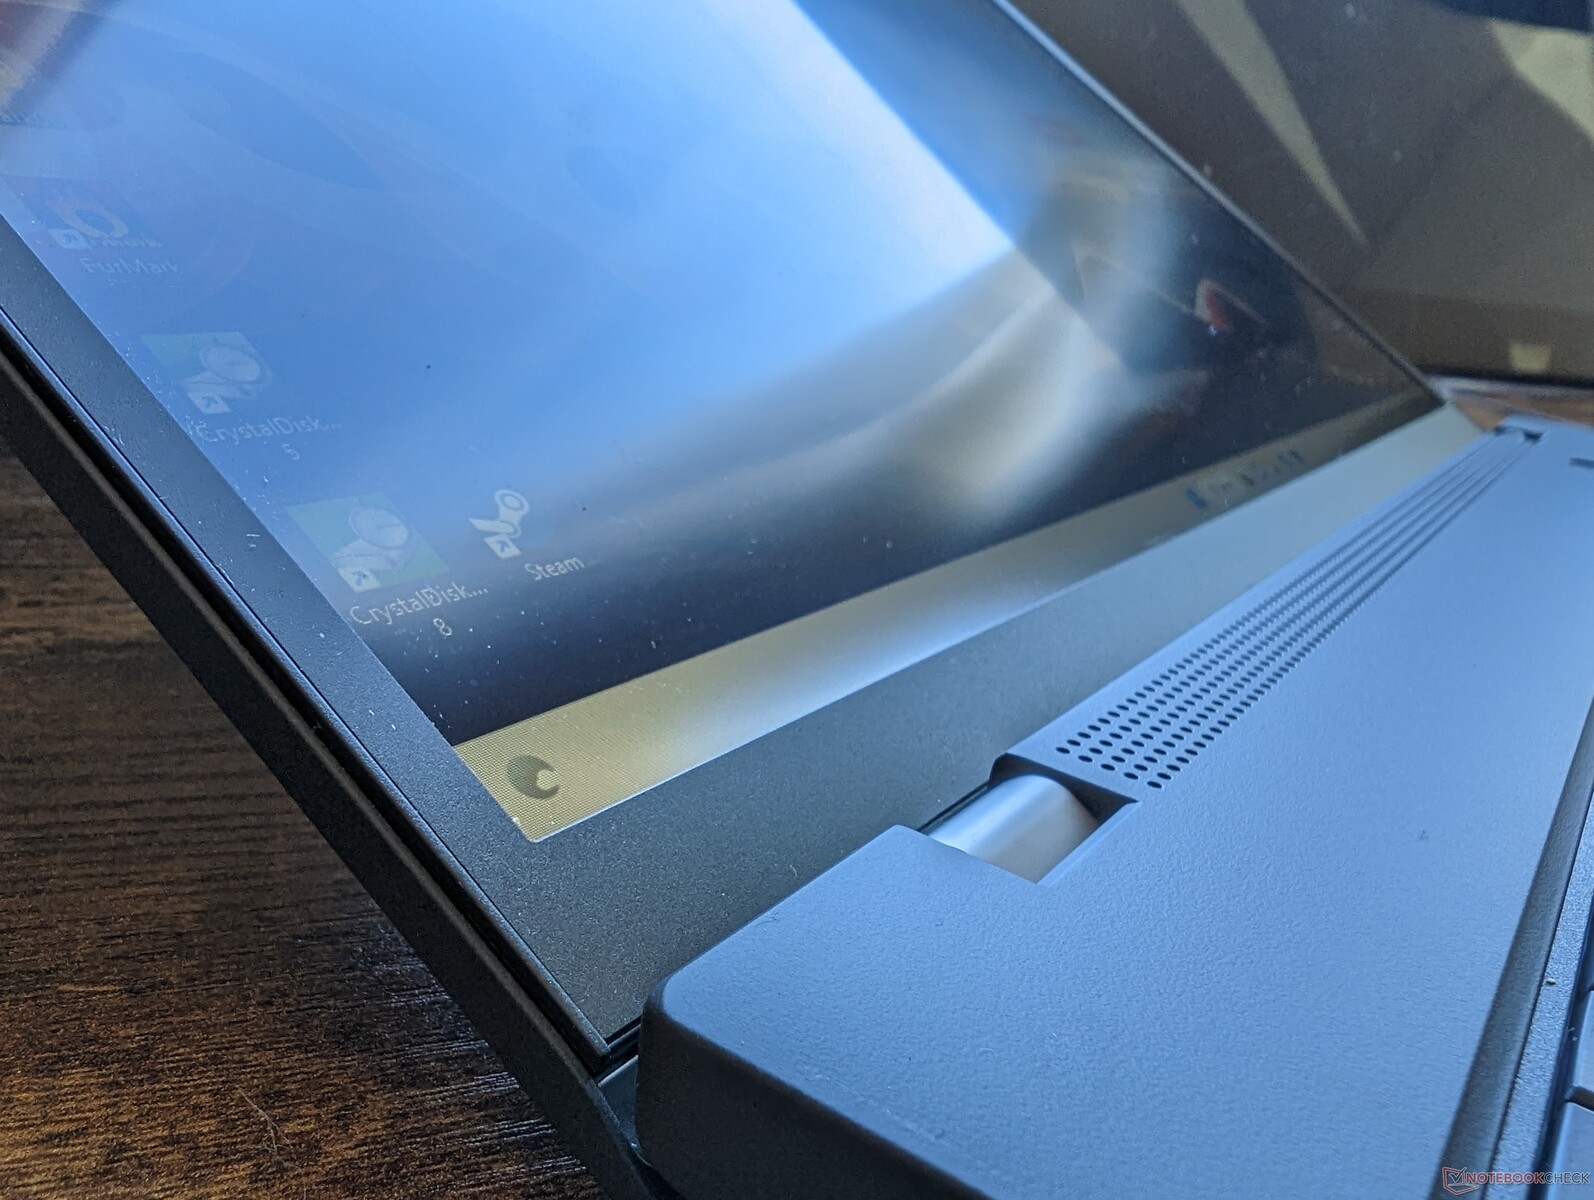
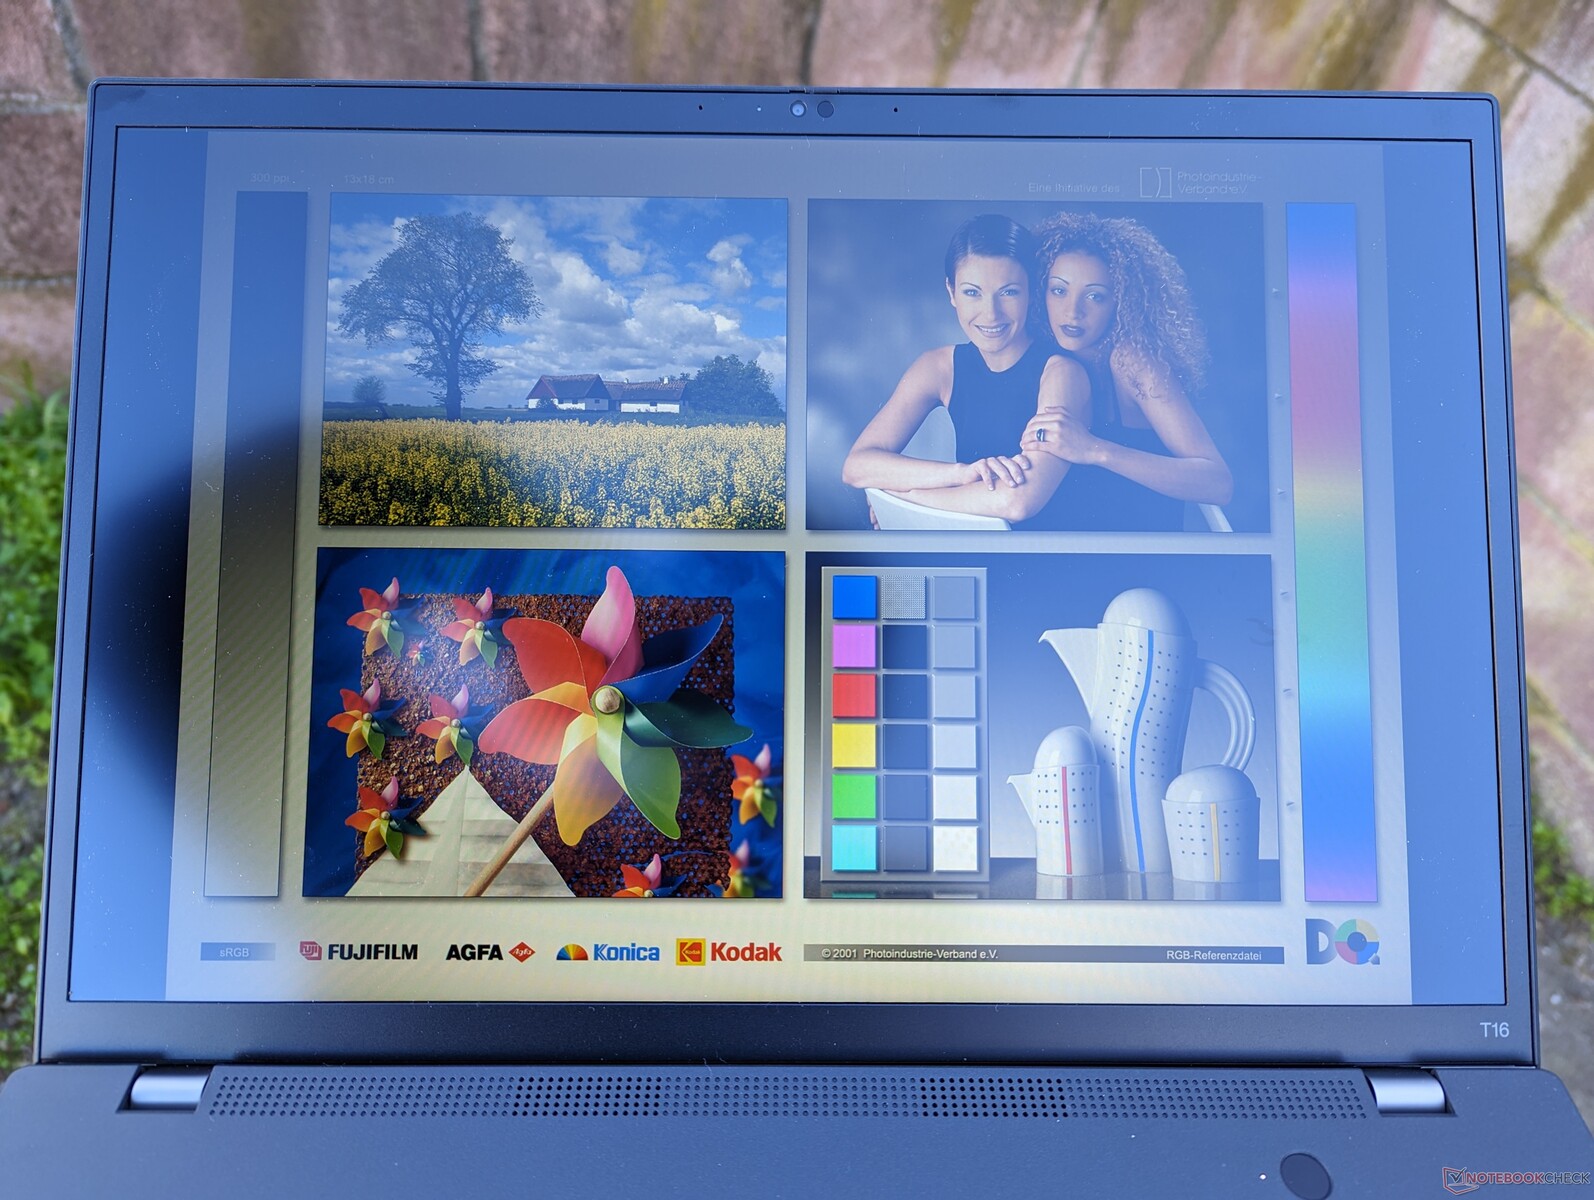
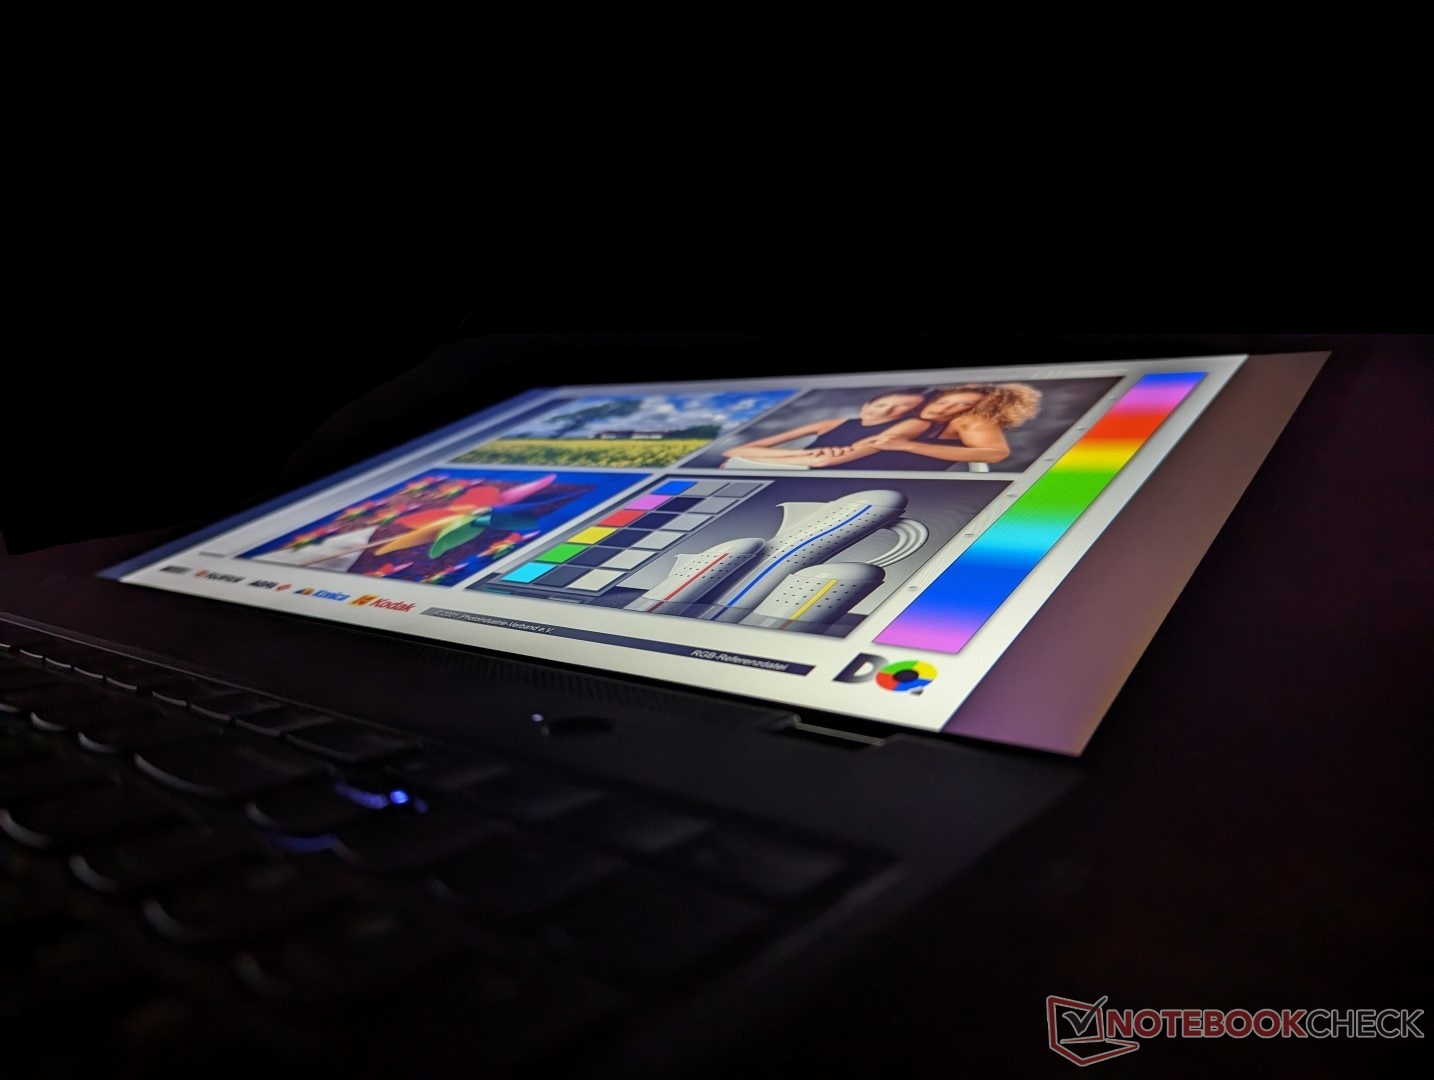
Affichage - du bas de gamme au haut de gamme
Lenovo propose actuellement cinq options différentes d'écran IPS mat, comme suit :
- 1920 x 1200, 300 nits, 45 % NTSC
- 1920 x 1200, 300 nits, écran tactile, 45% NTSC
- 1920 x 1200, faible consommation, 400 nits, 100% sRGB, faible lumière bleue
- 1920 x 1200, écran tactile avec Privacy Guard, 500 nits, 100% sRGB, faible lumière bleue
- 2560 x 1600, 400 nits, faible lumière bleue, calibré par l'International Color Consortium
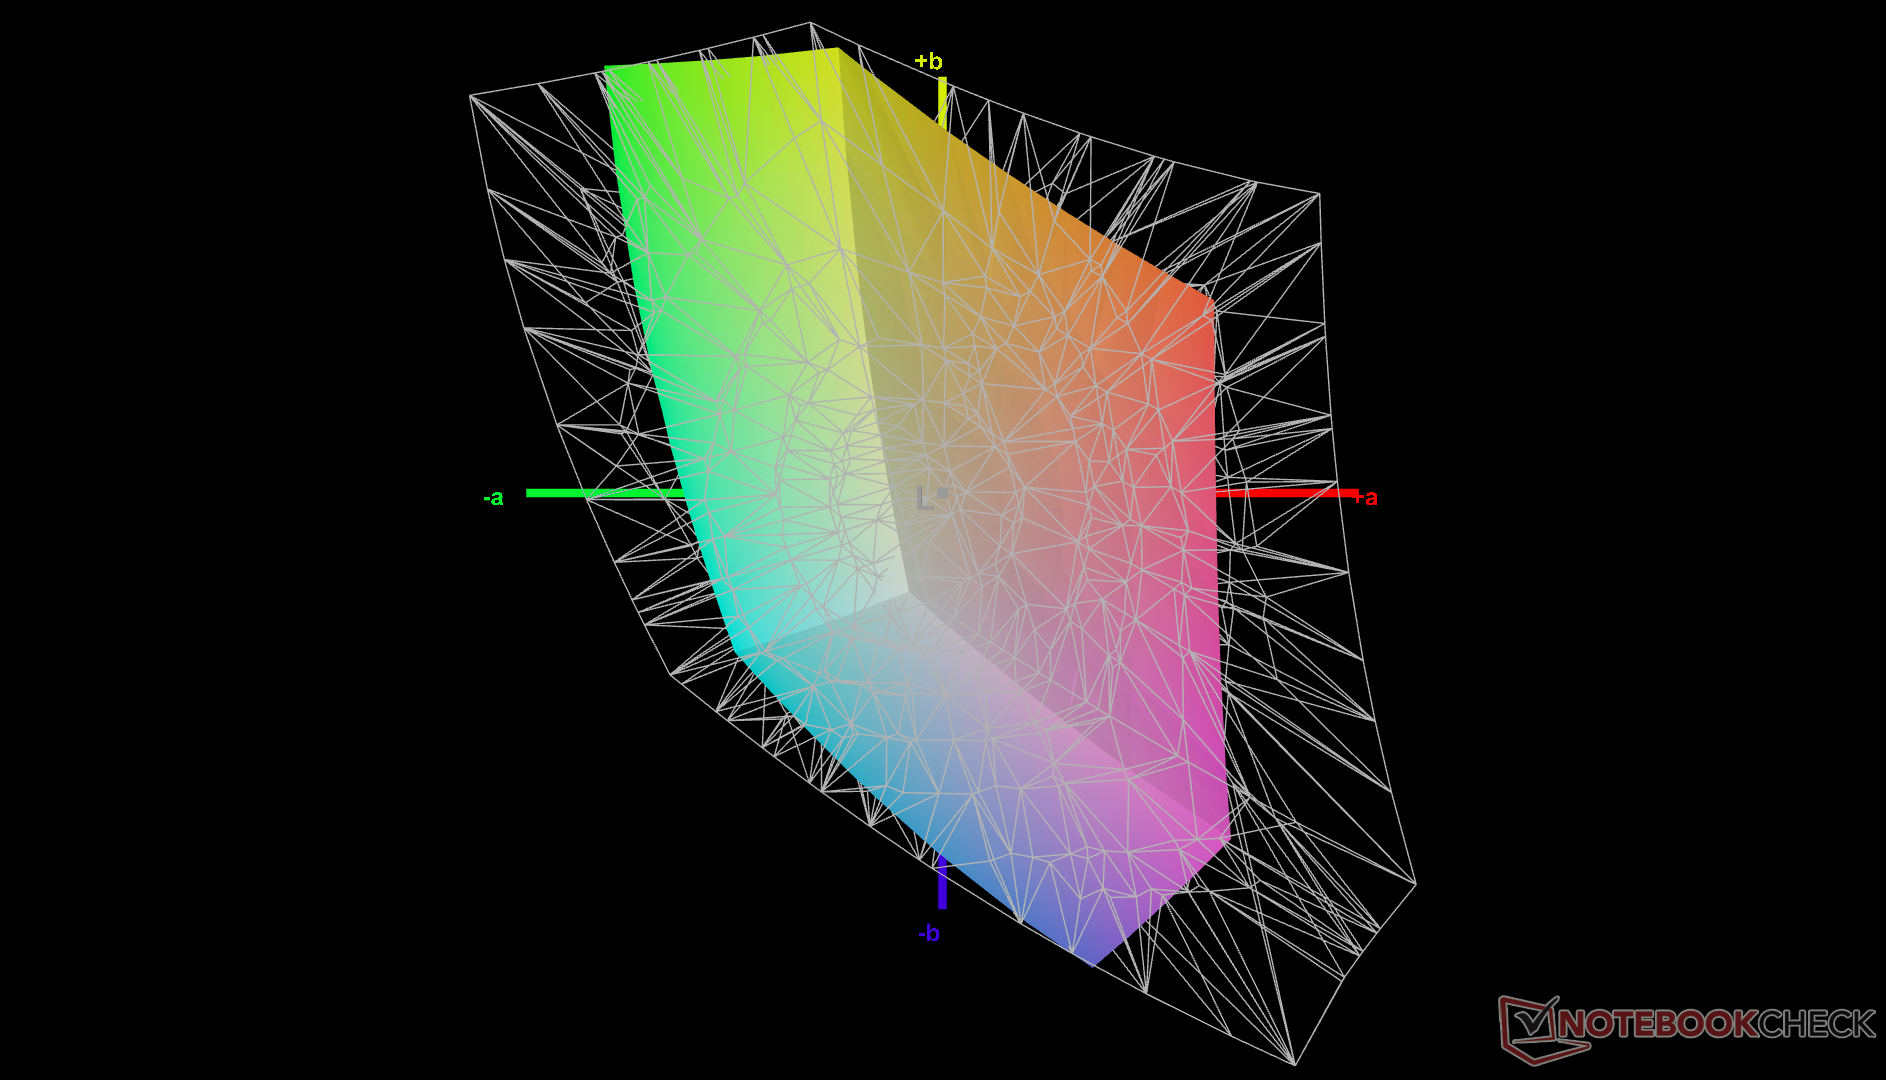
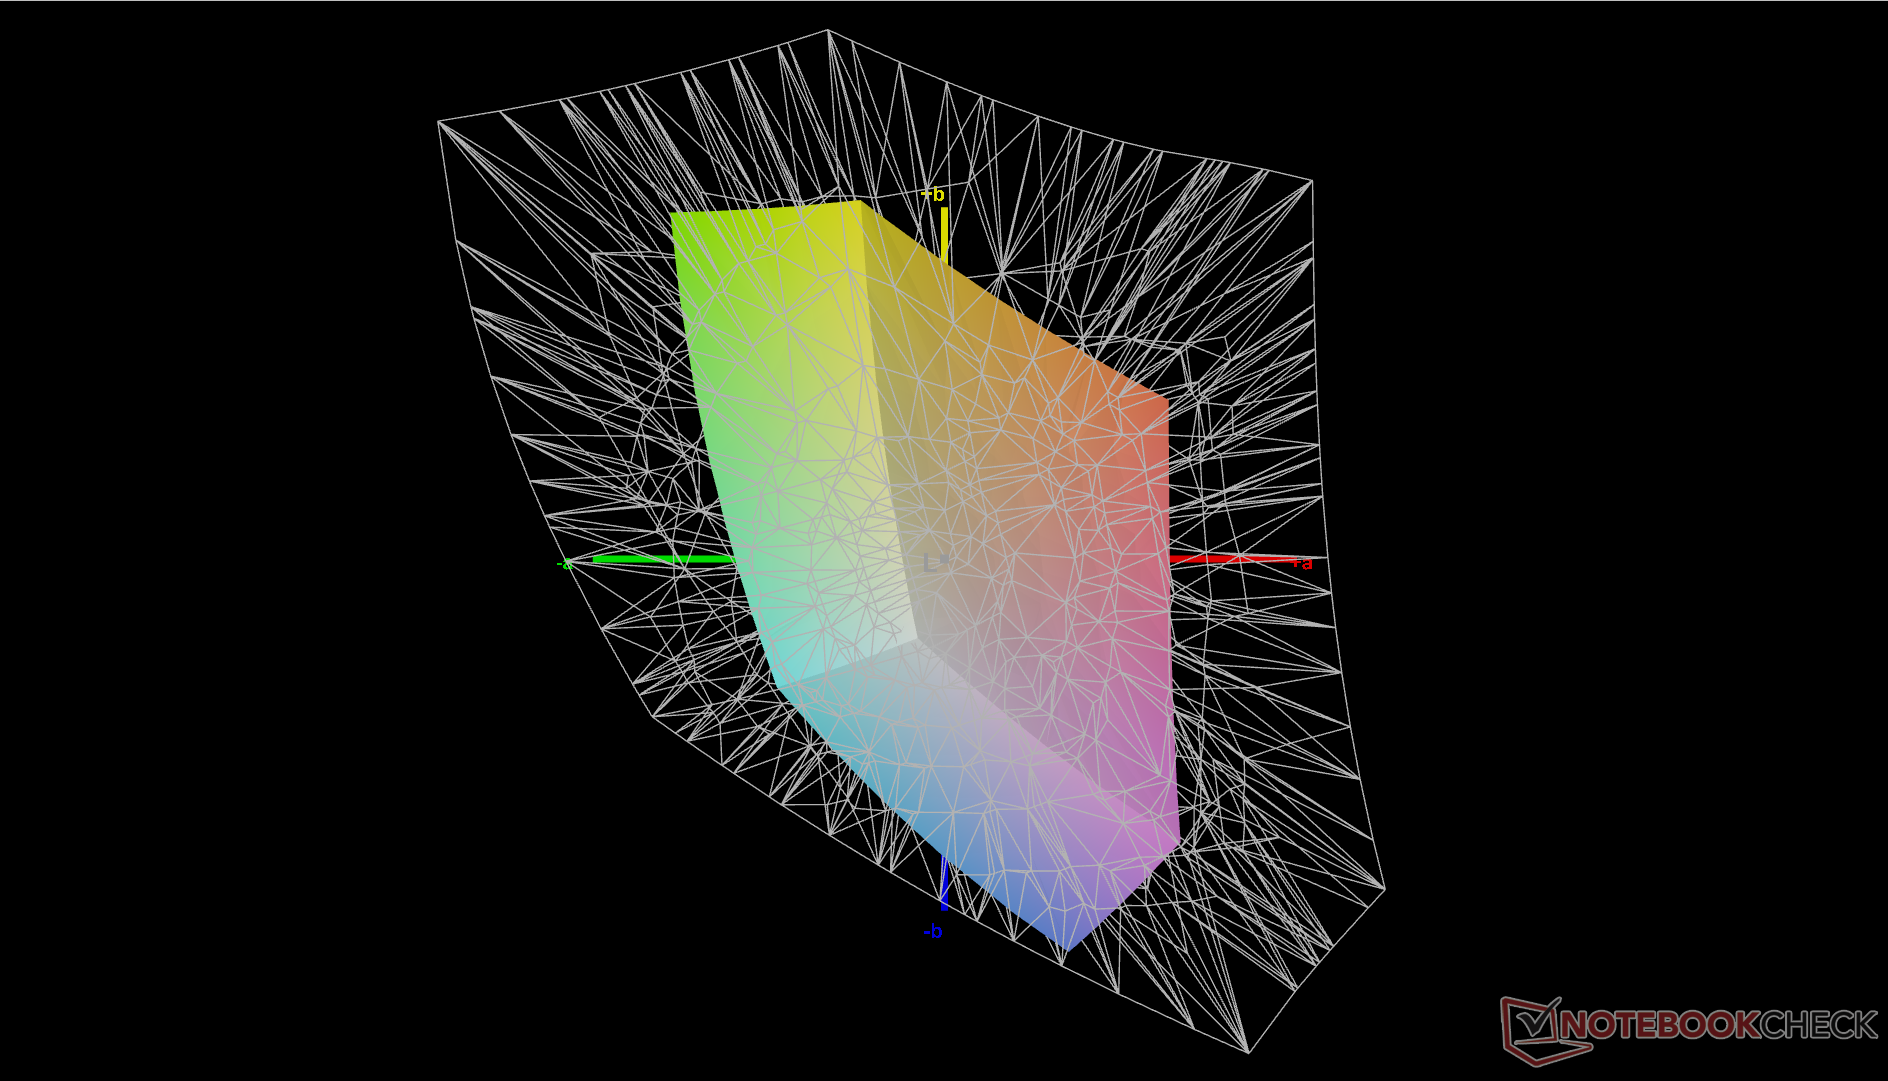
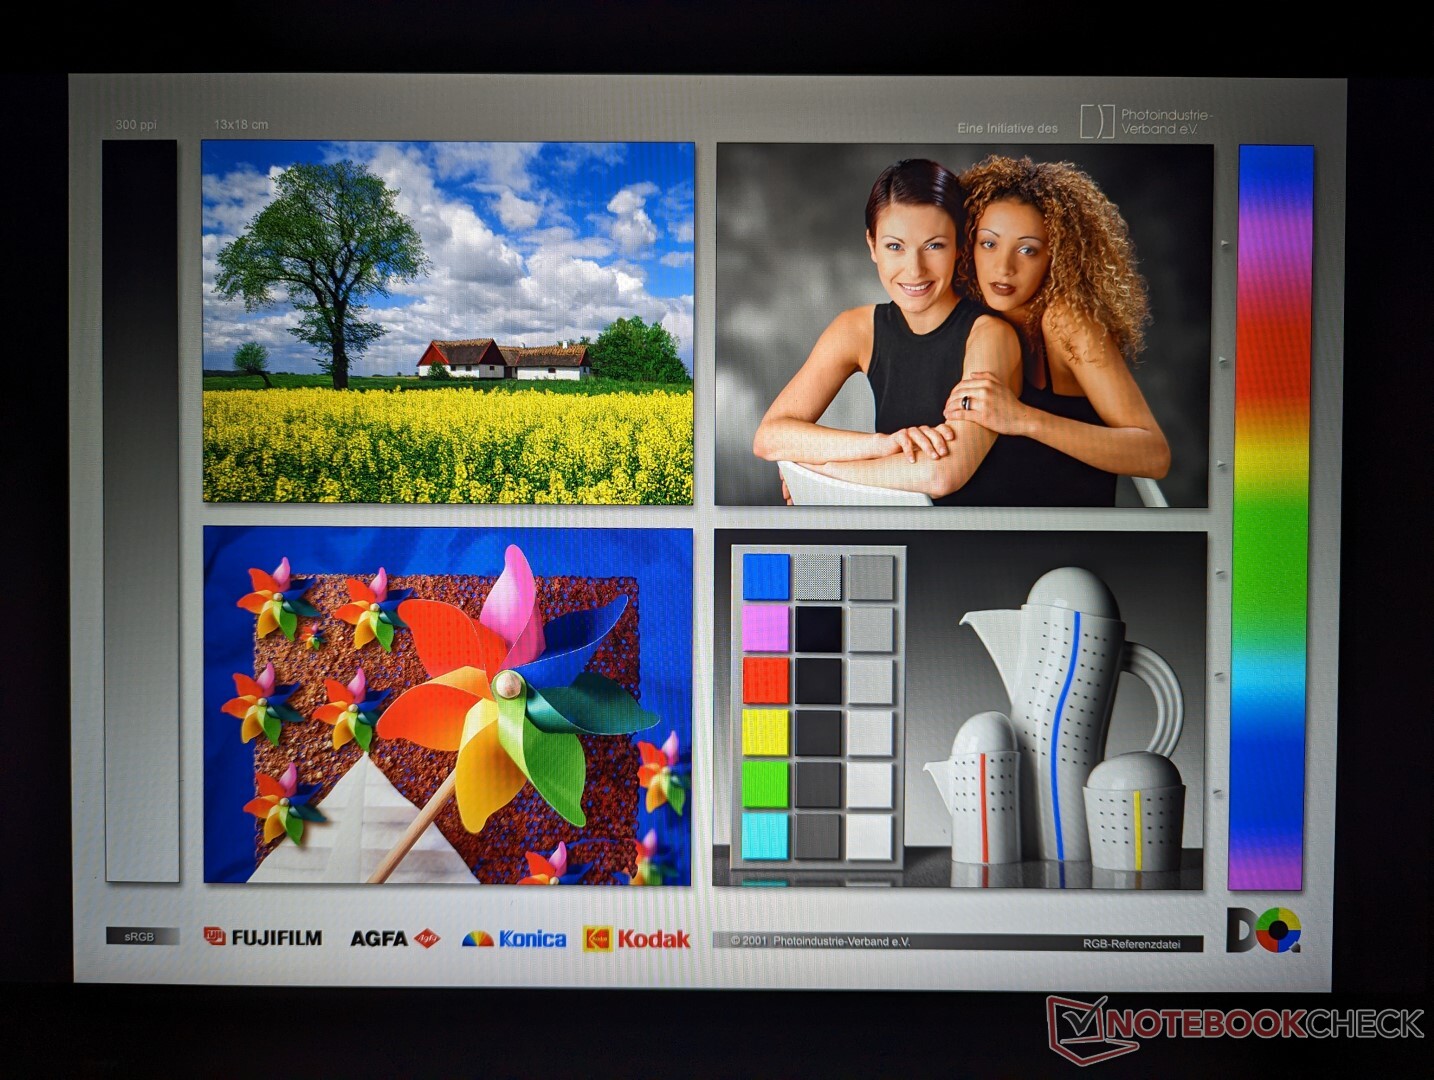
Notre configuration est équipée de l'écran B160UAN03.2 en gras ci-dessus, qui est l'option la moins chère. Comparé à la dalle haut de gamme 1600p, notre écran 1200p présente des couleurs et une netteté inférieures de façon notable. Il s'agit néanmoins d'un écran décent, surtout si on le compare à d'autres panneaux offrant une gamme sRGB similaire de 60 %, mais vous voudrez choisir une couverture sRGB complète pour toute sorte d'édition vidéo ou graphique.


| |||||||||||||||||||||||||
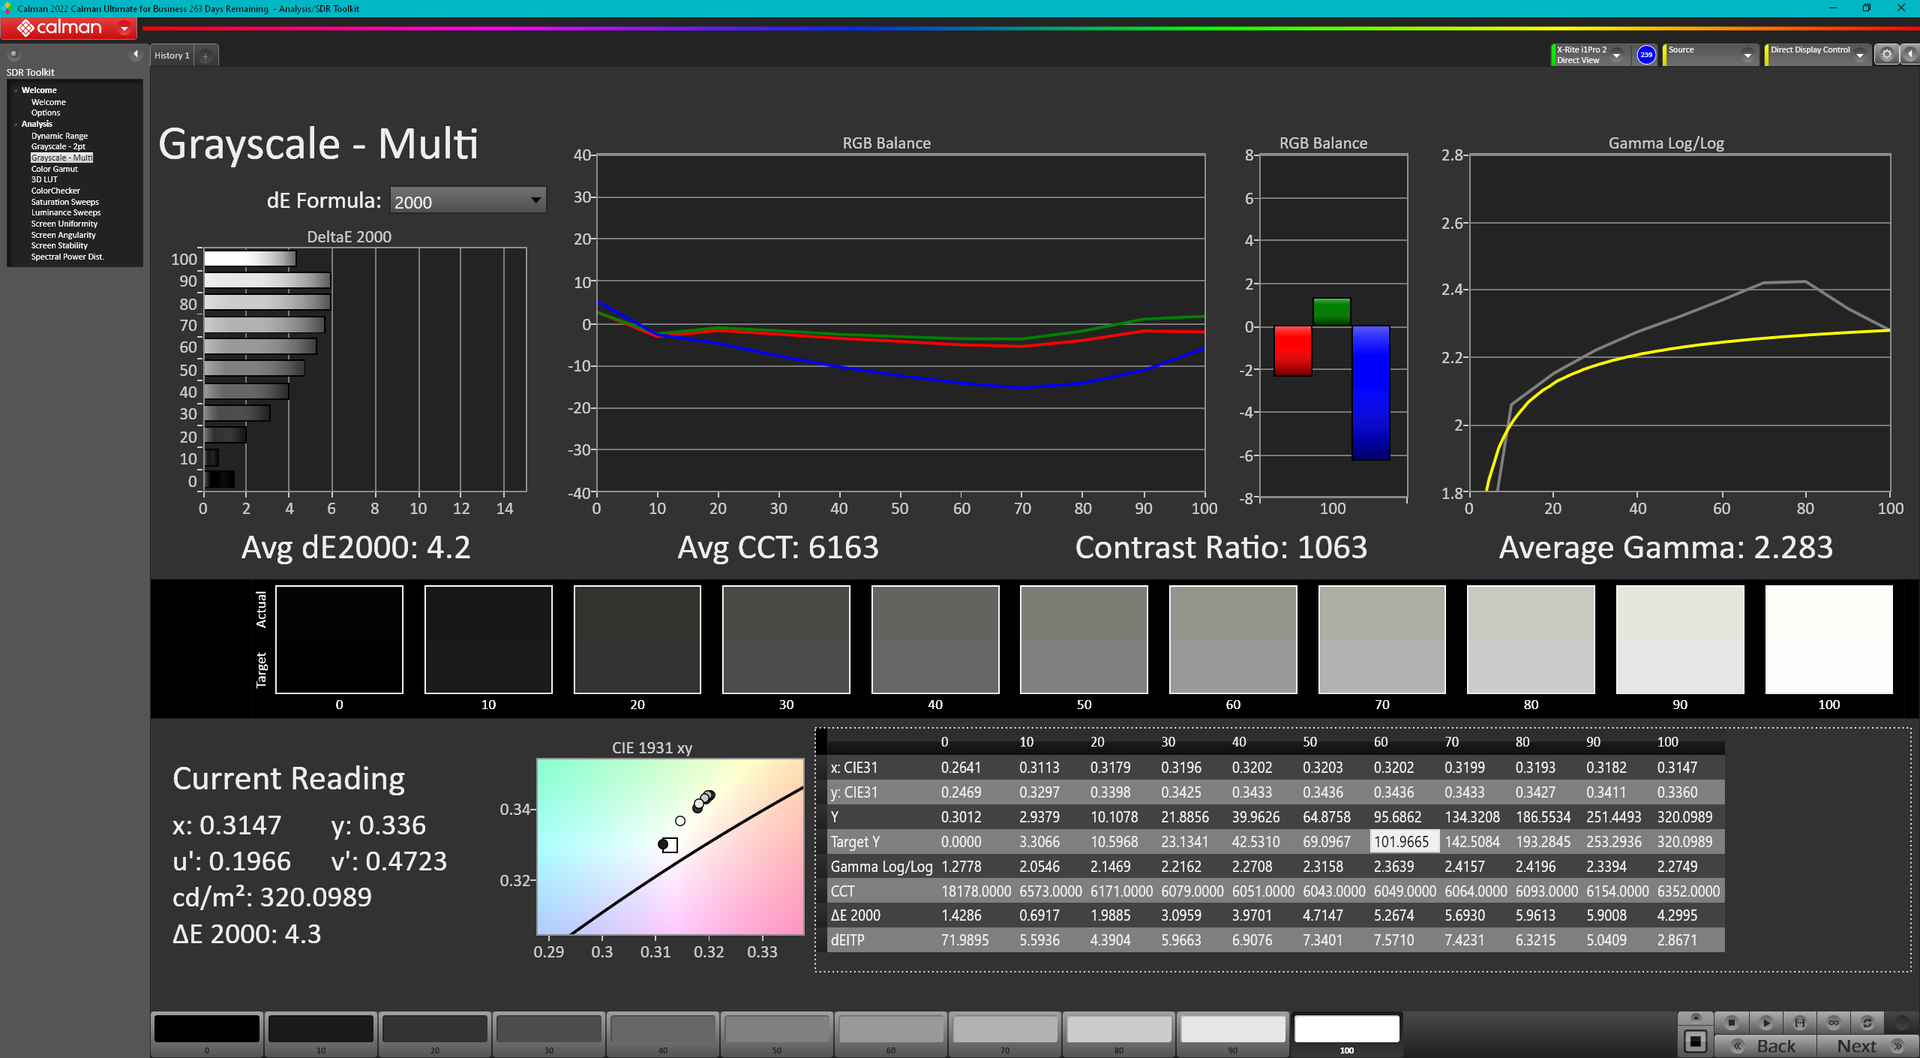
Homogénéité de la luminosité: 82 %
Valeur mesurée au centre, sur batterie: 321.3 cd/m²
Contraste: 1036:1 (Valeurs des noirs: 0.31 cd/m²)
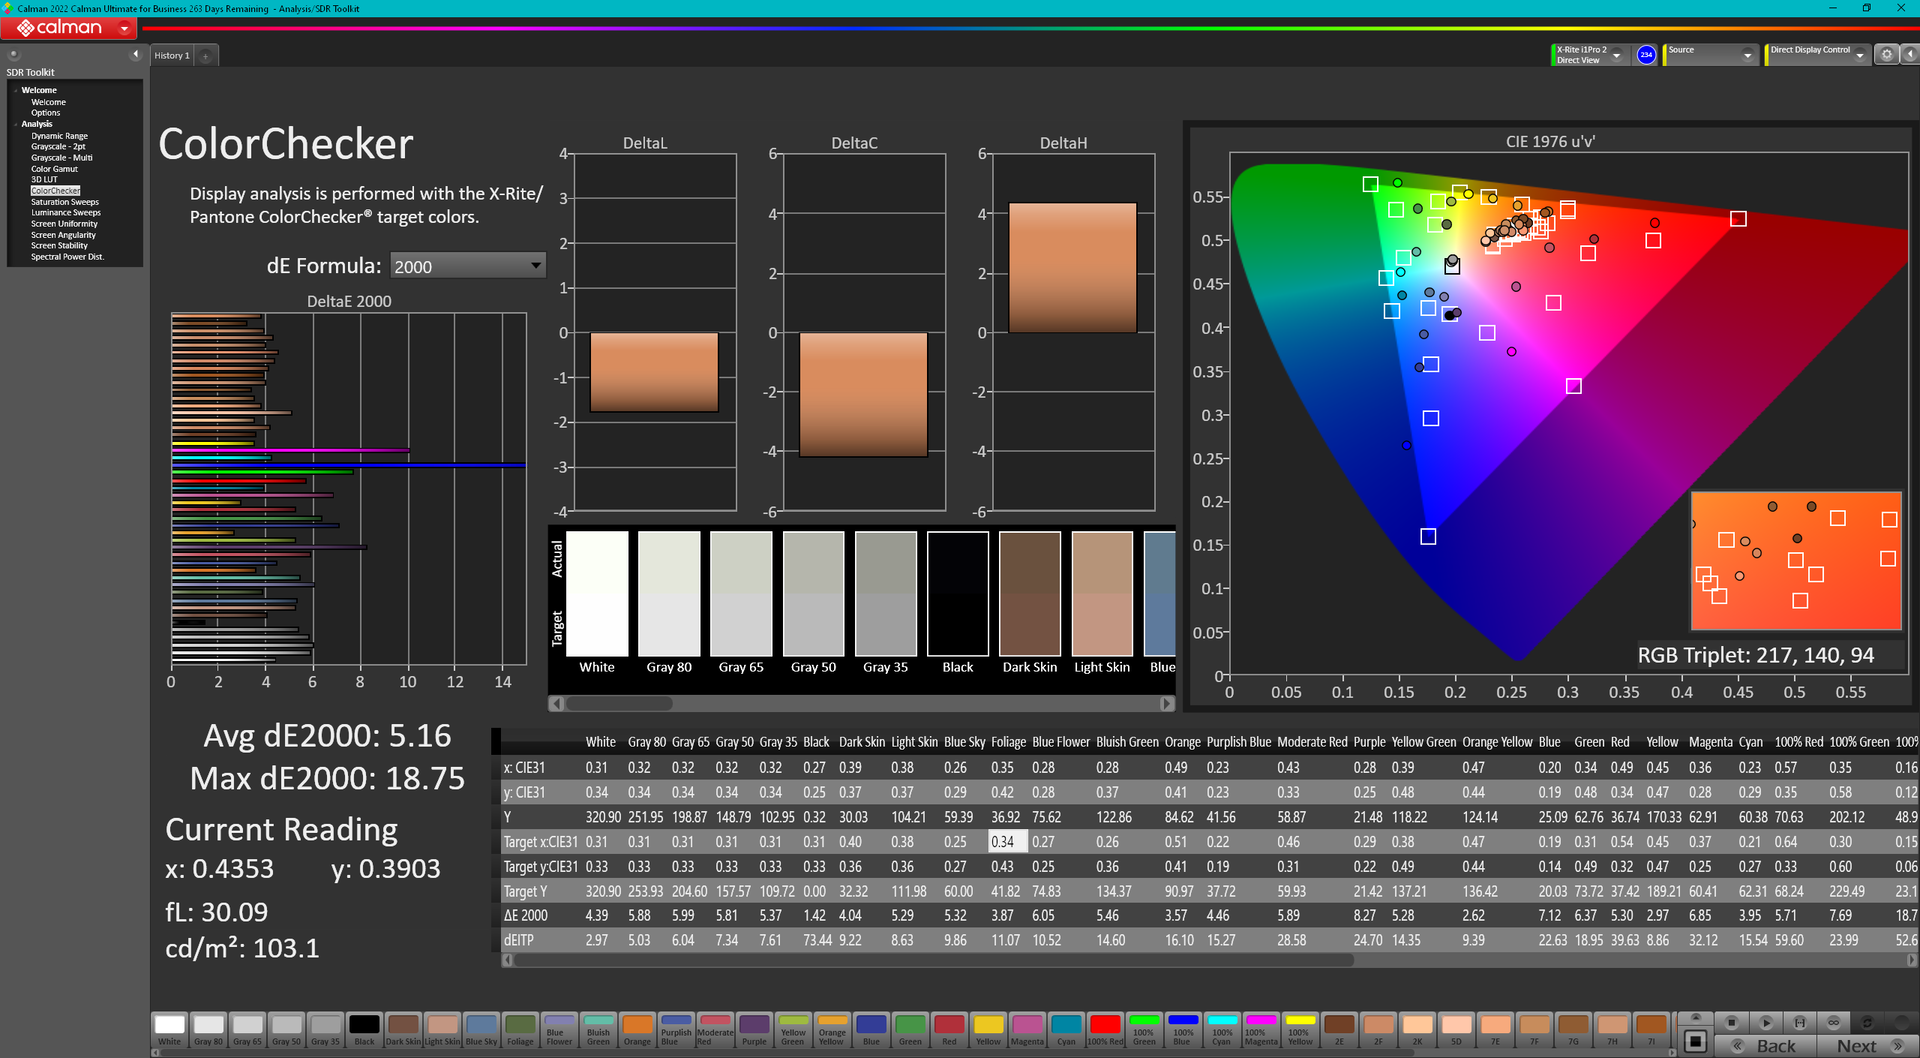
ΔE ColorChecker Calman: 5.16 | ∀{0.5-29.43 Ø4.71}
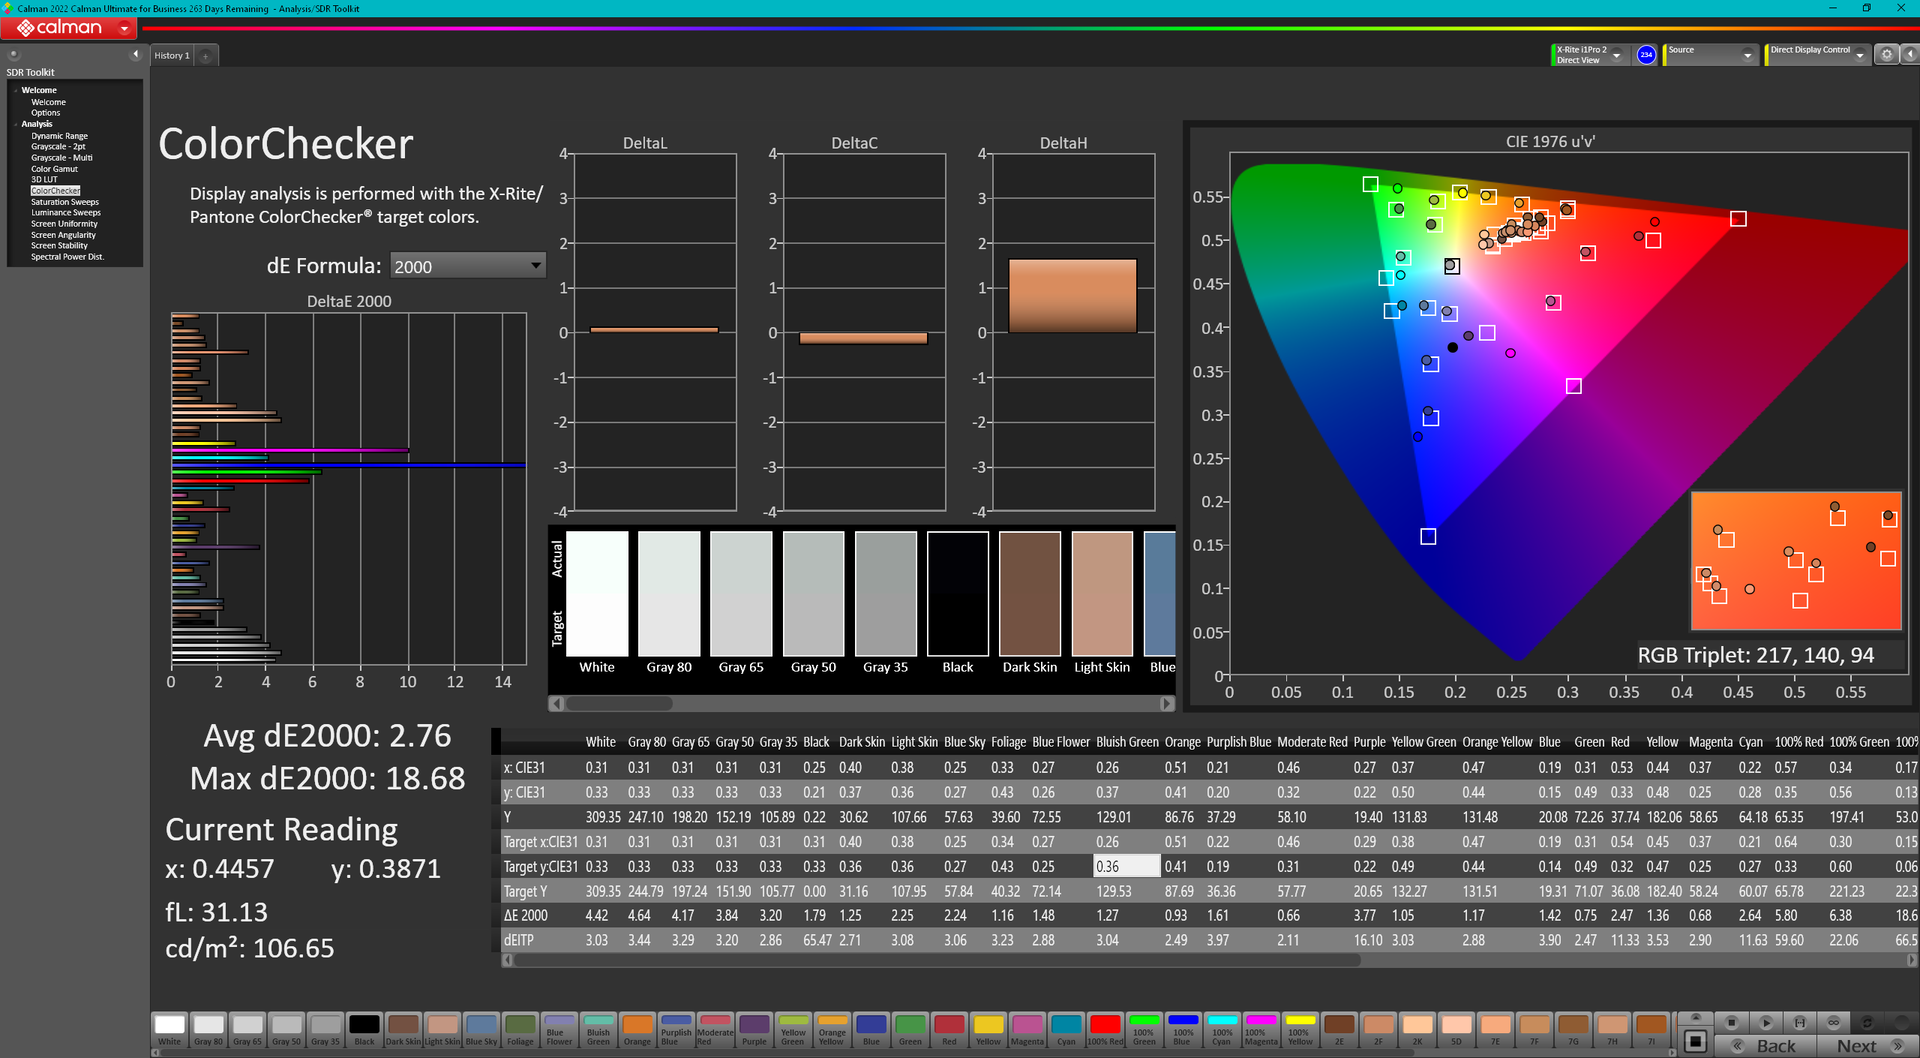
calibrated: 2.76
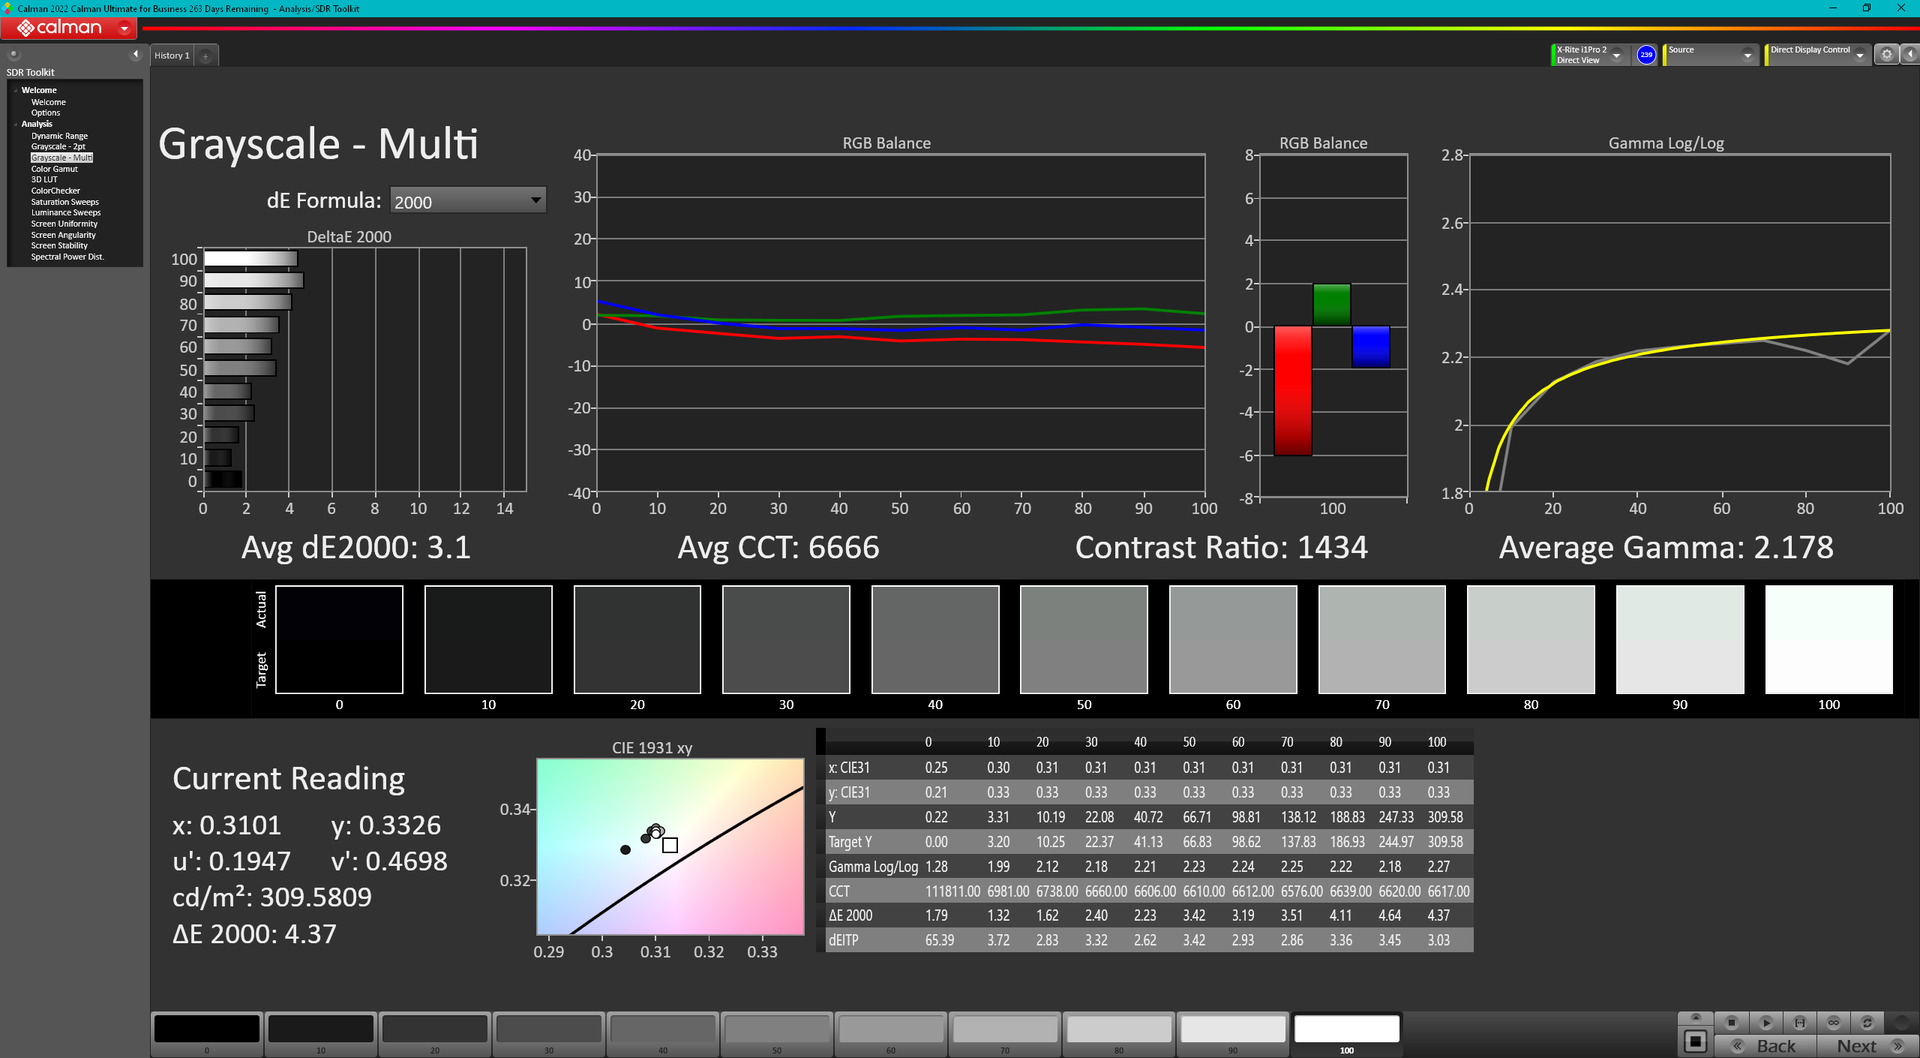
ΔE Greyscale Calman: 4.2 | ∀{0.09-98 Ø4.96}
41% AdobeRGB 1998 (Argyll 3D)
59% sRGB (Argyll 3D)
39.7% Display P3 (Argyll 3D)
Gamma: 2.28
CCT: 6163 K
| Lenovo ThinkPad T16 Gen 1 Core i7-1270P B160UAN3.2, IPS, 1920x1200, 16" | Lenovo ThinkPad T16 G1 21CH004MGE MNG007DA1-C, IPS-LED, 2560x1600, 16" | LG Gram 16Z90Q LG LP160WQ1-SPB2 (LGD06EB), IPS, 2560x1600, 16" | HP EliteBook 865 G9 X160NV42, IPS, 1920x1200, 16" | Huawei MateBook 16s i7 BOE XS TV160DKT-NH0, IPS, 2520x1680, 16" | Apple MacBook Pro 16 2021 M1 Pro Liquid Retina XDR, Mini-LED, 3456x2234, 16.2" | |
|---|---|---|---|---|---|---|
| Display | 66% | 106% | 76% | 63% | 111% | |
| Display P3 Coverage (%) | 39.7 | 66.7 68% | 96.8 144% | 71.4 80% | 64.5 62% | 99.1 150% |
| sRGB Coverage (%) | 59 | 95.7 62% | 99.9 69% | 99.3 68% | 96.7 64% | 100 69% |
| AdobeRGB 1998 Coverage (%) | 41 | 69.1 69% | 84.6 106% | 73.2 79% | 66.6 62% | 88 115% |
| Response Times | 7% | -19% | -9% | -9% | -161% | |
| Response Time Grey 50% / Grey 80% * (ms) | 29.2 ? | 32.1 ? -10% | 45.7 ? -57% | 35.5 ? -22% | 35.7 ? -22% | 42.8 ? -47% |
| Response Time Black / White * (ms) | 24.4 ? | 18.9 ? 23% | 19.7 ? 19% | 23.5 ? 4% | 23.2 ? 5% | 91.6 ? -275% |
| PWM Frequency (Hz) | 56.7 | 14880 | ||||
| Screen | 43% | 23% | 73% | 49% | 352% | |
| Brightness middle (cd/m²) | 321.3 | 417 30% | 366 14% | 865 169% | 311 -3% | 514 60% |
| Brightness (cd/m²) | 315 | 388 23% | 347 10% | 771 145% | 319 1% | 497 58% |
| Brightness Distribution (%) | 82 | 81 -1% | 89 9% | 72 -12% | 91 11% | 95 16% |
| Black Level * (cd/m²) | 0.31 | 0.24 23% | 0.32 -3% | 0.3 3% | 0.17 45% | 0.02 94% |
| Contrast (:1) | 1036 | 1738 68% | 1144 10% | 2883 178% | 1829 77% | 25700 2381% |
| Colorchecker dE 2000 * | 5.16 | 1.7 67% | 2.82 45% | 2.4 53% | 1 81% | 1.4 73% |
| Colorchecker dE 2000 max. * | 18.75 | 3.5 81% | 4.65 75% | 5.8 69% | 1.7 91% | 2.8 85% |
| Colorchecker dE 2000 calibrated * | 2.76 | 1.4 49% | 2.69 3% | 1.5 46% | 0.8 71% | |
| Greyscale dE 2000 * | 4.2 | 2.4 43% | 2.3 45% | 3.8 10% | 1.5 64% | 2.3 45% |
| Gamma | 2.28 96% | 2.16 102% | 1.971 112% | 2.36 93% | 2.15 102% | 2.27 97% |
| CCT | 6163 105% | 6924 94% | 6796 96% | 6922 94% | 6432 101% | 6792 96% |
| Moyenne finale (programmes/paramètres) | 39% /
43% | 37% /
35% | 47% /
62% | 34% /
44% | 101% /
217% |
* ... Moindre est la valeur, meilleures sont les performances
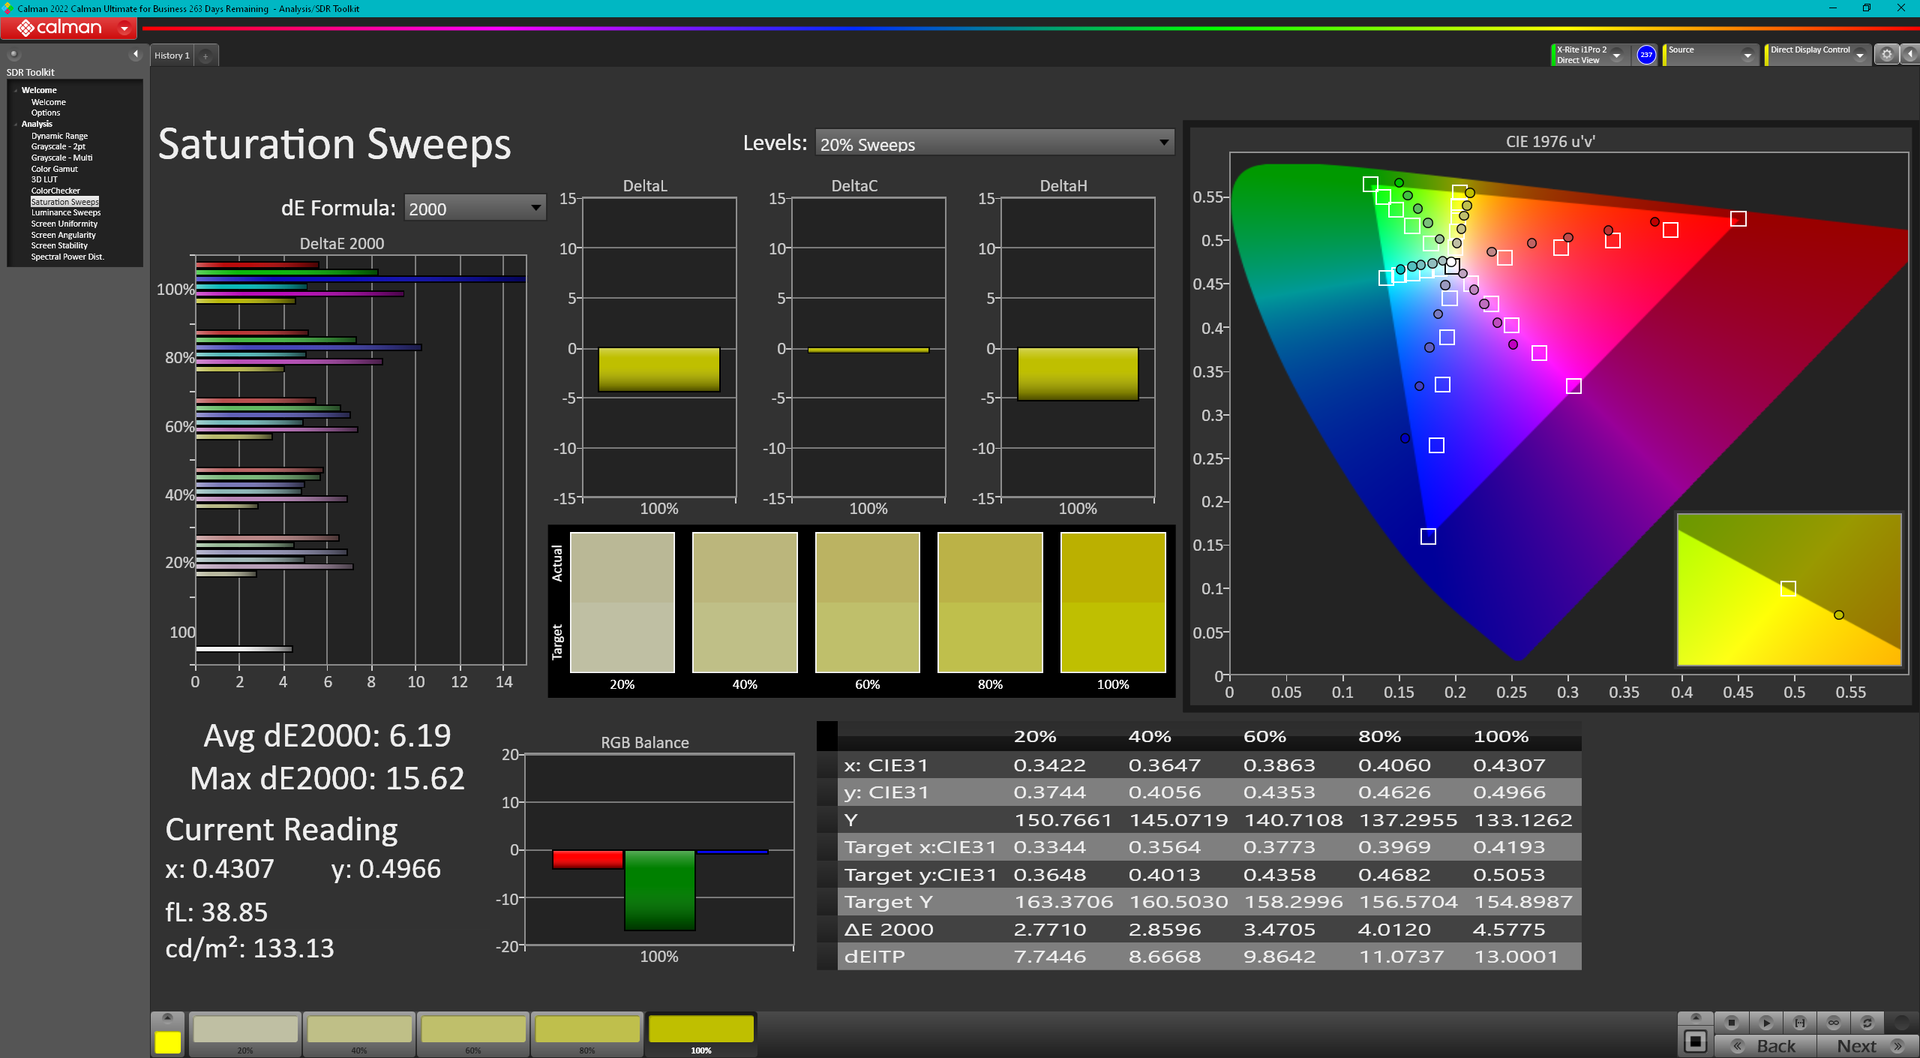
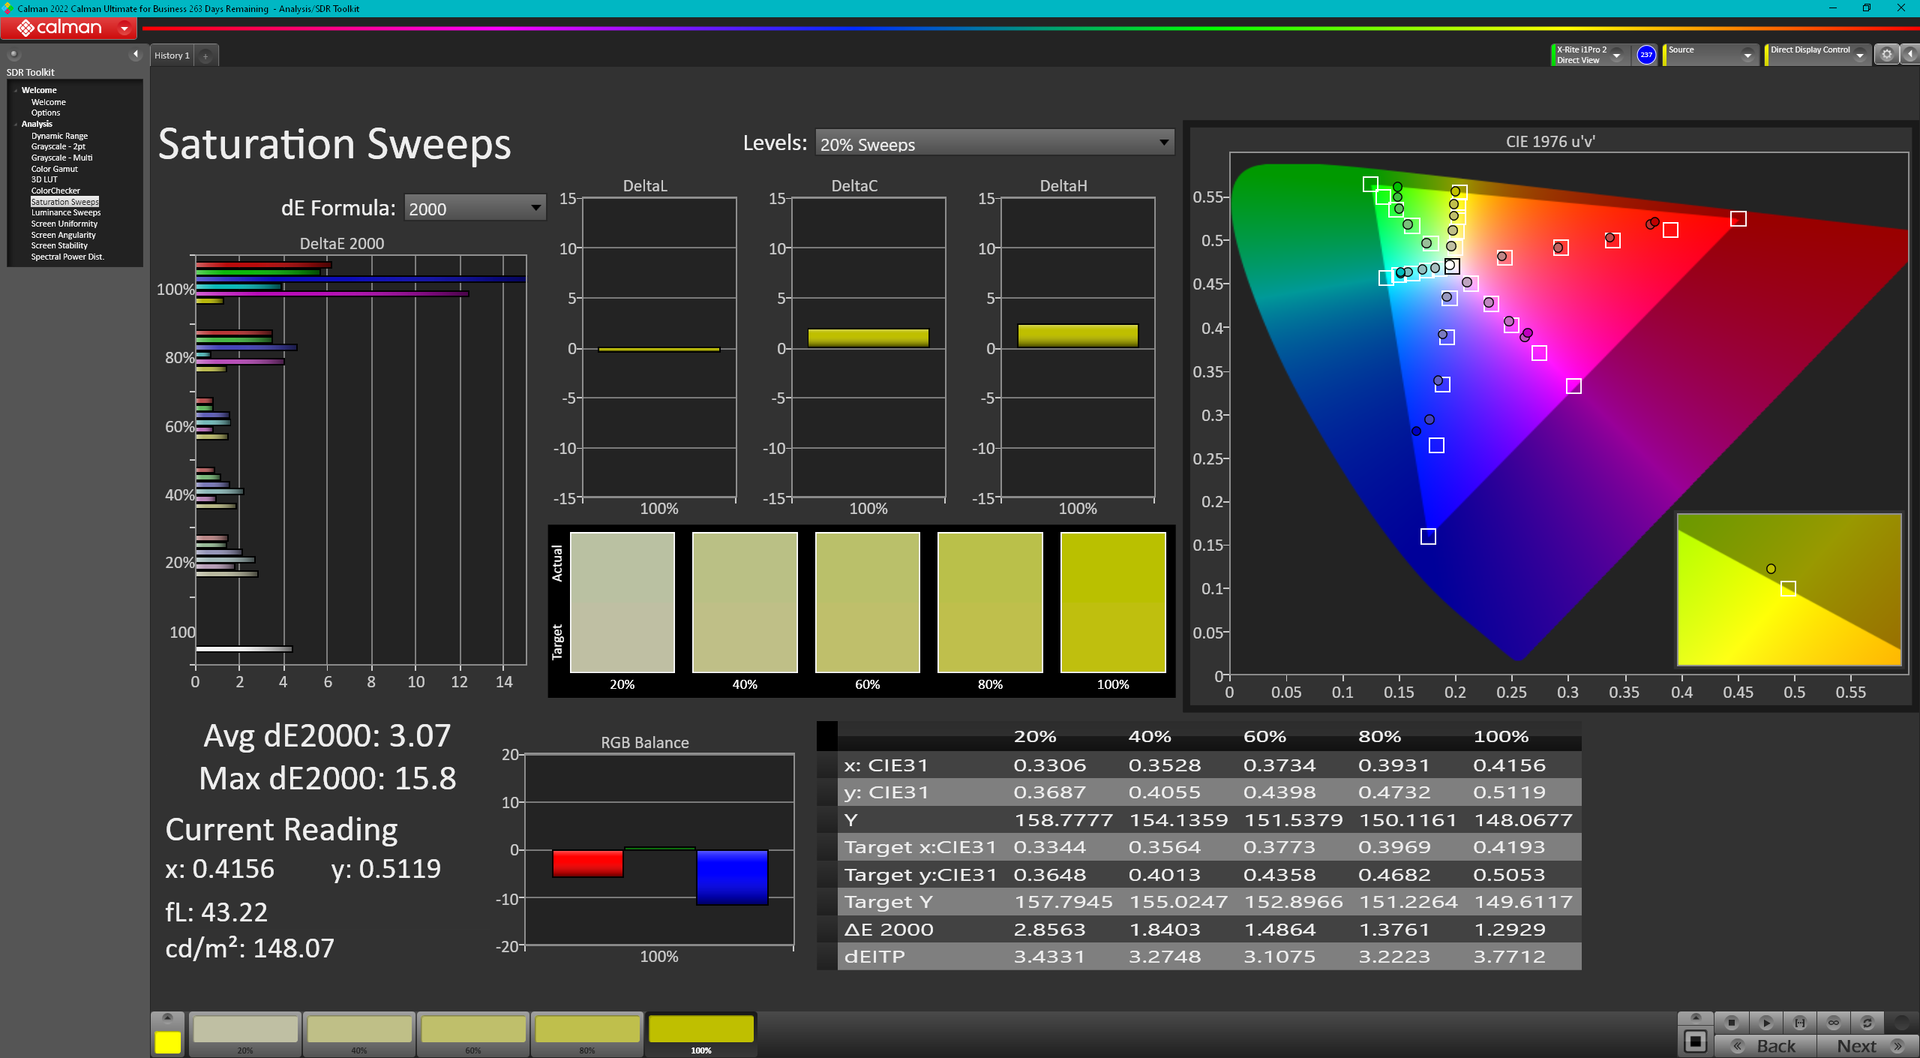
La température des couleurs est trop chaude à la sortie de l'emballage, ce qui peut heureusement être corrigé par un calibrage approprié. Le DeltaE moyen des couleurs s'améliore de 5,05 à 2,23, mais les couleurs restent imprécises à des niveaux de saturation élevés en raison de la couverture limitée des couleurs de l'écran. Nous recommandons d'appliquer notre profil ICM calibré ci-dessus car l'écran n'est pas calibré en usine.
Temps de réponse de l'écran
| ↔ Temps de réponse noir à blanc | ||
|---|---|---|
| 24.4 ms ... hausse ↗ et chute ↘ combinées | ↗ 14 ms hausse | 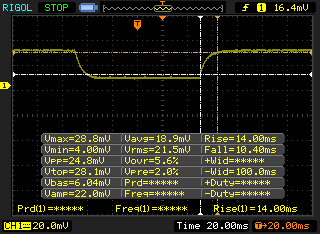 |
| ↘ 10.4 ms chute | ||
| L'écran montre de bons temps de réponse, mais insuffisant pour du jeu compétitif. En comparaison, tous les appareils testés affichent entre 0.1 (minimum) et 240 (maximum) ms. » 58 % des appareils testés affichent de meilleures performances. Cela signifie que les latences relevées sont moins bonnes que la moyenne (19.8 ms) de tous les appareils testés. | ||
| ↔ Temps de réponse gris 50% à gris 80% | ||
| 29.2 ms ... hausse ↗ et chute ↘ combinées | ↗ 15.6 ms hausse | 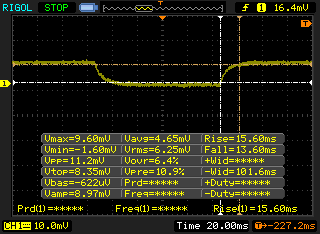 |
| ↘ 13.6 ms chute | ||
| L'écran souffre de latences relativement élevées, insuffisant pour le jeu. En comparaison, tous les appareils testés affichent entre 0.165 (minimum) et 636 (maximum) ms. » 40 % des appareils testés affichent de meilleures performances. Cela signifie que les latences relevées sont similaires à la moyenne (31 ms) de tous les appareils testés. | ||
Scintillement / MLI (Modulation de largeur d'impulsion)
| Scintillement / MLI (Modulation de largeur d'impulsion) non décelé | 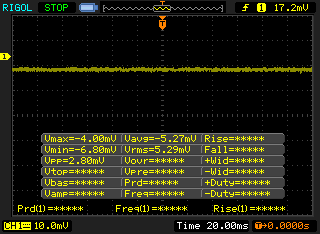 | ||
En comparaison, 52 % des appareils testés n'emploient pas MDI pour assombrir leur écran. Nous avons relevé une moyenne à 7757 (minimum : 5 - maximum : 343500) Hz dans le cas où une MDI était active. | |||
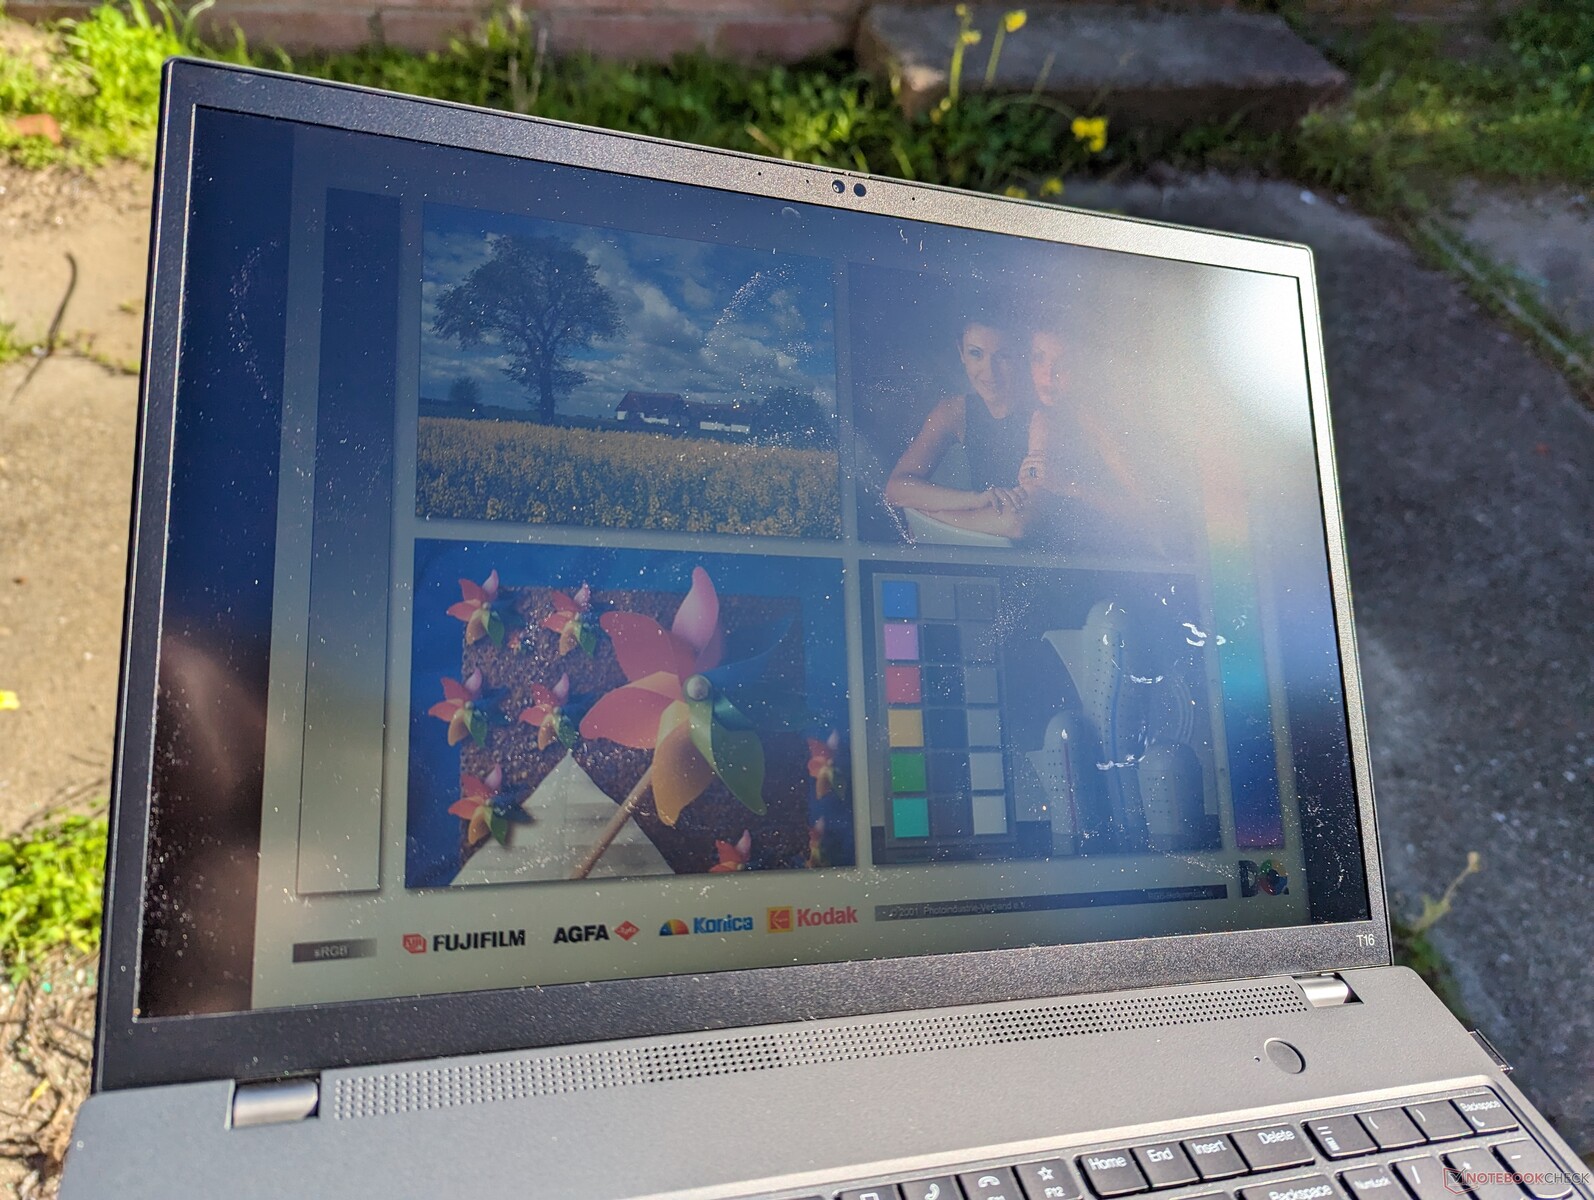
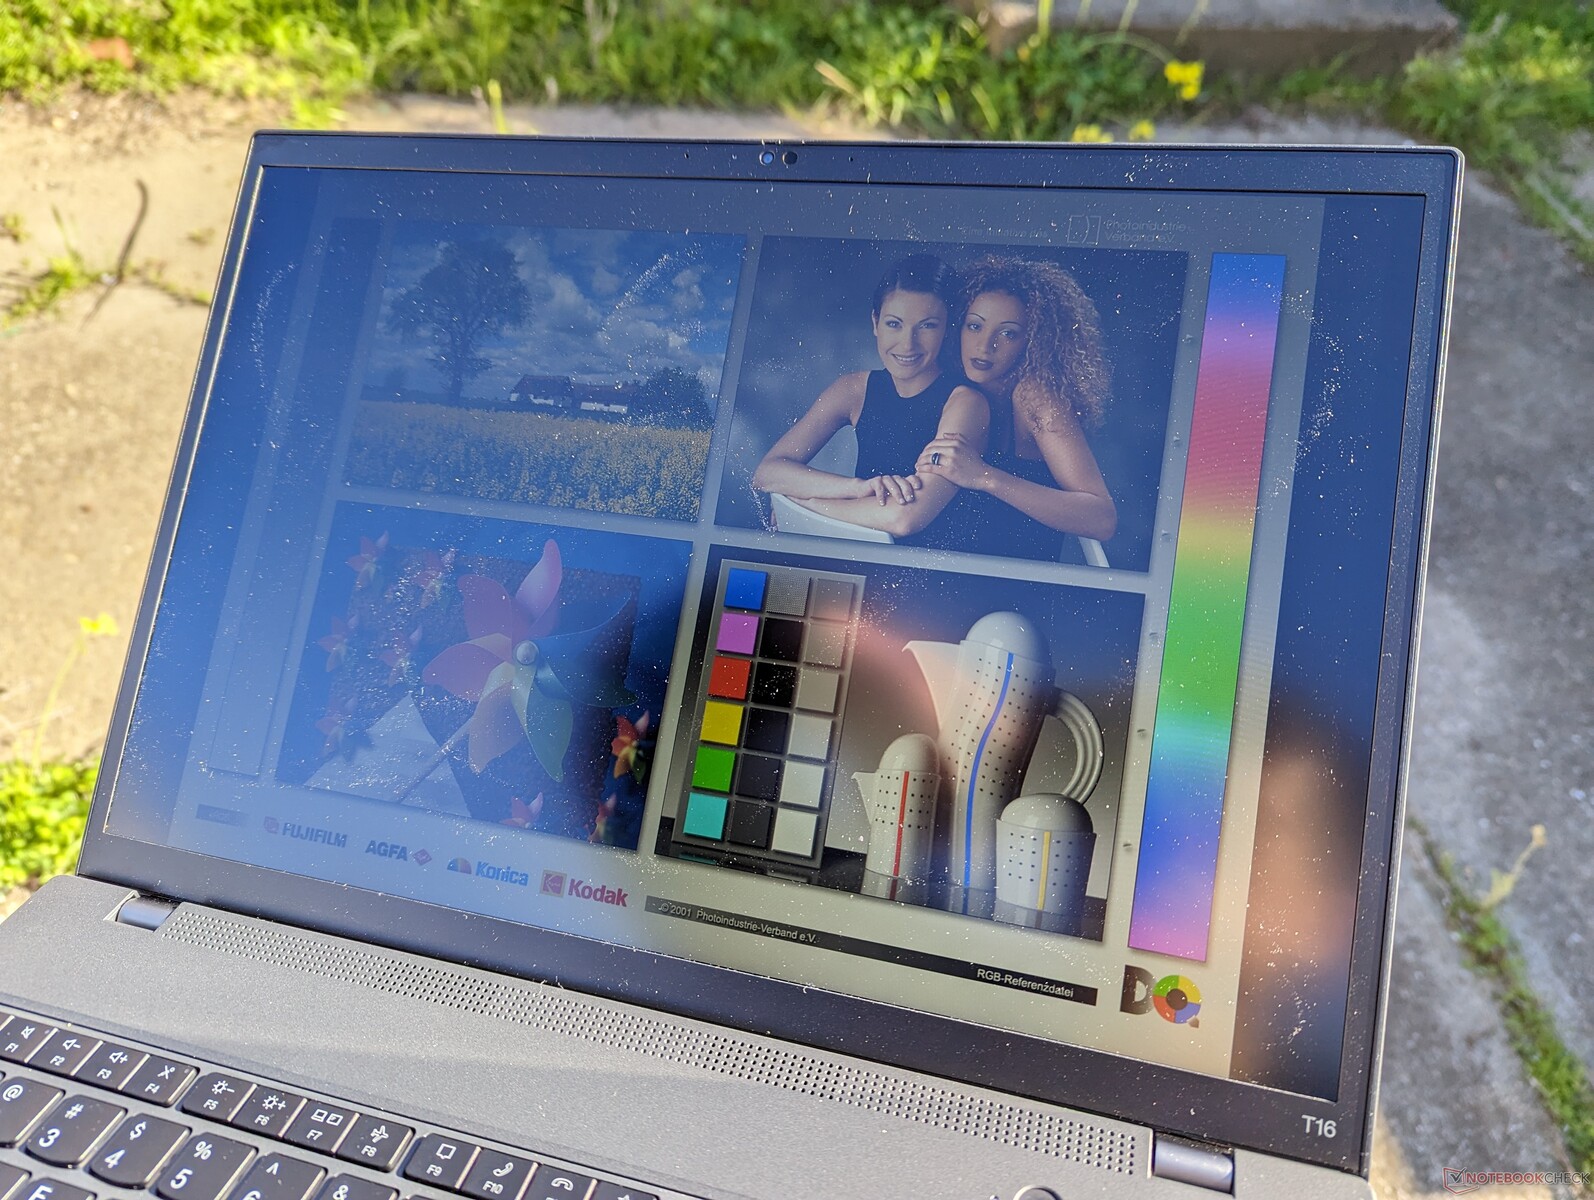
La visibilité à l'extérieur est moyenne, au mieux, sur notre panneau 300-nit. Les utilisateurs voudront peut-être envisager les options à 500 lumens pour réduire les effets d'éblouissement. Si la visibilité est un problème, nous vous recommandons de jeter un coup d'œil au HP EliteBook 860/865 G9 et à ses options de dalles 1000-nit beaucoup plus lumineuses.
Performances - Options Intel 12e génération
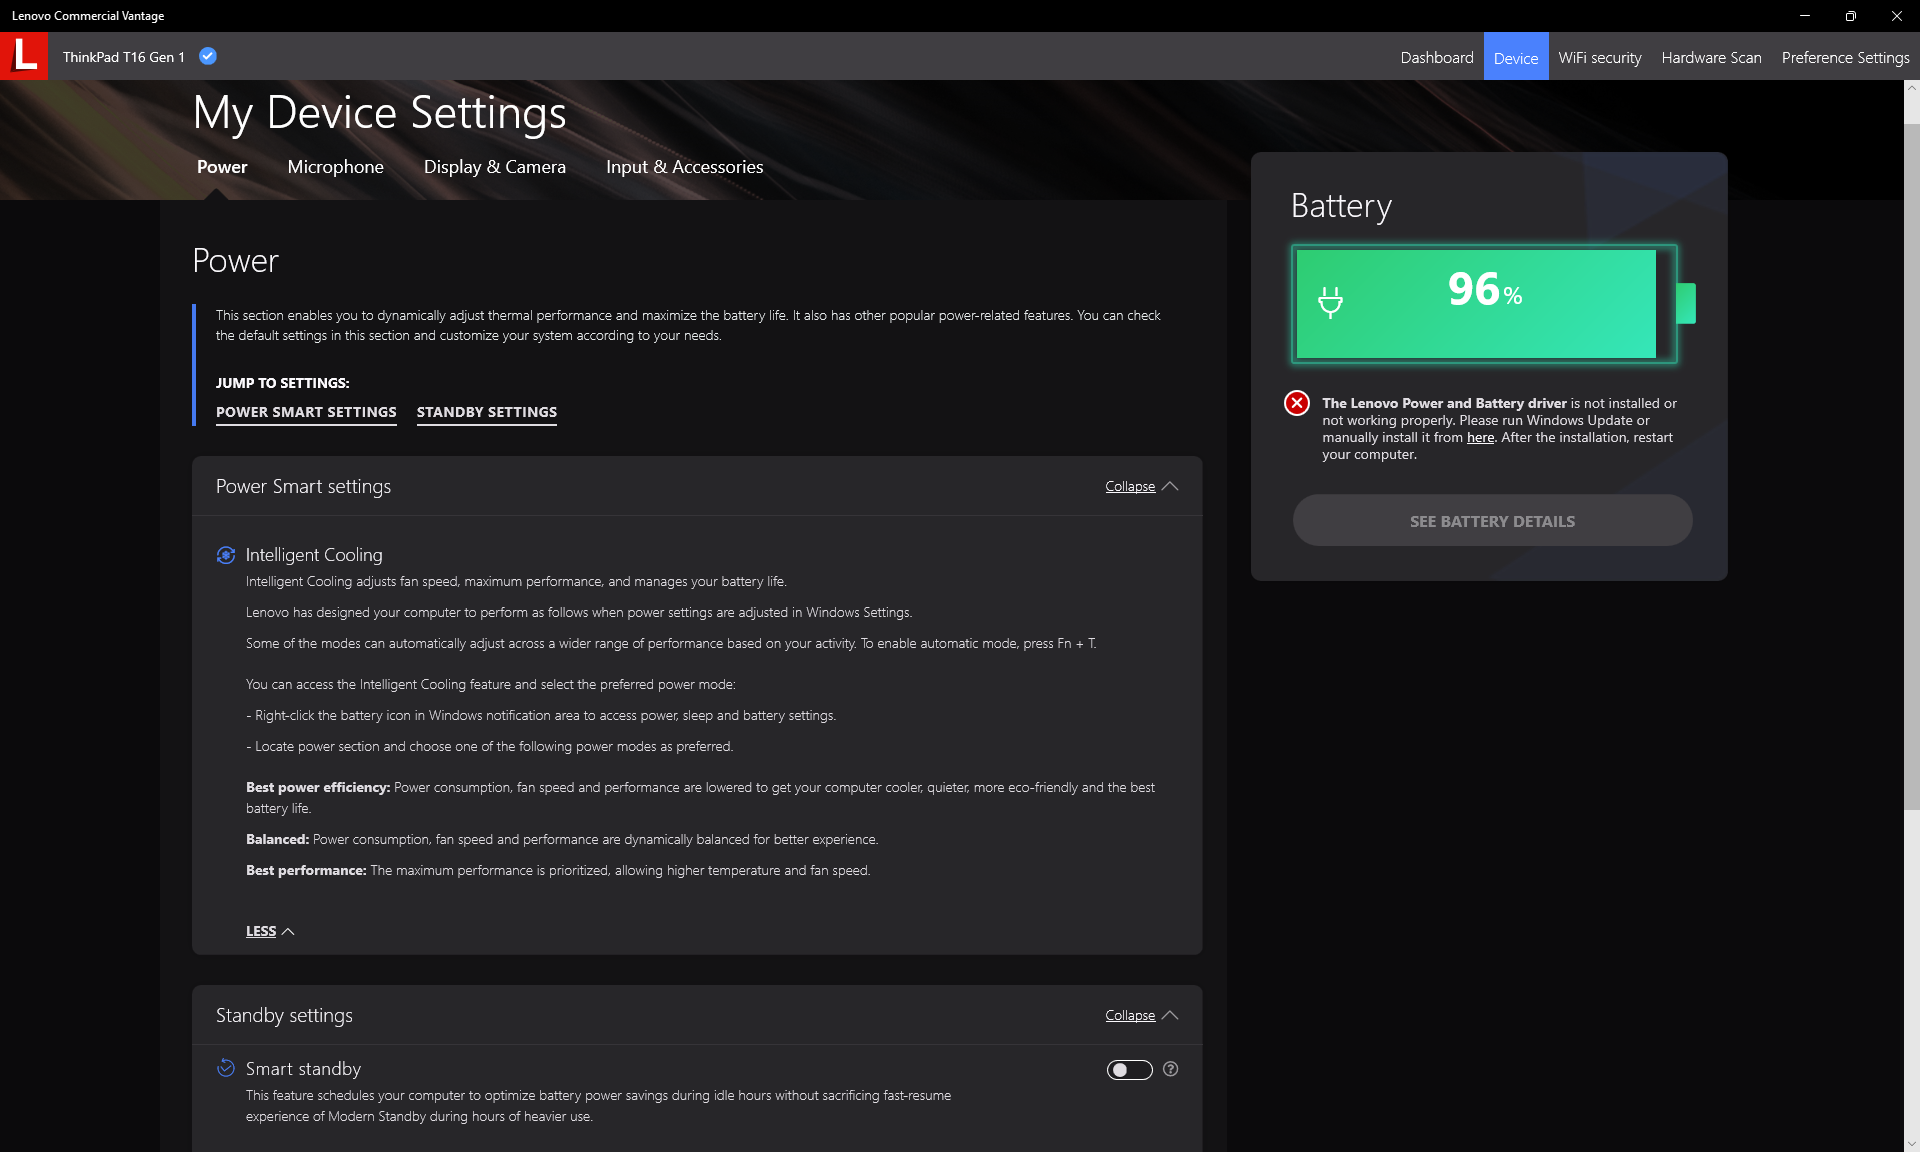
Conditions d'essai
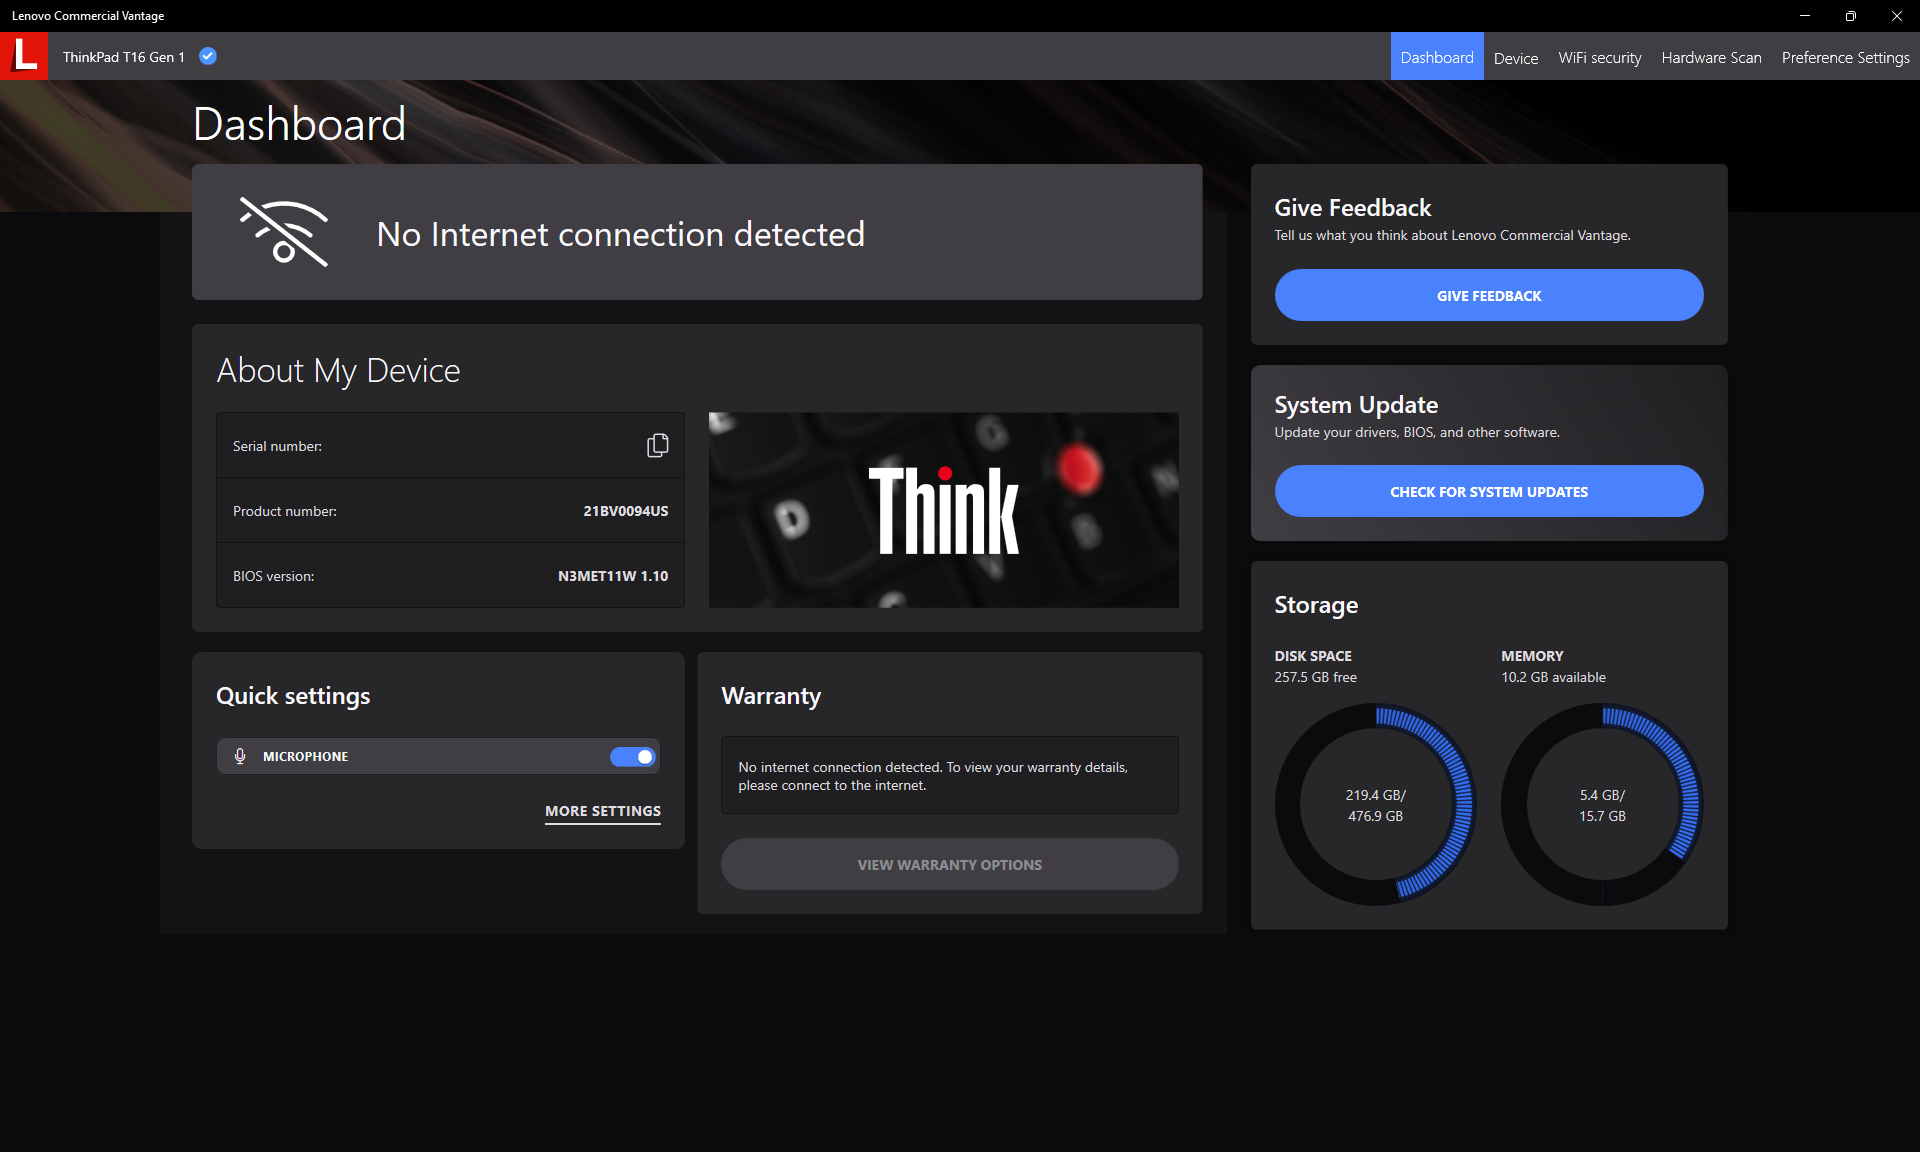
Nous avons réglé notre appareil en mode Performance via Windows avant d'effectuer les tests de référence ci-dessous. Les utilisateurs doivent se familiariser avec le logiciel Lenovo Commercial Vantage, car il s'agit de la plaque tournante des paramètres supplémentaires liés aux mises à jour, à la garantie, à la sécurité, etc. Les captures d'écran ci-dessous montrent quelques-unes des options.
Processeur - Le Turbo Boost pourrait être meilleur
Notre Core i7-1270P présente un comportement d'étranglement similaire à celui que nous avons observé avec le Core i5-1240P SKU. Lors de l'exécution de CineBench R15 xT en boucle, par exemple, le score initial de 1 782 points a chuté de 44 % au fil du temps, ce qui est nettement plus que sur la plupart des autres ordinateurs portables. En revanche, leRyzen 5 PRO 6650U Serait plus lent pendant les quelques minutes du test en boucle, mais il est capable de maintenir des fréquences d'horloge et des performances plus élevées sur des périodes plus longues, comme le montre notre graphique ci-dessous. Les avantages du Turbo Boost du Core i7-1270P sont donc de très courte durée sur le ThinkPad T16 G1.
Les utilisateurs peuvent installer ThrottleStop pour minimiser l'accélération des performances d'environ 20 % s'ils le souhaitent. Malgré cela, il est décevant que Lenovo n'offre pas une telle option de performance sans recourir à un logiciel tiers.
Cinebench R15 Multi Loop
Cinebench R20: CPU (Multi Core) | CPU (Single Core)
Cinebench R23: Multi Core | Single Core
Cinebench R15: CPU Multi 64Bit | CPU Single 64Bit
Blender: v2.79 BMW27 CPU
7-Zip 18.03: 7z b 4 | 7z b 4 -mmt1
Geekbench 5.5: Multi-Core | Single-Core
HWBOT x265 Benchmark v2.2: 4k Preset
LibreOffice : 20 Documents To PDF
R Benchmark 2.5: Overall mean
| CPU Performance rating | |
| Huawei MateBook 16s i7 | |
| MSI Summit E16 Flip A12UDT-031 | |
| Apple MacBook Pro 16 2021 M1 Pro -5! | |
| Lenovo Yoga 7-14ARB G7 | |
| Lenovo ThinkPad T16 Gen 1 Core i7-1270P | |
| Moyenne Intel Core i7-1270P | |
| HP EliteBook 865 G9 | |
| Lenovo ThinkPad T16 G1 21CH004MGE | |
| Lenovo ThinkBook 13s G3 20YA0005GE | |
| LG Gram 16Z90Q | |
| Lenovo ThinkPad T16 G1 21BWS00200 | |
| Asus ZenBook Flip 15 Q508U | |
| LG Gram 16 (2021) | |
| Asus ZenBook 14 UX434FL-DB77 -2! | |
| Cinebench R20 / CPU (Multi Core) | |
| Huawei MateBook 16s i7 | |
| MSI Summit E16 Flip A12UDT-031 | |
| Lenovo Yoga 7-14ARB G7 | |
| Lenovo ThinkPad T16 Gen 1 Core i7-1270P | |
| HP EliteBook 865 G9 | |
| Lenovo ThinkPad T16 G1 21CH004MGE | |
| Asus ZenBook Flip 15 Q508U | |
| Moyenne Intel Core i7-1270P (3167 - 3905, n=2) | |
| LG Gram 16Z90Q | |
| Lenovo ThinkBook 13s G3 20YA0005GE | |
| Lenovo ThinkPad T16 G1 21BWS00200 | |
| Apple MacBook Pro 16 2021 M1 Pro | |
| LG Gram 16 (2021) | |
| Asus ZenBook 14 UX434FL-DB77 | |
| Cinebench R20 / CPU (Single Core) | |
| Huawei MateBook 16s i7 | |
| MSI Summit E16 Flip A12UDT-031 | |
| Lenovo ThinkPad T16 Gen 1 Core i7-1270P | |
| Moyenne Intel Core i7-1270P (595 - 627, n=2) | |
| LG Gram 16Z90Q | |
| Lenovo Yoga 7-14ARB G7 | |
| HP EliteBook 865 G9 | |
| Lenovo ThinkPad T16 G1 21BWS00200 | |
| Lenovo ThinkPad T16 G1 21CH004MGE | |
| Lenovo ThinkBook 13s G3 20YA0005GE | |
| LG Gram 16 (2021) | |
| Asus ZenBook Flip 15 Q508U | |
| Asus ZenBook 14 UX434FL-DB77 | |
| Apple MacBook Pro 16 2021 M1 Pro | |
| Cinebench R23 / Multi Core | |
| MSI Summit E16 Flip A12UDT-031 | |
| Huawei MateBook 16s i7 | |
| Apple MacBook Pro 16 2021 M1 Pro | |
| Lenovo Yoga 7-14ARB G7 | |
| Lenovo ThinkPad T16 Gen 1 Core i7-1270P | |
| HP EliteBook 865 G9 | |
| Moyenne Intel Core i7-1270P (8426 - 11010, n=2) | |
| Lenovo ThinkPad T16 G1 21CH004MGE | |
| Asus ZenBook Flip 15 Q508U | |
| Lenovo ThinkBook 13s G3 20YA0005GE | |
| LG Gram 16Z90Q | |
| Lenovo ThinkPad T16 G1 21BWS00200 | |
| LG Gram 16 (2021) | |
| Cinebench R23 / Single Core | |
| Huawei MateBook 16s i7 | |
| Lenovo ThinkPad T16 Gen 1 Core i7-1270P | |
| MSI Summit E16 Flip A12UDT-031 | |
| Lenovo ThinkPad T16 G1 21BWS00200 | |
| Moyenne Intel Core i7-1270P (1552 - 1688, n=2) | |
| LG Gram 16Z90Q | |
| Apple MacBook Pro 16 2021 M1 Pro | |
| Lenovo Yoga 7-14ARB G7 | |
| Lenovo ThinkPad T16 G1 21CH004MGE | |
| Lenovo ThinkBook 13s G3 20YA0005GE | |
| HP EliteBook 865 G9 | |
| LG Gram 16 (2021) | |
| Asus ZenBook Flip 15 Q508U | |
| Cinebench R15 / CPU Multi 64Bit | |
| Huawei MateBook 16s i7 | |
| Huawei MateBook 16s i7 | |
| MSI Summit E16 Flip A12UDT-031 | |
| Lenovo Yoga 7-14ARB G7 | |
| Lenovo ThinkBook 13s G3 20YA0005GE | |
| Lenovo ThinkBook 13s G3 20YA0005GE | |
| Lenovo ThinkPad T16 Gen 1 Core i7-1270P | |
| Lenovo ThinkPad T16 G1 21BWS00200 | |
| Lenovo ThinkPad T16 G1 21BWS00200 | |
| Moyenne Intel Core i7-1270P (1695 - 1783, n=2) | |
| Apple MacBook Pro 16 2021 M1 Pro | |
| HP EliteBook 865 G9 | |
| Asus ZenBook Flip 15 Q508U | |
| Lenovo ThinkPad T16 G1 21CH004MGE | |
| LG Gram 16Z90Q | |
| LG Gram 16 (2021) | |
| Asus ZenBook 14 UX434FL-DB77 | |
| Cinebench R15 / CPU Single 64Bit | |
| Huawei MateBook 16s i7 | |
| Lenovo Yoga 7-14ARB G7 | |
| MSI Summit E16 Flip A12UDT-031 | |
| Lenovo ThinkPad T16 Gen 1 Core i7-1270P | |
| Lenovo ThinkPad T16 G1 21CH004MGE | |
| HP EliteBook 865 G9 | |
| Moyenne Intel Core i7-1270P (226 - 233, n=2) | |
| Lenovo ThinkBook 13s G3 20YA0005GE | |
| Lenovo ThinkPad T16 G1 21BWS00200 | |
| LG Gram 16Z90Q | |
| Apple MacBook Pro 16 2021 M1 Pro | |
| LG Gram 16 (2021) | |
| Asus ZenBook Flip 15 Q508U | |
| Asus ZenBook 14 UX434FL-DB77 | |
| Blender / v2.79 BMW27 CPU | |
| LG Gram 16 (2021) | |
| Asus ZenBook 14 UX434FL-DB77 | |
| LG Gram 16Z90Q | |
| Lenovo ThinkPad T16 G1 21BWS00200 | |
| Lenovo ThinkBook 13s G3 20YA0005GE | |
| Moyenne Intel Core i7-1270P (372 - 375, n=2) | |
| Lenovo ThinkPad T16 Gen 1 Core i7-1270P | |
| Lenovo ThinkPad T16 G1 21CH004MGE | |
| Asus ZenBook Flip 15 Q508U | |
| MSI Summit E16 Flip A12UDT-031 | |
| HP EliteBook 865 G9 | |
| Lenovo Yoga 7-14ARB G7 | |
| Huawei MateBook 16s i7 | |
| Apple MacBook Pro 16 2021 M1 Pro | |
| 7-Zip 18.03 / 7z b 4 | |
| Huawei MateBook 16s i7 | |
| Lenovo Yoga 7-14ARB G7 | |
| MSI Summit E16 Flip A12UDT-031 | |
| HP EliteBook 865 G9 | |
| Asus ZenBook Flip 15 Q508U | |
| Lenovo ThinkPad T16 G1 21CH004MGE | |
| Lenovo ThinkBook 13s G3 20YA0005GE | |
| Lenovo ThinkPad T16 Gen 1 Core i7-1270P | |
| Moyenne Intel Core i7-1270P (38099 - 38449, n=2) | |
| LG Gram 16Z90Q | |
| Lenovo ThinkPad T16 G1 21BWS00200 | |
| LG Gram 16 (2021) | |
| Asus ZenBook 14 UX434FL-DB77 | |
| 7-Zip 18.03 / 7z b 4 -mmt1 | |
| Huawei MateBook 16s i7 | |
| Lenovo ThinkPad T16 Gen 1 Core i7-1270P | |
| HP EliteBook 865 G9 | |
| Lenovo Yoga 7-14ARB G7 | |
| Lenovo ThinkBook 13s G3 20YA0005GE | |
| Moyenne Intel Core i7-1270P (4874 - 5684, n=2) | |
| Lenovo ThinkPad T16 G1 21CH004MGE | |
| MSI Summit E16 Flip A12UDT-031 | |
| LG Gram 16Z90Q | |
| LG Gram 16 (2021) | |
| Lenovo ThinkPad T16 G1 21BWS00200 | |
| Asus ZenBook Flip 15 Q508U | |
| Asus ZenBook 14 UX434FL-DB77 | |
| Geekbench 5.5 / Multi-Core | |
| Huawei MateBook 16s i7 | |
| Apple MacBook Pro 16 2021 M1 Pro | |
| MSI Summit E16 Flip A12UDT-031 | |
| LG Gram 16Z90Q | |
| Lenovo Yoga 7-14ARB G7 | |
| Moyenne Intel Core i7-1270P (8610 - 8710, n=2) | |
| Lenovo ThinkPad T16 Gen 1 Core i7-1270P | |
| Lenovo ThinkPad T16 G1 21CH004MGE | |
| Lenovo ThinkPad T16 G1 21BWS00200 | |
| HP EliteBook 865 G9 | |
| Lenovo ThinkBook 13s G3 20YA0005GE | |
| Asus ZenBook Flip 15 Q508U | |
| LG Gram 16 (2021) | |
| Asus ZenBook 14 UX434FL-DB77 | |
| Geekbench 5.5 / Single-Core | |
| Huawei MateBook 16s i7 | |
| Apple MacBook Pro 16 2021 M1 Pro | |
| Lenovo ThinkPad T16 Gen 1 Core i7-1270P | |
| LG Gram 16Z90Q | |
| Moyenne Intel Core i7-1270P (1564 - 1724, n=2) | |
| MSI Summit E16 Flip A12UDT-031 | |
| Lenovo Yoga 7-14ARB G7 | |
| Lenovo ThinkPad T16 G1 21BWS00200 | |
| LG Gram 16 (2021) | |
| Lenovo ThinkPad T16 G1 21CH004MGE | |
| Lenovo ThinkBook 13s G3 20YA0005GE | |
| HP EliteBook 865 G9 | |
| Asus ZenBook Flip 15 Q508U | |
| Asus ZenBook 14 UX434FL-DB77 | |
| HWBOT x265 Benchmark v2.2 / 4k Preset | |
| Huawei MateBook 16s i7 | |
| Lenovo Yoga 7-14ARB G7 | |
| MSI Summit E16 Flip A12UDT-031 | |
| Lenovo ThinkPad T16 G1 21CH004MGE | |
| HP EliteBook 865 G9 | |
| Lenovo ThinkPad T16 Gen 1 Core i7-1270P | |
| Moyenne Intel Core i7-1270P (9.56 - 11.3, n=2) | |
| Lenovo ThinkBook 13s G3 20YA0005GE | |
| Asus ZenBook Flip 15 Q508U | |
| Lenovo ThinkPad T16 G1 21BWS00200 | |
| LG Gram 16Z90Q | |
| LG Gram 16 (2021) | |
| Asus ZenBook 14 UX434FL-DB77 | |
| LibreOffice / 20 Documents To PDF | |
| Asus ZenBook 14 UX434FL-DB77 | |
| Asus ZenBook Flip 15 Q508U | |
| Lenovo Yoga 7-14ARB G7 | |
| LG Gram 16Z90Q | |
| HP EliteBook 865 G9 | |
| MSI Summit E16 Flip A12UDT-031 | |
| Lenovo ThinkBook 13s G3 20YA0005GE | |
| Lenovo ThinkPad T16 G1 21CH004MGE | |
| Moyenne Intel Core i7-1270P (47.1 - 48.6, n=2) | |
| Lenovo ThinkPad T16 G1 21BWS00200 | |
| Lenovo ThinkPad T16 Gen 1 Core i7-1270P | |
| LG Gram 16 (2021) | |
| Huawei MateBook 16s i7 | |
| R Benchmark 2.5 / Overall mean | |
| Asus ZenBook 14 UX434FL-DB77 | |
| LG Gram 16 (2021) | |
| Asus ZenBook Flip 15 Q508U | |
| Lenovo ThinkBook 13s G3 20YA0005GE | |
| LG Gram 16Z90Q | |
| Moyenne Intel Core i7-1270P (0.4926 - 0.575, n=2) | |
| Lenovo ThinkPad T16 G1 21CH004MGE | |
| Lenovo ThinkPad T16 G1 21BWS00200 | |
| HP EliteBook 865 G9 | |
| MSI Summit E16 Flip A12UDT-031 | |
| Lenovo Yoga 7-14ARB G7 | |
| Lenovo ThinkPad T16 Gen 1 Core i7-1270P | |
| Huawei MateBook 16s i7 | |
Cinebench R20: CPU (Multi Core) | CPU (Single Core)
Cinebench R23: Multi Core | Single Core
Cinebench R15: CPU Multi 64Bit | CPU Single 64Bit
Blender: v2.79 BMW27 CPU
7-Zip 18.03: 7z b 4 | 7z b 4 -mmt1
Geekbench 5.5: Multi-Core | Single-Core
HWBOT x265 Benchmark v2.2: 4k Preset
LibreOffice : 20 Documents To PDF
R Benchmark 2.5: Overall mean
* ... Moindre est la valeur, meilleures sont les performances
* ... Moindre est la valeur, meilleures sont les performances
AIDA64: FP32 Ray-Trace | FPU Julia | CPU SHA3 | CPU Queen | FPU SinJulia | FPU Mandel | CPU AES | CPU ZLib | FP64 Ray-Trace | CPU PhotoWorxx
| Performance rating | |
| HP EliteBook 865 G9 | |
| Lenovo ThinkPad T16 G1 21CH004MGE | |
| Huawei MateBook 16s i7 | |
| Lenovo ThinkPad T16 Gen 1 Core i7-1270P | |
| LG Gram 16Z90Q | |
| Moyenne Intel Core i7-1270P | |
| AIDA64 / FP32 Ray-Trace | |
| HP EliteBook 865 G9 | |
| Lenovo ThinkPad T16 G1 21CH004MGE | |
| Lenovo ThinkPad T16 Gen 1 Core i7-1270P | |
| LG Gram 16Z90Q | |
| Huawei MateBook 16s i7 | |
| Moyenne Intel Core i7-1270P (4789 - 6722, n=2) | |
| AIDA64 / FPU Julia | |
| HP EliteBook 865 G9 | |
| Lenovo ThinkPad T16 G1 21CH004MGE | |
| Lenovo ThinkPad T16 Gen 1 Core i7-1270P | |
| Moyenne Intel Core i7-1270P (22017 - 37567, n=2) | |
| Huawei MateBook 16s i7 | |
| LG Gram 16Z90Q | |
| AIDA64 / CPU SHA3 | |
| HP EliteBook 865 G9 | |
| Lenovo ThinkPad T16 G1 21CH004MGE | |
| Huawei MateBook 16s i7 | |
| Lenovo ThinkPad T16 Gen 1 Core i7-1270P | |
| Moyenne Intel Core i7-1270P (1543 - 1853, n=2) | |
| LG Gram 16Z90Q | |
| AIDA64 / CPU Queen | |
| Huawei MateBook 16s i7 | |
| HP EliteBook 865 G9 | |
| Lenovo ThinkPad T16 G1 21CH004MGE | |
| Lenovo ThinkPad T16 Gen 1 Core i7-1270P | |
| LG Gram 16Z90Q | |
| Moyenne Intel Core i7-1270P (61703 - 76671, n=2) | |
| AIDA64 / FPU SinJulia | |
| HP EliteBook 865 G9 | |
| Lenovo ThinkPad T16 G1 21CH004MGE | |
| Huawei MateBook 16s i7 | |
| Moyenne Intel Core i7-1270P (5059 - 5210, n=2) | |
| Lenovo ThinkPad T16 Gen 1 Core i7-1270P | |
| LG Gram 16Z90Q | |
| AIDA64 / FPU Mandel | |
| HP EliteBook 865 G9 | |
| Lenovo ThinkPad T16 G1 21CH004MGE | |
| Lenovo ThinkPad T16 Gen 1 Core i7-1270P | |
| Huawei MateBook 16s i7 | |
| Moyenne Intel Core i7-1270P (12876 - 17891, n=2) | |
| LG Gram 16Z90Q | |
| AIDA64 / CPU AES | |
| Lenovo ThinkPad T16 G1 21CH004MGE | |
| Huawei MateBook 16s i7 | |
| HP EliteBook 865 G9 | |
| Lenovo ThinkPad T16 Gen 1 Core i7-1270P | |
| Moyenne Intel Core i7-1270P (33137 - 39956, n=2) | |
| LG Gram 16Z90Q | |
| AIDA64 / CPU ZLib | |
| Huawei MateBook 16s i7 | |
| HP EliteBook 865 G9 | |
| Lenovo ThinkPad T16 G1 21CH004MGE | |
| Lenovo ThinkPad T16 Gen 1 Core i7-1270P | |
| Moyenne Intel Core i7-1270P (553 - 579, n=2) | |
| LG Gram 16Z90Q | |
| AIDA64 / FP64 Ray-Trace | |
| HP EliteBook 865 G9 | |
| Lenovo ThinkPad T16 G1 21CH004MGE | |
| LG Gram 16Z90Q | |
| Lenovo ThinkPad T16 Gen 1 Core i7-1270P | |
| Huawei MateBook 16s i7 | |
| Moyenne Intel Core i7-1270P (2603 - 3521, n=2) | |
| AIDA64 / CPU PhotoWorxx | |
| Huawei MateBook 16s i7 | |
| LG Gram 16Z90Q | |
| Moyenne Intel Core i7-1270P (21056 - 34745, n=2) | |
| Lenovo ThinkPad T16 G1 21CH004MGE | |
| Lenovo ThinkPad T16 Gen 1 Core i7-1270P | |
| HP EliteBook 865 G9 | |
Performance du système
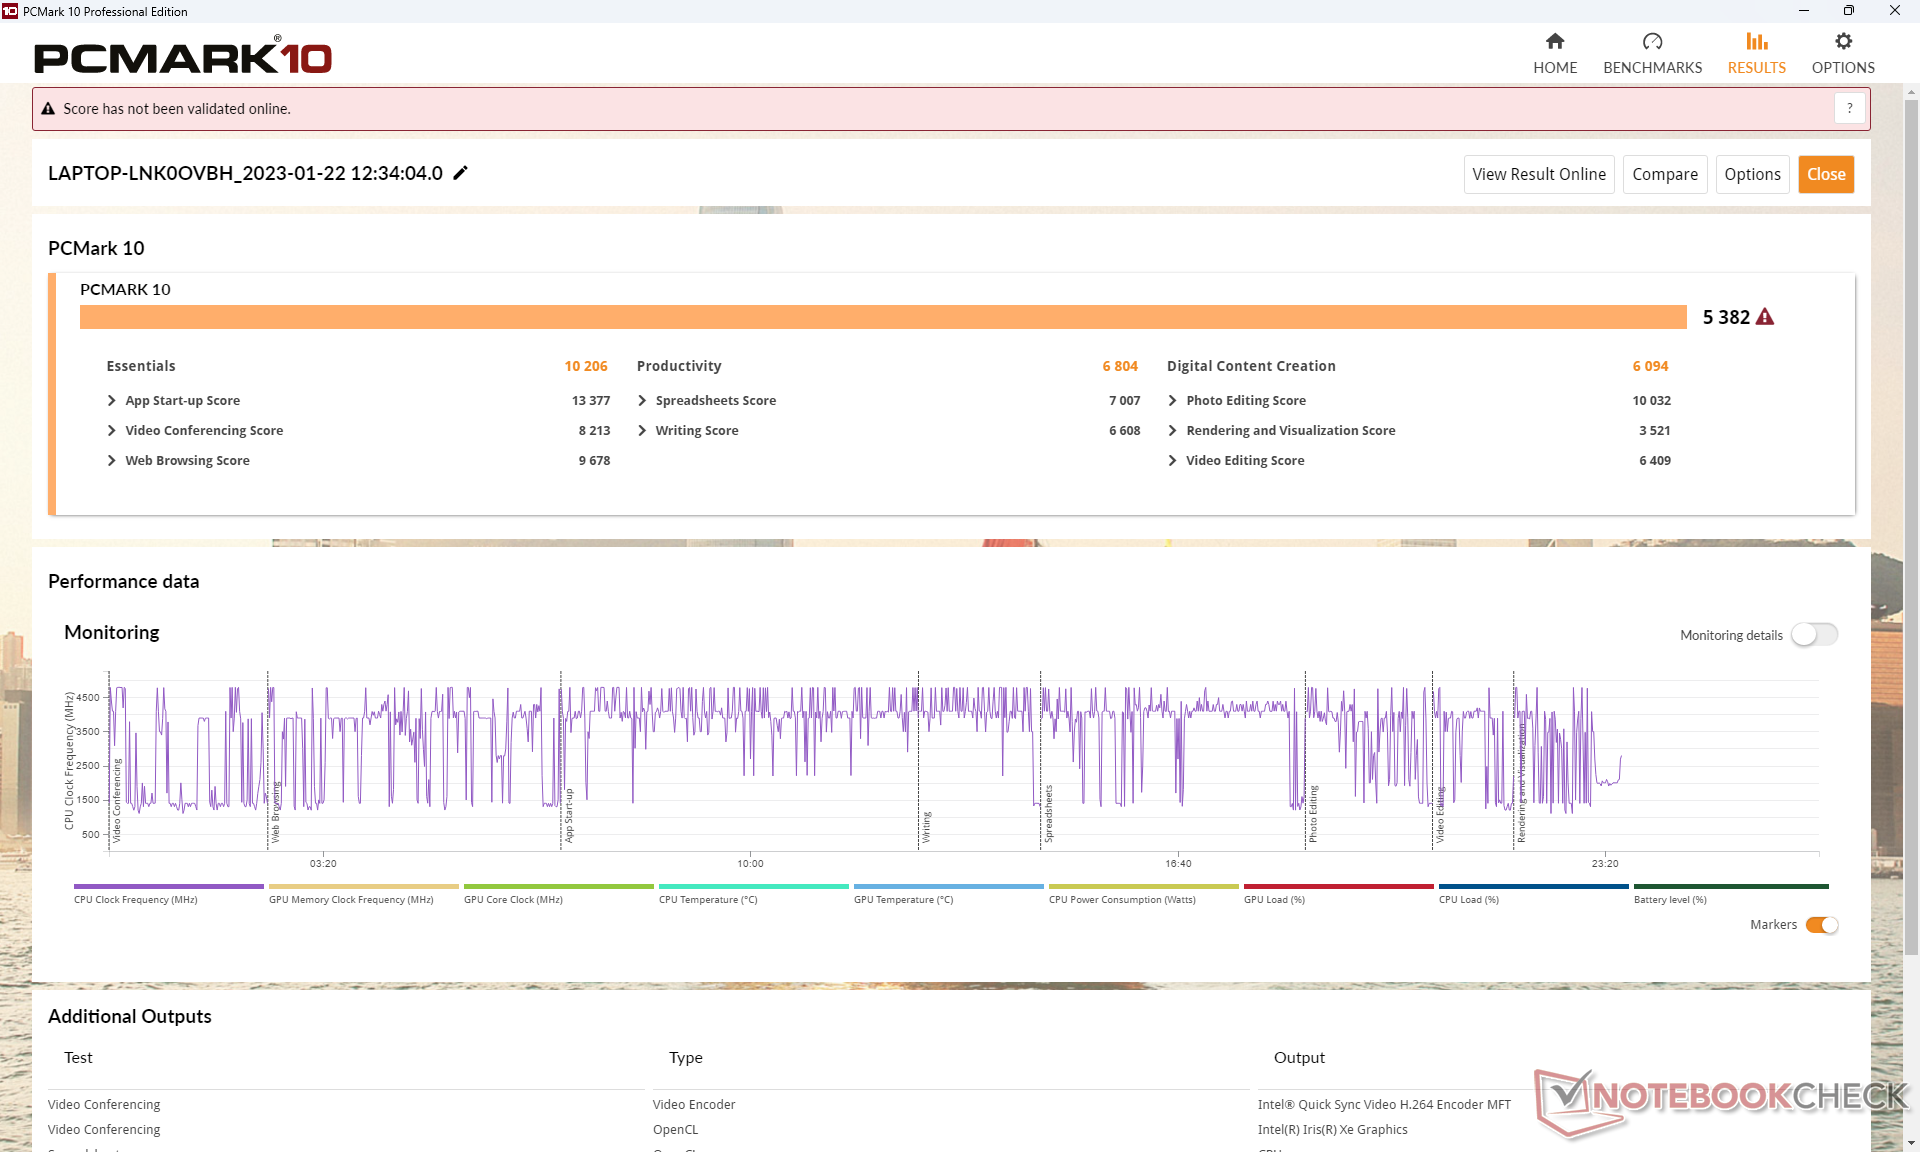
Les résultats moyens de PCMark se situent entre les SKUs à base de Core i5, plus lents, et ceux à base de Ryzen 5, plus rapides, comme le montre le tableau comparatif ci-dessous. Le SKU AMD est nettement en avance dans le subtest Productivité, probablement en raison de ses performances multithread plus rapides et de son GPU intégré par rapport aux SKU Intel.
CrossMark: Overall | Productivity | Creativity | Responsiveness
| PCMark 10 / Score | |
| Huawei MateBook 16s i7 | |
| Lenovo ThinkPad T16 G1 21CH004MGE | |
| HP EliteBook 865 G9 | |
| Moyenne Intel Core i7-1270P, Intel Iris Xe Graphics G7 96EUs (5382 - 5647, n=2) | |
| Lenovo ThinkPad T16 Gen 1 Core i7-1270P | |
| LG Gram 16Z90Q | |
| Lenovo ThinkPad T16 G1 21BWS00200 | |
| PCMark 10 / Essentials | |
| Huawei MateBook 16s i7 | |
| Moyenne Intel Core i7-1270P, Intel Iris Xe Graphics G7 96EUs (10206 - 11224, n=2) | |
| Lenovo ThinkPad T16 Gen 1 Core i7-1270P | |
| LG Gram 16Z90Q | |
| Lenovo ThinkPad T16 G1 21CH004MGE | |
| Lenovo ThinkPad T16 G1 21BWS00200 | |
| HP EliteBook 865 G9 | |
| PCMark 10 / Productivity | |
| Lenovo ThinkPad T16 G1 21CH004MGE | |
| HP EliteBook 865 G9 | |
| Huawei MateBook 16s i7 | |
| Moyenne Intel Core i7-1270P, Intel Iris Xe Graphics G7 96EUs (6804 - 6805, n=2) | |
| Lenovo ThinkPad T16 Gen 1 Core i7-1270P | |
| LG Gram 16Z90Q | |
| Lenovo ThinkPad T16 G1 21BWS00200 | |
| PCMark 10 / Digital Content Creation | |
| Huawei MateBook 16s i7 | |
| HP EliteBook 865 G9 | |
| Lenovo ThinkPad T16 G1 21CH004MGE | |
| Moyenne Intel Core i7-1270P, Intel Iris Xe Graphics G7 96EUs (6094 - 6398, n=2) | |
| Lenovo ThinkPad T16 Gen 1 Core i7-1270P | |
| LG Gram 16Z90Q | |
| Lenovo ThinkPad T16 G1 21BWS00200 | |
| CrossMark / Overall | |
| Huawei MateBook 16s i7 | |
| Moyenne Intel Core i7-1270P, Intel Iris Xe Graphics G7 96EUs (1585 - 1712, n=2) | |
| Lenovo ThinkPad T16 Gen 1 Core i7-1270P | |
| Apple MacBook Pro 16 2021 M1 Pro | |
| Lenovo ThinkPad T16 G1 21CH004MGE | |
| Lenovo ThinkPad T16 G1 21BWS00200 | |
| HP EliteBook 865 G9 | |
| CrossMark / Productivity | |
| Huawei MateBook 16s i7 | |
| Moyenne Intel Core i7-1270P, Intel Iris Xe Graphics G7 96EUs (1567 - 1636, n=2) | |
| Lenovo ThinkPad T16 Gen 1 Core i7-1270P | |
| Lenovo ThinkPad T16 G1 21CH004MGE | |
| Lenovo ThinkPad T16 G1 21BWS00200 | |
| HP EliteBook 865 G9 | |
| Apple MacBook Pro 16 2021 M1 Pro | |
| CrossMark / Creativity | |
| Apple MacBook Pro 16 2021 M1 Pro | |
| Huawei MateBook 16s i7 | |
| Moyenne Intel Core i7-1270P, Intel Iris Xe Graphics G7 96EUs (1684 - 1839, n=2) | |
| Lenovo ThinkPad T16 Gen 1 Core i7-1270P | |
| Lenovo ThinkPad T16 G1 21CH004MGE | |
| Lenovo ThinkPad T16 G1 21BWS00200 | |
| HP EliteBook 865 G9 | |
| CrossMark / Responsiveness | |
| Huawei MateBook 16s i7 | |
| Moyenne Intel Core i7-1270P, Intel Iris Xe Graphics G7 96EUs (1365 - 1584, n=2) | |
| Lenovo ThinkPad T16 Gen 1 Core i7-1270P | |
| Lenovo ThinkPad T16 G1 21BWS00200 | |
| Lenovo ThinkPad T16 G1 21CH004MGE | |
| HP EliteBook 865 G9 | |
| Apple MacBook Pro 16 2021 M1 Pro | |
| PCMark 10 Score | 5382 points | |
Aide | ||
| AIDA64 / Memory Copy | |
| Huawei MateBook 16s i7 | |
| LG Gram 16Z90Q | |
| Moyenne Intel Core i7-1270P (39471 - 62300, n=2) | |
| Lenovo ThinkPad T16 G1 21CH004MGE | |
| Lenovo ThinkPad T16 Gen 1 Core i7-1270P | |
| HP EliteBook 865 G9 | |
| AIDA64 / Memory Read | |
| Huawei MateBook 16s i7 | |
| LG Gram 16Z90Q | |
| Moyenne Intel Core i7-1270P (42289 - 72572, n=2) | |
| Lenovo ThinkPad T16 Gen 1 Core i7-1270P | |
| Lenovo ThinkPad T16 G1 21CH004MGE | |
| HP EliteBook 865 G9 | |
| AIDA64 / Memory Write | |
| LG Gram 16Z90Q | |
| Huawei MateBook 16s i7 | |
| Moyenne Intel Core i7-1270P (43051 - 61340, n=2) | |
| Lenovo ThinkPad T16 G1 21CH004MGE | |
| Lenovo ThinkPad T16 Gen 1 Core i7-1270P | |
| HP EliteBook 865 G9 | |
| AIDA64 / Memory Latency | |
| Lenovo ThinkPad T16 G1 21CH004MGE | |
| Huawei MateBook 16s i7 | |
| LG Gram 16Z90Q | |
| HP EliteBook 865 G9 | |
| Lenovo ThinkPad T16 Gen 1 Core i7-1270P | |
| Moyenne Intel Core i7-1270P (89.3 - 89.3, n=2) | |
* ... Moindre est la valeur, meilleures sont les performances
Latence DPC
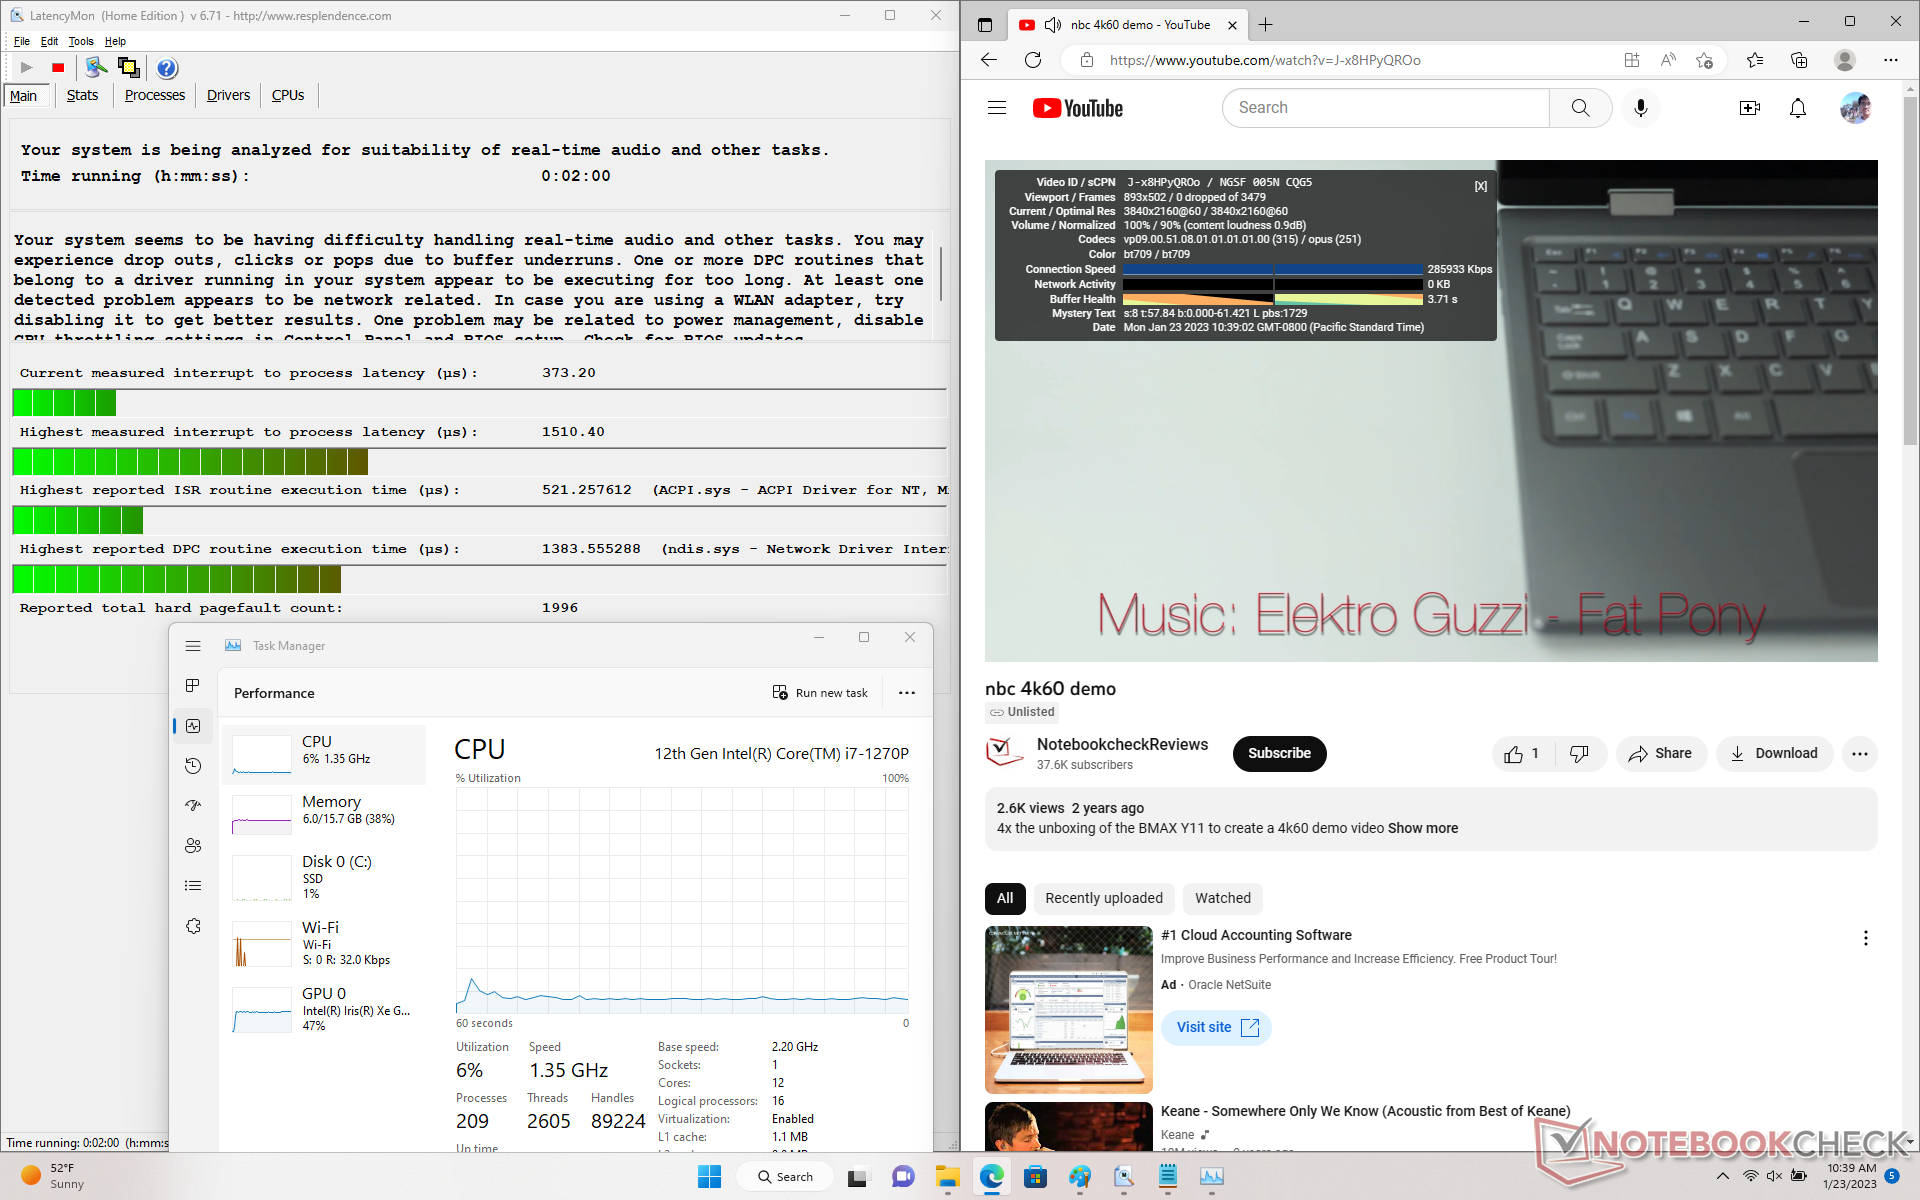
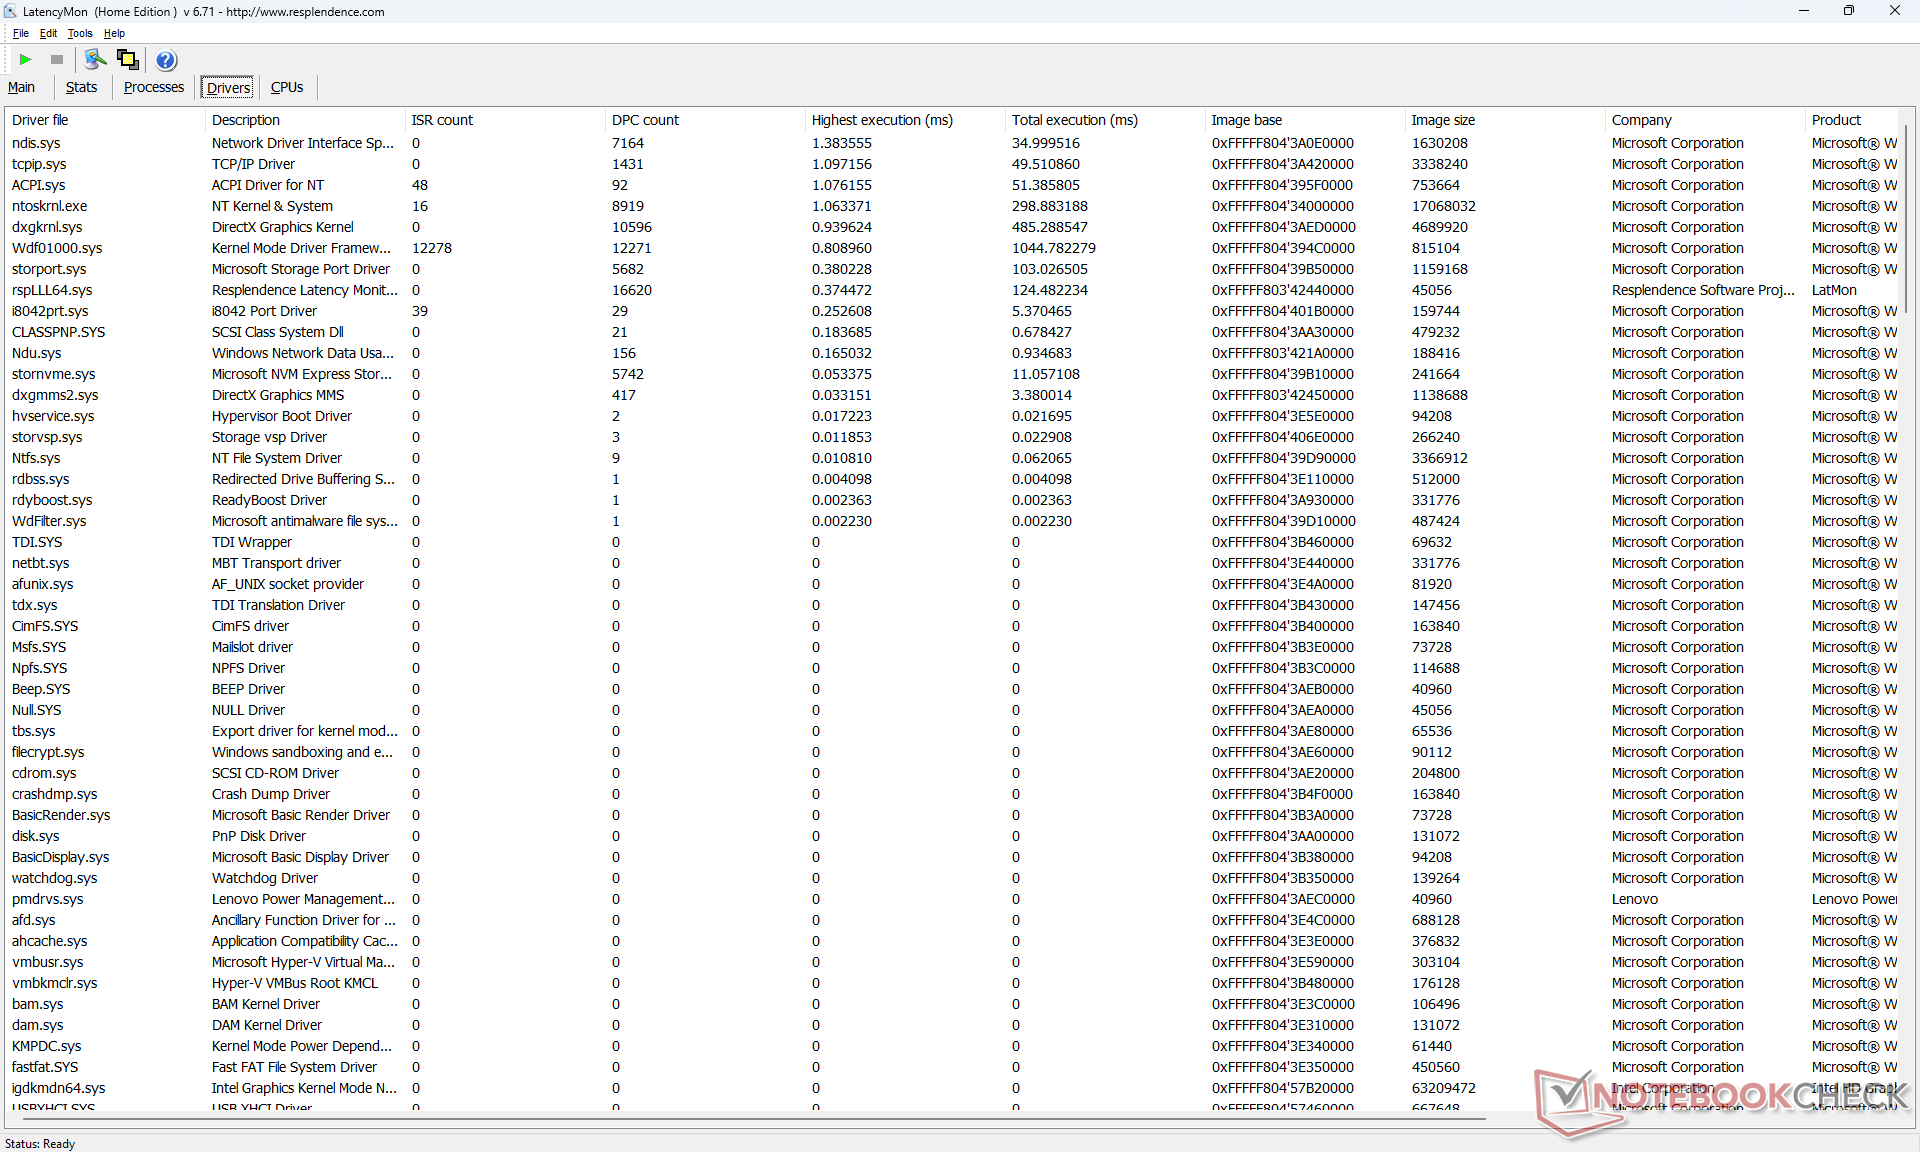
LatencyMon montre des problèmes de DPC lors de l'ouverture de plusieurs onglets de navigateur de notre page d'accueil. la lecture de vidéos 4K à 60 FPS est par ailleurs parfaite et sans aucune image perdue.
| DPC Latencies / LatencyMon - interrupt to process latency (max), Web, Youtube, Prime95 | |
| LG Gram 16Z90Q | |
| Lenovo ThinkPad T16 Gen 1 Core i7-1270P | |
| Lenovo ThinkPad T16 G1 21CH004MGE | |
| HP EliteBook 865 G9 | |
* ... Moindre est la valeur, meilleures sont les performances
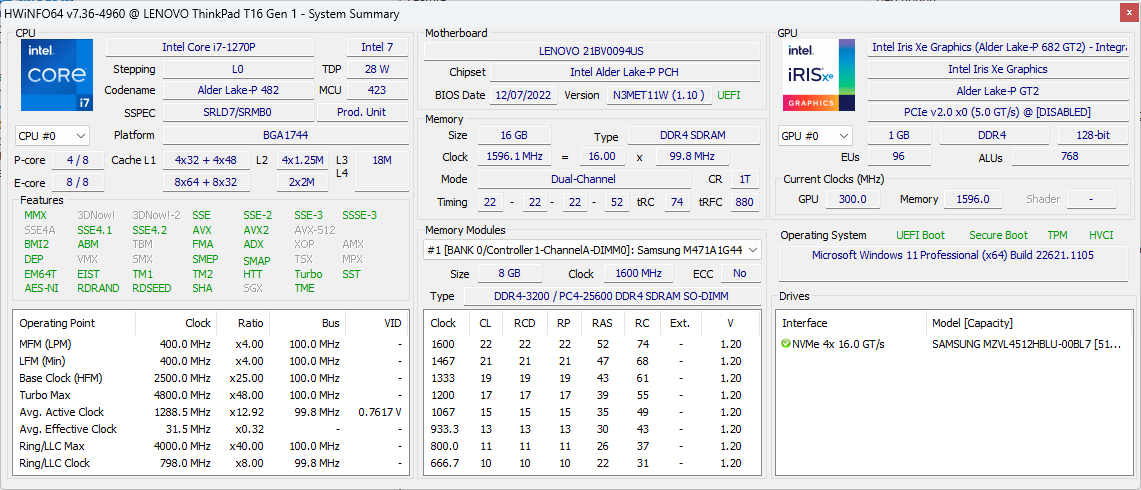
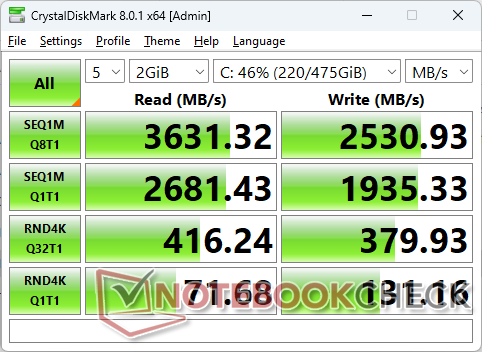
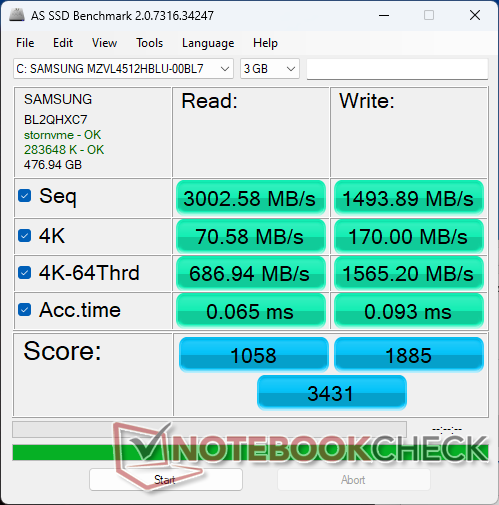
Périphériques de stockage
Notre unité est livrée avec un disque dur de 512 GB Samsung PM9B1 PCIe4 x4 NVMe SSD au lieu du Samsung PM9A1, plus courant. La série PM9B1 offre des taux de transfert inférieurs de près de la moitié ; les taux de lecture séquentielle atteignent ~3600 Mo/s sur notre unité, contre ~6300 Mo/s sur le LG Gram 16 LG Gram 16 avec le Samsung PM9A1.

| Drive Performance rating - Percent | |
| Huawei MateBook 16s i7 | |
| LG Gram 16Z90Q | |
| Lenovo ThinkPad T16 G1 21CH004MGE | |
| Lenovo ThinkPad T16 Gen 1 Core i7-1270P | |
| HP EliteBook 865 G9 | |
* ... Moindre est la valeur, meilleures sont les performances
Disk Throttling: DiskSpd Read Loop, Queue Depth 8
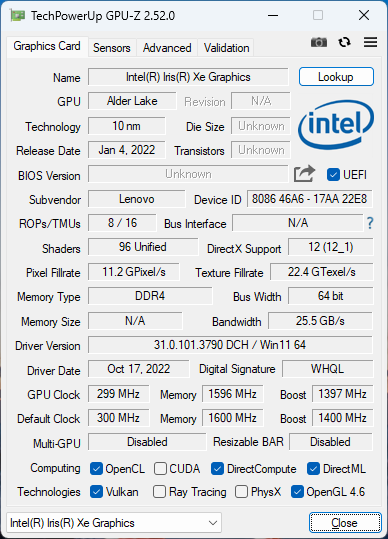
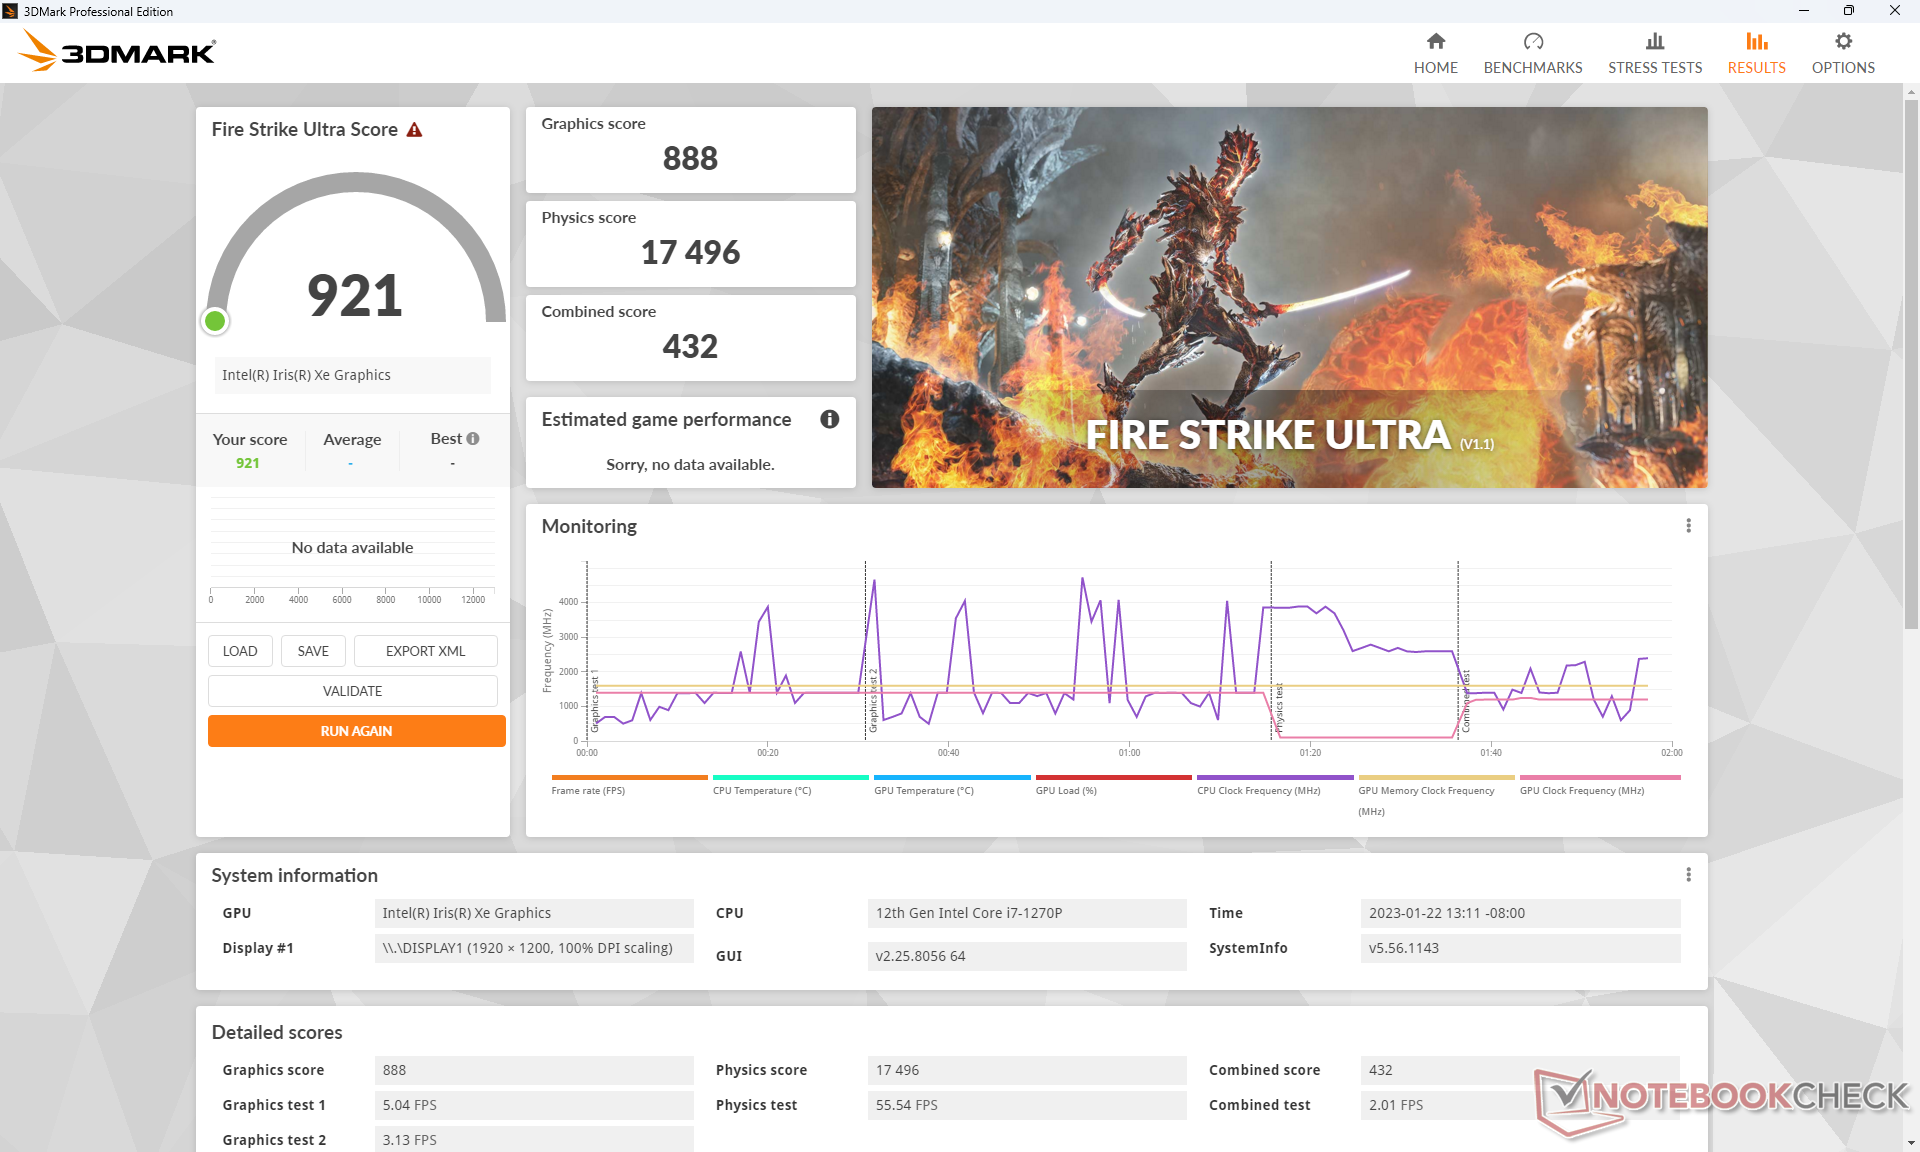
Performances du GPU - freinées par la lenteur de la RAM
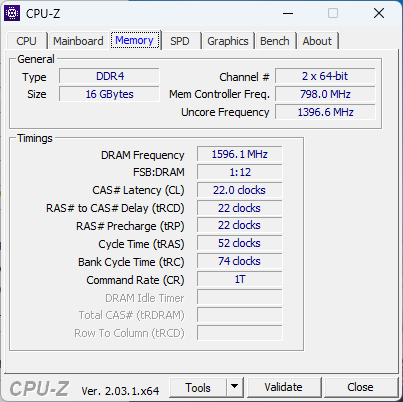
Les performances graphiques sont environ 10 % plus faibles que celles de l'ordinateur portable moyen de notre base de données équipé de la même technologie Iris Xe 96 EUs GPU. Cette sous-performance peut être en partie attribuée à la lenteur de la RAM DDR4-3200 par rapport à la plupart des autres ordinateurs portables équipés de CPU Intel de 12e génération. Le site LG Gram 16par exemple, est livré avec une RAM LPDDR5-5200 plus rapide en standard.
En outre, les performances graphiques peuvent devenir progressivement plus lentes lors de l'exécution de charges élevées pendant des périodes prolongées. Lorsque l'ordinateur tourne au ralenti sur Witcher 3 à des paramètres bas, par exemple, les taux de trame chutent de 84 FPS au début du test à ~70 FPS après quelques minutes, comme le montre le graphique ci-dessous, en raison du potentiel limité de Turbo Boost du système.
Mise à niveau vers le Ryzen 5 Radeon 660M SKU du même modèle augmentera les performances graphiques d'environ 10 à 15 pour cent.
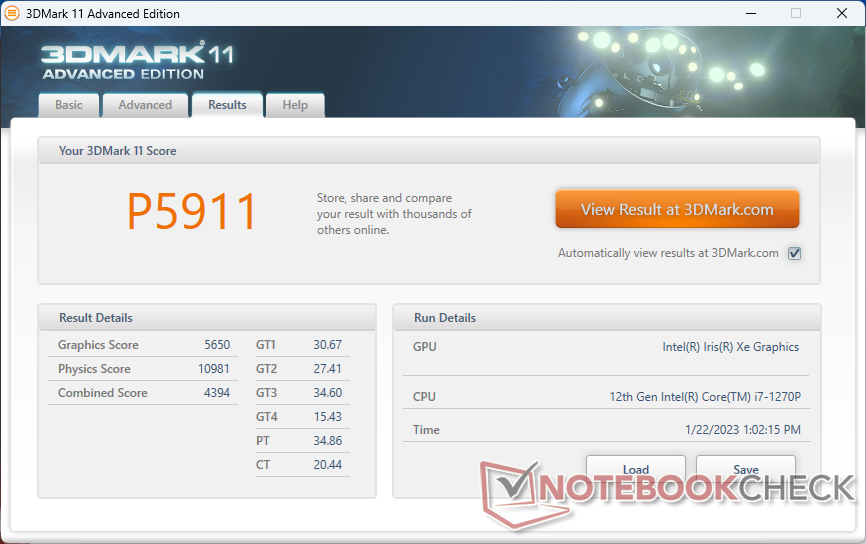
| 3DMark 11 Performance | 5911 points | |
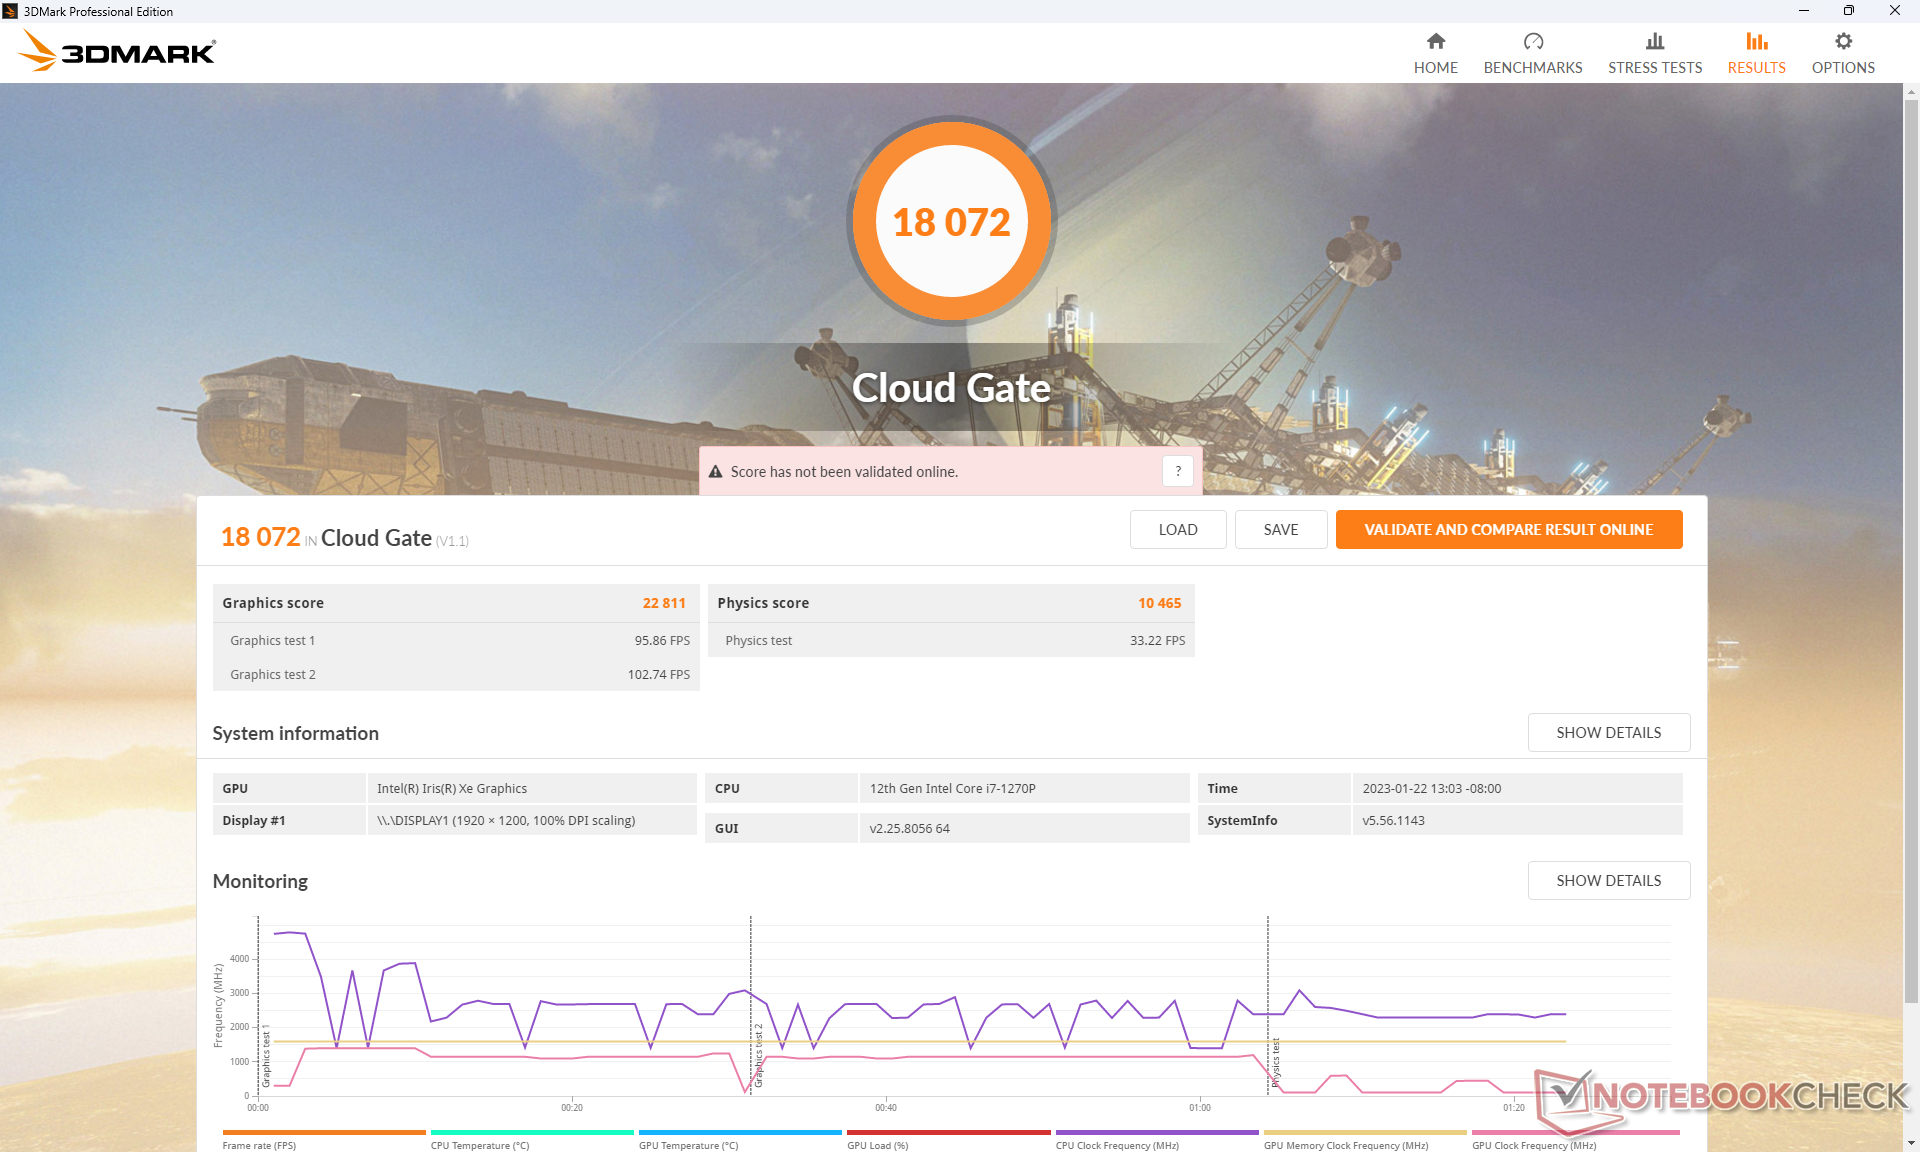
| 3DMark Cloud Gate Standard Score | 18072 points | |
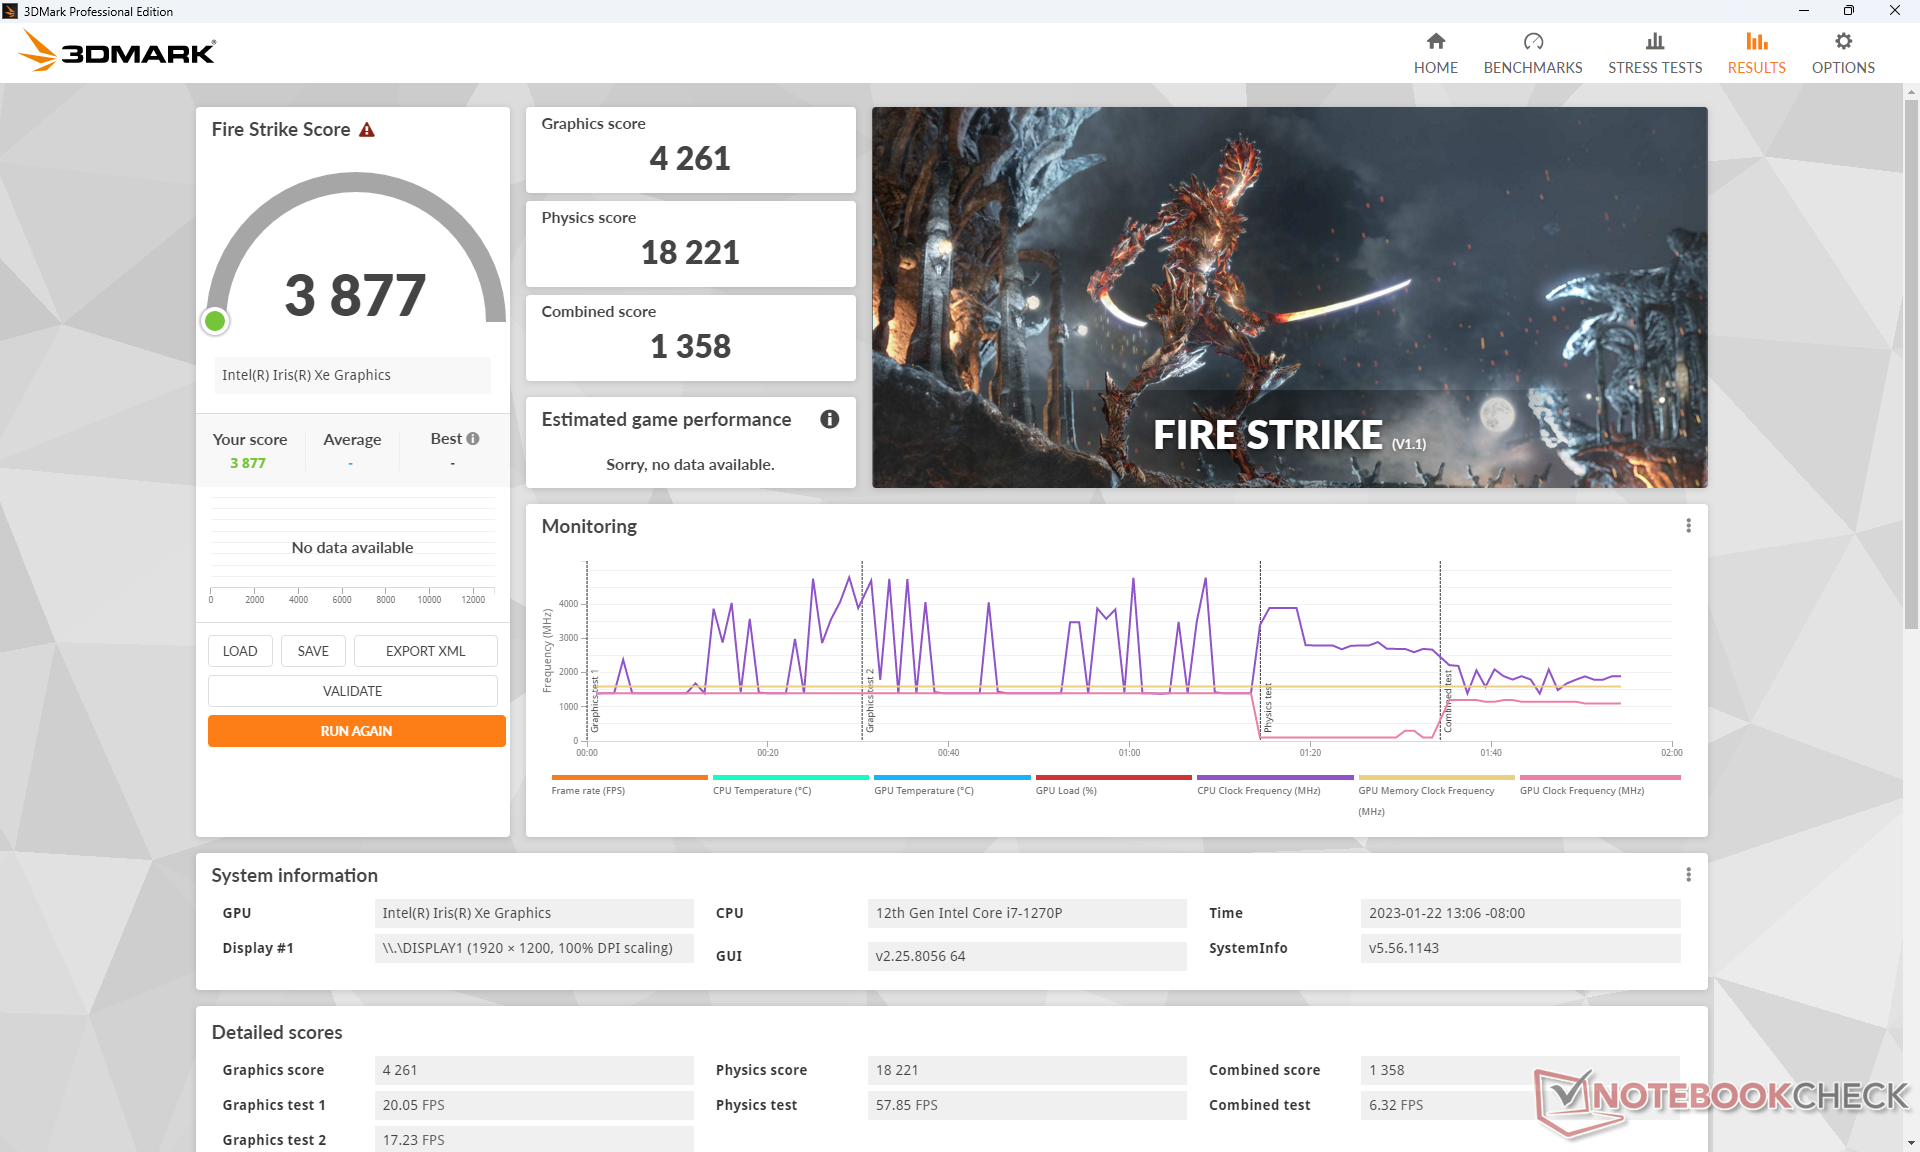
| 3DMark Fire Strike Score | 3877 points | |
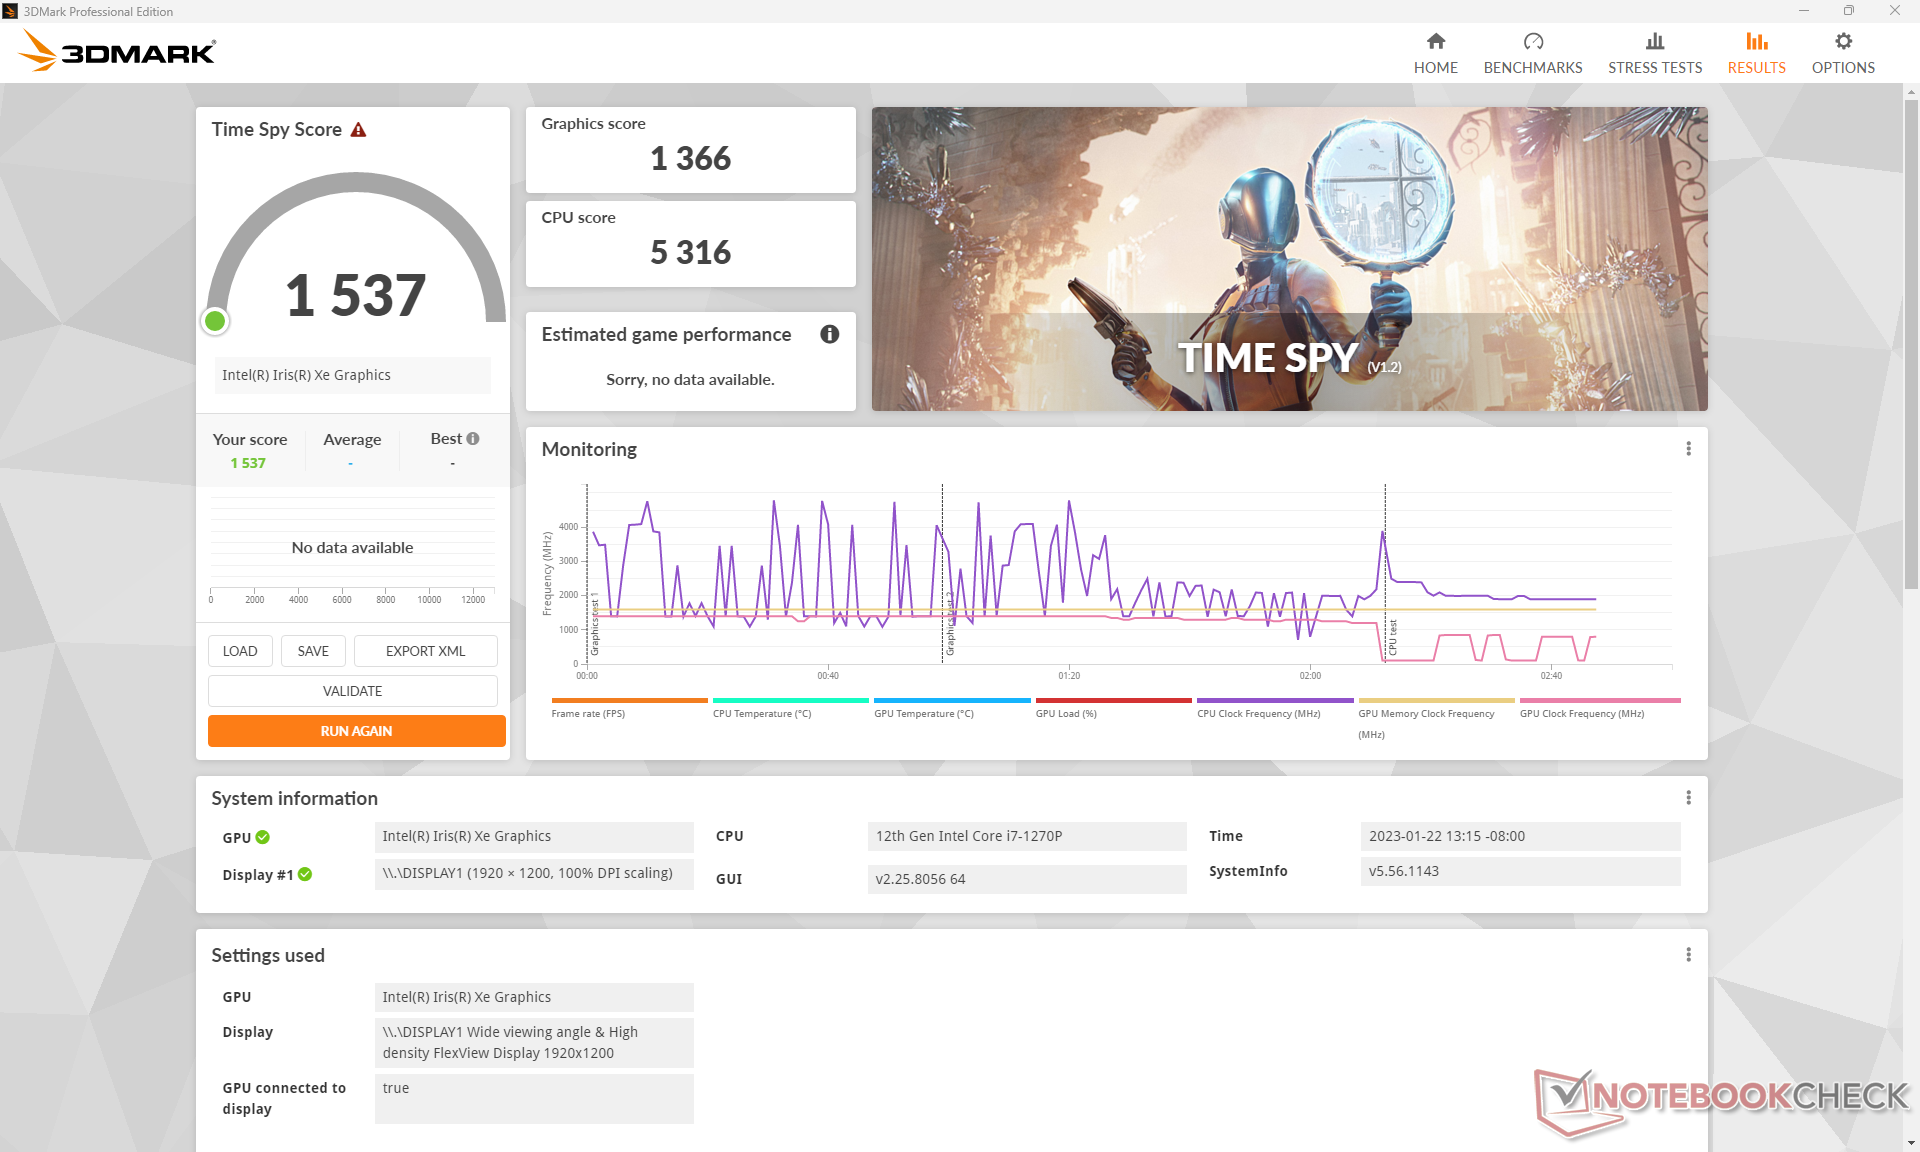
| 3DMark Time Spy Score | 1537 points | |
Aide | ||
| Cyberpunk 2077 1.6 - 1920x1080 Low Preset | |
| Lenovo Yoga 7-14ARB G7 | |
| Asus ZenBook Flip 15 Q508U | |
| Moyenne Intel Iris Xe Graphics G7 96EUs (13 - 25.9, n=42) | |
| Lenovo ThinkPad T16 Gen 1 Core i7-1270P | |
Witcher 3 FPS Chart
| Bas | Moyen | Élevé | Ultra | |
|---|---|---|---|---|
| GTA V (2015) | 97.8 | 74.8 | 14.1 | 4.85 |
| The Witcher 3 (2015) | 82.1 | 50.4 | 24.4 | 11.2 |
| Dota 2 Reborn (2015) | 110.6 | 71.9 | 48.9 | 44.6 |
| Final Fantasy XV Benchmark (2018) | 31.4 | 16.8 | 12.6 | |
| X-Plane 11.11 (2018) | 39.7 | 31.9 | 29.2 | |
| Strange Brigade (2018) | 79.2 | 29.8 | 24.2 | 19.1 |
| Cyberpunk 2077 1.6 (2022) | 18.4 |
Émissions
Bruit du système - presque toujours silencieux
Le bruit du ventilateur est l'un des plus faibles pour la taille de l'écran, ce qui explique en partie la faible durabilité des performances du processeur dans les benchmarks ci-dessus. Le ventilateur interne est à peine audible, même lorsqu'il est réglé sur le mode Performance et qu'il exécute des charges exigeantes comme des jeux. Il peut atteindre 34 dB(A) pendant de courtes périodes de temps en temps avant de revenir au silence, mais même ce maximum est plus silencieux que sur la plupart des ordinateurs portables. Le siteHP EliteBook 865 G9 adopte une approche similaire du bruit du ventilateur pour une expérience utilisateur très silencieuse. Il n'y a donc guère de raison de sélectionner un mode autre que Performance pour le contrôle du bruit du ventilateur.
Degré de la nuisance sonore
| Au repos |
| 24.7 / 24.7 / 24.7 dB(A) |
| Fortement sollicité |
| 24.5 / 34.4 dB(A) |
 | ||
30 dB silencieux 40 dB(A) audible 50 dB(A) bruyant |
||
min: | ||
| Lenovo ThinkPad T16 Gen 1 Core i7-1270P Iris Xe G7 96EUs, i7-1270P, Samsung PM9B1 512GB MZAL4512HBLU | Lenovo ThinkPad T16 G1 21CH004MGE Radeon 660M, R5 PRO 6650U, Micron 2450 512GB MTFDKBA512TFK | LG Gram 16Z90Q Iris Xe G7 96EUs, i7-1260P, Samsung PM9A1 MZVL21T0HCLR | HP EliteBook 865 G9 Radeon 680M, R7 PRO 6850U, Samsung PM991 MZVLQ512HBLU | Huawei MateBook 16s i7 Iris Xe G7 96EUs, i7-12700H, Silicon Motion PCIe-8 SSD | Apple MacBook Pro 16 2021 M1 Pro M1 Pro 16-Core GPU, M1 Pro, Apple SSD AP1024R | |
|---|---|---|---|---|---|---|
| Noise | -6% | -21% | -1% | -15% | -3% | |
| arrêt / environnement * (dB) | 24.7 | 23.1 6% | 25 -1% | 23 7% | 24 3% | 24.7 -0% |
| Idle Minimum * (dB) | 24.7 | 23.1 6% | 26 -5% | 23 7% | 24 3% | 24.7 -0% |
| Idle Average * (dB) | 24.7 | 23.1 6% | 27 -9% | 23 7% | 25.2 -2% | 24.7 -0% |
| Idle Maximum * (dB) | 24.7 | 23.1 6% | 28 -13% | 23 7% | 27.2 -10% | 24.7 -0% |
| Load Average * (dB) | 24.5 | 25.4 -4% | 38 -55% | 29.1 -19% | 34.8 -42% | 26.1 -7% |
| Witcher 3 ultra * (dB) | 24.3 | 35.93 -48% | 37 -52% | 29.1 -20% | 34.8 -43% | |
| Load Maximum * (dB) | 34.4 | 39.1 -14% | 38 -10% | 32.9 4% | 39 -13% | 37.4 -9% |
* ... Moindre est la valeur, meilleures sont les performances
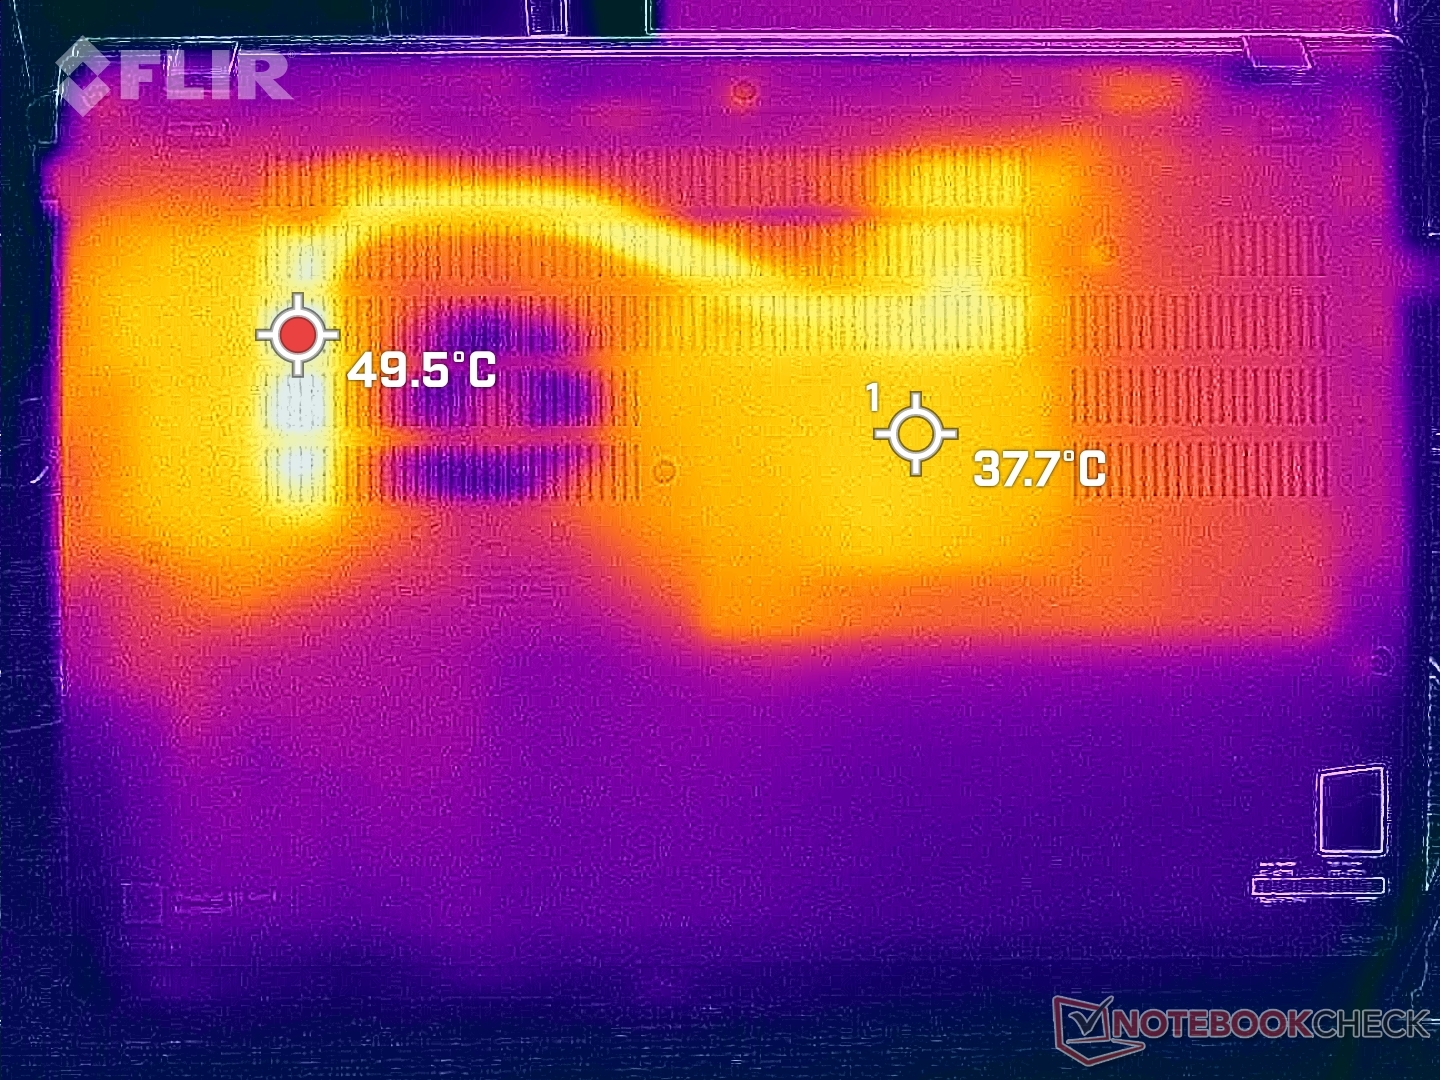
Température
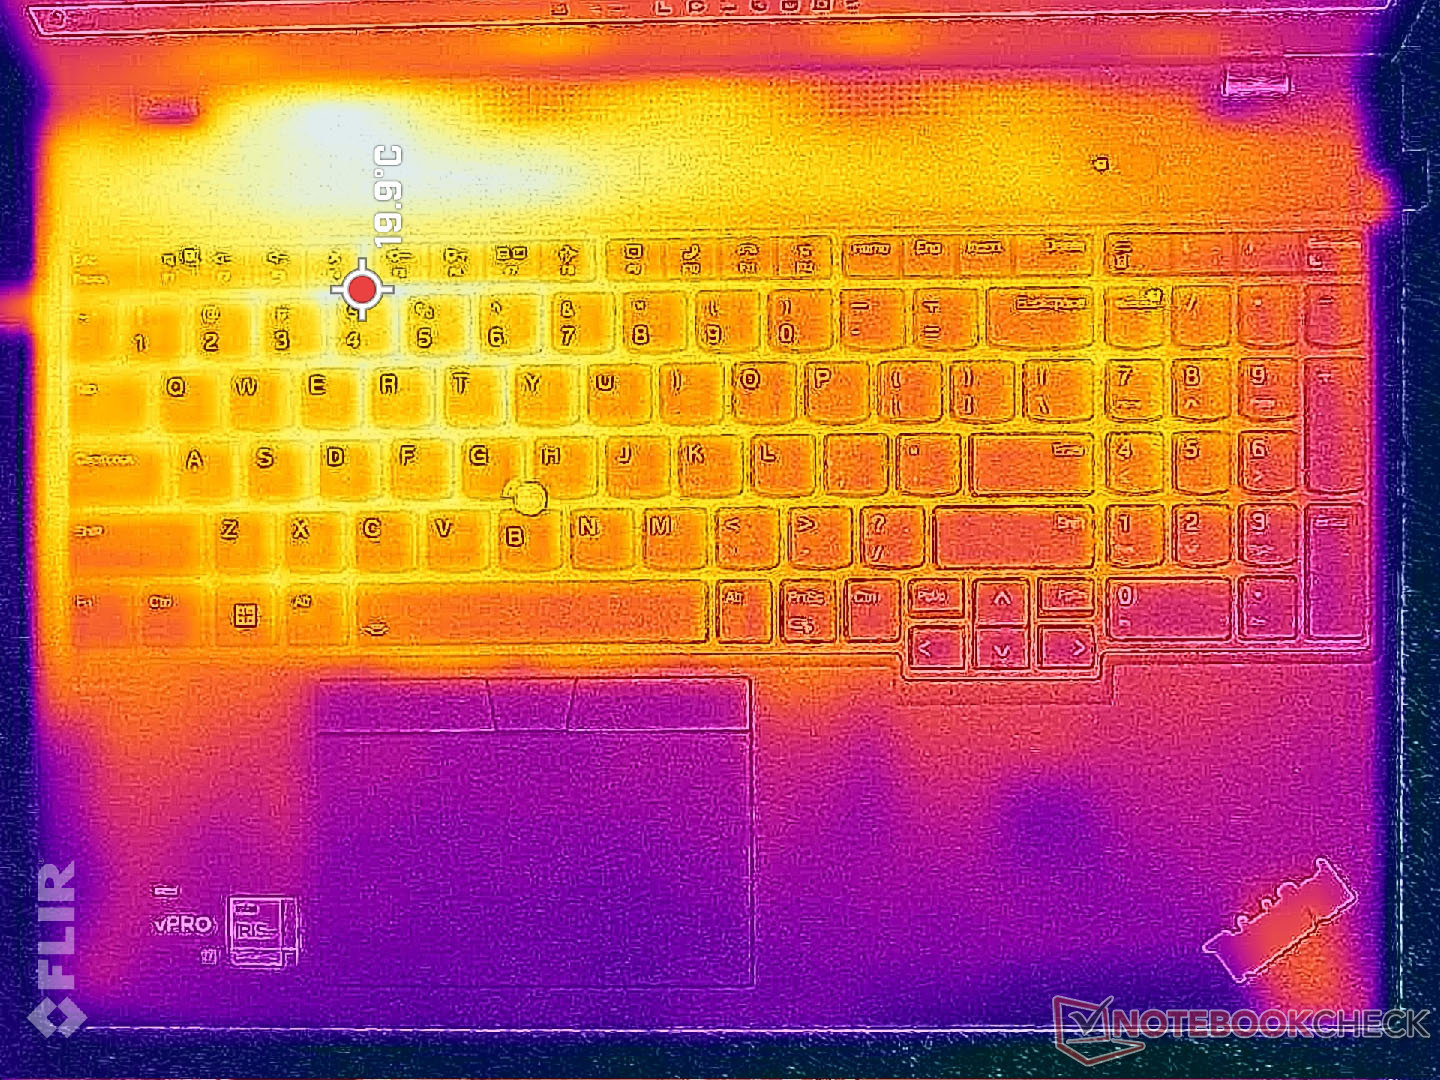
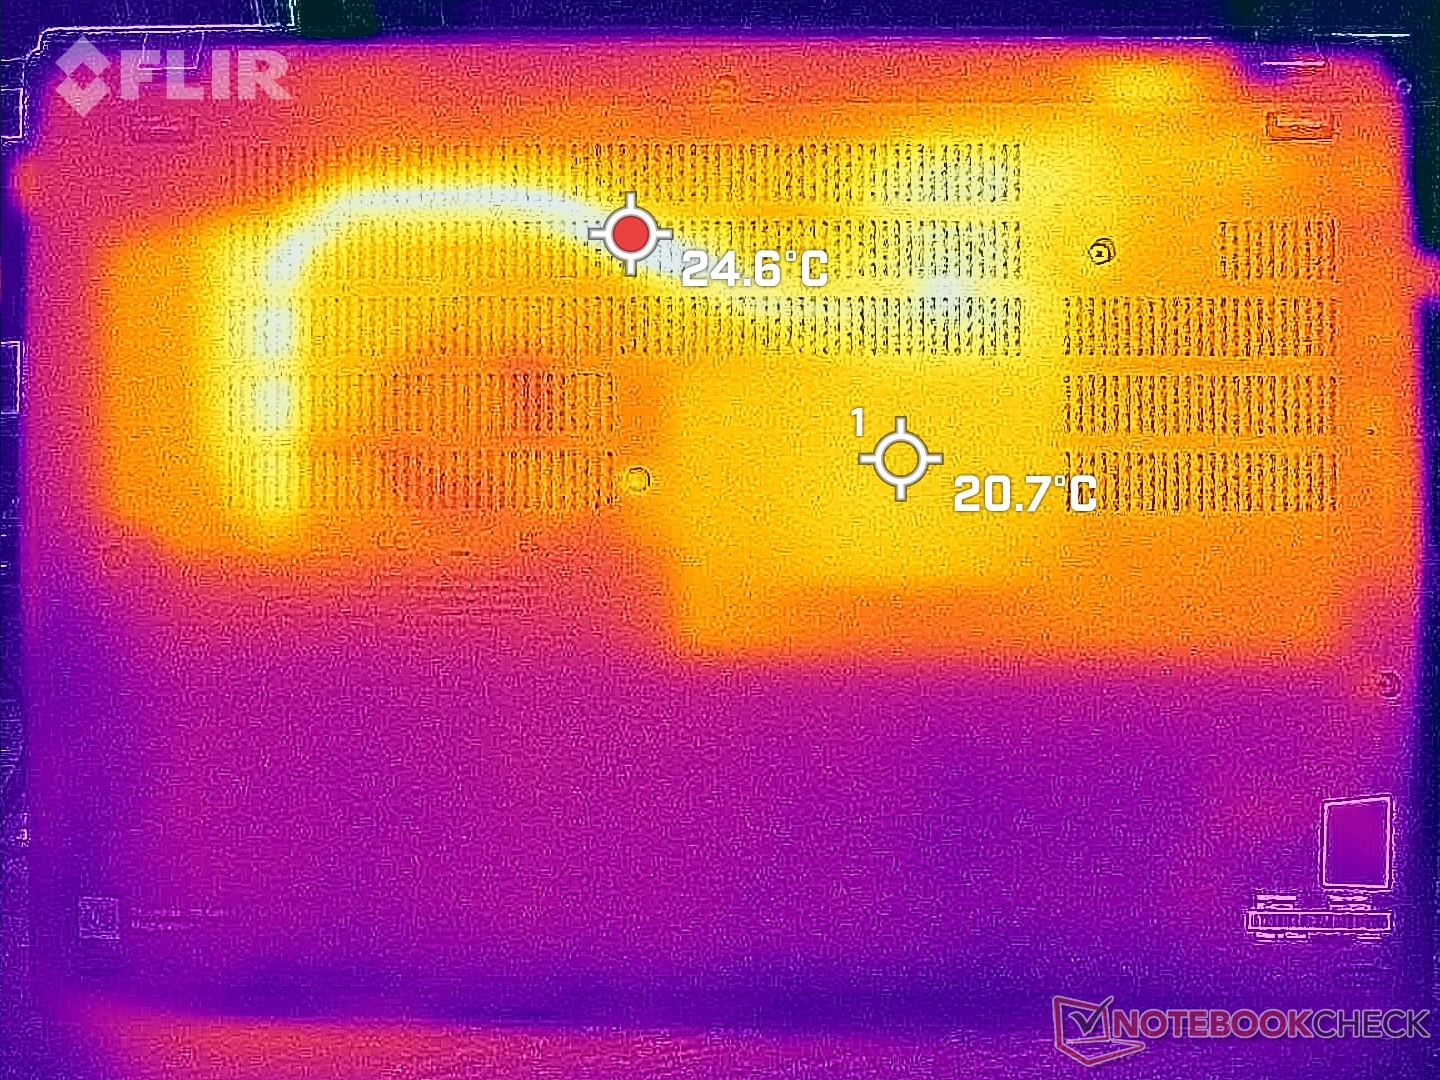
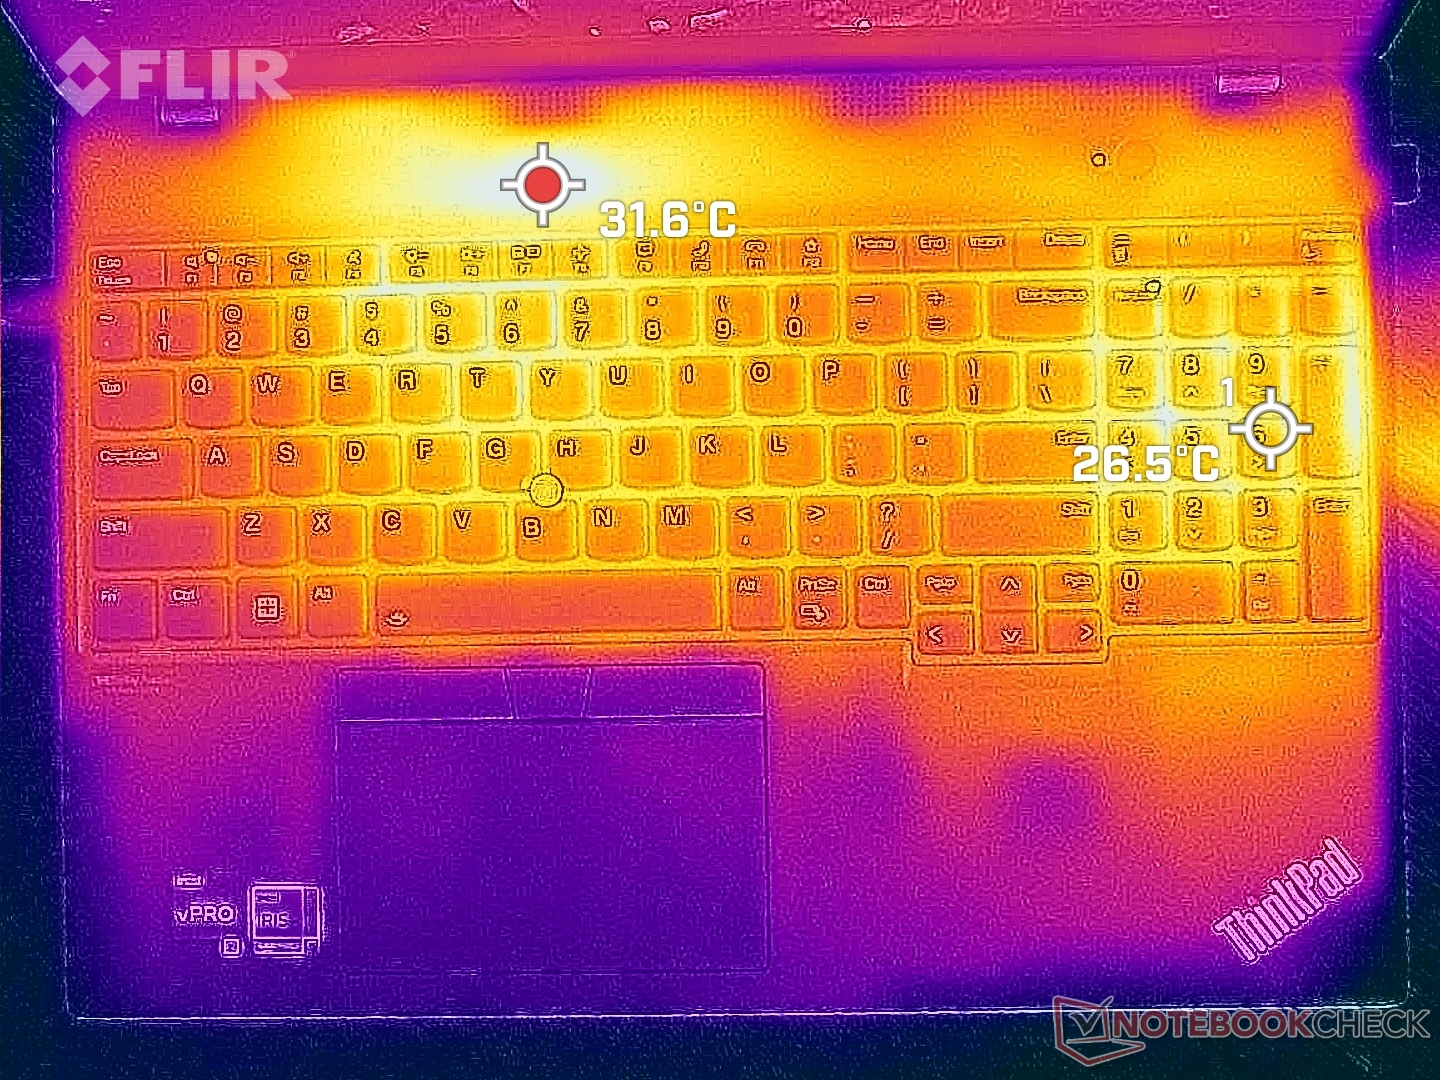
Les températures de surface sont beaucoup plus froides sur le plateau supérieur que sur le plateau inférieur. La température moyenne sur le clavier et les repose-poignets est d'environ 29°C lors d'une utilisation intensive, contre 36°C sur la surface inférieure. Ceci est en contraste avec la plupart des autres ordinateurs portables comme le LG Gram 16 où le centre du clavier peut atteindre 44 C pour être plus de 10 C plus chaud que sur notre ThinkPad T16 G1.
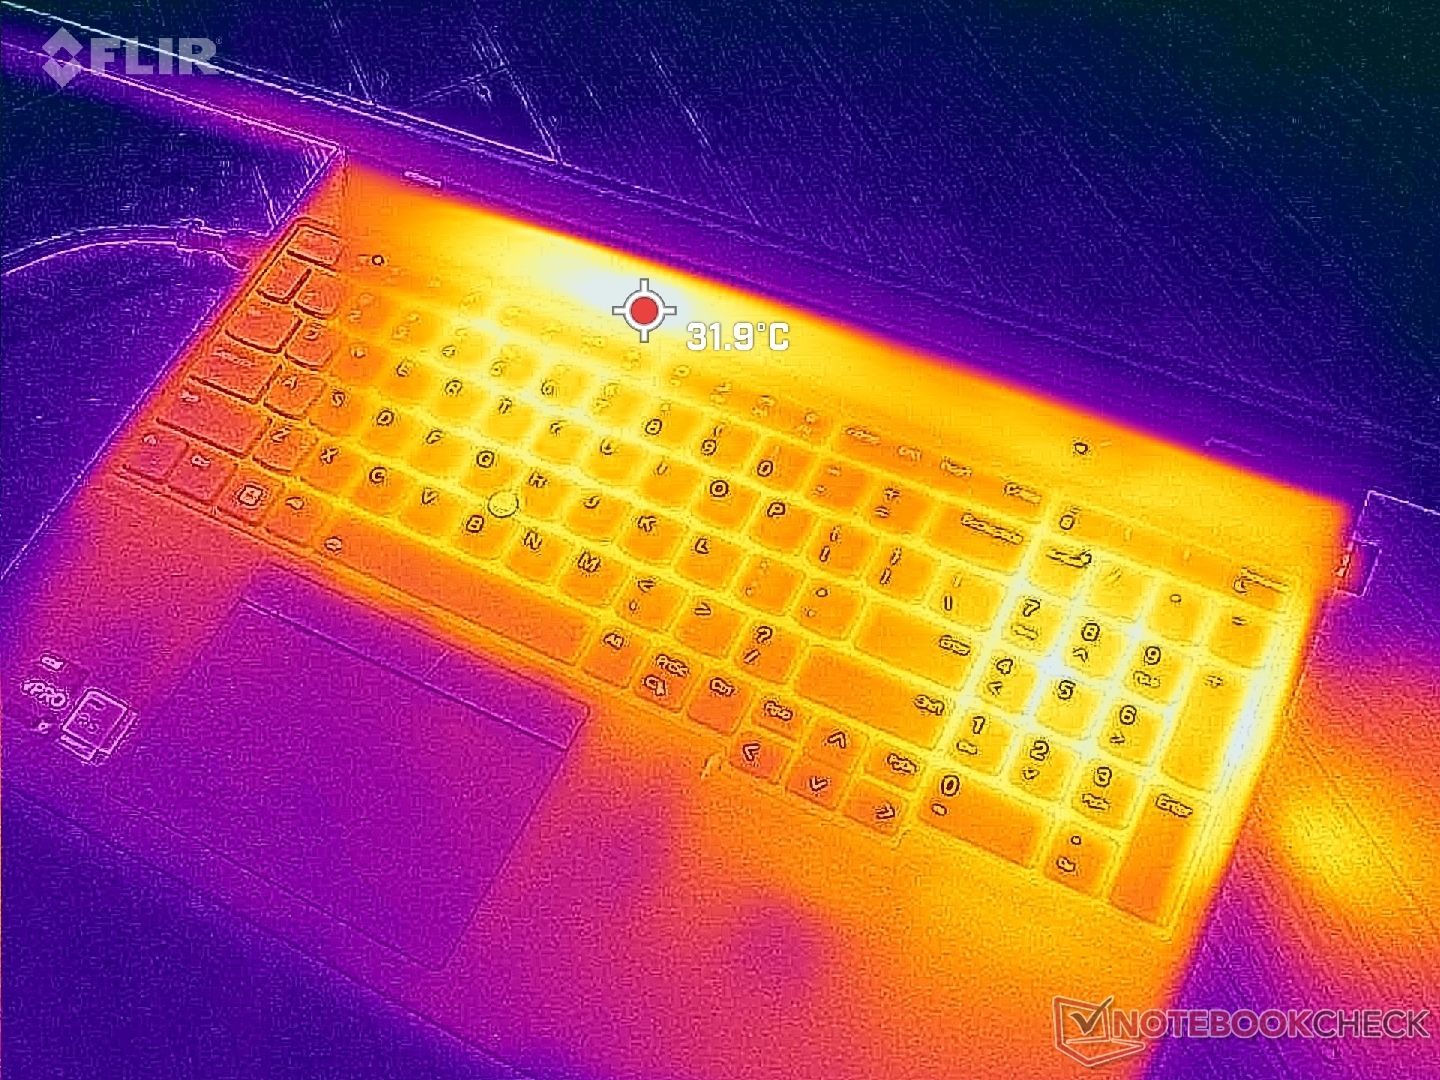
(+) La température maximale du côté supérieur est de 33.8 °C / 93 F, par rapport à la moyenne de 34.3 °C / 94 F, allant de 21.2 à 62.5 °C pour la classe Office.
(-) Le fond chauffe jusqu'à un maximum de 47 °C / 117 F, contre une moyenne de 36.8 °C / 98 F
(+) En utilisation inactive, la température moyenne du côté supérieur est de 22.6 °C / 73 F, par rapport à la moyenne du dispositif de 29.5 °C / 85 F.
(+) Les repose-poignets et le pavé tactile sont plus froids que la température de la peau avec un maximum de 24.6 °C / 76.3 F et sont donc froids au toucher.
(+) La température moyenne de la zone de l'appui-paume de dispositifs similaires était de 27.5 °C / 81.5 F (+2.9 °C / #5.2 F).
| Lenovo ThinkPad T16 Gen 1 Core i7-1270P Intel Core i7-1270P, Intel Iris Xe Graphics G7 96EUs | Lenovo ThinkPad T16 G1 21BWS00200 Intel Core i5-1240P, Intel Iris Xe Graphics G7 80EUs | LG Gram 16Z90Q Intel Core i7-1260P, Intel Iris Xe Graphics G7 96EUs | HP EliteBook 865 G9 AMD Ryzen 7 PRO 6850U, AMD Radeon 680M | Huawei MateBook 16s i7 Intel Core i7-12700H, Intel Iris Xe Graphics G7 96EUs | Apple MacBook Pro 16 2021 M1 Pro Apple M1 Pro, Apple M1 Pro 16-Core GPU | |
|---|---|---|---|---|---|---|
| Heat | -19% | -6% | 0% | -13% | 3% | |
| Maximum Upper Side * (°C) | 33.8 | 45 -33% | 45 -33% | 39.4 -17% | 40.9 -21% | 41 -21% |
| Maximum Bottom * (°C) | 47 | 42.8 9% | 43 9% | 47.6 -1% | 48.3 -3% | 39 17% |
| Idle Upper Side * (°C) | 24.6 | 33 -34% | 26 -6% | 23.6 4% | 29.2 -19% | 24 2% |
| Idle Bottom * (°C) | 28.2 | 33.6 -19% | 26 8% | 24.1 15% | 30.4 -8% | 24 15% |
* ... Moindre est la valeur, meilleures sont les performances
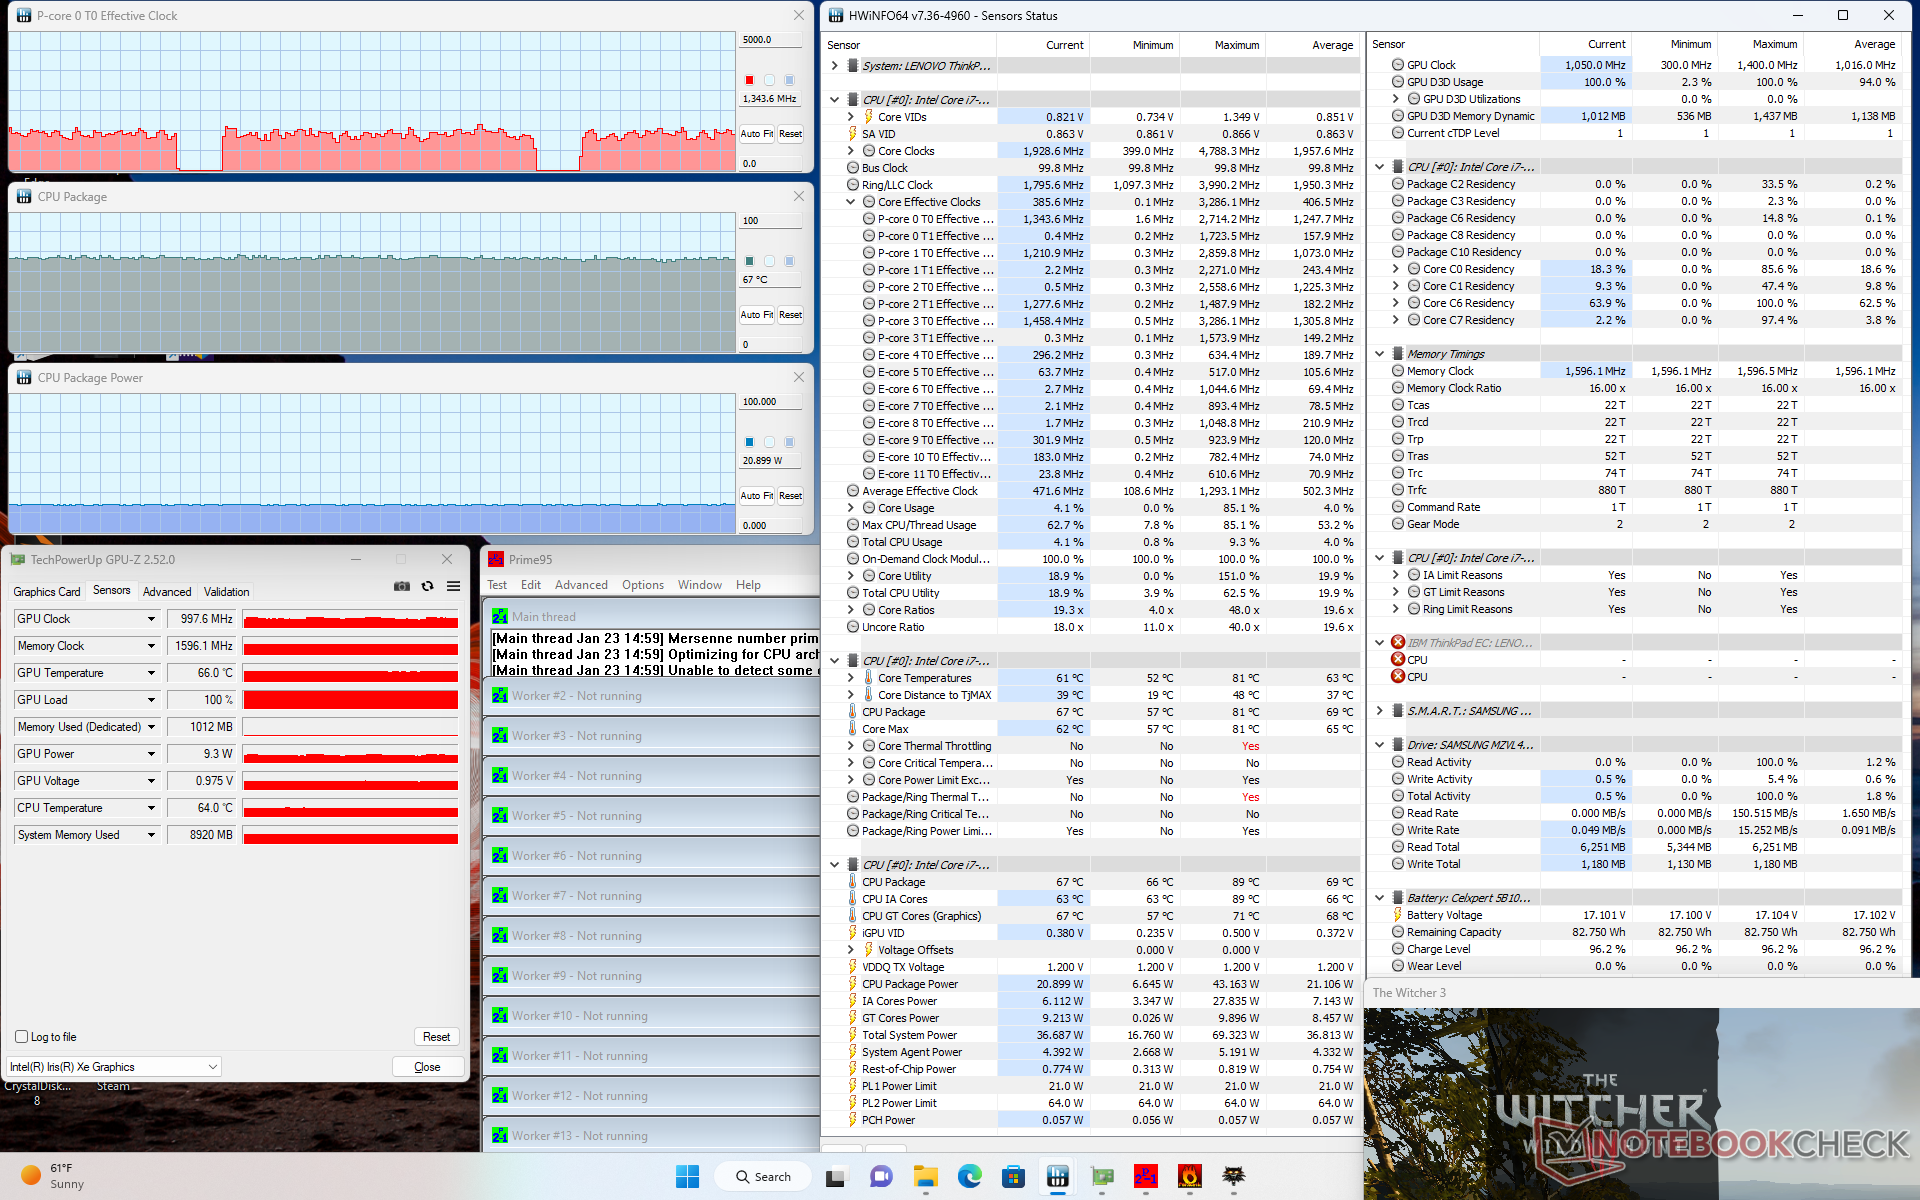
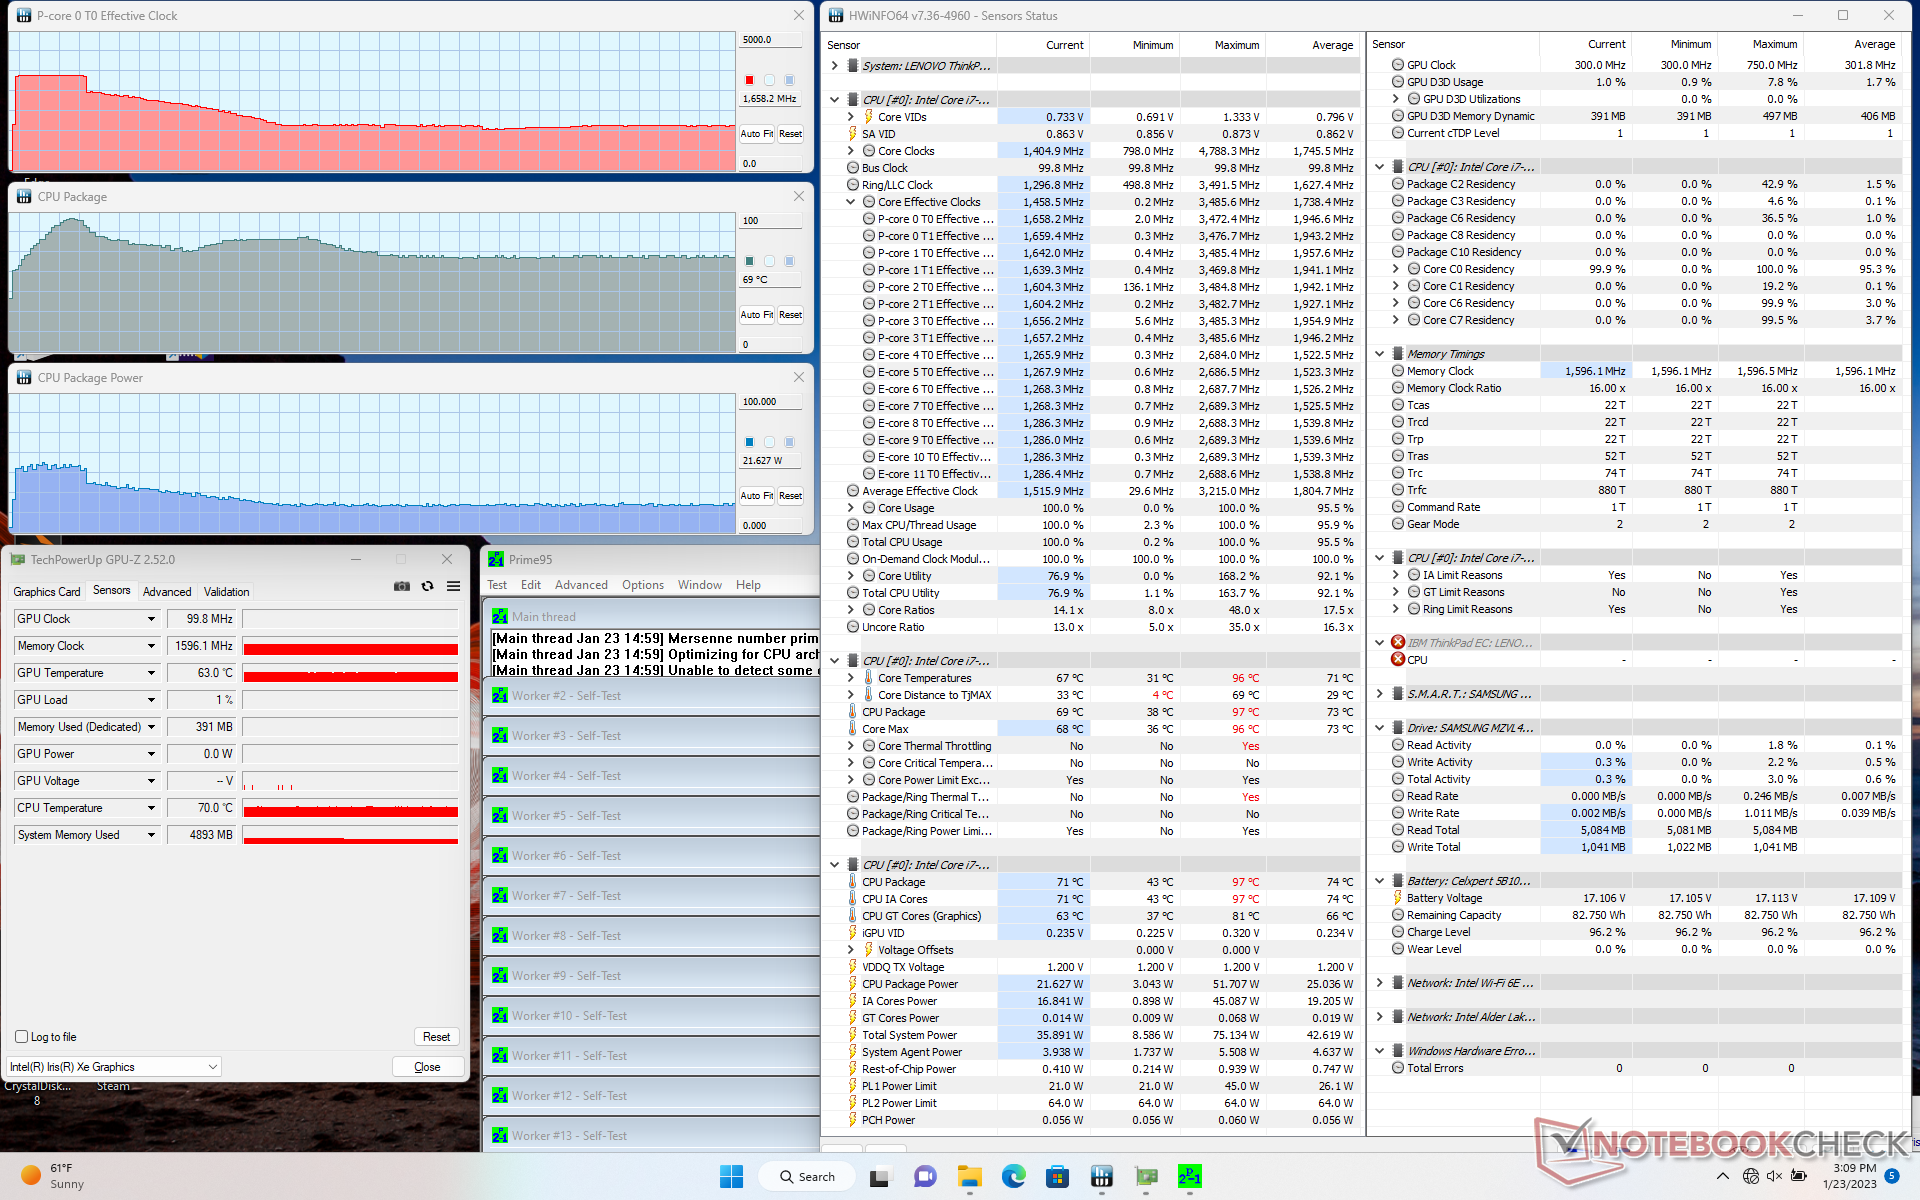
Test de stress
Les fortes baisses de performances lors de nos Witcher 3 et CineBench R15 xT ci-dessus peuvent être observées grâce à HWiNFO. Lors de l'exécution de Prime95, par exemple, les fréquences d'horloge du CPU et la consommation d'énergie de la carte peuvent atteindre 3,5 GHz et 48 W, respectivement. Cependant, lorsque la température du cœur atteint 97°C quelques secondes plus tard, les fréquences d'horloge et la consommation d'énergie de la carte commencent à diminuer régulièrement jusqu'à 1,7 GHz et 22 W, respectivement, afin de maintenir une température du cœur plus froide de 69°C. Le déploiement de ThrottleStop augmente la fréquence d'horloge stable à une plage plus élevée de 2 à 3 GHz, mais au prix de températures du cœur plus chaudes.
La fréquence d'horloge et la température du GPU en fonctionnement Witcher 3 se stabilisent à 998 MHz et 67 °C, respectivement, par rapport à 1100 MHz et 58 °C sur le plus petit HP Dragonfly Folio 13,5 pouces HP Dragonfly Folio 13.5 G3. Le fonctionnement sur batterie ne semble pas avoir d'impact sur les performances.
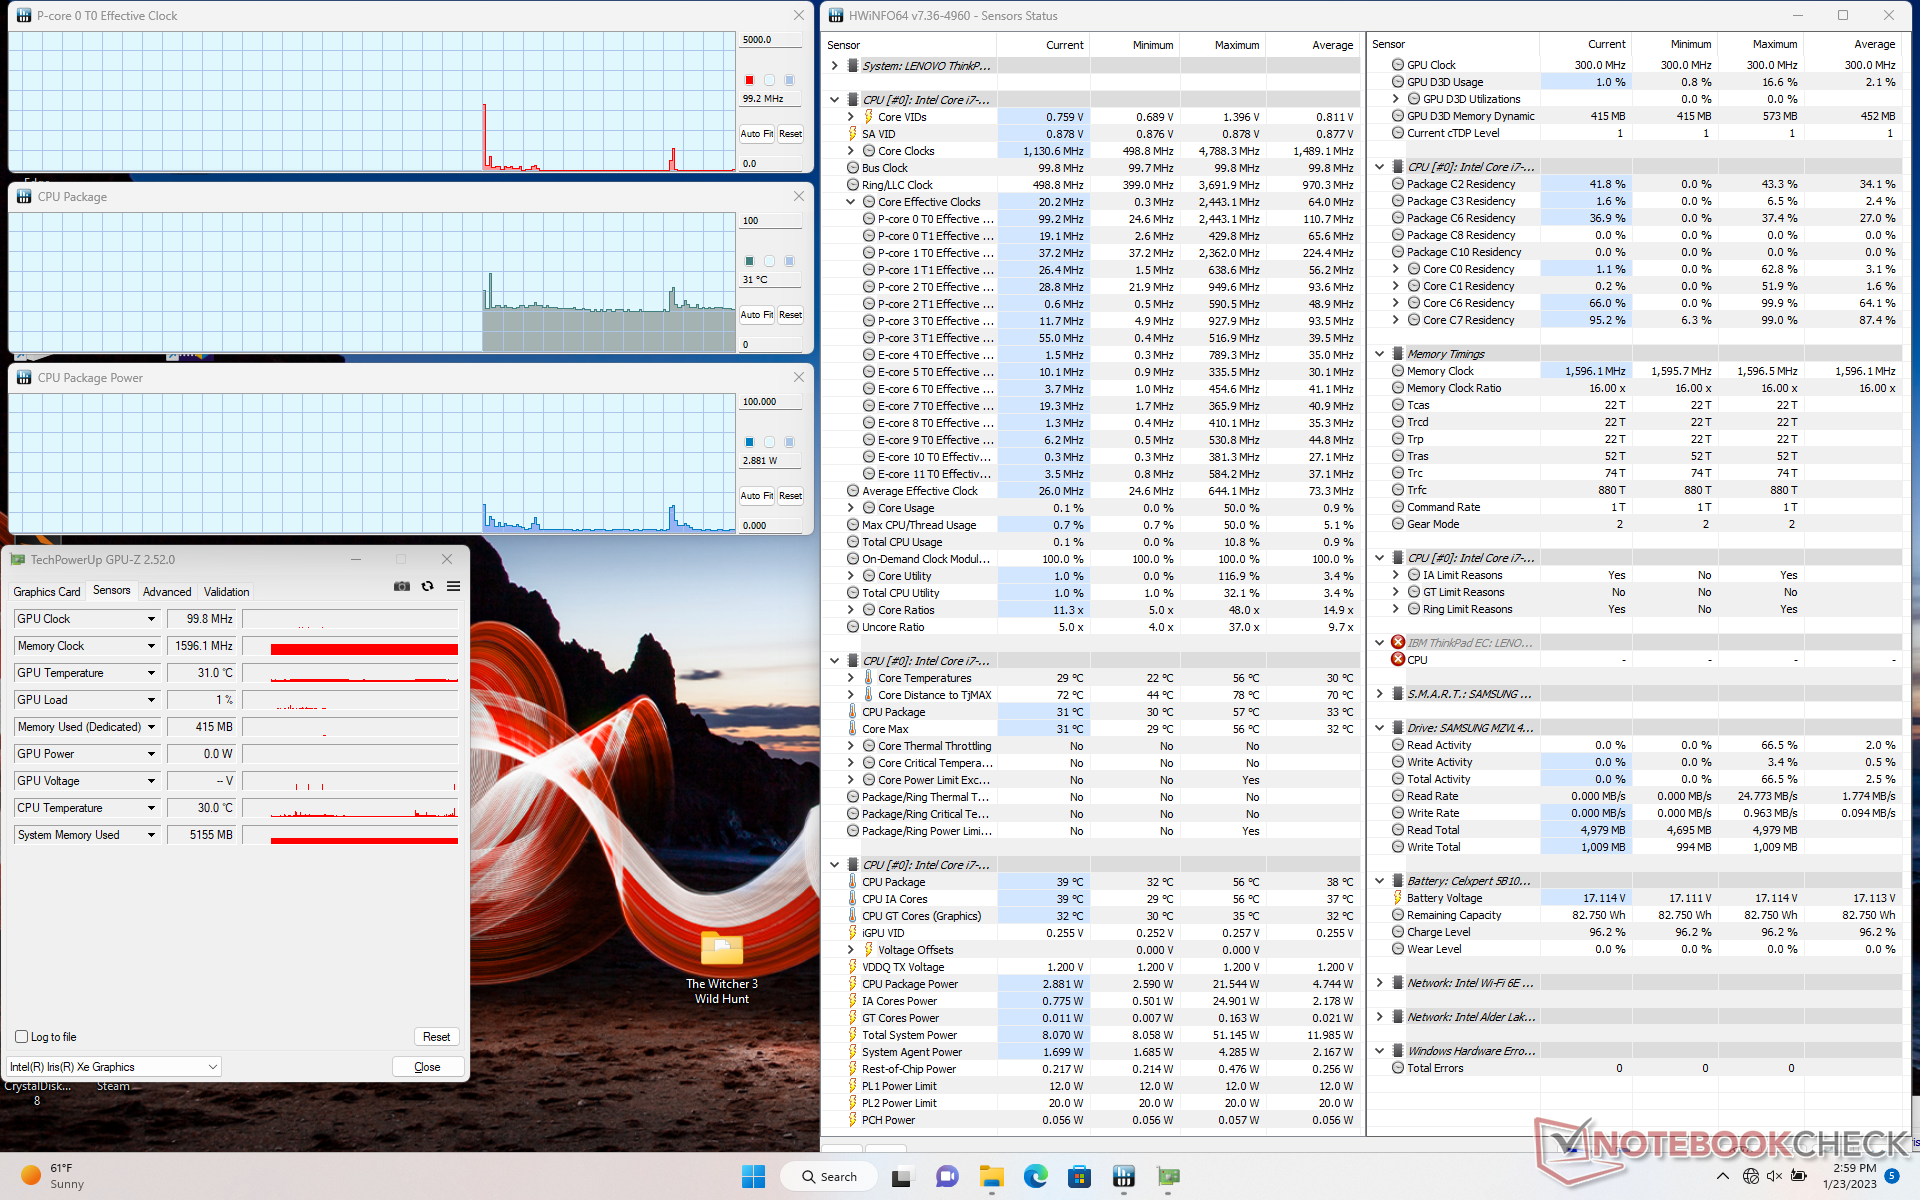
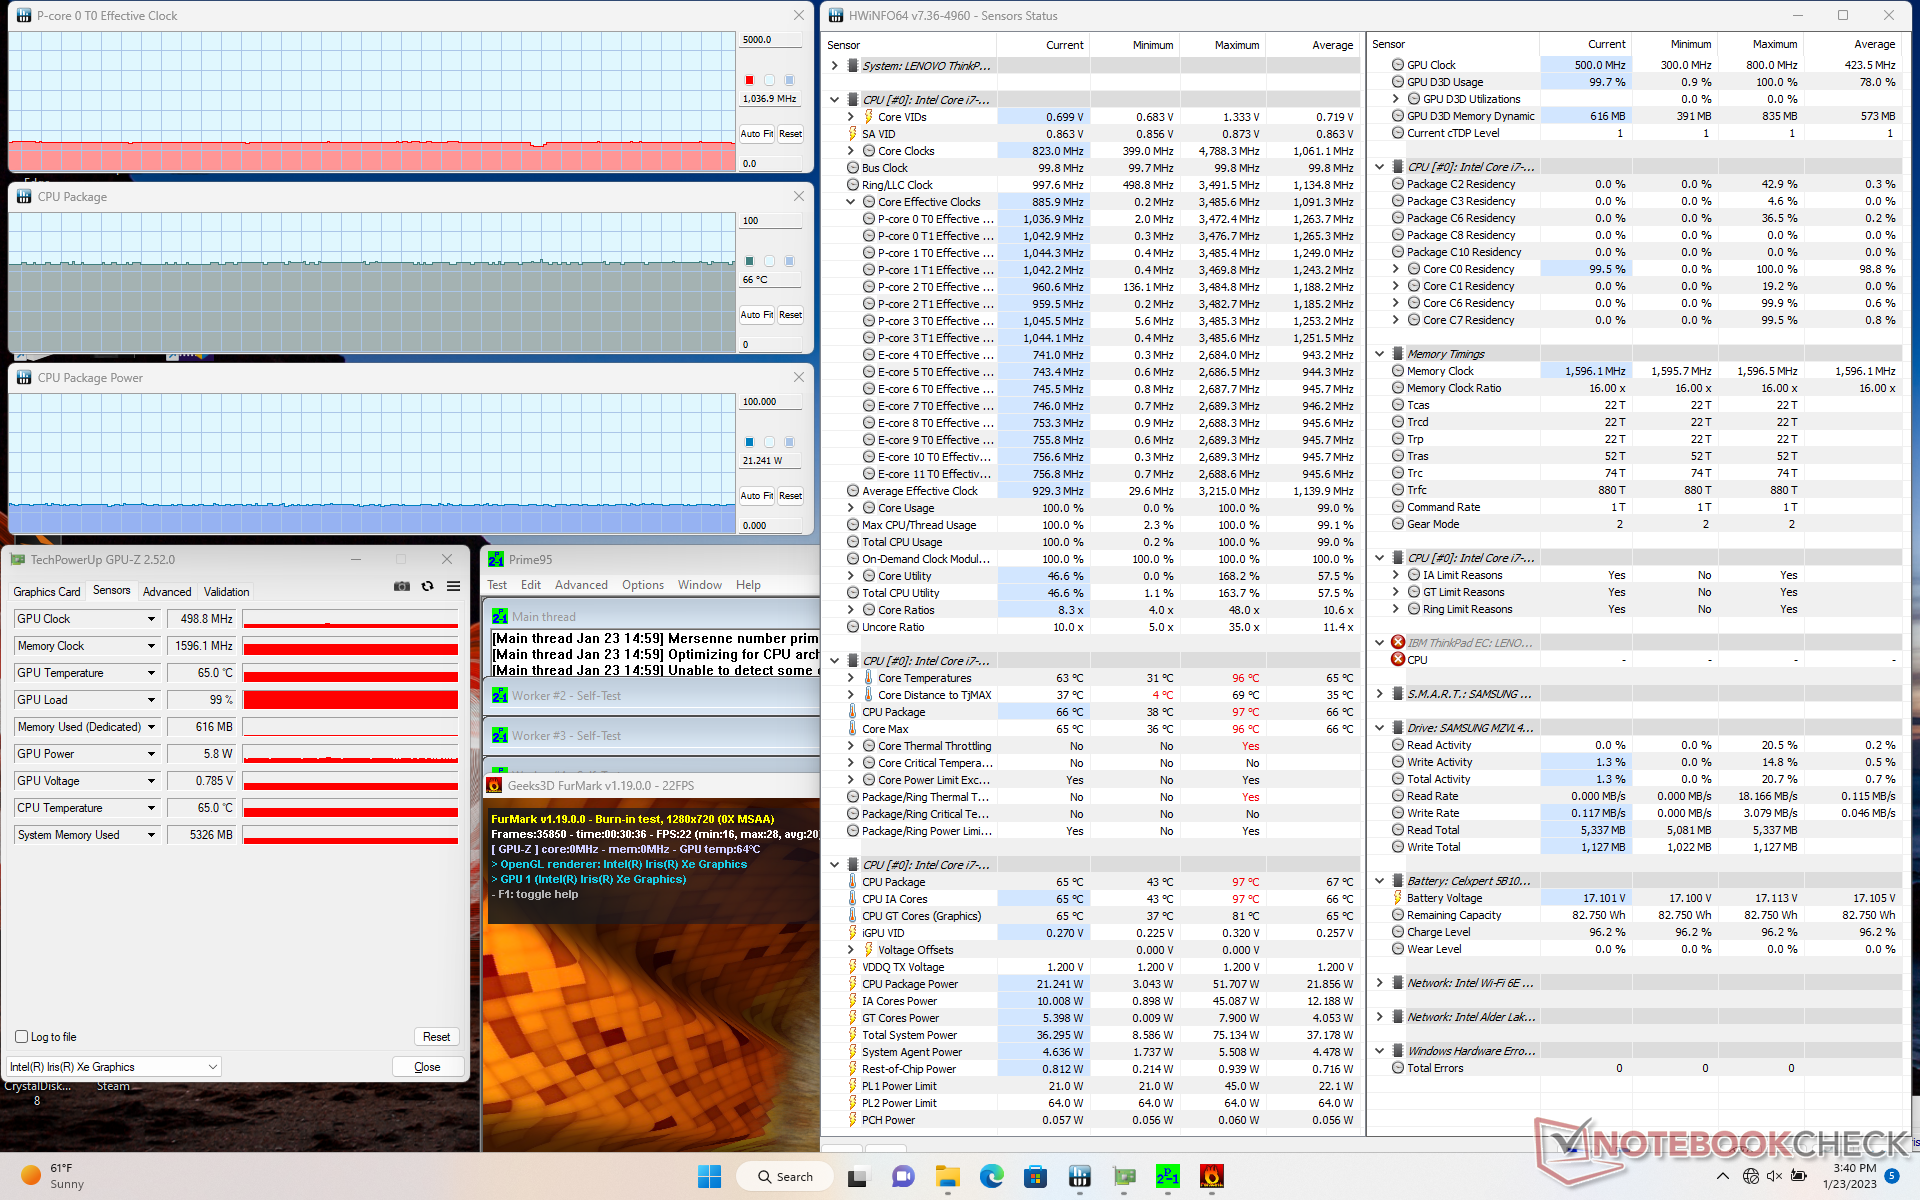
| Fréquence du CPU (GHz) | Fréquence du GPU (MHz) | Température moyenne du CPU (°C) | |
| Système au repos | -- | -- | 31 |
| Prime95 Stress | 1.7 | -- | 69 |
| Prime95 + FurMark Stress | 1.0 | 499 | 66 |
| Witcher 3 Stress | ~1.3 | 998 | 67 |
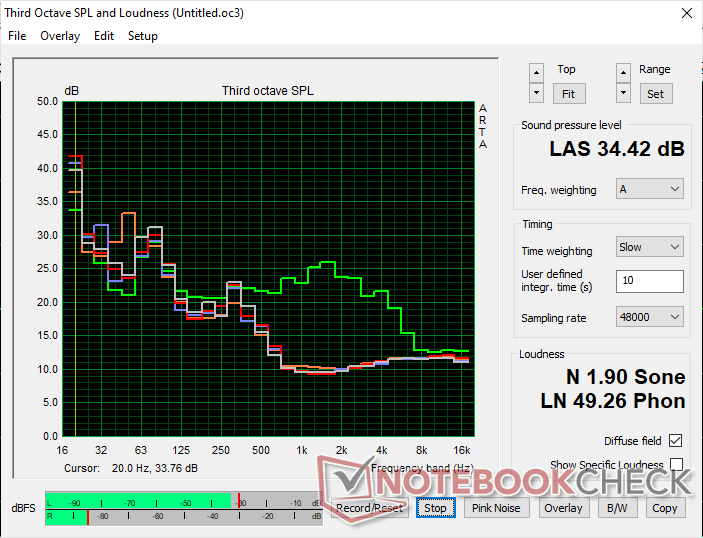
Haut-parleurs
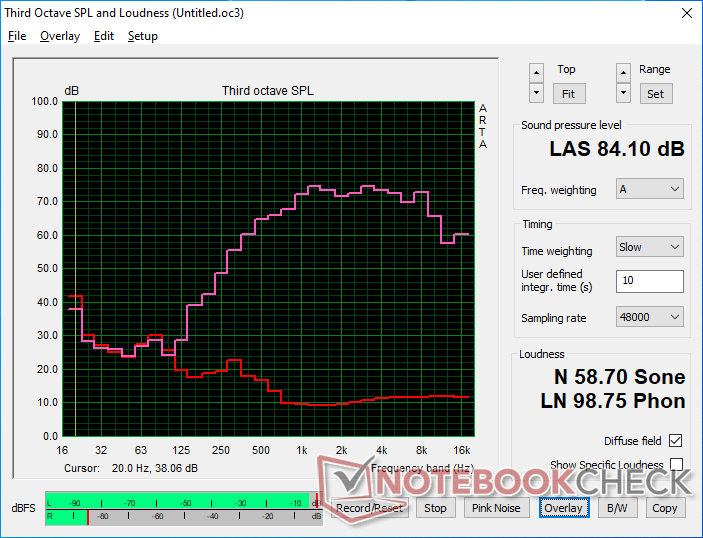
Lenovo ThinkPad T16 Gen 1 Core i7-1270P analyse audio
(+) | les haut-parleurs peuvent jouer relativement fort (84.1# dB)
Basses 100 - 315 Hz
(-) | presque aucune basse - en moyenne 26.3% plus bas que la médiane
(±) | la linéarité des basses est moyenne (11.1% delta à la fréquence précédente)
Médiums 400 - 2000 Hz
(+) | médiane équilibrée - seulement 4.5% de la médiane
(+) | les médiums sont linéaires (5.1% delta à la fréquence précédente)
Aiguës 2 - 16 kHz
(±) | sommets plus élevés - en moyenne 5.8% plus élevés que la médiane
(+) | les aigus sont linéaires (4.8% delta à la fréquence précédente)
Globalement 100 - 16 000 Hz
(±) | la linéarité du son global est moyenne (20.1% de différence avec la médiane)
Par rapport à la même classe
» 43% de tous les appareils testés de cette catégorie étaient meilleurs, 10% similaires, 47% pires
» Le meilleur avait un delta de 7%, la moyenne était de 21%, le pire était de 53%.
Par rapport à tous les appareils testés
» 52% de tous les appareils testés étaient meilleurs, 8% similaires, 40% pires
» Le meilleur avait un delta de 4%, la moyenne était de 23%, le pire était de 134%.
Apple MacBook Pro 16 2021 M1 Pro analyse audio
(+) | les haut-parleurs peuvent jouer relativement fort (84.7# dB)
Basses 100 - 315 Hz
(+) | bonne basse - seulement 3.8% loin de la médiane
(+) | les basses sont linéaires (5.2% delta à la fréquence précédente)
Médiums 400 - 2000 Hz
(+) | médiane équilibrée - seulement 1.3% de la médiane
(+) | les médiums sont linéaires (2.1% delta à la fréquence précédente)
Aiguës 2 - 16 kHz
(+) | des sommets équilibrés - à seulement 1.9% de la médiane
(+) | les aigus sont linéaires (2.7% delta à la fréquence précédente)
Globalement 100 - 16 000 Hz
(+) | le son global est linéaire (4.6% différence à la médiane)
Par rapport à la même classe
» 0% de tous les appareils testés de cette catégorie étaient meilleurs, 0% similaires, 100% pires
» Le meilleur avait un delta de 5%, la moyenne était de 17%, le pire était de 45%.
Par rapport à tous les appareils testés
» 0% de tous les appareils testés étaient meilleurs, 0% similaires, 100% pires
» Le meilleur avait un delta de 4%, la moyenne était de 23%, le pire était de 134%.
Gestion de l'énergie
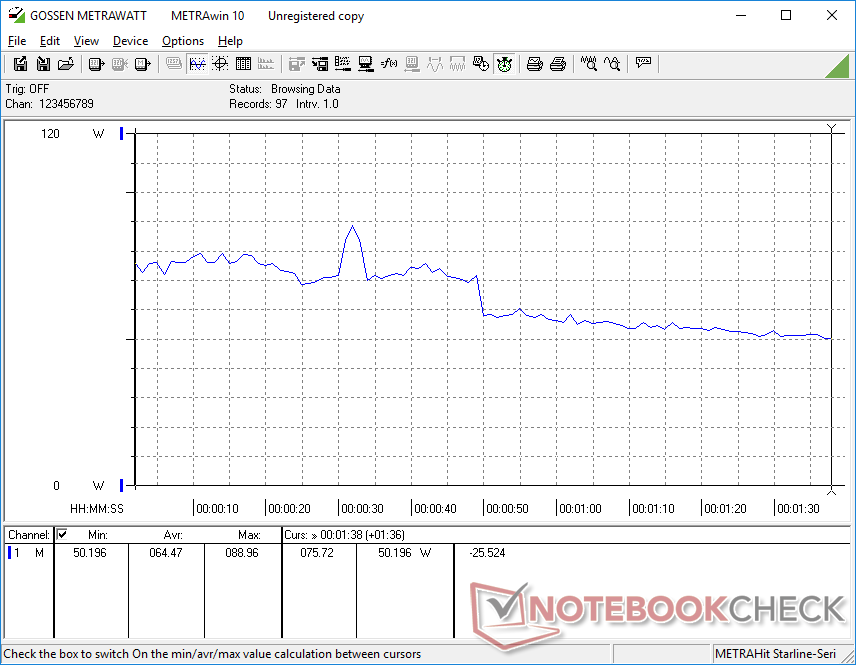
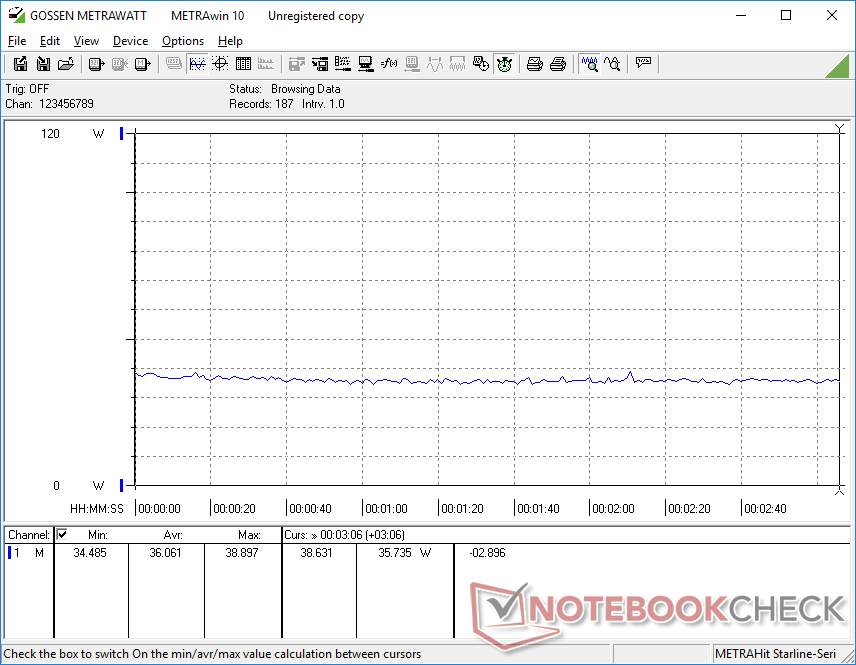
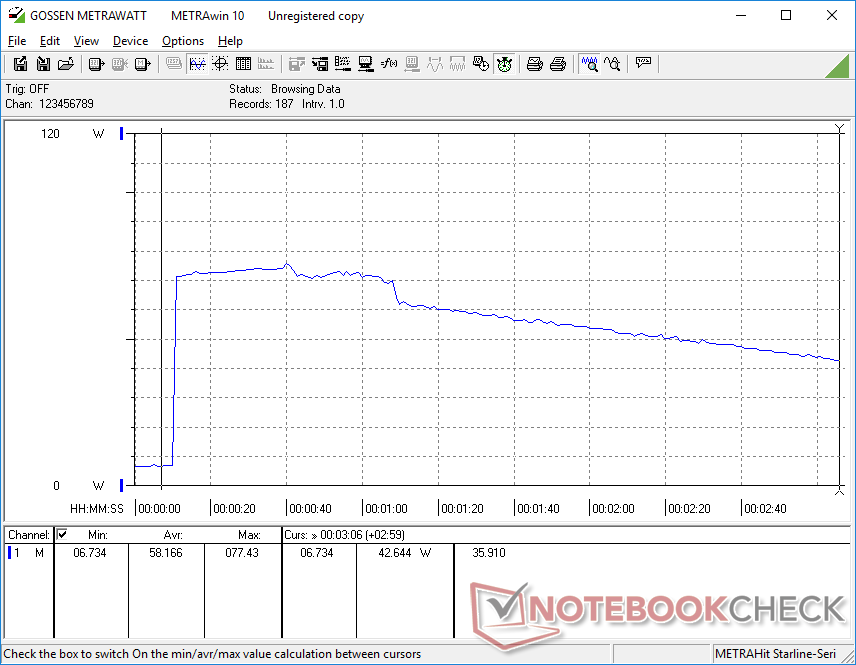
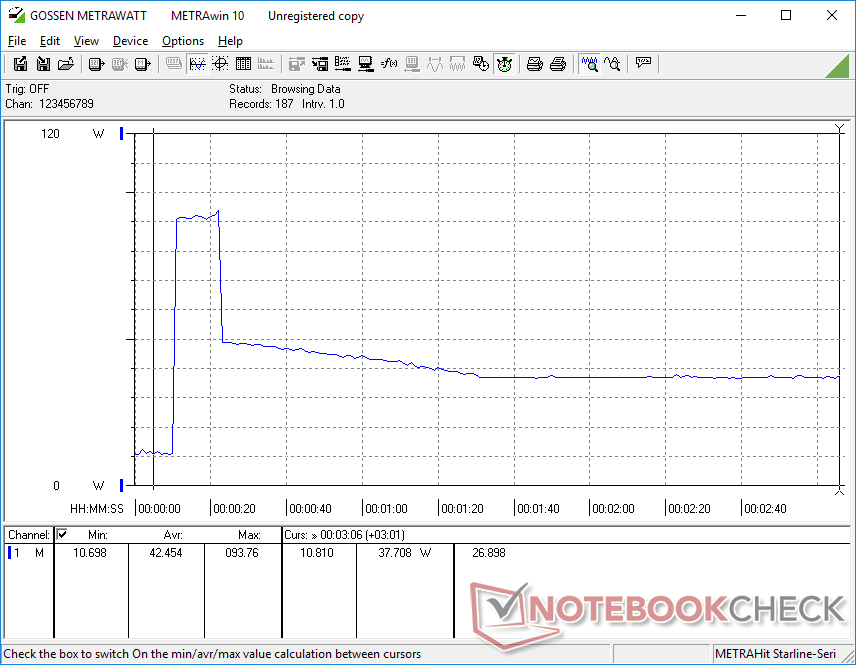
Consommation d'énergie
La consommation d'énergie lors de l'exécution de charges plus élevées reflète nos observations sur la fréquence d'horloge et les performances ci-dessus. En effet, elle peut être élevée pendant les premiers moments de stress avant de chuter à des niveaux inférieurs en raison de l'étranglement des performances. En exécutant Prime95, par exemple, la consommation serait élevée à environ 77 W pendant environ 60 secondes avant de tomber à 42 W ou moins au fil du temps. Ce phénomène se produit même en mode Haute performance.
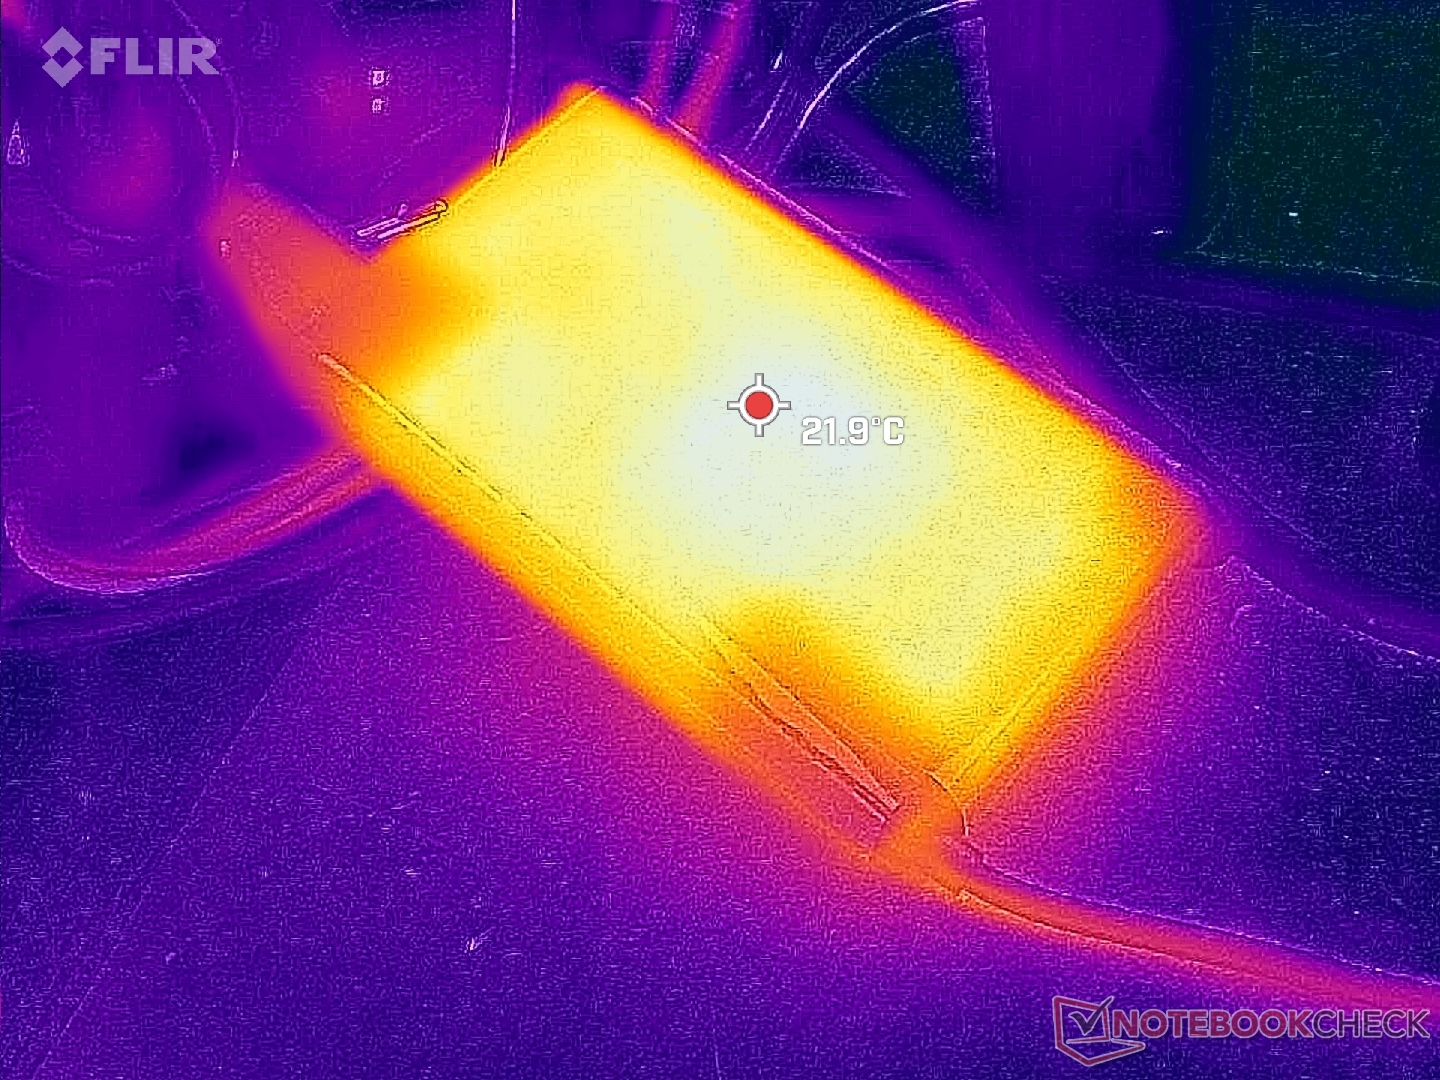
Nous sommes en mesure d'enregistrer une consommation maximale de 94 W de l'adaptateur secteur USB-C 135 W de taille petite-moyenne (~14,6 x 7,7 x 2,5 cm) lorsque le CPU et le GPU intégré sont chacun à 100 % d'utilisation. Ce taux n'est toutefois que temporaire, comme le montre le graphique ci-dessous. Le taux d'utilisation relativement élevé permet à l'ordinateur portable d'alimenter des périphériques Thunderbolt plus exigeants, comme certains docks et moniteurs. Lenovo propose comme alternative un adaptateur secteur de 65 W, plus petit et plus portable.
| Éteint/en veille | |
| Au repos | |
| Fortement sollicité |
|
Légende:
min: | |
| Lenovo ThinkPad T16 Gen 1 Core i7-1270P i7-1270P, Iris Xe G7 96EUs, Samsung PM9B1 512GB MZAL4512HBLU, IPS, 1920x1200, 16" | Lenovo ThinkPad T16 G1 21BWS00200 i5-1240P, Iris Xe G7 80EUs, Samsung PM9A1 MZVL2512HCJQ, IPS, 1920x1200, 16" | LG Gram 16Z90Q i7-1260P, Iris Xe G7 96EUs, Samsung PM9A1 MZVL21T0HCLR, IPS, 2560x1600, 16" | HP EliteBook 865 G9 R7 PRO 6850U, Radeon 680M, Samsung PM991 MZVLQ512HBLU, IPS, 1920x1200, 16" | Huawei MateBook 16s i7 i7-12700H, Iris Xe G7 96EUs, Silicon Motion PCIe-8 SSD, IPS, 2520x1680, 16" | Apple MacBook Pro 16 2021 M1 Pro M1 Pro, M1 Pro 16-Core GPU, Apple SSD AP1024R, Mini-LED, 3456x2234, 16.2" | |
|---|---|---|---|---|---|---|
| Power Consumption | 21% | -3% | -21% | -45% | -34% | |
| Idle Minimum * (Watt) | 3.5 | 2.9 17% | 5 -43% | 5.3 -51% | 6.8 -94% | 5 -43% |
| Idle Average * (Watt) | 7.4 | 6 19% | 8 -8% | 12.8 -73% | 13.2 -78% | 15.1 -104% |
| Idle Maximum * (Watt) | 10.7 | 6.9 36% | 14 -31% | 14.1 -32% | 13.8 -29% | 15.5 -45% |
| Load Average * (Watt) | 64.5 | 27.3 58% | 47 27% | 48.5 25% | 75.2 -17% | 54 16% |
| Witcher 3 ultra * (Watt) | 36.1 | 42.6 -18% | 37.8 -5% | 48.7 -35% | 56.1 -55% | |
| Load Maximum * (Watt) | 93.8 | 81.53 13% | 56 40% | 56.6 40% | 90.6 3% | 90 4% |
* ... Moindre est la valeur, meilleures sont les performances
Power Consumption Witcher 3 / Stresstest
Power Consumption external Monitor
Autonomie de la batterie - Navigation sur le Web toute la journée
Le temps d'exécution du WLAN est nettement plus court que celui que nous avons enregistré sur le SKU Core i5 du Thinkpad T16 G1, comme le montre le tableau ci-dessous. Nous avons veillé à effectuer le test avec les mêmes paramètres de profil d'alimentation équilibré entre les deux configurations et les résultats n'ont pas changé. Malgré tout, 8 heures d'utilisation de la navigation dans le monde réel sont probablement suffisantes pour la plupart des utilisateurs.
Le chargement d'un appareil vide à sa pleine capacité prend environ 90 minutes avec l'adaptateur secteur fourni.
| Lenovo ThinkPad T16 Gen 1 Core i7-1270P i7-1270P, Iris Xe G7 96EUs, 86 Wh | Lenovo ThinkPad T16 G1 21BWS00200 i5-1240P, Iris Xe G7 80EUs, 86 Wh | LG Gram 16Z90Q i7-1260P, Iris Xe G7 96EUs, 80 Wh | HP EliteBook 865 G9 R7 PRO 6850U, Radeon 680M, 76 Wh | Huawei MateBook 16s i7 i7-12700H, Iris Xe G7 96EUs, 84 Wh | Apple MacBook Pro 16 2021 M1 Pro M1 Pro, M1 Pro 16-Core GPU, 99.6 Wh | |
|---|---|---|---|---|---|---|
| Autonomie de la batterie | 76% | 26% | 88% | 1% | 111% | |
| WiFi v1.3 (h) | 8 | 14.1 76% | 10.1 26% | 15 88% | 8.1 1% | 16.9 111% |
| H.264 (h) | 10.4 | 18.5 | 9.3 | 17.5 | ||
| Load (h) | 3.5 | 2.6 | 1.8 | 1.9 | ||
| Reader / Idle (h) | 18.1 |
Points positifs
Points négatifs
Verdict - Pas pour les utilisateurs de performances extrêmes
Bien que le ThinkPad T16 G1 n'ait pas été conçu pour les utilisateurs à hautes performances, il est tout de même décevant de constater des taux d'accélération du processeur aussi élevés lors de l'exécution de charges plus exigeantes. L'étranglement est suffisamment important pour que les performances de notre Core i7-1270P puissent devenir aussi lentes que celles du Core i5-1240P, moins cher, après un certain temps. Un tel comportement signifie que le Core i7-1270P n'est optimal que pour de courtes périodes de haute performance, comme le lancement d'applications ou le traitement d'images, plutôt que pour l'encodage vidéo ou le travail graphique lourd, où l'étranglement peut se produire au fil du temps.
Une option intégrée pour augmenter les performances du processeur au prix d'un bruit de ventilateur plus fort et/ou de températures plus chaudes aurait quelque peu atténué l'étranglement.
L'option Ryzen 5 Pro 6650U offre des performances plus constantes que l'option Core i7-1270P. L'étranglement des performances est plus lourd en cas de configuration avec un processeur de la série Core P.
Outre le processeur, les utilisateurs doivent également faire attention à la lenteur de la RAM système et à certaines des options d'affichage disponibles. La première a un impact de 10 % sur les performances graphiques, tandis que certains écrans n'offrent pas les couleurs exigées par les professionnels du graphisme. Le concurrentHP EliteBook 865 G9 est une alternative plus fine avec des options qui ne sont pas disponibles sur le ThinkPad T16 G1, notamment un écran plus lumineux de 1000 nits et une webcam de 5 MP de plus haute résolution.
Prix et disponibilité
Le ThinkPad T16 G1 est maintenant disponible directement auprès de Lenovo à partir de 1050 USD pour la configuration de base Core i5-1235U jusqu'à 2040 USD pour la configuration Core i7-1270P. Newegg et Amazon ont également le modèle en stock dans diverses configurations à partir d'environ 1500 $ si configuré avec le Core i7-1270P.
Lenovo ThinkPad T16 Gen 1 Core i7-1270P
- 01/25/2023 v7 (old)
Allen Ngo
Transparency
La sélection des appareils à examiner est effectuée par notre équipe éditoriale. L'échantillon de test a été prêté à l'auteur par le fabricant ou le détaillant pour les besoins de cet examen. Le prêteur n'a pas eu d'influence sur cette évaluation et le fabricant n'a pas reçu de copie de cette évaluation avant sa publication. Il n'y avait aucune obligation de publier cet article. En tant que média indépendant, Notebookcheck n'est pas soumis à l'autorité des fabricants, des détaillants ou des éditeurs.
Voici comment Notebookcheck teste
Chaque année, Notebookcheck examine de manière indépendante des centaines d'ordinateurs portables et de smartphones en utilisant des procédures standardisées afin de garantir que tous les résultats sont comparables. Nous avons continuellement développé nos méthodes de test depuis environ 20 ans et avons établi des normes industrielles dans le processus. Dans nos laboratoires de test, des équipements de mesure de haute qualité sont utilisés par des techniciens et des rédacteurs expérimentés. Ces tests impliquent un processus de validation en plusieurs étapes. Notre système d'évaluation complexe repose sur des centaines de mesures et de points de référence bien fondés, ce qui garantit l'objectivité.Price comparison

