Test du MSI GE76 Raider : au paradis des jeux vidéos avec Alder Lake et RTX 3080 Ti

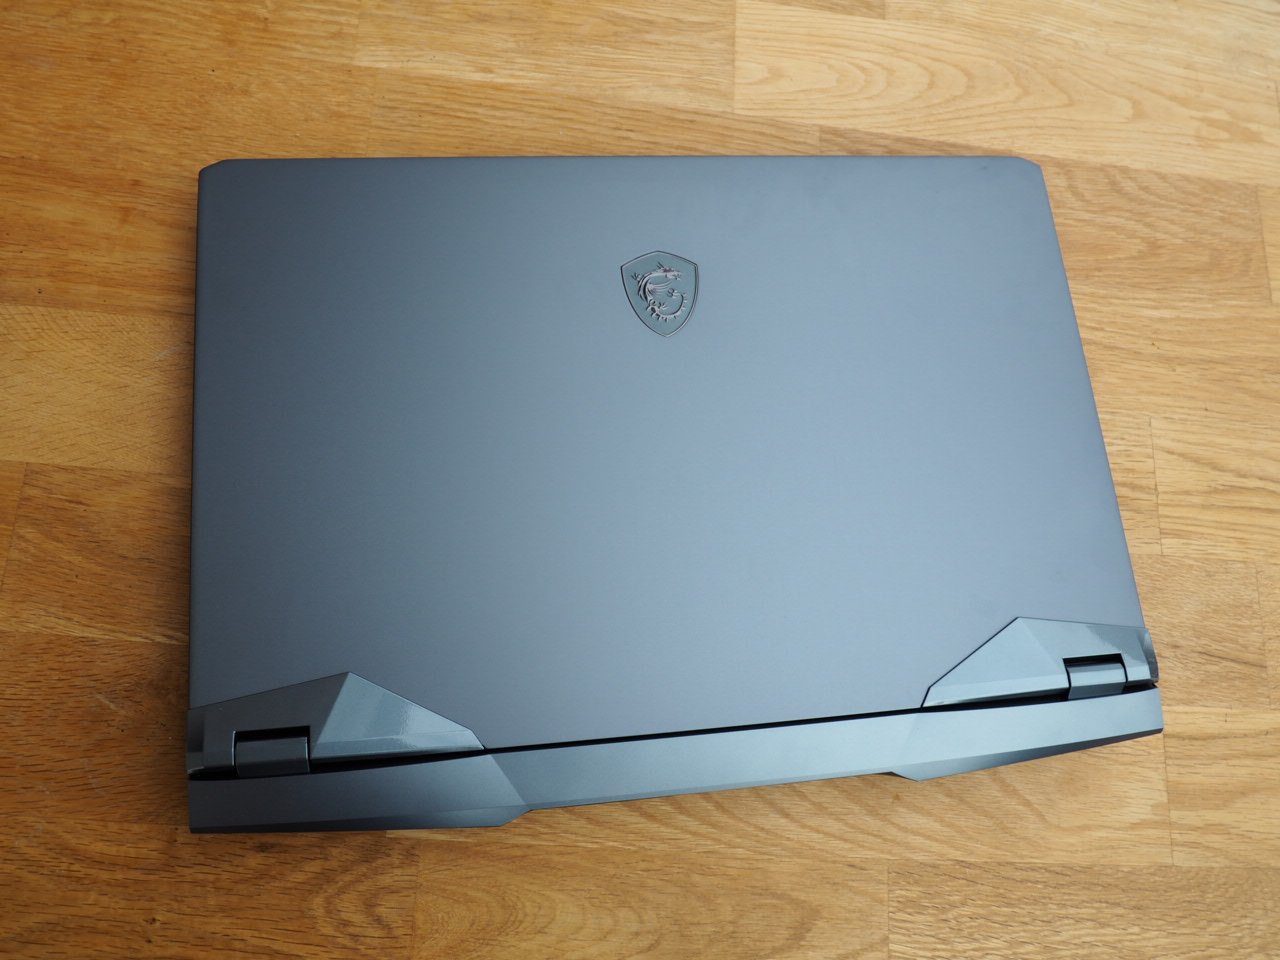
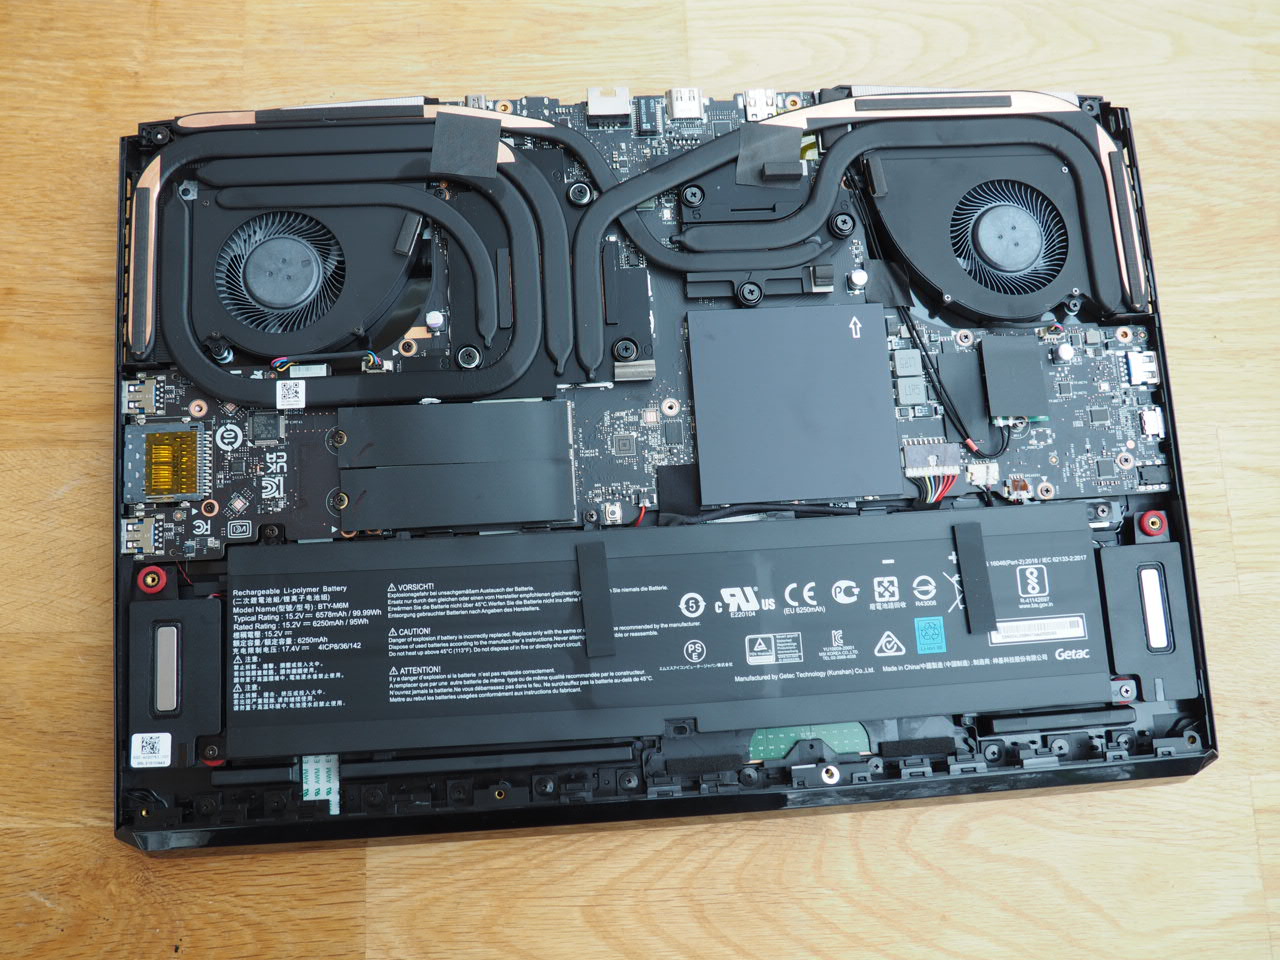
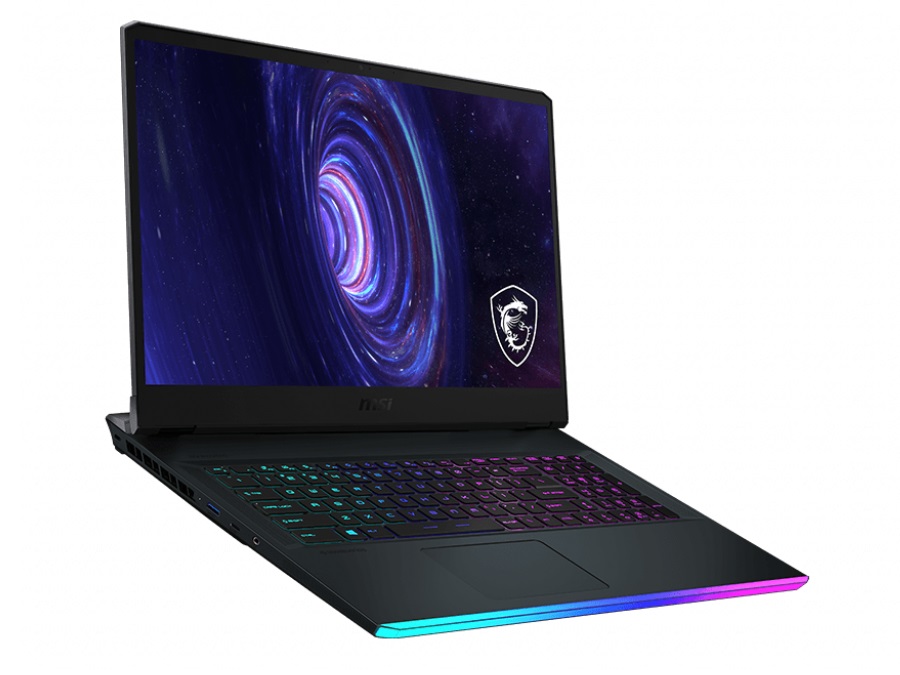
Avec ses 3 kg et sa hauteur de 2,6 cm (pieds en bas non inclus), le GE76 Raider n'est ni un monstre de jeu encombrant, ni un mince et léger, mais un bon mélange des deux catégories
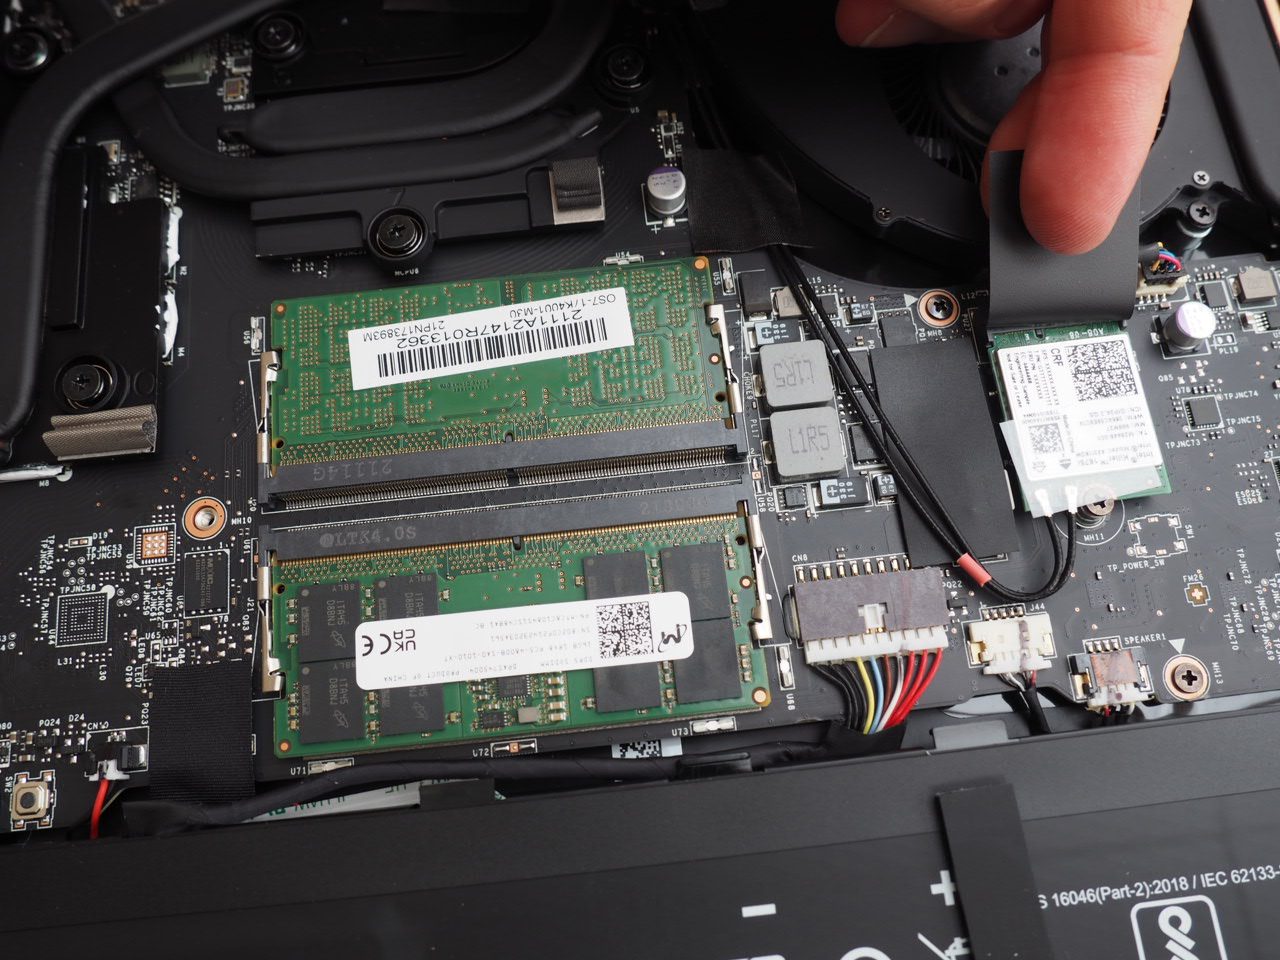
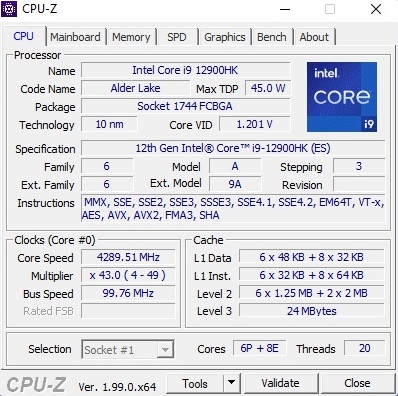
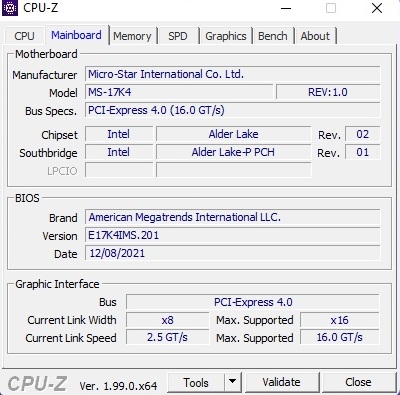
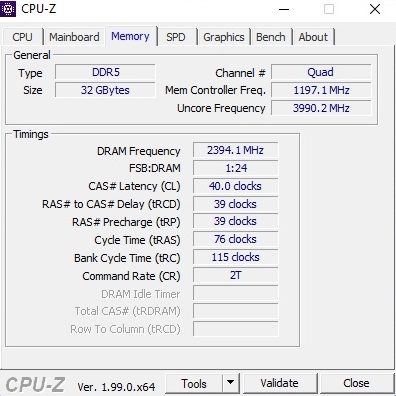
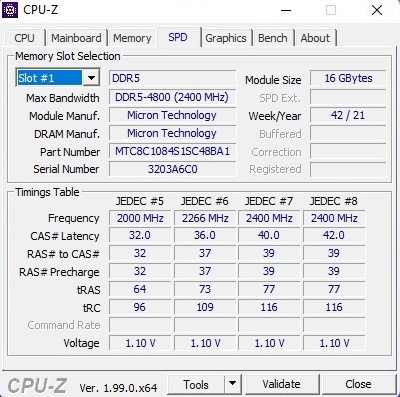
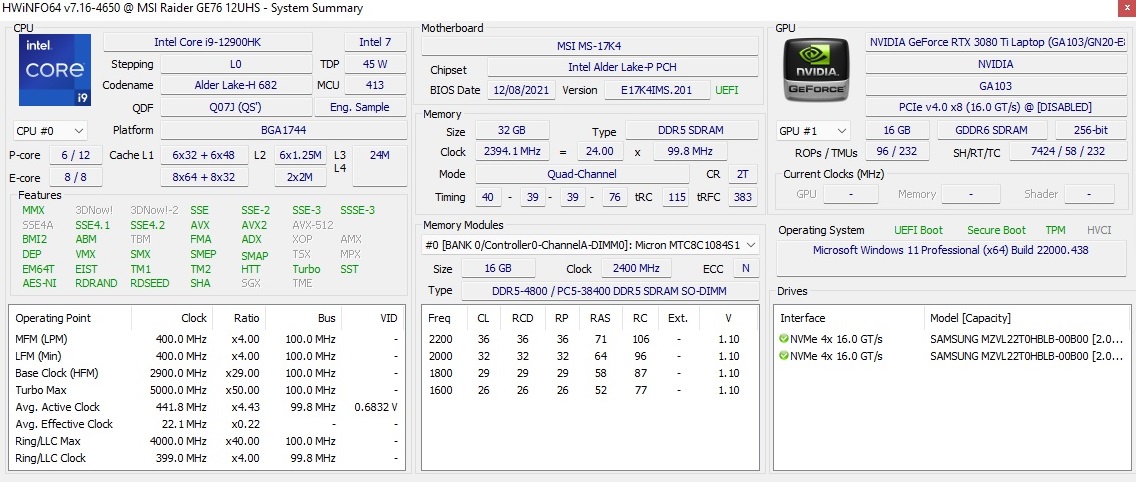
Malgré son profil un peu mince, l'ordinateur portable de 17 pouces est équipé de composants puissants. MSI utilise les dernièresGeForce RTX 3080 Tile GPU mobile phare, qui veut attirer les clients avec 16 Go de GDDR6 VRAM. Ensuite, il y a le nouveau et très rapide Intel Alder LakeCore i9-12900HKune puce à quatorze cœurs, qui peut exécuter jusqu'à 20 threads simultanément. Notre échantillon, qui est une unité de préproduction (pre-sample), arbore également 32 Go de RAM DDR5-4800 (2x 16 Go à double canal) ainsi que deux SSD NVMe de 2 To. La résolution d'affichage est limitée à 1080p, mais c'est un panneau très rapide avec un taux de rafraîchissement de 360 Hz
Il n'y avait pas de prix officiel de la part de MSI au moment de la revue, mais nous nous attendons à au moins 3000 euros (plus vers 4000 euros en fait).
Les concurrents sont principalement des systèmes de jeu de 17 pouces avec laGeForce RTX 3080et des réglages TGP maximum. Il s'agit notamment duSchenker XMG Neo 17leAlienware x17l'Alienware x17Asus ROG Zephyrus S17et leSchenker XMG Ultra 17.
Potential Competitors in Comparison
Note | Date | Modèle | Poids | Épaisseur | Taille | Résolution | Prix |
|---|---|---|---|---|---|---|---|
| 87.5 % v7 (old) | 01/22 | MSI GE76 Raider i9-12900HK, GeForce RTX 3080 Ti Laptop GPU | 3 kg | 26 mm | 17.30" | 1920x1080 | |
| 87.4 % v7 (old) | 09/21 | Schenker XMG NEO 17 GM7TG8S i7-11800H, GeForce RTX 3080 Laptop GPU | 2.6 kg | 27.45 mm | 17.30" | 2560x1440 | |
| 89 % v7 (old) | 09/21 | Alienware x17 RTX 3080 P48E i7-11800H, GeForce RTX 3080 Laptop GPU | 3.2 kg | 21.4 mm | 17.30" | 3840x2160 | |
| 90.1 % v7 (old) | 07/21 | Asus ROG Zephyrus S17 GX703HSD i9-11900H, GeForce RTX 3080 Laptop GPU | 2.8 kg | 19.9 mm | 17.30" | 2560x1440 | |
| 84.9 % v7 (old) | 04/21 | Schenker XMG Ultra 17 Rocket Lake i9-11900K, GeForce RTX 3080 Laptop GPU | 4.7 kg | 43.5 mm | 17.30" | 1920x1080 |
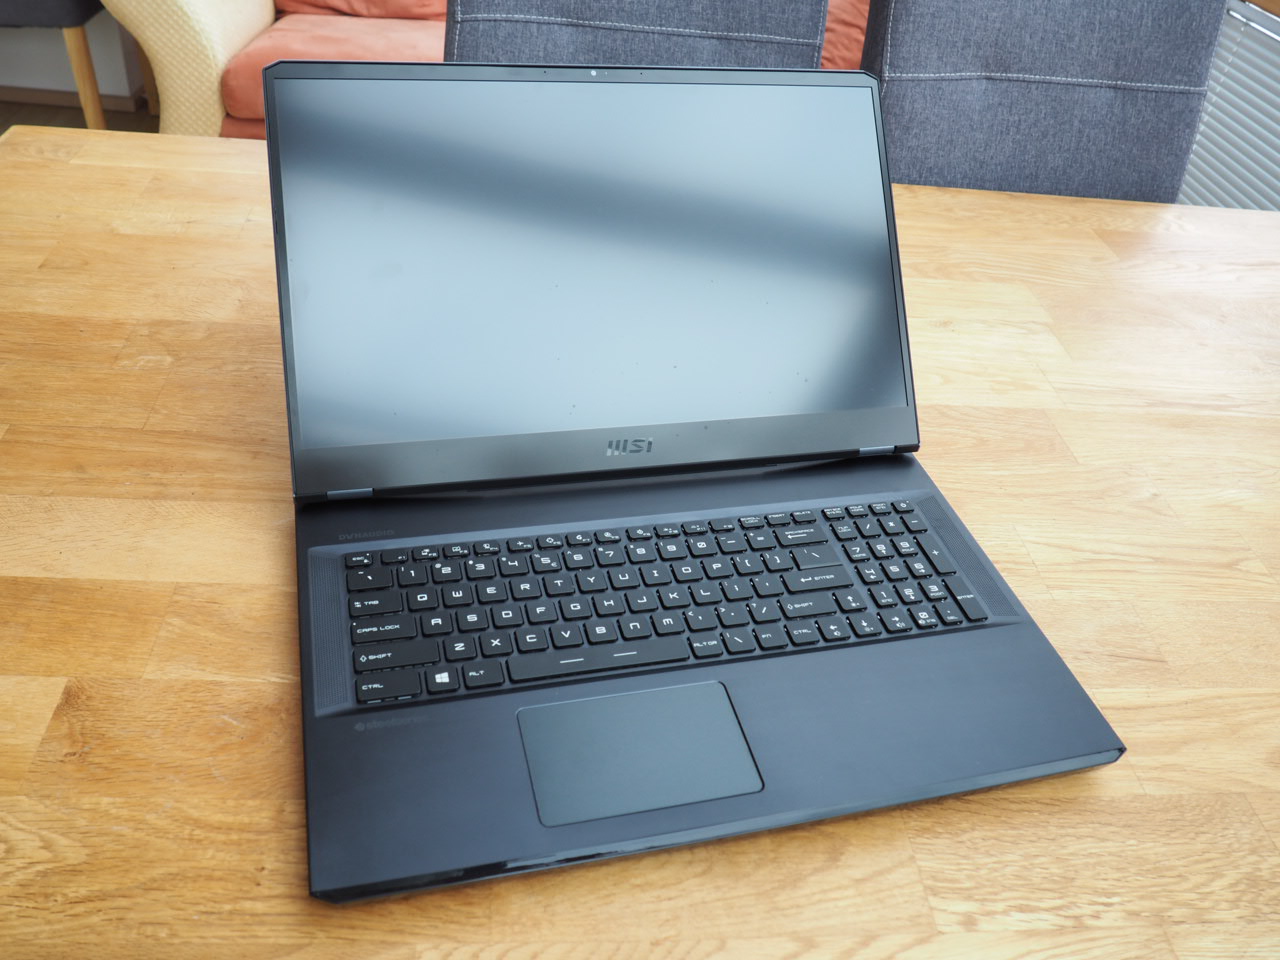
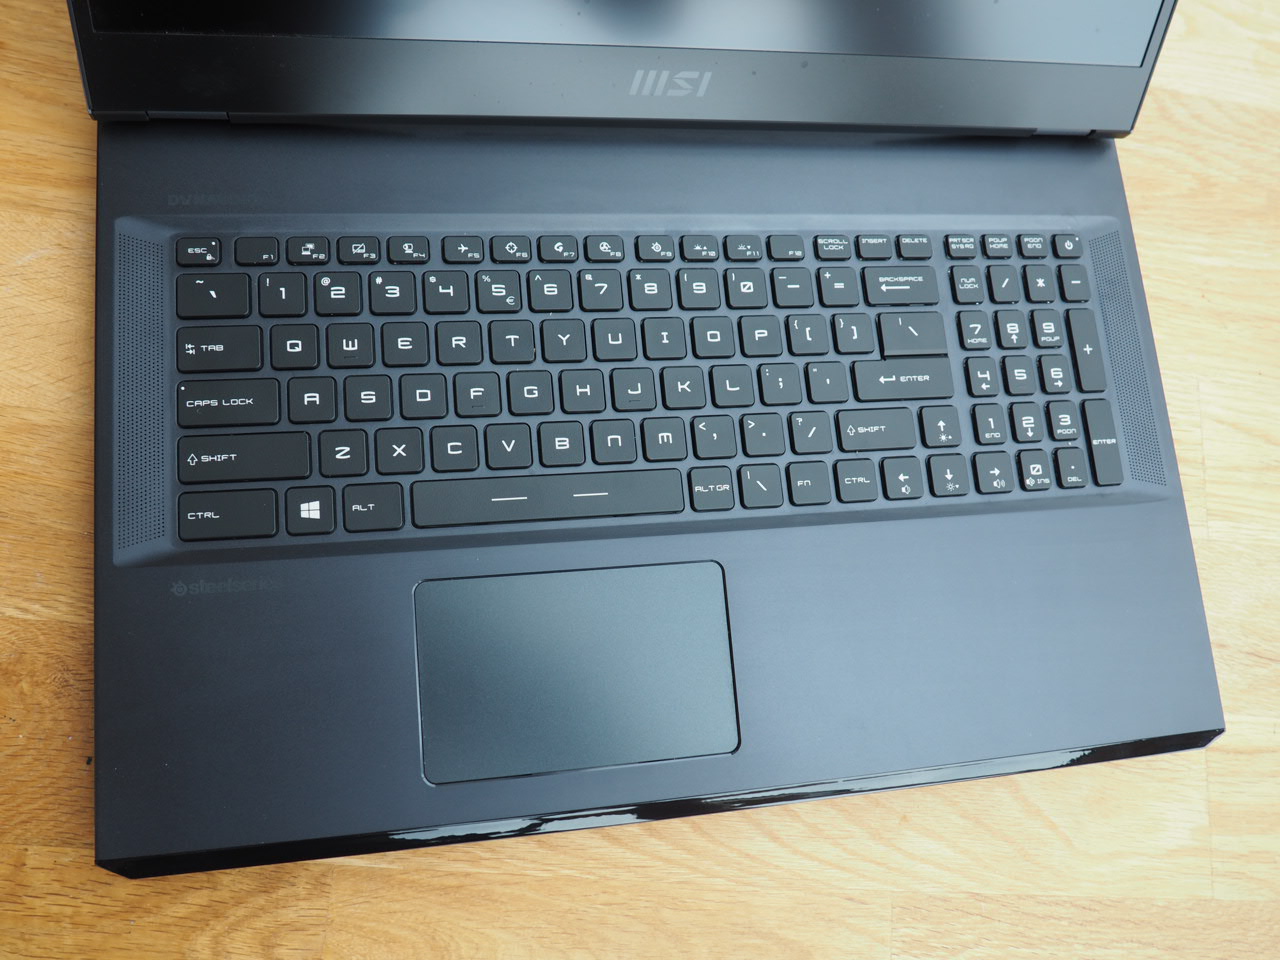
Le châssis est identique à celui de son (pré-)prédécesseur, nous n'aborderons donc pas le boîtier, la connectivité et les périphériques d'entrée dans le cadre de cet examen. Veuillez consulter leGE76 Raider 10UHpour toutes les informations correspondantes.
Lecteur de carte SD
| SD Card Reader - average JPG Copy Test (av. of 3 runs) | |
| Schenker XMG Ultra 17 Rocket Lake | |
| Asus ROG Zephyrus S17 GX703HSD | |
| Alienware x17 RTX 3080 P48E (AV Pro V60) | |
| Moyenne de la classe Gaming (20.9 - 210, n=54, 2 dernières années) | |
| MSI GE76 Raider (AV PRO microSD 128 GB V60) | |
| Schenker XMG NEO 17 GM7TG8S | |
Communication
Webcam


Afficher
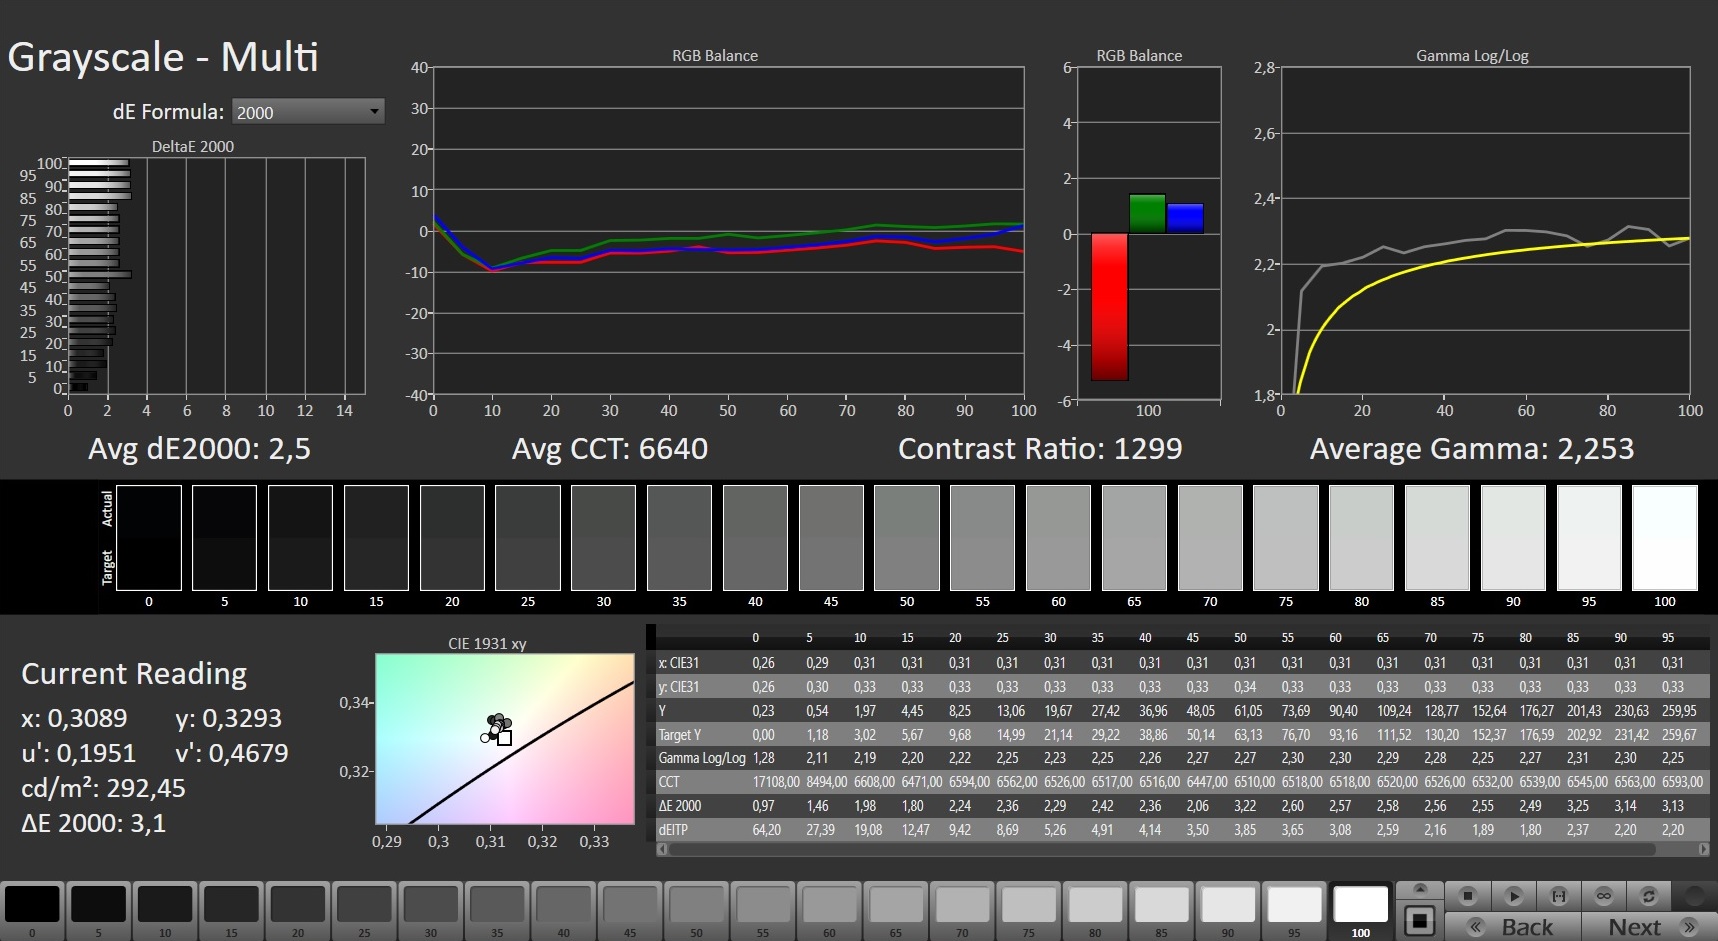
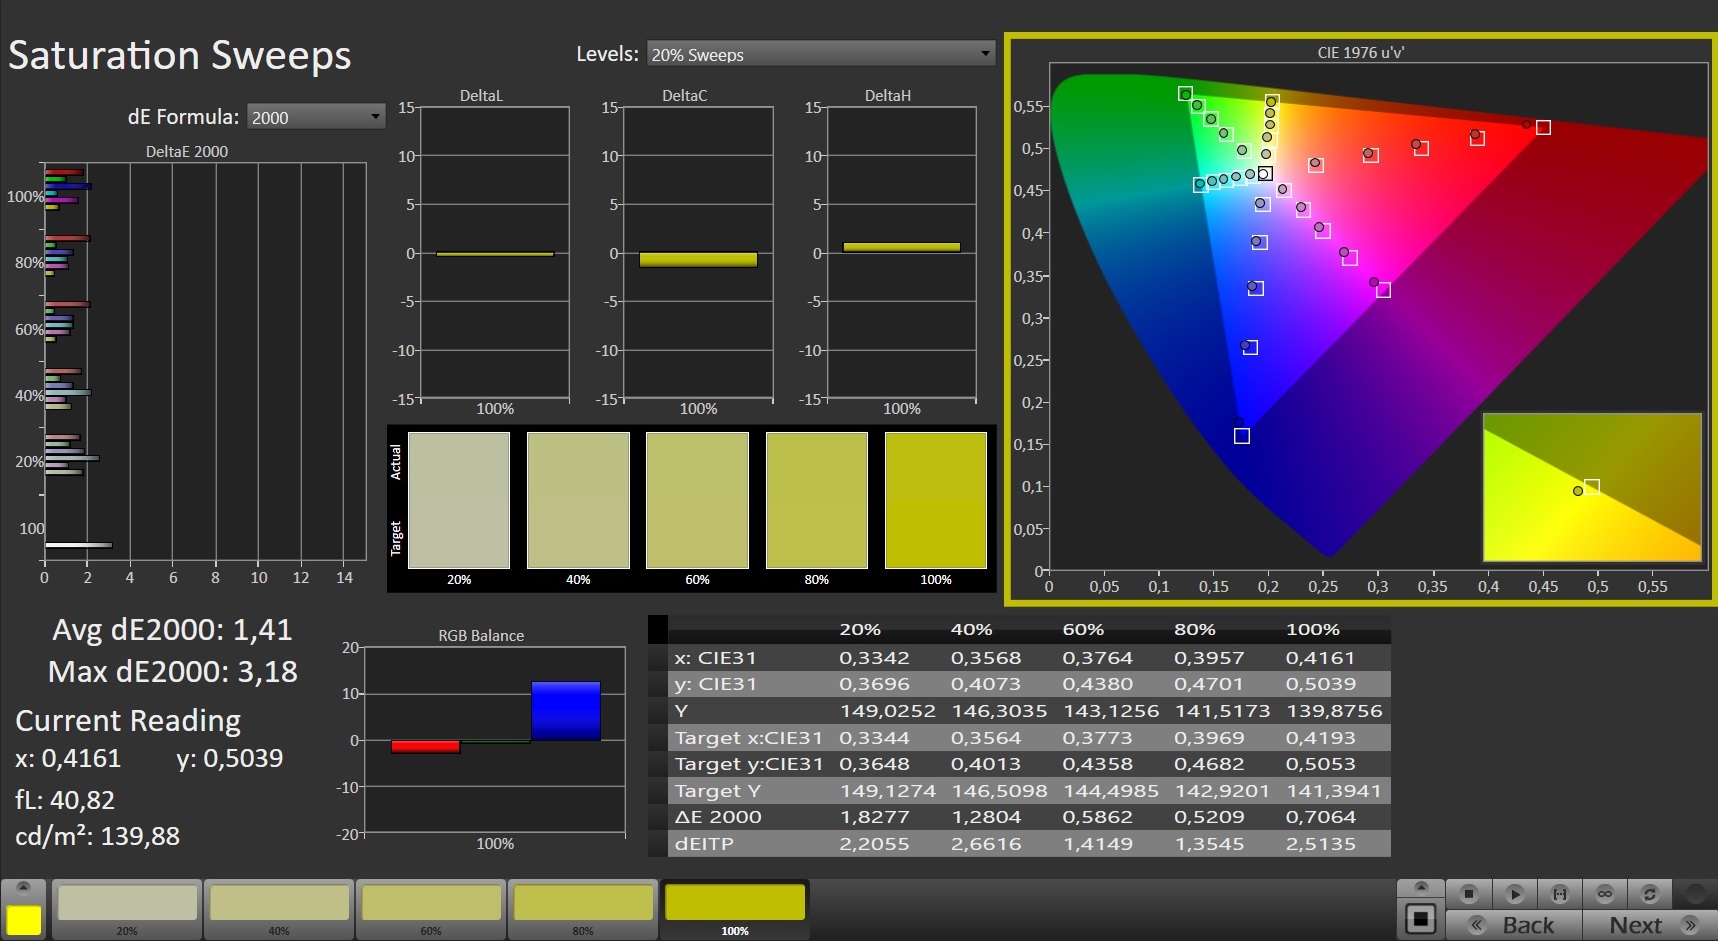
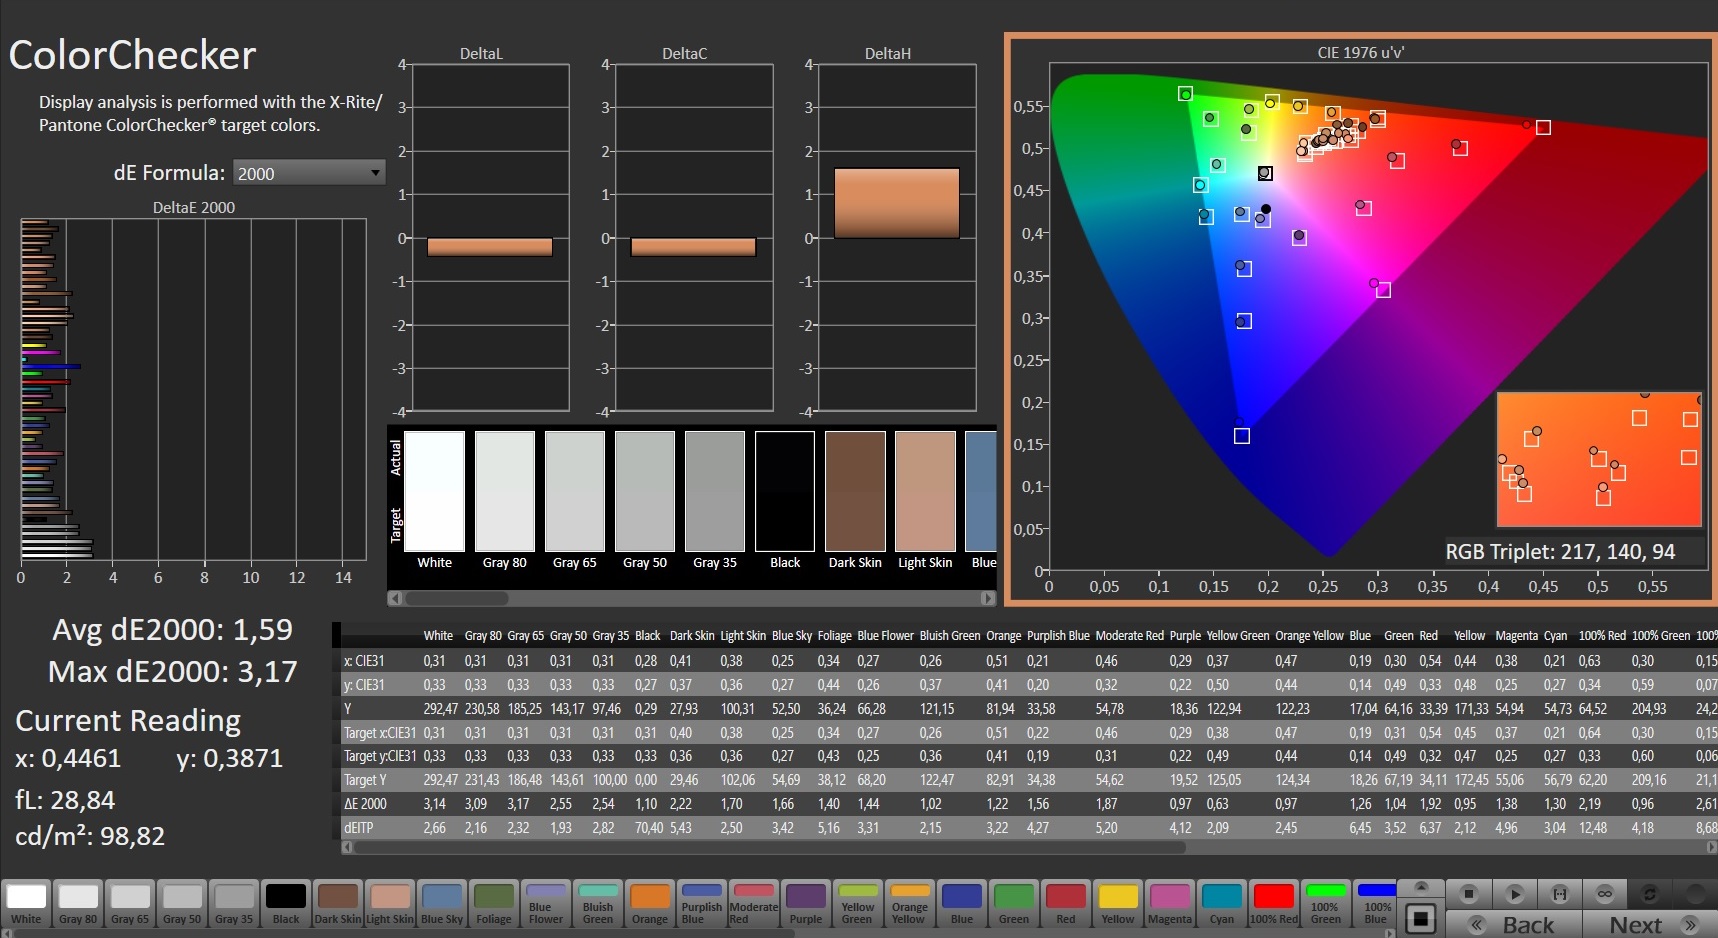
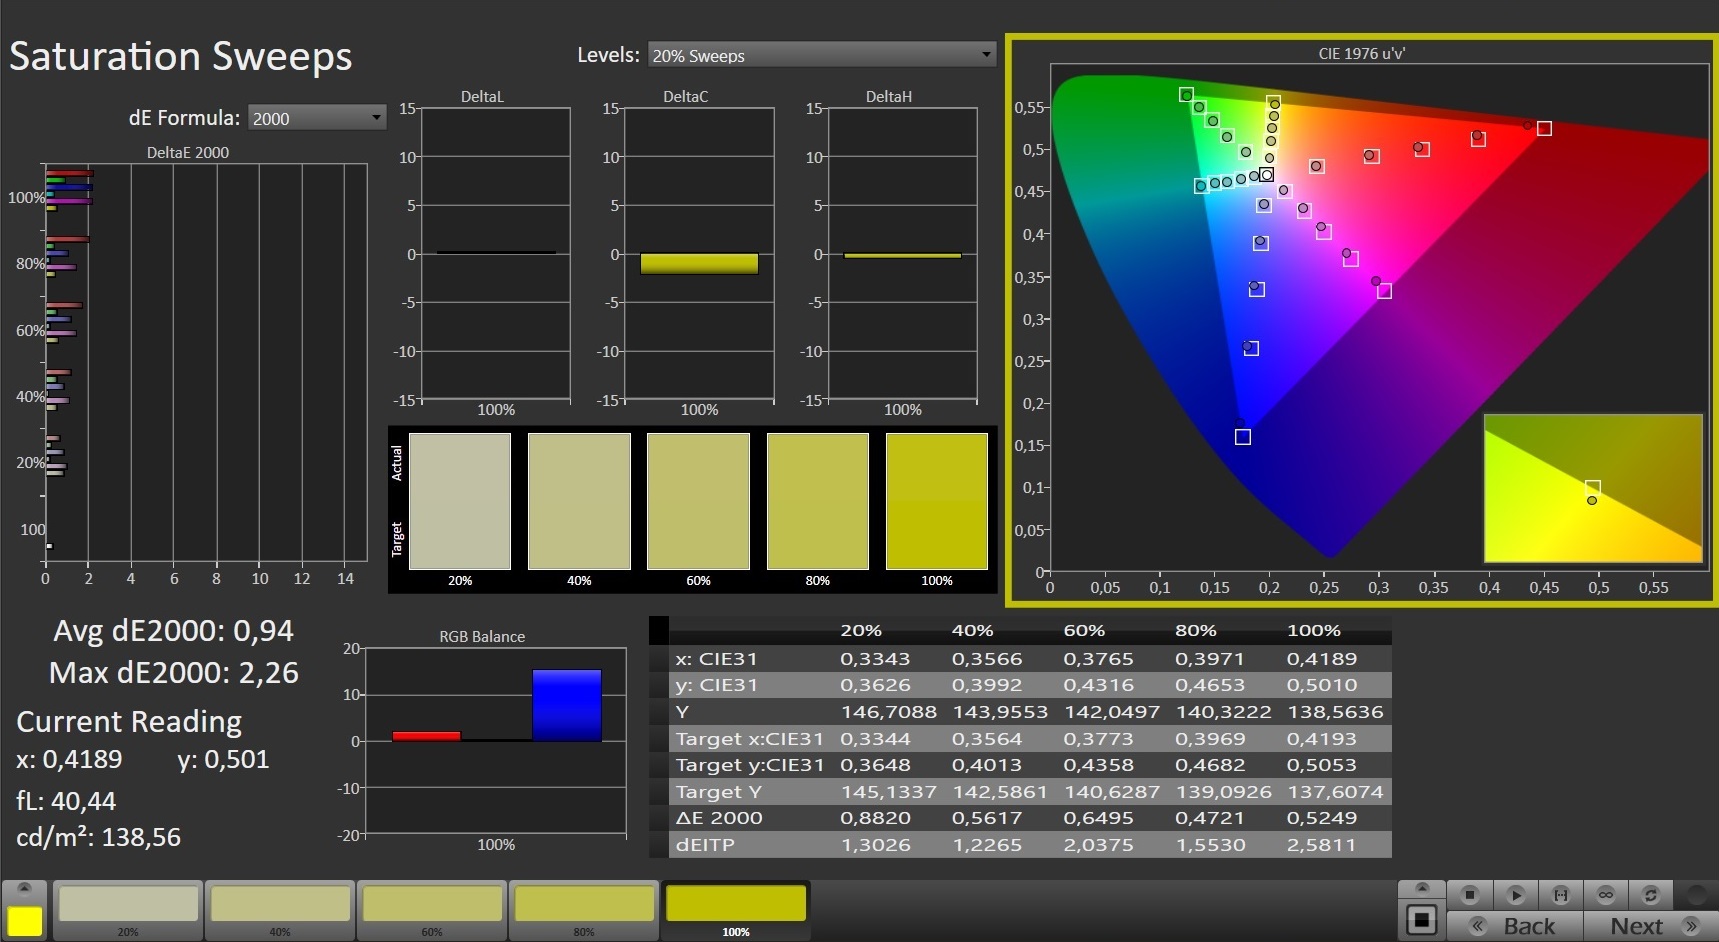
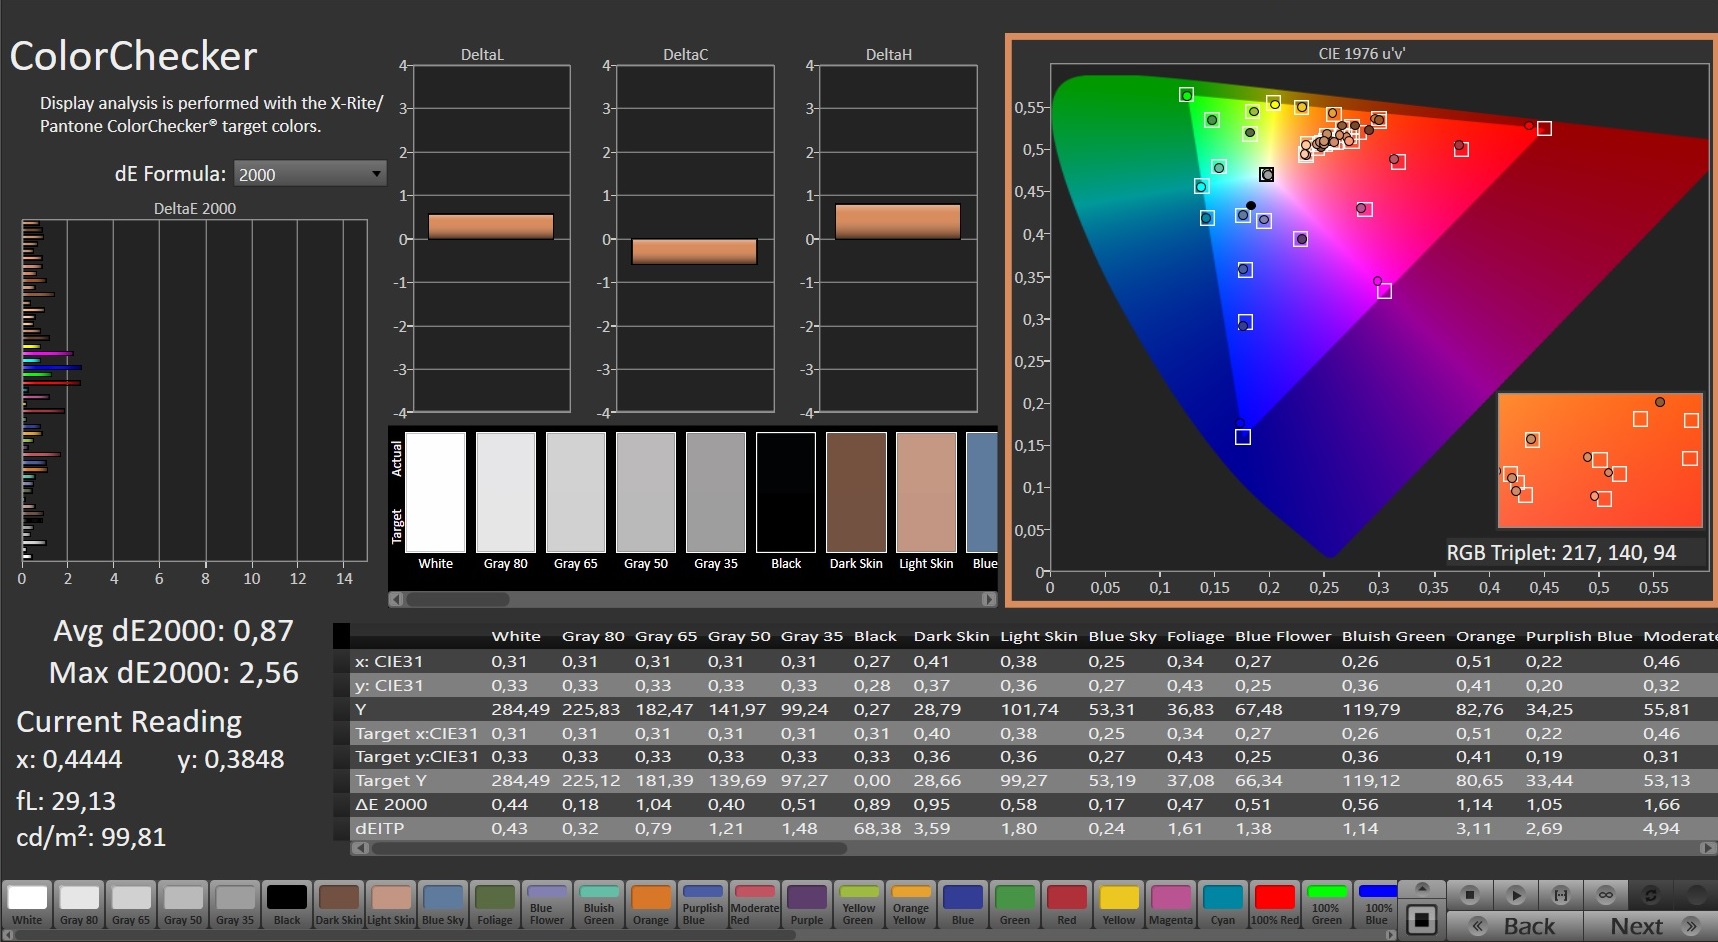
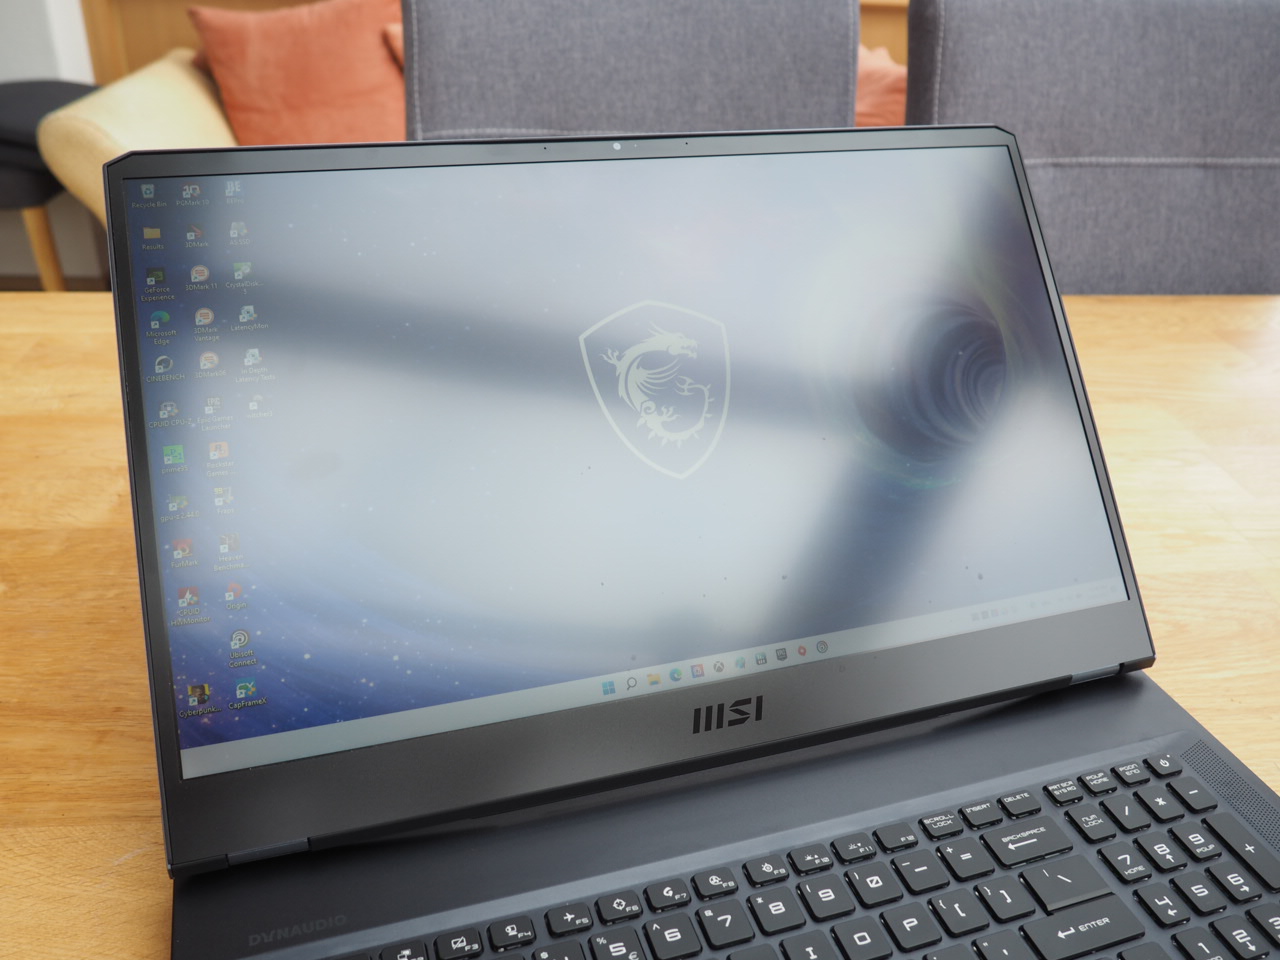
MSI utilise apparemment le même panneau AUOE295 que nous avons vu dans le GE76 Raider 11UH mais avec des améliorations sur plusieurs fronts. En plus d'une gamme de couleurs plus large (94 contre 74% sRGB), la précision des couleurs est également meilleure. Les écarts entre les niveaux de gris et les couleurs sont déjà très bons (DeltaE inférieur à 3) dans nos mesures CalMAN sans calibrage.
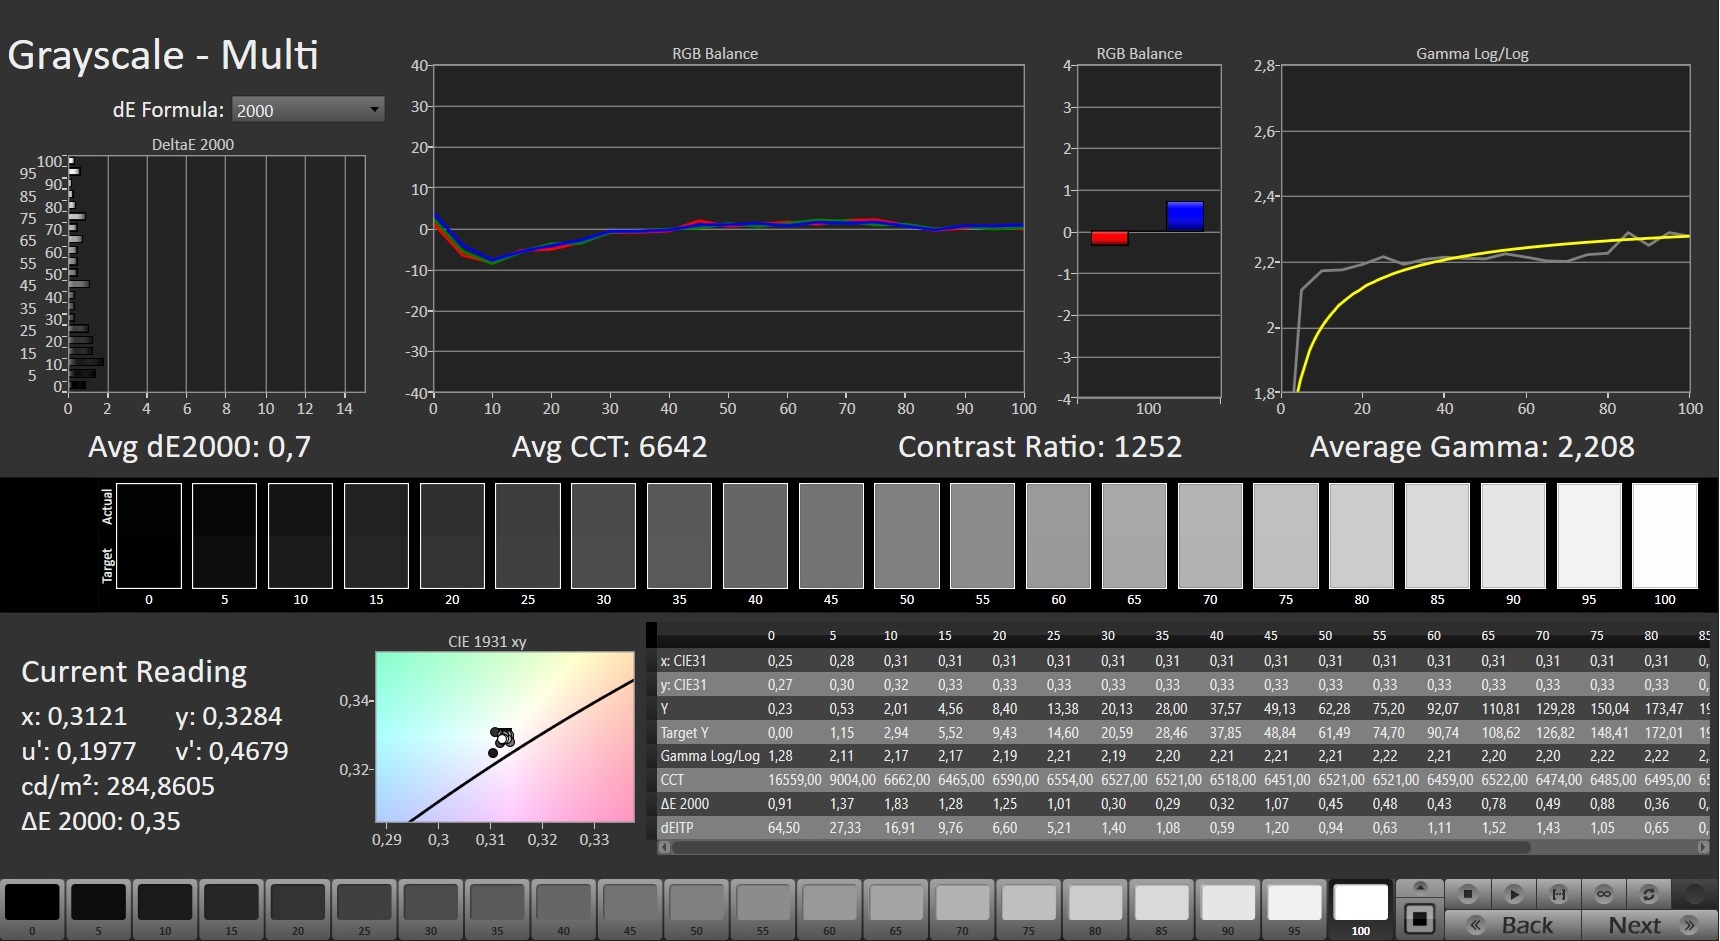
Toutes les autres mesures sont comparables. Une valeur de noir de 0,23 cd/m² est tout aussi respectable qu'un rapport de contraste de 1261:1. Le fabricant devrait cependant améliorer la luminosité. Une luminance moyenne de 290 nits pourrait être suffisante pour la plupart des scénarios en intérieur, mais le GE76 n'est pas génial en extérieur. En revanche, les temps de réponse sont excellents (<10 ms), de sorte que même les jeux de tir à la première personne rapides peuvent être joués sans limites.
| |||||||||||||||||||||||||
Homogénéité de la luminosité: 96 %
Valeur mesurée au centre, sur batterie: 290 cd/m²
Contraste: 1261:1 (Valeurs des noirs: 0.23 cd/m²)
ΔE ColorChecker Calman: 1.59 | ∀{0.5-29.43 Ø4.71}
calibrated: 0.87
ΔE Greyscale Calman: 2.5 | ∀{0.09-98 Ø4.96}
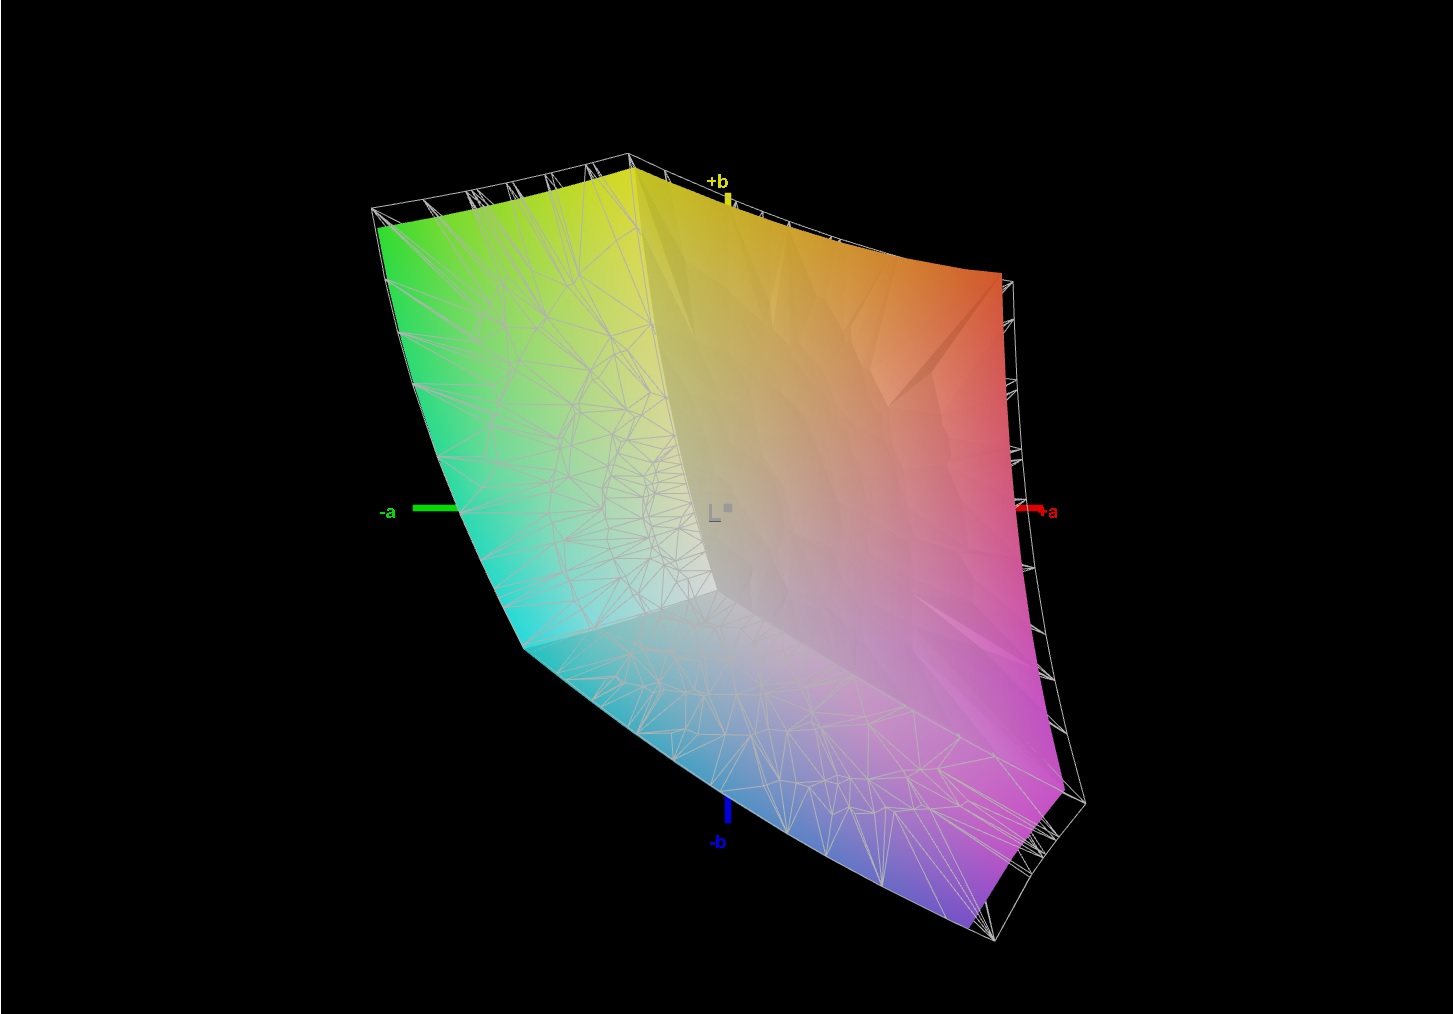
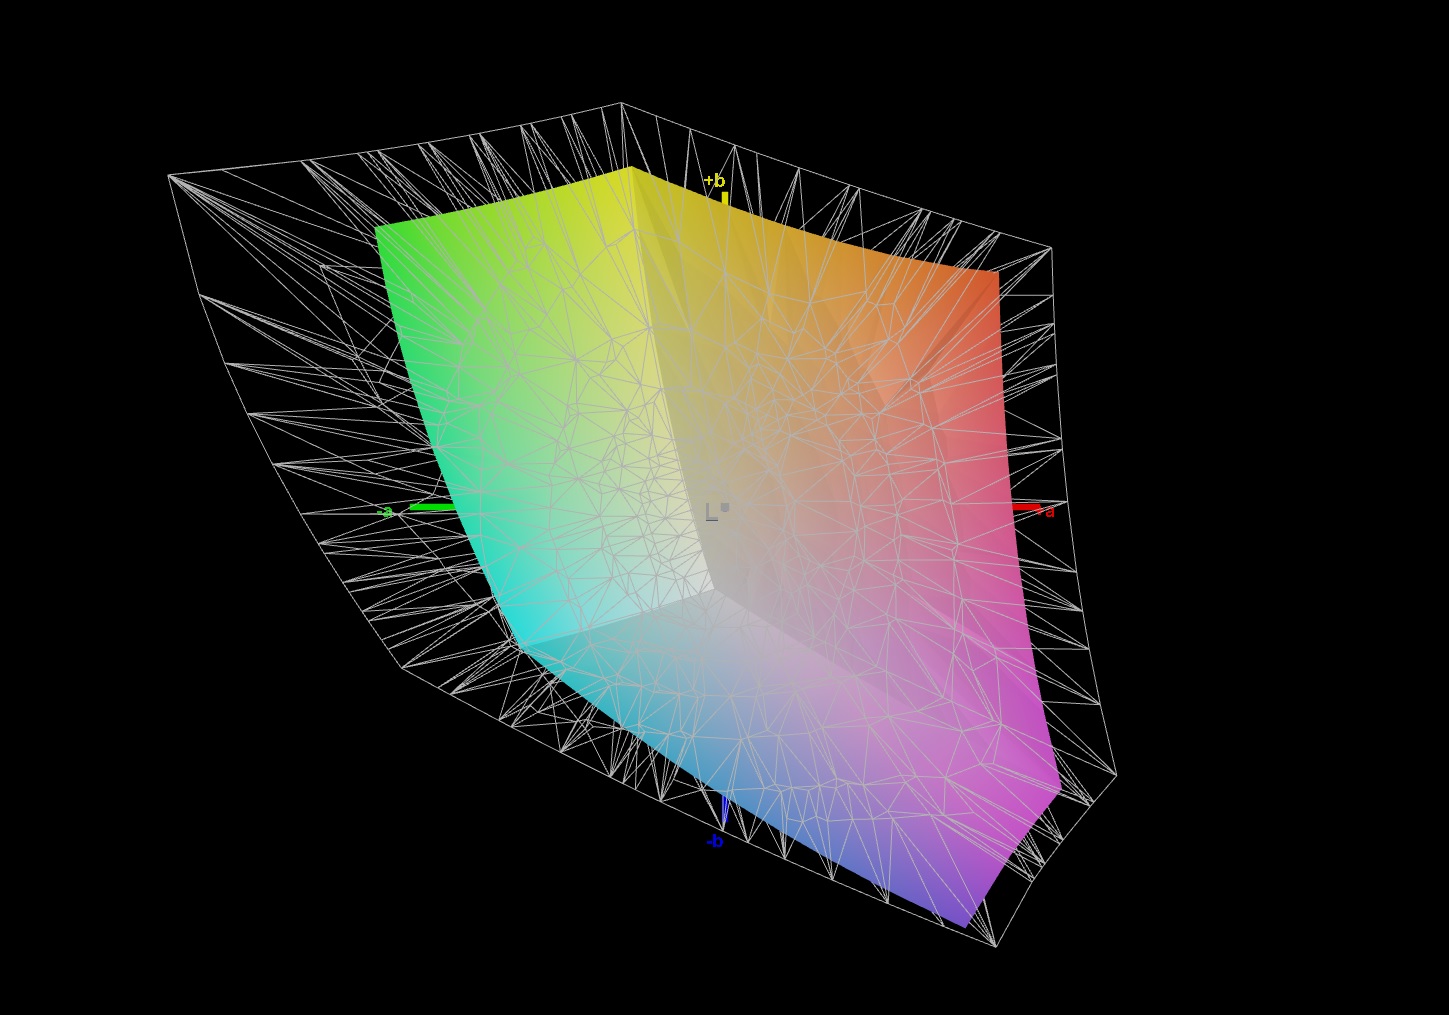
65.2% AdobeRGB 1998 (Argyll 3D)
94% sRGB (Argyll 3D)
63.1% Display P3 (Argyll 3D)
Gamma: 2.253
CCT: 6640 K
| MSI GE76 Raider AU Optronics B173HAN05.4 (AUOE295), IPS-Level, 1920x1080, 17.3" | Schenker XMG NEO 17 GM7TG8S BOE0977 (NE173QHM-NY2), IPS, 2560x1440, 17.3" | Alienware x17 RTX 3080 P48E AU Optronics B173ZAN, IPS, 3840x2160, 17.3" | Asus ROG Zephyrus S17 GX703HSD BOE099D (BOE CQ NE173QHM-NY3), IPS, 2560x1440, 17.3" | Schenker XMG Ultra 17 Rocket Lake AU Optronics B173HAN05.1, IPS, 1920x1080, 17.3" | |
|---|---|---|---|---|---|
| Display | 4% | 33% | 28% | 8% | |
| Display P3 Coverage (%) | 63.1 | 67.1 6% | 88.3 40% | 94.2 49% | 69.8 11% |
| sRGB Coverage (%) | 94 | 96.3 2% | 100 6% | 98.7 5% | 97.2 3% |
| AdobeRGB 1998 Coverage (%) | 65.2 | 68.6 5% | 100 53% | 84.4 29% | 72 10% |
| Response Times | -82% | -83% | 16% | 2% | |
| Response Time Grey 50% / Grey 80% * (ms) | 5.6 ? | 15.2 -171% | 14.4 ? -157% | 4.8 14% | 5.6 ? -0% |
| Response Time Black / White * (ms) | 9.6 ? | 8.8 8% | 10.4 ? -8% | 8 17% | 9.2 ? 4% |
| PWM Frequency (Hz) | |||||
| Screen | -7% | -36% | -40% | -10% | |
| Brightness middle (cd/m²) | 290 | 396 37% | 438.7 51% | 322 11% | 306 6% |
| Brightness (cd/m²) | 290 | 366 26% | 435 50% | 288 -1% | 299 3% |
| Brightness Distribution (%) | 96 | 82 -15% | 91 -5% | 72 -25% | 93 -3% |
| Black Level * (cd/m²) | 0.23 | 0.45 -96% | 0.48 -109% | 0.3 -30% | 0.22 4% |
| Contrast (:1) | 1261 | 880 -30% | 914 -28% | 1073 -15% | 1391 10% |
| Colorchecker dE 2000 * | 1.59 | 1.43 10% | 4.34 -173% | 3.05 -92% | 1.92 -21% |
| Colorchecker dE 2000 max. * | 3.17 | 2.2 31% | 7.3 -130% | 5.23 -65% | 4.78 -51% |
| Colorchecker dE 2000 calibrated * | 0.87 | 1.34 -54% | 0.72 17% | 1.92 -121% | 1.34 -54% |
| Greyscale dE 2000 * | 2.5 | 1.8 28% | 2.4 4% | 3.11 -24% | 2 20% |
| Gamma | 2.253 98% | 2.4 92% | 2.09 105% | 2.13 103% | 2.153 102% |
| CCT | 6640 98% | 6489 100% | 6413 101% | 6553 99% | 6738 96% |
| Color Space (Percent of AdobeRGB 1998) (%) | 84 | 72 | |||
| Color Space (Percent of sRGB) (%) | 99 | 93 | |||
| Moyenne finale (programmes/paramètres) | -28% /
-15% | -29% /
-28% | 1% /
-18% | 0% /
-4% |
* ... Moindre est la valeur, meilleures sont les performances
Temps de réponse de l'écran
| ↔ Temps de réponse noir à blanc | ||
|---|---|---|
| 9.6 ms ... hausse ↗ et chute ↘ combinées | ↗ 5.2 ms hausse | 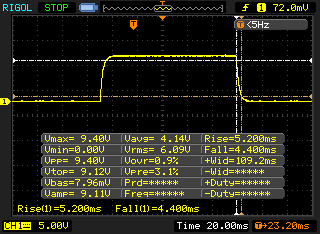 |
| ↘ 4.4 ms chute | ||
| L'écran montre de faibles temps de réponse, un bon écran pour jouer. En comparaison, tous les appareils testés affichent entre 0.1 (minimum) et 240 (maximum) ms. » 26 % des appareils testés affichent de meilleures performances. Cela signifie que les latences relevées sont meilleures que la moyenne (19.8 ms) de tous les appareils testés. | ||
| ↔ Temps de réponse gris 50% à gris 80% | ||
| 5.6 ms ... hausse ↗ et chute ↘ combinées | ↗ 2 ms hausse | 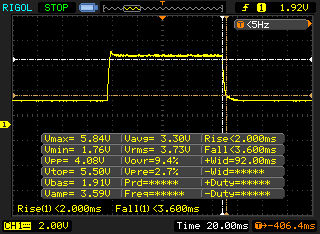 |
| ↘ 3.6 ms chute | ||
| L'écran montre de très faibles temps de réponse, parfait pour le jeu. En comparaison, tous les appareils testés affichent entre 0.165 (minimum) et 636 (maximum) ms. » 18 % des appareils testés affichent de meilleures performances. Cela signifie que les latences relevées sont meilleures que la moyenne (31 ms) de tous les appareils testés. | ||
Scintillement / MLI (Modulation de largeur d'impulsion)
| Scintillement / MLI (Modulation de largeur d'impulsion) non décelé | 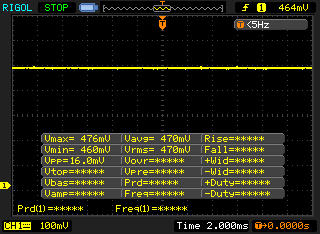 | ||
En comparaison, 52 % des appareils testés n'emploient pas MDI pour assombrir leur écran. Nous avons relevé une moyenne à 7754 (minimum : 5 - maximum : 343500) Hz dans le cas où une MDI était active. | |||
Performance
Grâce à son nouveau processeur haut de gamme et à son GPU phare, le GE76 Raider est de toute évidence l'un des ordinateurs portables de jeu les plus rapides du moment. 32 Go de RAM et un total de 4 To de stockage SSD constituent également une excellente base pour de nombreuses années de plaisir de jeu.
Conditions d'essai
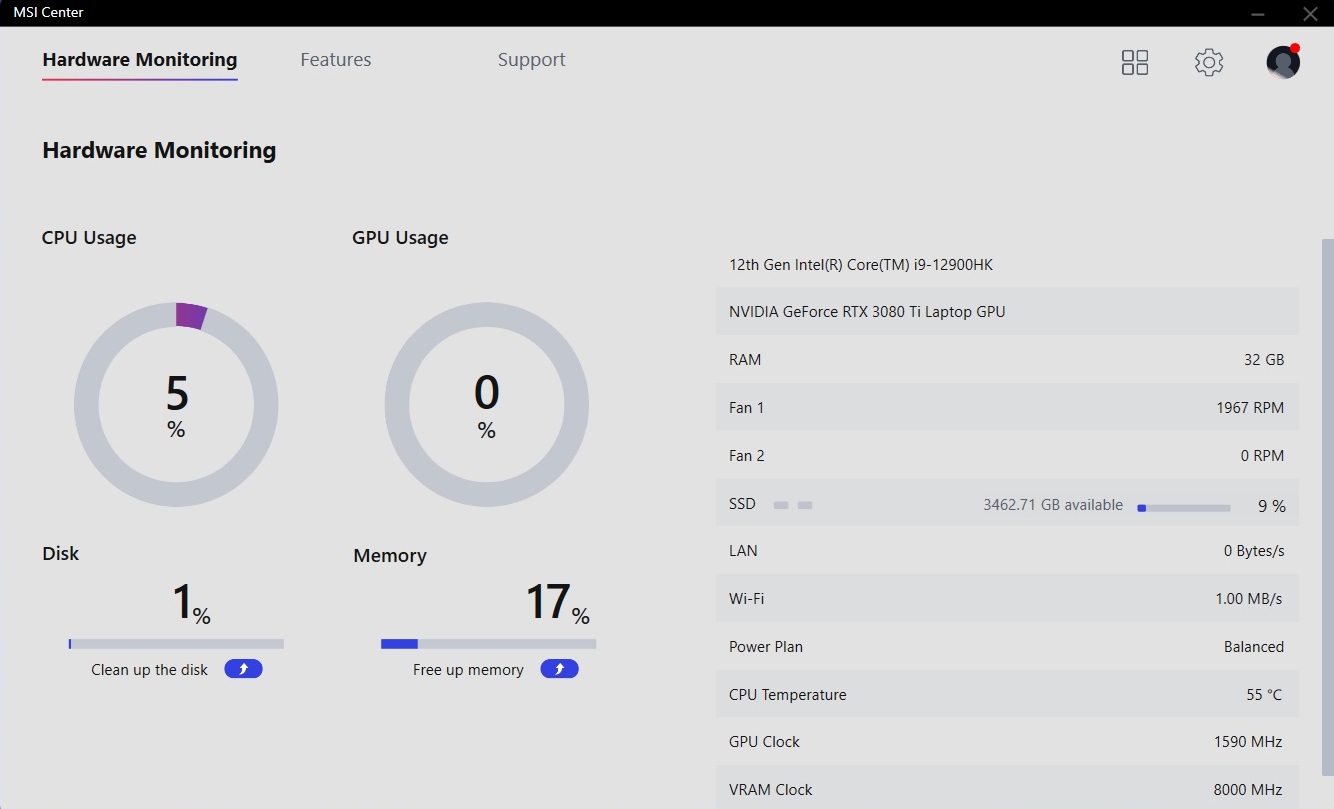
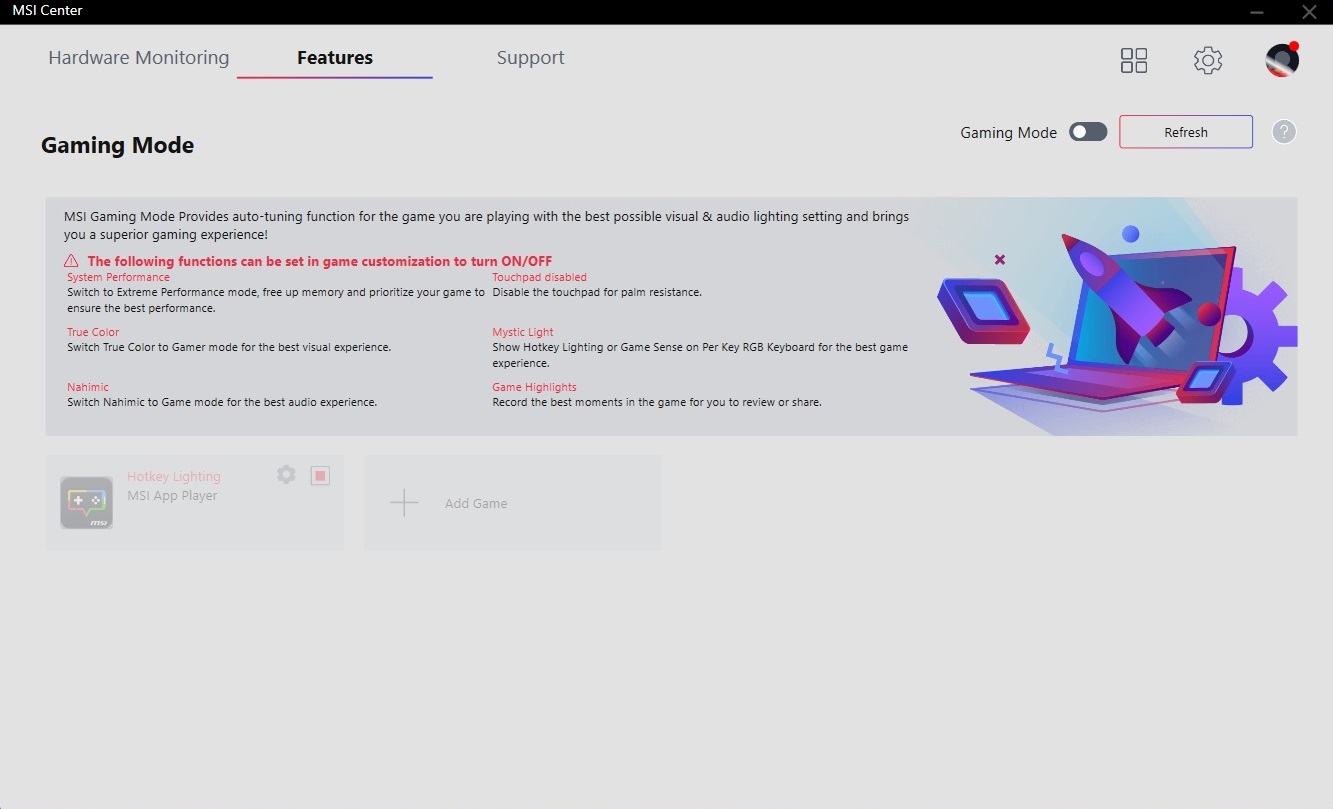
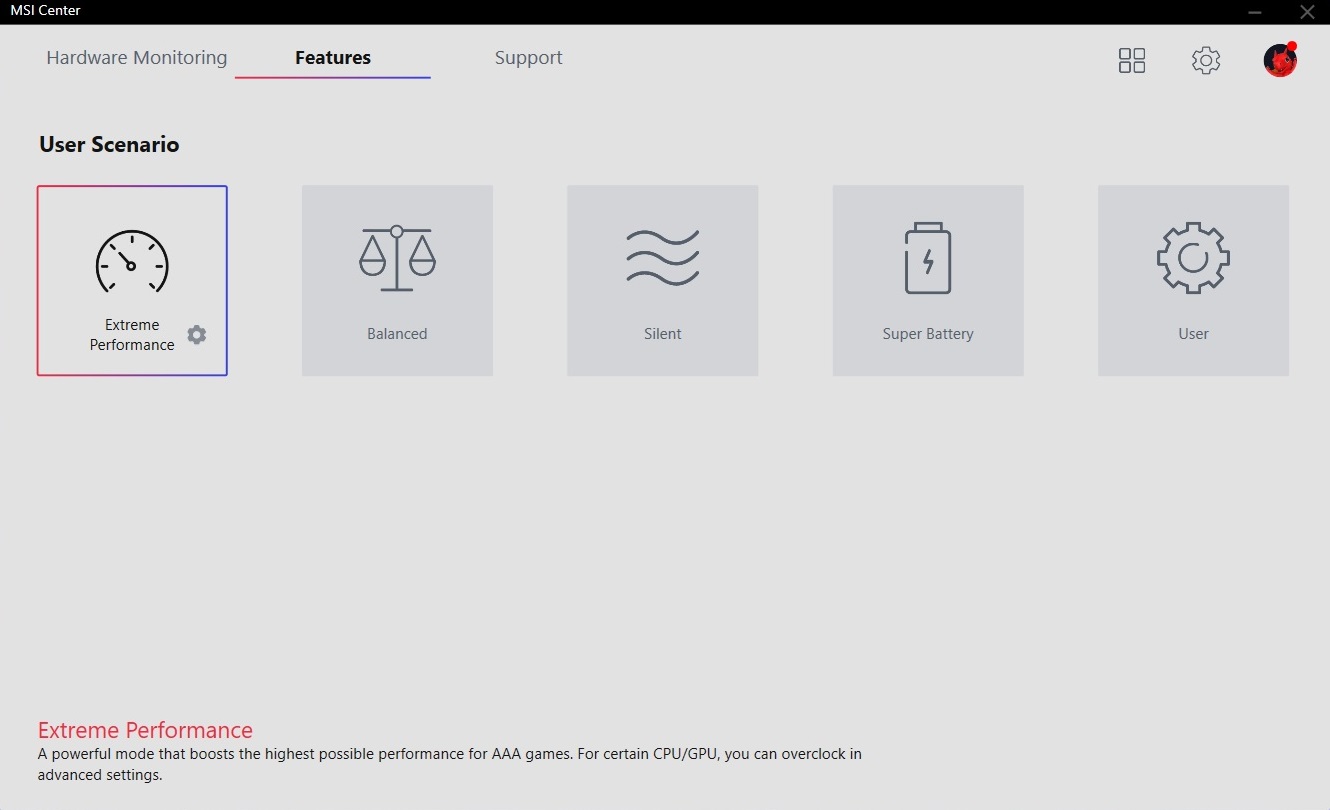
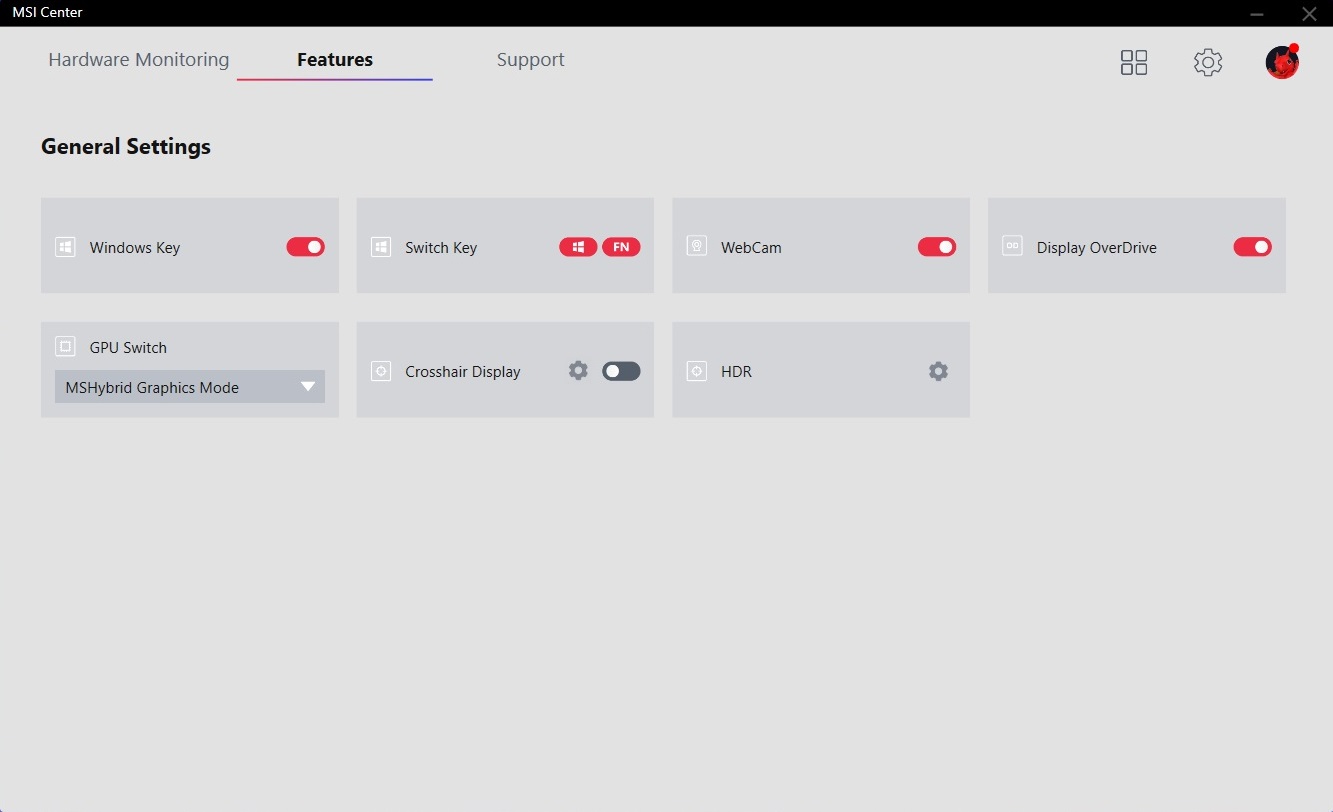
Comme nous l'attendons de MSI, l'ordinateur portable est livré avec un puissant logiciel de réglage fin. Le MSI Center préchargé vous permet de surveiller le matériel (charge, horloges, températures) et vous pouvez sélectionner différents modes d'alimentation.
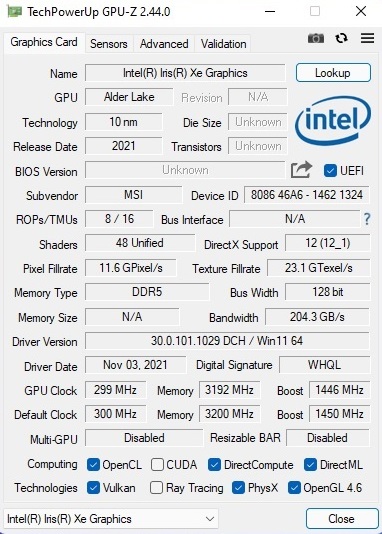
Nous avons décidé d'utiliser le profil Extreme Performance afin d'obtenir les meilleures performances possibles des composants. L'option Cooler Boost n'était pas active en raison de son bruit insupportable. Les benchmarks 3D et de jeu ci-dessous ont été réalisés avec la commutation graphique désactivée, mais nous avons activé la technologie Optimus lorsque nous avons effectué des tests pour d'autres sections de la revue (nous avons réglé le GPU Switch sur le mode graphique hybride MSI dans le MSI Center pour y parvenir). Les modes de performance disponibles et l'effet qu'ils ont sur le GPU/CPU sont listés dans le tableau ci-dessous.
| Scénario utilisateur du centre MSI | Performances extrêmes | Équilibré | Silencieux | Super batterie |
|---|---|---|---|---|
| CPU PL1 (HWiNFO) | 110 Watts | 110 Watts | 30 Watts | 15 Watts |
| CPU PL2 (HWiNFO) | 135 Watts | 135 Watts | 30 Watts | 15 Watts |
| Consommation de la carte GPU (GPU-Z) Witcher 3 | ~160 Watts | ~145 Watts | ~145 Watts | ~135 Watts |
| Bruit du ventilateur Witcher 3 | 53 dB(A) | 46 dB(A) | 37 dB(A) | 36 dB(A) |
Processeur
Comme indiqué précédemment, le Core i9-12900HK est actuellement le processeur pour ordinateur portable le plus rapide. Le modèle 10 nm de la génération Alder Lake est équipé de 6 cœurs de performance avec prise en charge de l'hyper threading ainsi que de 8 cœurs d'efficacité sans hyper threading. Le 12900HK offre également 24 Mo de cache L3 ; le K dans la désignation du modèle indique le multiplicateur libre
L'Iris Xe Graphics G7 intégré est une autre nouveauté des modèles H45. L'iGPU gère toutes les charges de travail légères comme la bureautique, la lecture de vidéos et la navigation sur Internet, ce qui améliore la consommation d'énergie et l'autonomie de la batterie, respectivement
Les performances sont très impressionnantes par rapport à l'ancienne génération Tiger Lake. D'après notre évaluation des performances, le GE76 est environ 30 à 50 % plus rapide que les ordinateurs portables équipés duCore i9-11900HetCore i7-11800Hrespectivement. Même le modèle de bureauCore i9-11900Kn'a aucune chance dans les benchmarks multi-cœurs. Les résultats baissent légèrement pendant la boucle Cinebench, mais le déficit de performance n'est pas si important.
Cinebench R15 Multi Loop
| CPU Performance rating - Percent | |
| Moyenne de la classe Gaming | |
| MSI GE76 Raider | |
| Schenker XMG Ultra 17 Rocket Lake | |
| Asus ROG Zephyrus S17 GX703HSD | |
| Alienware x17 RTX 3080 P48E -2! | |
| Schenker XMG NEO 17 GM7TG8S | |
* ... Moindre est la valeur, meilleures sont les performances
AIDA64: FP32 Ray-Trace | FPU Julia | CPU SHA3 | CPU Queen | FPU SinJulia | FPU Mandel | CPU AES | CPU ZLib | FP64 Ray-Trace | CPU PhotoWorxx
| Performance rating | |
| Moyenne de la classe Gaming | |
| Schenker XMG Ultra 17 Rocket Lake | |
| MSI GE76 Raider | |
| Schenker XMG NEO 17 GM7TG8S -9! | |
| Alienware x17 RTX 3080 P48E -9! | |
| Asus ROG Zephyrus S17 GX703HSD -9! | |
| AIDA64 / FP32 Ray-Trace | |
| Moyenne de la classe Gaming (10227 - 85542, n=105, 2 dernières années) | |
| Schenker XMG Ultra 17 Rocket Lake | |
| MSI GE76 Raider | |
| AIDA64 / FPU Julia | |
| Moyenne de la classe Gaming (51376 - 238426, n=105, 2 dernières années) | |
| Schenker XMG Ultra 17 Rocket Lake | |
| MSI GE76 Raider | |
| AIDA64 / CPU SHA3 | |
| Moyenne de la classe Gaming (2180 - 10115, n=105, 2 dernières années) | |
| Schenker XMG Ultra 17 Rocket Lake | |
| MSI GE76 Raider | |
| AIDA64 / CPU Queen | |
| Moyenne de la classe Gaming (49785 - 173351, n=90, 2 dernières années) | |
| MSI GE76 Raider | |
| Schenker XMG Ultra 17 Rocket Lake | |
| AIDA64 / FPU SinJulia | |
| Moyenne de la classe Gaming (4424 - 33636, n=105, 2 dernières années) | |
| Schenker XMG Ultra 17 Rocket Lake | |
| MSI GE76 Raider | |
| AIDA64 / FPU Mandel | |
| Moyenne de la classe Gaming (25115 - 128721, n=105, 2 dernières années) | |
| Schenker XMG Ultra 17 Rocket Lake | |
| MSI GE76 Raider | |
| AIDA64 / CPU AES | |
| Schenker XMG Ultra 17 Rocket Lake | |
| Moyenne de la classe Gaming (39258 - 247074, n=105, 2 dernières années) | |
| MSI GE76 Raider | |
| AIDA64 / CPU ZLib | |
| Moyenne de la classe Gaming (574 - 2531, n=105, 2 dernières années) | |
| MSI GE76 Raider | |
| Schenker XMG Ultra 17 Rocket Lake | |
| Asus ROG Zephyrus S17 GX703HSD | |
| Schenker XMG NEO 17 GM7TG8S | |
| Alienware x17 RTX 3080 P48E | |
| AIDA64 / FP64 Ray-Trace | |
| Moyenne de la classe Gaming (5509 - 45446, n=105, 2 dernières années) | |
| Schenker XMG Ultra 17 Rocket Lake | |
| MSI GE76 Raider | |
| AIDA64 / CPU PhotoWorxx | |
| Moyenne de la classe Gaming (12271 - 89891, n=105, 2 dernières années) | |
| MSI GE76 Raider | |
| Schenker XMG Ultra 17 Rocket Lake | |
Performance du système
Le MSI GE76 est également en tête du comparatif en termes de performances système avec 8000 points dans PCMark 10, ce qui était habituellement réservé à certains systèmes de bureau. Ce résultat n'est pas seulement dû à la combinaison coûteuse CPU/GPU, mais aussi aux disques durs solides rapides.
| PCMark 10 / Score | |
| Moyenne de la classe Gaming (5828 - 12414, n=93, 2 dernières années) | |
| MSI GE76 Raider | |
| Schenker XMG Ultra 17 Rocket Lake | |
| Alienware x17 RTX 3080 P48E | |
| Asus ROG Zephyrus S17 GX703HSD | |
| Schenker XMG NEO 17 GM7TG8S | |
| PCMark 10 / Essentials | |
| Schenker XMG Ultra 17 Rocket Lake | |
| MSI GE76 Raider | |
| Moyenne de la classe Gaming (8810 - 11935, n=97, 2 dernières années) | |
| Asus ROG Zephyrus S17 GX703HSD | |
| Schenker XMG NEO 17 GM7TG8S | |
| Alienware x17 RTX 3080 P48E | |
| PCMark 10 / Productivity | |
| Moyenne de la classe Gaming (6845 - 25323, n=95, 2 dernières années) | |
| MSI GE76 Raider | |
| Schenker XMG Ultra 17 Rocket Lake | |
| Alienware x17 RTX 3080 P48E | |
| Schenker XMG NEO 17 GM7TG8S | |
| Asus ROG Zephyrus S17 GX703HSD | |
| PCMark 10 / Digital Content Creation | |
| Moyenne de la classe Gaming (7602 - 19954, n=95, 2 dernières années) | |
| MSI GE76 Raider | |
| Schenker XMG Ultra 17 Rocket Lake | |
| Alienware x17 RTX 3080 P48E | |
| Asus ROG Zephyrus S17 GX703HSD | |
| Schenker XMG NEO 17 GM7TG8S | |
| PCMark 10 Score | 8007 points | |
Aide | ||
| AIDA64 / Memory Copy | |
| Moyenne de la classe Gaming (21750 - 129946, n=105, 2 dernières années) | |
| MSI GE76 Raider | |
| Moyenne Intel Core i9-12900HK (42967 - 62959, n=15) | |
| Schenker XMG Ultra 17 Rocket Lake | |
| AIDA64 / Memory Read | |
| Moyenne de la classe Gaming (22956 - 118858, n=105, 2 dernières années) | |
| MSI GE76 Raider | |
| Moyenne Intel Core i9-12900HK (44419 - 66989, n=15) | |
| Schenker XMG Ultra 17 Rocket Lake | |
| AIDA64 / Memory Write | |
| Moyenne de la classe Gaming (22297 - 135096, n=105, 2 dernières années) | |
| MSI GE76 Raider | |
| Moyenne Intel Core i9-12900HK (42144 - 65268, n=15) | |
| Schenker XMG Ultra 17 Rocket Lake | |
| AIDA64 / Memory Latency | |
| Moyenne de la classe Gaming (75.3 - 259, n=105, 2 dernières années) | |
| MSI GE76 Raider | |
| Moyenne Intel Core i9-12900HK (79.9 - 109, n=15) | |
| Schenker XMG Ultra 17 Rocket Lake | |
| Asus ROG Zephyrus S17 GX703HSD | |
| Schenker XMG NEO 17 GM7TG8S | |
| Alienware x17 RTX 3080 P48E | |
* ... Moindre est la valeur, meilleures sont les performances
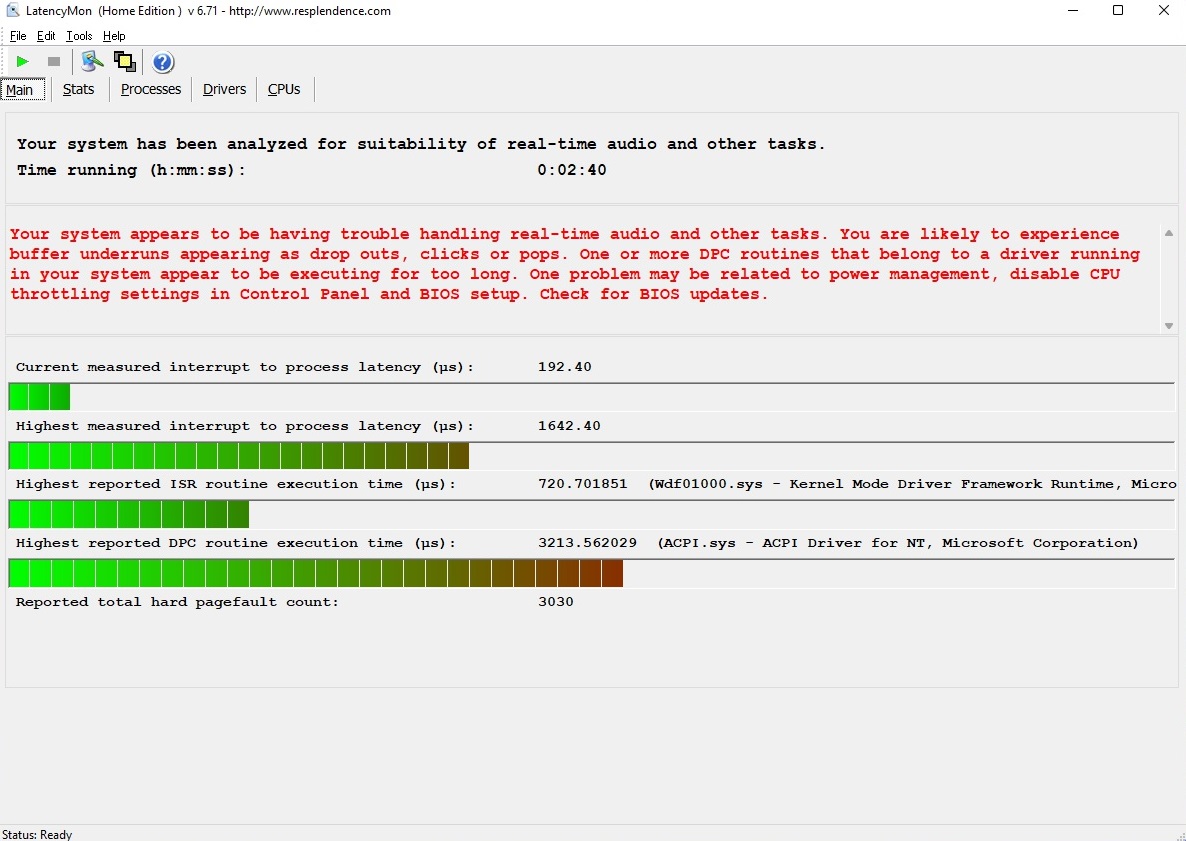
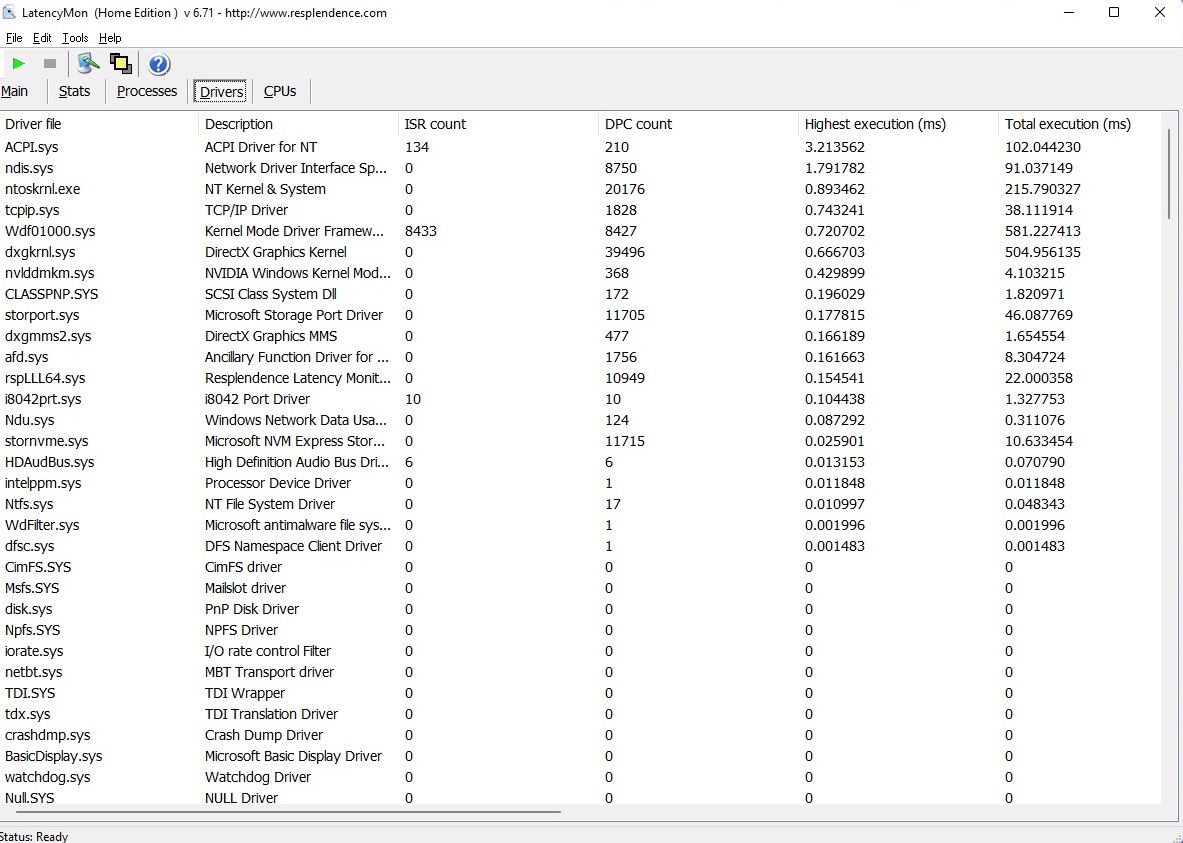
Latences DPC
Nous constatons une certaine marge d'amélioration dans le test de latence. L'outil LatencyMon indique quelques problèmes lorsque vous éditez des fichiers vidéo ou audio en temps réel, mais ce problème touche de nombreux ordinateurs portables et peut généralement être résolu par l'utilisateur avec quelques ajustements.
| DPC Latencies / LatencyMon - interrupt to process latency (max), Web, Youtube, Prime95 | |
| Schenker XMG NEO 17 GM7TG8S | |
| Alienware x17 RTX 3080 P48E | |
| MSI GE76 Raider | |
| Asus ROG Zephyrus S17 GX703HSD | |
| Schenker XMG Ultra 17 Rocket Lake | |
* ... Moindre est la valeur, meilleures sont les performances
Stockage
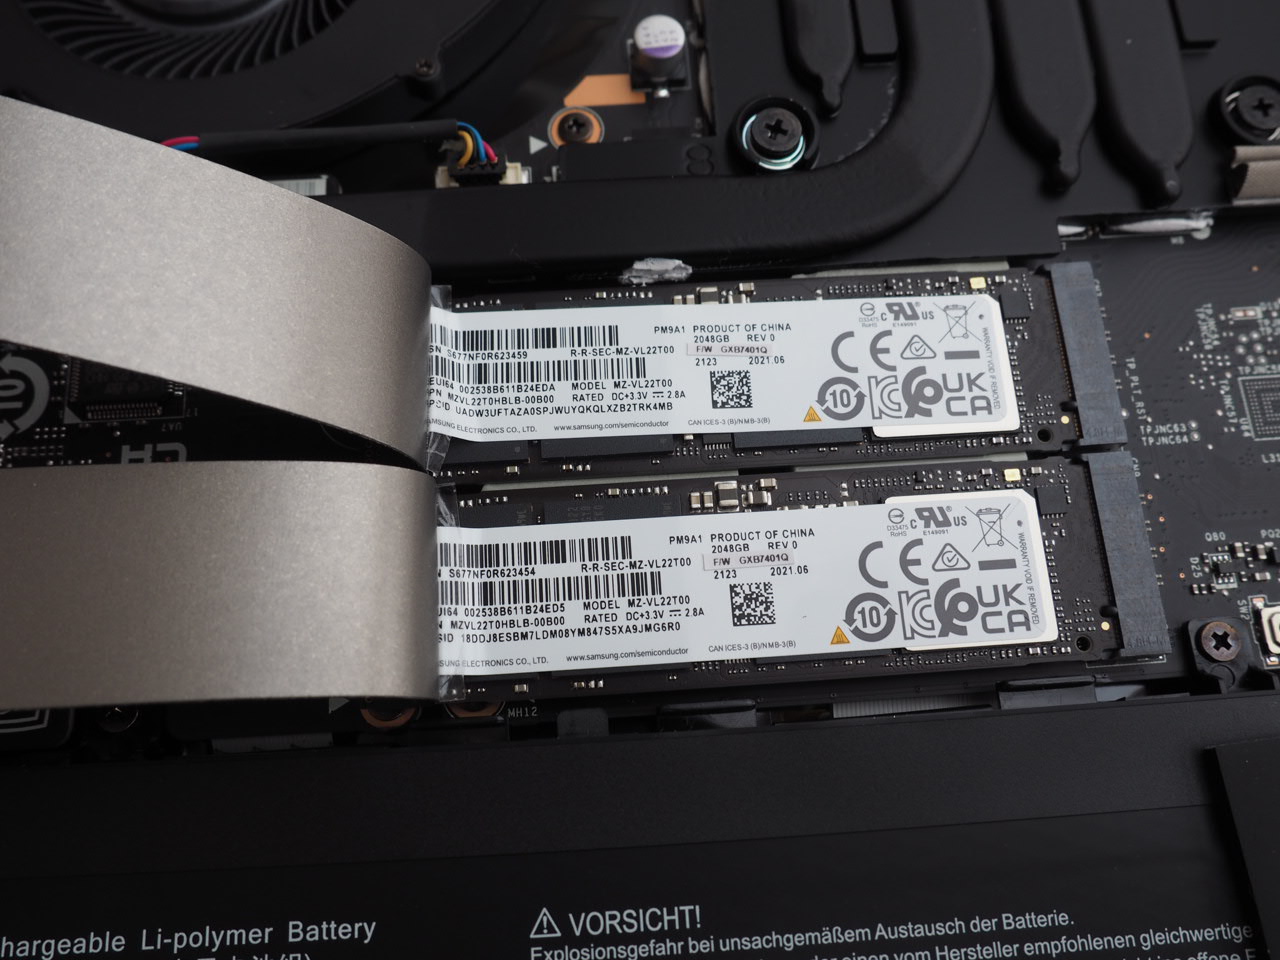
La solution de stockage est très impressionnante : MSI a équipé les deux emplacements M.2 de la version 2 To du Samsung PM9A1, qui atteint des taux de transfert élevés grâce à l'interface PCIe-x4. Des taux de transfert séquentiels en lecture et en écriture de plus de 5000 Mo/s et 3000 Mo/s (AS SSD Benchmark), respectivement, auraient été impensables il y a quelques années.

| Drive Performance rating - Percent | |
| Asus ROG Zephyrus S17 GX703HSD | |
| MSI GE76 Raider | |
| Schenker XMG NEO 17 GM7TG8S | |
| Schenker XMG Ultra 17 Rocket Lake | |
| Moyenne de la classe Gaming | |
| Alienware x17 RTX 3080 P48E | |
* ... Moindre est la valeur, meilleures sont les performances
Disk Throttling: DiskSpd Read Loop, Queue Depth 8
Performances du GPU
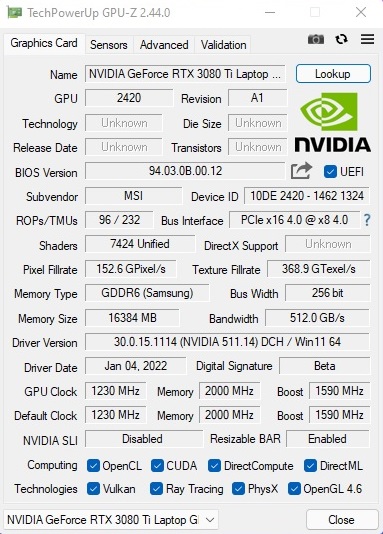
Le gros point fort du GE76 Raider sera la carte graphique pour de nombreux utilisateurs. La nouvelle GeForce RTX 3080 Ti de Nvidia est un véritable monstre de performance, qui - comme on le sait avec les autres GPU Ampère - peut avoir des performances très différentes selon les réglages TGP.
MSI ne fait aucun compromis et utilise le TGP maximum de 175 Watts (Dynamic Boost inclus) pour la RTX 3080 Ti. Cela signifie que le GE76 bat tous les ordinateurs portables précédents dans nos benchmarks, mais l'avantage sur la RTX 3080 avec des réglages TGP élevés n'est pas énorme dans les tests 3DMark. Il ne faut pas s'attendre à un avantage de plus de 10-20% (la différence est souvent beaucoup plus importante dans les tests de jeu 4K). Tous les modèles de la RTX 3080 Ti sont équipés de 16 Go de GDDR6-VRAM, alors que certaines versions de la RTX 3080 étaient équipées de seulement 8 Go. Veuillez consulter notresection techniqueet notreAnalyse des performancespour plus de détails techniques.
| 3DMark Performance rating - Percent | |
| Moyenne de la classe Gaming | |
| MSI GE76 Raider | |
| Schenker XMG Ultra 17 Rocket Lake | |
| Schenker XMG NEO 17 GM7TG8S -1! | |
| Alienware x17 RTX 3080 P48E | |
| Asus ROG Zephyrus S17 GX703HSD -1! | |
| 3DMark 06 Standard Score | 56967 points | |
| 3DMark Vantage P Result | 94760 points | |
| 3DMark 11 Performance | 36650 points | |
| 3DMark Cloud Gate Standard Score | 66067 points | |
| 3DMark Fire Strike Score | 27992 points | |
| 3DMark Time Spy Score | 13413 points | |
Aide | ||
Performances en matière de jeux
Le GE76 est le premier appareil équipé de la RTX 3080 Ti, nous avons donc testé plus de 30 jeux avec différents paramètres et résolutions - en commençant par 1080p/Moyen jusqu'à 4K/Ultra (voir tableau).
Résultat : Le nouveau fleuron de Nvidia n'est pas intimidé par les titres exigeants. La plupart des jeux tourneront à plus de 60 fps, même avec 3840 x 2160 pixels et les paramètres maximums. Il n'y a qu'une poignée d'exceptions (commeCyberpunk 2077&Crysis Remastered) où vous devez réduire les paramètres et/ou la résolution, mais cela est plus probablement dû au codage qu'aux performances du GPU. La RTX 3080 Ti est également bien adaptée au Ray Tracing.
| Performance rating - Percent | |
| MSI GE76 Raider -167! | |
| Schenker XMG Ultra 17 Rocket Lake -289! | |
| XMG Neo 15 @165 W TGP -160! | |
| Schenker XMG NEO 17 GM7TG8S -308! | |
| XMG Neo 17 @140 W TGP -155! | |
| Alienware x17 RTX 3080 P48E -300! | |
| Asus ROG Zephyrus S17 GX703HSD -307! | |
| The Witcher 3 v4 | |
| 1920x1080 RT Ultra Preset / On AA:FX | |
| XMG Neo 15 @165 W TGP | |
| XMG Neo 17 @140 W TGP | |
| 2560x1440 Ultra Preset / On AA:FX | |
| XMG Neo 15 @165 W TGP | |
| XMG Neo 17 @140 W TGP | |
| 1920x1080 Ultra Preset / On AA:FX | |
| XMG Neo 15 @165 W TGP | |
| XMG Neo 17 @140 W TGP | |
| 1920x1080 High Preset / On AA:FX | |
| XMG Neo 15 @165 W TGP | |
| XMG Neo 17 @140 W TGP | |
| 1920x1080 Medium Preset / On AA:FX | |
| XMG Neo 15 @165 W TGP | |
| XMG Neo 17 @140 W TGP | |
| 1920x1080 Low Preset / Off | |
| XMG Neo 15 @165 W TGP | |
| XMG Neo 17 @140 W TGP | |
| Need for Speed Unbound | |
| 2560x1440 Ultra Preset | |
| XMG Neo 15 @165 W TGP | |
| XMG Neo 17 @140 W TGP | |
| 1920x1080 Ultra Preset | |
| XMG Neo 15 @165 W TGP | |
| XMG Neo 17 @140 W TGP | |
| 1920x1080 High Preset | |
| XMG Neo 15 @165 W TGP | |
| XMG Neo 17 @140 W TGP | |
| 1920x1080 Medium Preset | |
| XMG Neo 15 @165 W TGP | |
| XMG Neo 17 @140 W TGP | |
| 1920x1080 Low Preset | |
| XMG Neo 15 @165 W TGP | |
| XMG Neo 17 @140 W TGP | |
| The Callisto Protocol | |
| 1920x1080 Ultra Preset (without FSR Upscaling) + Full Ray-Tracing | |
| XMG Neo 15 @165 W TGP | |
| XMG Neo 17 @140 W TGP | |
| 3840x2160 Ultra Preset (without FSR Upscaling) | |
| XMG Neo 15 @165 W TGP | |
| XMG Neo 17 @140 W TGP | |
| 2560x1440 Ultra Preset (without FSR Upscaling) | |
| XMG Neo 15 @165 W TGP | |
| XMG Neo 17 @140 W TGP | |
| 1920x1080 Ultra Preset (without FSR Upscaling) | |
| XMG Neo 15 @165 W TGP | |
| XMG Neo 17 @140 W TGP | |
| 1920x1080 High Preset (without FSR Upscaling) | |
| XMG Neo 15 @165 W TGP | |
| XMG Neo 17 @140 W TGP | |
| 1920x1080 Medium Preset (without FSR Upscaling) | |
| XMG Neo 15 @165 W TGP | |
| XMG Neo 17 @140 W TGP | |
| Spider-Man Miles Morales | |
| 1920x0180 Very High Preset + Ray-Tracing AA:T | |
| XMG Neo 15 @165 W TGP | |
| XMG Neo 17 @140 W TGP | |
| 3840x2160 Very High Preset AA:T | |
| XMG Neo 15 @165 W TGP | |
| XMG Neo 17 @140 W TGP | |
| 2560x1440 Very High Preset AA:T | |
| XMG Neo 15 @165 W TGP | |
| XMG Neo 17 @140 W TGP | |
| 1920x1080 Very High Preset AA:T | |
| XMG Neo 15 @165 W TGP | |
| XMG Neo 17 @140 W TGP | |
| 1920x1080 High Preset AA:T | |
| XMG Neo 15 @165 W TGP | |
| XMG Neo 17 @140 W TGP | |
| 1920x1080 Medium Preset AA:SM | |
| XMG Neo 15 @165 W TGP | |
| XMG Neo 17 @140 W TGP | |
| Uncharted Legacy of Thieves Collection | |
| 3840x2160 Ultra Preset | |
| XMG Neo 15 @165 W TGP | |
| XMG Neo 17 @140 W TGP | |
| 2560x1440 Ultra Preset | |
| XMG Neo 15 @165 W TGP | |
| XMG Neo 17 @140 W TGP | |
| 1920x1080 Ultra Preset | |
| XMG Neo 15 @165 W TGP | |
| XMG Neo 17 @140 W TGP | |
| 1920x1080 High Preset | |
| XMG Neo 15 @165 W TGP | |
| XMG Neo 17 @140 W TGP | |
| 1920x1080 Medium Preset | |
| XMG Neo 15 @165 W TGP | |
| XMG Neo 17 @140 W TGP | |
| A Plague Tale Requiem | |
| 3840x2160 Ultra Preset | |
| XMG Neo 15 @165 W TGP | |
| XMG Neo 17 @140 W TGP | |
| 2560x1440 Ultra Preset | |
| XMG Neo 15 @165 W TGP | |
| XMG Neo 17 @140 W TGP | |
| 1920x1080 Ultra Preset | |
| XMG Neo 15 @165 W TGP | |
| XMG Neo 17 @140 W TGP | |
| 1920x1080 High Preset | |
| XMG Neo 15 @165 W TGP | |
| XMG Neo 17 @140 W TGP | |
| 1920x1080 Medium Preset | |
| XMG Neo 15 @165 W TGP | |
| XMG Neo 17 @140 W TGP | |
| Call of Duty Modern Warfare 2 2022 | |
| 3840x2160 Extreme Quality Preset AA:T2X Filmic SM | |
| XMG Neo 15 @165 W TGP | |
| XMG Neo 17 @140 W TGP | |
| 2560x1440 Extreme Quality Preset AA:T2X Filmic SM | |
| XMG Neo 15 @165 W TGP | |
| XMG Neo 17 @140 W TGP | |
| 1920x1080 Extreme Quality Preset AA:T2X Filmic SM | |
| XMG Neo 15 @165 W TGP | |
| XMG Neo 17 @140 W TGP | |
| 1920x1080 Ultra Quality Preset AA:T2X Filmic SM | |
| XMG Neo 15 @165 W TGP | |
| XMG Neo 17 @140 W TGP | |
| 1920x1080 Balanced Quality Preset AA:T2X SM | |
| XMG Neo 15 @165 W TGP | |
| XMG Neo 17 @140 W TGP | |
| FIFA 23 | |
| 3840x2160 Ultra Rendering Quality | |
| XMG Neo 15 @165 W TGP | |
| XMG Neo 17 @140 W TGP | |
| 2560x1440 Ultra Rendering Quality | |
| XMG Neo 15 @165 W TGP | |
| XMG Neo 17 @140 W TGP | |
| 1920x1080 Ultra Rendering Quality | |
| XMG Neo 15 @165 W TGP | |
| XMG Neo 17 @140 W TGP | |
| 1920x1080 High Rendering Quality | |
| XMG Neo 15 @165 W TGP | |
| XMG Neo 17 @140 W TGP | |
| 1920x1080 Medium Rendering Quality | |
| XMG Neo 15 @165 W TGP | |
| XMG Neo 17 @140 W TGP | |
| F1 22 | |
| 3840x2160 Ultra High Preset AA:T AF:16x | |
| XMG Neo 15 @165 W TGP | |
| XMG Neo 17 @140 W TGP | |
| 2560x1440 Ultra High Preset AA:T AF:16x | |
| XMG Neo 15 @165 W TGP | |
| XMG Neo 17 @140 W TGP | |
| 1920x1080 Ultra High Preset AA:T AF:16x | |
| XMG Neo 15 @165 W TGP | |
| XMG Neo 17 @140 W TGP | |
| 1920x1080 High Preset AA:T AF:16x | |
| XMG Neo 15 @165 W TGP | |
| XMG Neo 17 @140 W TGP | |
| 1920x1080 Medium Preset AA:T AF:16x | |
| XMG Neo 15 @165 W TGP | |
| XMG Neo 17 @140 W TGP | |
| The Quarry | |
| 3840x2160 Ultra Preset | |
| XMG Neo 15 @165 W TGP | |
| XMG Neo 17 @140 W TGP | |
| 2560x1440 Ultra Preset | |
| XMG Neo 15 @165 W TGP | |
| XMG Neo 17 @140 W TGP | |
| 1920x1080 Ultra Preset | |
| XMG Neo 15 @165 W TGP | |
| XMG Neo 17 @140 W TGP | |
| 1920x1080 High Preset | |
| XMG Neo 15 @165 W TGP | |
| XMG Neo 17 @140 W TGP | |
| 1920x1080 Medium Preset | |
| XMG Neo 15 @165 W TGP | |
| XMG Neo 17 @140 W TGP | |
| Vampire Bloodhunt | |
| 3840x2160 Ultra Preset | |
| XMG Neo 15 @165 W TGP | |
| XMG Neo 17 @140 W TGP | |
| 2560x1440 Ultra Preset | |
| XMG Neo 15 @165 W TGP | |
| XMG Neo 17 @140 W TGP | |
| 1920x1080 Ultra Preset | |
| XMG Neo 15 @165 W TGP | |
| XMG Neo 17 @140 W TGP | |
| 1920x1080 High Preset | |
| XMG Neo 15 @165 W TGP | |
| XMG Neo 17 @140 W TGP | |
| 1920x1080 Medium Preset | |
| XMG Neo 15 @165 W TGP | |
| XMG Neo 17 @140 W TGP | |
| Tiny Tina's Wonderlands | |
| 3840x2160 Badass Preset (DX12) | |
| XMG Neo 15 @165 W TGP | |
| XMG Neo 17 @140 W TGP | |
| 2560x1440 Badass Preset (DX12) | |
| XMG Neo 15 @165 W TGP | |
| XMG Neo 17 @140 W TGP | |
| 1920x1080 Badass Preset (DX12) | |
| XMG Neo 15 @165 W TGP | |
| XMG Neo 17 @140 W TGP | |
| 1920x1080 High Preset (DX12) | |
| XMG Neo 15 @165 W TGP | |
| XMG Neo 17 @140 W TGP | |
| 1920x1080 Medium Preset (DX12) | |
| XMG Neo 15 @165 W TGP | |
| XMG Neo 17 @140 W TGP | |
| Ghostwire Tokyo | |
| 1920x1080 Highest Settings + Maximum Ray Tracing | |
| XMG Neo 15 @165 W TGP | |
| XMG Neo 17 @140 W TGP | |
| 3840x2160 Highest Settings | |
| XMG Neo 15 @165 W TGP | |
| XMG Neo 17 @140 W TGP | |
| 2560x1440 Highest Settings | |
| XMG Neo 15 @165 W TGP | |
| XMG Neo 17 @140 W TGP | |
| 1920x1080 Highest Settings | |
| XMG Neo 15 @165 W TGP | |
| XMG Neo 17 @140 W TGP | |
| 1920x1080 High Settings | |
| XMG Neo 15 @165 W TGP | |
| XMG Neo 17 @140 W TGP | |
| 1920x1080 Medium Settings | |
| XMG Neo 15 @165 W TGP | |
| XMG Neo 17 @140 W TGP | |
| Elden Ring | |
| 3840x2160 Maximum Preset | |
| XMG Neo 15 @165 W TGP | |
| XMG Neo 17 @140 W TGP | |
| 2560x1440 Maximum Preset | |
| XMG Neo 17 @140 W TGP | |
| XMG Neo 15 @165 W TGP | |
| 1920x1080 Maximum Preset | |
| XMG Neo 17 @140 W TGP | |
| XMG Neo 15 @165 W TGP | |
| 1920x1080 High Preset | |
| XMG Neo 17 @140 W TGP | |
| XMG Neo 15 @165 W TGP | |
| 1920x1080 Medium Preset | |
| XMG Neo 17 @140 W TGP | |
| XMG Neo 15 @165 W TGP | |
| Elex 2 | |
| 3840x2160 Ultra / On AA:SM AF:16x | |
| XMG Neo 15 @165 W TGP | |
| XMG Neo 17 @140 W TGP | |
| 2560x1440 Ultra / On AA:SM AF:16x | |
| XMG Neo 15 @165 W TGP | |
| XMG Neo 17 @140 W TGP | |
| 1920x1080 Ultra / On AA:SM AF:16x | |
| XMG Neo 15 @165 W TGP | |
| XMG Neo 17 @140 W TGP | |
| 1920x1080 High / On AA:FX AF:16x | |
| XMG Neo 17 @140 W TGP | |
| XMG Neo 15 @165 W TGP | |
| 1920x1080 Medium / On AA:FX AF:16x | |
| XMG Neo 17 @140 W TGP | |
| XMG Neo 15 @165 W TGP | |
| Cyberpunk 2077 1.6 | |
| 3840x2160 Ray Tracing Ultra Preset (DLSS off) | |
| XMG Neo 15 @165 W TGP | |
| XMG Neo 17 @140 W TGP | |
| 1920x1080 Ray Tracing Ultra Preset (DLSS off) | |
| XMG Neo 15 @165 W TGP | |
| XMG Neo 17 @140 W TGP | |
| 3840x2160 Ultra Preset | |
| XMG Neo 17 @140 W TGP | |
| 2560x1440 Ultra Preset | |
| XMG Neo 17 @140 W TGP | |
| 1920x1080 Ultra Preset | |
| XMG Neo 17 @140 W TGP | |
| 1920x1080 High Preset | |
| XMG Neo 17 @140 W TGP | |
| 1920x1080 Medium Preset | |
| XMG Neo 17 @140 W TGP | |
| GRID Legends | |
| 3840x2160 Ultra Preset | |
| XMG Neo 15 @165 W TGP | |
| XMG Neo 17 @140 W TGP | |
| 2560x1440 Ultra Preset | |
| XMG Neo 15 @165 W TGP | |
| XMG Neo 17 @140 W TGP | |
| 1920x1080 Ultra Preset | |
| XMG Neo 15 @165 W TGP | |
| XMG Neo 17 @140 W TGP | |
| 1920x1080 High Preset | |
| XMG Neo 15 @165 W TGP | |
| XMG Neo 17 @140 W TGP | |
| 1920x1080 Medium Preset | |
| XMG Neo 15 @165 W TGP | |
| XMG Neo 17 @140 W TGP | |
| Dying Light 2 | |
| 1920x1080 High Quality Raytracing | |
| XMG Neo 15 @165 W TGP | |
| XMG Neo 17 @140 W TGP | |
| 3840x2160 High Quality | |
| XMG Neo 15 @165 W TGP | |
| XMG Neo 17 @140 W TGP | |
| 2560x1440 High Quality | |
| XMG Neo 15 @165 W TGP | |
| XMG Neo 17 @140 W TGP | |
| 1920x1080 High Quality | |
| XMG Neo 15 @165 W TGP | |
| XMG Neo 17 @140 W TGP | |
| 1920x1080 Medium Quality | |
| XMG Neo 15 @165 W TGP | |
| XMG Neo 17 @140 W TGP | |
| Rainbow Six Extraction | |
| 3840x2160 Ultra Preset (with Fixed Resolution Quality) | |
| XMG Neo 15 @165 W TGP | |
| XMG Neo 17 @140 W TGP | |
| 2560x1440 Ultra Preset (with Fixed Resolution Quality) | |
| XMG Neo 15 @165 W TGP | |
| XMG Neo 17 @140 W TGP | |
| 1920x1080 Ultra Preset (with Fixed Resolution Quality) | |
| XMG Neo 15 @165 W TGP | |
| XMG Neo 17 @140 W TGP | |
| 1920x1080 High Preset (with Fixed Resolution Quality) | |
| XMG Neo 15 @165 W TGP | |
| XMG Neo 17 @140 W TGP | |
| 1920x1080 Medium Preset (with Fixed Resolution Quality) | |
| XMG Neo 15 @165 W TGP | |
| XMG Neo 17 @140 W TGP | |
| God of War | |
| 3840x2160 Ultra Preset | |
| MSI GE76 Raider | |
| XMG Neo 15 @165 W TGP | |
| XMG Neo 17 @140 W TGP | |
| 2560x1440 Ultra Preset | |
| MSI GE76 Raider | |
| XMG Neo 15 @165 W TGP | |
| XMG Neo 17 @140 W TGP | |
| 1920x1080 Ultra Preset | |
| MSI GE76 Raider | |
| XMG Neo 15 @165 W TGP | |
| XMG Neo 17 @140 W TGP | |
| 1920x1080 High Preset | |
| MSI GE76 Raider | |
| XMG Neo 15 @165 W TGP | |
| XMG Neo 17 @140 W TGP | |
| 1920x1080 Original Preset | |
| MSI GE76 Raider | |
| XMG Neo 15 @165 W TGP | |
| XMG Neo 17 @140 W TGP | |
| Halo Infinite | |
| 3840x2160 Ultra Preset | |
| MSI GE76 Raider | |
| XMG Neo 15 @165 W TGP | |
| XMG Neo 17 @140 W TGP | |
| 2560x1440 Ultra Preset | |
| MSI GE76 Raider | |
| XMG Neo 15 @165 W TGP | |
| XMG Neo 17 @140 W TGP | |
| 1920x1080 Ultra Preset | |
| MSI GE76 Raider | |
| XMG Neo 15 @165 W TGP | |
| XMG Neo 17 @140 W TGP | |
| 1920x1080 High Preset | |
| MSI GE76 Raider | |
| XMG Neo 15 @165 W TGP | |
| XMG Neo 17 @140 W TGP | |
| 1920x1080 Medium Preset | |
| MSI GE76 Raider | |
| XMG Neo 15 @165 W TGP | |
| XMG Neo 17 @140 W TGP | |
| Farming Simulator 22 | |
| 3840x2160 Very High Preset | |
| MSI GE76 Raider | |
| XMG Neo 15 @165 W TGP | |
| XMG Neo 17 @140 W TGP | |
| 2560x1440 Very High Preset | |
| MSI GE76 Raider | |
| XMG Neo 15 @165 W TGP | |
| XMG Neo 17 @140 W TGP | |
| 1920x1080 Very High Preset | |
| MSI GE76 Raider | |
| XMG Neo 15 @165 W TGP | |
| XMG Neo 17 @140 W TGP | |
| 1920x1080 High Preset | |
| MSI GE76 Raider | |
| XMG Neo 15 @165 W TGP | |
| XMG Neo 17 @140 W TGP | |
| 1920x1080 Medium Preset | |
| MSI GE76 Raider | |
| XMG Neo 17 @140 W TGP | |
| XMG Neo 15 @165 W TGP | |
| Battlefield 2042 | |
| 1920x1080 Ultra Preset + Ray Tracing | |
| MSI GE76 Raider | |
| XMG Neo 15 @165 W TGP | |
| XMG Neo 17 @140 W TGP | |
| 3840x2160 Ultra Preset | |
| MSI GE76 Raider | |
| XMG Neo 15 @165 W TGP | |
| XMG Neo 17 @140 W TGP | |
| 2560x1440 Ultra Preset | |
| MSI GE76 Raider | |
| XMG Neo 15 @165 W TGP | |
| XMG Neo 17 @140 W TGP | |
| 1920x1080 Ultra Preset | |
| MSI GE76 Raider | |
| XMG Neo 15 @165 W TGP | |
| XMG Neo 17 @140 W TGP | |
| 1920x1080 High Preset | |
| MSI GE76 Raider | |
| XMG Neo 15 @165 W TGP | |
| XMG Neo 17 @140 W TGP | |
| 1920x1080 Medium Preset | |
| XMG Neo 17 @140 W TGP | |
| MSI GE76 Raider | |
| XMG Neo 15 @165 W TGP | |
| Forza Horizon 5 | |
| 3840x2160 Extreme Preset | |
| MSI GE76 Raider | |
| XMG Neo 15 @165 W TGP | |
| XMG Neo 17 @140 W TGP | |
| 2560x1440 Extreme Preset | |
| MSI GE76 Raider | |
| XMG Neo 15 @165 W TGP | |
| XMG Neo 17 @140 W TGP | |
| 1920x1080 Extreme Preset | |
| MSI GE76 Raider | |
| XMG Neo 15 @165 W TGP | |
| XMG Neo 17 @140 W TGP | |
| 1920x1080 High Preset | |
| MSI GE76 Raider | |
| XMG Neo 15 @165 W TGP | |
| XMG Neo 17 @140 W TGP | |
| 1920x1080 Medium Preset | |
| MSI GE76 Raider | |
| XMG Neo 15 @165 W TGP | |
| XMG Neo 17 @140 W TGP | |
| 1920x1080 Low Preset | |
| XMG Neo 15 @165 W TGP | |
| XMG Neo 17 @140 W TGP | |
| Call of Duty Vanguard | |
| 3840x2160 Ultra Preset | |
| XMG Neo 15 @165 W TGP | |
| XMG Neo 17 @140 W TGP | |
| 2560x1440 Ultra Preset | |
| XMG Neo 15 @165 W TGP | |
| XMG Neo 17 @140 W TGP | |
| 1920x1080 Ultra Preset | |
| XMG Neo 15 @165 W TGP | |
| XMG Neo 17 @140 W TGP | |
| 1920x1080 High Preset | |
| XMG Neo 15 @165 W TGP | |
| XMG Neo 17 @140 W TGP | |
| 1920x1080 Medium Preset | |
| XMG Neo 17 @140 W TGP | |
| XMG Neo 15 @165 W TGP | |
| 1920x1080 Low Preset | |
| XMG Neo 17 @140 W TGP | |
| XMG Neo 15 @165 W TGP | |
| Riders Republic | |
| 3840x2160 Ultra Preset | |
| MSI GE76 Raider | |
| XMG Neo 15 @165 W TGP | |
| XMG Neo 17 @140 W TGP | |
| 2560x1440 Ultra Preset | |
| MSI GE76 Raider | |
| XMG Neo 15 @165 W TGP | |
| XMG Neo 17 @140 W TGP | |
| 1920x1080 Ultra Preset | |
| MSI GE76 Raider | |
| XMG Neo 15 @165 W TGP | |
| XMG Neo 17 @140 W TGP | |
| 1920x1080 High Preset | |
| MSI GE76 Raider | |
| XMG Neo 15 @165 W TGP | |
| XMG Neo 17 @140 W TGP | |
| 1920x1080 Medium Preset | |
| MSI GE76 Raider | |
| XMG Neo 15 @165 W TGP | |
| XMG Neo 17 @140 W TGP | |
| 1920x1080 Low Preset | |
| XMG Neo 15 @165 W TGP | |
| XMG Neo 17 @140 W TGP | |
| Guardians of the Galaxy | |
| 1920x1080 Ultra Preset + Ultra Ray-Tracing | |
| MSI GE76 Raider | |
| XMG Neo 15 @165 W TGP | |
| XMG Neo 17 @140 W TGP | |
| 3840x2160 Ultra Preset | |
| MSI GE76 Raider | |
| XMG Neo 15 @165 W TGP | |
| XMG Neo 17 @140 W TGP | |
| 2560x1440 Ultra Preset | |
| MSI GE76 Raider | |
| XMG Neo 15 @165 W TGP | |
| XMG Neo 17 @140 W TGP | |
| 1920x1080 Ultra Preset | |
| MSI GE76 Raider | |
| XMG Neo 15 @165 W TGP | |
| XMG Neo 17 @140 W TGP | |
| 1920x1080 High Preset | |
| MSI GE76 Raider | |
| XMG Neo 15 @165 W TGP | |
| XMG Neo 17 @140 W TGP | |
| 1920x1080 Medium Preset | |
| MSI GE76 Raider | |
| XMG Neo 15 @165 W TGP | |
| XMG Neo 17 @140 W TGP | |
| Alan Wake Remastered | |
| 3840x2160 High Preset | |
| MSI GE76 Raider | |
| XMG Neo 15 @165 W TGP | |
| XMG Neo 17 @140 W TGP | |
| 2560x1440 High Preset | |
| MSI GE76 Raider | |
| XMG Neo 15 @165 W TGP | |
| XMG Neo 17 @140 W TGP | |
| 1920x1080 High Preset | |
| MSI GE76 Raider | |
| XMG Neo 15 @165 W TGP | |
| XMG Neo 17 @140 W TGP | |
| 1920x1080 Medium Preset | |
| MSI GE76 Raider | |
| XMG Neo 15 @165 W TGP | |
| XMG Neo 17 @140 W TGP | |
| 1920x1080 Low Preset | |
| XMG Neo 15 @165 W TGP | |
| XMG Neo 17 @140 W TGP | |
| Back 4 Blood | |
| 3840x2160 Epic Preset (DX12) AA:T | |
| MSI GE76 Raider | |
| XMG Neo 15 @165 W TGP | |
| XMG Neo 17 @140 W TGP | |
| 2560x1440 Epic Preset (DX12) AA:T | |
| MSI GE76 Raider | |
| XMG Neo 15 @165 W TGP | |
| XMG Neo 17 @140 W TGP | |
| 1920x1080 Epic Preset (DX12) AA:T | |
| MSI GE76 Raider | |
| XMG Neo 15 @165 W TGP | |
| XMG Neo 17 @140 W TGP | |
| 1920x1080 High Preset (DX12) AA:T | |
| MSI GE76 Raider | |
| XMG Neo 15 @165 W TGP | |
| XMG Neo 17 @140 W TGP | |
| 1920x1080 Medium Preset (DX12) AA:FX | |
| MSI GE76 Raider | |
| XMG Neo 15 @165 W TGP | |
| XMG Neo 17 @140 W TGP | |
| 1920x1080 Low Preset (DX12) | |
| XMG Neo 15 @165 W TGP | |
| XMG Neo 17 @140 W TGP | |
| Far Cry 6 | |
| 1920x1080 Ultra Graphics Quality + HD Textures + DXR AA:T | |
| MSI GE76 Raider | |
| XMG Neo 15 @165 W TGP | |
| XMG Neo 17 @140 W TGP | |
| 3840x2160 Ultra Graphics Quality + HD Textures AA:T | |
| MSI GE76 Raider | |
| XMG Neo 15 @165 W TGP | |
| XMG Neo 17 @140 W TGP | |
| 2560x1440 Ultra Graphics Quality + HD Textures AA:T | |
| MSI GE76 Raider | |
| XMG Neo 15 @165 W TGP | |
| XMG Neo 17 @140 W TGP | |
| 1920x1080 Ultra Graphics Quality + HD Textures AA:T | |
| MSI GE76 Raider | |
| XMG Neo 15 @165 W TGP | |
| XMG Neo 17 @140 W TGP | |
| 1920x1080 High Graphics Quality AA:T | |
| MSI GE76 Raider | |
| XMG Neo 15 @165 W TGP | |
| XMG Neo 17 @140 W TGP | |
| 1920x1080 Medium Graphics Quality AA:SM | |
| MSI GE76 Raider | |
| XMG Neo 15 @165 W TGP | |
| XMG Neo 17 @140 W TGP | |
| 1920x1080 Low Graphics Quality | |
| XMG Neo 15 @165 W TGP | |
| XMG Neo 17 @140 W TGP | |
| FIFA 22 | |
| 3840x2160 Ultra Rendering Quality AA:4x MS | |
| XMG Neo 15 @165 W TGP | |
| XMG Neo 17 @140 W TGP | |
| 2560x1440 Ultra Rendering Quality AA:4x MS | |
| XMG Neo 15 @165 W TGP | |
| XMG Neo 17 @140 W TGP | |
| 1920x1080 Ultra Rendering Quality AA:4x MS | |
| XMG Neo 15 @165 W TGP | |
| XMG Neo 17 @140 W TGP | |
| 1920x1080 High Rendering Quality AA:2x MS | |
| XMG Neo 15 @165 W TGP | |
| XMG Neo 17 @140 W TGP | |
| 1920x1080 Medium Rendering Quality | |
| XMG Neo 17 @140 W TGP | |
| XMG Neo 15 @165 W TGP | |
| 1920x1080 Low Rendering Quality | |
| XMG Neo 15 @165 W TGP | |
| XMG Neo 17 @140 W TGP | |
| New World | |
| 3840x2160 Very High Video Quality | |
| MSI GE76 Raider | |
| XMG Neo 15 @165 W TGP | |
| XMG Neo 17 @140 W TGP | |
| 2560x1440 Very High Video Quality | |
| MSI GE76 Raider | |
| XMG Neo 15 @165 W TGP | |
| XMG Neo 17 @140 W TGP | |
| 1920x1080 Very High Video Quality | |
| MSI GE76 Raider | |
| XMG Neo 17 @140 W TGP | |
| XMG Neo 15 @165 W TGP | |
| 1920x1080 High Video Quality | |
| MSI GE76 Raider | |
| XMG Neo 17 @140 W TGP | |
| XMG Neo 15 @165 W TGP | |
| 1920x1080 Medium Video Quality | |
| MSI GE76 Raider | |
| XMG Neo 17 @140 W TGP | |
| XMG Neo 15 @165 W TGP | |
| 1920x1080 Low Video Quality | |
| XMG Neo 17 @140 W TGP | |
| XMG Neo 15 @165 W TGP | |
| Deathloop | |
| 3840x2160 Ultra Preset | |
| XMG Neo 15 @165 W TGP | |
| MSI GE76 Raider | |
| XMG Neo 17 @140 W TGP | |
| 2560x1440 Ultra Preset | |
| XMG Neo 15 @165 W TGP | |
| MSI GE76 Raider | |
| XMG Neo 17 @140 W TGP | |
| 1920x1080 Ultra Preset | |
| MSI GE76 Raider | |
| XMG Neo 15 @165 W TGP | |
| XMG Neo 17 @140 W TGP | |
| 1920x1080 High Preset | |
| MSI GE76 Raider | |
| XMG Neo 15 @165 W TGP | |
| XMG Neo 17 @140 W TGP | |
| 1920x1080 Medium Preset | |
| MSI GE76 Raider | |
| XMG Neo 15 @165 W TGP | |
| XMG Neo 17 @140 W TGP | |
| 1920x1080 Low Preset | |
| XMG Neo 17 @140 W TGP | |
| XMG Neo 15 @165 W TGP | |
| Monster Hunter Stories 2 | |
| 3840x2160 High Preset | |
| XMG Neo 15 @165 W TGP | |
| XMG Neo 17 @140 W TGP | |
| 2560x1440 High Preset | |
| XMG Neo 17 @140 W TGP | |
| XMG Neo 15 @165 W TGP | |
| 1920x1080 High Preset | |
| XMG Neo 17 @140 W TGP | |
| XMG Neo 15 @165 W TGP | |
| 1920x1080 Medium Preset | |
| XMG Neo 17 @140 W TGP | |
| XMG Neo 15 @165 W TGP | |
| 1920x1080 Low Preset | |
| XMG Neo 17 @140 W TGP | |
| XMG Neo 15 @165 W TGP | |
| F1 2021 | |
| 3840x2160 Ultra High Preset + Raytracing AA:T AF:16x | |
| MSI GE76 Raider | |
| 2560x1440 Ultra High Preset + Raytracing AA:T AF:16x | |
| MSI GE76 Raider | |
| 1920x1080 Ultra High Preset + Raytracing AA:T AF:16x | |
| MSI GE76 Raider | |
| 1920x1080 High Preset AA:T AF:16x | |
| MSI GE76 Raider | |
| 1920x1080 Medium Preset AA:T AF:16x | |
| MSI GE76 Raider | |
| Days Gone | |
| 3840x2160 Very High Preset | |
| MSI GE76 Raider | |
| 2560x1440 Very High Preset | |
| MSI GE76 Raider | |
| 1920x1080 Very High Preset | |
| MSI GE76 Raider | |
| 1920x1080 High Preset | |
| MSI GE76 Raider | |
| 1920x1080 Medium Preset | |
| MSI GE76 Raider | |
| Mass Effect Legendary Edition | |
| 3840x2160 On | |
| MSI GE76 Raider | |
| 2560x1440 On | |
| MSI GE76 Raider | |
| 1920x1080 On | |
| MSI GE76 Raider | |
| Resident Evil Village | |
| 1920x1080 Ray Tracing Preset | |
| MSI GE76 Raider | |
| 3840x2160 Max Preset | |
| MSI GE76 Raider | |
| 2560x1440 Max Preset | |
| MSI GE76 Raider | |
| 1920x1080 Max Preset | |
| MSI GE76 Raider | |
| 1920x1080 Prioritize Graphics Preset | |
| MSI GE76 Raider | |
| 1920x1080 Balanced Preset | |
| MSI GE76 Raider | |
| Outriders | |
| 3840x2160 Ultra Preset | |
| MSI GE76 Raider | |
| 2560x1440 Ultra Preset | |
| MSI GE76 Raider | |
| 1920x1080 Ultra Preset | |
| MSI GE76 Raider | |
| 1920x1080 High Preset | |
| MSI GE76 Raider | |
| 1920x1080 Medium Preset | |
| MSI GE76 Raider | |
| Hitman 3 | |
| 3840x2160 Maximum Settings AF:16x | |
| MSI GE76 Raider | |
| 2560x1440 Maximum Settings AF:16x | |
| MSI GE76 Raider | |
| 1920x1080 Maximum Settings AF:16x | |
| Schenker XMG Ultra 17 Rocket Lake | |
| MSI GE76 Raider | |
| 1920x1080 High Settings AF:16x | |
| Schenker XMG Ultra 17 Rocket Lake | |
| MSI GE76 Raider | |
| 1920x1080 Medium Settings AF:16x | |
| Schenker XMG Ultra 17 Rocket Lake | |
| MSI GE76 Raider | |
| 1920x1080 Minimum Settings | |
| Schenker XMG Ultra 17 Rocket Lake | |
| 1280x720 Minimum Settings | |
| Schenker XMG Ultra 17 Rocket Lake | |
| Cyberpunk 2077 1.0 | |
| 1920x1080 Ray Tracing Ultra Preset (DLSS off) | |
| MSI GE76 Raider | |
| Schenker XMG Ultra 17 Rocket Lake | |
| 3840x2160 Ultra Preset | |
| MSI GE76 Raider | |
| 2560x1440 Ultra Preset | |
| MSI GE76 Raider | |
| 1920x1080 Ultra Preset | |
| MSI GE76 Raider | |
| Schenker XMG Ultra 17 Rocket Lake | |
| 1920x1080 High Preset | |
| MSI GE76 Raider | |
| Schenker XMG Ultra 17 Rocket Lake | |
| 1920x1080 Medium Preset | |
| MSI GE76 Raider | |
| Schenker XMG Ultra 17 Rocket Lake | |
| 1920x1080 Low Preset | |
| Schenker XMG Ultra 17 Rocket Lake | |
| 1280x720 Low Preset | |
| Schenker XMG Ultra 17 Rocket Lake | |
| Immortals Fenyx Rising | |
| 1920x1080 Very High Preset | |
| Schenker XMG Ultra 17 Rocket Lake | |
| 1920x1080 High Preset | |
| Schenker XMG Ultra 17 Rocket Lake | |
| 1920x1080 Medium Preset | |
| Schenker XMG Ultra 17 Rocket Lake | |
| 1280x720 Very Low Preset | |
| Schenker XMG Ultra 17 Rocket Lake | |
| Crysis Remastered | |
| 3840x2160 Very High Preset AA:SM | |
| MSI GE76 Raider | |
| 2560x1440 Very High Preset AA:SM | |
| MSI GE76 Raider | |
| 1920x1080 Very High Preset AA:SM | |
| MSI GE76 Raider | |
| 1920x1080 High Preset AA:SM | |
| MSI GE76 Raider | |
| 1920x1080 Medium Preset | |
| MSI GE76 Raider | |
| Yakuza Like a Dragon | |
| 3840x2160 Ultra Preset | |
| MSI GE76 Raider | |
| 2560x1440 Ultra Preset | |
| MSI GE76 Raider | |
| 1920x1080 Ultra Preset | |
| MSI GE76 Raider | |
| 1920x1080 High Preset | |
| MSI GE76 Raider | |
| 1920x1080 Medium Preset | |
| MSI GE76 Raider | |
| Assassin´s Creed Valhalla | |
| 3840x2160 Ultra High Preset | |
| MSI GE76 Raider | |
| 2560x1440 Ultra High Preset | |
| MSI GE76 Raider | |
| 1920x1080 Ultra High Preset | |
| MSI GE76 Raider | |
| 1920x1080 High Preset | |
| MSI GE76 Raider | |
| 1920x1080 Medium Preset | |
| MSI GE76 Raider | |
| Dirt 5 | |
| 3840x2160 Ultra High Preset | |
| MSI GE76 Raider | |
| 2560x1440 Ultra High Preset | |
| MSI GE76 Raider | |
| 1920x1080 Ultra High Preset | |
| MSI GE76 Raider | |
| Schenker XMG Ultra 17 Rocket Lake | |
| 1920x1080 High Preset | |
| MSI GE76 Raider | |
| Schenker XMG Ultra 17 Rocket Lake | |
| 1920x1080 Medium Preset | |
| MSI GE76 Raider | |
| Schenker XMG Ultra 17 Rocket Lake | |
| 1280x720 Ultra Low Preset | |
| Schenker XMG Ultra 17 Rocket Lake | |
| Watch Dogs Legion | |
| 1920x1080 Ultra Preset + Ultra Ray Tracing (DX12) | |
| MSI GE76 Raider | |
| Schenker XMG Ultra 17 Rocket Lake | |
| 3840x2160 Ultra Preset (DX12) | |
| MSI GE76 Raider | |
| 2560x1440 Ultra Preset (DX12) | |
| MSI GE76 Raider | |
| 1920x1080 Ultra Preset (DX12) | |
| Schenker XMG Ultra 17 Rocket Lake | |
| MSI GE76 Raider | |
| 1920x1080 High Preset (DX12) | |
| MSI GE76 Raider | |
| Schenker XMG Ultra 17 Rocket Lake | |
| 1920x1080 Medium Preset (DX12) | |
| Schenker XMG Ultra 17 Rocket Lake | |
| MSI GE76 Raider | |
| 1280x720 Low Preset (DX12) | |
| Schenker XMG Ultra 17 Rocket Lake | |
| Star Wars Squadrons | |
| 3840x2160 Ultra Preset | |
| MSI GE76 Raider | |
| 2560x1440 Ultra Preset | |
| MSI GE76 Raider | |
| 1920x1080 Ultra Preset | |
| MSI GE76 Raider | |
| 1920x1080 High Preset | |
| MSI GE76 Raider | |
| 1920x1080 Medium Preset | |
| MSI GE76 Raider | |
| Mafia Definitive Edition | |
| 3840x2160 High Preset | |
| MSI GE76 Raider | |
| 2560x1440 High Preset | |
| MSI GE76 Raider | |
| 1920x1080 High Preset | |
| MSI GE76 Raider | |
| 1920x1080 Medium Preset | |
| MSI GE76 Raider | |
| Serious Sam 4 | |
| 3840x2160 Ultra (DX12) AA:2xMS | |
| MSI GE76 Raider | |
| 2560x1440 Ultra (DX12) AA:2xMS | |
| MSI GE76 Raider | |
| 1920x1080 Ultra (DX12) AA:2xMS | |
| Schenker XMG Ultra 17 Rocket Lake | |
| MSI GE76 Raider | |
| 1920x1080 High (DX12) | |
| Schenker XMG Ultra 17 Rocket Lake | |
| MSI GE76 Raider | |
| 1920x1080 Medium (DX12) | |
| MSI GE76 Raider | |
| Schenker XMG Ultra 17 Rocket Lake | |
| 1280x720 Lowest (DX12) | |
| Schenker XMG Ultra 17 Rocket Lake | |
| Strange Brigade | |
| 3840x2160 ultra AA:ultra AF:16 | |
| Alienware x17 RTX 3080 P48E | |
| 2560x1440 ultra AA:ultra AF:16 | |
| Alienware x17 RTX 3080 P48E | |
| 1920x1080 ultra AA:ultra AF:16 | |
| MSI GE76 Raider | |
| Schenker XMG NEO 17 GM7TG8S | |
| Alienware x17 RTX 3080 P48E | |
| Asus ROG Zephyrus S17 GX703HSD | |
| 1920x1080 high AA:high AF:8 | |
| MSI GE76 Raider | |
| Schenker XMG NEO 17 GM7TG8S | |
| Alienware x17 RTX 3080 P48E | |
| Asus ROG Zephyrus S17 GX703HSD | |
| 1920x1080 medium AA:medium AF:4 | |
| MSI GE76 Raider | |
| Schenker XMG NEO 17 GM7TG8S | |
| Alienware x17 RTX 3080 P48E | |
| Asus ROG Zephyrus S17 GX703HSD | |
| 1280x720 lowest AF:1 | |
| Schenker XMG NEO 17 GM7TG8S | |
| Asus ROG Zephyrus S17 GX703HSD | |
| Alienware x17 RTX 3080 P48E | |
| Death Stranding | |
| 3840x2160 Very High Preset | |
| MSI GE76 Raider | |
| 2560x1440 Very High Preset | |
| MSI GE76 Raider | |
| 1920x1080 Very High Preset | |
| MSI GE76 Raider | |
| 1920x1080 Default Preset | |
| MSI GE76 Raider | |
| 1920x1080 Medium Preset | |
| MSI GE76 Raider | |
| Gears Tactics | |
| 3840x2160 Ultra Preset | |
| MSI GE76 Raider | |
| 2560x1440 Ultra Preset | |
| MSI GE76 Raider | |
| 1920x1080 Ultra Preset | |
| MSI GE76 Raider | |
| 1920x1080 High Preset | |
| MSI GE76 Raider | |
| 1920x1080 Medium Preset | |
| MSI GE76 Raider | |
| Doom Eternal | |
| 3840x2160 Ultra Preset | |
| MSI GE76 Raider | |
| 2560x1440 Ultra Preset | |
| MSI GE76 Raider | |
| 1920x1080 Ultra Preset | |
| MSI GE76 Raider | |
| Schenker XMG Ultra 17 Rocket Lake | |
| 1920x1080 High Preset | |
| MSI GE76 Raider | |
| Schenker XMG Ultra 17 Rocket Lake | |
| 1920x1080 Medium Preset | |
| MSI GE76 Raider | |
| Schenker XMG Ultra 17 Rocket Lake | |
| 1280x720 Low Preset | |
| Schenker XMG Ultra 17 Rocket Lake | |
| Hunt Showdown | |
| 3840x2160 High Preset | |
| MSI GE76 Raider | |
| 2560x1440 High Preset | |
| MSI GE76 Raider | |
| 1920x1080 High Preset | |
| MSI GE76 Raider | |
| 1920x1080 Medium Preset | |
| MSI GE76 Raider | |
| Shadow of the Tomb Raider | |
| 2560x1440 Highest Preset AA:T | |
| Schenker XMG NEO 17 GM7TG8S | |
| Asus ROG Zephyrus S17 GX703HSD | |
| 1920x1080 Highest Preset AA:T | |
| Schenker XMG Ultra 17 Rocket Lake | |
| Schenker XMG NEO 17 GM7TG8S | |
| Asus ROG Zephyrus S17 GX703HSD | |
| 1920x1080 High Preset AA:SM | |
| Schenker XMG Ultra 17 Rocket Lake | |
| Asus ROG Zephyrus S17 GX703HSD | |
| Schenker XMG NEO 17 GM7TG8S | |
| 1920x1080 Medium Preset | |
| Schenker XMG Ultra 17 Rocket Lake | |
| Schenker XMG NEO 17 GM7TG8S | |
| Asus ROG Zephyrus S17 GX703HSD | |
| 1920x1080 Lowest Preset | |
| Schenker XMG Ultra 17 Rocket Lake | |
| Schenker XMG NEO 17 GM7TG8S | |
| Asus ROG Zephyrus S17 GX703HSD | |
| 1280x720 Lowest Preset | |
| Schenker XMG Ultra 17 Rocket Lake | |
| Schenker XMG NEO 17 GM7TG8S | |
| Asus ROG Zephyrus S17 GX703HSD | |
| Far Cry 5 | |
| 3840x2160 Ultra Preset AA:T | |
| Alienware x17 RTX 3080 P48E | |
| 2560x1440 Ultra Preset AA:T | |
| Schenker XMG NEO 17 GM7TG8S | |
| Asus ROG Zephyrus S17 GX703HSD | |
| Alienware x17 RTX 3080 P48E | |
| 1920x1080 Ultra Preset AA:T | |
| Schenker XMG Ultra 17 Rocket Lake | |
| Schenker XMG NEO 17 GM7TG8S | |
| Asus ROG Zephyrus S17 GX703HSD | |
| Alienware x17 RTX 3080 P48E | |
| 1920x1080 High Preset AA:T | |
| Schenker XMG Ultra 17 Rocket Lake | |
| Schenker XMG NEO 17 GM7TG8S | |
| Asus ROG Zephyrus S17 GX703HSD | |
| Alienware x17 RTX 3080 P48E | |
| 1920x1080 Medium Preset AA:T | |
| Schenker XMG Ultra 17 Rocket Lake | |
| Schenker XMG NEO 17 GM7TG8S | |
| Asus ROG Zephyrus S17 GX703HSD | |
| Alienware x17 RTX 3080 P48E | |
| 1920x1080 Low Preset AA:T | |
| Schenker XMG Ultra 17 Rocket Lake | |
| Schenker XMG NEO 17 GM7TG8S | |
| Asus ROG Zephyrus S17 GX703HSD | |
| Alienware x17 RTX 3080 P48E | |
| 1280x720 Low Preset AA:T | |
| Schenker XMG Ultra 17 Rocket Lake | |
| Asus ROG Zephyrus S17 GX703HSD | |
| Schenker XMG NEO 17 GM7TG8S | |
| Alienware x17 RTX 3080 P48E | |
| X-Plane 11.11 | |
| 3840x2160 high (fps_test=3) | |
| Alienware x17 RTX 3080 P48E | |
| 1920x1080 high (fps_test=3) | |
| Schenker XMG Ultra 17 Rocket Lake | |
| MSI GE76 Raider | |
| Asus ROG Zephyrus S17 GX703HSD | |
| Schenker XMG NEO 17 GM7TG8S | |
| Alienware x17 RTX 3080 P48E | |
| 1920x1080 med (fps_test=2) | |
| Schenker XMG Ultra 17 Rocket Lake | |
| MSI GE76 Raider | |
| Asus ROG Zephyrus S17 GX703HSD | |
| Schenker XMG NEO 17 GM7TG8S | |
| Alienware x17 RTX 3080 P48E | |
| 1280x720 low (fps_test=1) | |
| Schenker XMG Ultra 17 Rocket Lake | |
| MSI GE76 Raider | |
| Asus ROG Zephyrus S17 GX703HSD | |
| Schenker XMG NEO 17 GM7TG8S | |
| Alienware x17 RTX 3080 P48E | |
| Final Fantasy XV Benchmark | |
| 3840x2160 High Quality | |
| Alienware x17 RTX 3080 P48E | |
| 2560x1440 High Quality | |
| Alienware x17 RTX 3080 P48E | |
| 1920x1080 High Quality | |
| MSI GE76 Raider | |
| Alienware x17 RTX 3080 P48E | |
| 1920x1080 Standard Quality | |
| MSI GE76 Raider | |
| Asus ROG Zephyrus S17 GX703HSD | |
| Alienware x17 RTX 3080 P48E | |
| 1280x720 Lite Quality | |
| Alienware x17 RTX 3080 P48E | |
| Dota 2 Reborn | |
| 3840x2160 ultra (3/3) best looking | |
| Alienware x17 RTX 3080 P48E | |
| 1920x1080 ultra (3/3) best looking | |
| Schenker XMG Ultra 17 Rocket Lake | |
| MSI GE76 Raider | |
| Asus ROG Zephyrus S17 GX703HSD | |
| Alienware x17 RTX 3080 P48E | |
| Schenker XMG NEO 17 GM7TG8S | |
| 1920x1080 high (2/3) | |
| MSI GE76 Raider | |
| Schenker XMG Ultra 17 Rocket Lake | |
| Asus ROG Zephyrus S17 GX703HSD | |
| Alienware x17 RTX 3080 P48E | |
| Schenker XMG NEO 17 GM7TG8S | |
| 1366x768 med (1/3) | |
| MSI GE76 Raider | |
| Schenker XMG Ultra 17 Rocket Lake | |
| Schenker XMG NEO 17 GM7TG8S | |
| Alienware x17 RTX 3080 P48E | |
| Asus ROG Zephyrus S17 GX703HSD | |
| 1280x720 min (0/3) fastest | |
| MSI GE76 Raider | |
| Schenker XMG Ultra 17 Rocket Lake | |
| Schenker XMG NEO 17 GM7TG8S | |
| Asus ROG Zephyrus S17 GX703HSD | |
| Alienware x17 RTX 3080 P48E | |
| The Witcher 3 | |
| 3840x2160 Ultra Graphics & Postprocessing (HBAO+) | |
| Alienware x17 RTX 3080 P48E | |
| 3840x2160 High Graphics & Postprocessing (Nvidia HairWorks Off) | |
| Alienware x17 RTX 3080 P48E | |
| 1920x1080 Ultra Graphics & Postprocessing (HBAO+) | |
| MSI GE76 Raider | |
| Schenker XMG Ultra 17 Rocket Lake | |
| Schenker XMG NEO 17 GM7TG8S | |
| Asus ROG Zephyrus S17 GX703HSD | |
| Alienware x17 RTX 3080 P48E | |
| 1920x1080 High Graphics & Postprocessing (Nvidia HairWorks Off) | |
| MSI GE76 Raider | |
| Schenker XMG Ultra 17 Rocket Lake | |
| Schenker XMG NEO 17 GM7TG8S | |
| Asus ROG Zephyrus S17 GX703HSD | |
| Alienware x17 RTX 3080 P48E | |
| 1366x768 Medium Graphics & Postprocessing | |
| MSI GE76 Raider | |
| Schenker XMG Ultra 17 Rocket Lake | |
| Schenker XMG NEO 17 GM7TG8S | |
| Alienware x17 RTX 3080 P48E | |
| Asus ROG Zephyrus S17 GX703HSD | |
| 1920x1080 Medium Graphics & Postprocessing | |
| Schenker XMG NEO 17 GM7TG8S | |
| Asus ROG Zephyrus S17 GX703HSD | |
| 1024x768 Low Graphics & Postprocessing | |
| Schenker XMG Ultra 17 Rocket Lake | |
| Schenker XMG NEO 17 GM7TG8S | |
| Asus ROG Zephyrus S17 GX703HSD | |
| Alienware x17 RTX 3080 P48E | |
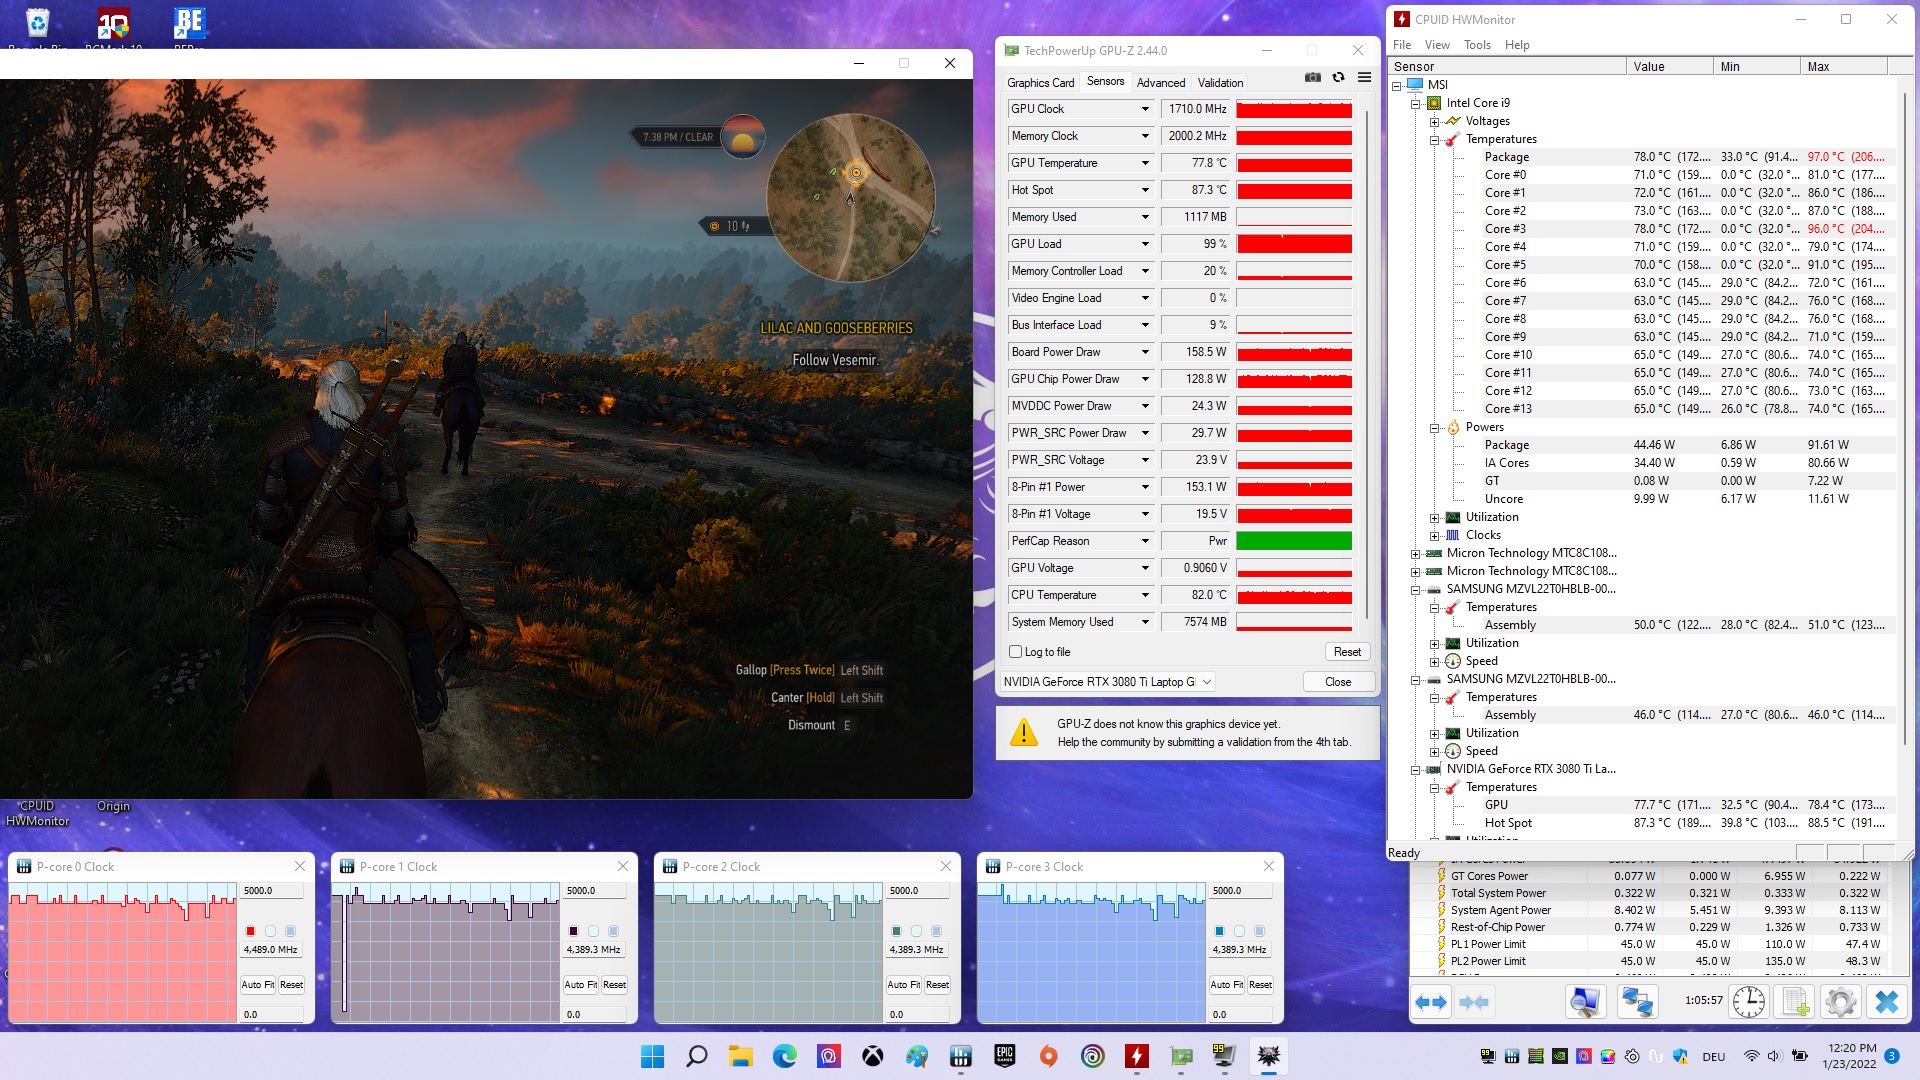
Nous avons vérifié la performance 3D soutenue avec notre test Witcher 3 (60 minutes). L'horloge du GPU chute légèrement (comme l'horloge du CPU), mais la différence n'est pas perceptible. La fréquence d'images globale est restée très stable pendant toute la durée du test.
Witcher 3 FPS chart
| Bas | Moyen | Élevé | Ultra | QHD | 4K | |
|---|---|---|---|---|---|---|
| GTA V (2015) | 184 | 176 | 125 | |||
| The Witcher 3 (2015) | 384 | 247 | 126 | |||
| Dota 2 Reborn (2015) | 186 | 172 | 164 | 156 | ||
| Final Fantasy XV Benchmark (2018) | 171 | 131 | ||||
| X-Plane 11.11 (2018) | 155 | 133 | 109 | |||
| Strange Brigade (2018) | 312 | 251 | 221 | |||
| Hunt Showdown (2020) | 206 | 181 | 117 | 54.3 | ||
| Doom Eternal (2020) | 361 | 307 | 304 | 236 | 128 | |
| Gears Tactics (2020) | 295 | 205 | 154 | 103 | 58.9 | |
| Death Stranding (2020) | 152 | 151 | 150 | 130 | 78 | |
| Crysis Remastered (2020) | 199 | 103 | 71.4 | 60.9 | 38.1 | |
| Serious Sam 4 (2020) | 121 | 109 | 103 | 94.4 | 65.6 | |
| Mafia Definitive Edition (2020) | 158 | 151 | 108 | 58.6 | ||
| Star Wars Squadrons (2020) | 407 | 378 | 354 | 261 | 144 | |
| Watch Dogs Legion (2020) | 121 | 113 | 87 | 69 | 42 | |
| Dirt 5 (2020) | 170 | 141 | 117 | 93.1 | 60.9 | |
| Assassin´s Creed Valhalla (2020) | 135 | 103 | 93 | 74 | 50 | |
| Yakuza Like a Dragon (2020) | 162 | 160 | 143 | 107 | 54.8 | |
| Cyberpunk 2077 1.0 (2020) | 121 | 101 | 85.3 | 53.9 | 26.1 | |
| Hitman 3 (2021) | 213 | 197 | 189 | 136 | 76.1 | |
| Outriders (2021) | 160 | 155 | 153 | 111 | 57.4 | |
| Resident Evil Village (2021) | 248 | 232 | 197 | 135 | 70.9 | |
| Mass Effect Legendary Edition (2021) | 152 | 149 | 115 | |||
| Days Gone (2021) | 197 | 177 | 133 | 98.5 | 57.1 | |
| F1 2021 (2021) | 342 | 289 | 157 | 117 | 68 | |
| Deathloop (2021) | 143 | 133 | 112 | 80.2 | 44.4 | |
| New World (2021) | 129 | 122 | 115 | 94.9 | 50.9 | |
| Alan Wake Remastered (2021) | 157 | 155 | 149 | 89 | ||
| Far Cry 6 (2021) | 144 | 130 | 114 | 93 | 57 | |
| Back 4 Blood (2021) | 294 | 263 | 238 | 171 | 88.9 | |
| Guardians of the Galaxy (2021) | 157 | 156 | 155 | 136 | 75 | |
| Riders Republic (2021) | 163 | 138 | 129 | 98 | 56 | |
| Forza Horizon 5 (2021) | 155 | 142 | 95 | 82 | 61 | |
| Battlefield 2042 (2021) | 141 | 121 | 108 | 88.2 | 58.7 | |
| Farming Simulator 22 (2021) | 205 | 183 | 158 | 143 | 93.3 | |
| Halo Infinite (2021) | 171 | 147 | 141 | 104 | 59 | |
| God of War (2022) | 146 | 119 | 81.6 | 67.5 | 46.4 |
Émissions
Bruit du système
Le bruit du ventilateur est un problème familier pour les ordinateurs portables de jeu, et le GE76 sera également assez bruyant lorsque vous jouerez à des jeux avec le mode Performance extrême. 50 à 53 dB(A) est clairement audible, même si la concurrence est parfois encore plus bruyante en charge maximale - malgré des composants plus lents.
Compte tenu du bruit élevé du ventilateur, nous recommandons le mode Balanced pour les jeux, dans lequel le GE76 reste en dessous de 50 dB(A) et ne subit qu'une légère baisse de performance. Certains jeux fonctionneront même bien avec le mode Silencieux, qui porte bien son nom (moins de 40 dB(A)). Le système 17 pouces est généralement très silencieux lorsqu'il tourne au ralenti (même avec le mode Performance extrême) si vous pouvez supporter les montées en puissance occasionnelles des ventilateurs.
Degré de la nuisance sonore
| Au repos |
| 26 / 27 / 40 dB(A) |
| Fortement sollicité |
| 50 / 53 dB(A) |
 | ||
30 dB silencieux 40 dB(A) audible 50 dB(A) bruyant |
||
min: | ||
| MSI GE76 Raider i9-12900HK, GeForce RTX 3080 Ti Laptop GPU | Schenker XMG NEO 17 GM7TG8S i7-11800H, GeForce RTX 3080 Laptop GPU | Alienware x17 RTX 3080 P48E i7-11800H, GeForce RTX 3080 Laptop GPU | Asus ROG Zephyrus S17 GX703HSD i9-11900H, GeForce RTX 3080 Laptop GPU | Schenker XMG Ultra 17 Rocket Lake i9-11900K, GeForce RTX 3080 Laptop GPU | |
|---|---|---|---|---|---|
| Noise | 14% | 12% | 17% | -18% | |
| arrêt / environnement * (dB) | 26 | 23 12% | 24.9 4% | 23 12% | 24 8% |
| Idle Minimum * (dB) | 26 | 23 12% | 24.9 4% | 23 12% | 30 -15% |
| Idle Average * (dB) | 27 | 23 15% | 24.9 8% | 23 15% | 31 -15% |
| Idle Maximum * (dB) | 40 | 23 43% | 29.6 26% | 23 43% | 57 -43% |
| Load Average * (dB) | 50 | 39.5 21% | 31.1 38% | 41 18% | 63 -26% |
| Witcher 3 ultra * (dB) | 53 | 54.5 -3% | 49.7 6% | 45 15% | 61 -15% |
| Load Maximum * (dB) | 53 | 55.09 -4% | 54.8 -3% | 52 2% | 63 -19% |
* ... Moindre est la valeur, meilleures sont les performances
Température
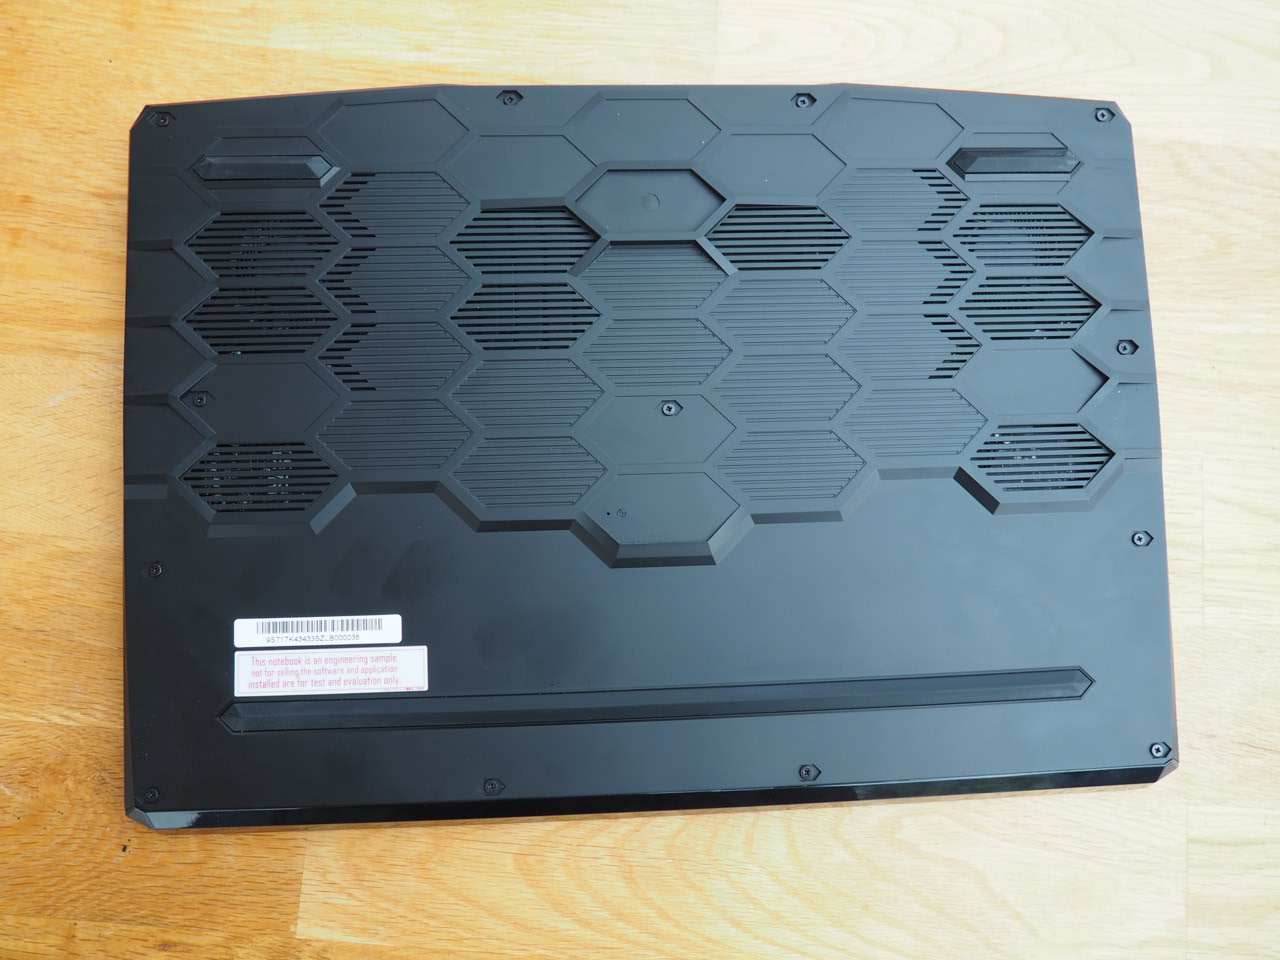
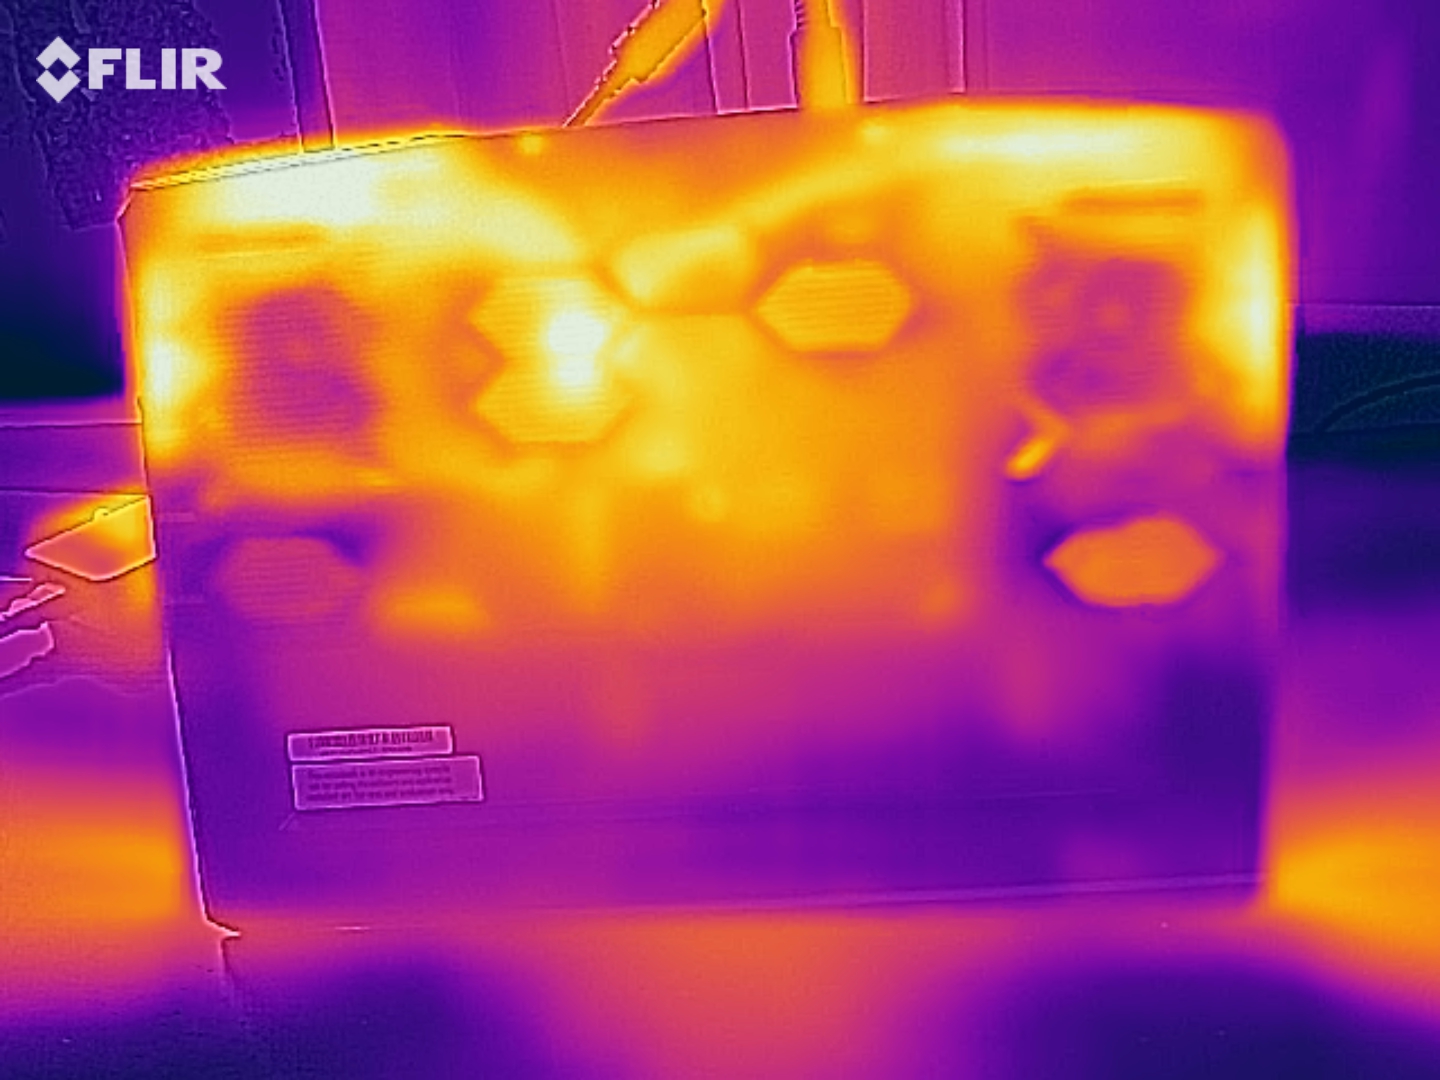
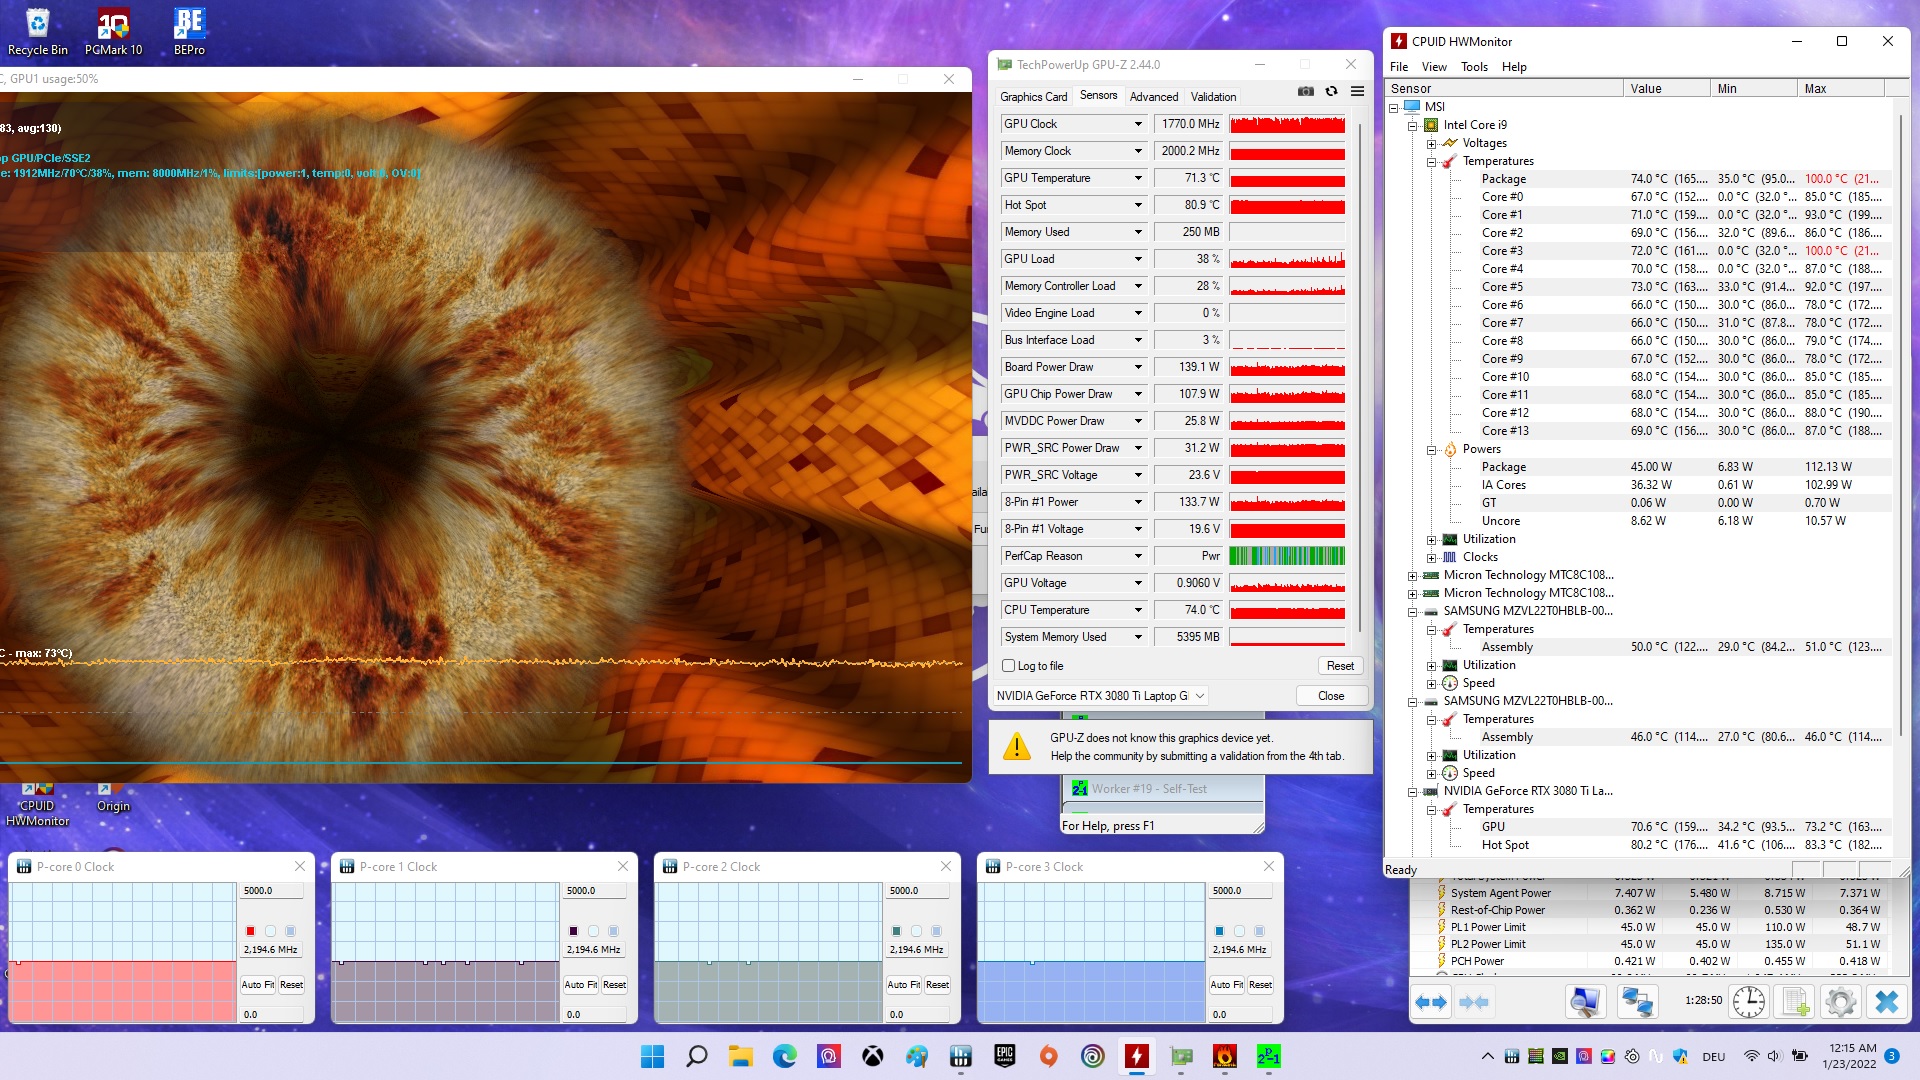
Même si le GE76 peut être assez bruyant, nous pensons que le système de refroidissement est une réussite. Ceci est basé sur les températures modérées du châssis. Alors que les mesures effectuées pendant le test de stress avec les outils FurMark et Prime95 ne sont pas très représentatives en raison de l'accélération du processeur, le test Witcher 3 est un meilleur indicateur des températures pendant les sessions de jeu. Moins de 45 °C en haut et moins de 50 °C en bas sont étonnamment bons pour un ordinateur portable haut de gamme aussi puissant - surtout si l'on considère la hauteur du châssis de moins de 3 cm. Les composants (CPU et GPU) tournent autour de 80 °C pendant le test Witcher 3, ce qui est également un bon résultat.
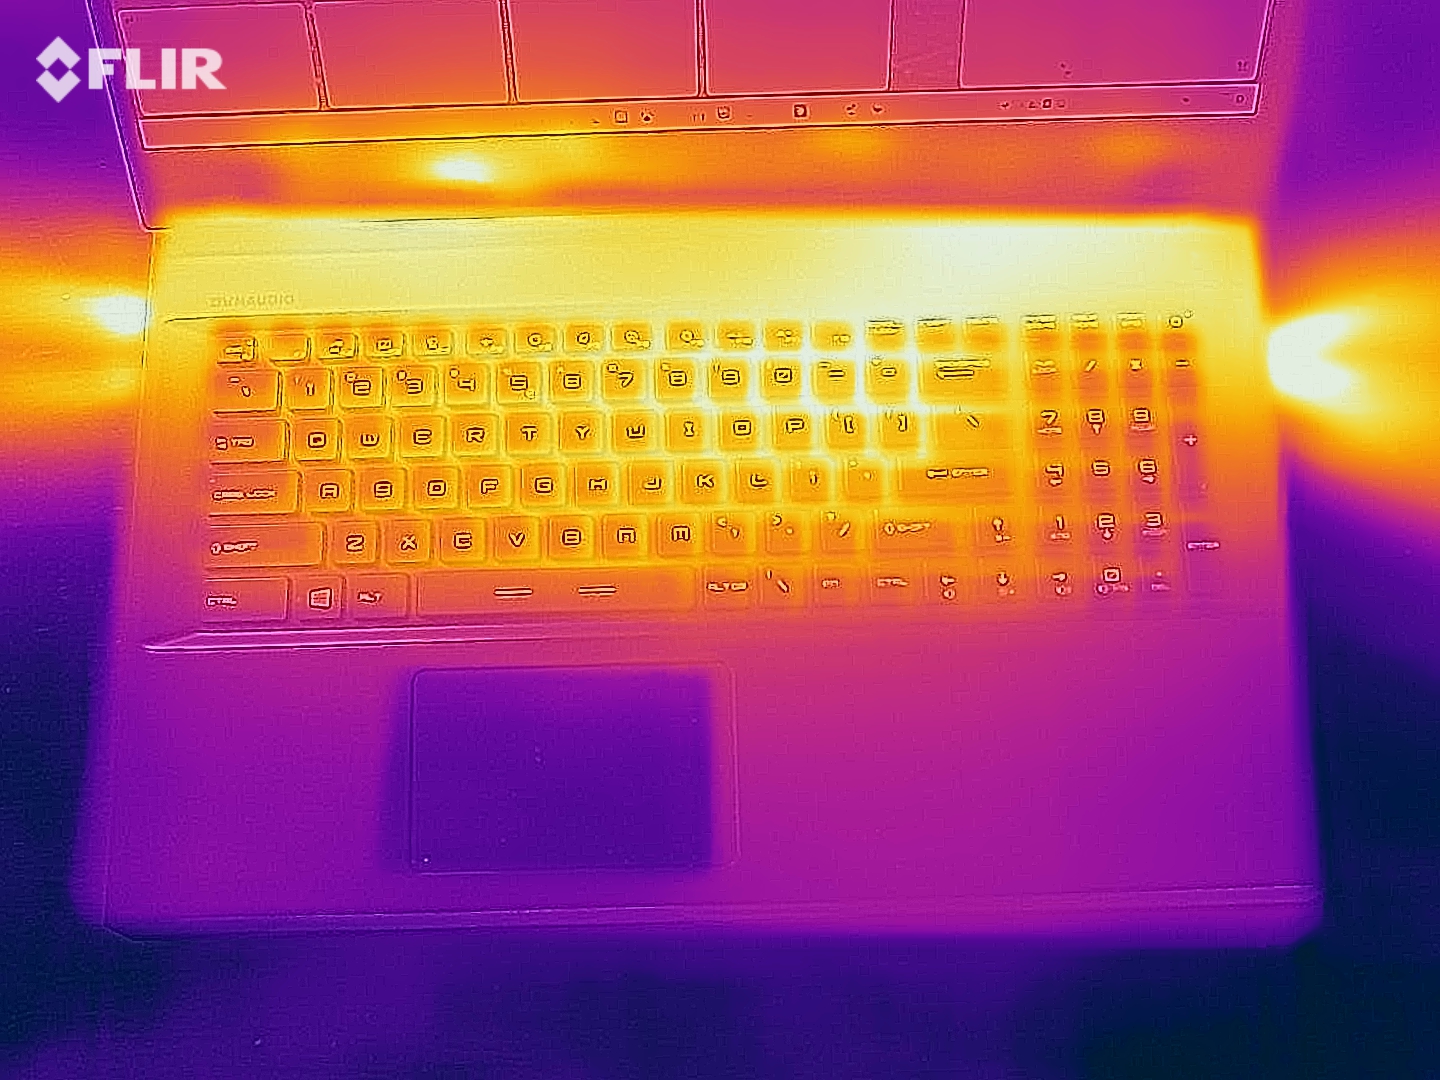
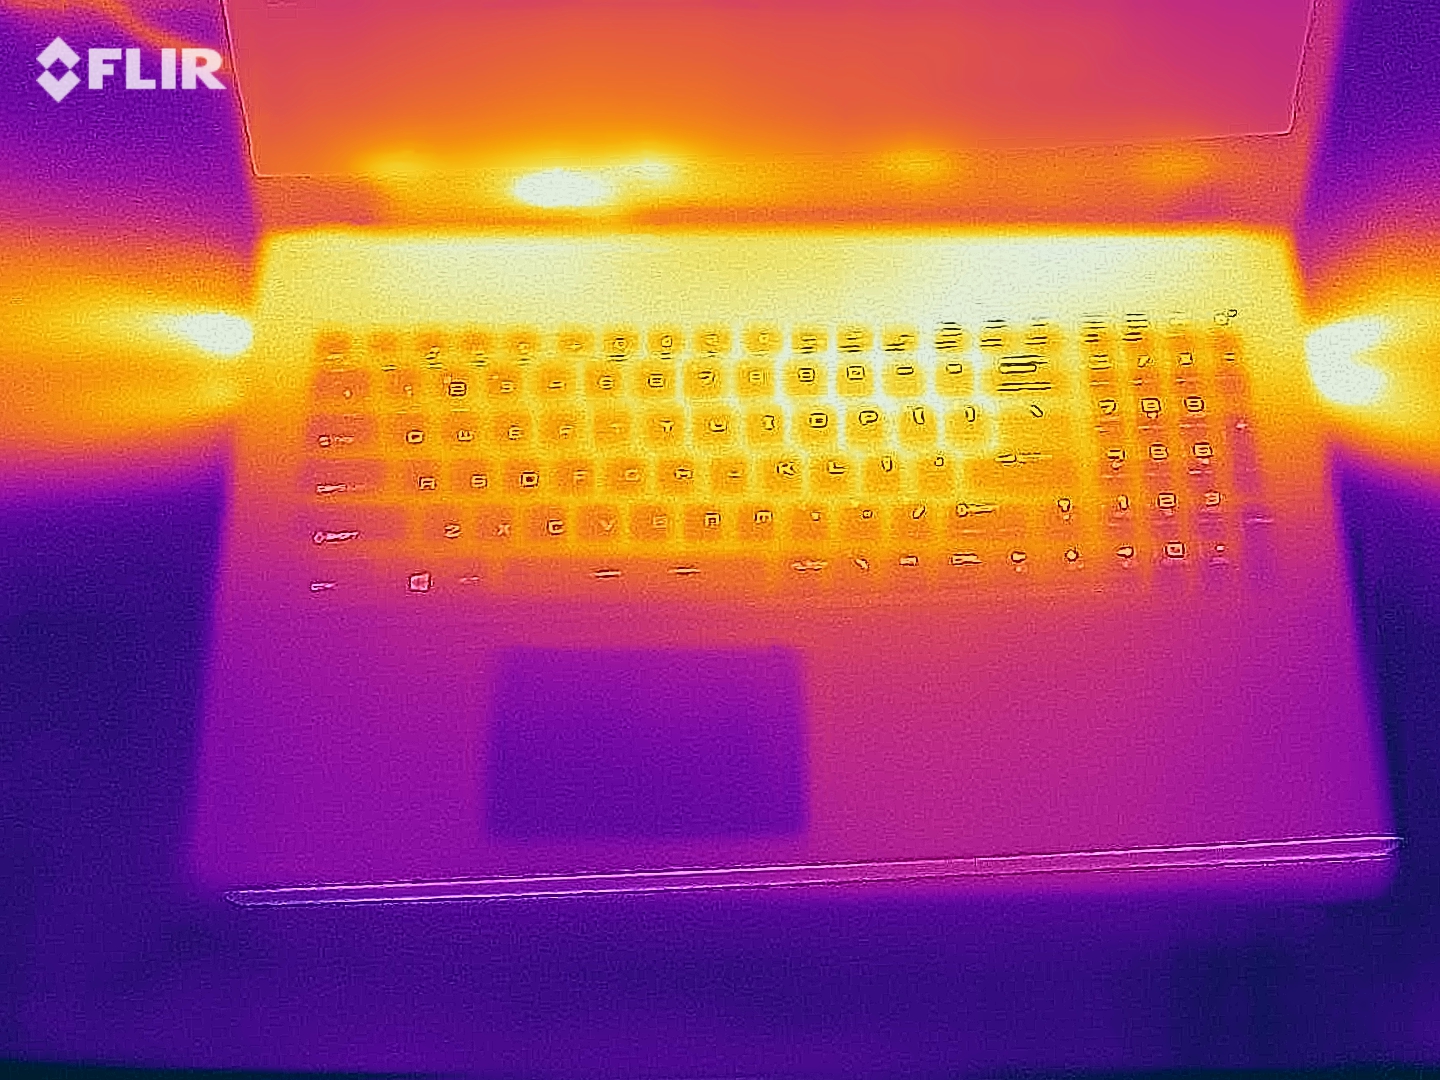
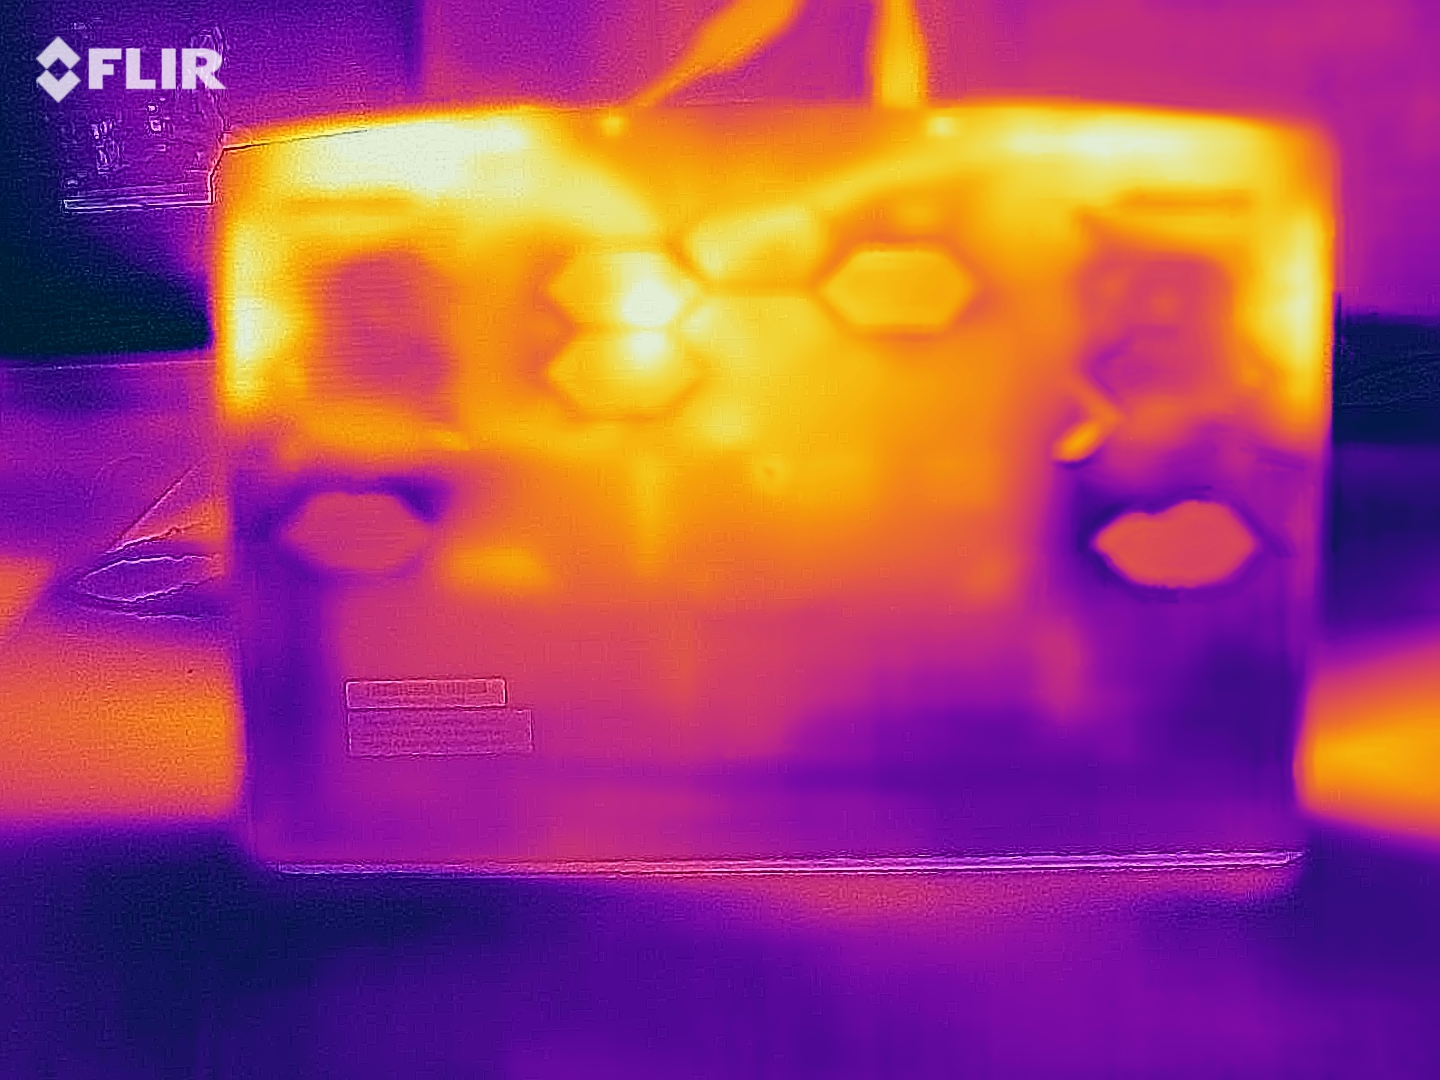
(±) La température maximale du côté supérieur est de 43 °C / 109 F, par rapport à la moyenne de 40.4 °C / 105 F, allant de 21.2 à 68.8 °C pour la classe Gaming.
(-) Le fond chauffe jusqu'à un maximum de 47 °C / 117 F, contre une moyenne de 43.2 °C / 110 F
(+) En utilisation inactive, la température moyenne du côté supérieur est de 29.1 °C / 84 F, par rapport à la moyenne du dispositif de 33.9 °C / 93 F.
(±) En jouant à The Witcher 3, la température moyenne du côté supérieur est de 37.6 °C / 100 F, alors que la moyenne de l'appareil est de 33.9 °C / 93 F.
(+) Les repose-poignets et le pavé tactile sont plus froids que la température de la peau avec un maximum de 30 °C / 86 F et sont donc froids au toucher.
(±) La température moyenne de la zone de l'appui-paume de dispositifs similaires était de 28.8 °C / 83.8 F (-1.2 °C / #-2.2 F).
| MSI GE76 Raider i9-12900HK, GeForce RTX 3080 Ti Laptop GPU | Schenker XMG NEO 17 GM7TG8S i7-11800H, GeForce RTX 3080 Laptop GPU | Alienware x17 RTX 3080 P48E i7-11800H, GeForce RTX 3080 Laptop GPU | Asus ROG Zephyrus S17 GX703HSD i9-11900H, GeForce RTX 3080 Laptop GPU | Schenker XMG Ultra 17 Rocket Lake i9-11900K, GeForce RTX 3080 Laptop GPU | |
|---|---|---|---|---|---|
| Heat | -15% | -9% | -13% | 3% | |
| Maximum Upper Side * (°C) | 43 | 51 -19% | 58.4 -36% | 59 -37% | 34 21% |
| Maximum Bottom * (°C) | 47 | 62 -32% | 49 -4% | 53 -13% | 43 9% |
| Idle Upper Side * (°C) | 33 | 35 -6% | 33.6 -2% | 35 -6% | 38 -15% |
| Idle Bottom * (°C) | 37 | 38 -3% | 34.6 6% | 35 5% | 39 -5% |
* ... Moindre est la valeur, meilleures sont les performances
Haut-parleurs
MSI GE76 Raider analyse audio
(+) | les haut-parleurs peuvent jouer relativement fort (84# dB)
Basses 100 - 315 Hz
(±) | basse réduite - en moyenne 10.3% inférieure à la médiane
(±) | la linéarité des basses est moyenne (8.5% delta à la fréquence précédente)
Médiums 400 - 2000 Hz
(±) | médiane supérieure - en moyenne 6.8% supérieure à la médiane
(+) | les médiums sont linéaires (4.1% delta à la fréquence précédente)
Aiguës 2 - 16 kHz
(+) | des sommets équilibrés - à seulement 2.7% de la médiane
(+) | les aigus sont linéaires (4.9% delta à la fréquence précédente)
Globalement 100 - 16 000 Hz
(+) | le son global est linéaire (13.5% différence à la médiane)
Par rapport à la même classe
» 20% de tous les appareils testés de cette catégorie étaient meilleurs, 7% similaires, 73% pires
» Le meilleur avait un delta de 6%, la moyenne était de 18%, le pire était de 132%.
Par rapport à tous les appareils testés
» 14% de tous les appareils testés étaient meilleurs, 4% similaires, 82% pires
» Le meilleur avait un delta de 4%, la moyenne était de 23%, le pire était de 134%.
Alienware x17 RTX 3080 P48E analyse audio
(+) | les haut-parleurs peuvent jouer relativement fort (88# dB)
Basses 100 - 315 Hz
(-) | presque aucune basse - en moyenne 23% plus bas que la médiane
(±) | la linéarité des basses est moyenne (9.8% delta à la fréquence précédente)
Médiums 400 - 2000 Hz
(+) | médiane équilibrée - seulement 2.7% de la médiane
(+) | les médiums sont linéaires (4% delta à la fréquence précédente)
Aiguës 2 - 16 kHz
(+) | des sommets équilibrés - à seulement 4.4% de la médiane
(±) | la linéarité des aigus est moyenne (7% delta à la fréquence précédente)
Globalement 100 - 16 000 Hz
(±) | la linéarité du son global est moyenne (17.3% de différence avec la médiane)
Par rapport à la même classe
» 47% de tous les appareils testés de cette catégorie étaient meilleurs, 12% similaires, 41% pires
» Le meilleur avait un delta de 6%, la moyenne était de 18%, le pire était de 132%.
Par rapport à tous les appareils testés
» 33% de tous les appareils testés étaient meilleurs, 8% similaires, 59% pires
» Le meilleur avait un delta de 4%, la moyenne était de 23%, le pire était de 134%.
Gestion de l'énergie
Consommation d'énergie
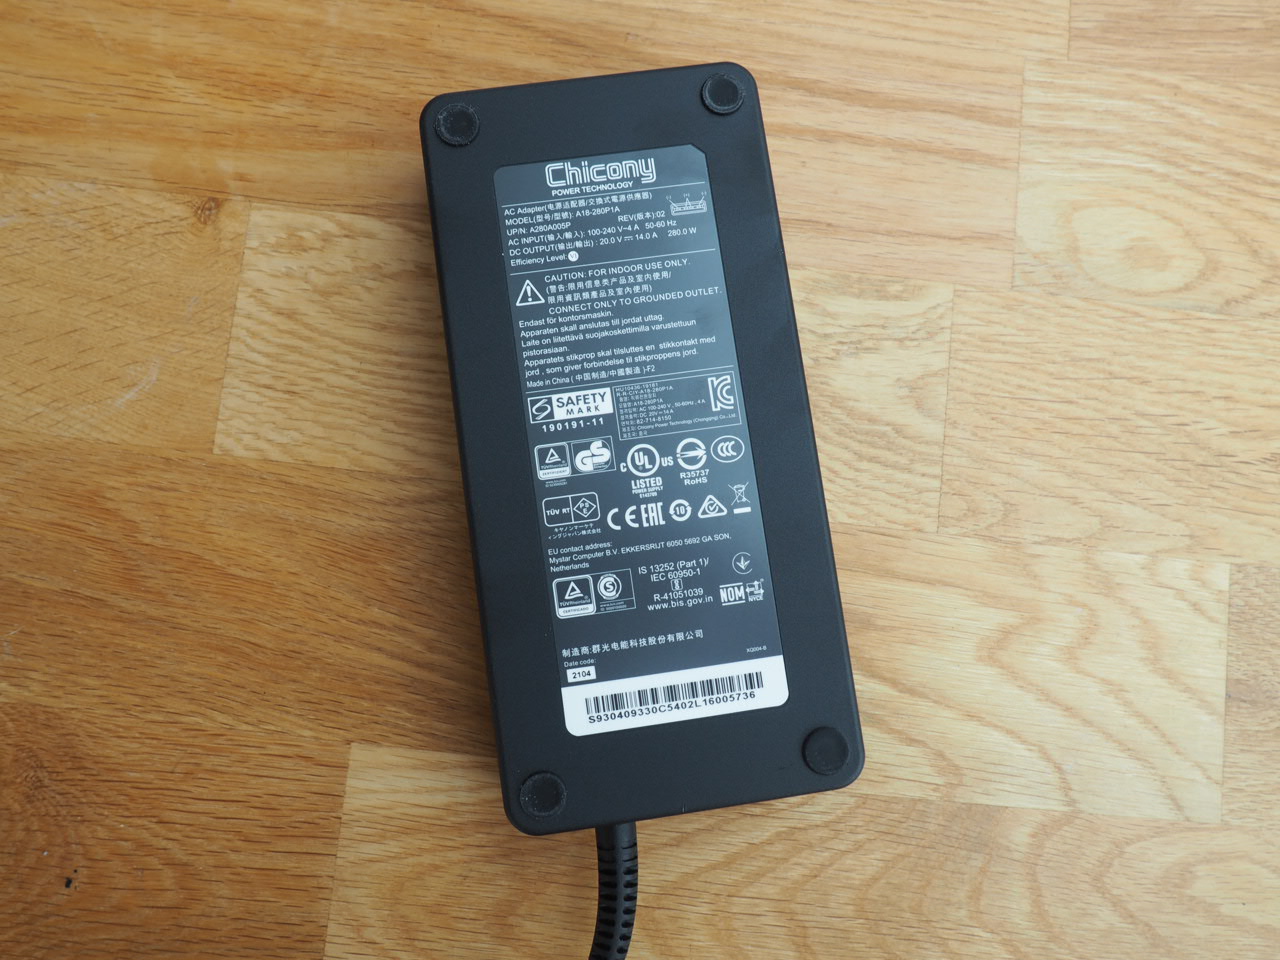
Le GE76 ne consomme pas trop d'énergie au ralenti tant que la commutation graphique est activée. une consommation de 12 à 28 watts est un bon résultat compte tenu du matériel utilisé, et il est également plus efficace que ses concurrents. Nous avons observé entre 118 et 272 Watts pendant les applications 3D, donc l'adaptateur d'alimentation 280W inclus semble être suffisant.
| Éteint/en veille | |
| Au repos | |
| Fortement sollicité |
|
Légende:
min: | |
| MSI GE76 Raider i9-12900HK, GeForce RTX 3080 Ti Laptop GPU | Schenker XMG NEO 17 GM7TG8S i7-11800H, GeForce RTX 3080 Laptop GPU | Alienware x17 RTX 3080 P48E i7-11800H, GeForce RTX 3080 Laptop GPU | Asus ROG Zephyrus S17 GX703HSD i9-11900H, GeForce RTX 3080 Laptop GPU | Schenker XMG Ultra 17 Rocket Lake i9-11900K, GeForce RTX 3080 Laptop GPU | Moyenne de la classe Gaming | |
|---|---|---|---|---|---|---|
| Power Consumption | -11% | -13% | -17% | -158% | 1% | |
| Idle Minimum * (Watt) | 12 | 19 -58% | 10.2 15% | 21.7 -81% | 62 -417% | 13 ? -8% |
| Idle Average * (Watt) | 17 | 25 -47% | 21.2 -25% | 27 -59% | 64 -276% | 19 ? -12% |
| Idle Maximum * (Watt) | 28 | 28 -0% | 48.4 -73% | 33 -18% | 69 -146% | 24.6 ? 12% |
| Load Average * (Watt) | 118 | 105 11% | 118.7 -1% | 108 8% | 183 -55% | 110.7 ? 6% |
| Witcher 3 ultra * (Watt) | 252 | 223 12% | 249 1% | 195 23% | 297 -18% | |
| Load Maximum * (Watt) | 272 | 226 17% | 262 4% | 210 23% | 368 -35% | 259 ? 5% |
* ... Moindre est la valeur, meilleures sont les performances
Power Consumption Witcher 3 / Stress test
Power Consumption external screen
Durée de vie de la batterie
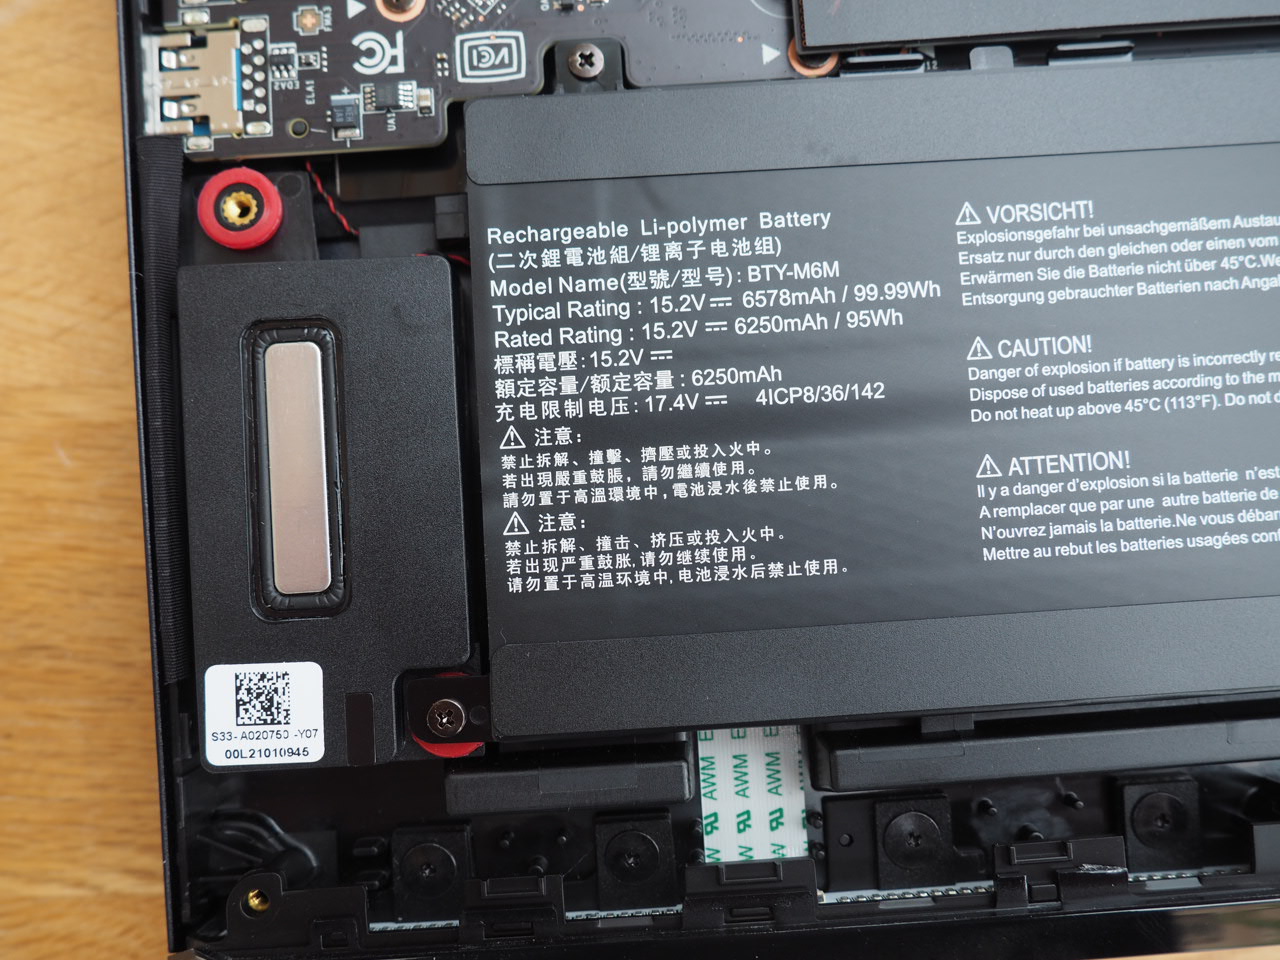
Un coup d'œil à la disposition interne montre que la zone située sous les repose-paumes est presque entièrement occupée par la batterie. MSI a une fois de plus décidé d'utiliser un modèle géant de 99,9 Wh, qui bat tous ses rivaux - du moins sur le papier (62 jusqu'à 97 Wh). Cependant, l'autonomie de la batterie n'est pas à la hauteur. L'Alienware x17 et l'Asus Zephyrus S17 ont tous deux une autonomie plus longue dans notre test Wi-Fi (navigation sur Internet à 150 nits), malgré des batteries plus petites. Près de 5 heures avec le mode de performance Balanced reste un résultat respectable pour l'appareil de test de 17 pouces.
| MSI GE76 Raider i9-12900HK, GeForce RTX 3080 Ti Laptop GPU, 99.99 Wh | Schenker XMG NEO 17 GM7TG8S i7-11800H, GeForce RTX 3080 Laptop GPU, 62 Wh | Alienware x17 RTX 3080 P48E i7-11800H, GeForce RTX 3080 Laptop GPU, 87 Wh | Asus ROG Zephyrus S17 GX703HSD i9-11900H, GeForce RTX 3080 Laptop GPU, 90 Wh | Schenker XMG Ultra 17 Rocket Lake i9-11900K, GeForce RTX 3080 Laptop GPU, 97 Wh | Moyenne de la classe Gaming | |
|---|---|---|---|---|---|---|
| Autonomie de la batterie | -27% | 16% | 47% | -65% | 39% | |
| WiFi v1.3 (h) | 5.1 | 3.7 -27% | 5.9 16% | 7.5 47% | 1.8 -65% | 7.11 ? 39% |
| H.264 (h) | 3.7 | 7.2 | 1.9 | 8.32 ? | ||
| Load (h) | 1.6 | 0.8 | 2.7 | 1.1 | 1.502 ? | |
| Reader / Idle (h) | 7 | 3 | 8.27 ? | |||
| Witcher 3 ultra (h) | 1 |
Points positifs
Points négatifs
Verdict
La dernière version du MSI GE76 Raider est une fois de plus un rêve pour les amateurs de jeux vidéo
Oui, MSI pourrait améliorer certains aspects (comme la qualité de la webcam), mais le fabricant propose un ensemble très convaincant et équilibré. Le plus grand avantage est certainement l'immense potentiel de performances.
La combinaison deCore i9-12900HK,GeForce RTX 3080 Ti32 Go de DDR5-RAM et les deux NVMe-SSD offrent de nombreuses performances pour les deux prochaines années et beaucoup de puissance pour les applications 3D. La plupart des titres fonctionneraient encore sans problème sur un écran 4K externe avec les paramètres maximaux. La dalle intégrée de 360 Hz impressionne par ses temps de réponse rapides et sa bonne précision des couleurs.
Si l'appareil est trop bruyant pour vous en mode Performance extrême, vous pouvez facilement passer à un autre paramètre de performance via le logiciel MSI Center. Le profil Balanced est un bon compromis entre les fréquences d'images et le bruit du ventilateur selon notre expérience, et nous recommanderions les modes Silent et Super Battery avec commutation graphique active pour les charges de travail simples ou sur la route, respectivement.
MSI GE76 Raider
- 01/24/2022 v7 (old)
Florian Glaser
Price comparison

