Verdict - L'épée pourrait être plus tranchante
Le katana 17 HX B14WGK est confronté à des défis non seulement au sein de la gamme MSI, mais aussi par rapport à ses homologues. Bien que le boîtier soit de bonne facture, il a tendance à s'entrechoquer et ne donne pas l'impression d'être d'une grande qualité. Les mesures de réduction des coûts se retrouvent également dans les interfaces. Les ports Thunderbolt ou les ports USB modernes (mot-clé USB 4) sont absents, tout comme le lecteur de cartes. En outre, le niveau de bruit est très élevé en charge, ce qui vous oblige pratiquement à utiliser des écouteurs. MSI pourrait également améliorer le clavier, auquel il faut s'habituer, le son des haut-parleurs, la qualité de la webcam et l'autonomie de la batterie.
Il n'y a pas grand-chose à redire sur l'affichage : hormis la faible luminosité, l'écran 240 Hz atteint de bonnes valeurs presque partout. Le fait que la GeForce RTX 5070 laisse des sentiments mitigés est plutôt le résultat des décisions de Nvidia en matière de produits. En outre, 8 Go de VRAM ne suffiront plus en 2025, surtout pour des applications gourmandes en ressources comme Indiana Jonesmême si la GDDR7 atténue quelque peu la situation. En dehors de cela, le 17 pouces est assez peu spectaculaire, c'est-à-dire qu'il ne se démarque pas de la masse, que ce soit positivement ou négativement, et il est donc juste suffisant pour obtenir la note "bon".
Points positifs
Points négatifs
Prix et disponibilité
En Allemagne, le MSI Katana 17 HX B14WGK avec Core i7-14650HX et GeForce RTX 5070 est proposé à partir de 1 800 euros (environ 2 065 dollars) sur différents sites de vente en ligne (par exemple playox.de)
- $57.95240W 12A Adapter for MSI Katana 15 17 HX B13V B13VGK B13VFK B13VEK B12V B12VGK B12VEK B12VFK B14W B14WGK Pulse 15 17 B13V B13VGK Delta 15 A5EFK Chicony A20-240P2A Gaming Laptop Charger 4.5 * 3.0 mm
- $59.99240W 200W AC Charger for MSI Katana 15 17 HX Pulse 15 17 B13V B13VF B13VGK B13VEK B13VGK-484US B13VEK-277US B14W B14WGK B14WFK B12V B12VFK B12VGK B12VEK GF66 GF76 12UE 12UGS 12UG Laptop
- $1,469.00msi Katana 15 HX B14WGK 15.6" 165Hz WQHD (2560x1440) IPS Laptop 2025 New | Intel i7-14650HX 16-Core | NVIDIA GeForce RTX 5070 | Four-Zone RGB Backlit KB | Wi-Fi 6E | 16GB DDR5 1TB SSD | Win11 Home
Les concurrents de la Katana 17 comprennent d'autres ordinateurs portables de jeu RTX 5070 (Ti) tels que le Gigabyte Aero X16l'Aero X16 de Gigabyte, le ProArt P16 d'Asus Asus ProArt P16l'Asus ProArt P16 Schenker XMG Pro 16ou encore le Vector 16 HX AI.
Spécifications
Cas
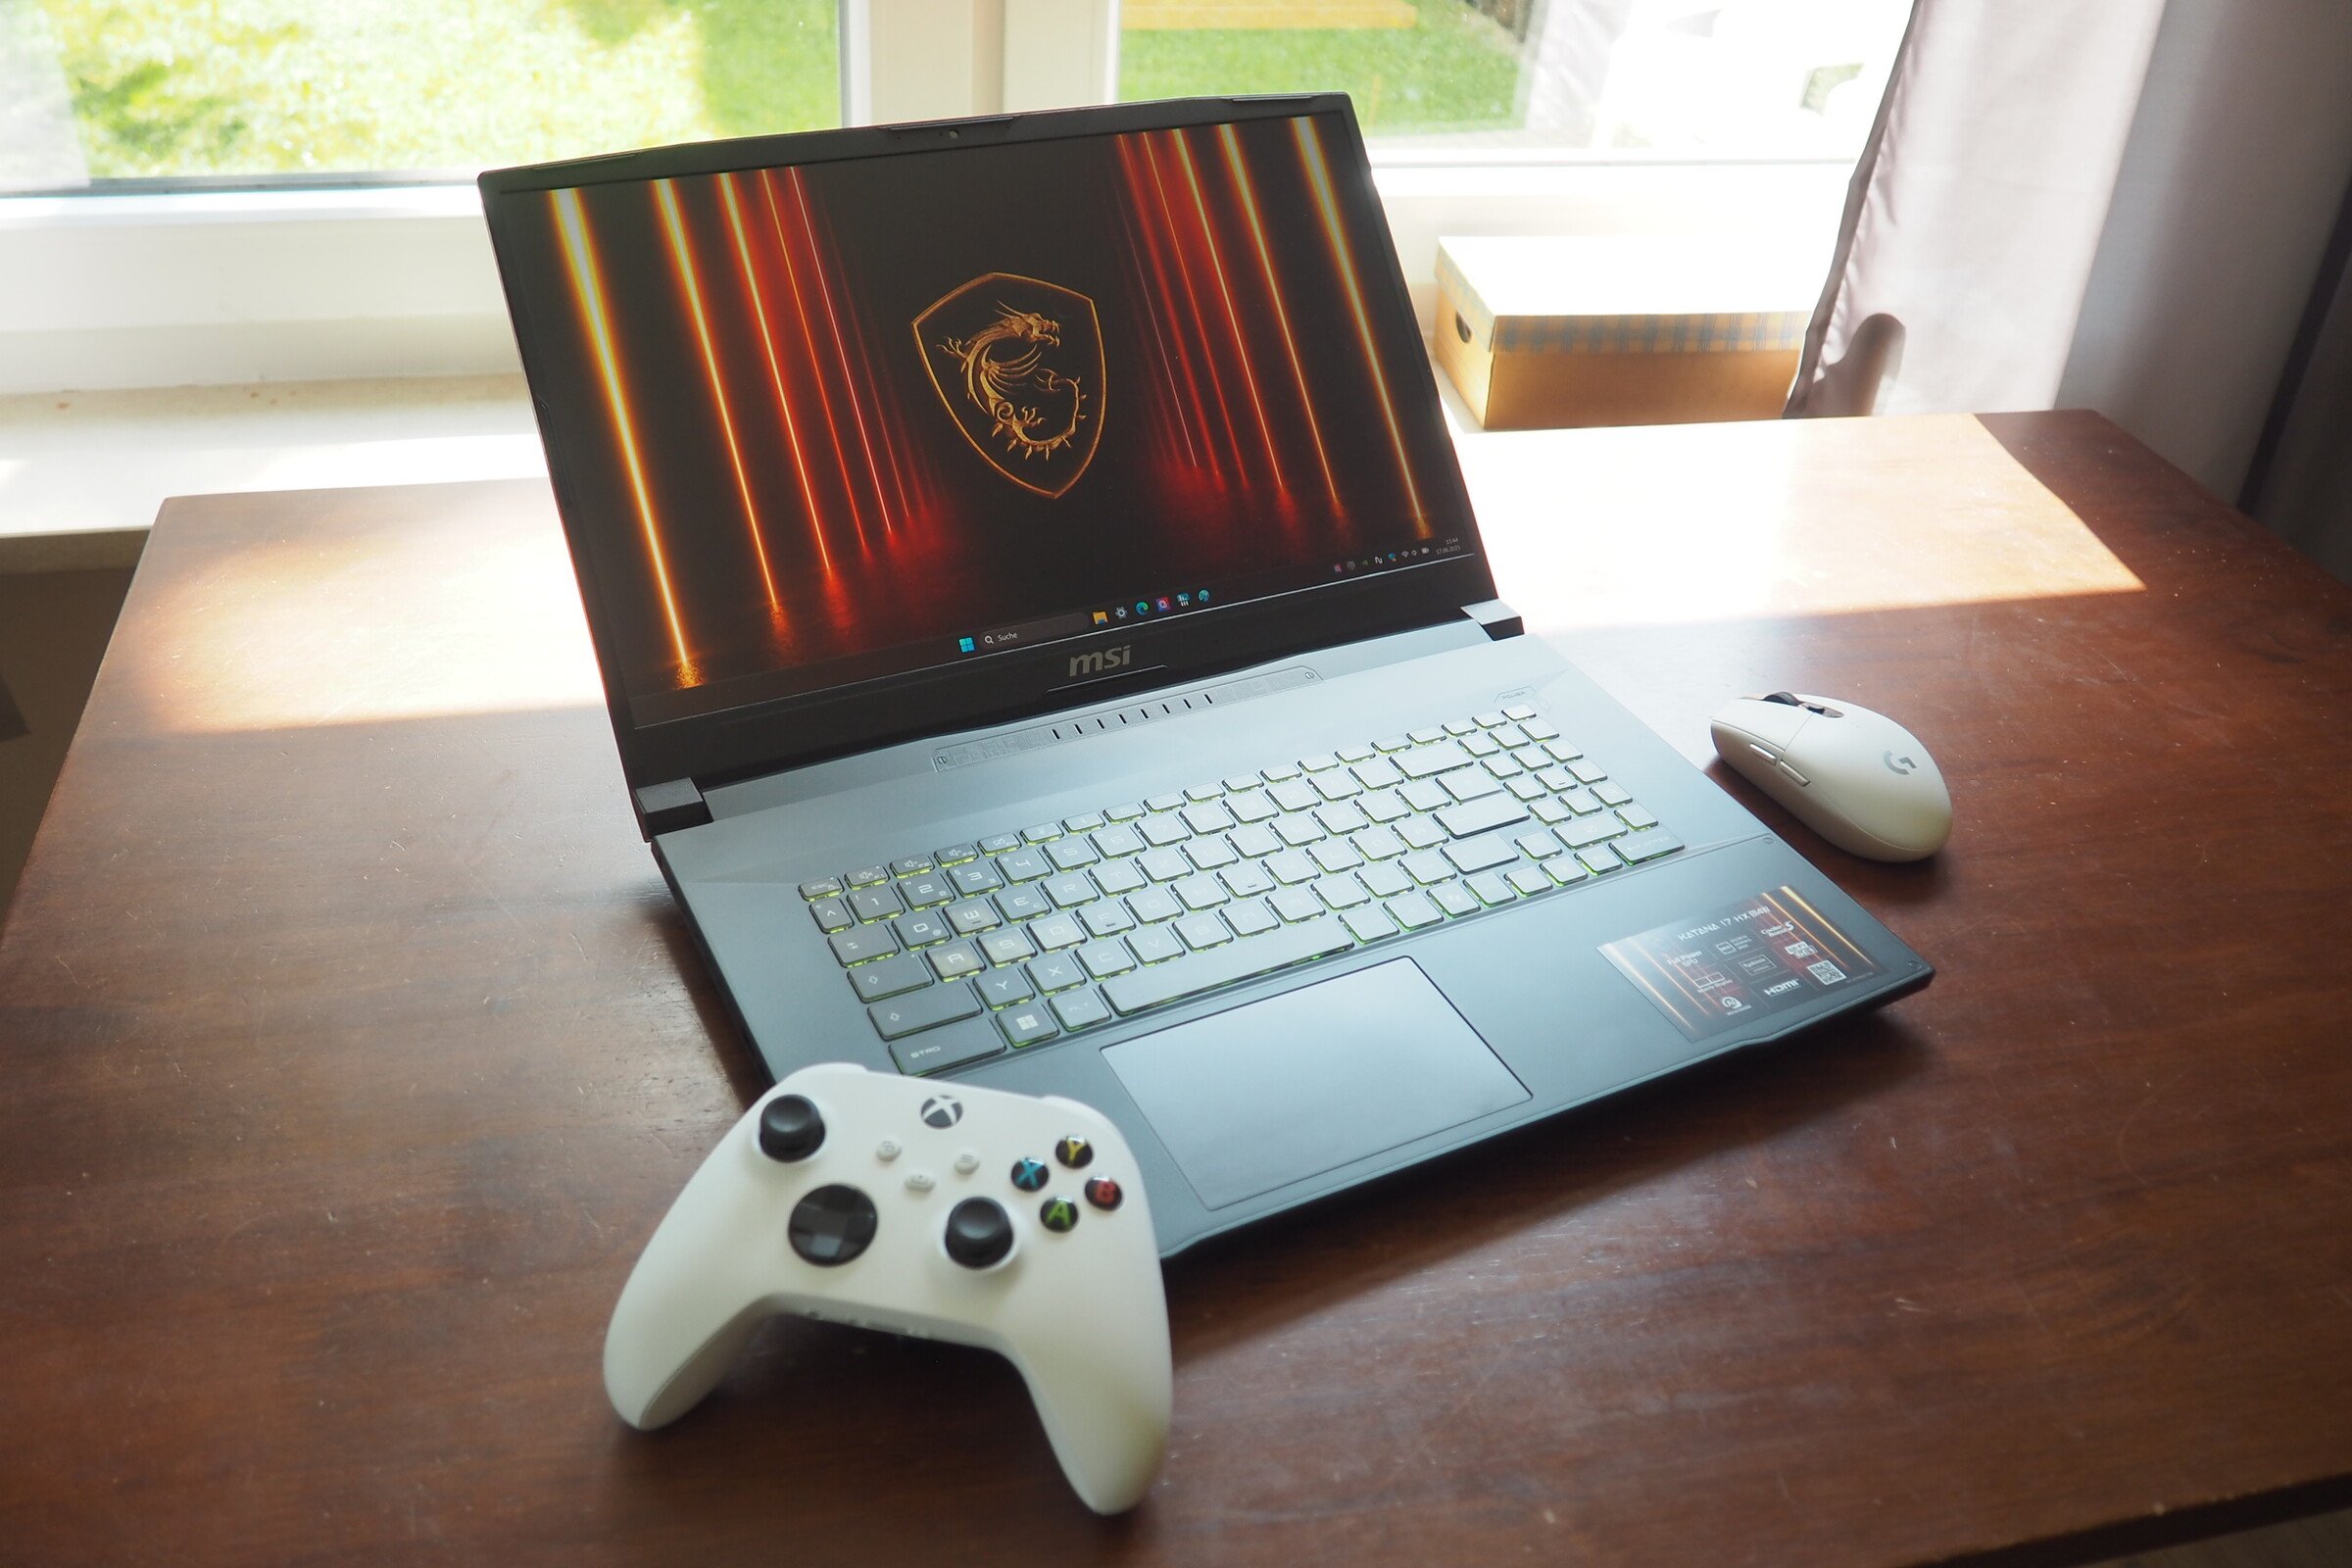
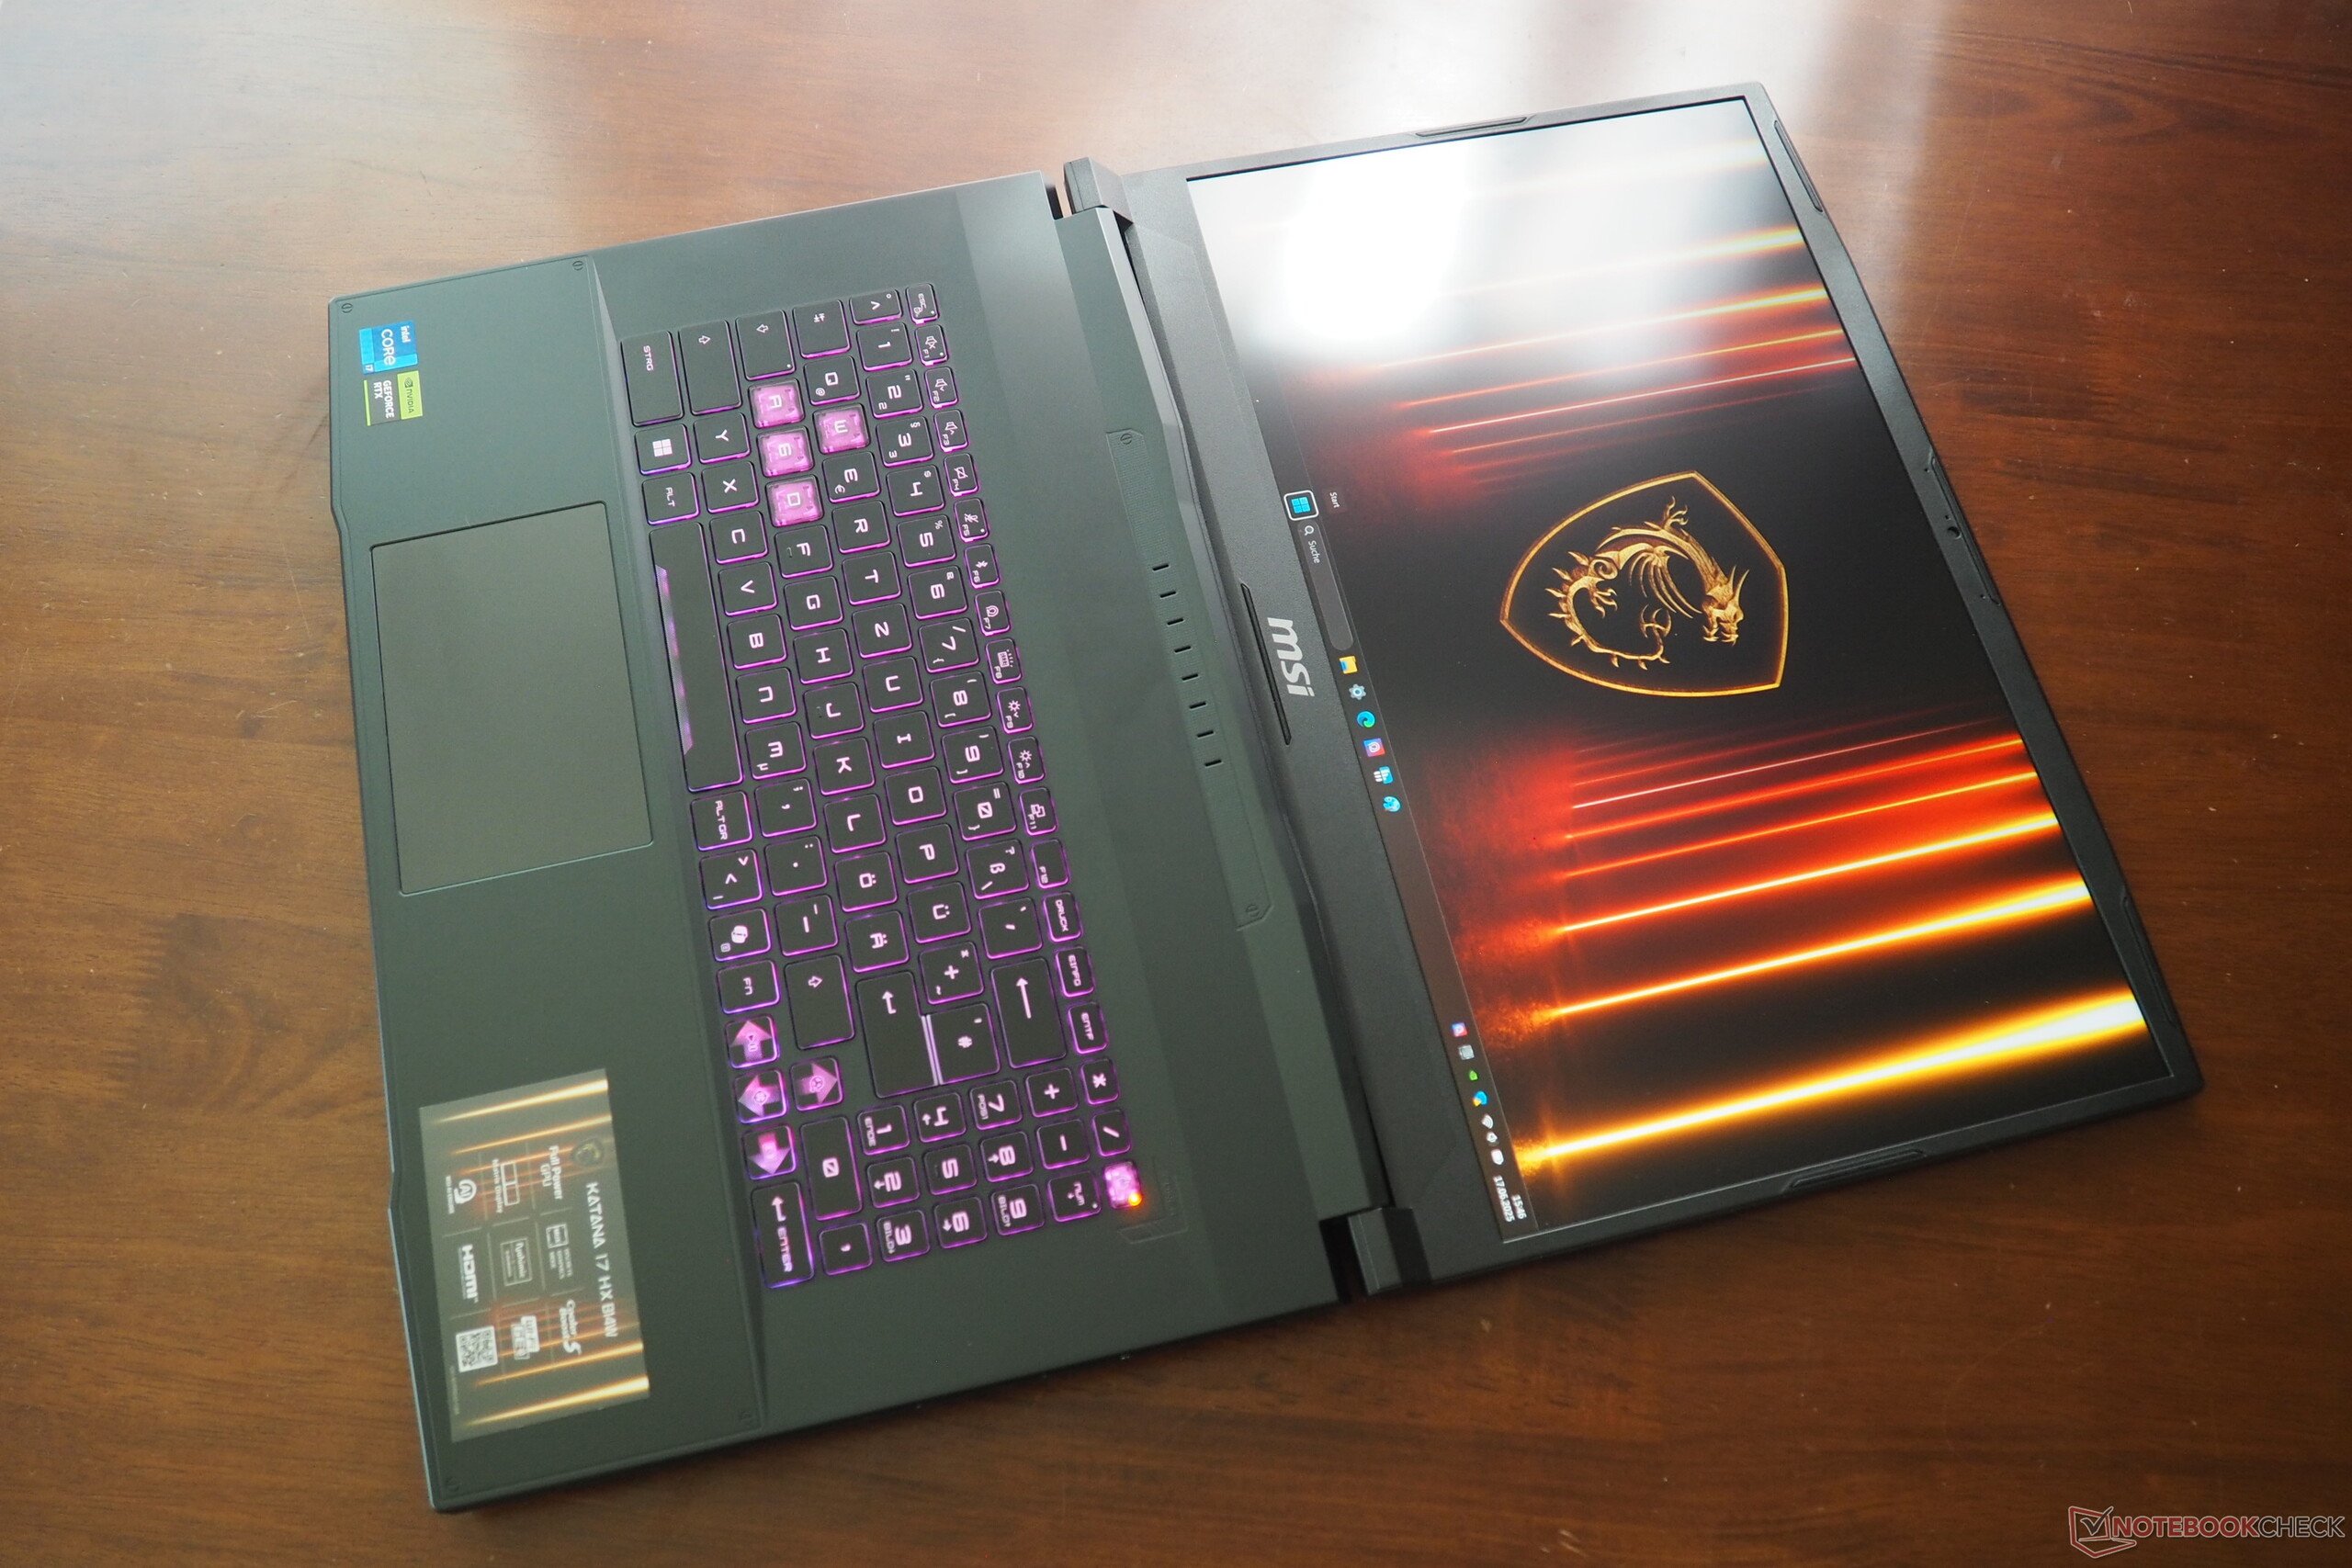
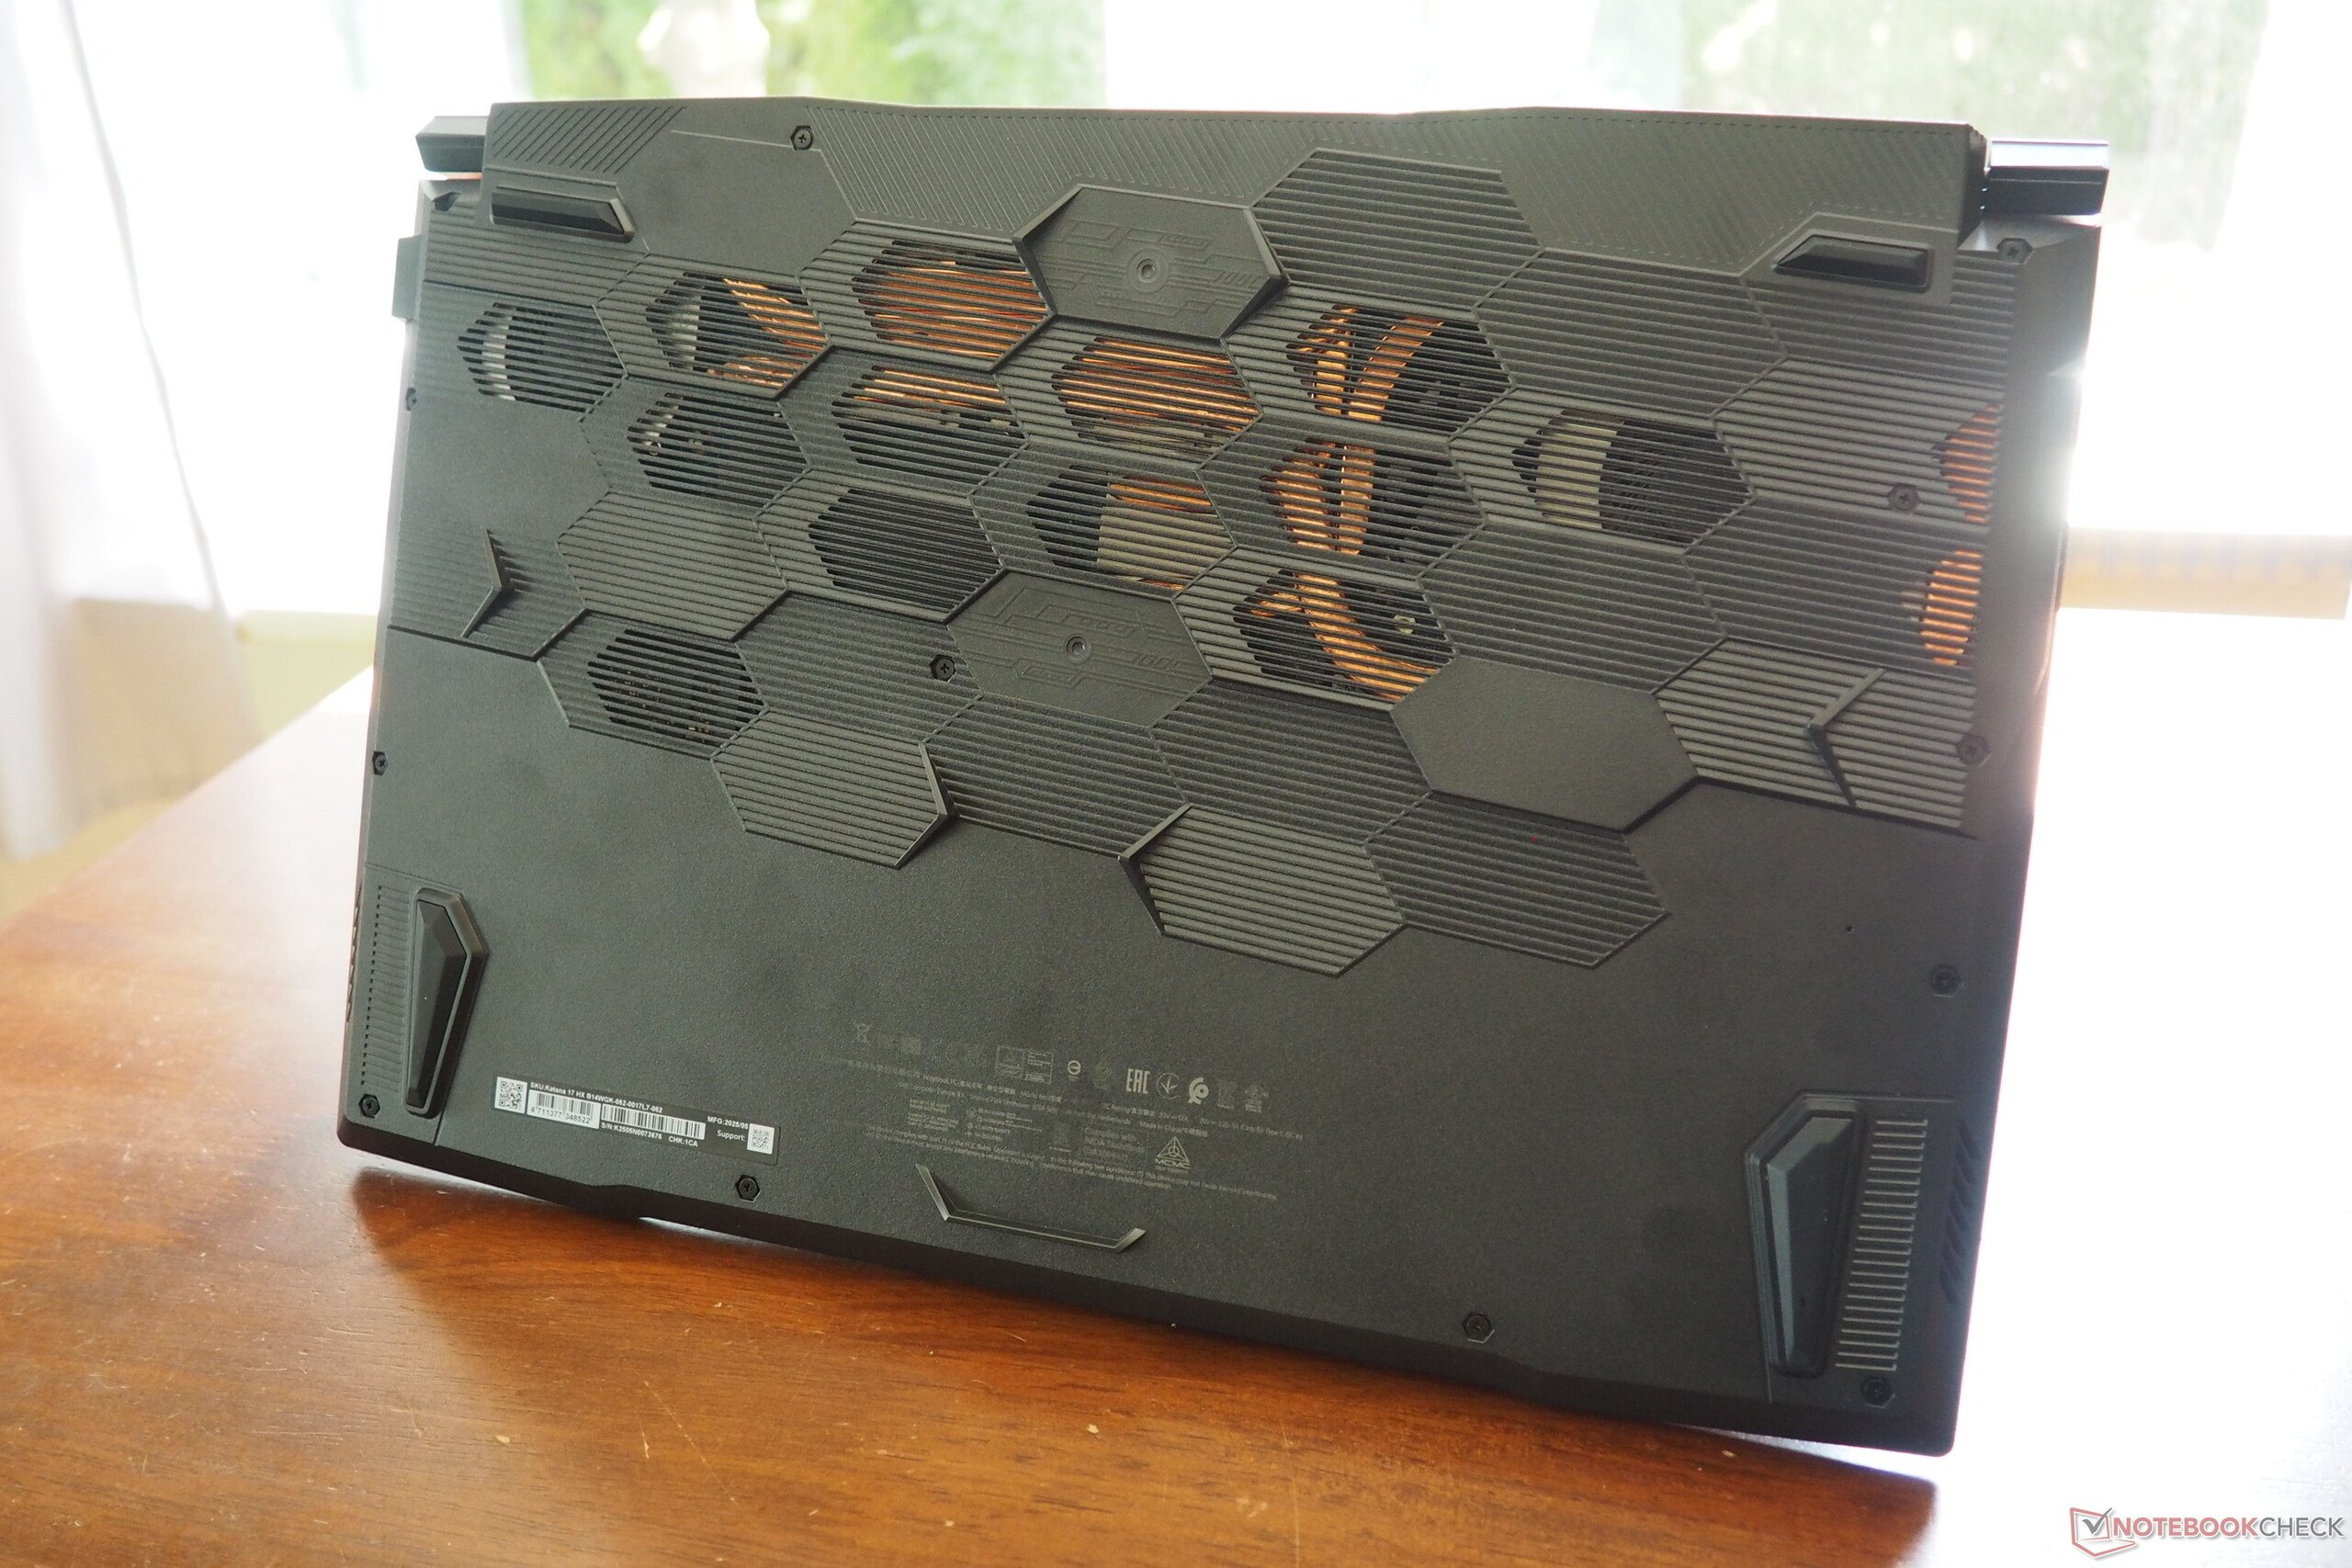
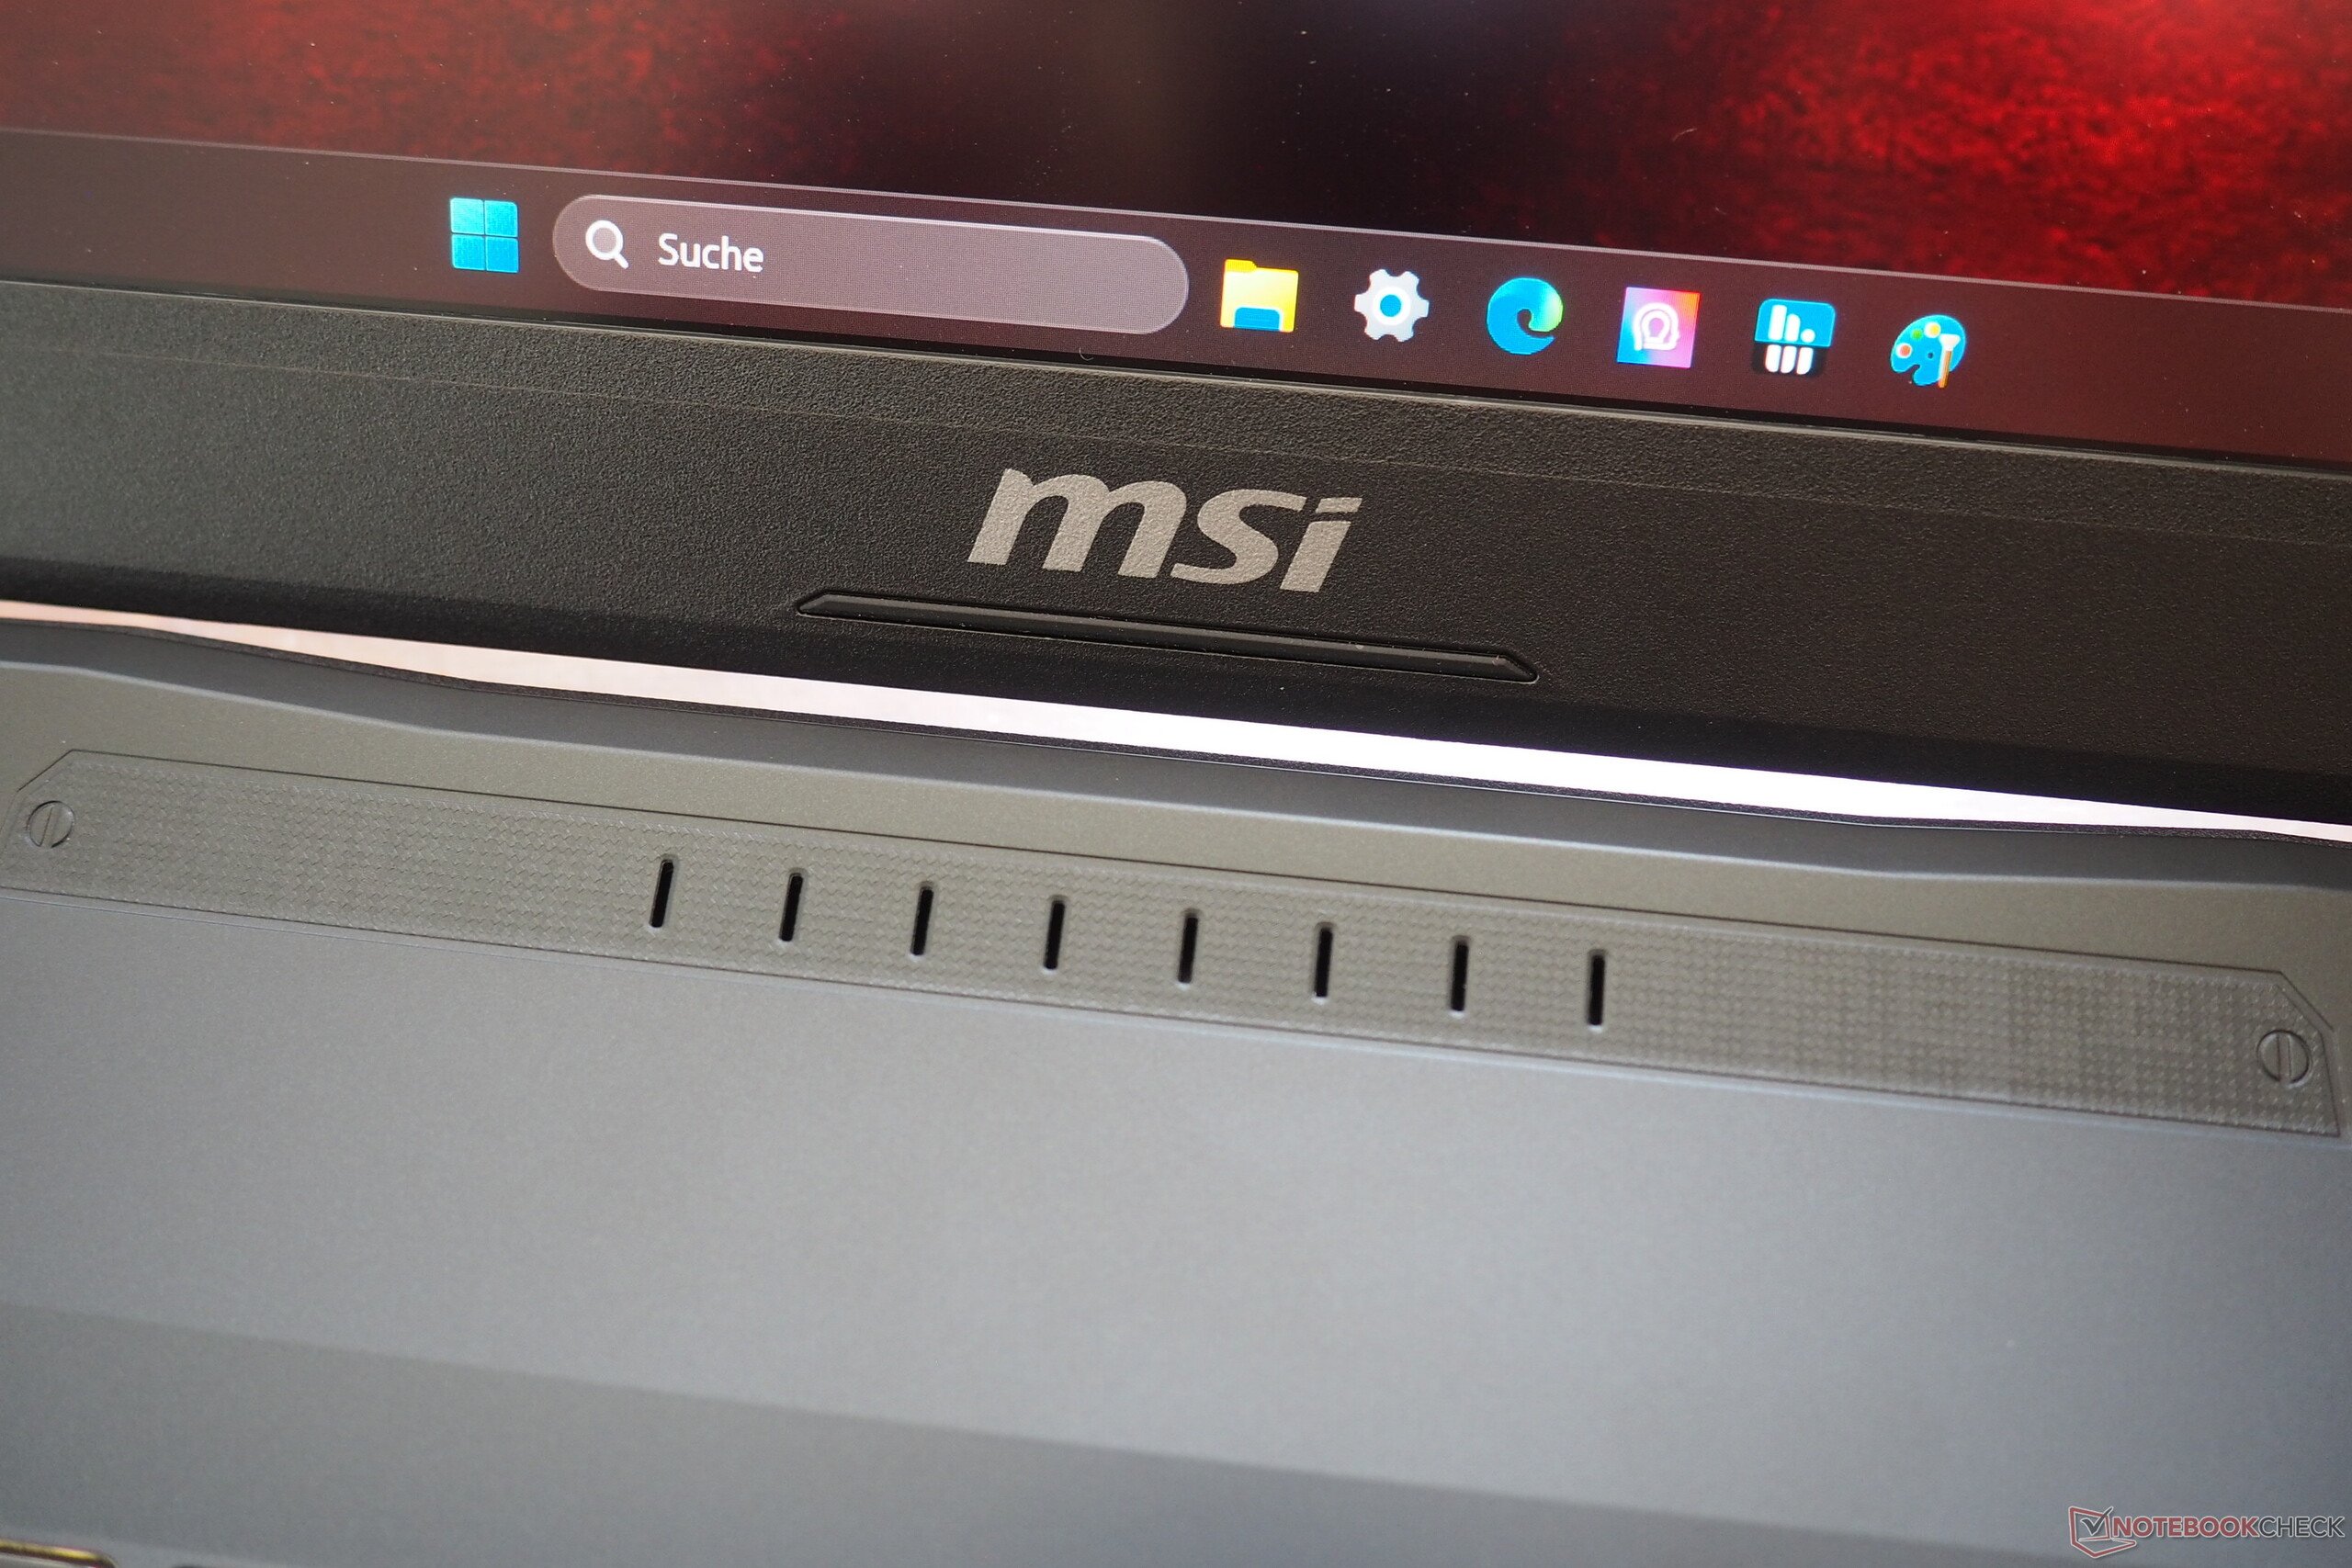
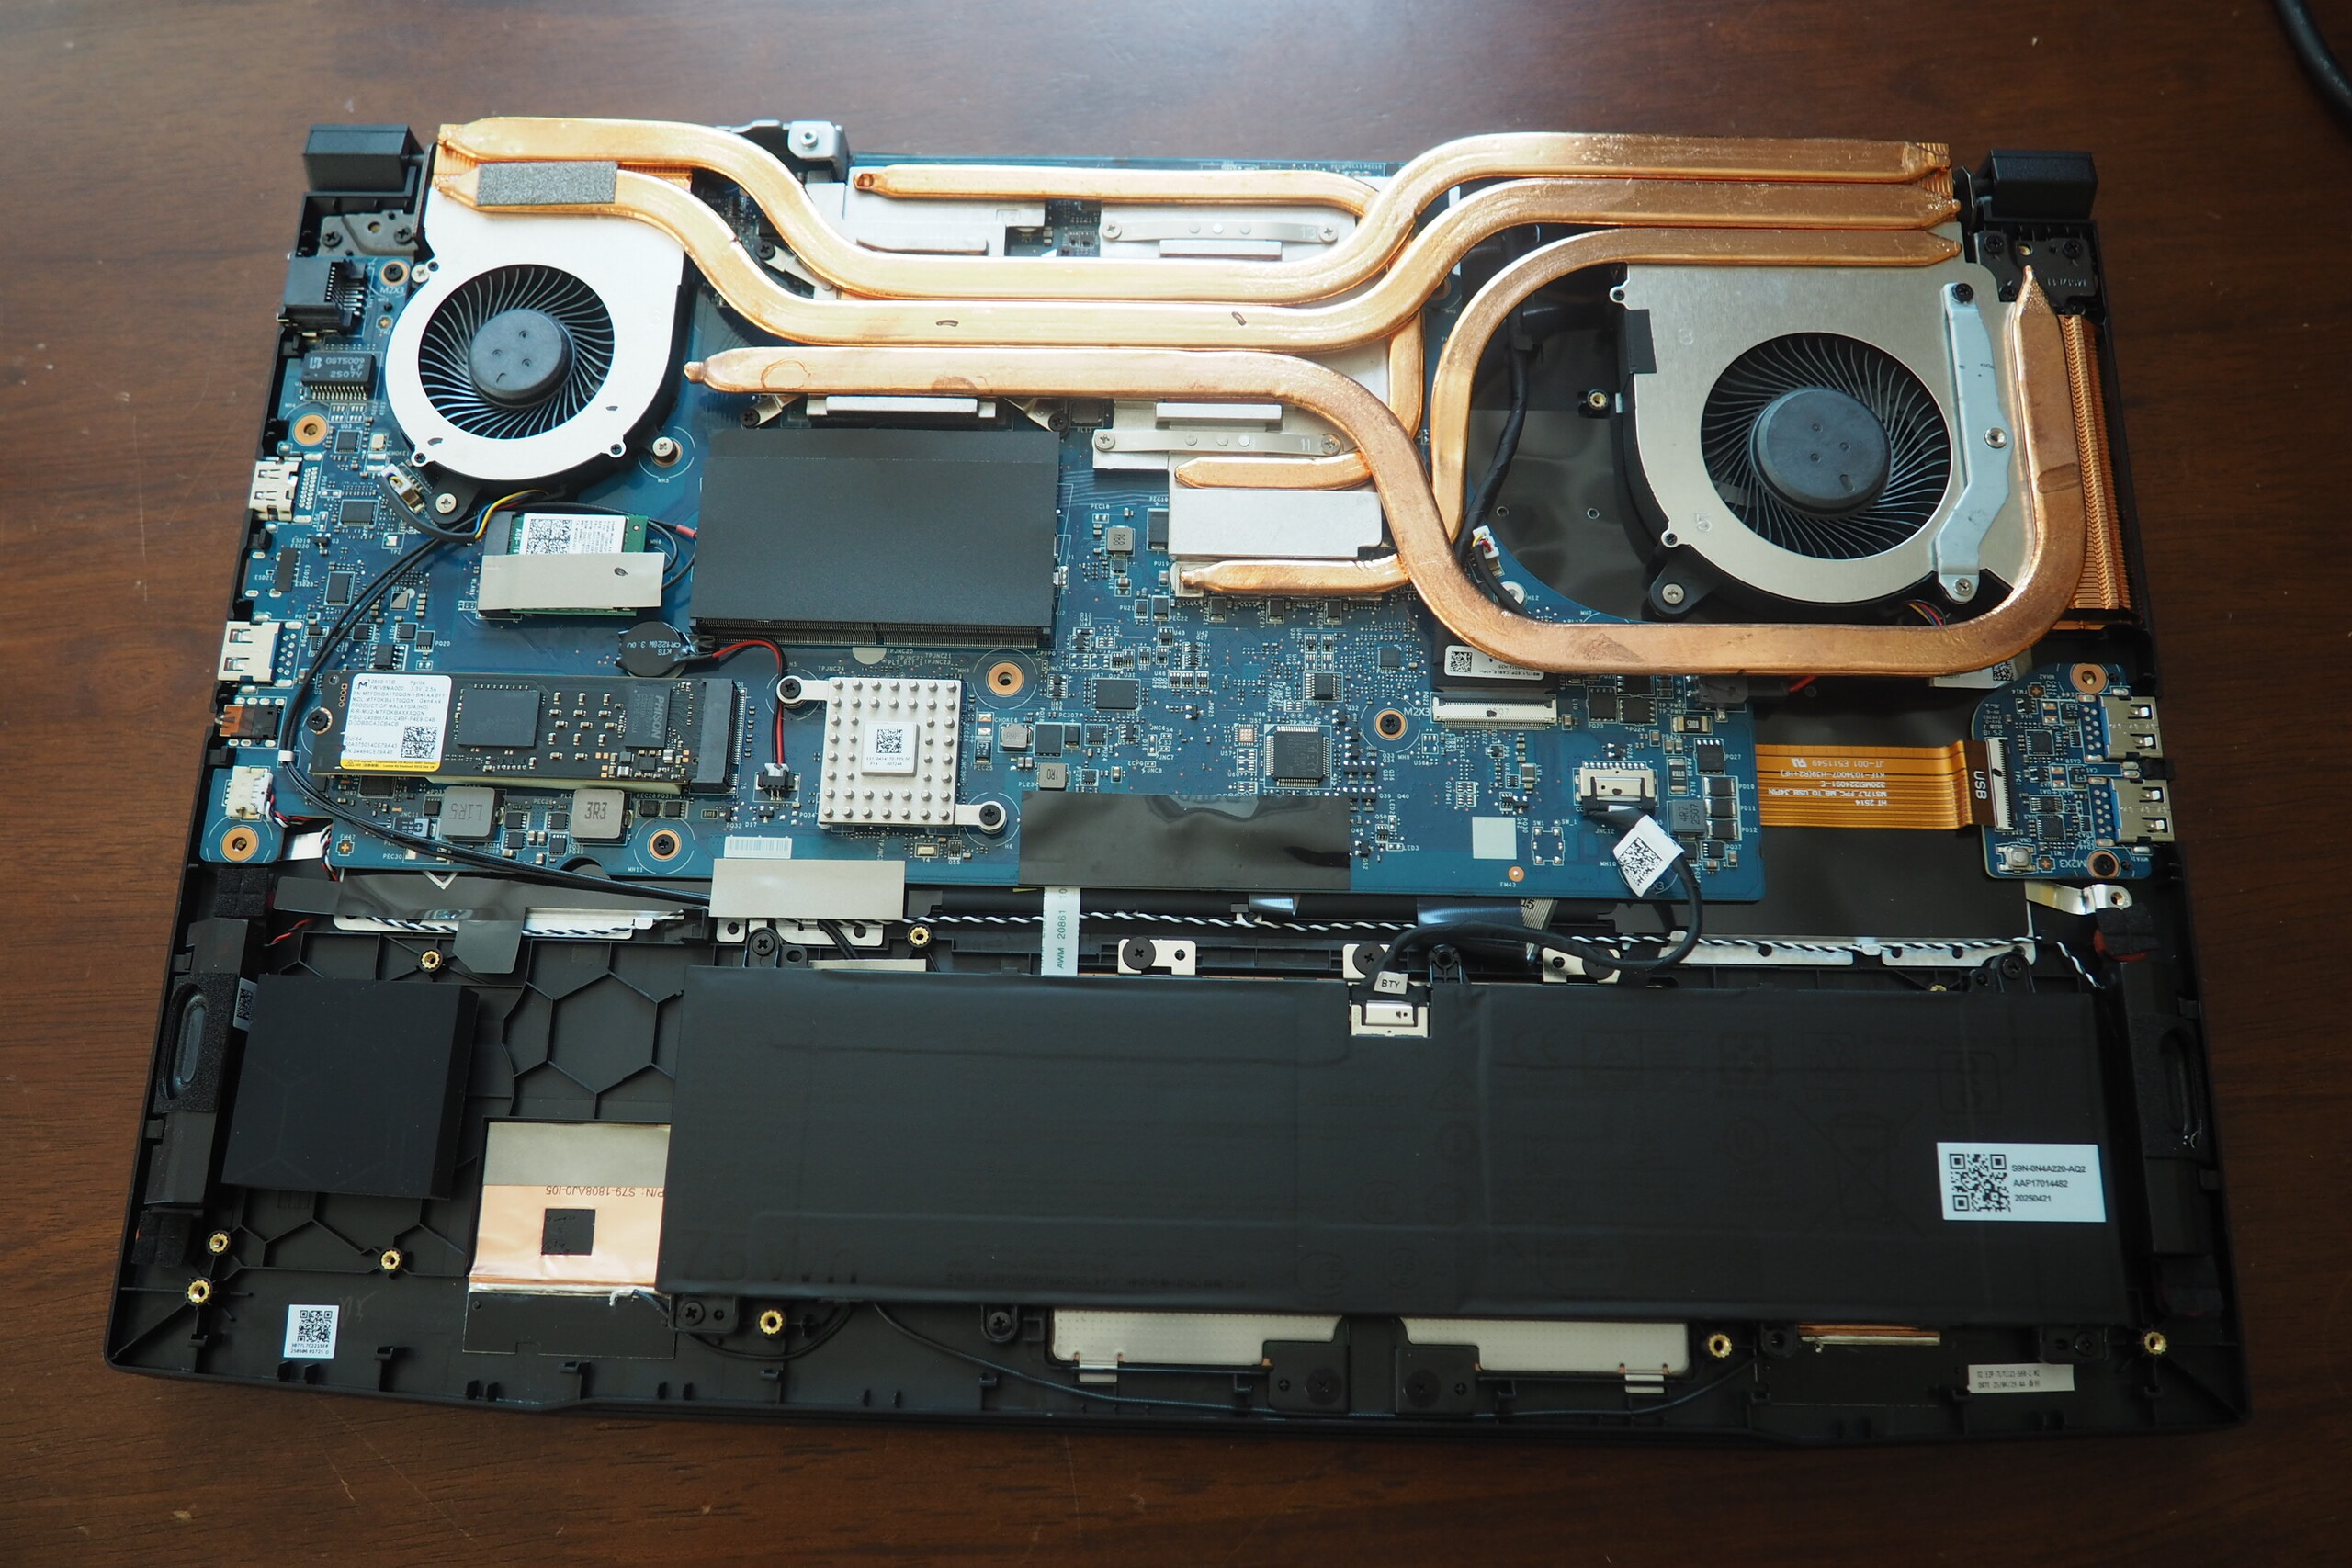
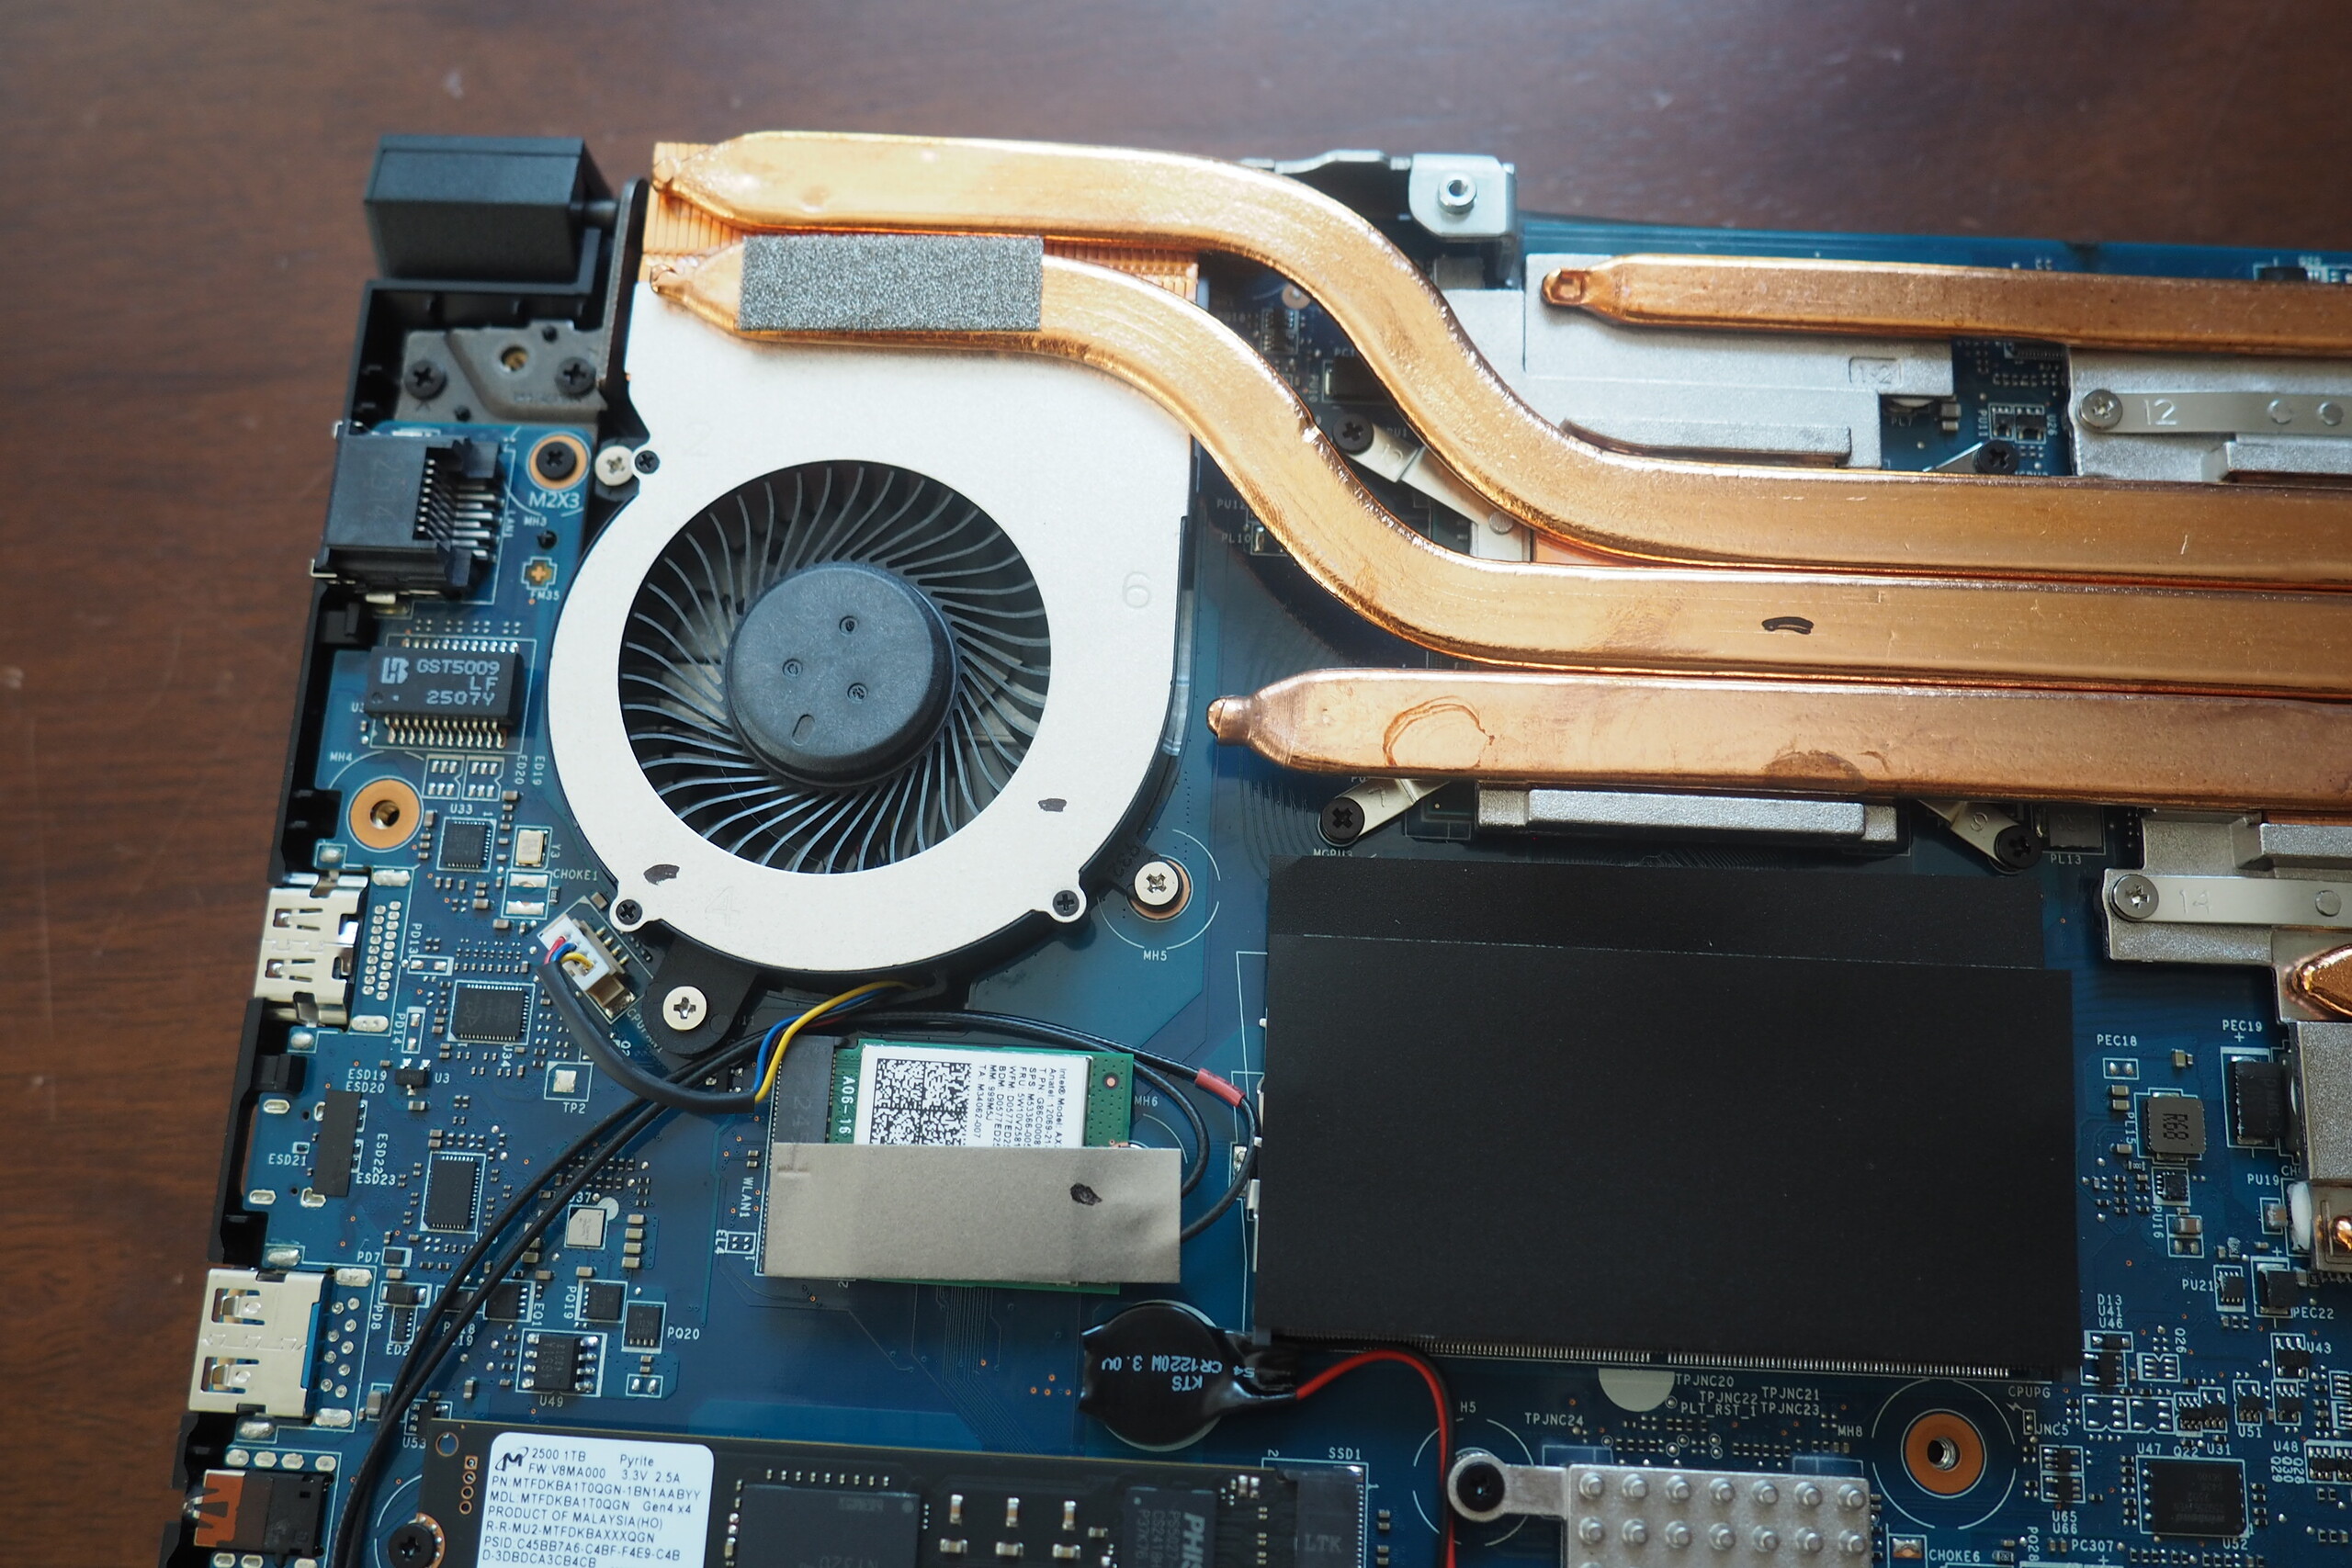
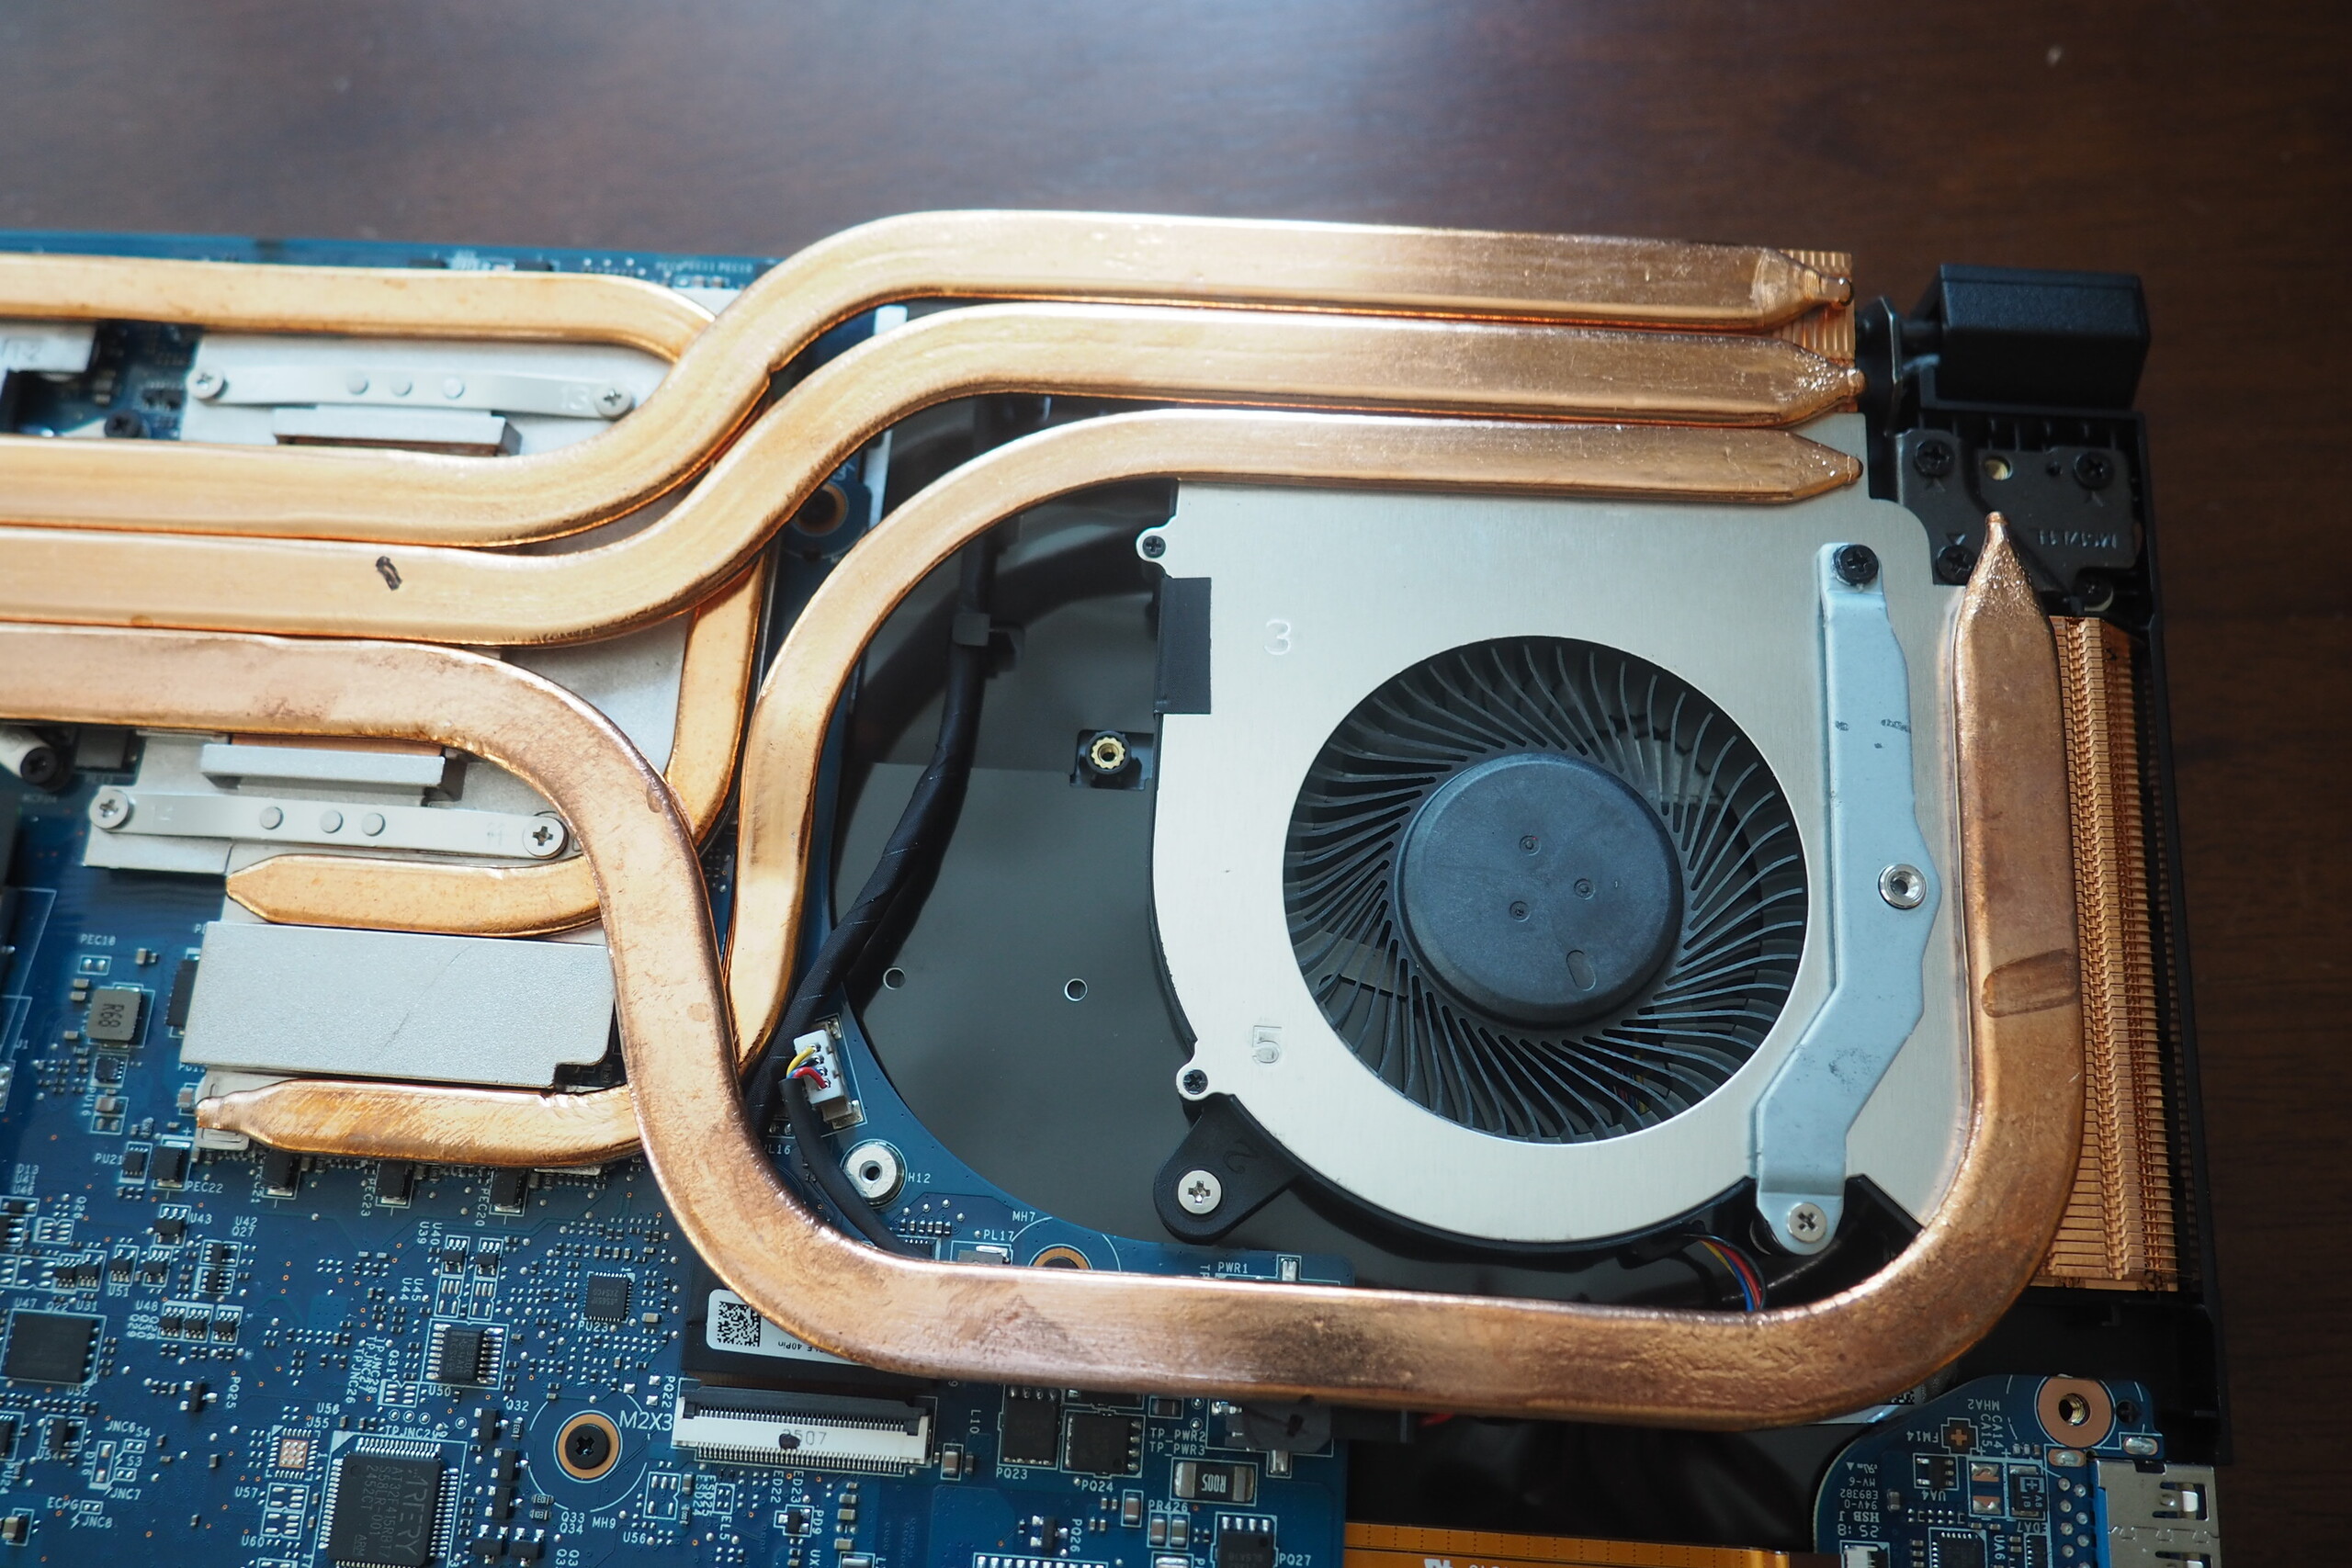
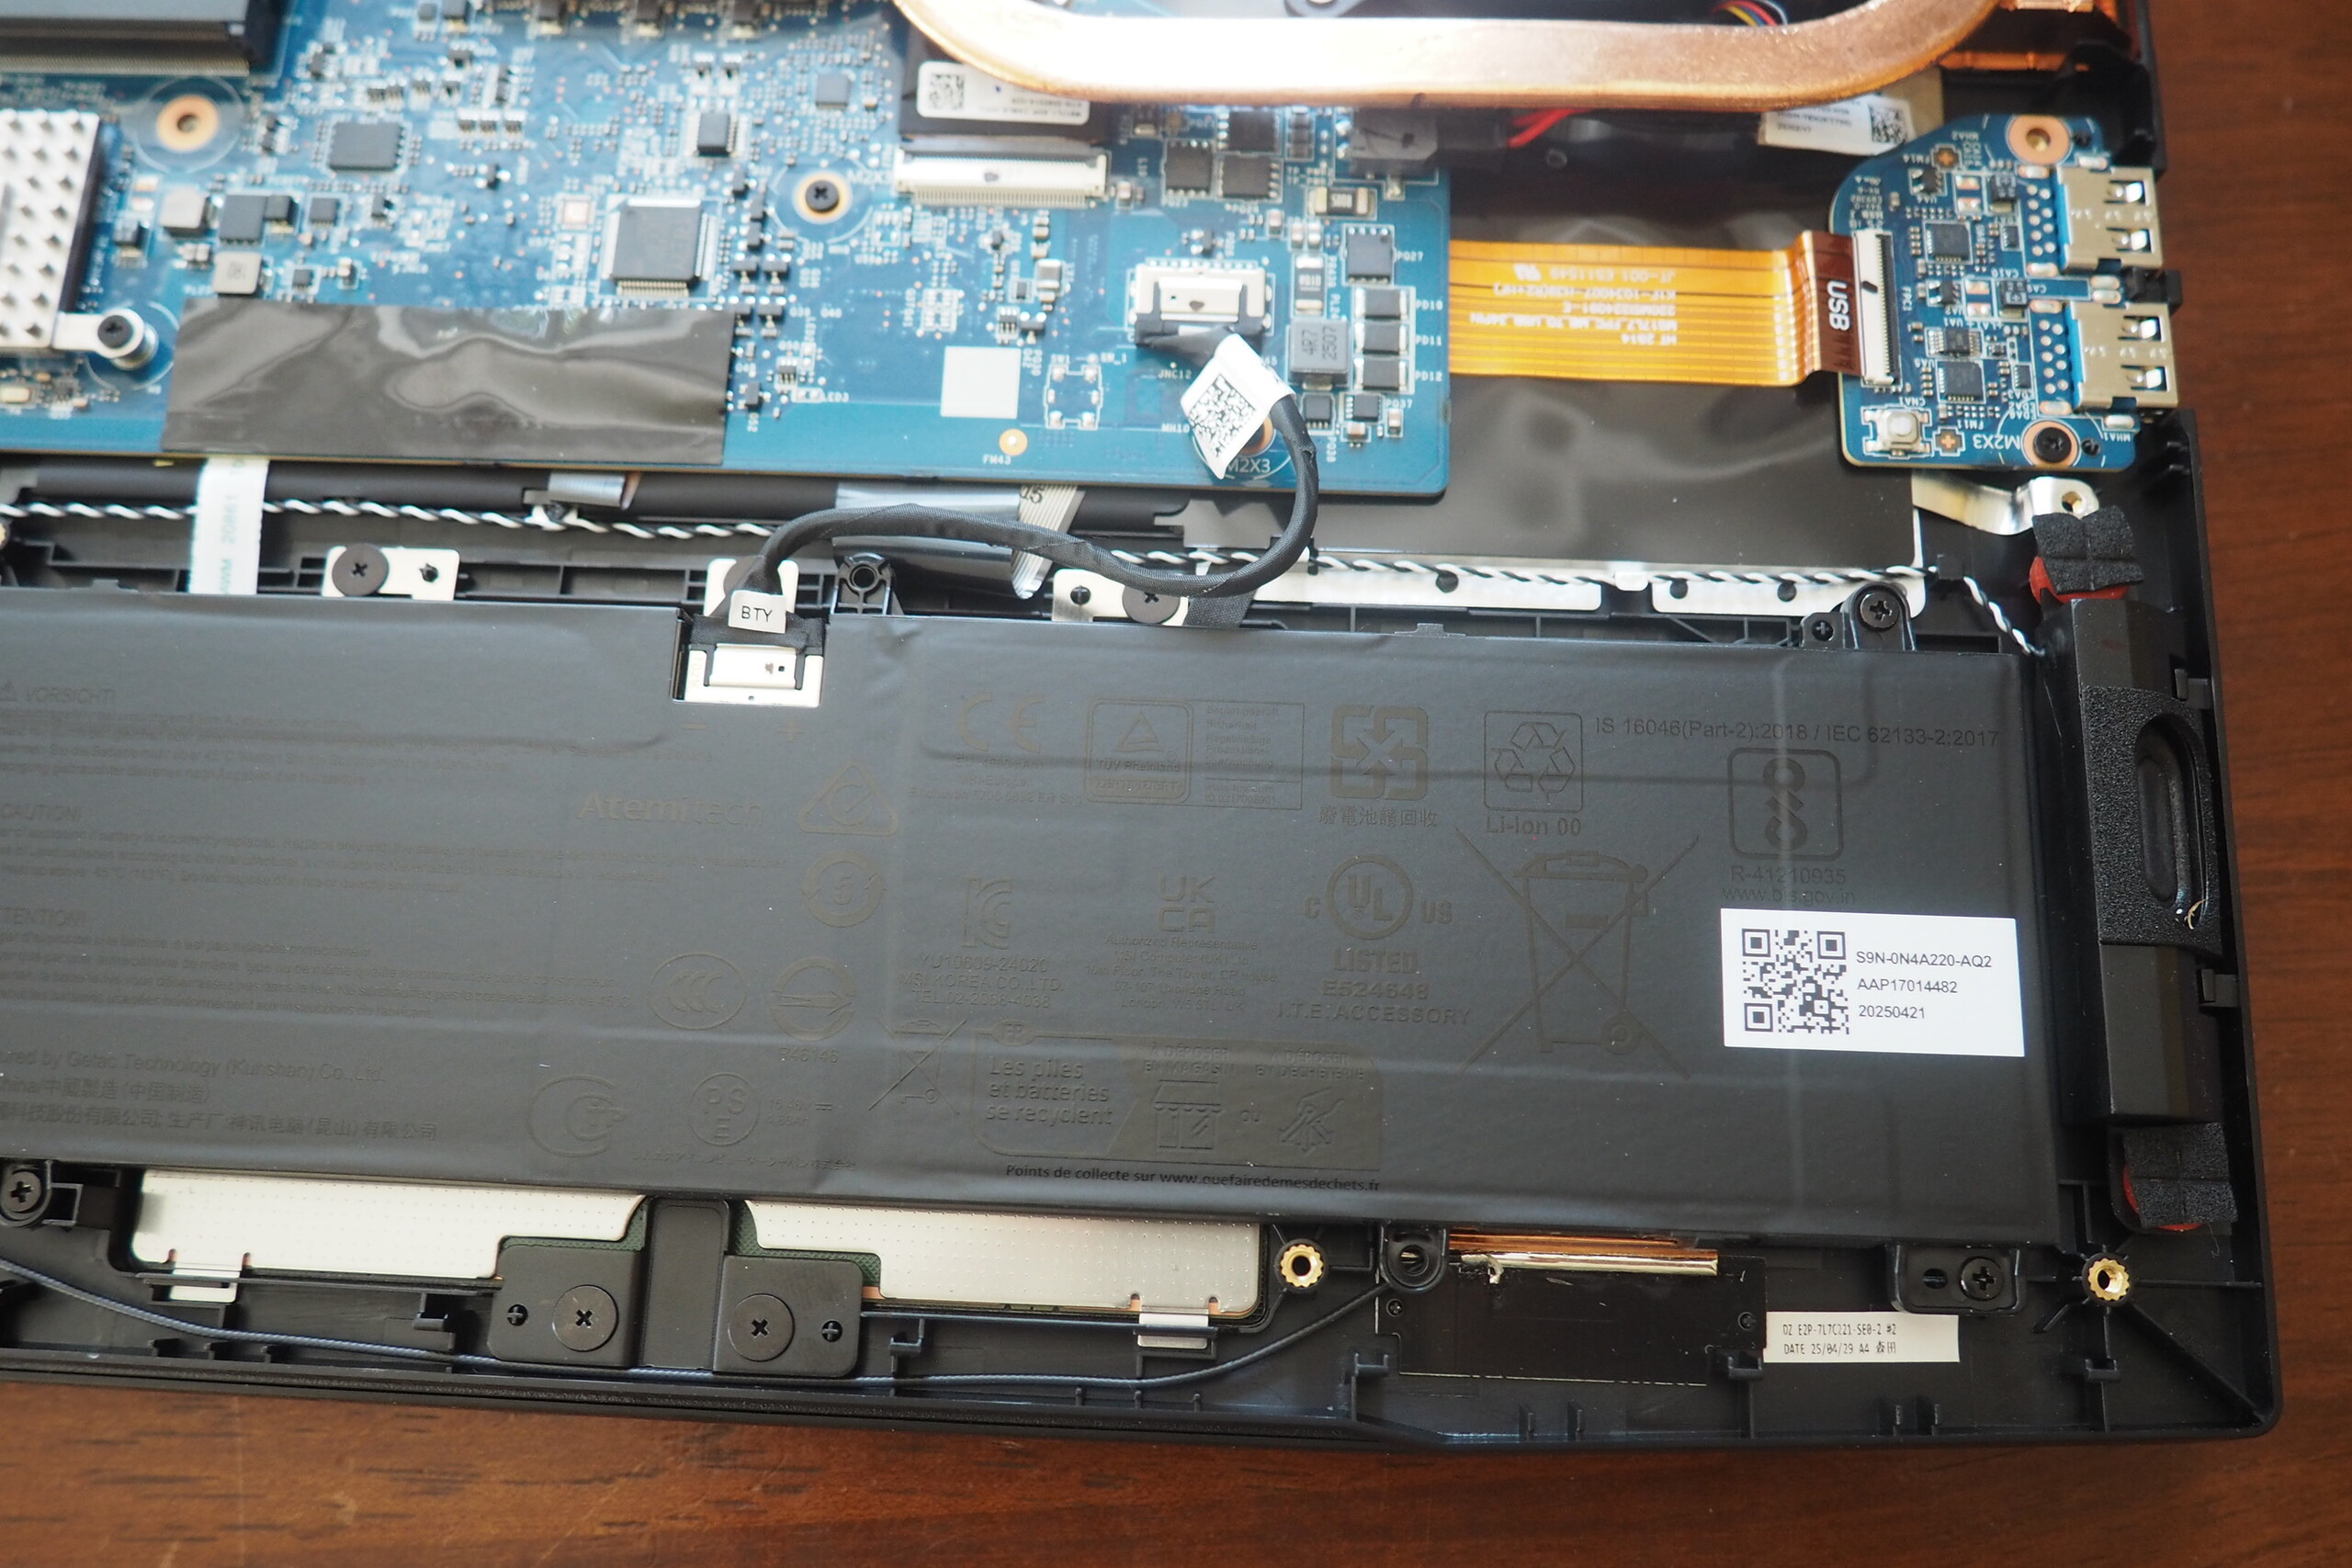
Comme nous l'avons mentionné au début, la qualité du boîtier est quelque peu décevante. MSI a renoncé au métal à l'extérieur et a opté pour du plastique sur une grande surface, qui a tendance à céder à certains endroits et semble plutôt bon marché au toucher. En revanche, l'angle d'ouverture généreux présente plusieurs avantages. Il peut s'ouvrir jusqu'à 180°, ce qui n'est pas habituel. Avec un poids de 2,7 kg, le modèle 17 pouces est légèrement plus lourd que ses concurrents 16 pouces (1,8 à 2,6 kg). Fondamentalement, le boîtier est très similaire à son prédécesseur (que nous avons testé dans le cadre de l'étude AMD et Intel), bien qu'il y ait quelques différences dans les détails.

Ports et connectivité
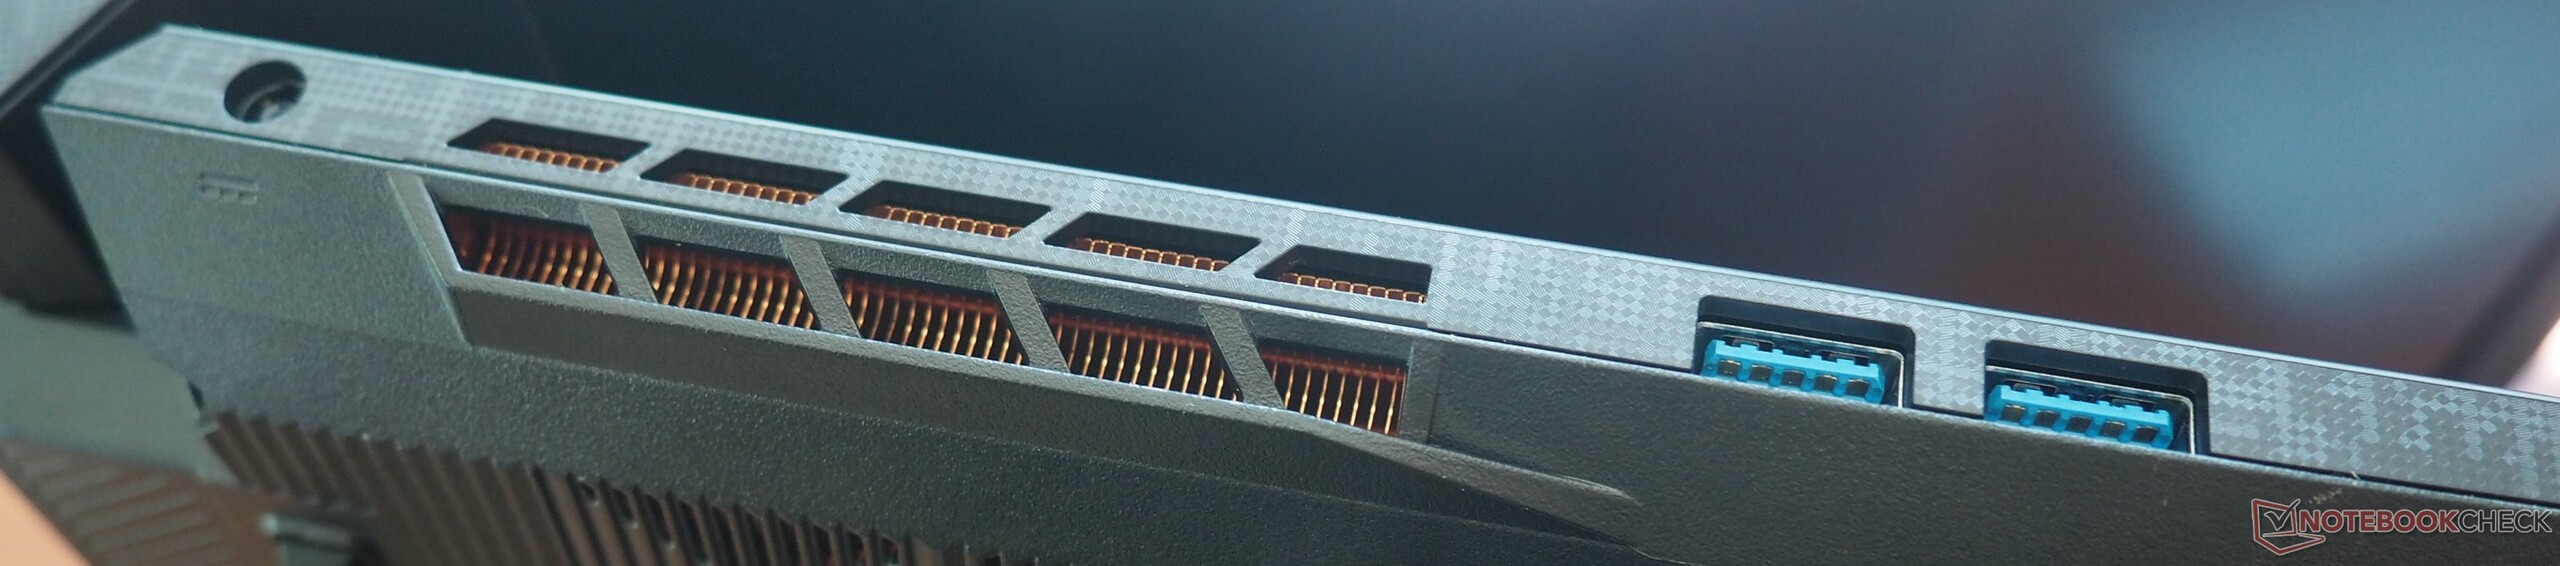
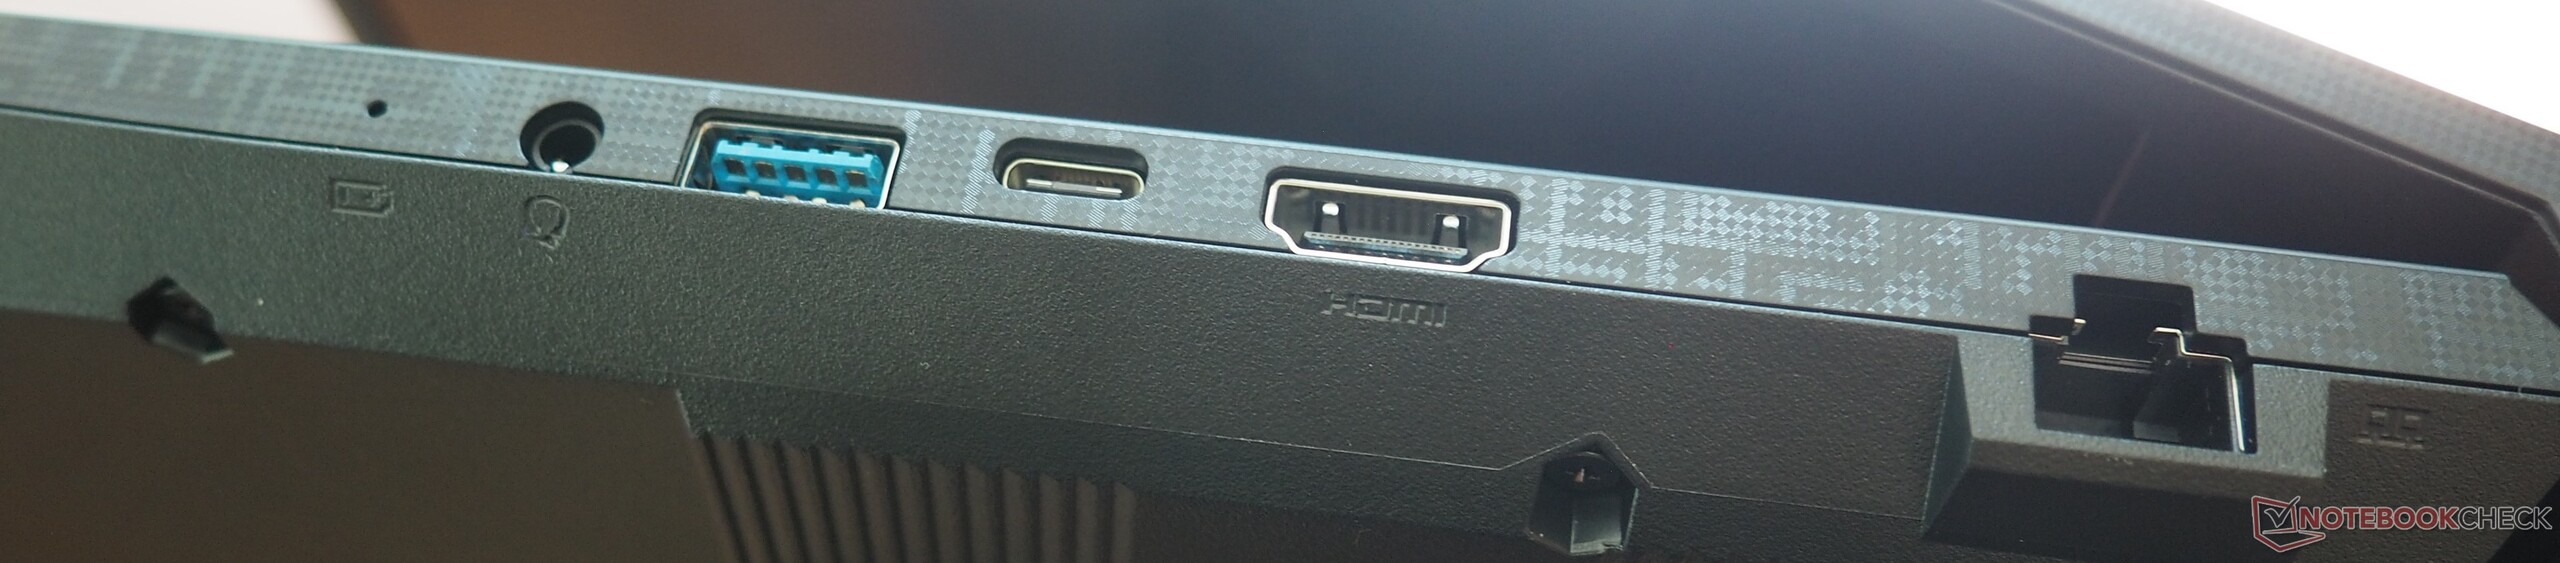
Le Katana 17 offre trois ports USB-A (3.0) et un port USB-C (3.1 Gen 2 avec DisplayPort) ainsi qu'une prise audio, un port Gigabit Ethernet et une sortie HDMI 2.1. La vitesse du module Wi-Fi intégré (Intel Wi-Fi 6E AX211) est décente à très bonne, selon le test. Toutefois, la webcam HD offre une image très floue.
Communication
Webcam


Maintenance
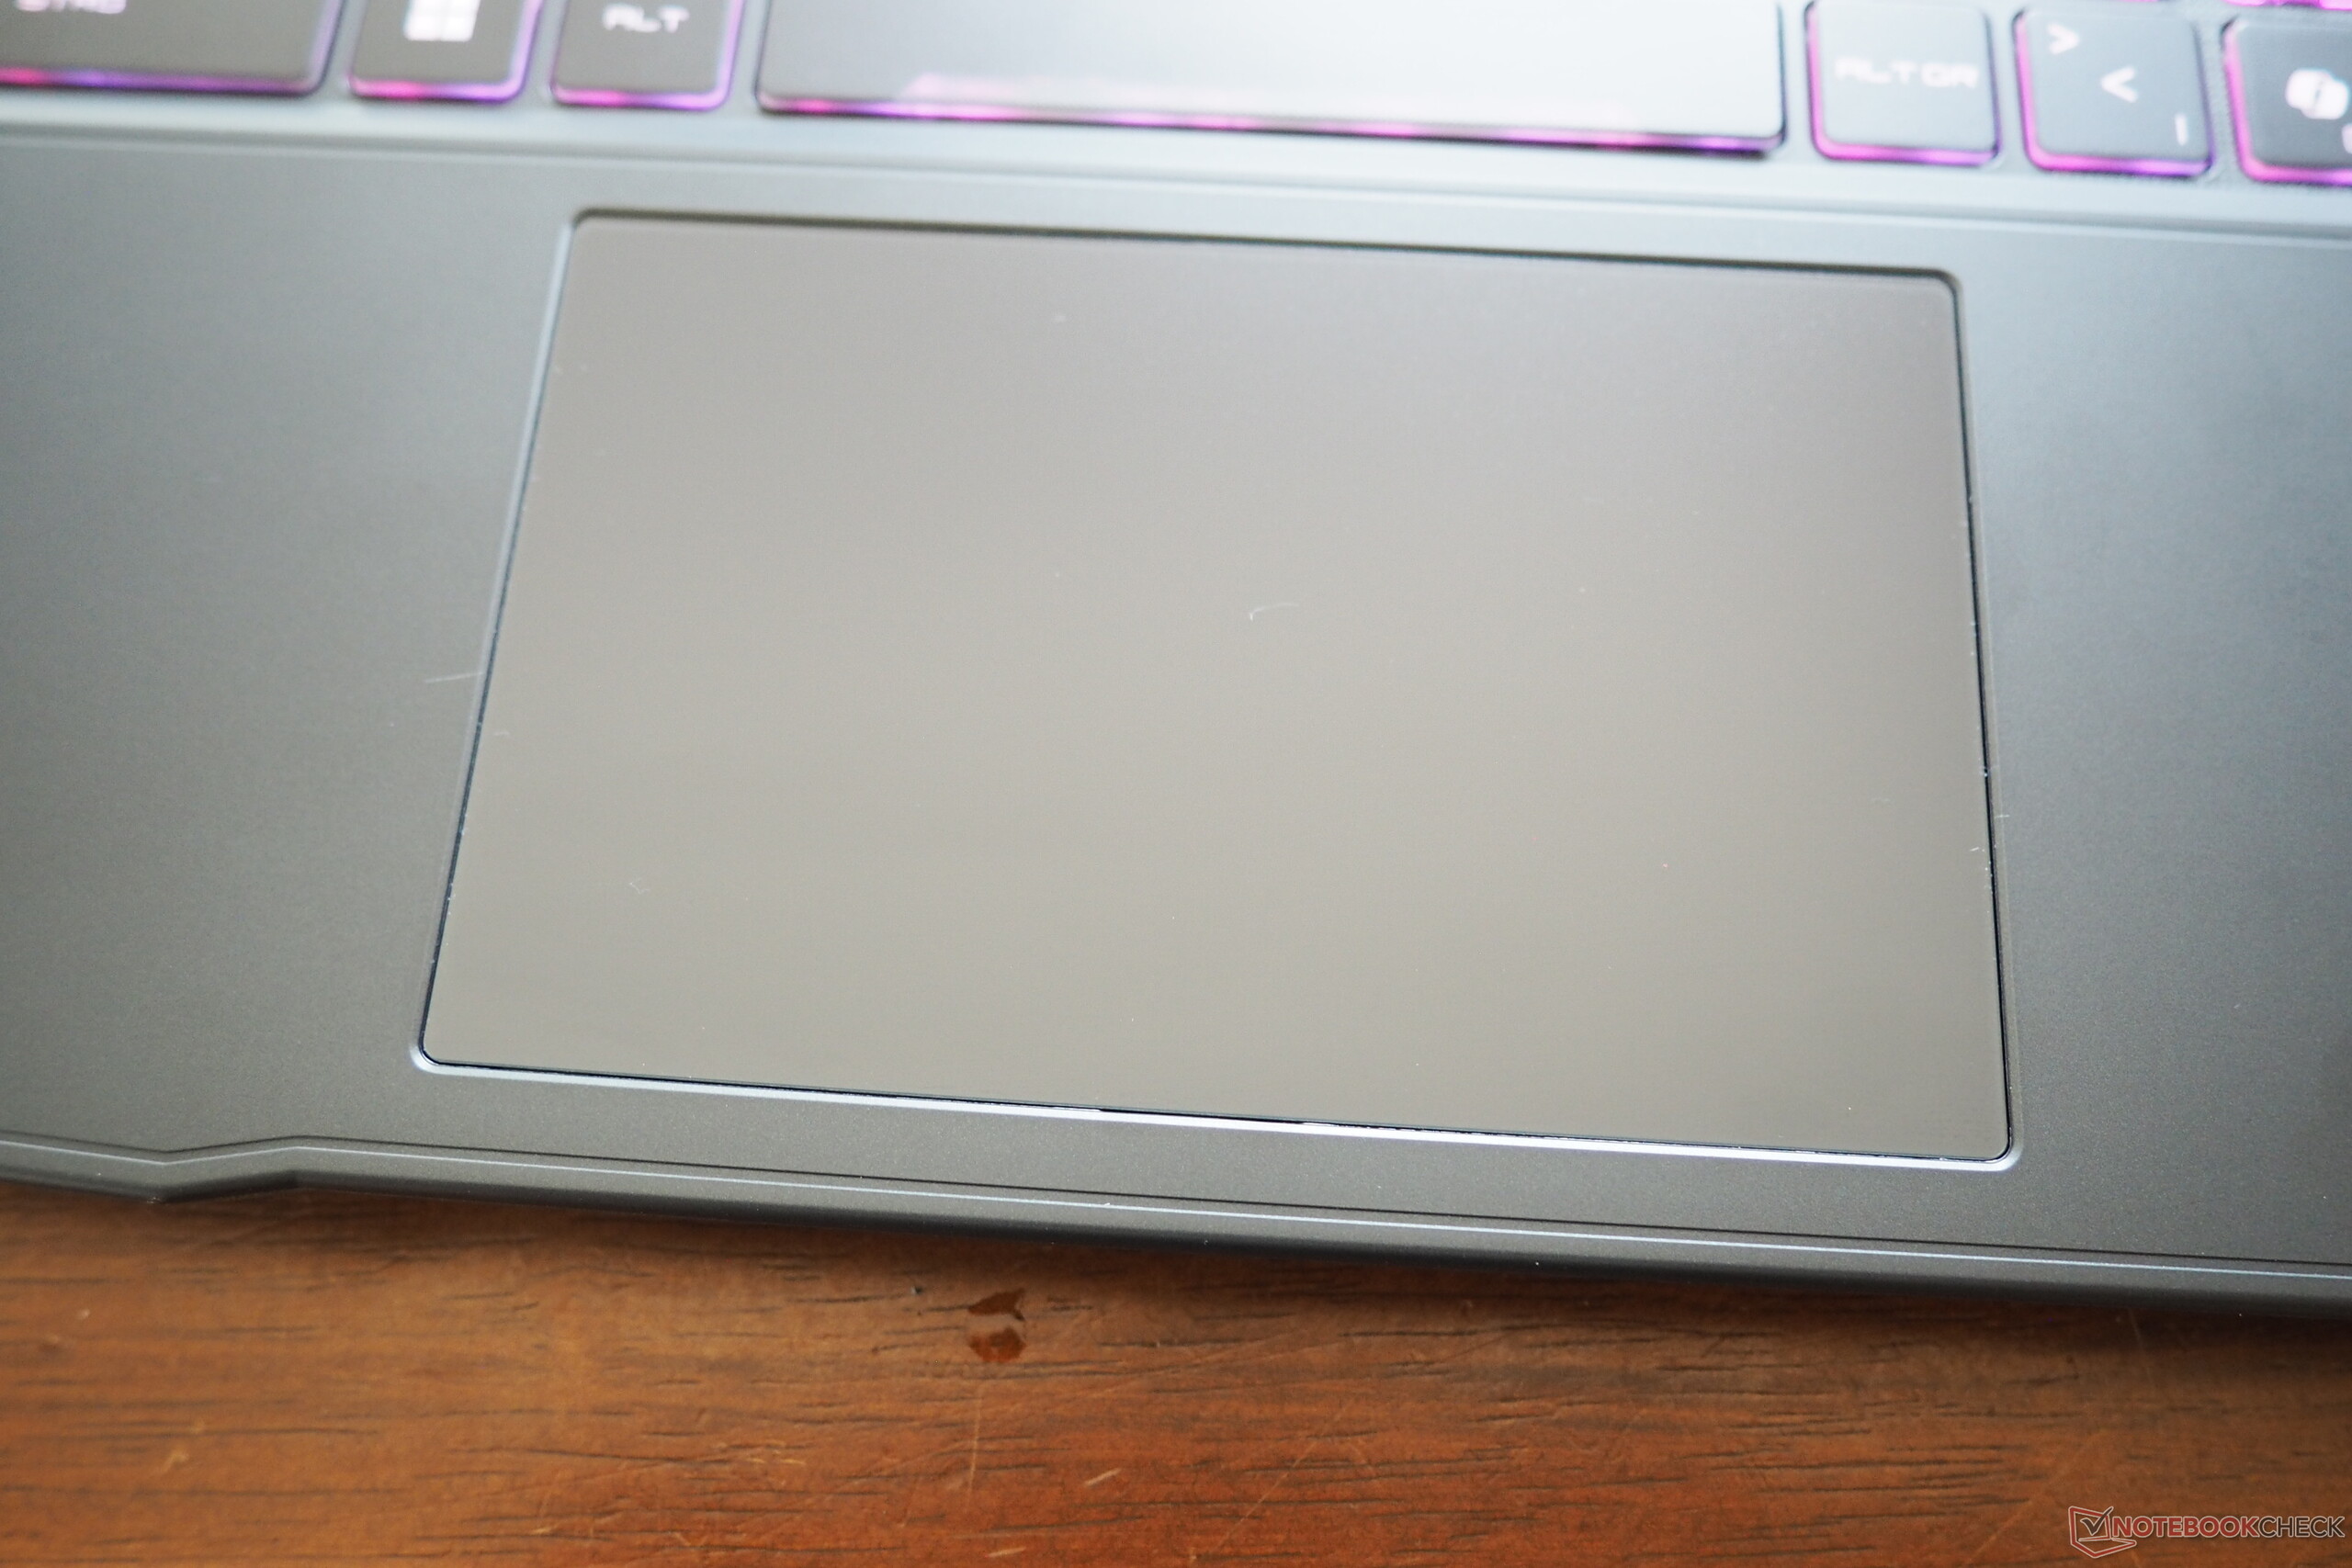
Dispositifs d'entrée
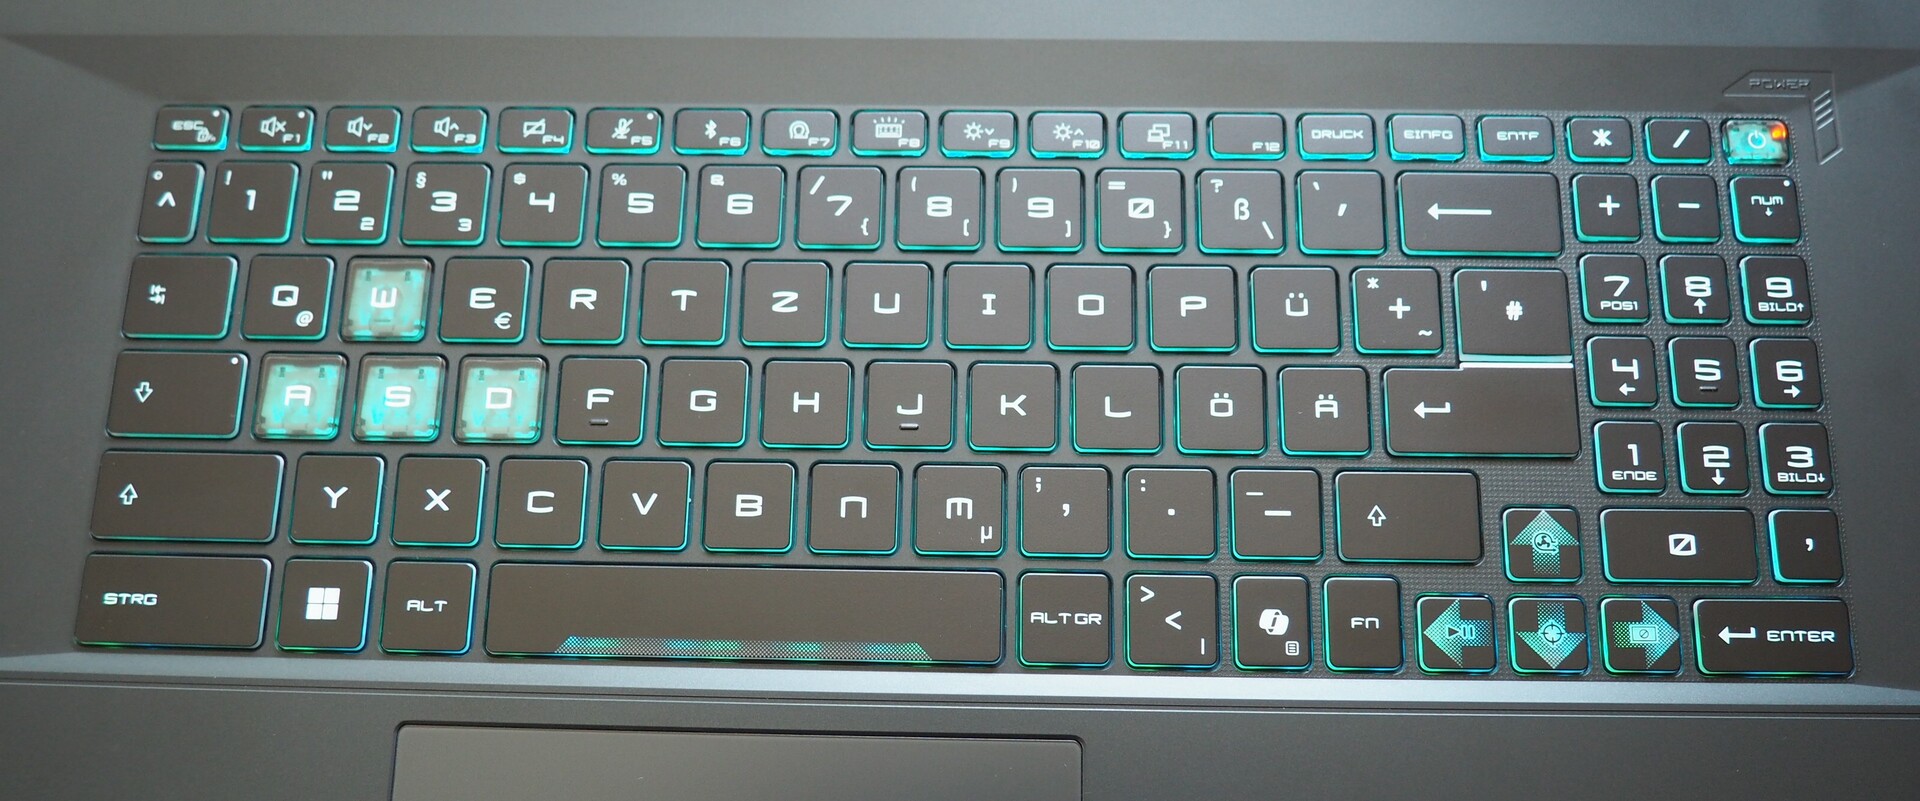
MSI continue de miser sur sa disposition de clavier non conventionnelle. Malgré l'espace disponible, le pavé numérique ne comporte que trois colonnes au lieu de quatre. En revanche, les joueurs peuvent se réjouir de l'éclairage RVB réglable. La sensation de frappe est décente, mais ne suscite pas l'enthousiasme. La souris de remplacement mesure 12 x 7,5 cm, ce qui est raisonnable, et pourrait être encore plus stable à notre goût (en particulier lorsque vous cliquez). Les caractéristiques de glisse et la précision sont acceptables.
Affichage
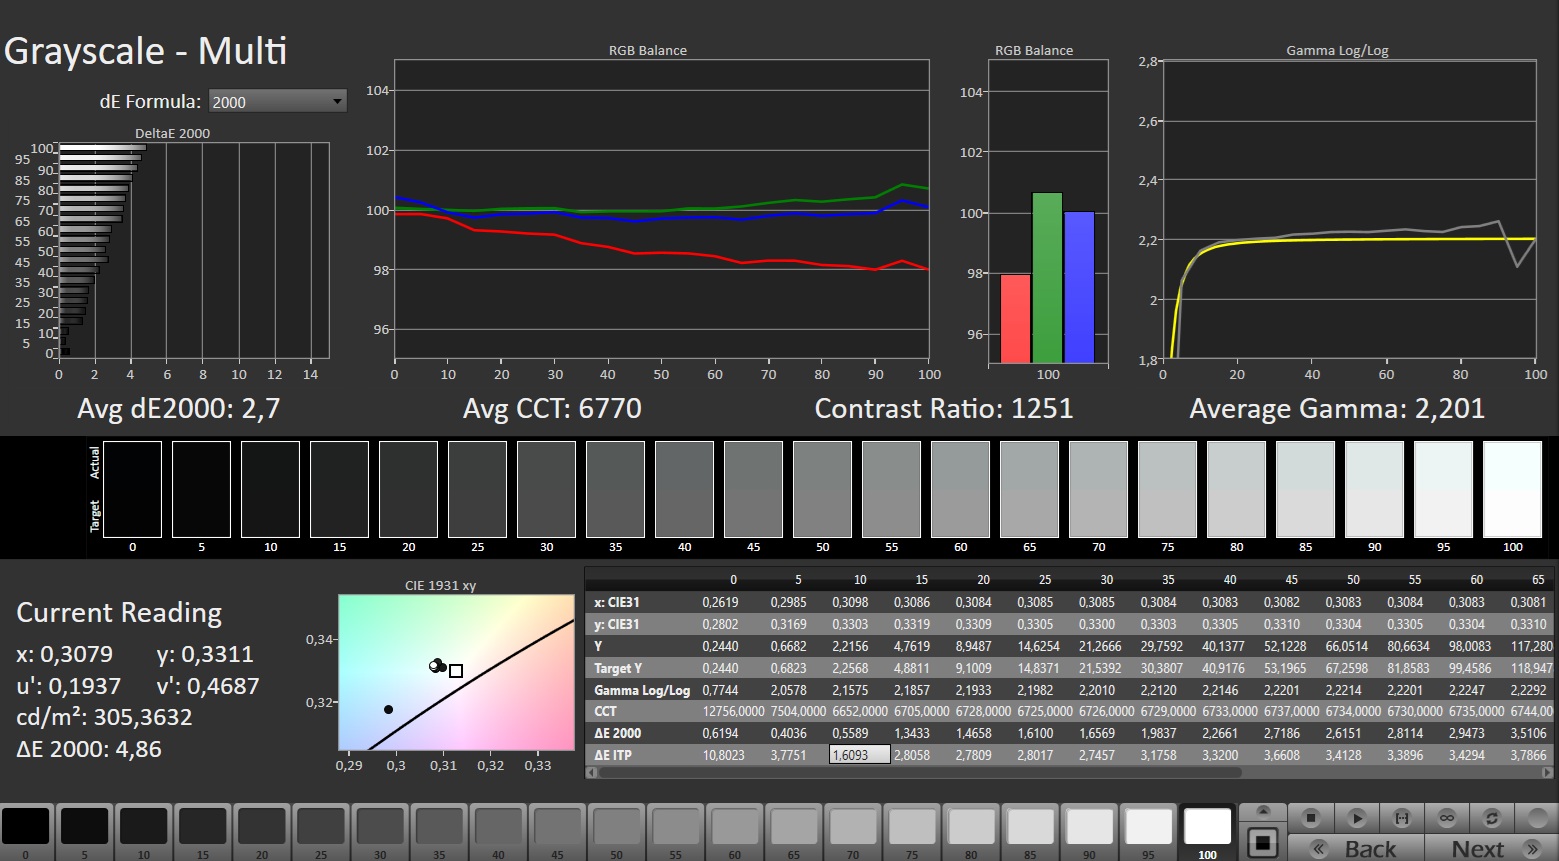
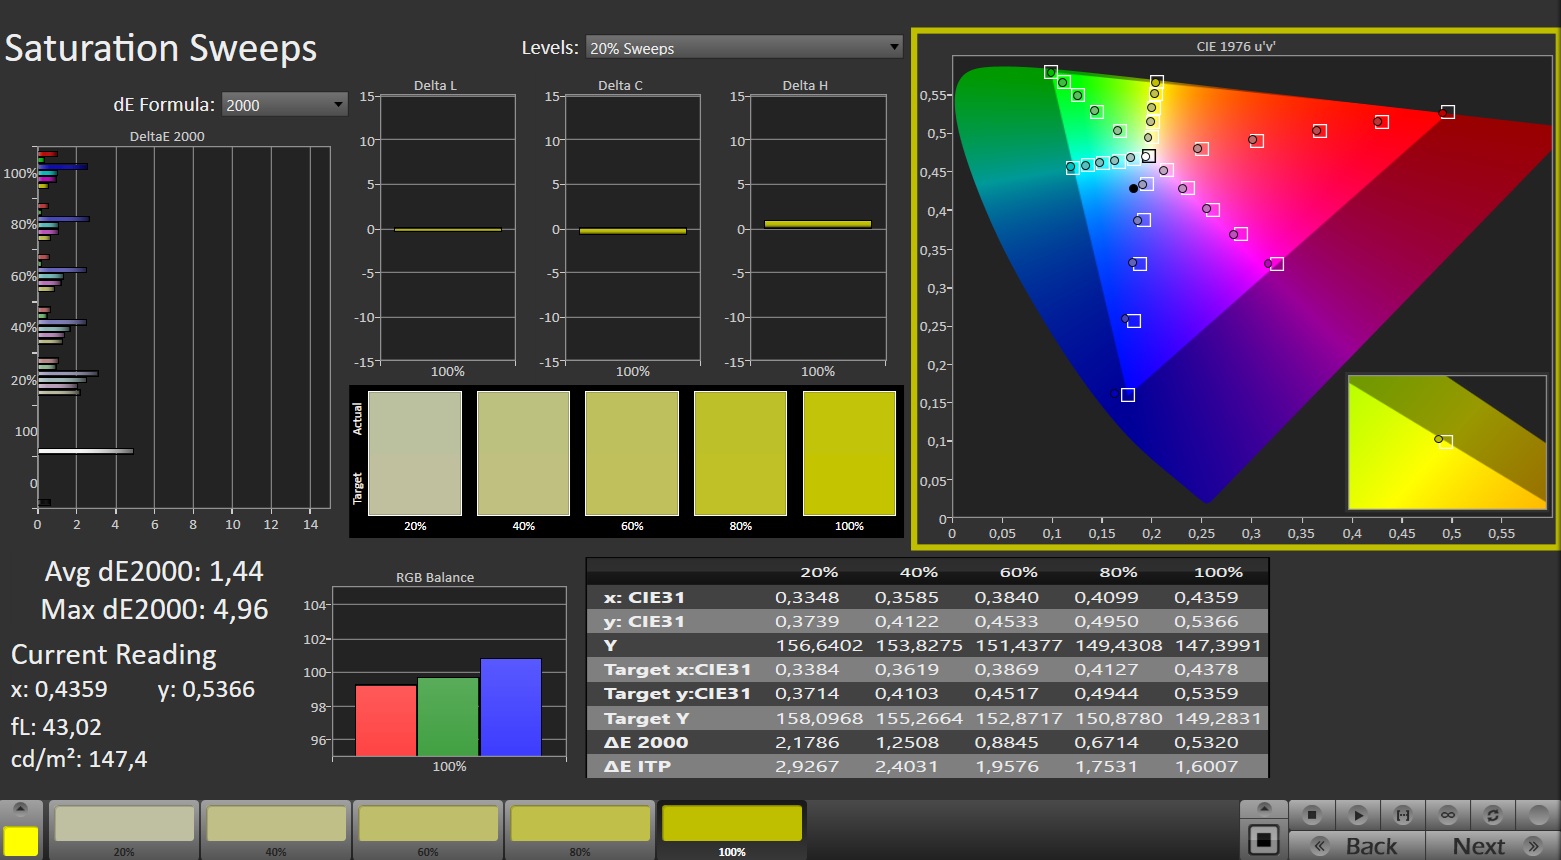
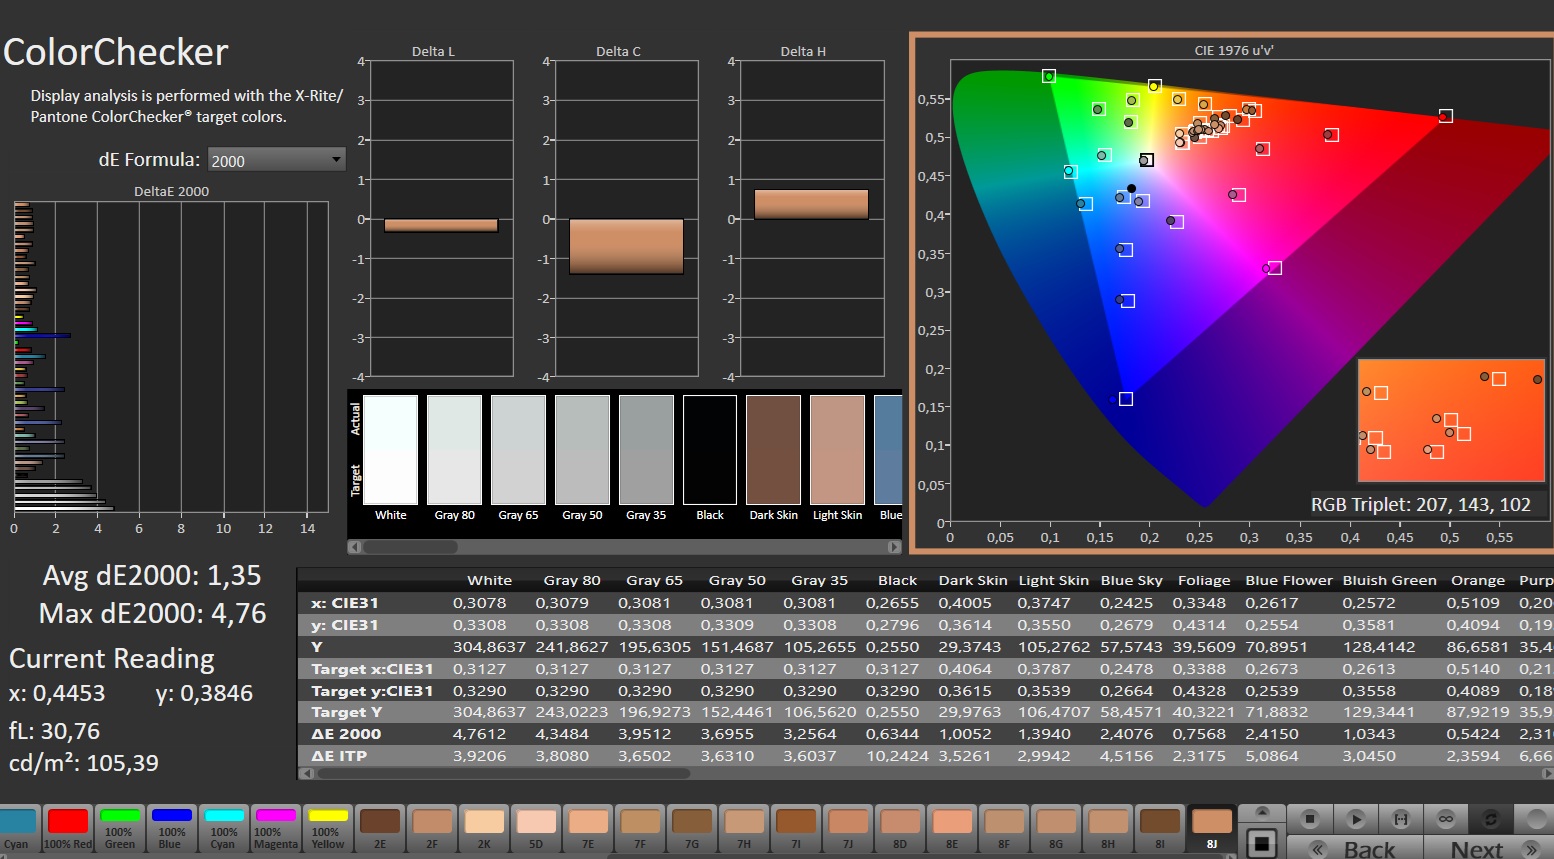
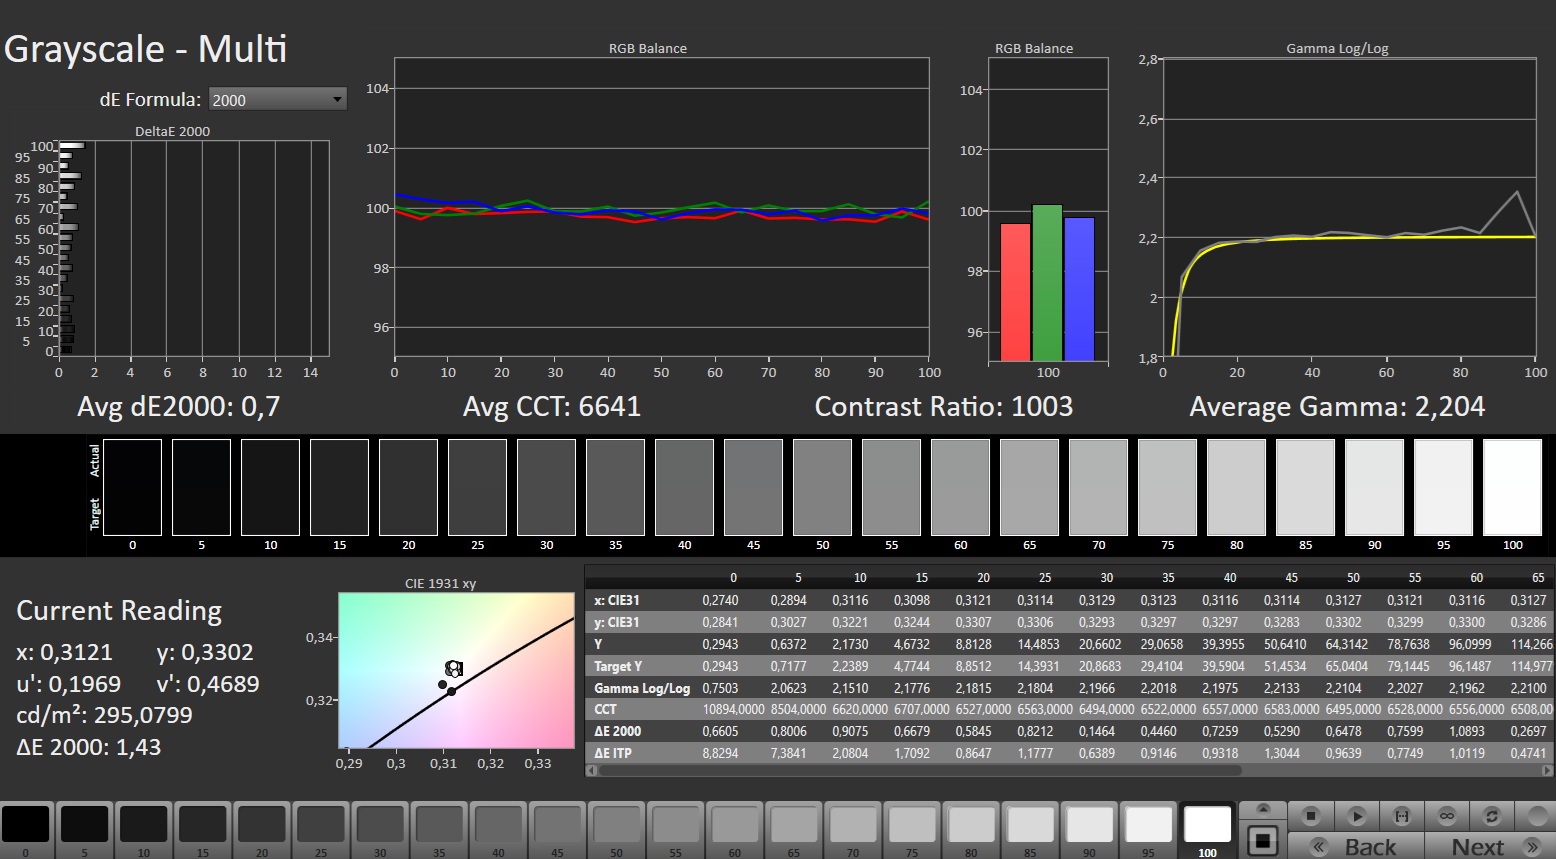
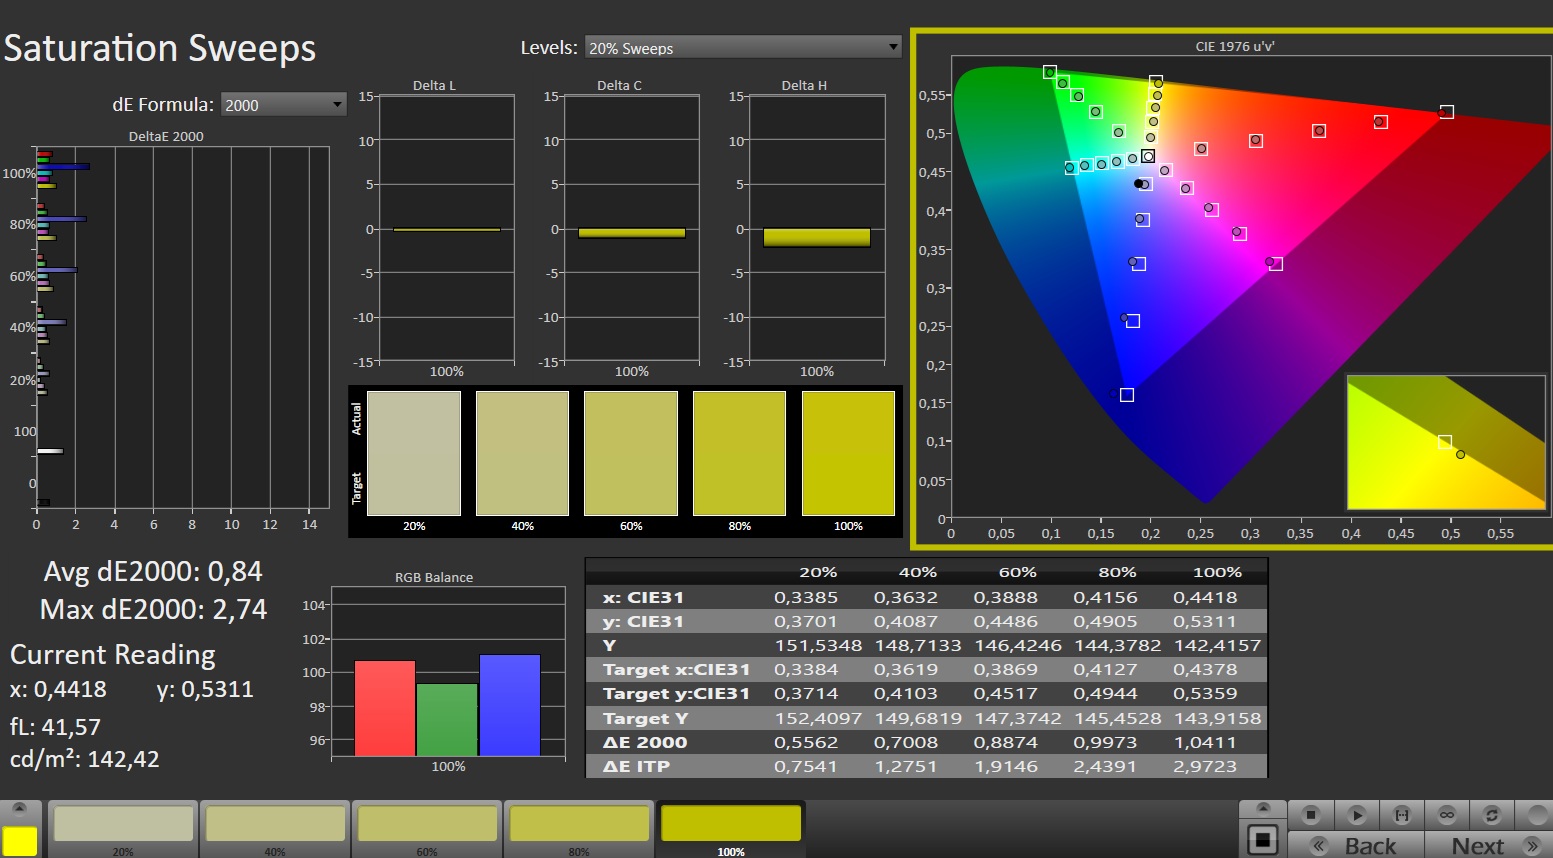
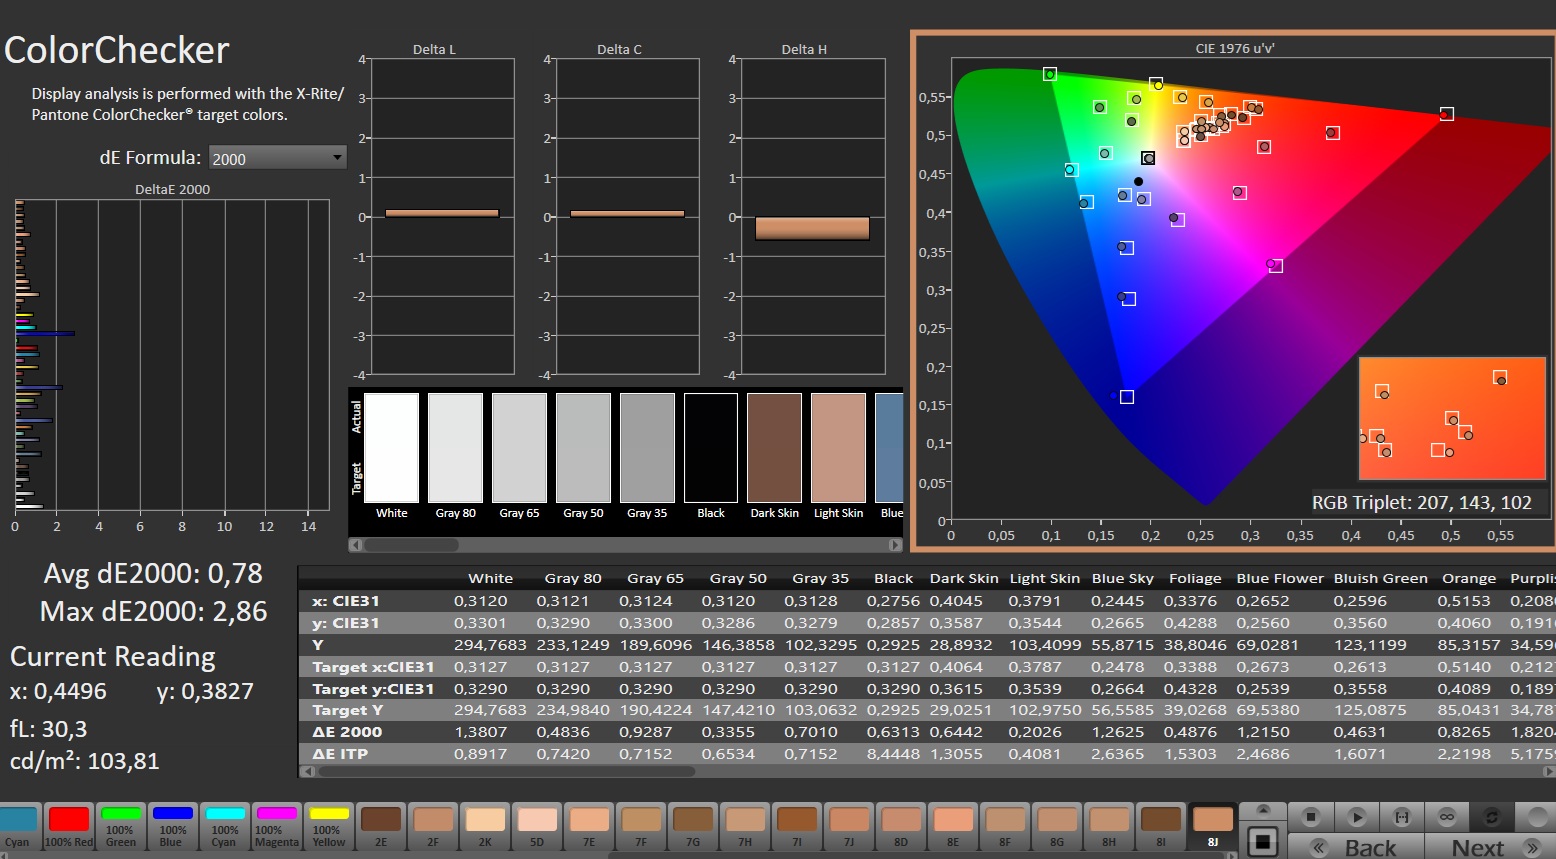
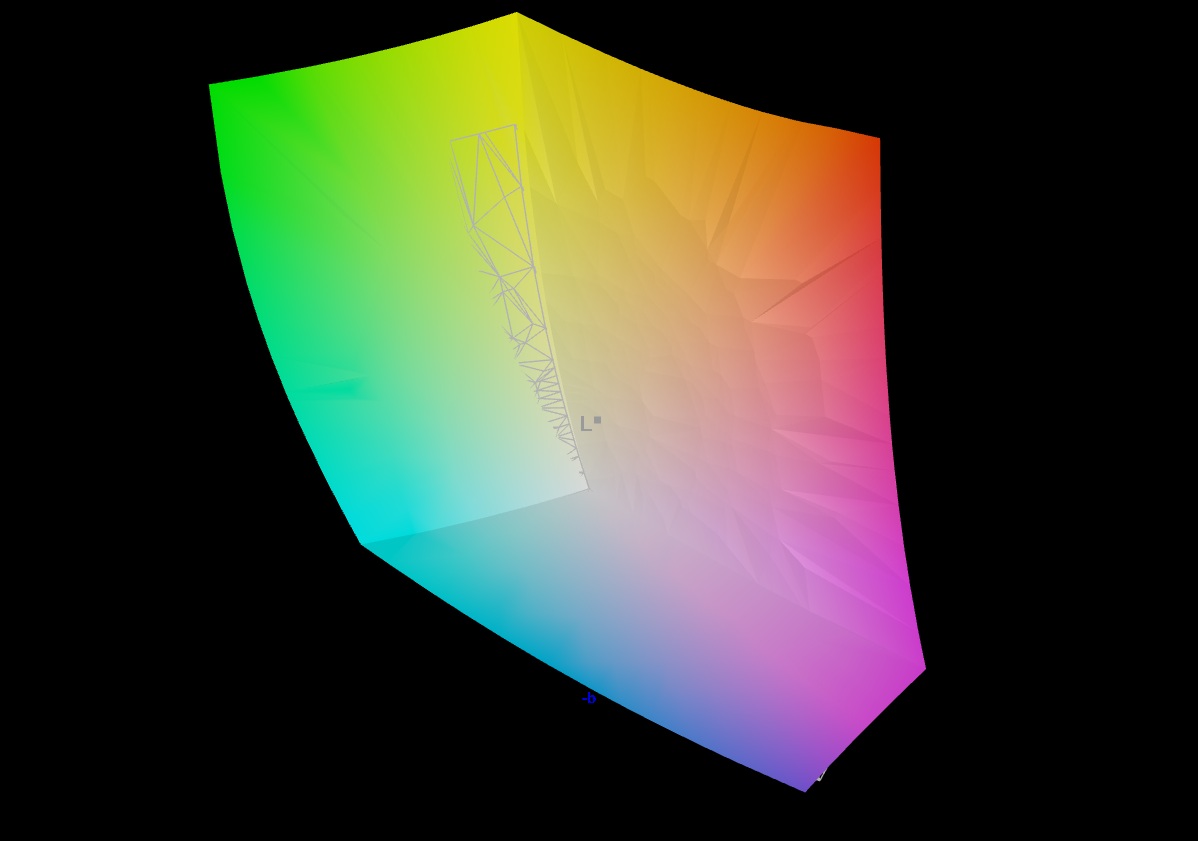
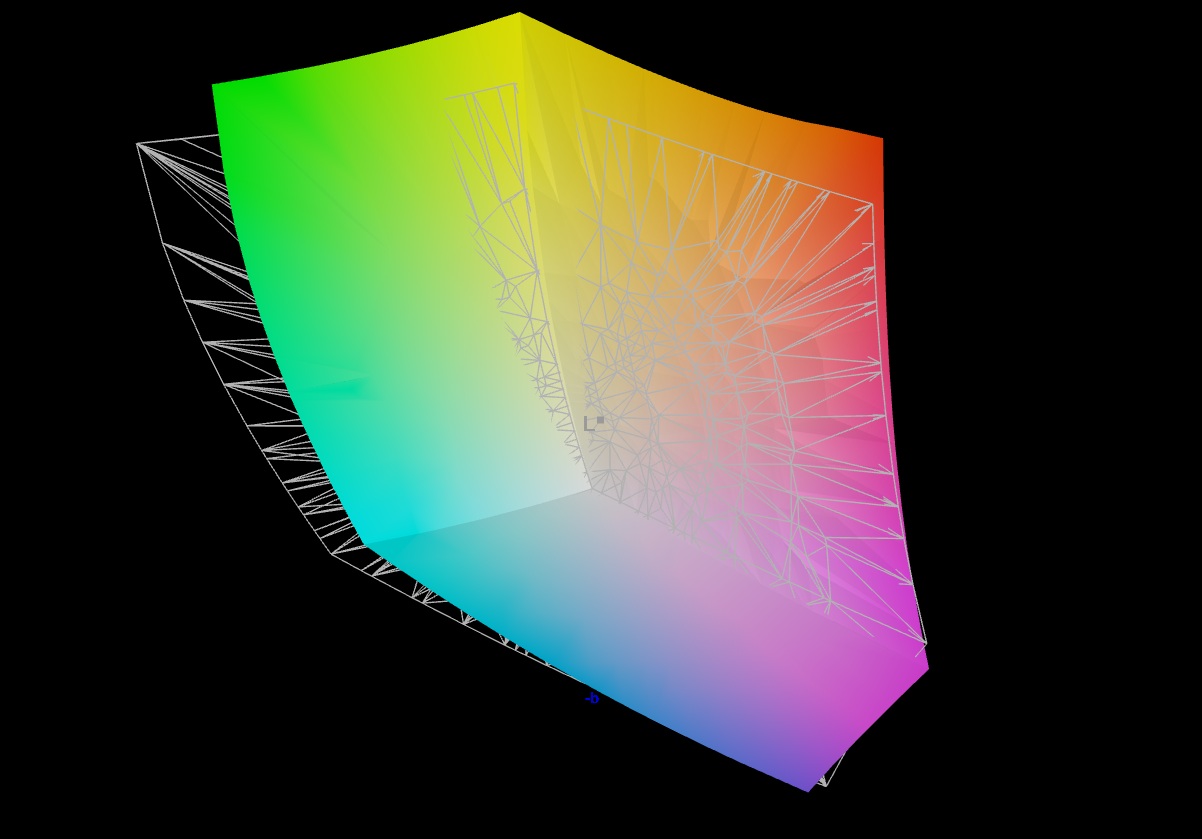
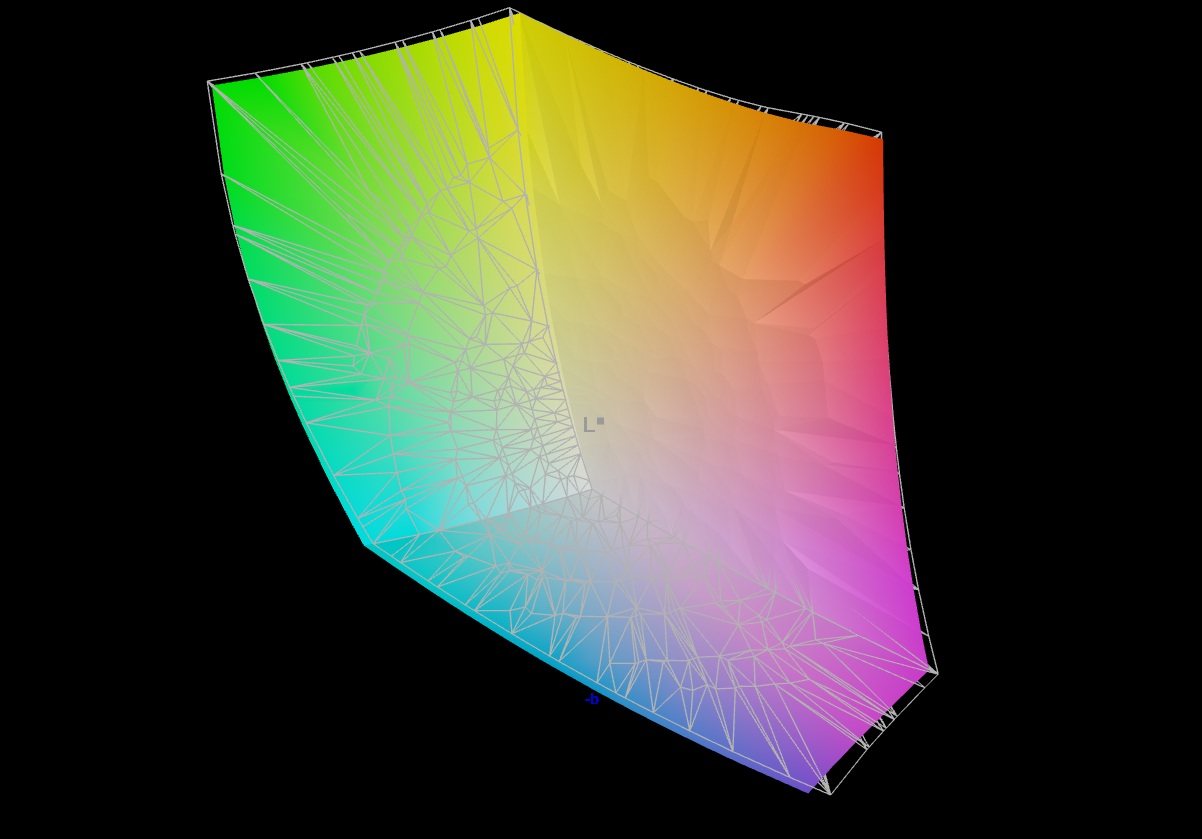
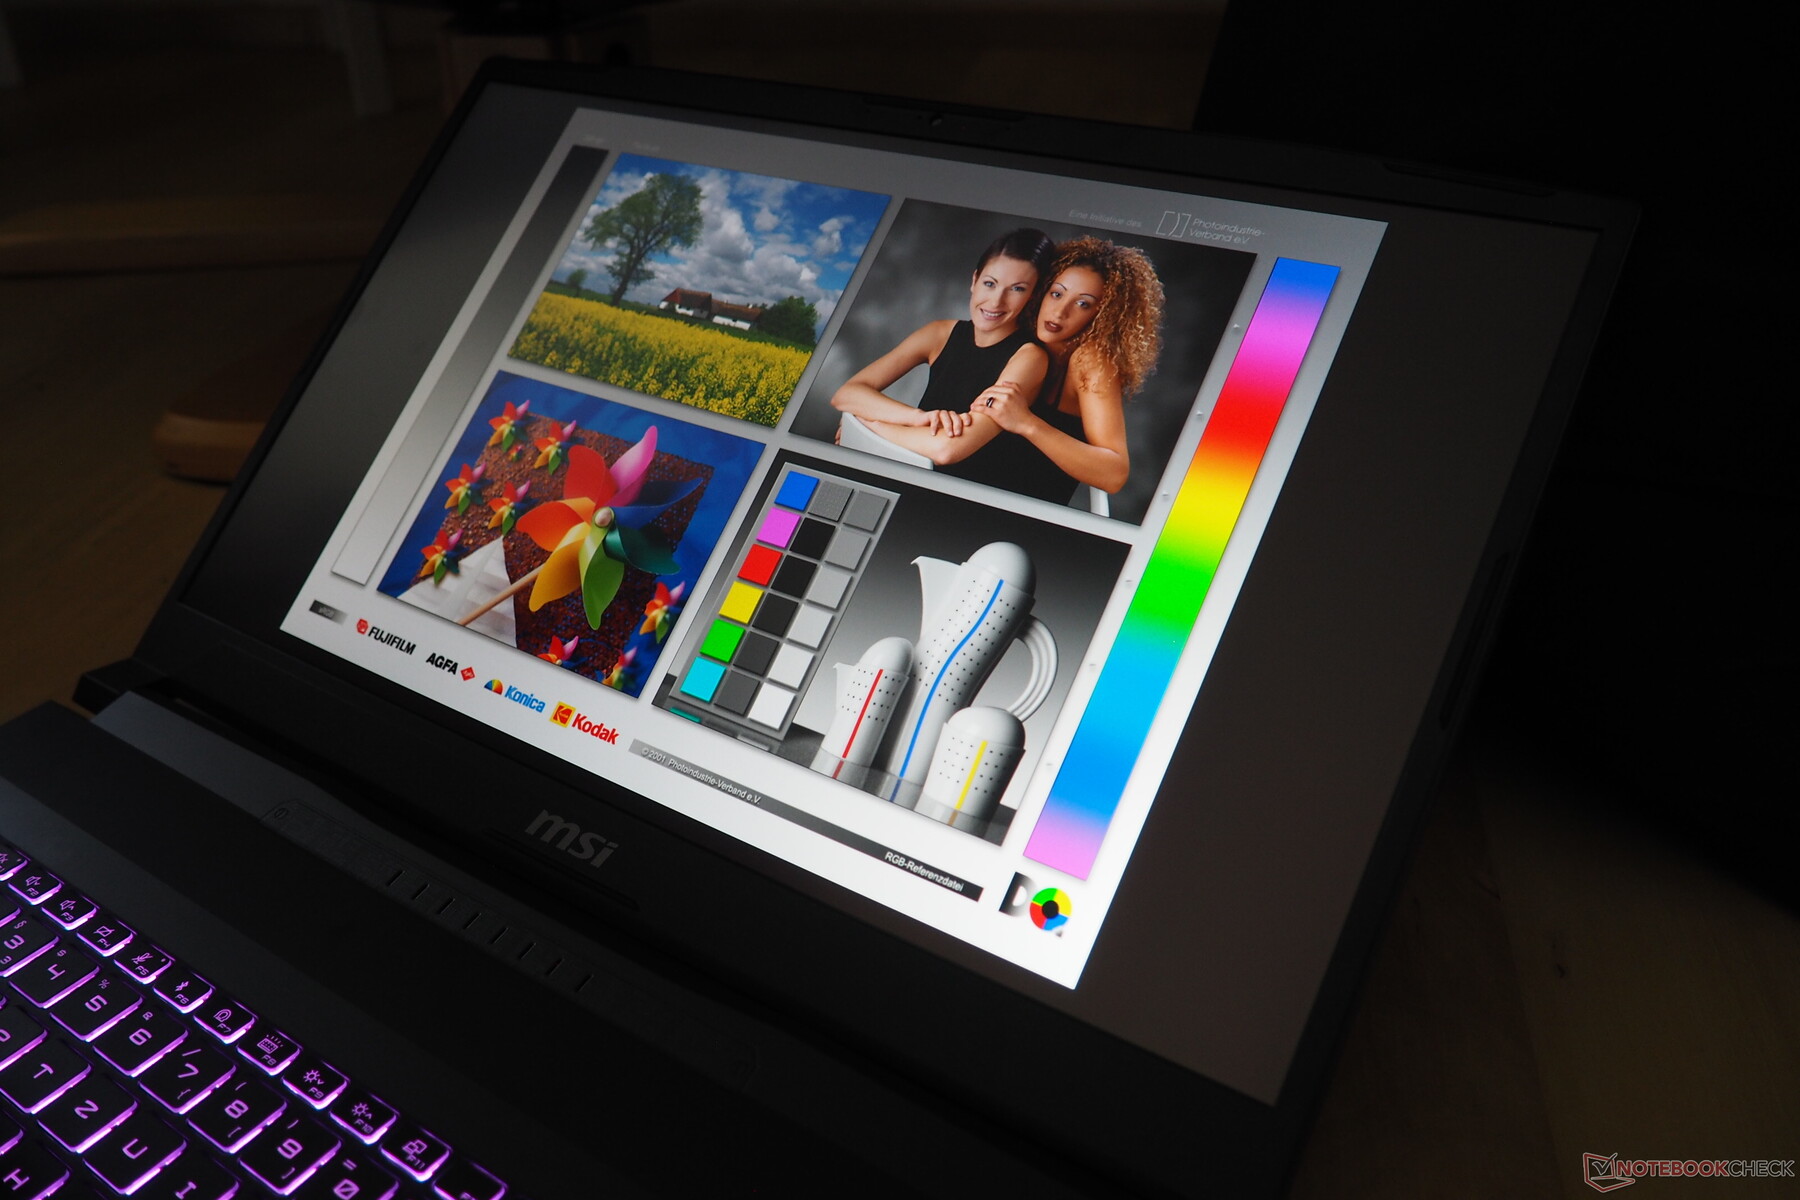
MSI a opté pour un écran IPS mat au format 16:9 d'une résolution de 2560 x 1440 pixels qui offre un bon taux de contraste de plus de 1000:1 grâce à une valeur de noir relativement basse (0,27 cd/m²). Cependant, cela se fait au détriment de la luminosité, avec une moyenne de 272 cd/m², ce qui le rend uniquement adapté à une utilisation en intérieur. La gamme de couleurs, en revanche, est étonnamment élevée, avec un peu moins de 100 % de sRGB ou DCI-P3. Les temps de réponse et la fidélité des couleurs ne sont pas non plus à plaindre.
| |||||||||||||||||||||||||
Homogénéité de la luminosité: 87 %
Valeur mesurée au centre, sur batterie: 296 cd/m²
Contraste: 1096:1 (Valeurs des noirs: 0.27 cd/m²)
ΔE ColorChecker Calman: 1.35 | ∀{0.5-29.43 Ø4.73}
calibrated: 0.78
ΔE Greyscale Calman: 2.7 | ∀{0.09-98 Ø4.97}
89% AdobeRGB 1998 (Argyll 3D)
99.6% sRGB (Argyll 3D)
97.3% Display P3 (Argyll 3D)
Gamma: 2.201
CCT: 6770 K
| MSI Katana 17 HX B14WGK CSOT MNH301CA3-1, IPS, 2560x1440, 17.3", 240 Hz | Gigabyte Aero X16 1WH MNG007DA5-1, IPS, 2560x1600, 16", 165 Hz | Asus ProArt P16 H7606WP ATNA60CL10-0, OLED, 2880x1800, 16", 120 Hz | Schenker XMG Pro 16 (E25) NE160QDM-NZL, IPS, 2560x1600, 16", 300 Hz | MSI Vector 16 HX AI A2XWHG B160QAN02.3 (AUO7DB2), IPS, 2560x1600, 16", 240 Hz | |
|---|---|---|---|---|---|
| Display | -18% | 1% | -13% | -2% | |
| Display P3 Coverage (%) | 97.3 | 68.7 -29% | 99.5 2% | 74.7 -23% | 96.6 -1% |
| sRGB Coverage (%) | 99.6 | 96.1 -4% | 100 0% | 99.8 0% | 99.8 0% |
| AdobeRGB 1998 Coverage (%) | 89 | 71.2 -20% | 89.5 1% | 75.4 -15% | 84.4 -5% |
| Response Times | -46% | 91% | -31% | 26% | |
| Response Time Grey 50% / Grey 80% * (ms) | 5.2 ? | 12 ? -131% | 0.63 ? 88% | 10.5 ? -102% | 4.3 ? 17% |
| Response Time Black / White * (ms) | 9.2 ? | 5.6 ? 39% | 0.63 ? 93% | 5.4 ? 41% | 6 ? 35% |
| PWM Frequency (Hz) | 480 ? | ||||
| PWM Amplitude * (%) | 26 | ||||
| Screen | 9% | 37% | 9% | -26% | |
| Brightness middle (cd/m²) | 296 | 395 33% | 362 22% | 538 82% | 473 60% |
| Brightness (cd/m²) | 272 | 398 46% | 363 33% | 508 87% | 426 57% |
| Brightness Distribution (%) | 87 | 97 11% | 99 14% | 88 1% | 85 -2% |
| Black Level * (cd/m²) | 0.27 | 0.32 -19% | 0.47 -74% | 0.42 -56% | |
| Contrast (:1) | 1096 | 1234 13% | 1145 4% | 1126 3% | |
| Colorchecker dE 2000 * | 1.35 | 1.3 4% | 0.8 41% | 1.9 -41% | 3.47 -157% |
| Colorchecker dE 2000 max. * | 4.76 | 2.8 41% | 1.8 62% | 4 16% | 7.24 -52% |
| Colorchecker dE 2000 calibrated * | 0.78 | 1.4 -79% | 1.36 -74% | ||
| Greyscale dE 2000 * | 2.7 | 1.8 33% | 1.3 52% | 2.7 -0% | 3.1 -15% |
| Gamma | 2.201 100% | 2.2 100% | 2.2 100% | 2.24 98% | 2.486 88% |
| CCT | 6770 96% | 6842 95% | 6741 96% | 7027 93% | 6832 95% |
| Moyenne finale (programmes/paramètres) | -18% /
-4% | 43% /
37% | -12% /
-2% | -1% /
-14% |
* ... Moindre est la valeur, meilleures sont les performances
Temps de réponse de l'écran
| ↔ Temps de réponse noir à blanc | ||
|---|---|---|
| 9.2 ms ... hausse ↗ et chute ↘ combinées | ↗ 5.2 ms hausse | 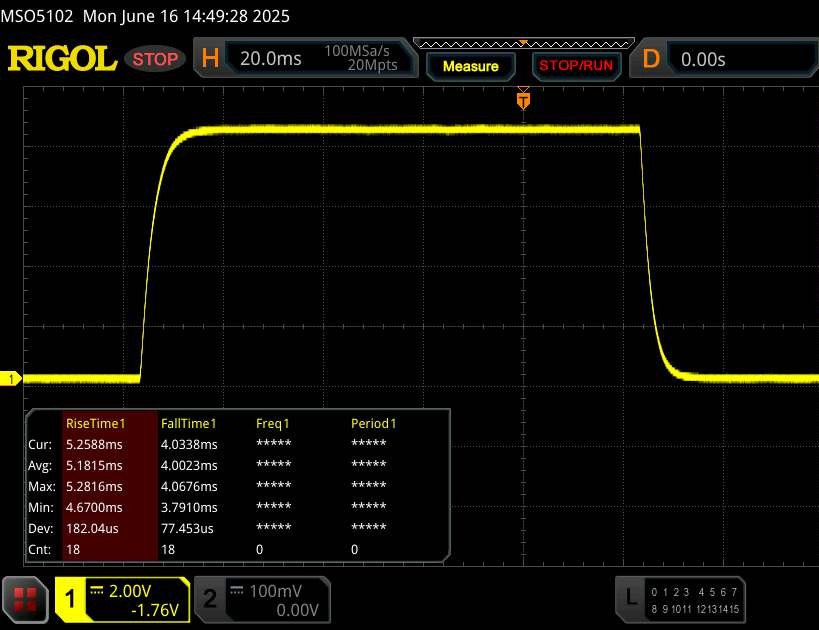 |
| ↘ 4 ms chute | ||
| L'écran montre de faibles temps de réponse, un bon écran pour jouer. En comparaison, tous les appareils testés affichent entre 0.1 (minimum) et 240 (maximum) ms. » 25 % des appareils testés affichent de meilleures performances. Cela signifie que les latences relevées sont meilleures que la moyenne (19.9 ms) de tous les appareils testés. | ||
| ↔ Temps de réponse gris 50% à gris 80% | ||
| 5.2 ms ... hausse ↗ et chute ↘ combinées | ↗ 2.4 ms hausse | 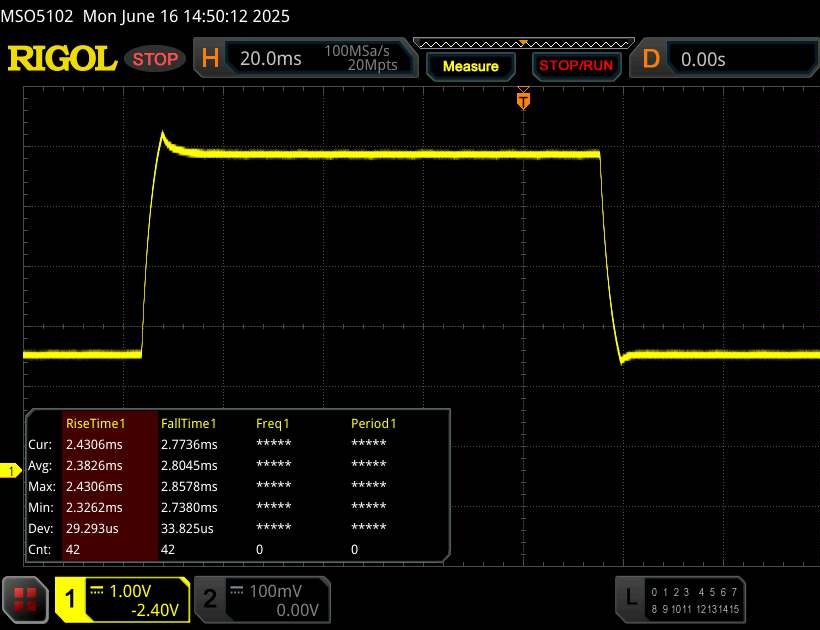 |
| ↘ 2.8 ms chute | ||
| L'écran montre de très faibles temps de réponse, parfait pour le jeu. En comparaison, tous les appareils testés affichent entre 0.165 (minimum) et 636 (maximum) ms. » 17 % des appareils testés affichent de meilleures performances. Cela signifie que les latences relevées sont meilleures que la moyenne (31.1 ms) de tous les appareils testés. | ||
Scintillement / MLI (Modulation de largeur d'impulsion)
| Scintillement / MLI (Modulation de largeur d'impulsion) non décelé |  | ||
En comparaison, 52 % des appareils testés n'emploient pas MDI pour assombrir leur écran. Nous avons relevé une moyenne à 7798 (minimum : 5 - maximum : 343500) Hz dans le cas où une MDI était active. | |||
Performance
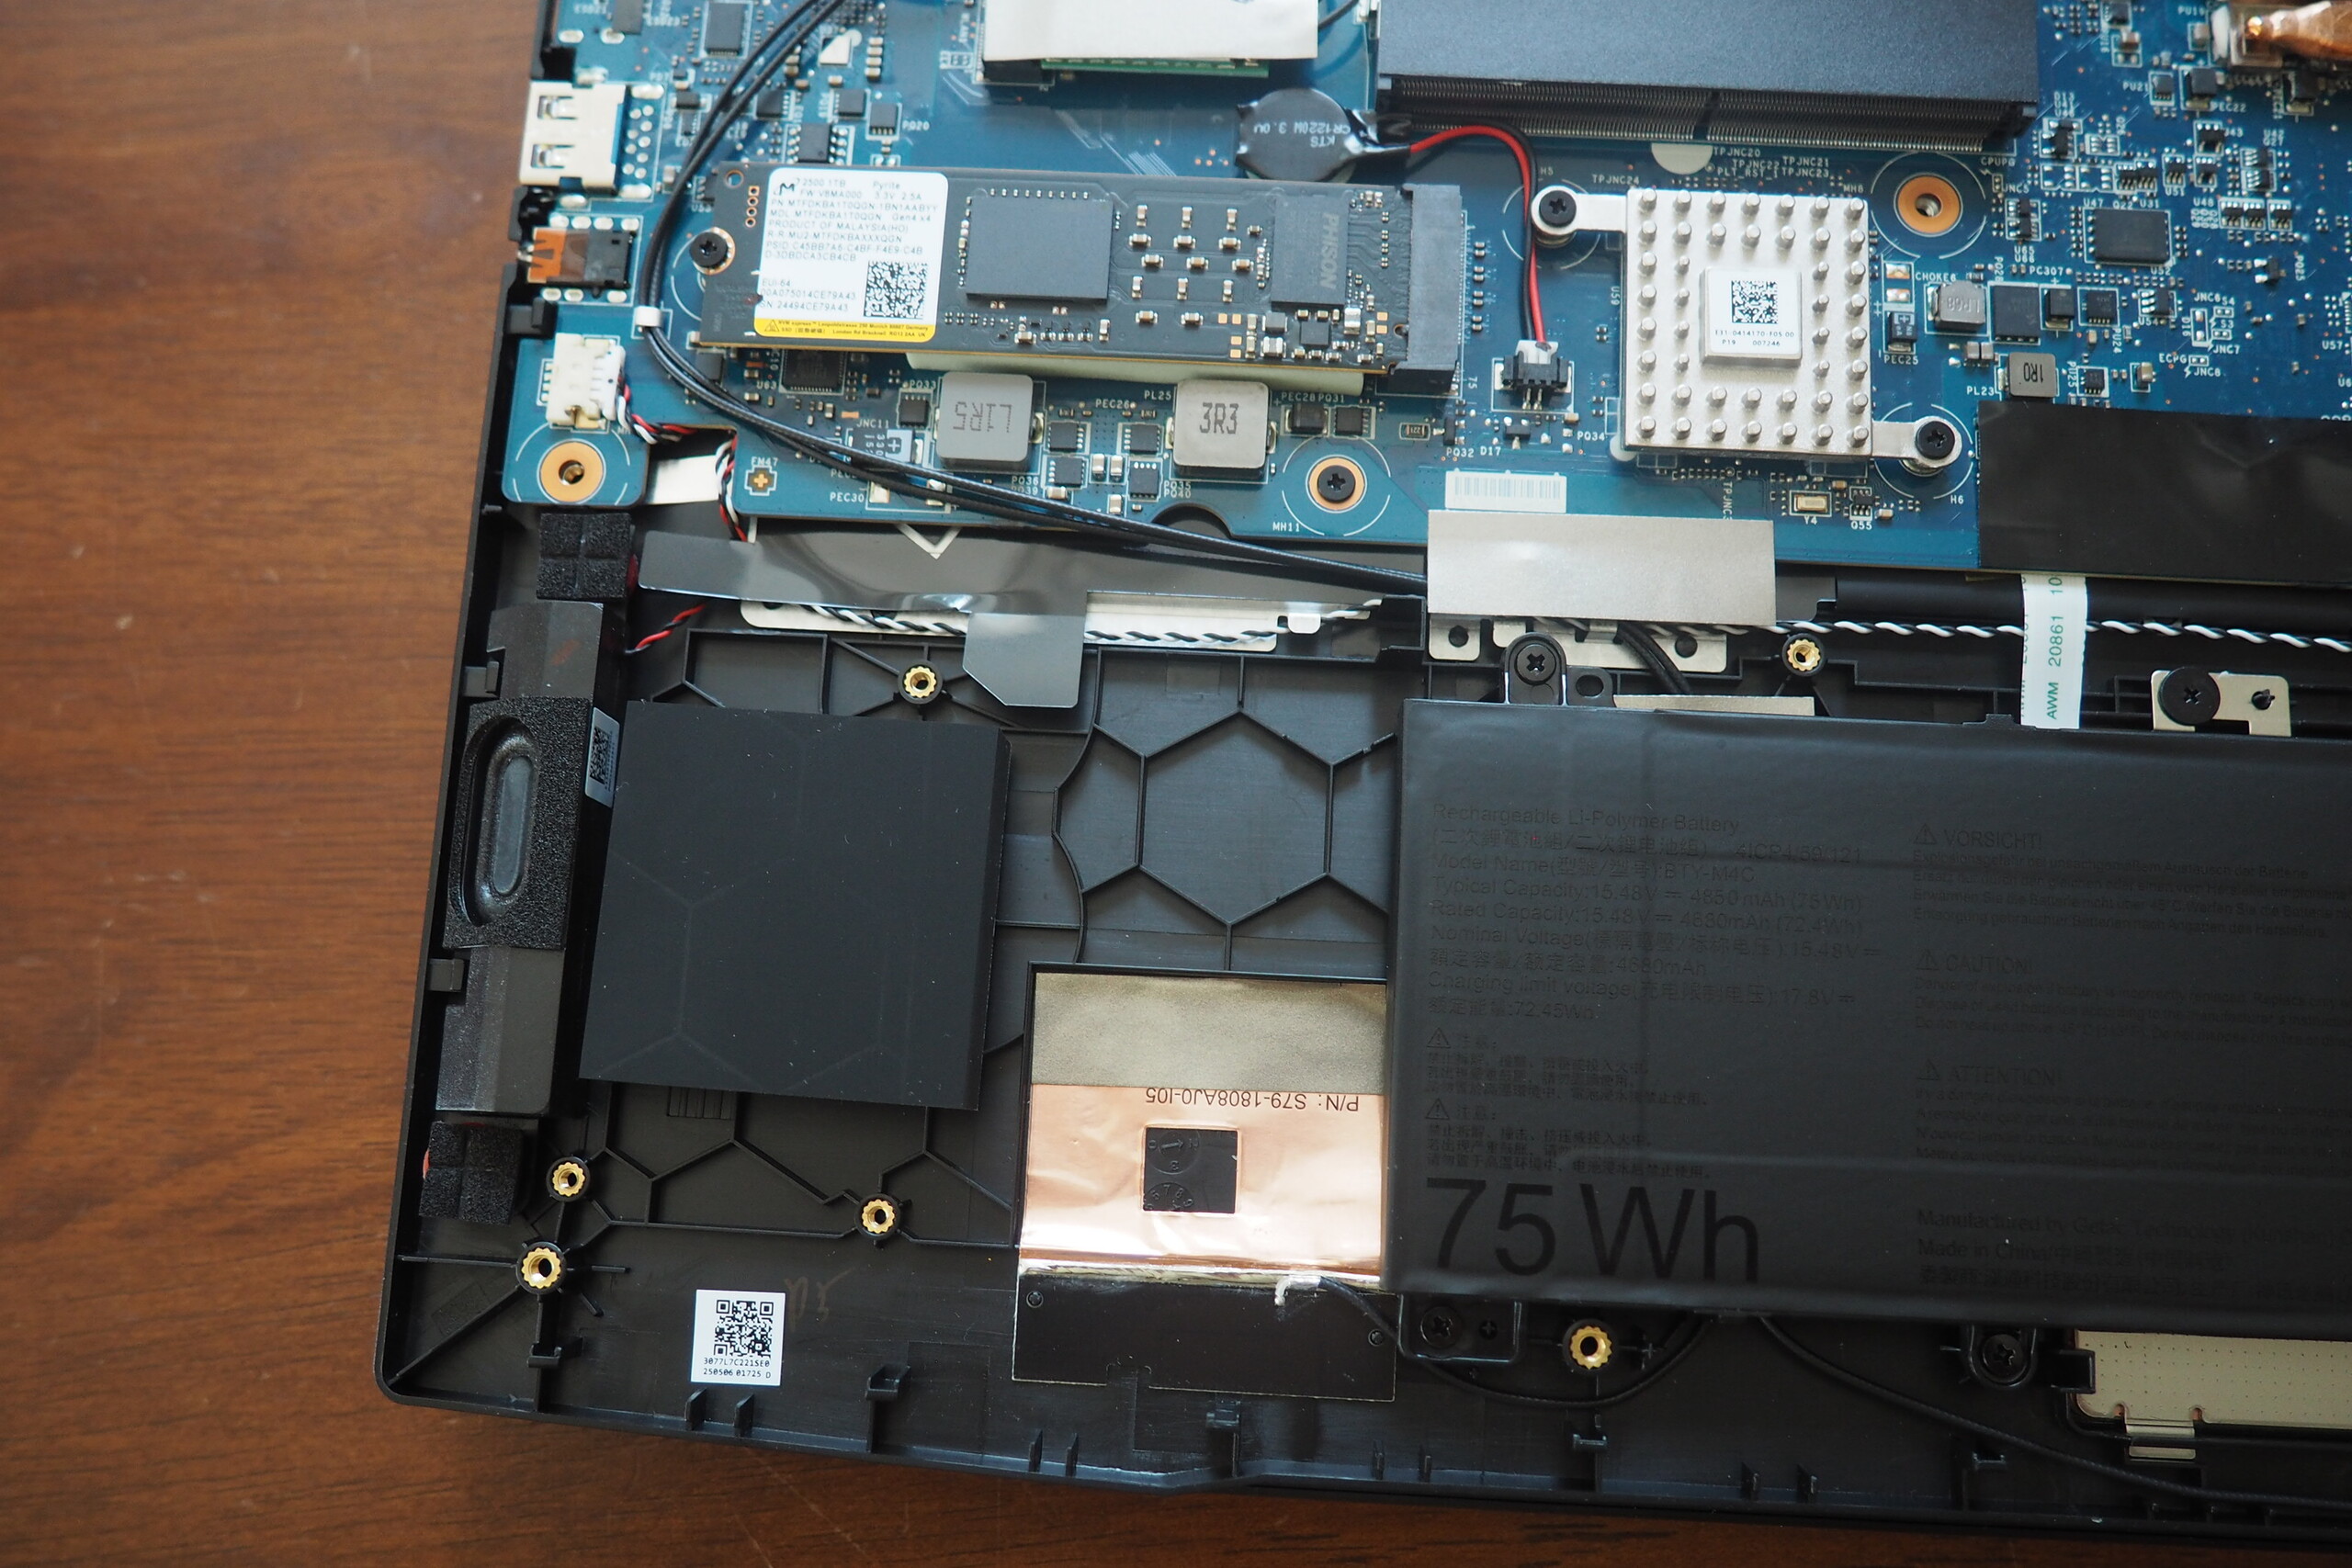
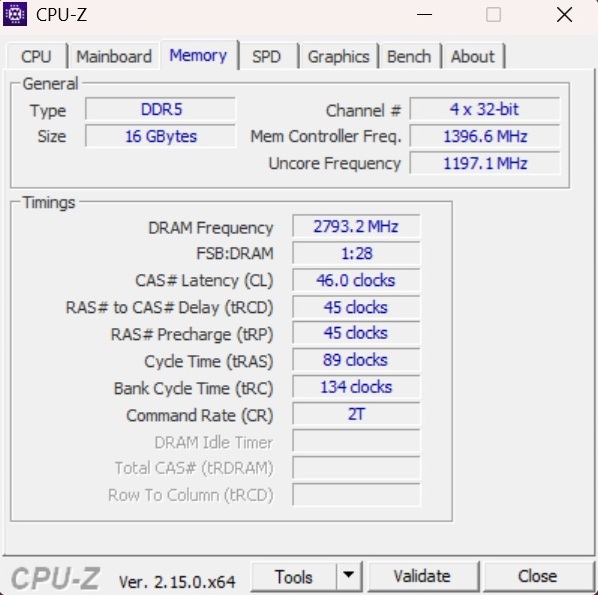
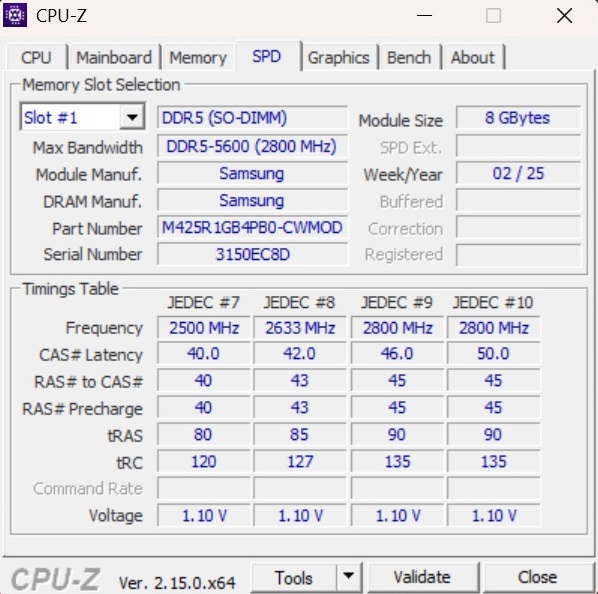
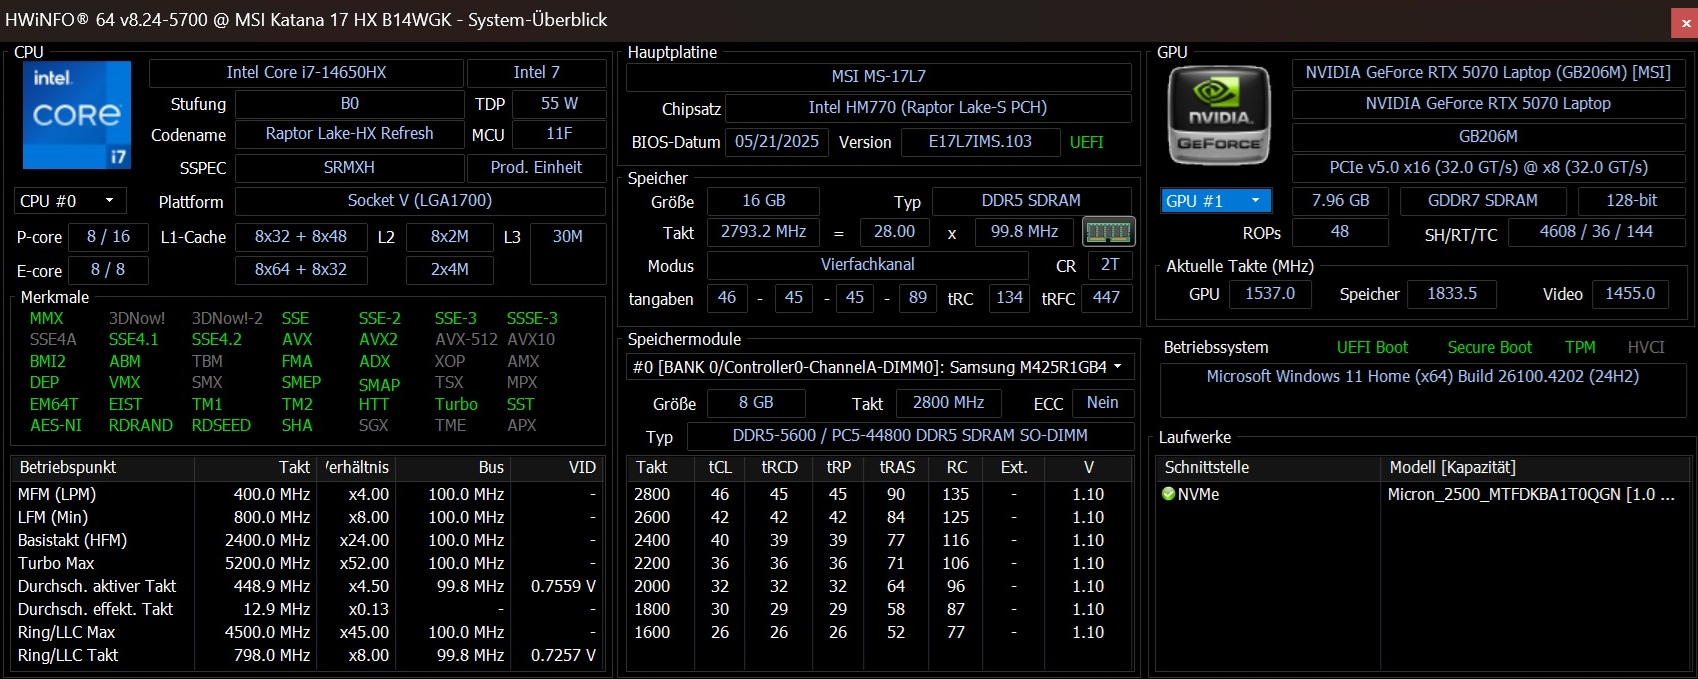
Le Katana 17 HX n'appartient qu'au milieu de gamme (supérieur), principalement en raison de sa VRAM de 8 Go. Haut : Grâce à deux banques SO-DIMM, rien ne s'oppose à la mise à niveau des 16 Go de RAM (2x 8 Go DDR5-5600). Il est toutefois décevant que MSI n'ait intégré qu'un seul emplacement M.2.
Conditions d'essai
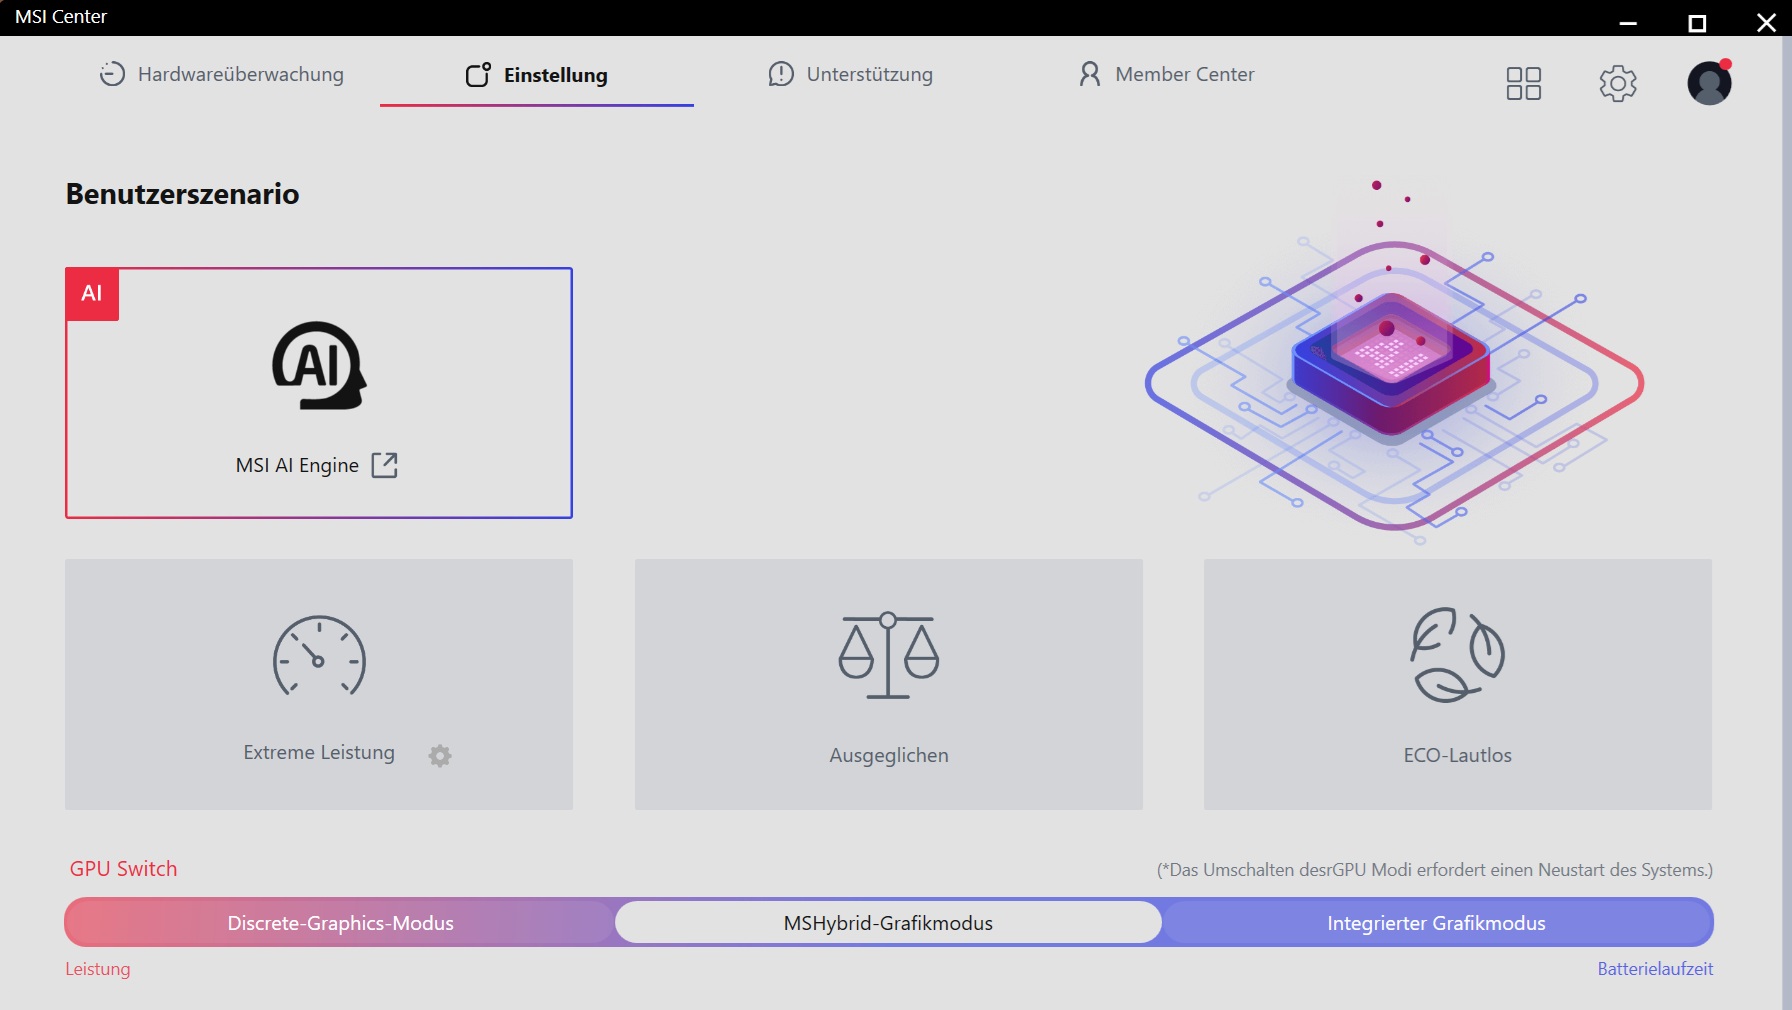
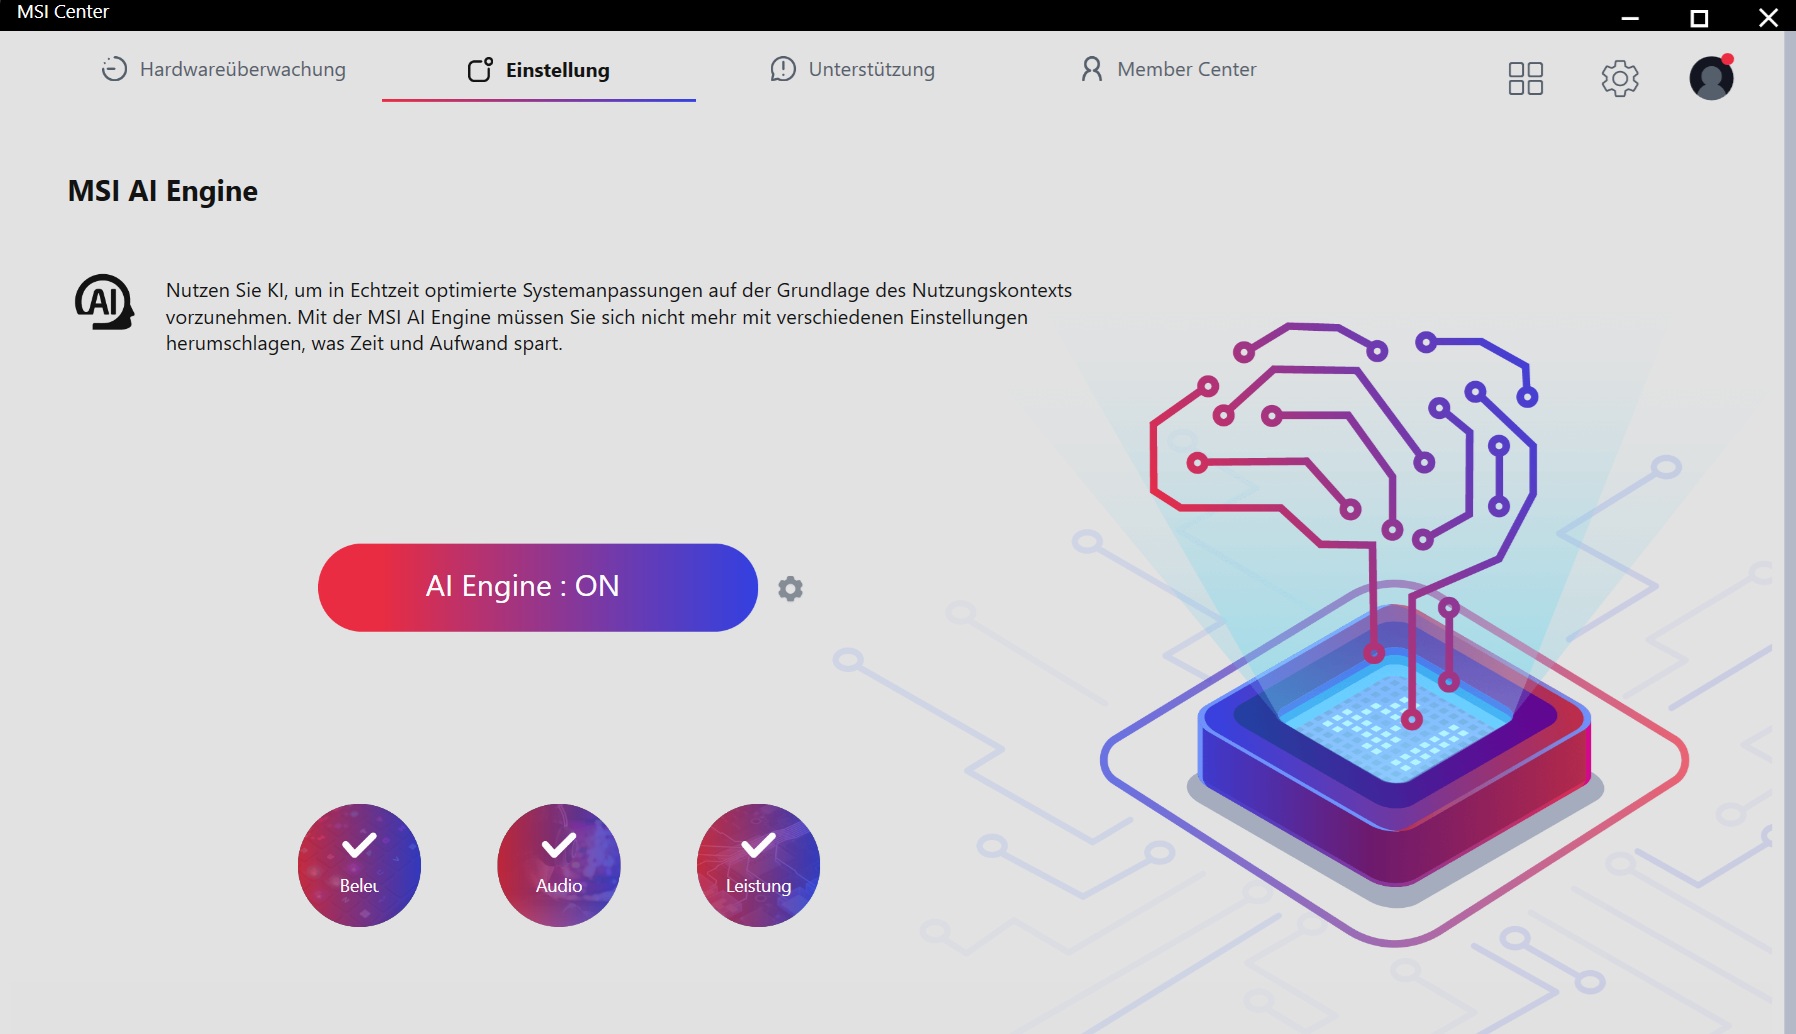
Différents modes de fonctionnement sont disponibles dans le MSI Center préinstallé. Toutes nos mesures ont été effectuées avec le profil AI, qui devrait automatiquement sélectionner les paramètres appropriés pour chaque scénario.
Processeur
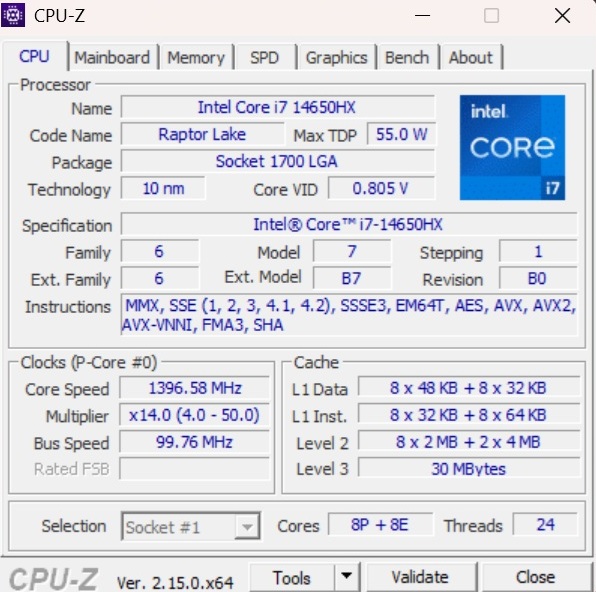
Étant donné que la version installée du Core i7-14650HX issu de la génération Raptor Lake d'Intel et contenant 8 cœurs de performance avec Hyper-Threading et 8 cœurs d'efficacité sans HT, n'est plus tout à fait d'actualité, les concurrents prennent parfois clairement l'avantage dans les benchmarks de CPU - qu'il s'agisse du Ryzen AI 9 HX 370 ou du Core Ultra 7 255HX ou de l Ultra 9 275HX. Comme l'indiquent nos tableaux, les performances sont plus proches de celles des Ryzen AI 7 350.
Cinebench R15 Multi loop
* ... Moindre est la valeur, meilleures sont les performances
AIDA64: FP32 Ray-Trace | FPU Julia | CPU SHA3 | CPU Queen | FPU SinJulia | FPU Mandel | CPU AES | CPU ZLib | FP64 Ray-Trace | CPU PhotoWorxx
| Performance rating | |
| Schenker XMG Pro 16 (E25) | |
| Asus ProArt P16 H7606WP | |
| Moyenne de la classe Gaming | |
| MSI Vector 16 HX AI A2XWHG | |
| Gigabyte Aero X16 1WH | |
| Moyenne Intel Core i7-14650HX | |
| MSI Katana 17 HX B14WGK | |
| AIDA64 / FP32 Ray-Trace | |
| Asus ProArt P16 H7606WP | |
| Schenker XMG Pro 16 (E25) | |
| Moyenne de la classe Gaming (10227 - 85542, n=110, 2 dernières années) | |
| MSI Vector 16 HX AI A2XWHG | |
| Gigabyte Aero X16 1WH | |
| Moyenne Intel Core i7-14650HX (13096 - 19044, n=2) | |
| MSI Katana 17 HX B14WGK | |
| AIDA64 / FPU Julia | |
| Schenker XMG Pro 16 (E25) | |
| Asus ProArt P16 H7606WP | |
| MSI Vector 16 HX AI A2XWHG | |
| Moyenne de la classe Gaming (51376 - 238426, n=110, 2 dernières années) | |
| Gigabyte Aero X16 1WH | |
| Moyenne Intel Core i7-14650HX (67335 - 95271, n=2) | |
| MSI Katana 17 HX B14WGK | |
| AIDA64 / CPU SHA3 | |
| Schenker XMG Pro 16 (E25) | |
| MSI Vector 16 HX AI A2XWHG | |
| Moyenne de la classe Gaming (2180 - 9817, n=110, 2 dernières années) | |
| Asus ProArt P16 H7606WP | |
| Gigabyte Aero X16 1WH | |
| Moyenne Intel Core i7-14650HX (3109 - 4214, n=2) | |
| MSI Katana 17 HX B14WGK | |
| AIDA64 / CPU Queen | |
| Schenker XMG Pro 16 (E25) | |
| Moyenne de la classe Gaming (49785 - 173351, n=101, 2 dernières années) | |
| MSI Vector 16 HX AI A2XWHG | |
| Moyenne Intel Core i7-14650HX (89907 - 101500, n=2) | |
| Asus ProArt P16 H7606WP | |
| MSI Katana 17 HX B14WGK | |
| Gigabyte Aero X16 1WH | |
| AIDA64 / FPU SinJulia | |
| Asus ProArt P16 H7606WP | |
| Moyenne de la classe Gaming (4424 - 33636, n=110, 2 dernières années) | |
| Schenker XMG Pro 16 (E25) | |
| Gigabyte Aero X16 1WH | |
| MSI Vector 16 HX AI A2XWHG | |
| Moyenne Intel Core i7-14650HX (9159 - 11913, n=2) | |
| MSI Katana 17 HX B14WGK | |
| AIDA64 / FPU Mandel | |
| Schenker XMG Pro 16 (E25) | |
| Asus ProArt P16 H7606WP | |
| MSI Vector 16 HX AI A2XWHG | |
| Moyenne de la classe Gaming (25115 - 128721, n=110, 2 dernières années) | |
| Gigabyte Aero X16 1WH | |
| Moyenne Intel Core i7-14650HX (32747 - 47097, n=2) | |
| MSI Katana 17 HX B14WGK | |
| AIDA64 / CPU AES | |
| Schenker XMG Pro 16 (E25) | |
| Asus ProArt P16 H7606WP | |
| Moyenne de la classe Gaming (39258 - 247074, n=110, 2 dernières années) | |
| MSI Vector 16 HX AI A2XWHG | |
| Gigabyte Aero X16 1WH | |
| Moyenne Intel Core i7-14650HX (63627 - 86485, n=2) | |
| MSI Katana 17 HX B14WGK | |
| AIDA64 / CPU ZLib | |
| Schenker XMG Pro 16 (E25) | |
| Moyenne de la classe Gaming (574 - 2531, n=110, 2 dernières années) | |
| MSI Vector 16 HX AI A2XWHG | |
| Asus ProArt P16 H7606WP | |
| Gigabyte Aero X16 1WH | |
| Moyenne Intel Core i7-14650HX (924 - 1289, n=2) | |
| MSI Katana 17 HX B14WGK | |
| AIDA64 / FP64 Ray-Trace | |
| Asus ProArt P16 H7606WP | |
| Schenker XMG Pro 16 (E25) | |
| Moyenne de la classe Gaming (5509 - 45446, n=110, 2 dernières années) | |
| MSI Vector 16 HX AI A2XWHG | |
| Gigabyte Aero X16 1WH | |
| Moyenne Intel Core i7-14650HX (7064 - 10316, n=2) | |
| MSI Katana 17 HX B14WGK | |
| AIDA64 / CPU PhotoWorxx | |
| Schenker XMG Pro 16 (E25) | |
| Asus ProArt P16 H7606WP | |
| Moyenne de la classe Gaming (12271 - 89891, n=110, 2 dernières années) | |
| Gigabyte Aero X16 1WH | |
| MSI Vector 16 HX AI A2XWHG | |
| MSI Katana 17 HX B14WGK | |
| Moyenne Intel Core i7-14650HX (33763 - 34470, n=2) | |
Performance du système
En ce qui concerne les performances du système, la Katana 17 arrive en queue de peloton, bien que l'écart avec la concurrence (à l'exception de la XMG Pro 16) soit assez faible.
PCMark 10: Score | Essentials | Productivity | Digital Content Creation
CrossMark: Overall | Productivity | Creativity | Responsiveness
WebXPRT 3: Overall
WebXPRT 4: Overall
Mozilla Kraken 1.1: Total
| Performance rating | |
| Schenker XMG Pro 16 (E25) | |
| Moyenne de la classe Gaming | |
| MSI Vector 16 HX AI A2XWHG | |
| Asus ProArt P16 H7606WP | |
| Gigabyte Aero X16 1WH | |
| MSI Katana 17 HX B14WGK | |
| Moyenne Intel Core i7-14650HX, NVIDIA GeForce RTX 5070 Laptop | |
| PCMark 10 / Score | |
| Schenker XMG Pro 16 (E25) | |
| Moyenne de la classe Gaming (5828 - 11574, n=96, 2 dernières années) | |
| Asus ProArt P16 H7606WP | |
| Gigabyte Aero X16 1WH | |
| MSI Vector 16 HX AI A2XWHG | |
| MSI Katana 17 HX B14WGK | |
| Moyenne Intel Core i7-14650HX, NVIDIA GeForce RTX 5070 Laptop (n=1) | |
| PCMark 10 / Essentials | |
| Schenker XMG Pro 16 (E25) | |
| MSI Vector 16 HX AI A2XWHG | |
| Moyenne de la classe Gaming (8810 - 12600, n=100, 2 dernières années) | |
| Asus ProArt P16 H7606WP | |
| Gigabyte Aero X16 1WH | |
| MSI Katana 17 HX B14WGK | |
| Moyenne Intel Core i7-14650HX, NVIDIA GeForce RTX 5070 Laptop (n=1) | |
| PCMark 10 / Productivity | |
| Moyenne de la classe Gaming (6845 - 18766, n=98, 2 dernières années) | |
| Gigabyte Aero X16 1WH | |
| Schenker XMG Pro 16 (E25) | |
| MSI Vector 16 HX AI A2XWHG | |
| Asus ProArt P16 H7606WP | |
| MSI Katana 17 HX B14WGK | |
| Moyenne Intel Core i7-14650HX, NVIDIA GeForce RTX 5070 Laptop (n=1) | |
| PCMark 10 / Digital Content Creation | |
| Schenker XMG Pro 16 (E25) | |
| Asus ProArt P16 H7606WP | |
| Moyenne de la classe Gaming (7602 - 19657, n=98, 2 dernières années) | |
| MSI Vector 16 HX AI A2XWHG | |
| Gigabyte Aero X16 1WH | |
| MSI Katana 17 HX B14WGK | |
| Moyenne Intel Core i7-14650HX, NVIDIA GeForce RTX 5070 Laptop (n=1) | |
| CrossMark / Overall | |
| Schenker XMG Pro 16 (E25) | |
| Moyenne de la classe Gaming (1366 - 2409, n=98, 2 dernières années) | |
| MSI Katana 17 HX B14WGK | |
| Moyenne Intel Core i7-14650HX, NVIDIA GeForce RTX 5070 Laptop (n=1) | |
| MSI Vector 16 HX AI A2XWHG | |
| Asus ProArt P16 H7606WP | |
| Gigabyte Aero X16 1WH | |
| CrossMark / Productivity | |
| Schenker XMG Pro 16 (E25) | |
| MSI Katana 17 HX B14WGK | |
| Moyenne Intel Core i7-14650HX, NVIDIA GeForce RTX 5070 Laptop (n=1) | |
| Moyenne de la classe Gaming (1386 - 2254, n=98, 2 dernières années) | |
| MSI Vector 16 HX AI A2XWHG | |
| Asus ProArt P16 H7606WP | |
| Gigabyte Aero X16 1WH | |
| CrossMark / Creativity | |
| Schenker XMG Pro 16 (E25) | |
| Asus ProArt P16 H7606WP | |
| MSI Vector 16 HX AI A2XWHG | |
| Moyenne de la classe Gaming (1343 - 2729, n=98, 2 dernières années) | |
| MSI Katana 17 HX B14WGK | |
| Moyenne Intel Core i7-14650HX, NVIDIA GeForce RTX 5070 Laptop (n=1) | |
| Gigabyte Aero X16 1WH | |
| CrossMark / Responsiveness | |
| MSI Katana 17 HX B14WGK | |
| Moyenne Intel Core i7-14650HX, NVIDIA GeForce RTX 5070 Laptop (n=1) | |
| Schenker XMG Pro 16 (E25) | |
| Moyenne de la classe Gaming (1226 - 2334, n=98, 2 dernières années) | |
| Asus ProArt P16 H7606WP | |
| MSI Vector 16 HX AI A2XWHG | |
| Gigabyte Aero X16 1WH | |
| WebXPRT 3 / Overall | |
| Schenker XMG Pro 16 (E25) | |
| Gigabyte Aero X16 1WH | |
| Asus ProArt P16 H7606WP | |
| MSI Vector 16 HX AI A2XWHG | |
| Moyenne de la classe Gaming (242 - 532, n=101, 2 dernières années) | |
| MSI Katana 17 HX B14WGK | |
| Moyenne Intel Core i7-14650HX, NVIDIA GeForce RTX 5070 Laptop (n=1) | |
| WebXPRT 4 / Overall | |
| Schenker XMG Pro 16 (E25) | |
| MSI Vector 16 HX AI A2XWHG | |
| Moyenne de la classe Gaming (176.4 - 354, n=101, 2 dernières années) | |
| Gigabyte Aero X16 1WH | |
| Asus ProArt P16 H7606WP | |
| MSI Katana 17 HX B14WGK | |
| Moyenne Intel Core i7-14650HX, NVIDIA GeForce RTX 5070 Laptop (n=1) | |
| Mozilla Kraken 1.1 / Total | |
| MSI Katana 17 HX B14WGK | |
| Moyenne Intel Core i7-14650HX, NVIDIA GeForce RTX 5070 Laptop (n=1) | |
| Moyenne de la classe Gaming (391 - 590, n=106, 2 dernières années) | |
| Asus ProArt P16 H7606WP | |
| Gigabyte Aero X16 1WH | |
| MSI Vector 16 HX AI A2XWHG | |
| Schenker XMG Pro 16 (E25) | |
* ... Moindre est la valeur, meilleures sont les performances
| PCMark 10 Score | 6864 points | |
Aide | ||
| AIDA64 / Memory Copy | |
| Asus ProArt P16 H7606WP | |
| Schenker XMG Pro 16 (E25) | |
| Gigabyte Aero X16 1WH | |
| Moyenne de la classe Gaming (21750 - 129946, n=110, 2 dernières années) | |
| MSI Vector 16 HX AI A2XWHG | |
| Moyenne Intel Core i7-14650HX (58978 - 59727, n=2) | |
| MSI Katana 17 HX B14WGK | |
| AIDA64 / Memory Read | |
| Asus ProArt P16 H7606WP | |
| Schenker XMG Pro 16 (E25) | |
| MSI Vector 16 HX AI A2XWHG | |
| Moyenne de la classe Gaming (22956 - 118858, n=110, 2 dernières années) | |
| Moyenne Intel Core i7-14650HX (70720 - 71455, n=2) | |
| MSI Katana 17 HX B14WGK | |
| Gigabyte Aero X16 1WH | |
| AIDA64 / Memory Write | |
| Asus ProArt P16 H7606WP | |
| Gigabyte Aero X16 1WH | |
| Schenker XMG Pro 16 (E25) | |
| Moyenne de la classe Gaming (22297 - 135096, n=110, 2 dernières années) | |
| MSI Vector 16 HX AI A2XWHG | |
| MSI Katana 17 HX B14WGK | |
| Moyenne Intel Core i7-14650HX (51138 - 56811, n=2) | |
| AIDA64 / Memory Latency | |
| Asus ProArt P16 H7606WP | |
| MSI Vector 16 HX AI A2XWHG | |
| Moyenne de la classe Gaming (75.3 - 259, n=110, 2 dernières années) | |
| Schenker XMG Pro 16 (E25) | |
| Gigabyte Aero X16 1WH | |
| MSI Katana 17 HX B14WGK | |
| Moyenne Intel Core i7-14650HX (89.8 - 95.2, n=2) | |
* ... Moindre est la valeur, meilleures sont les performances
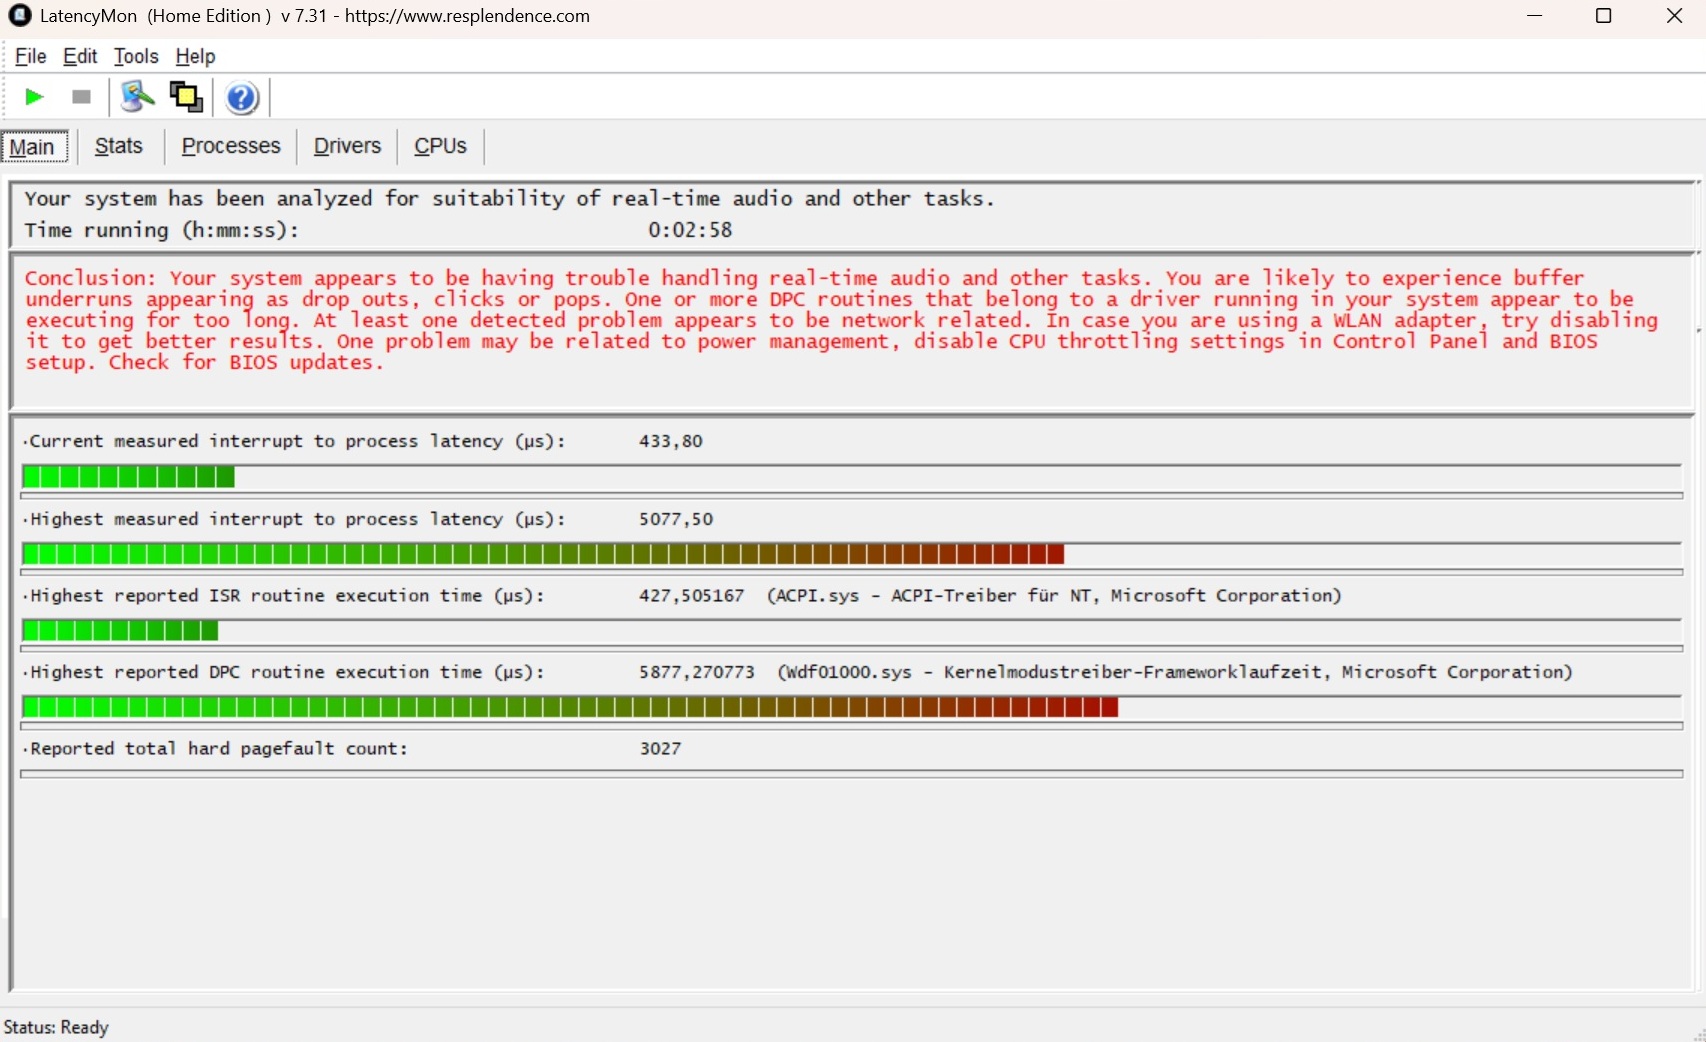
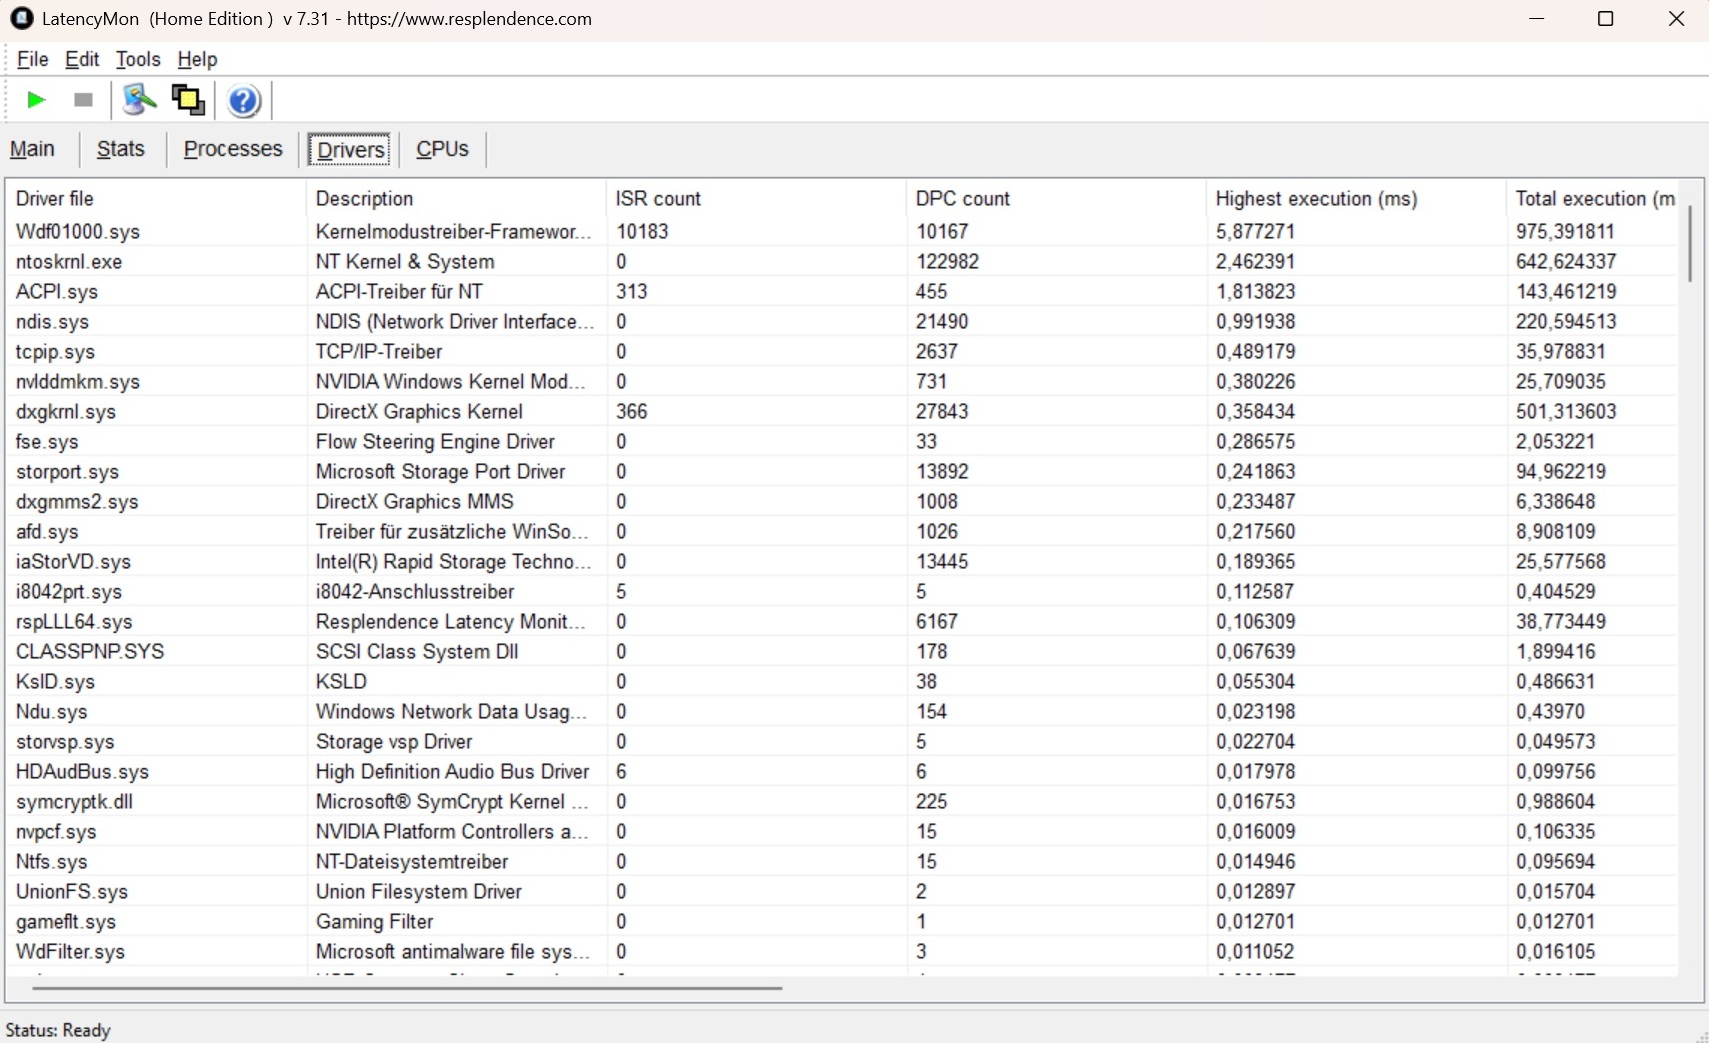
Latences DPC
Un problème pour certains utilisateurs pourrait être la latence très élevée, qui affecte également le Vector 16.
| DPC Latencies / LatencyMon - interrupt to process latency (max), Web, Youtube, Prime95 | |
| MSI Katana 17 HX B14WGK | |
| MSI Vector 16 HX AI A2XWHG | |
| Gigabyte Aero X16 1WH | |
| Schenker XMG Pro 16 (E25) | |
| Asus ProArt P16 H7606WP | |
* ... Moindre est la valeur, meilleures sont les performances
Dispositifs de stockage
MSI mérite des éloges pour son SSD rapide. Le disque de 1 To de Micron (modèle 2500) offre des valeurs excellentes et stables tant en lecture qu'en écriture.

* ... Moindre est la valeur, meilleures sont les performances
Continuous read: DiskSpd Read Loop, Queue Depth 8
Performance du GPU
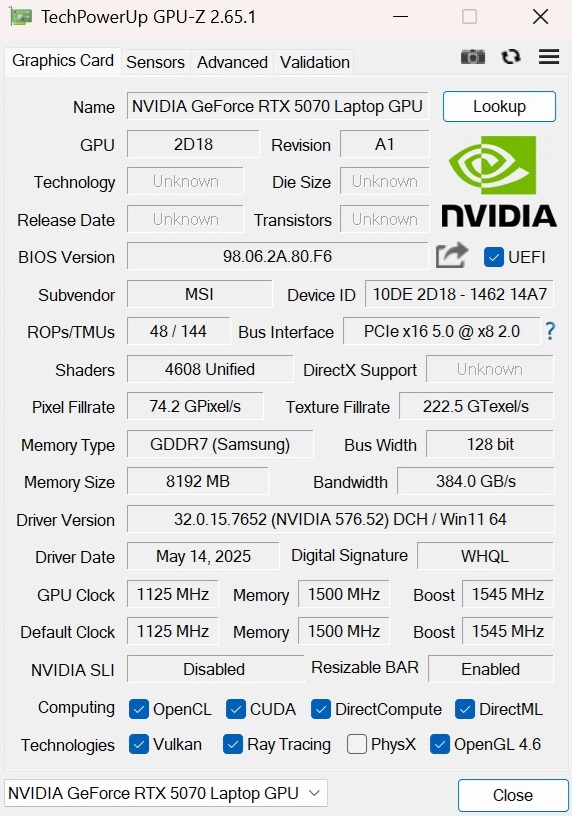
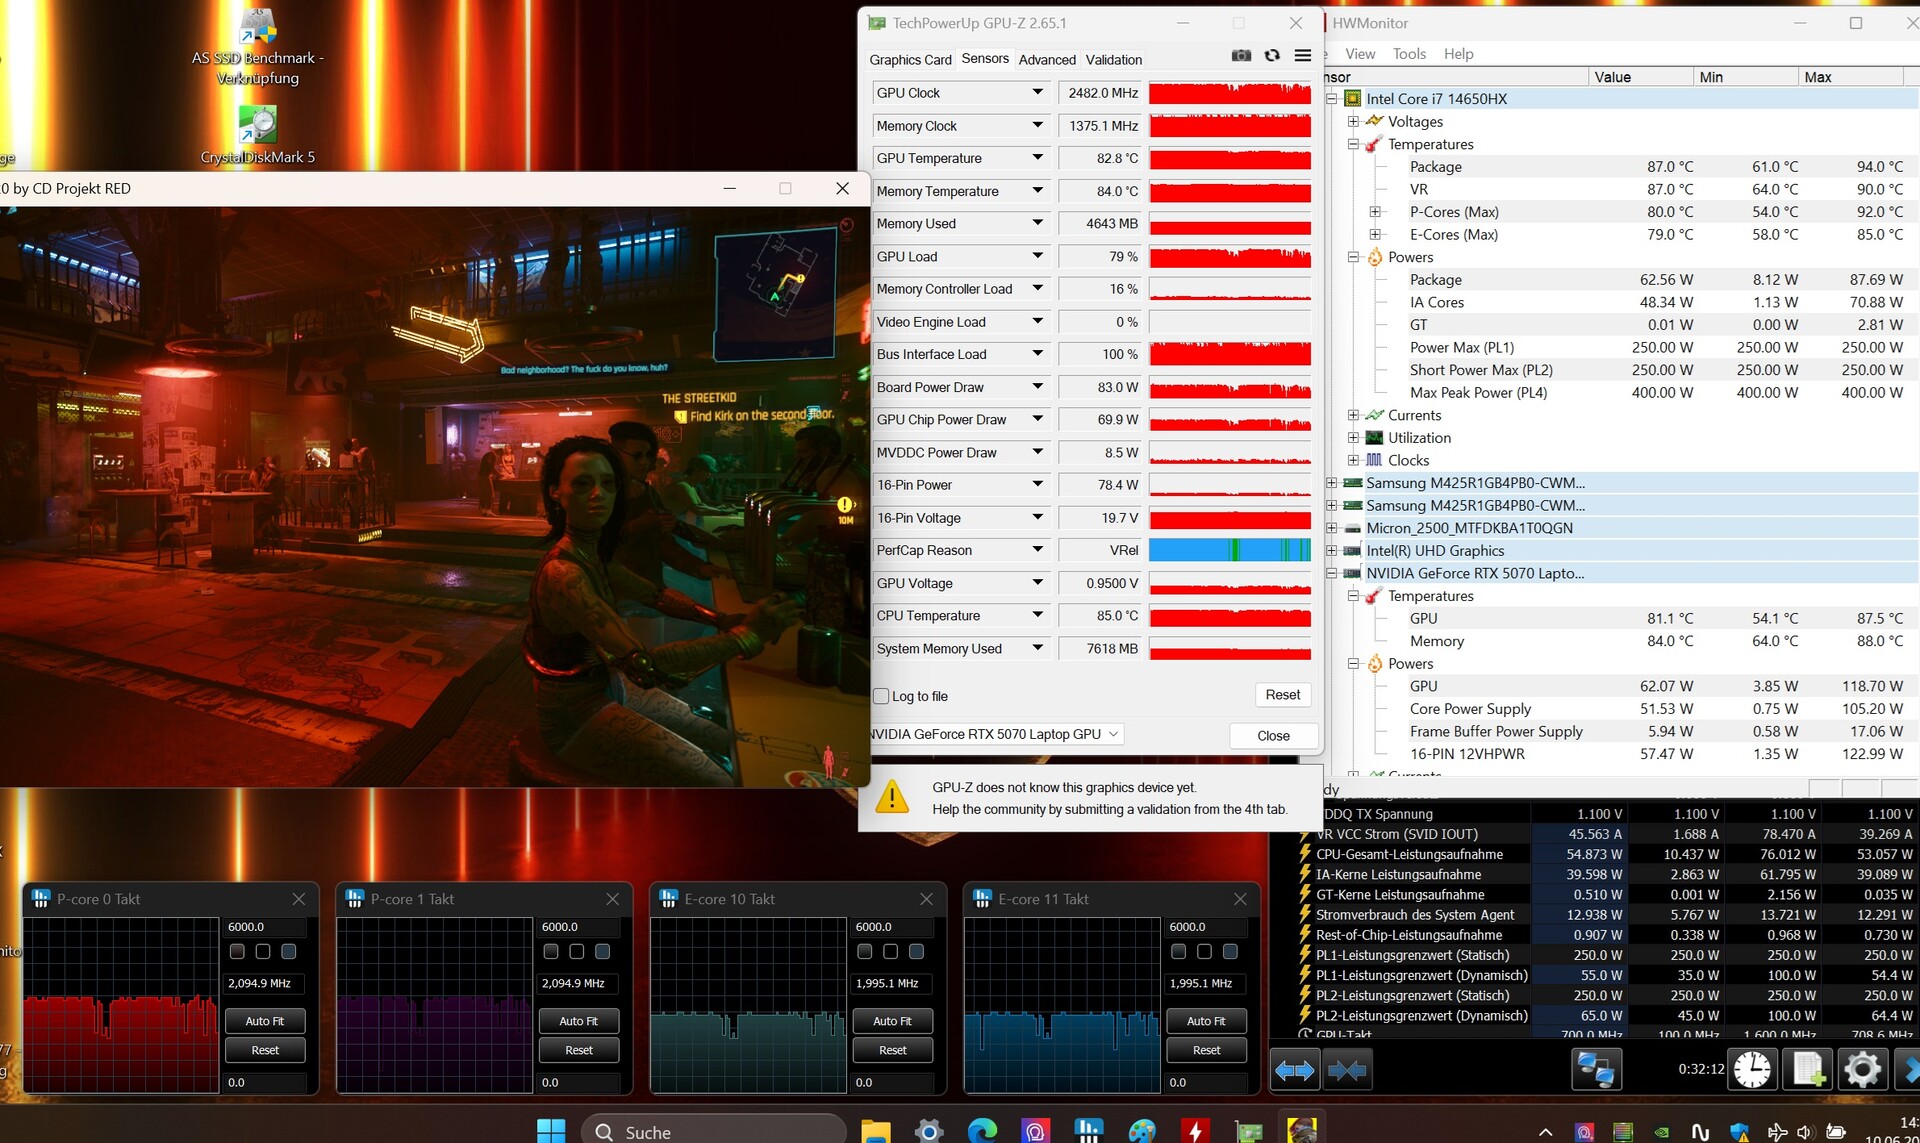
De notre point de vue, l'ordinateur portable GeForce RTX 5070 ne devrait pas exister sous cette forme. L'ordinateur portable Ordinateur portable RTX 5070 Tiavec ses 12 Go de VRAM GDDR7 au lieu de 8 Go, devrait être la véritable "version standard" (au prix de l'ordinateur portable RTX 5070, bien sûr). Cependant, il en résulte un ordinateur portable de jeu qui n'est que très peu évolutif en raison de sa mémoire vidéo limitée, et qui atteint déjà ses limites avec certains titres modernes - plus d'informations à ce sujet dans un instant. Dans les benchmarks synthétiques, le Katana 17 avec son TGP de 115 watts (Dynamic Boost inclus) est au moins en ligne avec la moyenne déterminée précédemment pour ce GPU. Un modèle d'ordinateur portable RTX 5070 Ti est en moyenne 30% plus performant.
| 3DMark 11 Performance | 33622 points | |
| 3DMark Cloud Gate Standard Score | 56625 points | |
| 3DMark Fire Strike Score | 29564 points | |
| 3DMark Time Spy Score | 12583 points | |
Aide | ||
* ... Moindre est la valeur, meilleures sont les performances
Performances des jeux
Cet écart se poursuit dans le domaine du jeu. Ici aussi, un ordinateur portable RTX 5070 Ti est 30% plus rapide en moyenne. Un ordinateur portable RTX 5080 est quant à lui 60% plus rapide en QHD. La différence peut être flagrante dans les jeux gourmands en VRAM. Avec le préréglage Très Ultra, un ordinateur portable RTX 5070 Ti atteint environ 150% d'images par seconde en plus dans Indiana Jones (32,4 contre 82,5 FPS @ MSI Vector A18 HX), un ordinateur portable RTX 5080 est même presque 200% plus performant (99.5 FPS @ MSI Raider A18 HX).
Cependant, l'ordinateur portable RTX 5070 a encore assez de puissance pour exécuter presque tous les titres avec des détails élevés à maximaux dans la résolution native de 2 560 x 1 440 pixels. Les choses se corsent avec des titres très exigeants ou mal optimisés tels que Hellblade 2, Star Wars Outlaws, Until Dawnet Oblivion Remastered - ici, la barre des 40 FPS n'est pas franchie. Comme d'habitude, l'upscaling sous forme de DLSS (4) et de (Multi) Frame Generation en option permet d'y remédier. Les capacités de cette dernière en termes de taux de rafraîchissement peuvent être observées, par exemple, dans Stalker 2 (voir tableau).
| Performance rating - Percent | |
| Medion Erazer Beast 18 X1 MD62731 -1! | |
| MSI Vector 16 HX AI A2XWHG -1! | |
| Moyenne de la classe Gaming | |
| Moyenne NVIDIA GeForce RTX 5070 Laptop | |
| MSI Katana 17 HX B14WGK | |
| Doom: The Dark Ages | |
| 2560x1440 Ultra Nightmare AA:T | |
| Medion Erazer Beast 18 X1 MD62731 | |
| MSI Vector 16 HX AI A2XWHG | |
| Moyenne de la classe Gaming (30.4 - 92.2, n=19, 2 dernières années) | |
| MSI Katana 17 HX B14WGK | |
| Moyenne NVIDIA GeForce RTX 5070 Laptop (39.5 - 49.4, n=5) | |
| 2560x1440 Ultra Nightmare - DLSS Quality | |
| Medion Erazer Beast 18 X1 MD62731 | |
| MSI Vector 16 HX AI A2XWHG | |
| Moyenne de la classe Gaming (48 - 107.3, n=18, 2 dernières années) | |
| Moyenne NVIDIA GeForce RTX 5070 Laptop (54.6 - 70, n=5) | |
| MSI Katana 17 HX B14WGK | |
| The Elder Scrolls IV Oblivion Remastered | |
| 2560x1440 Ultra Preset AA:T | |
| Medion Erazer Beast 18 X1 MD62731 | |
| MSI Vector 16 HX AI A2XWHG | |
| Moyenne de la classe Gaming (12.7 - 45.9, n=14, 2 dernières années) | |
| MSI Katana 17 HX B14WGK | |
| Moyenne NVIDIA GeForce RTX 5070 Laptop (19.5 - 20.9, n=3) | |
| 2560x1440 Ultra Preset + Quality DLSS | |
| Medion Erazer Beast 18 X1 MD62731 | |
| MSI Vector 16 HX AI A2XWHG | |
| Moyenne de la classe Gaming (25.3 - 59.7, n=12, 2 dernières années) | |
| Moyenne NVIDIA GeForce RTX 5070 Laptop (30.3 - 34, n=3) | |
| MSI Katana 17 HX B14WGK | |
| Ghost of Tsushima | |
| 2560x1440 Very High Preset AA:T | |
| Medion Erazer Beast 18 X1 MD62731 | |
| MSI Vector 16 HX AI A2XWHG | |
| Moyenne de la classe Gaming (22.7 - 100.3, n=14, 2 dernières années) | |
| Moyenne NVIDIA GeForce RTX 5070 Laptop (49.1 - 53.8, n=2) | |
| MSI Katana 17 HX B14WGK | |
| 2560x1440 Very High Preset + Quality DLSS | |
| Medion Erazer Beast 18 X1 MD62731 | |
| MSI Vector 16 HX AI A2XWHG | |
| Moyenne de la classe Gaming (55.2 - 105.2, n=11, 2 dernières années) | |
| Moyenne NVIDIA GeForce RTX 5070 Laptop (66.5 - 74.6, n=2) | |
| MSI Katana 17 HX B14WGK | |
| Horizon Forbidden West | |
| 2560x1440 Very High Preset AA:T | |
| Medion Erazer Beast 18 X1 MD62731 | |
| MSI Vector 16 HX AI A2XWHG | |
| Moyenne de la classe Gaming (39.6 - 100.9, n=10, 2 dernières années) | |
| Moyenne NVIDIA GeForce RTX 5070 Laptop (57.9 - 64, n=2) | |
| MSI Katana 17 HX B14WGK | |
| 2560x1440 Very High Preset + DLSS Quality | |
| Medion Erazer Beast 18 X1 MD62731 | |
| MSI Vector 16 HX AI A2XWHG | |
| Moyenne de la classe Gaming (58.4 - 116.6, n=8, 2 dernières années) | |
| Moyenne NVIDIA GeForce RTX 5070 Laptop (70.3 - 81.3, n=2) | |
| MSI Katana 17 HX B14WGK | |
| Indiana Jones and the Great Circle - 2560x1440 Very Ultra Preset | |
| Moyenne de la classe Gaming (4.2 - 121.9, n=33, 2 dernières années) | |
| MSI Katana 17 HX B14WGK | |
| Moyenne NVIDIA GeForce RTX 5070 Laptop (7.6 - 32.4, n=4) | |
| Final Fantasy XV Benchmark - 1920x1080 High Quality | |
| MSI Vector 16 HX AI A2XWHG | |
| Schenker XMG Pro 16 (E25) | |
| Moyenne de la classe Gaming (41 - 215, n=104, 2 dernières années) | |
| Moyenne NVIDIA GeForce RTX 5070 Laptop (96 - 150.7, n=25) | |
| Asus ProArt P16 H7606WP | |
| Gigabyte Aero X16 1WH | |
| Strange Brigade - 1920x1080 ultra AA:ultra AF:16 | |
| Moyenne de la classe Gaming (76.3 - 456, n=94, 2 dernières années) | |
| Asus ProArt P16 H7606WP | |
| Moyenne NVIDIA GeForce RTX 5070 Laptop (203 - 261, n=23) | |
| Gigabyte Aero X16 1WH | |
| Schenker XMG Pro 16 (E25) | |
| Bas | Moyen | Élevé | Ultra | QHD DLSS | QHD | |
|---|---|---|---|---|---|---|
| GTA V (2015) | 180.8 | 167.2 | 119 | 108.3 | ||
| Dota 2 Reborn (2015) | 199.1 | 170.8 | 161.7 | 149.3 | ||
| X-Plane 11.11 (2018) | 146.6 | 127.7 | 106.4 | |||
| Baldur's Gate 3 (2023) | 127.2 | 123.8 | 101.3 | 82.5 | ||
| Cyberpunk 2077 (2023) | 126.8 | 113.8 | 101.5 | 64.5 | ||
| Counter-Strike 2 (2023) | 222 | 170.4 | 156.5 | 115.4 | ||
| Prince of Persia The Lost Crown (2024) | 356 | 356 | 356 | 352 | ||
| Helldivers 2 (2024) | 102.1 | 101.2 | 97.4 | 81.3 | ||
| Dragon's Dogma 2 (2024) | 66 | 60.2 | ||||
| Horizon Forbidden West (2024) | 91.1 | 74.9 | 73.2 | 70.3 | 57.9 | |
| Ghost of Tsushima (2024) | 84.5 | 80.4 | 64.9 | 66.5 | 49.1 | |
| Senua's Saga Hellblade 2 (2024) | 64.1 | 46.3 | 49.4 | 31.7 | ||
| Star Wars Outlaws (2024) | 65.4 | 58.5 | 49.4 | 48.5 | 35.1 | |
| Space Marine 2 (2024) | 64.7 | 61.6 | 58.9 | 58.5 | 54.7 | |
| Until Dawn (2024) | 76.8 | 59.6 | 48.8 | 46.7 | 35.4 | |
| Stalker 2 (2024) | 64 | 54.1 | 47.1 | 74.1 | 36 | |
| Indiana Jones and the Great Circle (2024) | 60 | 42.3 | 32.4 | |||
| Kingdom Come Deliverance 2 (2025) | 111.5 | 91.4 | 67.6 | 61.5 | 45.5 | |
| Civilization 7 (2025) | 154.1 | 142.7 | 97.9 | |||
| The Elder Scrolls IV Oblivion Remastered (2025) | 72.8 | 62.3 | 30.7 | 32 | 20.9 | |
| Doom: The Dark Ages (2025) | 69.6 | 66 | 64.8 | 59.9 | 45.4 |
Nous avons testé si les performances du GPU restaient constantes sur une longue période avec Cyberpunk 2077 : La Katana 17 peut produire des FPS stables sans chute.
Cyberpunk 2077 Ultra settings FPS chart
Émissions
Émissions sonores
Alors que l'appareil de 17 pouces reste raisonnablement silencieux en mode veille (31 à 34 dB(A)), les ventilateurs du boîtier deviennent très bruyants en charge (50 à 59 dB(A)). Tous les concurrents sont plus silencieux en mode 3D.
Degré de la nuisance sonore
| Au repos |
| 31 / 32 / 34 dB(A) |
| Fortement sollicité |
| 50 / 59 dB(A) |
 | ||
30 dB silencieux 40 dB(A) audible 50 dB(A) bruyant |
||
min: | ||
| MSI Katana 17 HX B14WGK i7-14650HX, GeForce RTX 5070 Laptop | Gigabyte Aero X16 1WH Ryzen AI 7 350, GeForce RTX 5070 Laptop | Asus ProArt P16 H7606WP Ryzen AI 9 HX 370, GeForce RTX 5070 Laptop | Schenker XMG Pro 16 (E25) Ultra 9 275HX, GeForce RTX 5070 Ti Laptop | MSI Vector 16 HX AI A2XWHG Ultra 7 255HX, GeForce RTX 5070 Ti Laptop | |
|---|---|---|---|---|---|
| Noise | 21% | 10% | 14% | 3% | |
| arrêt / environnement * (dB) | 25 | 23.9 4% | 23.5 6% | 23.3 7% | 25 -0% |
| Idle Minimum * (dB) | 31 | 23.9 23% | 26.7 14% | 25 19% | 33 -6% |
| Idle Average * (dB) | 32 | 23.9 25% | 26.7 17% | 25 22% | 34 -6% |
| Idle Maximum * (dB) | 34 | 23.9 30% | 31.1 9% | 25 26% | 38 -12% |
| Load Average * (dB) | 50 | 33.2 34% | 44.8 10% | 45.5 9% | 46 8% |
| Cyberpunk 2077 ultra * (dB) | 58 | 50.2 13% | 53.7 7% | 53.3 8% | 47 19% |
| Load Maximum * (dB) | 59 | 50.2 15% | 53.7 9% | 53.3 10% | 49 17% |
* ... Moindre est la valeur, meilleures sont les performances
Température
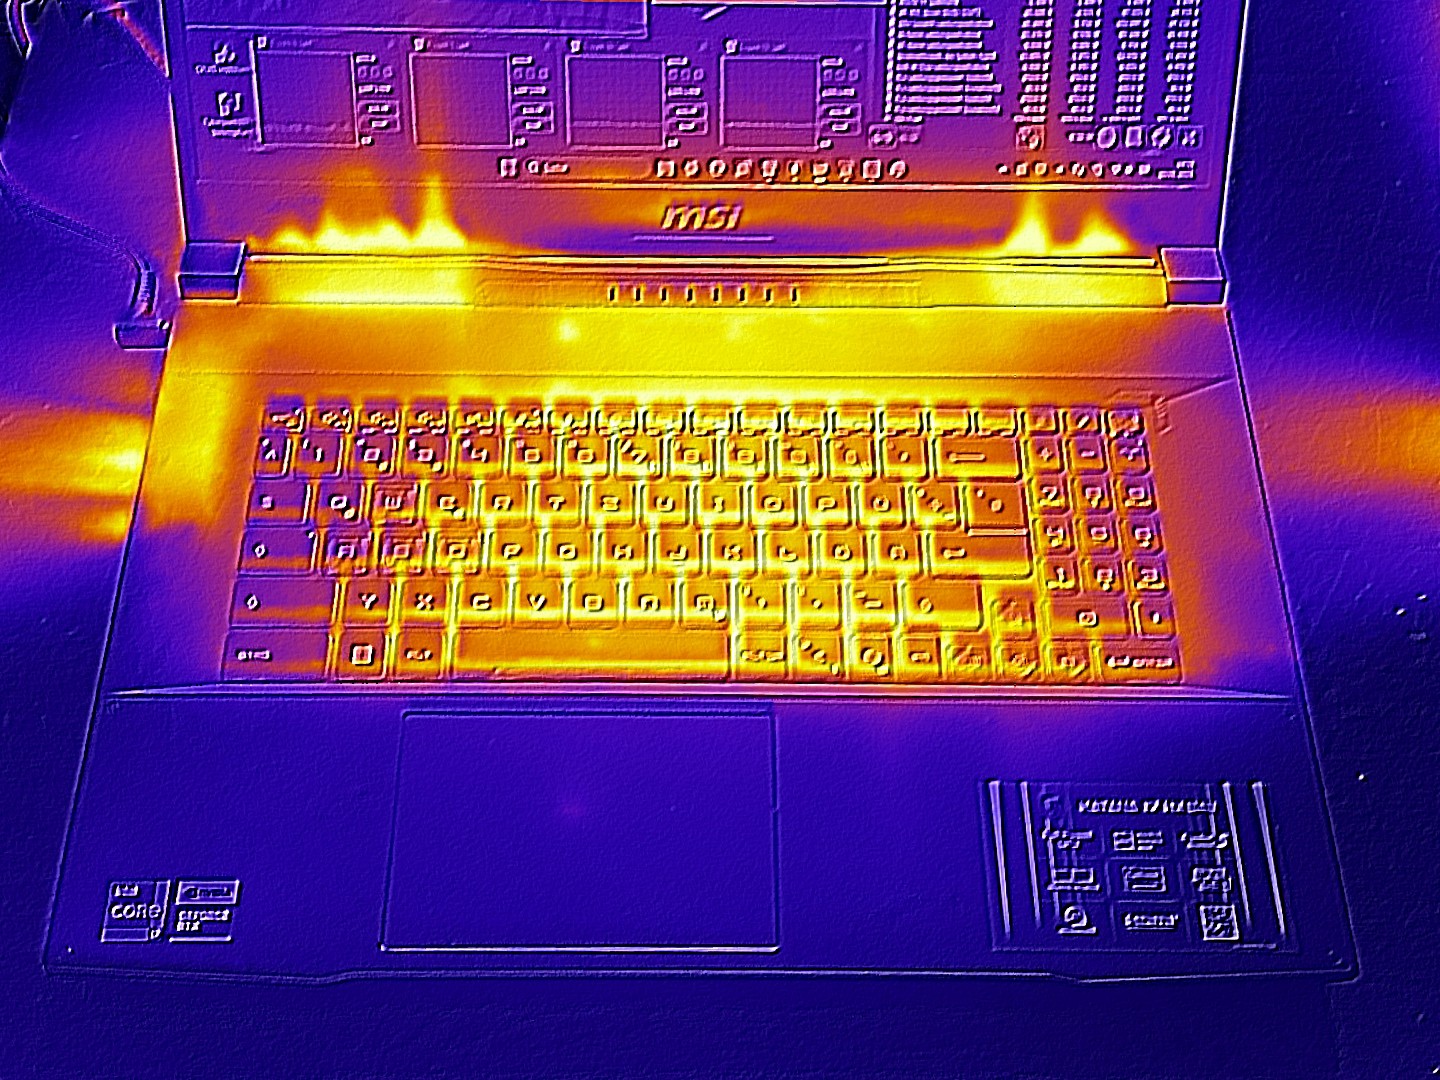
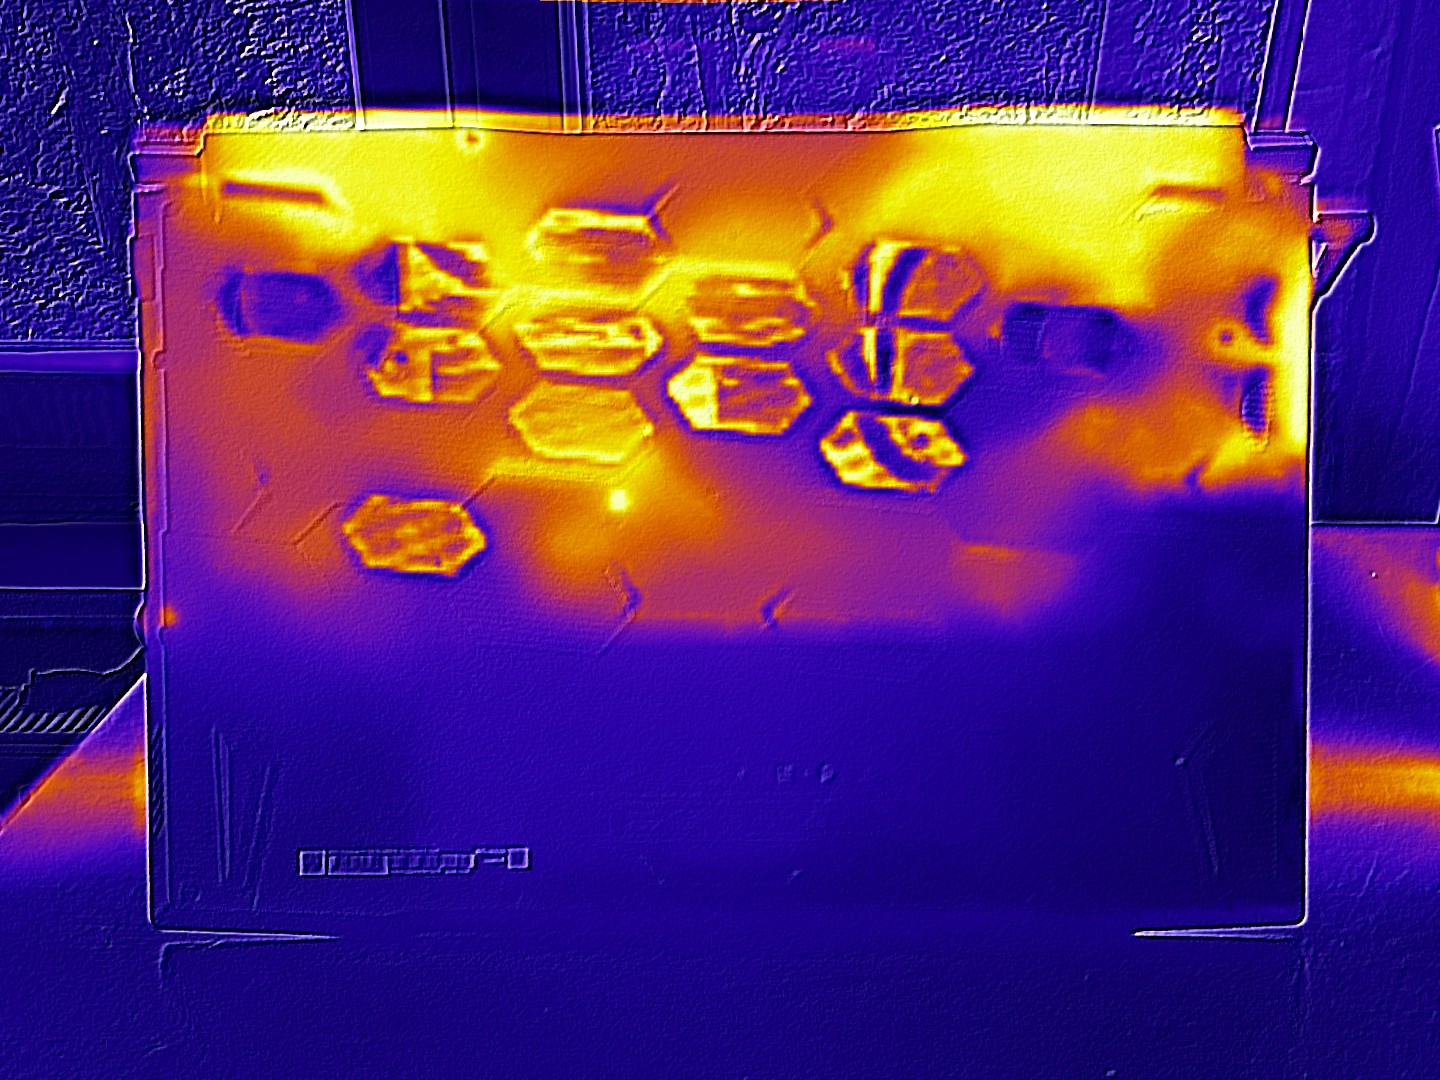
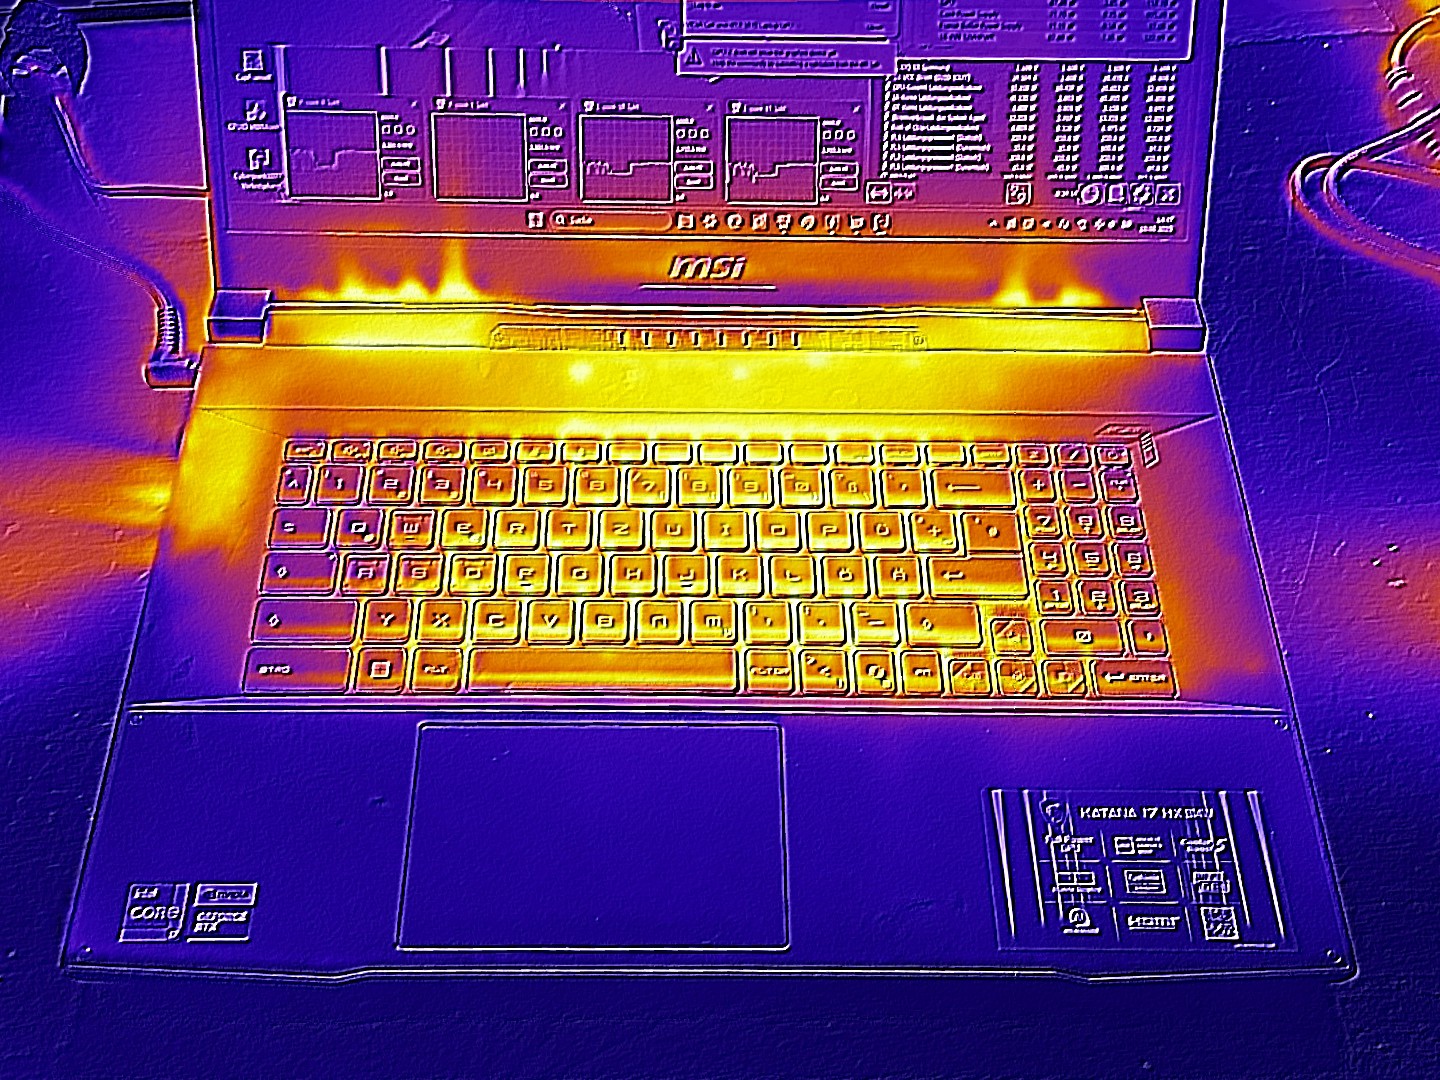
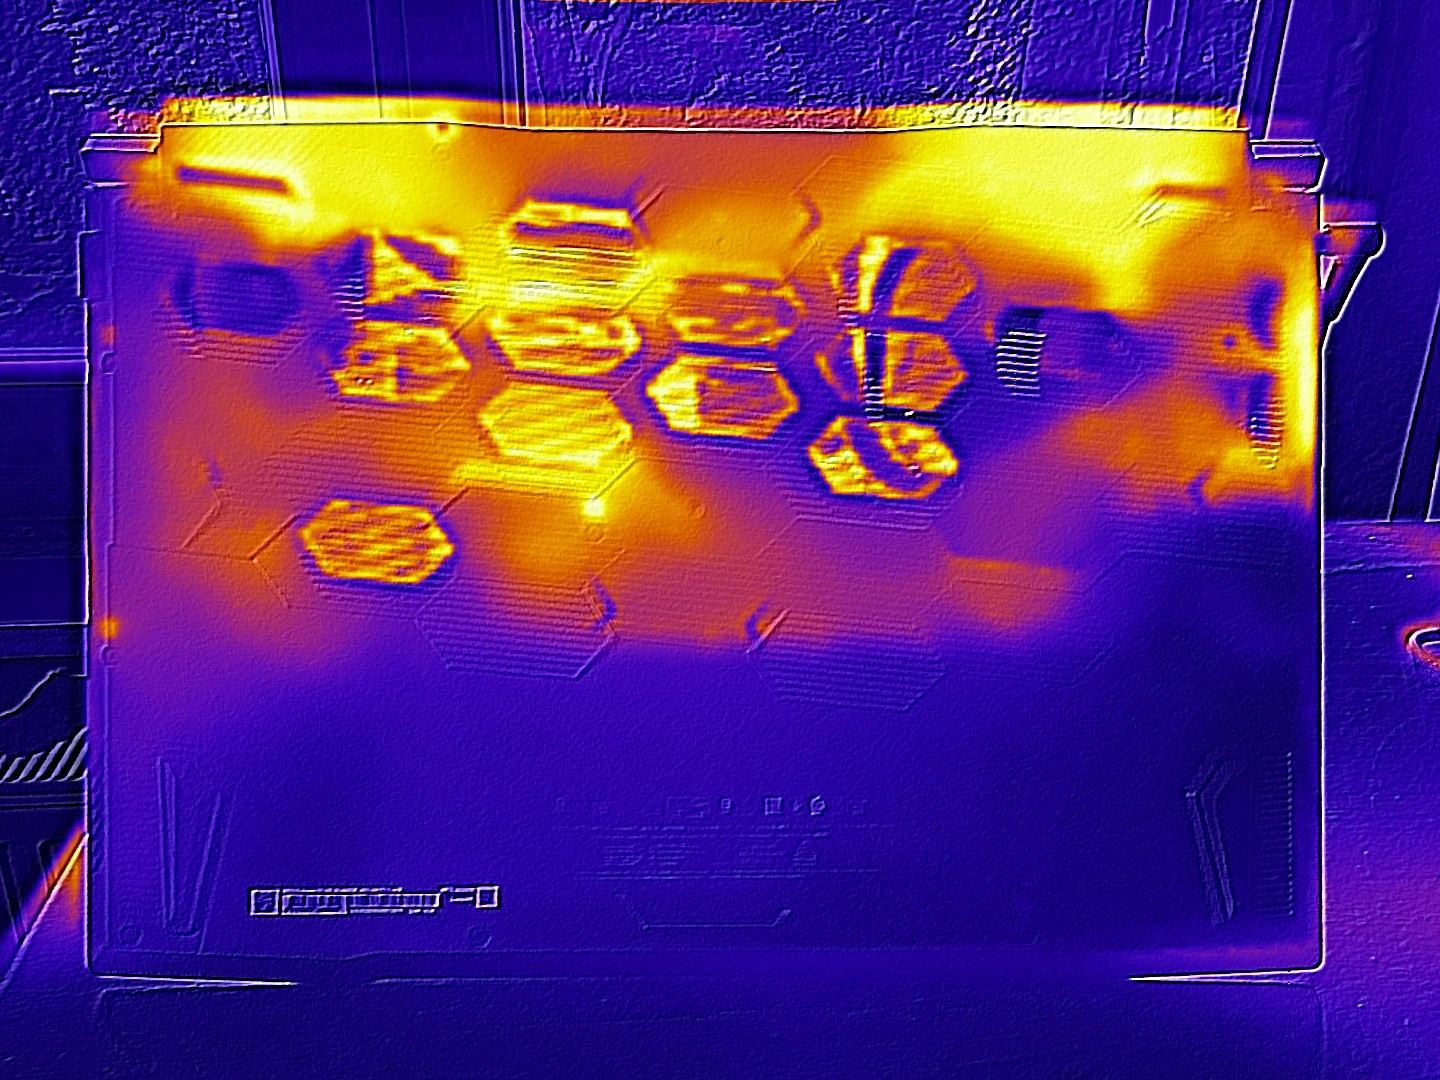
Avec un maximum de 52 °C sur le dessus et un maximum de 56 °C sur le dessous du boîtier, le Katana 17 est plus chaud que ses concurrents en mode 3D. La situation est nettement plus détendue en mode idle avec une moyenne de 29 °C.
(-) La température maximale du côté supérieur est de 52 °C / 126 F, par rapport à la moyenne de 40.4 °C / 105 F, allant de 21.2 à 68.8 °C pour la classe Gaming.
(-) Le fond chauffe jusqu'à un maximum de 56 °C / 133 F, contre une moyenne de 43.2 °C / 110 F
(+) En utilisation inactive, la température moyenne du côté supérieur est de 29.2 °C / 85 F, par rapport à la moyenne du dispositif de 33.9 °C / 93 F.
(-) 3: The average temperature for the upper side is 42.7 °C / 109 F, compared to the average of 33.9 °C / 93 F for the class Gaming.
(±) Les repose-poignets et le pavé tactile peuvent devenir très chauds au toucher, avec un maximum de 36 °C / 96.8# F.
(-) La température moyenne de la zone de l'appui-paume de dispositifs similaires était de 28.8 °C / 83.8 F (-7.2 °C / #-13 F).
| MSI Katana 17 HX B14WGK Intel Core i7-14650HX, NVIDIA GeForce RTX 5070 Laptop | Gigabyte Aero X16 1WH AMD Ryzen AI 7 350, NVIDIA GeForce RTX 5070 Laptop | Asus ProArt P16 H7606WP AMD Ryzen AI 9 HX 370, NVIDIA GeForce RTX 5070 Laptop | Schenker XMG Pro 16 (E25) Intel Core Ultra 9 275HX, NVIDIA GeForce RTX 5070 Ti Laptop | MSI Vector 16 HX AI A2XWHG Intel Core Ultra 7 255HX, NVIDIA GeForce RTX 5070 Ti Laptop | |
|---|---|---|---|---|---|
| Heat | 14% | 16% | -169% | 4% | |
| Maximum Upper Side * (°C) | 52 | 43.3 17% | 47 10% | 43.2 17% | 53 -2% |
| Maximum Bottom * (°C) | 56 | 50.3 10% | 47.4 15% | 46 18% | 52 7% |
| Idle Upper Side * (°C) | 33 | 27 18% | 26.1 21% | 27.7 16% | 33 -0% |
| Idle Bottom * (°C) | 32 | 28.3 12% | 26.4 17% | 264 -725% | 29 9% |
* ... Moindre est la valeur, meilleures sont les performances
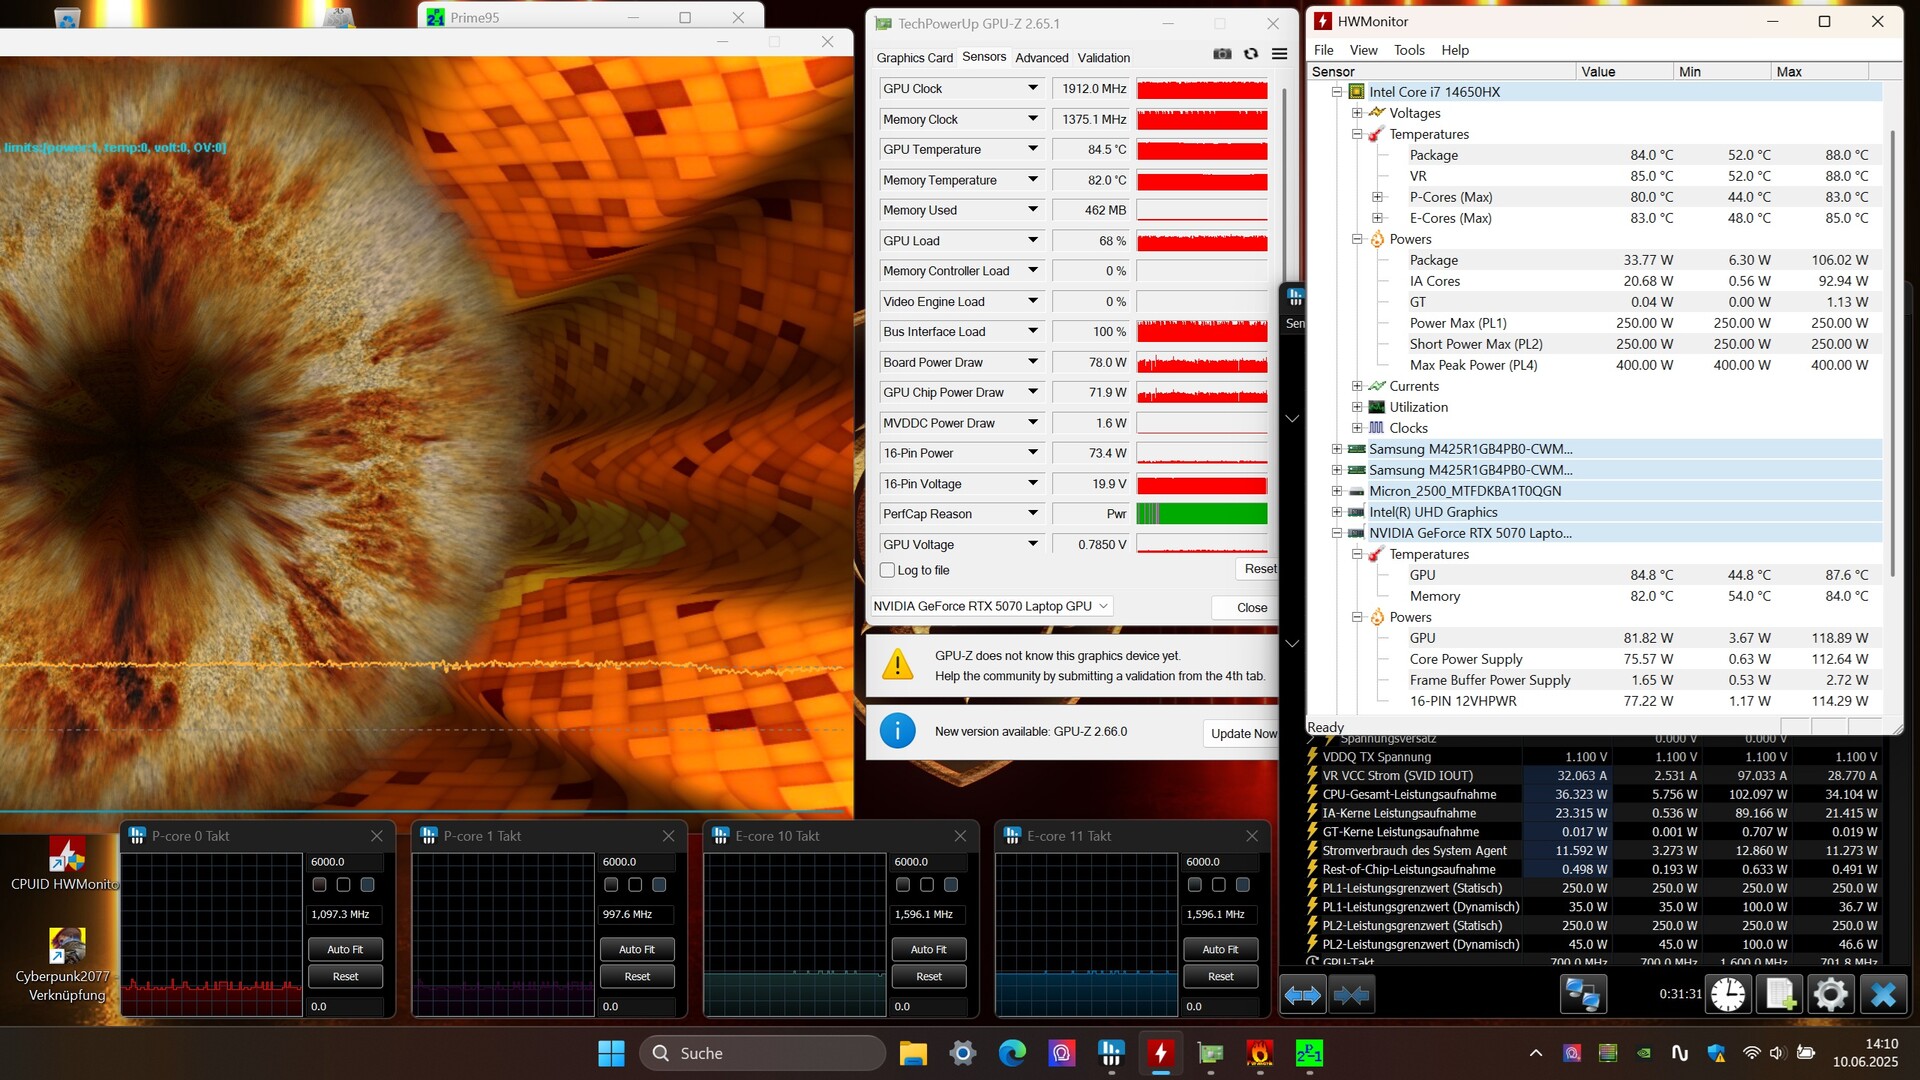
Épreuve d'effort
Lors de notre test de stress avec les outils Furmark et Prime95, le CPU et le GPU se sont stabilisés autour de 84 °C après un certain temps - une valeur raisonnable. Cyberpunk 2077 a généré des températures similaires.
Intervenants
Malheureusement, la qualité du son laisse à désirer. Les basses, en particulier, sont très faibles. La plupart des concurrents sont plus performants en termes de son.
MSI Katana 17 HX B14WGK analyse audio
(+) | les haut-parleurs peuvent jouer relativement fort (84# dB)
Basses 100 - 315 Hz
(-) | presque aucune basse - en moyenne 19% plus bas que la médiane
(±) | la linéarité des basses est moyenne (10.6% delta à la fréquence précédente)
Médiums 400 - 2000 Hz
(±) | médiane supérieure - en moyenne 8.7% supérieure à la médiane
(±) | la linéarité des médiums est moyenne (7.5% delta à la fréquence précédente)
Aiguës 2 - 16 kHz
(+) | des sommets équilibrés - à seulement 4.6% de la médiane
(±) | la linéarité des aigus est moyenne (9.7% delta à la fréquence précédente)
Globalement 100 - 16 000 Hz
(±) | la linéarité du son global est moyenne (20.6% de différence avec la médiane)
Par rapport à la même classe
» 74% de tous les appareils testés de cette catégorie étaient meilleurs, 5% similaires, 21% pires
» Le meilleur avait un delta de 6%, la moyenne était de 18%, le pire était de 132%.
Par rapport à tous les appareils testés
» 55% de tous les appareils testés étaient meilleurs, 8% similaires, 37% pires
» Le meilleur avait un delta de 4%, la moyenne était de 24%, le pire était de 134%.
MSI Vector 16 HX AI A2XWHG analyse audio
(+) | les haut-parleurs peuvent jouer relativement fort (86# dB)
Basses 100 - 315 Hz
(±) | basse réduite - en moyenne 12.3% inférieure à la médiane
(±) | la linéarité des basses est moyenne (8.5% delta à la fréquence précédente)
Médiums 400 - 2000 Hz
(±) | médiane supérieure - en moyenne 9.9% supérieure à la médiane
(+) | les médiums sont linéaires (6.8% delta à la fréquence précédente)
Aiguës 2 - 16 kHz
(+) | des sommets équilibrés - à seulement 1.8% de la médiane
(+) | les aigus sont linéaires (2.9% delta à la fréquence précédente)
Globalement 100 - 16 000 Hz
(±) | la linéarité du son global est moyenne (15.8% de différence avec la médiane)
Par rapport à la même classe
» 37% de tous les appareils testés de cette catégorie étaient meilleurs, 7% similaires, 56% pires
» Le meilleur avait un delta de 6%, la moyenne était de 18%, le pire était de 132%.
Par rapport à tous les appareils testés
» 24% de tous les appareils testés étaient meilleurs, 5% similaires, 71% pires
» Le meilleur avait un delta de 4%, la moyenne était de 24%, le pire était de 134%.
Gestion de l'énergie
Consommation électrique
Avec 10 à 24 watts en mode veille et 126 à 227 watts en charge, la consommation d'énergie est typique d'un ordinateur portable de jeu dans cette catégorie de performance, bien que l'Aero 16X avec son Ryzen AI 7 350 soit encore plus économe.
| Éteint/en veille | |
| Au repos | |
| Fortement sollicité |
|
Légende:
min: | |
| MSI Katana 17 HX B14WGK i7-14650HX, GeForce RTX 5070 Laptop | Gigabyte Aero X16 1WH Ryzen AI 7 350, GeForce RTX 5070 Laptop | Asus ProArt P16 H7606WP Ryzen AI 9 HX 370, GeForce RTX 5070 Laptop | Schenker XMG Pro 16 (E25) Ultra 9 275HX, GeForce RTX 5070 Ti Laptop | MSI Vector 16 HX AI A2XWHG Ultra 7 255HX, GeForce RTX 5070 Ti Laptop | Moyenne de la classe Gaming | |
|---|---|---|---|---|---|---|
| Power Consumption | 37% | 17% | -10% | -9% | -13% | |
| Idle Minimum * (Watt) | 9.7 | 5.8 40% | 9.9 -2% | 11.7 -21% | 7.1 27% | 13.3 ? -37% |
| Idle Average * (Watt) | 15 | 10.9 27% | 13.6 9% | 16.6 -11% | 15.9 -6% | 19 ? -27% |
| Idle Maximum * (Watt) | 23.7 | 11.2 53% | 14 41% | 17.1 28% | 29.5 -24% | 24.5 ? -3% |
| Load Average * (Watt) | 126 | 91.3 28% | 93.8 26% | 122.4 3% | 124 2% | 108.1 ? 14% |
| Cyberpunk 2077 ultra external monitor * (Watt) | 202 | 117.9 42% | 158.3 22% | 241 -19% | 217 -7% | |
| Cyberpunk 2077 ultra * (Watt) | 205 | 123.8 40% | 162.1 21% | 245 -20% | 222 -8% | |
| Load Maximum * (Watt) | 227 | 155.3 32% | 229 -1% | 291.5 -28% | 336 -48% | 254 ? -12% |
* ... Moindre est la valeur, meilleures sont les performances
Power consumption Cyberpunk / Stress test
Power consumption with the external monitor
Durée de vie de la batterie
La durée de vie de la batterie ne doit pas être très élevée. Lors de notre test WLAN (avec une luminosité réduite à 150 cd/m²), la batterie de 75 Wh n'a tenu qu'environ 5 heures. En comparaison, la concurrence atteint 7 à 9 heures.
| MSI Katana 17 HX B14WGK i7-14650HX, GeForce RTX 5070 Laptop, 75 Wh | Gigabyte Aero X16 1WH Ryzen AI 7 350, GeForce RTX 5070 Laptop, 76 Wh | Asus ProArt P16 H7606WP Ryzen AI 9 HX 370, GeForce RTX 5070 Laptop, 90 Wh | Schenker XMG Pro 16 (E25) Ultra 9 275HX, GeForce RTX 5070 Ti Laptop, 99.8 Wh | MSI Vector 16 HX AI A2XWHG Ultra 7 255HX, GeForce RTX 5070 Ti Laptop, 90 Wh | Moyenne de la classe Gaming | |
|---|---|---|---|---|---|---|
| Autonomie de la batterie | ||||||
| WiFi v1.3 (h) | 5.1 | 8.6 69% | 9.2 80% | 9.1 78% | 7 37% | 7.01 ? 37% |
Notebookcheck note globale
Avec le Katana 17 HX B14WGK, MSI est allé trop loin à bien des égards, rendant difficile pour le gamer de 17 pouces de se maintenir face à la concurrence.
MSI Katana 17 HX B14WGK
- 06/23/2025 v8
Florian Glaser
 Total Sustainability Score:
 Possible competitors comparison
Image | Modèle | Prix | Poids | Épaisseur | Écran |
|---|---|---|---|---|---|
1. 77.3%  | MSI Katana 17 HX B14WGK Intel Core i7-14650HX ⎘ NVIDIA GeForce RTX 5070 Laptop ⎘ 16 Go Mémoire, 1024 Go SSD | Amazon: Prix de liste: 1800 EUR | 2.7 kg | 28 mm | 17.30" 2560x1440 170 PPI IPS |
2. 83.7%  | Gigabyte Aero X16 1WH AMD Ryzen AI 7 350 ⎘ NVIDIA GeForce RTX 5070 Laptop ⎘ 32 Go Mémoire, 1024 Go SSD | Amazon: Prix de liste: 1799€ | 2 kg | 19.9 mm | 16.00" 2560x1600 189 PPI IPS |
3. 89.1%  | Asus ProArt P16 H7606WP AMD Ryzen AI 9 HX 370 ⎘ NVIDIA GeForce RTX 5070 Laptop ⎘ 64 Go Mémoire, 2048 Go SSD | Amazon: 1. $2,249.99 HIDevolution [2025] ASUS Pro... 2. $2,979.99 ASUS ProArt P16 Creator Lapt... 3. $2,999.99 ASUS ProArt P16 Creator Lapt... Prix de liste: 3399€ | 1.8 kg | 17.3 mm | 16.00" 2880x1800 212 PPI OLED |
4. 87.4%  | Schenker XMG Pro 16 (E25) Intel Core Ultra 9 275HX ⎘ NVIDIA GeForce RTX 5070 Ti Laptop ⎘ 32 Go Mémoire, 1024 Go SSD | Amazon: 1. $22.79 Very Best of Michael Schenke... Prix de liste: 2480€ | 2.5 kg | 26.5 mm | 16.00" 2560x1600 189 PPI IPS |
5. 84%  | MSI Vector 16 HX AI A2XWHG Intel Core Ultra 7 255HX ⎘ NVIDIA GeForce RTX 5070 Ti Laptop ⎘ 16 Go Mémoire, 512 Go SSD | Amazon: Prix de liste: 2000 EUR | 2.6 kg | 28.6 mm | 16.00" 2560x1600 189 PPI IPS |
Transparency
La sélection des appareils à examiner est effectuée par notre équipe éditoriale. L'échantillon de test a été prêté à l'auteur par le fabricant ou le détaillant pour les besoins de cet examen. Le prêteur n'a pas eu d'influence sur cette évaluation et le fabricant n'a pas reçu de copie de cette évaluation avant sa publication. Il n'y avait aucune obligation de publier cet article. En tant que média indépendant, Notebookcheck n'est pas soumis à l'autorité des fabricants, des détaillants ou des éditeurs.
Voici comment Notebookcheck teste
Chaque année, Notebookcheck examine de manière indépendante des centaines d'ordinateurs portables et de smartphones en utilisant des procédures standardisées afin de garantir que tous les résultats sont comparables. Nous avons continuellement développé nos méthodes de test depuis environ 20 ans et avons établi des normes industrielles dans le processus. Dans nos laboratoires de test, des équipements de mesure de haute qualité sont utilisés par des techniciens et des rédacteurs expérimentés. Ces tests impliquent un processus de validation en plusieurs étapes. Notre système d'évaluation complexe repose sur des centaines de mesures et de points de référence bien fondés, ce qui garantit l'objectivité.